state-to-state spectroscopy and dynamics of neutrals and ions by photoionization and photoelectron...
TRANSCRIPT

State-to-state spectroscopy and dynamics of neutrals and ions by photoionization and
photoelectron methods
Cheuk-Yiu Ng
Department of ChemistryUniversity of California, Davis
International Symposium on Molecular Spectroscopy (June 17, 2014)

Delayed Pulsed Field Ionization (PFI)
Laser based Technique (M. Dethlefs and E. Schlag)
M + hM*(n>100)
PFI
M++e-
0.1-5 cm-1
PFI
PFI-PE
PFI-photoion (PFI-PI) or MATI
Long Rydberg state lifetimes >s
PFI-photoelectron (PFI-PE) or ZEKE
Background
Stark shift: 6(F)1/2 cm-1
For PFI: 4(F)1/2 cm-1
Lower F - Higher Resolution
Highest resolution reported:
0.1 cm-1 (FWHM)
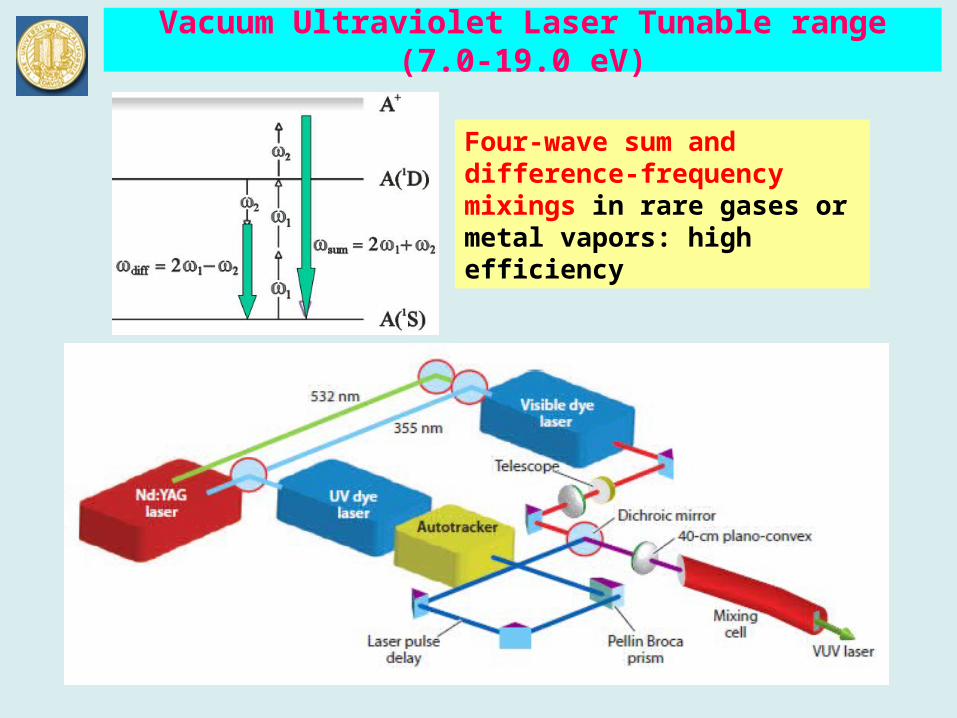
Vacuum Ultraviolet Laser Tunable range (7.0-19.0 eV)
Four-wave sum and difference-frequency mixings in rare gases or metal vapors: high efficiency

VUV laser generation by four-wave mixing schemes (7-19.5 eV)
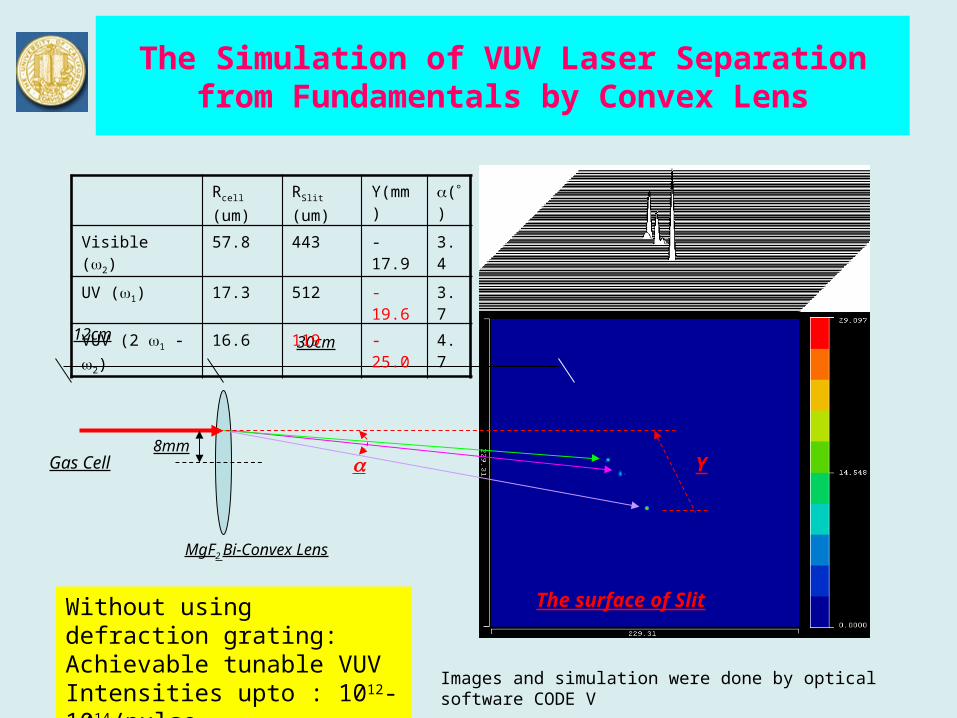
The Simulation of VUV Laser Separation from Fundamentals by Convex Lens
12cm 30cm
8mm
MgF2 Bi-Convex Lens
The surface of Slit
Gas Cell
Rcell (um) RSlit (um) Y(mm)
()
Visible (2) 57.8 443 -17.9 3.4
UV (1) 17.3 512 -19.6 3.7
VUV (2 1 -2) 16.6 119 -25.0 4.7
Y
Images and simulation were done by optical software CODE V
Without using defraction grating: Achievable tunable VUV Intensities upto : 1012-1014/pulse
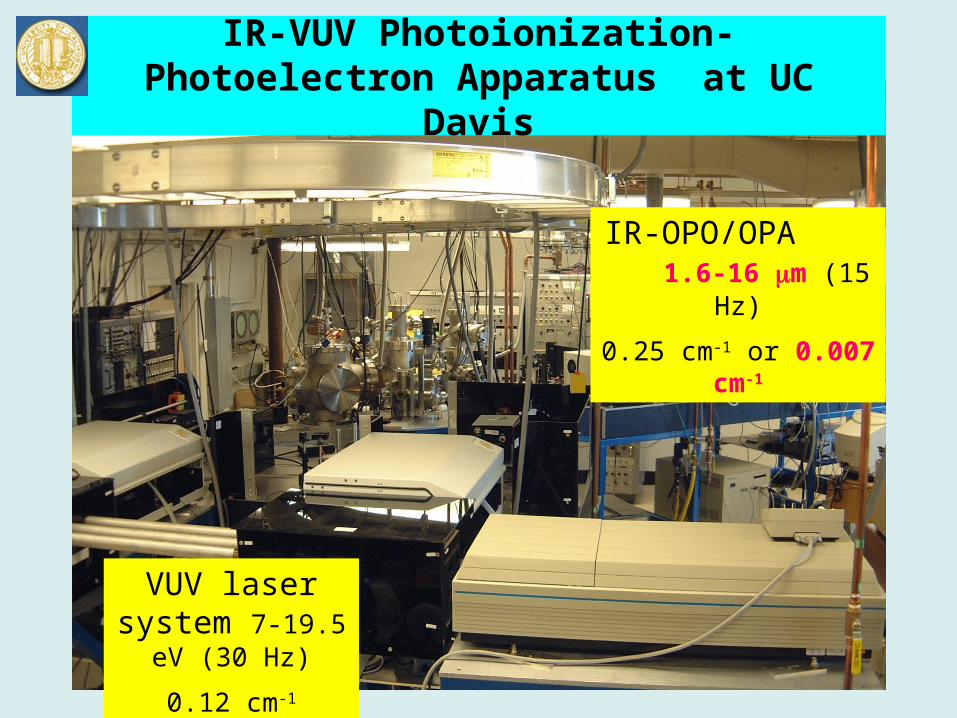
IR-VUV Photoionization-Photoelectron Apparatus at UC Davis
IR-OPO/OPA 1.6-16 m (15 Hz)
0.25 cm-1 or 0.007 cm-1
VUV laser system 7-19.5 eV (30 Hz)
0.12 cm-1
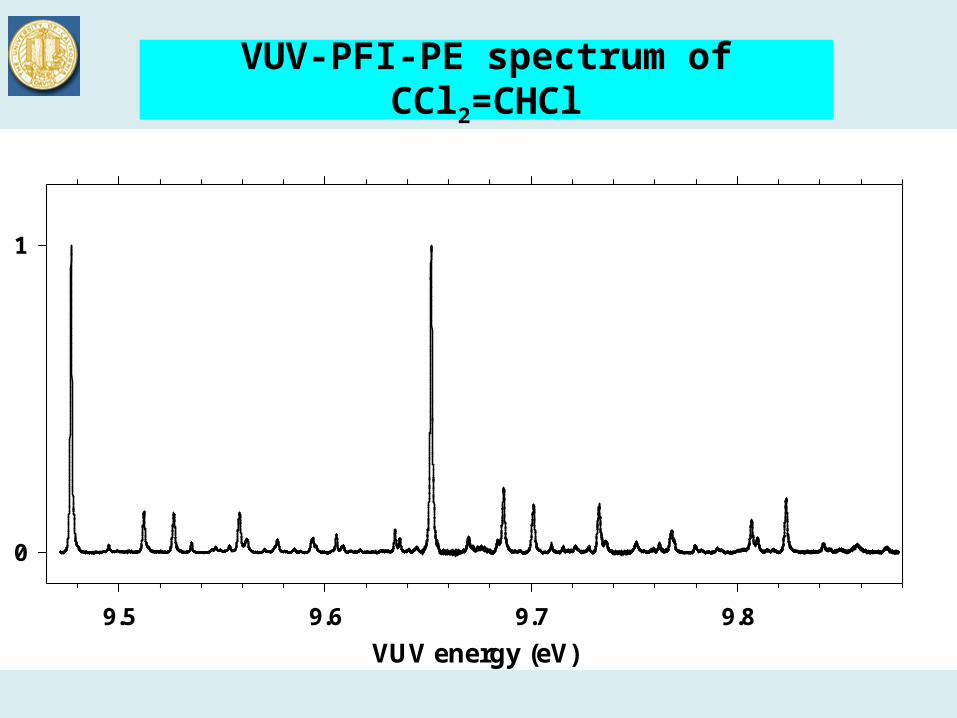
VUV-PFI-PE spectrum of CCl2=CHCl
Origin band
VUV energy (eV)
9.5 9.6 9.7 9.8
0
1Origin band
v11+
HeI PES
v3+ v4
+ v6+
2v11+
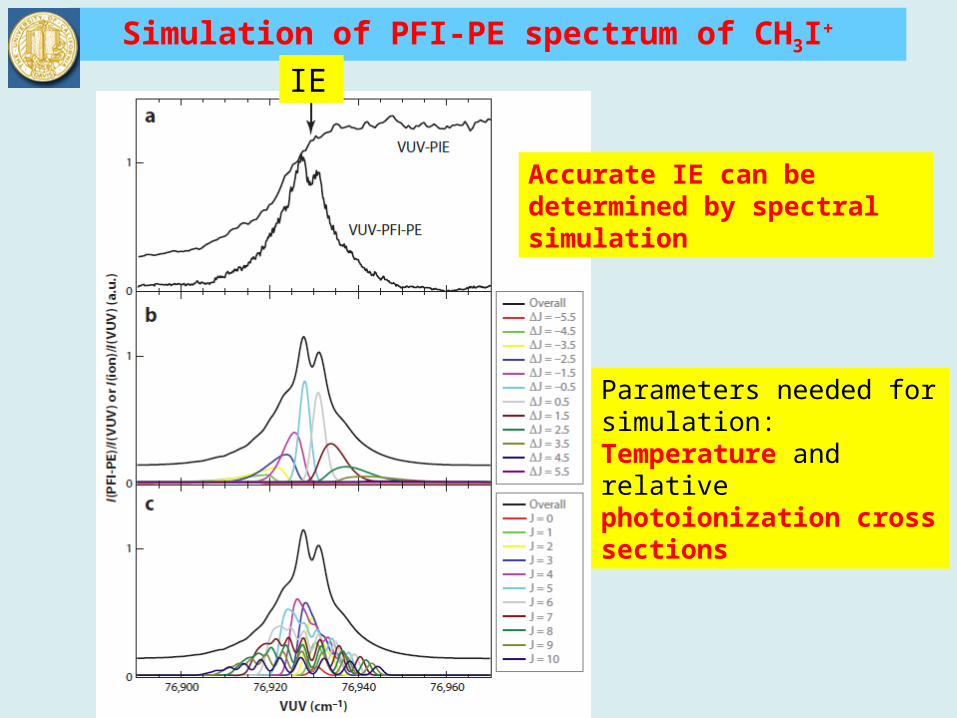
Simulation of PFI-PE spectrum of CH3I+
Accurate IE can be determined by spectral simulation
IE
Parameters needed for simulation: Temperature and relative photoionization cross sections

Ionic ground state
Ground state
+
Fix VUV < IE
Scan IR
t=50 ns
Resolved (v, J)
IR frequency (cm-1)
2960 2965 2970 2975 2980
IR-V
UV
-Pho
toio
n (a
rb. u
nit)
0.0
0.5
1.0
1.5
P branch
R branch
Q
9
6
0
3
4 6
*
*
*
*
**
State-to-state PFI-PE spectrum for CH3I(X, 7=1) by IR-VUV photoionization technique
IR Resolution = 0.25 cm-1 (FWHM)
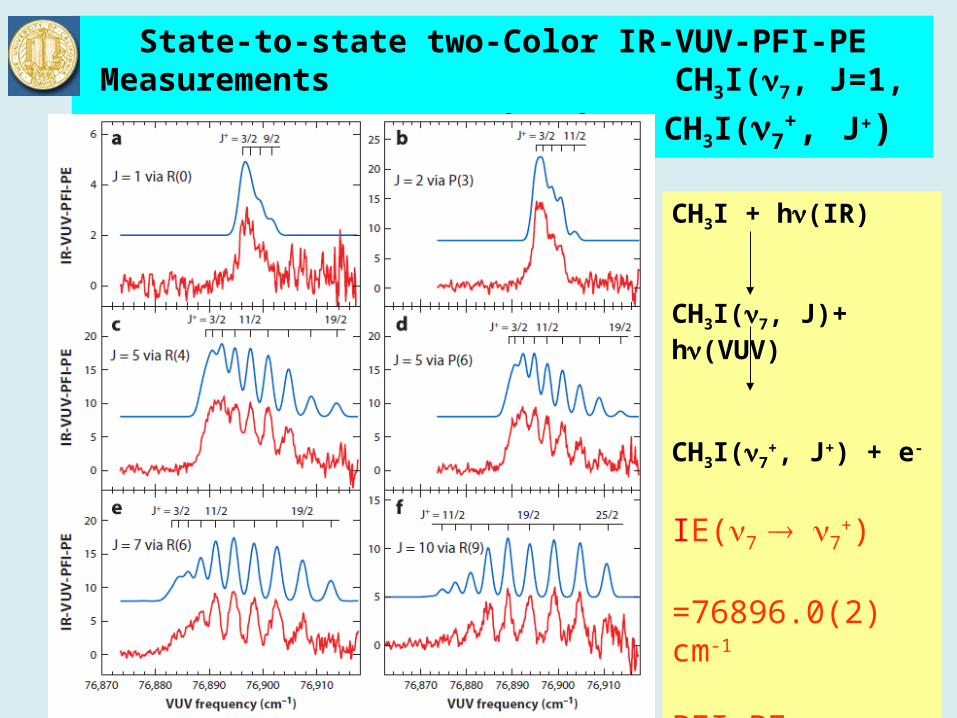
State-to-state two-Color IR-VUV-PFI-PE Measurements CH3I(7, J=1, 2, 5, 7, and 10) +h(VUV) CH3I(7
+, J+)
CH3I + h(IR)
CH3I(7, J)+ h(VUV)
CH3I(7+, J+) + e-
IE(7 7+)
=76896.0(2) cm-1
PFI-PE resolution= 1.2 cm-1 (FWHM)

Photoionization cross section () vs J+=J+-J
Depend only on J+ (not on J and K) and J+ 6.5

VUV laser velocity-mapped ion- and electron- imaging appartatus
Tunable VUV laser radiation
Molecular beam
Imaging TOF chamberPhotodissociation laser 193 nm
Imaging MCP

Comparison of the threshold photoelectron (TPE) and PFI-PE spectra of C6H5Cl
eV
Ele
ctro
n In
tens
ity
(a.u
.)
Resolution:
E E v = E r

Velocity-map imaging-photoelectron (VMI-PE) image of C6H5Cl at 9.24 eV
Abel transformation
The VMI-TPE method has comparable resolution 1.5-2.0 cm-1 (FWHM) with that of PFI-ZEKE or PFI-PE, but with higher photo-electron collection efficiency.
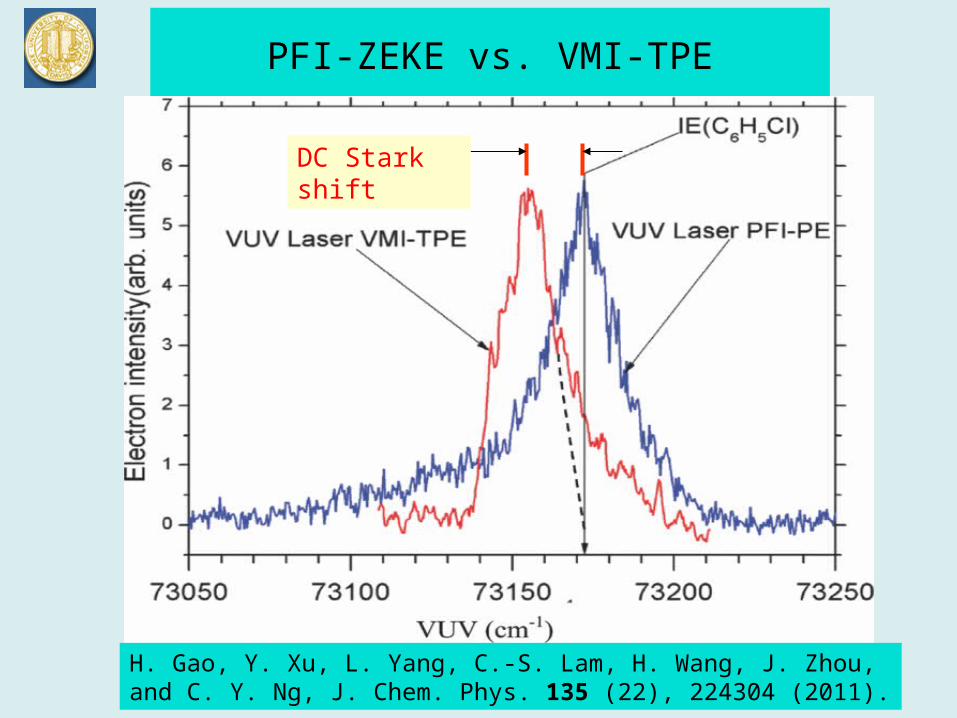
PFI-ZEKE vs. VMI-TPE
H. Gao, Y. Xu, L. Yang, C.-S. Lam, H. Wang, J. Zhou, and C. Y. Ng, J. Chem. Phys. 135 (22), 224304 (2011).
DC Stark shift
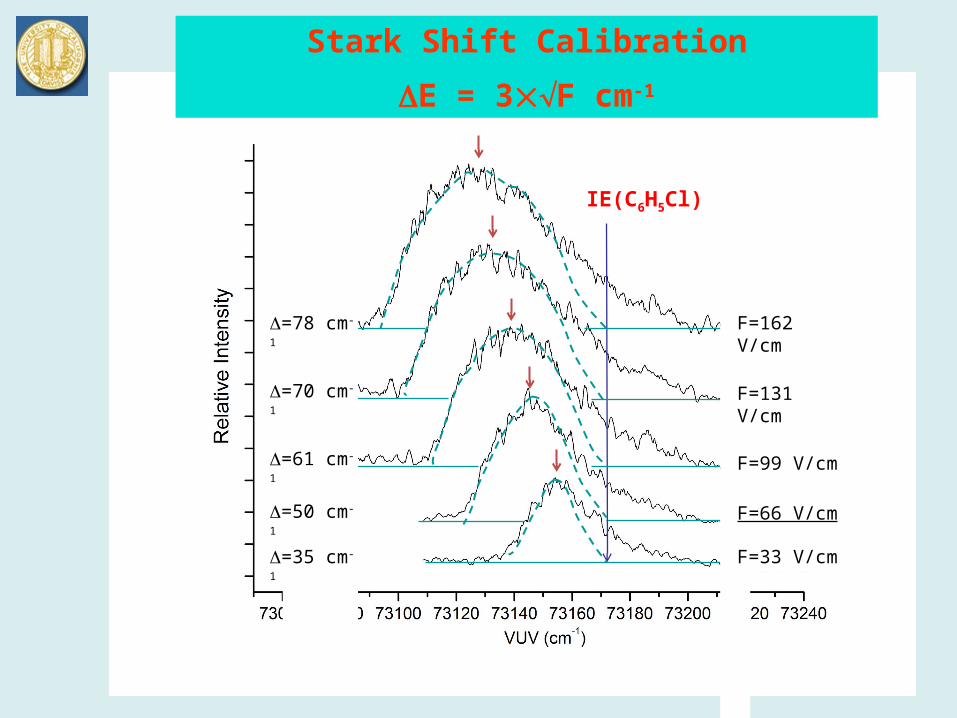
=35 cm-1
=50 cm-1
=61 cm-1
=70 cm-1
=78 cm-1 F=162 V/cm
F=131 V/cm
F=99 V/cm
F=66 V/cm
F=33 V/cm
IE(C6H5Cl)
Stark Shift Calibration
E = 3F cm-1

P. Hemberger, M. Lang, B. Noller, I. Fischer, C. Alcaraz, B.K. Cunha de Miranda, G.A. Garcia, H. Soldi-Lose, The Journal of Physical Chemistry A 115 2225 (2011).
H. Gao, Z. Lu, L. Yang, J. Zhou, C. Ng, J. Chem. Phys. 137 161101 (2012)
VMI-PE spectrum for C3H3+
TPE spectrum of propargyl radical cation (C3H3+)
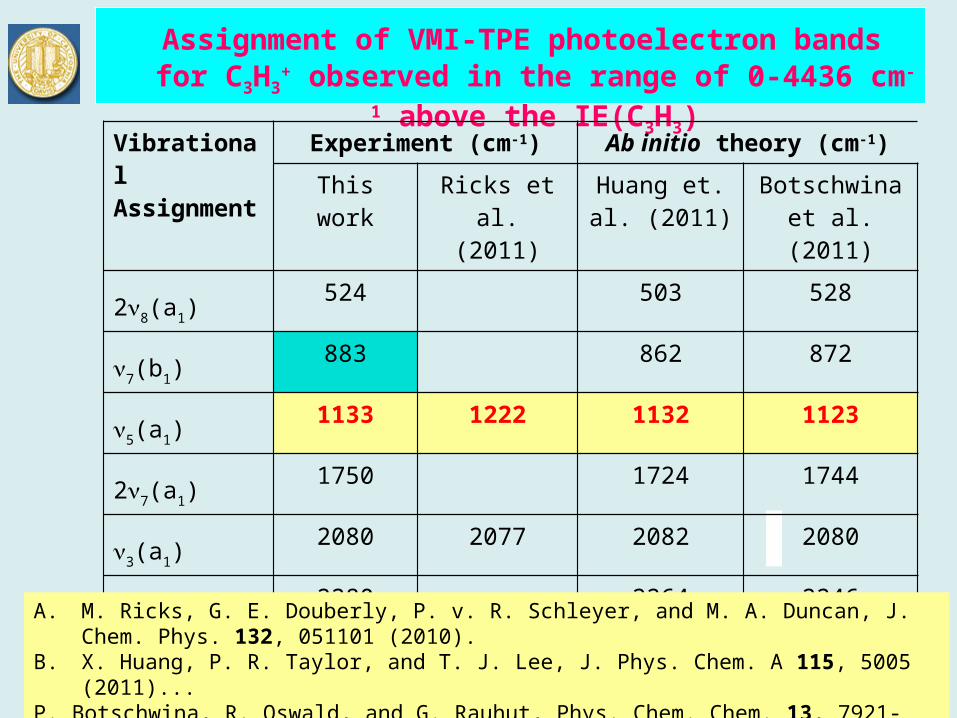
Assignment of VMI-TPE photoelectron bands for C3H3+
observed in the range of 0-4436 cm-1 above the IE(C3H3)
Vibrational Assignment
Experiment (cm-1) Ab initio theory (cm-1)
This work Ricks et al.(2011)
Huang et. al. (2011)
Botschwina et al. (2011)
28(a1) 524 503 528
7(b1) 883 862 872
5(a1)1133 1222 1132 1123
27(a1) 1750 1724 1744
3(a1)2080 2077 2082 2080
25(a1)2280 2264 2246
35(a1)3410 3395 3369
23(a1)4132 4164 4160
A. M. Ricks, G. E. Douberly, P. v. R. Schleyer, and M. A. Duncan, J. Chem. Phys. 132, 051101 (2010).B. X. Huang, P. R. Taylor, and T. J. Lee, J. Phys. Chem. A 115, 5005 (2011)...P. Botschwina, R. Oswald, and G. Rauhut, Phys. Chem. Chem. 13, 7921-7929 (2011).
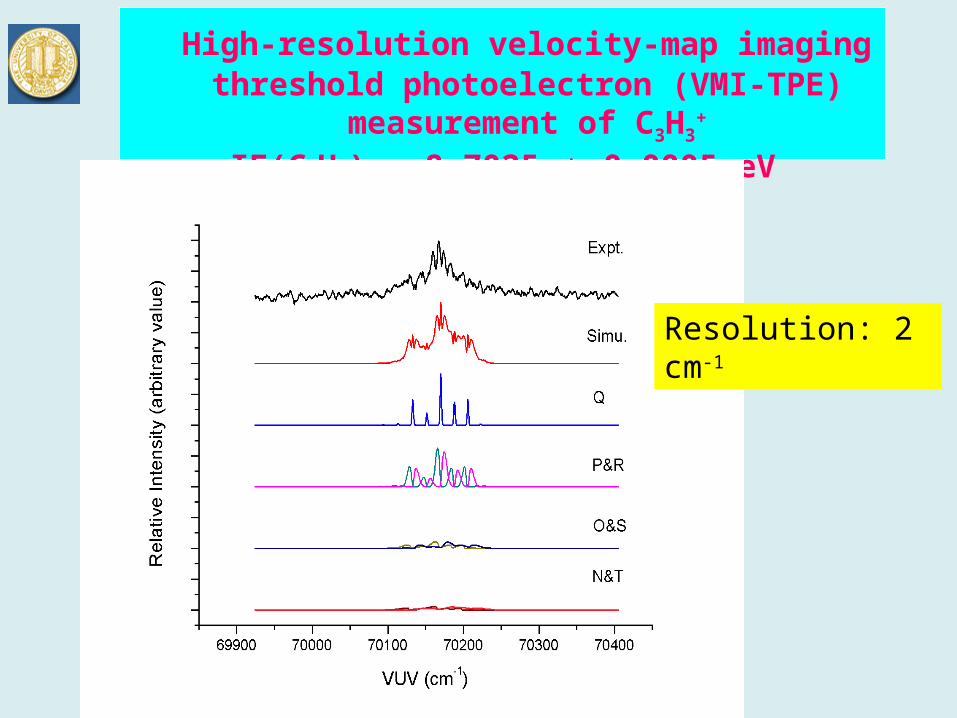
High-resolution velocity-map imaging threshold photoelectron (VMI-TPE) measurement of C3H3
+
IE(C3H3) = 8.7025 0.0005 eV
Resolution: 2 cm-1
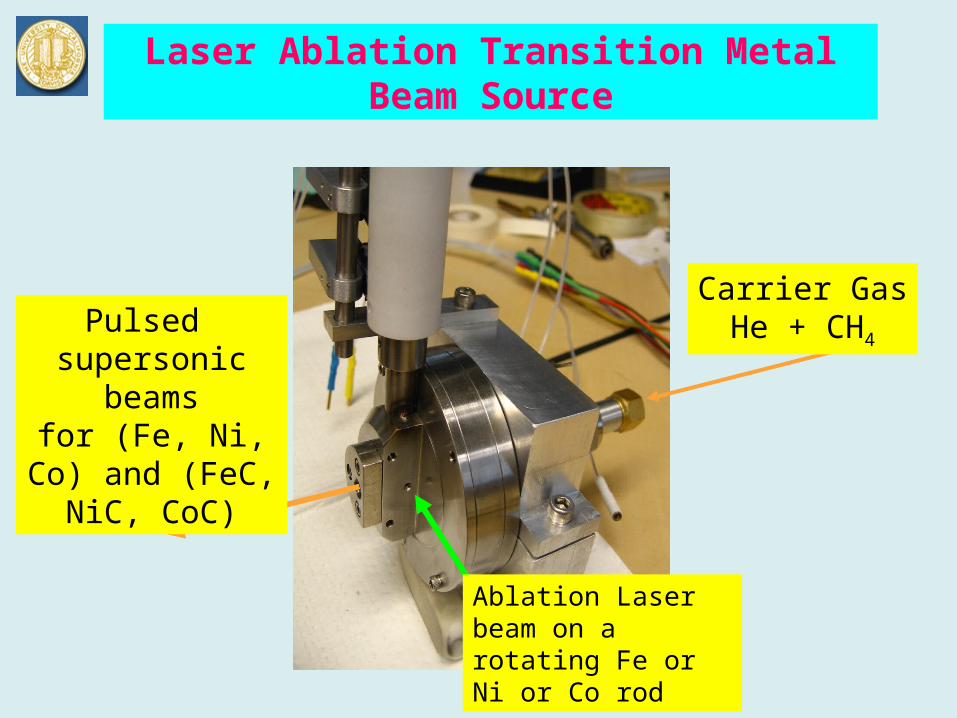
Laser Ablation Transition Metal Beam Source
Ablation Laser beam on a rotating Fe or Ni or Co rod
Pulsed supersonic beamsfor (Fe, Ni, Co) and (FeC, NiC,
CoC)
Carrier GasHe + CH4

VUV Photoion Spectrum of Fe Fe(3d64s2 5D4)+h Fe(3d64s1)np Fe+(3d7; 4F9/2,4F7/2)+e
hv(VUV) (cm-1)
63000 64000 65000 66000 67000 68000
I(F
e+)/
I(hv
) (
arb
itrar
y un
its)
-2
0
2
4
6
8
10
12
hv(VUV) (Å)
148015001520154015601580
4F9/2
4F7/2
6DJ J=9/2 7/2 5/2 3/2 1/2 4FJ J=9/2 7/2 5/2 3/2
n=10 11 12 32
n=9 10 11 27
IE(Fe)
Fe+(3d64s1 6D9/2)
Fe+(3d7; 4F9/2, 4F7/2)
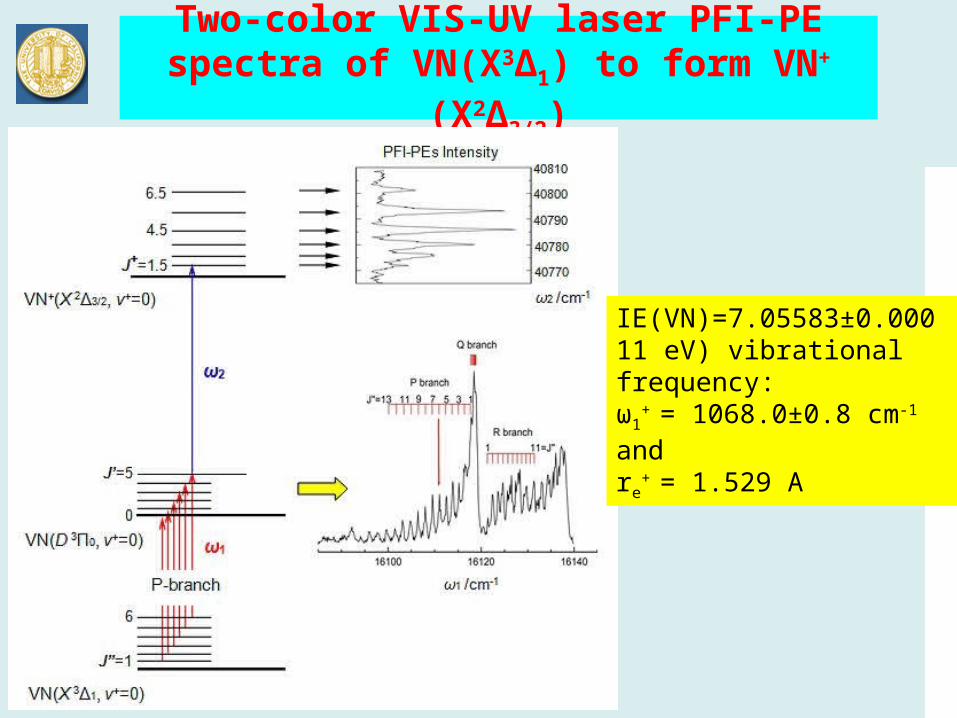
Two-color VIS-UV laser PFI-PE spectra of VN(X3∆1) to form VN+ (X2∆3/2)
IE(VN)=7.05583±0.00011 eV) vibrational frequency:ω1
+ = 1068.0±0.8 cm-1 and re
+ = 1.529 A
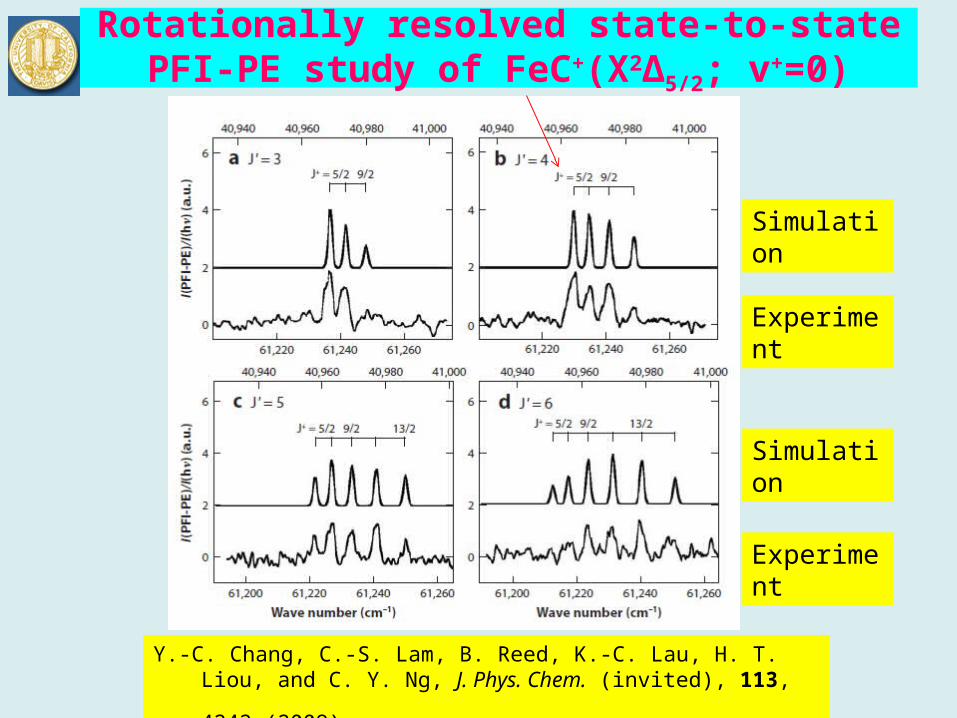
Rotationally resolved state-to-state PFI-PE study of FeC+(X2Δ5/2; v+=0)
Y.-C. Chang, C.-S. Lam, B. Reed, K.-C. Lau, H. T. Liou, and C. Y. Ng, J.
Phys. Chem. (invited), 113, 4242 (2009).
Experiment
Simulation
Experiment
Simulation
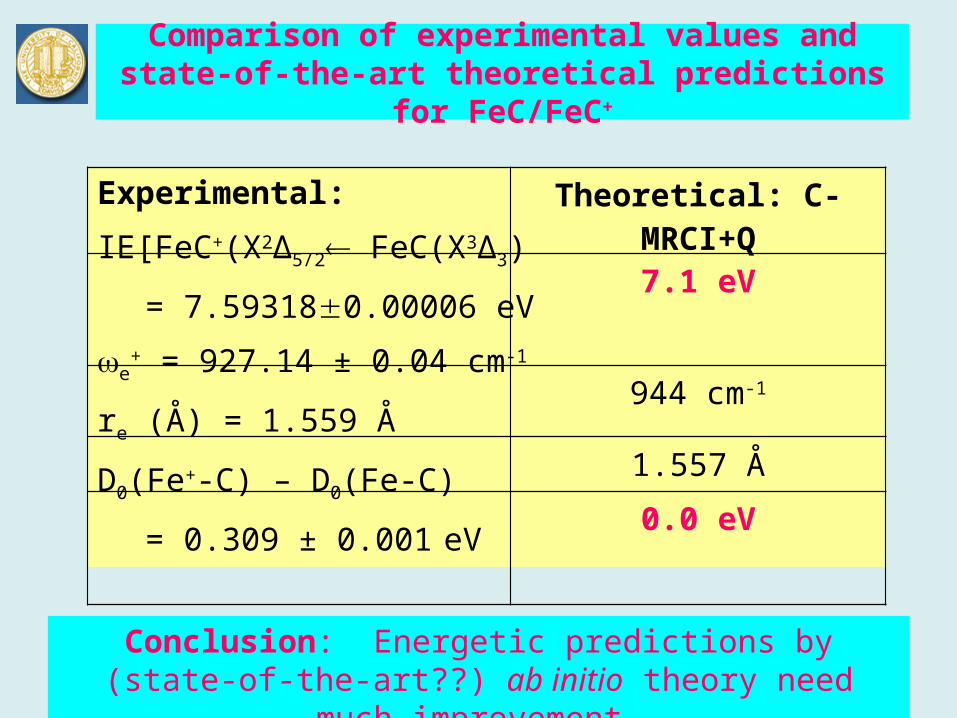
Comparison of experimental values and state-of-the-art theoretical predictions for FeC/FeC+
Experimental:
IE[FeC+(X2Δ5/2 FeC(X3Δ3)
= 7.593180.00006 eV
e+ = 927.14 ± 0.04 cm-1
re (Å) = 1.559 Å
D0(Fe+-C) – D0(Fe-C)
= 0.309 ± 0.001 eV
Theoretical: C-MRCI+Q
7.1 eV
944 cm-1
1.557 Å
0.0 eV
Conclusion: Energetic predictions by (state-of-the-art??) ab initio theory need much improvement.

Comparison of the VUV laser photoion and PFI-PE spectra of TiO2
IE(TiO2) = 9.57355 ± 0.00015 eV) vibrational frequencies:ω1
+ = 829.1 ± 2.0 cm-1 and ω2
+ = 248.7 ± 0.6 cm-1
The first high-resolution single-photon VUV-PFI-PE measrement of Transition metal-containing molecules

Rotationally resolved state-to-state VIS-UV laser PFI-PE spectra of VCH(X3∆1) to form VCH+ (X2Σ+)

Thermochemical cycles of the VC/VC+ and VCH/VCH+ systems

Coupled Cluster Theory
Complete Basis Set Extrapolation
Energetics at CCSD(T)/CBS
Inclusion ofCorrelation
Effects
Zero-Point Vibrational Energy
Spin-Orbit Coupling
Diagonal Born-Oppenheimer
Correction
Higher-Order Correction
Scalar-Relativistic Effect
Core-Valence Correlation
Ultimate level of theory could be
effectively as CCSDTQ(Full)/CBS
HΨ=EΨ
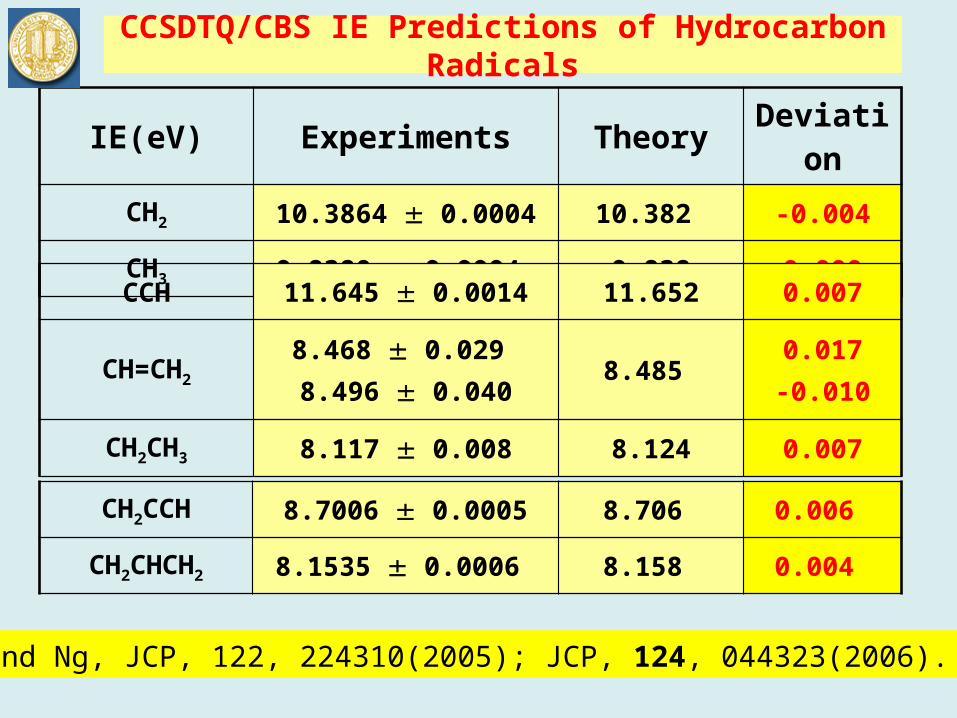
CCSDTQ/CBS IE Predictions of Hydrocarbon Radicals
IE(eV) Experiments Theory Deviation
CH2 10.3864 0.0004 10.382 -0.004
CH3 9.8380 0.0004 9.838 0.000
Lau and Ng, JCP, 122, 224310(2005); JCP, 124, 044323(2006).
CCH 11.645 0.0014 11.652 0.007
CH=CH2
8.468 0.029 8.496 0.040
8.485 0.017-0.010
CH2CH3 8.117 0.008 8.124 0.007
CH2CCH 8.7006 0.0005 8.706 0.006
CH2CHCH2 8.1535 0.0006 8.158 0.004
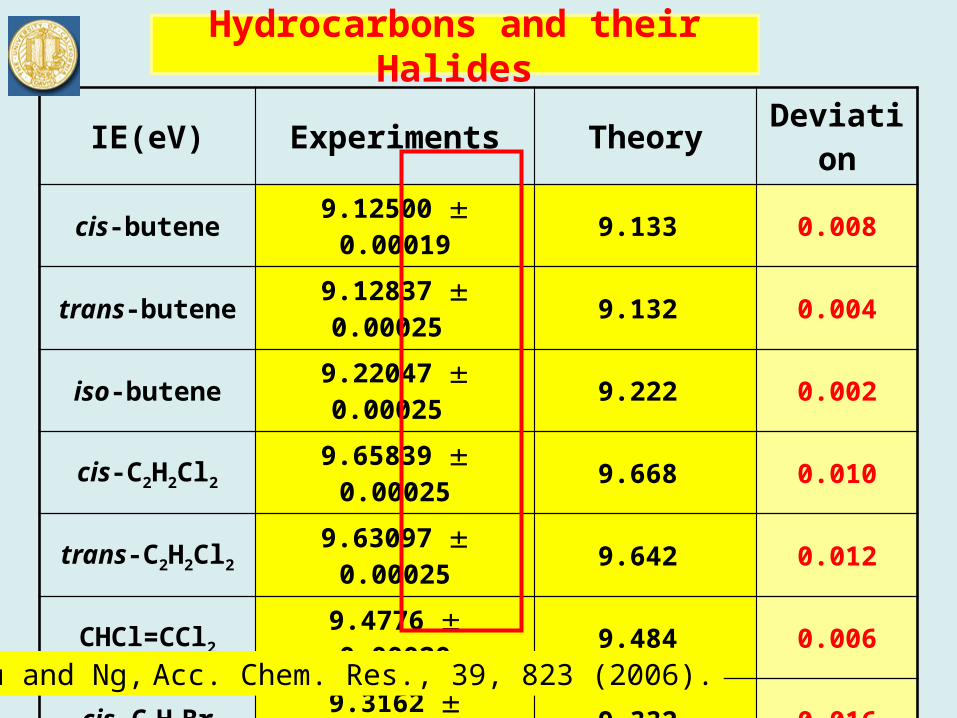
Hydrocarbons and their Halides
IE(eV) Experiments Theory Deviation
cis-butene 9.12500 0.00019 9.133 0.008
trans-butene 9.12837 0.00025 9.132 0.004
iso-butene 9.22047 0.00025 9.222 0.002
cis-C2H2Cl2 9.65839 0.00025 9.668 0.010
trans-C2H2Cl2 9.63097 0.00025 9.642 0.012
CHCl=CCl2 9.4776 0.00020 9.484 0.006
cis-C3H5Br 9.3162 0.00020 9.332 0.016
trans-C3H5Br 9.2715 0.00020 9.289 0.018
Lau and Ng, Acc. Chem. Res., 39, 823 (2006).
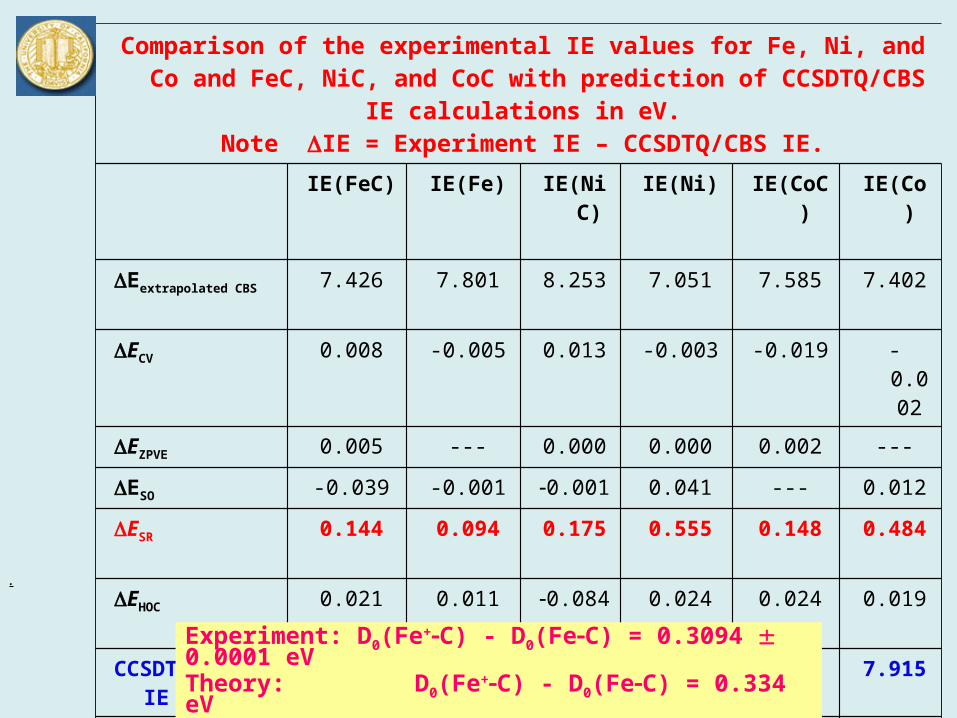
Comparison of the experimental IE values for Fe, Ni, and Co and FeC, NiC, and CoC with prediction of CCSDTQ/CBS IE
calculations in eV. Note IE = Experiment IE – CCSDTQ/CBS IE.
IE(FeC) IE(Fe) IE(NiC)
IE(Ni) IE(CoC)
IE(Co)
Eextrapolated CBS
7.426 7.801 8.253 7.051 7.585 7.402
ECV 0.008 -0.005 0.013 -0.003 -0.019 -0.002
EZPVE 0.005 --- 0.000 0.000 0.002 ---
ESO -0.039 -0.001 0.001 0.041 --- 0.012
ESR 0.144 0.094 0.175 0.555 0.148 0.484
EHOC 0.021 0.011 0.084 0.024 0.024 0.019
CCSDTQ/CBS IE
7.565 7.899 8.356 7.668 7.740 7.915
Experiment IE
7.59318 0.0006
7.9024 0.0006
8.37209
0.00006
7.639836
±0.000006
7.73467
0.0006
7.88101
0.00012
IE = Expt -Theo 0.028 0.003 0.016 -0.028 -0.005 -0.034
.
Experiment: D0(Fe+C) - D0(FeC) = 0.3094 0.0001 eV
Theory: D0(Fe+C) - D0(FeC) = 0.334 eV

Energetics of NiC (1Σ+) and NiC+ (2Σ+)
IE(NiC)
CCSDTQ/CBS 8.356
MRCI+Q 8.00
B3LYP 8.26
Experiments 8.372 05 0.00006
D0(NiC) D0(Ni+C)
CCSDTQ/CBS 0.688
MRCI+Q 0.38
B3LYP 0.37
Experiments 0.732 21 0.00006
Ng and co-workers, JCP, 133 054310(2010);Lau et al. JCP 133, 114304(2010).
D0(Ni−C) − D0(Ni+−C)
= IE(NiC) − IE(Ni)
Comparison with DFT and other ab initio quantum predictions

State-to-state photodissociation Study
State-to-state photodissociation studies by
• VUV laser photodissociation pump
• VUV laser photoionization probe
Goals: To apply on photodissociation
Atmospheric gases CO, N2, NO, O2, CO2 etc.

CO is the second most abundant molecular species after H2 in the interstellar medium. VUV photodissociation study of CO is important to understand the properties of the interstellar medium and O-atom isotope fractionation.
CO photodissociation in the VUV region is still largely unknown.
C(3P) + O(1D)
C(1D) + O(3P) ??
M. Eidelsberg, F. Launay, K. Ito, T. Matsui, P. C. Hinnen, E. Reinhold, W. Ubachs, and K. P. Huber, J. Chem. Phys., 121 (1), 292 (2004).
C(3P) + O(3P)

VUV-VUV pump-probe time-slice VMI-PI experiment
CO + VUV-I → C(3PJ) + O(3PJ) 11.05 eV → C(1D) + O(3PJ) 12.31 eV → C(3PJ) + O(1D) 13.02 eV
C(3PJ) + VUV-II C+ + e-
C(1D) + VUV-II C+ + e-
Nd:YAG
Kr or Xe
Nd:YAG
Kr or Xe
E-L valve
CCD
MB
MCP
Phosphor screen
Computer
LiF window
VUV-I
VUV-II
ω 1
ω 2 BBO
BBO
ω 1
ω 2
Dye laser
Dye laser
Dye laser
Dye laser
Nd:YAG
Kr or Xe
Nd:YAG
Kr or Xe
E-L valve
CCD
MB
MCP
Phosphor screen
Computer
LiF window
VUV-I
VUV-II
ω 1
ω 2 BBO
BBO
ω 1
ω 2
Dye laser
Dye laser
Dye laser
Dye laser
State-selective photoionization detection:
1. VUV-UV (1+1’) photoinization detection
2. VUV-excited Autoionizing Rydberg detection

(a) (b): R(0) line of (4pσ)1Σ+(v'=3) at 109484.7 cm-1
(c) (d): R(0) line of (4sσ)1Σ+(v'=4) at 109452.5 cm-1

R. Visser, E. F. van Dishoeck, and J. H. Black, Astron. Astrophys. 503 (2), 323 (2009).
Branching Ratio measurement
Above Dissociation limit of CO
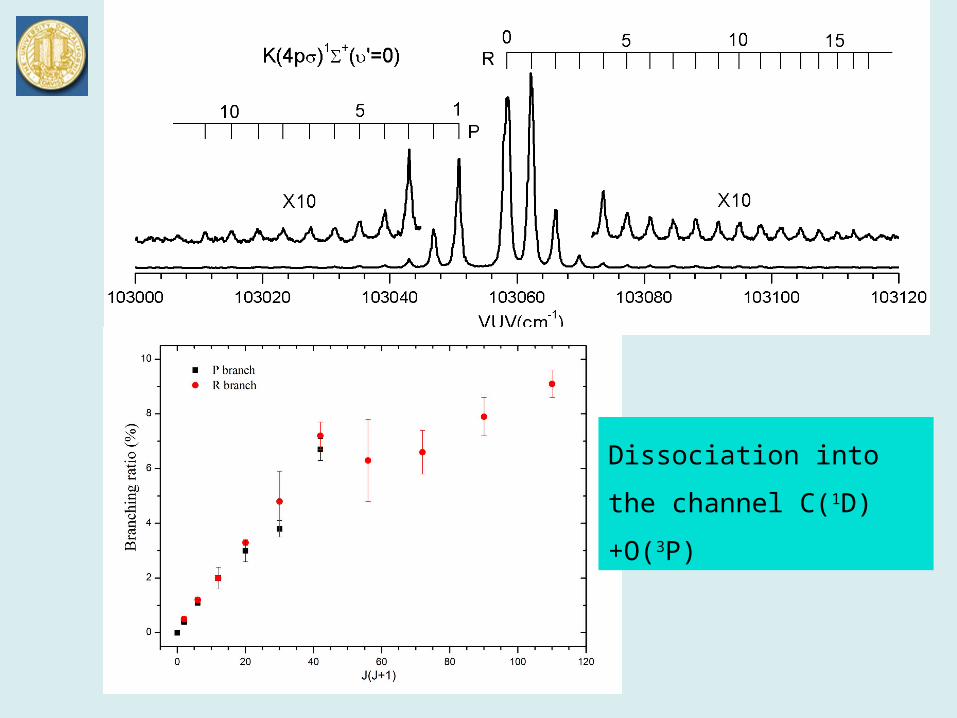
Dissociation into the
channel C(1D)+O(3P)

Fine structure distributions of O(3P0,1,2) and C(3P0,1,2)
VUV-UV(1+1’) photoionization method
VUV-Excited Autoionizing Rydberg VUV-EAR detection method

CO + VUV
C(3P) + O(1D)
C(3P) + O(3P)
C(3P0) + O(1D) -------- (BR-I)*(F0)
C(3P1) + O(1D) -------- (BR-II)*(F1)
C(3P2) + O(1D) -------- (BR-III)*(F2)
C(3P0) + O(3P) -------- [1-(BR-I)]*(F0)
C(3P1) + O(3P) -------- [1-(BR-II)]*(F1)
C(3P2) + O(3P) -------- [1-(BR-III)]*(F2)
BR-I = [C(3P0) + O(1D)] / { [C(3P0) + O(3P)] + [C(3P0) + O(1D)] }
BR-II = [C(3P1) + O(1D)] / { [C(3P1) + O(3P)] + [C(3P1) + O(1D)] }
BR-III = [C(3P2) + O(1D)] / { [C(3P2) + O(3P)] + [C(3P2) + O(1D)] }
F0 = [C(3P0)] / {[C(3P0)] + [C(3P1)] + [C(3P2)]}
F1 = [C(3P1)] / {[C(3P0)] + [C(3P1)] + [C(3P2)]}
F2 = [C(3P2)] / {[C(3P0)] + [C(3P1)] + [C(3P2)]}

BR-I BR-II BR-III
(4sσ)1Σ+(v=4) 0.62±0.03 0.09±0.01 0.08±0.01
(4pσ)1Σ+(v=3) 0.37±0.02 0.03±0.02 0.12±0.01
(4pπ)1Π(v=3) 0.20±0.01 0.59±0.03 0.13±0.01
C(3P2)+O(1D) C(3P1)+O(1D) C(3P0)+O(1D) C(3P2)+O(3PJ) C(3P1)+O(3PJ) C(3P0)+O(3PJ)
(4sσ)1Σ+(v=4) 1.7±0.3 0.9±0.2 42.4±3.0 19.3±2.0 9.1±1.9 26.6±2.3
(4pσ)1Σ+(v=3) 2.7±0.4 0.7±0.4 19.7±1.6 19.3±1.9 23.3±2.3 34.3±2.2
(4pπ)1Π(v=3) 4.3±1.1 23.4±3.4 5.5±0.9 27.7±4.8 16.6±2.7 22.5±3.3
Correlated fine structure distribution of the channel C(3P0,1,2)+O(1D2)
Thank you:
Greetings from Ng Group 2013