state university of...
TRANSCRIPT

STATE UNIVERSITY OF CAMPINAS
Faculty of Chemical Engineering (FEQ)
MICHELLE DA CUNHA ABREU XAVIER
LIPID PRODUCTION FROM HEMICELLULOSIC HYDROLYSATE OF
SUGARCANE BAGASSE AND METABOLIC ENGINEERING OF YEAST
Lipomyces starkeyi
PRODUÇÃO DE LIPÍDIOS A PARTIR DO HIDROLISADO
HEMICELULÓSICO DO BAGAÇO DE CANA E ENGENHARIA METABÓLICA
DA LEVEDURA Lipomyces starkeyi
Campinas-SP
2016

MICHELLE DA CUNHA ABREU XAVIER
LIPID PRODUCTION FROM HEMICELLULOSIC HYDROLYSATE OF
SUGARCANE BAGASSE AND METABOLIC ENGINEERING OF YEAST
Lipomyces starkeyi
PRODUÇÃO DE LIPÍDIOS A PARTIR DO HIDROLISADO
HEMICELULÓSICO DO BAGAÇO DE CANA E ENGENHARIA METABÓLICA
DA LEVEDURA Lipomyces starkeyi
Supervisor: Prof. Dra. TELMA TEIXEIRA FRANCO
Campinas-SP
2016
Thesis presented to the Faculty of Chemical Engineering of the State University of Campinas in partial fulfillment of the requirements for the degree of Doctor in Chemical Engineering.
THIS COPY CORRESPONDS TO THE FINAL VERSION OF THESIS DEFENDED BY MICHELLE DA CUNHA ABREU XAVIER AND SUPERVISED BY PROF. Dra. TELMA TEIXEIRA FRANCO.
Tese apresentada à Faculdade de Engenharia Química da Universidade Estadual de Campinas como parte dos requisitos exigidos para a obtenção do título de Doutora em Engenharia
Química.

Agência(s) de fomento e nº(s) de processo(s): CAPES, 33003017034P8; CNPq,159739/2012-8
Ficha catalográficaUniversidade Estadual de Campinas
Biblioteca da Área de Engenharia e ArquiteturaLuciana Pietrosanto Milla - CRB 8/8129
Xavier, Michelle da Cunha Abreu, 1985- X19L XavLipid production from hemicellulosic hydrolysate of sugarcane bagasse and
metabolic engineering of yeast Lipomyces starkeyi / Michelle da Cunha AbreuXavier. – Campinas, SP : [s.n.], 2016.
XavOrientador: Telma Teixeira Franco. XavTese (doutorado) – Universidade Estadual de Campinas, Faculdade de
Engenharia Química.
Xav1. Bagaço de cana. 2. Lipídios. 3. Biocombustível. 4. Leveduras. 5.
Engenharia genética. I. Franco, Telma Teixeira,1957-. II. UniversidadeEstadual de Campinas. Faculdade de Engenharia Química. III. Título.
Informações para Biblioteca Digital
Título em outro idioma: Produção de lipídios a partir do hidrolisado hemicelulósico dobagaço de cana e engenharia metabólica da levedura Lipomyces starkeyiPalavras-chave em inglês:Sugarcane bagasseLipidsBiofuelYeastGenetic engineeringÁrea de concentração: Engenharia de ProcessosTitulação: Doutora em Engenharia QuímicaBanca examinadora:Telma Teixeira Franco [Orientador]Thiago Olitta BassoJaciane Lutz IenczakOtávio CavalettMarcelo Mendes BrandãoData de defesa: 18-02-2016Programa de Pós-Graduação: Engenharia Química
Powered by TCPDF (www.tcpdf.org)

Doctoral thesis defended by Michelle da Cunha Abreu Xavier and approved on
February 18th, 2016 by the examining committee consisting of doctors:
________________________________________________ Prof. Dra. Telma Teixeira Franco (Supervisor)
________________________________________________ Prof. Dr. Thiago Olitta Basso
________________________________________________ Dra. Jaciane Lutz Ienczak
________________________________________________ Dr. Otávio Cavalett
________________________________________________ Dr. Marcelo Mendes Brandão
The defense document with the signatures of the members is in the academic
life of the student process.
DEDICATION
I dedicate this achievement to God, the author of my destiny and my guide, and
to my parents Ireni Abreu and Geraldo Xavier, essential in my life, which
supported and believed me during this long journey.
“Para se ter algo que você nunca teve, é preciso fazer algo que você nunca fez”. (Chico Xavier)
“A persistência é o menor caminho do êxito”. (Charles Chaplin)

ACKNOWLEDGMENT
Agradeço imensamente a Deus pela força e coragem caminho durante
esta caminhada me permitindo concluir com sucesso esta etapa.
Agradeço aos meus pais pоr acreditar еm mіm, por compreender a
minha ausência em muitos momentos especiais em família e por suportar a
minha distância. À minha mãe, Ireni Abreu, por seu cuidado e dedicação, por
nunca medir esforços para me ajudar a realizar os meus sonhos e que sempre
esteve ao meu lado em todos os momentos de alegrias e dificuldades e nunca
me deixou desistir. Ao meu pai, Geraldo Xavier, pelo carinho e admiração. Aos
meus irmãos Geraldo Júnior, Edvan, Maguiânia e Magna pela torcida e apoio.
Com vocês tenho segurança e certeza de que nunca estive sozinha nessa
caminhada.
Ao meu noivo, meu amor Sergio Andres, com quem amo partilhar a vida
e que de forma especial e carinhosa me deu força e coragem, me apoiando
nos momentos de dificuldades. Obrigada pelo incentivo, paciência e por
suportar a distância, o sofrimento e renúncias durante o meu Doutorado
sanduíche nos USA. Você foi, junto com minha família, o maior suporte que tive
durante o Doutorado. Obrigada por seu amor, companheirismo, cumplicidade e
por sua capacidade de me trazer paz na correria e dificuldades enfrentadas,
tornando esta árdua etapa muito mais leve e saudável! Esta conquista é nossa!
Obrigada por estar ao meu lado em todos os momentos e ser minha família
aqui! Te amo!
Ao tio Raimundo Abreu por todo o apoio e por acreditar no meu
potencial!
À minha orientadora, Telma Franco, por acreditar no meu potencial, pelo
suporte e por todas as oportunidades que me foram dadas tornando possível a
conclusão deste trabalho.

Aos amigos do laboratório LEBBPOR com quem convivi ao longo desses
anos, compartilhando experiências, ganhando conhecimentos, dividindo
alegrias e preocupações e formando grandes parcerias. Obrigada a cada um
pela convivência diária tornando o ambiente mais descontraído.
Aos amigos Vinícius Maciel e Jaiver Efrén, pelos momentos desfrutados
juntos, por cada alegria e tristeza divida, pelo companheirismo e apoio.
Obrigada por podermos compartilhar os problemas e apoiar uns aos outros,
pelos momentos de descontração e por cada gargalhada que contagiava e fez
com que tudo fosse mais fácil nessa jornada. Obrigada pela grande amizade e
por serem meus irmãos compondo junto com o Sergio, Bianca, Matheus e
Giselle minha família aqui em Campinas.
Às secretárias do Depro, Rosângela e Fabiane, por toda força e quebra-
galho nos processos burocráticos.
Agradeço ao prof. Dr. Carlos Rossell pela parceria com este projeto,
fornecendo o bagaço de cana e nos permitir realizar alguns pré-tratamentos do
bagaço de cana nas instalações do CTBE. Obrigada ao Thiago de Assis pela
ajuda na utilização do reator Parr.
Ao prof. Dr. Adam Arkin por me aceitar no Energy Bioscience Institute
(EBI)-University of California-Berkeley (UCB), USA para realizar parte desta
pesquisa. Ao Dr. Jeffrey Skerker e Msc. Masakazu Ito por toda a orientação e
paciência nos ensinamentos de engenharia metabólica. Em especial ao meu
amigo Masa, por sua amizade e apoio durante esta fase e principalmente por
toda a paciência e ajuda em cada etapa do meu aprendizado! Agradeço
imensamente por tudo! Aos amigos que fiz no EBI e que de uma forma ou de
outra me ajudaram no convívio diário e me deram suporte de alguma maneira.
Aos queridos amigos Jessie e Glauber, que me acolheram e foram
minha família em Berkeley tornando a distância e a saudade da família menos
difícil. Obrigada por cada momento de alegria, por dividir as preocupações e
dificuldades e por todo o amor e carinho que me deram.

Aos amigos fofos, Julie e Joe, pelo carinho e companheirismo. Obrigada
por cada caminhada à brisa da Baía de San Francisco, cada conversa,
conselho e lindos momentos vividos. Vocês são um exemplo de casal! Que
sorte a minha ter conhecido vocês! Obrigada por me fazer sentir muito especial
e por iluminarem de maneira especial meus dias em Berkeley! Vocês são muito
importantes para mim!
À CAPES, CNPq e Shell pelo apoio financeiro no desenvolvimento deste
trabalho.
A todos aqueles qυе dе alguma forma estiveram е estão próximos dе
mim, fazendo esta vida valer cada vеz mais а pena!
Muito Obrigada!

RESUMO
Preocupações com a escassez das reservas de petróleo e as mudanças climáticas têm impulsionado as investigações em busca de biocombustíveis renováveis e sustentáveis, como o biodiesel, como fontes alternativas aos combustíveis fósseis. O alto custo da produção de biodiesel e a competição com alimentos têm apresentado restrições à sua produção econômica e a utilização de substratos de baixo custo e renováveis, como o bagaço de cana, torna-se necessária. Os óleos microbianos têm sido uma alternativa promissora para a produção rentável de biocombustível. A conversão microbiana da fração hemicelulósica é essencial para o aumento da produção de biocombustíveis, e o uso de microrganismos capazes de superar as dificuldades em relação aos inibidores gerados durante a hidrólise da fração hemicelulósica, são desejáveis para essa proposta. Lipomyces starkeyi oferece grande potencial para ser usado na produção de biocombustíveis e produtos químicos devido à sua habilidade em utilizar uma variedade de fontes de carbono e produzir lipídios. Contudo, a plataforma microbiana para a produção de biocombustíveis apresenta muitos desafios em relação à produção baseado em cultura, e a engenharia metabólica estabelece-se como uma tecnologia capacitante para o desenvolvimento de biocombustíveis. No entanto, ainda há poucas ferramentas genéticas para transformar a L. starkeyi. Neste contexto, este trabalho estudou a produção de lipídios a partir do hidrolisado hemicelulósico (HH) do bagaço de cana e a engenharia metabólica da L. starkeyi DSM 70296 visando aumentar a produção de lipídios. Perfis cinéticos similares foram observados para as fermentações de xilose e HH. O aumento da concentração de inóculo aumentou consideravelmente o acúmulo de lipídio de 29,1% para 36,8% para o cultivo de xilose e de 27,8% para 44,8% para o cultivo em HH. L. starkeyi apresentou tolerância ao furfural, ácido acético e hidroximetilfurfural (HMF) presentes no HH e, além disso, estes inibidores foram reduzidos durante a fermentação, provavelmente devido ao metabolismo da levedura. O cultivo de ácido acético mostrou que a levedura foi capaz de utilizar este inibidor para crescimento celular (0,9 g/L) e biossíntese de lipídios (28,8%). Transformação mediada por Agrobacterium tumefaciens (ATMT) foi o método mais eficiente e confiável para a transformação da L. starkeyi e a superexpressão dos genes ACC1 (Acetyl-CoA carboxylase) e DGA1(Diacylglycerol Acyltransferase), envolvidos na biossíntese de lipídios, proporcionaram maior acúmulo de lipídios, com DGA1 apresentando efeito dominante. Estes resultados mostraram que L. starkeyi apresentou características robustas e favoráveis como um microrganismo promissor capaz de converter os açúcares hemicelulósicos em lipídios e a possibilidade de alteração da expressão de genes-alvo e vias metabólicas por engenharia genética ajudaria a melhorar a produtividade lipídica, possibilitando tornar este microrganismo como plataforma para produção de bioprodutos derivados de lipídios.
Palavras-chave: Levedura, Hidrolisado hemicelulósico, Bagaço, Lipídio microbiano, Lipomyces starkeyi, Biocombustível, Biomassa lignocelulósica, Engenharia metabólica.

ABSTRACT
Concerns about the shortage of oil reserves and climate changes have stimulate the investigation of renewable and sustainable biofuels, such as biodiesel, as alternative source to fossil fuels. Sugarcane bagasse (SCB) represents a potentially less expensive and renewable source of fermentable sugars which can be converted into biofuels and chemicals. The high cost of biodiesel production and competition with foods have shown restrictions on economic production and the microbial oil, named Single Cell Oil (SCO), has been promising alternative to for the cost-effective production of biofuels. The microbial conversion of hemicellulose fraction is essential for increased production of biofuels, and the use of microorganisms able of overcoming the difficulties related to inhibitors generated during hydrolysis of hemicellulosic fraction, are desirable for these purposes. Lipomyces starkeyi, oleaginous yeast, offers great potential to be used in biofuel and chemical production because it is able to utilize a variety of carbon sources and produce lipids. However, microbial platforms for biofuel production are challenging to culture-based production and metabolic engineering is established as enabling technology for the development of biofuels. Nevertheless, there are few genetic tools to transform L. starkeyi. Therefore, this work studied the lipid production from hemicellulosic hydrolysate of sugarcane bagasse and metabolic engineering of L. starkeyi DSM70296 to increase the lipid production. Similar kinetic profiles were observed for the xylose and HH fermentation; however, higher biomass production was obtained when L. starkeyi was cultivated in HH. Increasing the concentration of inoculum greatly increased the lipid accumulation from 29.1% to 36.8% for xylose cultivation and from 27.8% to 44.8% for HH cultivation. L. starkeyi had tolerance to furfural, acetic acid and hydroxymethylfurfural present in HH and, furthermore, these inhibitors were depleted during fermentation due the metabolism of yeast. Acetic acid cultivation showed that the yeast was able to use this inhibitor for growth (0.9 g/L) and lipid biosynthesis (28.4%). Agrobacterium tumefaciens-mediated transformation (ATMT) was the most efficient and reliable method for L. starkeyi transformation and overexpressing ACC1 (Acetyl-CoA carboxylase) and DGA1 (Diacylglycerol Acyltransferase) genes, involved in lipid biosynthesis, provided an increasing of fatty acid content, with DGA1 having the dominant effect. These results demonstrated that L. starkeyi showed robust and favorable characteristics as a promising microorganism capable of converting hemicellulosic sugar into lipids, and the possibility of change targeted gene expressions and metabolic pathways by genetic engineering would improve the lipid productivity, enabling to make this microorganism as platform for the lipid-based products.
Keywords: Yeast, Hemicellulosic hydrolysate, Bagasse, Microbial lipid,
Lipomyces starkeyi, Biofuel, Lignocellulosic biomass, Metabolic engineering.

FIGURE LIST
Figure 1. Total energy consumed in the world in 2011. (A) World energy
consumption, (B) Details about world renewable energy consumption (19%). Adapted
of BALAN, (2014). ..................................................................................................... 26
Figure 2. Concept of petroleum refinery and biorefinery. Adapted of KAMM & KAMM,
(2004). ....................................................................................................................... 27
Figure 3. Biorefinery from lignocellulosic materials. Adapted of KAMM & KAMM,
(2004). ....................................................................................................................... 28
Figure 4. Biodiesel obtaining process (FEOFILOVA et al., 2010). ............................ 29
Figure 5. Overview of metabolic pathways for lipid synthesis in Lipomyces starkeyi
from xylose and glucose as the carbon source. The main pathway of lipid synthesis is
highlighted in blue and red. G3P: Glyceraldehyde 3-phosphate; TCA Cycle:
tricarboxylic acid cycle; ACC: acetyl-CoA carboxylase; DGA: diacylglycerol
acyltransferase TAG: triacylglycerol; DAG: diacylglycerol; PA: phosphatidic acid;
OAA: oxaloacetate; a-KG: alpha-ketoglutarate; PEP: phosphoenolpyruvate; DHAP:
dihydroxyacetone phosphate; LPA: lysophosphatidic acid; MD: malate
dehydrogenase; ME: malic enzyme; PC: pyruvate carboxylase, FAS: fatty acid
synthase. GPAT: G3P acyltransferase; LPAT: ALP- acyltransferase PAP:
phosphatidate phosphatase. Adapted of ZHU & JACKSON, (2015); TAI &
STEPHANOPOULOS, (2013); BEOPOULOS et al., (2009). ..................................... 36
Figure 6. Overview of metabolic pathways for lipid synthesis in Lipomyces starkeyi
from xylose and glucose as the carbon source. The main pathway of lipid synthesis is
highlighted in blue and red. G3P: Glyceraldehyde 3-phosphate; TCA Cycle:
tricarboxylic acid cycle; ACC: acetyl-CoA carboxylase; DGA: diacylglycerol
acyltransferase TAG: triacylglycerol; DAG: diacylglycerol; PA: phosphatidic acid;
OAA: oxaloacetate; a-KG: alpha-ketoglutarate; PEP: phosphoenolpyruvate; DHAP:
dihydroxyacetone phosphate; LPA: lysophosphatidic acid; MD: malate
dehydrogenase; ME: malic enzyme; PC: pyruvate carboxylase, FAS: fatty acid
synthase; GPAT: G3P acyltransferase; LPAT: ALP- acyltransferase PAP:
Phosphatidate phosphatase, FA: Fatty acid; FAT: Fatty acid transport; TGL: TAG
lipase; DGAT: diacylglycerol acyltransferase; Pex3 and Pex10, peroxisome

biogenesis factor 3 and 10, respectively; Pox1 to Pox6, acyl-CoA oxidases 1–6,
respectively; Mfe1: multifunctional enzyme; GPD: glycerol-3-phosphate
dehydrogenase; ER: Endoplasmic reticulum. Adapted of BEOPOULOS et al., (2011);
TAI & STEPHANOPOULOS, (2013); BEOPOULOS et al., (2009); ZHU & JACKSON,
(2015). ....................................................................................................................... 41
Figure 7. Structure of lignocellulosic biomass. Adapted of CANILHA et al., (2009). . 47
Figure 8. Lignocellulosic complex after pretreatment. Cellulose microfibrils (green),
hemicellulose (light green) and lignin (brown). “Center for Molecular Biophysics”
Thomas Splettstoesser. LANGAN et al., (2014). ....................................................... 50
Figure 9. Structural profile of inhibitors derived of lignocellulosic biomass. Adapted of
CHANDEL et al., (2011). ........................................................................................... 52
Figure 10. Obtaining process of hemicellulose hydrolysate (HH). Abbreviation: S: L =
solid: liquid. ................................................................................................................ 59
Figure 11. Xylose, glucose and arabinose concentration on HH. ............................. 63
Figure 12. Loss of sugars after the detoxification treatments of HH. (A) H2SO4 1.5 %
(m/v), 20 min; (B) H2SO4 2 % (m/v), 24 min. Treatments 1: Ca(OH)2 - increase the pH
to 8.5 and decrease to 4.0; 2: Ca(OH)2 - increase the pH to 7.0 and decrease to 5.5;
3: Ca(OH)2 - increase the pH to 5.5, 4: Charcoal; 5: Ca(OH)2 increase the pH to 8.5
and decrease to 4.0 + Charcoal. ............................................................................... 66
Figure 13. Removal of inhibitors after the detoxification treatments of HH. (A)
Furfural; (B) HMF; (C) Ácido acético. Treatments 1: Ca(OH)2 - increase the pH to 8.5
and decrease to 4.0; 2: Ca(OH)2 - increase the pH to 7.0 and decrease to 5.5; 3:
Ca(OH)2 - increase the pH to 5.5, 4: Charcoal; 5: Ca(OH)2 increase the pH to 8.5 and
decrease to 4.0 + Charcoal. ...................................................................................... 67
Figure 14. Xylose, acetic acid and furfural concentration after the acid hydrolysis of
sugarcane bagasse on the experimental design. ...................................................... 70
Figure 15. Pareto chart for estimating the effects of H2SO4 concentration (1) and
residence time (2) in the production of glucose (A), xylose (B) and arabinose (C)
generated in the hydrolysis of sugarcane bagasse at 120°C..................................... 72
Figure 16. Pareto chart for estimating the effects of H2SO4 concentration (1) and
residence time (2) for the production of acetic acid (A) furfural and (B) generated in
the hydrolysis of sugarcane bagasse at 120°C. ........................................................ 74

Figure 17. Response surface plots (a) and contour curve (b) obtained from Equation
4 showing the effect of H2SO4 concentration, residence time and their combined
interaction in the concentration of furfural.................................................................. 75
Figure 18. Pareto chart for estimating the effects of H2SO4 concentration (1) and
residence time (2) in the production of HMF generated in the hydrolysis of sugarcane
bagasse at 120°C. ..................................................................................................... 76
Figure 19. Schematic diagram of lignocellulosic ethanol production from sugarcane
bagasse (2G) and alternatives for pentose use as biodiesel production or value-
added chemicals. SCB (Sugarcane Bagasse). .......................................................... 81
Figure 20. Adaptation procedure of L. starkeyi to HH. .............................................. 83
Figure 21. Scheme of fermentations of synthetic, HH and AA medium. ................... 84
Figure 22. DCW profile of L. starkeyi in HH during the adaptation phases. (A) HHA;
(B) HHR. () AD-1, (∆) AD-2. .................................................................................... 88
Figure 23. Kinetic profile of L. starkeyi during the adaptation phase AD-7 in HH. (A)
HHA; (B) HHR. (♦) Xylose, () Glucose, () Arabinose, (∆) DCW. All analyzes were
performed in triplicate and error bars denote the standard deviation. ....................... 90
Figure 24. Kinetic profile of inhibitors during the adaptation phase AD-7 of L. starkeyi
to HH. (A) HHA; (B) HHR. () Acetic acid, () Furfural, () HMF. All analyzes were
performed in triplicate and error bars denote the standard deviation. ....................... 91
Figure 25. Kinetic profile of L. starkeyi cell growth during synthetic medium
fermentation in shaking flasks using 1.0 g/L of inoculum. (♦) Xylose; (∆) DCW. ........ 92
Figure 26. Kinetic profile of L. starkeyi during fermentation of HHA in shaking flasks
using 1.0 g/L of inoculum. (A) Cell growth and sugars consumption: (♦) Xylose, ()
Glucose, () Arabinose, (∆) DCW; (B) Inhibitors: () Acetic acid, () Furfural, ()
HMF........................................................................................................................... 93
Figure 27. Kinetic profile of L. starkeyi during fermentation of HHR in shaking flasks
using 1.0 g/L of inoculum. (A) Cell growth and sugars consumption: (♦) Xylose, ()
Glucose, () Arabinose, (∆) DCW; (B) Inhibitors: () Acetic acid, () Furfural, ()
HMF........................................................................................................................... 94
Figure 28. Continuous cultivations of HHA at 0.03 h-1. (A) Sugars, DCW and Lipids
content; (B) Inhibitors. (♦) Xylose, () Glucose, () Arabinose, (∆) DCW, (◊) Lipids;
(B) Inhibitors: () Acetic acid, () Furfural, () HMF. The continuous cultivation was
started at 0 h after a batch stage (negative scale). .................................................... 99

Figure 29. Consumption of acetic acid and cell growth of L. starkeyi during cultivation
of acetic acid in shaking flasks. () Acetic acid, (∆) DCW, (◊) Nitrogen. We performed
all analyzes in triplicate and error bars denote the standard deviation. ................... 102
Figure 30. Genetic maps of plasmids pGI2 (A) and G19 (B) used in the construction
of plasmid pGI18. .................................................................................................... 111
Figure 31. Electrophoresis of PCR products from colony PCR in 1.2% agarose gel to
check the integration of NAT or HYG cassette. MW: Molecular Weight-1 Kb Plus
DNA Ladder. (A) Colonies from pGI18,19,20; (B) Colonies from pGI21. ................. 121
Figure 32. Putative mechanism of transformation by LiAc (Adapted of KAWAI et al.
(2010). ..................................................................................................................... 122
Figure 33. Agrobacterium tumefaciens mediated transformation mechanism (A) and
an example of a binary plasmid used to transform Lipomyces (B). (Adapted of
Dominic Pinel, 2015: In preparation) ....................................................................... 124
Figure 34. Lipomyces colonies formed in YPD plates supplemented with NAT 30
µg/mL (A) and HYG 20 µg/mL (B) and restreaked at the same plate to isolate
individual clones generated by LiAc transformation. ............................................... 127
Figure 35. Electrophoresis of PCR products from gDNA of Lipomyces transformants
in 1.2% agarose gel to check the integration of NAT (A) and HYG (B) cassettes into
the Lipomyces genome by LiAc transformation method. MW: Molecular Weight-1 Kb
Plus DNA Ladder. .................................................................................................... 127
Figure 36. Lipomyces colonies formed in YPD plates supplemented with NAT 30
µg/mL (A) and HYG 20 µg/mL (B, C) and restreaked at the same plate to isolate
individual clones generated by ATMT transformation. ............................................. 128
Figure 37. Electrophoresis of PCR products from gDNA of Lipomyces transformants
in 1.2% agarose gel to check the integration of NAT (A) and HYG (B, C) cassettes
into the Lipomyces genome by ATMT transformation method. MW: Molecular Weight-
1 Kb Plus DNA Ladder. ........................................................................................... 129
Figure 38. Overview of metabolic pathways for lipid synthesis with glucose as the
carbon source in oleaginous yeast. The main pathway of lipid synthesis is highlighted
in blue and red. G3P: Glyceraldehyde 3-phosphate; TCA Cycle: tricarboxylic acid
cycle; ACC: acetyl-CoA carboxylase; DGA: diacylglycerol acyltransferase TAG:
triacylglycerol; DAG: diacylglycerol; PA: phosphatidic acid; OAA: oxaloacetate; a-KG:
alpha-ketoglutarate; PEP: phosphoenolpyruvate; DHAP: dihydroxyacetone
phosphate; LPA: lysophosphatidic acid; MD: malate dehydrogenase; ME: malic

enzyme; PC: pyruvate carboxylase, FAS: fatty acids synthase; GPAT: G3P
acyltransferase; LPAT: ALP- acyltransferase PAP: phosphatidate phosphatase.
Adapted of TAI & STEPHANOPOULOS, 2013). ..................................................... 131
Figure 39. Simplified scheme of fatty acid desaturation by Δ-9 fatty acid desaturase.
................................................................................................................................ 132
Figure 40. Electrophoresis of PCR products from colony PCR in 1.2% agarose gel to
check the integration of ACC, DGA, FAD9 cassettes. MW: Molecular Weight-1 Kb
Plus DNA Ladder. (A) Colonies from pGI25; (B) pGI26, pGI27; (C) pGI29; (D) pGI30.
................................................................................................................................ 135
Figure 41. Lipomyces colonies formed in YPD plates supplemented with NAT 30
µg/mL or HYG 20 µg/mL (A) and 4 colonies from each transformant restreaked at the
same plate to isolate individual clones (B) generated by ATMT transformation. ..... 138
Figure 42. Electrophoresis of PCR products from gDNA of wild type (WT) and drug-
resistant transformants of Lipomyces LS 25-ACC1, LS 26-DGA1, LS 27-FAD9.1, LS
29-DGA1, LS 30-FAD9.1) (APA 4345, APA 4348, APA 4351, 4248, APA 4354) in
1.2% agarose gel to check for integration of T-DNA into Lipomyces genome after
ATMT transformation. MW: Molecular Weight-1 Kb Plus DNA Ladder. ................... 139
Figure 43. Fluorescence microscopy image of wild type Lipomyces, after 120h
growth in lipid induction medium, stained with BODIPY and calcofluor white.......... 140
Figure 44. Fluorescence microplate assay of wild type (WT) and engineered
Lipomyces overexpression strains (ACC1, DGA1, FAD9.1) cultured in low nitrogen
YPD medium for 96 and 120h (Single measurements with no replicates). .............. 141
Figure 45. Restreak of 24 colonies of wild type and of each DNA construction
transformants (LS 25-ACC1, LS 26-DGA1, LS 27-FAD9.1) to be used on BODIPY +
calcofluor white microplate assay. ........................................................................... 142
Figure 46. Fluorescence microplate assay of wild type (WT) and engineered
Lipomyces (ACC1,DGA1,FAD9.1) cultured in YPD low nitrogen medium for 120h.
Error bars: deviation of 3 biological replicates. ........................................................ 143
Figure 47. Fluorescence average of 24 colonies of wild type and engineered
Lipomyces cultured in YPD low nitrogen medium for 120h. Error bars: deviation of 3
biological replicates. ................................................................................................ 144
Figure 48. Total fatty acid (FA) produced by wild type and engineered L. starkeyi
culture in YPD low nitrogen medium for 120h analyzed by CG/MS. ........................ 145

Figure 49. Fatty acid profile of lipid produced by wild type and engineered Lipomyces
expressing ACC1, DGA1 and FAD9.1 genes cultured in low nitrogen YPD medium
for 120h. Error bars: deviation of 4 biological replicates selected on Figure 48. ...... 146
Figure 50. Electrophoresis of PCR products from potential double OE Lipomyces
ATMT transformants (LS ACC1+DGA1 and LS ACC1+FAD9.1) in 1.2% agarose gel.
The presence of bands indicates either the NATR (724 bp) or HYGR (787 bp), which
confirms integration of the T-DNA cassette. MW: Molecular Weight-1 Kb Plus DNA
Ladder. .................................................................................................................... 149

TABLE LIST
Table 1. Lipid content of some microorganisms and oil plants (SAWANGKEAW &
NGAMPRASERTSITH et al., 2013) ........................................................................... 33
Table 2. Fatty acid profile of some oleaginous yeast ................................................ 34
Table 3. Performance of lipid production from lignocellulosic biomass with different
microorganisms ......................................................................................................... 54
Table 4. Detoxification methods of HH ...................................................................... 61
Table 5. Factorial design 22 with real and coded values............................................ 62
Table 6. Composition of HH obtained by acid hydrolysis of sugarcane bagasse under
the conditions tested in this work ............................................................................... 64
Table 7. Experimental design matrix with actual values and experimental results for
factorial design. ......................................................................................................... 70
Table 8. ANOVA for the production of acetic acid in HH ........................................... 74
Table 9. ANOVA for the concentration of furfural in HH ............................................ 75
Table 10. Composition of hemicellulosic hydrolysate (HHR) obtained by acid
hydrolysis in Parr reactor and comparison with the HHA obtained in autoclave. ........ 78
Table 11. Chemical characterization of in natura sugarcane bagasse and pretreated
by acid hydrolysis in reactor Parr .............................................................................. 78
Table 12. Maximum specific growth rate (µmáx) of L. starkeyi during the adaptation
phases in HH. ............................................................................................................ 89
Table 13. Kinetic parameters obtained of L. starkeyi grown on xylose and HH in
shaking flasks and bioreactor experiments................................................................ 97
Table 14. Microbial oil production on lignocellulosic hydrolysates. ......................... 100
Table 15. Comparison of fatty acids profiles of L. starkeyi in different cultivations and
palm oil. ................................................................................................................... 105
Table 16. Plasmids and primers used in this study ................................................. 109
Table 17. Primers used in this study ....................................................................... 110
Table 18. PCR (Hot Start Flex DNA polymerase) of fragments for the construction of
ACC1, DGA1 and FAD9.1 overexpressing plasmids ............................................... 112
Table 19. DNA constructions and the results of plasmids assembly ....................... 120
Table 20. Results of Lipomyces starkeyi transformation by LiAc and ATMT methods
................................................................................................................................ 125

Table 21. DNA constructions integrating the ACC1, DGA1 and FAD9.1 genes and
the results of plasmids assembly ............................................................................. 134
Table 22. Results of overexpression of ACC1, DGA1 and FAD9.1 in L. starkeyi by
ATMT....................................................................................................................... 136
Table 23. Double overexpression of LS transformants by ATMT ............................ 148
Table 24. Double OE of L. starkeyi by electroporation ........................................... 151

NOMENCLATURE
Abbreviation
2G ethanol Second generation ethanol
ACC1 Acetyl-CoA carboxylase
AOX1 Aldehyde oxidase
AS Acetosyringone
AT Agrobacterium tumefaciens
ATMT Agrobacterium tumefaciens- mediated transformation
CFW Calcofluor White
DCW Dry cell weight
DGA1 Diacylglycerol Acyltransferase
FA Fatty acid
FAD9.1 Fatty acyl-CoA delta 9 desaturase
gDNA genomic DNA
HH Hemicellulosic hydrolysate
HHA Hemicellulosic hydrolysate obtained by autoclave
HHE Hemicellulosic hydrolysate obtained by steam explosion
HHR Hemicellulosic hydrolysate obtained by Parr reactor
IM Induction medium
LB Luria Bertani medium
LiAc Lithium acetate
LS Lipomyces starkeyi
MUFA Monounsaturated fatty acid
OE Overexpression
OMW Oil mill wastewaters
PCR Polymerase chain reaction
PEG Polyethylene Glycol
PGK1 3-phosphoglycerate kinase

SCB Sugar cane bagasse
SCO Single cell oil
SF Severity factor
ssDNA Single-stranded salmon sperm carrier
TAG Triacylglyceride
TDH Glyceraldehyde-3-phosphate dehydrogenase
Tfm Transformant
Ti Tumor-inducing
WT Wild type

SUMMARY
RESUMO ..................................................................................................................... 6
ABSTRACT ................................................................................................................. 7
FIGURE LIST .............................................................................................................. 8
TABLE LIST .............................................................................................................. 14
NOMENCLATURE .................................................................................................... 16
CHAPTER 1. INTRODUCTION ............................................................................... 21
1.1. GENERAL OBJECTIVE ............................................................................... 24
1.1.1. SPECIFIC OBJETIVES .................................................................................... 24
CHAPTER 2. LITERATURE REVIEW ................................................................... 25
2.1. ENERGY OUTLOOK .......................................................................................... 25
2.2. BIODIESEL ...................................................................................................... 28
2.3. MICROBIAL LIPID PRODUCTION ......................................................................... 30
2.3.1. Oleaginous yeasts ................................................................................. 31
2.3.1.1. Lipomyces starkeyi ................................................................................ 35
2.3.1.1.1. Metabolic engineering and transformation of yeast Lipomyces starkeyi
............................................................................................................................ 39
2.3.2. Culture mode of operations.................................................................... 43
2.4. RAW MATERIAL FOR SCO PRODUCTION ............................................................ 45
2.4.1. Lignocellulosic materials ........................................................................ 45
2.4.1.1. Sugarcane bagasse............................................................................ 47
2.4.1.2. Pretreatment of lignocellulosic biomass ............................................. 49
2.4.1.2.1. Acid hydrolysis.................................................................................... 51
2.4.1.3. Detoxification methods ....................................................................... 52
2.4.1.4. Hemicellulose fraction for production of microbial lipids ..................... 55
CHAPTER 3. OBTAINING OF HEMICELLULOSIC HYDROLYSATE (HH) FROM
SUGARCANE BAGASSE ......................................................................................... 57
3.1. INTRODUCTION .................................................................................................. 57
3.2. MATERIAL AND METHODS .................................................................................... 58
3.2.1. Raw material ............................................................................................. 58
3.2.2. Determination of moisture of sugarcane bagasse ..................................... 58
3.2.3. Strategies for obtaining hemicellulosic hydrolysate from sugarcane
bagasse .............................................................................................................. 58
3.2.3.1. Acid hydrolysis in autoclave ................................................................... 58
3.2.3.1.1. Severity factor ..................................................................................... 60
3.2.3.1.1. Detoxification procedures of HH ......................................................... 60
3.2.3.2. Experimental design to increase the sugars concentration of HH .......... 61
3.2.3.3. Acid hydrolysis in Parr reactor ............................................................... 62
3.3. RESULTS AND DISCUSSION.................................................................................. 62
3.3.1. Hemicellulosic hydrolysate (HH) from sugarcane bagasse obtained by
autoclave ............................................................................................................ 62
3.3.1.1. Detoxification of HH obtained by autoclave ........................................... 64

3.3.2. Experimental design to increase the sugars concentration on HH ............ 68
3.3.3. Obtaining the HH by Parr reactor .............................................................. 77
3.4. CONCLUSION ..................................................................................................... 79
CHAPTER 4. HEMICELLULOSIC HYDROLYSATE OF SUGARCANE BAGASSE
AS CARBON SOURCE FOR CONVERSION INTO LIPIDS BY LIPOMYCES
STARKEYI ................................................................................................................ 80
4.1. INTRODUCTION .................................................................................................. 80
4.2. MATERIALS AND METHODS .................................................................................. 81
4.2.1. Strain and media ....................................................................................... 81
4.2.2. Culture conditions ..................................................................................... 82
4.2.2.1. Adaptation of L. starkeyi to hemicelullosic hydrolysate (HH) ................. 82
4.2.2.2. Fermentations ........................................................................................ 83
4.2.3. Analytical methods .................................................................................... 84
4.2.3.1. Cells assessment ................................................................................... 84
4.2.3.2. Carbohydrates determination ................................................................. 85
4.2.3.3. Acetic acid determination ....................................................................... 85
4.2.3.4. Furfural and hydroxymethylfurfural (HMF) determination ....................... 85
4.2.3.5. Lipids content determination .................................................................. 86
4.2.3.6. Nitrogen determination ........................................................................... 86
4.2.3.7. Fatty acids composition ......................................................................... 86
4.3. RESULTS AND DISCUSSION.................................................................................. 87
4.3.1. Adaptation of L. starkeyi to hemicellulosic hydrolysate (HH) .................... 87
4.3.2 Fermentation .............................................................................................. 91
4.3.3. Fatty acid profile and cetane number estimation..................................... 103
4.4. CONCLUSIONS ................................................................................................. 106
CHAPTER 5. METABOLIC ENGINEERING OF THE OLEAGINOUS YEAST
LIPOMYCES STARKEYI FOR INCREASED LIPID PRODUCTION ...................... 107
5.1. INTRODUCTION ................................................................................................ 107
5.2. MATERIAL AND METHODS .................................................................................. 108
5.2.1. Strains, medium and growth conditions .................................................. 108
5.2.2. Plasmid construction ............................................................................... 108
5.2.3. Lipomyces starkeyi transformation .......................................................... 112
5.2.3.1. Lithium acetate (LiAc) .......................................................................... 112
5.2.3.2. Agrobacterium tumefaciens mediated transformation (ATMT) ............. 113
5.2.4. Genomic DNA (gDNA) extraction with LiOAc-SDS ................................. 114
5.2.5. Electroporation ........................................................................................ 115
5.2.6. Colony PCR ............................................................................................ 115
5.2.7. Polymerase Chain Reaction (PCR) analysis to determine the incorporation
of transferred genes .......................................................................................... 116
5.2.8. Plasmid extraction (miniprep).................................................................. 116
5.2.9. Cell biomass assessment ....................................................................... 116
5.2.10. Fluorescence measurements of lipid content ........................................ 117
5.2.11. Fatty acid composition .......................................................................... 117
5.3. RESULTS AND DISCUSSION................................................................................ 118
5.3.1. Developing basic genetic tools to engineer Lipomyces for gene
overexpression (Part I)...................................................................................... 119

5.3.1.1. Plasmids construction .......................................................................... 119
5.3.1.2. Selection of transformation method of Lipomyces starkeyi .................. 121
5.3.2. Overexpression (OE) of ACC1, DGA1 and FAD9.1 in Lipomyces starkeyi
by ATMT (Part II) .............................................................................................. 130
5.3.2.1. Plasmid constructions .......................................................................... 132
5.3.2.2. Lipid content of wild type versus overexpression strains ..................... 139
5.4. CONCLUSIONS ................................................................................................. 152
6. GENERAL CONCLUSION .................................................................................. 153
7. SUGESTIONS TO FUTURE WORK ................................................................... 155
REFERENCES ........................................................................................................ 156

21
CHAPTER 1. INTRODUCTION
Economic and environmental studies have challenged researchers to search
for alternative, sustainable and renewable fuels able to satisfy the global energy
demand. Biodiesel and biokerosene have received much attention due to their
renewable characteristics and lower CO2 and sulphur-rich emissions (CHEN et al.,
2012). Due to limitations in the vegetable oil supply and direct competition with food
production, it is necessary to study their replacement by other feedstocks, such as
agricultural waste and lignocellulosic biomass (ZHAO et al., 2012).
Microbial oils, also known as single cell oils (SCOs), are promising candidates
for biodiesel/biokerosene production because their fatty acid composition is similar to
those of vegetable oils (HUANG et al., 2012). The current high prices of the most
conventional carbon sources (sugars, i.e. sucrose [$400/ton], glucose [$400/ton])
place limits on the economic competitiveness of SCO production (CHEN et al., 2012;
ZHU& JACKSON, 2015). Nevertheless, lignocellulosic materials are less expensive
than edible sources and can also be used as substrates in microbial lipid production.
Sugarcane bagasse (SCB), the main byproduct of sugarcane mills, is one of the most
abundant renewable resource in Brazil and some other tropical countries. It can be
hydrolyzed into monosaccharides and then used as a carbon source by yeast or
other microorganisms for lipid production. The hemicellulosic fraction (the second
most abundant polysaccharide in lignocellulosic biomass) is generally removed
during pretreatment of the biomass in order to reduce structural constraints on the
enzymatic hydrolysis of cellulose (ZHAO et al., 2012). Its complete utilization would
increase the economic balance of biofuel production. The hemicellulose fraction of
sugarcane bagasse, rich in xylose, still show difficulties to be used for biofuels
production, due to many microorganisms cannot metabolize xylose and tolerate the
inhibitors originating in the pretreatment of biomass (GIRIO et al., 2010). Lipomyces
starkeyi, a non-conventional oleaginous yeast extensively studied in our lab
(ANSCHAU et. al., 2014; ARISTIZABAL, 2013; CORADINI, 2014; REIS, 2013;
GARZÓN, 2009), is able to assimilate xylose as carbon source standing out among
wild oleaginous yeasts such as R. toruloides and Y. lipolytica (PAN et al., 2009;
AGEITOS et al., 2011), especially the last one which is classified as a microorganism

22
that cannot grow on xylose (TAI, 2012). Therefore, using the hemicellulosic fraction
from sugarcane bagasse for SCO production by L. starkeyi would be interesting and
challenging because would promote the reduction of the competition with food
production and would improve the economic production of biodiesel and bioproducts.
Lipomyces starkeyi offers great potential to be used in the production of
biofuels and chemicals (polymers, softeners, stabilizers, coatings, etc.) due to its
ability to utilize a wide range of carbon sources (glucose, xylose, cellobiose, glycerol,
molasses, sunflower meal, etc.) and produce high amounts of lipid (~60%) (GONG et
al., 2012; VIEIRA et al., 2014). However, the lack of genetic knowledge of wild
microorganisms difficult the metabolic adjustments, that are often required to control
the parameters which affect the processes of production (productivity, yield,
fermentation efficiency, μmáx, substrate consumption, product, etc.) and besides, limit
the application of techniques of genetic engineering (CORADINI, 2014). Metabolic
engineering is a process of optimizing native metabolic pathways and regulatory
networks or assembling heterologous metabolic pathways for production of targeted
molecules using molecular, genetic and combinatorial approaches (TAI, 2012). The
purpose of the metabolic engineering is to generate a cell factory that produces cost-
effective molecules at industrial scale (SHENG & FENG, 2015). Metabolic
engineering has been used to modify strains such as Yarrowia lipolytica to improve
their capacity to store lipids and production of alternative fuels and new chemicals
(WANG et al., 2011). However, the lack of metabolic engineering tools of "non-
model" yeast such as L. starkeyi, combined with the engineering of conventional
yeast remains challenging partly due to the absence of efficient and reliable
transformation methods. Thus, establishing effective transformation methods with the
appropriate selection of markers and genetic elements for expression of targeted
genes will provide tools to genetically engineer these organisms (DAI et al., 2015).
There are few established genetic tools for engineering L. starkeyi, and thus the
engineering of lipid biosynthesis pathways in this microorganism, it is still relatively
unexplored. Therefore, the development of genetic tools for metabolic engineering of
L. starkeyi is fundamental to establish this yeast as a new platform for the production
of biofuels and chemicals derived of lipids. The overexpression of some genes
related to lipid biosynthesis such as Acetyl-CoA carboxylase (ACC1), Diacylglycerol
Acyltransferase (DGA1) and Fatty acyl-CoA delta 9 desaturase (FAD9.1) by an

23
efficient transformation method could be a strategy of metabolic engineering for
increasing the lipid production by L. starkeyi.
In this context, this study aimed to use the hemicellulose hydrolysate from
sugarcane bagasse for the lipid production by Lipomyces starkeyi, and developing
basic genetic tools to increase the lipid production by metabolic engineering,
exploring the effects of ACC1, DGA1 and FAD9.1 overexpression on lipid
accumulation via de novo lipid biosynthesis. This study comes to complement all the
work developed in our laboratory related to xylose consumption by L. starkeyi to lipid
production. It is being differentiated by the production of hemicellulosic hydrolysate
(HH) trying to get high concentration of xylose and low level of inhibitors, cultivation
of HH in two concentrations of inoculum, cultivation of inhibitor as sole carbon source
and the transformation of L. starkeyi by overexpression of genes involved on lipid
biosynthesis.

24
1.1. GENERAL OBJECTIVE
The objective of this work is the production of lipids from hemicellulose
hydrolysate of sugarcane bagasse by Lipomyces starkeyi and establishing genetic
tools to increase the lipid production of this yeast by metabolic engineering.
1.1.1. Specific objetives
Extraction of hemicellulosic sugars from in natura sugarcane bagasse by
pretreatment of biomass to obtain high concentrations of sugars and low levels
of inhibitors;
Evaluating the detoxification processes of HH to increase the fermentability of
HH;
Evaluating the cell growth and lipid production by Lipomyces starkeyi from
hemicellulose hydrolysate of sugarcane bagasse;
Evaluating different culture conditions in HH to improve the lipid accumulation
by L. starkeyi;
Analyzing the composition of fatty acids from xylose and HH cultivations;
Developing basic genetic tools for metabolic engineering of L. starkeyi through
selection of promoters, terminators and antibiotics as resistance marker,
construction of integrative DNA cassettes, selection of suitable transformation
method to genetic manipulation of the yeast;
Evaluating the effects of overexpression of ACC1 (Acetyl-CoA carboxylase),
DGA1 (diacylglycerol acyltransferase) and FAD9.1 (fatty acyl-CoA delta 9
desaturase) genes on lipid biosynthesis;
Identify the overexpressed gene with higher effect on lipid accumulation by the
engineered Lipomyces starkeyi;
Evaluating the fatty acid profile of lipids produced by the engineered L.
starkeyi from glucose cultivation.

25
CHAPTER 2. LITERATURE REVIEW
2.1. Energy outlook
Petroleum is the largest source of energy consumed in the world exceeding
coal, natural gas, hydro, nuclear and renewable sources (SUBRAMANIAM et al.,
2010). However, considering the increase of world population, expansion of
economic growth and the increase of energy consumption, is expected in the future,
an even higher demand for crude oil and petroleum-derivated products (SARROUH
et al., 2009; SUBRAMANIAM et al., 2010; SARKAR et al., 2012). In 2011, about
78% of energy consumed in the world is from fossil fuel, 3% from nuclear and 19%
from renewable sources (wind, solar, geothermal, hydrothermal and biomass) (Figure
1). Currently, about 93 million barrels of crude oil are processed annually to meet the
world's energy demands and it is estimated that global oil demand will increase about
40% by 2030 (SARROUH et al., 2009; BALAN, 2014). Since this may result in
depletion of crude oil reserves in the world and increased emission of greenhouse
gases, it is imperative to consider alternative energy sources to crude oil (BALAN,
2014).

26
Figure 1. Total energy consumed in the world in 2011. (A) World energy
consumption, (B) Details about world renewable energy consumption (19%). Adapted
of BALAN, (2014).
The rising costs of fossil fuels coupled with the concerns about the energy
security and an increasing awareness of the environmental impact associated to CO2
emissions, have led to the development of alternative energy solutions becoming a
global priority (SANTAMAURO et al., 2014). Thus, changing the global energy mix to
renewable sources is required (FURLAN, 2013) and the biofuels are one of the best
options to lead the transition from short-term petroleum-based fuels. Biorefineries
offer the promise of using less non-renewable natural resources, reducing CO2
emissions by using clean and efficient technologies (BALAN, 2014).
78%
19%
3%
Fossil fuel (coal, naturalgas, crude oil)
Renewable
Nuclear
(A)
9.30%
4.13%
3.73%
0.21%
0.56% 0.30%
0.55%
0.23%
Biomass
Other bioenergy
Hydrothermal
Geothermal
Wind
Solar
Ethanol
Biodiesel
(B)

27
The biorefinery is a facility that integrates biomass conversion processes and
equipment to produce fuels, power, and chemicals from biomass, using a variety of
different technologies. The concept of biorefinery is analogous to a petroleum
refinery. However, biorefinery makes use of renewable biomass whereas an oil
refinery uses non-renewable fossil fuels as input (Figure 2) (YOUSUF, 2010;
SANTOS et al., 2011). Biorefinery can provide a spectrum of marketable products
and energy that include: biofuels (bioethanol and biomethane), power, heat,
biomaterials (fibers, pulp for paper manufacture), chemicals, feed, etc. (YOUSUF,
2010; JONG & JUNGMEIER, 2015). The biorefinery shows at least three distinct
advantages compared to chemical refining of petroleum feedstocks: energy security,
climate change and rural development. In addition, biorefinery-based economy will
promote creation of new businesses that will lead to new jobs, and generate wealth
for the agro-based countries (YOUSUF, 2010).
Figure 2. Concept of petroleum refinery and biorefinery. Adapted of KAMM & KAMM,
(2004).
Other biorefinery system is the lignocellulosic feedstock biorefinery which
comprises the refining lignocellulosic biomass (bagasse, cob, straw, etc.) into
intermediate outputs (cellulose, hemicellulose, lignin) to be processed into a wide
range of products and bioenergy (Figure 3) (JONG & JUNGMEIER, 2015). Such
biorefinery consist of three chemicals fractions: hemicellulose, sugar polymers having

28
five carbons (C5); cellulose, glucose polymers of six carbons (C6); lignin, phenol
polymers (SANTOS et al., 2011). Lignocellulosic biomass is treated with acid or
alkaline agents to release cellulose and hemicellulose, and lignin can be
decomposed by enzymatic hydrolysis (JONG & JUNGMEIER, 2015). Therefore, this
system is the integral upstream, midstream, and downstream processing of
lignocellulosic biomass into a range of products.
Figure 3. Biorefinery from lignocellulosic materials. Adapted of KAMM & KAMM,
(2004).
2.2. Biodiesel
Biodiesel is an important renewable fuel and a possible candidate to replace
fossil fuels and become a source of primary energy to the world (FEOFILOVA et al.,
2010). Its production has received great attention due to its renewable characteristics
and reduced levels of combustion products such as particles, carbon monoxide,
sulfur oxides, hydrocarbons and soot, and have similar properties to conventional
diesel (SUBRAMANIAM et al., 2010; TSIGIE et al., 2011; CHEN, et al., 2012a).

29
Biodiesel is a mixture of methyl or ethyl esters of fatty acid that can be
produced from vegetable oil or animal fats (FEOFILOVA et al., 2010; CANILHA et
al., 2013). For its obtaining the triglyceride esterification reaction (TAG) with alcohol
(methanol or ethanol) in the presence of a catalyst (acid, base or enzyme: H2SO4,
KOH, NaOH, lipase), result in three esters molecules of fatty acids (biodiesel) and
glycerin molecule (Figure 4) (FEOFILOVA et al., 2010; KARMEE et al., 2015). The
fatty acid profile of biodiesel may vary according to the chain length. Thus, long
chains result in biodiesel with higher cetane number and reduced NOx emissions in
the exhaust of engines (SUBRAMANIAM et al., 2010). Currently, the raw materials
for biodiesel production are soybean, palm, rapeseed, peanut, sunflower, coconut,
jatropha and waste oil (MENG et al., 2009; FEOFILOVA et al., 2010;
SUBRAMANIAM et al., 2010; CANILHA et al., 2013; SANTAMAURO et al., 2014).
However, these crops require energy and area for oilseed production (MENG et al.,
2009). This has led to restrictions on economic production and competitive
commercialization of biodiesel, as well as competition with food crops for agricultural
land and environmental impact. Oleaginous microorganisms as microalgae, bacteria,
fungi and yeast are an attractive alternative to oilseed plants for the production of
lipids, since their production requires no agricultural land, avoiding the displacement
of food production (SANTAMAURO et al., 2014).
Figure 4. Biodiesel obtaining process (FEOFILOVA et al., 2010).

30
2.3. Microbial lipid production
To be a viable substitute for fossil fuels, an alternative fuel must have superior
environmental benefits over the fossilized materials, be economically competitive, be
producible in sufficient quantities to meet energy demands, do not compete with food
production, as well as providing a net energy gain over the energy sources used to
produce it (MENG et al., 2009; SUBRAMANIAM et al., 2010). Microbial oils, named
single cell oils (SCO), are considered promising candidates for the production of
biodiesel, due its fatty acid composition is similar to vegetable oils (HUANG et al.,
2012). Microorganisms are considered oleaginous when intracellularly accumulate
lipids more than 20% w/w of their dry mass, and some may accumulate up to 87%
under appropriate conditions (PAPANIKOLAOU, 2011; RAKICKA et al., 2015).
Oleaginous yeast produce SCO during nutrient limited conditions, usually
nitrogen, and a carbon source (glucose and other sugars) is in excess. Without
available nitrogen, cell proliferation is ceased (as the supply of N is essential for new
protein and nucleic acid biosynthesis) and the carbon is diverted to storage lipid or
triacylglycerol (TAG), a natural mechanism for energy storage (RATLEDGE, 2013;
PROBST, 2014; BEOPOULOS, 2009). Thus, the carbon to nitrogen (C/N) ratio is a
critical factor in optimizing SCO production. To induce lipid accumulation the C/N
ratio must be controlled to direct carbon flux to TAG formation. Low ratio (excess of
nitrogen) will promote the cellular growth and will not induce the SCO accumulation.
High ratio (limited nitrogen) will limit the cellular proliferation and the carbon becomes
available for microbial oil production, and may even result in the formation of
secondary metabolites. Therefore, optimal C/N ratios depend on the production
method, fermentation conditions and yeast species used and the control of C/N ratio
during fermentation is essential (PROBST, 2014)
Besides the C/N ratio, the lipid accumulation is also strongly influenced by pH,
temperature, culture mode and time, aeration, and inorganic salts. Culture,
temperature and pH have influence on the total cell number and lipid content in yeast
(SUBRAMANIAM et al., 2010; PAPANIKOLAOU et al., 2011a; CHRISTOPHE et al.,
2012). The optimal growth pH value for each yeast strain is different and varies from
pH 3.0 to pH 7.0. However, it has been shown that the pH optimal for lipid
accumulation is generally lower than that for optimal growth. For example, when
using sewage sludge to accumulate lipids by Lipomyces starkeyi, highest lipid
content was observed at pH 5.0 while the highest growth was at pH 6.5

31
(ANGERBAUER et al., 2008; SHA, 2013). In general, the optimal temperature for
growth rate of yeast is around 25°C but is different for each strain. Too high or too
low temperature affects the cell growth and lipid accumulation as well as the lipid
composition. Decreasing the temperature increases the level of unsaturated and
short chain fatty acids due to their melting point is lower than satured FA and long
chain FA, respectively. Aeration also affects the FA composition, since limited
conditions of oxygen increase the amounts of saturated FA and aerated culture
increases the unsaturated FA (SHA, 2013). Besides, dissolved oxygen content is
critical to SCO productivity because during the lipid accumulation stage the demand
of oxygen is variable depending on oleaginous yeast species and the culture
conditions used (PROBST, 2014). In addition, micronutrients such as Na+, K+, Cl-,
Ca2+, Zn2+, Mg2+, Cu2+, Mn2+ are normally essential for yeast growth or lipid
accumulation at lower concentration (SHA, 2013; PROBST, 2014).
2.3.1. Oleaginous yeasts
The production cost of SCO depends mainly on the species used for
cultivation, lipid concentration on cells, cellular production and type of feedstock.
Thus, finding inexpensive substrates and select suitable oleaginous microorganisms
capable of using these substrates for lipid production are important and efficient
aspects to be considered to make these cost-effective bioprocesses for their
industrialization (HUANG et al., 2012; ZHAO et al., 2012; XIONG et al., 2015).
Among 600 known species of yeast, only 30 were identified by their ability to store
lipids more than 20% (w/w) of its dry weight (BEOPOULOS et al., 2009a;
CHRISTOPHE et al., 2012a). Best known oleaginous yeasts are among the species
of Candida, Cryptococcus, Rhodotorula, Rhizopus, Trichosporon, Lipomyces,
Rhodosporidium and Yarrowia. The yeasts accumulate on average 40% of lipids and
in nutrient limited conditions, can accumulate at level over 70% of its dry mass
(RAKICKA et al., 2015; TCHAKOUTEU et al., 2015; ZHOU et al., 2011). Several
microorganisms such as microalgae, bacteria, yeasts and fungi are able to generate
and accumulate lipids. The lipid accumulation by these microorganisms can achieve
similar oil content or higher than to the oilseed generally used for biodiesel
production, such as soybeans and palm (Table 1). The fatty acid (FA) composition for
most species of yeasts comprise of palmitic (C16:0), oleic (C18:1), linolenic (C18:2)

32
with a FA profile similar to vegetable oils (FEOFILOVA et al., 2010). However, the
lipid content and fatty acid profile will vary with the species and even between
individual strains (Table 2) (BEOPOULOS et al., 2009a; MENG et al., 2009;
THEVENIEAU et al., 2013). The cultivation modes (batch, fed-batch and continuous)
can also influence the yield of cells and lipid content of oleaginous yeast. The fed-
batch and continuous cultures have been used for the production of microbial oils
being efficient in increasing the cell density and lipid accumulation (SUBRAMANIAM
et al., 2010; ANSCHAU et al., 2014).

33
Table 1. Lipid content of some microorganisms and oil plants (SAWANGKEAW &
NGAMPRASERTSITH et al., 2013)
Microorganisms/Oleaginous Lipid content
(%, w/w)
Yeast
Candida curvata 29.2-58.0
Criptococcus albidus 33.0-43.8
Criptococcus curvatus 25-45.8
Lipomyces starkeyi 61.0-68.0
Rhodosporidium toruloides 58.0-68.1
Fungi
Mortierella isabellina 50.0-55.0
Mucor mucedo 62
Aspergillus oryzae 18.0-57.0
Cunnighamella echinulata 35.0-57.7
Bacteria
Arthobacter sp. ˃40
Acinetobacter calcoaceticus 27-38
Rhodococcus opacus 24-25
Bacillus alcalophilus 18-24
Microalgae
Chorella sp. 22.4-33.9
Scenedesmus obliquus 12.6-58.3
Schizochytrium 68
Pseudochlorococcum sp. 24.6-52.1
Chaetoceros gracilis 15.5-60.3
Oleaginous Soybean
Palm
18-20% 45-50%

34
Table 2. Fatty acid profile of some oleaginous yeast
Species Fatty acid composition (%, w/w) Reference
C16:0 C16:1 C18:0 C18:1 C18:2 C18:3
Candida curvata 25.0-28.0 - 5.0-44.0 9.0-33.0 15.0-27.0 - PAPANIKOLAOU & AGGELIS. 2011
Cryptococcus albidus 16.1-17.9 1.0 5.1 2.9-17.7 19.6-61.1 0.5-59.1 FEI et al., 2011
Cryptococcus curvatus 30.0-33.0 - 11.0-13.0 43.0-45.0 8.0-10.0 0.1-0.5 SAWANGKEAW & NGAMPRASERTSITH, 2013
Lipomyces starkeyi 36.2-37.1 6.0 4.5-5.5 45.1-46.3 3.4-4.9 - PAPANIKOLAOU & AGGELIS, 2011
Rhodosporidium toruloides 13.0-16.0 - 4.0-41.0 18.0-42.0 15.0-29.0 - MENG et al., 2009
Yarrowia lipolytica 11.0 6.0 1.0 28.0 51.0 1.0
RATLEDGE & WYNN, 2002 Rhodotorula glutinis 37.0 1.0 3.0 47.0 8.0 0.0
Rhodotorula graminis 30.0 2.0 12.0 36.0 15.0 4.0
Candida sp. 107 44.0 5.0 8.0 31.0 9.0 1.0
BEOPOULOS et al., 2009 Rhisopus arrhizus 18.0 0.0 6.0 22.0 10.0 12.0
Trichosporon pullulans 15.0 0.0 2.0 57.0 24.0 1.0

35
Oleaginous yeasts can grow in a wide range of carbon sources such as
glucose, xylose, arabinose, mannose, glycerol and agroindustrial residues
(FEOFILOVA et al., 2010; LI, M. et al., 2010; SUBRAMANIAM et al., 2010; LEIVA-
CANDIA et al., 2015; TCHAKOUTEU et al., 2015) and Lipomyces starkeyi shows up
as potential yeast for growth and production of SCO due its ability to utilize different
carbon sources and produce high amounts of lipid.
2.3.1.1. Lipomyces starkeyi
The oleaginous yeast Lipomyces starkeyi is a species belonging to the
Saccharomycetales order that was originally isolated from soil (ROSSI et al., 2011).
L. starkeyi is considered to be an excellent candidate for the production of SCO as it
can accumulate up to 70% of their dry cell mass as SCO (BONTURI et al., 2015) and
assimilate different carbon sources such as glucose, glycerol, a mixture of sugars,
molasses, cellobiose, potato starch, molasses for growth and lipid production
(VIEIRA et al., 2014; GONG et al., 2012; YANG et al., 2014; ANSCHAU et al., 2014;
WILD, 2010). The majority of lipids produced by this yeast are triacylglycerides (TAG)
containing long chain fatty acids consisting of 14–20 carbon atoms that are
comparable to vegetable oils (WILD, 2010; SALUNKE et al., 2015). In oleaginous
yeast, lipids may be produced via two different pathways: (1) de novo pathway,
where the synthesis involves the production of fatty acid precursors, such as acetyl-
CoA and malonyl-CoA and their accumulation into the storage lipid biosynthesis
pathway (the Kennedy pathway, Figure 5) and (2) the ex novo accumulation
pathway, which involves the uptake of fatty acids (FA), oils and TAG from the culture
medium and their accumulation within the cell. This latter pathway requires hydrolysis
of the hydrophobic substrate and incorporation of these released fatty acids
(BEOPOULOS et al., 2009). In the de novo pathway, nitrogen limitation causes the
citric acid cycle (TCA) deregulation, resulting in the overproduction of citrate,
immediate precursor of acetyl-CoA and malonyl-CoA (BEOPOULOS et al., 2012). In
addition to precursors, energy (ATP, NADPH) is required to FA synthesis
(BEOPOULOS et al., 2009a).

36
Figure 5. Overview of metabolic pathways for lipid synthesis in Lipomyces starkeyi
from xylose and glucose as the carbon source. The main pathway of lipid synthesis is
highlighted in blue and red. G3P: Glyceraldehyde 3-phosphate; TCA Cycle:
tricarboxylic acid cycle; ACC: acetyl-CoA carboxylase; DGA: diacylglycerol
acyltransferase TAG: triacylglycerol; DAG: diacylglycerol; PA: phosphatidic acid;
OAA: oxaloacetate; a-KG: alpha-ketoglutarate; PEP: phosphoenolpyruvate; DHAP:
dihydroxyacetone phosphate; LPA: lysophosphatidic acid; MD: malate
dehydrogenase; ME: malic enzyme; PC: pyruvate carboxylase, FAS: fatty acid
synthase. GPAT: G3P acyltransferase; LPAT: ALP- acyltransferase PAP:
phosphatidate phosphatase. Adapted of ZHU & JACKSON, (2015); TAI &
STEPHANOPOULOS, (2013); BEOPOULOS et al., (2009).
De novo synthesis of fatty acids, the first step of lipid accumulation, is carried
out in the cytosol by fatty acids synthetase (FAS) complex and requires the
constant supply of acetyl-CoA as initial biosynthetic unit and of malonyl-CoA
as the elongation unit. The acetyl-CoA and malonyl-CoA provide two carbons

37
at each step of the growth of FA chain up to an intermediate level of (C14-C16),
depending on enzymatic arsenal of each microorganism (ROSSI et al., 2011). The
major FA synthetized by FAS is the palmitate, which is released by the enzyme and
can be elongated and/or desaturated to produce other molecules of FA (RATLEDGE,
2004).
TAG synthesis generally follows the Kennedy pathway by the glycerol-3-
phosphate (G3P) metabolic pathway which occurs in endoplasmic reticulum
(BEOPOULOS et al., 2009a; TAI & STEPHANOPOULOS, 2013). During the first step
of TAG assembly, glycerol-3-phosphate (G3P) is acylated by G3P acyltransferase
(GPAT) to generate lysophosphatidic acid (LPA) and the acyl-CoA is the precursor
for this reaction. The LPA is acylated to generate the phosphatidic acid (PA) and
then, after the dephosphorylation of PA, the diacylglycerol (DAG) is released from
PA. The final acylation occurs by DGA-aciltransferase (DGA) to TAG synthesis
(BEOPOULOS et al., 2009a; ROSSI et al., 2011).
L. starkeyi has been targeted due to its ability to produce oil from non-
traditional sugar sources including xylose (GONG et al., 2012; ANSCHAU et al.,
2014; ZHAO, 2008, SHA, 2013; PROBST, 2014), a monosaccharide derived from the
hemicellulose portion of plant-based materials such as lignocellulosic biomass,
agricultural residues and grain processing by-products (PROBST, 2014). Our lab has
extensively studied L. starkeyi as lipid producer from xylose after screening of 25
oleaginous yeast for their ability to assimilate xylose and produce lipids (GARZÓN,
2009 ). Some culture conditions for lipid accumulation were established as the use of
ammonium sulfate plus yeast extract as nitrogen source at a C/N ratio of 50. Effects
of feeding strategies on lipid production by L. starkeyi on cultivation of xylose and
glucose showed that the repeated fed-batch strategy achieved the highest cell
density and lipid production. Besides, the continuous cultivation mode at 0.03 h-1
showed the highest cells and lipid yields (ANSCHAU et al., 2014). Genetic studies
aiming the genetic enhancement of L. starkeyi by random mutagenesis of DNA by
ultraviolet irradiation achieved an increasing of 15.1% in cell production and 30.7% in
lipid productivity from a mixture of xylose and glucose when compared to wild type
(TAPIA et al., 2012). In addition, the L. starkeyi DSM 70296 genoma was sequenced
by our lab (data no published) and transcriptome studies identified relevant genes to
metabolism of xylose such as XYL1 (xylose reductase), XylB (xylose

38
dehydrogenase), XylC (xylan lactanase) and XylD (dehydratase) and to lipid
accumulation such as ICL1 (isocitrate lyase), CIT1 (citrate synthase) and DAG2
(diacylglycerol acyl transferase). Furthermore, in order to engineer L. starkeyi
transformation methods (lithium acetate, electroporation, and espheroplastos) were
used for deletion of gene URA3 but no transformants were obtained (CORADINI,
2014).
REIS (2013), reported the transesterification in situ and conventional of L.
starkeyi by ethylic route in the presence of catalysts (NaOH and H2SO4) to obtain
biodiesel. Effects of solvents (hexane, chloroform, methanol and ethanol) on the
extraction of lipids by Soxlet and Butt showed that the efficiency of extraction is
directly related to the polarity of the solvents.
Aiming the use of lignocellulosic materials as feedstock for lipid production by
L. starkeyi, the hemicellulosic hydrolysate (HHE) obtained by steam explosion of
sugarcane bagasse was studied as carbon source. The adaptation of L. starkeyi to
the medium containing HHE by evolutionary engineering obtained an adapted yeast
to medium containing 30% of HHE (ARISTIZABAL, 2013).
Since L. starkeyi can assimilate a wide range of carbon sources others studies
have reported the use of this yeast to the fermentation of complex materials such as
lignocellulosic biomass and by-products of industries. AZAD et al., (2014) achieved a
lipid content of 36% when the rice straw hydrolysate was used as carbon source by
L. starkeyi. MATSAKAS et al., (2014) reported that the use of saccharified sweet
sorghum stalks juice by L. starkeyi reached 29.5% of lipid accumulation. L. starkeyi
was able to survive, proliferate and produce lipids in the presence of olive oil mill
wastewaters (OMW), a medium difficult to process by biological treatments, due to
the antimicrobial activities of their phenolic components. A significant yield of lipid of
22.4% was raised when pure OMW was used, while this content increased to 28.6%
from 50% with diluted OMW (YOUSUF, 2010). The shaking flasks culture of L.
starkeyi using flow rich waste hydrolysate as fermentation media reached 40.4% of
microbial oil while the fed-batch culture significantly increased the content to 57.8%
(TSAKONA et al., 2014). In another study, L. starkeyi efficiently produced lipid during
the pulsed fed-batch cultivation of Brazilian molasses yielding an oil content of 32%
(VIEIRA et al., 2014).
Lipomyces starkeyi shows up as potential yeast for SCO production as
feedstock to biodiesel production. Due its great ability to accumulate high amount of

39
lipids (up to 70%), L. starkeyi can produce up to 3.5 times more lipid content
compared to the soybean which contains only around 20% (SAWANGKEAW &
NGAMPRASERTSITH, 2013). In addition, oleaginous yeasts have some attractive
characteristics such as their high growth rates, their cultivation is not affected by
climate conditions, do not require large areas, short life cycle and the most important
matter is that they can use low cost fermentation medium such as waste agricultural
materials and also some industrial by-products (TSIGIE et al., 2011; ZHAO et al.,
2012). Since the major obstacle that hinders commercialization of microbial lipid
production is the high cost of the raw materials (ZHAO et al., 2012), the utilization of
low-cost feedstock would decrease this cost and also do not compete with food
production, as for example when sucrose or starch are used (MATSAKAS et al.,
2014). Thus, finding inexpensive substrates, selecting suitable microorganisms able
to efficiently assimilate these substrates for SCO production and suitable solvents for
downstream processes are important aspects to be considered for cost-effective
production of biofuels (SUBRAMANIAM et al., 2010; ZHAO et al., 2012; XIONG et
al., 2015). Besides, the genetic knowledge of non-conventional oleaginous yeast is
important to manipulate the metabolic pathway of wild strain in order to improve the
lipid production.
2.3.1.1.1. Metabolic engineering and transformation of yeast Lipomyces
starkeyi
Microbial biosynthesis of fuel and chemicals provides renewable and
sustainable path to reduce dependence on raw material oil (BLAZECK et al., 2014).
However, the economic feasibility of biosynthetic production of fuels and chemicals
has challenges to its development, such as high yields and productivity (TAI, 2012;
BLAZECK et al., 2014). Metabolic engineering that is a process of optimizing native
metabolic pathways and regulatory networks through the DNA recombinant
technology provides the ability to formulate new solutions to these challenges,
optimizing biological systems in order to make it economically viable (TAI, 2012).
The production of lipids and products derived from oils provide an unique
platform for the sustainable production of biodiesel and other oleochemicals
(BLAZECK et al., 2014). Several oleaginous yeast such as Lipomyces starkeyi, are
being actively investigated for its potential in biofuel production using various sources

40
of carbon and nutrients (DAI et al., 2015). Metabolic engineering has been used to
modify strains to improve their capacity to store lipids and production of alternative
fuels and new chemicals (WANG et al., 2011). The strategies to enhance the lipid
accumulation in different species can be classified into different approaches such as
the overexpression of enzymes of the fatty acid biosynthesis pathway (push
mechanisms); the overexpression of enzymes that enhance the TAG biosynthesis
pathway (pull mechanisms); the regulation of related TAG biosynthesis bypass
approaches; the partial block of competing pathways; and the multi-gene transgenic
approach (LIANG & JIANG, 2013). Therefore, the availability of genome data and
genetic tools, such as the possibility to integrate homologous or heterologous genes,
is essential and bring the possibility to use metabolic engineering to understand the
molecular mechanisms involved in lipid accumulation or to increase the yield of
stored lipids (ROSSI et al., 2011).
Some examples of those approaches are (Figure 6):
• Increasing the “pool” of cytosolic acetyl-CoA, a key intracellular metabolite that
serves as the carbon supply for de novo FA synthesis, could enhance the
biosynthesis;
• Coercing the acetyl-CoA into FA synthesis, pathways competing with acetyl-
CoA could be down-regulated and/or knocked out;
• Overexpression of key enzymes such as ACC and malic enzyme could also
help “push” the flux of acetyl-CoA toward de novo FA synthesis.
• Enhancing the activity of TAG-forming enzymes. TAG molecules are formed
by acyltransferases, which “pull” FAs from the FAS onto the glycerol-3-
phosphate (G3P) backbone. G3P is synthesized from DHAP via the glycerol-
3-phosphate dehydrogenase (GPD) shuttle mechanism. The final and
committed step of TAG formation is catalyzed by the DGAT (diacylglycerol
acyltransferase) and PDAT (phospholipid:diacylglycerol acyltransferase)
enzymes via acylation at the sn-3 position of diacylglycerol (DAG), one of the
major enzymes influencing the rate of TAG formation;
• TAG mobilization and oxidation pathways. TAG mobilization via TAG lipases
(TGLs) is the first committed step of breakdown. TGLs hydrolyze TAG to form
free FAs and glycerol and are mostly restricted to lipid bodies; thus, TGL
down-regulation may prevent TAG mobilization for β-oxidation (PROBST,
2014).

41
Figure 6. Overview of metabolic pathways for lipid synthesis in Lipomyces starkeyi
from xylose and glucose as the carbon source. The main pathway of lipid synthesis is
highlighted in blue and red. G3P: Glyceraldehyde 3-phosphate; TCA Cycle:
tricarboxylic acid cycle; ACC: acetyl-CoA carboxylase; DGA: diacylglycerol
acyltransferase TAG: triacylglycerol; DAG: diacylglycerol; PA: phosphatidic acid;
OAA: oxaloacetate; a-KG: alpha-ketoglutarate; PEP: phosphoenolpyruvate; DHAP:
dihydroxyacetone phosphate; LPA: lysophosphatidic acid; MD: malate
dehydrogenase; ME: malic enzyme; PC: pyruvate carboxylase, FAS: fatty acid
synthase; GPAT: G3P acyltransferase; LPAT: ALP- acyltransferase PAP:
Phosphatidate phosphatase, FA: Fatty acid; FAT: Fatty acid transport; TGL: TAG
lipase; DGAT: diacylglycerol acyltransferase; Pex3 and Pex10, peroxisome
biogenesis factor 3 and 10, respectively; Pox1 to Pox6, acyl-CoA oxidases 1–6,
respectively; Mfe1: multifunctional enzyme; GPD: glycerol-3-phosphate
dehydrogenase; ER: Endoplasmic reticulum. Adapted of BEOPOULOS et al., (2011);
TAI & STEPHANOPOULOS, (2013); BEOPOULOS et al., (2009); ZHU & JACKSON,
(2015).

42
S. cerevisiae has been used mostly as a model to investigate and understand
the lipid metabolism whereas in Y. lipolytica several attempts have been done in
order to drive the carbon flux toward TAG production and accumulation (ROSSI et
al., 2011). Although being extensively studied, metabolic engineering of oleaginous
yeast is still limited. Most studies have been focused on the establishment of genetic
tools for engineering Y. lipolytica (WANG et al., 2011; TAI et al., 2013; BLAZECK et
al., 2014; LIU, L. et al., 2015; QIAO et al., 2015; XIE, 2015). The overexpression of
acetyl-CoA carboxylase (ACC1), the first committed step of fatty acid synthesis, and
diacylglycerol acyltransferase (DGA1) (Figure 6), the final step of the triglyceride
(TAG) synthesis pathway, yielded a Y. lipolytica 4-fold (33.8%) and 2-fold (17.9%)
increase in lipid production over the control. The simultaneous coexpression of ACC1
and DGA1showed synergic effect to divert flux towards the lipid synthesis and create
driving force for TAG synthesis in Y. lipolytica increasing the lipid content to 61.7%
(TAI & STEPHANOPOULOS, 2013). The strains coexpressing ACC1and DGAT1
have an improvement due to a better balance between the fatty acid and TAG
synthesis pathways. Acyl-CoA intermediates function as both product and feedback
inhibitors in the fatty acid (upstream) pathway and primary precursors in the TAG
(downstream) pathway (Figure 6). Upregulation of the upstream pathway increases
the throughput of fatty acid synthesis. Upregulation of the downstream pathway
creates a driving force by depleting acyl-CoA intermediates and increasing the rate of
storage of TAG in lipid bodies (LIANG & JIANG, 2013). Simultaneous overexpression
of SCD (delta-9stearoyl-CoA desaturase), a central metabolic regulatory enzyme,
ACC1 and DGA1 in Y. lipolytica yielded an engineered strain exhibiting highly
desirable phenotypes of fast cell growth and lipid overproduction (QIAO et al., 2015).
Also, the regulation of fatty acid pathway in order to induce the production of a
targeted fatty acid in Y. lipolytica have been reported (BEOPOULOS et al., 2014; XIE
et al., 2015).
Recently, ZHANG et al. (2015) reported the successful metabolic engineering
of R. toruloides for the production of greater quantities of lipids by the overexpression
of ACC1 and DGA1 genes involved in lipid biosynthesis. Furthermore, the regulation
of biosynthesis pathway of polyunsaturated fatty acids (PUFAs) from L. starkeyi was
possible, yielding larger amounts of ω-3 fatty acids (SALUNKE et al., 2015).
However, the metabolic engineering of non-oleaginous yeast model, such as L.
stakeyi, remains challenging due to the lack of efficient and reliable transformation

43
methods (LIN et al., 2014; SHENG & FENG, 2015). The engineering of lipid
biosynthesis pathways in L. starkeyi is still relatively unexplored, although early
attempts proved promising. CALVEY et al. (2014) reported the optimization of
transformation method of L. starkeyi by lithium acetate (LiAc) which could also be
applied to non-conventional yeasts that have not yet developed transformation
methods. DAI et al. (2015) reported the effective integration of bacterial gene hph as
an antibiotic selection marker in chromosome of 5 different Lipomyces species using
the transformation method mediated by Agrobacterium tumefaciens (ATMT). The
heterologous expression of delta-6 fatty acid desaturase (D6DM) was found in
Lipomyces kononenkoae driven by the hybrid promoter Hp4d; however, yielding low
expression levels leading to speculation that better results could be found using
native promoters of L. kononenkoae. Although the sequencing of L. starkeyi genome
is available and some tools of genetic engineering to transformation have been
reported, significant challenges remain in the engineering of its genome. Especially,
the integration or knockout of targets gene poorly developed currently, making the
engineering to improved lipid production very challenging (FRANDEN et al., 2015).
Thus, establishing efficient transformation methods with appropriate genetic elements
for expression of the selected gene will provide tools to genetically engineer this
organism, facilitating the creation of higher strains, potentially making this yeast an
important host microorganism for biotechnological applications (DAI et al., 2015).
Implementation the concepts of metabolic engineering will be fundamental in
enabling the technologies of robust, efficient, commodity-scale production of
biologically-derived chemicals and fuels. Although research is ongoing for many new
developments in SCO bioprocessing, industrial activity has been limited due to
economic drawbacks. Therefore, the application of metabolic engineering to lipid
biosynthesis opens the path for microbial oil overproduction and cost-effective biofuel
manufacturing (PROBST, 2014; TAI & STEPHANOPOULOS, 2013).
2.3.2. Culture mode of operations
Different culture modes such as batch, fed-batch, repeated fed-batch and
continuous cultivation have been used to produce microbial oils. Batch operation is
the cultivation method most commonly used in studies of microbial lipid
accumulation. In this culture mode, most of the metabolic energy is used for

44
synthesis of cell constituents during the exponential growth phase; and in the
stationary phase, the energy is predominantly used for the synthesis of extracellular
compounds (SUBRAMANIAM et al., 2010).
Fed-batch culture is often used to control the C/N ratio for SCO production and
has been successfully used to increase production of oil using oleaginous yeast
(ZHAO et al., 2011; ANSCHAU et al., 2014; LEIVA-CANDIA et al., 2015). Substrate
feeding modes had a great impact on lipid productivity (ZHAO et al., 2011). This can
be achieved by providing nitrogen at a lower C/N ratio during the initial stages of
growth and increasing the C/N ratio by feeding additional carbon substrate into the
fermenter during times of lipid accumulation (PROBST, 2014). Thus, fed-batch
culture is effective to increase both the cell density and lipid contents of oleaginous
yeasts (SUBRAMANIAM et al., 2010)
Repeated fed-batch consists of periodic removal of part of culture medium and
replacement by a fresh medium. This operation mode can increase the productivity of
microbial fermentations, reducing cleaning time, sterilization, inoculation and feeding.
(ZHAO, X. et al., 2011). In this process, large portion of culture medium with high
lipid content is directly used as inoculum for the next culture, reducing the preparation
time and cost for seed culture and inoculation between each fermentation cycles,
which have large industrial interest (WIEBE et al., 2012).
In continuous chemostat culture the optimum dilution rates (D) for maximum
cell growth are often achieved slightly below the maximum specific growth rate
(PROBST, 2014). In general, high cell yields occur when the cells are cultivated
under steady-state conditions and when carbon is used with the same efficiency at
each stage of the growth cycle (SUBRAMANIAM et al., 2010). Much lower dilution
rates (D) are used for SCO production that prevent excess nitrogen buildup and
maximize lipid accumulation. As a general rule, a dilution rate of one-third the
maximum specific growth rate can be used in SCO production. Since the microbial oil
fermentation consists of different stages, a control mechanism would be useful in
regulating the dilution rate during each stage of growth and lipid accumulation
(PROBST, 2014). In addition, in continuous cultivation in chemostat conditions, all
parameters remain constant, it is possible to isolate a single parameter and study its
effect on the accumulation of lipids keeping constant the other physical and chemical
parameters (ANSCHAU et al., 2014). Continuous chemostat operation also has been
reported as an effective fermentation technique for SCO production

45
(PAPANIKOLAOU, 2002; GANUZA et al., 2007; SHEN et al., 2013; ANSCHAU et
al., 2014).
2.4. Raw material for SCO production
Recently, the lignocellulosic biomass is considered a promising feedstock for
SCO production due to its low cost, high availability and renewable characteristics
(YU et al., 2011; CHEN et al., 2012; XIONG et al., 2015). Rice straw, miscanthus,
switchgrass, wheat straw, corncob and sugarcane bagasse are some lignocellulosic
biomass that have been explored to reduce the microbial lipid production cost
besides other substrates such as glycerol, sewage sludge, wastewater and waste
from food industry (CHEN et al., 2012; HUANG et al., 2012; MAST et al., 2014;
TCHAKOUTEU et al., 2015). Studies using oleaginous microorganisms such as
Trichosporon dermatis (XIONG et al., 2015), Lipomyces starkeyi (ANSCHAU et al.,
2014), Trichosporon fermentans (HUANG et al., 2009), Yarrowia lipolytica (TSIGIE et
al., 2011), Cryptococcus curvatus (YU et al., 2011) and Rhodotorula glutinis (MAST
et al., 2014) to SCO production from lignocellulosic hydrolysates have increased.
However, the selection of new strains for the SCO production from lignocellulosic
hydrolysates would be beneficial for the development of microbial oil production
(HUANG et al., 2012). Lipomyces starkeyi has shown ability to assimilate a wide
range of substrates such as sewage sludge, sunflower meal, rice straw hydrolysate,
glycerol, showing up as potential yeast for growth and production of SCO from waste
and by-products of agro-industrial sector (ANGERBAUER et al., 2008; AZAD et al.,
2014; LEIVA-CANDIA et al., 2015; TCHAKOUTEU et al., 2015).
2.4.1. Lignocellulosic materials
Lignocellulosic biomass, major cell wall component of plants, is mainly
composed of cellulose (40-60%), hemicellulose (20-40%) and lignin (10-25%) (KANG
et al., 2014). It is a promising alternative energy source due to the national
abundance in Brazil of renewable and sustainable raw materials, and has attracted
great attention in biofuels industries (SHIELDS et al., 2011; YU et al., 2011). Biofuels
produced from lignocellulosic biomass will not only improve energy security as well
as stimulate the economy, create jobs, reduce global climate change and decrease

46
the competition between food production and bioenergy. The biomass can be
converted into biofuel, chemicals and electricity (SARROUH et al., 2009; SHIELDS &
BOOPATHY, 2011).
Biofuel production from lignocellulosic materials involves the conversion of
cellulose and hemicellulose, which is much more difficult than the conversion of
starch and pure sugars (EGGLESTON & LIMA, 2015). The main component of
lignocellulosic biomass is cellulose, chain of glucose molecules linked by β (1-4)
linkages. The hydrogen bonds of polysaccharide contribute to the strength of
recalcitrant cellulose to degradation. The hemicellulose, the second most abundant
component of lignocellulose, is an amorphous and variable structure composed of
heteropolymers of hexoses and pentoses and may contain uronic acids. The lignin,
synthesized by the polymerization of phenolic compounds, is an aromatic and rigid
biopolymer of high molecular weight linked to xylan by covalent bonds conferring
rigidity and compactness to the plant cell wall (Figure 7) (CANILHA et al., 2013;
KANG et al., 2014). Cellulose, hemicellulose and lignin are arranged to form a highly
recalcitrant structure preventing the availability of carbohydrates to fermentation
processes, which represents a major barrier for the bioconversion of lignocellulosic
materials (SARROUH et al., 2009; LIMAYEM et al., 2012; SARKAR et al., 2012;
CANILHA et al., 2013; KANG et al., 2014).

47
Figure 7. Structure of lignocellulosic biomass. Adapted of CANILHA et al., (2009).
2.4.1.1. Sugarcane bagasse
An important lignocellulosic agro-industrial by-product is the sugarcane
bagasse, a fibrous residue of sugarcane stalks remaining after crushing and
extraction of the juice from sugarcane (HUANG et al., 2012a; EGGLESTON & LIMA,
2015). The sugar mill generates approximately 270-280 kg of bagasse (50%
humidity) per ton of sugarcane, representing about 30% of total production
(CANILHA et al., 2012; CHANDEL et al., 2012). In Brazil, the annual production of
sugarcane bagasse is estimated at 200 million tonnes (ZANCANER, 2013;
CHANDEL et al., 2013) which is mainly used to generate steam and electricity, being
burned in boilers to meet the energy demands of the industrial plant, and export the
surplus of electric power to network (FURLAN, 2013; EGGLESTON; LIMA, 2015).
Part of the surplus bagasse is also used in the manufacture of cardboard and feed
animal (BEUKES & PLETSCHKE, 2010; MALCATA, 2011; MATOS et al., 2012).
However, the remaining bagasse is usually stored, especially during the off-season
electricity generation; presenting a risk of spontaneous combustion of the stored

48
bagasse, microbial decomposition of bagasse (~ 50% humidity), health problems
such as bagassosis, and the loss of fuel value, while at the same time is a source of
renewable resource (BEUKES & PLETSCHKE, 2010; EGGLESTON & LIMA, 2015).
Moreover, with the increased production of sugarcane more residue will be available
(CANILHA et al., 2013).
Among the many potential sources of biomass, sugarcane bagasse has been
one of the most promising coproduct (HUANG et al., 2012a). Due to its low ash
content (2.4%), bagasse has many advantages compared to other crop residues
such as rice straw and wheat that have ash content of 17.5% and 11%, respectively,
for use in bioconversion processes using microbial cultures (CANILHA et al., 2013).
Due to its high carbohydrate content (cellulose and hemicellulose), relatively low
lignin content, availability as coproduct (low cost) and contributor to the reduction of
environmental pollution, the bagasse is a particularly suitable substrate for
bioconversion in sustainable products such as biodiesel, bioethanol, lactic acid,
enzymes, xylitol, etc. (BEUKES & PLETSCHKE, 2010; LAOPAIBOON et al., 2010;
HUANG et al., 2012a; CANILHA et al., 2013; FURLAN, 2013). The xylan, after
glucan, is the most abundant carbohydrate in the bagasse. The xylose may be
responsible for nearly 1/3 of the total content of sugars in the bagasse hydrolysate.
Therefore, microorganisms capable of fermenting glucose and xylose are required for
efficient conversion of bagasse into products of interest (BEUKES & PLETSCHKE,
2010).
The search for efficient and cost-effective production of biodiesel has
intensified searches for potential application of bagasse in the production of SCO.
Some authors have evaluated the potential production of microbial oil from
sugarcane bagasse by some yeasts as Y. lipolytica (TSIGIE et al., 2011), T.
fermentans (HUANG et al., 2012a) and T. mycotoxinivorans (MATOS et al., 2012).
These studies show that the sugarcane bagasse hydrolysate can be used as
substrate for the SCO production with similar fatty acid composition of vegetable oils
which can be used in the biodiesel production (HUANG et al., 2012b). Our work used
the L. starkeyi for lipid production from hemicellulosic hydrolysate of sugarcane
bagasse in different cultivation modes in order to improve the lipid accumulation. The
application of sugarcane bagasse into bio-processes provides alternative substrates
bringing technological innovations, especially to enzyme and fermentation

49
technology, promoting the opening of new paths that enable its correct use and
obtaining value-added products (DIEDERICKS et al., 2012). Thus, the sugarcane
bagasse cannot be seen only as a fuel (generating steam and electricity) or a by-
product of the sugarcane mill, but also as a rich substrate that has a very high
potential for manufacturing several products with high commercial values (WU et al.,
2010; CANILHA et al., 2013).
2.4.1.2. Pretreatment of lignocellulosic biomass
For use in biological processes, the lignocellulosic biomass requires a
treatment that aims to transform the polymer chains of carbohydrates (cellulose and
hemicellulose) into sugars, primarily glucose, xylose and arabinose that can be
assimilated by microorganisms to obtaining sustainable products as well as value-
added biomolecules. Initially, this transformation process requires a pretreatment of
biomass (physical, chemical, physico-chemical and biological), followed by hydrolysis
(acidic or enzymatic). The pretreatment aims to remove or alter the lignin to increase
the accessibility of biomass to the enzymes that convert carbohydrates into
fermentable sugars (Figure 8). It is also during this step that the majority of
hemicellulose is released. This process should be as simple as possible to obtain a
product with commercial viability (SAHA, 2003; TAHERZADEH et al., 2008;
SARROUH et al., 2009; CHEN et al., 2012; DIEDERICKS et al., 2012; SARKAR et
al., 2012; CANILHA et al., 2013).

50
Figure 8. Lignocellulosic complex after pretreatment. Cellulose microfibrils (green),
hemicellulose (light green) and lignin (brown). “Center for Molecular Biophysics”
Thomas Splettstoesser. LANGAN et al., (2014).
The pretreatments can be divided into physical, chemical, physico-chemical
and biological. Among the pretreatments are the steam explosion, acid or alkali
treatment, ammonia, hydrogen peroxide, solvents, physical crushing or grinding,
fungal degradation, etc. All methods aim the disruption of recalcitrant biomass to
increase the porosity of substrate by the redistribution of lignin allowing the exposure
of cellulose to the enzymes and thus, improve the efficiency of enzymatic hydrolysis
(CHANDEL et al., 2010; BALAN, 2014). There is no universal pretreatment to all
biomass because the different types of biomass differ in respect to their composition
of cellulose, hemicellulose and lignin. Thus, pretreatment methods depend on the
type of feedstock, objective of the process (the constituent to be degraded) and the
product to be obtained, which will directly affect the process. However, production of
highly digestible solids which enhance the yields of sugars during enzymatic
hydrolysis; prevention of degradation of sugars; reduction the formation of inhibitors
and recovering the lignin for conversion to high value byproducts are typical
characteristics that must be achieved in pre-treatment processes. Pretreatment
processes must be cost-effective and environmentally friendly (CANILHA et al., 2013;
CAVKA & & JÖNSSON, 2013).

51
2.4.1.2.1. Acid hydrolysis
The acid hydrolysis use acids such as hydrochloric acid (HCl), phosphoric acid
(H3PO4) and sulfuric acid (H2SO4) to catalyze the hydrolysis reaction of lignocellulosic
materials (BENSAH & MENSAH, 2013; BALAN, 2014). Acid hydrolysis may be
based on the use of concentrated acid/low temperature or dilute acid/high
temperature (LIMAYEM & RICKE, 2012). During the acid hydrolysis of lignocellulosic
biomass, weak acids (formic levulinic), derivatives of furans and phenolic compounds
are formed in addition to the sugars (Figure 9). Acetic acid is formed by hydrolysis of
acetyl groups from hemicellulose as a result of deacetylation of acetylated
pentosans, and its generation depends mainly on the temperature and the
pretreatment residence time with dilute acid (CHANDEL et al., 2011; KANG et al.,
2014). Furfural and 5-hydroxymethylfurfural (HMF) are formed by the degradation of
pentoses and hexoses, respectively. Nevertheless, the HMF concentration of the acid
hydrolysate tends to be smaller due to limited degradation of hexoses in the acid
saccharificationHowever, the formation of degradation products is influenced by the
concentration of acid, temperature, residence time (BALAN, 2014) and equipment
(RABELO et al., 2012). As these compounds are toxic to many microorganisms,
affect the microbial metabolism hindering the fermentation process, and its toxicity is
the major limiting factor to the bioconversion of lignocellulosic materials (CHANDEL
et al., 2007; PANAGIOTOPOULOS et al., 2011; CANILHA et al., 2013). Thus, the
detoxification methods of hydrolysates prior to fermentation, it has been used to
reduce these inhibitory compounds or to remove them in order to improve the
fermentability of hydrolysates to increase their biotechnological applications
(PALMQVIST, 2000; CHANDEL et al., 2010; STOUTENBURG et al., 2011).

52
Figure 9. Structural profile of inhibitors derived of lignocellulosic biomass. Adapted of
CHANDEL et al., (2011).
2.4.1.3. Detoxification methods
The detoxification methods can be physical, chemical or biological agents may
be used individually or in combined form. These methods are included pH
adjustment, adsorption on ion exchange resins, active charcoal adsorption or tin
oxide, neutralization, evaporation, solvent extraction, biological treatment with
enzymes, electrodialysis, membrane separation, adaptation of organism, etc.
(PALMQVIST, 2000; VILLARREAL et al., 2006; CANILHA et al., 2008; CHENG et
al., 2008; CHANDEL et al., 2010; CHANDEL et al., 2011; GE et al., 2011;
CANILHA et al., 2013; JÖSSON, 2013). The detoxification method will vary
depending on the hydrolysate and the microorganism for fermentation. Furthermore,
inhibitors removal techniques can also result in partial degradation of fermentable
carbohydrates. Therefore, it is important to compare different treatment methods in
order to select those that provide higher inhibitors removal and lower reduction of
sugars concentration. An alternative to these treatments is the selection of
microorganisms tolerant to inhibitors that enable efficient fermentation of glucose,
xylose and arabinose, which would reduce the production costs of biofuels from

53
hemicellulose and even minimization or elimination of detoxification processes
(CHANDEL et al., 2010; STOUTENBURG et al., 2011).
Alkali treatment with Ca(OH)2 (overliming) and active charcoal are chemical
methods used to detoxify acid hydrolysates. The overliming causes the precipitation
of toxic compounds and instability of some inhibitors in high pH, efficiently removing
furans and phenolic compounds with a marginal loss of sugars (CHANDEL et al.,
2011; JÖSSON, 2013). Adsorption by active charcoal is capable of removing a
variety of inhibitory compounds such as acetic acid, furans, phenolic, aromatic,
furfural and HMF in high yields combined with low cost (CHANDEL et al., 2011;
STOUTENBURG et al., 2011).
Lignocellulosic biomass has been widely used as raw material for lipid
production by various microorganisms (Table 3). The use of corn cob hydrolysate by
T. dermatis reached a lipid content of 40.2% (XIONG et al., 2015). Y. lipolytica
achieved the accumulation of 58.5% of lipid from sugarcane bagasse hydrolysate.
(TSIGIE et al., 2011). These results show the promising use of lignocellulosic
materials as alternative sources of substrates in the production of renewable raw
materials for biodiesel.

54
Table 3. Performance of lipid production from lignocellulosic biomass with different microorganisms
Microorganism Lignocellulosic
biomass Cell concentration
(g/L) Lipid (g/L)
Lipid content (%)
Reference
T. dermatis Corncob 17.3 7.0 40.2 (XIONG et al., 2015)
T. cutaneum Corncob 38.4 12.3 32.1 (GAO et al., 2014)
L. starkeyi Rice straw 12.0 4.6 36.0 (AZAD et al., 2014)
R. glutinis Wheat straw 11.8 1.4 12.5 (MAST et al., 2014)
T. cutaneum Corncob 22.0 7.9 36.0 (CHEN et al., 2012a)
C. curvatus Sorghum bagasse 6.0 2.6 43.0 (LIANG, YANNA et al., 2012)
C. curvatus Wheat straw 17.2 5.8 33.5 (YU et al., 2011)
Y. lipolytica Sugarcane bagasse 11.4 6.7 58.5 (TSIGIE et al., 2011)
T. fermentuns Rice straw 28.6 11.5 40.1 (HUANG et al., 2009)

55
2.4.1.4. Hemicellulose fraction for production of microbial lipids
Hemicellulose is a heterogeneous polymer which is closely associated with
cellulose in plant cell walls. It has short chain and amorphous structure, which makes
it more easily hydrolyzed than cellulose. This fraction has a branched structure
composed of pentoses (D-xylose, L-arabinose), hexoses (D-glucose, D-galactose, D-
mannose), amounts of acetic and uronic acids (D-glucuronic acid and 4-Acid methyl-
glucuronic) and, in general, may represent about 20-35% of lignocellulosic biomass
(BENSAH & MENSAH, 2013; CANILHA et al., 2013). Other sugars such as L-
mannose and L-fucose may also be present in small amounts (GIRIO et al., 2010).
Xylose is the dominant carbohydrate of the hemicellulose fraction, representing
approximately 80% of sugars (CANILHA et al., 2013).
The heterogeneous structure of hemicellulose having a low degree of
polymerization makes it an interesting fraction for fermentation processes. However,
the conversion of hemicellulose into biofuels and chemicals is still problematic, since
many microorganisms fermenting hexoses are generally unable to assimilate and
tolerate the pentoses and inhibitors originated in the pretreatment of biomass. Thus,
hemicellulose still represents the major polysaccharide fraction wasted in most pilot
plant of 2G ethanol. As for its production, the hemicellulose is generally removed
during early processing of biomass in order to reduce structural constraints for the
enzymatic hydrolysis of cellulose. In addition, traditional ethanol producing
microorganisms are unable to ferment the monosaccharides of the hemicellulose
(GIRIO et al., 2010; ZHANG et al., 2014). Some attempts have been made to
genetically modify some microorganisms such as Saccharomyces cerevisiae, for the
fermentation of hexoses and pentoses to second generation ethanol (2G ethanol)
cellulosic ethanol production in order to obtain higher yields and productivity (VILELA
et al., 2013; NIJLAND, 2014). However, a major challenge is the isolation of
microorganisms having ability to ferment a wide range of sugars and resist the
fermentation inhibitors.
Some microorganisms can use xylose as a carbon source for microbial lipid
production and recently, the conversion of hydrolyzed hemicellulose sugars into SCO

56
for biodiesel production have been reported. Among the exploited lignocellulosic
biomass are the hemicellulose hydrolysate from sugarcane bagasse (TSIGIE et al.,
2011; HUANG et al., 2012a; ZHAO et al., 2012), wheat straw (KITCHA et al., 2011;
YU et al., 2011), corn cob (HADDOUCHE et al., 2011; CHEN et al., 2012; LIU et
al., 2015; XIONG et al., 2015), rice straw (HUANG et al., 2009; AZAD et al., 2014),
corn fiber (LIANG et al., 2014) and tree leaves (HADDOUCHE et al., 2011). When
compared to other substrates, the hemicellulose hydrolysate from sugarcane
bagasse has higher concentrations of carbohydrates and high availability and low
cost (MATOS et al., 2012). Besides, Utilization of hemicellulose-derived sugars such
as xylose would be a key consideration for the success of industrial SCO production
(PROBST, 2014). Yeasts that can use the hemicellulose hydrolysate from sugarcane
bagasse as sole carbon source and can assimilate D-xylose has high
biotechnological potential and can be used for various purposes such as
biodetoxification, fermentation, protein supplementation, biofuels and other chemicals
(MATOS et al., 2012). Among the oleaginous yeast being studied for microbial lipid
production using hemicellulosic hydrolysate are Rhodosporidium toruloides (HU et
al., 2009; ZHAO et al., 2012); Cryptococcus curvatus, Rhodosporidium toruloides,
Lipomyces starkeyi, Yarrowia lipolytica (CHEN et al., 2009; TSIGIE et al., 2011; YU
et al., 2011; ANSCHAU et al., 2014); Microsphaeropsis sp (KITCHA, 2011);
Trichosporon fermentans (HUANG et al., 2009; HUANG et al., 2012a); Trichosporon
cutaneum (CHEN et al., 2009; CHEN et al., 2012) and Rhodotorula glutinis
(HADDOUCHE et al., 2011; YU et al., 2011; LIU et al., 2015a). Fermentation of
pentose in industrial scale is not well established in Brazil (CANILHA et al., 2013)
and since the hemicellulose is the second most abundant polysaccharide in
lignocellulosic biomass, the use of all hemicellulosic sugars is essential to the
efficient and cost-effective production of biofuels from lignocellulosic biomass (YU et
al., 2011). Thus, the hemicellulose fraction could be integrated to the biorefinery from
lignocellulosic materials for the complete utilization of sugarcane bagasse for
production of biofuels and chemicals.

57
CHAPTER 3. OBTAINING OF HEMICELLULOSIC HYDROLYSATE
(HH) FROM SUGARCANE BAGASSE
3.1. Introduction
Economic and environmental studies have challenged researchers to search
for alternative, sustainable and renewable fuels able to satisfy the global energy
demand. Biodiesel and biokerosene have received much attention due to their
biodegradable characteristics and lower CO2 and sulphur-rich emissions (CHEN et
al., 2012). Due to limitations in the vegetable oil supply and direct competition with
food production, it is necessary to study their replacement by other feedstocks, such
as agricultural waste and lignocellulosic biomass (ZHAO et al., 2012). The sugarcane
bagasse, a by-product of sugarcane mills, is mainly composed of lignin and two
polysaccharides (cellulose and hemicellulose). These two can be hydrolyzed into
monosaccharides and then, used as a carbon source by microorganism for
production of fuels and chemicals. Usually, the pretreatment of biomass reaches the
hemicellulosic fraction releasing fermentable sugars, mainly xylose, (AGUILAR et al.,
2002) which can be a carbon source to produce SCO as feedstock for biodiesel
production. However, the pretreatment generates toxic compounds by the
degradation of hemicellulose and cellulose fraction of lignocellulosic biomass which
are potential inhibitors of microbial metabolism, hindering the bioconversion of sugars
into desired products (CANILHA et al., 2010). Since, in general, the amount of these
inhibitors depends on the pretreatment condition and type of biomass is important
establish favorable conditions of pretreatment for each kind of lignocellulosic
biomass. Many studies on acid hydrolysis of sugarcane bagasse have been
developed to investigate several factors such as the type of acid and its
concentration, residence time, temperature and concentration of solids (raw
material), aiming to establish the optimal conditions of hydrolysis to obtain
hydrolysates with high concentration of xylose and low content of inhibitors
(AGUILAR et al., 2002; PAIVA et al., 2009; UM et al., 2011). Thus, this chapter
investigates the potential of hydrolysis with dilute acid of in natura sugarcane
bagasse using different concentrations of H2SO4, residence time and the equipments

58
autoclave and Parr reactor, in order to obtain a hydrolysate with high concentration of
sugars and low level of inhibitors.
3.2. Material and methods
3.2.1. Raw material
The in natura sugarcane bagasse was kindly provided by CTBE (National
Laboratory of Science and Technology of Bioethanol) from Usina da Pedra, Serrana-
SP, Brazil. Its chemical composition (dry basis) was 49.5% cellulose, 24.3%
hemicellulose, lignin 22.7% and 0.3% ash and it was determined using the validated
method by (GOUVEIA, 2009; CANILHA, L. et al., 2011; ROCHA et al., 2011). The
bagasse was dried under the sun light and stored in plastic bags until use.
3.2.2. Determination of moisture of sugarcane bagasse
About 1g of bagasse in triplicate was dried in petri dishes at 50°C until
constant weight, usually 24 hours.
3.2.3. Strategies for obtaining hemicellulosic hydrolysate from sugarcane
bagasse
3.2.3.1. Acid hydrolysis in autoclave
In the literature, the pretreatment of sugarcane bagasse by acid hydrolysis has
varied in the type of acid and its concentration, residence time and temperature. One
of the most acid used is the H2SO4 in different concentrations, time and temperature
(CANILHA et al., 2010; HUANG et al., 2012a; CHENG et al., 2008; AGUILAR et al.,
2002) being effective on the solubilization of hemicellulosic fraction yielding
fermentable sugars. Thus, the sugarcane bagasse was pretreated by acid hydrolysis
with H2SO4, as described in Figure 10, in order to obtain the hemicellulosic

59
hydrolysate for lipid production and leaving the cellulosic fraction for 2G ethanol.
Initially, for the acid hydrolysis in autoclave were tested two conditions of acid
hydrolysis: 1.5% (w/v) H2SO4 at 120°C for 20 min and 2% H2SO4 at 120°C for 24 min
(w/v) (AGUILAR et al., 2002). The hemicellulosic hydrolysate (liquid phase) was
named as HH.
Figure 10. Obtaining process of hemicellulose hydrolysate (HH). Abbreviation: S: L =
solid: liquid.
The hemicellulose conversion by acid hydrolysis was calculated by relating the
amount of obtained hemicellulose (g) by the amount of bagasse (dry basis) used to
pretreatment according to the Equation 1.
𝐶𝐻 (%) =𝑀ℎ
𝐹∗𝐵∗ 100 (1)

60
Where:
CH: Hemicellulose conversion (%)
𝑀ℎ: Mass of hemicellulose after the pretreatment* (g)
*Hemicellulose= pentoses (xylose + arabinose)*0.88 + furfural*1.38 + acetic
acid*0,72 (CANILHA et al., 2013)
F: Hemicellulose percentage of sugarcane bagasse
B: Massa de bagaço (g)
3.2.3.1.1. Severity factor
The acid hydrolysis was evaluated with the severity factor (SF), which is an
index used to assess the effect of pretreatment temperature and time on the
efficiency of the process (RABELO et al., 2012; BENSAH & MENSAH, 2013).
Equation 2 describes the SF of the pretreatment.
𝐿𝑜𝑔 (𝑅0) = 𝐿𝑜𝑔 [𝑡. exp (𝑇−𝑇𝑟𝑒𝑓
14.75)] (2)
Where 𝑡 is the residence time in minutes, 𝑇 is the hydrolysis temperature in
°C, Tref is the reference temperature, most often 100°C.
3.2.3.1.1. Detoxification procedures of HH
The hemicellulose hydrolysate was treated in order to decrease the
concentrations of inhibitors generated in the acid hydrolysis of sugarcane bagasse.
The treatments consisted of several pH adjustments, wherein the initial pH of HH (~
0.80 - 1.03) was neutralized by the addition of Ca(OH)2 (10%, w/v) (Overliming) and
then acidified by addition of concentrated H3PO4. The precipitate was removed by
centrifugation at 2980 G, 4°C for 10 minutes. In some treatments, the hydrolysate
was submitted to active charcoal adsorption (5%, w/v; granulometry 1-2mm, Synth) in

61
Erlenmeyer flasks on rotary shaker at 150 rpm, 28°C for 2 hours (Table 4) (AGUILAR
et al., 2002; MUSSATO, 2004; CARVALHO 2005; MARTON et al., 2006;
VILLARREAL et al., 2006; CHANDEL, 2011; GE et al., 2011). Then, the detoxified
HH was vacuum filtrated and characterized to quantify the concentrations of xylose,
glucose, arabinose, acetic acid, furfural and HMF.
Table 4. Detoxification methods of HH
Treatments Detoxification methods Conditions
Ca(OH)2
1 Ca(OH)2 Increasing of pH to 8.5 and decreased to pH 4.0*
2 Ca(OH)2 Increasing of pH to 7.0 and decreased to pH 5.5*
3 Ca(OH)2 Increasing of pH to 5.5 with Ca(OH)2
Active charcoal
4 Active charcoal No pH adjustment 5 Ca(OH)2 + Active charcoal Increasing of pH to 8.5 and decreased to pH 4.0*
*Reduction of pH with H3PO4.
3.2.3.2. Experimental design to increase the sugars concentration of HH
To produce fermentable hydrolysates and prevent high losses of yields, it is
necessary the selection of reaction conditions that keep the generation of
degradation products at a low level (UM; BAE, 2011). In order to find the appropriate
concentration of H2SO4 and residence time for the acid hydrolysis of sugarcane
bagasse, a factorial design 22 with three central points (Table 5) was performed in
autoclave at 120°C using a solid:liquid (S:L) ratio of 1:10. The experimental data
were analyzed by regression and graphical analysis by Statistica software version
7.0 (Statsoft, USA).

62
Table 5. Factorial design 22 with real and coded values
Parameters -1 0 1
H2SO4, % (X1) 1.5 3.5 5.5
Time, min (X2) 20 30 40
3.2.3.3. Acid hydrolysis in Parr reactor
Acid hydrolysis was also performed using a 7.5 L Parr reactor Model 4556
(Parr Instrument Company, Illnois- USA) at 120°C, H2SO4 1.5% (w/v) for 20 min,
solid: liquid ratio of 1:10 to obtain a hydrolysate with a high concentration of
hemicellulose sugars. The sugarcane bagasse was also kindly provided by CTBE
(National Laboratory of Science and Technology of Bioethanol), however, was from
another batch supplied by Usina da Pedra, Serrana-SP, Brazil. Its chemical
composition (dry basis) was 42.6% cellulose, hemicellulose 26.2%, 22.5% lignin,
4.3% ash and 5.3% extractives determined by (GOUVEIA, 2009).
3.3. Results and discussion
3.3.1. Hemicellulosic hydrolysate (HH) from sugarcane bagasse obtained by
autoclave
The sugarcane bagasse has a moisture content of about 9%. During the acid
hydrolysis of sugarcane bagasse, the sugar concentrations not changed significantly
when the conditions of H2SO4 1.5% for 20 min and 2% H2SO4 for 24 min. Xylose,
major hemicellulosic sugar, reached a concentration around 13.5 g/L and glucose
and arabinose were released into the liquor during acid hydrolysis at lower
concentrations (Figure 11). Glucose can be originated from the cellulosic fraction or
heteropolymers of hemicellulose fraction (AGUILAR et al., 2002). It is possible to
observe low glucose concentration because the hydrolysis of hemicellulose hardly
damages the cellulosic fraction due to hemicellulose bonds are weaker than in the
cellulose requiring milder conditions to be hydrolysate than to the hexoses (AGUILAR

63
et al., 2002; TSOUTSOS et al., 2011). The condition of 2% H2SO4 at 120°C for 24
min resulted a hydrolysate with 13.4 g/L xylose, 2.3 g/L glucose, 2.4 g/L arabinose,
2.7 g/L acetic acid, 111.3 ppm furfural and 28.9 ppm HMF yielding a hemicellulose
conversion around 65%. In similar conditions of hydrolysis, 2% H2SO4 at 120°C for
24 min, AGUILAR (2002) obtained a hydrolysate with 21.6 g/L xylose, 3.0 g/L
glucose, 0.5 g/L furfural and 3.65 g/L acetic acid but in this condition 90% of
hemicellulose was hydrolyzed. The efficiency of hydrolysis depends on the catalyst
and its concentration, temperature, residence time and equipment, which affects the
yields of sugars and the formation of its degradation products. CHENG, K. K. et al.
(2008) pretreated the sugarcane bagasse using 1.25% (w/w) H2SO4 at 121°C for 2
hours in autoclave reached 17.1 g/L xylose, however, the high concentration of
glucose, 7.2 g/L, indicated the substantial degradation of cellulosic fraction. TSIGIE
et al. (2011) used 2.5% HCl at 121°C for 45 min to pretreat the sugarcane bagasse
and found similar composition of HH obtained in this study, but with higher
concentrations of glucose, furfural and HMF indicating higher breakdown of cellulose
into glucose and degradation by-products. LAOPAIBOON et al. (2010) achieved an
yield of 92% of xylose pretreating the sugarcane bagasse with 0.5% HCl at 100°C for
5h. Therefore, different conditions of acid hydrolysis for the pretreatment of
sugarcane bagasse affect the concentration of sugars and inhibitors influencing on
conversion of hemicellulose.
Figure 11. Xylose, glucose and arabinose concentration on HH.
0
2
4
6
8
10
12
14
16
Xylose Glucose Arabinose
Co
nc
en
tra
tio
n (
g/L
)
HH 1.5% (m/v) H2SO4 HH 2% (m/v) H2SO4

64
In both conditions of pretreatment, 1.5% H2SO4 at 120°C for 20 min and 2%
H2SO4 at 120°C for 24 min, the HH showed higher concentration of furfural than HMF
due to the increased degradation of pentoses on acid hydrolysis. Increasing the
concentration of H2SO4 and residence time caused a slight higher degradation of
pentoses, which was indicated by the concentration of furfural from 85.4 ppm to
111.3 ppm when H2SO4 2% (w/v) for 24 min was used (Table 6). The concentrations
of acetic acid and HMF were not significantly affected by the severity of pretreatment
keeping around 2.7 g/L and 30 ppm, respectively.
Table 6. Composition of HH obtained by acid hydrolysis of sugarcane bagasse under
the conditions tested in this work
Acid hydrolysis condition
Concentration (g/L) 1.5% H2SO4, 120°C, 20 min 2% H2SO4, 120°C, 24 min
Xylose 13.2 ± 0.9 13.4 ± 1.1
Glucose 2.4 ± 0.4 2.3 ± 0.3
Arabinose 2.3 ± 0.3 2.4 ± 0.2
Acetic acid 2.6 ± 0.3 2.7 ± 0.4
Furfural 0.09± 0.004 0.11± 0.005
HMF 0.03 ± 0.004 0.03 ± 0.001
3.3.1.1. Detoxification of HH obtained by autoclave
The detoxification processes help the removal of toxic compounds and
additionally cause loss of sugars by adsorption (CHANDEL etal., 2011). The results
show that the detoxification treatments caused a significant reduction of sugars
(Figure 12). The treatment 2 caused the highest loss of sugars, especially glucose
and arabinose, for both HH (Figure 12). The losses achieved about 40% and 45% for
glucose and arabinose, respectively. The lowest loss of xylose of around 10% was
found when the treatment 3 was used in both HH. The highest removal of inhibitors
was achieved when only active charcoal (treatment 4) or Ca(OH)2 in combination
with active charcoal (treatment 5) were used (Figure 13). Furfural and HMF were

65
almost completely removed while the acetic acid removal was only 44%. Similar
results were obtained by GE et al., (2011) when used Ca(OH)2 and activated
charcoal to detoxify corn cob hydrolysate achieving complete removal of furfural,
96.6% of phenolic compounds and 62.4% of acetic acid. YU et al. (2011) detoxified
the wheat straw hydrolysate by the combination of (Ca(OH)2 with high temperature,
which caused a loss of 26% of total sugars. The treatments with pH adjustments with
Ca(OH)2 and H3PO4 showed less effectiveness in removing inhibitors.
The results show that using only active charcoal would be enough to remove
most of the toxic compounds from hemicellulose hydrolysate in order to improve its
fermentability. STOUTENBURG et al. (2011) improved the fermentability of wood
hydrolysate using 5% activated charcoal having increased the ethanol production,
sugars consumption and conversion efficiency by S. stipitis. The treatment with active
charcoal is an efficient and economical method of removing phenolic compounds,
acetic acid, aromatic compounds, furfural and HMF by adsorption but it depends on
the porosity, purity, brand and granulometry of active charcoal. The ability to remove
a variety of inhibitors contributes to improving the fermentability of hydrolysates, and
hence the yield fermentation (STOUTENBURG et al., 2011).

66
Figure 12. Loss of sugars after the detoxification treatments of HH. (A) H2SO4 1.5 %
(m/v), 20 min; (B) H2SO4 2 % (m/v), 24 min. Treatments 1: Ca(OH)2 - increase the pH to 8.5 and
decrease to 4.0; 2: Ca(OH)2 - increase the pH to 7.0 and decrease to 5.5; 3: Ca(OH)2 - increase the pH to 5.5, 4:
Charcoal; 5: Ca(OH)2 increase the pH to 8.5 and decrease to 4.0 + Charcoal.
0
10
20
30
40
50
60
1 2 3 4 5
Lo
ss
of
su
ga
rs (
%)
Detoxification treatment
A
Xylose Glucose Arabinose
0
10
20
30
40
50
60
1 2 3 4 5
Lo
ss
of
su
ga
rs (
%)
Detoxification treatment
B
Xylose Glucose Arabinose

67
Figure 13. Removal of inhibitors after the detoxification treatments of HH. (A)
Furfural; (B) HMF; (C) Ácido acético. Treatments 1: Ca(OH)2 - increase the pH to 8.5 and decrease to
4.0; 2: Ca(OH)2 - increase the pH to 7.0 and decrease to 5.5; 3: Ca(OH)2 - increase the pH to 5.5, 4: Charcoal; 5:
Ca(OH)2 increase the pH to 8.5 and decrease to 4.0 + Charcoal.
0
20
40
60
80
100
120
1 2 3 4 5
Fu
rfu
ral re
mo
va
l (%
)
Detoxification method
A
HH 1.5% (w/v) H2SO4 HH 2% (w/v) H2SO4
0
20
40
60
80
100
120
1 2 3 4 5
HM
F r
em
ova
l (%
)
Detoxification method
HH 1.5% (w/v) H2SO4 HH 2% (w/v) H2SO4
0
10
20
30
40
50
1 2 3 4 5
Ac
eti
c a
cid
re
mo
va
l (%
)
Detoxification treatment
HH 1.5% (w/v) H2SO4 HH 2% (w/v) H2SO4
B
C

68
The effectiveness of detoxification processes depend on the type of
hydrolysate and methods of detoxification because each type of hydrolysate has a
different degree of toxicity (PARAWIRA et al., 2011). Although we have tested
several detoxification treatments of HH in order to improve its fermentative efficiency,
it was observed that Lipomyces starkeyi was able to ferment the HH obtained by
hydrolysis with H2SO4 1.5% (w/v) at 120°C for 20 minutes and pH adjusted with CaO
(liming) at room temperature, considered as non-detoxified since the concentration of
sugars and inhibitors has not changed significantly.
3.3.2. Experimental design to increase the sugars concentration on HH
Acid hydrolysis is one of the more efficient pretreatment to solubilize the
hemicellulose and it was effective in the hemicellulose hydrolysis of sugarcane
bagasse. However, to improve the yield of hydrolysis and obtain a hydrolysate with a
high xylose concentration and low content of inhibitors the acid concentration and
residence time were statistically investigated in order to obtain optimum conditions
for the pretreatment of bagasse. Table 7 shows the experimental design matrix and
the experimental results obtained in various conditions of acid hydrolysis. Even to the
lower severity factor (SF) (Run 1) considerable conversion of hemicellulosic fraction
(~63%) could be achieved and the cellulosic fraction and formation of inhibitors were
affected by increasing the SF. A remarkable change in xylose concentration is
evident when the acid concentration and residence time are increased, as reported
by PAIVA et al., (2009). At the condition of 5.5% H2SO4 the xylose concentration
improved with increasing the SF (Run 2 and 4), however, the higher SF (Run 4)
showed the highest values of furfural and HMF indicating more degradation of the
hemicellulosic and cellulosic fractions, respectively. The highest hemicellulose
conversion (~94%) was found in mid-range of SF (Run 6, 7, and 8), however, with
the concentration of furfural nearly 5 times higher than that found in milder SF (Run
1).
Although the runs 1-2 have the same SF, there was a considerable increase of
furfural by a factor of 6 to the run 2 followed by the increasing of glucose, arabinose
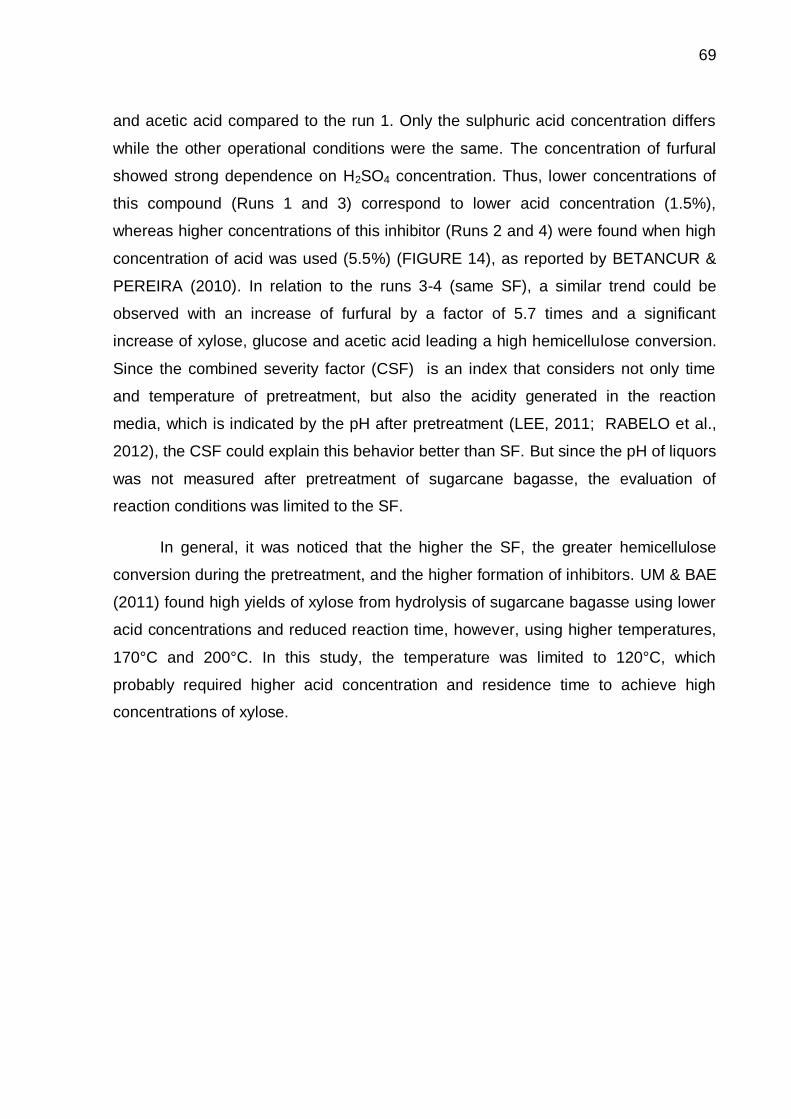
69
and acetic acid compared to the run 1. Only the sulphuric acid concentration differs
while the other operational conditions were the same. The concentration of furfural
showed strong dependence on H2SO4 concentration. Thus, lower concentrations of
this compound (Runs 1 and 3) correspond to lower acid concentration (1.5%),
whereas higher concentrations of this inhibitor (Runs 2 and 4) were found when high
concentration of acid was used (5.5%) (FIGURE 14), as reported by BETANCUR &
PEREIRA (2010). In relation to the runs 3-4 (same SF), a similar trend could be
observed with an increase of furfural by a factor of 5.7 times and a significant
increase of xylose, glucose and acetic acid leading a high hemicellulose conversion.
Since the combined severity factor (CSF) is an index that considers not only time
and temperature of pretreatment, but also the acidity generated in the reaction
media, which is indicated by the pH after pretreatment (LEE, 2011; RABELO et al.,
2012), the CSF could explain this behavior better than SF. But since the pH of liquors
was not measured after pretreatment of sugarcane bagasse, the evaluation of
reaction conditions was limited to the SF.
In general, it was noticed that the higher the SF, the greater hemicellulose
conversion during the pretreatment, and the higher formation of inhibitors. UM & BAE
(2011) found high yields of xylose from hydrolysis of sugarcane bagasse using lower
acid concentrations and reduced reaction time, however, using higher temperatures,
170°C and 200°C. In this study, the temperature was limited to 120°C, which
probably required higher acid concentration and residence time to achieve high
concentrations of xylose.

70
Table 7. Experimental design matrix with actual values and experimental results for
factorial design.
Runs 1 2 3 4 5 6 7
Concentration of H2SO4 (%, w/v) 1.5 5.5 1.5 5.5 3.5 3.5 3.5
Time (min) 20 20 40 40 30 30 30 Temperature (°C) 120 120 120 120 120 120 120
Severity factor (Log R0) 1.9 1.9 2.2 2.2 2.1 2.1 2.1
Xylose (g/L) 12.3 13.7 11.3 18.3 17.8 19.0 19.5
Glucose (g/L) 1.9 3.7 2.2 4.4 3.7 3.9 4.0
Arabinose (g/L) 2.2 2.6 2.5 3.0 2.9 3.3 3.4
Acetic acid (g/L) 3.3 4.0 3.6 4.2 4.0 3.9 4.0
Furfural (ppm) 41.3 249.6 74.8 422.7 197 190.8 199.6
HMF (ppm) 11.6 15.6 12.1 24.4 21.6 21.7 21.3
Hemicellulose conversion (%) 63.4 74.4 61.4 94.5 89.7 95.2 97.7
Figure 14. Xylose, acetic acid and furfural concentration after the acid hydrolysis of
sugarcane bagasse on the experimental design.
The effect of parameters H2SO4, time and their interaction on the
concentration of glucose, xylose and arabinose are shown in Figure 15. The
concentration of H2SO4 and residence time were statistically significant (p ≤ 0.05) for
0
100
200
300
400
500
0
5
10
15
20
25
1 2 3 4 5 6 7
Fu
rfu
ral
(pp
m)
Xylo
se
, a
ce
tic
ac
id (
g/L
)
Runs (Hydrolysis condition)
Xylose Acetic acid Furfural

71
the production of glucose, however, only the variable H2SO4 showed statistically
significant influence on xylose within the range studied. While the parameters
showed no statistically significant effect at 95% confidence level for the arabinose
production. ANOVA analysis showed R2 values of 0.40, 0.79 and 0.27 for xylose,
glucose and arabinose, respectively, and linear predictive model could not be
obtained, because it could not explain the variability of responses within the ranges
studied.
Pareto Chart of Standardized Effects; Variable: Glucose (g/L)
2**(2-0) design; MS Pure Error=,0180417
DV: Glucose (g/L)
6,041108
17,35817
p=,05
Standardized Effect Estimate (Absolute Value)
(2)Tempo
(1)H2SO4
A

72
Figure 15. Pareto chart for estimating the effects of H2SO4 concentration (1) and
residence time (2) in the production of glucose (A), xylose (B) and arabinose (C)
generated in the hydrolysis of sugarcane bagasse at 120°C.
Pareto Chart of Standardized Effects; Variable: Xylose (g/L)
2**(2-0) design; MS Pure Error=,7402791
DV: Xylose (g/L)
4,836022
p=,05
Standardized Effect Estimate (Absolute Value)
(1)H2SO4
Pareto Chart of Standardized Effects; Variable: Arabinose (g/L)
2**(2-0) design; MS Pure Error=,0694207
DV: Arabinose (g/L)
1,668023
p=,05
Standardized Effect Estimate (Absolute Value)
(1)H2SO4
C
B

73
The effect of parameters H2SO4, time and their interaction on the
concentration of acetic acid and furfural is shown in Figure 16. The acid
concentration is the factor with the largest effect on the concentration of acetic acid
and furfural. For acetic acid, the reaction time also showed statistically significant
effect (p = 0.05), however, the interaction of acid concentration and reaction time had
no significant influence. For furfural, the parameters and the interaction between
them have statistically significant effect (p = 0.05) within the range studied.
The analysis of variance (ANOVA) for the acetic acid (Table 8) showed R2
0.856, meaning that 85.6% of the variability of responses could be explained by
Equation 3. However, the surface cannot be generated, because it does not meet the
established condition of Fcal greater than the Ftab.
Pareto Chart of Standardized Effects; Variable: Ácido acético
2**(2-0) design; MS Pure Error=,0012093
DV: Ácido acético
-,073759
6,008528
17,54766
p=,05
Standardized Effect Estimate (Absolute Value)
1by2
(2)Tempo
(1)H2SO4
A

74
Pareto Chart of Standardized Effects; Variable: Furfural
2**(2-0) design; MS Pure Error=20,35733
DV: Furfural
15,46878
22,90078
61,62884
p=,05
Standardized Effect Estimate (Absolute Value)
1by2
(2)Tempo
(1)H2SO4
Figure 16. Pareto chart for estimating the effects of H2SO4 concentration (1) and
residence time (2) for the production of acetic acid (A) furfural and (B) generated in
the hydrolysis of sugarcane bagasse at 120°C.
Table 8. ANOVA for the production of acetic acid in HH
Source of variation Sum of squares
Degrees of freedom
Mean square
Fcal
Regression 0.4164 2 0.1041 6.06
Residue 0.0687 4 0.0343
Total 0.4851 6
% explained variation (R2)= 85.6; F2;4;0.05=6.96
Acetic acid (g/L)=3.84+0.31*X1+0.10*X2 (3)
By ANOVA (Table 9), a significant linear and predictive model at 95%
confidence level was obtained for furfural with R2 = 0.99, represented by Equation 4.
As the Fcal (2137.3) was higher than the Ftab (9.28), it was possible to generate the
B
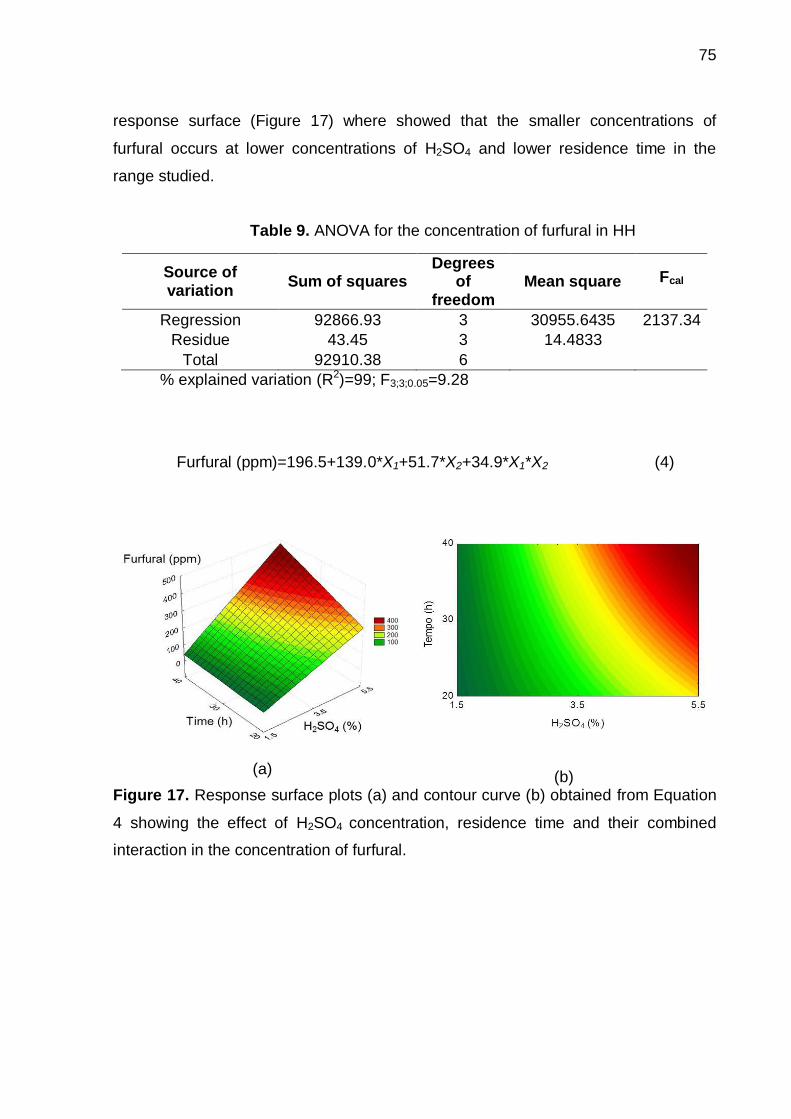
75
response surface (Figure 17) where showed that the smaller concentrations of
furfural occurs at lower concentrations of H2SO4 and lower residence time in the
range studied.
Table 9. ANOVA for the concentration of furfural in HH
Source of variation
Sum of squares Degrees
of freedom
Mean square Fcal
Regression 92866.93 3 30955.6435 2137.34
Residue 43.45 3 14.4833
Total 92910.38 6
% explained variation (R2)=99; F3;3;0.05=9.28
Furfural (ppm)=196.5+139.0*X1+51.7*X2+34.9*X1*X2 (4)
(a)
(b)
Figure 17. Response surface plots (a) and contour curve (b) obtained from Equation
4 showing the effect of H2SO4 concentration, residence time and their combined
interaction in the concentration of furfural.

76
For the concentration of HMF, all parameters were significant at 95%
confidence level within the range studied (Figure 18), but a linear model could not be
obtained, as presented R2 of 0.66 by ANOVA.
Figure 18. Pareto chart for estimating the effects of H2SO4 concentration (1) and
residence time (2) in the production of HMF generated in the hydrolysis of sugarcane
bagasse at 120°C.
The models were not predictive for the concentration of sugars and HMF and
an increasing of H2SO4 concentration and residence time would considerably
increase the concentration of furfural and acetic acid. ARISTIZABAL, (2013) reported
that L. starkeyi could grow in medium containing 30% of HH from steam exploded
sugarcane bagasse showing a composition of 3 g/L acetic acid, 180 ppm furfural and
62 ppm HMF. In concentrations higher than these, the yeast showed a strong
inhibition, long lag phase and cell death. Therefore, it was decided to continue using
the condition of H2SO4 1.5% (m/v) for 20 minutes which showed a similar HH
Pareto Chart of Standardized Effects; Variable: HMF (ppm)
2**(2-0) design; MS Pure Error=,0234563
DV: HMF (ppm)
27,10823
30,3827
53,03301
p=,05
Standardized Effect Estimate (Absolute Value)
1by2
(2)Tempo
(1)H2SO4

77
composition to that found by ARISTIZABAL, (2013), although no high concentration
of xylose was obtained in the present study.
3.3.3. Obtaining the HH by Parr reactor
The hemicellulosic hydrolysate of sugarcane bagasse obtained by acid
hydrolysis with 1.5% H2SO4 120°C for 20 minutes in a Parr reactor had a composition
of sugars greater than that obtained in autoclave (Table 10). The concentration of
xylose increased from 13.2 to 18.5 g/L, representing an increase of about 40%.
Under these conditions, approximately 82% of the hemicellulosic sugars were
hydrolyzed with minimal degradation of cellulose, however, with additional by-product
formation and hence degradation of the hemicellulose fraction. The acetic acid
concentration was 3.6 g/L and furfural and HMF were maintained below 0.3 and 0.4
g/L, respectively. CHANDEL et al. (2007) obtained a similar composition of
sugarcane bagasse hydrolyzed with HCl 1.5% at 140°C for 30 min resulting in 17.2
g/L xylose, 3.8 g/L glucose, 2.56 g/L arabinose, and 3.5 g/L acetic acid.
The high conversion of hemicellulose was also evidenced by the chemical
composition of sugarcane bagasse before and after the pretreatment, where the
hemicellulose decreased from 26.2% to 5.4%, respectively (Table 11). Bedises, the
pretreatment resulted in enrichement of cellulose content from 42.6% to 50.9%. The
improvement in the yield of hemicellulose can be due to better operating conditions in
reactor than to autoclave, which can improve the efficiency of hydrolysis. However, it
may also have avoided the reduction of volatiles inhibitors concentration by
evaporation (LENIHAN et al., 2010; CHANDEL et al., 2011) generating higher level
of inhibitors than to the HH obtained in autoclave.
Although the hydrolysates obtained by autoclave and reactor Parr showed
differences in its composition, especially xylose content, it was decided to use both
hydrolysates as potential substrates for fermentation in order to evaluate the lipid
production by Lipomyces starkeyi. The HH autoclave and HH reactor were named as
HHA and HHR, respectively.

78
Table 10. Composition of hemicellulosic hydrolysate (HHR) obtained by acid hydrolysis in Parr reactor and comparison with
the HHA obtained in autoclave.
Pretreatment Xylose (g/L) Glucose (g/L) Arabinose (g/L) Acetic acid (g/L) HMF (g/L) Furfural (g/L)
Parr reactor 18.5 ± 1.7 2.5 ± 0.9 2.2 ± 0.3 3.6 ± 0.4 0.16 ± 0.05 0.29 ± 0.2
Autoclave 13.2 ± 0.9 2.4 ± 0.4 2.3 ± 0.2 2.6 ± 0.2 0.03 ± 0.004 0.1± 0.004
Table 11. Chemical characterization of in natura sugarcane bagasse and pretreated by acid hydrolysis in reactor Parr
Bagasse Cellulose (%) Hemicellulose (%) Lignin (%) Ash (%) Extratives (%)
In natura 42.6 26.2 22.5 4.3 5.3
Pretreated 50.9 5.4 37.1 5.2 -

79
3.4. Conclusion
The pretreatment of sugarcane bagasse with dilute acid was capable of
hydrolyzing 65% of hemicellulose generating fermentable sugars, especially
xylose; and this efficiency reached 82% when the hydrolysis was carried out in
a Parr reactor under the same conditions.
Although higher conversions of hemicellulose were achieved when the
H2SO4 concentration and reaction time increased, the obtained model was not
predictive for the variability of sugars. However, additional generation of
inhibitors was observed, indicating the degradation of cellulosic and
hemicellulosic fraction. When necessary the detoxification of hydrolysate, only
activated charcoal or in combination with Ca(OH)2 would be enough to remove
nearly 100% of furfural and HMF and reduce 44% of acetic acid concentration.
However, detoxification methods could significantly reduce the concentration of
sugars.
The hydrolysates obtained may be potential substrates for fermentation
processes, since the pretreatment led to low formation of by-products of
pentoses and hexoses degradation.

80
CHAPTER 4. HEMICELLULOSIC HYDROLYSATE OF
SUGARCANE BAGASSE AS CARBON SOURCE FOR
CONVERSION INTO LIPIDS BY Lipomyces starkeyi
4.1. Introduction
Hemicellulose is a constituent of lignocellulosic biomass that is of particular
interest because of its unique properties and composition. It can be
depolymerized mainly into xylose, and its subsequent conversion into value-
added products via microbial fermentation is complex, since most of the
industrial microorganisms are unable to metabolize pentoses or tolerate the
presence of growth inhibitors (CHANDEL et al., 2010; CANILHA et al., 2013).
As the hemicellulosic hydrolysate (HH) produced industrially in 2G ethanol
plants is usually seen as a secondary stream due to the lack of efficient
fermentation to bioethanol, one could estimate the potential for conversion into
higher value chemicals/lipids if a robust microorganism and processes could
integrate the use of this fraction by a lignocellulose feedstock-based biorefinery
(CARVALHEIRO et al., 2008). Therefore, the efforts of this work were directed
towards using this fraction from lignocellulose for the production of microbial oil
for biofuels or oleochemical industry, leaving the cellulosic fraction for ethanol
production, thereby aiming at the integral utilization of lignocellulosic biomass
(Figure 19). Since the HH is rich in sugar, its use as raw material would be very
appropriate in the production of industrially relevant compounds by fermentation
or by chemical transformation. In this chapter, we aimed to evaluate the use of
xylose (synthetic) and hemicellulosic fraction of sugarcane bagasse as carbon
source for lipids production in different cultivation modes and try to understand
the L. starkeyi tolerance to inhibitors, especially to acetic acid the most
abundant inhibitor in HH.

81
Figure 19. Schematic diagram of lignocellulosic ethanol production from
sugarcane bagasse (2G) and alternatives for pentose use as biodiesel
production or value-added chemicals. SCB (Sugarcane Bagasse).
4.2. Materials and methods
4.2.1. Strain and media
The oleaginous yeast L. starkeyi DSM 70296 was used throughout this
study. Agar slants (YPD medium) were stored in a refrigerator and propagated
monthly or stored through cryopreservation at -80ºC with 10% (v/v) glycerol.
The pre-cultivation medium (YPX medium) was composed of xylose 20 g/L,
yeast extract 10 g/L and peptone 10 g/L. The composition of inoculum and
fermentation medium was as follows (per liter): 20 g of xylose (synthetic
medium), 0.66 g of yeast extract, 0.45 g of (NH4)2SO4, 1 g of Na2HPO4, 3.5 g of
KH2PO4, 0.4 g of Mg2SO4.7H2O, 0.04 g of CaCl2
.2H2O, 0.08 g of ZnSO4.7H2O,
0.001 g of CuSO4.5H2O, 0.001 g of CoCL2.6H2O and 0.005 g of (NH4)2Mo2O7
(pH 5.5). For exclusive acetic acid cultivation (AA medium), the culture medium
contained 3 g/L acetic acid under nitrogen-limited conditions (C/N=50) without

82
any other carbon source. For all other studies, HHA and HHR were used as
carbon source, supplemented with the salts of synthetic medium at the same
concentration, pH was adjusted to 5.5 with CaO at room temperature and the
precipitate was separated by centrifugation at 4500 rpm (420R Hettich-
Germany) and 4 °C for 10 minutes. The initial carbon-to-nitrogen (C/N) ratio
was fixed at 50 for all operation modes by using yeast extract and ammonium
sulfate as nitrogen source. To avoid medium darkening due to the reaction of
the sugars (caramelization and Maillard reactions), the sugar solutions were
sterilized at 120°C for 15 minutes in separate flasks. All chemicals and reagents
used were of analytical grade.
4.2.2. Culture conditions
4.2.2.1. Adaptation of L. starkeyi to hemicellulosic hydrolysate (HH)
Lipomyces starkeyi was adaptated to HH in order to reduce the lag
phase during the HH cultivation due the potential inhibitors present in
hemicellulosic hydrolysate and lead to improved fermentation efficiency. The
adaptation was performed by the transferring 30% of pre-inoculum in YPX to
100% of HH medium and during the exponential growth phase of yeast was
transferred successively to 100% of HH medium, similar to the adaptation
performed by ARISTIZABAL, (2013) (Figure 20). The first transfer from pre-
inoculum to 100% of HH medium (inoculum) was named as adaptation 1 (AD-1)
and the second transference to HH as adaptation 2 (AD-2). Experiments in
shaking flasks were previously carried out in flasks of 250 mL at 28°C, 200 rpm,
pH 5.5 and working volume of 100 mL.

83
Figure 20. Adaptation procedure of L. starkeyi to HH.
4.2.2.2. Fermentations
The inoculum was prepared through two successive cell propagations in
liquid media (HH or synthetic medium) at 28ºC and 200 rpm in an orbital
shaker. The first was incubated for 48 h (pre-inoculum) and the second was
incubated for around 30 h and an inoculum concentration of about 1.0 g/L and
3.0 g/L was used for the experiments. Experiments in shaking flasks were
carried out in flasks of 250 mL at 28°C, 200 rpm, pH 5.5 and working volume of
100 mL. The experiments in batch cultivation were conducted in a 3.0-L
bioreactor (New Brunswick, USA) with an initial working volume of 1.0 L and the
experiments of chemostat cultivation were conducted in a 1.3-L bioreactor (New
Brunswick, USA) with a working volume of 0.5 L. For all cultivations in
bioreactor, the aeration rate, agitation and temperature were set to 1 vvm, 400
rpm and 28ºC, respectively. The pH was maintained at 5.5 through the
automatic addition of 2 M NaOH or 1M HCl. Aliquots were collected at various
intervals and stored at -20°C until analysis for substrate concentration, dry cell
weight (DCW) and lipid content.
According to ANSCHAU et al. (2014), the continuous culture of L.
starkeyi at dilution rate (D, volume of incoming media per unit time/volume of
media in the culture vessel) at 0.03 h-1 presented the highest overall cell mass
and lipids yields when a mix of glucose:xylose (30:70,w/w) was used at C/N of
50. In this order, the dilution ratio of 0.03 h-1 was studied using hemicellulosic

84
hydrolysate with limitation of nitrogen (C/N=50) and the continuous culture
started after 15h of batch cultivation. The composition of HH medium (HH
supplemented with salts) used for continuous culture was 13.1 g/L xylose, 2.2
g/L glucose, 2.1 g/L acetic acid, 2.2 g/L arabinose, 0.02 g/L furfural, and 0.02
g/L HMF. The HH medium was used as feeding solution at C/N ratio of 50 using
yeast extract (10% of N) and (NH4)2SO4 (21% of N) as nitrogen source added
into the medium according to the concentration of the carbon sources (xylose,
glucose and acetic acid).
Figure 21 shows the scheme of fermentations of synthetic, HH and AA
medium performed in this study.
Figure 21. Scheme of fermentations of synthetic, HH and AA medium.
4.2.3. Analytical methods
4.2.3.1. Cells assessment
Cells concentration was assessed by absorbance and dry cells (TAPIA et
al., 2012). For the absorbance readings, 1 mL samples were collected during
fermentation, diluted in water and measured at 600 nm by Nanophotometer®
(Implen GmbH, Munich, Germany). Water and HH media were used as
references for the analysis of synthetic and HH media, respectively. Dry cells

85
results were calculated by using 1.5 mL aliquots of cultures withdrew along
fermentation. They were transferred to pre-weighted tubes, centrifuged at 6000
G at 4 °C for 15 min. and their weight determined after freeze drying (difference
of the initial tube weight and final weight). Triplicates of each experiment were
produced. Defatted cells were determined as the difference between total cells
and lipids.
4.2.3.2. Carbohydrates determination
Glucose, xylose and arabinose were determined by ion chromatograph at
a Metrohm system (polystyrene/divinylbenzene copolymer column, particle size
5 mm, dimensions of 150 x 4.0 mm, 871 Advanced Bioscan detector). Eluent:
NaOH (0,1mM/L) at 1.0 mL/min, temperature of column and detector: 30 °C.
During fermentation, the sugar concentration was on-time monitored by a
colorimetric method (Somogy-Nelson) in order to follow the sugars consumption
(TAPIA et al., 2012).
4.2.3.3. Acetic acid determination
Acetic acid was determined by ion chromatograph (Metrohm,
Switzerland) using a Metrosep Organic Acid column (250 x 7.8 mm Metrohm
AG CH 9101), mobile phase 0.5 mM H2SO4 injection volume of 196 μL and
conductivity detector.
4.2.3.4. Furfural and hydroxymethylfurfural (HMF) determination
Furfural and hydroxymethylfurfural were quantified by high-performance
liquid chromatography (HPLC Waters) using a UV detector (486) at 280 nm and
a Delta-Pak C18 column (150x3.9 mm), 5 µm, 300Å at 25 °C. Acetonitrile
(2.5%): H3PO4 2mM (1:1) at flow rate of 0.5 ml/min was the eluent and the
injection volume was 10 µl.

86
4.2.3.5. Lipids content determination
For lipids determination, the yeast cells were treated with HCl 2M,
incubated at 80 ºC for 1 hour, and centrifuged at 6000 G, 4 ºC for 15 minutes
and the lipids were then extracted and quantified by Bligh-Dyer’s method
(TAPIA et al., 2012) using methanol (CH4O) and chloroform (CHCl3) as
solvents.
4.2.3.6. Nitrogen determination
Inorganic nitrogen was quantified by Berthelot method and the reaction
product measured at 630 nm (TAPIA et al., 2012). A calibration curve was
constructed with different ammonium sulfate concentrations (5-60 mg/L of N-
NH4) according to Tapia et al., (TAPIA et al., 2012).
4.2.3.7. Fatty acids composition
To determine the fatty acid composition, the oil from lyophilized biomass
was converted into fatty acid methyl ester (FAME) by direct transesterification
(LEWIS et al., 2000). Fatty acid composition was assayed by gas
chromatography using a GC-2010 Plus, mass detector MS (Shimatzu), capillary
column Stabilwax, 30m, ID 0.25 millimeters, 0.25 μm. Helium gas was the
mobile phase (15 psi, split 1/100), injector and detector temperatures at 250 °C
and 300 °C, respectively. Temperature ramp of the column varied from 50 °C
(for 2 minutes), gradient of 10 °C/min to 180 °C with standby time of 5 minutes,
gradient of 5 °C/min until 240 °C. Mass detector operated at scan mode at 0.30
sec. of m/z=35 to m/z=400, ionization temperature of 200 °C and interface of
240 °C. All analyses were performed in triplicate.

87
4.3. Results and discussion
4.3.1. Adaptation of L. starkeyi to hemicellulosic hydrolysate (HH)
Some microorganisms have the ability to degrade inhibitors and only
need to be exploited or enhance this natural strategy to overcome inhibitors in
lignocellulose biomass in some cases through adaptation and genetic
engineering. Development of an adaptive lipid producing yeast that require
minimal or no detoxification treatment is desirable since it not only reduces the
detoxification cost, but also avoids loss of fermentable sugars (PARAWIRA &
TEKERE, 2011). Many studies of adaptation (evolutionary engineering) of
microorganisms to hydrolysates and increasing tolerance to inhibitory
compounds like HMF and furfural have been carried out in order to increase the
fermentability of hydrolysates from renewable sources to obtain high value-
added products (KOOTSTRA et al., 2009; ZHU et al., 2009; KAHR, 2011;
SILVA, 2014). However, most of studies are performed using different ratios of
hydrolysates to get the adaptation of microorganisms by sequential transfers
due the inhibition by toxic compounds. L. starkeyi was transferred directly to
100% of hydrolysate and showed a significant improvement of cell growth and
reduced lag phase of AD-1 to AD-2 (Figure 22). The maximum specific growth
rate (µmáx) had a considerably increasing from 0.04 h-1 to 0.07 h-1 at AD-2 and
the highest value was found at AD-4 for both hydrolysates reaching the same
µmáx found for the fermentation of xylose reported by GARZÓN, 2009. After AD-
4 the µmáx were reduced reaching the lowest rate at AD-7 (Table 12). The
adapted yeast from AD-4 was preserved into respective HH medium and
glycerol 10% (v/v) at -80°C to be used for later fermentations. However, this
adapted yeast did not showed good fermentability when attempted to be
reactivated in hydrolysate presenting long lag phase. Therefore, we decided to
carry out the adaptation AD-1 (inoculum grown in HH medium) when we would
perform the hydrolysate fermentation due the significant improvement of
fermentability when the inoculum was prepared on hydrolysate (Figure 22).
Furthermore, the adaptation of yeasts to the lignocellulosic hydrolysate prior to
fermentation is suggested as an alternative approach to detoxification
(PARAWIRA &TEKERE, 2011).
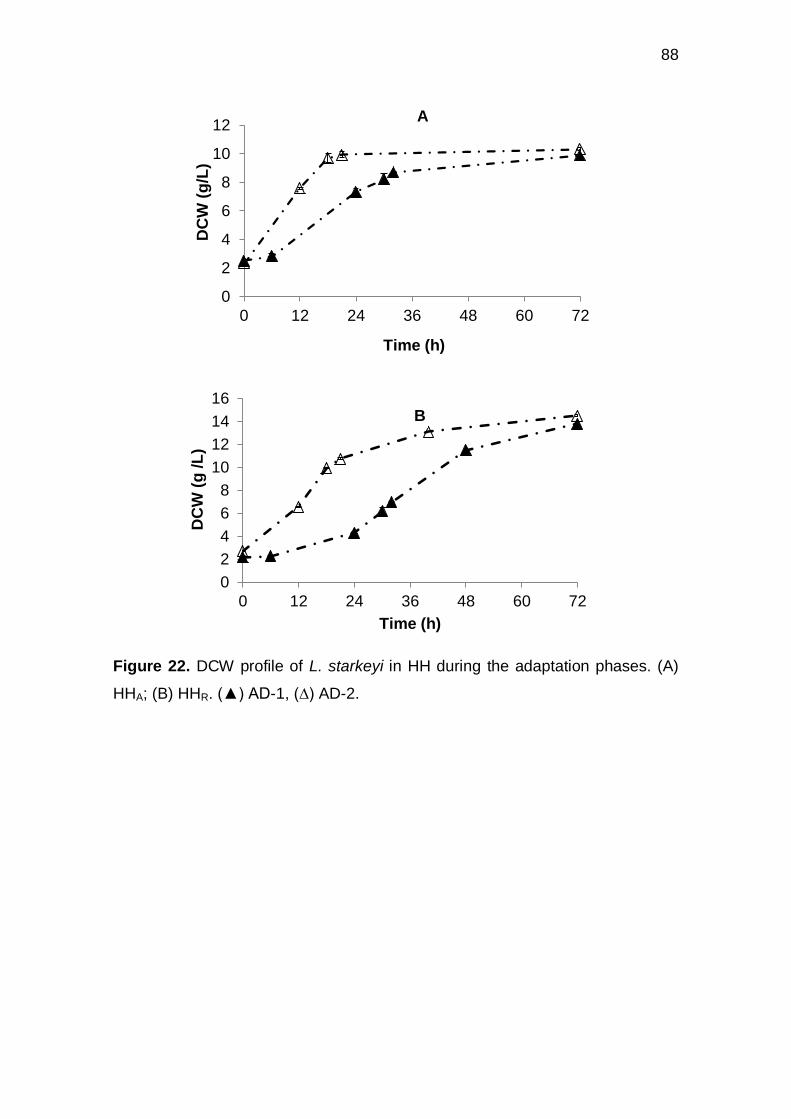
88
Figure 22. DCW profile of L. starkeyi in HH during the adaptation phases. (A)
HHA; (B) HHR. () AD-1, (∆) AD-2.
0
2
4
6
8
10
12
0 12 24 36 48 60 72
DC
W (
g/L
)
Time (h)
0
2
4
6
8
10
12
14
16
0 12 24 36 48 60 72
DC
W (
g /L
)
Time (h)
A
B

89
Table 12. Maximum specific growth rate (µmáx) of L. starkeyi during the
adaptation phases in HH.
Adaptation µmáx (h
-1)
HHA HHR
AD-1 0.04 0.04
AD-2 0.07 0.07
AD-3 0.08 0.06
AD-4 0.09 0.08
AD-5 0.09 0.07
AD-6 0.07 0.06
AD-7 0.04 0.04
Component µmáx (h-1) Reference
Xylose 0.09 GARZÓN, 2009
Glucose:Xylose (30:70) 0.04 ANSCHAU et al., 2014
The sugars consumption and inhibitors profile were monitored only
during the AD-7 (Figure 23 and 24). No lag phase was observed but an
immediate growth and reduction of inhibitors concentration during fermentation.
The significant improvement of fermentability from AD-1 to AD-2 strongly
indicates that yeast has great tolerance to the inhibitors, as furfural, HMF and
acetic acid, at the concentrations found in this study. Good results have been
presented from adapted yeast strain but additional investigations need to be
carrying out to determine how long the improved characters derived from
adaptation remain after selective pressures have been lifted.

90
Figure 23. Kinetic profile of L. starkeyi during the adaptation phase AD-7 in HH.
(A) HHA; (B) HHR. (♦) Xylose, () Glucose, () Arabinose, (∆) DCW. All analyzes
were performed in triplicate and error bars denote the standard deviation.
0
2
4
6
8
10
12
14
0
2
4
6
8
10
12
14
0 24 48 72 96
DC
W (
g/L
)
Su
ga
rs (
g/L
)
Time (h)
A
0
2
4
6
8
10
12
14
16
18
0
2
4
6
8
10
12
14
16
0 24 48 72 96
DC
W (
g/l
)
Su
ga
rs (
g/L
)
Time (h)
B

91
Figure 24. Kinetic profile of inhibitors during the adaptation phase AD-7 of L.
starkeyi to HH. (A) HHA; (B) HHR. () Acetic acid, () Furfural, () HMF. All
analyzes were performed in triplicate and error bars denote the standard
deviation.
4.3.2 Fermentation
L. starkeyi can consume xylose efficiently and produce lipids. On
synthetic medium culture using 1.0 g/L of inoculum the yeast was able to
produce 10.4 g/L of cells, a lipid accumulation of 29.1% (w/w) and lipid yield of
0.14 g/g (g lipid/g xylose) (Figure 25, Table 13). Increasing the inoculum
concentration to 3.0 g/L improved the lipid content and yield to 36.8% (w/w) and
0.16 g/g, respectively (Table 13). The inoculum size has high effect to lipid
0
2
4
6
8
10
12
14
0,0
0,5
1,0
1,5
2,0
0 24 48 72 96
Fu
rfu
ral,
HM
F (
pp
m)
Ac
eti
c a
cid
(g
/L)
Time (h)
0
20
40
60
80
100
120
0,0
1,0
2,0
3,0
0 12 24 36 48 60 72 84 96F
urf
ura
l, H
MF
(p
pm
)
Ac
eti
c a
cid
(g
/L)
Time (h)
B
A

92
biosynthesis and cell mass concentration. ANSCHAU et al. (2014) found an
improvement of lipid content of 25.3 to 31.7% (w/w) and a yield of biomass and
lipids three times higher than to those reached when 1.0 g/L of inoculum was
used on culture of glucose and xylose mixture. LIU et al. (2012) reported that
the microbial oil production is profoundly related to inoculation concentration
when L. starkeyi was cultivated in monosodium glutamate wastewater in
different inoculum concentration.
Figure 25. Kinetic profile of L. starkeyi cell growth during synthetic medium
fermentation in shaking flasks using 1.0 g/L of inoculum. (♦) Xylose; (∆) DCW.
L. starkeyi showed great ability to assimilate the hemicellulosic sugars
from sugarcane bagasse without an apparent inhibition to the HH, indicating the
importance of prior adaptation to it (Figures 26 and 27). Xylose and glucose,
the main sugars obtained from HH, were totally metabolized; however
arabinose was not assimilated during any of cultivations. L. starkeyi showed
diauxic growth consuming xylose and glucose sequentially during cultivations of
HH due to glucose repression as found by ZHAO et al., (2008). Moreover, we
observed a co-consumption of acetic acid and sugars by L. starkeyi. This is
particularly interesting because it could reduce the process costs of microbial
lipids associated with the use of lignocellulosic biomass.
0
2
4
6
8
10
12
14
0
5
10
15
20
25
0 12 24 36 48 60 72
DC
W (
g/L
)
Xylo
se
(g
/L)
Time (h)

93
Figure 26. Kinetic profile of L. starkeyi during fermentation of HHA in shaking
flasks using 1.0 g/L of inoculum. (A) Cell growth and sugars consumption: (♦)
Xylose, () Glucose, () Arabinose, (∆) DCW; (B) Inhibitors: () Acetic acid, ()
Furfural, () HMF.
0
2
4
6
8
10
12
14
16
0
2
4
6
8
10
12
14
16
0 12 24 36 48 60 72
DC
W (
g/L
)
Su
ga
rs (
g/L
)
Time (h)
A
B
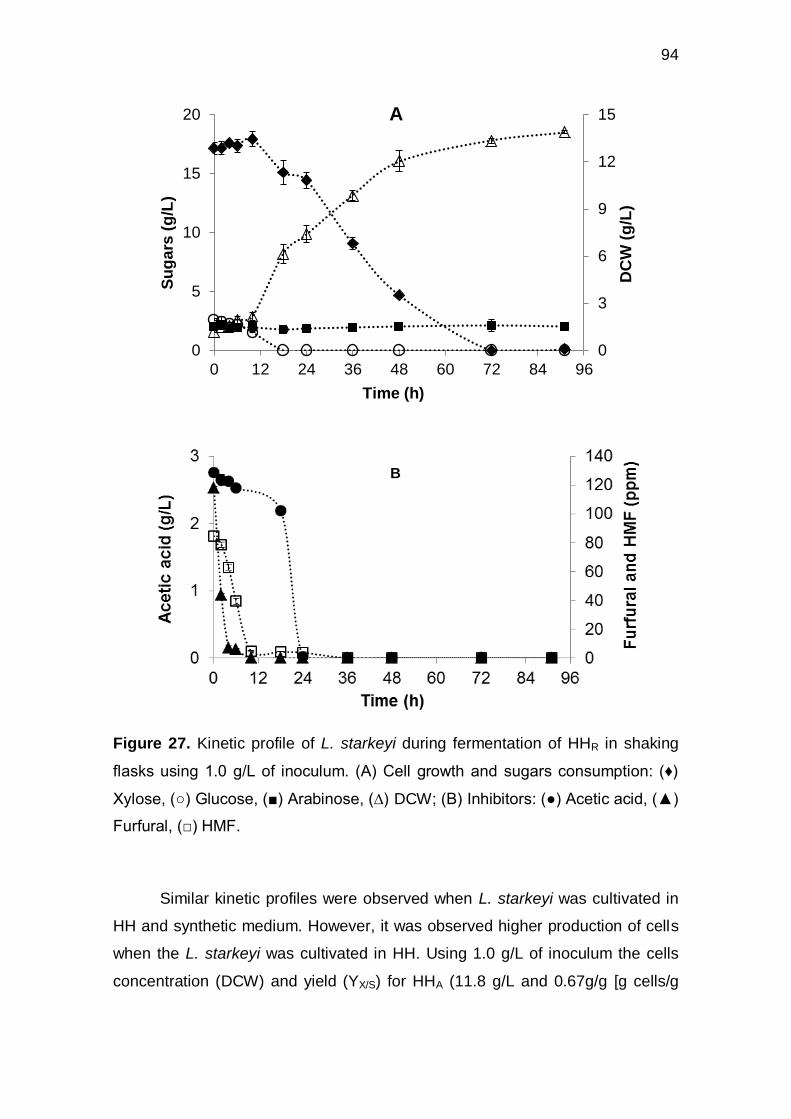
94
Figure 27. Kinetic profile of L. starkeyi during fermentation of HHR in shaking
flasks using 1.0 g/L of inoculum. (A) Cell growth and sugars consumption: (♦)
Xylose, () Glucose, () Arabinose, (∆) DCW; (B) Inhibitors: () Acetic acid, ()
Furfural, () HMF.
Similar kinetic profiles were observed when L. starkeyi was cultivated in
HH and synthetic medium. However, it was observed higher production of cells
when the L. starkeyi was cultivated in HH. Using 1.0 g/L of inoculum the cells
concentration (DCW) and yield (YX/S) for HHA (11.8 g/L and 0.67g/g [g cells/g
0
3
6
9
12
15
0
5
10
15
20
0 12 24 36 48 60 72 84 96
DC
W (
g/L
)
Su
ga
rs (
g/L
)
Time (h)
A
B

95
xylose + glucose + acetic acid]) and HHR (12.7 g/L and 0.57 g/g) were higher
than those in xylose supported growth (10.4 g/L and 0.48 g/g), indicating that a
larger amount of carbon was partitioned into biomass, which might be due to
the presence of additional carbon sources in the HH such as glucose and acetic
acid resulting in higher cell growth (Table 13). Zhao et al. (ZHAO X. et al., 2012)
also found that Rhodosporidium toruloides could produce a higher biomass
concentration when cultivated in bagasse hydrolysate compared to pure sugars.
Acetic acid can also contribute to cell growth, since L. starkeyi consumed this
organic acid during fermentation (Figures 26 and 27). HUANG et al., (2012b)
reported that at low concentrations of acetic acid the cell growth and lipids
accumulation of Trichosporon fermentans were stimulated. L. starkeyi reached
a lower lipid accumulation from HH (20% and 27.8% for HHA and HHR,
respectively) compared to the xylose (29.1%). The lipid yield achieved (YL/S)
from HH were 0.13 g/g and 0.16 g/g (g lipid/g xylose + glucose + acetic acid) for
HHA and HHR, respectively, and from xylose were 0.14 g/g. Similar behavior
were found when 3.0 g/L of inoculum were used, however, the cell yield
reduced for HH and xylose, especially for HHR (0.34 g/g) which showed higher
lipid content of 44.8%. Increasing the inoculum concentration from 1.0 g/L to 3.0
g/L improved considerably the lipid content from HH to 26.9% and 44.8% (HHA
and HHR, respectively) and xylose to 36.8%; therefore, better lipid yield (Table
13). The lipid productivity from HH and xylose were nearly constant of 0.04
g/L.h (PL) when 1.0 g/L and 3.0 g/L of inoculum were used in shaking flasks.
Acetic acid, furfural and HMF, known as potential fermentation inhibitors,
apparently did not suppress sugar consumption and cell growth of L. starkeyi in
HH cultivations. YU et al. (2011) reported that L. starkeyi was able to grow in
wheat straw hydrolysate and that lipids production was not affected by the
various concentrations of furfural (0-3 g/L), HMF (0-3 g/L) and acetic acid
tested. Interestingly, these compounds were consumed or bioreduced by L.
starkeyi during the fermentation of sugarcane bagasse hydrolysate, suggesting
that this yeast could use the inhibitors as an additional carbon source (Figures
26B and 27B). The tolerance to aldehyde compounds is most likely due to the
ability of microorganisms to convert these compounds to the corresponding less
inhibitory alcohols (NILSSON et al., 2005). Firstly, the yeast ferments the

96
sugars; it reduces toxic furfural to non-inhibitory furfuryl alcohol and HMF to 5-
hydroxymethylfurfuryl alcohol in a prolonged lag phase (LI, Q. et al., 2011).
Bioreduction of furfural and HMF may shorten the lag phase highlighting the
importance of prior adaptation of yeast to the hydrolysate. In general, the furans
effects can be explained by a re-direction of yeast energy to fixing the damage
caused by furans and by reduced intracellular ATP and NAD(P)H levels, either
by enzymatic inhibition or consumption/regeneration of cofactors (ALMEIDA et
al., 2007).

97
Table 13. Kinetic parameters obtained of L. starkeyi grown on xylose and HH in shaking flasks and bioreactor experiments.
Parameter
Shaking flasks Bioreactor
Inoculum 1.0 g/L Inoculum 3.0 g/L Inoculum 3.0 g/L
Synthetic H-HR HHA Synthetic H-HR HHA HHA HHA
(continuous)
Xmáx (g/L) 10.4 12.7 11.8 7.9 8.0 9.3 9.6 11.5
Yx/s (g/g)* 0.48 0.57 0.67 0.42 0.34 0.51 0.54 0.67
Px (g/L.h) 0.14 0.13 0.18 0.11 0.09 0.09 0.22 0.35
Lipids (%,w/w) 29.1 27.8 20.0 36.8 44.8 26.9 26.1 27.3
Lipids (g/L) 3.01 3.53 2.36 2.9 3.58 2.50 2.51 3.14
Yp/s (g/g)* 0.14 0.16 0.13 0.16 0.15 0.14 0.14 0.18
PP (g/L.h) 0.04 0.04 0.04 0.04 0.04 0.03 0.06 0.09 a Representations of cells (Xmáx, g/L), yield of dry biomass produced per unit of substrate consumed (xylose, glucose and acetic
acid) (YX/S, g/g), lipids (g/L), lipids in dry biomass (%, w/w), yield of lipid produced per unit of substrate consumed (xylose, glucose,
acetic acid) (YP/S, g/g), lipid productivity (PL, g/L.h) of the end of fermentation.

98
The batch culture of HH by L. starkeyi showed similar results to those
when cultivated in shaking flasks, however, the lipid productivity of 0.06 g/L.h
was much higher than that obtained to flask culture of 0.03 g/L.h. The lipid yield
of 0.14 g/g and lipid content of 26.1%, from HH were lower than that found by
ANSCHAU et al. (2014) using a mixture of xylose and glucose of 0.19 g/g and
31.7%, respectively. The continuous culture of HH by L. starkeyi at D=0.03 h,
showed significant growth and higher yield of lipids than in the batch cultivation
of HH (Figure 28). Lipid production was favored at a low specific dilution rate
nevertheless the yield of lipids (0.18 g/g) was lower to that in the continuous
culture in synthetic media at D=0.03 h-1 (0.24 g/g) (Table 13). Normally, a low
dilution rate (D) is required for optimum conversions, since the microbial cells
need to remain in the chemostat for at least 12–24 h in order to consume the
available nitrogen and then convert the remaining sugar into oil (HUANG et al.,
2009) Here, the nitrogen was exhausted after 10 hours of continuous culture on
HH media with no remaining sugars, besides arabinose, detected during
fermentation. Possibly, in the continuous fermentation, the continuous feeding
of HH under nitrogen-limited conditions allows for higher conversion rates of
furfural, HMF and other inhibitory aldehydes, ensuring that the concentrations of
these inhibitors in the fermentations remain low or at zero, favoring lipids
synthesis from the available nutrients (NILSSON et al., 2005). PAPANIKOLAOU
& AGGELIS, (2002) reported that lipid production by Y. lipolytica was favored at
low dilution rates during growth on raw glycerol in nitrogen-limited continuous
cultures. The highest lipid productivity achieved was 0.12 g/L.h at the lowest
dilution rate studied, 0.03 h-1. Increasing dilution rates resulted in increased cell
mass yields, but with a decreasing lipid fraction. The different cultivation modes
(flasks, batch and continuous) of hydrolysate (HHA) used in this study did not
show significant influence to the lipid accumulation kept around 26%. Despite of
the lipid content from HH produced by L. starkeyi found in this study be, in
general, lower than synthetic medium these results are satisfactory and
promising when comparing the complexity of real hydrolysates to pure sugars.
Similar lipid yield of 0.14 g/g was found when T. fermentans was used for
cultivation of sugarcane bagasse in shake flasks (HUANG et al., 2012a), in
contrast to 0.20 g/g for R. glutinis on wheat straw (YU et al., 2011). The lipid

99
yield and content vary depending on the oleaginous yeast species, feedstock
types, and cultivation conditions and that it is feasible to convert sugars in the
hydrolysate of lignocellulosic biomass to lipid using oleaginous yeasts (Table
14).
Figure 28. Continuous cultivations of HHA at 0.03 h-1. (A) Sugars, DCW and
Lipids content; (B) Inhibitors. (♦) Xylose, () Glucose, () Arabinose, (∆) DCW,
(◊) Lipids; (B) Inhibitors: () Acetic acid, () Furfural, () HMF. The continuous
cultivation was started at 0 h after a batch stage (negative scale).
0
5
10
15
20
25
30
35
0
2
4
6
8
10
12
14
16
Lip
ids
(%
)
Su
ga
rs ,
DC
W (
g/L
)
Time (h)
A
0
0,004
0,008
0,012
0,016
0,02
0,0
0,5
1,0
1,5
2,0
2,5
Fu
rfu
ral
an
d H
MF
(g
/L)
Ac
eti
c a
cid
(g
/L)
Time (h)
B

100
Table 14. Microbial oil production on lignocellulosic hydrolysates.
Lignocellulosic biomass Strain Culture
mode
Lipid
content
(%, w/w)
Lipid yield Reference
Sugarcane bagasse Yarrowia lipolytica Flask 58.5 6.68 g/L (TSIGIE et al., 2011)
Sugarcane bagasse Trichosporon fermentans Flask 39.9 0.14 g/g (HUANG et al., 2012a)
Rice straw Lipomyces starkeyi Flask 36.0 0.19 g/g (AZAD et al., 2014)
Corncob Rhodotorula glutinis Batch 36.4 NA (LIU et al., 2015a)
Wheat straw Rhodotorula glutinis Batch 11.9 0.07 g/g (MAST et al., 2014)
Wheat straw
Rhodotorula glutinis Flask 25.0 0.20 g/g
(YU et al., 2011) Rhodotorula toruloides Flask 24.6 0.08 g/g
Lipomyces starkeyi Flask 31.2 0.16 g/g
Cryptococcus curvatus Flask 33.5 0.18 g/g
Corn stover Rhodotorula graminis Batch 34.0 ~0.18 g/g (GALAFASSI et al., 2012)
Corn stover Cryptococcus humicola Flask 40.0 15.5 g/L (SITEPU et al., 2014)
Corncob Trichosporon cutaneum Batch 32.0 0.13 g/g (GAO et al., 2014)
Sorghum bagasse Cryptococcus curvatus Flask 53.0 0.19 g/g (LIANG et al., 2012)
Sugarcane bagasse (HHA) Lipomyces starkeyi Flask 26.9 0.14 g/g This study
Sugarcane bagasse (HHR) Lipomyces starkeyi Flask 44.8 0.15 g/g This study
Sugarcane bagasse (HHA) Lipomyces starkeyi Batch 26.1 0.14 g/g This study

101
Since acetic acid was the most abundant aliphatic acid in the HH and
was consumed during fermentation, a culture medium containing acetic acid (~3
g/L) as the sole carbon source (concentration equivalent to that of the HH
culture media) was used to evaluate the ability of L. starkeyi to consume this
compound (Figure 29). Cell growth was not inhibited and L. starkeyi was able to
metabolize this organic acid producing lipid. The yields of total cells, defatted
cells and lipids achieved were 0.38 g/g, 0.26 g/g and 0.10 g/g, respectively. The
acetic acid can be involved to lipid production because can be metabolized to
acetyl-CoA by enzyme acetyl-CoA synthase (ACS), which is the main precursor
of lipid biosynthesis (XIAO et al., 2013). The inhibitory action of acetic acid
depends on its undissociated form, which diffuses through the cell cytoplasm
causing an intracellular pH reduction, resulting in an uncoupled energy
production and deficient transport of various nutrients, and consequently,
increased ATP requirements. In addition, the corresponding ATP demand
increases with the increase in acid concentration. After ATP demand exceeds a
certain limit, the acid significantly inhibits fermentation because the free energy
is diverted more and more away from cellular growth, resulting in cessation of
growth or even cell death (ZHAO et al., 2012). LIU et al, (2015b) reported that
increasing the concentration of undissociated acetic acid from 0.026 g/L to
0.096 g/L prolonged the lag phase of T. fermentans and the growth was ceased
at 1.92 g/L of undissociated acetic acid.
Yeast sensitivity to acetic acid also depends on the microorganism
(CHEN et al., 2009; HU et al., 2009; ZHAO et al., 2012). The cell growth of R.
toruloides was inhibited at acetic acid concentrations higher than 10 g/L; to
obtain a high biomass accumulation, the concentration had to be lower than 5
g/L when acetic acid was the only inhibitor in the media. However, 2 g/L of
acetic acid could completely inhibit yeast growth when other inhibitors were also
present due to the synergistic effect between them, which could affect cell
growth and sugar consumption (ZHAO et al., 2012). Nevertheless, the present
work showed that, instead of suppressing L. starkeyi growth and lipid
accumulation, acetic acid stimulated both, even when HMF and furfural were
present in the media.

102
Figure 29. Consumption of acetic acid and cell growth of L. starkeyi during
cultivation of acetic acid in shaking flasks. () Acetic acid, (∆) DCW, (◊)
Nitrogen. We performed all analyzes in triplicate and error bars denote the
standard deviation.
Recently, acetic acid was used as carbon source to produce lipids by
microorganisms. Huang et al., (2012b) reported that at low concentrations of
acetic acid the cell growth and lipids accumulation of Trichosporon fermentans
were stimulated. However, LIU et al., (2015b) reported that T. fermentans could
assimilate acetic acid in the concentration range from 1.5 g/L to 30 g/L
accumulating 34.1% of lipid when 20 g/L was used as the sole carbon source.
CHRISTOPHE et al. (2012) observed lipid contents up to 50% (w/w) when
Cryptococcus curvatus was grown in medium containing acetic acid as carbon
source under nitrogen limitation conditions in the cultivation after the exhaustion
of glucose (first stage). FONTANILLE et al., (2012) demonstrated the ability of
oleaginous yeast Yarrowia lipolytica to consume acetic acid (12g/L) as unique
carbon source during fed-batch mode cultivation reaching to values of 0.50 g/g
and 0.15 g/g of biomass and lipids yield. Xiao et al., (2013) engineered an E.
coli strain to assimilate acetic acid and convert it into lipids. These studies
indicate that the acetic acid bioconversion into chemicals would be valuable,
since this acid is often found in industrial streams at considerable
concentrations.

103
The growth of L. starkeyi is similar whether in pure sugars or in HH and
therefore, the utilization of HH is advantageous due the costs reduction and
abundance of lignocellulosic biomass. Nevertheless, continuous efforts should
be made to obtain optimized conditions and understand the metabolism of
inhibitors to applying this yeast with lignocellulosic materials for biofuels
production and in the oleochemical industry.
4.3.3. Fatty acid profile and cetane number estimation
The fatty acid composition of the oil extracted from L. starkeyi grown in
the HH culture media was very similar to that oil from L. starkeyi grown in plain
xylose media (Table 15). Oleic acid (C18:1) was the most abundant fatty acid in
the HH growth, representing about 49% of total fatty acids, followed by palmitic
acid (C16:0). However, the linoleic acid content was higher and the palmitic acid
content was lower than those in the synthetic medium, since the presence of
furfural on the media might induce more biosynthesis of unsaturated acids fatty
acids, as reported by ZHAO et al., (2012) for the cultivation of R. toruloides.
Oleic acid content increased from 47.7% to 55.5% in the presence of acetic acid
compared to the xylose cultivation, showing little influence on the fatty acid
composition of the lipids produced by L. starkeyi in contrast to that of the lipids
produced by R. Toruloides, where the oleic acid content increased substantially
from 25.61% to 52.88% (ZHAO et al., 2012). These results show that neither
acetic acid nor hydrolysate significantly affected the fatty acid biosynthetic
pathway for L. starkeyi.
The relative fatty acid composition in this study indicated that the lipid
composition was similar to that of palm oil (Table 15) and the majority of those
lipids were long-chained unsaturated fatty acid containing 16 and 18 carbons
which dominated the lipid compounds. Differences in the relative proportions of
palmitic and oleic acids are perhaps due to the differences in carbon source and
medium composition, since the nature of the substrate affects the fatty acids
composition in yeast lipids. This can be observed when molasses and potato
starch or willow wood sawdust hydrolysate and acetic acid are used as carbon
source by L. starkeyi. The cetane number (CN) of diesel is related to the ignition

104
delay (ID) time and it is a prime indicator of fuel quality. The CN of fatty esters
increases with increasing saturation and increasing chain length, and the FAME
composition has an important role in affecting the CN of biodiesel (KNOTHE,
2009). The quality standards for diesel and biodiesel require minimum cetane
numbers of 40 (ASTM D975) and 47 (ASTM D6751), respectively. Based on
these compositional data and estimated cetane numbers, which are similar to
values obtained for palm oil, the lipid from L. starkeyi fermentation on HH could
be used for biodiesel production because the high yield (46.7-52.6%) of methyl
ester of oleic acid and palmitic acid (27.8-31.3%) meets the standards
specifications.

105
Table 15. Comparison of fatty acids profiles of L. starkeyi in different cultivations and palm oil.
Lipids of L. starkeyi in different cultivations (%, weight)
Substrate C14:0 C16:0 C18:0 C16:1 C18:1 C18:2 Estimated
Cetane Number
Reference
Xylose (flasks) 0.5 33.4 12.9 3.0 47.7 1.6 61.8 This study
HH (flasks) 0.3 31.3 6.3 5.5 52.6 2.6 60.0 This study
Acetic acid (flasks) - 29.2 4.0 4.1 55.5 5.7 58.8 This study
HH (batch) - 27.8 6.0 3.7 48.2 10.1 56.7 This study
HH (continuous) - 30.3 12.6 1.3 46.7 7.0 59.8 This study
Potato starch - 39.0 3.0 3.0 55.0 - 61.7 (Wild R. et al., 2010)
Brazilian molasses 0.6 21.3 5.2 5.2 50.0 18.2 57.1 (Vieira et al., 2014)
Glycerol - 35.8 8.8 - 46.1 5.3 59.2 Tchakouteu et al., 2015
Willow wood sawdust hydrolysate - 35.4 6.3 9.6 39.4 2.5 57.4 (Wang et al., 2014)
Glucose 0.5 36.5 5.4 3.6 52.8 1.2 61.6 (Lin et al., 2011)
Glucose:xylose - 37.7 5.4 3.1 49.6 - 59.6 (Gong et al., 2012)
Palm oil 1.3 47.2 4.5 - 37.2 10.1 61.8 (Maleki et al., 2013)
Palm oil 0.7 36.7 6.6 0.1 46.1 8.2 59.9 (Ramos et al., 2009)

106
4.4. Conclusions
Lipomyces starkeyi DSM 70296 showed an ability to consume sugars from HH
without appreciable inhibition. Increasing the inoculum concentration increased the
lipid accumulation from xylose and HH. The tolerance to inhibitors and the efficient
utilization of xylose make L. starkeyi a promising candidate of industrial importance
for lipid production using lignocellulosic biomass. Co-conversion of xylose and acetic
acid to value-added products offers a strategy for making efficient the use of
lignocellulosic biomass. Microbial oil produced by L. starkeyi showed similar
composition to vegetable oil and could be used as feedstock of biodiesel production.
Microbial lipids production from HH would be interesting and challenging and would
promote the reduction of waste disposed in the environment and improve the techno-
economics of biodiesel production.

107
CHAPTER 5. METABOLIC ENGINEERING OF THE OLEAGINOUS
YEAST Lipomyces starkeyi FOR INCREASED LIPID PRODUCTION
5.1. Introduction
The production of lipids and products derived from oils provide an unique
platform for the sustainable production of biodiesel and other oleochemicals
(BLAZECK et al., 2014). Several oleaginous yeast such as Lipomyces starkeyi, are
being actively investigated for its potential in biofuel production using various sources
of carbon and nutrients (DAI et al., 2015). Metabolic engineering has been used to
modify the strains to improve their capacity of lipid storage and production of
alternative novel chemicals and fuels (WANG et al., 2011). However, most work of
has been focused on the establishment of genetic tools for engineering Yarrowia
lipolytica (WANG et al., 2011; TAI & STEPHANOPOULOS, 2013; BLAZECK et al.,
2014; LIU et al., 2015; QIAO et al., 2015) and most recently for Rhodosporidium
toruloides (ZHANG et al., 2015). Metabolic engineering of oleaginous yeast non-
model, such as L. starkeyi, remains challenging due to the lack of efficient and
reliable transformation methods (LIN et al., 2014; SHENG et al., 2015). Engineering
the lipid biosynthesis pathways in L. starkeyi is still relatively unexplored, though
initial attempts have shown promising (DAI et al., 2015; SALUNKE et al., 2015).
Establishing effective transformation methods with suitable genetic elements for the
selected gene expression will provide the tools needed to genetically modify this
organism, potentially making this yeast an important host microorganism for
biotechnological applications. Thus, strategies must be developed for effective
engineering of the lipid production pathways to maximize the output. Therefore, this
chapter aimed the increased lipid production by metabolic engineering of Lipomyces
starkeyi, exploring the effects of overexpression of acetyl-CoA carboxylase (ACC1),
diacylglycerol acyltransferase (DGA1) and fatty acyl-CoA delta-9 desaturase
(FAD9.1) genes on lipid accumulation via de novo lipid biosynthesis.

108
5.2. Material and methods
5.2.1. Strains, medium and growth conditions
The oleaginous yeast Lipomyces starkeyi DSM 70296, bacterium
Agrobacterium tumefaciens EH105 and Escherichia coli NEB 5-α were used
throughout this study. YPD medium (yeast extract 10 g/L, peptone 20 g/L and
glucose 20 g/L) was used for routine growth of L. starkeyi. Low-nitrogen YPD
medium (70 g/L glucose, 0.75 g/L yeast extract, 0.1 g/L (NH4)2SO4, 1.0 g/L KH2PO4,
1.5 g/L MgSO4.7H2O, pH 5.6, C/N = 340) was used to induce lipid production in L.
starkeyi. LB medium (Luria-Bertani (Miller) - 10 g/L tryptone, 10 g/L NaCl, 5 g/L
yeast extract, pH 7.0) was used to grow Agrobacterium tumefaciens EHA105 and E.
coli NEB5-α. Induction medium (IM) consisted of AB salts, 40 mM 2-(N-morpholino)
ethanesulfonic acid (pH 5.3), 10 mM glucose, 0.5% (w/v) glycerol and 100 µM
acetosyringone (Winans et al. 1988). AB salts were prepared as a 20X stock (20 g/L
NH4Cl, 6 g/L MgSO4.7H2O, 3 g/L KCl, 0.2 g/L CaCl2.2H2O, 0.05 g/L FeSO4.7H2O, pH
7.1). Antibiotics were used as resistance marker at the following concentrations:
kanamycin (KN), 40 μg/mL; nourseothricin (NAT), 30 μg/mL; hygromycin B (HYG), 20
μg/mL; and cefotaxime (CEF), 300 μg/ml. Stationary phase L. starkeyi seed cultures
were obtained by inoculating single colonies from a YPD agar plate into 1 mL YPD
liquid medium and transference of 10% of inoculum to fresh YPD medium. For lipid
production, the fermentation was performed in 50 mL low-nitrogen YPD medium, in a
250 mL shaking flask, at 30°C and 250 rpm.
E.coli NEB 5-α was used for cloning and plasmid propagation. E.coli NEB 5-α
was grown at 37°C at 250 rpm in Luria Bertani Both (LB) supplemented with 40
μg/mL kanamycin for plasmid propagation.
5.2.2. Plasmid construction
All plasmids and primers used in this study are listed in Tables 16 and 17. The
NAT plasmid, named pGI18 and pGI19, and HYG plasmid, named pGI20 and pGI21,
used to transform L. starkeyi 70296, were constructed by insertion into PvuII site by
Infusion HD cloning (Clontech Laboratories, Inc., Mountain View, CA, USA) following
the manufacturer’s instructions. First, the plasmids G19, G20, G21, G22 were

109
amplified by PCR using the primers MI143F/MI144R (Phusion Hot Start Flex DNA
Polymerase). Then, PCR products (expression cassette fragments) were cloned into
the PvuII site of linearized pGI2 plasmid (New England Biolabs, USA), resulting the
binary vectors pGI18, pGI19, pGI20, pGI21. As an example, the genetic maps of
pGI2 and plasmid G19 are showed in Figure 24B as well as the restriction site
(Figure 30).
Table 16. Plasmids and primers used in this study
Plasmids Genotype/features Source
pGI2 KanR for bacteria, NatR for yeast, binary plasmid (ABBOTT et al., 2013)
G19 KJ155690 (PTDH3-NATR-TTDH3 ) in pUC57 Genscript
G20 KJ155691 (PTDH3-NATR-TPGK1 ) in pUC57 Genscript
G21 PGK1-HYG-AOX1 in pUC57 Genscript
G22 Hp4d-HYG-AOX1 in pUC57 Genscript
G23 ACC1 in pUC57 Genscript
G24 DGA1 in pUC57 Genscript
G25 FAD9.1 in pUC57 Genscript
pGI18 PTDH3-NATR-TTDH3 in pGI2 This study
pGI19 PTDH3-NATR-TPGK1 in pGI2 This study
pGI20 PPGK1-HYGR-TAOX1 in pGI2 This study
pGI21 PHp4d-HYGR-TAOX1 in pGI2 This study
pGI25 PTDH3-NATR-TPGK1 ; PTDH3-ACC1-TPGK1 in pGI19 This study
pGI26 PPGK1-HYGR-TAOX1 ; PTDH3-DGA1-TPGK1 in pGI20 This study
pGI27 PPGK1-HYGR-TAOX1 ; PTDH3-FAD9.1-TPGK1 in pGI20 This study
pGI29 PTDH3-NATR-TPGK1 ; PPGK1-DGA1-TAOX1 in pGI19 This study
pGI30 PTDH3-NATR-TPGK1 ; PPGK1-FAD9.1-TAOX1 in pGI19 This study TDH3 promoter: glyceraldehyde-3-phosphate dehydrogenase (Source: Lipomyces (CALVEY, 2014)
PGK1 terminator: 3-phosphoglycerate kinase (Source: Lipomyces (CALVEY, 2014)
TDH3 terminator: (Source: Lipomyces (CALVEY, 2014)
PGK1 promoter: (Source: Trichosporon) JGI (Joint Genome Institute,2015)
AOX1 terminator: Acyl CoA oxidase encoded by POX1(Source: Yarrowia)
Hp4d: Synthetic promoter derived from Yarrowia lipolytica (WANG, et al., 2011).

110
Table 17. Primers used in this study
Primers Sequence (5'-3')
MI143 tcgctattacgccagctgCGCCAGGGTTTTCCCAGTCACGAC
MI144 gattcattaatgcagctgAGCGGATAACAATTTCACACA GG
MA01 CTGTGGTTGGCATGCACATACA
MA05 GTCTGCCGCCTTACAACGG
MA06 atacaaggcagtatccaagccgc
MA08 gctccgcggattaaaatgatgagc
MA11 TGAACTCACCGCGACGTCTG
MA16 CTGATAGAAAGGCTCACCACGAGC
MA22 agcatgcaccattccttgcg
MA23 AAACACTGATAGTTTAAACcctctggtacgtaagattacggagc
MA25 attcgcaATGTCTGCTGCGGCC
MA27 TAATTAActcccgttaatgttgggattctaaaaagg
MA31 attcgcaATGTCGACCGCTG
MA33 GAGCTAGctcccgttaatgttggg
MA35 AAACACTGATAGTTTAAACcctctggtacgtaagattacggagc
MA37 attcgcaATGACTGCCAGTGCTGAGAC
MA39 CGCTTAGctcccgttaatgttgggattctaaaaagg
MA41 TGCAGCGGTCGACATtgcgaatgtggattagagtaagatagataact
MA42 caacattaacgggagCTAGCTCTCGACCATCTTTACTTTGCT
MA43 GCCTTCAGTTTAAACctgtcaattatgctaccacttggtaaataacg
MA44 AGCACTGGCAGTCATtgcgaatgtggattagagtaagatagataacttttatctg
MA45 caacattaacgggagCTAAGCGGCACCAGCGC
MA46 GCCTTCAGTTTAAACcctgtcaattatgctaccacttggtaaataacg
MA47 GGCCGCAGCAGACATtgcgaatgtggattagagtaagatagataacttttatct
MA48 TCCCGCCTTCAGTTTAAACcctgtcaattatgctaccacttggtaaa
MA85 AAACACTGATAGTTTAAACCTGATAACTCTGGCTTCTCCCAATCC
MA86 TTACAAAATGTCGACCGCTGCACA
MA87 GAGCTAGGTTTGTAGCCTTAGACATGACTGTTCCT
MA88 TCCCGCCTTCAGTTTAAACGGATCCGCACAAACGAAGGT
MA89 CTACAAACCTAGCTCTCGACCATCTTTACTTTGCT
MA90 GTCGACATTTTGTAAAACTAGGGTTAAGGGTGT
MA91 AAACACTGATAGTTTAAACCTGATAACTCTGGCTTCTCCCAATCC
MA92 TTACAAAATGACTGCCAGTGCTGAGAC
MA93 CGCTTAGGTTTGTAGCCTTAGACATGACTGTTCCT
MA94 TCCCGCCTTCAGTTTAAACGGATCCGCACAAACGAAGGT
MA95 CTACAAACCTAAGCGGCACCAGCGC
MA96 GCAGTCATTTTGTAAAACTAGGGTTAAGGGTGTTAGC
MA98 aacgggagTTAATTAGAAGCCTGCTTGAAAATCGCATCCC
MA100 gttctcgatgctgccatccg

111
Figure 30. Genetic maps of plasmids pGI2 (A) and G19 (B) used in the construction
of plasmid pGI18.
The sequences of ACC1, DGA1 and FAD9.1 were retrieved from the genome
database of Lipomyces starkeyi, Joint the Genome Institute (JGI), and used to
synthesize the target genes. The ACC1, FAD9.1 and DGA1 overexpression plasmids
A
B
TDH3 TDH3
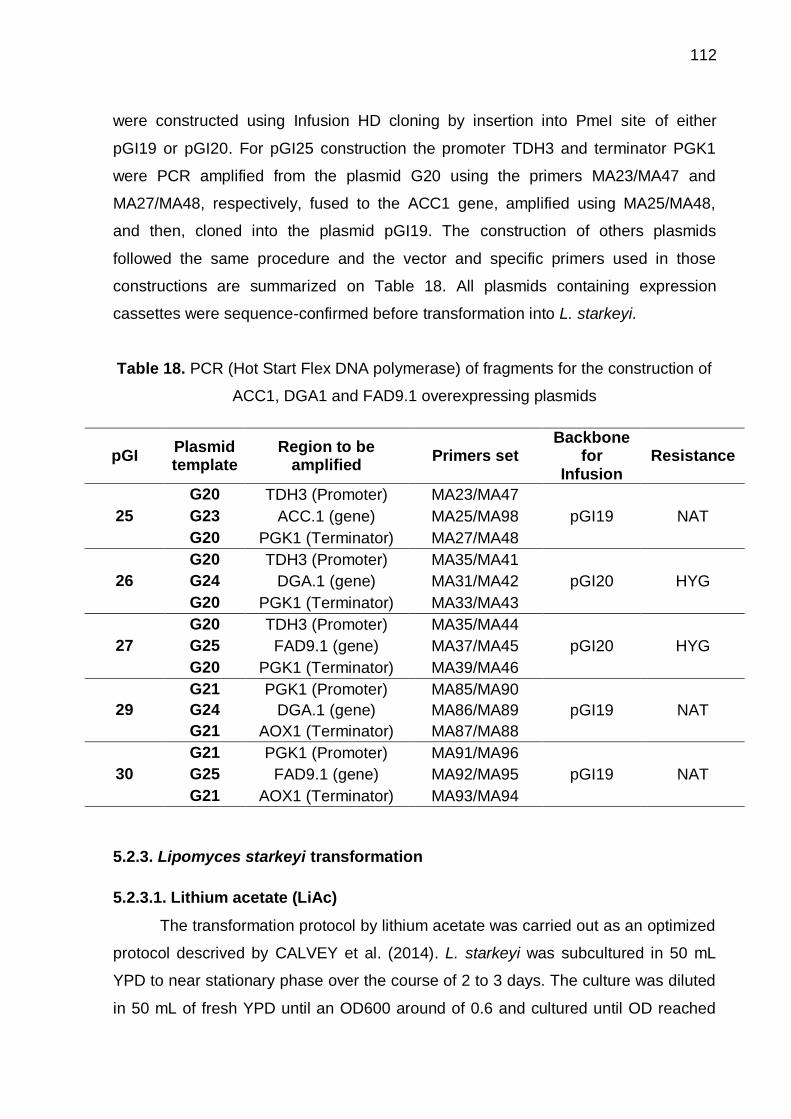
112
were constructed using Infusion HD cloning by insertion into PmeI site of either
pGI19 or pGI20. For pGI25 construction the promoter TDH3 and terminator PGK1
were PCR amplified from the plasmid G20 using the primers MA23/MA47 and
MA27/MA48, respectively, fused to the ACC1 gene, amplified using MA25/MA48,
and then, cloned into the plasmid pGI19. The construction of others plasmids
followed the same procedure and the vector and specific primers used in those
constructions are summarized on Table 18. All plasmids containing expression
cassettes were sequence-confirmed before transformation into L. starkeyi.
Table 18. PCR (Hot Start Flex DNA polymerase) of fragments for the construction of
ACC1, DGA1 and FAD9.1 overexpressing plasmids
pGI Plasmid template
Region to be amplified
Primers set Backbone
for Infusion
Resistance
25
G20 TDH3 (Promoter) MA23/MA47
pGI19 NAT G23 ACC.1 (gene) MA25/MA98
G20 PGK1 (Terminator) MA27/MA48
26
G20 TDH3 (Promoter) MA35/MA41
pGI20 HYG G24 DGA.1 (gene) MA31/MA42
G20 PGK1 (Terminator) MA33/MA43
27
G20 TDH3 (Promoter) MA35/MA44
pGI20 HYG G25 FAD9.1 (gene) MA37/MA45
G20 PGK1 (Terminator) MA39/MA46
29
G21 PGK1 (Promoter) MA85/MA90
pGI19 NAT G24 DGA.1 (gene) MA86/MA89
G21 AOX1 (Terminator) MA87/MA88
30
G21 PGK1 (Promoter) MA91/MA96
pGI19 NAT G25 FAD9.1 (gene) MA92/MA95
G21 AOX1 (Terminator) MA93/MA94
5.2.3. Lipomyces starkeyi transformation
5.2.3.1. Lithium acetate (LiAc)
The transformation protocol by lithium acetate was carried out as an optimized
protocol descrived by CALVEY et al. (2014). L. starkeyi was subcultured in 50 mL
YPD to near stationary phase over the course of 2 to 3 days. The culture was diluted
in 50 mL of fresh YPD until an OD600 around of 0.6 and cultured until OD reached

113
near 10. The culture was washed once with 25 mL of water and the cell pellet was
resuspended in 500 μL of 0.1 M LiAc. An aliquots of cell suspension were centrifuged
and aspirated off the LiAc such that only 50 μL cell pellet remains (competent cells).
Then, it was added to the competent cells 240 μL PEG, 30 μL 1.0 M LiAc, 15 μL
ssDNA, and 15 μL of DNA (150-200 ng/µL, PCR product), up to a final volume of 350
μL (including cells) and a final LiAc concentration of 86 mM. This mixture was
incubated in a 30 °C water bath for 3 h, and in a 40°C water bath for a 5 min heat
shock. The cells were then pelleted and resuspended in 1 mL of YPD and incubate at
30°C, 200 rpm for a 4h recovery period. The cells were centrifuged, resuspended in
water and plated onto YPD plate supplemented with 30 μg/mL nourseothricin (NAT)
or 20 μg/mL hygromycin (HYG) as selective media.
The solution and reagents such as 50 % (w/v) Polyethylene Glycol of average
molecular weight 3,650 (PEG), 1.0 M Lithium Acetate (LiAc), TE buffer, and 2 mg/mL
single-stranded salmon sperm carrier DNA (ssDNA) were all prepared as described
by GIETZ et al. (2002). The ssDNA was boiled for 5 min and then cooled on ice prior
to every transformation experiment.
5.2.3.2. Agrobacterium tumefaciens mediated transformation (ATMT)
First, the pGI2-derived binary plasmids were electroporated into
Agrobacterium tumefaciens EHA105 (ABBOTT et al., 2013). Briefly, A. tumefaciens
was subcultured in 50 mL from an overnight seed culture until OD reached around
0.5. The culture was first washed with ice cold 1 mM 4-(2-hydroxyethyl)-1-
piperazineethanesulfonic acid (HEPES), pH 7.0, and then washed with ice cold 1 mM
HEPES, pH 7.0, 10% glycerol, before finally resuspending in 0.5 mL of ice cold 1 mM
HEPES, pH 7.0, 10% glycerol. In a chilled 0.2 cm BioRad electroporation cuvette 1
μL of plasmid DNA (50ng - 1 μg) was electroporated into 50 µL of Agrobacterium
tumefaciens EHA105 using a Gene Pulser Xcell (Bio-Rad) with 2.5 kV electrical
pulse (field strength of 12.5 kV/cm), 25 µF, 400 Ω and recovered in 1 mL LB medium
at 30°C for 3 hours and then plated onto LB medium plates supplemented with
kanamycin (40 µg/mL). Colonies appeared after 2 days growth at 30°C (ZHANG, S.
et al., 2015).
A. tumefaciens EHA105 strain carrying the binary plasmid was then cultured at
30°C, 250 rpm in 2 mL LB medium with kanamycin (40 µg/mL) until OD600 reached

114
approximately 1.0. The cells were then pelleted and resuspended in 1.5 mL induction
medium for 8 hours in 30°C to induce the virulence of Agrobacterium. L. starkeyi was
cultured at 30°C, 250 rpm in YPD medium to saturation and then, subcultured up to
mid-exponential phase. The cells were then diluted to OD approximately 1.0 and
mixed with induced A. tumefaciens cells in a ratio of Agrobacterium:Lipomyces
(AT:LS) of 1:1. After 5 minutes at room temperature the mixture was then vacuum
filtered using a 0.45 μm filter membrane (Millipore). The filter was then placed on
induction medium plate, and incubated at room temperature for 2 days. The cells on
the membrane were then resuspended with YPD medium and plated onto a YPD
plate supplemented with nourseothricin or hygromycin and cefotaxime, where the
latter was used to kill the A. tumefaciens cells. Colonies were formed after 4-5 days,
and were subsequently restreaked on YPD plates containing nourseothricin or
hygromycin to isolate individual clones.
5.2.4. Genomic DNA (gDNA) extraction with LiOAc-SDS
Stable Lipomyces transformants were confirmed by restreaking for single
colonies on the appropriate drug plate and integration of the drug resistance cassette
was determined by PCR analysis of genomic DNA. Single colonies of L. starkeyi
transformants (Tfm) from YPD+NAT or HYG (selective medium) were cultured into
YPD medium up to OD600 reached 0.4, 100-200 µL of culture was pelleted and
suspended in 100 µL of 200 mM LiOAc 1% SDS (Sodium Dodecyl Sulfate) solution
and were incubated at 95°C for 15 minutes. After incubation, 300μl of 96-100%
ethanol was added for DNA precipitation, briefly vortexed and DNA was collected by
centrifugation at 15000 G for 3 minutes. The ethanol was aspirated off and the pellet
washed with 70% ethanol and then, aspirated. Precipitated DNA was dissolved in
100 µL of H2O, cell debris was spun down by centrifugation at 15000 G for 15
seconds and 1 µL of the supernatant was used for PCR (LÕOKE et al., 2011). The
gDNA fragments were amplified by PCR reaction (Phusion Hot Start Flex DNA
Polymerase) and PCR products were analyzed on 1.2% SYBR Safe agarose gel
electrophoresis using 1Kb Plus DNA ladder (Invitrogen, USA) and DNA gel loading
dye (6X, Thermo Fisher Scientific-USA)

115
5.2.5. Electroporation
Later, the electroporation was tested as transformation method to transform L.
starkeyi to get the double overexpression (ACC1+DGA1 and ACC1+FAD9.1). L.
starkeyi was subcultured at YPD medium from seed culture of 24h until OD reached
around 2.0 - 2.5. The cells were pelleted at 400 rpm, 4°C for 5 min at Eppendorf
centrifuge 5810R, washed with 2 mL of cold 1M sorbitol, pelleted at 8000 G for 30
sec at Eppendorf centrigue 5424 and then, washed 4 times with 1 mL of cold sorbitol.
The supernatant was aspirated and added 1M sorbitol to a final volume of 50 uL. The
DGA1 (pGI26) and FAD9.1 (pGI27) promoter-gene-terminator cassettes were
amplified by PCR reaction (Phusion Hot Start Flex DNA Polymerase) using primers
MA01/05 and MA35/05, respectively, and purified with a Zymo research PCR
cleanup kit. The Lipomyces cells were electroporated with 5 µL (200-250 ng) of DNA
in a chilled 0.1 cm BioRad electroporation cuvette using a Gene Pulser Xcell (Bio-
Rad) with a range of electrical pulse (0.3 - 1.5 kV), 25 µF, 200 Ω and recovered in 1
mL cold mixture 1:1 of YPD:1M sorbitol at 30°C for 3 hours and then plated onto YPD
medium plates supplemented with NAT (30 µg/mL) and HYG (20 µg/mL). Colonies
appeared after 5 days growth at 30°C.
5.2.6. Colony PCR
PCR reaction is performed to determine whether or not the colony contains the
DNA fragment or plasmid of interest using the protocol for a routine Taq PCR as
described by the company (New England BioLabs). Colony PCR reaction parameters
in a mastercycler (Eppendorf) were as follows: 95°C for 3-sec (initial cell breakage
and DNA denaturation), after 95°C for 30 sec (DNA denatures into single strands),
50°C for 30 sec (primers anneal to ssDNA template (temp depends on primers),
incubated at 68°C for 1 min (primes are extended from 3'-end by Taq Polymerase -1
min/kb), followed by 29 cycles of 95°C for 30 s, and followed by a final extension of 5
min at 72°C (final extension to make sure all products are full length). It was
incubated at 10°C until its use.

116
5.2.7. Polymerase Chain Reaction (PCR) analysis to determine the
incorporation of transferred genes
To confirm the genome integration of transferred genes (DNA cassette), PCR
analysis was performed. The genomic DNA of the transformed L. starkeyi was used
as template for amplification of the gene coding region using specific primers by
phusion hot start flex DNA polymerase protocol as described by the company (New
England BioLabs). PCR reaction parameters in a mastercycler (Eppendorf) were as
follows: 98°C for 1 min, after 98°C for 10 sec, 69°C for 30 sec, incubated at 72°C for
3 min, followed by 29 cycles of 98°C for 10 s, and followed by a final extension of 10
min at 72°C. It was incubated at 10°C until its use.
5.2.8. Plasmid extraction (miniprep)
The plasmid DNA purification using QIAprep spin miniprep kit protocol as
described by QiAGEN-Germany, is used to extract the plasmid DNA from bacteria.
This microorganism cultured overnight at 37°C and 250 rpm, is holding the
assembled cassette and the isolated plasmid DNA is used to confirm the correct
construction of the plasmid of interest (cassette) by electrophoresis of PCR products
in 1.2% SYBR Safe agarose gel and/or DNA sequencing by Quintara Bio Company,
USA. When sent for Sanger sequencing, the PCR products were first purified using a
DNA clean and concentrator kit from Zymo Research (USA).
5.2.9. Analytical methods
5.2.9. Cell biomass assessment
Cell biomass was assessed by absorbance measured at 600 nm in a
spectrophotometer (Genesys 20, Thermo Fisher) and by dry cell weight (DCW). Dry
biomass was determined as follows: A 1.0 mL liquid aliquot culture was pelleted
using a pre-weighed Eppendorf tubes at 10,000 x g for 2 minutes and then washed
with water. The Eppendorf tubes were dried at 60°C for 24 h, cooled at room
temperature in the desiccator and weighed. Cell dry weight measurements were
performed in triplicates.

117
5.2.10. Fluorescence measurements of lipid content
BODIPY 493/503 (Invitrogen, Inc., USA) fluorescence was used to assess
relative lipid content in L. starkeyi cells grown under lipid accumulation conditions.
The potassium iodide (KI) in the reaction mixture quenches the BODIPY signal
outside of cells. Extracellular quenching of BODIPY fluorescence facilitates the use
of fluorescence microplate readers for the estimation of lipid droplets content in cell
populations (RADULOVIC et al., 2013). BODIPY that enters cells preferentially
accumulates in lipid bodies and is not quenched. Calcofluor white (Sigma Aldrich)
fluoresces when complexed with polysaccharides in the fungal cell walls
(HARRINGTON et al., 2003) and in this assay is used to normalize the BODIPY
signal to cell density. The L. starkeyi wild type (WT) and L. starkeyi transformants
grown in YPD low nitrogen medium at 30°C, 200 rpm were stained with staining
solution consisted of 0.25 μg/mL BODIPY 493/503, 500 mM KI, 1x PBS, 1 μg/mL
Calcolfuor white, incubated at room temperature for 10 minutes and then measured
fluorescence on the Tecan Safire 2 plate reader (Adapted of BOZAQUEL-MORAIS et
al. (2010). The measurements were carried out using black 96 well plates and blank
sample wells to a well with no cells, to normalize BODIPY signal to Calcofluor signal.
The emission/excitation wavelengths for BODIPY and calcofluor white were 522/498
nm and 443/411 nm, respectively. The integration time of 100 μs and gain of 100
were used for both dyers. The PBS was prepared as a 10X stock solution (1.37M
NaCl, 27mM KCl, 100mM Na2HPO4, 18mM KH2PO4, pH 7.4), the potassium iodide
as 10X stock (5M KI), the BODIPY as 4000X stock (1 mg/mL BODIPY in ethanol),
the Calcofluor white as 1000X stock (1mg/mL). The BODIPY to Calcofluor ratio was
used to evaluate the lipid content. Samples were analyzed in biological triplicate for
each colonie.
Intracellular lipid droplets were visualized using fluorescence microscopy (RC
Zeiss Axio Observer D.1, Germany) using a GFP filter set. Calcofluor white
fluorescence was visualized using a DAPI filter set.
5.2.11. Fatty acid composition
5mL of the culture were pelletized (~ 60-85mg) and the pellet was washed with
water and pelletized again. To the washed pellet, 2 mL of methanolic HCl (3N) and
0.2 mL of chloroform were added. The mixture was vortexed and heated in a sealed

118
tube at 70C for 3h. The mixture was cooled to room temperature and 2 mL of
internal standard (C13:0) and 2 mL of n-hexane were added. The mixture was
shaken vigorously and then centrifuged (2,000 x g) for 3 min. The upper layer was
removed and analyzed by GC/FID.
One µL was injected in split mode (1:10) onto a SP2330 capillary column (30
m x 0.25 mm x 0.2 µm, Supelco). An Agilent 7890A gas chromatograph equipped
with a flame ionization detector (FID) was used for analysis with the following
settings: Injector temperature 250 °C, carrier gas: helium at 1 mL/min, temperature
program: 140 °C, 3 min isocratic, 10 °C/min to 220 °C, 40 °C/min to 240 °C, 2.5 min
isocratic.
Fatty acids concentrations were calculated by comparing the peak areas in the
samples to the peak areas of commercially available standards in known
concentration relative to the internal standard, respectively.
5.3. Results and discussion
The results are presented in two parts:
Part I: Developing basic genetic tools to engineer Lipomyces for gene
overexpression (Plasmids constructions with diferents promoters and terminators and
NATR and HYGR as drug markers, selection of transformation method of L. starkeyi).
Part II: Overexpression of genes that may increase lipid production (Plasmids
constructions with the ACC1, DGA1 and FAD9.1 genes to be overexpressed in L.
starkeyi, overexpression of genes by selected transformation method, lipid
production of engineered strains).

119
5.3.1. Developing basic genetic tools to engineer Lipomyces for gene
overexpression (Part I)
5.3.1.1. Plasmids construction
The NAT or HYG cassettes were cloned into pGI2, resulting in the plasmids
pGI18, pGI19, pGI20 and pGI21 (Table 19). The cloning and the correct assembly of
the plasmids were confirmed by electrophoresis of PCR products from colony PCR
technique of isolated colonies from selective medium plates, in addition to DNA
sequence of the whole insert (one fragment) by QUINTARABIO COMPANY, CA-
USA. The electrophoresis gel image showed that 100% of tested colonies from
pGI18, pGI19, pGI20 and pGI21 constructions had the correct construction of
plasmids presenting the expected bands size (Figure 31). These plasmids were used
to the transformation of L. starkeyi for the selection of more adequate transformation
method.
Plasmids were transformed into E. coli, by electroporation or chemical
transformation (NEB 5-α, New England Biolabs, USA), for storage at - 80°C and keep
a permanent culture containing the target cassette.

120
Table 19. DNA constructions and the results of plasmids assembly
pGI PCR
template Backbone Resistance Construction
Number of fragments in the in-fusion
reaction
Construction confirmed
Colony PCR
Expected size (b.p.)
DNA sequence
pGI18 G19 pGI2 NAT TDH3-NAT-TDH3 1 4/4 634 Matched
pGI19 G20 pGI2 NAT TDH3-NAT-PGK1 1 4/4 634 Matched
pGI20 G21 pGI2 HYG PGK-HYG-AOX 1 3/3 735 Matched
pGI21 G22 pGI2 HYG Hp4d-HYG-AOX 1 4/4 348 Matched

121
Figure 31. Electrophoresis of PCR products from colony PCR in 1.2% agarose gel to
check the integration of NAT or HYG cassette. MW: Molecular Weight-1 Kb Plus
DNA Ladder. (A) Colonies from pGI18,19,20; (B) Colonies from pGI21.
5.3.1.2. Selection of transformation method of Lipomyces starkeyi
Transformation is an indispensable technique for the genetic manipulation of
cells. In this study, two methods were tested to generate stable transformants of
Lipomyces starkeyi: lithium acetate (LiAc) and Agrobacterium tumefaciens mediated
transformation (ATMT). Briefly, the transformation mechanism of yeasts by LiAc
starts with the attachment of DNA to the cell wall. The attached DNA passes through
the cell wall and then enters into the cell via endocytotic membrane invagination.
Some DNA in the endosomes is delivered to the vacuoles and digested. Although,
how the DNA escapes digestion, reaches the nucleus and enters it through the
nuclear pore is still unclear (Figure 32). Polyethylene Glycol (PEG) is indispensable
for the DNA attachment and possibly acts on the membrane to increase the
transformation efficiency. LiAc and heat shock, which enhance the transformation
efficiency of intact cells, probably help DNA to pass through the cell wall (KAWAI et
al., 2010; PHAM et al., 2011).

122
Figure 32. Putative mechanism of transformation by LiAc (Adapted of KAWAI et al.
(2010).
Agrobacterium tumefaciens-mediated transformation (ATMT) has long been
used to transfer genes to a wide variety of plants (CHENG, R. et al., 2012) and has
also been widely used as an effective tool for insertional mutagenesis in fungi
(WANG et al., 2014). Agrobacterium tumefaciens (AT) belongs to gram-negative soil
bacteria that cause crown gall tumors at wound sites of infected plants. During the
tumor induction, Agrobacterium transfer part of its Ti (tumor-inducing) plasmid, known
as ‘T-DNA’ which is located on a 200 kbp of Ti plasmid, to plant. The T-DNA is
flanked by 24 bp directional imperfect repeat sequences, known as the left and right
border (LB and RB, respectively). Prior to transfer, the T-DNA region is released from
the Ti plasmid by endonucleases, which introduce site- and strand-specific single-
stranded breaks into the LB and RB sequences. Once T-DNA has entered the host
cell it is randomly integrated into nuclear chromosomes (Figure 33). The process of
T-DNA transfer depends on the induction of a serie of virulence (vir) genes, also
located in the Ti plasmid, needed to tumorigenicity. The vir genes are induced by
compounds secreted by wounded plants cells, such as acetosyringone (AS)
(GROOT et al., 1998; FRANDSEN, 2011; VIEIRA et al., 2011). ATMT of fungi is
believed to proceed via a T-DNA transfer mechanism similar to that described for

123
plants; however, an artificial induction of AT virulence system using phenolic inducer
compounds, such as acetosyringone, is necessary (Frandsen, 2011). The sequences
of natural T-DNA can be deleted and replaced by another DNA sequence, without
any harmful effect in DNA transference to the host cell. Therefore, the binary vector
may be used by ATMT. In this system, T-DNA and the virulence region are separated
in two distinct plasmids, allowing an easier genetic manipulation of the smaller binary
vector containing the T-DNA (VIEIRA & CAMILO, 2011; CHENG, R. et al., 2012;
MUNIZ et al., 2014). Then, the natural ability of At to transfer portions of its DNA to
cells host has been widely used to fungal transformation (PARK et al., 2013; KOH et
al., 2014; SØRENSEN et al., 2014).

124
Figure 33. Agrobacterium tumefaciens mediated transformation mechanism (A) and
an example of a binary plasmid used to transform Lipomyces (B). (Adapted of
Dominic Pinel, 2015: In preparation)
Both methods have generated transformants strains of Lipomyces. LiAc
method could generate Lipomyces transformants with NAT and HYG resistance;
however, fewer colonies were found compared to ATMT (Table 20). There was not
any transformants for DNA construction of pGI18 (TDH3-NAT-TDH3) for both
transformation methods. Possibly the TDH3 terminator doesn’t work well for
Lipomyces since the correct construction of pGI18 was confirmed by complete
sequencing (data no shown) and the TDH3 promoter has worked for pGI19
construction by LiAc and ATMT (Table 20).
A
B

125
Table 20. Results of Lipomyces starkeyi transformation by LiAc and ATMT methods
Plasmid Resistance Construction
Lipomyces starkeyi DSM 70296
ATMT LiAc
NAT 30 ug/mL or HYG 20 ug/mL NAT 30 ug/mL or HYG 20 ug/mL
Colonies Restreak
Confirmation of
integration by PCR
DNA Sequence
Colonies Restreak
Confirmation of
integration by PCR
DNA Sequence
pGI18 NAT TDH3-NAT-TDH3 - - - - 0 - - -
pGI19 NAT TDH3-NAT-PGK1 3,050 4/4 3/3 3/3 1 1/1 1/1 1/1
pGI20 HYG-R PGK-HYG-AOX1 1,040 3/3 3/3 2/2 0 - - -
pGI21 HYG-R Hp4d-HYG-AOX1 810 4/4 3/3 3/3 210 4/4 2/2 2/2

126
It was obtained only 1 and 210 colonies for pGI19 and pGI21, respectively, by
LiAc transformation (Figure 34). The colonies formed in YPD plates with selective
drug marker were restreaked at the same YPD plate to isolate individual clones. To
confirm the presence of the transgenes in the putatively transformed clones, genomic
DNAs were extracted for PCR amplification. PCR reactions using NAT or HYG
internal primers yielded the expected amplification product in each transformant
analyzed, suggesting that the exogenous genes has been incorporated into the
genome (Figure 35). Further confirmation was carried out by the gDNA sequencing
performed by QuintaraBio Company (data no shown). No colonies were found for
pGI20 by LiAc. The ATMT method was much more efficient than LiAc (Table 21).
Using ATMT, we could get 3,050, 1,040 and 810 colonies for pGI19, pGI20, pGI21
constructions, respectively (Figure 36). All restreaked colonies showed resistance to
the respective drug marker and integration of NAT or HYG cassettes into Lipomyces
genome was confirmed by PCR analysis and electrophoresis. For each stable drug
resistant transformant, the expected PCR band size was obtained (Figure 37). Also,
sequencing of PCR products from gDNA of transformants confirmed the presence of
exogenous gene and the correct integration of cassette into L. starkeyi genome (data
no shown).
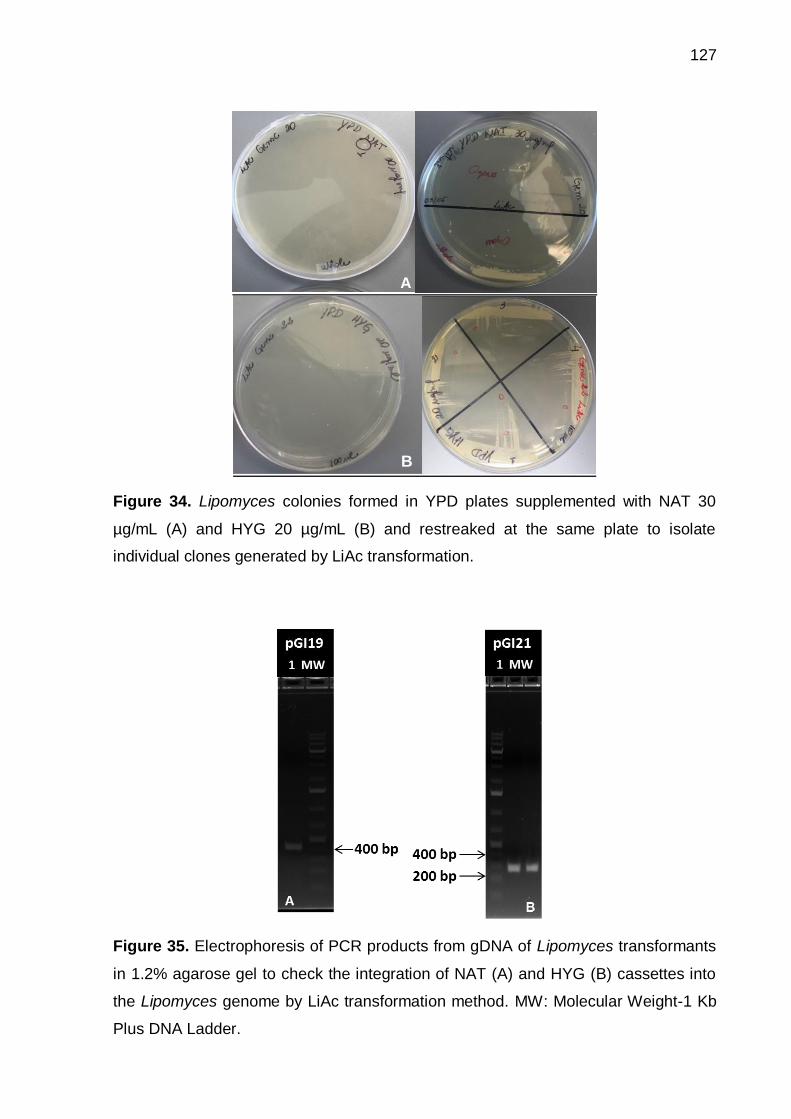
127
Figure 34. Lipomyces colonies formed in YPD plates supplemented with NAT 30
µg/mL (A) and HYG 20 µg/mL (B) and restreaked at the same plate to isolate
individual clones generated by LiAc transformation.
Figure 35. Electrophoresis of PCR products from gDNA of Lipomyces transformants
in 1.2% agarose gel to check the integration of NAT (A) and HYG (B) cassettes into
the Lipomyces genome by LiAc transformation method. MW: Molecular Weight-1 Kb
Plus DNA Ladder.
A
B

128
Figure 36. Lipomyces colonies formed in YPD plates supplemented with NAT 30
µg/mL (A) and HYG 20 µg/mL (B, C) and restreaked at the same plate to isolate
individual clones generated by ATMT transformation.
A
B
C

129
Figure 37. Electrophoresis of PCR products from gDNA of Lipomyces transformants
in 1.2% agarose gel to check the integration of NAT (A) and HYG (B, C) cassettes
into the Lipomyces genome by ATMT transformation method. MW: Molecular Weight-
1 Kb Plus DNA Ladder.
Although the LiAc transformation protocol was easier and faster to perform, it
was less efficient and reliable than ATMT. The LiAc transformation has worked for L.
A
B C

130
starkeyi in a previous study, but it was also found to be of low efficiency (CALVEY et
al. 2014). Probably the different DNA constructions have influenced or even the
strains diversity between them. However, transformation of Lipomyces starkeyi DSM
70926 by LiAc method using intact cells or spheroplasts was not successful by
CORADINI (2014) as well as found by DAI et al. (2015) using others species of
Lipomyces. Although, WANG et al., (2011a) reported a novel expression system in
L. kononenkoae by LiAc transformation to increase linoleic acid production.
Considering the difficulty of Lipomyces transformation and only few studies show be
promising on its genetic modification (WANG et al., 2011a; CALVEY et al., 2014;
DAI et al., 2015; SALUNKE et al., 2015), the results found in this study for LiAc
method may contributing for future studies of establishment of tools for an stable
transformation of L. starkeyi. DAI et al. (2015) reported that a DNA could be
effectively integrated into the chromosomes of Lipomyces by ATMT while the LiAc
transformation has failed with no transformants. Some advantageous of ATMT
include a high efficiency in transformation, versatility to operate on distinct types of
cells, a high percentage of single T-DNA insertion, transform intact cells, etc.
(MUNIZ, 20014; WANG et al., 2014). Then, the Agroacterium-mediated
transformation can be a viable alternative for method for Lipomyces transformation,
making possible to screen libraries in metabolic engineering of this yeast. Therefore,
the ATMT was the transformation method used in this study for metabolic
engineering of Lipomyces starkeyi.
5.3.2. Overexpression (OE) of ACC1, DGA1 and FAD9.1 in Lipomyces starkeyi
by ATMT (Part II)
Since we could efficiently transform L. starkeyi by ATMT and the engineering
lipid biosynthesis pathways in this yeast is still relatively unexplored, though initial
attempts have shown promising (SALUNKE et al., 2015), we focused in engineer this
strain for increase the lipid production by over-expression of genes involved on lipid
biosynthesis. The genes acetyl-CoA carboxylase (ACC1), the first committed step of
fatty acid synthesis, diacylglycerol acyltransferase (DGA1), the final step of the
triglyceride (TAG) synthesis pathway (Figure 38) (TAI & STEPHANOPOULOS, 2013)
and fatty acyl-CoA delta-9 desaturase (FAD9.1), involved in formation of
monounsaturated fatty acids, were chosen to be overexpressed in L. starkeyi yielding
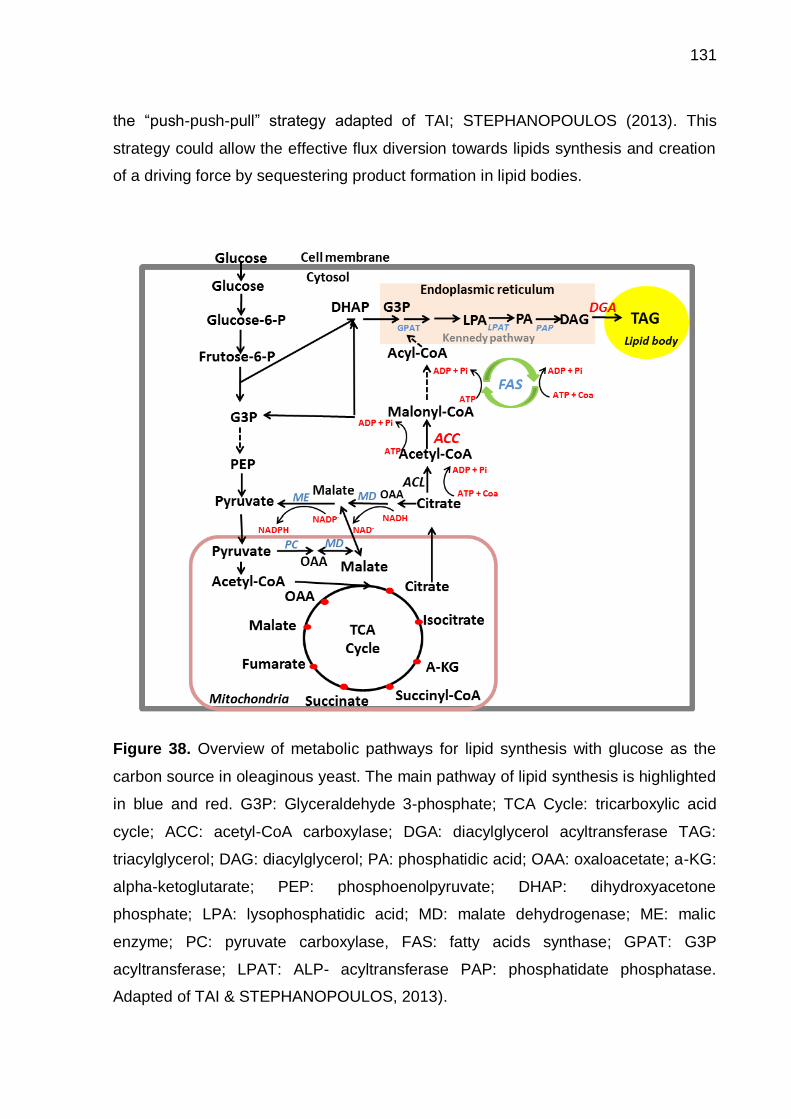
131
the “push-push-pull” strategy adapted of TAI; STEPHANOPOULOS (2013). This
strategy could allow the effective flux diversion towards lipids synthesis and creation
of a driving force by sequestering product formation in lipid bodies.
Figure 38. Overview of metabolic pathways for lipid synthesis with glucose as the
carbon source in oleaginous yeast. The main pathway of lipid synthesis is highlighted
in blue and red. G3P: Glyceraldehyde 3-phosphate; TCA Cycle: tricarboxylic acid
cycle; ACC: acetyl-CoA carboxylase; DGA: diacylglycerol acyltransferase TAG:
triacylglycerol; DAG: diacylglycerol; PA: phosphatidic acid; OAA: oxaloacetate; a-KG:
alpha-ketoglutarate; PEP: phosphoenolpyruvate; DHAP: dihydroxyacetone
phosphate; LPA: lysophosphatidic acid; MD: malate dehydrogenase; ME: malic
enzyme; PC: pyruvate carboxylase, FAS: fatty acids synthase; GPAT: G3P
acyltransferase; LPAT: ALP- acyltransferase PAP: phosphatidate phosphatase.
Adapted of TAI & STEPHANOPOULOS, 2013).

132
Considering the low temperature fluidity and oxidative stability of biodiesel the
monounsaturated fatty acids (MUFAs) are the best components for this biofuel
production. Since the biodiesel, derived from vegetable oil or microbial lipids, always
consists of significant amounts of polyunsaturated and saturated fatty acids alkyl
esters, which hampers its practical applications, the fatty acid composition should be
modified to increase MUFA contents (CAO et al., 2014). Fatty acid desaturases are
enzymes that catalyze the insertion of a double bond at the delta position of fatty
acids. The Δ-9 fatty acid desaturase, also known as stearoyl-CoA, catalyzes the
biosynthesis of monounsaturated fatty acid (C16:1 and C18:1) from saturated fatty
acid (Figure 39). The increased production of MUFAs is desirable for biodiesel fuels
for their cold flow property (TANG et al., 2015).
Figure 39. Simplified scheme of fatty acid desaturation by Δ-9 fatty acid desaturase.
5.3.2.1. Plasmid constructions
To implement the gene overexpression strategy in L. starkeyi, new DNA
constructions integrating the genes ACC1, DGA1 and FAD9.1 (Table 21) were
assembled using the promoter – gene – terminator combinations that worked well
based on the previous HYG and NAT results (Table 21). The PCR products of
fragments (promoter, gene (ACC1, DGA1, FAD9.1) and terminator) (Table 18) from
plasmids were cloned into pGI19 or pGI20, yielding the plasmids pGI25, pGI26,
pGI27, pGI29, pGI30 (Table 21). The DNA construction for ACC1, DGA1 and FAD9.1
showed the correct assembly (Figure 40). We can observe that the number of

133
confirmed colonies for these three fragments infusion reactions (three PCR products
plus backbone) was lower than the one fragment reactions. It is known that
increasing the number of fragments decreases the efficiency of correct infusion
assembly (Clontech manual). The DNA sequence of the whole insert (three
fragments) by QUINTARABIO COMPANY, CA-USA also confirmed the correct
assembly.

134
Table 21. DNA constructions integrating the ACC1, DGA1 and FAD9.1 genes and the results of plasmids assembly
pGI PCR
template Backbone Resistance Construction
Number of fragments in the in-fusion
reaction
Construction confirmed
Colony PCR
Expected size (b.p.)
DNA sequence
pGI25 G20, G23 pGI19 NAT TDH3 - ACC1 - PGK1 3 10/11 792 Matched
pGI26 G20, G24 pGI20 HYG-R TDH3 - DGA1 - PGK1 3 3/11 480 Matched
pGI27 G20, G25 pGI20 HYG-R TDH3 - FAD9.1 - PGK1 3 1/11 480 Matched
pGI29 G21, G24 pGI19 NAT PGK1 - DGA1 - AOX1 3 9/11 406 Matched
pGI30 G22, G25 pGI19 NAT PGK1 - FAD9.1 – AOX1 3 1/16 1476 Matched

135
Figure 40. Electrophoresis of PCR products from colony PCR in 1.2% agarose gel to
check the integration of ACC, DGA, FAD9 cassettes. MW: Molecular Weight-1 Kb
Plus DNA Ladder. (A) Colonies from pGI25; (B) pGI26, pGI27; (C) pGI29; (D) pGI30.
The new plasmids containing the genes involved in lipid accumulation were
cloned into Agrobacterium and then, randomly integrated into the chromosome of L.
starkeyi by ATMT, yielding the single over-expression (OE) strains LS 25-ACC1, LS
26-DGA1, LS 26-FAD9.1, LS 29-DGA1, LS 30-FAD9 (Table 22).
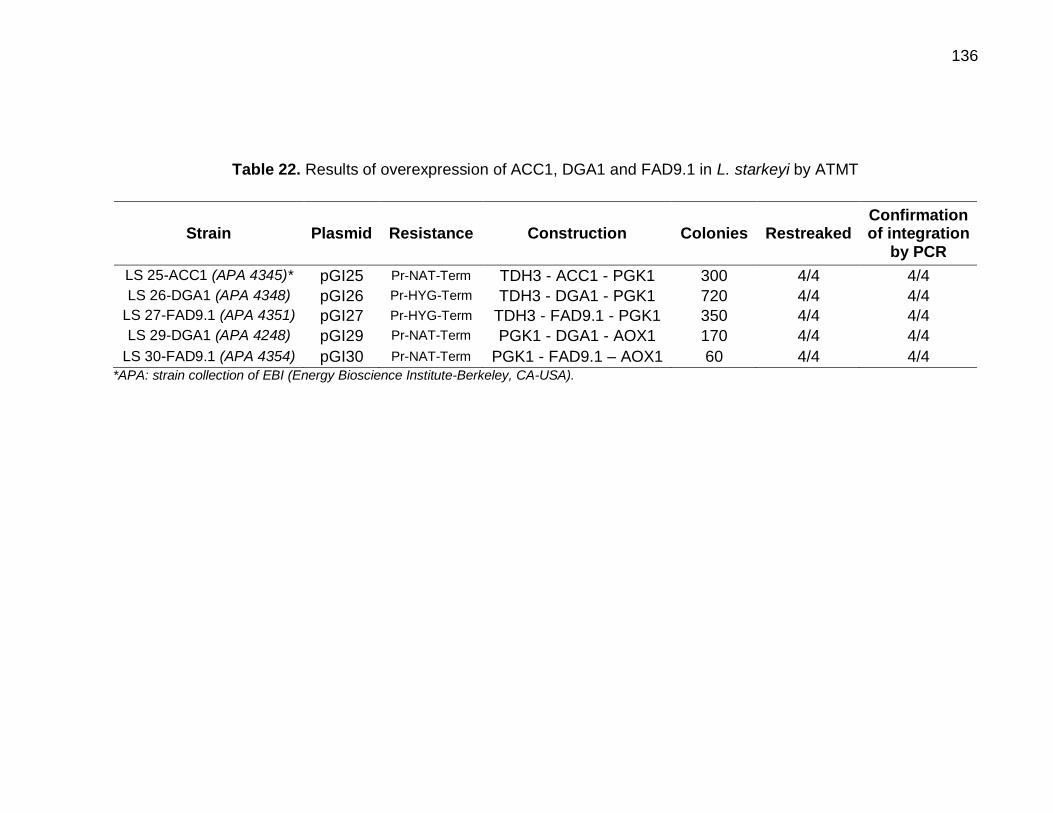
136
Table 22. Results of overexpression of ACC1, DGA1 and FAD9.1 in L. starkeyi by ATMT
Strain Plasmid Resistance Construction Colonies Restreaked Confirmation of integration
by PCR
LS 25-ACC1 (APA 4345)* pGI25 Pr-NAT-Term TDH3 - ACC1 - PGK1 300 4/4 4/4
LS 26-DGA1 (APA 4348) pGI26 Pr-HYG-Term TDH3 - DGA1 - PGK1 720 4/4 4/4
LS 27-FAD9.1 (APA 4351) pGI27 Pr-HYG-Term TDH3 - FAD9.1 - PGK1 350 4/4 4/4
LS 29-DGA1 (APA 4248) pGI29 Pr-NAT-Term PGK1 - DGA1 - AOX1 170 4/4 4/4
LS 30-FAD9.1 (APA 4354) pGI30 Pr-NAT-Term PGK1 - FAD9.1 – AOX1 60 4/4 4/4 *APA: strain collection of EBI (Energy Bioscience Institute-Berkeley, CA-USA).

137
The ATMT method showed be an efficient tool to introduce functional exogenous
genes into Lipomyces and 100% of analyzed colonies had the correct integration of
cassettes which contained the genes of interest (Figures 41 and 42). Such confirmation
may be seen by the isolation of clones restreaked in YPD supplemented with NAT or
HYG (Figure 35) and the amplification of gDNA using specific primers which yielded the
expected amplification product in each analyzed transformant (Figure 42). The amplified
region consisted of binding coding region of gene-terminator for putative transformants
and wild type; however, it was expected no generation of band by PCR reaction for wild
type, which should not present the amplified coding region in its genome. This could be
confirmed by electrophoresis where no bands were found for wild type Lipomyces
(Figure 42).

138
Figure 41. Lipomyces colonies formed in YPD plates supplemented with NAT 30 µg/mL
or HYG 20 µg/mL (A) and 4 colonies from each transformant restreaked at the same
plate to isolate individual clones (B) generated by ATMT transformation.
LS 25-ACC1
A
B
LS 26-DGA1 LS 27-FAD9.1
LS 29-DGA1 LS 30-FAD9.1

139
Figure 42. Electrophoresis of PCR products from gDNA of wild type (WT) and drug-
resistant transformants of Lipomyces LS 25-ACC1, LS 26-DGA1, LS 27-FAD9.1, LS 29-
DGA1, LS 30-FAD9.1) (APA 4345, APA 4348, APA 4351, 4248, APA 4354) in 1.2%
agarose gel to check for integration of T-DNA into Lipomyces genome after ATMT
transformation. MW: Molecular Weight-1 Kb Plus DNA Ladder.
5.3.2.2. Lipid content of wild type versus overexpression strains
As ATMT-mediated integration is random, and could have unknown effects on
expression of the integrated cassettes, we tested multiple colonies for lipid production by
fluorescence in order to observe the variation in lipid content and to find the best lipid
producers among the different transformants. The BODIPY 493/503, that is a green
emitting fluorophore and stain preferentially the lipid bodies and the Calcolfuor White
(CFW), which fluoresces an intense bluish/white color when complexed with
polysaccharides in the fungal cell walls, were the dyes used to determine the lipid
content of yeasts (Figure 43). Their fluorescent staining for lipids offers a rapid and
inexpensive analysis tool to measure neutral lipid content, avoiding time-consuming and
costly gravimetric analysis (RUMIN et al., 2015).

140
Figure 43. Fluorescence microscopy image of wild type Lipomyces, after 120h growth in
lipid induction medium, stained with BODIPY and calcofluor white.
Based on BODIPY and Calcofluor White (CFW) we could rapidly evaluate relative
lipid content. The first microplate assays were perfomed for high throughput screening of
95 colonies of each DNA construction transformant, except for LS 30-FAD9.1 (APA
4354) (28 colonies only), plus wild type Lipomyces cultured in low nitrogen YPD (Figure
44). The first well of microplates corresponds to the wild type strain. We could observe
the fluorescence increased from 96h to 120h of cultivation for all transformants
indicating lipid accumulation during fermentation. The BODIPY/calcofluor ratio increased
every 24 hours, but the change was smaller (data not shown). As the results varied a lot
among the individual clones, a second screening was carried out, now selecting 24
clones in biological triplicate, from strains LS 25-ACC1, LS 26-DGA1 and LS 27-FAD9.1
(APA 4345, APA 4348, and APA 4351) which express ACC1, DGA1 and FAD9.1 with
the same promoter and terminator (Figure 45).

141
Figure 44. Fluorescence microplate assay of wild type (WT) and engineered Lipomyces
overexpression strains (ACC1, DGA1, FAD9.1) cultured in low nitrogen YPD medium for
96 and 120h (Single measurements with no replicates).

142
Figure 45. Restreak of 24 colonies of wild type and of each DNA construction
transformants (LS 25-ACC1, LS 26-DGA1, LS 27-FAD9.1) to be used on BODIPY +
calcofluor white microplate assay.
The individual clones exhibited variation between them as well as wild type
suggesting that the differences would be due to the intrinsic factors. However, wide
variations among their clones were observed for strain LS 26-DGA1 (APA 4348) mutant
(Figure 46), possibly due to random integration of T-DNA in an unknown specific
genomic location that could affect the transcription of over-expressed genes and or lipid
production (XUE et al., 2013). ZHANG et al., 2015, reported a significant variability in
lipid production between the individual ATMT-derived clones of R. toruloides. Despite of
unsuccessfully attempts to map the genomic location of T-DNA insertion into the R.
toruloides to determine if the genes were disrupted or if multiply copies of T-DNA had
been inserted into genome, they could verify, by lipid content of several clones, that the
increasing of lipid production was strongly related to the over-expression of ACC1 and
DGA1 genes encoded on the T-DNA cassette. Then, the supposed best lipid producers
of Lipomyces mutants, which presented higher BODIPY/calcofluor ratio, were selected
from second screening and four promissing clones of each transformant were then,
WT LS 25-ACC1
LS 27-FAD9.1
WT LS 25-ACC1
LS 26-DGA1 LS 26-DGA1 LS 27-FAD9.1

143
fermented in low nitrogen YPD in shaking flasks and the fatty acid profile was analyzed
by Gas Chromatography/Mass (GC/MS).
Figure 46. Fluorescence microplate assay of wild type (WT) and engineered Lipomyces
(ACC1,DGA1,FAD9.1) cultured in YPD low nitrogen medium for 120h. Error bars: deviation
of 3 biological replicates.
Several transformants expressing DGA1 appeared to have higher lipid content
than wild type (Figure 46). Previously to the GC/MS analysis, the fluorescence average
of 24 colonies indicated that the DGA1 would be the gene with higher influence on lipid
production of Lipomyces, showing higher lipid content than to the wild type (Figure 47).
To confirm this result, 4 promissing clones of each transformant were selected from 24
colonies and the lipids extracted and analyzed by GC/MS (Figure 48). This assumption
would be later confirmed by chromatography analysis, which showed an increased
amount of total fatty acid for mutants over-expressing DGA1 than the over-expression of
ACC1 and FAD9.1 and even to the wild type (Figure 48). Over-expression of DGA1 and
ACC1 leads to significant increases in lipid accumulation and DGA1, in particular,
exhibited 1.5-fold (0.97 mg/mL) of total fatty acid over the control (0.66 mg/mL) (WT),
compared to 26.5% increased by ACC1 overexpression (0.83 mg/mL). Similarly, the Y.
lipolytica transformants showed the increased lipid production to overexpression of
0
2
4
6
8
10
12
14
0 2 4 6 8 10 12 14 16 18 20 22 24
BO
DIP
Y/C
alc
ofl
uo
r w
hit
e
Colony
WT LS 25-ACC1 LS 26-DGA1 LS 27-FAD9.1
Average
of WT

144
ACC1 and DGA1, in the respective strains, with DGA1 being much more highly
expressed than ACC1 increasing 4-fold (33.8%) in lipid production over the control,
compared to the 2-fold (17.8%) increase for ACC1 gene (TAI & STEPHANOPOULOS,
2013). The simultaneous coexpression of ACC1 and DGA1 could increase the lipid
content of Y. lipolytica and R. toruloides to 95% and 41.4%, respectively, demonstrating
synergistic effect among them (TAI & STEPHANOPOULOS, 2013; ZHANG et al.,
2015). QIAO et al., (2015) could found a lipid production 5-fold by overexpression of
delta-9 stearoyl-CoA desaturase in addition to ACC1 and DGA1 in Y. lipolytica. All
clones, except the LS 27-FAD9.1 (APA 4351), had total fatty acid greater than WT,
indicating that the increased fatty acids were most likely due to overexpression of ACC1
and DGA1 (Figure 48).
Figure 47. Fluorescence average of 24 colonies of wild type and engineered Lipomyces
cultured in YPD low nitrogen medium for 120h. Error bars: deviation of 3 biological replicates.
0
2
4
6
8
10
BO
DIP
Y/C
alc
ofl
uo
r
WT and Engineered Lipomyces
WT LS 25-ACC1 LS 26-DGA1 LS 27-FAD9.1

145
Figure 48. Total fatty acid (FA) produced by wild type and engineered L. starkeyi culture
in YPD low nitrogen medium for 120h analyzed by CG/MS.
In contrast to ACC1 and DGA1, the expression of FAD9.1 gene in Lipomyces
showed a negative effect, reducing the total amount of fatty acid compared to the wild
type (Figure 48). Possibly, the random integration of T-DNA encoding the gene caused
some unknown effect on the lipid biosynthesis affecting negatively the microbial
production. Besides, no improvement of monounsaturated fatty acid over the wild type
was observed, but a slight reduction of polyunsaturated linoleic acid (C18:2) (Figure 49).
There was an increasing of C16:0 and C18:1 for Lipomyces strains expressing ACC1
and DGA1 mainly for palmitic acid, and this increase was most pronounced for the strain
expressing DGA1 (Figure 49). The proportion of linoleic acid stayed relatively even
across the both strains. In Y. lipolytica the ACC overexpression strain produced
significantly more linoleic acid and DGA1 maintaining a higher proportion of stearic acid
(TAI; STEPHANOPOULOS, 2013). Overall, the composition of fatty acid of engineered
and wild type strains, obtained in this study, was also found to be similar to the palm oil,
widely used to biodiesel production, with oleic and palmitic acids predominating.
However, the possibility of regulating the fatty acid composition to produce high level of
MUFAs by overexpression of FAD9.1 in Lipomyces was unsuccessful in this study,

146
requiring further studies to promote the production of biodiesel from MUFAs, since
SALUNKE et al. (2015) reported be possible the regulation of polyunsaturated fatty acid
(PUFA) biosynthesis pathway of Lipomyces by genetic engineering.
Figure 49. Fatty acid profile of lipid produced by wild type and engineered Lipomyces
expressing ACC1, DGA1 and FAD9.1 genes cultured in low nitrogen YPD medium for
120h. Error bars: deviation of 4 biological replicates selected on Figure 48.
Overall, these results demonstrate that either overexpression of ACC1 or DGA1
significantly increased the total content of fatty acid, with the DGA1 strain having the
dominant effect. By contrast, overexpression of FAD9.1 reduced the total fatty acid
production, and did not increase the monounsaturated formation. However, how these
individual ACC1 and DGA1 genes could contribute to lipid production in L. starkeyi
should be better investigated as well as their simultaneous expression to improve the
lipid biosynthesis. Since the co-overexpression of ACC1 and DGA1 (push-pull) has
showed promising results for others oleaginous yeast (TAI & STEPHANOPOULOS,
2013; ZHANG et al., 2015) it would be an interesting strategy to genetic modification of
0,0
0,1
0,2
0,3
0,4
0,5
0,6
Fa
tty a
cid
pro
file
(m
g/m
L)
WT LS 25-ACC1 LS 26-DGA1 LS 27-FAD9.1

147
Lipomyces, as it would allow the effective flux diversion towards lipid synthesis and
creation of a driving force by sequestering product formation in lipid bodies. Since we
generated a series of single gene overexpression (OE) strains, we could do a second
round transformation by ATMT with these single OE strains to generate double OE
strains, and ultimately triple OE strains (push-push-pull). Initial efforts were done to
transformation of LS 25-ACC1 clone (APA4345) by random integration of pGI26 (DGA1)
and pGI27 (FAD9.1) mediated by Agrobacterium, yielding the double overexpression LS
ACC1+DGA1 (APA 4404) and LS ACC1+FAD9.1 (APA4407) strains (Table 23). The
random integration of T-DNA to Lipomyces genome was confirmed by PCR of gDNA for
two double OE strains LS ACC1+DGA (APA 4404) and LS ACC1+FAD9.1 (APA 4407)
(Figure 50). The NAT and HYG coding region were amplified using the primers
MA100/06 and MA11/14, respectively, and the electrophoresis showed that the both
genes were integrated into genome of each transgenic clone. However, the double
overexpression strains were not yet used for fermentation in low nitrogen medium to
evaluate the effect of simultaneous expression of ACC1 + DGA1 and ACC1 + FAD9
genes to the lipid production. This strategy will be performe in furture works. However,
this work demonstrates that we could integrate multiple genes into the genome by
consecutive ATMT, leading to the generation of strains simultaneously resistant to
antibiotics NAT and HYG and overexpressing either ACC1+DGA1 or ACC1+FAD9.1.
Thus, ATMT was an efficient method for Lipomyces transformation and it should help
further metabolic engineering of this yeast in order to facilitate the construction of
superior strains that produce fuel and chemicals (LIN et al., 2014).

148
Table 23. Double overexpression of LS transformants by ATMT
Strain (OE gene) APA
number Lipomyces Tfm
(host)*
Agrobacterium carrying the
binary plasmid
AT:LS ratio
Resistance Colonies
Confirmation of integration
by PCR of gDNA
LS ACC1+DGA1 (1) - LS 25-ACC1-col.3
AT-pGI26 (APA 4217)
1:1 NAT/HYG no colony -
LS ACC1+DGA1 (2) - LS 25-ACC1- col.7 1:1 NAT/HYG no colony -
LS ACC1+DGA1 (3) - LS 25-ACC1-col.8 1:1 NAT/HYG 100 -
LS ACC1+DGA1 (4) APA 4404 LS 25-ACC1-col. 20 1:1 NAT/HYG 100 3/3
LS ACC1+FAD9.1 (1) - LS 25-ACC1-col.3
AT-pGI27 (APA 4218)
1:1 NAT/HYG no colony -
LS ACC1+FAD9.1 (2) - LS 25-ACC1- col.7 1:1 NAT/HYG 100 -
LS ACC1+FAD9.1 (3) - LS 25-ACC1-col.8 1:1 NAT/HYG 100 -
LS ACC1+FAD9.1 (4) APA 4407 LS 25-ACC1-col. 20 1:1 NAT/HYG 100 1/1
*Lipomyces host were the 4 promising clones selected from 24 colonies.

149
Figure 50. Electrophoresis of PCR products from potential double OE Lipomyces ATMT
transformants (LS ACC1+DGA1 and LS ACC1+FAD9.1) in 1.2% agarose gel. The
presence of bands indicates either the NATR (724 bp) or HYGR (787 bp), which confirms
integration of the T-DNA cassette. MW: Molecular Weight-1 Kb Plus DNA Ladder.
As an alternative to ATMT transformation, we developed an optimized
electroporation protocol for Lipomyces. The electroporation was tested to get the double
overexpression because is an easier and faster method of transformation compared to
ATMT (Table 24). First, it was used an optimized condition (1.5 kV, 200 Ω, 25 µF) for R.
toruloides, established by the Arkin laboratory-EBI, to transform Lipomyces WT (Single
OE) and some transformants from the first screening by fluorescence. As we couldn’t
get any transformants for that condition we tried others electrical pulses (0.3, 0.6, 0.9,
1.2 kV) to transform WT + pGI26 PCR product to get single OE. Since we have gotten
more colonies in 0.3 kV, grown in YPD supplemented with NAT+HYG, this condition was

150
used to the transformation of LS transformants to get the double OE. We could get
around 100 colonies for all clones, except for the LS 25/26-2 (EP) and LS 25/27-2 (EP)
that was achieved around 600 colonies, which may be due the intrinsic factors. Even we
could supposedly get the double OE by electroporation the confirmation of cassettes
integration were not done. However, this is a strong indication that we could use this
method to transform Lipomyces starkeyi since we got significant amount of colonies
grown on selective medium. Using our optimized electroporation protocol instead of
ATMT, we can now more rapidly engineer Lipomyces and this will serve as a useful
method for future studies.

151
Table 24. Double OE of L. starkeyi by electroporation
Double OE by Electroporation
Strain Lipomyces Tfm
(host)* Template
(PCR product) DNA (ng)
Condition
(200 Ω, 25 µF) Colony
LS WT-26 (EP 1.5) Lipomyces WT pGI26
200-250 1.5 kV
No colony
LS WT-27 (EP 1.5) Lipomyces WT pGI27 No colony
LS 25/26- col. 13 (EP) LS 25-ACC1 col. 13 pGI26 No colony
LS 25/27-col. 13 (EP) LS 25-ACC1 col. 13 pGI27 No colony
LS 25/26- col. 7 (EP) LS 25-ACC1 col. 7 pGI26 No colony
LS 25/27- col. 7 (EP) LS 25-ACC1 col. 7 pGI27 No colony
LS 25/26- col. 24 (EP) LS 25-ACC1 col. 24 pGI26 No colony
LS 25/27-col. 24 (EP) LS 25-ACC1 col. 24 pGI27 No colony
LS WT-26 (EP 0.3) Lipomyces WT pGI26
200-250
0.3 kV 114
LS WT-26 (EP 0.6) Lipomyces WT pGI26 0.6 kV 3
LS WT-26 (EP 0.9) Lipomyces WT pGI26 0.9 kV 1
LS WT-26 (EP 1.2) Lipomyces WT pGI26 1.2 kV No colony
LS WT-26 (EP 1.5) Lipomyces WT pGI26 1.5 kV No colony
LS ACC1+DGA1-col. 3 (EP) LS 25-ACC1-col. 3 pGI26
200-250 0.3 kV
84
LS ACC1+DGA1-col.7 (EP) LS 25-ACC1-col. 7 pGI26 592
LS ACC1+DGA1-col.8 (EP) LS 25-ACC1-col. 8 pGI26 94
LS ACC1+FAD9.1-col. 3 (EP) LS 25-ACC1-col. 3 pGI27 131
LS ACC1+FAD9.1-col. 7(EP) LS 25-ACC1-col. 7 pGI27 594
LS ACC1+FAD9.1-col. 8 (EP) LS 25-ACC1-col. 8 pGI27 124
*Lipomyces host were selected from 24 colonies.

152
5.4. Conclusions
L. starkeyi is a promising microorganism for the production of lipid-based
chemicals because it produces a high content of lipids and utilizes a variety of pure and
complex carbon sources such as xylose, glucose, glycerol, molasses and lignocellulosic
hydrolysates. Effective engineering of biosynthetic pathways is necessary to maximize
yield and productivity in order to microbial lipid production competitive with cheaper
sources of oil, such as plants. Our results demonstrate that A. tumefaciens mediated
transformation (ATMT) can be an efficient tool to integrate functional genes into the L.
starkeyi genome. Overexpression of ACC1 and DGA1 both could increase the total fatty
acid production, whereas DGA1 had a stronger effect. The overexpression of FAD9.1
gene did not increase the level of monounsaturated fatty acid (C16:1 and C18:1) and, in
addition, clones expressing this gene showed lower production of total fatty acids. We
further demonstrated that multiple genes could be integrated by consecutive ATMT,
leading to the generation of strains simultaneously resistant to antibiotics NAT and HYG
and overexpressing either ACC1 + DGA1 or ACC1 + FAD9.1. We also demonstrated
that electroporation could be used as an alternative method for Lipomyces
transformation. These results show important initial steps for the establishment of a
genetic toolbox for metabolic engineering of L. starkeyi. In future studies, these tools can
be used to explore the full potential of this microorganism as a production host for future
biorefineries.

153
6. GENERAL CONCLUSION
The pretreatment of sugarcane bagasse with diluted acid was able to hydrolyze
the hemicellulosic fraction into fermentable sugars, mainly xylose. The acid hydrolysis
with H2SO4 1.5% for 20 minutes in autoclave could hydrolyze around 65% of
hemicellulose fraction and this yield reached 82% when the pretreatment was carried
out in Parr reactor under the same condition.
Lipomyces starkeyi DSM 70296 showed an ability to consume sugars from HH
without appreciable inhibition. Increasing the inoculum concentration increased the lipid
accumulation from xylose and HH. Microbial oil produced by L. starkeyi showed similar
composition to vegetable oil and could be used as feedstock of biodiesel production.
The tolerance to inhibitors and the efficient utilization of xylose make L. starkeyi a
promising candidate of industrial importance for lipid production from lignocellulosic
biomass.
Metabolic engineering of oleaginous yeast such as overexpression of key
enzymes can help to maximize yield and lipid productivity. A. tumefaciens mediated
transformation (ATMT) showed to be an efficient tool to integrate functional genes into
the L. starkeyi genome. Overexpression of genes related to lipid biosynthesis such as
ACC1 and DGA1, increased the total fatty acid production and DGA had a stronger
effect. The consecutive ATMT allowed the integration of multiple genes leading to the
generation of strains simultaneously resistant to antibiotics NAT and HYG and
overexpressing ACC1 + DGA1 or ACC1 + FAD9.1. These strategies will be essential in
enabling the technologies for production of biologically-derived chemicals and fuels by L.
starkeyi.
Single cell oil (SCO) from oleaginous yeast is a renewable, noncrop-based oil
source that can be used for biofuels and oleochemicals throughout the food,
pharmaceutical, cosmetics and industrial sectors. The ability to utilize hemicellulose of
some oleaginous yeast such as L. starkeyi makes them highly valuable for the future of
sustainable bioprocessing. Therefore, this yeast could be adopted as a value-added
platform for hemicellulose bioconversion on the context of biorefineries.
154
This work shows the promising use of L. starkeyi for microbial oil from
hemicellulosic hydrolysate of sugarcane bagasse, its tolerance to acetic acid and ability
of use this compound as carbon source. Furthermore, the successful overexpression of
genes involved on lipid biosynthesis of L. starkeyi brings up the possibility of
manipulation and regulation of lipid metabolism of non-model oleaginous yeast, building
up an emergent biotechnological field with many promising applications. The application
of metabolic engineering to lipid biosynthesis is promising and opens the path for
microbial oil overproduction and cost-effective biofuel manufacturing.

155
7. SUGESTIONS TO FUTURE WORK
- Mass balance of pretreatment of sugarcane bagasse;
- Production of HH in large scale.
- Evaluating the concentration of HH in order to obtain high concentration of
fermentable sugars for lipid production;
- Evaluating the fermentation of HH with no or minimal supplementation of salts in
order to reduce the cost of lipid production;
- Evaluating the use of other nitrogen sources to supplementation of HH;
- Establishing processes of high cell density in fed-batch mode to promote the
complete consumption of substrates and inhibitors and the increase of lipid
accumulation from HH; and the tolerance of L. starkeyi to inhibitors of HH;
- Identify others genes of interest in the genome of L. starkeyi to be regulated by
metabolic engineering in order to produce desired products or improve abilities of
microorganism;
- Perform fermentations of engineered L. starkeyi in bioreactor for lipid production;
- Fermenting the engineered L. starkeyi overexpressing two genes (double OE) to
evaluate the lipid accumulation over the single OE and wild type;
- Evaluate the fatty acid profile produced by double OE strains;
- Perform fermentation of xylose by engineered L. starkeyi and evaluate the lipid
accumulation and fatty acid profile;
- Fermenting the HH by engineered L. starkeyi.

156
REFERENCES
ABBOTT, E.; IANIRI, G.; CASTORIA, R.; IDNURM, A. Overcoming recalcitrant transformation and gene manipulation in Pucciniomycotina yeasts. Applied Microbiology and Biotechnology, v. 97, n. 1, p. 283-295, 2013/01/01 2013.
AGEITOS, J.; VALLEJO, J.; VEIGA-CRESPO, P.; VILLA, T. Oily yeasts as oleaginous
cell factories. Applied Microbiology and Biotechnology, v. 90, n. 4, p. 1219 - 1227,
2011.
AGUILAR, R. R., J. A.; GARROTE, G.; VÁZQUEZ, M. Kinetic study of the acid hydrolysis of sugar cane bagasse. Journal of Food Engineering, v. 55, p. 309-318,
2002.
ALMEIDA, J. R. M.; MODIG, T.; PETERSSON, A.; HÄHN-HÄGERDAL, B.; LIDÉN, G.; GORWA-GRAUSLUND, M. F. Increased tolerance and conversion of inhibitors in lignocellulosic hydrolysates by Saccharomyces cerevisiae. Journal of Chemical Technology & Biotechnology, v. 82, n. 4, p. 340-349, 2007.
ANSCHAU, A.; XAVIER, M. C.; HERNALSTEENS, S.; FRANCO, T. T. Effect of feeding strategies on lipid production by Lipomyces starkeyi. Bioresource Technology, v. 157, p. 214-22, Apr. 2014.
ANGERBAUER, C.; SIEBENHOFER, M.; MITTELBACH, M.; GUEBITZ, G. M. Conversion of sewage sludge into lipids by Lipomyces starkeyi for biodiesel production. Bioresource Technology, v. 99, n. 8, p. 3051-6, May 2008.
ARISTIZABAL, R. V. S. Produção de leveduras oleaginosas em meio de cultura contendo hidrolisao de bagaço de cana-de-açúcar. Departamento de Processos Químicos, Universidade Estadual de Campinas, 2013. Dissertação (Mestrado).
AZAD, A. K., YOUSUF, A., FERDOUSH, A., HASAN, M.M., KARIM, M.R., JAHAN, A. Production of Microbial Lipids from Rice Straw Hydrolysates by Lipomyces starkeyi for Biodiesel Synthesis. Journal of Microbial & Biochemical Technology, v. s8, n. 01, 2014.
BALAN, V. Current challenges in commercially producing biofuels from lignocellulosic biomass. ISRN Biotechnology, v. 2014, p. 463074, 2014.
BENSAH, E.; MENSAH, M. Chemical Pretreatment Methods for the Production of Cellulosic Ethanol: Technologies and Innovations. International Journal of Chemical Engineering, v. 2013, p. 1-21, 2013.
BEOPOULOS, A.; CESCUT, J.; HADDOUCHE, R.; URIBELARREA, J. L.; MOLINA-JOUVE, C.; NICAUD, J. M. Yarrowia lipolytica as a model for bio-oil production. Progress in Lipid Resource, v. 48, n. 6, p. 375-87, Nov 2009.

157
BEOPOULOS, A.; CHARDOT, T.; NICAUD, J. M. Yarrowia lipolytica: A model and a tool to understand the mechanisms implicated in lipid accumulation. Biochimie, v. 91, n. 6, p. 692-6, Jun 2009a.
BEOPOULOS, A.; HADDOUCHE, R.; KABRAN, P.; DULERMO, T.; CHARDOT, T.; NICAUD, J. M. Identification and characterization of DGA2, an acyltransferase of the DGAT1 acyl-CoA:diacylglycerol acyltransferase family in the oleaginous yeast Yarrowia lipolytica. New insights into the storage lipid metabolism of oleaginous yeasts. Applied Microbiology and Biotechnology, v. 93, n. 4, p. 1523-37, Feb 2012.
BEOPOULOS, A.; VERBEKE, J.; BORDES, F.; GUICHERD, M.; BRESSY, M.; MARTY, A.; NICAUD, J.-M. Metabolic engineering for ricinoleic acid production in the oleaginous yeast Yarrowia lipolytica. Applied Microbiology and Biotechnology, v. 98, n. 1, p. 251-262, 2014.
BEUKES, N.; PLETSCHKE, B. I. Effect of lime pre-treatment on the synergistic hydrolysis of sugarcane bagasse by hemicellulases. Bioresource Technology, v. 101, n. 12, p. 4472-8, Jun 2010.
BLAZECK, J.; HILL, A.; LIU, L.; KNIGHT, R.; MILLER, J.; PAN, A.; OTOUPAL, P.; ALPER, H. S. Harnessing Yarrowia lipolytica lipogenesis to create a platform for lipid and biofuel production. Nature Communications, v. 5, p. 3131, 2014.
BONTURI, N.; MATSAKAS, L.; NILSSON, R.; CHRISTAKOPOULOS, P.; MIRANDA, E.; BERGLUND, K.; ROVA, U. Single Cell Oil Producing Yeasts Lipomyces starkeyi and Rhodosporidium toruloides: Selection of Extraction Strategies and Biodiesel Property Prediction. Energies, v. 8, n. 6, p. 5040-5052, 2015.
BOZAQUEL-MORAIS, B. L.; MADEIRA, J. B.; MAYA-MONTEIRO, C. M.; MASUDA, C. A.; MONTERO-LOMELI, M. A New Fluorescence-Based Method Identifies Protein Phosphatases Regulating Lipid Droplet Metabolism. Plos One, v. 5, n. 10, p. e13692,
2010.
BRANCO, R. F.; SANTOS, J. C.; SILVA, S. S. A novel use for sugarcane bagasse hemicellulosic fraction: Xylitol enzymatic production. Biomass Bioenergy, v. 35, n. 7, p.
3241-3246, 2011.
CALVEY, C. H.; WILLIS, L. B.; JEFFRIES, T. W. An optimized transformation protocol for Lipomyces starkeyi. Current Genetics, v. 60, n. 3, p. 223-30, Aug 2014.
CANILHA, L. C., W.; FELIPE, M.A.; SILVA, J.B.A. Xylitol production from wheat straw hemicellulosic hydrolysate: hydrolysate detoxification and carbon source used for inoculum preparation. Journal of Microbiology, v. 39, p. 333-336, 2008.
CANILHA, L.; CARVALHO, W.; FELIPE, M.; SILVA, J. B.; GIULIETTI, M. Ethanol production from sugarcane bagasse hydrolysate using Pichia stipitis. Applied Biochemistry Biotechnology, v. 161, n. 1-8, p. 84-92, May 2010.

158
CANILHA, L.; KUMAR CHANDEL, A.; DOS SANTOS MILESSI, T. S.; FERNANDES ANTUNES, F. A.; DA COSTA FREITAS, W. L.; DAS GRACAS ALMEIDA FELIPE, M.; DA SILVA, S. S. Bioconversion of sugarcane biomass into ethanol: an overview about composition, pretreatment methods, detoxification of hydrolysates, enzymatic saccharification, and ethanol fermentation. Journal of Biomedicine and Biotechnology, v. 2012, p. 989572, 2012.
CANILHA, L.; MILAGRES, A. M.; SILVA, S. S.; SILVA, J. B. A.; FELIPE, M. G. A.; ROCHA, G. J. M.; FERRAZ, A.; CARVALHO, W. Sacarificação da biomassa lignocelulósica através de pré-hidrólise ácida seguida por hidrólise enzimática_ uma estratégia de “desconstrução” da fibra vegetal. Revista Analytica, v. 44, 2009.
CANILHA, L.; RODRIGUES, R. D. C. L. B.; ANTUNES, F. A. F.; CHANDEL, A. K.; MILESSI, T. S. D. S.; FELIPE, M. D. G. A.; SILVA, S. S. D. Bioconversion of Hemicellulose from Sugarcane Biomass Into Sustainable Products. In: EKINCI, D. (Ed.). Biochemistry, Genetics and Molecular Biology: InTech. chapter. 2, p.15-44. ISBN
978-953-51-1119-1., 2013
CANILHA, L.; SANTOS, V. T.; ROCHA, G. J.; ALMEIDA E SILVA, J. B.; GIULIETTI, M.; SILVA, S. S.; FELIPE, M. G.; FERRAZ, A.; MILAGRES, A. M.; CARVALHO, W. A study on the pretreatment of a sugarcane bagasse sample with dilute sulfuric acid. Journal of Industrial Microbiology and Biotechnology, v. 38, n. 9, p. 1467-75, Sep 2011.
CAO, Y.; LIU, W.; XU, X.; ZHANG, H.; WANG, J.; XIAN, M. Production of free monounsaturated fatty acids by metabolically engineered Escherichia coli. Biotechnology for biofuels, v. 7, p. 59-59, 2014.
CARVALHEIRO, F. D., L.C.; GÍRIO, F.M. Hemicellulose biorefineries a review on biomass pretreatments. Journal of Scientific & Industrial Research, v. 67, p. 849-864,
2008.
CAVKA, A.; JONSSON, L. J. Detoxification of lignocellulosic hydrolysates using sodium borohydride. Bioresource Technology, v. 136, p. 368-76, May 2013.
CHANDEL, A. K., KAPOOR, R.K.; SINGH, A.; KUHAD, R.C. Detoxification of sugarcane bagasse hydrolysate improves ethanol production by Candida shehatae NCIM 3501. Bioresource Technology, v. 98, n. 10, p. 1947-1950, Jul 2007.
CHANDEL, A. K. S., O.V.; RAO, L.V. Biotechnological Applications of Hemicellulosic derived sugars:state-of-the-art. Sustainable Biotechnology, p. 63-81, 2010.
CHANDEL, A. K.; SILVA, S.S.; SINGH, O.V. Detoxification of Lignocellulosic Hydrolysates for improved bioethanol production. Biofuel production-Recent developments and prospects. InTech, 2011. cap. 10, p. 225-246, 2011.
CHANDEL, A. K.; ANTUNES, F. A.; SILVA, M. B.; SILVA, S. S. Unraveling the structure of sugarcane bagasse after soaking in concentrated aqueous ammonia (SCAA) and ethanol production by Scheffersomyces (Pichia) stipitis. Biotechnology for Biofuels, v.
6, p. 102, 2013.

159
CHANDEL, A. K.; SILVA, S. S.; CARVALHO, W.; SINGH, O. V. Sugarcane bagasse and leaves: foreseeable biomass of biofuel and bio-products. Journal of Chemical Technology & Biotechnology, v. 87, n. 1, p. 11-20, 2012.
CHANDEL, A. K.; SINGH, O. V.; RAO, L.V. Biotechnological Applications of Hemicellulosic Derived Sugars: State-of-the-Art. Sustainable Biotechnology., p. 63-81,
2010.
CHEN, W. H.; YE, S. C.; SHEEN, H. K. Hydrolysis characteristics of sugarcane bagasse pretreated by dilute acid solution in a microwave irradiation environment. Applied Energy, v. 93, p. 237-244, 2012.
CHEN, X. F.; HUANG, C.; XIONG, L.; CHEN, X. D.; MA, L. L. Microbial oil production from corncob acid hydrolysate by Trichosporon cutaneum. Biotechnology Letters, v.
34, n. 6, p. 1025-8, 2012a.
CHEN, X.; LI, Z.; ZHANG, X.; HU, F.; RYU, D. D.; BAO, J. Screening of oleaginous yeast strains tolerant to lignocellulose degradation compounds. Applied Biochemistry and Biotechnology, v. 159, n. 3, p. 591-604, 2009.
CHENG, K. K.; CAI, B.-Y.; ZHANG, J.-A.; LING, H.-Z.; ZHOU, Y.-J.; GE, J.-P.; XU, J.-M. Sugarcane bagasse hemicellulose hydrolysate for ethanol production by acid recovery process. Biochemical Engineering Journal, v. 38, n. 1, p. 105-109, 2008.
CHENG, R.; MA, R.; LI, K.; RONG, H.; LIN, X.; WANG, Z.; YANG, S.; MA, Y. Agrobacterium tumefaciens mediated transformation of marine microalgae Schizochytrium. Microbiological Research, v. 167, n. 3, p. 179-186, 2012.
CHRISTOPHE, G.; DEO, J. L.; KUMAR, V.; NOUAILLE, R.; FONTANILLE, P.; LARROCHE, C. Production of oils from acetic acid by the oleaginous yeast Cryptococcus curvatus. Applied Biochemistry and Biotechnology, v. 167, n. 5, p.
1270-9, Jul 2012. CHRISTOPHE, G.; KUMAR, V.; NOUAILLE, R.; GAUDET, G.; FONTANILLE, P.; PANDEY, A.; SOCCOL, C. R.; LARROCHE, C. Recent Developments in Microbial Oils Production: a Possible Alternative to Vegetable Oils for Biodiesel Without Competition with Human Food? Brazilian Archives of Biology and Technology, v. 55, n. 1, p. 29-
46, Jan-Feb 2012a.
CORADINI, A. L. V. “Domesticação genética da levedura oleaginosa Lipomyces
starkeyi e estudoda expressão de genes ligados ao metabolismo de xilose e lipídeos durante fermentaçãi em frascos agitados”. Departamento de Processos Químicos, Universidade Estadual de Campinas, 2014. Dissertação (Mestrado).
DAI, Z.; DENG, S.; CULLEY, D. E.; BRUNOO, K. S.; MAGNUSON, J. K. Agrobacterium tumefaciens-mediated transformation of the oleaginous yeast genus Lipomyces. Symposium on Biotechnology for Fuels and Chemicals. San Diego 2015.

160
DANTAS, G. A.; LEGEY, L. F. L.; MAZZONE, A. Energy from sugarcane bagasse in Brazil: An assessment of the productivity and cost of different technological routes. Renewable and Sustainable Energy Reviews, v. 21, p. 356-364, 2013.
DIEDERICKS, D.; VAN RENSBURG, E.; GORGENS, J. F. Fractionation of sugarcane bagasse using a combined process of dilute acid and ionic liquid treatments. Applied Biochemistry and Biotechnology, v. 167, n. 7, p. 1921-37, Aug 2012.
EASTERLING, E. R.; FRENCH, W. T.; HERNANDEZ, R.; LICHA, M. The effect of glycerol as a sole and secondary substrate on the growth and fatty acid composition of Rhodotorula glutinis. Bioresource Technology, v. 100, n. 1, p. 356-61, Jan 2009.
EGGLESTON, G.; LIMA, I. Sustainability Issues and Opportunities in the Sugar and Sugar-Bioproduct Industries. Sustainability, v. 7, n. 9, p. 12209-12235, 2015.
EVANS, T. C.; RATLEDGE, C. Induction of xylulose-5-phosphate phosphoketolase in a variety of yeast grown on D-xylose: the key to efficient metabolism. Archives of Microbiology, v. 139, p. 48-52, 1984.
FEI,Q.; CHANG, H.N.; SHANG, L.; CHOI, J.D.R.; KIM, N.; KANG, J. The effect of volatile fatty acids as a sole carbon source on lipid accumulation by Cryptococcus albidus for biodiesel production. Bioresource Technology, 2011; 102:2695–701. FEOFILOVA, E. P.; SERGEEVA, Y. E.; IVASHECHKIN, A. A. Biodiesel-fuel: Content, production, producers, contemporary biotechnology (Review). Applied Biochemistry and Microbiology, v. 46, n. 4, p. 369-378, 2010.
FITZPATRICK, M.; CHAMPAGNE, P.; CUNNINGHAM, M. F.; WHITNEY, R. A. A biorefinery processing perspective: treatment of lignocellulosic materials for the production of value-added products. Bioresource Technology, v. 101, n. 23, p. 8915-22, Dec 2010.
FONTANILLE, P.; KUMAR, V.; CHRISTOPHE, G.; NOUAILLE, R.; LARROCHE, C. Bioconversion of volatile fatty acids into lipids by the oleaginous yeast Yarrowia lipolytica. Bioresource Technology, v. 114, p. 443-449, 2012.
FRANDEN, M. A. T., T.; KNOSHAUG, E.P.; DOWE, N.; BECKHAM, G.T.; LINGER, J.G. Enhancing lipid production of Lipomyces starkeyi for the upgrading of C6 sugars from lignocellulosic biomass. Annual Meeting and Exhibition- Society for Industrial Microbiology & Biotechnology, 2015. Philadelphia-PA.
FRANDSEN, R. J. N. A guide to binary vectors and strategies for targeted genome modification in fungi using Agrobacterium tumefaciens-mediated transformation. Journal of Microbiological Methods, v. 87, n. 3, p. 247-262, 2011.
FURLAN, F. F. F., R.T.; PINTO, F.H.P.B;COSTA, C.B.B.; CRUZ, A.J.G.; GIORDANO, R.L.C.; GIORDANO, R.C. Bioelectricity versus bioethanol from sugarcane bagasse. Biotechnology for Biofuels, v. 6, n. 142, 2013.

161
GALAFASSI, S.; CUCCHETTI, D.; PIZZA, F.; FRANZOSI, G.; BIANCHI, D.; COMPAGNO, C. Lipid production for second generation biodiesel by the oleaginous yeast Rhodotorula graminis. Bioresource Technology, v. 111, p. 398-403, May 2012.
GANUZA, E.; IZQUIERDO, M. S. Lipid accumulation in Schizochytrium G13/2S produced in continuous culture. Applied Microbiology and Biotechnology, v. 76, n. 5,
p. 985-990, 2007.
GAO, Q.; CUI, Z.; ZHANG, J.; BAO, J. Lipid fermentation of corncob residues hydrolysate by oleaginous yeast Trichosporon cutaneum. Bioresource Technology, v.
152, p. 552-6, 2014.
GARZÓN, C. S. L. Produção microbiana de lipídios. Desenvolvimento de processos químicos, Universidade Estadual de Campinas, 2009. Dissertação (Mestrado).
GE, J. P. C., B.Y.; LIU, G.M.; LING, H.Z.; FANG, B.Z.; SONG, G.; YANG, X.F.; PING, W.X. Comparison of different detoxification methods for corn cob hemicellulose to improve ethanol production by Candida shehatae ACCC20335. American Journal of Microbiology Research, v. 5, n. 10, p. 1163-1168, 2011.
GIETZ, D. R.; WOODS, R. A. Transformation of yeast by lithium acetate/single-stranded carrier DNA/polyethylene glycol method. In: CHRISTINE, G. e GERALD, R. F. (Ed.). Methods in Enzymology: Academic Press, v.Volume 350, 2002. p.87-96. ISBN 0076-
6879.
GIRIO, F. M.; FONSECA, C.; CARVALHEIRO, F.; DUARTE, L. C.; MARQUES, S.; BOGEL-LUKASIK, R. Hemicelluloses for fuel ethanol: A review. Bioresource Technology, v. 101, n. 13, p. 4775-800, Jul 2010.
GONG, Z.; WANG, Q.; SHEN, H.; HU, C.; JIN, G.; ZHAO, Z. K. Co-fermentation of cellobiose and xylose by Lipomyces starkeyi for lipid production. Bioresource Technology, v. 117, p. 20-24, 2012.
GOUVEIA, E. R. N., R.T.; SOUTO-MAIOR, A.M. Validação de metodologia para a caracterização química de bagaço de cana-de-açúcar. Química Nova, v. 32, n. 6, p. 1500-1503, 2009.
GROOT, M. J. A.; BUNDOCK, P.; HOOYKAAS, P. J. J.; BEIJERSBERGEN, A. G. M. Agrobacterium tumefaciens-mediated transformation of filamentous fungi. Nature Biotechnology, v. 16, n. 9, p. 839-842, 1998.
HADDOUCHE, R.; POIRIER, Y.; DELESSERT, S.; SABIROVA, J.; PAGOT, Y.; NEUVÉGLISE, C.; NICAUD, J.-M. Engineering polyhydroxyalkanoate content and monomer composition in the oleaginous yeast Yarrowia lipolytica by modifying the ß-oxidation multifunctional protein. Applied Microbiology and Biotechnology, v. 91, n. 5, p. 1327-1340, 2011.

162
HARRINGTON, B. J.; HAGEAGE, G. J. Calcofluor White: A Review of its Uses and Applications in Clinical Mycology and Parasitology. Laboratory Medicine Journal, v. 34, n. 5, p. 361-367, May 1, 2003 2003.
HU, C.; ZHAO, X.; ZHAO, J.; WU, S.; ZHAO, Z. K. Effects of biomass hydrolysis by-products on oleaginous yeast Rhodosporidium toruloides. Bioresource Technology, v.
100, n. 20, p. 4843-7, 2009.
HUANG, C.; CHEN, X.-F.; XIONG, L.; CHEN, X.-D.; MA, L.-L. Oil production by the yeast Trichosporon dermatis cultured in enzymatic hydrolysates of corncobs. Bioresource Technology, v. 110, n. 0, p. 711-714, 2012.
HUANG, C.; WU, H.; LI, R. F.; ZONG, M. H. Improving lipid production from bagasse hydrolysate with Trichosporon fermentans by response surface methodology. New Biotechnology, v. 29, n. 3, p. 372-8, Feb 15 2012a.
HUANG, C.; WU, H.; LIU, Z. J.; CAI, J.; LOU, W. Y.; ZONG, M. H. Effect of organic acids on the growth and lipid accumulation of oleaginous yeast Trichosporon fermentans. Biotechnology for Biofuels, v. 5, p. 4, 2012b.
HUANG, C.; ZONG, M. H.; WU, H.; LIU, Q. P. Microbial oil production from rice straw hydrolysate by Trichosporon fermentans. Bioresource Technology, v. 100, n. 19, p. 4535-8, 2009.
JONG, E.; JUNGMEIER, G. Biorefinery Concepts in Comparison to Petrochemical Refineries. Industrial Biorefineries and White Biotechnology, Chapter 1, p. 3-33, 2015.
JONSSON, L.; ALRIKSSON, B.; NILVEBRANT, N.-O. Bioconversion of lignocellulose: inhibitors and detoxification. Biotechnology for Biofuels, v. 6, n. 1, p. 16, 2013.
KAHR, H., HELMBERGER, S., JÄGER, A.G. Yeast adaptation on the substrate straw. World Renewable Energy Congress. Linköping, Sweden: Bioenergy Technology, p. 492-499, 2011.
KAMM, B.; KAMM, M. Principles of biorefineries. Applied Microbiology Biotechnology, v. 64, p. 137-145, 2004.
KANG, Q.; APPELS, L.; TAN, T.; DEWIL, R. Bioethanol from lignocellulosic biomass: current findings determine research priorities. Scientific World Journal, v. 2014, p.
298153, 2014.
KARMEE, S.; PATRIA, R.; LIN, C. Techno-Economic Evaluation of Biodiesel Production from Waste Cooking Oil-A Case Study of Hong Kong. International Journal of Molecular Sciences, v. 16, n. 3, p. 4362-4371, 2015.
KAWAI, S.; HASHIMOTO, W.; MURATA, K. Transformation of Saccharomyces cerevisiae and other fungi: Methods and possible underlying mechanism. Bioengineered Bugs Journal, v. 1, n. 6, p. 395-403, Nov-Dec 2010.

163
KITCHA, S.; CHEIRSILP, B. Screening of Oleaginous Yeasts and Optimization for Lipid Production Using Crude Glycerol as a Carbon Source. Energy Procedia, v. 9, p. 274-282, 2011.
KNOTHE, G. Improving biodiesel fuel properties by modifying fatty ester composition. Energy & Environmental Science, v. 2, n. 7, p. 759, 2009.
KOH, C. M. J.; LIU, Y.; MOEHNINISI;; DU, M.; JI, L. Molecular characterization of KU70 and KU80 homologues and exploitation of a KU70-deficient mutant for improving gene deletion frequencey in Rhodosporidium toruloides. BMC Microbiology, v. 14, n. 50,
2014.
KOOTSTRA, A. M. J.; BEEFTINK, H. H.; SCOTT, E. L.; SANDERS, J. P. M. Comparison of dilute mineral and organic acid pretreatment for enzymatic hydrolysis of wheat straw. Biochemistry Engineering Journal, v. 46, n. 2, p. 126-131, 2009.
LAOPAIBOON, P.; THANI, A.; LEELAVATCHARAMAS, V.; LAOPAIBOON, L. Acid hydrolysis of sugarcane bagasse for lactic acid production. Bioresource Technology,
v. 101, n. 3, p. 1036-43, Feb 2010.
LANGAN, P. P., L.; O’NEILL, H.M.; PINGALI. S.V.; FOSTON, M. N., Y.; SCHULZ, R.; LINDNER,B.; HANSON, B. L.; HARTON,S.; HELLER, W. T. ; URBAN, V.; EVANS; B. R.; GNANAKARAN, S.; RAGAUSKAS, A.J.; JEREMY, C.S. AND; DAVISON, B. H. Common processes drive the thermochemical pretreatment of lignocellulosic biomass. Green chemistry, 2014.
LEE, J. W. J., T. Efficiencies of acid catalysts in the hydrolysis of lignocellulosic biomass over a range of combined severity factors. Bioresource Technology, v. 102, p. 5884-5890, 2011.
LEIVA-CANDIA, D. E.; TSAKONA, S.; KOPSAHELIS, N.; GARCIA, I. L.; PAPANIKOLAOU, S.; DORADO, M. P.; KOUTINAS, A. A. Biorefining of by-product streams from sunflower-based biodiesel production plants for integrated synthesis of microbial oil and value-added co-products. Bioresource Technology, v. 190, p. 57-65, 2015.
LENIHAN, P.; OROZCO, A.; O’NEILL, E.; AHMAD, M. N. M.; ROONEY, D. W.; WALKER, G. M. Dilute acid hydrolysis of lignocellulosic biomass. Chemical Engineering Journal, v. 156, n. 2, p. 395-403, 2010.
LEWIS, T.; NICHOLS, P. D.; MCMEEKIN, T. A. Evaluation of extraction methods for recovery of fatty acids from lipid producing microheterotrophs. Journal of Microbiology Methods, v. 43, n. 2, p. 107-116, Dec 2000.
LI, M.; LIU, G.-L.; CHI, Z.; CHI, Z.-M. Single cell oil production from hydrolysate of cassava starch by marine-derived yeast Rhodotorula mucilaginosa TJY15a. Biomass and Bioenergy, v. 34, n. 1, p. 101-107, 2010.

164
LI, Q.; METTHEW LAM, L. K.; XUN, L. Biochemical characterization of ethanol-dependent reduction of furfural by alcohol dehydrogenases. Biodegradation, v. 22, n. 6, p. 1227-37, Nov 2011.
LIANG, M. H. J., J. G. Advancing oleaginous microorganisms to produce lipid via metabolic engineering technology. Progress in Lipid Research, v. 52, n. 4, p. 395-408,
2013.
LIANG, Y.; PEREZ, I.; GOETZELMANN, K.; TRUPIA, S. Microbial lipid production from pretreated and hydrolyzed corn fiber. Biotechnology Progress, v. 30, n. 4, p. 945-51,
2014.
LIANG, Y.; TANG, T.; UMAGILIYAGE, A. L.; SIDDARAMU, T.; MCCARROLL, M.; CHOUDHARY, R. Utilization of sorghum bagasse hydrolysates for producing microbial lipids. Applied Energy, v. 91, n. 1, p. 451-458, 2012.
LIMAYEM, A.; RICKE, S. C. Lignocellulosic biomass for bioethanol production: Current perspectives, potential issues and future prospects. Progress in Energy and Combustion Science, v. 38, n. 4, p. 449-467, 2012.
LIN, X.; WANG, Y.; ZHANG, S.; ZHU, Z.; ZHOU, Y. J.; YANG, F.; SUN, W.; WANG, X.; ZHAO, Z. K. Functional integration of multiple genes into the genome of the oleaginous yeast Rhodosporidium toruloides. FEMS Yeast Research, v. 14, n. 4, p. 547-555,
2014.
LIU, J. X.; YUE, Q. Y.; GAO, B. Y.; MA, Z. H.; ZHANG, P. D. Microbial treatment of the monosodium glutamate wastewater by Lipomyces starkeyi to produce microbial lipid. Bioresource Technology, v. 106, p. 69-73, 2012.
LIU, L.; PAN, A.; SPOFFORD, C.; ZHOU, N.; ALPER, H. S. An evolutionary metabolic engineering approach for enhancing lipogenesis in Yarrowia lipolytica. Metabolic engineering, v. 29, p. 36-45, 2015.
LIU, Y.; WANG, Y.; LIU, H.; ZHANG, J. A. Enhanced lipid production with undetoxified corncob hydrolysate by Rhodotorula glutinis using a high cell density culture strategy. Bioresource Technology, v. 180, p. 32-39, 2015a.
LIU, Z. J., LIU, L.P., WEN, P. LI, N., ZONG, M.H., WU, H. Effects of acetic acid and pH on growth and lipid accumulation of the oleaginous yeast Trichosporon fermentans. Bioresources Journal, v. 10, n. 3, p. 4152-4166, 2015b.
LÕOKE, M.; KRISTJUHAN, K.; KRISTJUHAN, A. Extraction of genomic DNA from yeasts for PCR-based applications. BioTechniques, v. 50, n. 5, p. 325-328, 2011.
MALCATA, F. X. Microalgae and biofuels: A promising partnership? Trends in Biotechnology, v. 29, n. 11, p. 542-549, 2011.
MAST, B.; ZÖHRENS, N.; SCHMIDL, F.; HERNANDEZ, R.; FRENCH, W. T.; MERKT, N.; CLAUPEIN, W.; GRAEFF-HÖNNINGER, S. Lipid Production for Microbial Biodiesel by the Oleagenious Yeast Rhodotorula glutinis Using Hydrolysates of Wheat Straw and

165
Miscanthus as Carbon Sources. Waste and Biomass Valorization, v. 5, n. 6, p. 955-
962, 2014.
MATOS, I.; CASSA-BARBOSA, L. A.; NETO, P. Q. C.; ASTOLFI, S. Cultivation of Trichosporon mycotoxinivorans in sugarcane bagasse hemicellulosic hydrolysate. Electronic Journal of Biotechnology, v. 15, n. 1, Jan 2012.
MATSAKAS, L. S., A.A.; ROVA, U; CHRISTAKOPOULOS, P. Use of dried sweet sorghum for the efficient production of lipids by yeast Lipomyces starkeyi CBS 1807. Industrial Crops and Products, v. 62, p. 367-372, 2014.
MENG, X.; YANG, J.; XU, X.; ZHANG, L.; NIE, Q.; XIAN, M. Biodiesel production from oleaginous microorganisms. Renewable Energy, v. 34, n. 1, p. 1-5, 2009.
MUNIZ, C. R.; DA SILVA, G. F.; SOUZA, M. T., JR.; FREIRE, F. C.; KEMA, G. H.; GUEDES, M. I. Agrobacterium tumefaciens-mediated transformation of Lasiodiplodia theobromae, the causal agent of gummosis in cashew nut plants. Genetics and Molecular Research, v. 13, n. 2, p. 2906-13, 2014.
NIJLAND, J. G. S., H.Y.; JONG, R.M.; WALL, P.P.; KLAASSEN, P.; DRIESSEN, A.J.M. Engineering of an endogenous hexose transporter into a speficif D-xylose transporter facilitates. Biotechnology for biofuels, v. 7, n. 168, 2014.
NILSSON, A.; GORWA-GRAUSLUND, M. F.; HAHN-HAGERDAL, B.; LIDEN, G. Cofactor dependence in furan reduction by Saccharomyces cerevisiae in fermentation of acid-hydrolyzed lignocellulose. Applied Environmental Microbiology, v. 71, n. 12, p. 7866-71, Dec 2005.
PAIVA, E. J. M., I. R.; SCAMPARINI, R.P. Xylose production from sugarcane bagasse by surface response methodology. Revista Brasileira de Engenharia Agrícola e Ambiental, v. 13, p. 75-80, 2009.
PALMQVIST, E. H.-H., B. Fermentation of lignocellulosic hydrolysates. I inhibition and detoxification. Bioresource Technology, v. 74, p. 17-24, 2000.
PAN, L. X. Y., D.F.; SHAO, L.; CHEN, G.G.; LIANG, Z.Q. Isolation of the Oleaginous Yeasts from the Soil and studies of their lipid-producing capacities. Food Technology and Biotechnology, v. 47, p. 215-220, 2009.
PANAGIOTOPOULOS, I. A.; BAKKER, R. R.; DE VRIJE, T.; KOUKIOS, E. G. Effect of pretreatment severity on the conversion of barley straw to fermentable substrates and the release of inhibitory compounds. Bioresource Technology, v. 102, n. 24, p. 11204-
11, Dec 2011.
PAPANIKOLAOU S.; AGGELIS G. Lipid production by Yarrowia lipolytica growing on industrial glycerol in a single-stage continuous culture. Bioresource Technology, v. 82, p. 43-49, 2002.

166
PAPANIKOLAOU, I. C. M. K. S. Single cell oil production by Yarrowia lipolytica growing on an industrial derivative of animal fat in batch cultures. Applied Microbiology and Biotechnology, v. 58, n. 3, p. 308-312, 2002.
PAPANIKOLAOU, S.; AGGELIS, G. Lipids of oleaginous yeasts. Part II: Technology and potential applications. European Journal of Lipid Science and Technology, v. 113, n.
8, p. 1052-1073, 2011a.
PAPANIKOLAOU, S.; AGGELIS, G. Lipids of oleaginous yeasts. Part I: Biochemistry of single cell oil production. European Journal of Lipid Science and Technology, v. 113,
n. 8, p. 1031-1051, 2011.
PARAWIRA, W., TEKERE, M. Biotechnological strategies to overcome inhibitors in lignocellulose hydrolysates for ethanol production: review. Crit Rev Biotechnol, v. 31,
n. 1, p. 20-31, Mar 2011.
PARK, S. Y.; JEONG, M. H.; WANG, H. Y.; KIM, J. A.; KI, S.; CHEONG, W. H.; KANG, S.; LEE, Y. H.; HUR, J. S. Agrobacterium tumefaciens-Mediated Transformation of the Lichen Fungus, Umbilicaria muehlenbergii. Plos One, v. 8, n. 12, 2013.
PHAM, T.; KAWAI, S.; MURATA, K. Visualization of the synergistic effect of lithium acetate and single-stranded carrier DNA on Saccharomyces cerevisiae transformation. Current Genetics, v. 57, n. 4, p. 233-239, 2011/08/01 2011.
PROBST, K. V. Single cell oil production using Lipomyces starkeyi: fermentation. Department of Grain Science and Industry, Kansas State University, 2014. Thesis (Doctorate).
QIAO, K.; ABIDI, S. H. I.; LIU, H.; ZHANG, H.; CHAKRABORTY, S.; WATSON, N.; KUMARAN AJIKUMAR, P.; STEPHANOPOULOS, G. Engineering lipid overproduction in the oleaginous yeast Yarrowia lipolytica. Metabolic Engineering, v. 29, p. 56-65,
2015.
RABELO, S. C.; VAZ ROSSELL, C. E.; DE MORAES ROCHA, G. J.; ZACCHI, G. Enhancement of the enzymatic digestibility of sugarcane bagasse by steam pretreatment impregnated with hydrogen peroxide. Biotechnology Progress, v. 28, n.
5, p. 1207-1217, 2012.
RADULOVIC, M.; KNITTELFELDER, O.; CRISTOBAL-SARRAMIAN, A.; KOLB, D.; WOLINSKI, H.; KOHLWEIN, S. D. The emergence of lipid droplets in yeast: current status and experimental approaches. Current Genetics, v. 59, n. 4, p. 231-242, 2013.
RAKICKA, M.; LAZAR, Z.; DULERMO, T.; FICKERS, P.; NICAUD, J. M. Lipid production by the oleaginous yeast Yarrowia lipolytica using industrial by-products under different culture conditions. Biotechnology for Biofuels, v. 8, p. 104, 2015.
RATLEDGE, C . Microbial oils: an introductory overview of current status and future prospects. Oilseeds & fats Crops and Lipids, v. 20, n. 6, p. D602, 2013.

167
RATLEDGE, C. Fatty acid biosynthesis in microorganisms being used for Single Cell Oil production. Biochimie, v. 86, n. 11, p. 807-815, 2004.
RATLEDGE,C.; WYNN, J. The biochemistry and molecular biology of lipid accumulation in oleaginous microorganisms. Advances in Applied Microbiology, v. 51, p. 1-51, 2002.
REIS, E. M. Transesterificação in situ via etanólise do óleo de levedura para a produção de biodiesel. Departamento de Processos Químicos, Universidade Estadual de Campinas, 2013. Dissertação (Mestrado).
ROCHA, G. J. M.; MARTIN, C.; SOARES, I. B.; SOUTO MAIOR, A. M.; BAUDEL, H. M.; MORAES DE ABREU, C. A. Dilute mixed-acid pretreatment of sugarcane bagasse for ethanol production. Biomass and Bioenergy, v. 35, n. 1, p. 663-670, 2011.
ROSSI, M. A., A.; RAIMONDI, S.; LEONARDI, A. Getting Lipids for Biodiesel Production from Oleaginous Fungi. In: (Ed.). Biodiesel – Feedstocks and Processing Technologies. University of Modena and Reggio Emilia, p.72-92, 2011.
RUMIN, J.; BONNEFOND, H.; SAINT-JEAN, B.; ROUXEL, C.; SCIANDRA, A.; BERNARD, O.; CADORET, J. P.; BOUGARAN, G. The use of fluorescent Nile red and BODIPY for lipid measurement in microalgae. Biotechnology for Biofuels, v. 8, p. 42, 2015.
SAHA, B. C. Hemicellulose bioconversion. Journal of Industrial Microbiology and Biotechnology, v. 30, n. 5, p. 279-91, May 2003.
SALUNKE, D.; MANGLEKAR, R.; GADRE, R.; NENE, S.; HARSULKAR, A. M. Production of polyunsaturated fatty acids in recombinant Lipomyces starkeyi through submerged fermentation. Bioprocess and Biosystems Engineering, v. 38, n. 7, p. 1407-1414, 2015.
SANTAMAURO, F.; WHIFFIN, F. M.; SCOTT, R. J.; CHUCK, C. J. Low-cost lipid production by an oleaginous yeast cultured in non-sterile conditions using model waste resources. Biotechonology for Biofuels, v. 7, p. 34-34, 2014.
SANTOS, M. R. F. R. B., S.; COUTO, M.A.P.G. Iniciativas para o uso da biomassa lignocelulósica em biorrefinarias: a plataforma sucroquímica no mundo e no Brasil. Economia e energia, v. 82, p. 14-32, 2011.
SARKAR, N.; GHOSH, S. K.; BANNERJEE, S.; AIKAT, K. Bioethanol production from agricultural wastes: An overview. Renewable Energy, v. 37, n. 1, p. 19-27, 2012.
SARROUH, B. F.; DE FREITAS BRANCO, R.; DA SILVA, S. S. Biotechnological production of xylitol: enhancement of monosaccharide production by post-hydrolysis of dilute acid sugarcane hydrolysate. Applied Biochemistry and Biotechnology, v. 153, n. 1-3, p. 163-70, May 2009.

168
SAWANGKEAW, R.; NGAMPRASERTSITH, S. A review of lipid-based biomasses as feedstocks for biofuels production. Renewable and Sustainable Energy Reviews, v. 25, p. 97-108, 2013.
SHA, Q. A comparative study on four oleaginous yeasts on their lipid accumulating capacity. Department of microbiology, Institutionen för mikrobiologi,Uppsala Universitet-Sweden, 2013. Thesis (Master).
SHEN, H.; GONG, Z.; YANG, X.; JIN, G.; BAI, F.; ZHAO, Z. K. Kinetics of continuous cultivation of the oleaginous yeast Rhodosporidium toruloides. Journal of Biotechnology, v. 168, n. 1, p. 85-89, 2013.
SHENG, J.; FENG, X. Metabolic Engineering of Yeast to Produce Fatty Acid-derived Biofuels: Bottlenecks and Solutions. Frontiers in Microbiology, v. 6, 2015-June-8
2015.
SHIELDS, S.; BOOPATHY, R. Ethanol production from lignocellulosic biomass of energy cane. International Biodeterioration & Biodegradation, v. 65, n. 1, p. 142-
146, 2011.
SILVA, D. D. V., ARRUDA, P.V., DUSSÁN, K.J., FELIPE, M.G.A. Adaptation of Scheffersomyces Stipitis Cells as a Strategy to the Improvement of Ethanol Production from Sugarcane Bagasse Hemicellulosic Hydrolysate Chemical Engineering Transactions, v. 38, p. 427-432, 2014.
SITEPU, I.; JIN, M.; FERNANDEZ, J. E.; DA COSTA SOUSA, L.; BALAN, V.; BOUNDY-MILLS, K. Identification of oleaginous yeast strains able to accumulate high intracellular lipids when cultivated in alkaline pretreated corn stover. Applied Microbiology and Biotechnology, v. 98, n. 17, p. 7645-7657, 2014/09/01 2014.
SØRENSEN, L.; LYSØE, E.; LARSEN, J.; KHORSAND-JAMAL, P.; NIELSEN, K.; FRANDSEN, R. Genetic transformation of Fusarium avenaceum by Agrobacterium tumefaciens-mediated transformation and the development of a USER-Brick vector construction system. BMC Molecular Biology, v. 15, n. 1, p. 1-15, 2014/07/22 2014.
STOUTENBURG, R. M.; PERROTTA, J. A.; NAKAS, J. P. Overcoming inhibitors in a hemicellulosic hydrolysate: improving fermentability by feedstock detoxification and adaptation of Pichia stipitis. Journal of Industrial Microbiology and Biotechnology, v.
38, n. 12, p. 1939-45, 2011.
SUBRAMANIAM, R.; DUFRECHE, S.; ZAPPI, M.; BAJPAI, R. Microbial lipids from renewable resources: production and characterization. Journal of Industrial Microbiology & Biotechnology, v. 37, n. 12, p. 1271-1287, 2010.
TAHERZADEH, M. J.; KARIMI, K. Pretreatment of lignocellulosic wastes to improve ethanol and biogas production: a review. Int J Mol Sci, v. 9, n. 9, p. 1621-51, Sep 2008.

169
TAI, M. Metabolic Engineering of Oleaginous Yeast for the Production of Biofuels. Departament of Chemical Engineering, Massachusetts Institute of Technology-USA, 2012. Thesis (Doctorate).
TAI, M.; STEPHANOPOULOS, G. Engineering the push and pull of lipid biosynthesis in oleaginous yeast Yarrowia lipolytica for biofuel production. Metabolic Engineering, v.
15, p. 1-9, 2013.
TANG, X.; LEE, J.; CHEN, W. N. Engineering the fatty acid metabolic pathway in Saccharomyces cerevisiae for advanced biofuel production. Metabolic Engineering Communications, v. 2, p. 58-66, 2015.
TAPIA, E. V.; ANSCHAU, A.; CORADINI, A. L. V.; FRANCO, T. T.; DECKMANN, A. C. Optimization of lipid production by the oleaginous yeast Lipomyces starkeyi by random mutagenesis coupled to cerulenin screening. AMB Express, v. 2, n. 64, p. 1-8, 2012.
TCHAKOUTEU, S. S.; KALANTZI, O.; GARDELI, C.; KOUTINAS, A. A.; AGGELIS, G.; PAPANIKOLAOU, S. Lipid production by yeasts growing on biodiesel-derived crude glycerol: strain selection and impact of substrate concentration on the fermentation efficiency. Journal Applied Microbiology, v. 118, n. 4, p. 911-27, 2015.
THEVENIEAU, F.; NICAUD, J.-M. Microorganisms as sources of oils. Oilseeds and fats, Crops and Lipids, v. 20, n. 6, p. D603, 2013.
TSAKONA, S.; KOPSAHELIS, N.; CHATZIFRAGKOU, A.; PAPANIKOLAOU, S.; KOOKOS, I. K.; KOUTINAS, A. A. Formulation of fermentation media from flour-rich waste streams for microbial lipid production by Lipomyces starkeyi. Journal of Biotechnology, v. 189, n. 0, p. 36-45, 2014.
TSIGIE, Y. A.; WANG, C. Y.; TRUONG, C. T.; JU, Y. H. Lipid production from Yarrowia lipolytica Po1g grown in sugarcane bagasse hydrolysate. Bioresource Technology, v.
102, n. 19, p. 9216-22, 2011.
TSOUTSOS, T.; BETHANIS, D. Optimization of the Dilute Acid Hydrolyzator for Cellulose-to-Bioethanol Saccharification. Energies, v. 4, n. 12, p. 1601-1623, 2011.
UM, B.-H.; BAE, S.-H. Statistical methodology for optimizing the dilute acid hydrolysis of sugarcane bagasse. Korean Journal of Chemical Engineering, v. 28, n. 5, p. 1172-
1176, 2011/05/01 2011.
BETANCUR, G.J.V; PEREIRA, J.N. Sugar cane bagasse as feedstock for second generation ethanol production. Part I: Diluted acid pretreatment optimization. Electronic Journal of Biotechnology, v. 13, n. 3, 2010.
VERMA, D. G., P.C.; MAHESHWARI, M.K.; SHARMA, R.K. Bagasse Fiber Composites-A Review. Journal of Materials Enviromental Science, v. 3, n. 6, p. 1079-1092, 2012.
VIEIRA, A. L.; CAMILO, C. M. Agrobacterium tumefaciens-mediated transformation of the aquatic fungus Blastocladiella emersonii. Fungal Genetics and Biology, v. 48, n. 8,
p. 806-11, Aug 2011.

170
VIEIRA, J. P. F.; IENCZAK, J. L.; ROSSELL, C. E. V.; PRADELLA, J. G. C.; FRANCO, T. T. Microbial lipid production: screening with yeasts grown on Brazilian molasses. Biotechnology Letters, v. 36, n. 12, p. 2433-2442, 2014.
VIEIRA, J. P.; IENCZAK, J. L.; ROSSELL, C. E.; PRADELLA, J. G.; FRANCO, T. T. Microbial lipid production: screening with yeasts grown on Brazilian molasses. Biotechnol Letters, v. 36, n. 12, p. 2433-42, 2014.
VILELA, F. L.; DE MELLO, V. M.; REIS, V. C.; BON, E. P.; GONCALVES TORRES, F. A.; NEVES, B. C.; ELEUTHERIO, E. C. Functional expression of Burkholderia cenocepacia xylose isomerase in yeast increases ethanol production from a glucose-xylose blend. Bioresource Technology, v. 128, p. 792-6, Jan 2013.
VILLARREAL, M. L. M.; PRATA, A. M. R.; FELIPE, M. G. A.; ALMEIDA E SILVA, J. B. Detoxification procedures of eucalyptus hemicellulose hydrolysate for xylitol production by Candida guilliermondii. Enzyme and Microbial Technology, v. 40, n. 1, p. 17-24,
2006.
WANG, D.; HE, D.; LI, G.; GAO, S.; LV, H.; SHAN, Q.; WANG, L. An efficient tool for random insertional mutagenesis: Agrobacterium tumefaciens-mediated transformation of the filamentous fungus Aspergillus terreus. Journal of Microbiological Methods, v. 98, p. 114-118, 2014.
WANG, J.; ZHANG, B.; CHEN, S. Oleaginous yeast Yarrowia lipolytica mutants with a disrupted fatty acyl-CoA synthetase gene accumulate saturated fatty acid. Process Biochemistry, v. 46, n. 7, p. 1436-1441, 2011.
WANG, P.; WAN, X.; ZHANG, Y.; JIANG, M. Production of γ-linolenic acid using a novel heterologous expression system in the oleaginous yeast Lipomyces kononenkoae. Biotechnology Letters, v. 33, n. 10, p. 1993-1998, 2011a.
WEI, N.; QUARTERMAN, J.; KIM, S. R.; CATE, J. H.; JIN, Y. S. Enhanced biofuel production through coupled acetic acid and xylose consumption by engineered yeast. Nature Communications., v. 4, p. 2580, 2013.
WIEBE, M. G.; KOIVURANTA, K.; PENTTILÄ, M.; RUOHONEN, L. Lipid production in batch and fed-batch cultures of Rhodosporidium toruloides from 5 and 6 carbon carbohydrates. BMC Biotechnology, v. 12, n. 1, p. 1-10, 2012// 2012.
WILD, R. P., S.; POPOVIC, M.; ZAPPI, M.; DUFRECHE, S.; BAIPAI, R. Lipids from Lipomyces starkeyi. Food Technology and Biotechnology, v. 48, p. 329-335, 2010.
WU, S.; HU, C.; JIN, G.; ZHAO, X.; ZHAO, Z. K. Phosphate-limitation mediated lipid production by Rhodosporidium toruloides. Bioresource Technology, v. 101, n. 15, p.
6124-6129, 2010.
XIAO, Y.; RUAN, Z.; LIU, Z.; WU, S. G.; VARMAN, A. M.; LIU, Y.; TANG, Y. J. Engineering Escherichia coli to convert acetic acid to free fatty acids. Biochemical Engineering Journal, v. 76, p. 60-69, 2013.

171
XIE, D. J., E.N.; ZHU, Q. Sustainable source of omega-3 eicosapentaenoic acid from metabolically engineered Yarrowia lipolytica: from fundamental research to commercial production. Applied Microbiology and Biotechnology, v. 99, p. 1599-1610, 2015.
XIONG, L.; HUANG, C.; YANG, X. Y.; LIN, X. Q.; CHEN, X. F.; WANG, C.; WANG, B.; ZENG, X. A.; CHEN, X. D. Beneficial effect of corncob acid hydrolysate on the lipid production by oleaginous yeast Trichosporon dermatis. Preparative Biochemistry and Biotechnology, v. 45, n. 5, p. 421-9, 2015.
XUE, Z.; SHARPE, P. L.; HONG, S.-P.; YADAV, N. S.; XIE, D.; SHORT, D. R.; DAMUDE, H. G.; RUPERT, R. A.; SEIP, J. E.; WANG, J.; POLLAK, D. W.; BOSTICK, M. W.; BOSAK, M. D.; MACOOL, D. J.; HOLLERBACH, D. H.; ZHANG, H.; ARCILLA, D. M.; BLEDSOE, S. A.; CROKER, K.; MCCORD, E. F.; TYREUS, B. D.; JACKSON, E. N.; ZHU, Q. Production of omega-3 eicosapentaenoic acid by metabolic engineering of Yarrowia lipolytica. Nature Biotechnology Journal, v. 31, n. 8, p. 734-740, 2013.
YANG, X.; JIN, G.; GONG, Z.; SHEN, H.; SONG, Y.; BAI, F.; ZHAO, Z. K. Simultaneous utilization of glucose and mannose from spent yeast cell mass for lipid production by Lipomyces starkeyi. Bioresource Technology., v. 158, n. 0, p. 383-387, 2014.
YOUSUF, A. Conversion of Agro-industrial Wastes into Lipids Suitable for Biodiesel Production. Department of Chemical Engineering, Università degli Studi di Napoli Federico II-Italy, 2010. Thesis (Doctorate).
YU, X.; ZHENG, Y.; DORGAN, K. M.; CHEN, S. Oil production by oleaginous yeasts using the hydrolysate from pretreatment of wheat straw with dilute sulfuric acid. Bioresource Technology, v. 102, n. 10, p. 6134-40, 2011.
ZANCANER, M. G. S., T.B.S. Cogeração Ampliação da Oferta de Energia Elétrica com a Biomassa (Bagaço da Cana-de-Açúcar). Revista Diálogos Interdisciplinares, v. 2, n. 2, 2013.
ZHANG, L.; YOU, T.; LI, M.; XU, F. Comprehensive utilization of waste hemicelluloses during ethanol production to increase lactic acid yield: from pretreatment to fermentation. Biotechnology for Biofuels, v. 7, n. 1, p. 494, 2014.
ZHANG, S.; SKERKER, J. M.; RUTTER, C. D.; MAURER, M. J.; ARKIN, A. P.; RAO, C. V. Engineering Rhodosporidium toruloides for increased lipid production. Biotechnology Bioengineering, 2015.
ZHAO X.; PENG F.; DU W.; LIU C.; LIU D. Effects of some inhibitors on the growth and lipid accumulation of oleaginous yeast Rhodosporidium toruloides and preparation of biodiesel by enzymatic transesterification of the lipid. Bioprocess Biosystems Engineering, v. 35, n. 6, p. 993-1004, 2012.
ZHAO, X.; HU, C.; WU, S.; SHEN, H.; ZHAO, Z. K. Lipid production by Rhodosporidium toruloides Y4 using different substrate feeding strategies. Journal Industrial Microbiology and Biotechnology, v. 38, 2011, 2011.

172
ZHAO, X.; KONG, X.; HUA, Y.; FENG, B.; ZHAO, Z. Medium optimization for lipid production through co-fermentation of glucose and xylose by the oleaginous yeast Lipomyces starkeyi. European Journal of Lipid Science Technology, v. 110, n. 5, p.
405-412, 2008.
ZHOU, W.; LI, Y.; ZHANG, Y.; ZHAO, Z. Energy efficiency evaluation of lipid production by oleaginous yeast Rhodosporidium toruloides. Journal of Thermal Analysis and Calorimetry, 2011.
ZHU, J.-J.; YONG, Q.; XU, Y.; CHEN, S.-X.; YU, S.-Y. Adaptation fermentation of Pichia stipitis and combination detoxification on steam exploded lignocellulosic prehydrolysate. Natural Science, v. 01, n. 01, p. 47-54, 2009.
ZHU, Q.; JACKSON, E. N. Metabolic engineering of Yarrowia lipolytica for industrial applications. Current Opinion in Biotechnology, v. 36, p. 65-72, 2015.