statement 10: australian accounting standard no. 31 … · 2018-04-11 · 10-1 statement 10:...
TRANSCRIPT
10-1
STATEMENT 10: AUSTRALIAN ACCOUNTINGSTANDARD NO. 31 FINANCIAL STATEMENTS
This statement provides financial tables prepared on an accrual basis in accordancewith applicable Australian Accounting Standards, including Australian AccountingStandard No. 31 Financial Reporting by Governments (AAS31), except wheredepartures from the standard are identified in Note 1.
A reconciliation between the Commonwealth's general government AAS31 andGovernment Finance Statistics (GFS) revenue, expenses and operating results isprovided in Statement 8.
Australian Accounting Standard No. 31 Financial Statements ...........................10-2
Notes to the AAS31 Financial Statements.............................................................10-5
Appendix A: Additional agency statistics ..........................................................10-13

10-2
STATEMENT 10: AUSTRALIAN ACCOUNTINGSTANDARD NO. 31 FINANCIAL STATEMENTS
Table 1: Statement of financial performance for the Commonwealth generalgovernment sector — AAS31
Note2002-03 2003-04 2004-05 2005-06 2006-07
$m $m $m $m $mRevenuesTaxation
Income tax 3 128,723 134,230 141,140 149,780 159,480Indirect tax 4 27,110 27,485 27,775 28,157 28,643Fringe benefits tax 3,220 3,190 3,230 3,330 3,440Other taxes 1,502 1,479 1,411 1,436 1,442
Total taxation revenue 160,556 166,384 173,556 182,703 193,006
Non-taxationSales of goods and services 3,894 4,081 4,191 4,319 4,410Interest and dividends 5 7,053 6,440 5,516 5,114 4,828Net foreign exchange gains 753 0 0 0 0Proceeds from the sale of assets 1,278 1,182 926 11,707 11,725Other sources of non-tax revenue 6 4,640 3,579 3,256 3,337 3,448
Total non-tax revenue 17,619 15,282 13,889 24,477 24,412Total revenue 178,175 181,666 187,445 207,181 217,418ExpensesGoods and services
Employees 7 24,863 20,783 21,631 21,642 22,226Suppliers 8 13,722 14,265 14,426 14,059 14,371Depreciation and amortisation 9 3,836 4,087 4,270 4,077 4,195Net writedown of assets 2,480 1,761 1,464 1,486 1,462Net foreign exchange losses 0 122 28 10 0Value of assets sold 1,224 906 790 2,242 2,251Other goods and services expenses 6,208 6,565 6,907 7,511 7,932
Total goods and services 52,333 48,489 49,516 51,026 52,436
Subsidies benefits and grantsPersonal benefits 76,666 80,589 86,397 91,967 97,796Subsidies 8,689 9,113 9,401 9,625 10,062Grants 10 35,358 36,612 38,707 39,461 39,759
Total subsidies benefits and grants 120,713 126,314 134,505 141,053 147,616
Borrowing costsInterest 6,572 5,724 5,214 4,539 4,150Other borrowing costs 24 34 39 39 38
Total borrowing costs 6,597 5,758 5,254 4,578 4,189Total expenses 179,643 180,561 189,274 196,657 204,241Net result -1,468 1,105 -1,829 10,524 13,177Extraordinary items 0 0 0 0 0Operating result after extraordinary
items -1,468 1,105 -1,829 10,524 13,177
Estimates Projections

Statement 10: Australian Accounting Standard No. 31
10-3
Table 2: Statement of financial position for the Commonwealth generalgovernment sector — AAS31
Note2002-03 2003-04 2004-05 2005-06 2006-07
$m $m $m $m $mAssetsFinancial assets
Cash 2,507 2,346 2,269 2,381 2,469Receivables 27,301 28,970 28,999 29,876 31,458Investments 11 34,977 26,557 26,519 24,894 23,278Accrued revenue 565 478 442 465 520Other financial assets 25 18 13 14 15
Total financial assets 65,374 58,369 58,243 57,630 57,739Non-financial assets 12
Land and buildings 16,700 16,460 16,121 16,204 16,078Infrastructure 43,972 45,127 45,984 47,512 49,240Intangibles 1,327 1,372 1,367 1,367 1,334Inventories 3,903 3,857 3,779 3,714 3,767Other non-financial assets 1,680 1,226 1,279 1,125 1,096
Total non-financial assets 67,582 68,042 68,529 69,922 71,514Total assets 132,957 126,411 126,772 127,552 129,253LiabilitiesDebt
Government securities 11 57,963 48,472 48,509 36,890 22,158Loans 5,169 4,954 4,721 4,540 4,363Leases 197 149 123 83 51Deposits 300 300 300 300 300Overdrafts 0 0 0 0 0Other debt 2,355 1,840 1,262 1,220 1,220
Total debt 65,984 55,715 54,914 43,033 28,092Provisions and payables
Employees 13 96,489 99,083 101,630 104,102 106,559Suppliers 2,017 2,019 2,016 2,036 2,030Personal benefits payable 2,954 3,113 2,624 2,620 3,009Subsidies payable 406 381 353 140 123Grants payable 14 8,848 8,609 9,389 9,782 10,031Other provisions and payables 6,010 6,029 6,188 5,557 5,797
Total provisions and payables 116,725 119,234 122,200 124,237 127,549Total liabilities 182,709 174,949 177,114 167,270 155,641Net assets 15 -49,752 -48,538 -50,342 -39,718 -26,388EquityAccumulated results -81,225 -79,867 -81,438 -69,256 -54,395Reserves 31,474 31,329 31,096 29,538 28,007Capital 0 0 0 0 0Total equity -49,752 -48,538 -50,342 -39,718 -26,388
Estimates Projections

Part 4: Financial Reporting Standards and Financial Statements
10-4
Table 3: Statement of cash flows for the Commonwealth general governmentsector — AAS31
Note2002-03 2003-04 2004-05 2005-06 2006-07
$m $m $m $m $mOperating activitiesCash received
Taxes 16 158,408 164,750 171,851 180,906 190,892Sales of goods and services 4,132 4,210 4,330 4,474 4,556Interest 3,241 2,695 2,355 2,164 2,364Dividends 3,960 3,074 4,294 3,155 2,640GST input credit receipts 2,277 2,277 2,296 2,312 2,378Other 2,875 2,787 2,782 2,787 2,880
Total operating cash received 174,893 179,793 187,908 195,798 205,710Cash used
Payments to employees 17,131 18,189 19,084 19,171 19,768Payments to suppliers 16,227 16,506 16,637 16,288 16,816Subsidies paid 8,119 8,573 8,863 9,232 9,506Personal benefits 76,662 80,465 86,931 91,967 97,395Grant payments 35,448 36,318 37,915 39,051 39,495Interest and other financing costs 6,407 5,691 5,121 5,227 3,958GST payments to taxation authority 145 147 149 151 154Other 6,147 6,612 6,894 7,489 7,910
Total operating cash used 166,287 172,501 181,594 188,576 195,001Net cash from operating activities 8,605 7,291 6,314 7,223 10,708Investing activitiesCash received
Proceeds from asset sales program 0 109 91 11,280 11,280Proceeds from sales of property,
plant and equipment and intangibles 1,312 1,073 835 427 445Net loans, advances and HECS 0 0 0 0 0Other net investing cash received 1,990 34 11 0 0
Total investing cash received 3,302 1,217 937 11,707 11,725Cash used
Purchase of property, plant and equipment and intangibles 5,897 6,076 5,731 5,968 6,165
Net loans, advances and HECS 64 587 719 733 1,015Other net investing cash paid 11 0 271 41 219 215
Total investing cash used 5,961 6,934 6,491 6,920 7,396Net cash from investing activities -2,659 -5,717 -5,553 4,787 4,330Financing activities Cash received
Net cash received from currency issues 0 0 0 0 0
Other 276 0 0 0 0Total financing cash received 276 0 0 0 0Cash used
Net repayments of borrowings 11 5,945 1,199 196 11,800 14,909Other 0 537 641 98 41
Total financing cash used 5,945 1,736 837 11,898 14,950Net cash from financing activities -5,670 -1,736 -837 -11,898 -14,950Net increase/decrease in cash held 2 277 -162 -77 112 88
Estimates Projections

Statement 10: Australian Accounting Standard No. 31
10-5
NOTES TO THE AAS31 FINANCIAL STATEMENTS
Note 1: External reporting standards
The Charter of Budget Honesty Act 1998 requires that the Budget be based on externalreporting standards and that departures from applicable external reporting standardsbe identified.
The financial statements included in this Statement have been prepared on an accrualbasis in accordance with applicable Australian Accounting Standards, includingAustralian Accounting Standard No. 31: Financial Reporting by Governments (AAS31).AAS31 is the relevant accounting standard for financial reporting by governments.
AAS31 requires adoption of the full accrual basis of accounting. This means that assets,liabilities, revenues and expenses are recorded in financial statements when they havetheir economic impact on the government, rather than when the cash flow associatedwith these transactions occurs. Consistent with AAS31, a statement of financialperformance, a statement of financial position and a statement of cash flows have beenprepared using estimates for the budget year and the three forward years.
The accounting policies in this budget document are generally consistent with theaccounting policies in AAS31. While the scope for financial reporting recommended inAAS31 is the Whole of Government (that is, the Commonwealth public sector), inaccordance with the Charter of Budget Honesty Act 1998, the budget presentation offinancial estimates covers the general government sector only.
In relation to taxation revenue, AAS31 and other relevant accounting standardssuggest revenue be recognised at the time the income (or economic activity) giving riseto a tax liability occurs, where this can be measured reliably. At this stage, theCommonwealth does not consider its taxation revenues can be reliably measured onthis basis for budget reporting purposes. Taxation revenue is therefore recognised theearlier of when an assessment of a tax liability is made or a cash payment is receivedby the Australian Taxation Office or the Australian Customs Service.
In regard to goods and services tax (GST) revenue, AAS31 and other relevantaccounting standards would suggest the gross amount of GST be included in theCommonwealth's financial statements. However, the clear policy intent of theIntergovernmental Agreement on the Reform of Commonwealth-State Financial Relations isthat the GST is a State tax collected by the Commonwealth in an agency capacity.Therefore, accrued GST revenues and associated payments to the States and Territoriesare not recorded in the budget financial statements.

Part 4: Financial Reporting Standards and Financial Statements
10-6
Note 2: Reconciliation of cash
2002-03 2003-04 2004-05 2005-06 2006-07$m $m $m $m $m
Operating result (revenues less expenses) -1,468 1,105 -1,829 10,524 13,177less Revenues not providing cash
Foreign exchange gains 753 0 0 0 0 Gains from asset sales programme 0 109 91 11,280 11,280 Gains from sale of assets 1,278 1,073 835 427 445 Other 1,594 570 306 330 355
Total revenues not providing cash 3,625 1,753 1,232 12,037 12,080plus Expenses not requiring cash
Increase/(decrease) in employee entitlements 7,732 2,593 2,547 2,471 2,458 Depreciation/amortisation expense 3,836 4,087 4,270 4,077 4,195 Provision for bad and doubtful debts 488 257 240 333 327 Provision for diminution in value of assets 577 432 172 134 159 Losses from asset sales programme 0 80 53 1,836 1,826 Losses from sale of assets 1,224 826 736 407 425 Foreign exchange losses 0 122 28 10 0 Other 0 0 0 0 0
Total expenses not requiring cash 13,857 8,397 8,048 9,268 9,389plus Cash provided by working capital items
Decrease in inventories 0 47 78 64 0 Decrease in receivables 440 0 779 0 0 Decrease in other financial assets 4 94 40 0 0 Decrease in other non-financial assets 0 517 0 0 4 Increase in benefits subsidies and grants payable 882 186 793 411 654 Increase in suppliers liabilities 0 2 0 20 0 Increase in other provisions and payables 0 19 159 0 240
Total cash provided by working capital items 1,326 864 1,850 496 898less Cash used by working capital items
Increase in inventories 4 0 0 0 52 Increase in receivables 0 1,057 0 151 544 Increase in other financial assets 0 0 0 24 55 Decrease in other non-financial assets 542 0 2 5 0 Decrease in benefits subsidies and grants payable 0 265 516 217 17 Decrease in other provisions and payables 783 0 0 631 0 Decrease in suppliers liabilities 157 0 4 0 6
Total cash used by working capital items 1,485 1,322 522 1,028 675equals Net cash from/(to) operating activities 8,605 7,291 6,314 7,223 10,708
Net cash from/(to) investing activities -2,659 -5,717 -5,553 4,787 4,330
Net cash from operating activities andinvestment 5,946 1,574 761 12,010 15,038
Net cash from/(to) financing activities -5,670 -1,736 -837 -11,898 -14,950
equals Net (decrease)/increase in cash 277 -162 -77 112 88
Estimates Projections

Statement 10: Australian Accounting Standard No. 31
10-7
Note 2(a): Consolidated Revenue Fund
The estimated and projected cash balance reflected in the statement of financialposition for the Commonwealth general government sector (Table 2) includes thereported cash balances controlled and administered by Commonwealth agenciessubject to the Financial Management and Accountability Act 1997 (FMA Act) and thereported cash balances controlled and administered by entities, subject to theCommonwealth Authorities and Companies Act 1997, that implement public policythrough the provision of primarily non-market services.
Revenues or moneys raised by the Executive Government automatically form part ofthe Consolidated Revenue Fund by force of Section 81 of the Constitution. There is,however, no requirement for the Consolidated Revenue Fund to be accounted for inany particular form. For practical purposes, total Commonwealth general governmentsector cash, less cash controlled and administered by Commonwealth Authorities andCompanies Act 1997 entities, represents the Consolidated Revenue Fund referred to inSection 81 of the Constitution. On this basis, the estimated and projected balance of theConsolidated Revenue Fund is shown below.
2002-03 2003-04 2004-05 2005-06 2006-07$m $m $m $m $m
Total general government sector cash (Statement 10) 2,507 2,346 2,269 2,381 2,469
less CAC agency cash balances 1,047 914 800 863 897Balance of Consolidated Revenue Fund
at 30 June 1,461 1,432 1,469 1,518 1,572
Estimates Projections
Further information on the Consolidated Revenue Fund is included in Budget PaperNo. 4, Agency Resourcing 2003-04.
Note 3: Income tax revenue — accrual AAS31
2002-03 2003-04 2004-05 2005-06 2006-07$m $m $m $m $m
Individuals and other withholding taxGross income tax withholding 84,590 88,650 94,560 101,140 108,620Gross other individuals 17,300 19,130 19,660 20,550 21,500less Refunds 11,540 12,200 12,810 13,680 14,720
Total individuals and other withholding tax 90,350 95,580 101,410 108,010 115,400
Companies 32,093 32,370 33,750 35,700 37,820Superannuation funds
Contributions and earnings 3,580 4,050 4,150 4,400 4,650Surcharge 980 950 910 860 880
Total superannuation funds 4,560 5,000 5,060 5,260 5,530Petroleum resource rent tax 1,720 1,280 920 810 730Total income tax revenue 128,723 134,230 141,140 149,780 159,480
Estimates Projections

Part 4: Financial Reporting Standards and Financial Statements
10-8
Note 4: Indirect tax revenue — accrual AAS31
2002-03 2003-04 2004-05 2005-06 2006-07$m $m $m $m $m
Excise dutyPetroleum products 13,250 13,280 13,430 13,570 13,850Other excise 7,330 7,360 7,430 7,520 7,630
Total excise duty revenue 20,580 20,640 20,860 21,090 21,480
Customs duty revenue 5,630 5,915 5,915 5,997 6,023
Other indirect tax revenue 900 930 1,000 1,070 1,140
GST 31,230 32,050 33,815 35,680 37,690less transfers to States and Territories
in relation to GST revenue 31,230 32,050 33,815 35,680 37,690GST revenue 0 0 0 0 0
Mirror taxes 271 284 300 315 331less transfers to States and Territories
in relation to mirror tax revenue 271 284 300 315 331Mirror tax revenue 0 0 0 0 0
Indirect tax revenue 27,110 27,485 27,775 28,157 28,643
Estimates Projections
Note 5: Interest and dividend revenue
2002-03 2003-04 2004-05 2005-06 2006-07$m $m $m $m $m
InterestInterest from other governments
State and Territory debt 50 38 28 17 15Housing agreements 181 178 174 170 166
Total interest from other governments 232 215 202 187 181
Interest from other sourcesSwap interest 2,198 1,858 1,506 1,208 956Advances 18 21 21 21 21Deposits 15 3 3 3 3Bills receivable 6 6 6 6 6Bank deposits 152 159 175 179 181Other 473 203 208 355 840
Total interest from other sources 2,861 2,250 1,920 1,771 2,007
Total interest 3,093 2,465 2,122 1,958 2,189DividendsDividends from associated entities 3,922 3,951 3,374 3,131 2,617Other dividends 38 23 20 24 23Total dividends 3,960 3,974 3,394 3,155 2,640Total interest and dividends 7,053 6,440 5,516 5,114 4,828
Estimates Projections
Statement 10: Australian Accounting Standard No. 31
10-9
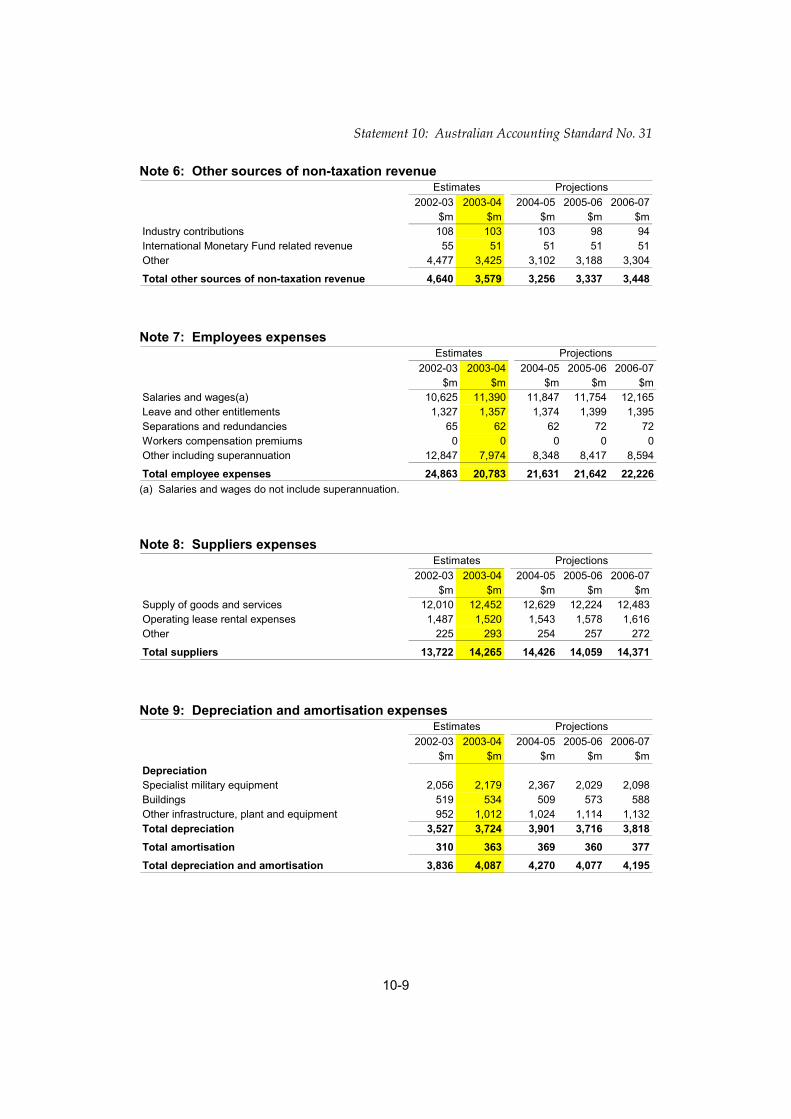
Note 6: Other sources of non-taxation revenue
2002-03 2003-04 2004-05 2005-06 2006-07$m $m $m $m $m
Industry contributions 108 103 103 98 94International Monetary Fund related revenue 55 51 51 51 51Other 4,477 3,425 3,102 3,188 3,304
Total other sources of non-taxation revenue 4,640 3,579 3,256 3,337 3,448
Estimates Projections
Note 7: Employees expenses
2002-03 2003-04 2004-05 2005-06 2006-07$m $m $m $m $m
Salaries and wages(a) 10,625 11,390 11,847 11,754 12,165Leave and other entitlements 1,327 1,357 1,374 1,399 1,395Separations and redundancies 65 62 62 72 72Workers compensation premiums 0 0 0 0 0Other including superannuation 12,847 7,974 8,348 8,417 8,594
Total employee expenses 24,863 20,783 21,631 21,642 22,226
Estimates Projections
(a) Salaries and wages do not include superannuation.
Note 8: Suppliers expenses
2002-03 2003-04 2004-05 2005-06 2006-07$m $m $m $m $m
Supply of goods and services 12,010 12,452 12,629 12,224 12,483Operating lease rental expenses 1,487 1,520 1,543 1,578 1,616Other 225 293 254 257 272
Total suppliers 13,722 14,265 14,426 14,059 14,371
Estimates Projections
Note 9: Depreciation and amortisation expenses
2002-03 2003-04 2004-05 2005-06 2006-07$m $m $m $m $m
DepreciationSpecialist military equipment 2,056 2,179 2,367 2,029 2,098Buildings 519 534 509 573 588Other infrastructure, plant and equipment 952 1,012 1,024 1,114 1,132Total depreciation 3,527 3,724 3,901 3,716 3,818Total amortisation 310 363 369 360 377Total depreciation and amortisation 3,836 4,087 4,270 4,077 4,195
Estimates Projections
Part 4: Financial Reporting Standards and Financial Statements
10-10
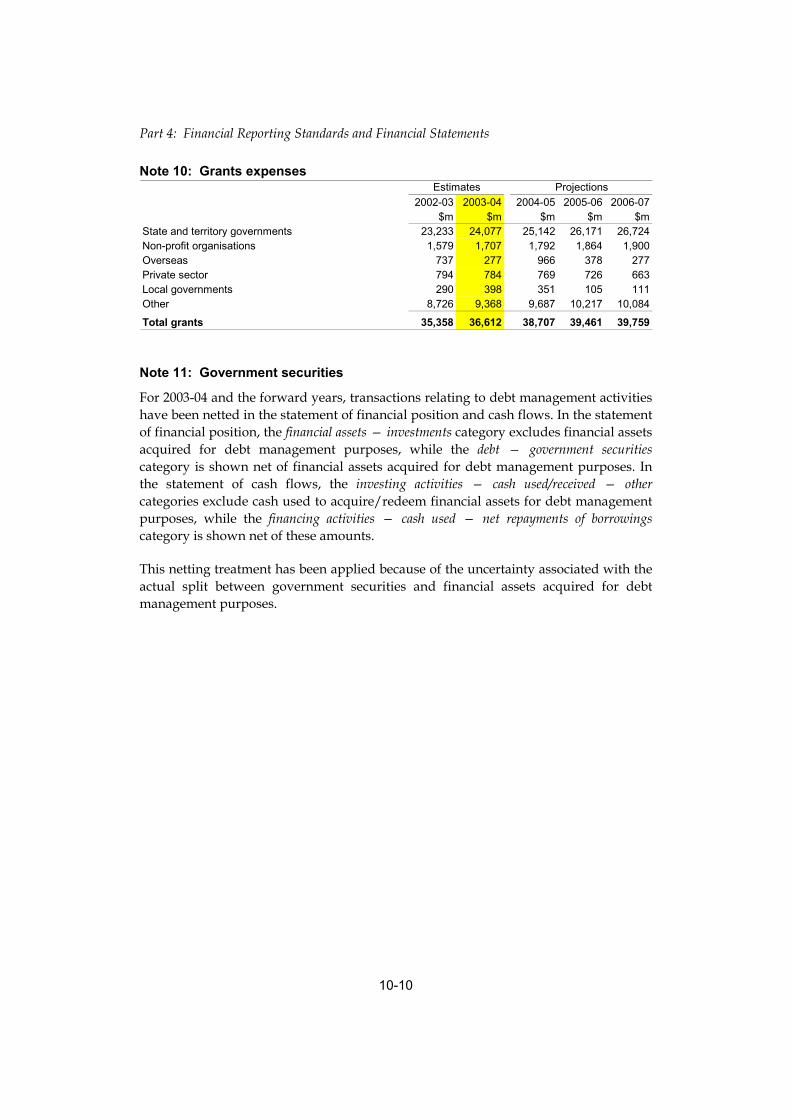
Note 10: Grants expenses
2002-03 2003-04 2004-05 2005-06 2006-07$m $m $m $m $m
State and territory governments 23,233 24,077 25,142 26,171 26,724Non-profit organisations 1,579 1,707 1,792 1,864 1,900Overseas 737 277 966 378 277Private sector 794 784 769 726 663Local governments 290 398 351 105 111Other 8,726 9,368 9,687 10,217 10,084
Total grants 35,358 36,612 38,707 39,461 39,759
Estimates Projections
Note 11: Government securities
For 2003-04 and the forward years, transactions relating to debt management activitieshave been netted in the statement of financial position and cash flows. In the statementof financial position, the financial assets — investments category excludes financial assetsacquired for debt management purposes, while the debt — government securitiescategory is shown net of financial assets acquired for debt management purposes. Inthe statement of cash flows, the investing activities — cash used/received — othercategories exclude cash used to acquire/redeem financial assets for debt managementpurposes, while the financing activities — cash used — net repayments of borrowingscategory is shown net of these amounts.
This netting treatment has been applied because of the uncertainty associated with theactual split between government securities and financial assets acquired for debtmanagement purposes.

Statement 10: Australian Accounting Standard No. 31
10-11
Note 12: Total non-financial assets
2002-03 2003-04 2004-05 2005-06 2006-07$m $m $m $m $m
Land and buildingsLand 4,416 4,242 4,014 4,026 4,055Buildings 12,285 12,218 12,107 12,178 12,023
Total land and buildings 16,700 16,460 16,121 16,204 16,078Infrastructure
Specialist military equipment 31,501 32,582 33,425 34,979 36,911Other 12,471 12,544 12,559 12,533 12,328
Total infrastructure 43,972 45,127 45,984 47,512 49,240Intangibles
Computer software 1,227 1,297 1,315 1,312 1,281Other 99 75 52 55 53
Total intangibles 1,327 1,372 1,367 1,367 1,334Inventories 3,903 3,857 3,779 3,714 3,767Total inventories 3,903 3,857 3,779 3,714 3,767Other non-financial assets
Prepayments 1,461 935 936 939 934Other 219 290 343 185 162
Total other non-financial assets 1,680 1,226 1,279 1,125 1,096Total non-financial assets 67,582 68,042 68,529 69,922 71,514
Estimates Projections
Note 13: Employee liabilities
2002-03 2003-04 2004-05 2005-06 2006-07$m $m $m $m $m
Superannuation 89,040 91,541 93,957 96,317 98,680Leave and other entitlements 3,556 3,595 3,744 3,752 3,834Accrued salaries and wages 332 283 154 235 290Workers compensation claims 1,387 1,371 1,355 1,339 1,321Separations and redundancies 19 19 19 19 19Workers compensation premiums 1,425 1,522 1,619 1,643 1,608Other 730 753 782 796 808
Total employee entitlements 96,489 99,083 101,630 104,102 106,559
Estimates Projections
Note 14: Grants payable
2002-03 2003-04 2004-05 2005-06 2006-07$m $m $m $m $m
State and territory governments 3,375 3,640 3,866 4,101 4,351Non-profit organisations 27 25 25 25 25Private sector 36 34 34 33 32Overseas 1,089 828 1,292 1,192 967Local governments 2 2 2 2 2Other 4,319 4,081 4,170 4,429 4,654
Total grants payable 8,848 8,609 9,389 9,782 10,031
Estimates Projections

Part 4: Financial Reporting Standards and Financial Statements
10-12
Note 15: Net asset movements
2002-03 2003-04 2004-05 2005-06 2006-07$m $m $m $m $m
Opening net assets -48,457 -49,752 -48,538 -50,342 -39,718Operating result after extraordinary items -1,468 1,105 -1,829 10,524 13,177Asset revaluation reserve 24 37 -10 102 121Other movements 150 72 36 -1 33Closing net assets -49,752 -48,538 -50,342 -39,718 -26,388
Estimates Projections
Note 16: Tax receipts — cash AAS31
2002-03 2003-04 2004-05 2005-06 2006-07$m $m $m $m $m
Total tax receipts 189,393 196,734 205,600 216,521 228,504less payments to States and Territories in relation to GST revenue 30,670 31,700 33,450 35,300 37,280less payments to States and Territories in relation to mirror tax revenue 315 284 300 315 331Tax receipts 158,408 164,750 171,851 180,906 190,892
Estimates Projections

Statement 10: Australian Accounting Standard No. 31
10-13
APPENDIX A: ADDITIONAL AGENCY STATISTICS
Table A1: General government expenses by agency
2002-03 2003-04 2004-05 2005-06 2006-07$m $m $m $m $m
Agriculture, Fisheries and ForestryDepartment of Agriculture, Fisheries
and Forestry 1,747 1,822 1,644 1,400 1,272Grains Research and Development
Corporation 117 124 128 132 135Total 1,864 1,946 1,771 1,531 1,408Attorney-General'sAttorney-General's Department 487 512 405 400 406Australian Customs Service 760 815 843 864 850Australian Federal Police 563 585 560 564 569Family Court of Australia 117 119 122 124 126Total 1,927 2,032 1,930 1,953 1,951Communications, Information
Technology and the ArtsDepartment of Communications, Information
Technology and the Arts 633 588 414 366 338Australian Broadcasting Corporation 862 913 936 940 934Special Broadcasting Service Corporation 159 180 191 195 195Australian Sports Commission 135 138 140 144 148Total 1,788 1,819 1,681 1,645 1,614DefenceDepartment of Defence 16,420 17,030 17,434 17,175 17,883Defence Housing Authority 291 305 316 331 331Total 16,711 17,335 17,749 17,506 18,214Education, Science and TrainingDepartment of Education, Science
and Training 13,489 14,258 15,054 16,082 16,799Australian Research Council 375 426 495 574 586Australian Nuclear Science and Technology
Organisation 150 160 157 156 164Commonwealth Scientific and Industrial
Research Organisation 850 920 916 966 1,027Total 14,864 15,763 16,623 17,778 18,575Employment and Workplace RelationsDepartment of Employment and Workplace
Relations 1,703 1,768 1,770 1,784 1,842Comcare 321 214 218 222 224Total 2,024 1,982 1,988 2,006 2,065Environment and HeritageDepartment of Environment and Heritage 553 491 557 563 557Australian Greenhouse Office 92 124 119 111 85Bureau of Meteorology 170 208 210 216 221Total 815 823 885 890 863
Estimates Projections

Part 4: Financial Reporting Standards and Financial Statements
10-14
Table A1: General government expenses by agency (continued)
2002-03 2003-04 2004-05 2005-06 2006-07$m $m $m $m $m
Family and Community Services Department of Family and Community Services 60,310 63,192 66,226 68,977 71,846Centrelink 1,990 2,112 2,149 2,157 2,156Total 62,299 65,304 68,374 71,134 74,003Finance and AdministrationDepartment of Finance and Administration 10,114 5,422 5,391 5,623 5,675Australian Electoral Commission 106 109 196 110 106Total 10,220 5,531 5,587 5,733 5,781Foreign Affairs and TradeDepartment of Foreign Affairs and Trade 876 905 930 882 888Australian Agency for International
Development 1,794 1,309 2,038 1,492 1,398Australian Trade Commission 342 344 338 340 342Total 3,012 2,558 3,306 2,714 2,628Health and AgeingDepartment of Health and Ageing 31,417 32,979 34,792 36,413 37,977Health Insurance Commission 485 533 482 479 494National Blood Authority 0 433 436 448 490Total 31,902 33,944 35,710 37,339 38,962Immigration and Multicultural and
Indigenous AffairsDepartment of Immigration and Multicultural
and Indigenous Affairs 1,043 1,152 1,010 1,024 1,039Aboriginal and Torres Strait Islander
Commission 1,128 125 119 122 124Office of Aboriginal and Torres Strait Islander
Services 0 1,133 1,175 1,212 1,246Total 2,171 2,410 2,305 2,359 2,408Industry, Tourism and Resources Department of Industry, Tourism
and Resources 1,778 1,836 1,728 1,564 1,337Australian Tourist Commission 112 107 109 110 108Total 1,891 1,943 1,836 1,674 1,445Prime Minister and CabinetDepartment of Prime Minister and Cabinet 96 86 75 64 64Total 96 86 75 64 64Transport and Regional ServicesDepartment of Transport and Regional Services 3,468 3,572 3,806 3,357 3,310Civil Aviation Safety Authority 107 114 116 109 108Total 3,575 3,686 3,922 3,465 3,418TreasuryDepartment of the Treasury 2,045 2,000 1,571 1,814 651Australian Bureau of Statistics 269 266 282 317 404Australian Securities and Investment 209 233 227 213 213
CommissionAustralian Taxation Office 7,739 7,898 8,173 8,366 8,584Australian Office of Financial Management 6,362 5,541 5,153 4,610 4,040Total 16,624 15,939 15,405 15,321 13,892
Estimates Projections

Statement 10: Australian Accounting Standard No. 31
10-15
Table A1: General government expenses by agency (continued)
2002-03 2003-04 2004-05 2005-06 2006-07$m $m $m $m $m
Veterans' AffairsDepartment of Veterans' Affairs 9,540 9,994 10,345 10,771 11,145Total 9,540 9,994 10,345 10,771 11,145Small agencies 3,978 4,135 4,143 4,179 4,220Whole of government and inter-agency
amounts(a) -5,658 -6,671 -4,361 -1,406 1,585Total expenses 179,643 180,561 189,274 196,657 204,241
Estimates Projections
(a) Estimates of inter-agency transactions are included in the whole of government and inter-agencyamounts. The entry for each portfolio does not include eliminations for inter-agency transactions withinthat portfolio.

Part 4: Financial Reporting Standards and Financial Statements
10-16
Table A2: Departmental expenses by agency
2002-03 2003-04 2004-05 2005-06 2006-07$m $m $m $m $m
Agriculture, Fisheries and ForestryDepartment of Agriculture, Fisheries
and Forestry 460 446 444 357 329Grains Research and Development
Corporation 117 124 128 132 135Total 577 569 572 488 465Attorney-General'sAttorney-General's Department 165 170 119 120 120Australian Customs Service 760 814 842 864 850Australian Federal Police 563 585 560 564 569Family Court of Australia 117 119 122 124 126Total 1,604 1,690 1,644 1,672 1,665Communications, Information
Technology and the ArtsDepartment of Communications, Information
Technology and the Arts 143 138 136 138 139Australian Broadcasting Corporation 789 840 863 867 861Special Broadcasting Service Corporation 159 180 191 195 195Australian Sports Commission 135 138 140 144 148Total 1,226 1,296 1,330 1,344 1,343DefenceDepartment of Defence 14,183 14,793 15,097 14,839 15,446Defence Housing Authority 291 305 316 331 331Total 14,475 15,099 15,413 15,170 15,777Education, Science and TrainingDepartment of Education, Science
and Training 233 245 249 255 262Australian Research Council 12 12 12 12 13Australian Nuclear Science and Technology
Organisation 150 160 157 156 164Commonwealth Scientific and Industrial
Research Organisation 850 920 916 966 1,027Total 1,245 1,336 1,334 1,390 1,465Employment and Workplace RelationsDepartment of Employment and Workplace Relations 445 437 421 429 434Comcare 321 214 218 222 224Total 766 651 639 651 657Environment and HeritageDepartment of Environment and Heritage 293 235 242 249 254Australian Greenhouse Office 72 108 91 85 61Bureau of Meteorology 170 208 210 216 221Total 534 551 543 551 535Family and Community Services Department of Family and Community Services 2,425 2,478 2,513 2,536 2,542Centrelink 1,990 2,112 2,149 2,157 2,156Total 4,415 4,590 4,662 4,694 4,698
Estimates Projections

Statement 10: Australian Accounting Standard No. 31
10-17
Table A2: Departmental expenses by agency (continued)Projections
2002-03 2003-04 2004-05 2005-06 2006-07$m $m $m $m $m
Finance and AdministrationDepartment of Finance and Administration 369 388 400 564 559Australian Electoral Commission 106 109 151 110 106Total 474 497 551 674 665Foreign Affairs and TradeDepartment of Foreign Affairs and Trade 664 719 744 695 720Australian Agency for International
Development 71 70 70 71 72Australian Trade Commission 192 194 188 190 192Total 926 984 1,002 956 984Health and AgeingDepartment of Health and Ageing 983 1,098 1,040 1,037 1,041Health Insurance Commission 485 533 482 479 494National Blood Authority 0 7 5 5 5Total 1,468 1,637 1,526 1,520 1,540Immigration and Multicultural and
Indigenous AffairsDepartment of Immigration and Multicultural
and Indigenous Affairs 849 809 706 722 735Aboriginal and Torres Strait Islander
Commission 1,090 31 32 33 34Office of Aboriginal and Torres Strait Islander
Services 0 161 165 169 168Total 1,938 1,001 903 924 937Industry, Tourism and Resources Department of Industry, Tourism
and Resources 225 240 243 240 204Australian Tourist Commission 112 107 109 110 108Total 338 347 351 351 312Prime Minister and CabinetDepartment of Prime Minister and Cabinet 46 53 53 52 52Total 46 53 53 52 52Transport and Regional ServicesDepartment of Transport and Regional Services 232 230 231 228 231Civil Aviation Safety Authority 107 114 116 109 108Total 338 344 348 336 339TreasuryDepartment of the Treasury 145 148 149 153 153Australian Bureau of Statistics 269 266 282 317 404Australian Securities and Investment
Commission 177 180 178 180 179Australian Taxation Office 2,127 2,301 2,348 2,403 2,440Australian Office of Financial Management 6 7 7 7 7Total 2,724 2,902 2,963 3,059 3,184
Estimates

Part 4: Financial Reporting Standards and Financial Statements
10-18
Table A2: Departmental expenses by agency (continued)
2002-03 2003-04 2004-05 2005-06 2006-07$m $m $m $m $m
Veterans' AffairsDepartment of Veterans' Affairs 293 296 300 306 315Total 293 296 300 306 315Small agencies 2,795 2,882 2,864 2,874 2,902Whole of government and inter-agency
amounts(a) 0 18 451 152 157Total departmental expenses 36,183 36,745 37,450 37,165 37,993
Estimates Projections
(a) Estimates of inter-agency transactions are included in the whole of government and inter-agencyamounts. The entry for each portfolio does not include eliminations for inter-agency transactions withinthat portfolio.

Statement 10: Australian Accounting Standard No. 31
10-19
Table A3: Net capital investment by agency
2002-03 2003-04 2004-05 2005-06 2006-07$m $m $m $m $m
Agriculture, Fisheries and ForestryDepartment of Agriculture, Fisheries
and Forestry 2.3 1.7 0.8 -0.2 -8.8Grains Research and Development
Corporation 0.0 -0.1 -0.4 -0.3 -0.2Total 2.3 1.6 0.4 -0.4 -9.0Attorney-General'sAttorney-General's Department -26.8 -1.3 -3.2 -3.2 -3.7Australian Customs Service 58.7 16.8 3.4 -0.5 0.0Australian Federal Police 4.7 6.1 6.3 4.2 2.3Family Court of Australia 1.0 -0.5 0.3 -1.2 -0.1Total 37.6 21.1 6.9 -0.6 -1.5Communications, Information
Technology and the ArtsDepartment of Communications, Information
Technology and the Arts -17.6 -0.7 -1.8 -2.0 -1.6Australian Broadcasting Corporation 20.1 -9.0 -6.9 0.0 0.0Special Broadcasting Service Corporation 11.0 8.7 3.3 2.7 -2.5Australian Sports Commission -3.9 -0.7 22.9 16.6 8.2Total 9.5 -1.7 17.5 17.3 4.2DefenceDepartment of Defence 394.1 740.4 535.6 1,376.6 1,736.6Defence Housing Authority -111.5 14.0 -64.8 4.0 0.0Total 282.7 754.4 470.8 1,380.6 1,736.6Education, Science and TrainingDepartment of Education, Science
and Training 5.7 3.2 0.6 1.7 0.3Australian Research Council -0.2 -0.4 0.0 0.2 0.0Australian Nuclear Science and Technology
Organisation 70.3 117.7 68.3 6.1 4.0Commonwealth Scientific and Industrial
Research Organisation 17.3 -23.4 26.2 -12.2 -12.0Total 93.0 97.1 95.0 -4.1 -7.8Employment and Workplace RelationsDepartment of Employment and Workplace
Relations -4.3 16.9 -6.7 2.6 2.7Comcare 0.0 0.0 0.0 0.0 0.0Total -4.3 16.9 -6.7 2.6 2.7Environment and HeritageDepartment of Environment and Heritage -205.8 0.3 -3.6 -5.9 -5.9Australian Greenhouse Office 0.1 -0.1 -0.1 0.0 0.0Bureau of Meteorology 215.1 7.2 9.8 8.8 10.8Total 9.4 7.3 6.2 2.9 4.9Family and Community Services Department of Family and Community Services -35.6 0.9 -3.3 7.1 2.3Centrelink 50.2 21.1 -2.0 2.6 -10.4Total 14.6 22.0 -5.3 9.7 -8.1
Estimates Projections

Part 4: Financial Reporting Standards and Financial Statements
10-20
Table A3: Net capital investment by agency (continued)
2002-03 2003-04 2004-05 2005-06 2006-07$m $m $m $m $m
Finance and AdministrationDepartment of Finance and Administration -146.3 53.9 96.8 -184.1 -25.6Australian Electoral Commission 2.8 -0.2 -3.3 -3.7 -0.9Total -143.5 53.7 93.5 -187.8 -26.5Foreign Affairs and TradeDepartment of Foreign Affairs and Trade -28.6 -32.0 -159.5 -29.6 -34.3Australian Agency for International
Development 4.5 0.6 -1.3 -1.5 -1.5Australian Trade Commission 0.0 0.4 -0.1 -0.1 -0.1Total -24.1 -30.9 -160.9 -31.2 -35.8Health and AgeingDepartment of Health and Ageing 14.8 11.9 -6.6 -6.9 -4.3Health Insurance Commission 15.2 28.8 31.5 13.0 0.0National Blood Authority 0.0 0.0 0.0 0.0 0.0Total 30.0 40.7 25.0 6.1 -4.3Immigration and Multicultural and
Indigenous AffairsDepartment of Immigration and Multicultural
and Indigenous Affairs 73.7 -15.3 -29.9 162.2 -32.1Aboriginal and Torres Strait Islander
Commission -3.0 -66.0 -4.7 0.0 0.0Office of Aboriginal and Torres Strait Islander
Services 0.0 61.0 -0.9 0.0 0.0Total 70.8 -20.3 -35.4 162.2 -32.1Industry, Tourism and Resources Department of Industry, Tourism
and Resources 5.6 -1.8 4.2 3.8 -4.6Australian Tourist Commission 0.8 -0.7 -0.7 -1.8 0.8Total 6.5 -2.6 3.5 2.0 -3.8Prime Minister and CabinetDepartment of Prime Minister and Cabinet -0.2 2.8 -0.2 -0.2 -0.1Total -0.2 2.8 -0.2 -0.2 -0.1Transport and Regional ServicesDepartment of Transport and Regional Services 111.0 23.4 -1.1 -1.4 -1.1Civil Aviation Safety Authority 5.2 3.5 -0.2 0.5 -3.4Total 116.3 27.0 -1.3 -0.9 -4.5TreasuryDepartment of the Treasury 529.6 -533.7 1.1 2.2 1.9Australian Bureau of Statistics -8.3 0.1 2.1 8.2 -1.7Australian Securities and Investment
Commission 6.7 -2.0 0.9 1.9 2.6Australian Taxation Office 13.2 38.1 15.6 20.8 8.3Australian Office of Financial Management 2.2 -0.8 -0.8 -0.8 -0.8Total 543.4 -498.2 18.9 32.4 10.3
Estimates Projections

Statement 10: Australian Accounting Standard No. 31
10-21
Table A3: Net capital investment by agency (continued)
2002-03 2003-04 2004-05 2005-06 2006-07$m $m $m $m $m
Veterans' AffairsDepartment of Veterans' Affairs 10.6 11.7 1.5 2.6 -0.5Total 10.6 11.7 1.5 2.6 -0.5Small agencies 966.8 19.5 -0.9 27.0 -13.2Whole of government and inter-agency
amounts(a) -62.8 -62.9 -40.7 -27.7 -19.5Total net capital investment 1,958.3 459.2 487.8 1,392.3 1,592.1
Estimates Projections
(a) Estimates of inter-agency transactions are included in the whole of government and inter-agencyamounts. The entry for each portfolio does not include eliminations for inter-agency transactions withinthat portfolio.

Part 4: Financial Reporting Standards and Financial Statements
10-22
Table A4: Capital appropriations by portfolio
2002-03 2003-04 2004-05 2005-06 2006-07$m $m $m $m $m
Agriculture, Fisheries and ForestryDepartment of Agriculture, Fisheries
and Forestry 2 30 0 0 0Grains Research and Development
Corporation 0 0 0 0 0Total 2 30 0 0 0Attorney-General'sAttorney-General's Department 2 5 0 0 0Australian Customs Service 19 20 8 3 0Australian Federal Police 5 4 3 1 0Family Court of Australia 0 0 0 0 0Total 26 29 11 4 0Communications, Information
Technology and the ArtsDepartment of Communications, Information
Technology and the Arts 0 0 0 0 0Australian Broadcasting Corporation 74 20 0 0 0Special Broadcasting Service Corporation 33 7 6 6 5Australian Sports Commission 0 0 12 18 11Total 107 28 17 24 16DefenceDepartment of Defence 995 1,021 779 1,295 1,653Defence Housing Authority 100 0 0 0 0Total 1,095 1,021 779 1,295 1,653Education, Science and TrainingDepartment of Education, Science
and Training 0 0 0 0 0Australian Research Council 0 0 0 0 0Australian Nuclear Science and Technology
Organisation 104 85 34 3 0Commonwealth Scientific and Industrial
Research Organisation 17 0 0 0 0Total 121 85 34 3 0Employment and Workplace RelationsDepartment of Employment and Workplace
Relations 11 0 0 0 0Comcare 0 0 0 0 0Total 11 0 0 0 0Environment and HeritageDepartment of Environment and Heritage 5 2 0 0 0Australian Greenhouse Office 0 0 0 0 0Bureau of Meteorology 0 6 9 9 11Total 5 9 9 9 11Family and Community Services Department of Family and Community Services 304 1 1 1 1Centrelink 14 38 23 34 25Total 318 39 24 34 26
Estimates Projections

Statement 10: Australian Accounting Standard No. 31
10-23
Table A4: Capital appropriations by portfolio (continued)
2002-03 2003-04 2004-05 2005-06 2006-07$m $m $m $m $m
Finance and AdministrationDepartment of Finance and Administration 944 852 912 894 851Australian Electoral Commission 0 0 0 0 0Total 944 852 912 894 851Foreign Affairs and TradeDepartment of Foreign Affairs and Trade 30 16 0 0 0Australian Agency for International
Development 219 209 93 34 22Australian Trade Commission 0 1 0 0 0Total 249 225 93 34 22Health and AgeingDepartment of Health and Ageing 48 46 41 48 48Health Insurance Commission 39 56 19 0 0National Blood Authority 0 0 0 0 0Total 87 102 60 48 48Immigration and Multicultural and
Indigenous AffairsDepartment of Immigration and Multicultural
and Indigenous Affairs 23 13 2 1 1Aboriginal and Torres Strait Islander
Commission 0 92 0 0 0Office of Aboriginal and Torres Strait Islander
Services 0 14 14 14 14Total 23 119 15 15 15Industry, Tourism and Resources Department of Industry, Tourism
and Resources 105 99 89 32 13Australian Tourist Commission 0 0 0 0 0Total 105 99 89 32 13Prime Minister and CabinetDepartment of Prime Minister and Cabinet 0 0 0 0 0Total 0 0 0 0 0Transport and Regional ServicesDepartment of Transport and Regional Services 212 30 5 5 5Civil Aviation Safety Authority 0 0 0 0 0Total 212 30 5 5 5TreasuryDepartment of the Treasury 1,427 159 96 63 46Australian Bureau of Statistics 0 0 0 0 0Australian Securities and Investment
Commission 0 0 0 0 0Australian Taxation Office -21 0 0 0 0Australian Office of Financial Management 0 0 0 0 0Total 1,406 159 96 63 46
Estimates Projections

Part 4: Financial Reporting Standards and Financial Statements
10-24
Table A4: Capital appropriations by portfolio (continued)
2002-03 2003-04 2004-05 2005-06 2006-07$m $m $m $m $m
Veterans' AffairsDepartment of Veterans' Affairs 7 5 0 0 0Total 7 5 0 0 0Small agencies 98 9 5 26 5Whole of government and inter-agency
amounts(a) 0 0 0 0 0Total capital appropriations 4,815 2,842 2,150 2,486 2,711
Estimates Projections
(a) Estimates of inter-agency transactions are included in the whole of government and inter-agencyamounts. The entry for each portfolio does not include eliminations for inter-agency transactions withinthat portfolio.
Statement 10: Australian Accounting Standard No. 31
10-25
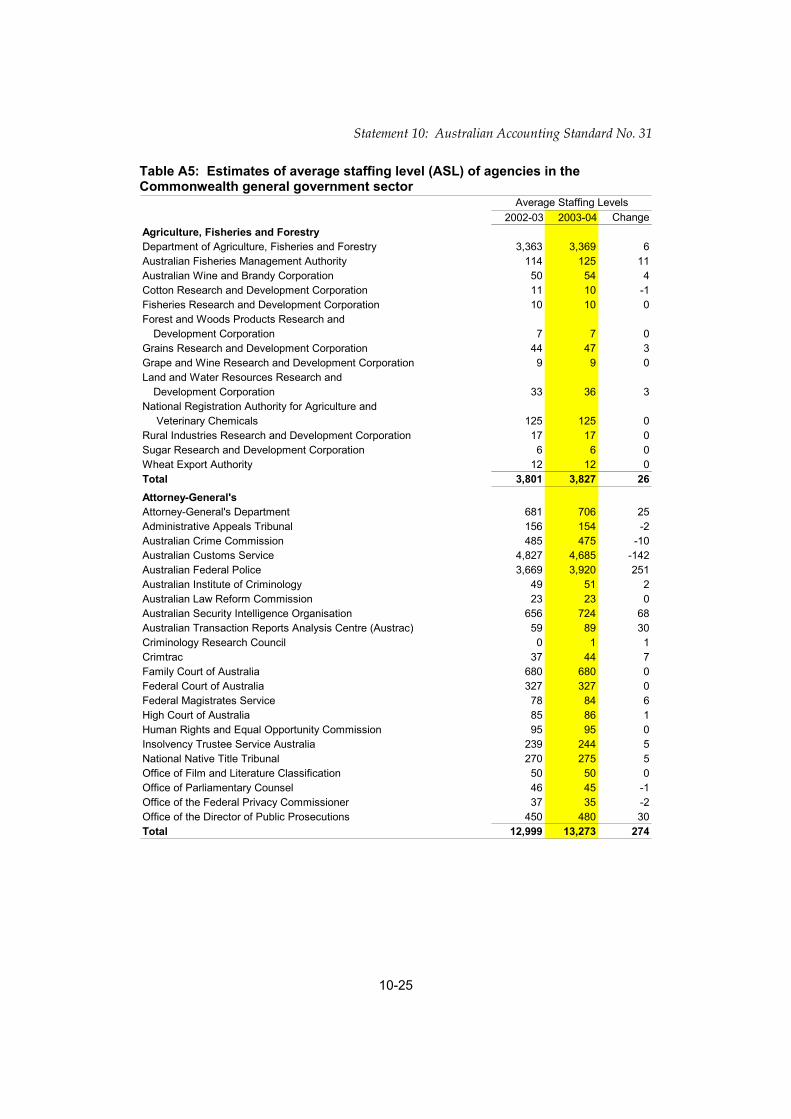
Table A5: Estimates of average staffing level (ASL) of agencies in theCommonwealth general government sector
2002-03 2003-04 ChangeAgriculture, Fisheries and ForestryDepartment of Agriculture, Fisheries and Forestry 3,363 3,369 6Australian Fisheries Management Authority 114 125 11Australian Wine and Brandy Corporation 50 54 4Cotton Research and Development Corporation 11 10 -1Fisheries Research and Development Corporation 10 10 0Forest and Woods Products Research and
Development Corporation 7 7 0Grains Research and Development Corporation 44 47 3Grape and Wine Research and Development Corporation 9 9 0Land and Water Resources Research and
Development Corporation 33 36 3National Registration Authority for Agriculture and
Veterinary Chemicals 125 125 0Rural Industries Research and Development Corporation 17 17 0Sugar Research and Development Corporation 6 6 0Wheat Export Authority 12 12 0Total 3,801 3,827 26Attorney-General'sAttorney-General's Department 681 706 25Administrative Appeals Tribunal 156 154 -2Australian Crime Commission 485 475 -10Australian Customs Service 4,827 4,685 -142Australian Federal Police 3,669 3,920 251Australian Institute of Criminology 49 51 2Australian Law Reform Commission 23 23 0Australian Security Intelligence Organisation 656 724 68Australian Transaction Reports Analysis Centre (Austrac) 59 89 30Criminology Research Council 0 1 1Crimtrac 37 44 7Family Court of Australia 680 680 0Federal Court of Australia 327 327 0Federal Magistrates Service 78 84 6High Court of Australia 85 86 1Human Rights and Equal Opportunity Commission 95 95 0Insolvency Trustee Service Australia 239 244 5National Native Title Tribunal 270 275 5Office of Film and Literature Classification 50 50 0Office of Parliamentary Counsel 46 45 -1Office of the Federal Privacy Commissioner 37 35 -2Office of the Director of Public Prosecutions 450 480 30Total 12,999 13,273 274
Average Staffing Levels
Part 4: Financial Reporting Standards and Financial Statements
10-26
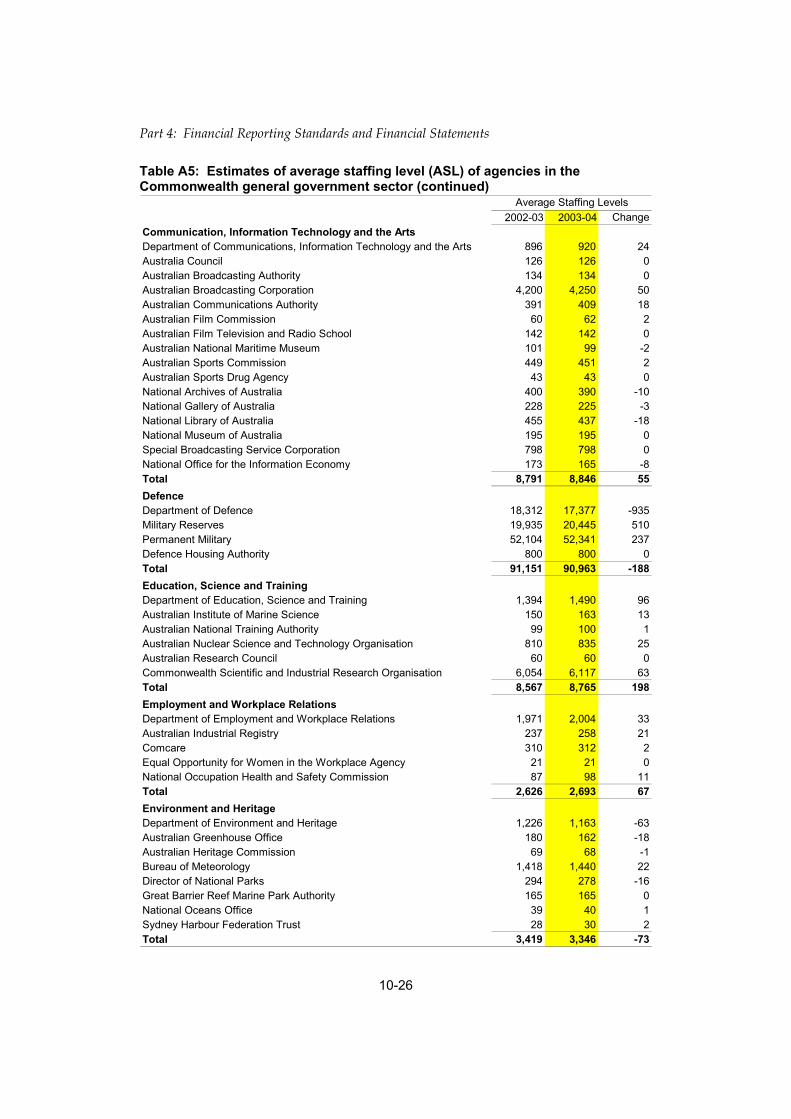
Table A5: Estimates of average staffing level (ASL) of agencies in theCommonwealth general government sector (continued)
2002-03 2003-04 ChangeCommunication, Information Technology and the ArtsDepartment of Communications, Information Technology and the Arts 896 920 24Australia Council 126 126 0Australian Broadcasting Authority 134 134 0Australian Broadcasting Corporation 4,200 4,250 50Australian Communications Authority 391 409 18Australian Film Commission 60 62 2Australian Film Television and Radio School 142 142 0Australian National Maritime Museum 101 99 -2Australian Sports Commission 449 451 2Australian Sports Drug Agency 43 43 0National Archives of Australia 400 390 -10National Gallery of Australia 228 225 -3National Library of Australia 455 437 -18National Museum of Australia 195 195 0Special Broadcasting Service Corporation 798 798 0National Office for the Information Economy 173 165 -8Total 8,791 8,846 55DefenceDepartment of Defence 18,312 17,377 -935Military Reserves 19,935 20,445 510Permanent Military 52,104 52,341 237Defence Housing Authority 800 800 0Total 91,151 90,963 -188Education, Science and TrainingDepartment of Education, Science and Training 1,394 1,490 96Australian Institute of Marine Science 150 163 13Australian National Training Authority 99 100 1Australian Nuclear Science and Technology Organisation 810 835 25Australian Research Council 60 60 0Commonwealth Scientific and Industrial Research Organisation 6,054 6,117 63Total 8,567 8,765 198Employment and Workplace RelationsDepartment of Employment and Workplace Relations 1,971 2,004 33Australian Industrial Registry 237 258 21Comcare 310 312 2Equal Opportunity for Women in the Workplace Agency 21 21 0National Occupation Health and Safety Commission 87 98 11Total 2,626 2,693 67Environment and HeritageDepartment of Environment and Heritage 1,226 1,163 -63Australian Greenhouse Office 180 162 -18Australian Heritage Commission 69 68 -1Bureau of Meteorology 1,418 1,440 22Director of National Parks 294 278 -16Great Barrier Reef Marine Park Authority 165 165 0National Oceans Office 39 40 1Sydney Harbour Federation Trust 28 30 2Total 3,419 3,346 -73
Average Staffing Levels

Statement 10: Australian Accounting Standard No. 31
10-27
Table A5: Estimates of average staffing level (ASL) of agencies in theCommonwealth general government sector (continued)
2002-03 2003-04 ChangeFamily and Community ServicesDepartment of Family and Community Services 4,291 4,674 383Australian Institute of Family Studies 40 41 1Centrelink 23,750 23,680 -70Total 28,081 28,395 314Finance and AdministrationDepartment of Finance and Administration 804 871 67Australian Electoral Commission 794 771 -23Commonwealth Grants Commission 48 48 0Commonwealth Superannuation Administration (ComSuper) 346 351 5Total 1,992 2,041 49Foreign Affairs and TradeDepartment of Foreign Affairs and Trade 3,196 3,154 -42AusAID 511 488 -23Australia-Japan Foundation 6 6 0Australian Centre for International Agricultural Research 50 47 -3Australian Trade Commission 1,002 1,024 22Total 4,765 4,719 -46Health and AgeingDepartment of Health and Ageing 3,470 3,551 81Aged Care Standards and Accreditation Agency 179 174 -5Australian Institute of Health and Welfare 72 72 0Australian Radiation Protection and Nuclear Safety Agency 127 128 1Food Standards Australia New Zealand 129 128 -1Health Insurance Commission 4,100 4,100 0Private Health Insurance Administration Council 11 12 1Private Health Insurance Ombudsman 8 8 0Professional Services Review 28 35 7Total 8,124 8,208 84Immigration and Multicultural and Indigenous AffairsDepartment of Immigration and Multicultural and Indigenous Affairs 4,488 4,552 64Aboriginal and Torres Strait Islander Commission 1,217 75 -1,142Aboriginal and Torres Strait Islander Services 0 1,172 1,172Aboriginal Hostels Ltd 405 405 0Australian Institute of Aboriginal and Torres Strait Islander Studies 90 80 -10Indigenous Business Australia 18 18 0Indigenous Land Corporation 124 127 3Migration Review Tribunal 203 207 4Refugee Review Tribunal 216 224 8Torres Strait Regional Authority 38 39 1Total 6,799 6,899 100Industry Tourism and ResourcesDepartment of Industry, Tourism and Resources 1,437 1,460 23Geoscience Australia 560 560 0Australian Tourist Commission 212 212 0IP Australia 785 807 22National Standards Commission 33 32 -1Total 3,027 3,071 44
Average Staffing Levels

Part 4: Financial Reporting Standards and Financial Statements
10-28
Table A5: Estimates of average staffing level (ASL) of agencies in theCommonwealth general government sector (continued)
2002-03 2003-04 ChangeParliamentDepartment of the Senate 227 227 0Department of the House of Representatives 232 232 0Department of the Parliamentary Library 167 167 0Department of Parliamentary Reporting Staff 317 320 3Joint House Department 261 260 -1Total 1,204 1,206 2Prime Minister and CabinetDepartment of Prime Minister and Cabinet 344 374 30Australian National Audit Office 280 290 10Australian Public Service Commission 172 175 3Office of the Inspector-General of Intelligence and Security 3 5 2Office of National Assessments 60 65 5Office of the Commonwealth Ombudsman 82 85 3Office of the Official Secretary to the Governor-General 75 77 2Total 1,016 1,071 55Transport and Regional ServicesDepartment of Transport and Regional Services 1,105 1,104 -1Australian Maritime Safety Authority 233 237 4Civil Aviation Safety Authority 680 680 0National Capital Authority 82 85 3Total 2,100 2,106 6TreasuryDepartment of the Treasury 816 816 0Australian Bureau of Statistics 3,050 2,825 -225Australian Competition and Consumer Commission 460 460 0Australian Office of Financial Management 33 37 4Australian Prudential Regulation Authority 450 475 25Australian Securities and Investment Commission 1,362 1,460 98Australian Taxation Office 19,700 20,930 1,230Corporations and Markets Advisory Committee 3 3 0National Competition Council 20 20 0Productivity Commission 200 195 -5Total 26,094 27,221 1,127Veterans' AffairsDepartment of Veterans' Affairs 2,453 2,451 -2Australian War Memorial 275 277 2Total 2,728 2,728 0
Average Staffing Levels
Note: This table includes estimates of ASL provided by general government sector agencies. ASL figuresreflect the average number of employees receiving salary or wages over the financial year, with adjustmentsfor casual and part-time staff, to show the full time equivalent. This also includes non-uniformed staff andoverseas personnel.