states of geological survey - alaska
TRANSCRIPT

UNITED STATES DEPARTMENT OF INTERIOR
GEOLOGICAL SURVEY
CONTINUOUS ACOUSTIC PROFILES AND
SEDIMENTOLOGIC DATA FROM R/V SEA
CRUISE (S-1-76) 1 EASTERN GULF OF ALASKA
Paul R. Carlson, Bruce F. Molnia and wi l l iarn P. Levy
OPEN FILE REPORT 80-65
T h i s report i s p r e l i m i n a r y and has no t been e d i t e d o r reviewed f o r conformity with Geological Survey standards and nomenclature
Menlo P a r k , Cal i fornia

- - !- 1
INTRODUCTION
In June 1976, a scientific party from the U . S . Geological Survey, oonducted a high resolution geophysical and seafloor sediment sampling cruise (S-1-76) in the eastern Gulf of Alaska between Sitka and Seward (fig. I), to obtain data on seafloor hazards pertinent to OCS oil and gas lease sale activity. We had previously participated in four cruises to this area and had begun developing a regional "picture" o f the geologic hazards on the continental shelf, between Prince William Sound and Yakutat Bay. Cruise S-1-76 was planned to investigate, in greater detail, specific hazards previously identified on this portion of the shelf and to run some reconnaissance lines on the shelf east of Yakutat Bay. In addition to the data collected on the shelf, we used this opportunity to investigate the three major navigable bays that interupt the coast line in this portion of the eastern Gulf of Alaska (Lituya Bay, Yakutat Bay, and Icy Bay-fig. 1).
This report contains a list of the seismic reflection records and shipboard logs that are publicly available and includes trackline maps and a text. Included in the report are: (1) examples of characteristic seismic profiles, ( 2 ) descriptions of geologic hazards observed on specific profiles, and ( 3 ) summary descriptions of sediment samples and bottom photographs. Microfilm or paper prints of the seismic reflection records and shipboard logs are available for viewing:
(11 . U.S. Geological Survey Pacific-Arctic Branch of Marine Geology, Room B171 345 Middlefield Road Menlo Park, CA 94025 Phone 415-323-8111, ext. 7132
or for purchase:
(2) National Geophysical and Solar Terrestrial Data Center
EDS/NOAA Boulder, Colorado 80302
Acknowledgements
The cruise was supported jointly by the U.S. Geological Survey and by the Bureau of Land Management through interagency agreement with the National Oceanic and Atmospheric Administration, under which a multi-year environmental hazards study of the Alaskan continental shelf is managed by the OCSEAP office.
We appreciate the assistance provided by the scientific personnel on the cruise (Andrew Alden, Darlene Condra, John Cudnohufsky, Paul Fuller, Rich Garlow, Jack Hampson, Harry Hill, Dennis Kerr, Steve Kittelson, us tin Post, Paula Quinterno, George Redden, Glen Schumacher, Steve Wallace and Elias Zendejas); the ship's Captain (Alan McClenaghan) and crew; and the shore-based navigation group (Richard Tagg and William Clique).

SEA SOUNDER cruise S-1-76 left Sitka June 5, 1976, for work in oCS lease sale area 39 (Eastern Gulf of Alaska) and arrived at Seward June 16, 1976. Maps 1, 2, and 3 show the tracklines of the cruise, except transit line 600 shown on figure 4 and details of t h e Lituya Bay lines on figure 11; both samples and tracklines are numbered sequentially. Navigation positions were determined by satellite, Loran A t miniranger, radar and dead reckoning. Not all systems were used simultaneously: Table 1 shows the type of naviga- tion systems that were used for the various segments of the cruise.
Seismic reflection records were made using the following equipment: 90 kiloJoule sparker (857 km of trackline), 800 Joule boomer (1512 km) and 3.5 kiloHertz transducer (2300 km) along t h e tracklines shown on maps 1-3. Records were also collected with a side-scan sonar (200 km) and a magnetometer (800 km) along selected tracklines. Sediment samples (86 total) were collected with a large gravity corer ( 9 cm I.D. x 3 to 6 m length barrels) and with grab samplers (Van Veen and Shipek). The location of these sample stations are shown on the trackline maps 1-3. A 35 nun bottom camera was deployed at three stations and an underwater television camera at eleven stations.
Examples of the annotated seismic records are shown in figure 2, and examples of the shipboard logs for the seismic systems are included in figure 3. The sequence of events on the cruise is summarized in table 1, the descriptions and locations of the sediment samples are listed in table 2, and summaries of the results of television and bottom camera stations are compiled in tables 3 and 4.
DISCUSSION OF DATA
Brief discussions of major features observed with seismic profiling, sediment sampling, television, or seabed photographic viewing techniques follow for the various geographic areas. For ease in description, the study region has been divided into 14 areas (fig. 1). The areas will be discussed in the approximate order sampled: (1) Sitka to Cross Sound, ( 2 ) Cross Sound to Lituya Bay, ( 3 ) Lituya Bay, ( 4 ) Fairweather Ground, (5) Alsek and Yakutat Sea Valleys, (6) Yakutat Bay, (7) Malaspina Glacier nearshore area, (8) Icy Bay, (9) Bering Trough, (10) Kayak Island East, (11) Kayak Trough, (12) Copper River Prodelta, (13) Tarr Bank, and (14) Hinchinbrook Sea Valley.
(1) Sitka to Cross Sound (Line 600 - sample 600). Line 600 is a transit line from Sitka to Cross Sound along which only the 3.5 kHz system was operated. Figure 4 is a sketch map showing the location of this trackline. The first third of this line (600) traverses a very hard, irregular, seafloor between Baranof, Kruzof and smaller islands that consist primarily of Triassic- Jurassic metasedimentary rocks (Loney and others, 1975). In Salisbury Sound, the hard bedrock seafloor persists, but pods of soft sediment up to 20 m thick, are present in the numerous irregular depressions crossed by this trackline along the length of the sound. The hard, knobby bedrock bottom continues to about 0300 hrs (fig. 5) at which point a change in seafloor morphology occurs. A much flatter seafloor persists to the end of trackline

L . 600. A grab sample consisting of gravelly, sandy mud was collected at the
end of line 600. The pebbles and cobbles (up to 10 cm in diameter) were rounded to sub-rounded, granitic and metasedimentary rock types with en- crusting organisms.
(2 ) Cross Sound to Lituya Bay (lines 601-615; samples 601-612). Seismic profiles were obtained in this area for a three-fold purpose: (1) to check -
for evidence of glacial moraines within or adjacent to Cross Sound; (2) to investigate the seaward extension of the Fairweather fault between Palma Bay and Cross Sound; and (3) to see if the seismic profiles would show any glacial channeling on this portion of the shelf.
a. ~koss Sound, the northernmost outlet of the famed "inland passage," is 15 km wide, 20 km long and contains the landward part of a large sea valley that extends to the edge of the continental shelf. The seafloor underlying Cross Sound is very rugged containing numerous bedrock knobs and crags, morphology that is consistent with the rugged coastline of the adjacent land masses mapped as Mesozoic metasedimentary and metamorphic rocks (Plafker, 1967a, Loney and others, 1975; and Brew and others, 1978).
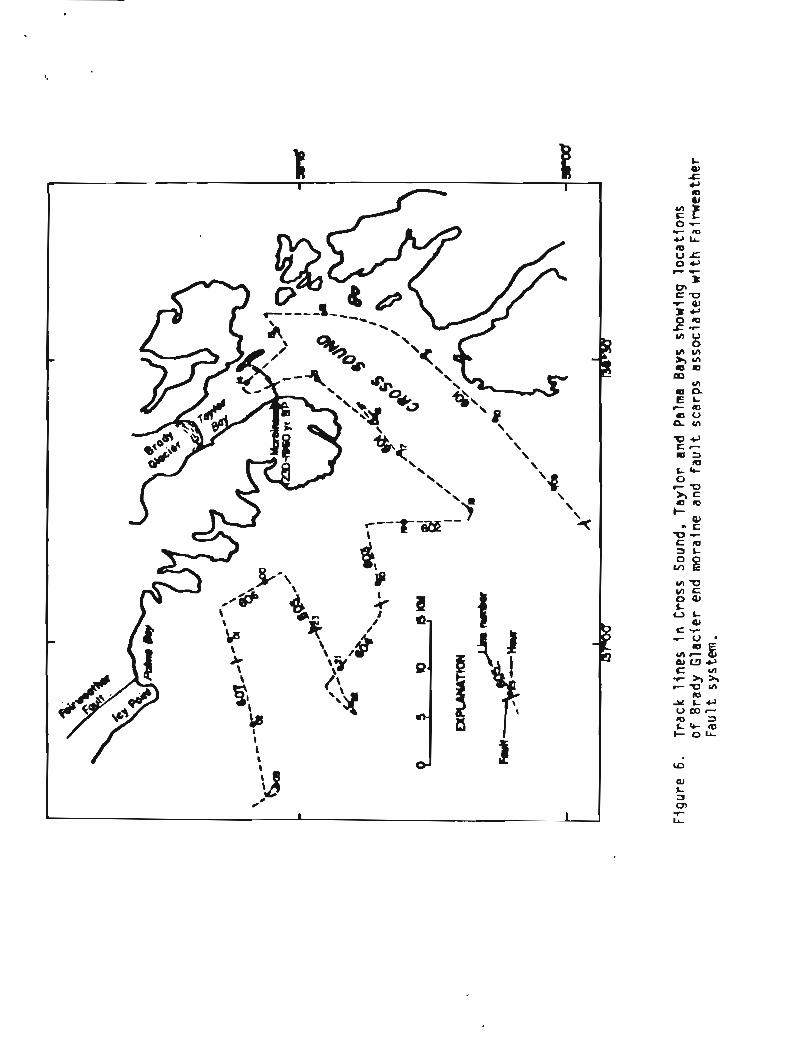
The only recognized moraine along the Cross Sound line (601) was profiled in Taylor Bay where a prominent ridge (fig. 6) extends across the mouth of the bay. This ridge, that has relief of 40-70 m (fig. 7) is one of the end moraines deposited by the Brady Glacier. Morainal material cropping out along the shoreline of Taylor Bay (Derksen, 19761, is located along the trend of the submarine ridge shown on our profiles (fig. 6). Derksen (1976) has assigned an early Neoglacial age ('r, 1230-1960 yrs. B.P.) to the onshore remnants of this moraine. Both crossings of the moraine show some discontinuous reflectors in the 15-20 m thick sequence of sediment located seaward of the moraine.
Outwash material from the Brady Glacier is being ponded behind the end moraine. The thickness of this outwash sediment is as great as 50 m. The seismic records show distinct, continuous, parallel bedding of the modern sediment that suggests deposition of glacial flour perhaps inter- spersed with layers of coarser clastics transported by slump-triggered density or turbidity currents. If we assume that this sediment has been accumulating for the past 1230 years, then the 50 m thick layer of sediment has been accumulating at a rate of about 4 cm/yr. In the inner part of Taylor Bay, the rate of sediment accumulation is about an order of magni- tude greater (Molnia, 1979). The seismic line that traverses the west side of Taylor Bay (fig. 8) shows what seem to be large bed forms with some internal reflectors. The largest of these features has a height of 10 m and a wave length of 0.2 km (fig. 8). Until additional profiles and some sediment samples are obtained, the makeup and orientation of these features will remain unknown.
b. Palma Bay, a re-entrant in the shoreline 30 km north of Cross Sound, marks the southeastern end of the Fairweather Fault as mapped on land by Plafker (1967a). This fault is believed to be a transform boundary between the North American and Pacific crustal plates along which average displace- ment has occurred at a rate of approximately 5 cm/yr (Plafker and others, 1978). Lines 601-607 were planned to cross the seaward extension of the
T >
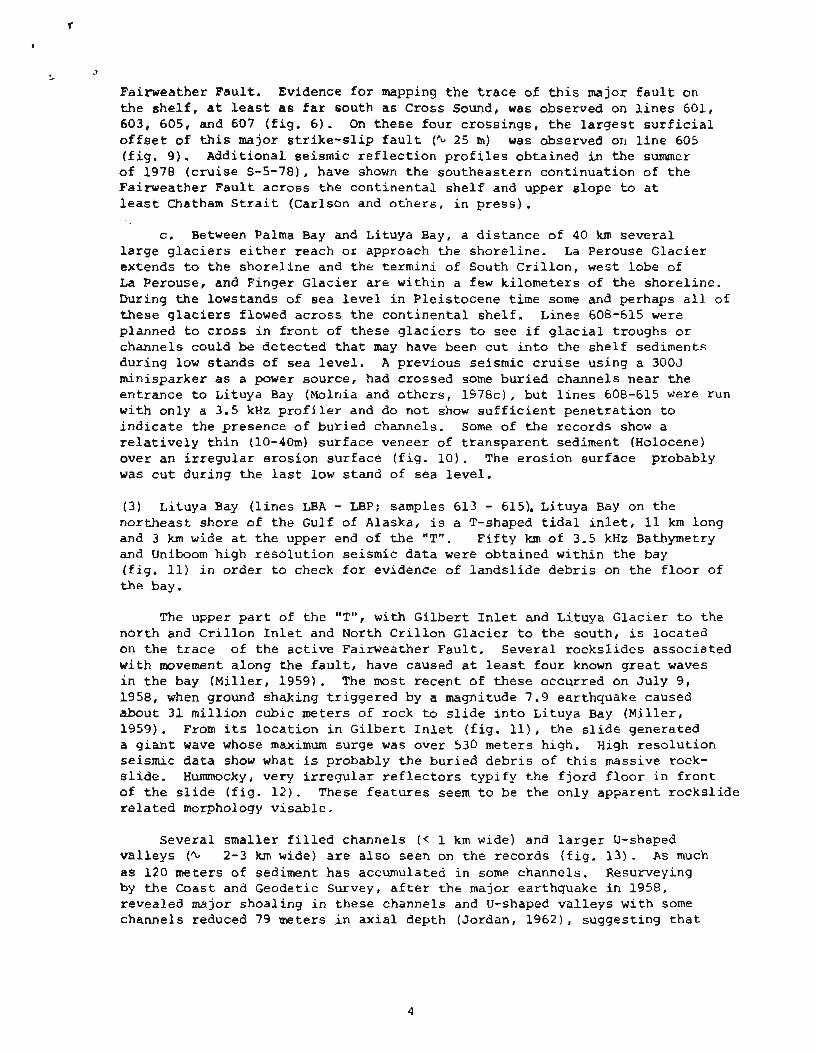
Fai rweather Fau l t . Evidence f o r mapping t h e trace of t h i s major f a u l t on the s h e l f , a t least as far south a s Cross Sound, was observed on l i n e s 601, 603, 605, and 607 (fig. 6) . On t h e s e fou r c ros s ings , t h e l a r g e s t s u r f i c i a l offset of this major s t r i k e - s l i p f a u l t (Q 25 rn) was observed on l i n e 605 (fig. 9) . Additional se i smic r e f l e c t i o n p r o f i l e s ob ta ined in t h e summer of 1978 ( c r u i s e S-5-78), have shown t h e sou theas t e rn con t inua t ion of t h e Fa i rweather F a u l t a c ros s the c o n t i n e n t a l s h e l f and upper s lope t o a t l e a s t Chatham S t r a i t (Carlson and o t h e r s , i n p r e s s ) .
c. Between Palma Bay and Lituya Bay, a d i s t a n c e of 40 km s e v e r a l l a r g e g l a c i e r s e i t h e r reach o r approach t h e sho re l i ne . La Perouse G lac i e r ex tends t o t h e s h o r e l i n e and t h e t e rmin i of South C r i l l o n , west lobe of La Perouse, and Finger G lac i e r a r e wi th in a few k i lometers of t h e sho re l i ne . During the lowstands of sea l e v e l i n P l e i s tocene time some and perhaps a l l of t h e s e g l a c i e r s flowed ac ros s t h e c o n t i n e n t a l s h e l f . L ines 608-615 were planned t o cross i n f r o n t of t h e s e g l a c i e r s t o see i f g l a c i a l t roughs o r channels could be d e t e c t e d t h a t may have been c u t i n t o t h e s h e l f sediments dur ing l o w s t a n d s of sea level. A previous seismic c r u i s e us ing a 300J minisparker as a power source, had c rossed some bur i ed channels near t h e en t r ance t o Li tuya Bay (Molnia and o t h e r s , 1978c) , bu t l i n e s 608-615 were run wi th only a 3.5 kHz p r o f i l e r and do no t show s u f f i c i e n t p e n e t r a t i o n t o i n d i c a t e t h e presence of bu r i ed channels. Some of t h e records show a r e l a t i v e l y t h i n (10-40m) s u r f a c e veneer of t r a n s p a r e n t sediment (Holocene) over an i r r e g u l a r e ros ion s u r f a c e ( f i g . 1 0 ) . The e ros ion su r f ace pxobably was c u t dur ing t h e l a s t l o w s t and of sea l e v e l .
(3) Li tuya Bay ( l i n e s LBA - LBP; samples 613 - 615). Li tuya Bay on t h e n o r t h e a s t shore of t h e Gulf of Alaska, i s a T-shaped t i d a l i n l e t , 11 km long and 3 km wide a t t h e upper end of t h e "T". F i f t y km of 3.5 kHz Bathymetry and Uniboom high r e s o l u t i o n se i smic d a t a were ob ta ined wi th in t h e bay ( f i g . 11) i n oxder t o check for evidence of l a n d s l i d e d e b r i s on t h e f l o o r of t h e bay.
The upper part of t h e "T", wi th G i l b e r t I n l e t and Li tuya G lac i e r t o t h e n o r t h and C r i l l o n I n l e t and North C r i l l o n G lac i e r t o t h e south , i s loca t ed on t h e t r a c e o f t h e a c t i v e Fairweather Fau l t . Severa l r o c k s l i d e s a s soc i a t ed w i th movement a long the f a u l t , have caused a t l e a s t f o u r known g r e a t waves i n t h e bay (Miller, 1959). The most r e c e n t o f t h e s e occurred on J u l y 9 , 1958, when ground shaking t r i g g e r e d by a magnitude 7.9 ear thquake caused about 31 m i l l i o n cubic meters of rock t o s l i d e i n t o Li tuya Bay (Mi l l e r , 1959). From i t s l o c a t i o n i n G i l b e r t I n l e t ( f i g . ll), the s l i d e generated a g i a n t wave whose maximum surge was over 530 meters high. High r e s o l u t i o n se i smic d a t a show what is probably the bu r i ed d e b r i s of t h i s massive rock- s l i d e . Hummocky, very i r r e g u l a r r e f l e c t o r s t y p i f y t h e f j o r d f l o o r i n f r o n t of t h e s l i d e ( f i g . 1 2 ) . These f e a t u r e s seem t o be t h e on ly apparent r o c k s l i d e r e l a t e d morphology v i s a b l e .
Severa l sma l l e r f i l l e d channels (< 1 k m wide) and Larger U-shaped v a l l e y s (Q 2-3 km wide) a r e a l so seen on the r eco rds ( f i g . 13). As much as 120 meters of sediment has accumulated i n some channels . Resurveying by t h e Coast and Geodetic Survey, a f t e r t h e major ear thquake i n 1958, revea led major shoa l ing i n t h e s e channels and U-shaped v a l l e y s wi th some channels reduced 79 meters i n a x i a l depth ( Jordan , 1962) , sugges t ing t h a t

I debris f r o m t h e r o c k s l i d e s has been a major s o u r c e of t h e sediment accumu- l a t i n g i n Lituya Bay. Bedrock is s e e n h t h c ropp ing o u t and b u r i e d under a t h i n sediment veneer . The r o c k s on l a n d a d j a c e n t t o t h i s area have been mapped as c r y s t a l l i n e complex, metasediments , and a moderate ly metamorphosed v o l c a n i c group, a l l Mesozoic i n age ( P l a f k e r , 1967a) . G e n e r a l l y bedrock c l o s e t o t h e s u r f a c e i s conf ined t o t h e s t e e p s i d e s o f t h e bay o r forms t h e Cenotaph I s l a n d p l a t f o r m .
(41 L i t u y a Bay t o Fa imea therGround t o Alsek Sea Val ley ( l i n e s 616-619, samples 615-6261. L ine 616 i s a t r a n s i t l i n e which b e g i n s i n L i t u y a Bay and e x t e n d s a c r o s s t h e c o n t i n e n t a l s h e l f t o Fa i rwea ther Ground, a s t r u c t u r a l and topograph ic h i g h c l o s e t o t h e s h e l f edge. The n e a r s h o r e end of t h e l i n e shows a l a y e r e d Holocene s e c t i o n of vary ing t h i c k n e s s o v e r l y i n g g l a c i a l l y s c u l p t u r e d bedrock. The Holocene s e c t i o n r e a c h e s a maximum t h i c k n e s s o f a b o u t 100 m. Record q u a l i t y i s n o i s y and t h e g l a c i a l l y modif ied bedrock is l o s t abou t 0100 h r s . T h i s bedrock r e f l e c t o r r e a p p e a r s occa- s i o n a l l y t h e r e a f t e r . Beginning a t 0245 h r s . , t he s e a f l o o r becomes more i r r e g u l a r t h a n n e a r e r t o s h o r e and is u n d e r l a i n by a s e r i e s o f d i p p i n g and eroded r e f l e c t o r s . Small c h a n n e l s are p r e s e n t i n t h e s u b s u r f a c e r e f l e c t o r s . These c h a n n e l s p e r s i s t to a t least 0400 h r s . when r e c o r d q u a l i t y a g a i n d e t e r i o r a t e s .
Beginning a t 0555 h r s . , s t e e p l y d i p p i n g sub-sur face r e f l e c t o r s , c h a r a c t e r i s - t i c o f Fa i rwea ther Ground (Molnia, and o t h e r s 1 9 7 8 ~ ) f i r s t appear . The F a i r w e a t h e r Ground area is c h a r a c t e r i z e d by rocky o u t c r o p s w i t h p o c k e t s and ponds o f sediment . R e l i e f i s v a r i a b l e w i t h t h e s h a l l o w e s t d e p t h b e i n g less t h a n 40 rn.
L i n e s 617, 618, and FA-1 a l l show t h e i r r e g u l a r Fa i rwea ther Ground morphology s e e n on t h e end o f l i n e 616. Samples 615-625c were c o l l e c t e d on t h e s e t h r e e l i n e s . The samples i n c l u d e mud and small rock f ragments .
L i n e 619 i s a t r a n s i t l i n e from Fa i rwea ther Ground t o t h e edge o f t h e c o n t i n e n t a l s h e l f and t h e n down t h e c o n t i n e n t a l s l o p e . An u n u s u a l l y narrow p i n n a c l e o f basement c r o p s o u t abou t 2145-2148 h r s . The s h e l f b reak appears a t 2218 h r s a t a d e p t h of a b o u t 255 m. Evidence o f slumping and p o s s i b l y f a u l t i n g e x i s t a t and n e a r t h e s h e l f break.
(5) Alsek and Yakutat Sea V a l l e y s ( l i n e s 620-625; samples 627-634). These two sea v a l l e y s a r e prominent i n c i s i o n s i n the c o n t i n e n t a l s h e l f . Se i smic l i n e s were r u n a l o n g t h e a x i s o f Alsek and t h e upper p a r t o f Yakutat Sea V a l l e y s t o de te rmine t h i c k n e s s and geometry of sediment f i l l , t o s t u d y the s e i s m i c s t r a t i g r a p h y o f t h e s e c r o s s - s h e l f c o n d u i t s f o r w a t e r and sediment , and t o observe t h e types o f s t r u c t u r a l f e a t u r e s u n d e r l y i n g t h e s e s e a v a l l e y s .
Alsek Sea V a l l e y b e g i n s abou t 5 km seaward of Dry Bay i n 80 m o f wa te r . T h i s exceed ing ly s t r a i g h t , 20 km wide, U-shaped v a l l e y ex tends 90 km t o t h e s h e l f edge a t a d e p t h of 215 m. The d e e p e s t parts o f t h e s e a v a l l e y r e a c h 250 rn below s e a l e v e l n e a r a middle s h e l f l o c a t i o n .
The 90KJ s p a r k e r p r o f i l e o b t a i n e d a l o n g t h e lower h a l f of l i n e 620 shows a wel l -de f ined a n g u l a r unconformity covered by 100-150 m o f Holocene sediment ( f i g . 1 4 ) . Below t h e unconformity , t h e r e f l e c t o r s d i p g e n t l y land- ward on t h e inner two- th i rds o f t h e s h e l f . On t h e o u t e r one- th i rd of t h e s h e l f , t h e d i p becomes s t e e p e r and t h e s t r u c t u r e s more complex. A t t h e o u t e r

' edge of the shelf (0040 hrs, line 6201, the Holocene sediment wedges out and the underlying more lithified strata crop out. At the shelf break, these strata are faulted and form a prominent bedrock knob or ridge, which is probably a continuation of the shelf edge structural high at Fairweather Ground located east of the sea valley.
A t the shoreward end of Alsek Sea Valley (1020-1110 hrs., line 620), surface irregularities and discontinuous reflectors suggest sliding within the upper 10-20 m of Holocene sediment. Surficial features attributed to gas-charged sediment were seen on other high-resolution seismic records in this nearshore area off the Alsek River (Molnia and others, 1978a, and 1978~). Additional sampling is needed to determine the quantity of excess gas present in these sediments. If the sediments are "gas-charged," the influence of this gas upon the pore pressures of the sediment would create instability that could be triggered into sliding by the earthquakes and frequent storm waves that impinge on this exposed coast.
Lines 622-624 were run parallel to shore between Alsek and Yakutat Sea Valleys to see if any channels were evident in this nearshore zone. A clearly defined buried channel one km wide and filled with 20 m of fill was crossed on line 622 (Q 2200 hrs) west of Dry Bay (fig. 15). Additionally channel and cut and fill features were evident on lines 623 (2330-0040 hrs) and 624 (0430-0720 hrs). A more detailed grid of high resolution seismic lines is needed to determine the lateral extent of these channels. The buried channels and a well-defined erosion surface are covered by 20-25 m of Holocene sediment. The source o f most of the sediment was probably the 385 km long Alsek River that carries large quantities of sediment to the Gulf of Alaska (Molnia and others, 1978b) where the dominantly counterclockwise nearshore currents move the sediment to the west (Reimitz and Carlson, 1975).
Yakutat Sea Valley is an anomally among the sea valleys that cross the continental shelf in the eastern Gulf of Alaska. The unusual shape of the valley appears to result from structural control (Carlson and others, 1977a; Schwab, Bruns and von Huene, in press). The upper end of Yakutat Sea Valley parallels the coastline seaward of Yakutat for Q 90 km and then the valley makes a broad turn extending to the shelf break, a distance of Q 70 km. The 90 W sparker record run along the thalweg of the upper end of the sea valley shows 50-100 m of Holocene sediment overlying well-defined gently undulating reflectors at 100-150 m and 200-250 m deep in the section. In a few places, some channel-like features are outlined by occasional reflectors below the lowermost continuous reflector. A filled channel is present where the sea valley makes the broad bend (fig. 16). This channel is about 10 km in width and has a relief of nearly 100 m. Additional crossings are needed to determine if this buried channel coincides completely with the present Yakutat Sea Valley or if it represents a branch of an ancient sea valley.
(6) Yakutat Bay (lines 635-643). This glacial fjord, that was last filled by the Hubbard Glacier between 700 and 1000 yrs ago (Plafker and Miller, 19581, contains the only community with harbor facilities along a 600 km stretch of coast in the eastern Gulf of Alaska between Prince William Sound and Cross Sound. Because of the possibility of discovering petroleum on the nearby continental shelf and the resulting impact of such activity on Yakutat Bay, reconnaissance seismic lines (635-643) were run to begin a preliminary geohazards survey of the bay. In addition to searching for submarine slumps and evidence for active faults, we wanted to determine the location of end moraines and the seismic characteristics of modern sediments ponded in the basins between moraines.

t There are three discrete but very irregular morainal ridges in Yakutat Bay (Carlson and others, 1978). Lines 636, 637, and 638 cross portions of the outer bay nroraine (fig. 17). Line 636 crosses a part of the basin formed by the outex moraine. This part of the basin has been filled with up to 70 m of sediment, some of which seems to have slumped off the basin's west wall (fig. 18). In addition to the sediment introduced by slumps and sedi- m?nt flows, a large amount of glacial flour has settled out from the plumes of turbid water that develop from the discharge of the numerous melt water streams that drain the large glaciers of southeastern Alaska (Reirnnitz and Carlson, 1975; Molnia and others, 1978b). If we assume deposition began in the basin 750 years ago, the average rate of sediment accumulation could be as high as 9 cm/yr. Based on additional seismic data, Carlson and others (1978) reported rates to 25 cm/yr in the basin behind the bay mouth moraine and 70 cm/yr in the basin behind the upper bay moraine (fig. 17). The maximum thickness of modern sediment in Yakutat Bay, measured on the S-1-76 records, range from 60 to 105 rn. Figure 17 shows where these thicknesses occur and how they compare with thicknesses and accumulation rates obtained from a later cruise.
(7) Malaspina Glacier nearshore (lines 626-634 and 644-656; samples 635-645). seismic and side scan sonar profiles and sediment samples were obtained on the shelf seaward of this large piedmont glacier in order to determine if an area interpreted as a submarine slump (Carlson and others, 1975; Carlson and Molnia, 1977a): had been correctly identified and if the slump is presently active. The seismic profiles and side scan sonographs from 5-1-76 and seismic data from four previous cruises were used by Carlson (1978) to reinforce the original interpretation and to more accurately delineate the area affected by slumping. The type of movement was progressive slumping along an incompetent zone of Holocene sediments 15-40 m thick. The existence of small incipient scarps detected on the side scan sonographs (fig, 19) showed active headward growth of the slump. The most likely triggering forces for continued slumping on the rapidly accumulating, underconsolidated sediments are earthquakes and/or storm waves (Carlson, 1978). Additional data such as in situ soil strength and pore water pressure measurements, however, are needed to more fully understand the mechanics of mass movement of this glacially derived sediment.
(8) Icy Bay to southeast of Bering Trough (lines 657-659, samples 646-655). Lines 657 and 658 are two short lines of variable course in Icy Bay, an enlarging bay first formed in 1904 by the retreat of Guyot Glacier (Molnia, 1977, 1979). The profiles show a series of sediment filled basins separated by moraines and bedrock ridges. The northern end of 658 is in Tyndal Fiord where the morainal ridge is shallower than 20 m (658,2300-000 hrs). ~ i n e 658 continues offshore of Icy Bay and shows a series of well bedded Holocene reflectors. Between 0410 and 0445 hrs, the Malaspina Slump (Carlson, 1978) is traversed. Line 659 crosses the flat lying sediment of the outermost can- tinental shelf and descends the continental slope. The shelf break occurs at 0619 in a water depth of about 220 m.
(9) Bering Trough (lines 660-670, samples 656-658) Line 660 is a northwest trending line that runs parallel to the axis of Bering Trough, The line begins on the continental slope, but data quality is very poor with only occasional traces of the bottom until about 1120 hrs, A Uniboom profile that begins at 1310 hrs shows a thick section of well stratified Holocene layers that dip seaward. Several sections of line 660 show evidence of slumping including 1420-1430 and 1510-16 hrs.

I Lines 661-670 were run to investigate the distribution of slumps and to investigate the possibility that part of upper Bering Trough may be underlain by buried relict ice (Molnia, 1976). Examples of the slump-related seafloax irregularities (fig. 20) in upper Bering Trough can be seen on profiles 662 (1653-17181, 662 B (1742-1812), 663 (1918- at least 20401, 664 (2255-23581, 668 (all), and 669 (start - 0703). High winds and rough seas resulted in poor quality records on lines 663-666.
(10). ~ayak Island East (lines 672-674; samples 658-659). Although high resolution seismic records were obtained east of Kayak Island, all records in this area are of poor quality with distorted surficial returns as aell as almost no subsurface penetration, due to heavy sea state conditions. Seismic profiles from other USGS cruises in the area, show a relatively smooth seafloor in this area except for several anomalous sub-bottom re- flectors that have been postulated to be indicators of gas-charged sediments (Kvenvolden and others, 1977. Samples collected at station 659 showed methane contents as high as 20 nl/qrn. Subsequent cruises have verified the anaomalous gas contents (Molnia and others, 1978a).
(11) Kayak Trough (line 675; samples 660-662; TV stations 1-3). This glacially scoured trough was investigated b cause previous seismic data showed that a
9 5 large submarine slide (5.9 x 10 m had flowed down the north wall of the trough onto the trough floor to water depths greater than 200 m (Carlson and Molnia, 1975 and 1977; Molnia and others, 1977). Although this slide had previously been described, we wished to determine more about the head wall scarp and variations in mrphology of various parts of the slide, especially numerous secondary scarps seen on the slide surface. High-resolution seismic reflection records obtained in Kayak Trough were of low quality because of the sea state and hydrophone problems, but some useful side-scan sonar and television coverage was obtained of portions of the Kayak slide area. Television station 1 located north of the head wall scarp, showed distinct symmetrical ripples and burrowing. Television stations 2 and 3 are both located south of the scarp. Station 2 in 118-125 meters of water also showed extensive burrowing and less developed ripples. An adjacent terrain was characterized by large burrow holes (2-3 cm), depressions and mounds. Features associated with the slide, seen on the tele- vision at this station included steep scarp faces (50 cm high) with broken bedding planes and large blocks of sediment.
Station 3 located in 50-62 meters of water also showed several steep scarps as well as several irregular scarplets. Again the seafloor was extensively burrowed as in station 1 and distinct symmetrical ripples were observed though many were disrupted by burrowing. All three television stations had sediments consisting of clayey silts.
(12) Copper River Prodelta (lines 676 - 679; samples 663 - 666; TV stations 4 and 5 ) . The Copper River is one of the principal sediment suppliers to the Gulf of ~laska, This area of rapid sediment accumulation (10-15 m/1000 yrs; Carlson and others, 1977b)was revisited because previously obtained seismic reflection data showed a large area of progressive slumping on the prodelta (Carlson and others, 1975). Subsequent seismic and sedimentologic data from this area of slumping indicated that high rates of sedimentation resulting in under- consolidation and excess pore pressure were causative factors in the slope instability (Carlson and Molnia, 1977; Hampton and others, 1978). There were

i
also indications of gas-charged sediments in close association with the slump mass (Kvenvolden and others, 1977)). Numerous bedforms were observed at television station 4 an line 676 in 20 meters of water on the prodelta (table 3). Complex asymmetric ripple sets showing possibly two trending directions had formed in a fine sand substrate whereas more unidirectional ripple sets were found in adjacent areas. The ripple sets appeared recent as their crests were very distinct. No burrows and few benthic fauna were observed. Television station 5, in Egg Island Trough located at the western edge of the prodelta in 90-100 meters of water, showed a bottom that was markedly different than the previous station. Here the seafloor consisted of clayey silt with extensive burrowing and distinct bioturbation. No bedforms were seen at this station.
(13) Tarr Bank (Lines 680-684; samples 667-669; TV stations 6-81. Tarr Bank is a mid-shelf topographic high located between Hinchinbrook and Middleton Islands. Seismic profiles collected on previous cruises showed an uplifted bedrock bank that appeared to be devoid of Holocene sediment. On this cruise we wanted to determine the types of surficial sediment present on Tarr Bank. These data were used for distinguishing boundaries of sediment types as mapped by Carlson and others, (197713). Seismic reflection line 680 which extends from the Copper River prodelta to Tarr Bank, has very little subsurface penetration and shows no significant morphology on the seismic reflection profiles. Tele- vision station 6 is at the end of this line off the eastern edge of Tarr Bank. Surface sediments at this station were soft muds with some benthic organisms, many burrows and branching trails visible on the television images. The surface is undulating with many large depressions (possibly caused by organisms) and some faint rippling observed.
Line 681, across Tarr Bank, showed hard rock near the surface covered by a thin layer of soft sediment, whereas lines 682 and 683 show almost no penetration. At the end of line 683, another television station was occupied. This station had the clearest video of all the Tarr Bank stations. In this area, 2 km northwest of Wessel's Reef, there was relatively little fine sediment on the seafloor. Many large boulders of probable glacial origin, sand surfaces with cobble cover, several areas of shell hash and a large population of benthic and encrusting organisms were observed throughout the area. Higher wave energy in this shallower region (60 m water depth) seems to explain the lack of mud on this bank located within 50 km of the Copper River, the principle sediment source in the northern Gulf of Alaska.
Television station 8 is very similar to station 7 as here again a sandy bottom is seen with cobble to boulder cover. Although there are many benthic organisms, there is no shell hash or mollusk shell cover in this slightly deeper area (70 m).
(14) Hinchinbrook Sea Valley (lines 685-687; TV stations 9-11). Seismic reflection profiles were collected in this area to investigate the morphology of the sea valley, to determine the thickness of Holocene sediment overlying the bedrock into which the valley was cut, and to obtain additional data over the seaward extension of the Patton Bay Fault to the southwest of Montague Island. Television stations were occupied in order to observe the type of sediment that is filling the sea valley and the types of benthic organisms present in this environment.

As line 685 approaches Hinchinbrook Sea Valley, a bedrock ridge is encountered with a scoured channel on either side. This is possibly an extension of the nearby Seal Rocks that are located to the southwest of line 685. These islands consist of subquartzose sandstones of the Eocene age Orca Group (G. Winkler, 1976, oral communication). Profiles along line 686 have a rugged terrain of steep ridges and troughs and also show channels around the margin of the ridge indicating that this channel is a fairly extensive feature.
Line 687 crosses Hinchinbrook Sea Valley, a long, relatively shallow, glacially carved sea valley (Carlson and others, 1977a). Television stations 9 and 10 were deployed in and on the flank of the sea valley respectively. Both stations are in soft muddy sediment. Suspended sediment possibly originating from the Copper River, is present in the water column. Many benthic organisms are seen at these sites with many associated burrows and tracks. Another tele- vision station along the sea valley (station 11) has abundant suspended sediment in the water column and a discontinuous cobble cover over soft muddy sediment that contains numerous burrows and tracks.
Surface faults seen on profile 687 (fig. 21) fall along the postulated submarine extension of the Patton Bay fault on Montague Island. The breaks in the surface observed on seismic reflection profiles lie within a tectonically active zone of crustal shortening and uplift associated with the 1964 earthquake (Plafker, 1967b). Other possible fault traces are seen along this line that may correlate with faults on land, but additional surveys are needed to deter- mine the extent of these fault scarps.
Some possible morainal material is seen on line 687 near Resurrection Bay in the form of many hard parabolic reflectors and irregular surface features that appear at this Bay's entrance.

References Cited
Brew, D. A,, Johnson, B. R., Grybeck, Donald, Griscom, Andrew, Barnes, D. F . , Kimball, A. I,., Still, J. C., and Ratajl, J. L., 1978, Mineral resources of the Glacier Bay National Monument Wilderness Study Area, Alaska: U.S. Geological Survey Open File Report 78-494, 665 p., 6 maps.
Carlson, P. R., 1978, Holocene slump on Continental shelf off ~alaspina Glacier, Gulf of Alaska: Am. Assoc. Petroleum Geol. Bull., v. 62, p. 2412-2426.
Carlson, P. R., Bruns, T. R., and Molnia, B. F., 1975, Submarine slides and nearsurface faults, northern Gulf of Alaska: U.S. Geol. Survey Open-file Report No. 75-504, 6 p.
Carlson, P. R., Bruns, T. R., Molnia, B. F., and Hampson, Jr., J. C., 1977a, Submarine valleys on the continental shelf, northeastern Gulf of Alaska: Geol. Soc. America Abstracts with Programs, v. 9, no. 7, p. 921.
Carlson, P. R., and Molnia, B. F., 1975, Massive submarine slide in the Gulf of Alaska: Geol. Soc. America Abstracts with Programs, v. 7, no. 7, p. 1018.
Carlson, P. R. and Molnia, B. F., 1977, Submarine faults and slides on the continental shelf, northern Gulf of Alaska: Marine Geotechnology, v. 2, no. 1, p. 275-290.
Carlson, P. R., Molnia, B. F., Kittelson, S. C. and Hampson, J. C., Jr., 1977b, Distribution of bottom sediments on the continental shelf, northern Gulf of Alaska: U.S. Geol. Survey Miscellaneous field studies maps and text, MF 876. 2 map sheets and 13 p. pamphlet.
Carlson, P . R., Molnia, B. F., Hampson, J. C., Jr., Post, Austin, and Atwood, T. J., 1978, Post-deglaciation sedimentation in Yakutat Bay, Alaska: Transactions, Am. Geophysical Union, EOS, v. 59, p. 296.
Carlson, Paul R., Plafker, George, Bruns, Terry R., and Levy, William P . r in press, Seaward extension of the Fairweather fault: U.S. Geological Survey Circular.
Derksen, S. J., 1976, Glacial geology of the Brady Glacier region, Alaska: Xnst. Polar Studies Rept. 60, The Ohio State Univ., Columbus, Ohio, 97 p.
Harnpton, M. A * , Bouma, A. H., Carlson, P. R., Molnia, B. F., Clukey, E. C., and Sangrey, D. A. , 1978, Quantitative study of slope instability in the Gulf of Alaska: 10th Offshore Technology Conference, Houston, Tex., Proceedings, v. 4, p. 2307-2318.
Jordan, G. F . , 1962, Redistribution of sediments in Alaskan bays and inlets: Geographic Review, v. 52, p. 548-558.
Kvenvolden, K. A., Redden, G. D., and Carlson, P. R., 1977, Hydrocarbon gases in sediments of the eastern Gulf of Alaska: Am. Assoc. Petroleum Geologists Bull., v. 61, p. 806.

, Loney, Robert A . , Brew, David A., Muffler, L. J. Patrick, and Pomeroy, John S., 1975, Reconnaissance Geology of Chichagof, Baranof, and Kruzof Islands, Southeastern Alaska; U . S . Geological Survey Professional Paper 792, 105 p.
Miller, Don J., 1959, The Alaska Earthquake of July 10, 1958: Giant Wave in Lituya Bay; Bulletin of the Seismological Society of America. Vol. 50, NO. 2, pp. 253-266. April, 1960.
Molnia, B. F., 1976, Possible submarine ice-cored topography in the Bering Trough, NE Gulf of Alask: Geol. Soc. America Abstracts with Programs, v. 8, p. 1016.
Molnia, B. F., 1977, Rapid shoreline erosion at Icy Bay, Alaska - a staging area for offshore petroleum development: Proceedings of the 1977 Offshore Technology Conference, p. 115-126.
Molnia, B. F., 1979, Sedimentation in coastal embayments, northeastern Gulf of A1aska:Proceedings of the 1979 Offshore Technology Conference, p. 665-670.
Molnia, B. F., Carlson, P. R. and Bruns, T. R., 1977, Large submarine slide in Kayak Trough, Gulf of A1aska:in - Landslides, D. Coates, ed., Engineering Geology Reviews, Geol. Soc. Am., v. 111, p. 137-148.
Molnia, B. F., Carlson, P. R. and Kvenvolden, K. A., 1978a, Gas-charged sediment areas in the northern Gulf of Alaska: Geol. Soc. America Abstracts with Programs, v. 10, p. 458-459.
Molnia, B. F., Carlson, P. R., and Levy, W. P., 1978b, Holocene sediment volume and modern sediment yield, northeast Gulf of Alaska: Am. Assoc. Petroleum Geologists Bull., v. 62, p. 545.
Molnia, B. F., Carlson, P. R. and Wright, L. H., 1978c, Geophysical data from the 1975 cruise of the NOAA ship SURVEYOR: U.S. Geol. Survey open-file report 78-209.
Plafker, George, 1967a, Geologic Map of the Gulf o f Alaska Tertiary Province, Alaska: U.S.Geo1. Survey Misc. Geologic Invest. Map 1-484.
Plafker, George, 1967b, Surface faults on Montague Island associated with the 1964 ~laska Earthquake: U.S. Geol. Survey Prof. Paper 543 G I 42 p.
Plafker, George, Hudson, Travis, Bruns, Terry, and Rubin, Meyer, 1978, Late Quaternary Offsets Along the Fairweather Fault and Crustal Plate Interactions in Southern Alaska: Canadian Journal of Earth Sciences, Vol. 15, No. 5, 1978, pgs. 805-816.
Plafker, George, and Miller, D. J., 1958, Glacial features and surficial deposits of the Malaspina district, Alaska: Miscellaneous Geologic Investigation Map 1-271.
Reimnitz, E., and Carlson, P. R., 1975, Circulation of nearshore surface water in the Gulf of Alaska: in Carlson, P. R., Conomos, T. J., Janda, R. J., and Peterson, D. H., Principal sources and dispersal patterns of suspended particulate matter in nearshore surface waters of the northeast Pacific Ocean: ERTS Final Report, Natl. Tech. Info. Service, E75-10266, 145 p.

Wwab,W., Bruns, T. R., and von Huene, R., in press, Structural interpre- tation of magnetic lineaments in the Northern Gulf of Alaska: U.S. Geol. Survey Miscellaneous field studies.

Table 1 Cruise Sufranary - June 1976 (R/v SEA SOUNDER S-1-76)
N a v i g a t i o n Date - JD Tlme ( 2 ) T r r c k l i n e s - June 28 157 1600
Sa t . Nav.* and
Loran A
158 0200 600 ' 158 0615 158 0821 601 158 1756 601 158 1838 602- 159 0246 607
0322 608- 1600 61 5 1620 LB-A 2220 LB-P
159 2328 61 6 J u l y 1 160 0745 61 6
0959 FA- 1 231 1 61 9
160 2330 620 161 1630 AC- 1
1633 621 1917 621
161 2001 622 162 1530 625 2
N i n i r a n g e r and Sat . Nav. Radar and
D.R.** M i n i r a n g e r and Sa t . Nav.
c
Radar and D.R.
S a t . Nav. and Loran A
162 0930 163 0751 635 163 0803 164 0045
01 48 1540 1545 1748 1800 657
165 0514 051 5 0821 659 091 2
166 1041 1042 1237 1305 1809 673 1810 674 1930
166 1945 167 0610
061 6 1955 21 34
168 0342 6 84 0508 68 5 071 5 68 5 0802 68 6 1105 686 1131 687
168 2038 687 J u l y 8 168 2038
Sa t . Nav. - S a t e l l i t e N a v i g a t i o n **D.R. - Dead Reckoning
Sa t . Nav. and Loran A
Sa t . Nav. Radar
and D.R.
LV S i t k a SOL S i t k a Sound t o EOL Cross Sound SOL Cross Sound EOL SOL Palma Bay EOL (Fa i rwea the r F a u l t ) SOL I c y P o i n t t o EOL L i t u y a Bay Ent rance SOL L i tuya Bay EOL SOL L i t u y a Bay t o EOL Fa i rweather Ground SOL f a i r w e a t h e r Ground t o EOL A 1 sek Sea Val 1 ey SOL Alsek Sea V a l l e y EOL SOL Alsek Sea V a l l e y t o EOL Alsek R i v e r (Dry Bay) SOL Seaward o f A lsek R i v e r EOL t o Malaspina G l a c i e r SOL Icy Bay-Malaspina slump EOL SOL Yakuta t Bay EOL SOL I c y Bay-Malaspina slump EOL SOL Seaward o f Malaspina G l a c i e r EOL I c y Bay SOL I c y Bay t o EOL Pamplona R i d g e SOL Pamplona Ridge t o s l o p e EOL S .E . of B e r i n g Trough SOL B e r i n g Trough EOL SOL B e r i n g Trough t o EOL Southeast o f Kayak I s l a n d SOL Kayak I s l a n d EOL Gas-charged sediment SOL S.E. Kayak I s l a n d t o EOL Kayak Trough SOL Kayak Trough EOL SOL Copper R i v e r P r o d e l t a EOL SOL T a r r Bank EOL SOL Tar r Bank t o EOL H i nch i nbrook Sea Val 1 ey SOL Hinch inbrook Sea V a l l e y EOL SOL Hinch inbrook Sea V a l l e y t o EOL R e s u r r e c t i o n Bay AR Seward End o f Cru ise
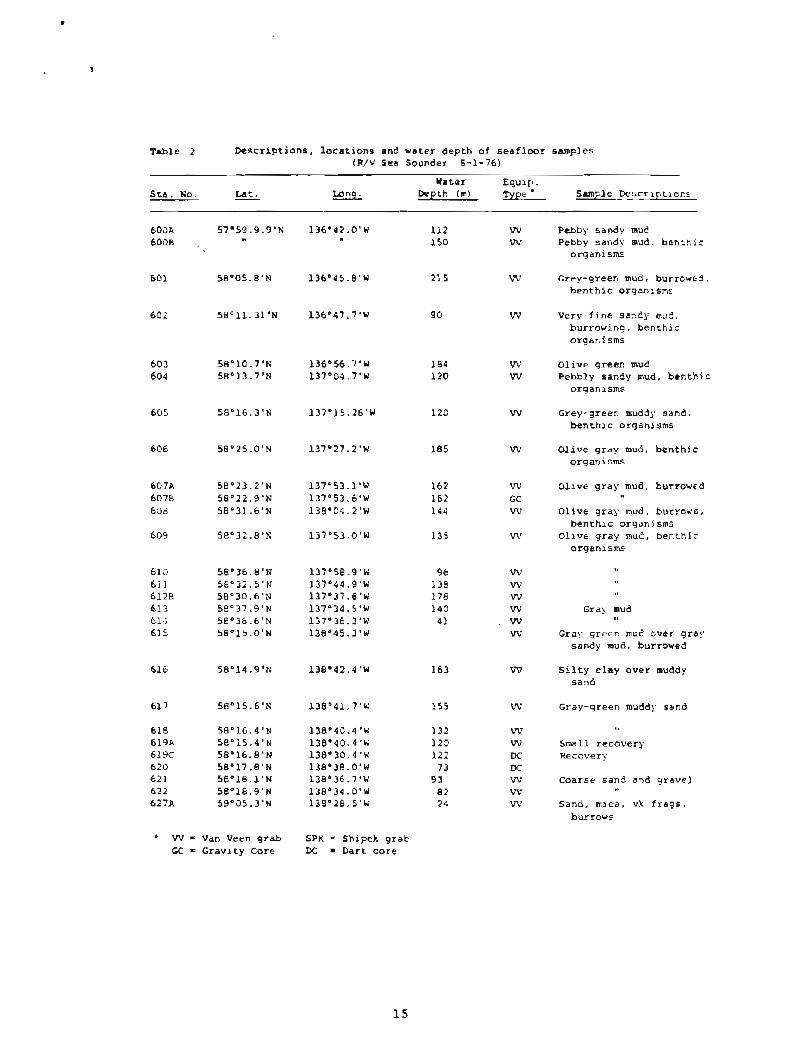
Table 2 Dcscrlptions, locations and water depth of seaflmr samples (R/V Sea Sounder S-1-76)
Water Equlp. Sta . No. - L s t . Depth (m) Type ' Sutnple Description=
Pebby sandy mud Pebby sandy mud, benttlc organisms
Grey-green mud, burrowe3, benthic organlsmc
Very f lne sandy mud, burxowlng , benthlc orga~isms
Olive green mud Pebbly sandy mud, benthic organlsmr.
Grey-green mud2y sand. benthlc organisms
Olive gray mud, benthic organisms
Ollve gray mud, burrowed
Olive gray mud, burrows. benthic organlsms
Ollve gray muc?, benthi: organlsms
G r a l - mud
Gray Sreen mu2 over gray sandy mud, burrowed
Silty clay over muddy sand
Gray-green muddy sand
Small recovery Recover).
Coarse sand and gravel
Sand, mica, vk frags, burrows
* W = Van Veen grab GC = Gravity Core
SPK = Shlpek grab DC = Dart core

Table 2 Descriptions. l o c a t i o n s and wa te r depth of s e a f l o o r samples (WV Sea Sounder 5-1-76)
Water sta. No. fat . Lanq. Depth (m) S a m ~ l e D e s c r i p t i o n s -
628 5q005.6 'N 13E029.1'W 11 W G r a y sand, shells, r k . f r a g s , b e n t h l c organism:
629 5B059.5'N 138'40.0'W 148 GC Gray-green mud 6308 5E053.6'N 13B050.6'W 195 GC Gray-mud 631A ? ? 18 W Sand 632 5g0O9.9'N 13B055.3'W 47 lnl V e r y f i n e sand 633 5g012.4'N 13B051.6'W 16 W F i n e s a n d , becthic
o r g a n i s m s , s h e l l s
634A 59'0B.8'N 139'16.9'W 9 0 W Olive gray mud 6348 9 0 GC 45 m. r e c o v e r y 6 36 5g034.2'N 140' .1'W 218 W Gray g r e e n s i l t a n d s i l t y
sand
65 W Gray v e r y f i n e s a n d . burrowed
638 5g038.1'N 14O040.8'W 48 W Gray f i n e s a l t y s and 6 39 5g034.5'N 14O059.O'W 166 W G r a y - g r e e n mud 64 0 59'37.5'N 141°06.0'W 7 0 VV Gray c l a y e y silt, burrow=
benthic organisms
3 0 W7 Gray sand, r k . f r a g s . 6 1 W Gray very flne s a n d ,
burrows
64 3 5g036.5'N 14l02O.0'W 95 bT7 Clayey silt 644 Sq032.8'N 14l023.O'W 134 W 645 5ge59.3'N 141°22.1'W 45 W 646 5q059.9'N 141°25.1'W 7 0 W Muddy s a n d , benthic
organisms
64 7 60°01 .O'N 14lP21.8'W 9 9 W Gray mud, b e n t h i c o r g a n i s m s
64 8 6Oo03.5'N 141°22.1'W 139 W 649 60°04.7'N 141°22.0'W 146 W Mud w l t h r k . f r a g s . 655 60°05.4'N 141°21.4'W 122 W Gray mud 651 6OaO5.7'N 14l02O.4'W 59 VV 652 60°06.3'N 14l016.3'W 138 Vl.
653 60a04.7'N 141°19.6'W 20 Wl Gray s a n d y mud vlth pebbles
654 60°00. 5'N 141°19.5'W 66 VL7 Pebbly mud 655 59m59.4'N 14lo21.1'W 16 W Gral- mud, r k . f r a g s . 656A 59'54 .OIN 143'39.3'W 277 VV Gray mud 656B GC

Table 2 Dcscriptlons, l o c a t i o n s and water depth of seafloor samples (WV Sea Sounder S-1-76)
Water S t a . No. fat. -
144O28.0'W 144'28 .4 ' 144'44.0W 144-40.5'W 144O40. B'W 144"40.3'W 144'37.8'W 144'55.2'W 144'55.7'W 145OO0.2'W 145°00.0'W
Depth (m) Sample Descript ions
265 W Gray mud GC Small recovery
7 4 W Gray mud GC
5 5 W Gray mud 54 GC 34 W Gray sand 34 W 3 4 SPK 7 0 W Gray mud 4 0 W Flne sand 18 W 18 W 9 5 W Clayey silt, burrowed 4 2 W Muddy sand, s h e l l s ,
burrows 4 5 W Muddy sand
116 W Gray mud, burrows 8 5 W Gray mud, burrowed 62 W S h e l l hash 7 0 W Sandy pebbly mud,
benthic organisms

Table 3 S e a f l w r C h a r a c t e r i s t i c s a t T e l e v i s i o n S t a t i o n s (R/V Sea Sounder 5-1-76]
Depth Bottom Camera S t a t i o n Im) C h a r a c t e r R i p p l e Marks Other S u r f a c e F e a t u r e s Benthos
JD/Time (Gm) S t a r t Lat./Lonq. End Lat./Lonq.
MS-muddy s and Sym-symetric M3S-mounded, u n d u l a t i n g Sp-sea peas SM- sandy mud L-Linguoid R-burrows * - s t a r f i s h , urchins, H-mud Asym-Asyme t r i c S - s c a r p s s and d o l l a r s S-sand -wavelength C-cover o f p e b b l e s , c o b b l e s A-anenomes S h - s h e l l ha sh Ampampl i t ude T - t r a c k s f r o m o rgan i sms EF-enc rus t i ng f l o r a
R - r e l i c , p o o r d e f i n i t i o n C-crabs H-modern, s h a r p l y d e f i n e d
T V 1 S Sym, M B S P , C 167/ 60'08.0' 34 h= 1 5 cm 1 4 4 ' 4 0 . 8 ' amp < 5-10 c m
TV 7 168/0100-0154 56-60 Sh, S , SH 59 '49 .6 ' 146'13 . O '
Sym, M A = 5 cm amp 2 3 crn
Asym, M A = 7-8 cm amp 2 6 cm
B, Mds, T

Table 3 Seafloor Characteristics at Television Stations (R/V Sea Sounder S-1-76)
Depth ~ o t tom Camera Station
Range (m) Character Ripple Marks Other Surface Features Benthos
JD/Time t GMT) Start Lat./Long. End Lat./Long.
MS-muddy sand Sym-symetric MDS-mounded, undulating Sp-sea peas SM-sandy mud L-Linguoid 8-burrows *-starfish. urchins, M-mud Asym-Asymetric S-scarps sand dollars S-sand -wavelength C-cover of pebbles, cobbles A-anenomes Sh-shell hash Amp-amplitude T-tracks from organisms EF-encrusting flora
R-relic, poor definition C-crabs M-modern, sharply defined
m 9 168/0730-0746 225 M 60'13.0' 146'44.7' Ed: 60'13.0' 146O44.5'
TV 10 168/0847-0920 99-122 H St. 60'07.3' 146' 45.9' Ed: 60'07.7' 146'46.0'
s p . ', C
Ef, *, SF

TABLE 4 D e s c r i p t i o n o f bot tom camera s t a t i o n s .
Bottom Camera S t a t i o n s - 51-76-EG
Water S t a t i o n L o c a t i o n - Frames Depth
624 5 8 1 9 1 6 60 m
13b031 '
S t a r t : 6279 59O05.3' 13 23 m
138' 28.5'
end : 59'05 .I ' 138O29.4'
S t a r t : 630A 58O53.7' 19 193 rn
1 3 8 ~ 5 0 . 6 '
end: 58'53.6'
1 3 8 ~ 5 0 . 6 '
D e s c r i p t i o n
S o f t muddy bottom, some
cobble cover , dense
b r i t t l e s t a r cover , o r -
ganism t r a c k s and burrows.
S l i g h t l y over exposed.
S u b p a r a l l e l r i p p l e sets ,
d i scon t i nuous crests , sym-
m e t r i c , l ow ampl i tude, no
organisms. Host o u t o f
focus, overexposed.
S o f t muddy bottom, many
burrows, some t r a c k s .
S l i g h t l y overexposed.

Figure 1 . Sketch nap o f eastern Gulf o f Alaska showlng the geographl c areas v is i ted. The numbers coincide with the areas discussed f n sectlons 1-14. (1) Sltka. ( 2 ) Cross Sound, (3) Ll tuya Bay, (4) Falmeather Ground, (5a) Alsek Sea Valley. (5b) Yakutat Sea Valley, ( 6 ) Yakutat Bay. (7) Malaspfna Glacier nearshore area, (8) Icy Bay, ( 9 ) Bering Trough. (10) Kayak Is land east. (11) Kayak Trough, (12) Copper River prodelta. (13) Tarr Bank, ( 1 4 ) Hlnchinbrook Sea Val ley. Dashed l t n e i s 200 m 4 soba th .

CT - 5 E x- u)"

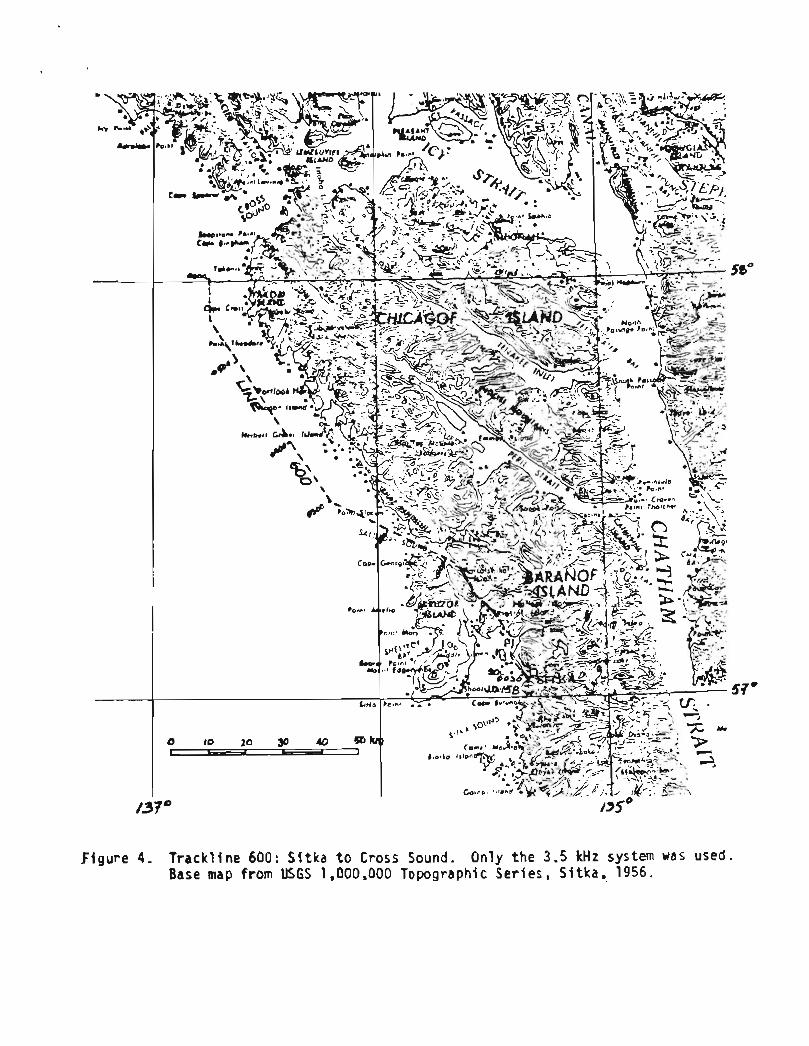
f i g u r e 4 . Track l ine 600: S i t k a t o Cross Sound. Only t h e 3 .5 kHz system was used. Base map from USGS 1.000,000 Topographic S e r i e s , S i t k a . 1956.

4- m 0s- L O n o w . N C > J= C)- Y
a I= m r o
' 0 - m t o


Flgure 1 5 . Uniboom prof 1 le (622) showing burled channel seaward o f Dry Bay. O u t l i n e o f channel shown by dashed l ine added f o r emphasis.


Figure 17. Yakutat Bay showing end moraines and r a t e s o f sediment accumulation. Rates a r e based on thicknesses o f s o f t sediment over ly ing g l a c i a l t i l l and t h e age assigned t o the ad jacent moraine.


Figure 19. Side scan sonar profile (655) showing incipient slump scarps in Icy Bay - Halaspina Glacier slump.


Figure 21. Seaward extension o f the Patton Bay f a u l t zone across t h e Montague I s l a n d p la t form.