static-content.springer.com10.1007... · web viewemiliano stendardo,1 francisco avila ferrer,2...
TRANSCRIPT

The absorption and emission spectra in solution of oligo-
thiophene based push-pull biomarkers: a PCM/TD-DFT vibronic
study. Emiliano Stendardo,1 Francisco Avila Ferrer,2 Fabrizio Santoro,3,* Roberto Improta1,*
1CNR—Consiglio Nazionale delle Ricerche, Istituto di Biostrutture Biommagini (IBB-CNR) Via
Mezzocannone 16, I-80136, Napoli, Italy
2 University of Málaga, Physical Chemistry, Faculty of Science, Málaga, 29071, Spain
3 CNR—Consiglio Nazionale delle Ricerche, Istituto di Chimica dei Composti Organo Metallici
(ICCOM-CNR), UOS di Pisa, Area della Ricerca, via G. Moruzzi 1, I-56124 Pisa, Italy
e-mail:[email protected]; [email protected]
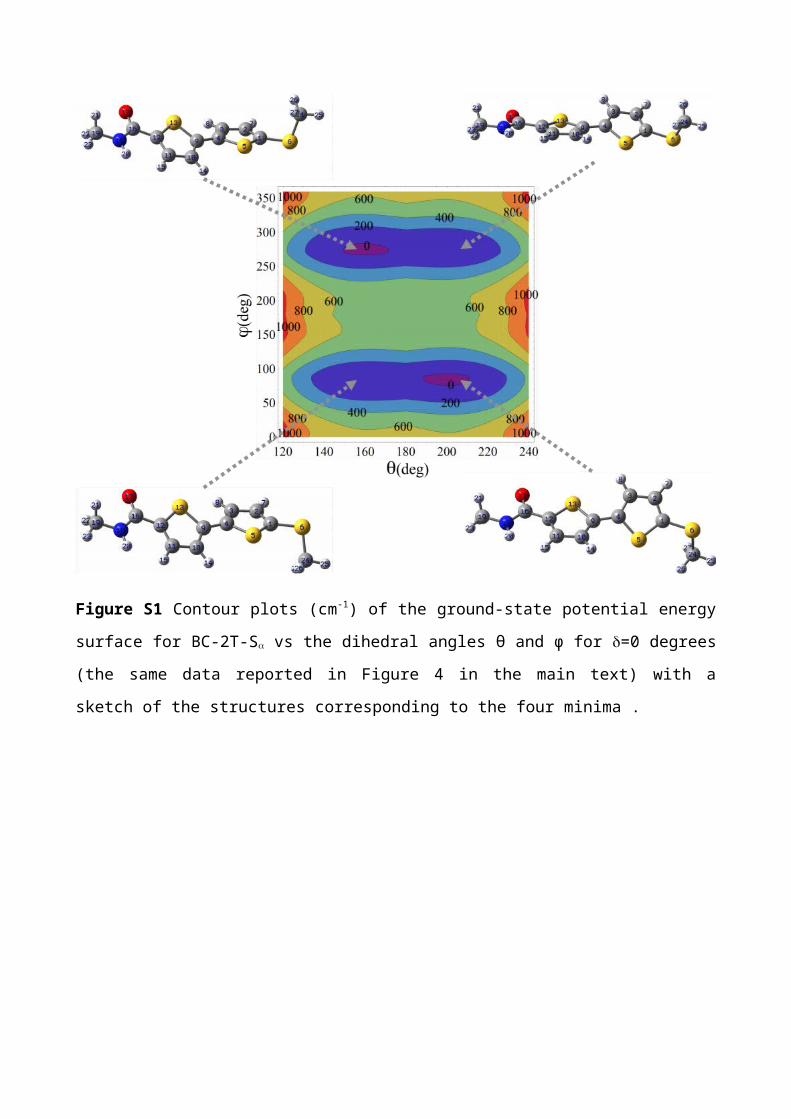
Figure S1 Contour plots (cm-1) of the ground-state potential energy surface for BC-2T-S vs the
dihedral angles θ and φ for =0 degrees (the same data reported in Figure 4 in the main text) with a
sketch of the structures corresponding to the four minima .

Figure S2 Contour plots (cm-1) of the ground-state potential energy surface for BC-2T-S vs the
dihedral angles θ and φ for =0 degrees (the same data reported in Figure 4 in the main text) with a
sketch of the structures corresponding to the four minima .

Figure S3 Contour plots (cm-1) of the ground-state potential energy surface vs the dihedral angles θ
and φ for BC-2T-Sβ (a), BC-2T-Sβ (b), and vertical excitation energies contours (cm-1) for BC-2T-Sα
(c) and BC-2T-Sβ (d). The dihedral angle has been fixed to 15º.

Figure S4 Contour plots (cm-1) of the ground-state potential energy surface for BC-2T-S vs the
dihedral angles θ and φ for =15 degrees (the same data reported in Figure S3) with a sketch of the
structures corresponding to the four minima .
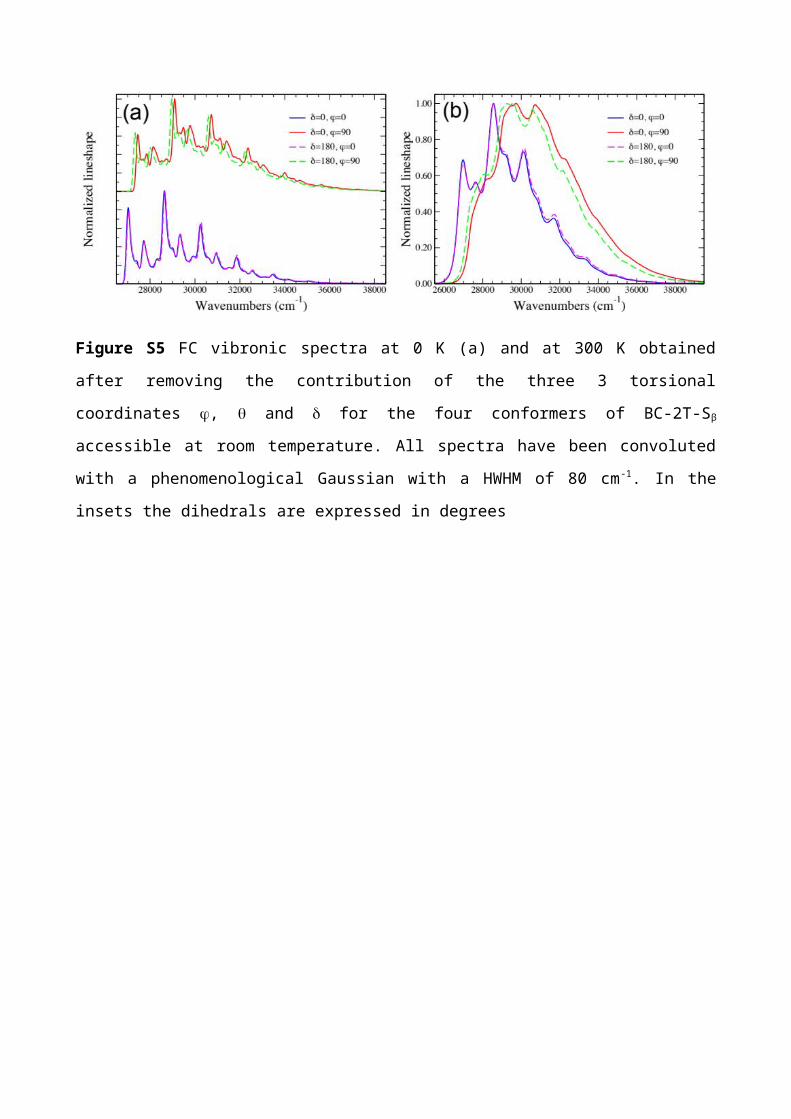
Figure S5 FC vibronic spectra at 0 K (a) and at 300 K obtained after removing the contribution of
the three 3 torsional coordinates , and for the four conformers of BC-2T-Sβ accessible at room
temperature. All spectra have been convoluted with a phenomenological Gaussian with a HWHM
of 80 cm-1. In the insets the dihedrals are expressed in degrees

Figure S6: Comparison of FC and FCHT vibronic S0S1 spectra computed at 0 and 300 K
considering 3N-9 quantum coordinates for four possible structures of BC-2T-S; a: =(0,
180, 0 degrees), b: =0, 180, 90 degrees), c: =(0, 180, 180 degrees)

Figure S7: Comparison of FC and FCHT vibronic S0S1 spectra computed at 0 and 300 K
considering 3N-9 quantum coordinates for four possible structures of BC-2T-Sβ; a: =(0,
180, 0 degrees), b: =(180, 180, 0 degrees), c: =(0, 180, 90 degrees) , d:
=(180, 180, 90 degrees).

Figure S8 Experimental [1] and final computed spectra as a result of the convolution of the
vibronic spectra, without the torsions , and , with a Gaussian with standard deviation equal to
the standard deviation of the vertical excitation energies weighted by their Botzmann populations
for BC-2T-Sα (a) and BC-2T-Sβ (b). For BC-2T-Sα the vibrational spectra were computed for three
conformers, =0, 90 and 180 degrees with and fixed to 180 and 0 degrees respectively. For BC-
2T-Sβ two conformers were considered with =0 and 90 degrees with and fixed to 180 and 0
degrees respectively.

Table S1 Relative Energies (cm-1) in the ground state of relaxed structures on S0 of NS-2TSα with
selected values of , and angles.
Sa/
BC/ 2T/ 180 90 0
180 180 705 245 765
180 0 1020 535 1083
0 180 456 0 558
0 0 882 373 861
Table S2 Vertical excitation energies (cm-1) of relaxed structures of NS-2TSα with selected values
of , and angles..
Sa/
BC/ 2T/ 180 90 0
180 180 29628 31087 29380
180 0 29561 31010 29310
0 180 29656 31145 29428
0 0 29583 31066 29307

Table S3 Relative Energies (cm-1) in the ground state of relaxed structures of NS-2TS with
selected values of , and angles.
Sb/
BC/ 2T/ 180 90 0
180 180 4266 50 383
180 0 4406 559 489
0 180 3866 0a 250
0 0 4317 341 300a Very flat PES, standard convergence criteria not fulfilled.
Table S4 Vertical excitation energies (cm-1) of relaxed structures on S0 of NS-2TS with selected
values of , and angles.
Sb/
BC/ 2T/ 180 90 0
180 180 30160 31177 30488
180 0 30303 31143 30340
0 180 30074 31259 30403
0 0 30379 31195 30416

References
1. M. Piacenza, M. Zambianchi, G. Barbarella, G. Gigli and F. Della Sala, Phys. Chem. Chem. Phys., 2008, 10, 5363-5373.