statin how we see and use statistics #4 opm
TRANSCRIPT

STATISTICAL INSTITUTE OF JAMAICA 1
How do we see & use statistics?
Government Communicators’ Meeting
Sonia M. JacksonDirector General
Statistical Institute of Jamaica

STATISTICAL INSTITUTE OF JAMAICA 2
Structure of Presentation World population trends Findings from Census 2011 Population projections to 2030 Components of the Labour Force Survey
July 2012 The changing structure of the economy Impact of the population change Conclusion

STATISTICAL INSTITUTE OF JAMAICA 3
World Population Trends 2012 Fertility rate worldwide 2.4 children per woman Infant mortality rate 41 infant deaths per 1000
population Life expectancy at birth - 70 years Death rate 8 deaths per 1000 population In Latin America & Caribbean (LAC)
Fertility rate 2.2 children per woman Infant mortality rate 20 infant deaths per 1000
population Death rate 6 deaths per 1000 population

STATISTICAL INSTITUTE OF JAMAICA 4
Findings Census 2011 Jamaica, like the rest of Caribbean, has
been similar to the rest of the world – Reduced fertility rates
Declining from 5.8 children per woman in 1970 to 2.3 children per woman in 2011
Slight increase in death rate From 6.4 per 1000 in 2001 to 7.1 per 1000 in 2011
Population aging Median age was 17 in 1970 and 27 in 2011 %age increase in Population over age 65 increased
from 4.3% in 1960 to 8.1% in 2011

STATISTICAL INSTITUTE OF JAMAICA 5
Population changesCensus
Year Population Births DeathsNet
Migration
Annual %age
growth rate
1911 831,400
1921 858,100 370,200 216,400 77,100 0.31
1943 1,246,200 765,300 412,200 25,800 1.67
1960 1,624,400 855,500 287,500 195,200 1.56
1970 1,848,500 676,500 141,300 296,500 1.39
1982 2,190,400 747,788 188,993 216,959 1.40
1991 2,380,700 505,844 133,973 181,601 0.95
2001 2,607,632 603,090 159,733 216,392 0.87
2011 2,697,983 438,318 179,253 168,714 0.36

STATISTICAL INSTITUTE OF JAMAICA 6
Components of Population Change:1921–2011
0
5
10
15
20
25
30
35
40
45
1921 1943 1960 1970 1982 1991 2001 2011
Census Years
Rat
e
Crude Birth Rate Crude Death Rate Net Migration Rate

STATISTICAL INSTITUTE OF JAMAICA 7
Findings Census 2011 Other Features -
Migration rates - though declining – still relatively high
Urbanization - 54 % of population living in urban centres
Use of technology – Telephone access within households increased
from 59.36% in 2001 to 94.04% in 2011 Households with Computers and Internet
Connection increased form 11.86% in 2001 to 26.69% in 2011

STATISTICAL INSTITUTE OF JAMAICA 8
Urbanization
Urban/Rural
2011 2001
Change
%age Change
%age Share of Total
Population
2001-2011
2011 2001
Total 2,697,983
2,607,632
90,351 3.5 100 100
Urban 1,453,438
1,355,334
98,104 7.2 54 52
Rural 1,244,545
1,252,299
-7,754 -0.6 46 48

STATISTICAL INSTITUTE OF JAMAICA 9
Percentage Distribution of the Population by Urban and Rural Census 2011
42
44
46
48
50
52
54
56
Urban Rural
Per
cent
age
2001 2011

Population Change in the Five Fastest Growing Parish Capitals: 2001 - 2011
CAPITAL PARISH POPULATION % CHANGE 2001-2011
% SHARE OF PARISH
TOTAL 2011
2011 2001
Black River
St Elizabeth 5,352 4,095 31 4
Lucea Hanover 7,131 6,062 14 10Spanish Town
St. Catherine 147,152 131,515
12 29
Montego Bay
St. James 110,115 96,477 14 60
Sav-la-Mar
Westmoreland 22,633 19,893 14 16

STATISTICAL INSTITUTE OF JAMAICA 12
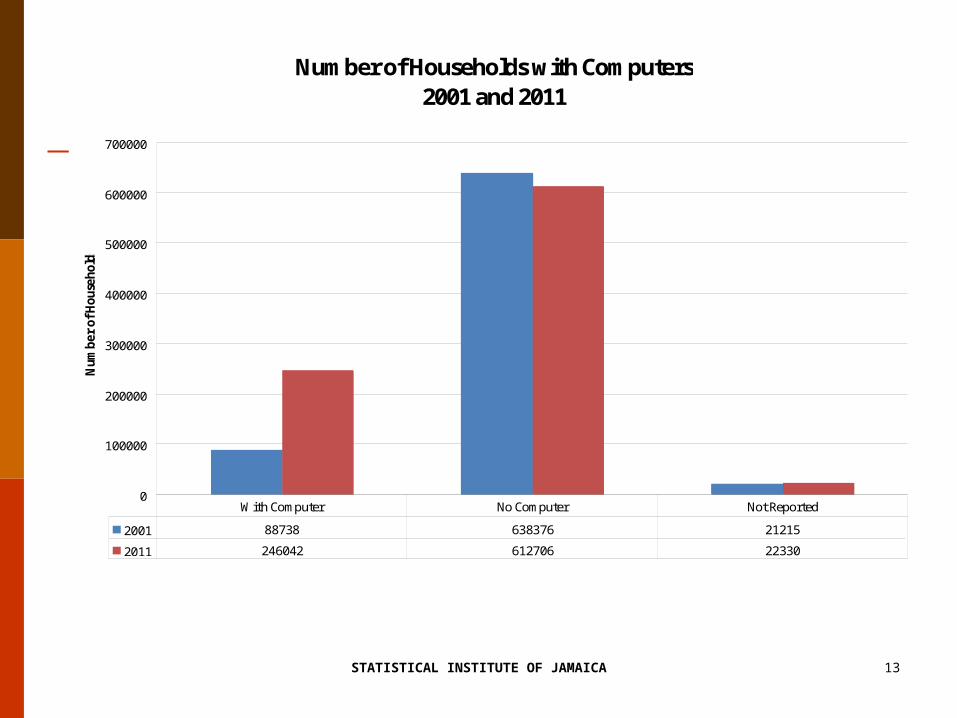
Availability and Access to Use of technology
Telephone access within households increased from 59.36% in 2001 to 94.04% in 2011
Households with Computers and Internet Connection increased from 11.86% in 2001 to 26.69% in 2011
STATISTICAL INSTITUTE OF JAMAICA 13
Number of Households with Computers2001 and 2011
0
100000
200000
300000
400000
500000
600000
700000
Num
ber
of H
ouse
hold
s
2001 88738 638376 21215
2011 246042 612706 22330
With Computer No Computer Not Reported

STATISTICAL INSTITUTE OF JAMAICA 14

STATISTICAL INSTITUTE OF JAMAICA 15

STATISTICAL INSTITUTE OF JAMAICA 16
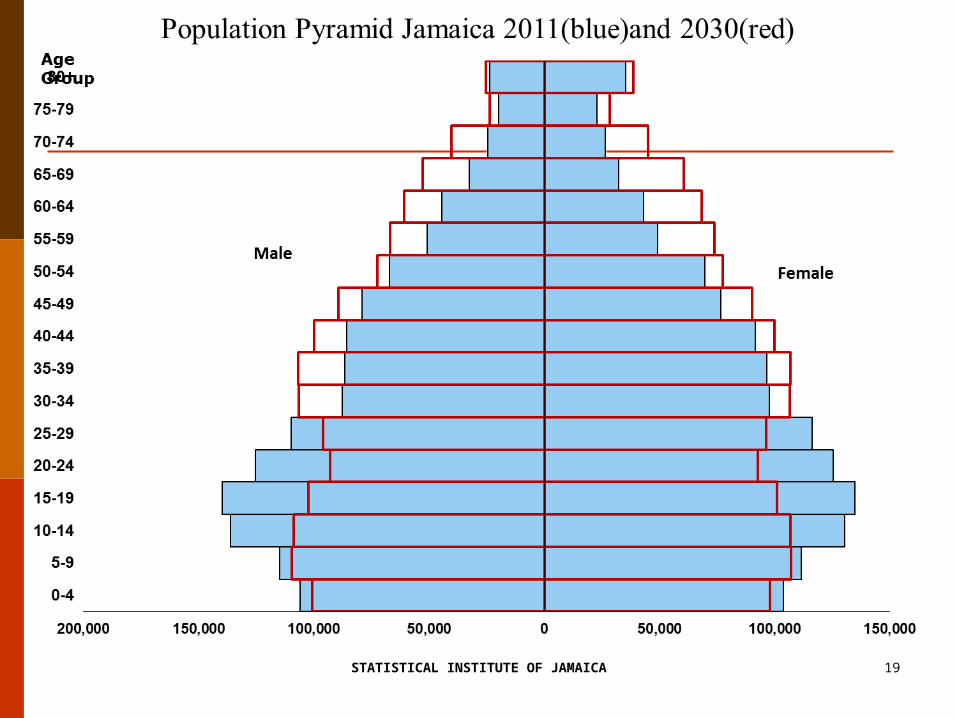
The Population Projections

STATISTICAL INSTITUTE OF JAMAICA 17
Population Projections to 2030 Fertility rates – continue to decline Life expectancy not expected to change
significantly – 70 for men and 75 for women Mortality rates will change with aging
population Net migration rates should remain fairly flat Total population – 2.752 million being
1.355 million males and 1.397 females – based on 2000 projections at the low level

STATISTICAL INSTITUTE OF JAMAICA 18
Components of Population Change 2015-2030
CensusYears
Births, Deaths and Migration in Inter-censal Period
AnnualGrowthRate %
Population Births Deaths
Natural
Increase
Migration
Census 2011 Results
2011 2,697,9
83438,31
8179,25
3259,0
65168,71
4 0.36
Projection Years (data per annum)
2015-2020
2,753,902 47,400 22,000
25,400 20,000 0.19
2020-2025
2,769,224 45,000 23,000
22,000 20,000 0.05
2025-2030
2,752,054 39,000 25,000
14,000 20,000 -0.10
STATISTICAL INSTITUTE OF JAMAICA 19

STATISTICAL INSTITUTE OF JAMAICA 20
Changing Age Structure of Population
AgeGroups 1960 2001 2011 2030
0 -14 41.20 32.20 26.10 23.00
15 - 64 54.60 60.10 65.90 66.00
65+ 4.30 7.70 8.10 11.00
100 100 100 100.00

STATISTICAL INSTITUTE OF JAMAICA 21
Vision 2030 Jamaica National Development Plan

STATISTICAL INSTITUTE OF JAMAICA 22
Vision 2030 Jamaica – National Development Plan
NATIONAL GOAL # 1
NATIONAL OUTCOMES
Jamaicans are empowered to achieve their fullest potential
1. A Healthy & Stable Population
2. World Class Education & Training
3. Effective Social Protection4. Authentic & Transformational
Culture

STATISTICAL INSTITUTE OF JAMAICA 23
Challenges to achieving National Goal #1a. Inadequate health personnel & infrastructureb. Poor performance of learners, especially boys at
the various levels of educationc. Need for better trained education personneld. Inadequate parentinge. Discrimination against persons with disabilitiesf. Inadequate support for the vulnerable
populationg. Not enough attention being paid to positive
values such as truthfulness & respect for each other
h. Inadequate resources for the development of the creative industries including culture & sports

STATISTICAL INSTITUTE OF JAMAICA 24
The Labour Force July 2012

STATISTICAL INSTITUTE OF JAMAICA25
Employed Labour Force by OccupationCategories MALE FEMALE TOTAL
Occupation Groups
Professional 96,104 146,695 242,800
Clerks 22,303 73,209 95,511
Service Worker 84,666 129,718 214,384
Skilled Agri. Worker 160,758 34,844 195,602
Craft & Related Worker 135,271 12,071 147,343
Plant & Machine Operator 52,885 2,878 55,764
Elementary Operator 66,746 75,503 142,249
Not specified 666 374 1,041
Total 619,399 475,2931,094,69
2

26
STATISTICAL INSTITUTE OF JAMAICA
26
Employed Labour Force By Industry
INDUSTRY MaleFemal
e Total
Agri. Forestry and Fishing. 157,231 39,241 196,472
Mining and Quarrying. 3,954 483 4,437
Manufacturing. 49,940 25,006 74,945
Elec. Gas & Water 5,919 2,128 8,047
Construction 81,783 3,470 85,253
Wholesale, Retail & Repairs 96,818 117,831
214,649
Hotels & Restaurant 33,597 48,071 81,668
Transport & Storage 57,917 17,185 75,102
Financial, Real Estate 40,655 41,426 82,082
Public Admin. & Education 48,518 78,618 127,136
Health , Social work & Personal Ser.
33,504 54,435 87,939
Private Household 8,887 45,524 54,411
Industries n/s & Extra Teri. (Embassy)
676 1,875 2,551
TOTAL 619,399 475,293
1,094,692

STATISTICAL INSTITUTE OF JAMAICA 27
Employed Labour Force by Education & Age
Educational Levels
Age Groups
Total 14 -
19
20 - 24
25 - 34
35 - 44 45 - 54
55 - 64 65 +
None 8,86843,13
0161,8
66216,05
3134,72
4
77,255
49,216 691,112
CXC basic, JSC 5 SSC, 3rd JL 169 2,017 7,039 4,417 4,664 1,613 365 20283
CXC Gen, GCE 'O' 1-2 721 6,412 6,978 4,328 2,192 266 0 20897
CXC Gen, GCE 'O' 3-4 1,86610,90
2 18,533 10,944 4,100 807 0 47152
CXC Gen, GCE 'O' 5+ 1,49614,96
8 23,036 8,351 3,824 823 0 52499
GCE 'A' 1-2/, CAPE 1-2 0 1,081 872 175 0 0 140 2268
CAPE/GCE 'A' 3+ 849 1,000 1,278 0 217 73 0 3417
Degree 0 5,489 50,438 45,259 25,72911,16
04,25
4 142,329
Other 204 2,94411,04
2 10,211 6,3002,80
0 636 34,137
Not stated 90
Total
15,220
95,115
305,796
327,413
194,772
99,550
56,737
1,094,692

STATISTICAL INSTITUTE OF JAMAICA 28
Employed L.F. by Industry & Education
INDUSTRY None
CXC Basic, JSC 5 SSC, 3rd JL
CXC
Gen,GCE "O"
GCE "A"& CAPE Degree Other
Not stated TOTAL
Agri. Forestry and Fishing.
181,572 2,090 4,995 73 1,532 1,706 4,412
196,381
Mining and Quarrying. 2,015 0 411 0 1,122 462 428 4,437
Manufacturing. 49,910 700 9,128 343 6,431 2,433 6,000 74,945
Elec. Gas & Water 1,587 186 2,133 0 2,749 504 888 8,047
Construction 71,739 1,212 4,059 665 2,365 832 4,382 85,253
Wholesale, Retail & Repairs
149,383 4,832
24,082 862 9,781 5,637 20,070
214,649
Hotels & Restaurant 50,765 2,22415,00
9 378 3,471 2,022 7,800 81,668
Transport & Storage 43,366 2,082 7,948 753 9,659 1,284 10,009 75,102
Financial, Real Estate 23,867 1,00617,86
7 96928,36
5 2,687 7,322 82,082
Public Admin. & Education 26,956 2,530
22,178 1,123
57,244 7,883 9,221
127,136
Health , Socialwork & Per. Ser. 40,207 2,485
11,873 519
18,352 6,952 7,550 87,939
Private Household 49,214 937 734 0 100 1,736 1,691 54,411
Industries n/s & Extra Ter. 621 0 130 0 1,158 0 732 2,642
Total691,20
3 20,283120,5
48 5,685142,3
2934,13
7 80,5061,094,
692

STATISTICAL INSTITUTE OF JAMAICA 29
The Changing Economy

STATISTICAL INSTITUTE OF JAMAICA30
The Changing Economic Structure - %age Contribution at Current Price
INDUSTRIES 197
0198
0199
0200
0201
1
1Wholesale, Retail; Repairs;
Install. 18.9 19.2 18.2 19.7 18.9
2Producers of Government
Service 7.9 14.0 7.4 11.7 14.2
3 Real Estate, Renting ,etc. 9.5 8.5 9.9 9.3 12.2
4Financial & Insurance
Services 3.5 4.8 6.8 9.0 10.2
5Transport, Storage &
Commun. 5.5 5.1 8.4 10.7 9.7
6 Manufacturing 15.8 16.6 16.9 10.5 9.2
7 Construction 13.3 5.8 7.2 7.6 7.3
8 Other Services 5.6 4.3 6.0 6.6 6.7
9Agriculture Forestry &
Fishing 6.4 8.2 6.8 7.0 6.5
10 Hotels & Restaurants 1.6 0.9 6.1 5.1 4.3
11 Electricity & Water Supply 1.0 1.6 2.2 3.2 3.6
12 Mining & Quarrying 12.7 14.2 7.8 4.2 1.5
13 Less: FISM 1.7 3.3 3.7 4.6 4.3
Total Value Added100.
0100.
0100.
0100.
0100.
0

STATISTICAL INSTITUTE OF JAMAICA 31
%age Contribution at Current Price – Comparative Contribution for Each Period
0.0
5.0
10.0
15.0
20.0
25.0
1 2 3 4 5 6 7 8 9 10 11 12
1970 1980 1990 2000 2011

STATISTICAL INSTITUTE OF JAMAICA 32
Impacts of the Change

STATISTICAL INSTITUTE OF JAMAICA 33
Impact of the Population Change on: HEALTH & WELL BEING
Increasing demand for health facilities & services Affordability Nutrition Entertainment & Exercise Pension Specialists care givers
HOUSING Design Assisted living/ retirement communities Recreation facilities/green spaces

STATISTICAL INSTITUTE OF JAMAICA 34
Impact of the Population Change on: EDUCATION & TRAINING
The demand for school places at all levels The demand for new skill sets Work force will be more technology proficient Work force needs to be more innovative
TRANSPORTATION Services to attend medical appointments, go
shopping, participate in social activities or simply get out of the house.

Government
Transportation
UtilitiesWholesale
& retail
Economy
Population
Age Structure
Culture
Education
Labour Force
Financial
Manufacture
Services Production
Construction
Agriculture &
Fisheries
Mining & Quarrying
Health
Housing
etc
Conclusion
Tourism, etc

STATISTICAL INSTITUTE OF JAMAICA 36
Thank you for having allowed us to share with you!!!

STATISTICAL INSTITUTE OF JAMAICA 37
References Population Projections Jamaica 2000 – 2050 –
published by Statistical Institute of Jamaica – April 2008
Population & Housing Census 2011 – Jamaica – General Report – Volume 1 - published by Statistical Institute of Jamaica – October 2011
Vision 2030 – National Development Plan The Labour Force Survey – July 2012 World Population Data Sheet 2012 – Population
Reference Bureau