stationary fuel cell system composite data products
TRANSCRIPT

NREL is a national laboratory of the U.S. Department of Energy, Office of Energy Efficiency & Renewable Energy, operated by the Alliance for Sustainable Energy, LLC.
Contract No. DE-AC36-08GO28308 This report is available at no cost from the National Renewable Energy Laboratory (NREL) at www.nrel.gov/publications.
Stationary Fuel Cell System Composite Data Products Data through Quarter 4 of 2013
G. Saur, J. Kurtz, C. Ainscough, and M. Peters
Technical Report NREL/TP-5400-61926 May 2014
NOTICE
This report was prepared as an account of work sponsored by an agency of the United States government. Neither the United States government nor any agency thereof, nor any of their employees, makes any warranty, express or implied, or assumes any legal liability or responsibility for the accuracy, completeness, or usefulness of any information, apparatus, product, or process disclosed, or represents that its use would not infringe privately owned rights. Reference herein to any specific commercial product, process, or service by trade name, trademark, manufacturer, or otherwise does not necessarily constitute or imply its endorsement, recommendation, or favoring by the United States government or any agency thereof. The views and opinions of authors expressed herein do not necessarily state or reflect those of the United States government or any agency thereof.
This report is available at no cost from the National Renewable Energy Laboratory (NREL) at www.nrel.gov/publications.
Available electronically at http://www.osti.gov/scitech
Available for a processing fee to U.S. Department of Energy and its contractors, in paper, from:
U.S. Department of Energy Office of Scientific and Technical Information P.O. Box 62 Oak Ridge, TN 37831-0062 phone: 865.576.8401 fax: 865.576.5728 email: mailto:[email protected]
Available for sale to the public, in paper, from:
U.S. Department of Commerce National Technical Information Service 5285 Port Royal Road Springfield, VA 22161 phone: 800.553.6847 fax: 703.605.6900 email: [email protected] online ordering: http://www.ntis.gov/help/ordermethods.aspx
Cover Photos: (left to right) photo by Pat Corkery, NREL 16416, photo from SunEdison, NREL 17423, photo by Pat Corkery, NREL 16560, photo by Dennis Schroeder, NREL 17613, photo by Dean Armstrong, NREL 17436, photo by Pat Corkery, NREL 17721.
Printed on paper containing at least 50% wastepaper, including 10% post consumer waste.
3
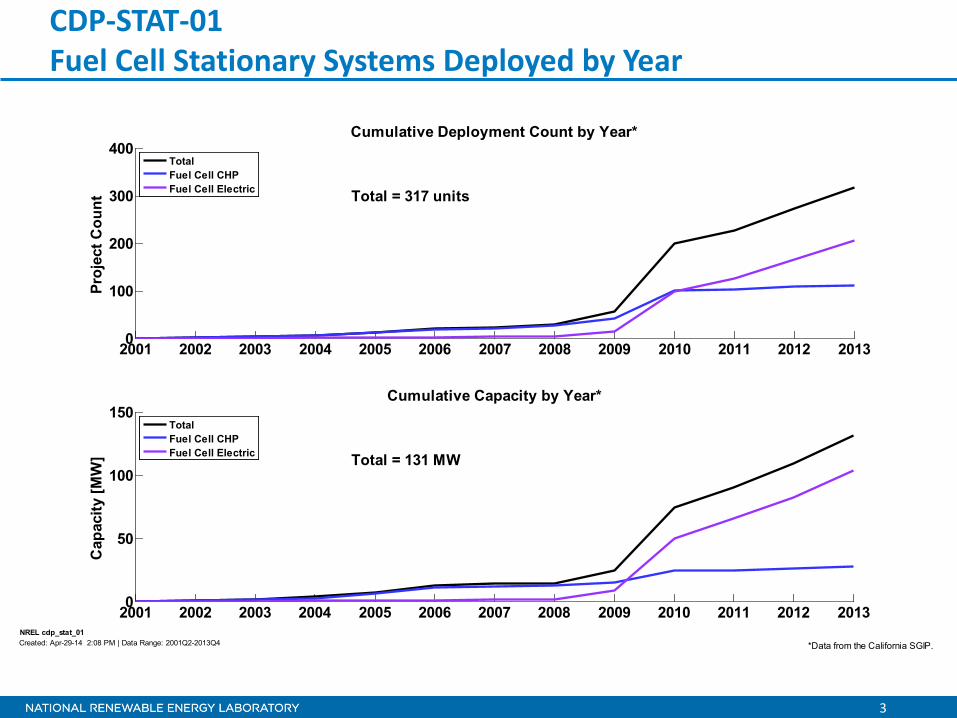
CDP-STAT-01 Fuel Cell Stationary Systems Deployed by Year
2001 2002 2003 2004 2005 2006 2007 2008 2009 2010 2011 2012 20130
100
200
300
400
Proj
ect C
ount
Cumulative Deployment Count by Year*
Total = 317 units
TotalFuel Cell CHPFuel Cell Electric
2001 2002 2003 2004 2005 2006 2007 2008 2009 2010 2011 2012 20130
50
100
150
Cap
acity
[MW
]
Cumulative Capacity by Year*
Total = 131 MW
TotalFuel Cell CHPFuel Cell Electric
NREL cdp_stat_01Created: Apr-29-14 2:08 PM | Data Range: 2001Q2-2013Q4 *Data from the California SGIP.

4
CDP-STAT-02 Stationary Fuel Cell System Count by Status
3%
4%
10%
11%64%
Deployment Count By Status*
Other Categories: ICF ReviewICF Technical ReviewICF Pending PaymentPPM Technical ReviewRRF ReviewRRF Technical Review
Definitions: RRF = Reservation Request Form, is the first step in the SGIP incentive claim process.PPM = Proof of Project Milestone; the applicant must prove progress and committment to the project.ICF = Incentive Claim Form is the step where the appliant, after meeting all SGIP requirements requests payment of the incentive.PBI = Performance Based Incentive is the way in which the incentive is paid out over time based on performance of the system.
OtherICF InspectionRRF ReservedPPM ConfirmedPayment PBI in ProcessPayment Completed
NREL cdp_stat_02Created: Apr-29-14 2:08 PM | Data Range: 2001Q2-2013Q4 *Data from the California SGIP.

5
CDP-STAT-03 Location of Stationary Fuel Cell Systems Analyzed
CA Stationary Fuel Cell Installations* (2001 - 2013)
ICF InspectionICF Pending PaymentICF ReviewICF Technical ReviewPPM ConfirmedPPM Technical ReviewPayment CompletedPayment PBI in ProcessRRF ReservedRRF ReviewRRF Technical Review
NREL cdp_stat_03Created: Apr-29-14 2:08 PM | Data Range: 2001Q2-2013Q4 *Data from the California SGIP.
Definitions: RRF = Reservation Request Form, is the first step in the SGIP incentive claim process.PPM = Proof of Project Milestone; the applicant must prove progress and committment to the project.ICF = Incentive Claim Form is the step where the appliant, after meeting all SGIP requirements requests payment of the incentive.PBI = Performance Based Incentive is the way in which the incentive is paid out over time based on performance of the system.
6
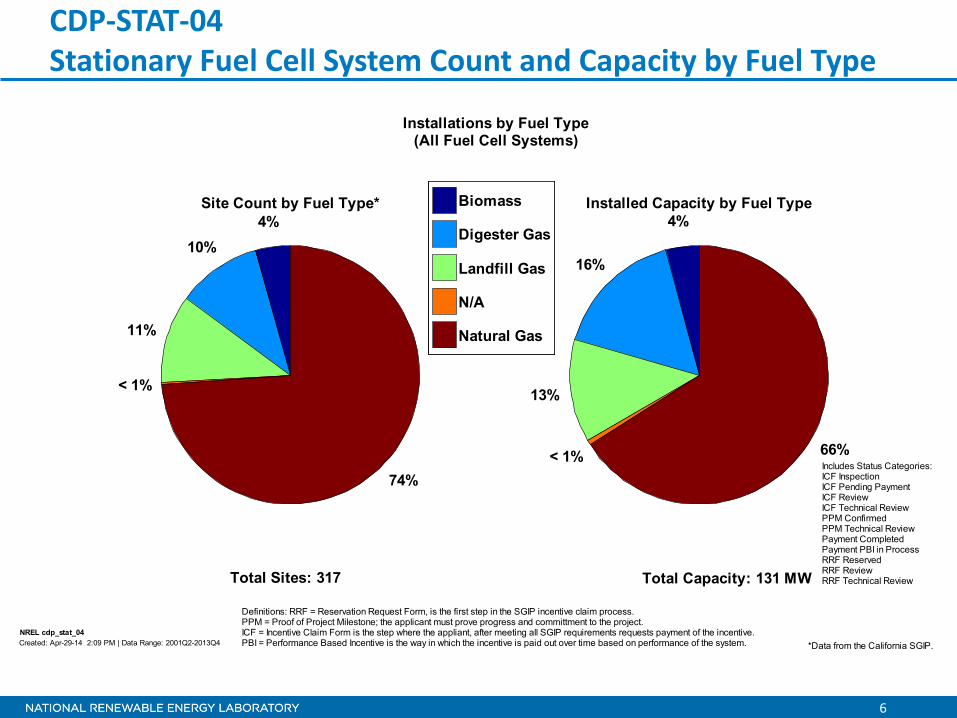
CDP-STAT-04 Stationary Fuel Cell System Count and Capacity by Fuel Type
4%10%
11%
< 1%
74%
Site Count by Fuel Type*
Biomass
Digester Gas
Landfill Gas
N/A
Natural Gas
4%
16%
13%
< 1% 66%
Installed Capacity by Fuel Type
NREL cdp_stat_04Created: Apr-29-14 2:09 PM | Data Range: 2001Q2-2013Q4
Includes Status Categories:ICF InspectionICF Pending PaymentICF ReviewICF Technical ReviewPPM ConfirmedPPM Technical ReviewPayment CompletedPayment PBI in ProcessRRF ReservedRRF ReviewRRF Technical ReviewTotal Capacity: 131 MWTotal Sites: 317
Installations by Fuel Type(All Fuel Cell Systems)
Definitions: RRF = Reservation Request Form, is the first step in the SGIP incentive claim process.PPM = Proof of Project Milestone; the applicant must prove progress and committment to the project.ICF = Incentive Claim Form is the step where the appliant, after meeting all SGIP requirements requests payment of the incentive.PBI = Performance Based Incentive is the way in which the incentive is paid out over time based on performance of the system. *Data from the California SGIP.

7
CDP-STAT-05 Fuel Type Capacity
Biomass Digester Gas Landfill Gas Natural Gas0
100
200
300
400
500
600
700
Inst
alle
d C
apac
ity (k
W)
Installation Capacity Statistics by Fuel Type*
NREL cdp_stat_05Created: Apr-29-14 2:09 PM | Data Range: 2001Q2-2013Q4
75% Percentile
Median
25% Percentile
Mean
Insufficientdata toprotect
anonymity
*Data from the California SGIP.

8
CDP-STAT-06 Fuel Cell Stationary Capacity and Average Prices
0 200 400 600 800 1000 >10000
5
10
15
20
25
30Distribution of Capacity and Average Eligible Cost $2010/kW*
Capacity (kW)
% o
f sys
tem
s
0 200 400 600 800 1000 >10000
2,000
4,000
6,000
8,000
10,000
12,000
Avg
. $/k
W
$/kW w/o Incentive$/kW w/ Incentive2020 DOE Target†
0 200 400 600 800 1000 0
5
10
15
20
Capacity (kW)
% o
f sys
tem
s
Detailed Capacity Distribution
0 10 20 30 40 500
20406080
Capacity (kW)%
of s
yste
ms
<=50
kW
NREL cdp_stat_06Created: Apr-29-14 2:09 PM | Data Range: 2001Q2-2013Q4
†for the year 2020, operating on natural gas.*Data from the California SGIP.
Eligible Costs May Include: Planning & Feasibility Study, Engineering & Design, Permitting, Self-Generation Equipment, WasteHeat Recovery Costs, Construction & Installation Costs, Gas & Electric Interconnection, Warranty, Maintenance Contract,Metering, Monitoring & Data Acquisition System, Emission Control Equipment Capital, Gasline Installation, Fuel Gas Clean-upEquipment, Electricity Storage Devices, Bond to Certify Renewable Fuel, Sales Tax, Fuel Supply (digesters, gas gathering,etc.), Thermal Load, & Other Eligible Costs
9
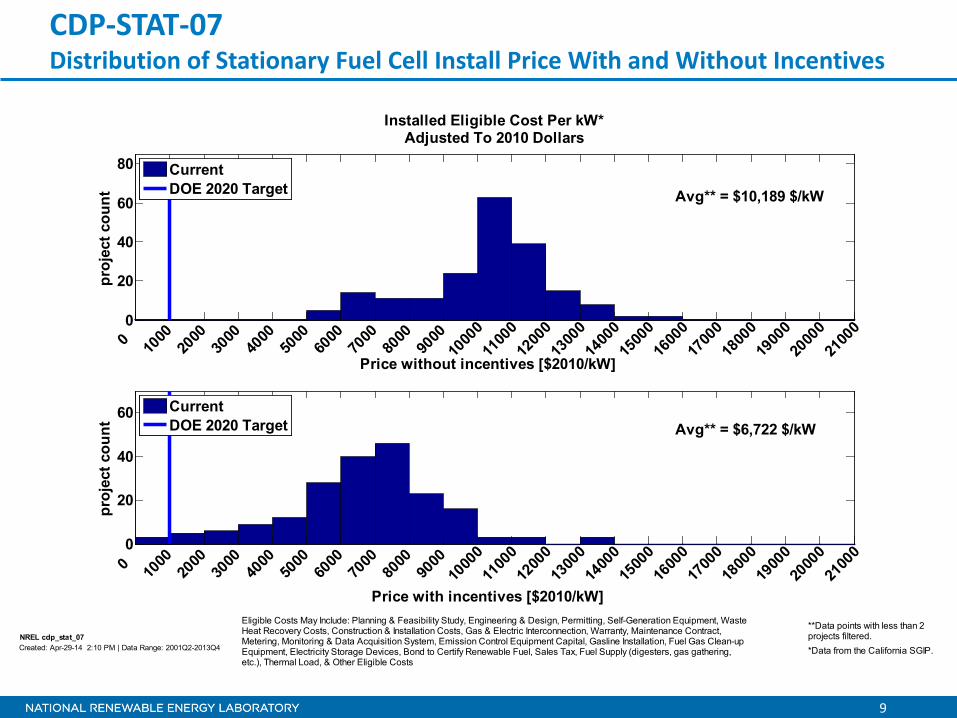
CDP-STAT-07 Distribution of Stationary Fuel Cell Install Price With and Without Incentives
0
20
40
60
80
0
1000
20
00
3000
40
00
5000
60
00
7000
80
00
9000
1000
011
000
1200
013
000
1400
015
000
1600
017
000
1800
019
000
2000
021
000
proj
ect c
ount
Price without incentives [$2010/kW]
Installed Eligible Cost Per kW*Adjusted To 2010 Dollars
Avg** = $10,189 $/kW
CurrentDOE 2020 Target
0
20
40
60
0
1000
20
00
3000
40
00
5000
60
00
7000
80
00
9000
1000
011
000
1200
013
000
1400
015
000
1600
017
000
1800
019
000
2000
021
000
proj
ect c
ount
Price with incentives [$2010/kW]
Avg** = $6,722 $/kW
CurrentDOE 2020 Target
NREL cdp_stat_07Created: Apr-29-14 2:10 PM | Data Range: 2001Q2-2013Q4 *Data from the California SGIP.
Eligible Costs May Include: Planning & Feasibility Study, Engineering & Design, Permitting, Self-Generation Equipment, WasteHeat Recovery Costs, Construction & Installation Costs, Gas & Electric Interconnection, Warranty, Maintenance Contract,Metering, Monitoring & Data Acquisition System, Emission Control Equipment Capital, Gasline Installation, Fuel Gas Clean-upEquipment, Electricity Storage Devices, Bond to Certify Renewable Fuel, Sales Tax, Fuel Supply (digesters, gas gathering,etc.), Thermal Load, & Other Eligible Costs
**Data points with less than 2projects filtered.
10
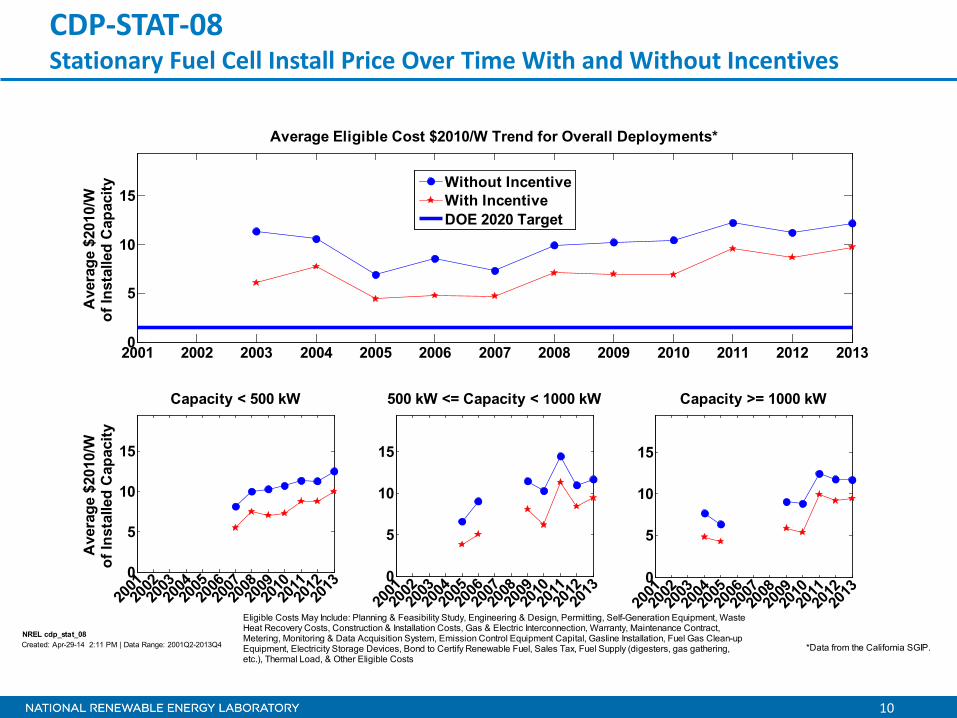
CDP-STAT-08 Stationary Fuel Cell Install Price Over Time With and Without Incentives
2001 2002 2003 2004 2005 2006 2007 2008 2009 2010 2011 2012 20130
5
10
15
Ave
rage
$20
10/W
of In
stal
led
Cap
acity
Average Eligible Cost $2010/W Trend for Overall Deployments*
Without IncentiveWith IncentiveDOE 2020 Target
0
5
10
15
200120
0220
0320
0420
0520
0620
0720
0820
0920
1020
1120
1220
13
Capacity < 500 kW
Ave
rage
$20
10/W
of In
stal
led
Cap
acity
0
5
10
15
200120
0220
0320
0420
0520
0620
0720
0820
0920
1020
1120
1220
13
500 kW <= Capacity < 1000 kW
0
5
10
15
200120
0220
0320
0420
0520
0620
0720
0820
0920
1020
1120
1220
13
Capacity >= 1000 kW
NREL cdp_stat_08Created: Apr-29-14 2:11 PM | Data Range: 2001Q2-2013Q4 *Data from the California SGIP.
Eligible Costs May Include: Planning & Feasibility Study, Engineering & Design, Permitting, Self-Generation Equipment, WasteHeat Recovery Costs, Construction & Installation Costs, Gas & Electric Interconnection, Warranty, Maintenance Contract,Metering, Monitoring & Data Acquisition System, Emission Control Equipment Capital, Gasline Installation, Fuel Gas Clean-upEquipment, Electricity Storage Devices, Bond to Certify Renewable Fuel, Sales Tax, Fuel Supply (digesters, gas gathering,etc.), Thermal Load, & Other Eligible Costs

11
CDP-STAT-09 Stationary Fuel Cell Install Price by Fuel Type With and Without Incentives
Biomass Digester Gas Landfill Gas Natural Gas
4000
6000
8000
10000
12000
$201
0/kW
of In
stal
led
Cap
acity
Eligible Cost $2010/kW of Installed Capacity by Fuel Type*
Avg. Without IncentiveAvg. With Incentive
NREL cdp_stat_09Created: Apr-29-14 2:11 PM | Data Range: 2001Q2-2013Q4
75% Percentile
Median
25% Percentile
Mean
*Data from the California SGIP.
Eligible Costs May Include: Planning & Feasibility Study, Engineering & Design, Permitting, Self-Generation Equipment, WasteHeat Recovery Costs, Construction & Installation Costs, Gas & Electric Interconnection, Warranty, Maintenance Contract,Metering, Monitoring & Data Acquisition System, Emission Control Equipment Capital, Gasline Installation, Fuel Gas Clean-upEquipment, Electricity Storage Devices, Bond to Certify Renewable Fuel, Sales Tax, Fuel Supply (digesters, gas gathering,etc.), Thermal Load, & Other Eligible Costs
12
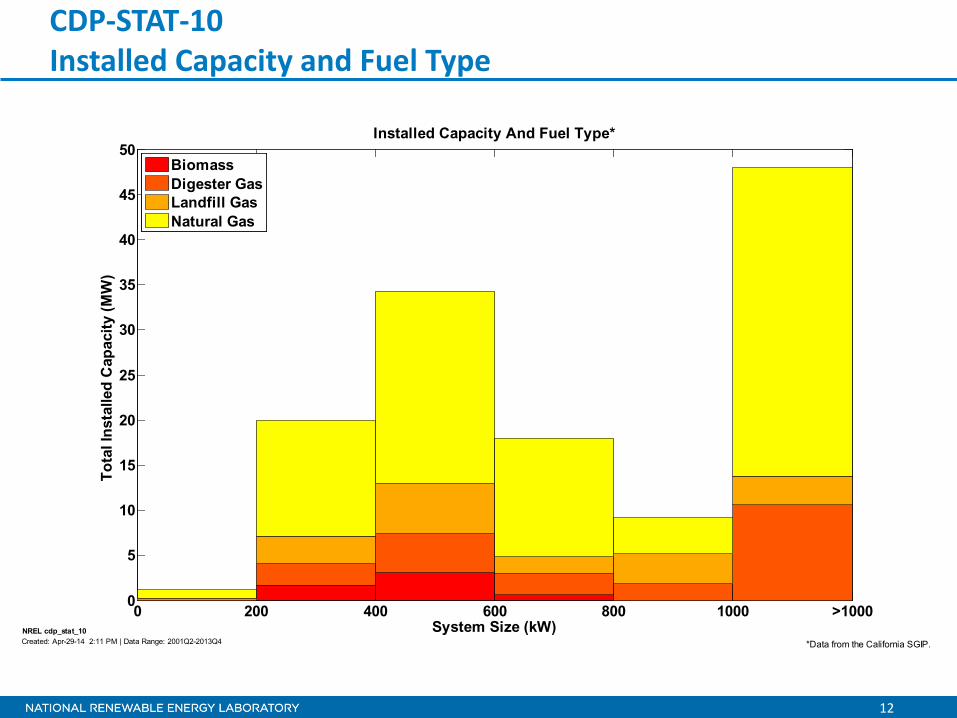
CDP-STAT-10 Installed Capacity and Fuel Type
0 200 400 600 800 1000 >10000
5
10
15
20
25
30
35
40
45
50
System Size (kW)
Tota
l Ins
talle
d C
apac
ity (M
W)
Installed Capacity And Fuel Type*
BiomassDigester GasLandfill GasNatural Gas
NREL cdp_stat_10Created: Apr-29-14 2:11 PM | Data Range: 2001Q2-2013Q4 *Data from the California SGIP.
13
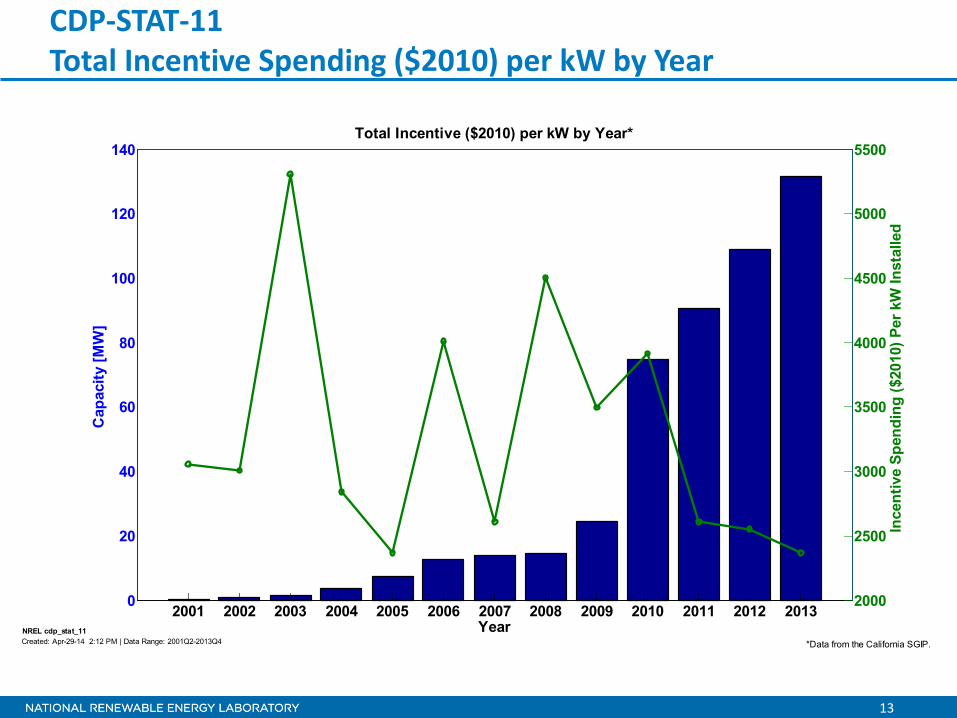
CDP-STAT-11 Total Incentive Spending ($2010) per kW by Year
2001 2002 2003 2004 2005 2006 2007 2008 2009 2010 2011 2012 20130
20
40
60
80
100
120
140
Cap
acity
[MW
]
Year2000
2500
3000
3500
4000
4500
5000
5500
Ince
ntiv
e Sp
endi
ng ($
2010
) Per
kW
Inst
alle
d
Total Incentive ($2010) per kW by Year*
NREL cdp_stat_11Created: Apr-29-14 2:12 PM | Data Range: 2001Q2-2013Q4 *Data from the California SGIP.

14
CDP-STAT-12 Average System Size Installed Per Year (kW)
2001 2002 2003 2004 2005 2006 2007 2008 2009 2010 2011 2012 20130
100
200
300
400
500
600
700
800
Ave
rage
Sys
tem
Siz
e In
stal
led
Per Y
ear (
kW)
Year
Average System Size Installed Per Year (kW)*
Overall Average Capacity = 462 kW
NREL cdp_stat_12Created: Apr-29-14 2:12 PM | Data Range: 2001Q2-2013Q4 *Data from the California SGIP.

15
CDP-STAT-13 Installed Annual Capacity by Fuel Type
2001 2002 2003 2004 2005 2006 2007 2008 2009 2010 2011 2012 20130
10
20
30
40
50
60
Year
Tota
l Ann
ual I
nsta
lled
Cap
acity
(MW
)
Installed Fuel Type By Year*
BiomassDigester GasLandfill GasNatural Gas
NREL cdp_stat_13Created: Apr-29-14 2:12 PM | Data Range: 2001Q2-2013Q4 *Data from the California SGIP.

16
CDP-STAT-14 Distribution of Capacity by Equipment Type
0 200 400 600 800 1000 1200 1400 1600 1800 2000 >20000
50
100
150
200
250Distribution of Capacity by Equipment Type*
Capacity (kW)
Tota
l # o
f Sys
tem
s
Fuel Cell CHPFuel Cell ElectricGas TurbineInternal CombustionMicroturbinePressure Reduction Turbine
NREL cdp_stat_14Created: Apr-29-14 2:13 PM | Data Range: 2001Q2-2013Q4 *Data from the California SGIP.

17
CDP-STAT-15 Average Eligible Cost by Equipment Type, Including Other DG
2001 2002 2003 2004 2005 2006 2007 2008 2009 2010 2011 2012 20130
5
10
15
20
25
Ave
rage
$20
10/W
of In
stal
led
Cap
acity
Average Eligible Cost $2010/W Trend for Overall Deployments*Without Incentives
2001 2002 2003 2004 2005 2006 2007 2008 2009 2010 2011 2012 20130
5
10
15
20
25
Average Eligible Cost $2010/W Trend for Overall Deployments*With Incentives
Ave
rage
$20
10/W
of In
stal
led
Cap
acity
Fuel Cell CHPFuel Cell ElectricGas TurbineInternal CombustionMicroturbinePressure Reduction Turbine
NREL cdp_stat_15Created: Apr-29-14 2:13 PM | Data Range: 2001Q2-2013Q4 *Data from the California SGIP.
Eligible Costs May Include: Planning & Feasibility Study, Engineering & Design, Permitting, Self-Generation Equipment, WasteHeat Recovery Costs, Construction & Installation Costs, Gas & Electric Interconnection, Warranty, Maintenance Contract,Metering, Monitoring & Data Acquisition System, Emission Control Equipment Capital, Gasline Installation, Fuel Gas Clean-upEquipment, Electricity Storage Devices, Bond to Certify Renewable Fuel, Sales Tax, Fuel Supply (digesters, gas gathering,etc.), Thermal Load, & Other Eligible Costs
18
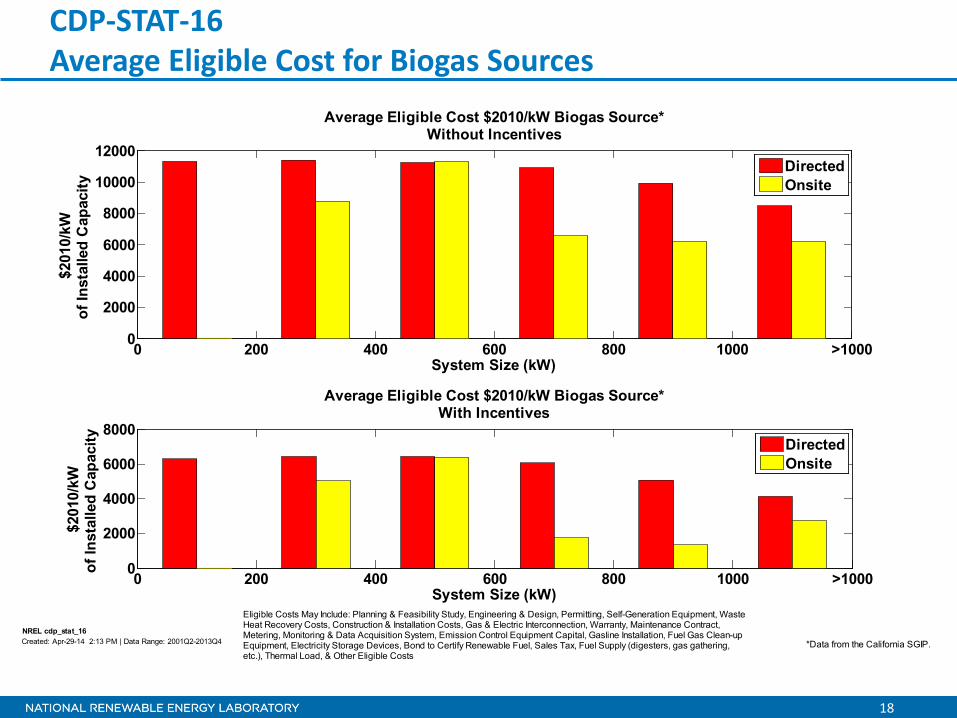
CDP-STAT-16 Average Eligible Cost for Biogas Sources
0 200 400 600 800 1000 >10000
2000
4000
6000
8000
10000
12000
Average Eligible Cost $2010/kW Biogas Source*Without Incentives
System Size (kW)
$201
0/kW
of In
stal
led
Cap
acity
DirectedOnsite
0 200 400 600 800 1000 >10000
2000
4000
6000
8000
Average Eligible Cost $2010/kW Biogas Source*With Incentives
System Size (kW)
$201
0/kW
of In
stal
led
Cap
acity
DirectedOnsite
NREL cdp_stat_16Created: Apr-29-14 2:13 PM | Data Range: 2001Q2-2013Q4 *Data from the California SGIP.
Eligible Costs May Include: Planning & Feasibility Study, Engineering & Design, Permitting, Self-Generation Equipment, WasteHeat Recovery Costs, Construction & Installation Costs, Gas & Electric Interconnection, Warranty, Maintenance Contract,Metering, Monitoring & Data Acquisition System, Emission Control Equipment Capital, Gasline Installation, Fuel Gas Clean-upEquipment, Electricity Storage Devices, Bond to Certify Renewable Fuel, Sales Tax, Fuel Supply (digesters, gas gathering,etc.), Thermal Load, & Other Eligible Costs

19
CDP-STAT-20 Installations By Fuel Type (CHP Fuel Cells)
8%
4%
88%
Site Count by Fuel Type*
Digester Gas
Landfill Gas
Natural Gas
32%
13%
55%
Installed Capacity by Fuel Type
NREL cdp_stat_20Created: Apr-29-14 3:30 PM | Data Range: 2001Q2-2013Q4
Includes Status Categories:ICF Technical ReviewPPM ConfirmedPPM Technical ReviewPayment CompletedPayment PBI in ProcessRRF ReservedRRF Technical Review
Total Capacity: 28 MWTotal Sites: 112
Installations by Fuel Type(CHP Fuel Cell Systems)
Definitions: RRF = Reservation Request Form, is the first step in the SGIP incentive claim process.PPM = Proof of Project Milestone; the applicant must prove progress and committment to the project.ICF = Incentive Claim Form is the step where the appliant, after meeting all SGIP requirements requests payment of the incentive.PBI = Performance Based Incentive is the way in which the incentive is paid out over time based on performance of the system. *Data from the California SGIP.

20
CDP-STAT-21 Installation Capacity by Fuel Type (CHP Fuel Cells)
Digester Gas Landfill Gas Natural Gas0
100
200
300
400
500
600
700
800
900
1000
1100
1200
1300
Inst
alle
d C
apac
ity (k
W)
Installation Capacity Statistics by Fuel Type (CHP)*
NREL cdp_stat_21Created: Apr-29-14 2:13 PM | Data Range: 2001Q2-2013Q4
75% Percentile
Median
25% Percentile
Mean
Insufficientdata toprotect
anonymity
*Data from the California SGIP.

21
CDP-STAT-22 Distribution of Capacity and Eligible Cost (CHP Fuel Cells)
0 200 400 600 800 1000 >10000
10
20
30
40
50
60
70Distribution of Capacity and Average Eligible Cost $2010/kW (CHP Fuel Cell)*
Capacity (kW)
% o
f sys
tem
s
0 200 400 600 800 1000 >10000
2,000
4,000
6,000
8,000
10,000
Avg
. $/k
W
$/kW w/o Incentive$/kW w/ Incentive2020 DOE Target†
0 200 400 600 800 1000 0
10
20
30
40
50
Capacity (kW)
% o
f sys
tem
s
Detailed Capacity Distribution
0 10 20 30 40 500
20406080
Capacity (kW)%
of s
yste
ms
<=50
kW
NREL cdp_stat_22Created: Apr-29-14 2:13 PM | Data Range: 2001Q2-2013Q4
†for the year 2020, operating on natural gas.*Data from the California SGIP.
Eligible Costs May Include: Planning & Feasibility Study, Engineering & Design, Permitting, Self-Generation Equipment, WasteHeat Recovery Costs, Construction & Installation Costs, Gas & Electric Interconnection, Warranty, Maintenance Contract,Metering, Monitoring & Data Acquisition System, Emission Control Equipment Capital, Gasline Installation, Fuel Gas Clean-upEquipment, Electricity Storage Devices, Bond to Certify Renewable Fuel, Sales Tax, Fuel Supply (digesters, gas gathering,etc.), Thermal Load, & Other Eligible Costs
22
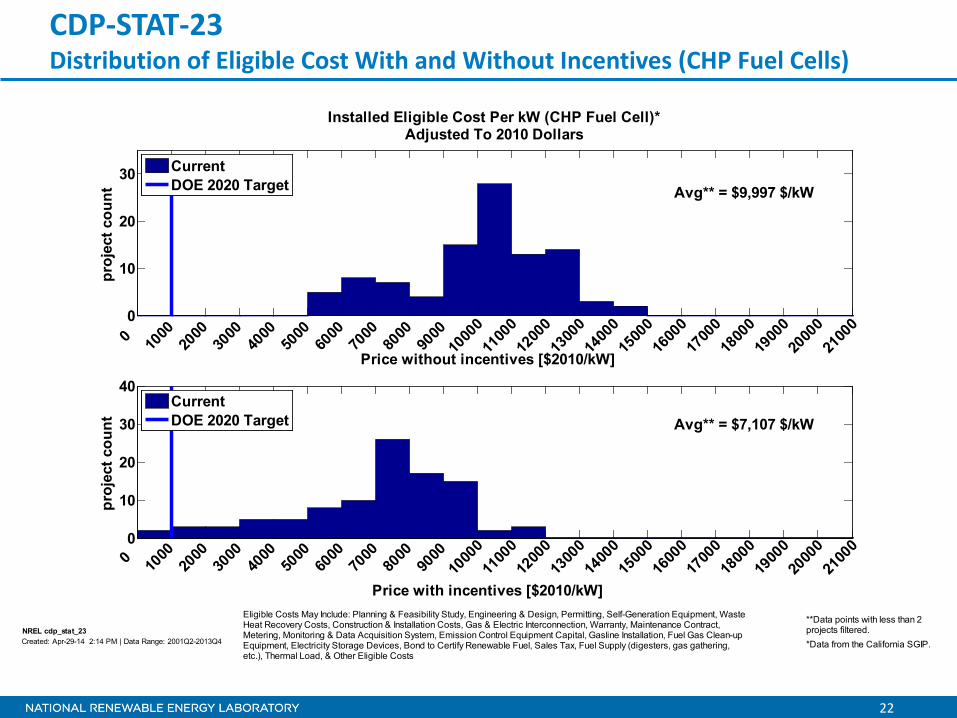
CDP-STAT-23 Distribution of Eligible Cost With and Without Incentives (CHP Fuel Cells)
0
10
20
30
0
1000
20
00
3000
40
00
5000
60
00
7000
80
00
9000
1000
011
000
1200
013
000
1400
015
000
1600
017
000
1800
019
000
2000
021
000
proj
ect c
ount
Price without incentives [$2010/kW]
Installed Eligible Cost Per kW (CHP Fuel Cell)*Adjusted To 2010 Dollars
Avg** = $9,997 $/kW
CurrentDOE 2020 Target
0
10
20
30
40
0
1000
20
00
3000
40
00
5000
60
00
7000
80
00
9000
1000
011
000
1200
013
000
1400
015
000
1600
017
000
1800
019
000
2000
021
000
proj
ect c
ount
Price with incentives [$2010/kW]
Avg** = $7,107 $/kW
CurrentDOE 2020 Target
NREL cdp_stat_23Created: Apr-29-14 2:14 PM | Data Range: 2001Q2-2013Q4 *Data from the California SGIP.
Eligible Costs May Include: Planning & Feasibility Study, Engineering & Design, Permitting, Self-Generation Equipment, WasteHeat Recovery Costs, Construction & Installation Costs, Gas & Electric Interconnection, Warranty, Maintenance Contract,Metering, Monitoring & Data Acquisition System, Emission Control Equipment Capital, Gasline Installation, Fuel Gas Clean-upEquipment, Electricity Storage Devices, Bond to Certify Renewable Fuel, Sales Tax, Fuel Supply (digesters, gas gathering,etc.), Thermal Load, & Other Eligible Costs
**Data points with less than 2projects filtered.
23
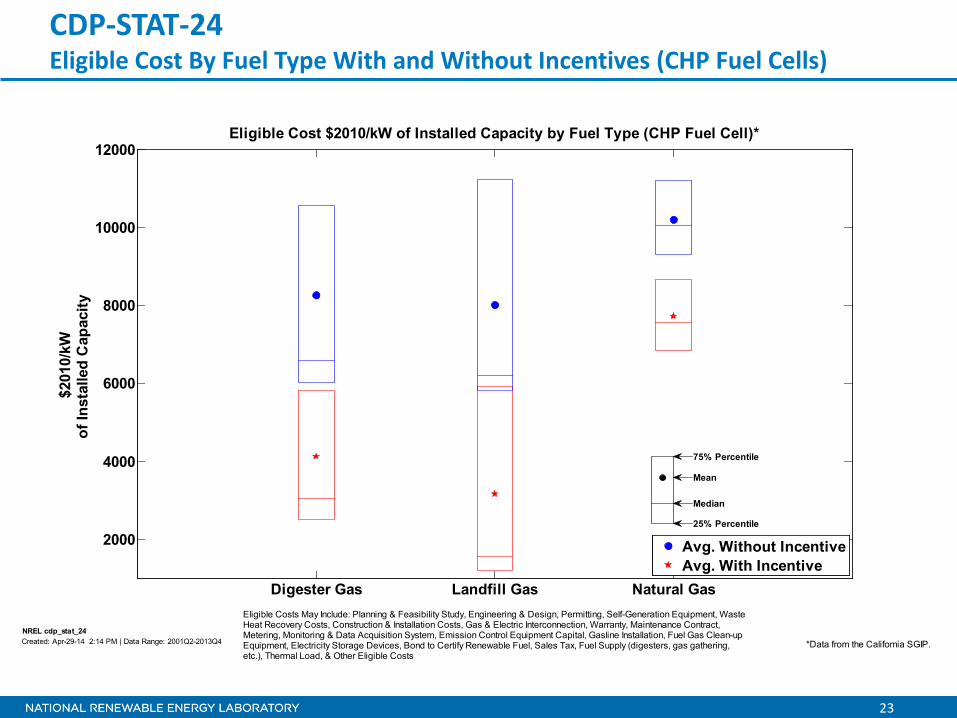
CDP-STAT-24 Eligible Cost By Fuel Type With and Without Incentives (CHP Fuel Cells)
Digester Gas Landfill Gas Natural Gas
2000
4000
6000
8000
10000
12000
$201
0/kW
of In
stal
led
Cap
acity
Eligible Cost $2010/kW of Installed Capacity by Fuel Type (CHP Fuel Cell)*
Avg. Without IncentiveAvg. With Incentive
NREL cdp_stat_24Created: Apr-29-14 2:14 PM | Data Range: 2001Q2-2013Q4
75% Percentile
Median
25% Percentile
Mean
*Data from the California SGIP.
Eligible Costs May Include: Planning & Feasibility Study, Engineering & Design, Permitting, Self-Generation Equipment, WasteHeat Recovery Costs, Construction & Installation Costs, Gas & Electric Interconnection, Warranty, Maintenance Contract,Metering, Monitoring & Data Acquisition System, Emission Control Equipment Capital, Gasline Installation, Fuel Gas Clean-upEquipment, Electricity Storage Devices, Bond to Certify Renewable Fuel, Sales Tax, Fuel Supply (digesters, gas gathering,etc.), Thermal Load, & Other Eligible Costs

24
CDP-STAT-25 Cumulative Deployment Count by Category and Year
2001 2002 2003 2004 2005 2006 2007 2008 2009 2010 2011 2012 20130
500
1000
1500
Proj
ect C
ount
Cumulative Deployment Count by Category and Year*
Total = 1493 units
TotalFuel Cell CHPFuel Cell ElectricGas TurbineInternal CombustionMicroturbinePressure Reduction Turbine
2001 2002 2003 2004 2005 2006 2007 2008 2009 2010 2011 2012 20130
100
200
300
400
500
Cap
acity
[MW
]
Cumulative Capacity by Category and Year*
Total = 460 MW
TotalFuel Cell CHPFuel Cell ElectricGas TurbineInternal CombustionMicroturbinePressure Reduction Turbine
NREL cdp_stat_25Created: Apr-29-14 2:14 PM | Data Range: 2001Q2-2013Q4 *Data from the California SGIP.

25
CDP-STAT-26 Installed Eligible Cost per kW By Capacity
0
10
20
30
Average Prices No Incentive, Incentive0-50 kW = $10,808/kW, $8,299/kWAverage Prices No Incentive, Incentive
51-200 kW = $10,932/kW, $6,725/kW
Average Prices No Incentive, Incentive
201-400 kW = $9,950/kW, $6,046/kW
Average Prices No Incentive, Incentive
401+ kW = $9,524/kW, $5,587/kWData points with less than 2 projects filtered.
0 10
00 20
00 30
00 40
00 50
00 60
00 70
00 80
00 90
00
1000
011
00012
00013
00014
00015
00016
00017
00018
00019
00020
00021
000
proj
ect c
ount
Price [$2010/kW] No Incentive
Installed Eligible Cost Per kW By Capacity*Adjusted To 2010 Dollars
0-50kW
51-200 kW
201-400 kW
>400 kW
DOE 2020 Target
0
10
20
30
0 10
00 20
00 30
00 40
00 50
00 60
00 70
00 80
00 90
00
1000
011
00012
00013
00014
00015
00016
00017
00018
00019
00020
00021
000
proj
ect c
ount
Price [$2010/kW] With IncentiveNREL cdp_stat_26Created: Apr-29-14 2:15 PM | Data Range: 2001Q2-2013Q4 *Data from the California SGIP.
Eligible Costs May Include: Planning & Feasibility Study,Engineering & Design, Permitting, Self-GenerationEquipment, Waste Heat Recovery Costs, Construction &Installation Costs, Gas & Electric Interconnection, Warranty,Maintenance Contract, Metering, Monitoring & DataAcquisition System, Emission Control Equipment Capital,Gasline Installation, Fuel Gas Clean-up Equipment,Electricity Storage Devices, Bond to Certify RenewableFuel, Sales Tax, Fuel Supply (digesters, gas gathering, etc.),Thermal Load, & Other Eligible Costs

26
CDP-STAT-27 Installed Eligible Cost per kW By Capacity (CHP Fuel Cell)
0
10
20
30
Average Prices No Incentive, Incentive0-50 kW = $10,830/kW, $8,320/kWAverage Prices No Incentive, Incentive
51-200 kW = $NaN/kW, $NaN/kW
Average Prices No Incentive, Incentive
201-400 kW = $8,817/kW, $5,330/kW
Average Prices No Incentive, Incentive
401+ kW = $7,582/kW, $3,647/kWData points with less than 2 projects filtered.
0 10
00 20
00 30
00 40
00 50
00 60
00 70
00 80
00 90
00
1000
011
00012
00013
00014
00015
00016
00017
00018
00019
00020
00021
000
proj
ect c
ount
Price [$2010/kW] No Incentive
Installed Eligible Cost Per kW By Capacity (CHP Fuel Cell)*Adjusted To 2010 Dollars
0-50kW
51-200 kW
201-400 kW
>400 kW
DOE 2020 Target
0
10
20
30
0 10
00 20
00 30
00 40
00 50
00 60
00 70
00 80
00 90
00
1000
011
00012
00013
00014
00015
00016
00017
00018
00019
00020
00021
000
proj
ect c
ount
Price [$2010/kW] With IncentiveNREL cdp_stat_27Created: Apr-29-14 2:15 PM | Data Range: 2001Q2-2013Q4 *Data from the California SGIP.
Eligible Costs May Include: Planning & Feasibility Study,Engineering & Design, Permitting, Self-GenerationEquipment, Waste Heat Recovery Costs, Construction &Installation Costs, Gas & Electric Interconnection, Warranty,Maintenance Contract, Metering, Monitoring & DataAcquisition System, Emission Control Equipment Capital,Gasline Installation, Fuel Gas Clean-up Equipment,Electricity Storage Devices, Bond to Certify RenewableFuel, Sales Tax, Fuel Supply (digesters, gas gathering, etc.),Thermal Load, & Other Eligible Costs

27
CDP-STAT-28 Range of Installed Eligible Cost per kW Biogas Sources by Capacity
0 200 400 600 800 1000 >10000
3000
6000
9000
12000
15000
18000
System Size (kW)
$201
0/kW
of In
stal
led
Cap
acity
Range of Installed Eligible Cost Per kW Biogas Sources by Capacity
Biogas Sources with Incentive 25th/75th percentileBiogas Sources without Incentive 25th/75th percentileMean with IncentiveMedian with IncentiveMean without IncentiveMedian without Incentive
NREL cdp_stat_28Created: Apr-29-14 2:15 PM | Data Range: 2001Q2-2013Q4
Insufficientdata toprotect
anonymity
Insufficientdata toprotect
anonymity
*Data from the California SGIP.
Eligible Costs May Include: Planning & Feasibility Study, Engineering & Design, Permitting, Self-Generation Equipment, Waste HeatRecovery Costs, Construction & Installation Costs, Gas & Electric Interconnection, Warranty, Maintenance Contract, Metering, Monitoring &Data Acquisition System, Emission Control Equipment Capital, Gasline Installation, Fuel Gas Clean-up Equipment, Electricity StorageDevices, Bond to Certify Renewable Fuel, Sales Tax, Fuel Supply (digesters, gas gathering, etc.), Thermal Load, & Other Eligible Costs