statistical analysis of federal sentencing data
TRANSCRIPT
BOOKER REPORT 2012: PART C
Statistical Analysis of Federal Sentencing Data METHODOLOGY
Some of the data in this report is taken from the Commission’s 2011 fiscal year datafile. In fiscal year 2011, the Commission received sentencing information on 86,201 individual offenders.1 However, the Commission received sufficient sentencing documentation for the analyses in this report for 76,216 offenders in fiscal year 2011.2 The analyses for this report were limited to those
1 Title 28 United States Code section 994(w) requires that the chief judge of every district ensure that within 30 days of entry of judgment in every felony and Class A misdemeanor case, the sentencing court submit to the Commission: (1) the judgment and commitment order; (2) the statement of reasons for the sentence imposed; (3) the plea agreement, if any; (4) the indictment or other charging information; and (5) the presentence report (unless waived by the court). 2 The Commission excluded 9,985 offenders from the 2011 fiscal year data for this report because the sentencing information for these offenders lacked the complete documentation needed for the analyses performed in this report. For 8,164 offenders, the majority of whom were immigration offenders from border districts, the court waived the presentence investigation report. As a result, those offenses lacked the documentation needed for the analysis, including guideline application and demographic information. The Commission excluded other offenders for whom the statement of reasons form and the presentence investigation report contained conflicting information concerning guideline application because the Commission could not ascertain how the Chapter Two guideline was applied.
76,216 offenders, and therefore the numbers reported here differ from those in the Commission’s 2011 Sourcebook of Federal Sentencing Statistics.
The data in this report necessarily differs in certain respects from the data published in the Commission’s Sourcebook of Federal Sentencing Statistics. In the Sourcebook, offenses are generally classified by the offense of conviction, whereas in this analysis, offenses are classified by the guideline applied at sentencing. These two methods of defining cases are both useful for research analysis; the choice of which method to use depends on the type of analysis to be undertaken. For this report, the Commission classified offenses by the guideline applied at sentencing because it enables several analyses. The guidelines take into account real offense conduct, such as the presence of a weapon, or the amount stolen in a robbery, that are not accounted for by mere reference to the statute of conviction.3 If, for example, an offender convicted of a drug trafficking offense engaged in conduct in which a victim was killed, that offender might be sentenced pursuant to the guideline applicable to homicide rather than drug trafficking.4 Such an offender’s sentence would not reflect the operation of the drug trafficking guideline, and therefore, including that sentence in the analysis of drug trafficking sentences would not contribute to an accurate analysis of the drug trafficking guideline. In summary, because the offender’s conduct ultimately determines the applicable sentencing range, classifying offenders by guideline rather than by statute of conviction facilitates a more precise analysis in which offenders engaged in similar criminal conduct are grouped together. As a result, cases with insufficient information to conduct the analysis were excluded.
3 See USSG Ch.1, Pt. A, intro. comment. (Nov. 2011). 4 USSG §2D1.1(d) (Cross References) (Nov. 2011).
1
BOOKER REPORT 2012: PART C Time Periods for Trend Analysis
In certain parts of this report, fiscal year data is discussed, for example where an overview of fiscal year 2011 data is provided to describe the current state of federal sentencing.5 However, for purposes of analyzing the impact of Booker and its progeny on sentencing trends, this report departs from the Commission’s general practice of reporting data by fiscal year, which runs from October 1 through September 30. Consistent with the Commission’s previous report on the impact of Booker on federal sentencing,6 the sentencing data are divided into four distinct time periods: the Koon period7 (June 13, 1996 through April 30, 2003), the PROTECT Act period8 (May 1, 2003 through June 24, 2004), the Booker period9 (January 12, 2005 through December 10, 2007), and the Gall period10 (December 11,
5 Other Commission datafiles, aggregated by fiscal year, are included in the analysis as appropriate, and their use is indicated in figures and tables throughout this report. 6 See U.S. SENT’G COMM’N, FINAL REPORT ON THE IMPACT OF UNITED STATES V. BOOKER ON FEDERAL SENTENCING (March 2006) [hereinafter 2006 BOOKER REPORT]. 7 The Koon period includes 333,564 offenders sentenced from June 13, 1996 (the day the Supreme Court issued the Koon decision) through and including April 30, 2003 (the day that the PROTECT Act was enacted) for which the Commission has received complete guideline information. 8 The PROTECT Act period includes 67,554 offenders sentenced from May 1, 2003 (the day after the PROTECT Act was enacted) through and including June 24, 2004 (the day the Supreme Court issued the Blakely decision) for which the Commission has received complete guideline information. Offenders sentenced after Blakely but before Booker are not included in this period. 9 The Booker period includes 187,632 offenders sentenced from January 12, 2005 (the day the Supreme Court issued the Booker decision) through and including December 10, 2007 (the day before the Supreme Court issued the Gall decision) for which the Commission has received complete guideline information. 10 The Gall period includes 274,623 offenders sentenced from December 11, 2007 (the day the Supreme Court issued the Gall decision) through and including
2007 through September 30, 2011). The Supreme Court’s decision in Koon, the enactment of the PROTECT Act, the Supreme Court’s decisions in Booker and Gall each marked significant changes in the legal framework governing federal sentencing, and are discussed in detail in Part A of this report.
With respect to the Commission’s trend analyses, a direct comparison across all four periods cannot always be made because the Commission changed the way it reported data on departures after the enactment of the PROTECT Act in April 2003. Before the PROTECT Act, the Commission reported only two categories of below range sentences: “substantial assistance” and “other downward departures.”11 In its 2003 report on departures under the sentencing guidelines,12 the Commission found that approximately 40 percent of the “other downward departures” attributed to courts in fiscal year 2001 cited in the sentencing documents some benefit to the government as the reason for the departure. Prior to the PROTECT Act, the existence of only two departure categories resulted in an overstatement of the proportion of downward departures attributable solely to the courts and an understatement of the proportion of downward departures attributable to government sponsorship.
The PROTECT Act authorized the creation of early disposition (“EDP” or “fast-track”) programs, under which defendants in districts designated by the Attorney General and the United States Attorney may enter written plea agreements stipulating to early disposition of their cases in exchange for a reduced sentence. In authorizing EDP departures, the PROTECT Act formalized a departure that was already in use, albeit informally, in various districts, and that was authorized
September 30, 2011 (the final day of fiscal year 2011) for which the Commission has received complete guideline information. 11 See, e.g., 2001 SOURCEBOOK OF FEDERAL SENTENCING STATISTICS, at 51. 12 U.S. SENT’G COMM’N, REPORT TO CONGRESS: DOWNWARD DEPARTURES FROM THE SENTENCING GUIDELINES (October 2003) at 5.
2
BOOKER REPORT 2012: PART C by the Attorney General for use in exceptional circumstances.13 The PROTECT Act also directed the Commission to promulgate a policy statement authorizing downward departures in such cases.14 In response the Commission promulgated USSG §5K3.1 (Early Disposition Programs) and created a new category for reporting below range sentences: government sponsored departures. This category includes substantial assistance departures, EDP departures under USSG §5K3.1, departures pursuant to a plea agreement, and any case in which the sentencing documents indicate government sponsorship of the below range sentence (“other government sponsored below range sentences”). The Commission fully implemented this new attribution methodology in fiscal year 2004. As a result, the Koon period data is not as refined as the data from subsequent periods and, in some instances, cannot be compared to data from the other periods. However, comparisons across the PROTECT Act, Booker, and Gall periods can be made because the Commission used the same data collection methodology throughout each of those time periods.
In sum, on the tables and in the text that follow, the non-government sponsored below range category for the Koon period is in fact the “other downward departures” category reported prior to the PROTECT Act. Although labeled as “non-government sponsored below range sentences,” this category represented all downward departures other than those for substantial assistance to authorities, including below range sentences that were advocated by the government for reasons other than substantial assistance, such as a plea agreement. In contrast, in the PROTECT Act, Booker, and Gall periods, non-government sponsored below range sentences are only those that fall below the calculated guideline range for a reason not initiated by the government.
13 Memorandum of John Ashcroft, Attorney General, Department Principles for Implementing an Expedited Disposition or “Fast-Track” Prosecution Program in a District (Sept. 22, 2003). 14 Pub. L. No. 108–21, §401(m) (2003).
Definitions of Key Terms
Throughout this report, sentences are discussed as either within range, above range, government sponsored below range, or non-government sponsored below range.
Within range sentences are those sentences that fall within the guideline range for the total offense level and criminal history category reported on the statement of reasons.
Above range sentences are those that are higher than the guideline range reported on the statement of reasons, whether initiated by the court or by the government. As used in this report above range sentences include: cases with departures above the guideline range which do not cite as a reason either Booker, 18 U.S.C. § 3553, or factors or reasons specifically prohibited in the provisions, policy statements, or commentary of the Guidelines Manual; cases with a sentence above the guideline range that includes both a departure as well as a sentence outside the guideline system mentioning either Booker, 18 U.S.C. § 3553, or related factors as a reason for sentencing above the guideline range; cases with a sentence above the guideline range with no departure indicated and that cite Booker, 18 U.S.C. § 3553, or related factors as one of the reasons for sentencing outside of the guideline system; and cases sentenced above the guideline range that cannot be classified into any of the other three above the range categories. This category includes, for example, cases in which no reason is provided for a sentence above the guideline range.
Government sponsored below range sentences are those sentences that fall below the guideline range reported on the statement of reasons based upon the government’s sponsorship. Government sponsorship of a below range sentence is determined by a yearly case review by Commission staff of both the reasons for the below range sentence and the coding by Commission staff of any indication of government sponsorship as indicated on the Statement of Reasons for below range sentences. The Statement of Reasons form AO245B versions 12/03, 06/05, and 09/08 have specific check-boxes to indicate the origins of the below range sentence, but cases that do not use this form may also indicate in writing the origins of the below range
3
BOOKER REPORT 2012: PART C sentence. Additionally, all cases with one or more of the following reasons were classified as being sponsored by the government regardless of whether the SOR indicated sponsorship: pursuant to a plea agreement (binding, non-binding, or unknown), fast track, savings to the government, early plea, deportation, waiver of indictment and/or appeal, other government motion, global disposition, due to stipulations, facilitated early release of a material witness, joint recommendation, and large number of immigration cases. Because the Commission staff reviews the reasons on a yearly basis, this list might be modified slightly from year to year. This report discusses government sponsored below range sentences in the aggregate, as well as substantial assistance below range sentences (USSG §5K1.1), Early Disposition Program below range sentences (“EDP”) (USSG §5K3.1), and other government sponsored below range sentences, separately.
Non-government sponsored below range sentences fall below the calculated guideline range for any reason not initiated by the government. This category includes: cases with departures below the guideline range that do not cite as a reason either Booker, 18 U.S.C. § 3553, or factors or reasons specifically prohibited in the provisions, policy statements, or commentary of the Guidelines Manual; cases with a sentence below the guideline range that include both a departure as well as a sentence outside the guideline system mentioning either Booker, 18 U.S.C. § 3553, or related factors as a reason for sentencing below the guideline range; cases with a sentence below the guideline range with no departure indicated and that cite Booker, 18 U.S.C. § 3553, or related factors as one of the reasons for sentencing outside of the guideline system; and other cases in which a below range sentence is imposed, but the case cannot be classified into any of the other three below range categories. This last category includes, for example, cases in which no reason is provided for a sentence below the guideline range.
Departures are those sentences that are outside of the guideline range or are otherwise different from the guideline range (i.e., a sentence of probation when only imprisonment is allowed under the guidelines) where the court cites factors or reasons specifically
permitted by the guidelines’ provisions, policy statements, or commentary.
Variances are those sentences that are outside the guideline range where the court cites a reason not found in the guidelines, such as. Booker or 18 U.S.C. § 3553. In cases in which the court cites both guidelines reasons and non-guidelines reasons to impose a sentence below the guideline range, the sentence is classified as a “Downward Departure with Booker / 18 U.S.C. § 3553.” For the most part, this report discusses non-government sponsored below range sentences without regard to the reasons for the sentence. Where it is instructive to note the reasons for the sentence and the distinction between departures, variances, and cases containing both, that distinction is made. National, Circuit, District, and Judge Level Data
National-level data is presented in the analysis of federal
offenses in the aggregate, and offense-specific sections of this report. A statistical overview of fiscal year 2011 for offenses in the aggregate, and for specific offense types, analyzes national level data. The trend analysis for the same offenses analyzes 1996 through 2011 data by fiscal year and by period, first on a national level, then by circuit, and then by district. The circuit- and district-level analyses illustrate similarities and differences in sentencing trends across circuits and districts. However, in several circuits, one or two large districts may have a disproportionate impact on the circuit-level data. For example in the Fifth Circuit, the Southern and Western Districts of Texas sentence far more offenders than other districts in that circuit.15 Therefore, circuit-level data reflects, in large part, the sentencing practices in those two districts. In contrast, an examination of district-level data allows clearer observation of where variations in sentencing practices have occurred. 15 In fiscal year 2011, judges in Southern Texas sentenced 8,158 offenders, and judges in Western Texas sentenced 6,533 offenders. Judges in these two districts sentenced 82.5 percent of all offenders in the Fifth Circuit (and almost 20 percent (19.3%) of all offenders nationwide).
4
BOOKER REPORT 2012: PART C Box plots
When presenting analyses of district-level data, the report
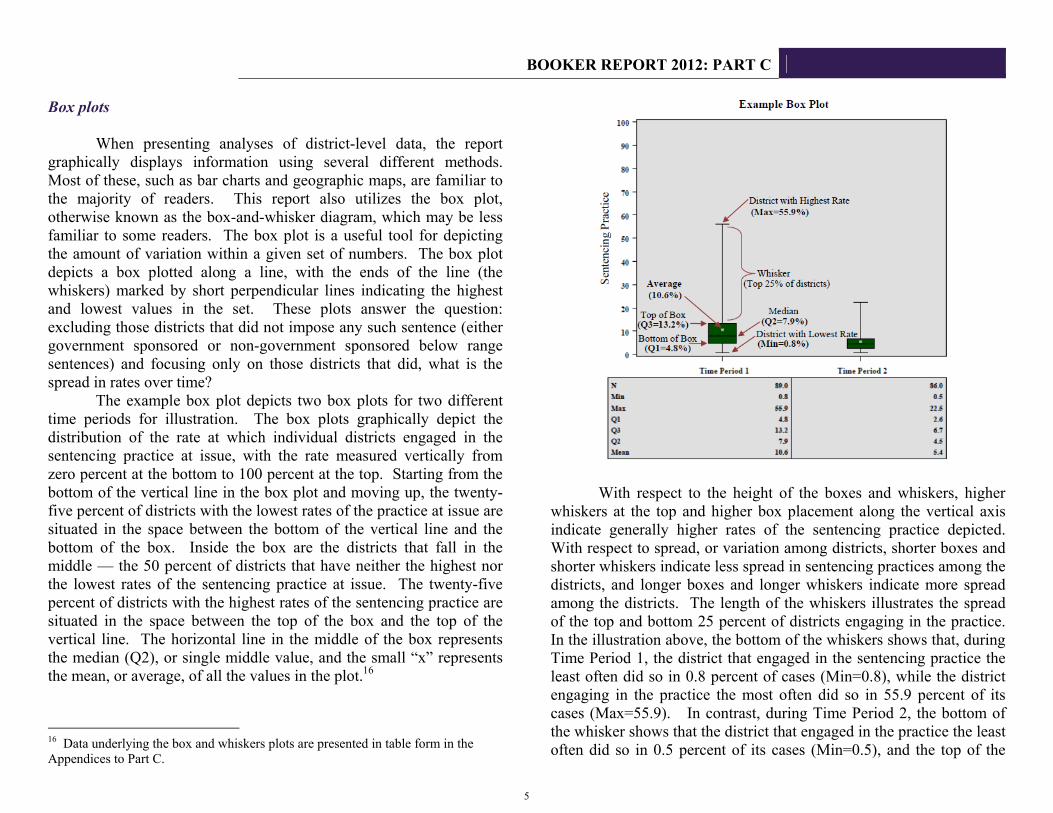
graphically displays information using several different methods. Most of these, such as bar charts and geographic maps, are familiar to the majority of readers. This report also utilizes the box plot, otherwise known as the box-and-whisker diagram, which may be less familiar to some readers. The box plot is a useful tool for depicting the amount of variation within a given set of numbers. The box plot depicts a box plotted along a line, with the ends of the line (the whiskers) marked by short perpendicular lines indicating the highest and lowest values in the set. These plots answer the question: excluding those districts that did not impose any such sentence (either government sponsored or non-government sponsored below range sentences) and focusing only on those districts that did, what is the spread in rates over time?
The example box plot depicts two box plots for two different time periods for illustration. The box plots graphically depict the distribution of the rate at which individual districts engaged in the sentencing practice at issue, with the rate measured vertically from zero percent at the bottom to 100 percent at the top. Starting from the bottom of the vertical line in the box plot and moving up, the twenty-five percent of districts with the lowest rates of the practice at issue are situated in the space between the bottom of the vertical line and the bottom of the box. Inside the box are the districts that fall in the middle — the 50 percent of districts that have neither the highest nor the lowest rates of the sentencing practice at issue. The twenty-five percent of districts with the highest rates of the sentencing practice are situated in the space between the top of the box and the top of the vertical line. The horizontal line in the middle of the box represents the median (Q2), or single middle value, and the small “x” represents the mean, or average, of all the values in the plot.16
16 Data underlying the box and whiskers plots are presented in table form in the Appendices to Part C.
With respect to the height of the boxes and whiskers, higher
whiskers at the top and higher box placement along the vertical axis indicate generally higher rates of the sentencing practice depicted. With respect to spread, or variation among districts, shorter boxes and shorter whiskers indicate less spread in sentencing practices among the districts, and longer boxes and longer whiskers indicate more spread among the districts. The length of the whiskers illustrates the spread of the top and bottom 25 percent of districts engaging in the practice. In the illustration above, the bottom of the whiskers shows that, during Time Period 1, the district that engaged in the sentencing practice the least often did so in 0.8 percent of cases (Min=0.8), while the district engaging in the practice the most often did so in 55.9 percent of its cases (Max=55.9). In contrast, during Time Period 2, the bottom of the whisker shows that the district that engaged in the practice the least often did so in 0.5 percent of its cases (Min=0.5), and the top of the
5
BOOKER REPORT 2012: PART C whisker shows that the district that engaged in the practice most often did so in 22.5 percent of its cases (Max=22.5).
The illustration of the top and bottom districts, however, is not the most instructive element of the box plot. The top and bottom of the whiskers may be set by a single district with a single case for any given period and therefore may be driven by the practice of an outlier district. In contrast, the box depicts the sentencing practice among the middle 50 percent of districts and is not driven by a single district. The placement of the box along the vertical axis and the size of the box indicate two things. First, higher placement of the box indicates that the middle 50 percent of districts were engaging in the practice at higher rates, while lower placement of the box indicates that the middle 50 percent of districts were engaging in the practice at lower rates. Second, the size of the box itself indicates the spread (or variation) among the middle 50 percent of districts. The larger the box, the greater the spread among the middle 50 percent of districts; the smaller the box, the smaller the spread among those districts.
Placing two box plots side by side allows visual comparison of sentencing practices across discrete periods. In this example, the box depicted in Time Period 2 is both compressed in size and lower down on the vertical axis compared to the box in Time Period 1. The fact that the box is higher on the vertical axis during Time Period 1 indicates two things. First, the middle 50 percent of districts engaged in the sentencing practice at higher rates than during Time Period 2, when the box is placed lower on the scale. Second, the compressed box during Time Period 2 indicates that there was less spread among the middle 50 percent of districts during Time Period 2 than there was during Time Period 1, when the box is larger (i.e., there is greater spread between the top and bottom of the box). The spread, or the Q1 value subtracted from the Q3 value, was 8.4 percentage points (Q1= 4.8, Q3=13.2) during Time Period 1 but only 4.1 percentage points (Q1=2.6, Q3=6.7) during Time Period 2.
Finally, the districts depicted on the box plot, as well as which districts make up the particular portions of the box plot, may change across time periods. In this sample box plot, for example, there were 89 districts that engaged in the sentencing practice during Time Period 1 (N=89) and only 86 that engaged in it during Time Period 2 (N=86). If a district did not have any cases exhibiting the particular sentencing practice, then that district is not depicted on the box plot. Moreover, a district may be in the top 25 percent during one time period, but the bottom 25 percent during another time period. Therefore, in different time periods, the box plot, and the various parts of the box plot, may be populated by different districts. Appendices to Part C contain tables listing all districts and their rates of government sponsored and non-government sponsored below range sentences during each of the periods.
Bubble and Scatter Plots
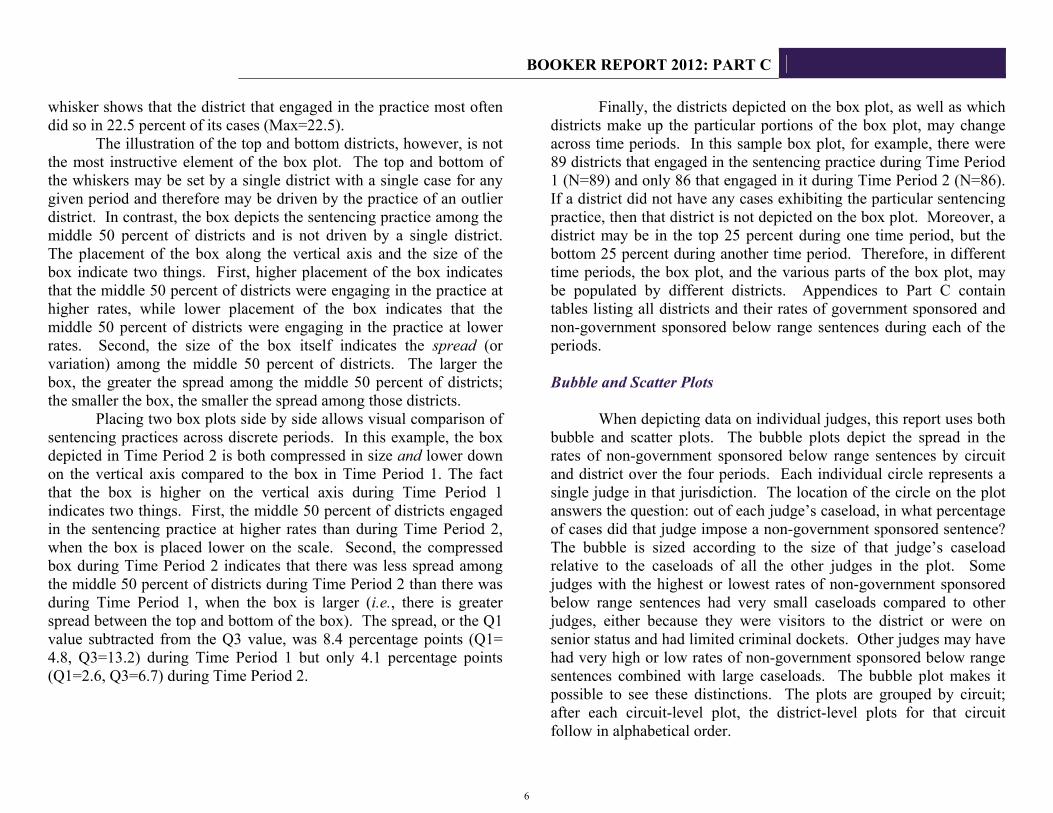
When depicting data on individual judges, this report uses both
bubble and scatter plots. The bubble plots depict the spread in the rates of non-government sponsored below range sentences by circuit and district over the four periods. Each individual circle represents a single judge in that jurisdiction. The location of the circle on the plot answers the question: out of each judge’s caseload, in what percentage of cases did that judge impose a non-government sponsored sentence? The bubble is sized according to the size of that judge’s caseload relative to the caseloads of all the other judges in the plot. Some judges with the highest or lowest rates of non-government sponsored below range sentences had very small caseloads compared to other judges, either because they were visitors to the district or were on senior status and had limited criminal dockets. Other judges may have had very high or low rates of non-government sponsored below range sentences combined with large caseloads. The bubble plot makes it possible to see these distinctions. The plots are grouped by circuit; after each circuit-level plot, the district-level plots for that circuit follow in alphabetical order.
6
BOOKER REPORT 2012: PART C
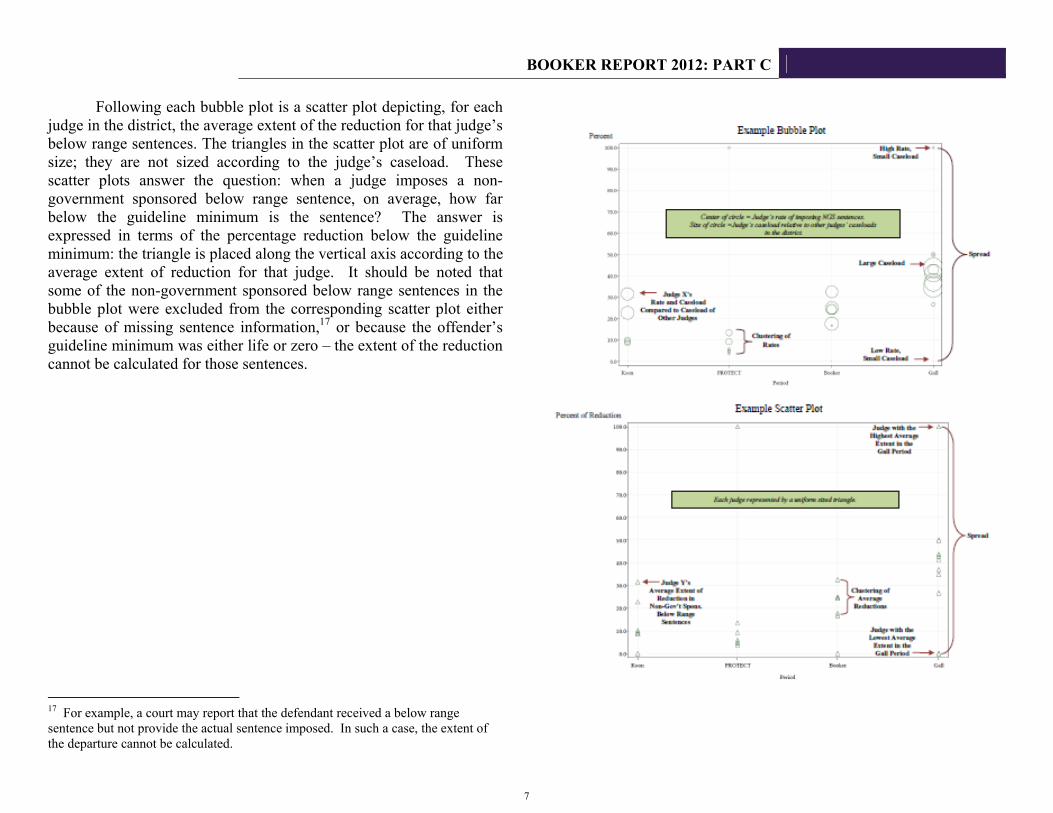
Following each bubble plot is a scatter plot depicting, for each judge in the district, the average extent of the reduction for that judge’s below range sentences. The triangles in the scatter plot are of uniform size; they are not sized according to the judge’s caseload. These scatter plots answer the question: when a judge imposes a non-government sponsored below range sentence, on average, how far below the guideline minimum is the sentence? The answer is expressed in terms of the percentage reduction below the guideline minimum: the triangle is placed along the vertical axis according to the average extent of reduction for that judge. It should be noted that some of the non-government sponsored below range sentences in the bubble plot were excluded from the corresponding scatter plot either because of missing sentence information,17 or because the offender’s guideline minimum was either life or zero – the extent of the reduction cannot be calculated for those sentences.
17 For example, a court may report that the defendant received a below range sentence but not provide the actual sentence imposed. In such a case, the extent of the departure cannot be calculated.
7
BOOKER REPORT 2012: PART C Average Guideline Minimum and Average Sentence
This report analyzes trends in the relationship between average guideline minimums18 and average sentences on the national and circuit level. This trend analysis compares the average minimum of the applicable guideline ranges for the offenders discussed (e.g., all offenders, drug trafficking offenders, or firearms offenders) with the average sentences for those offenders. For this analysis, the average sentence includes all sentences, whether they were above, within, or below the guideline range. By illustrating the relationship between the average guideline minimum and the average sentence over time, this analysis shows the relationship between the guidelines and the sentence, which can be viewed as the guidelines’ effect on sentences.
Generally, as the average guideline minimum increases, the average sentence increases. The reverse is also true: generally, as the average guideline minimum decreases, the average sentence also decreases. When the gap between the average guideline minimum and the average sentence widens, for example because the average sentence remains flat compared to increases in the average guideline minimum, the guidelines’ influence may be diminishing. When the gap does not change, the guidelines’ influence may be relatively stable.
Another comparison between the average sentence and the average guideline minimum seeks to answer the question: when courts impose sentences below the guideline range, how far below the guideline range do they sentence? In these analyses, only offenders receiving a below range sentences are included, and the analyses compare the average guideline minimum to the average sentence for those offenders only. The analyses examine the two different types of
18 Sentences of probation only are included as zero (0) months of imprisonment. Life sentences and other sentences exceeding 470 months are capped at 470 months. This analysis includes time of confinement as described in USSG §5C1.1 (Imposition of a Term of Imprisonment).
below range sentences: government sponsored19 and non-government sponsored.20 The analyses determine the extent of the downward departure or variance by calculating the difference between the length of the sentence and the guideline minimum. By illustrating the relationship between the average guideline minimum and the average below range sentence across the four periods, this analysis reveals trends in the extent of the reduction from the guideline minimum over time. Appeals Data
The report also analyzes the Commission’s appeals data. Each fiscal year, the Commission collects final decisions from all twelve circuit courts of appeals. The Commission collects orders and opinions, both published and unpublished, in direct appeals of federal criminal cases in which the defendant has been convicted and sentenced. The Commission receives slip opinions directly from some circuits, and searches electronic legal databases, individual circuit court websites, and the federal judiciary public access electronic records system (PACER) to collect these final decisions. The Commission’s Appeals Dataset may not report all criminal appellate decisions rendered during that fiscal year because these sources may not provide the Commission with every criminal appellate sentencing decision rendered in a fiscal year. The Commission does not include in the appeals database opinions that are not final dispositive decisions of direct criminal appeals in which the defendant has been convicted and sentenced. The
19 Government sponsored below range sentences include: substantial assistance (USSG §5K1.1) sentences; early disposition program (USSG §5K3.1) sentences; and other sentences in which the sentencing documents indicate government sponsorship of the below range sentence. 20 Non-government sponsored below range sentences include: downward departures from the guideline range, downward departures with Booker/18 U.S.C. § 3553, below the guideline range with Booker/18 U.S.C. § 3553, and all remaining sentences below the guideline range.
8

BOOKER REPORT 2012: PART C Commission does not include applications for writs of habeas corpus or other applications for writs, such as coram nobis or mandamus, because they are civil and are collateral attacks, not direct appeals. The Commission also excludes interlocutory appeals and appeals addressing pretrial issues, and circuit court opinions that are procedural in nature, such as remands to the district court to determine whether the defendant’s notice of appeal was timely filed.
Once the decisions that meet the Commission’s criteria are collected, basic information, such as the appellant’s name and the district in which the case originated, is extracted. Each appeal is then categorized into one of four types: (i) conviction-only appeals where the issues related only to the conviction; (ii) sentencing appeals, where the issues relate only to the sentence; (iii) conviction and sentencing appeals, where both conviction and sentencing issues are raised; and (iv) appeals filed pursuant to Anders v. California, where counsel for the appellant has advised the court of appeals that he or she has conscientiously examined the case but finds the appeal to be wholly frivolous and has requested, and received, permission to withdraw, as authorized in Anders v. California.21 The Commission added the Anders category of cases in fiscal year 2010. Previously, such cases had been categorized on the basis of the issues identified by counsel in the course of seeking to withdraw.
Where possible, the appellate case is linked to the original sentencing datafile on that offender in the Commission’s monitoring database. Such linking allows the Commission to analyze the demographic characteristics of the defendant, as well as factors such as the length of the defendant’s sentence and whether the defendant was subject to a mandatory minimum penalty.
Once the case is categorized, and matched to the original sentencing data in the Commission’s monitoring datafile where possible, the Commission collects further information on the issues related to sentencing. All four types of appeals remain in the database; however, additional information is only extracted from those cases in which the court’s opinion resolves sentencing issues. Each fiscal year
21 386 U.S. 738 (1967).
some appeals are categorized as “unknown.” In these cases, the court’s opinion does not contain sufficient information to classify the case as one type or another. This may occur, for example, if the opinion contains no information about the issues raised and merely states that the district court’s decision is “per curiam affirmed.” The Commission attempts to minimize the number of appeals of unknown type by consulting publicly available sources, such as briefs, to determine whether the appeal raised sentencing issues; however the Commission does not otherwise review briefs on appeal. The Commission generally captures information about the particular issues raised only from the court of appeals’ written order or opinion.
Extracting information on sentencing issues from the court’s opinion involves using a coding instrument consisting of variables to represent each sentencing issue decided on appeal. Each discrete issue related to sentencing is coded according to the most relevant variable in the coding instrument. The appellate court’s decision on the issue – for example whether the issue was properly or improperly decided by the district court, or whether the court of appeals has jurisdiction to consider the issue – is also coded using the appropriate variable. The Commission reports much of this information annually in its Federal Sourcebook of Sentencing Statistics. Some of the data reported in the Sourcebook and in this section reflects the number of discrete issues raised and decided. The number of issues raised and decided exceeds the number of appeals because each appeal may raise multiple issues.
Multivariate Analysis
Multivariate regression analysis usually begins with a decision to examine an observed phenomenon or outcome. In this instance, the outcome observed is the difference in sentence length between offenders. The researcher will then develop a hypothesis as to the many possible factors that might produce that outcome. In this instance, such relevant factors as type of offense, guideline minimum, and whether the offender was subject to a mandatory minimum penalty may contribute to differences in sentence length. The hypothesis is then tested through the use of multivariate regression analysis as data
9
BOOKER REPORT 2012: PART C about the outcome and many possible factors affecting that outcome are brought together. The goal of multivariate regression analysis is to determine whether there is an association between the factors being studied, and if so, to measure the extent to which each factor contributes to the observed outcome. Researchers refer to the outcome (in this instance, sentence length) as the “dependent variable.” The factors that might affect (and therefore might explain) that outcome are referred to as the “independent variables” or the “explanatory variables.” 22
Multivariate regression analysis often does not control for all relevant factors because sufficient data is not always readily available. For example, some factors that may be relevant to sentencing outcomes include whether the offender’s history included violent criminal conduct, the offender’s family ties, and the offender’s employment history.23 Data is not readily available for those factors,
22 For a more detailed explanation of multivariate regression analysis, the methodology behind it, and its uses and limitations, see U.S. SENT’G COMM’N, DEMOGRAPHIC DIFFERENCES IN FEDERAL SENTENCING PRACTICES: AN UPDATE OF THE BOOKER REPORT’S MULTIVARIATE REGRESSION ANALYSIS (March 2010). See also Federal Judicial Center, Reference Manual on Scientific Evidence 143, 181-83 (2d ed. 2000) [hereinafter FJC Reference Manual] (chapters titled “Reference Guide on Statistics,” by David H. Kaye, M.A., J.D., and David A. Freedman, Ph.D., and “Reference Guide on Multiple Regression,” by Daniel L. Rubinfeld, Ph.D.); Neil J. Salkind, Statistics for People Who (Think They) Hate Statistics 324 (2d ed. 2007). 23 See generally USSG Ch.4 (Criminal History and Criminal Livelihood) and Ch. 5 Pt.H (Specific Offender Characteristics). As noted in the 2006 Booker Report, “The presence of violent criminal history may lead the court to sentence higher in the prescribed range. The Commission’s datafile does not have information on the type of criminal history behavior. In 2002, the Commission created a datafile which took a 25 percent random sample of cases sentenced in Fiscal Year 2000. This datafile looked more closely at [an] offender’s criminal conduct, including detailed information on the type of criminal history the offender had. Using this data (the Intensive Study Sample 2000, or ISS2000), it was found that 24.4 percent of white offenders had violent criminal history events, as did 43.7 percent of black offenders, 18.9 percent of Hispanic offenders, and 23.7 percent of ‘other’ offenders.” 2006 BOOKER REPORT, supra note 6, at 105 n.317.
therefore the analysis cannot control for them.24 For this reason, caution should be exercised in drawing conclusions based on multivariate regression analysis.
The principal benefit of multivariate regression analysis is that it controls for the effect of each factor in the analysis by comparing offenders who are similar to one another in relevant ways. For example, controlling for the presumptive sentence (guideline minimum) and offense type means that Black male offenders convicted of firearms offenses and who faced a guideline minimum of 46 months of imprisonment are compared to White male offenders convicted of firearms offenses and facing a guideline minimum of 46 months of imprisonment. By controlling for such factors and comparing similarly situated offenders to each other, multivariate regression analysis seeks to answer the question: if two offenders are similar in certain ways, what other factors might be associated with those two offenders receiving different sentences? In addition, multivariate regression analysis measures the extent of the difference in outcomes.
The dependent variable used in each of the analyses was an offender’s total sentence length, in months, which included alternatives to imprisonment.25 Probationary sentences without 24 The Commission also does not have ready access to data related to prosecutorial decision making, which some commentators contend may contribute to demographic differences in sentencing. For further discussion of demographic differences in prosecutorial decision making, see VERA Institute of Justice, Do Race and Ethnicity Matter in Prosecution?: A Review of Empirical Studies (June 2012) (reviewing 34 studies analyzing the role of race and ethnicity in prosecutorial decision making), http://www.vera.org/download?file=3532/race-and-ethnicity-in-prosecution-first-edition.pdf. 25 Some have suggested that a period of alternative confinement is not analogous to a period of imprisonment. This analysis includes periods of alternative confinement (home detention or community confinement) because the main independent variable is the presumptive sentence, and in zones A, B, and C of the Sentencing Table (USSG Ch.5, Pt. A), the presumptive sentence can be satisfied by a period of alternative confinement. The inclusion of alternative sentences reduces the likelihood of introducing error in the statistical analysis due to the relationship of the presumptive sentence and overall confinement.
10
BOOKER REPORT 2012: PART C conditions of confinement are included as sentences of zero months. The independent variables were: The presumptive sentence, which is the bottom of the applicable
sentencing guideline range that applies in a case (i.e., the minimum sentence, in months, to which the offender was subject under the sentencing guidelines, taking into account all guideline, statutory, and mandatory minimum provisions);26
The type of offense committed (violent, sexual, pornography, drug trafficking, white collar, immigration, or other);27
Whether a statutory mandatory minimum punishment was applied
at sentencing;28
26 In some cases, a mandatory minimum provision limits the guideline range. For example, in a drug trafficking case in which a ten year mandatory minimum applies, the guideline minimum cannot be less than 120 months unless the offender qualifies for relief from the mandatory minimum. See USSG §5G1.1(b) (“Where a statutorily required minimum sentence is greater than the maximum of the applicable guideline range, the statutorily required minimum sentence shall be the guideline sentence.”). For more information on how the guidelines incorporate mandatory minimum penalty provisions, see U.S. SENT’G COMM’N, REPORT TO CONGRESS: MANDATORY MINIMUM PENALTIES IN THE FEDERAL CRIMINAL JUSTICE SYSTEM, at Ch. 3 (Oct. 2011). 27 The offense types (or categories) used in this analysis are broad in order to ensure a sufficient number of cases. The seriousness of the several crimes varies within the offense type categories as does the demographic characteristics of the offenders convicted of those crimes. Certain crimes within an offense type are punished more severely than others (e.g., those crimes involving injury not accounted for under the sentencing guidelines) and offenders of a particular demographic group may be disproportionately convicted of those crimes. If so, the offense type variables used in this analysis may not fully account for the effect on the sentence length imposed that is attributable to certain crimes. 28 This variable refers to whether the offender remained subject to a mandatory minimum penalty at sentencing, or whether the offender obtained relief from the mandatory minimum penalty and therefore was not subject to a mandatory minimum
Whether the court determined that a sentence outside the applicable sentencing guideline range was warranted;29
Detention status (whether the offender had been released on bail
prior to sentencing); Whether the offender pleaded guilty;
Race of the offender paired with the gender of the offender;
Citizenship of the offender (whether the offender was a United
States citizen); Educational level of the offender; and
Age of the offender.
The multivariate analyses pair race and gender into eight
distinct groups: White males/females, Black males/females, Hispanic males/females, and Other Race males/females. Reporting the results of the analyses in this way identifies any differences in sentencing outcomes associated with the offender’s race, gender, or both. These analyses show that some differences exist, and describe the relative size of those differences in the periods in which the differences were observed. However, the fact that certain sentencing outcomes may be correlated with demographic factors does not mean that the
penalty at sentencing (or was never subject to a mandatory minimum penalty because no such penalty applied to the charged offense). 29 This variable refers to whether the court imposed a sentence above or below the guideline range.
11
BOOKER REPORT 2012: PART C demographic factors caused the outcome.30 Furthermore, one or more key factors that could affect the analysis may have been omitted from the methodology used either because the factor is unknown or because data concerning the factor is not readily available in the Commission’s dataset. Therefore, the demographic differences in sentencing outcomes revealed by these analyses should not be interpreted as a finding that demographic factors caused those differences, or that the sentencing outcomes were motivated by racial or gender bias. Neither can the analyses presented in this report be used to explain why the observed differences in sentencing outcomes exist.
30 Correlation and causation are different concepts. A variable that is correlated with another may not be caused by it.
[I]n interpreting the results of a multiple regression analysis, it is important to distinguish between correlation and causality. Two variables are correlated when the events associated with the variables occur more frequently together than one would expect by chance . . . . A correlation between two variables does not imply that one event causes the second. Therefore, in making causal inferences, it is important to avoid spurious correlation. Spurious correlation arises when two variables are closely related but bear no causal relationship because both are caused by a third, unexamined variable . . . . Causality cannot be inferred by data analysis alone; rather, one must infer that a causal relationship exists on the basis of an underlying causal theory that explains the relationship between the two variables. Even when an appropriate theory has been identified, causality can never be inferred directly. One must look for empirical evidence that there is a causal relationship. Conversely, the fact that two variables are correlated does not guarantee the existence of a relationship; it could be that the model – a characterization of the underlying theory – does not reflect the correct interplay among the explanatory variables.
FJC Reference Manual, supra note 22, at 183-85. Judges make decisions when sentencing offenders based on many legitimate considerations that are not or cannot be measured. Some of these factors could be correlated with one or more of the demographic characteristics of offenders but not be influenced by any consideration of those characteristics.
12
PART C: ALL OFFENSES
Analysis of Federal Offenses in the Aggregate STATISTICAL OVERVIEW: FISCAL YEAR 2011
Trends in federal sentencing are best observed by analyzing specific offense types. Changes over time such as average sentences, average guideline minimums, and rates of within range and below range sentences vary from offense to offense. Nonetheless, there are some similarities in trends across offense types. The analysis presented in this section examines first, trends for federal offenses in the aggregate, then trends for specific offense types.
A review of quarterly data shows that, beginning in the PROTECT Act period and continuing through the Gall period, the proportion of sentences within the guideline range has generally decreased, while both rates of government sponsored and non-government sponsored below range sentences have generally increased. Nonetheless, over time, the majority of sentences have been either within range or below range pursuant to a government motion. During the Gall period 80.7 percent of sentences were either within range or below range pursuant to a government motion.
The increase in rates of non-government sponsored below range sentences has been particularly pronounced in the Booker and Gall periods. For nearly all offense types, more districts imposed non-government sponsored below range sentences at higher rates, and did so with greater variation during the Gall period than during any other period. However, the extent of the reduction in such cases has remained relatively stable; the average reduction for offenses in the
aggregate remained near 40 percent below the guideline minimum in the four periods.
Notwithstanding the general decrease in the percentage of within range sentences over time, when offenses are analyzed in the aggregate, the influence of the guidelines appears to have remained relatively stable. During all four periods, the average guideline minimum and the average sentence have tracked each other closely. Average sentences for offenses in the aggregate have decreased during the Gall period, from an average of 54 months during the Booker period to an average of 49 months during the Gall period. Similarly, average guideline minimums have also decreased, from 63 months during the Booker period to 59 months in the Gall period.
When federal offenses are analyzed separately, however, differences emerge in the relationship between the average guideline minimum and the average sentence. Of the major offenses types studied, the influence of the guidelines appears to have been most stable in immigration, firearms, and marijuana trafficking offenses, where the average guideline minimum and average sentence closely parallel one another during all four periods. Average guideline minimums and averages sentences have also paralleled each other over time for all other drug types, but not as closely as they have in marijuana trafficking offenses.
The influence of the guidelines appears to have diminished in fraud and child pornography offenses. In fraud offenses, beginning in the PROTECT Act period, the average guideline minimum increased steadily over time, due to a combination of guideline changes increasing penalties and increased seriousness of offenses, but average sentences increased at a slower rate. As a result, throughout most of the Booker and Gall periods, the divergence between average guideline minimums and average sentences increased. In child pornography non-production offenses (including receipt, trafficking, and possession), the divergence between the average guideline minimum and the average sentence has widened over time. While the average sentence was almost identical to the average guideline minimum until fiscal year 2005, in every year thereafter, the average guideline minimum has continued to increase and the average sentence
13
PART C: ALL OFFENSES has either not increased at the same rate or has remained the same.
Drug trafficking offenses are a microcosm for federal offenses generally inasmuch as the relationship between the average guideline minimum and average sentence is best analyzed by individual drug type rather than drug trafficking offenses in the aggregate. With a few exceptions, changes in the average sentence have tracked changes in the average guideline minimum for all drug types. The average guideline minimum and the average sentence in crack cocaine trafficking offenses diverged in fiscal years 2009 and 2010, but began to converge again concurrent with recent penalty reductions. For methamphetamine trafficking offenders, the average guideline minimum and average sentence have diverged slightly since fiscal year 2007. For methamphetamine trafficking offenders, the influence of the guidelines on the sentence appears to have diminished slightly since fiscal year 2007. For all other drug types, when the average guideline minimum has increased, generally the average sentence has similarly increased, and when the average guideline minimum has decreased, so too has the average sentence. Caseload Composition and Plea Rate
In fiscal year 2011, the Commission received sufficient information to conduct the analyses in this report for 76,216 individual felony or Class A misdemeanor offenders.31 The average sentence length was 46 months and the median sentence was 24 months.32 In fiscal year 2011, 96.7 percent of offenders pleaded guilty.
31 These offenders were sentenced between October 1, 2010 and September 30, 2011 for which the Commission received complete guideline information. The few cases in which the defendant was a corporation or other organization, rather than an individual, are not included. 32 Sentences of probation only are included as zero (0) months of imprisonment. Life sentences and other sentences exceeding 470 months are capped at 470 months. This analysis includes time of confinement as described in USSG §5C1.1 (Imposition of a Term of Imprisonment).
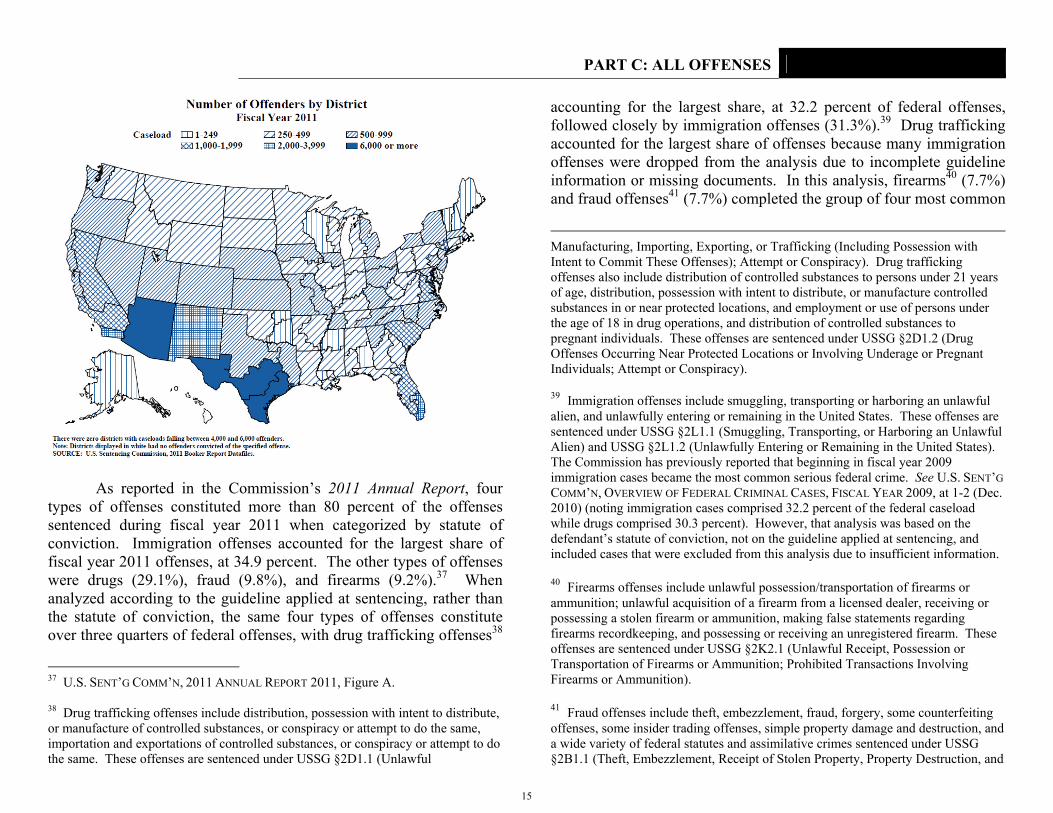
Commission data reveals geographic differences in the number of offenders in each district and, by extension, each circuit. When viewed at the district level,33 judges in the six districts with the largest number of cases collectively sentenced more than 40 percent (40.1%, n=30,579) of all offenders sentenced in fiscal year 2011.34 Judges in Southern Texas sentenced 8,158 offenders, which represented 10.7 percent of all offenders sentenced nationwide in fiscal year 2011, followed by judges in Arizona (9.9% of offenders nationwide, n=7,558), Western Texas (8.6% of offenders nationwide, n=6,533), Southern California (4.2% of offenders nationwide, n=3,199), New Mexico (4.1% of offenders nationwide, n= 3,104), and Southern Florida (2.7% of offenders nationwide, n=2,027). In contrast, judges in more than half (n=50) of the judicial districts reported sentencing fewer than 500 offenders in fiscal year 2011.35 Judges in these 50 districts sentenced less than 20 percent of all offenders sentenced in fiscal year 2011 (19.3%, n=14,716).36
33 The maps in this report depicting the number of offenders by district do not include those judicial districts located in the territories of the United States. 34 See “National Distribution of Offenses by Circuit and District, FY 2011” Appendix Table. 35 Id. 36 Id.
14
PART C: ALL OFFENSES
As reported in the Commission’s 2011 Annual Report, four types of offenses constituted more than 80 percent of the offenses sentenced during fiscal year 2011 when categorized by statute of conviction. Immigration offenses accounted for the largest share of fiscal year 2011 offenses, at 34.9 percent. The other types of offenses were drugs (29.1%), fraud (9.8%), and firearms (9.2%).37 When analyzed according to the guideline applied at sentencing, rather than the statute of conviction, the same four types of offenses constitute over three quarters of federal offenses, with drug trafficking offenses38
37 U.S. SENT’G COMM’N, 2011 ANNUAL REPORT 2011, Figure A. 38 Drug trafficking offenses include distribution, possession with intent to distribute, or manufacture of controlled substances, or conspiracy or attempt to do the same, importation and exportations of controlled substances, or conspiracy or attempt to do the same. These offenses are sentenced under USSG §2D1.1 (Unlawful
accounting for the largest share, at 32.2 percent of federal offenses, followed closely by immigration offenses (31.3%).39 Drug trafficking accounted for the largest share of offenses because many immigration offenses were dropped from the analysis due to incomplete guideline information or missing documents. In this analysis, firearms40 (7.7%) and fraud offenses41 (7.7%) completed the group of four most common
Manufacturing, Importing, Exporting, or Trafficking (Including Possession with Intent to Commit These Offenses); Attempt or Conspiracy). Drug trafficking offenses also include distribution of controlled substances to persons under 21 years of age, distribution, possession with intent to distribute, or manufacture controlled substances in or near protected locations, and employment or use of persons under the age of 18 in drug operations, and distribution of controlled substances to pregnant individuals. These offenses are sentenced under USSG §2D1.2 (Drug Offenses Occurring Near Protected Locations or Involving Underage or Pregnant Individuals; Attempt or Conspiracy). 39 Immigration offenses include smuggling, transporting or harboring an unlawful alien, and unlawfully entering or remaining in the United States. These offenses are sentenced under USSG §2L1.1 (Smuggling, Transporting, or Harboring an Unlawful Alien) and USSG §2L1.2 (Unlawfully Entering or Remaining in the United States). The Commission has previously reported that beginning in fiscal year 2009 immigration cases became the most common serious federal crime. See U.S. SENT’G COMM’N, OVERVIEW OF FEDERAL CRIMINAL CASES, FISCAL YEAR 2009, at 1-2 (Dec. 2010) (noting immigration cases comprised 32.2 percent of the federal caseload while drugs comprised 30.3 percent). However, that analysis was based on the defendant’s statute of conviction, not on the guideline applied at sentencing, and included cases that were excluded from this analysis due to insufficient information. 40 Firearms offenses include unlawful possession/transportation of firearms or ammunition; unlawful acquisition of a firearm from a licensed dealer, receiving or possessing a stolen firearm or ammunition, making false statements regarding firearms recordkeeping, and possessing or receiving an unregistered firearm. These offenses are sentenced under USSG §2K2.1 (Unlawful Receipt, Possession or Transportation of Firearms or Ammunition; Prohibited Transactions Involving Firearms or Ammunition). 41 Fraud offenses include theft, embezzlement, fraud, forgery, some counterfeiting offenses, some insider trading offenses, simple property damage and destruction, and a wide variety of federal statutes and assimilative crimes sentenced under USSG §2B1.1 (Theft, Embezzlement, Receipt of Stolen Property, Property Destruction, and
15
PART C: ALL OFFENSES offense types. The other offense type analyzed in this report, child pornography offenses, accounted for 2.4 percent of the federal caseload in fiscal year 2011.42 All other offenses combined constituted the remaining 18.7 percent of federal cases during fiscal year 2011. Career offenders do not fit exclusively into any of the offense types listed. The career offender provision applies in offenses involving a variety of primary sentencing guidelines, including those applicable to drug trafficking and firearms offenses, and various violent crimes.43
Offenses Involving Fraud or Deceit) with a primary offense type of fraud sentenced under a Guidelines Manual effective November 1, 2001 or later, or the former USSG §2F1.1 (Fraud and Deceit; Forgery; Offenses Involving Altered or Counterfeit Instruments Other than Counterfeit Bearer Obligations of the United States) (deleted by consolidation with §2B1.1 effective November 1, 2001 (see USSG App. C, amend. 617)). 42 Child pornography offenses include the production, sale, distribution, transportation, shipment, receipt, or possession of materials involving the sexual exploitation of minors sentenced under USSG §§2G2.1 (Sexually Exploiting a Minor by Production of Sexually Explicit Visual or Printed Material; Custodian Permitting Minor to Engage in Sexually Explicit Conduct; Advertisement for Minors to Engage in Production), 2G2.2 (Trafficking in Material Involving the Sexual Exploitation of a Minor; Receiving, Transporting, Shipping, Soliciting, or Advertising Material Involving the Sexual Exploitation of a Minor; Possessing Material Involving the Sexual Exploitation of a Minor with Intent to Traffic; Possessing Material Involving the Sexual Exploitation of a Minor), or 2G2.4 (Possession of Materials Depicting a Minor Engaged in Sexually Explicit Conduct) (deleted by consolidation with §2G2.2 effective November 1, 2004 (see USSG App. C, amend. 664)). 43 Career offender cases include offenses sentenced pursuant to USSG §§4B1.1 (Career Offender) and 4B1.2 (Definitions of Terms Used in Section 4B1.1). The career offender guideline is applied in offenses involving a variety of primary sentencing guidelines, including USSG §2D1.1 (Unlawful Manufacturing, Importing, Exporting, Trafficking, or Possession; Attempt or Conspiracy), §2B3.1 (Robbery), §2K2.1 (Unlawful Receipt, Possession, or Transportation of Firearms or Ammunition; Prohibited Transactions Involving Firearms or Ammunition), §2A2.2 (Aggravated Assault), §2A2.4 (Obstructing or Impeding Officers), §2A1.1 (First Degree Murder), §2A2.1 (Assault with Intent to Commit Murder; Attempted Murder), §2A4.1 (Kidnapping, Abduction, Unlawful Restraint), §2B3.2 (Extortion by Force or Threat of Injury or Serious Damage), and various others.
Demographics
Non-citizen offenders accounted for 45.0 percent of federal offenders in fiscal year 2011. The overwhelming majority (87.5%) of federal offenders were male. In fiscal year 2011, 50.6 percent of all offenders were Hispanic, 26.2 percent were White, 19.7 percent were Black, and 3.5 percent were Other Race.44 The average age of federal offenders sentenced in fiscal year 2011 was 36 years and the median age was 34 years. Slightly less than half (47.8%) of federal offenders completed high school, and only 5.5 percent graduated from college. Criminal History
In fiscal year 2011, 55.9 percent of all offenders had a prior
criminal history that assigned them to Criminal History Category (CHC) II or higher under the guidelines, meaning that their guideline range was increased due to their criminal history. The remaining 44.1 percent of offenders whose criminal history placed them in CHC I may have had no criminal history at all, or any criminal history was so minor or remote in time that it did not result in more than one criminal history point under the guidelines. Of all offenders, 8.8 percent were in CHC VI, the highest possible criminal history category. Just three percent of offenders were found to be Career Offenders,45 and less than one percent were found to be Armed Career Criminals (0.8%),46 designations that significantly increase the otherwise applicable guideline range of certain offenders who have particularly serious offenses in their criminal history.
44 Other race includes American Indians and Alaskan Natives, Asians and Pacific Islanders, Multi-racial, Non-US American Indians (e.g,. Canadian Indians), and other non-specified races. 45 These are offenders subject to USSG §4B1.1 (Career Offender). 46 These are offenders subject to USSG §4B1.4 (Armed Career Criminal).
16
PART C: ALL OFFENSES
Types of Sentences Imposed
In fiscal year 2011, the vast majority of federal offenders were sentenced to serve a term of incarceration with no type of alternative to incarceration as part of the sentence (87.8%). Approximately six percent of federal offenders received a sentence of probation only (5.8%). The remaining offenders (6.4%) were sentenced to a combination of probation and some form of confinement (e.g., home detention or other confinement) or to a combination of incarceration and community confinement. Sentencing Relative to the Guideline Range
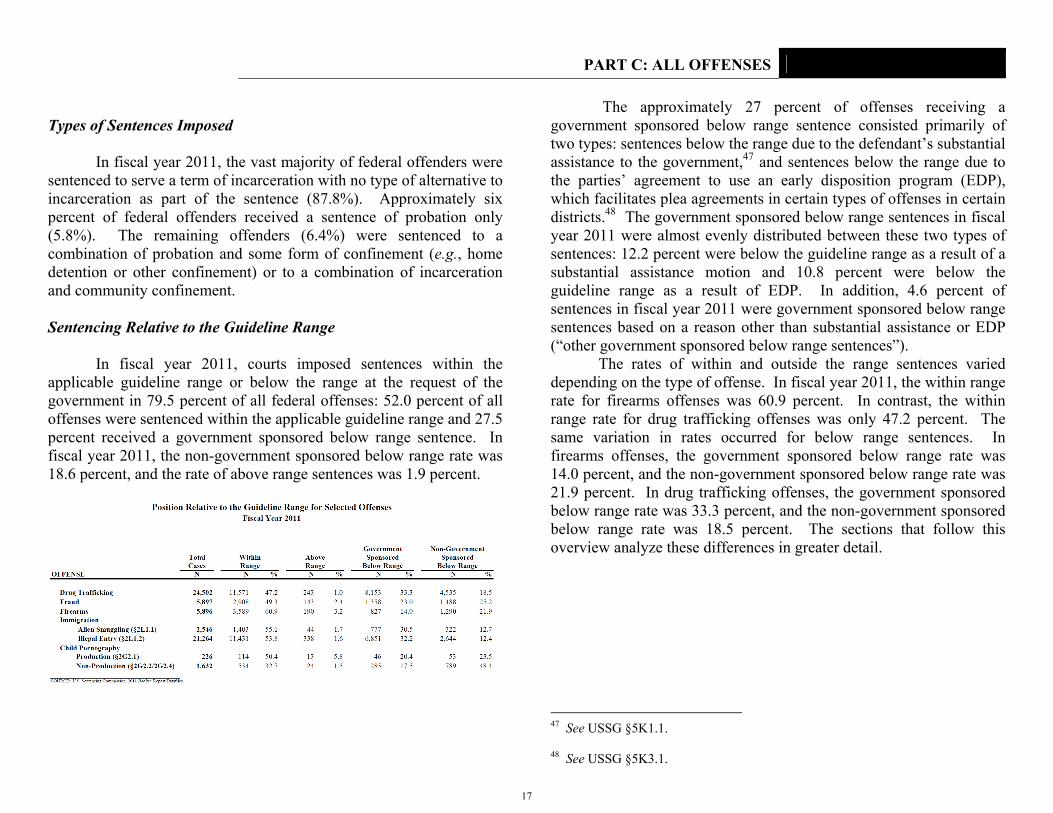
In fiscal year 2011, courts imposed sentences within the
applicable guideline range or below the range at the request of the government in 79.5 percent of all federal offenses: 52.0 percent of all offenses were sentenced within the applicable guideline range and 27.5 percent received a government sponsored below range sentence. In fiscal year 2011, the non-government sponsored below range rate was 18.6 percent, and the rate of above range sentences was 1.9 percent.
The approximately 27 percent of offenses receiving a government sponsored below range sentence consisted primarily of two types: sentences below the range due to the defendant’s substantial assistance to the government,47 and sentences below the range due to the parties’ agreement to use an early disposition program (EDP), which facilitates plea agreements in certain types of offenses in certain districts.48 The government sponsored below range sentences in fiscal year 2011 were almost evenly distributed between these two types of sentences: 12.2 percent were below the guideline range as a result of a substantial assistance motion and 10.8 percent were below the guideline range as a result of EDP. In addition, 4.6 percent of sentences in fiscal year 2011 were government sponsored below range sentences based on a reason other than substantial assistance or EDP (“other government sponsored below range sentences”).
The rates of within and outside the range sentences varied depending on the type of offense. In fiscal year 2011, the within range rate for firearms offenses was 60.9 percent. In contrast, the within range rate for drug trafficking offenses was only 47.2 percent. The same variation in rates occurred for below range sentences. In firearms offenses, the government sponsored below range rate was 14.0 percent, and the non-government sponsored below range rate was 21.9 percent. In drug trafficking offenses, the government sponsored below range rate was 33.3 percent, and the non-government sponsored below range rate was 18.5 percent. The sections that follow this overview analyze these differences in greater detail.
47 See USSG §5K1.1. 48 See USSG §5K3.1.
17
PART C: ALL OFFENSES NATIONAL TREND ANALYSIS OFFENDER AND OFFENSE CHARACTERISTICS
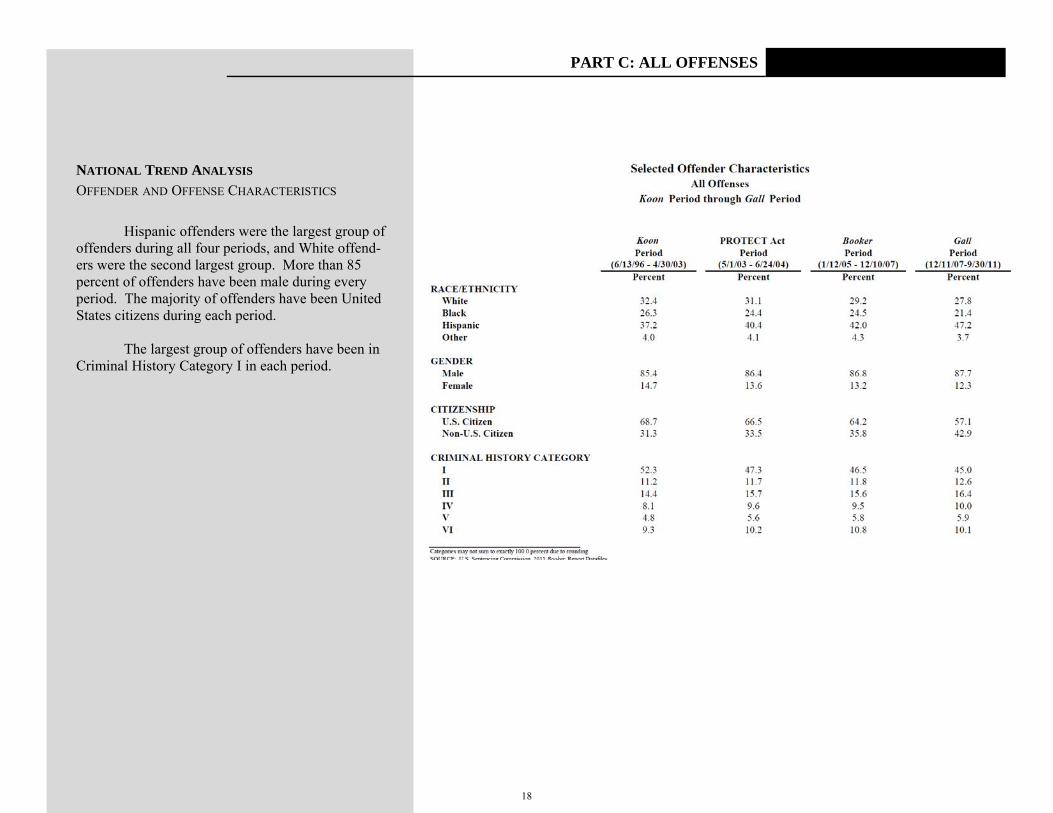
Hispanic offenders were the largest group of
offenders during all four periods, and White offend-ers were the second largest group. More than 85 percent of offenders have been male during every period. The majority of offenders have been United States citizens during each period.
The largest group of offenders have been in
Criminal History Category I in each period.
18
PART C: ALL OFFENSES NATIONAL TREND ANALYSIS OFFENDER AND OFFENSE CHARACTERISTICS
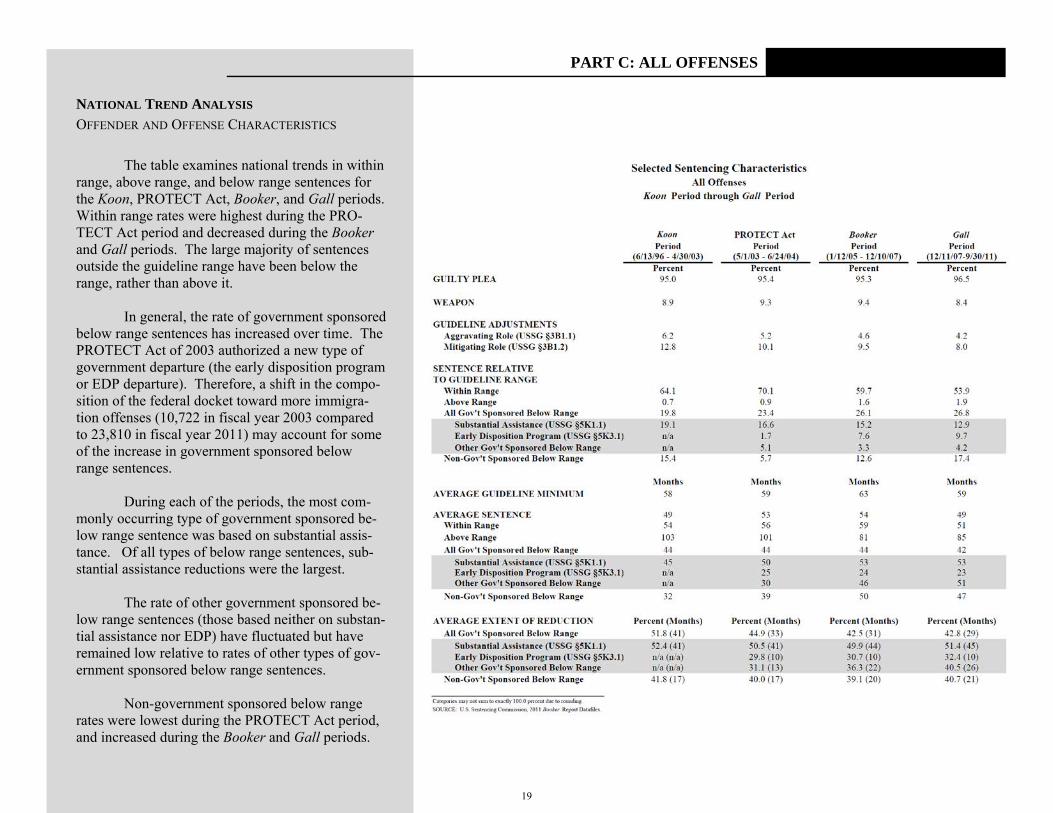
The table examines national trends in within
range, above range, and below range sentences for the Koon, PROTECT Act, Booker, and Gall periods. Within range rates were highest during the PRO-TECT Act period and decreased during the Booker and Gall periods. The large majority of sentences outside the guideline range have been below the range, rather than above it.
In general, the rate of government sponsored
below range sentences has increased over time. The PROTECT Act of 2003 authorized a new type of government departure (the early disposition program or EDP departure). Therefore, a shift in the compo-sition of the federal docket toward more immigra-tion offenses (10,722 in fiscal year 2003 compared to 23,810 in fiscal year 2011) may account for some of the increase in government sponsored below range sentences.
During each of the periods, the most com-
monly occurring type of government sponsored be-low range sentence was based on substantial assis-tance. Of all types of below range sentences, sub-stantial assistance reductions were the largest.
The rate of other government sponsored be-
low range sentences (those based neither on substan-tial assistance nor EDP) have fluctuated but have remained low relative to rates of other types of gov-ernment sponsored below range sentences.
Non-government sponsored below range
rates were lowest during the PROTECT Act period, and increased during the Booker and Gall periods.
19
PART C: ALL OFFENSES
NATIONAL TREND ANALYSIS INFLUENCE OF THE GUIDELINES
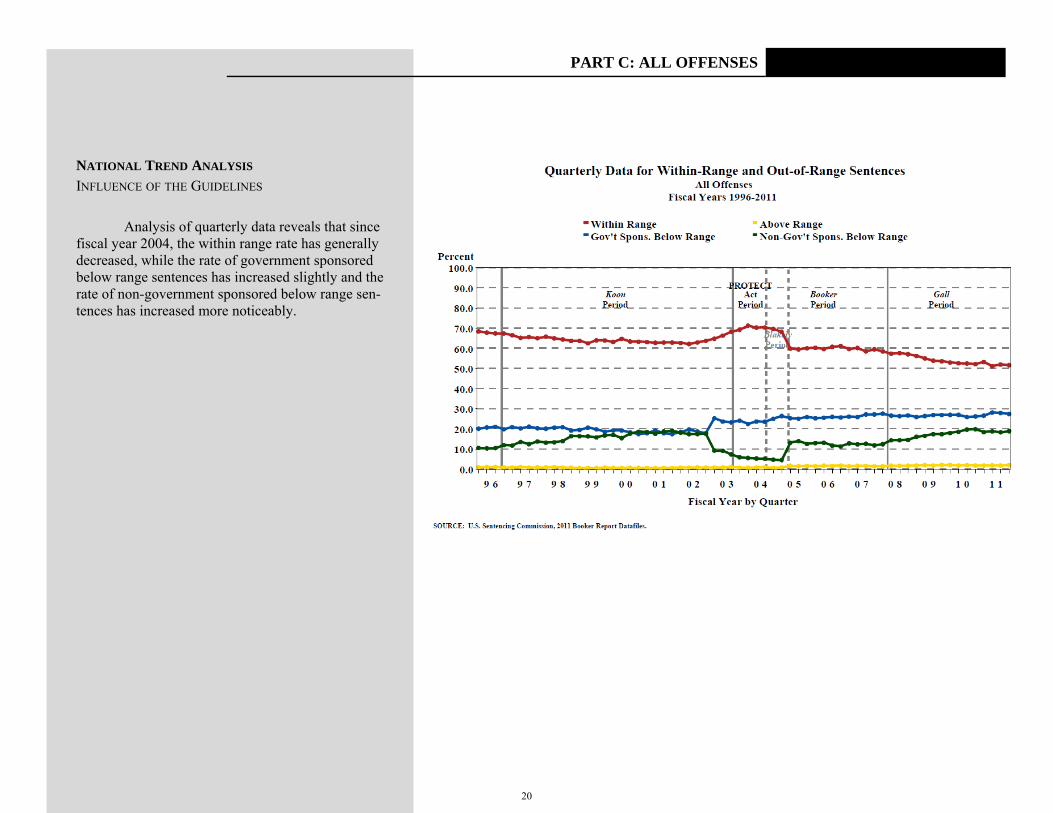
Analysis of quarterly data reveals that since
fiscal year 2004, the within range rate has generally decreased, while the rate of government sponsored below range sentences has increased slightly and the rate of non-government sponsored below range sen-tences has increased more noticeably.
20
PART C: ALL OFFENSES NATIONAL TREND ANALYSIS INFLUENCE OF THE GUIDELINES
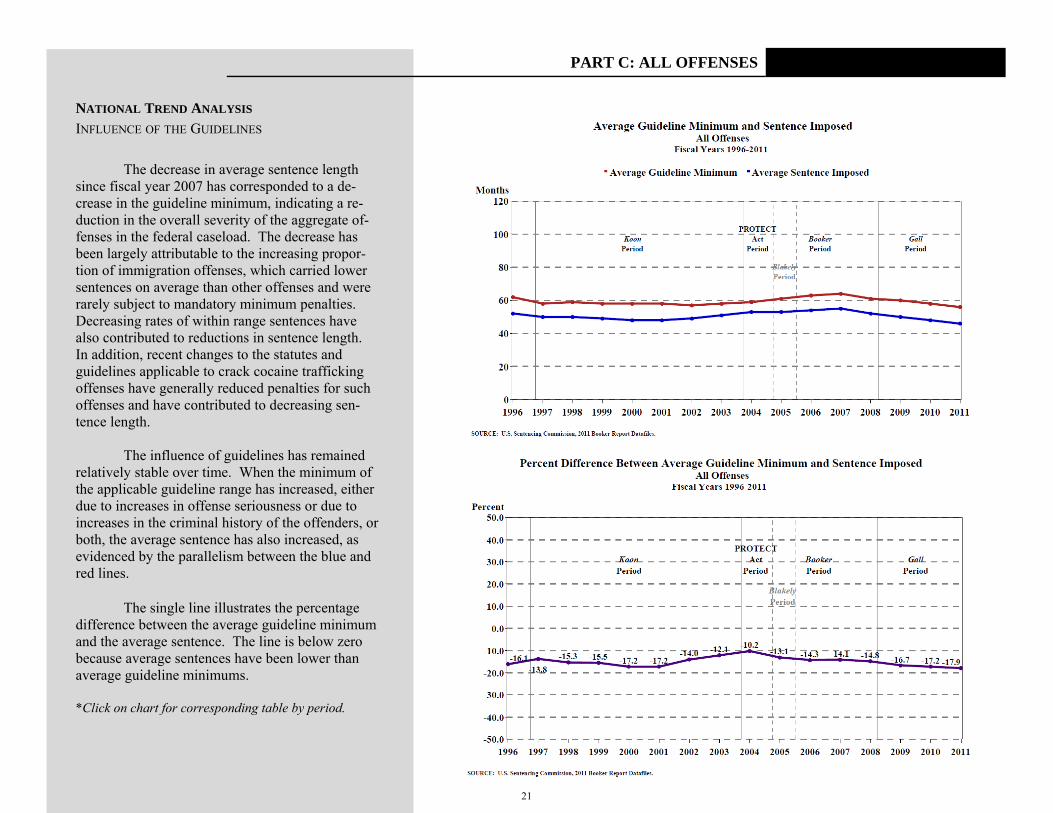
The decrease in average sentence length
since fiscal year 2007 has corresponded to a de-crease in the guideline minimum, indicating a re-duction in the overall severity of the aggregate of-fenses in the federal caseload. The decrease has been largely attributable to the increasing propor-tion of immigration offenses, which carried lower sentences on average than other offenses and were rarely subject to mandatory minimum penalties. Decreasing rates of within range sentences have also contributed to reductions in sentence length. In addition, recent changes to the statutes and guidelines applicable to crack cocaine trafficking offenses have generally reduced penalties for such offenses and have contributed to decreasing sen-tence length.
The influence of guidelines has remained relatively stable over time. When the minimum of the applicable guideline range has increased, either due to increases in offense seriousness or due to increases in the criminal history of the offenders, or both, the average sentence has also increased, as evidenced by the parallelism between the blue and red lines. The single line illustrates the percentage difference between the average guideline minimum and the average sentence. The line is below zero because average sentences have been lower than average guideline minimums. *Click on chart for corresponding table by period.
21
PART C: ALL OFFENSES
CIRCUIT TREND ANALYSIS INFLUENCE OF THE GUIDELINES
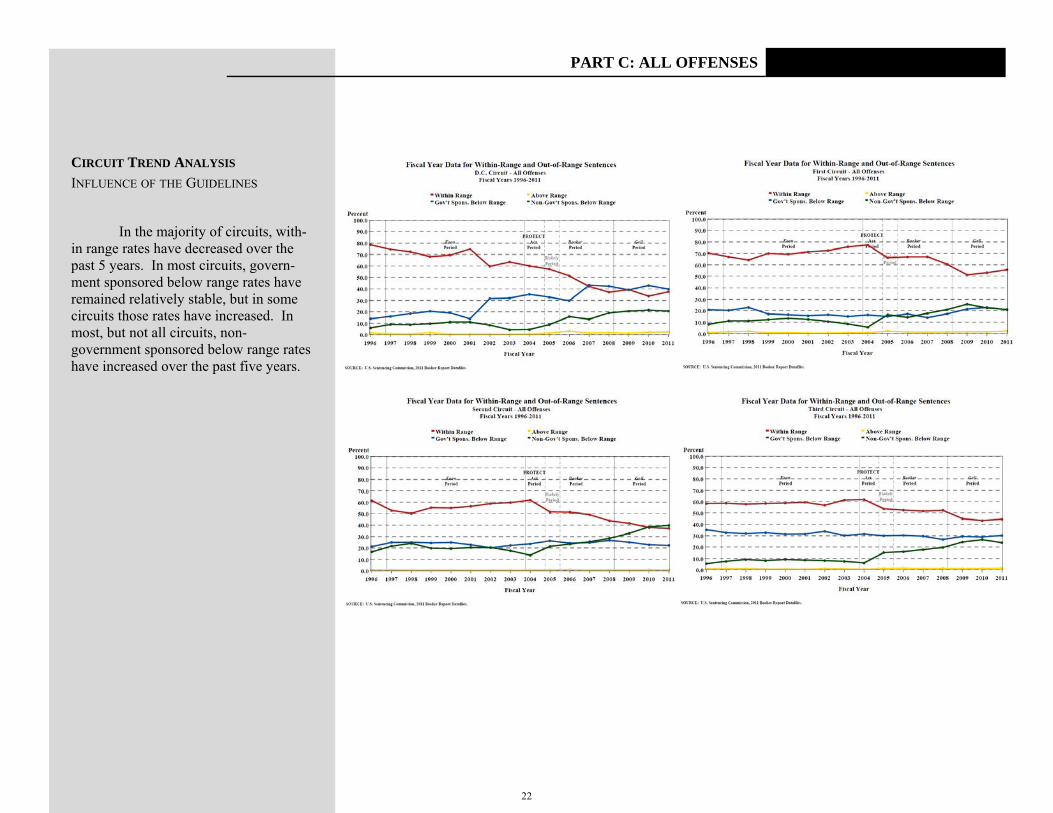
In the majority of circuits, with-in range rates have decreased over the past 5 years. In most circuits, govern-ment sponsored below range rates have remained relatively stable, but in some circuits those rates have increased. In most, but not all circuits, non-government sponsored below range rates have increased over the past five years.
22
PART C: ALL OFFENSES
CIRCUIT TREND ANALYSIS INFLUENCE OF THE GUIDELINES
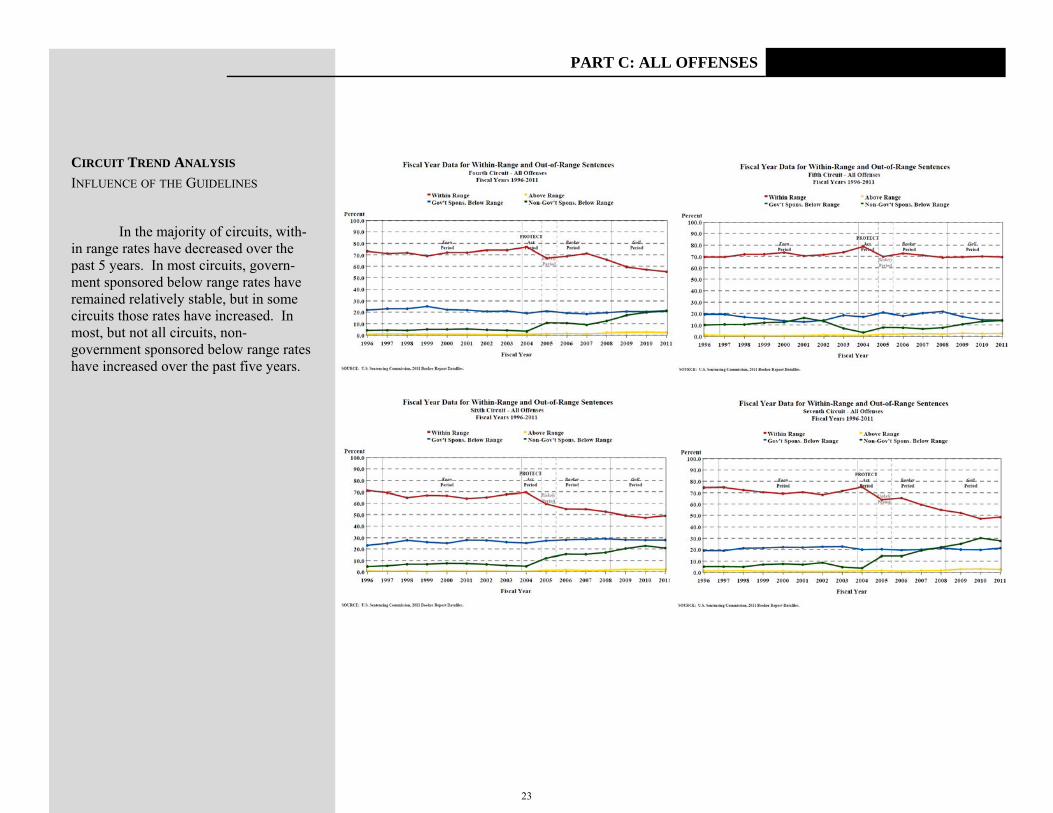
In the majority of circuits, with-in range rates have decreased over the past 5 years. In most circuits, govern-ment sponsored below range rates have remained relatively stable, but in some circuits those rates have increased. In most, but not all circuits, non-government sponsored below range rates have increased over the past five years.
23
PART C: ALL OFFENSES
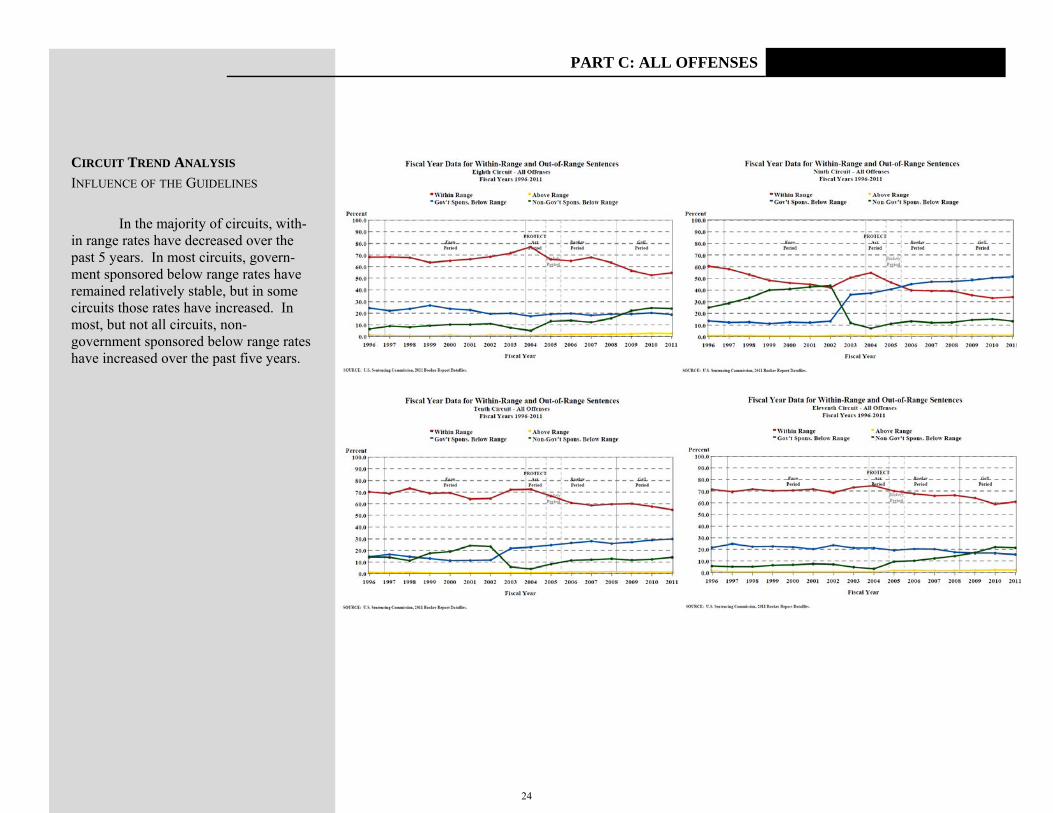
CIRCUIT TREND ANALYSIS INFLUENCE OF THE GUIDELINES In the majority of circuits, with-in range rates have decreased over the past 5 years. In most circuits, govern-ment sponsored below range rates have remained relatively stable, but in some circuits those rates have increased. In most, but not all circuits, non-government sponsored below range rates have increased over the past five years.
24
PART C: ALL OFFENSES
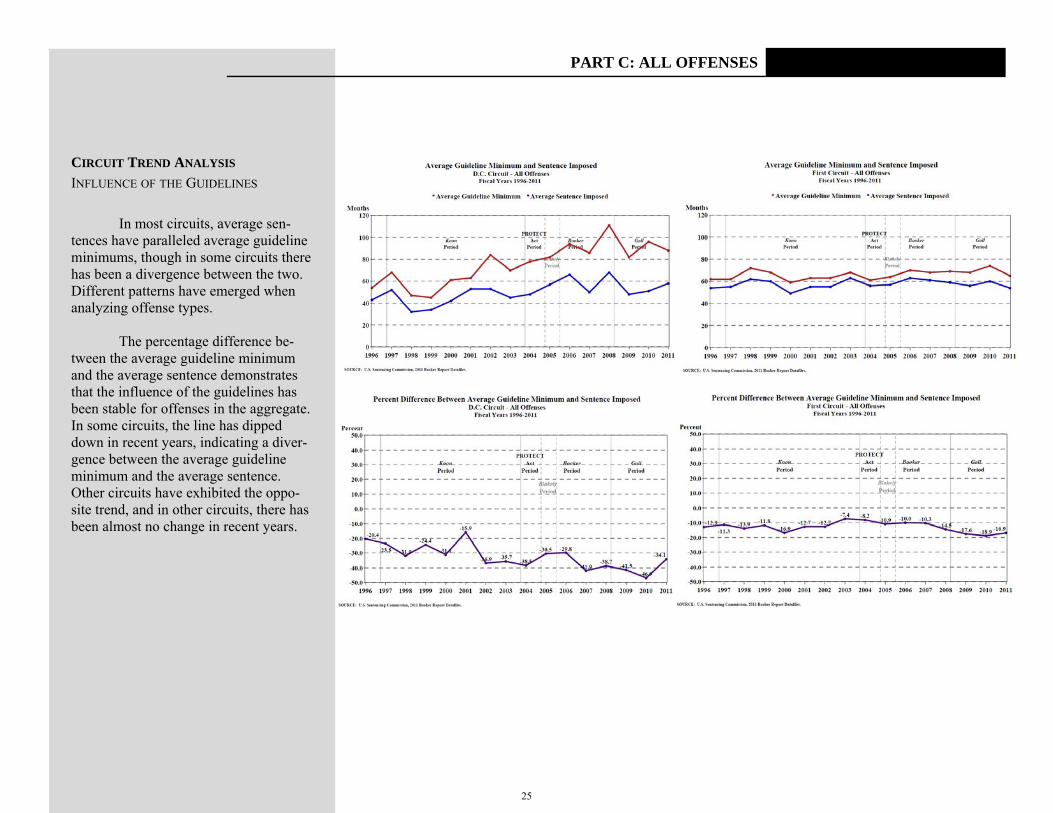
CIRCUIT TREND ANALYSIS INFLUENCE OF THE GUIDELINES In most circuits, average sen-tences have paralleled average guideline minimums, though in some circuits there has been a divergence between the two. Different patterns have emerged when analyzing offense types. The percentage difference be-tween the average guideline minimum and the average sentence demonstrates that the influence of the guidelines has been stable for offenses in the aggregate. In some circuits, the line has dipped down in recent years, indicating a diver-gence between the average guideline minimum and the average sentence. Other circuits have exhibited the oppo-site trend, and in other circuits, there has been almost no change in recent years.
25

PART C: ALL OFFENSES
CIRCUIT TREND ANALYSIS INFLUENCE OF THE GUIDELINES In most circuits, average sen-tences have paralleled average guideline minimums, though in some circuits there has been a divergence between the two. Different patterns have emerged when analyzing offense types. The percentage difference be-tween the average guideline minimum and the average sentence demonstrates that the influence of the guidelines has been stable for offenses in the aggregate. In some circuits, the line has dipped down in recent years, indicating a diver-gence between the average guideline minimum and the average sentence. Other circuits have exhibited the oppo-site trend, and in other circuits, there has been almost no change in recent years.
26
PART C: ALL OFFENSES
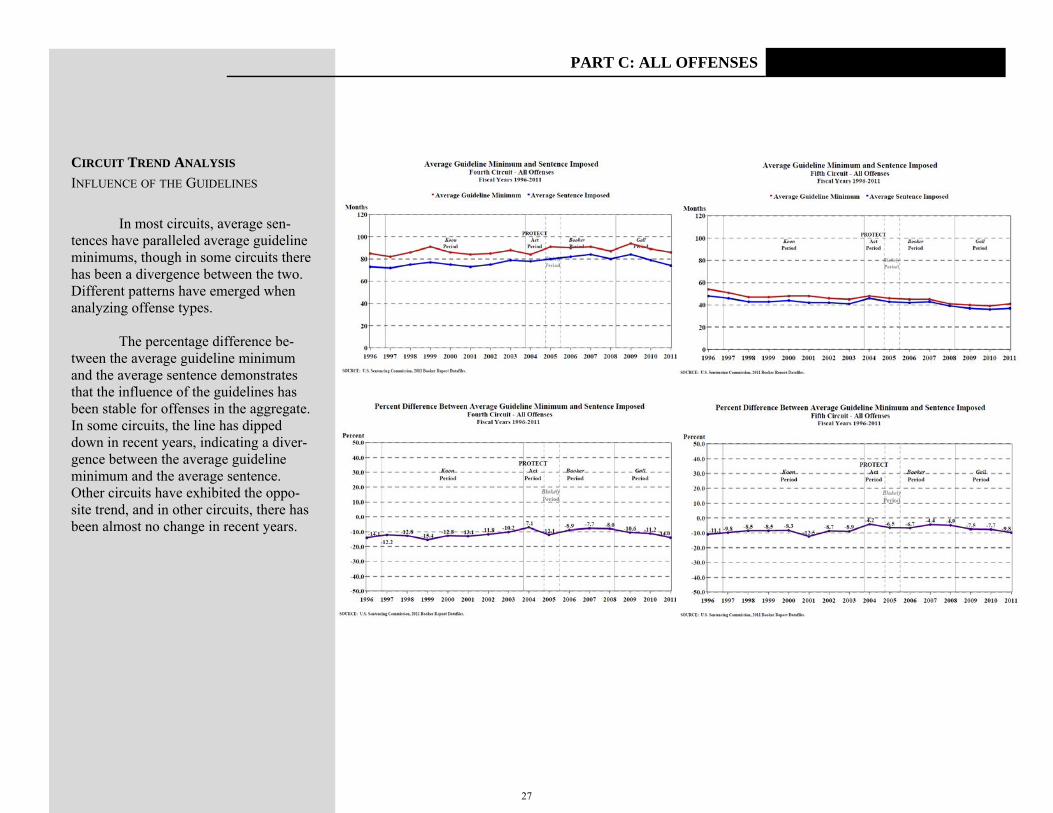
CIRCUIT TREND ANALYSIS INFLUENCE OF THE GUIDELINES In most circuits, average sen-tences have paralleled average guideline minimums, though in some circuits there has been a divergence between the two. Different patterns have emerged when analyzing offense types. The percentage difference be-tween the average guideline minimum and the average sentence demonstrates that the influence of the guidelines has been stable for offenses in the aggregate. In some circuits, the line has dipped down in recent years, indicating a diver-gence between the average guideline minimum and the average sentence. Other circuits have exhibited the oppo-site trend, and in other circuits, there has been almost no change in recent years.
27
PART C: ALL OFFENSES
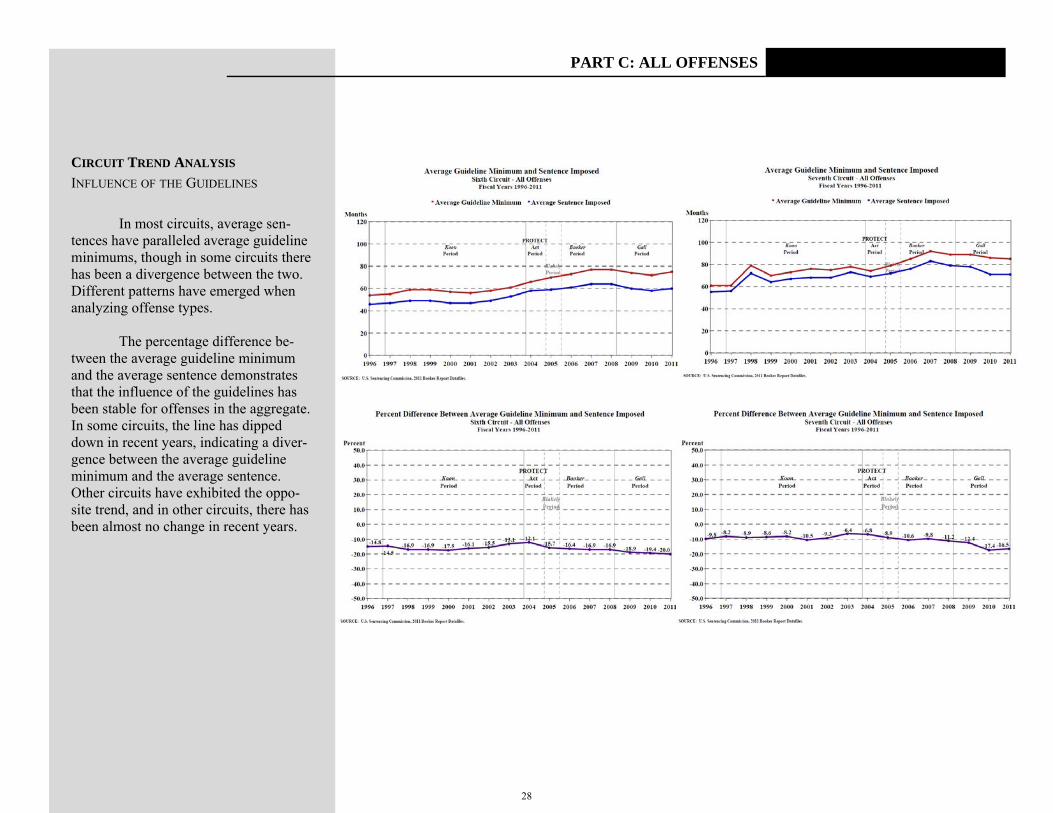
CIRCUIT TREND ANALYSIS INFLUENCE OF THE GUIDELINES In most circuits, average sen-tences have paralleled average guideline minimums, though in some circuits there has been a divergence between the two. Different patterns have emerged when analyzing offense types. The percentage difference be-tween the average guideline minimum and the average sentence demonstrates that the influence of the guidelines has been stable for offenses in the aggregate. In some circuits, the line has dipped down in recent years, indicating a diver-gence between the average guideline minimum and the average sentence. Other circuits have exhibited the oppo-site trend, and in other circuits, there has been almost no change in recent years.
28
PART C: ALL OFFENSES
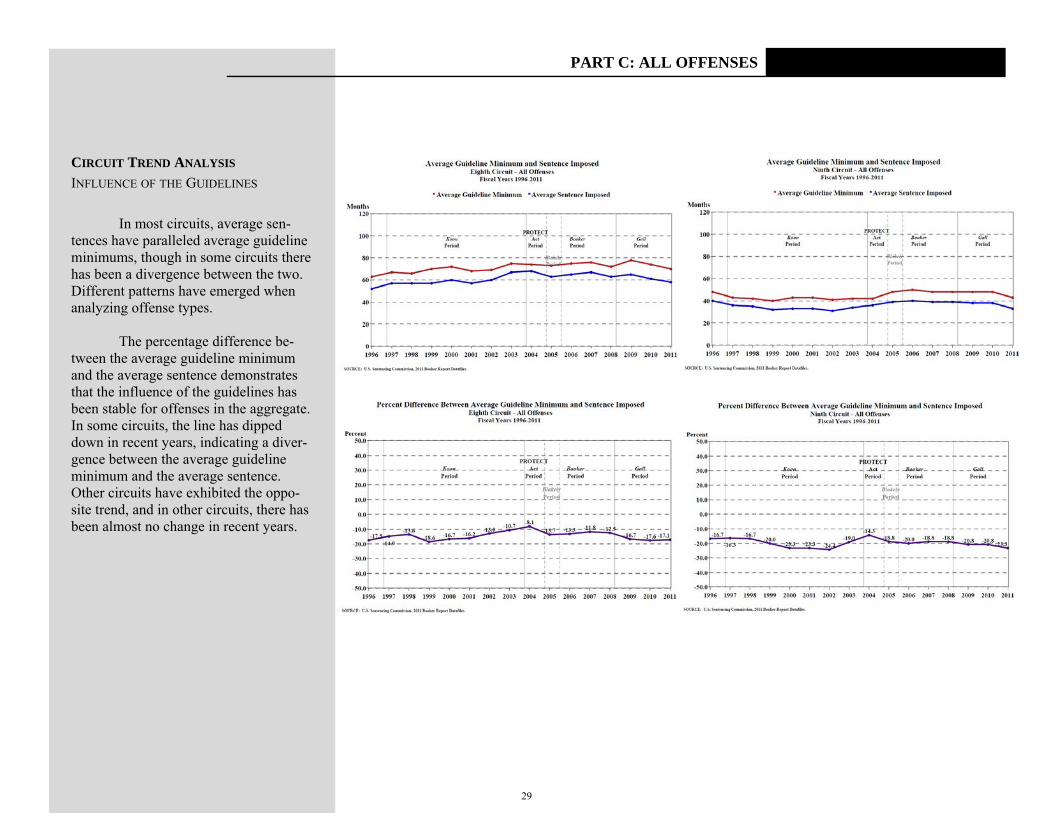
CIRCUIT TREND ANALYSIS INFLUENCE OF THE GUIDELINES In most circuits, average sen-tences have paralleled average guideline minimums, though in some circuits there has been a divergence between the two. Different patterns have emerged when analyzing offense types. The percentage difference be-tween the average guideline minimum and the average sentence demonstrates that the influence of the guidelines has been stable for offenses in the aggregate. In some circuits, the line has dipped down in recent years, indicating a diver-gence between the average guideline minimum and the average sentence. Other circuits have exhibited the oppo-site trend, and in other circuits, there has been almost no change in recent years.
29
PART C: ALL OFFENSES
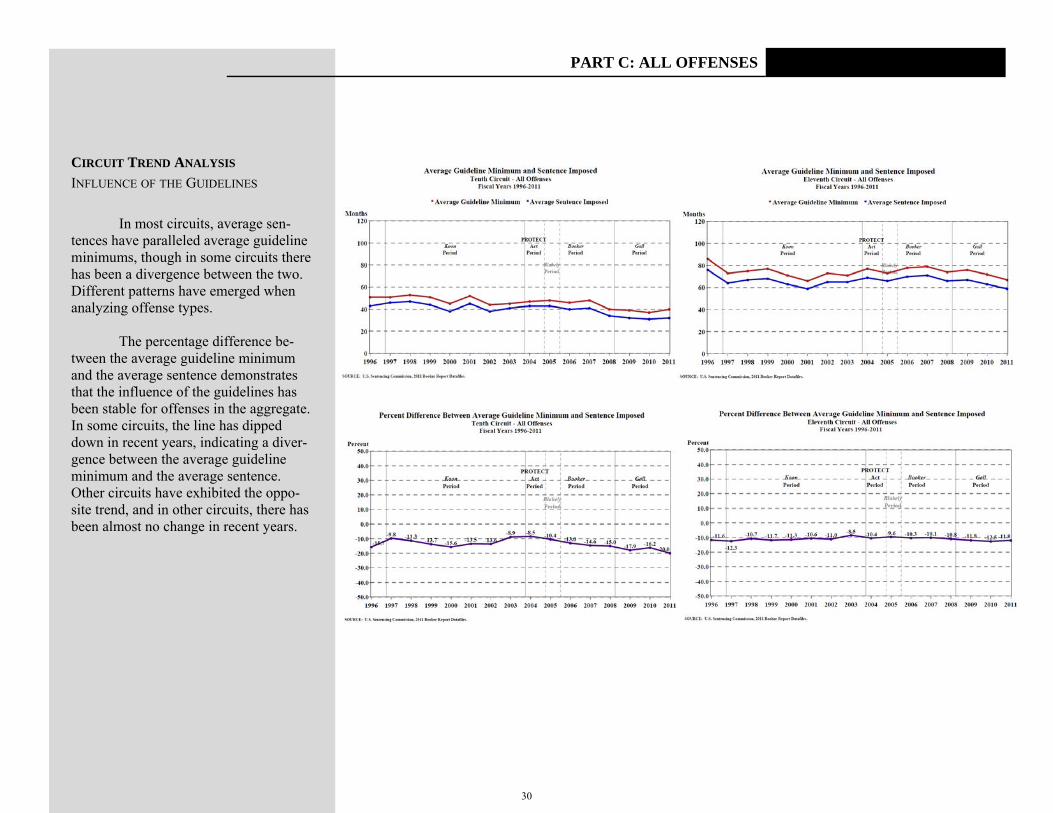
CIRCUIT TREND ANALYSIS INFLUENCE OF THE GUIDELINES In most circuits, average sen-tences have paralleled average guideline minimums, though in some circuits there has been a divergence between the two. Different patterns have emerged when analyzing offense types. The percentage difference be-tween the average guideline minimum and the average sentence demonstrates that the influence of the guidelines has been stable for offenses in the aggregate. In some circuits, the line has dipped down in recent years, indicating a diver-gence between the average guideline minimum and the average sentence. Other circuits have exhibited the oppo-site trend, and in other circuits, there has been almost no change in recent years.
30
PART C: ALL OFFENSES
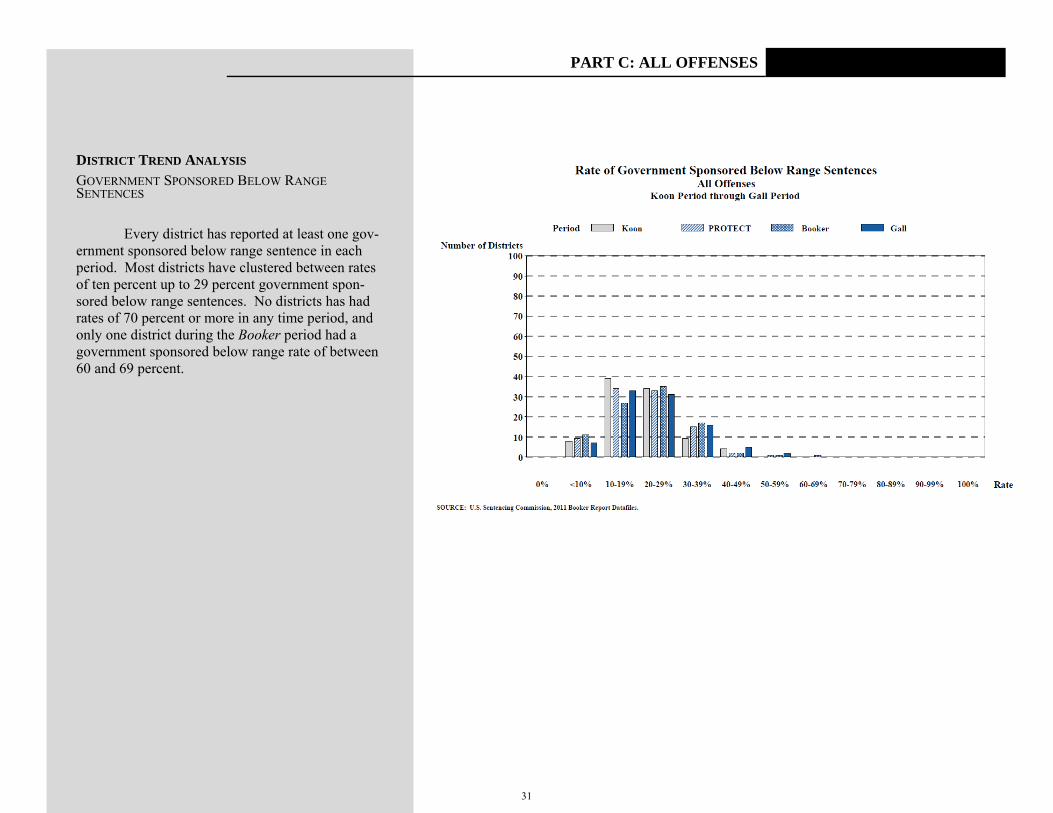
DISTRICT TREND ANALYSIS GOVERNMENT SPONSORED BELOW RANGE SENTENCES
Every district has reported at least one gov-
ernment sponsored below range sentence in each period. Most districts have clustered between rates of ten percent up to 29 percent government spon-sored below range sentences. No districts has had rates of 70 percent or more in any time period, and only one district during the Booker period had a government sponsored below range rate of between 60 and 69 percent.
31
PART C: ALL OFFENSES
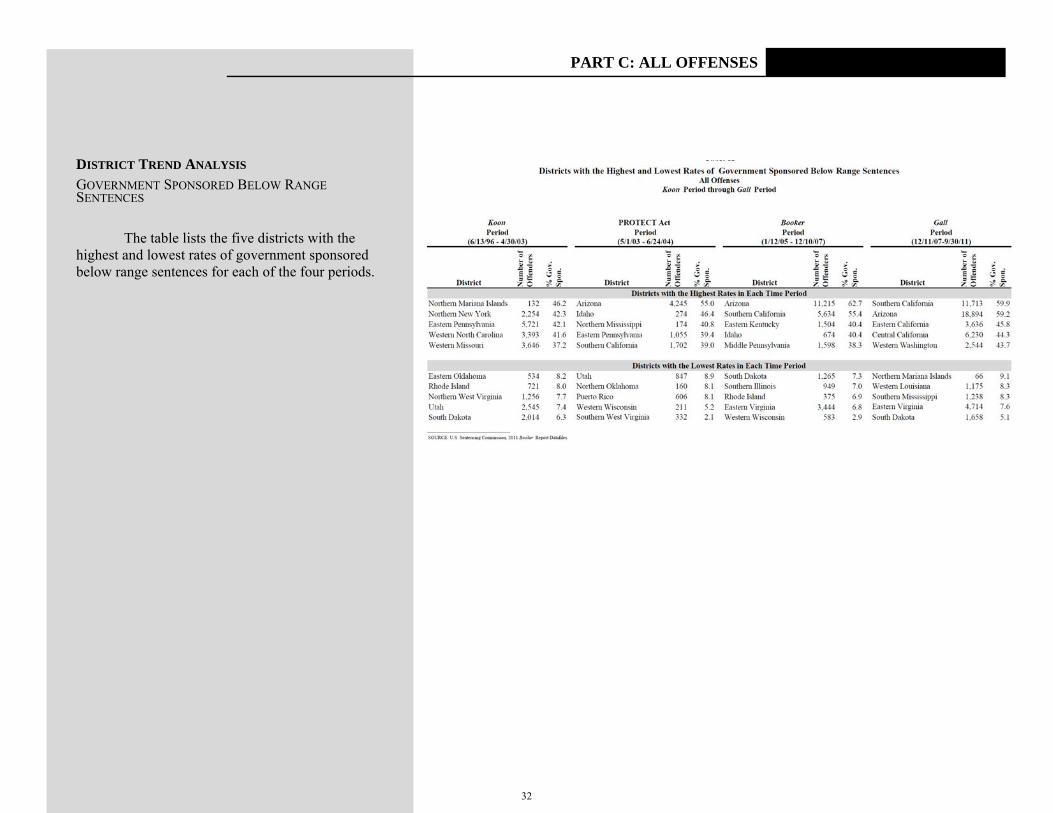
DISTRICT TREND ANALYSIS GOVERNMENT SPONSORED BELOW RANGE SENTENCES
The table lists the five districts with the
highest and lowest rates of government sponsored below range sentences for each of the four periods.
32
PART C: ALL OFFENSES
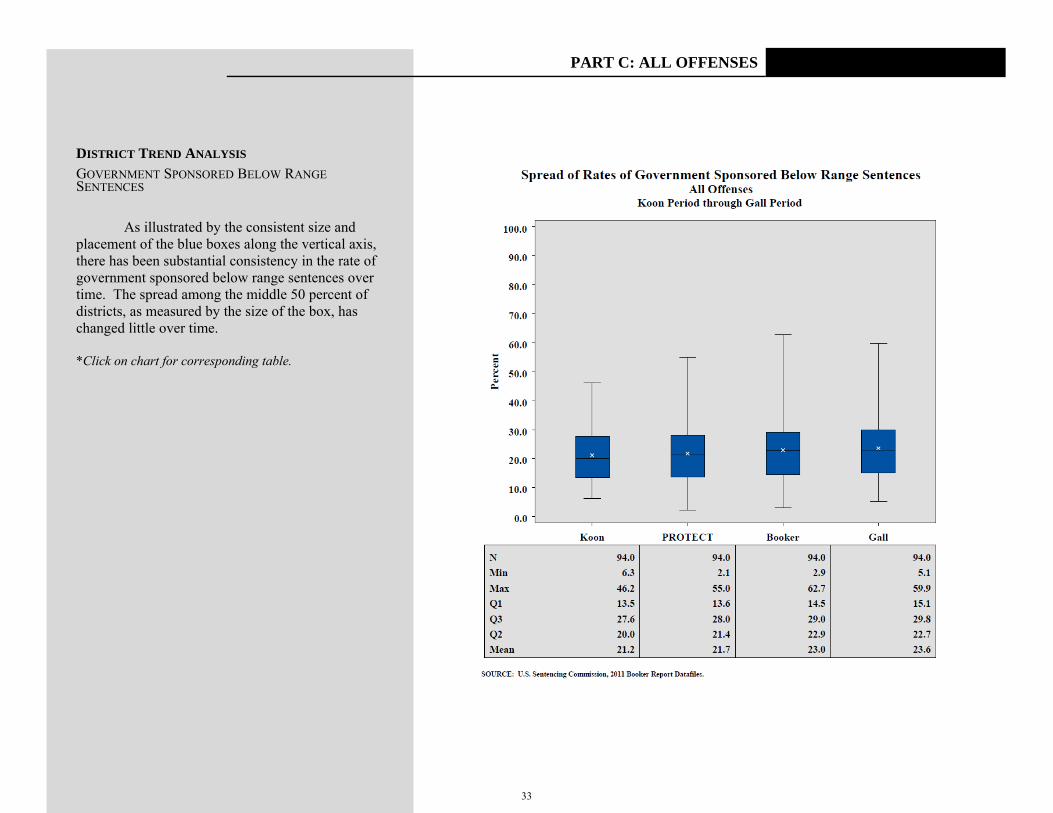
DISTRICT TREND ANALYSIS GOVERNMENT SPONSORED BELOW RANGE SENTENCES
As illustrated by the consistent size and
placement of the blue boxes along the vertical axis, there has been substantial consistency in the rate of government sponsored below range sentences over time. The spread among the middle 50 percent of districts, as measured by the size of the box, has changed little over time.
*Click on chart for corresponding table.
33
PART C: ALL OFFENSES
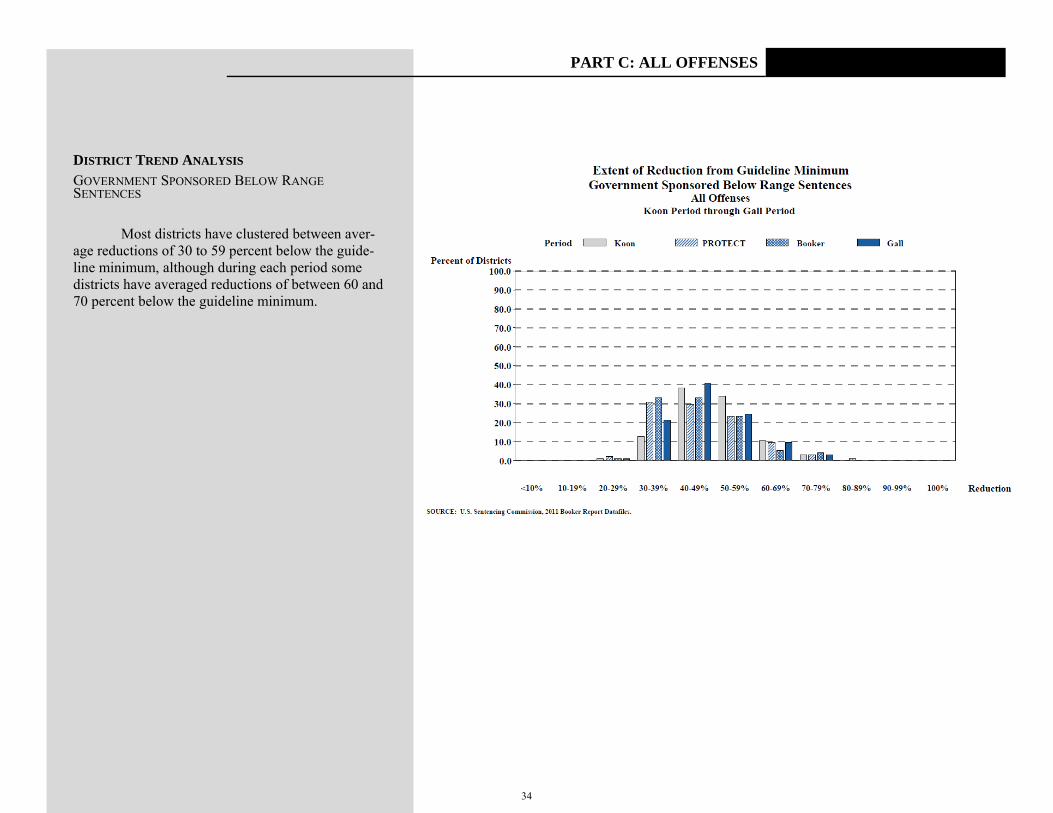
DISTRICT TREND ANALYSIS GOVERNMENT SPONSORED BELOW RANGE SENTENCES
Most districts have clustered between aver-
age reductions of 30 to 59 percent below the guide-line minimum, although during each period some districts have averaged reductions of between 60 and 70 percent below the guideline minimum.
34
PART C: ALL OFFENSES
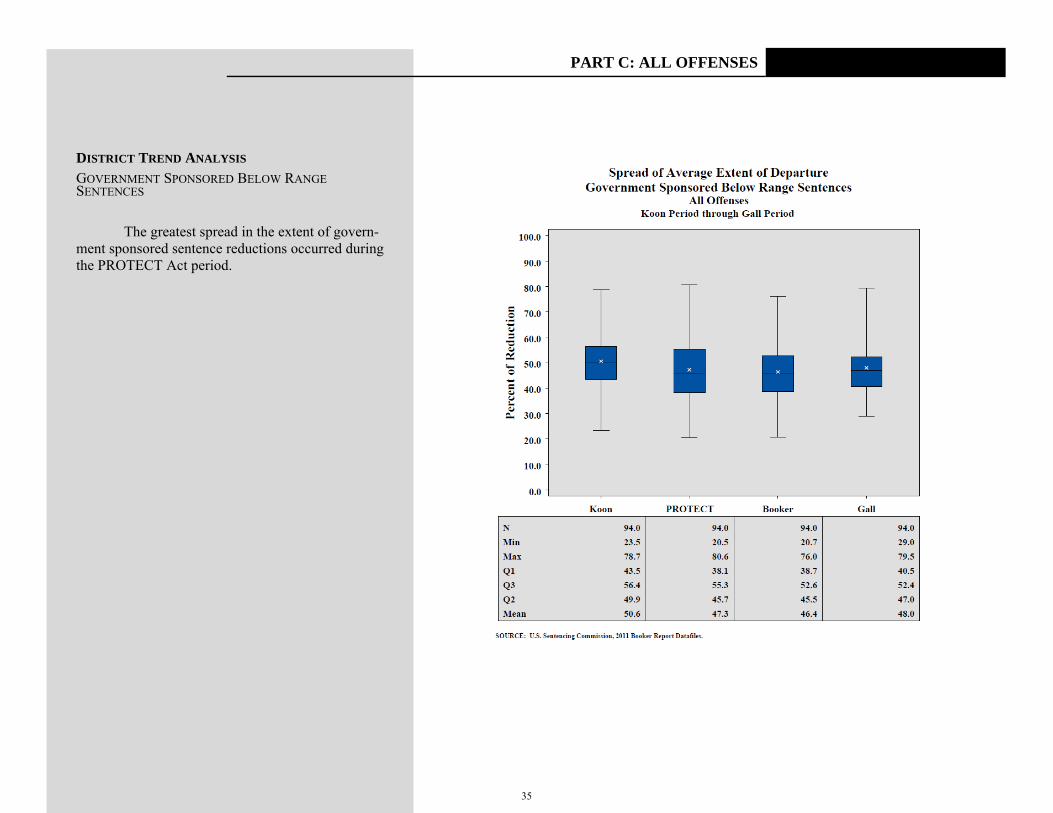
DISTRICT TREND ANALYSIS GOVERNMENT SPONSORED BELOW RANGE SENTENCES
The greatest spread in the extent of govern-ment sponsored sentence reductions occurred during the PROTECT Act period.
35
PART C: ALL OFFENSES
DISTRICT TREND ANALYSIS SUBSTANTIAL ASSISTANCE SENTENCES
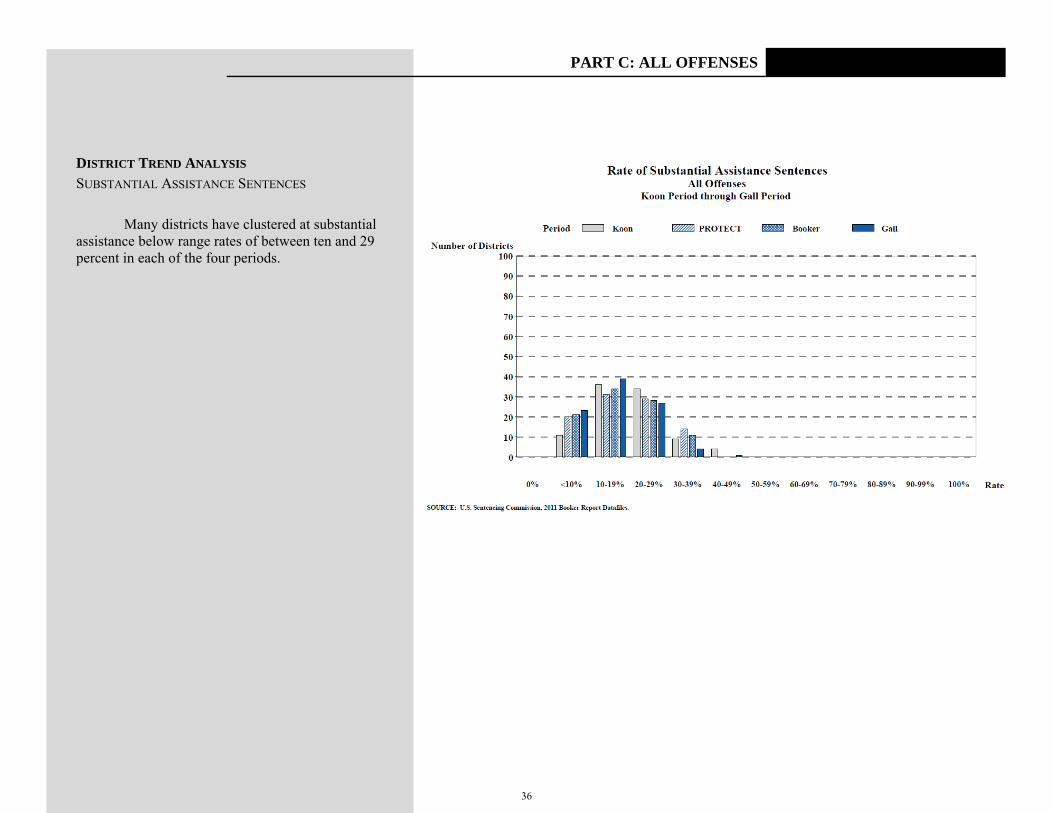
Many districts have clustered at substantial
assistance below range rates of between ten and 29 percent in each of the four periods.
36
PART C: ALL OFFENSES
DISTRICT TREND ANALYSIS SUBSTANTIAL ASSISTANCE SENTENCES
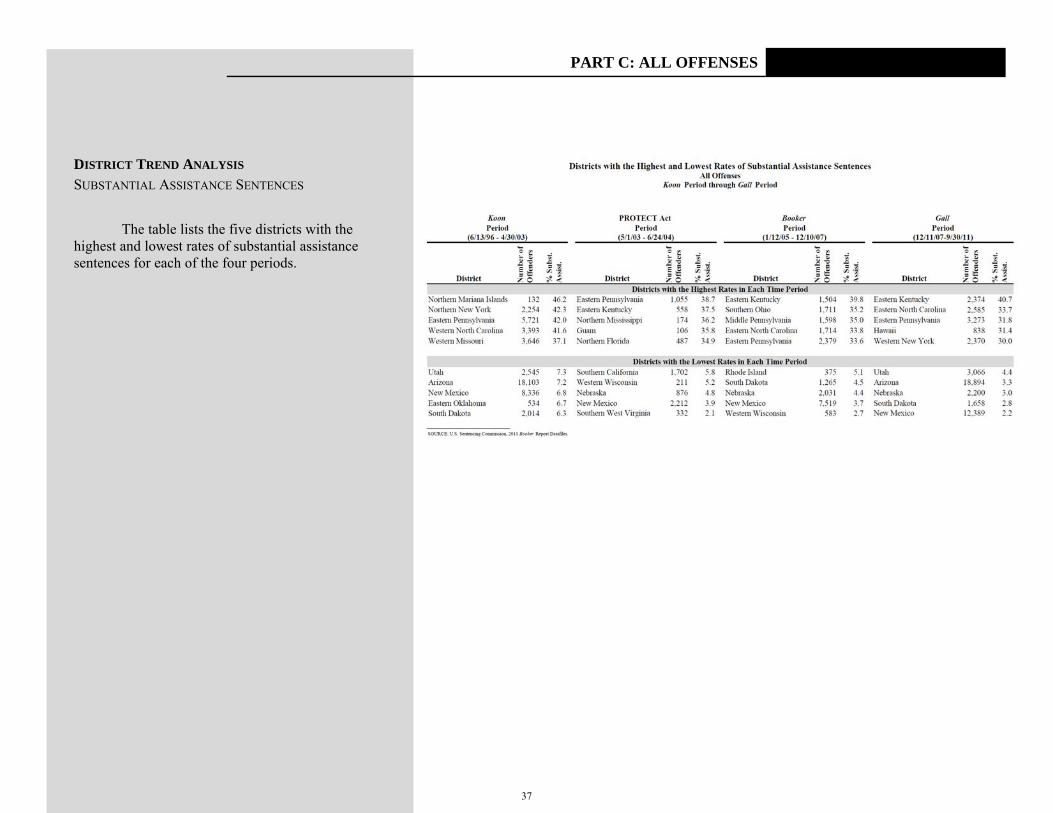
The table lists the five districts with the highest and lowest rates of substantial assistance sentences for each of the four periods.
37
PART C: ALL OFFENSES
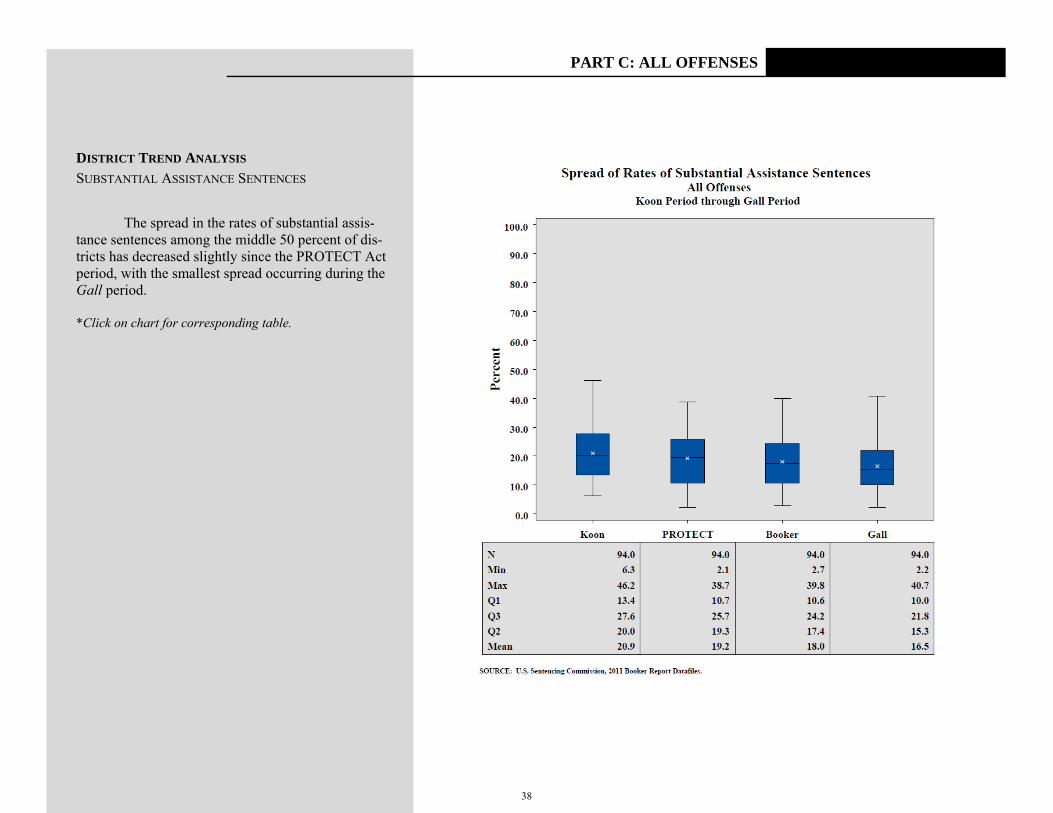
DISTRICT TREND ANALYSIS SUBSTANTIAL ASSISTANCE SENTENCES The spread in the rates of substantial assis-tance sentences among the middle 50 percent of dis-tricts has decreased slightly since the PROTECT Act period, with the smallest spread occurring during the Gall period. *Click on chart for corresponding table.
38
PART C: ALL OFFENSES
DISTRICT TREND ANALYSIS SUBSTANTIAL ASSISTANCE SENTENCES
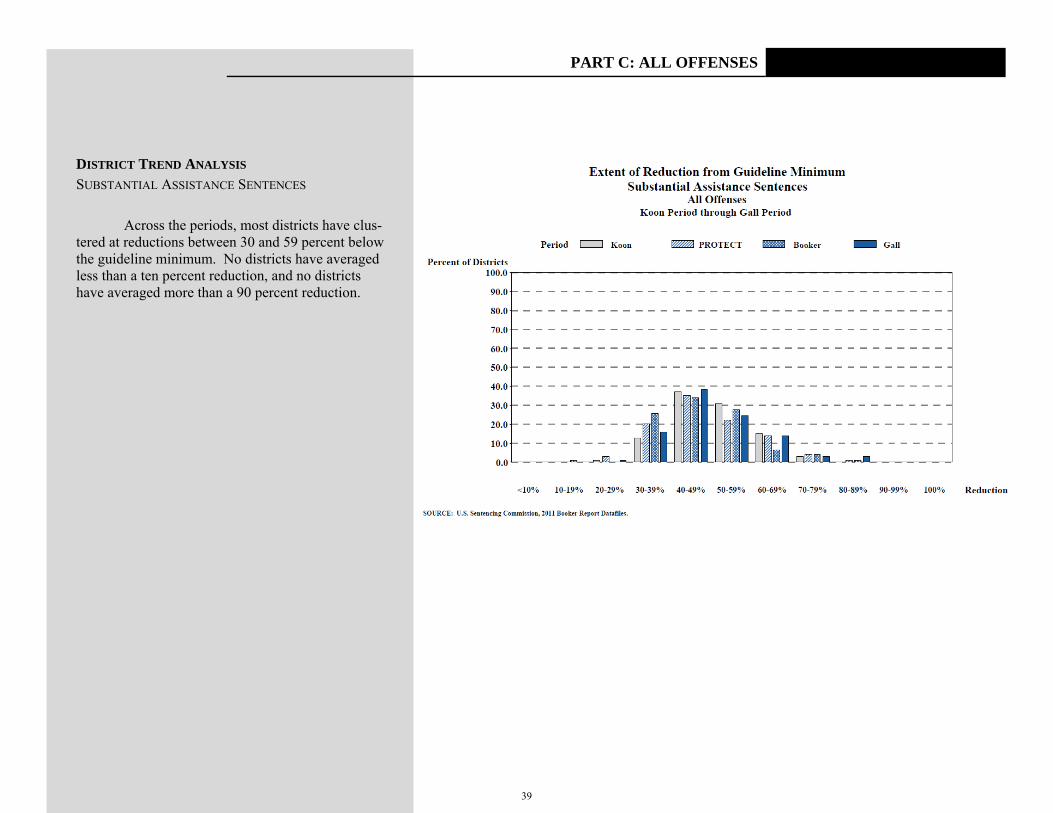
Across the periods, most districts have clus-
tered at reductions between 30 and 59 percent below the guideline minimum. No districts have averaged less than a ten percent reduction, and no districts have averaged more than a 90 percent reduction.
39
PART C: ALL OFFENSES
DISTRICT TREND ANALYSIS SUBSTANTIAL ASSISTANCE SENTENCES
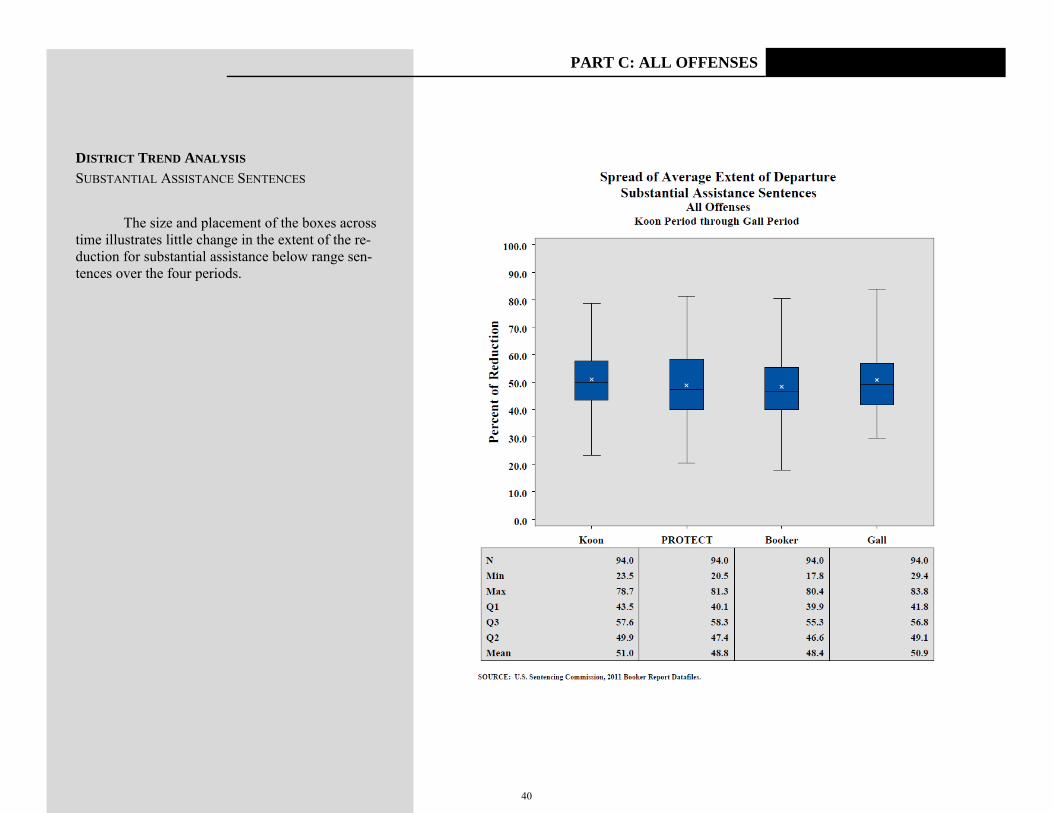
The size and placement of the boxes across time illustrates little change in the extent of the re-duction for substantial assistance below range sen-tences over the four periods.
40
PART C: ALL OFFENSES
DISTRICT TREND ANALYSIS EARLY DISPOSITION PROGRAM SENTENCES
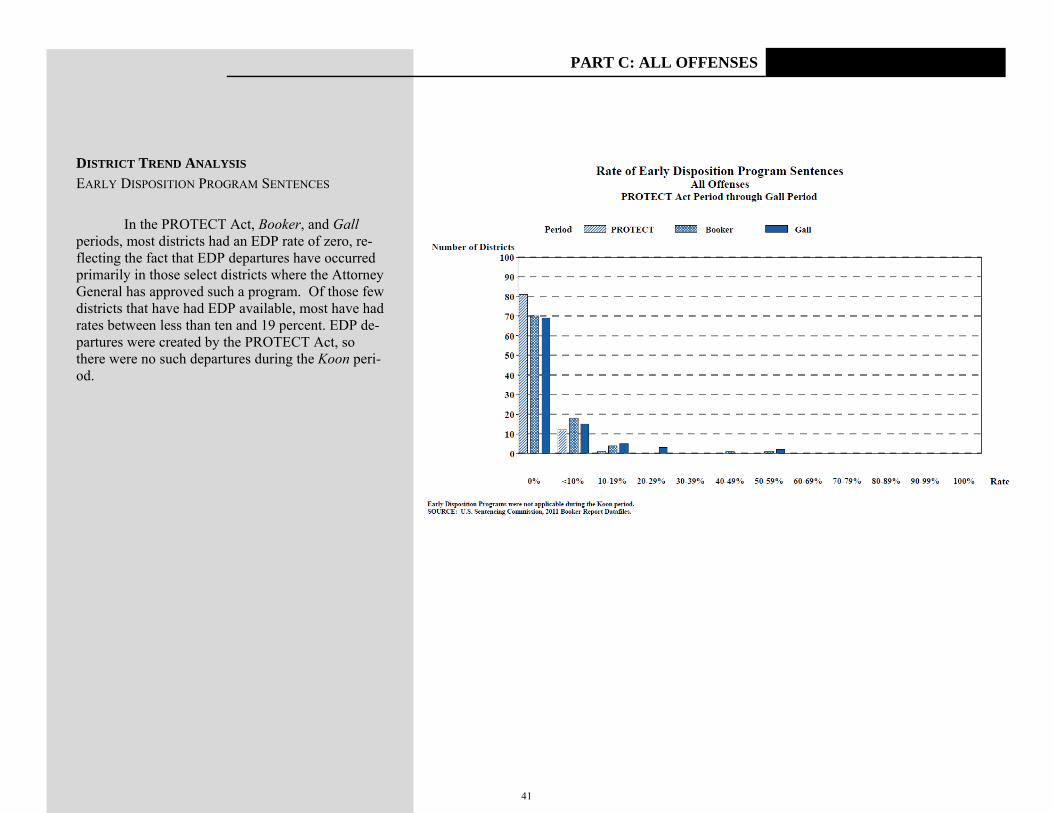
In the PROTECT Act, Booker, and Gall
periods, most districts had an EDP rate of zero, re-flecting the fact that EDP departures have occurred primarily in those select districts where the Attorney General has approved such a program. Of those few districts that have had EDP available, most have had rates between less than ten and 19 percent. EDP de-partures were created by the PROTECT Act, so there were no such departures during the Koon peri-od.
41
PART C: ALL OFFENSES
DISTRICT TREND ANALYSIS EARLY DISPOSITION PROGRAM SENTENCES
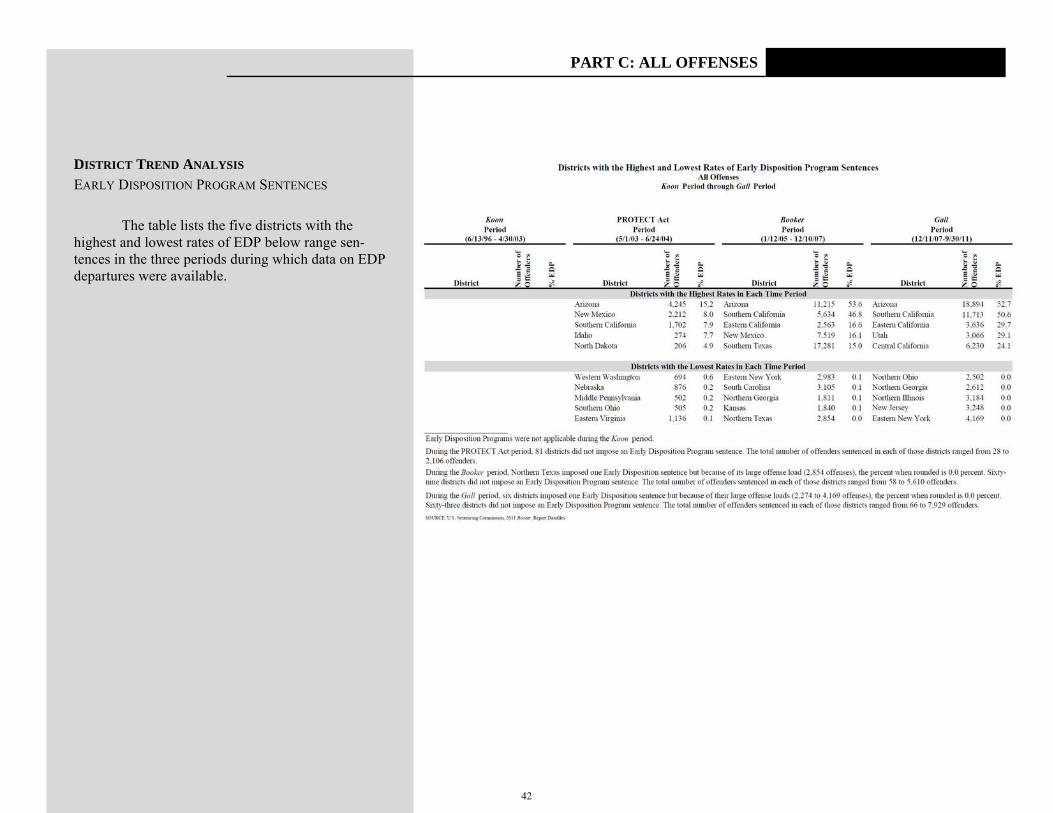
The table lists the five districts with the
highest and lowest rates of EDP below range sen-tences in the three periods during which data on EDP departures were available.
42
PART C: ALL OFFENSES
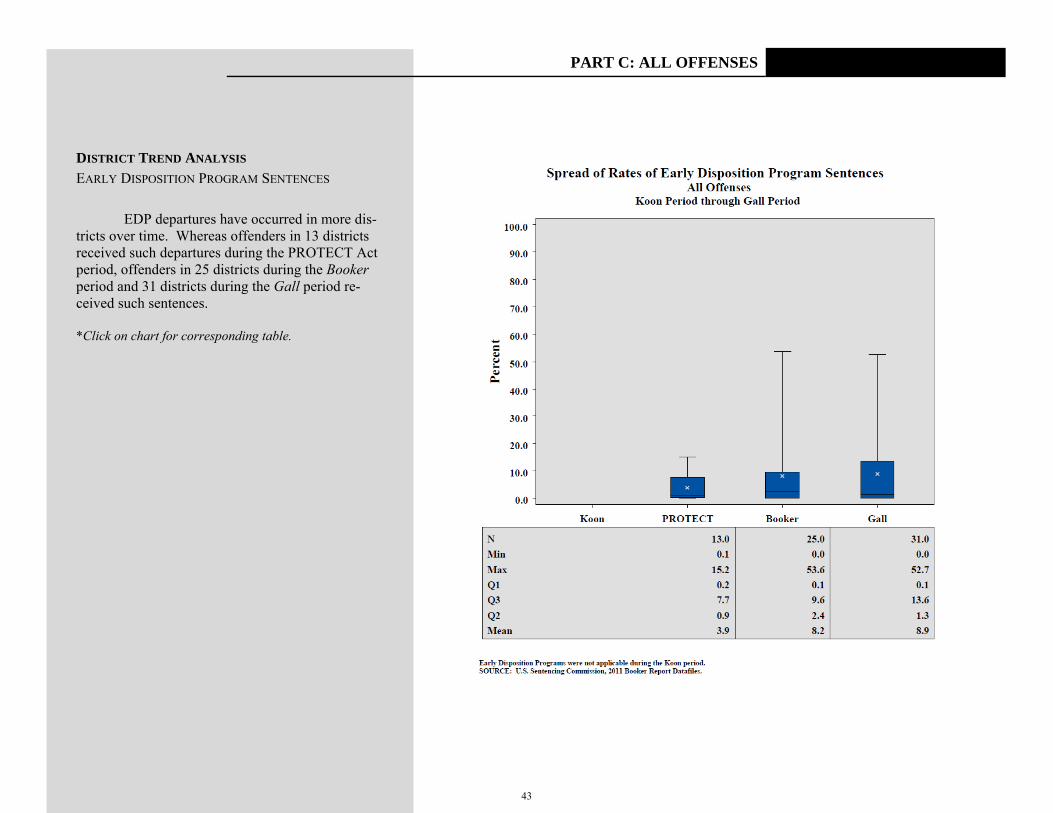
DISTRICT TREND ANALYSIS EARLY DISPOSITION PROGRAM SENTENCES EDP departures have occurred in more dis-tricts over time. Whereas offenders in 13 districts received such departures during the PROTECT Act period, offenders in 25 districts during the Booker period and 31 districts during the Gall period re-ceived such sentences. *Click on chart for corresponding table.
43
PART C: ALL OFFENSES
DISTRICT TREND ANALYSIS EARLY DISPOSITION PROGRAM SENTENCES
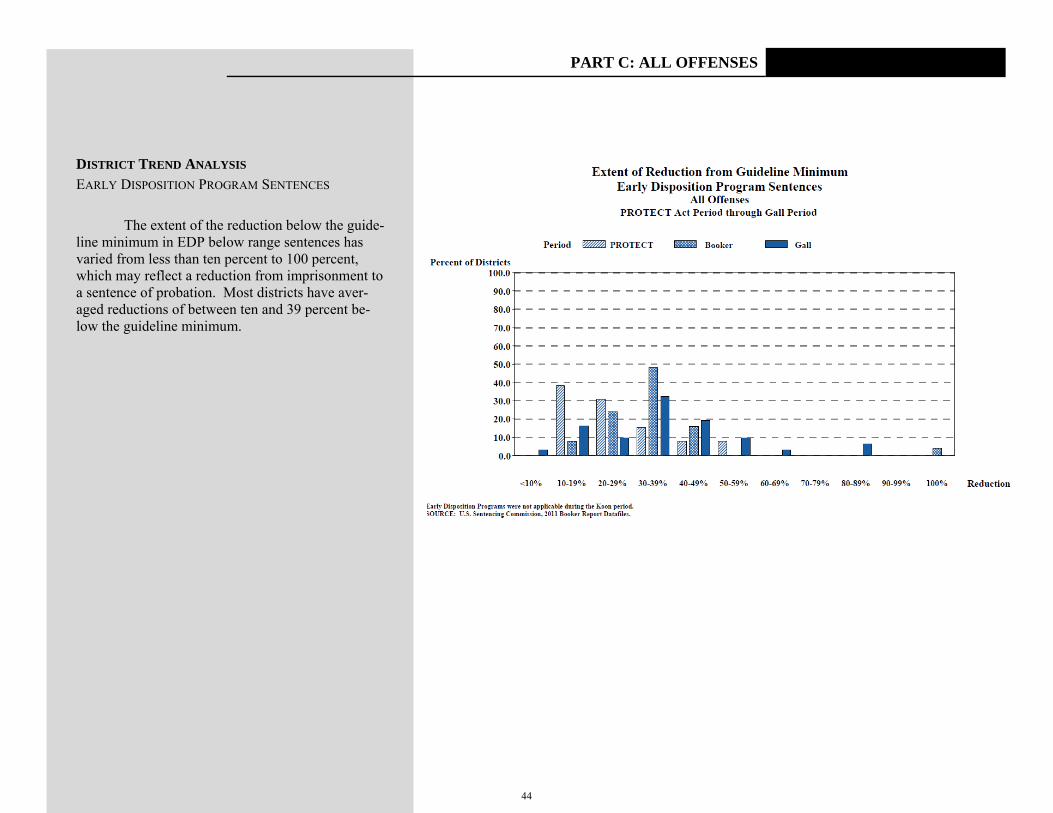
The extent of the reduction below the guide-
line minimum in EDP below range sentences has varied from less than ten percent to 100 percent, which may reflect a reduction from imprisonment to a sentence of probation. Most districts have aver-aged reductions of between ten and 39 percent be-low the guideline minimum.
44
PART C: ALL OFFENSES
DISTRICT TREND ANALYSIS EARLY DISPOSITION PROGRAM SENTENCES
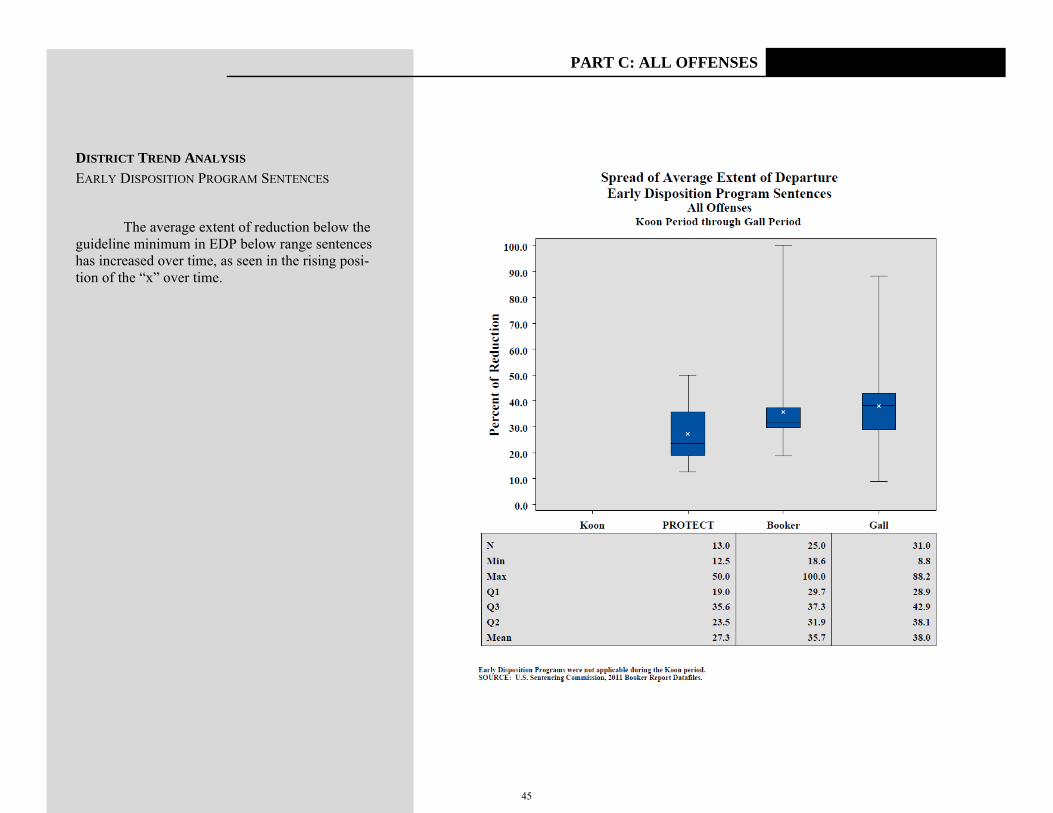
The average extent of reduction below the guideline minimum in EDP below range sentences has increased over time, as seen in the rising posi-tion of the “x” over time.
45
PART C: ALL OFFENSES
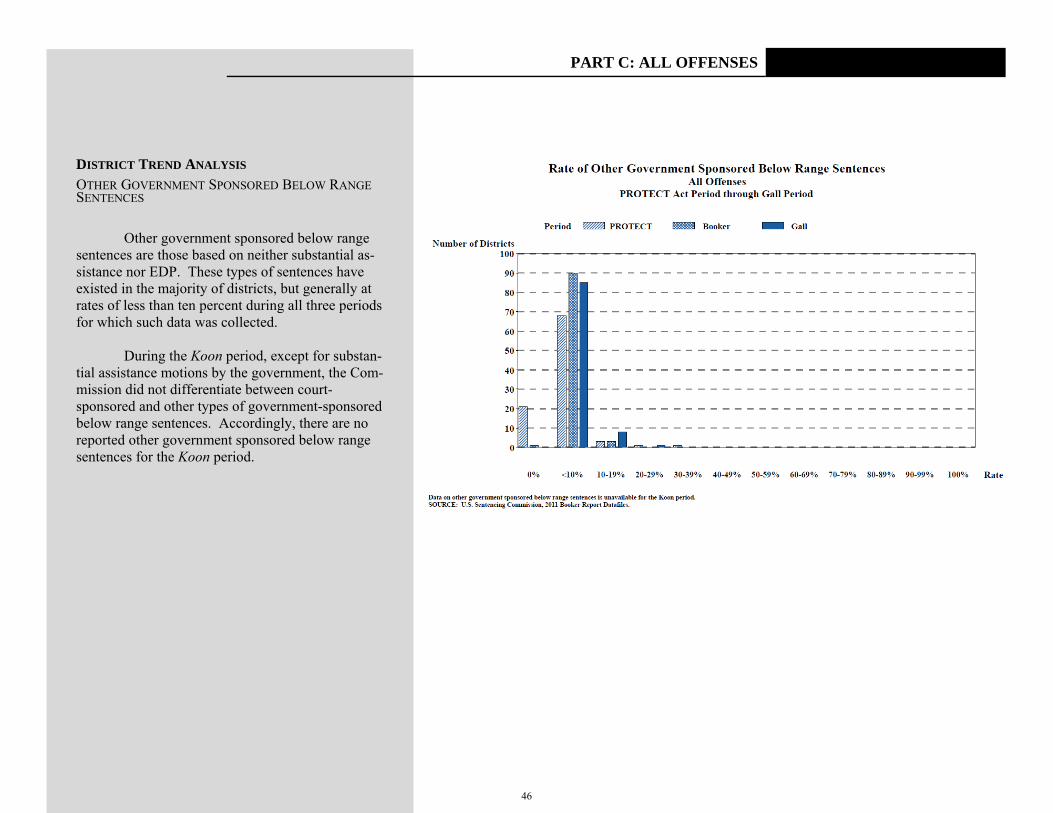
DISTRICT TREND ANALYSIS OTHER GOVERNMENT SPONSORED BELOW RANGE SENTENCES
Other government sponsored below range
sentences are those based on neither substantial as-sistance nor EDP. These types of sentences have existed in the majority of districts, but generally at rates of less than ten percent during all three periods for which such data was collected.
During the Koon period, except for substan-
tial assistance motions by the government, the Com-mission did not differentiate between court-sponsored and other types of government-sponsored below range sentences. Accordingly, there are no reported other government sponsored below range sentences for the Koon period.
46
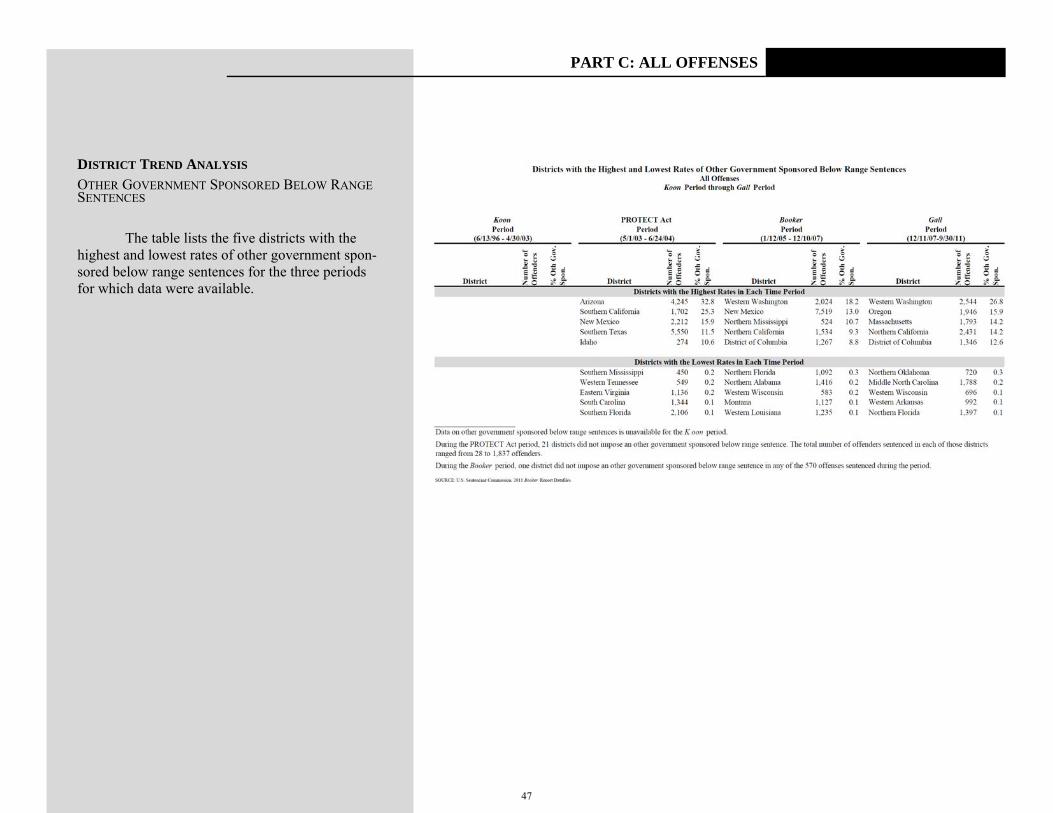
PART C: ALL OFFENSES
DISTRICT TREND ANALYSIS OTHER GOVERNMENT SPONSORED BELOW RANGE SENTENCES
The table lists the five districts with the
highest and lowest rates of other government spon-sored below range sentences for the three periods for which data were available.
47
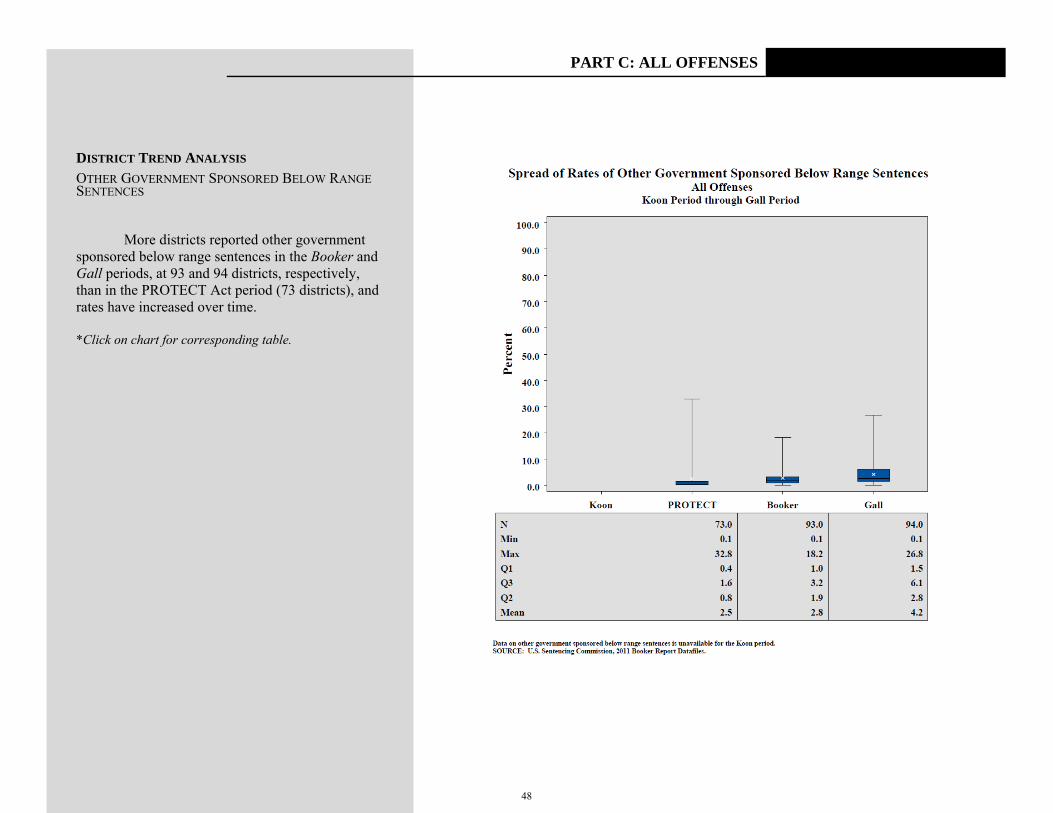
PART C: ALL OFFENSES
DISTRICT TREND ANALYSIS OTHER GOVERNMENT SPONSORED BELOW RANGE SENTENCES
More districts reported other government sponsored below range sentences in the Booker and Gall periods, at 93 and 94 districts, respectively, than in the PROTECT Act period (73 districts), and rates have increased over time.
*Click on chart for corresponding table.
48
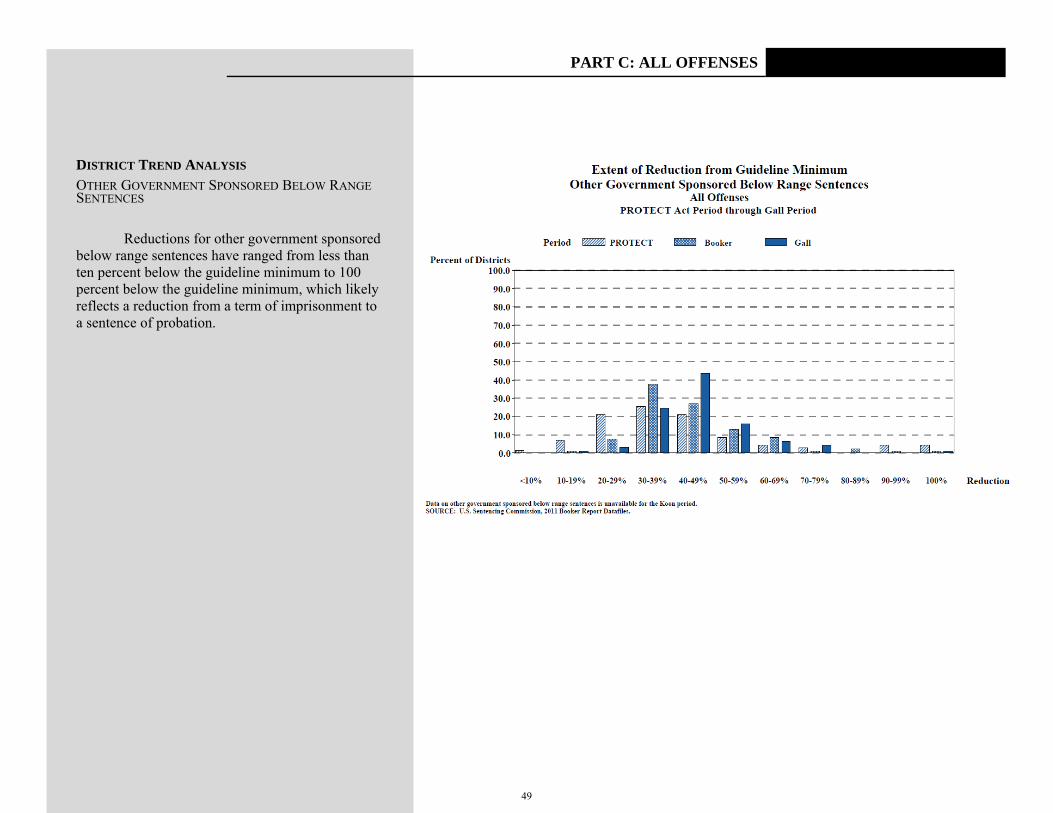
PART C: ALL OFFENSES
DISTRICT TREND ANALYSIS OTHER GOVERNMENT SPONSORED BELOW RANGE SENTENCES
Reductions for other government sponsored below range sentences have ranged from less than ten percent below the guideline minimum to 100 percent below the guideline minimum, which likely reflects a reduction from a term of imprisonment to a sentence of probation.
49

PART C: ALL OFFENSES
DISTRICT TREND ANALYSIS OTHER GOVERNMENT SPONSORED BELOW RANGE SENTENCES
As more districts have reported other gov-
ernment sponsored below range sentences, the spread in the extent of the reduction among the mid-dle 50 percent of districts has decreased. As seen in the higher position of the box along the vertical axis in the Gall period, reductions among the middle 50 percent of districts have become generally larger over the periods.
50
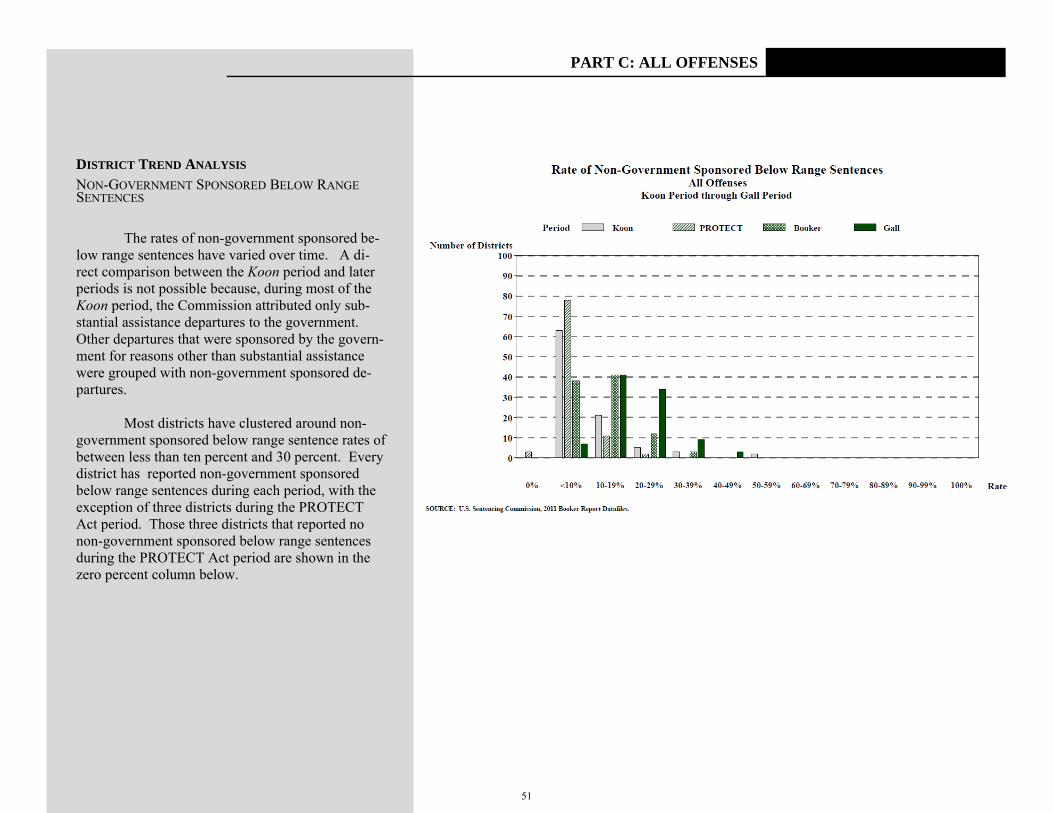
PART C: ALL OFFENSES
DISTRICT TREND ANALYSIS NON-GOVERNMENT SPONSORED BELOW RANGE SENTENCES
The rates of non-government sponsored be-
low range sentences have varied over time. A di-rect comparison between the Koon period and later periods is not possible because, during most of the Koon period, the Commission attributed only sub-stantial assistance departures to the government. Other departures that were sponsored by the govern-ment for reasons other than substantial assistance were grouped with non-government sponsored de-partures.
Most districts have clustered around non-
government sponsored below range sentence rates of between less than ten percent and 30 percent. Every district has reported non-government sponsored below range sentences during each period, with the exception of three districts during the PROTECT Act period. Those three districts that reported no non-government sponsored below range sentences during the PROTECT Act period are shown in the zero percent column below.
51
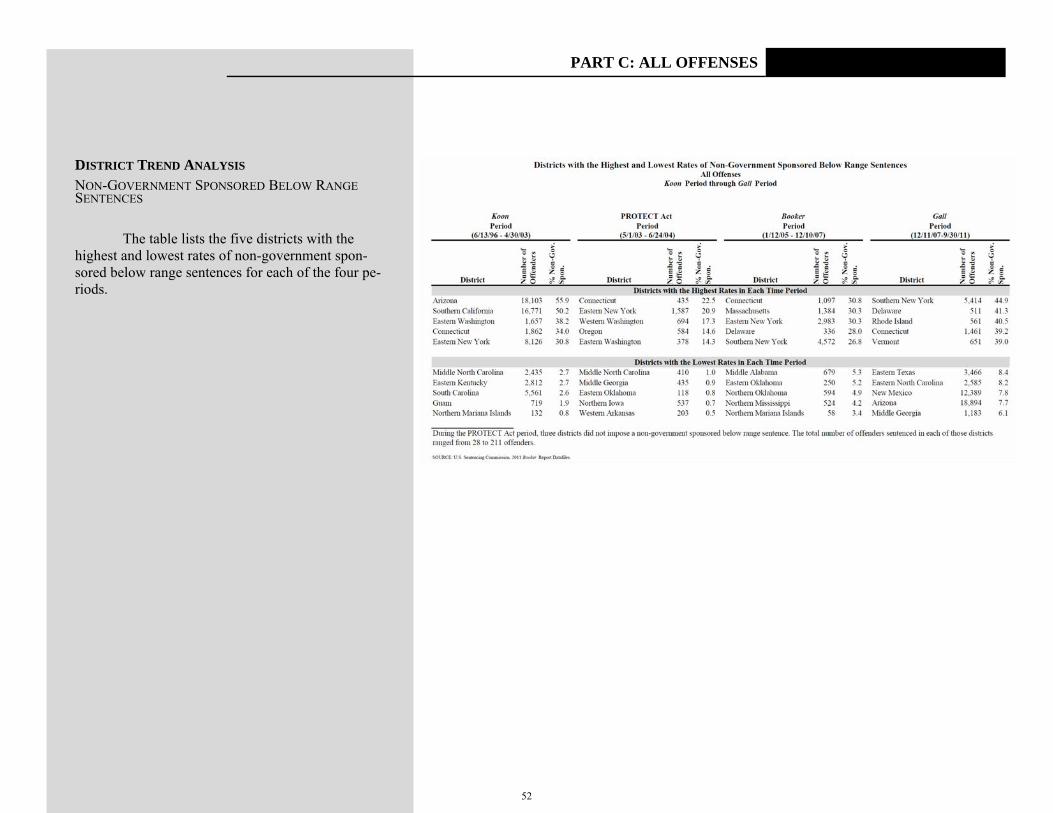
PART C: ALL OFFENSES
DISTRICT TREND ANALYSIS NON-GOVERNMENT SPONSORED BELOW RANGE SENTENCES
The table lists the five districts with the
highest and lowest rates of non-government spon-sored below range sentences for each of the four pe-riods.
52
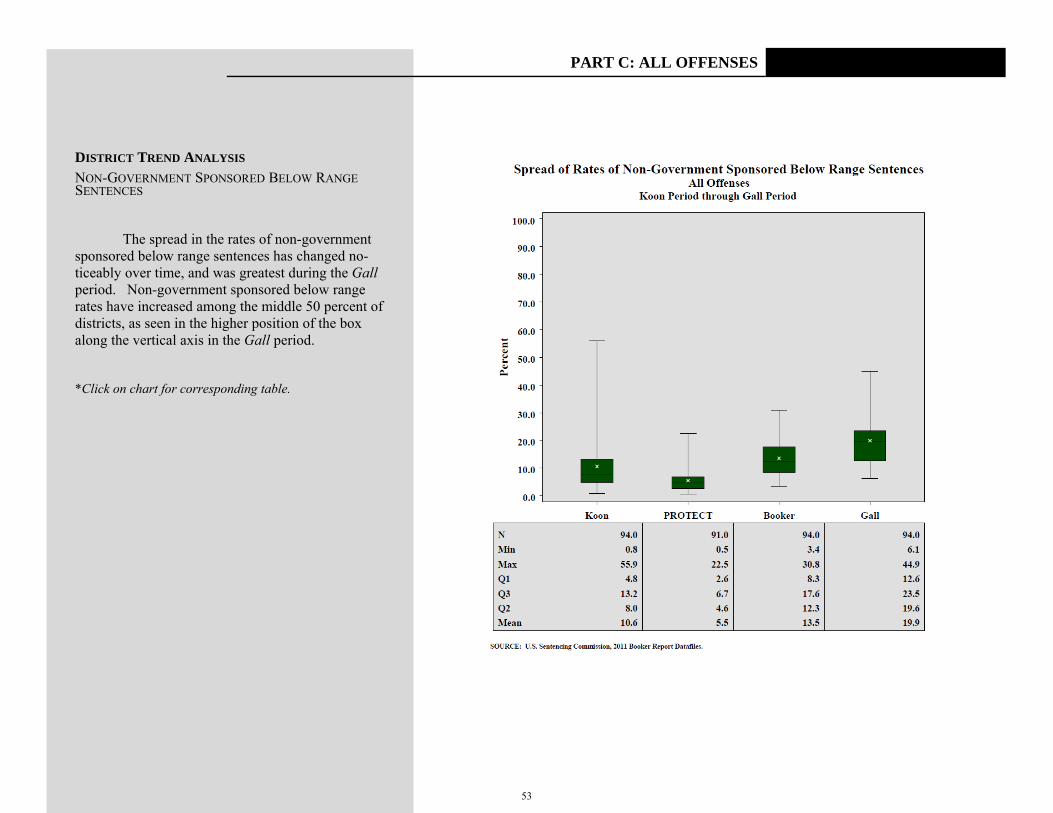
PART C: ALL OFFENSES
DISTRICT TREND ANALYSIS NON-GOVERNMENT SPONSORED BELOW RANGE SENTENCES
The spread in the rates of non-government sponsored below range sentences has changed no-ticeably over time, and was greatest during the Gall period. Non-government sponsored below range rates have increased among the middle 50 percent of districts, as seen in the higher position of the box along the vertical axis in the Gall period.
*Click on chart for corresponding table.
53
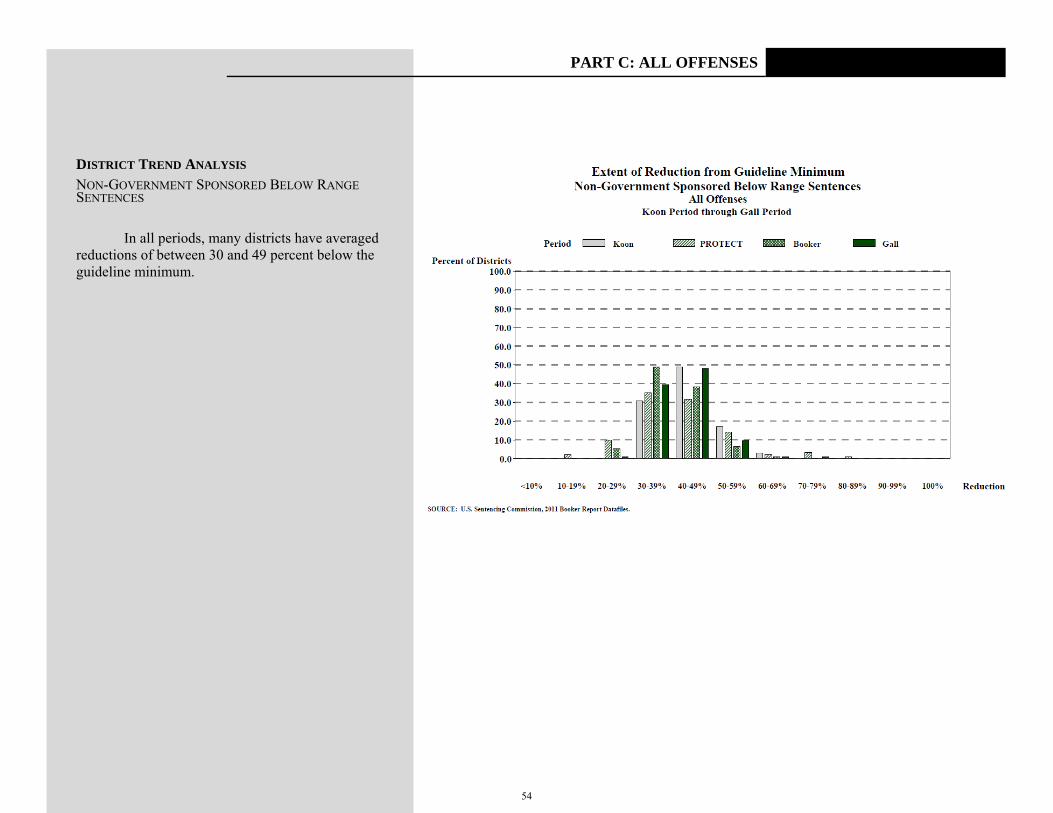
PART C: ALL OFFENSES
DISTRICT TREND ANALYSIS NON-GOVERNMENT SPONSORED BELOW RANGE SENTENCES
In all periods, many districts have averaged
reductions of between 30 and 49 percent below the guideline minimum.
54
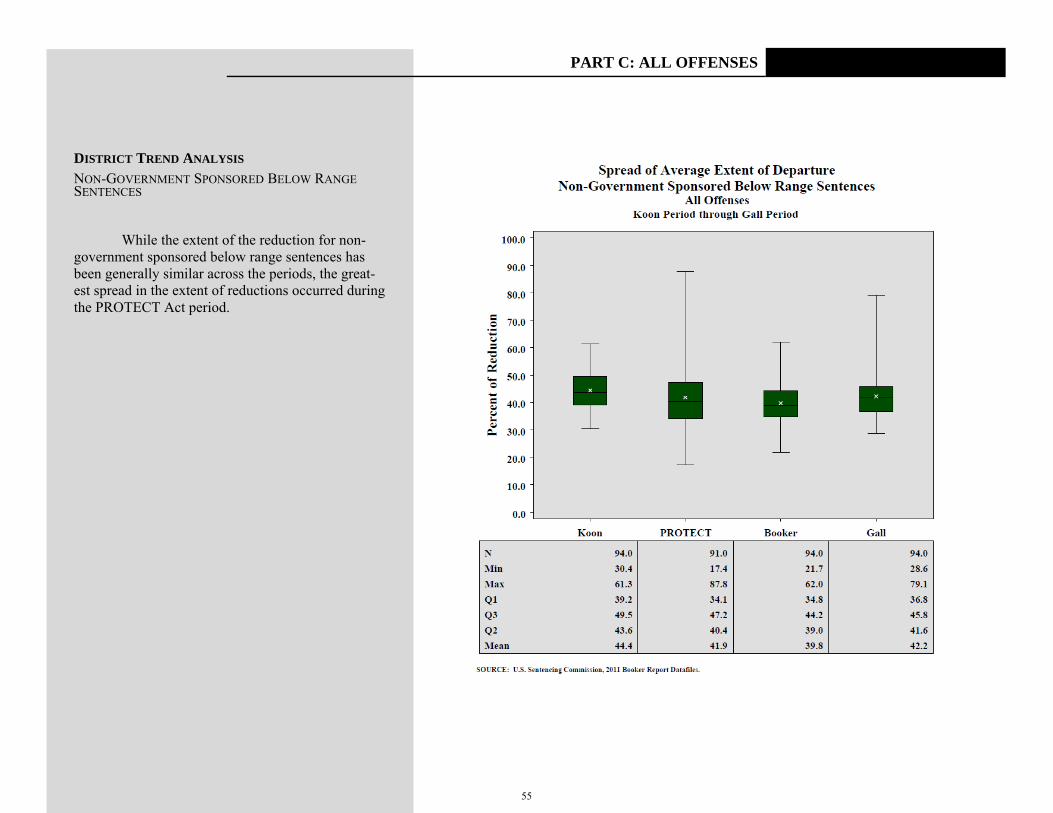
PART C: ALL OFFENSES
DISTRICT TREND ANALYSIS NON-GOVERNMENT SPONSORED BELOW RANGE SENTENCES
While the extent of the reduction for non-government sponsored below range sentences has been generally similar across the periods, the great-est spread in the extent of reductions occurred during the PROTECT Act period.
55
PART C: ALL OFFENSES
Appendix: Federal Offenses in the Aggregate I. OVERVIEW National Distribution of All Offenses by Circuit and District II. SENTENCE POSITION RELATIVE TO THE GUIDELINE RANGE Within Range Rates by Circuit and District
Above Range Rates by Circuit and District
Government Sponsored Below Range Rates by Circuit and District §5K1.1 Substantial Assistance Sentences §5K3.1 Early Disposition Program Sentences Other Government Sponsored Below Range Sentences
Non-Government Sponsored Below Range Sentences by Circuit and
District
Average Guideline Minimum and Length of Imprisonment by Circuit and District
III. BOX PLOTS: BELOW RANGE RATES BY DISTRICT Government Sponsored Below Range Rates Koon Period PROTECT Act Period Booker Period Gall Period
§5K1.1 Substantial Assistance Rates Koon Period PROTECT Act Period Booker Period Gall Period
§5K3.1 Early Disposition Program Sentences PROTECT Act Period Booker Period Gall Period
Other Government Sponsored Below Range Sentences PROTECT Act Period Booker Period Gall Period
Non-Government Sponsored Below Range Rates Koon Period PROTECT Act Period Booker Period Gall Period
56
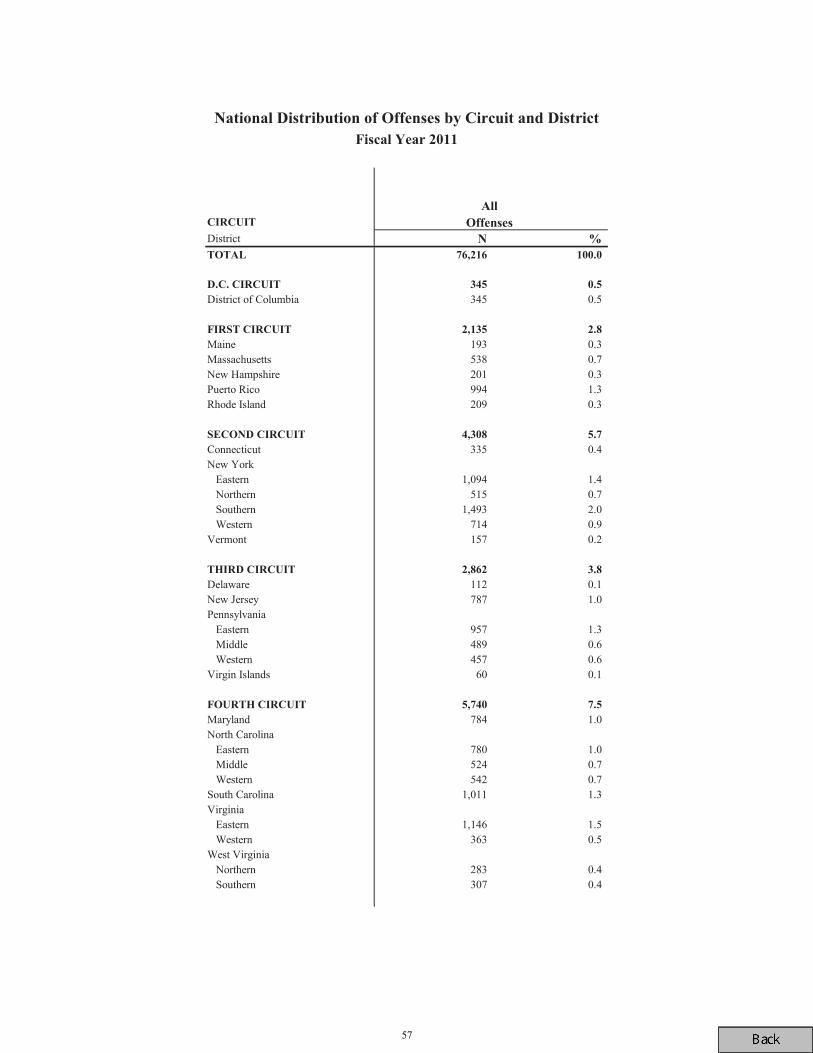
District
District of Columbia 345 0.5
Maine 193 0.3Massachusetts 538 0.7New Hampshire 201 0.3Puerto Rico 994 1.3Rhode Island 209 0.3
Connecticut 335 0.4New York Eastern 1,094 1.4 Northern 515 0.7 Southern 1,493 2.0 Western 714 0.9Vermont 157 0.2
Delaware 112 0.1New Jersey 787 1.0Pennsylvania Eastern 957 1.3 Middle 489 0.6 Western 457 0.6Virgin Islands 60 0.1
Maryland 784 1.0North Carolina Eastern 780 1.0 Middle 524 0.7 Western 542 0.7South Carolina 1,011 1.3Virginia Eastern 1,146 1.5 Western 363 0.5West Virginia Northern 283 0.4 Southern 307 0.4
57
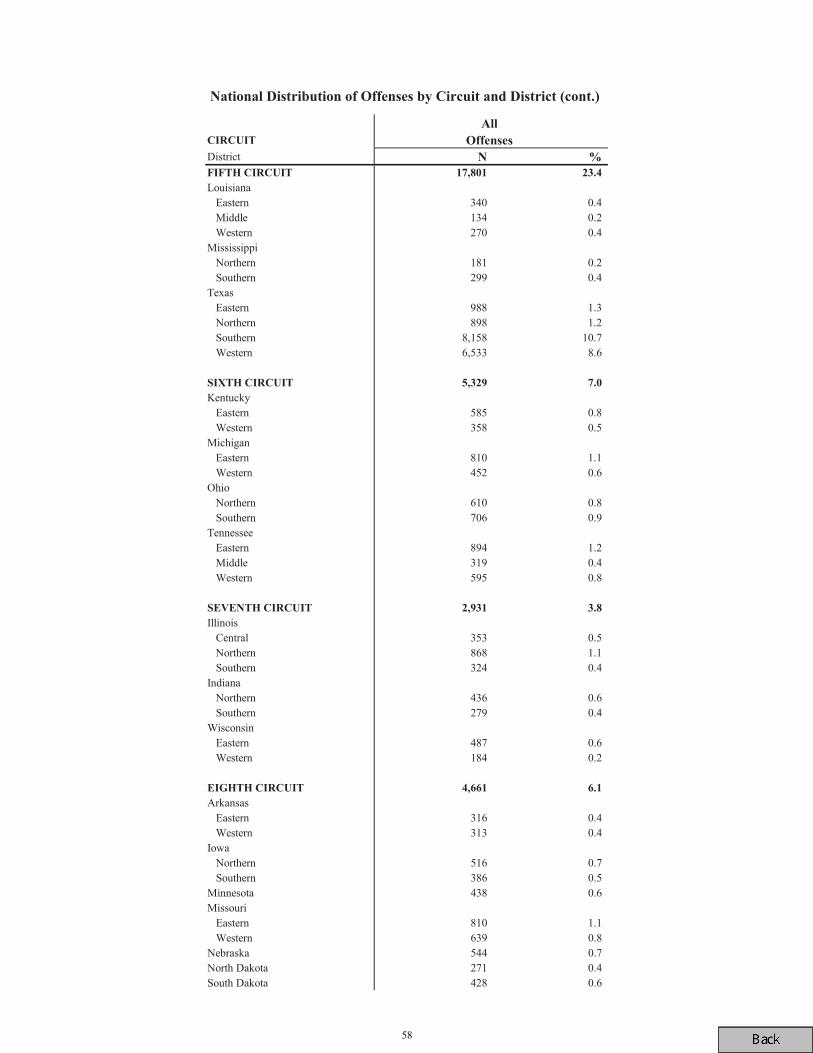
District
Louisiana Eastern 340 0.4 Middle 134 0.2 Western 270 0.4Mississippi Northern 181 0.2 Southern 299 0.4Texas Eastern 988 1.3 Northern 898 1.2 Southern 8,158 10.7 Western 6,533 8.6
Kentucky Eastern 585 0.8 Western 358 0.5Michigan Eastern 810 1.1 Western 452 0.6Ohio Northern 610 0.8 Southern 706 0.9Tennessee Eastern 894 1.2 Middle 319 0.4 Western 595 0.8
Illinois Central 353 0.5 Northern 868 1.1 Southern 324 0.4Indiana Northern 436 0.6 Southern 279 0.4Wisconsin Eastern 487 0.6 Western 184 0.2
Arkansas Eastern 316 0.4 Western 313 0.4Iowa Northern 516 0.7 Southern 386 0.5Minnesota 438 0.6Missouri Eastern 810 1.1 Western 639 0.8Nebraska 544 0.7North Dakota 271 0.4South Dakota 428 0.6
58
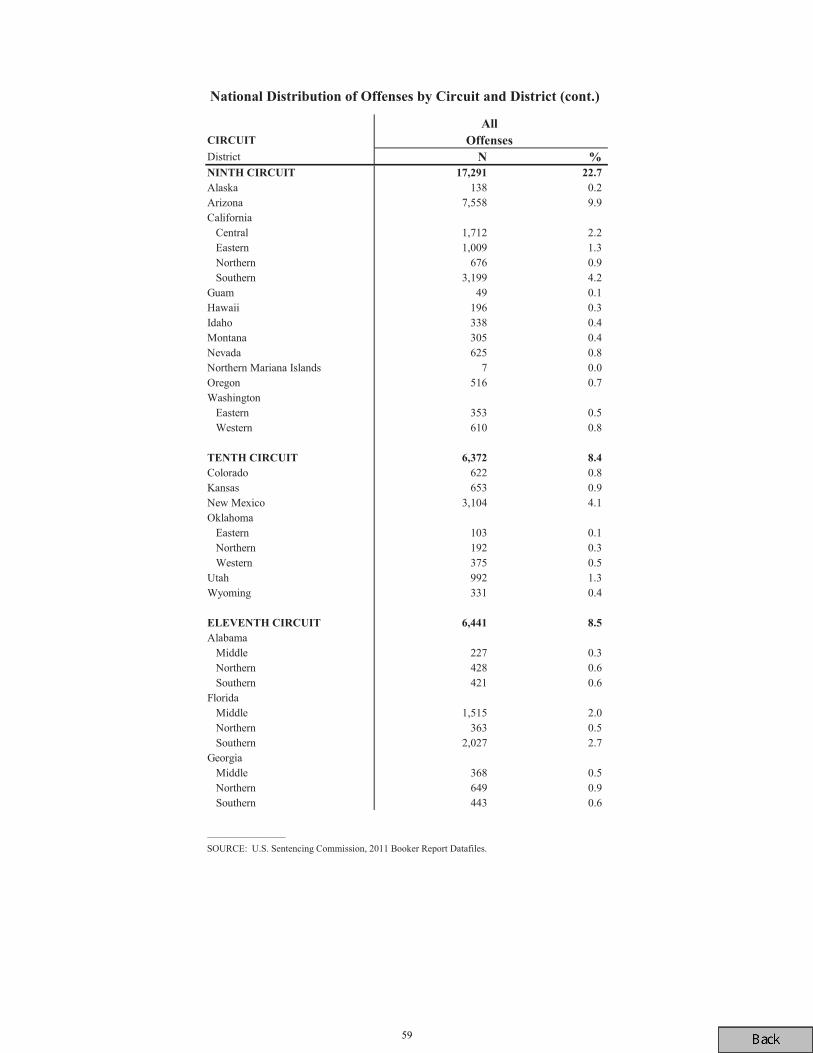
District
Alaska 138 0.2Arizona 7,558 9.9California Central 1,712 2.2 Eastern 1,009 1.3 Northern 676 0.9 Southern 3,199 4.2Guam 49 0.1Hawaii 196 0.3Idaho 338 0.4Montana 305 0.4Nevada 625 0.8Northern Mariana Islands 7 0.0Oregon 516 0.7Washington Eastern 353 0.5 Western 610 0.8
Colorado 622 0.8Kansas 653 0.9New Mexico 3,104 4.1Oklahoma Eastern 103 0.1 Northern 192 0.3 Western 375 0.5Utah 992 1.3Wyoming 331 0.4
Alabama Middle 227 0.3 Northern 428 0.6 Southern 421 0.6Florida Middle 1,515 2.0 Northern 363 0.5 Southern 2,027 2.7Georgia Middle 368 0.5 Northern 649 0.9 Southern 443 0.6
______________SOURCE: U.S. Sentencing Commission, 2011 Booker Report Datafiles.
59

�
Koon Gall
Koon Booker Gall
60
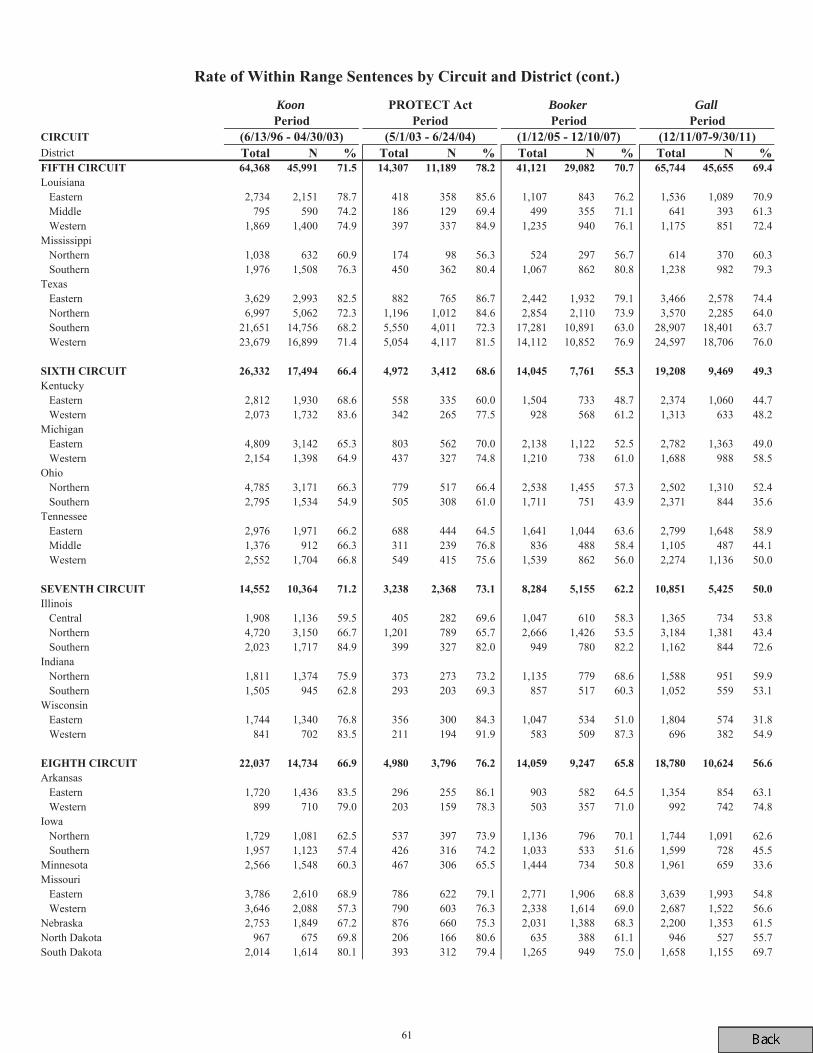
Koon Booker Gall
61
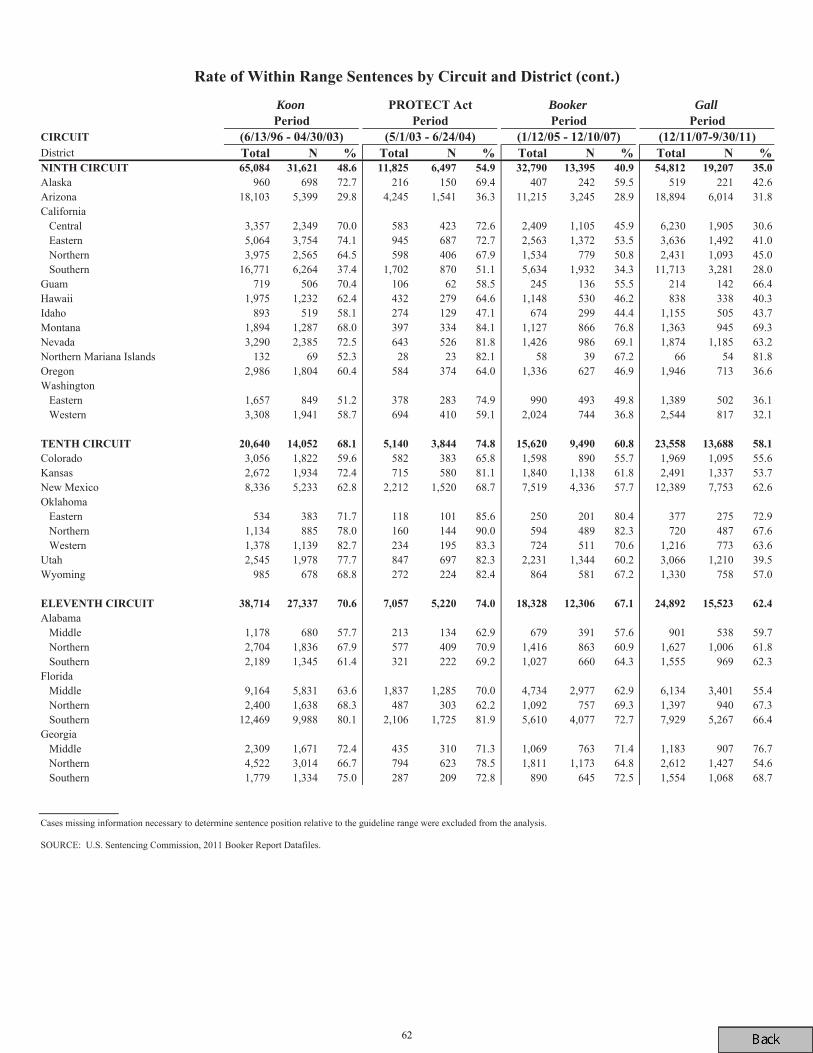
Koon Booker Gall
62
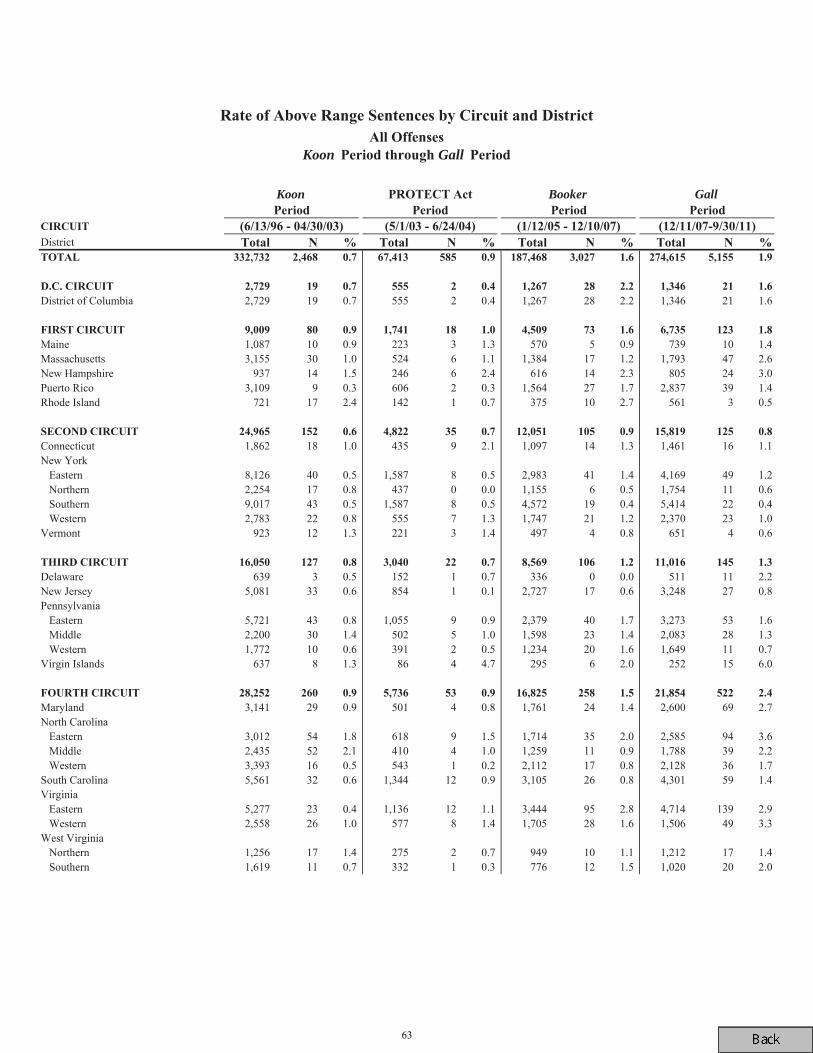
Koon Gall
Koon Booker Gall
63

Koon Booker Gall
64
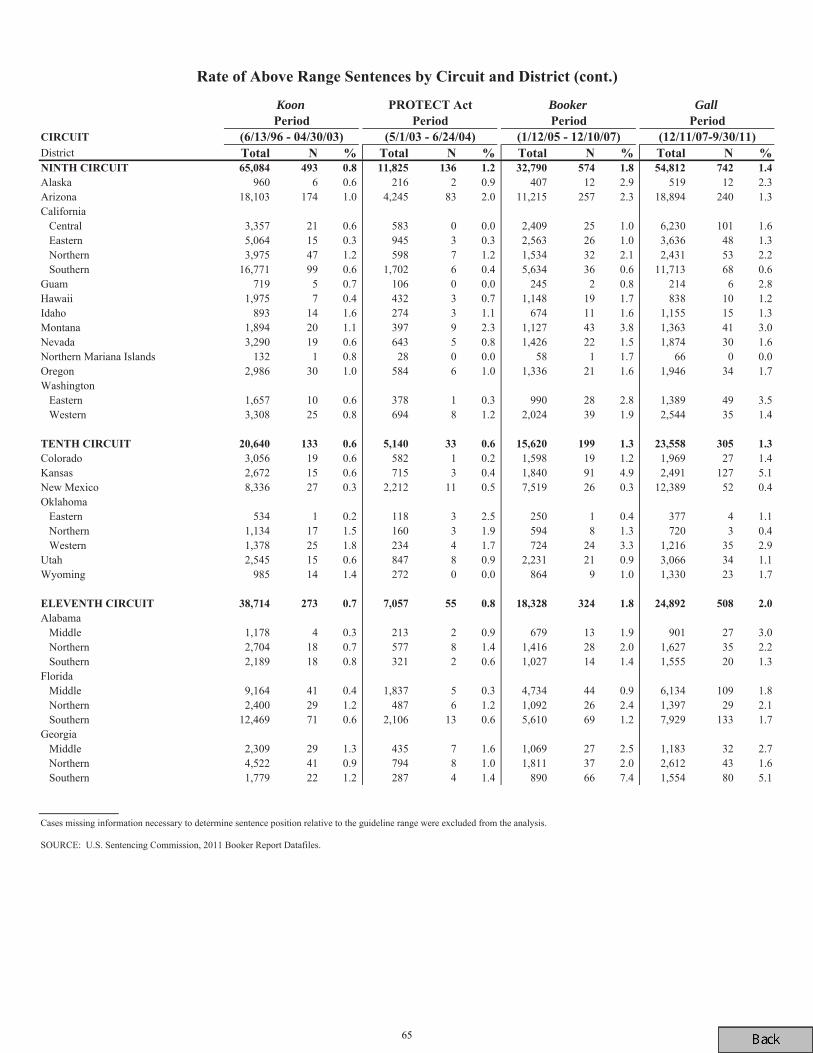
Koon Booker Gall
65
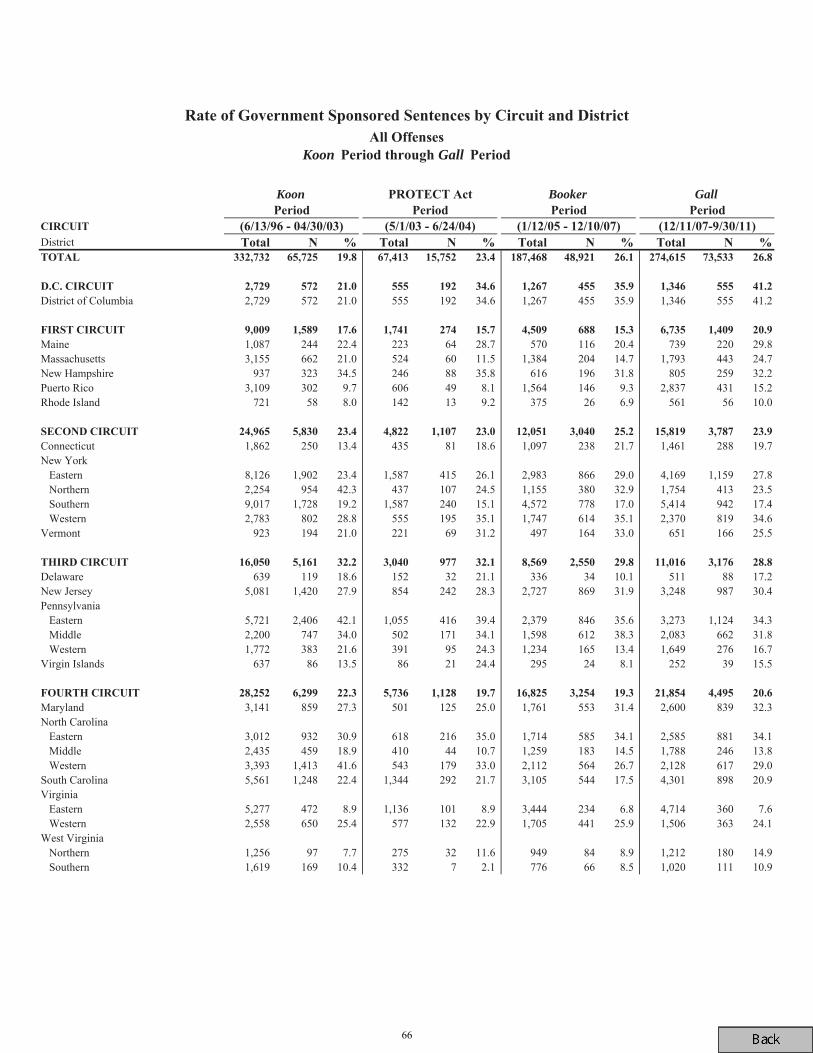
Koon Gall
Koon Booker Gall
66
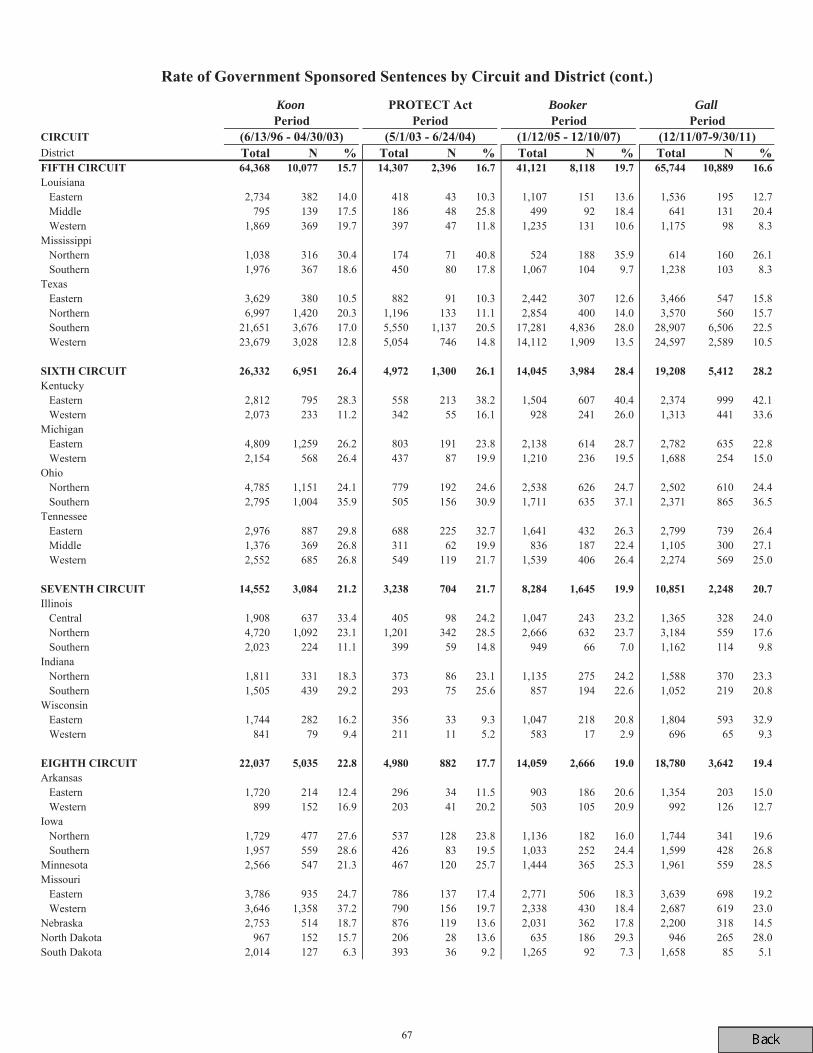
Koon Booker Gall
67
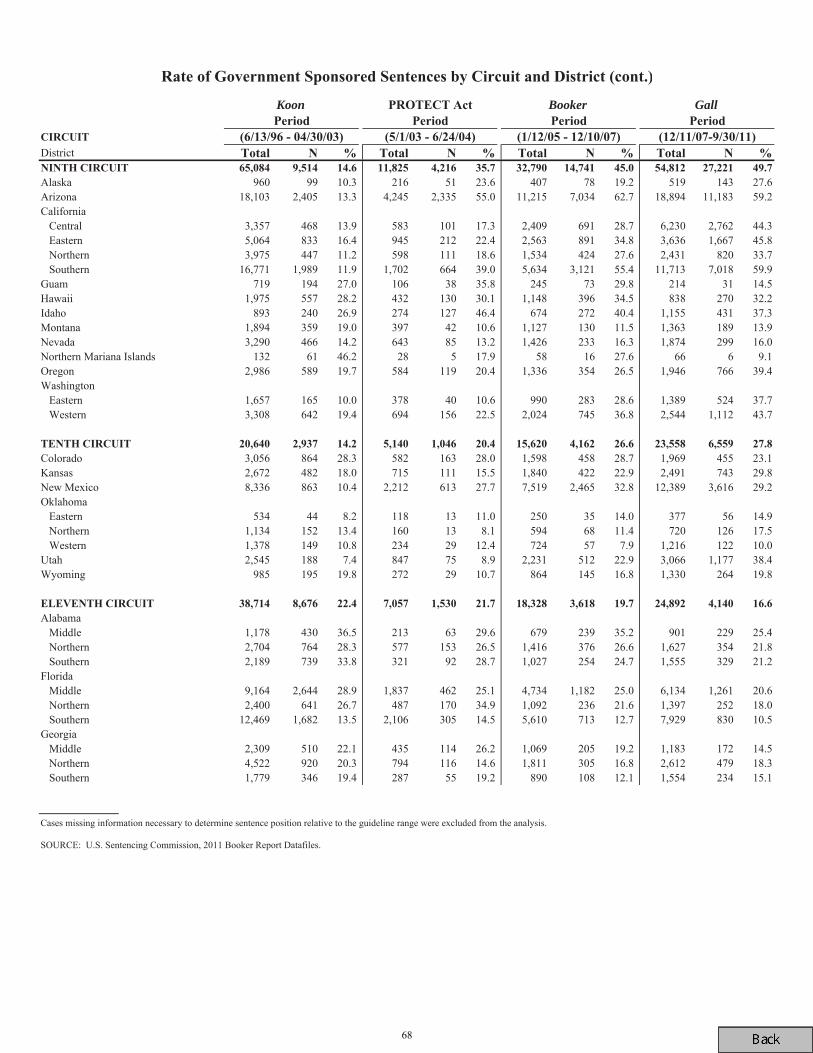
Koon Booker Gall
68

District
District of Columbia 2,729 562 20.6 555 169 30.5 1,267 344 27.2 1,346 386 28.7
Maine 1,087 244 22.4 223 64 28.7 570 116 20.4 739 216 29.2Massachusetts 3,155 661 21.0 524 55 10.5 1,384 163 11.8 1,793 186 10.4New Hampshire 937 323 34.5 246 84 34.1 616 162 26.3 805 182 22.6Puerto Rico 3,109 297 9.6 606 47 7.8 1,564 108 6.9 2,837 196 6.9Rhode Island 721 58 8.0 142 13 9.2 375 19 5.1 561 44 7.8
Connecticut 1,862 238 12.8 435 51 11.7 1,097 225 20.5 1,461 250 17.1New York Eastern 8,126 1,855 22.8 1,587 324 20.4 2,983 722 24.2 4,169 970 23.3 Northern 2,254 953 42.3 437 104 23.8 1,155 364 31.5 1,754 383 21.8 Southern 9,017 1,728 19.2 1,587 236 14.9 4,572 699 15.3 5,414 843 15.6 Western 2,783 794 28.5 555 189 34.1 1,747 563 32.2 2,370 710 30.0Vermont 923 194 21.0 221 69 31.2 497 152 30.6 651 126 19.4
Delaware 639 116 18.2 152 31 20.4 336 25 7.4 511 69 13.5New Jersey 5,081 1,419 27.9 854 234 27.4 2,727 839 30.8 3,248 923 28.4Pennsylvania Eastern 5,721 2,404 42.0 1,055 408 38.7 2,379 800 33.6 3,273 1,041 31.8 Middle 2,200 746 33.9 502 168 33.5 1,598 559 35.0 2,083 498 23.9 Western 1,772 382 21.6 391 95 24.3 1,234 156 12.6 1,649 247 15.0Virgin Islands 637 84 13.2 86 19 22.1 295 22 7.5 252 32 12.7
Maryland 3,141 857 27.3 501 123 24.6 1,761 502 28.5 2,600 646 24.8North Carolina Eastern 3,012 932 30.9 618 214 34.6 1,714 579 33.8 2,585 871 33.7 Middle 2,435 459 18.9 410 44 10.7 1,259 178 14.1 1,788 243 13.6 Western 3,393 1,410 41.6 543 176 32.4 2,112 535 25.3 2,128 572 26.9South Carolina 5,561 1,247 22.4 1,344 290 21.6 3,105 511 16.5 4,301 777 18.1Virginia Eastern 5,277 472 8.9 1,136 98 8.6 3,444 215 6.2 4,714 283 6.0 Western 2,558 646 25.3 577 127 22.0 1,705 420 24.6 1,506 312 20.7West Virginia Northern 1,256 97 7.7 275 32 11.6 949 74 7.8 1,212 116 9.6 Southern 1,619 169 10.4 332 7 2.1 776 63 8.1 1,020 105 10.3
Koon Gall
Koon Booker Gall
69
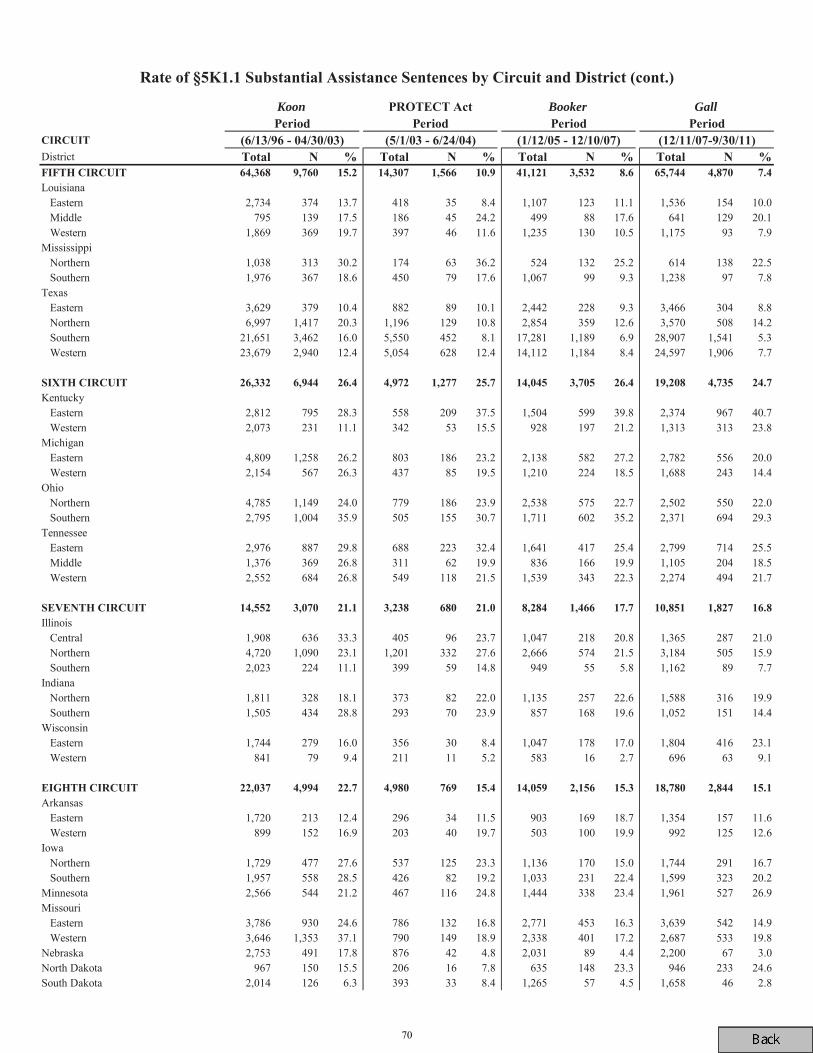
District
Louisiana Eastern 2,734 374 13.7 418 35 8.4 1,107 123 11.1 1,536 154 10.0 Middle 795 139 17.5 186 45 24.2 499 88 17.6 641 129 20.1 Western 1,869 369 19.7 397 46 11.6 1,235 130 10.5 1,175 93 7.9Mississippi Northern 1,038 313 30.2 174 63 36.2 524 132 25.2 614 138 22.5 Southern 1,976 367 18.6 450 79 17.6 1,067 99 9.3 1,238 97 7.8Texas Eastern 3,629 379 10.4 882 89 10.1 2,442 228 9.3 3,466 304 8.8 Northern 6,997 1,417 20.3 1,196 129 10.8 2,854 359 12.6 3,570 508 14.2 Southern 21,651 3,462 16.0 5,550 452 8.1 17,281 1,189 6.9 28,907 1,541 5.3 Western 23,679 2,940 12.4 5,054 628 12.4 14,112 1,184 8.4 24,597 1,906 7.7
Kentucky Eastern 2,812 795 28.3 558 209 37.5 1,504 599 39.8 2,374 967 40.7 Western 2,073 231 11.1 342 53 15.5 928 197 21.2 1,313 313 23.8Michigan Eastern 4,809 1,258 26.2 803 186 23.2 2,138 582 27.2 2,782 556 20.0 Western 2,154 567 26.3 437 85 19.5 1,210 224 18.5 1,688 243 14.4Ohio Northern 4,785 1,149 24.0 779 186 23.9 2,538 575 22.7 2,502 550 22.0 Southern 2,795 1,004 35.9 505 155 30.7 1,711 602 35.2 2,371 694 29.3Tennessee Eastern 2,976 887 29.8 688 223 32.4 1,641 417 25.4 2,799 714 25.5 Middle 1,376 369 26.8 311 62 19.9 836 166 19.9 1,105 204 18.5 Western 2,552 684 26.8 549 118 21.5 1,539 343 22.3 2,274 494 21.7
Illinois Central 1,908 636 33.3 405 96 23.7 1,047 218 20.8 1,365 287 21.0 Northern 4,720 1,090 23.1 1,201 332 27.6 2,666 574 21.5 3,184 505 15.9 Southern 2,023 224 11.1 399 59 14.8 949 55 5.8 1,162 89 7.7Indiana Northern 1,811 328 18.1 373 82 22.0 1,135 257 22.6 1,588 316 19.9 Southern 1,505 434 28.8 293 70 23.9 857 168 19.6 1,052 151 14.4Wisconsin Eastern 1,744 279 16.0 356 30 8.4 1,047 178 17.0 1,804 416 23.1 Western 841 79 9.4 211 11 5.2 583 16 2.7 696 63 9.1
Arkansas Eastern 1,720 213 12.4 296 34 11.5 903 169 18.7 1,354 157 11.6 Western 899 152 16.9 203 40 19.7 503 100 19.9 992 125 12.6Iowa Northern 1,729 477 27.6 537 125 23.3 1,136 170 15.0 1,744 291 16.7 Southern 1,957 558 28.5 426 82 19.2 1,033 231 22.4 1,599 323 20.2Minnesota 2,566 544 21.2 467 116 24.8 1,444 338 23.4 1,961 527 26.9Missouri Eastern 3,786 930 24.6 786 132 16.8 2,771 453 16.3 3,639 542 14.9 Western 3,646 1,353 37.1 790 149 18.9 2,338 401 17.2 2,687 533 19.8Nebraska 2,753 491 17.8 876 42 4.8 2,031 89 4.4 2,200 67 3.0North Dakota 967 150 15.5 206 16 7.8 635 148 23.3 946 233 24.6South Dakota 2,014 126 6.3 393 33 8.4 1,265 57 4.5 1,658 46 2.8
Koon Booker Gall
70
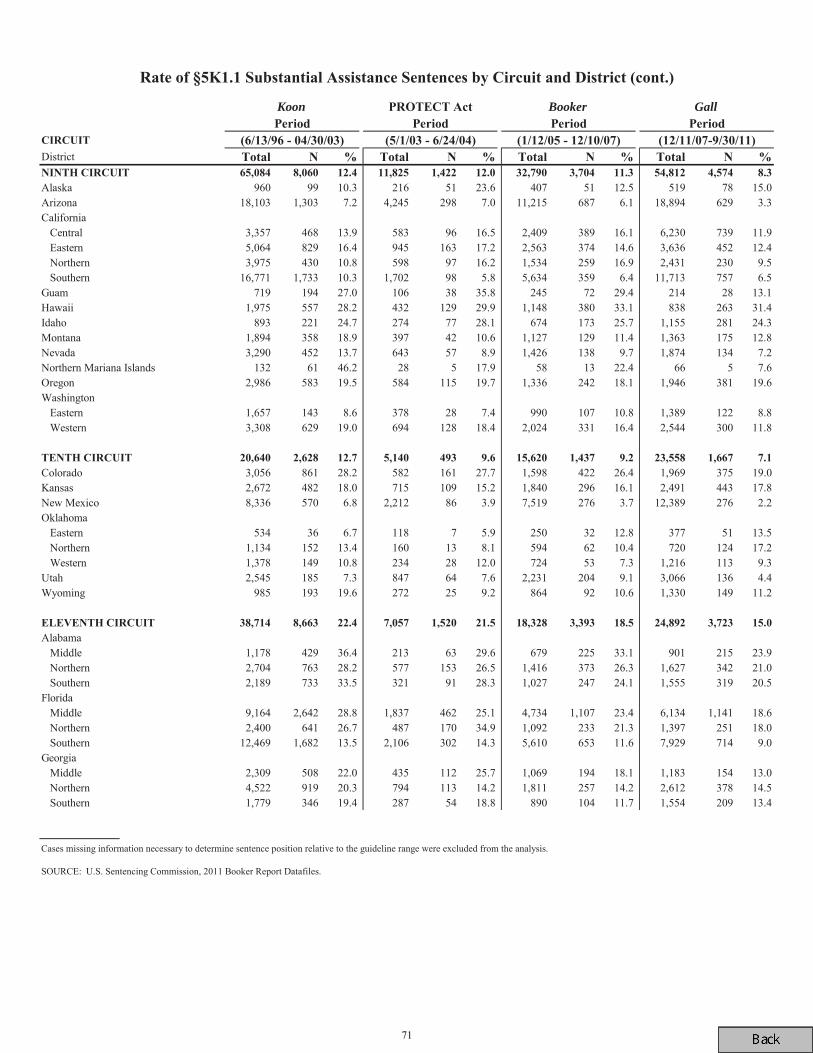
District
Alaska 960 99 10.3 216 51 23.6 407 51 12.5 519 78 15.0Arizona 18,103 1,303 7.2 4,245 298 7.0 11,215 687 6.1 18,894 629 3.3California Central 3,357 468 13.9 583 96 16.5 2,409 389 16.1 6,230 739 11.9 Eastern 5,064 829 16.4 945 163 17.2 2,563 374 14.6 3,636 452 12.4 Northern 3,975 430 10.8 598 97 16.2 1,534 259 16.9 2,431 230 9.5 Southern 16,771 1,733 10.3 1,702 98 5.8 5,634 359 6.4 11,713 757 6.5Guam 719 194 27.0 106 38 35.8 245 72 29.4 214 28 13.1Hawaii 1,975 557 28.2 432 129 29.9 1,148 380 33.1 838 263 31.4Idaho 893 221 24.7 274 77 28.1 674 173 25.7 1,155 281 24.3Montana 1,894 358 18.9 397 42 10.6 1,127 129 11.4 1,363 175 12.8Nevada 3,290 452 13.7 643 57 8.9 1,426 138 9.7 1,874 134 7.2Northern Mariana Islands 132 61 46.2 28 5 17.9 58 13 22.4 66 5 7.6Oregon 2,986 583 19.5 584 115 19.7 1,336 242 18.1 1,946 381 19.6Washington Eastern 1,657 143 8.6 378 28 7.4 990 107 10.8 1,389 122 8.8 Western 3,308 629 19.0 694 128 18.4 2,024 331 16.4 2,544 300 11.8
Colorado 3,056 861 28.2 582 161 27.7 1,598 422 26.4 1,969 375 19.0Kansas 2,672 482 18.0 715 109 15.2 1,840 296 16.1 2,491 443 17.8New Mexico 8,336 570 6.8 2,212 86 3.9 7,519 276 3.7 12,389 276 2.2Oklahoma Eastern 534 36 6.7 118 7 5.9 250 32 12.8 377 51 13.5 Northern 1,134 152 13.4 160 13 8.1 594 62 10.4 720 124 17.2 Western 1,378 149 10.8 234 28 12.0 724 53 7.3 1,216 113 9.3Utah 2,545 185 7.3 847 64 7.6 2,231 204 9.1 3,066 136 4.4Wyoming 985 193 19.6 272 25 9.2 864 92 10.6 1,330 149 11.2
Alabama Middle 1,178 429 36.4 213 63 29.6 679 225 33.1 901 215 23.9 Northern 2,704 763 28.2 577 153 26.5 1,416 373 26.3 1,627 342 21.0 Southern 2,189 733 33.5 321 91 28.3 1,027 247 24.1 1,555 319 20.5Florida Middle 9,164 2,642 28.8 1,837 462 25.1 4,734 1,107 23.4 6,134 1,141 18.6 Northern 2,400 641 26.7 487 170 34.9 1,092 233 21.3 1,397 251 18.0 Southern 12,469 1,682 13.5 2,106 302 14.3 5,610 653 11.6 7,929 714 9.0Georgia Middle 2,309 508 22.0 435 112 25.7 1,069 194 18.1 1,183 154 13.0 Northern 4,522 919 20.3 794 113 14.2 1,811 257 14.2 2,612 378 14.5 Southern 1,779 346 19.4 287 54 18.8 890 104 11.7 1,554 209 13.4
Cases missing information necessary to determine sentence position relative to the guideline range were excluded from the analysis.
SOURCE: U.S. Sentencing Commission, 2011 Booker Report Datafiles.
Koon Booker Gall
71
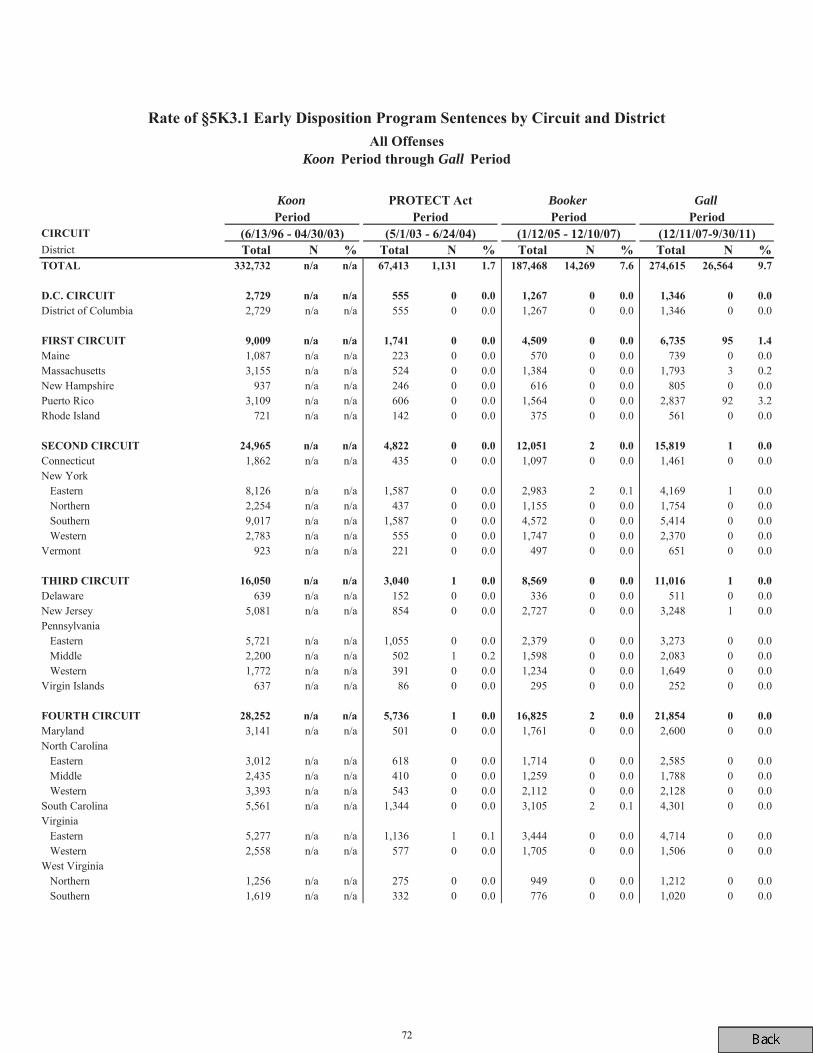
District
District of Columbia 2,729 n/a n/a 555 0 0.0 1,267 0 0.0 1,346 0 0.0
Maine 1,087 n/a n/a 223 0 0.0 570 0 0.0 739 0 0.0Massachusetts 3,155 n/a n/a 524 0 0.0 1,384 0 0.0 1,793 3 0.2New Hampshire 937 n/a n/a 246 0 0.0 616 0 0.0 805 0 0.0Puerto Rico 3,109 n/a n/a 606 0 0.0 1,564 0 0.0 2,837 92 3.2Rhode Island 721 n/a n/a 142 0 0.0 375 0 0.0 561 0 0.0
Connecticut 1,862 n/a n/a 435 0 0.0 1,097 0 0.0 1,461 0 0.0New York Eastern 8,126 n/a n/a 1,587 0 0.0 2,983 2 0.1 4,169 1 0.0 Northern 2,254 n/a n/a 437 0 0.0 1,155 0 0.0 1,754 0 0.0 Southern 9,017 n/a n/a 1,587 0 0.0 4,572 0 0.0 5,414 0 0.0 Western 2,783 n/a n/a 555 0 0.0 1,747 0 0.0 2,370 0 0.0Vermont 923 n/a n/a 221 0 0.0 497 0 0.0 651 0 0.0
Delaware 639 n/a n/a 152 0 0.0 336 0 0.0 511 0 0.0New Jersey 5,081 n/a n/a 854 0 0.0 2,727 0 0.0 3,248 1 0.0Pennsylvania Eastern 5,721 n/a n/a 1,055 0 0.0 2,379 0 0.0 3,273 0 0.0 Middle 2,200 n/a n/a 502 1 0.2 1,598 0 0.0 2,083 0 0.0 Western 1,772 n/a n/a 391 0 0.0 1,234 0 0.0 1,649 0 0.0Virgin Islands 637 n/a n/a 86 0 0.0 295 0 0.0 252 0 0.0
Maryland 3,141 n/a n/a 501 0 0.0 1,761 0 0.0 2,600 0 0.0North Carolina Eastern 3,012 n/a n/a 618 0 0.0 1,714 0 0.0 2,585 0 0.0 Middle 2,435 n/a n/a 410 0 0.0 1,259 0 0.0 1,788 0 0.0 Western 3,393 n/a n/a 543 0 0.0 2,112 0 0.0 2,128 0 0.0South Carolina 5,561 n/a n/a 1,344 0 0.0 3,105 2 0.1 4,301 0 0.0Virginia Eastern 5,277 n/a n/a 1,136 1 0.1 3,444 0 0.0 4,714 0 0.0 Western 2,558 n/a n/a 577 0 0.0 1,705 0 0.0 1,506 0 0.0West Virginia Northern 1,256 n/a n/a 275 0 0.0 949 0 0.0 1,212 0 0.0 Southern 1,619 n/a n/a 332 0 0.0 776 0 0.0 1,020 0 0.0
Koon Gall
Koon Booker Gall
72
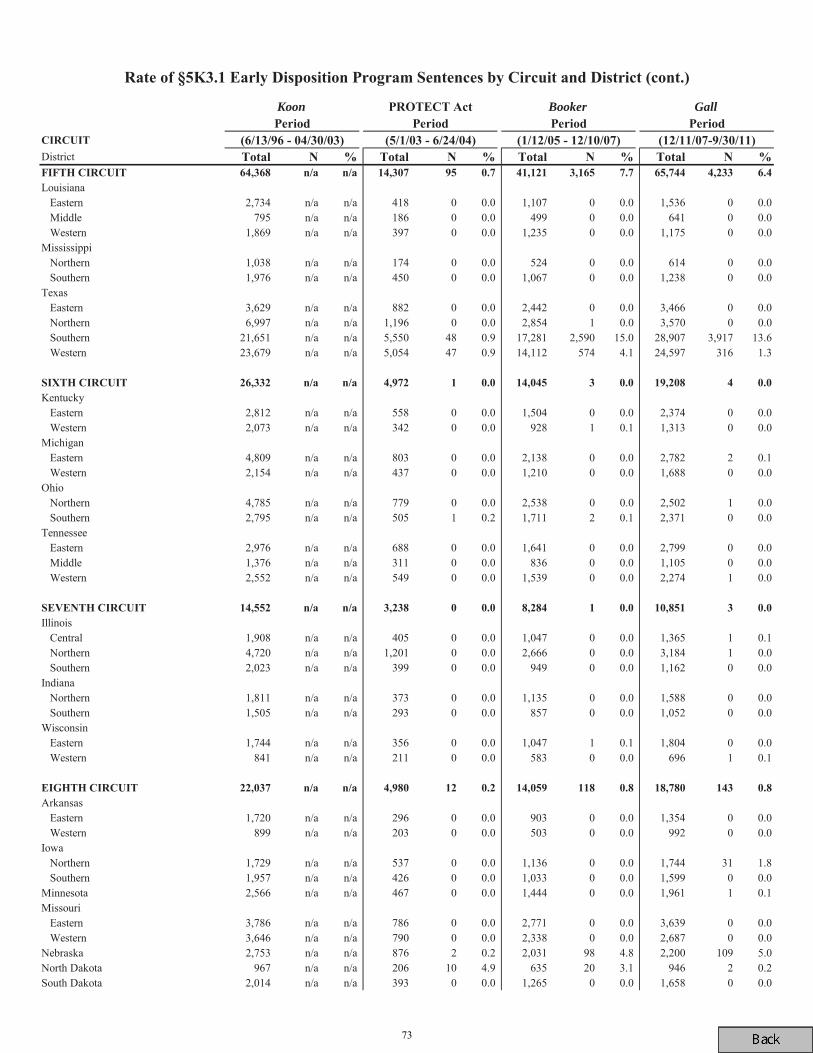
District
Louisiana Eastern 2,734 n/a n/a 418 0 0.0 1,107 0 0.0 1,536 0 0.0 Middle 795 n/a n/a 186 0 0.0 499 0 0.0 641 0 0.0 Western 1,869 n/a n/a 397 0 0.0 1,235 0 0.0 1,175 0 0.0Mississippi Northern 1,038 n/a n/a 174 0 0.0 524 0 0.0 614 0 0.0 Southern 1,976 n/a n/a 450 0 0.0 1,067 0 0.0 1,238 0 0.0Texas Eastern 3,629 n/a n/a 882 0 0.0 2,442 0 0.0 3,466 0 0.0 Northern 6,997 n/a n/a 1,196 0 0.0 2,854 1 0.0 3,570 0 0.0 Southern 21,651 n/a n/a 5,550 48 0.9 17,281 2,590 15.0 28,907 3,917 13.6 Western 23,679 n/a n/a 5,054 47 0.9 14,112 574 4.1 24,597 316 1.3
Kentucky Eastern 2,812 n/a n/a 558 0 0.0 1,504 0 0.0 2,374 0 0.0 Western 2,073 n/a n/a 342 0 0.0 928 1 0.1 1,313 0 0.0Michigan Eastern 4,809 n/a n/a 803 0 0.0 2,138 0 0.0 2,782 2 0.1 Western 2,154 n/a n/a 437 0 0.0 1,210 0 0.0 1,688 0 0.0Ohio Northern 4,785 n/a n/a 779 0 0.0 2,538 0 0.0 2,502 1 0.0 Southern 2,795 n/a n/a 505 1 0.2 1,711 2 0.1 2,371 0 0.0Tennessee Eastern 2,976 n/a n/a 688 0 0.0 1,641 0 0.0 2,799 0 0.0 Middle 1,376 n/a n/a 311 0 0.0 836 0 0.0 1,105 0 0.0 Western 2,552 n/a n/a 549 0 0.0 1,539 0 0.0 2,274 1 0.0
Illinois Central 1,908 n/a n/a 405 0 0.0 1,047 0 0.0 1,365 1 0.1 Northern 4,720 n/a n/a 1,201 0 0.0 2,666 0 0.0 3,184 1 0.0 Southern 2,023 n/a n/a 399 0 0.0 949 0 0.0 1,162 0 0.0Indiana Northern 1,811 n/a n/a 373 0 0.0 1,135 0 0.0 1,588 0 0.0 Southern 1,505 n/a n/a 293 0 0.0 857 0 0.0 1,052 0 0.0Wisconsin Eastern 1,744 n/a n/a 356 0 0.0 1,047 1 0.1 1,804 0 0.0 Western 841 n/a n/a 211 0 0.0 583 0 0.0 696 1 0.1
Arkansas Eastern 1,720 n/a n/a 296 0 0.0 903 0 0.0 1,354 0 0.0 Western 899 n/a n/a 203 0 0.0 503 0 0.0 992 0 0.0Iowa Northern 1,729 n/a n/a 537 0 0.0 1,136 0 0.0 1,744 31 1.8 Southern 1,957 n/a n/a 426 0 0.0 1,033 0 0.0 1,599 0 0.0Minnesota 2,566 n/a n/a 467 0 0.0 1,444 0 0.0 1,961 1 0.1Missouri Eastern 3,786 n/a n/a 786 0 0.0 2,771 0 0.0 3,639 0 0.0 Western 3,646 n/a n/a 790 0 0.0 2,338 0 0.0 2,687 0 0.0Nebraska 2,753 n/a n/a 876 2 0.2 2,031 98 4.8 2,200 109 5.0North Dakota 967 n/a n/a 206 10 4.9 635 20 3.1 946 2 0.2South Dakota 2,014 n/a n/a 393 0 0.0 1,265 0 0.0 1,658 0 0.0
Koon Booker Gall
73
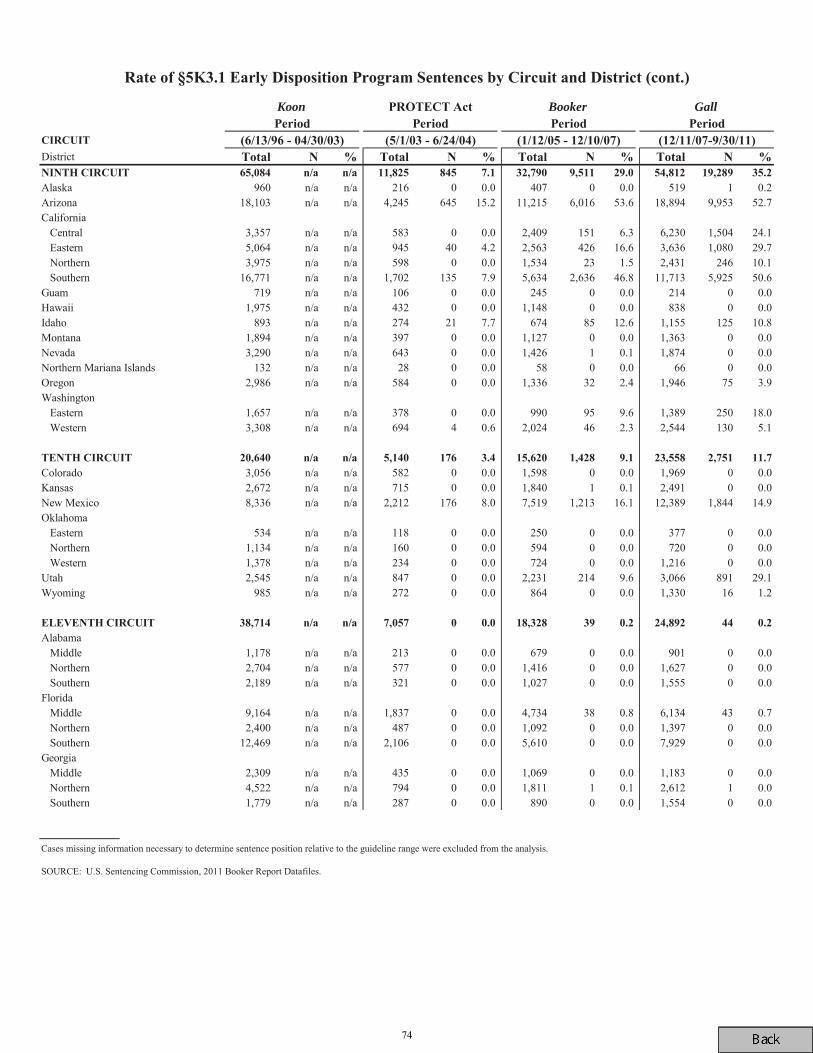
District
Alaska 960 n/a n/a 216 0 0.0 407 0 0.0 519 1 0.2Arizona 18,103 n/a n/a 4,245 645 15.2 11,215 6,016 53.6 18,894 9,953 52.7California Central 3,357 n/a n/a 583 0 0.0 2,409 151 6.3 6,230 1,504 24.1 Eastern 5,064 n/a n/a 945 40 4.2 2,563 426 16.6 3,636 1,080 29.7 Northern 3,975 n/a n/a 598 0 0.0 1,534 23 1.5 2,431 246 10.1 Southern 16,771 n/a n/a 1,702 135 7.9 5,634 2,636 46.8 11,713 5,925 50.6Guam 719 n/a n/a 106 0 0.0 245 0 0.0 214 0 0.0Hawaii 1,975 n/a n/a 432 0 0.0 1,148 0 0.0 838 0 0.0Idaho 893 n/a n/a 274 21 7.7 674 85 12.6 1,155 125 10.8Montana 1,894 n/a n/a 397 0 0.0 1,127 0 0.0 1,363 0 0.0Nevada 3,290 n/a n/a 643 0 0.0 1,426 1 0.1 1,874 0 0.0Northern Mariana Islands 132 n/a n/a 28 0 0.0 58 0 0.0 66 0 0.0Oregon 2,986 n/a n/a 584 0 0.0 1,336 32 2.4 1,946 75 3.9Washington Eastern 1,657 n/a n/a 378 0 0.0 990 95 9.6 1,389 250 18.0 Western 3,308 n/a n/a 694 4 0.6 2,024 46 2.3 2,544 130 5.1
Colorado 3,056 n/a n/a 582 0 0.0 1,598 0 0.0 1,969 0 0.0Kansas 2,672 n/a n/a 715 0 0.0 1,840 1 0.1 2,491 0 0.0New Mexico 8,336 n/a n/a 2,212 176 8.0 7,519 1,213 16.1 12,389 1,844 14.9Oklahoma Eastern 534 n/a n/a 118 0 0.0 250 0 0.0 377 0 0.0 Northern 1,134 n/a n/a 160 0 0.0 594 0 0.0 720 0 0.0 Western 1,378 n/a n/a 234 0 0.0 724 0 0.0 1,216 0 0.0Utah 2,545 n/a n/a 847 0 0.0 2,231 214 9.6 3,066 891 29.1Wyoming 985 n/a n/a 272 0 0.0 864 0 0.0 1,330 16 1.2
Alabama Middle 1,178 n/a n/a 213 0 0.0 679 0 0.0 901 0 0.0 Northern 2,704 n/a n/a 577 0 0.0 1,416 0 0.0 1,627 0 0.0 Southern 2,189 n/a n/a 321 0 0.0 1,027 0 0.0 1,555 0 0.0Florida Middle 9,164 n/a n/a 1,837 0 0.0 4,734 38 0.8 6,134 43 0.7 Northern 2,400 n/a n/a 487 0 0.0 1,092 0 0.0 1,397 0 0.0 Southern 12,469 n/a n/a 2,106 0 0.0 5,610 0 0.0 7,929 0 0.0Georgia Middle 2,309 n/a n/a 435 0 0.0 1,069 0 0.0 1,183 0 0.0 Northern 4,522 n/a n/a 794 0 0.0 1,811 1 0.1 2,612 1 0.0 Southern 1,779 n/a n/a 287 0 0.0 890 0 0.0 1,554 0 0.0
Cases missing information necessary to determine sentence position relative to the guideline range were excluded from the analysis.
SOURCE: U.S. Sentencing Commission, 2011 Booker Report Datafiles.
Koon Booker Gall
74
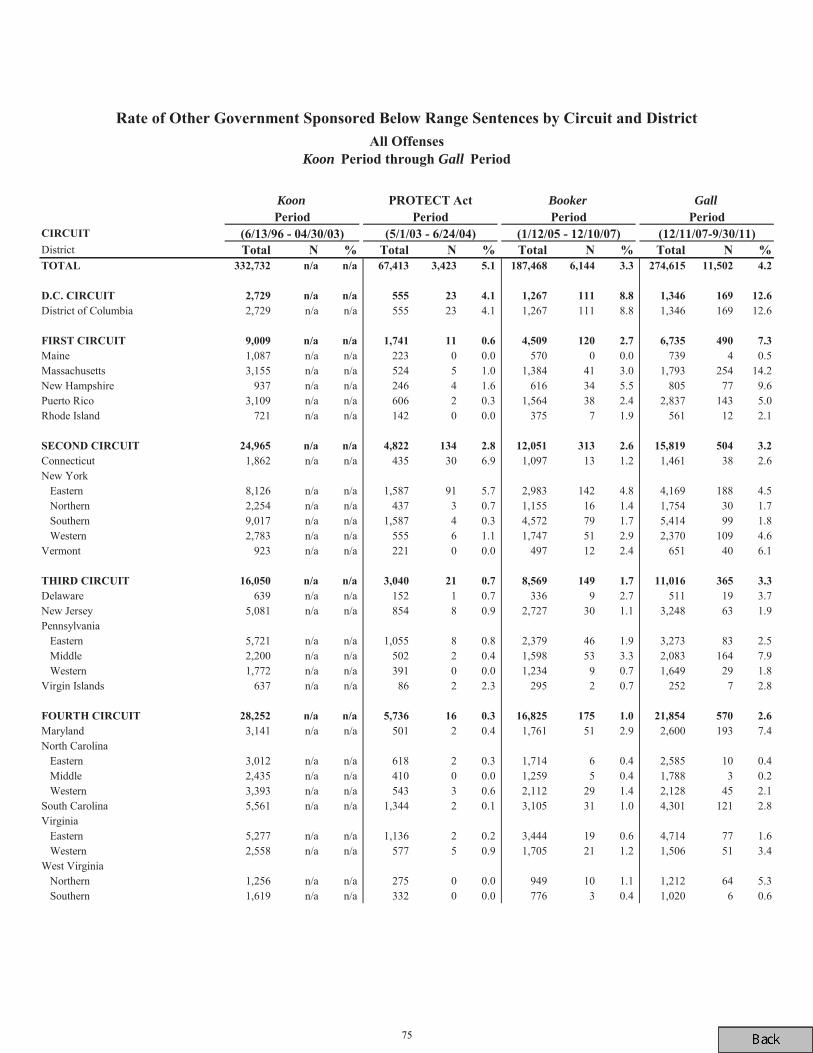
District
District of Columbia 2,729 n/a n/a 555 23 4.1 1,267 111 8.8 1,346 169 12.6
Maine 1,087 n/a n/a 223 0 0.0 570 0 0.0 739 4 0.5Massachusetts 3,155 n/a n/a 524 5 1.0 1,384 41 3.0 1,793 254 14.2New Hampshire 937 n/a n/a 246 4 1.6 616 34 5.5 805 77 9.6Puerto Rico 3,109 n/a n/a 606 2 0.3 1,564 38 2.4 2,837 143 5.0Rhode Island 721 n/a n/a 142 0 0.0 375 7 1.9 561 12 2.1
Connecticut 1,862 n/a n/a 435 30 6.9 1,097 13 1.2 1,461 38 2.6New York Eastern 8,126 n/a n/a 1,587 91 5.7 2,983 142 4.8 4,169 188 4.5 Northern 2,254 n/a n/a 437 3 0.7 1,155 16 1.4 1,754 30 1.7 Southern 9,017 n/a n/a 1,587 4 0.3 4,572 79 1.7 5,414 99 1.8 Western 2,783 n/a n/a 555 6 1.1 1,747 51 2.9 2,370 109 4.6Vermont 923 n/a n/a 221 0 0.0 497 12 2.4 651 40 6.1
Delaware 639 n/a n/a 152 1 0.7 336 9 2.7 511 19 3.7New Jersey 5,081 n/a n/a 854 8 0.9 2,727 30 1.1 3,248 63 1.9Pennsylvania Eastern 5,721 n/a n/a 1,055 8 0.8 2,379 46 1.9 3,273 83 2.5 Middle 2,200 n/a n/a 502 2 0.4 1,598 53 3.3 2,083 164 7.9 Western 1,772 n/a n/a 391 0 0.0 1,234 9 0.7 1,649 29 1.8Virgin Islands 637 n/a n/a 86 2 2.3 295 2 0.7 252 7 2.8
Maryland 3,141 n/a n/a 501 2 0.4 1,761 51 2.9 2,600 193 7.4North Carolina Eastern 3,012 n/a n/a 618 2 0.3 1,714 6 0.4 2,585 10 0.4 Middle 2,435 n/a n/a 410 0 0.0 1,259 5 0.4 1,788 3 0.2 Western 3,393 n/a n/a 543 3 0.6 2,112 29 1.4 2,128 45 2.1South Carolina 5,561 n/a n/a 1,344 2 0.1 3,105 31 1.0 4,301 121 2.8Virginia Eastern 5,277 n/a n/a 1,136 2 0.2 3,444 19 0.6 4,714 77 1.6 Western 2,558 n/a n/a 577 5 0.9 1,705 21 1.2 1,506 51 3.4West Virginia Northern 1,256 n/a n/a 275 0 0.0 949 10 1.1 1,212 64 5.3 Southern 1,619 n/a n/a 332 0 0.0 776 3 0.4 1,020 6 0.6
Koon Gall
Koon Booker Gall
75
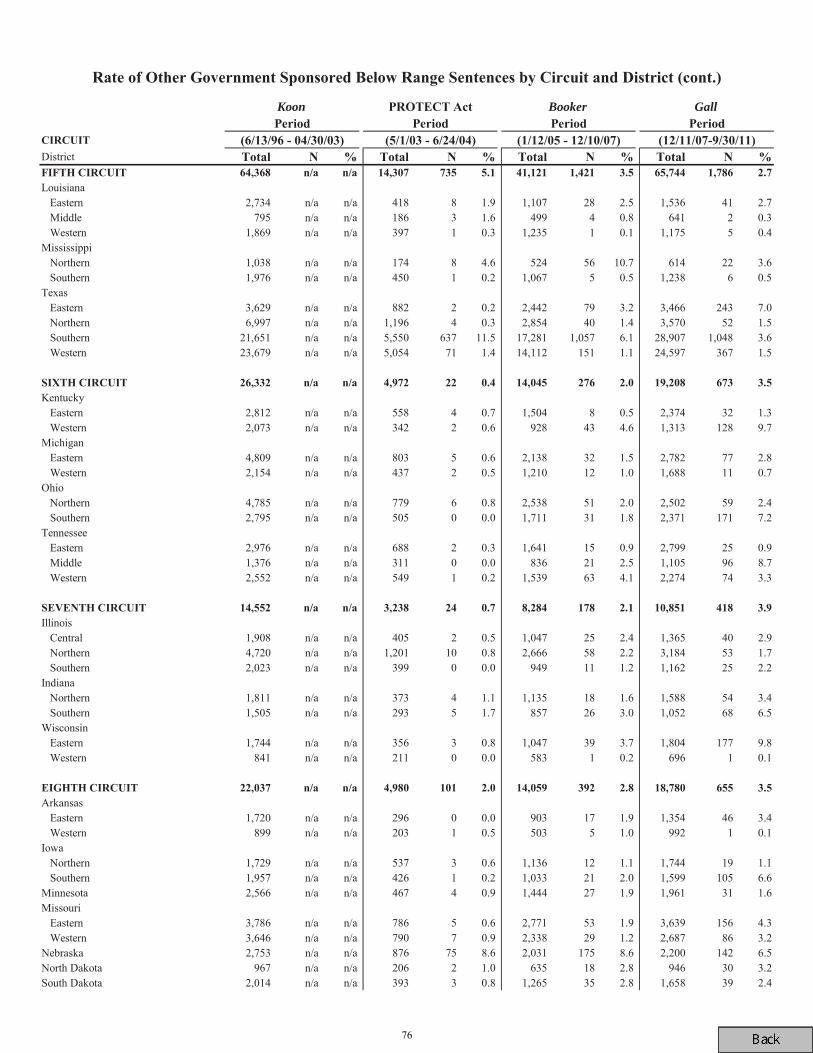
District
Louisiana Eastern 2,734 n/a n/a 418 8 1.9 1,107 28 2.5 1,536 41 2.7 Middle 795 n/a n/a 186 3 1.6 499 4 0.8 641 2 0.3 Western 1,869 n/a n/a 397 1 0.3 1,235 1 0.1 1,175 5 0.4Mississippi Northern 1,038 n/a n/a 174 8 4.6 524 56 10.7 614 22 3.6 Southern 1,976 n/a n/a 450 1 0.2 1,067 5 0.5 1,238 6 0.5Texas Eastern 3,629 n/a n/a 882 2 0.2 2,442 79 3.2 3,466 243 7.0 Northern 6,997 n/a n/a 1,196 4 0.3 2,854 40 1.4 3,570 52 1.5 Southern 21,651 n/a n/a 5,550 637 11.5 17,281 1,057 6.1 28,907 1,048 3.6 Western 23,679 n/a n/a 5,054 71 1.4 14,112 151 1.1 24,597 367 1.5
Kentucky Eastern 2,812 n/a n/a 558 4 0.7 1,504 8 0.5 2,374 32 1.3 Western 2,073 n/a n/a 342 2 0.6 928 43 4.6 1,313 128 9.7Michigan Eastern 4,809 n/a n/a 803 5 0.6 2,138 32 1.5 2,782 77 2.8 Western 2,154 n/a n/a 437 2 0.5 1,210 12 1.0 1,688 11 0.7Ohio Northern 4,785 n/a n/a 779 6 0.8 2,538 51 2.0 2,502 59 2.4 Southern 2,795 n/a n/a 505 0 0.0 1,711 31 1.8 2,371 171 7.2Tennessee Eastern 2,976 n/a n/a 688 2 0.3 1,641 15 0.9 2,799 25 0.9 Middle 1,376 n/a n/a 311 0 0.0 836 21 2.5 1,105 96 8.7 Western 2,552 n/a n/a 549 1 0.2 1,539 63 4.1 2,274 74 3.3
Illinois Central 1,908 n/a n/a 405 2 0.5 1,047 25 2.4 1,365 40 2.9 Northern 4,720 n/a n/a 1,201 10 0.8 2,666 58 2.2 3,184 53 1.7 Southern 2,023 n/a n/a 399 0 0.0 949 11 1.2 1,162 25 2.2Indiana Northern 1,811 n/a n/a 373 4 1.1 1,135 18 1.6 1,588 54 3.4 Southern 1,505 n/a n/a 293 5 1.7 857 26 3.0 1,052 68 6.5Wisconsin Eastern 1,744 n/a n/a 356 3 0.8 1,047 39 3.7 1,804 177 9.8 Western 841 n/a n/a 211 0 0.0 583 1 0.2 696 1 0.1
Arkansas Eastern 1,720 n/a n/a 296 0 0.0 903 17 1.9 1,354 46 3.4 Western 899 n/a n/a 203 1 0.5 503 5 1.0 992 1 0.1Iowa Northern 1,729 n/a n/a 537 3 0.6 1,136 12 1.1 1,744 19 1.1 Southern 1,957 n/a n/a 426 1 0.2 1,033 21 2.0 1,599 105 6.6Minnesota 2,566 n/a n/a 467 4 0.9 1,444 27 1.9 1,961 31 1.6Missouri Eastern 3,786 n/a n/a 786 5 0.6 2,771 53 1.9 3,639 156 4.3 Western 3,646 n/a n/a 790 7 0.9 2,338 29 1.2 2,687 86 3.2Nebraska 2,753 n/a n/a 876 75 8.6 2,031 175 8.6 2,200 142 6.5North Dakota 967 n/a n/a 206 2 1.0 635 18 2.8 946 30 3.2South Dakota 2,014 n/a n/a 393 3 0.8 1,265 35 2.8 1,658 39 2.4
Koon Booker Gall
76
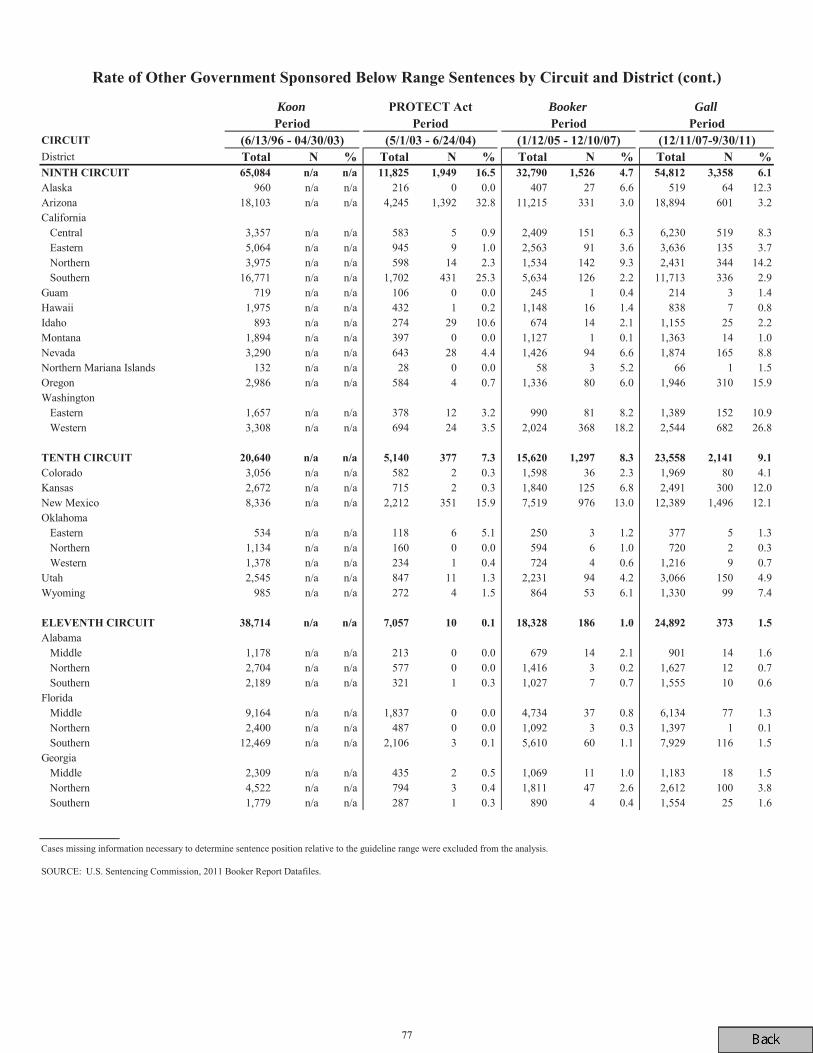
District
Alaska 960 n/a n/a 216 0 0.0 407 27 6.6 519 64 12.3Arizona 18,103 n/a n/a 4,245 1,392 32.8 11,215 331 3.0 18,894 601 3.2California Central 3,357 n/a n/a 583 5 0.9 2,409 151 6.3 6,230 519 8.3 Eastern 5,064 n/a n/a 945 9 1.0 2,563 91 3.6 3,636 135 3.7 Northern 3,975 n/a n/a 598 14 2.3 1,534 142 9.3 2,431 344 14.2 Southern 16,771 n/a n/a 1,702 431 25.3 5,634 126 2.2 11,713 336 2.9Guam 719 n/a n/a 106 0 0.0 245 1 0.4 214 3 1.4Hawaii 1,975 n/a n/a 432 1 0.2 1,148 16 1.4 838 7 0.8Idaho 893 n/a n/a 274 29 10.6 674 14 2.1 1,155 25 2.2Montana 1,894 n/a n/a 397 0 0.0 1,127 1 0.1 1,363 14 1.0Nevada 3,290 n/a n/a 643 28 4.4 1,426 94 6.6 1,874 165 8.8Northern Mariana Islands 132 n/a n/a 28 0 0.0 58 3 5.2 66 1 1.5Oregon 2,986 n/a n/a 584 4 0.7 1,336 80 6.0 1,946 310 15.9Washington Eastern 1,657 n/a n/a 378 12 3.2 990 81 8.2 1,389 152 10.9 Western 3,308 n/a n/a 694 24 3.5 2,024 368 18.2 2,544 682 26.8
Colorado 3,056 n/a n/a 582 2 0.3 1,598 36 2.3 1,969 80 4.1Kansas 2,672 n/a n/a 715 2 0.3 1,840 125 6.8 2,491 300 12.0New Mexico 8,336 n/a n/a 2,212 351 15.9 7,519 976 13.0 12,389 1,496 12.1Oklahoma Eastern 534 n/a n/a 118 6 5.1 250 3 1.2 377 5 1.3 Northern 1,134 n/a n/a 160 0 0.0 594 6 1.0 720 2 0.3 Western 1,378 n/a n/a 234 1 0.4 724 4 0.6 1,216 9 0.7Utah 2,545 n/a n/a 847 11 1.3 2,231 94 4.2 3,066 150 4.9Wyoming 985 n/a n/a 272 4 1.5 864 53 6.1 1,330 99 7.4
Alabama Middle 1,178 n/a n/a 213 0 0.0 679 14 2.1 901 14 1.6 Northern 2,704 n/a n/a 577 0 0.0 1,416 3 0.2 1,627 12 0.7 Southern 2,189 n/a n/a 321 1 0.3 1,027 7 0.7 1,555 10 0.6Florida Middle 9,164 n/a n/a 1,837 0 0.0 4,734 37 0.8 6,134 77 1.3 Northern 2,400 n/a n/a 487 0 0.0 1,092 3 0.3 1,397 1 0.1 Southern 12,469 n/a n/a 2,106 3 0.1 5,610 60 1.1 7,929 116 1.5Georgia Middle 2,309 n/a n/a 435 2 0.5 1,069 11 1.0 1,183 18 1.5 Northern 4,522 n/a n/a 794 3 0.4 1,811 47 2.6 2,612 100 3.8 Southern 1,779 n/a n/a 287 1 0.3 890 4 0.4 1,554 25 1.6
Cases missing information necessary to determine sentence position relative to the guideline range were excluded from the analysis.
SOURCE: U.S. Sentencing Commission, 2011 Booker Report Datafiles.
Koon Booker Gall
77
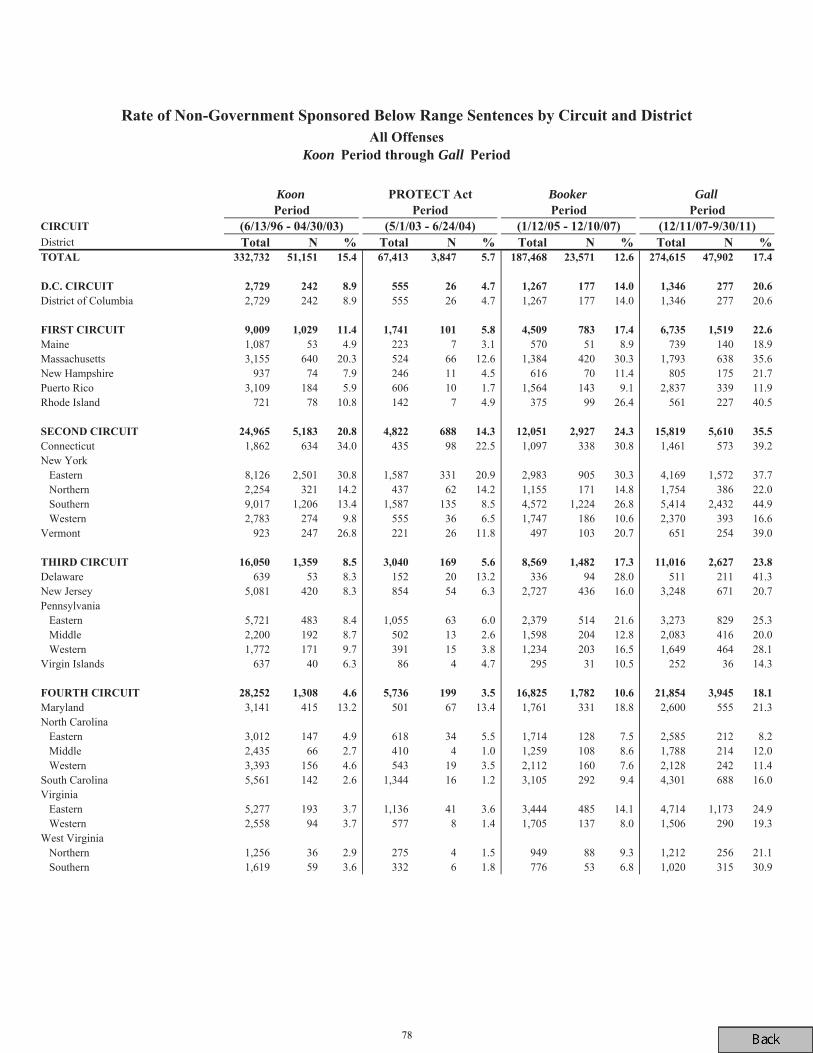
Koon Gall
Koon Booker Gall
78
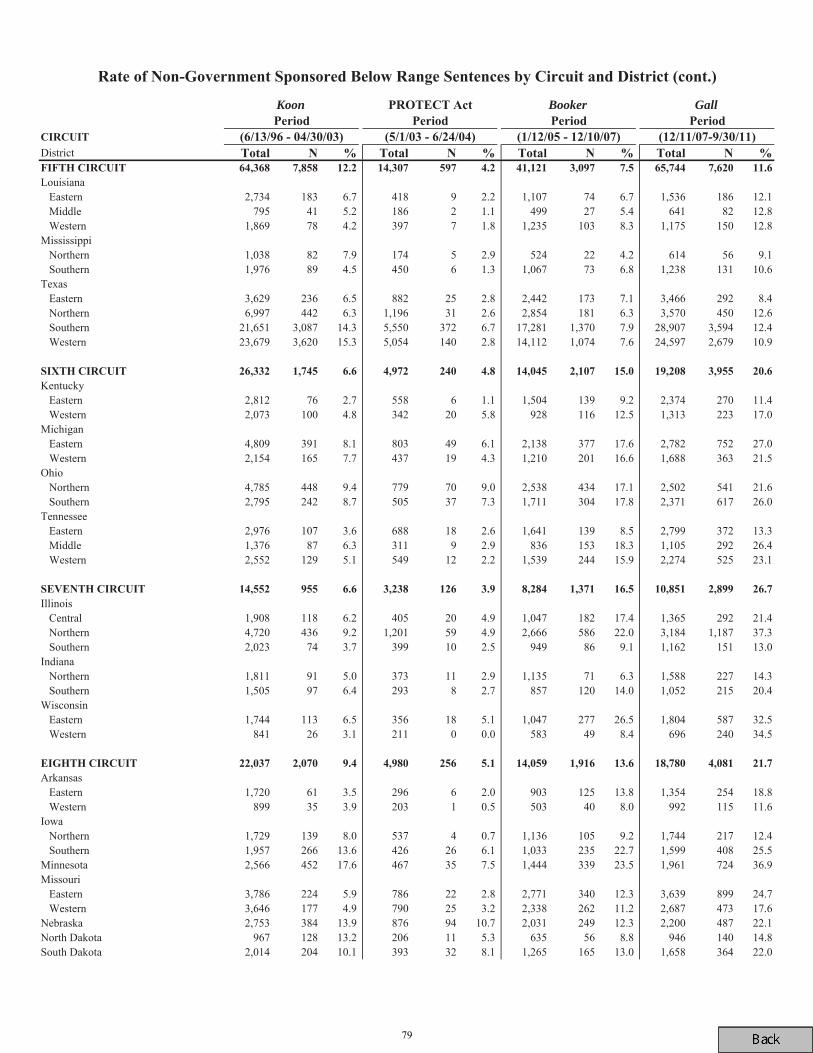
Koon Booker Gall
79
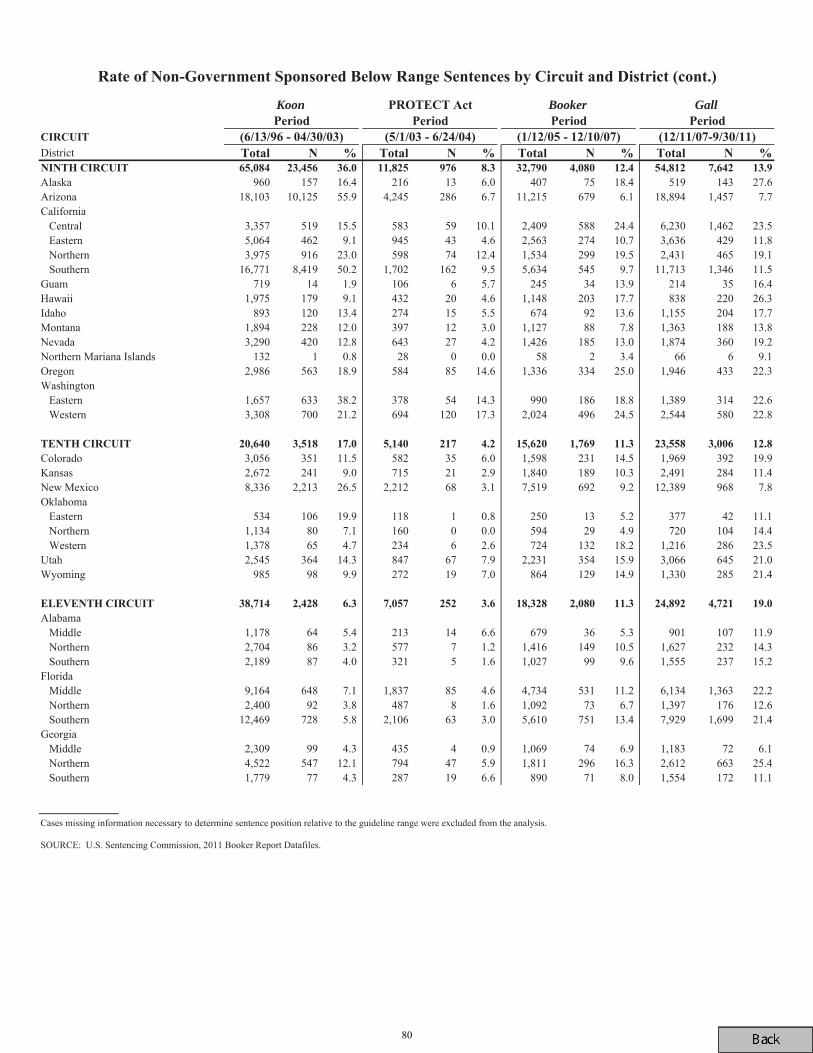
Koon Booker Gall
80
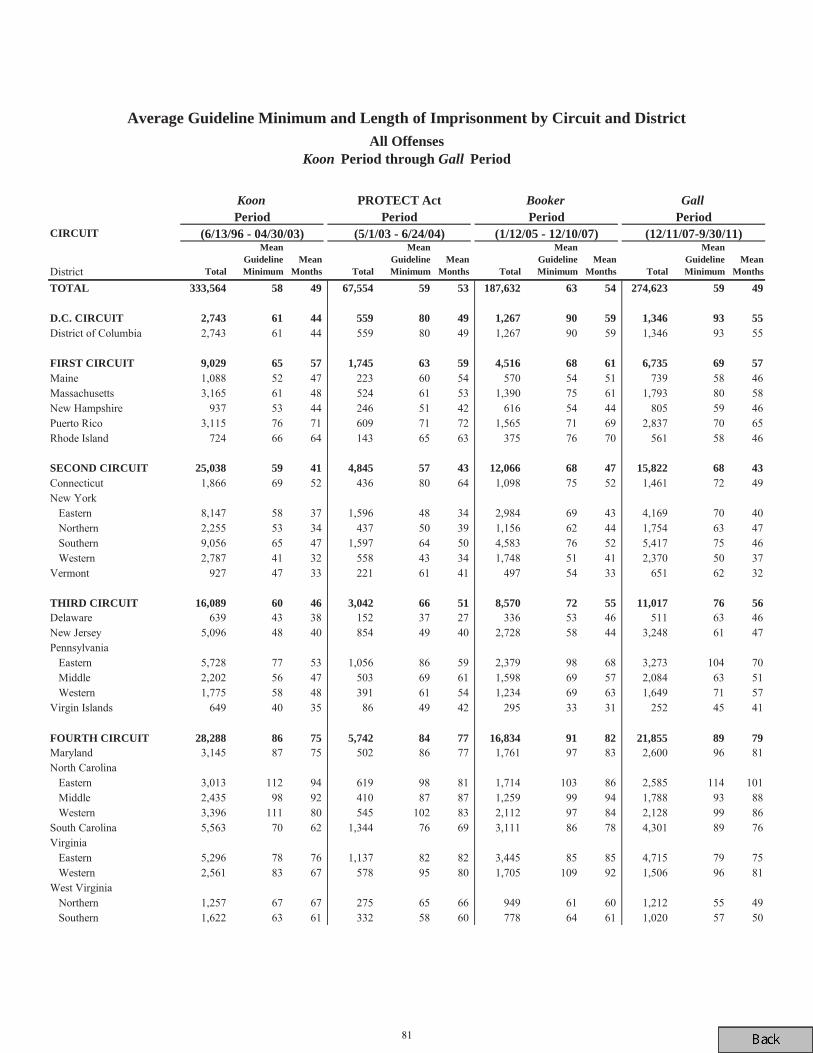
CIRCUIT
District Total
Mean Guideline Minimum
Mean Months Total
Mean Guideline Minimum
Mean Months Total
Mean Guideline Minimum
Mean Months Total
Mean Guideline Minimum
Mean Months
TOTAL 333,564 58 49 67,554 59 53 187,632 63 54 274,623 59 49
D.C. CIRCUIT 2,743 61 44 559 80 49 1,267 90 59 1,346 93 55District of Columbia 2,743 61 44 559 80 49 1,267 90 59 1,346 93 55
FIRST CIRCUIT 9,029 65 57 1,745 63 59 4,516 68 61 6,735 69 57Maine 1,088 52 47 223 60 54 570 54 51 739 58 46Massachusetts 3,165 61 48 524 61 53 1,390 75 61 1,793 80 58New Hampshire 937 53 44 246 51 42 616 54 44 805 59 46Puerto Rico 3,115 76 71 609 71 72 1,565 71 69 2,837 70 65Rhode Island 724 66 64 143 65 63 375 76 70 561 58 46
SECOND CIRCUIT 25,038 59 41 4,845 57 43 12,066 68 47 15,822 68 43Connecticut 1,866 69 52 436 80 64 1,098 75 52 1,461 72 49New York Eastern 8,147 58 37 1,596 48 34 2,984 69 43 4,169 70 40 Northern 2,255 53 34 437 50 39 1,156 62 44 1,754 63 47 Southern 9,056 65 47 1,597 64 50 4,583 76 52 5,417 75 46 Western 2,787 41 32 558 43 34 1,748 51 41 2,370 50 37Vermont 927 47 33 221 61 41 497 54 33 651 62 32
THIRD CIRCUIT 16,089 60 46 3,042 66 51 8,570 72 55 11,017 76 56Delaware 639 43 38 152 37 27 336 53 46 511 63 46New Jersey 5,096 48 40 854 49 40 2,728 58 44 3,248 61 47Pennsylvania Eastern 5,728 77 53 1,056 86 59 2,379 98 68 3,273 104 70 Middle 2,202 56 47 503 69 61 1,598 69 57 2,084 63 51 Western 1,775 58 48 391 61 54 1,234 69 63 1,649 71 57Virgin Islands 649 40 35 86 49 42 295 33 31 252 45 41
FOURTH CIRCUIT 28,288 86 75 5,742 84 77 16,834 91 82 21,855 89 79Maryland 3,145 87 75 502 86 77 1,761 97 83 2,600 96 81North Carolina Eastern 3,013 112 94 619 98 81 1,714 103 86 2,585 114 101 Middle 2,435 98 92 410 87 87 1,259 99 94 1,788 93 88 Western 3,396 111 80 545 102 83 2,112 97 84 2,128 99 86South Carolina 5,563 70 62 1,344 76 69 3,111 86 78 4,301 89 76Virginia Eastern 5,296 78 76 1,137 82 82 3,445 85 85 4,715 79 75 Western 2,561 83 67 578 95 80 1,705 109 92 1,506 96 81West Virginia Northern 1,257 67 67 275 65 66 949 61 60 1,212 55 49 Southern 1,622 63 61 332 58 60 778 64 61 1,020 57 50
(6/13/96 - 04/30/03) (5/1/03 - 6/24/04) (1/12/05 - 12/10/07) (12/11/07-9/30/11)Period Period Period
Average Guideline Minimum and Length of Imprisonment by Circuit and DistrictAll Offenses
Koon Period through Gall Period
Koon PROTECT Act GallBookerPeriod
81
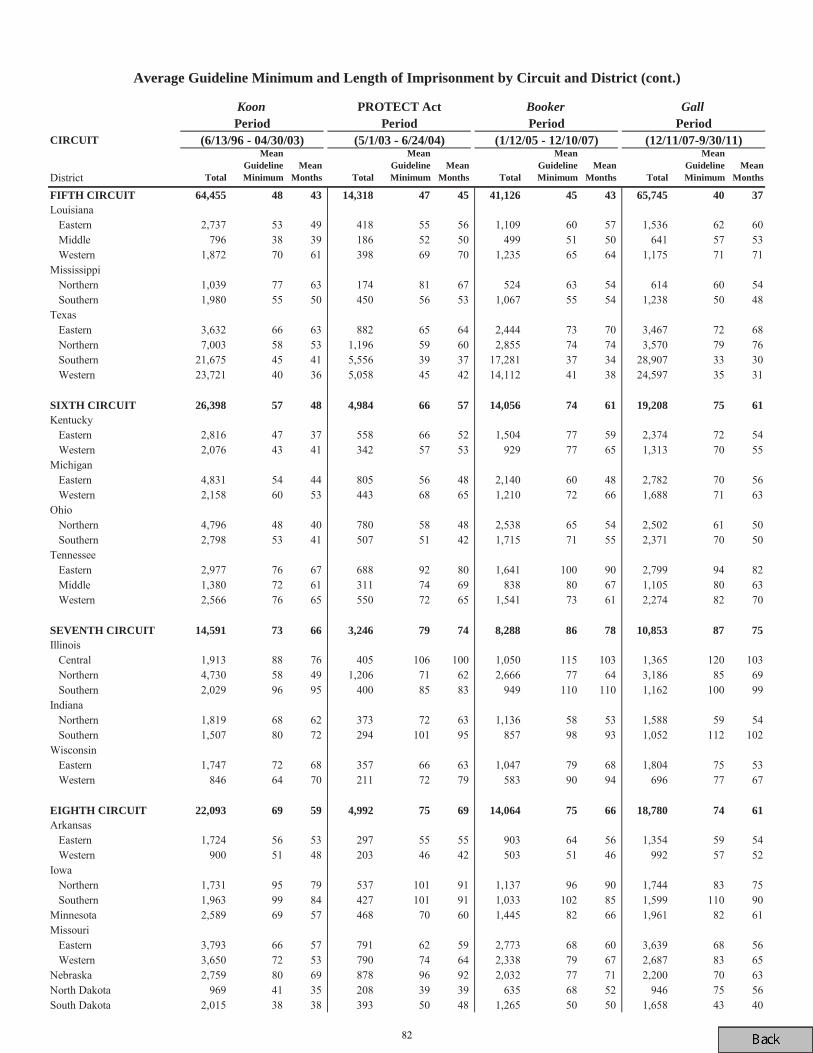
CIRCUIT
District Total
Mean Guideline Minimum
Mean Months Total
Mean Guideline Minimum
Mean Months Total
Mean Guideline Minimum
Mean Months Total
Mean Guideline Minimum
Mean Months
FIFTH CIRCUIT 64,455 48 43 14,318 47 45 41,126 45 43 65,745 40 37Louisiana Eastern 2,737 53 49 418 55 56 1,109 60 57 1,536 62 60 Middle 796 38 39 186 52 50 499 51 50 641 57 53 Western 1,872 70 61 398 69 70 1,235 65 64 1,175 71 71Mississippi Northern 1,039 77 63 174 81 67 524 63 54 614 60 54 Southern 1,980 55 50 450 56 53 1,067 55 54 1,238 50 48Texas Eastern 3,632 66 63 882 65 64 2,444 73 70 3,467 72 68 Northern 7,003 58 53 1,196 59 60 2,855 74 74 3,570 79 76 Southern 21,675 45 41 5,556 39 37 17,281 37 34 28,907 33 30 Western 23,721 40 36 5,058 45 42 14,112 41 38 24,597 35 31
SIXTH CIRCUIT 26,398 57 48 4,984 66 57 14,056 74 61 19,208 75 61Kentucky Eastern 2,816 47 37 558 66 52 1,504 77 59 2,374 72 54 Western 2,076 43 41 342 57 53 929 77 65 1,313 70 55Michigan Eastern 4,831 54 44 805 56 48 2,140 60 48 2,782 70 56 Western 2,158 60 53 443 68 65 1,210 72 66 1,688 71 63Ohio Northern 4,796 48 40 780 58 48 2,538 65 54 2,502 61 50 Southern 2,798 53 41 507 51 42 1,715 71 55 2,371 70 50Tennessee Eastern 2,977 76 67 688 92 80 1,641 100 90 2,799 94 82 Middle 1,380 72 61 311 74 69 838 80 67 1,105 80 63 Western 2,566 76 65 550 72 65 1,541 73 61 2,274 82 70
SEVENTH CIRCUIT 14,591 73 66 3,246 79 74 8,288 86 78 10,853 87 75Illinois Central 1,913 88 76 405 106 100 1,050 115 103 1,365 120 103 Northern 4,730 58 49 1,206 71 62 2,666 77 64 3,186 85 69 Southern 2,029 96 95 400 85 83 949 110 110 1,162 100 99Indiana Northern 1,819 68 62 373 72 63 1,136 58 53 1,588 59 54 Southern 1,507 80 72 294 101 95 857 98 93 1,052 112 102Wisconsin Eastern 1,747 72 68 357 66 63 1,047 79 68 1,804 75 53 Western 846 64 70 211 72 79 583 90 94 696 77 67
EIGHTH CIRCUIT 22,093 69 59 4,992 75 69 14,064 75 66 18,780 74 61Arkansas Eastern 1,724 56 53 297 55 55 903 64 56 1,354 59 54 Western 900 51 48 203 46 42 503 51 46 992 57 52Iowa Northern 1,731 95 79 537 101 91 1,137 96 90 1,744 83 75 Southern 1,963 99 84 427 101 91 1,033 102 85 1,599 110 90Minnesota 2,589 69 57 468 70 60 1,445 82 66 1,961 82 61Missouri Eastern 3,793 66 57 791 62 59 2,773 68 60 3,639 68 56 Western 3,650 72 53 790 74 64 2,338 79 67 2,687 83 65Nebraska 2,759 80 69 878 96 92 2,032 77 71 2,200 70 63North Dakota 969 41 35 208 39 39 635 68 52 946 75 56South Dakota 2,015 38 38 393 50 48 1,265 50 50 1,658 43 40
BookerPeriod
(1/12/05 - 12/10/07)
Average Guideline Minimum and Length of Imprisonment by Circuit and District (cont.)
Koon PROTECT Act GallPeriod Period Period
(5/1/03 - 6/24/04) (12/11/07-9/30/11)(6/13/96 - 04/30/03)
82
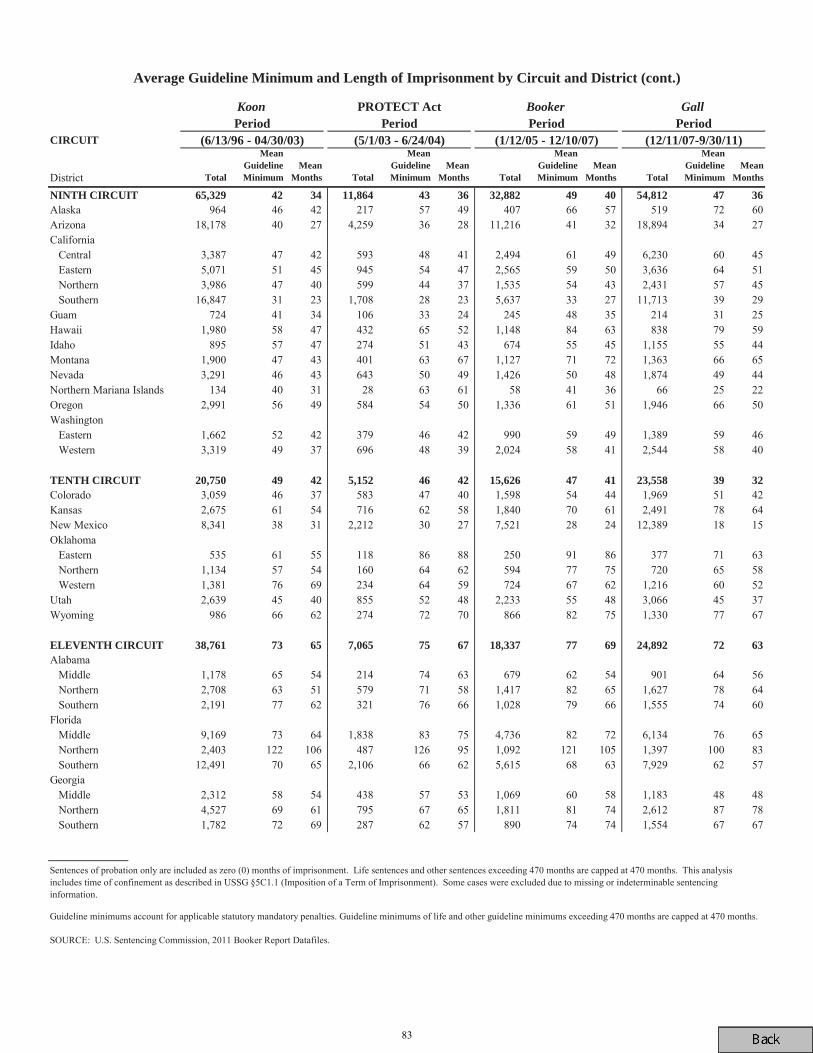
CIRCUIT
District Total
Mean Guideline Minimum
Mean Months Total
Mean Guideline Minimum
Mean Months Total
Mean Guideline Minimum
Mean Months Total
Mean Guideline Minimum
Mean Months
NINTH CIRCUIT 65,329 42 34 11,864 43 36 32,882 49 40 54,812 47 36Alaska 964 46 42 217 57 49 407 66 57 519 72 60Arizona 18,178 40 27 4,259 36 28 11,216 41 32 18,894 34 27California Central 3,387 47 42 593 48 41 2,494 61 49 6,230 60 45 Eastern 5,071 51 45 945 54 47 2,565 59 50 3,636 64 51 Northern 3,986 47 40 599 44 37 1,535 54 43 2,431 57 45 Southern 16,847 31 23 1,708 28 23 5,637 33 27 11,713 39 29Guam 724 41 34 106 33 24 245 48 35 214 31 25Hawaii 1,980 58 47 432 65 52 1,148 84 63 838 79 59Idaho 895 57 47 274 51 43 674 55 45 1,155 55 44Montana 1,900 47 43 401 63 67 1,127 71 72 1,363 66 65Nevada 3,291 46 43 643 50 49 1,426 50 48 1,874 49 44Northern Mariana Islands 134 40 31 28 63 61 58 41 36 66 25 22Oregon 2,991 56 49 584 54 50 1,336 61 51 1,946 66 50Washington Eastern 1,662 52 42 379 46 42 990 59 49 1,389 59 46 Western 3,319 49 37 696 48 39 2,024 58 41 2,544 58 40
TENTH CIRCUIT 20,750 49 42 5,152 46 42 15,626 47 41 23,558 39 32Colorado 3,059 46 37 583 47 40 1,598 54 44 1,969 51 42Kansas 2,675 61 54 716 62 58 1,840 70 61 2,491 78 64New Mexico 8,341 38 31 2,212 30 27 7,521 28 24 12,389 18 15Oklahoma Eastern 535 61 55 118 86 88 250 91 86 377 71 63 Northern 1,134 57 54 160 64 62 594 77 75 720 65 58 Western 1,381 76 69 234 64 59 724 67 62 1,216 60 52Utah 2,639 45 40 855 52 48 2,233 55 48 3,066 45 37Wyoming 986 66 62 274 72 70 866 82 75 1,330 77 67
ELEVENTH CIRCUIT 38,761 73 65 7,065 75 67 18,337 77 69 24,892 72 63Alabama Middle 1,178 65 54 214 74 63 679 62 54 901 64 56 Northern 2,708 63 51 579 71 58 1,417 82 65 1,627 78 64 Southern 2,191 77 62 321 76 66 1,028 79 66 1,555 74 60Florida Middle 9,169 73 64 1,838 83 75 4,736 82 72 6,134 76 65 Northern 2,403 122 106 487 126 95 1,092 121 105 1,397 100 83 Southern 12,491 70 65 2,106 66 62 5,615 68 63 7,929 62 57Georgia Middle 2,312 58 54 438 57 53 1,069 60 58 1,183 48 48 Northern 4,527 69 61 795 67 65 1,811 81 74 2,612 87 78 Southern 1,782 72 69 287 62 57 890 74 74 1,554 67 67
Guideline minimums account for applicable statutory mandatory penalties. Guideline minimums of life and other guideline minimums exceeding 470 months are capped at 470 months.
SOURCE: U.S. Sentencing Commission, 2011 Booker Report Datafiles.
(6/13/96 - 04/30/03) (5/1/03 - 6/24/04) (12/11/07-9/30/11)Period Period
Sentences of probation only are included as zero (0) months of imprisonment. Life sentences and other sentences exceeding 470 months are capped at 470 months. This analysis includes time of confinement as described in USSG §5C1.1 (Imposition of a Term of Imprisonment). Some cases were excluded due to missing or indeterminable sentencing information.
PeriodKoon PROTECT Act Gall
Average Guideline Minimum and Length of Imprisonment by Circuit and District (cont.)
BookerPeriod
(1/12/05 - 12/10/07)
83
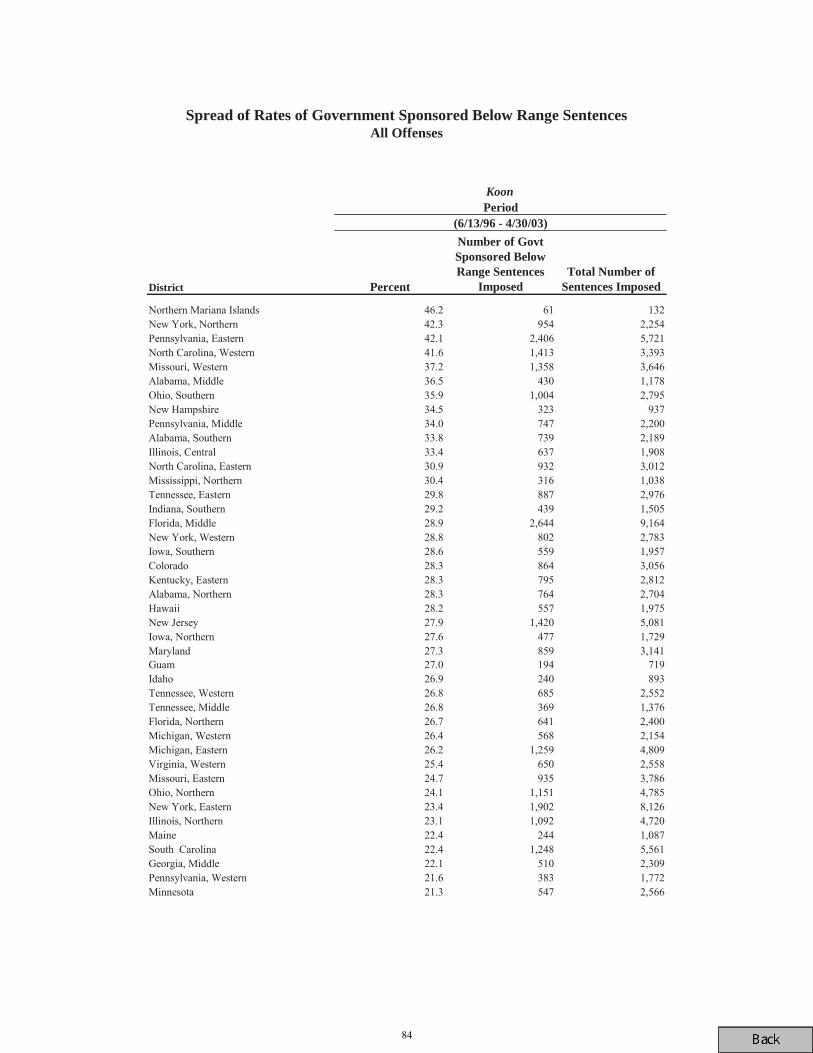
District Percent
Number of Govt Sponsored Below Range Sentences
ImposedTotal Number of
Sentences Imposed
Northern Mariana Islands 46.2 61 132New York, Northern 42.3 954 2,254Pennsylvania, Eastern 42.1 2,406 5,721North Carolina, Western 41.6 1,413 3,393Missouri, Western 37.2 1,358 3,646Alabama, Middle 36.5 430 1,178Ohio, Southern 35.9 1,004 2,795New Hampshire 34.5 323 937Pennsylvania, Middle 34.0 747 2,200Alabama, Southern 33.8 739 2,189Illinois, Central 33.4 637 1,908North Carolina, Eastern 30.9 932 3,012Mississippi, Northern 30.4 316 1,038Tennessee, Eastern 29.8 887 2,976Indiana, Southern 29.2 439 1,505Florida, Middle 28.9 2,644 9,164New York, Western 28.8 802 2,783Iowa, Southern 28.6 559 1,957Colorado 28.3 864 3,056Kentucky, Eastern 28.3 795 2,812Alabama, Northern 28.3 764 2,704Hawaii 28.2 557 1,975New Jersey 27.9 1,420 5,081Iowa, Northern 27.6 477 1,729Maryland 27.3 859 3,141Guam 27.0 194 719Idaho 26.9 240 893Tennessee, Western 26.8 685 2,552Tennessee, Middle 26.8 369 1,376Florida, Northern 26.7 641 2,400Michigan, Western 26.4 568 2,154Michigan, Eastern 26.2 1,259 4,809Virginia, Western 25.4 650 2,558Missouri, Eastern 24.7 935 3,786Ohio, Northern 24.1 1,151 4,785New York, Eastern 23.4 1,902 8,126Illinois, Northern 23.1 1,092 4,720Maine 22.4 244 1,087South Carolina 22.4 1,248 5,561Georgia, Middle 22.1 510 2,309Pennsylvania, Western 21.6 383 1,772Minnesota 21.3 547 2,566
Spread of Rates of Government Sponsored Below Range SentencesAll Offenses
KoonPeriod
(6/13/96 - 4/30/03)
84
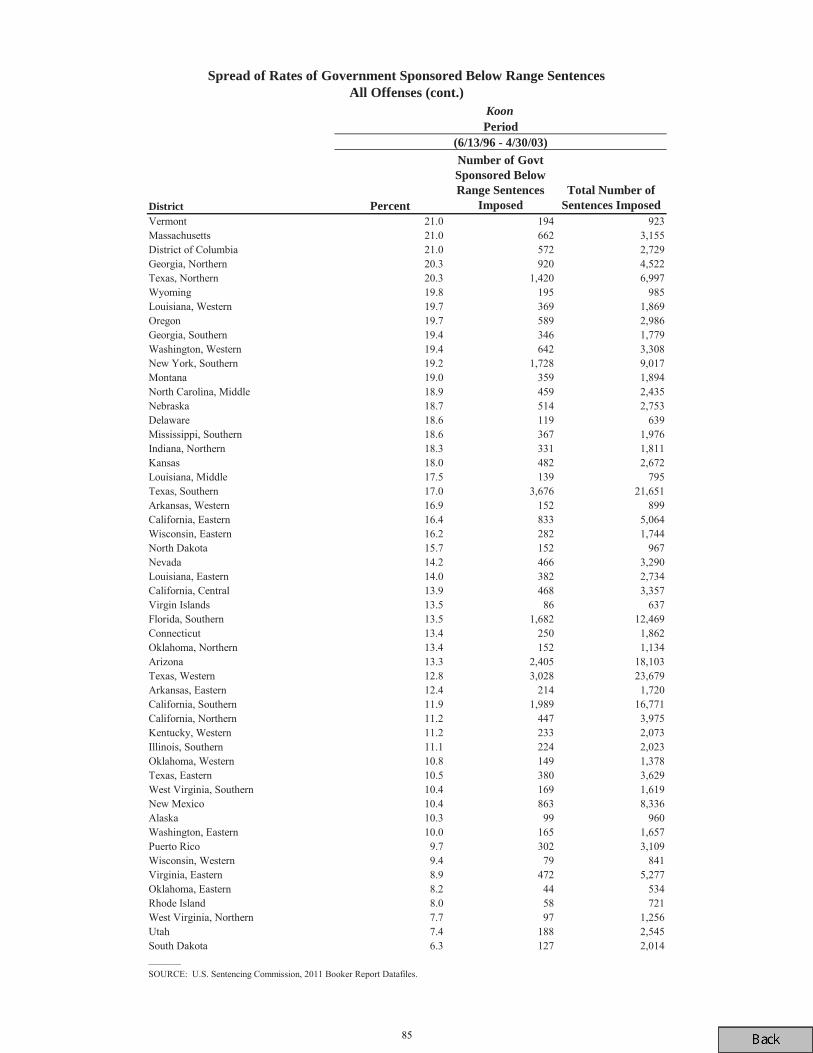
District Percent
Number of Govt Sponsored Below Range Sentences
ImposedTotal Number of
Sentences ImposedVermont 21.0 194 923Massachusetts 21.0 662 3,155District of Columbia 21.0 572 2,729Georgia, Northern 20.3 920 4,522Texas, Northern 20.3 1,420 6,997Wyoming 19.8 195 985Louisiana, Western 19.7 369 1,869Oregon 19.7 589 2,986Georgia, Southern 19.4 346 1,779Washington, Western 19.4 642 3,308New York, Southern 19.2 1,728 9,017Montana 19.0 359 1,894North Carolina, Middle 18.9 459 2,435Nebraska 18.7 514 2,753Delaware 18.6 119 639Mississippi, Southern 18.6 367 1,976Indiana, Northern 18.3 331 1,811Kansas 18.0 482 2,672Louisiana, Middle 17.5 139 795Texas, Southern 17.0 3,676 21,651Arkansas, Western 16.9 152 899California, Eastern 16.4 833 5,064Wisconsin, Eastern 16.2 282 1,744North Dakota 15.7 152 967Nevada 14.2 466 3,290Louisiana, Eastern 14.0 382 2,734California, Central 13.9 468 3,357Virgin Islands 13.5 86 637Florida, Southern 13.5 1,682 12,469Connecticut 13.4 250 1,862Oklahoma, Northern 13.4 152 1,134Arizona 13.3 2,405 18,103Texas, Western 12.8 3,028 23,679Arkansas, Eastern 12.4 214 1,720California, Southern 11.9 1,989 16,771California, Northern 11.2 447 3,975Kentucky, Western 11.2 233 2,073Illinois, Southern 11.1 224 2,023Oklahoma, Western 10.8 149 1,378Texas, Eastern 10.5 380 3,629West Virginia, Southern 10.4 169 1,619New Mexico 10.4 863 8,336Alaska 10.3 99 960Washington, Eastern 10.0 165 1,657Puerto Rico 9.7 302 3,109Wisconsin, Western 9.4 79 841Virginia, Eastern 8.9 472 5,277Oklahoma, Eastern 8.2 44 534Rhode Island 8.0 58 721West Virginia, Northern 7.7 97 1,256Utah 7.4 188 2,545South Dakota 6.3 127 2,014_______SOURCE: U.S. Sentencing Commission, 2011 Booker Report Datafiles.
Spread of Rates of Government Sponsored Below Range SentencesAll Offenses (cont.)
KoonPeriod
(6/13/96 - 4/30/03)
85
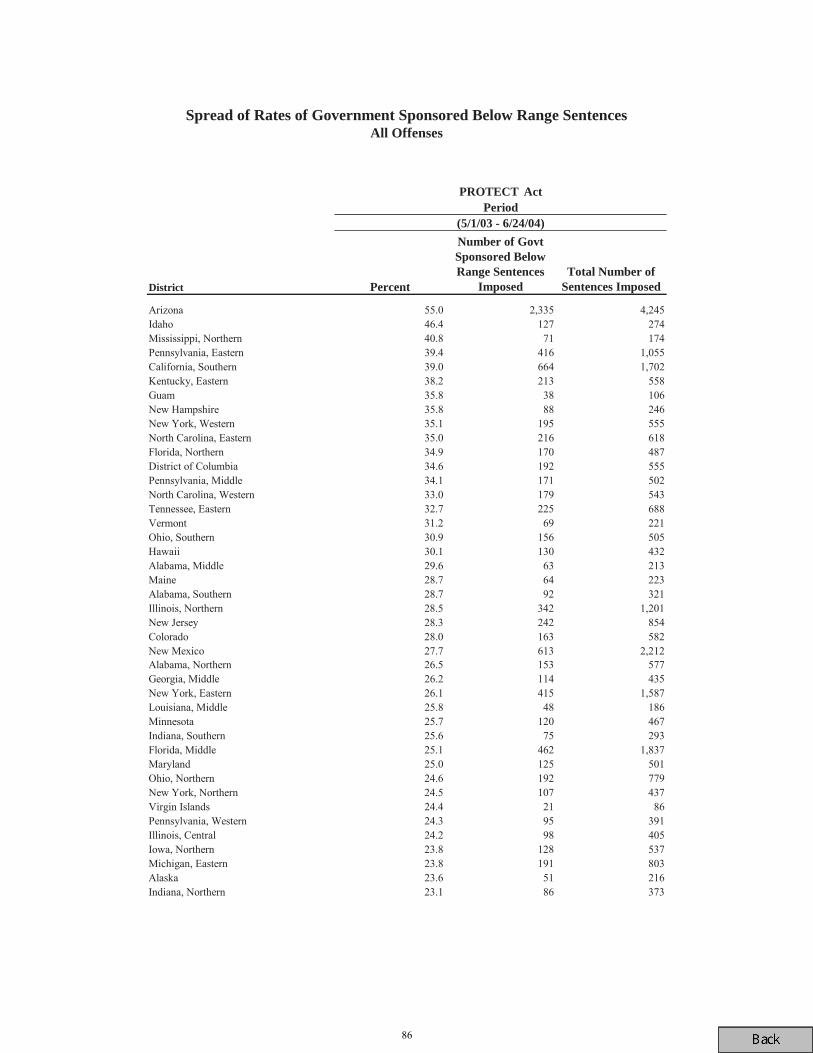
District Percent
Number of Govt Sponsored Below Range Sentences
ImposedTotal Number of
Sentences Imposed
Arizona 55.0 2,335 4,245Idaho 46.4 127 274Mississippi, Northern 40.8 71 174Pennsylvania, Eastern 39.4 416 1,055California, Southern 39.0 664 1,702Kentucky, Eastern 38.2 213 558Guam 35.8 38 106New Hampshire 35.8 88 246New York, Western 35.1 195 555North Carolina, Eastern 35.0 216 618Florida, Northern 34.9 170 487District of Columbia 34.6 192 555Pennsylvania, Middle 34.1 171 502North Carolina, Western 33.0 179 543Tennessee, Eastern 32.7 225 688Vermont 31.2 69 221Ohio, Southern 30.9 156 505Hawaii 30.1 130 432Alabama, Middle 29.6 63 213Maine 28.7 64 223Alabama, Southern 28.7 92 321Illinois, Northern 28.5 342 1,201New Jersey 28.3 242 854Colorado 28.0 163 582New Mexico 27.7 613 2,212Alabama, Northern 26.5 153 577Georgia, Middle 26.2 114 435New York, Eastern 26.1 415 1,587Louisiana, Middle 25.8 48 186Minnesota 25.7 120 467Indiana, Southern 25.6 75 293Florida, Middle 25.1 462 1,837Maryland 25.0 125 501Ohio, Northern 24.6 192 779New York, Northern 24.5 107 437Virgin Islands 24.4 21 86Pennsylvania, Western 24.3 95 391Illinois, Central 24.2 98 405Iowa, Northern 23.8 128 537Michigan, Eastern 23.8 191 803Alaska 23.6 51 216Indiana, Northern 23.1 86 373
Spread of Rates of Government Sponsored Below Range SentencesAll Offenses
PROTECT ActPeriod
(5/1/03 - 6/24/04)
86
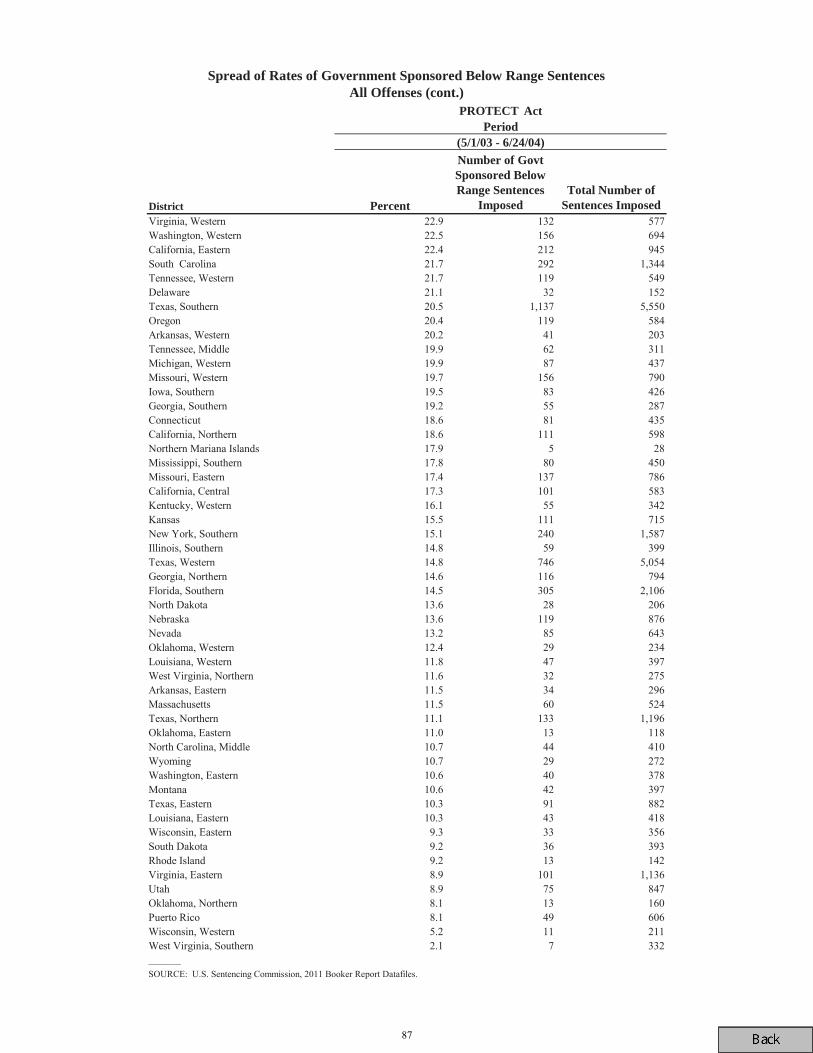
District Percent
Number of Govt Sponsored Below Range Sentences
ImposedTotal Number of
Sentences ImposedVirginia, Western 22.9 132 577Washington, Western 22.5 156 694California, Eastern 22.4 212 945South Carolina 21.7 292 1,344Tennessee, Western 21.7 119 549Delaware 21.1 32 152Texas, Southern 20.5 1,137 5,550Oregon 20.4 119 584Arkansas, Western 20.2 41 203Tennessee, Middle 19.9 62 311Michigan, Western 19.9 87 437Missouri, Western 19.7 156 790Iowa, Southern 19.5 83 426Georgia, Southern 19.2 55 287Connecticut 18.6 81 435California, Northern 18.6 111 598Northern Mariana Islands 17.9 5 28Mississippi, Southern 17.8 80 450Missouri, Eastern 17.4 137 786California, Central 17.3 101 583Kentucky, Western 16.1 55 342Kansas 15.5 111 715New York, Southern 15.1 240 1,587Illinois, Southern 14.8 59 399Texas, Western 14.8 746 5,054Georgia, Northern 14.6 116 794Florida, Southern 14.5 305 2,106North Dakota 13.6 28 206Nebraska 13.6 119 876Nevada 13.2 85 643Oklahoma, Western 12.4 29 234Louisiana, Western 11.8 47 397West Virginia, Northern 11.6 32 275Arkansas, Eastern 11.5 34 296Massachusetts 11.5 60 524Texas, Northern 11.1 133 1,196Oklahoma, Eastern 11.0 13 118North Carolina, Middle 10.7 44 410Wyoming 10.7 29 272Washington, Eastern 10.6 40 378Montana 10.6 42 397Texas, Eastern 10.3 91 882Louisiana, Eastern 10.3 43 418Wisconsin, Eastern 9.3 33 356South Dakota 9.2 36 393Rhode Island 9.2 13 142Virginia, Eastern 8.9 101 1,136Utah 8.9 75 847Oklahoma, Northern 8.1 13 160Puerto Rico 8.1 49 606Wisconsin, Western 5.2 11 211West Virginia, Southern 2.1 7 332_______SOURCE: U.S. Sentencing Commission, 2011 Booker Report Datafiles.
Spread of Rates of Government Sponsored Below Range SentencesAll Offenses (cont.)
PROTECT ActPeriod
(5/1/03 - 6/24/04)
87
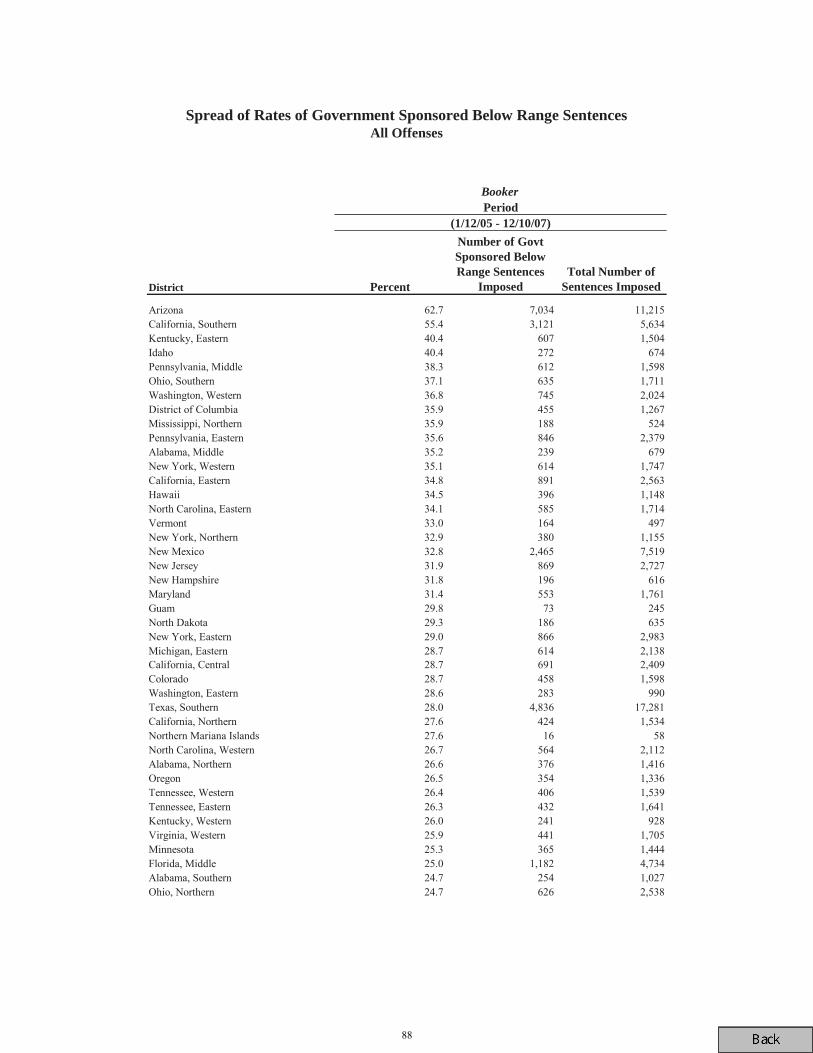
District Percent
Number of Govt Sponsored Below Range Sentences
ImposedTotal Number of
Sentences Imposed
Arizona 62.7 7,034 11,215California, Southern 55.4 3,121 5,634Kentucky, Eastern 40.4 607 1,504Idaho 40.4 272 674Pennsylvania, Middle 38.3 612 1,598Ohio, Southern 37.1 635 1,711Washington, Western 36.8 745 2,024District of Columbia 35.9 455 1,267Mississippi, Northern 35.9 188 524Pennsylvania, Eastern 35.6 846 2,379Alabama, Middle 35.2 239 679New York, Western 35.1 614 1,747California, Eastern 34.8 891 2,563Hawaii 34.5 396 1,148North Carolina, Eastern 34.1 585 1,714Vermont 33.0 164 497New York, Northern 32.9 380 1,155New Mexico 32.8 2,465 7,519New Jersey 31.9 869 2,727New Hampshire 31.8 196 616Maryland 31.4 553 1,761Guam 29.8 73 245North Dakota 29.3 186 635New York, Eastern 29.0 866 2,983Michigan, Eastern 28.7 614 2,138California, Central 28.7 691 2,409Colorado 28.7 458 1,598Washington, Eastern 28.6 283 990Texas, Southern 28.0 4,836 17,281California, Northern 27.6 424 1,534Northern Mariana Islands 27.6 16 58North Carolina, Western 26.7 564 2,112Alabama, Northern 26.6 376 1,416Oregon 26.5 354 1,336Tennessee, Western 26.4 406 1,539Tennessee, Eastern 26.3 432 1,641Kentucky, Western 26.0 241 928Virginia, Western 25.9 441 1,705Minnesota 25.3 365 1,444Florida, Middle 25.0 1,182 4,734Alabama, Southern 24.7 254 1,027Ohio, Northern 24.7 626 2,538
Spread of Rates of Government Sponsored Below Range SentencesAll Offenses
BookerPeriod
(1/12/05 - 12/10/07)
88
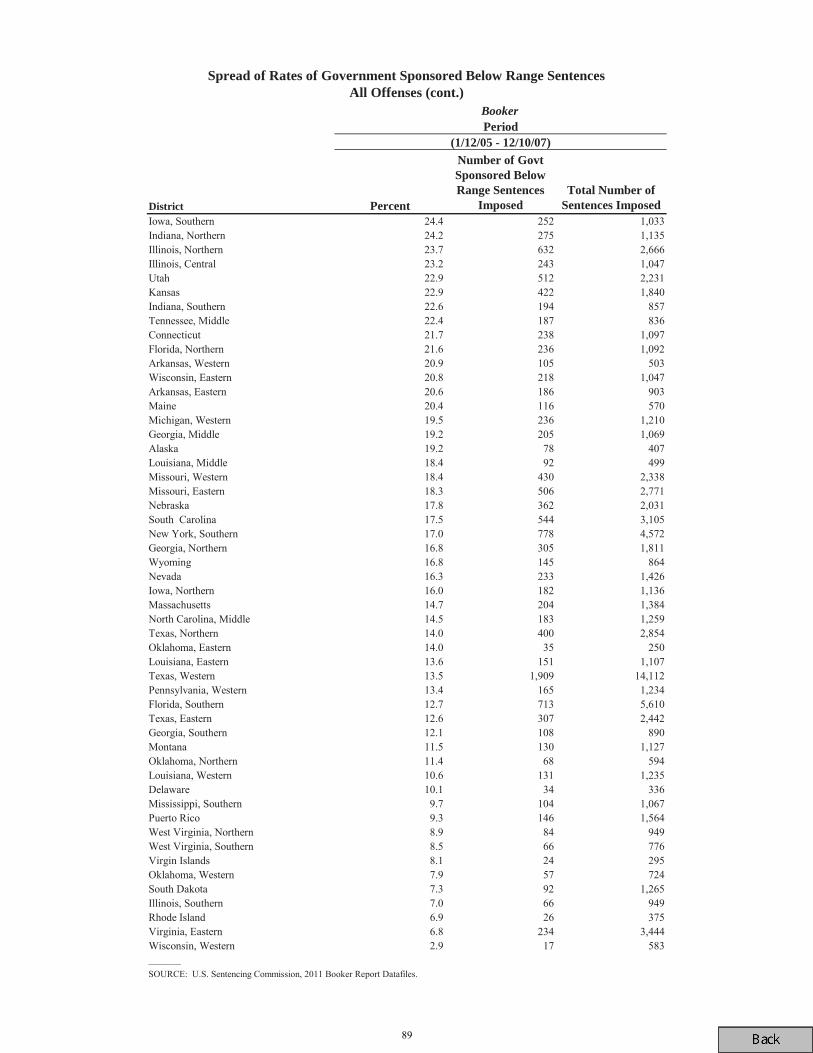
District Percent
Number of Govt Sponsored Below Range Sentences
ImposedTotal Number of
Sentences ImposedIowa, Southern 24.4 252 1,033Indiana, Northern 24.2 275 1,135Illinois, Northern 23.7 632 2,666Illinois, Central 23.2 243 1,047Utah 22.9 512 2,231Kansas 22.9 422 1,840Indiana, Southern 22.6 194 857Tennessee, Middle 22.4 187 836Connecticut 21.7 238 1,097Florida, Northern 21.6 236 1,092Arkansas, Western 20.9 105 503Wisconsin, Eastern 20.8 218 1,047Arkansas, Eastern 20.6 186 903Maine 20.4 116 570Michigan, Western 19.5 236 1,210Georgia, Middle 19.2 205 1,069Alaska 19.2 78 407Louisiana, Middle 18.4 92 499Missouri, Western 18.4 430 2,338Missouri, Eastern 18.3 506 2,771Nebraska 17.8 362 2,031South Carolina 17.5 544 3,105New York, Southern 17.0 778 4,572Georgia, Northern 16.8 305 1,811Wyoming 16.8 145 864Nevada 16.3 233 1,426Iowa, Northern 16.0 182 1,136Massachusetts 14.7 204 1,384North Carolina, Middle 14.5 183 1,259Texas, Northern 14.0 400 2,854Oklahoma, Eastern 14.0 35 250Louisiana, Eastern 13.6 151 1,107Texas, Western 13.5 1,909 14,112Pennsylvania, Western 13.4 165 1,234Florida, Southern 12.7 713 5,610Texas, Eastern 12.6 307 2,442Georgia, Southern 12.1 108 890Montana 11.5 130 1,127Oklahoma, Northern 11.4 68 594Louisiana, Western 10.6 131 1,235Delaware 10.1 34 336Mississippi, Southern 9.7 104 1,067Puerto Rico 9.3 146 1,564West Virginia, Northern 8.9 84 949West Virginia, Southern 8.5 66 776Virgin Islands 8.1 24 295Oklahoma, Western 7.9 57 724South Dakota 7.3 92 1,265Illinois, Southern 7.0 66 949Rhode Island 6.9 26 375Virginia, Eastern 6.8 234 3,444Wisconsin, Western 2.9 17 583_______SOURCE: U.S. Sentencing Commission, 2011 Booker Report Datafiles.
Spread of Rates of Government Sponsored Below Range SentencesAll Offenses (cont.)
BookerPeriod
(1/12/05 - 12/10/07)
89
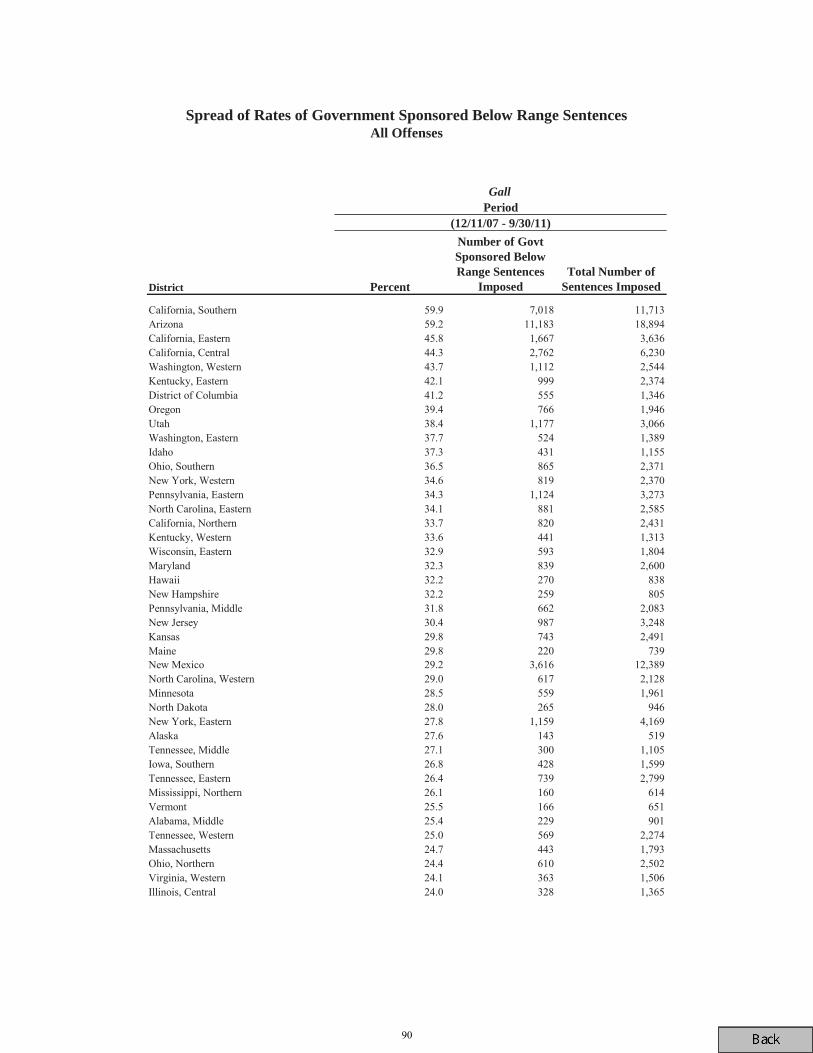
District Percent
Number of Govt Sponsored Below Range Sentences
ImposedTotal Number of
Sentences Imposed
California, Southern 59.9 7,018 11,713Arizona 59.2 11,183 18,894California, Eastern 45.8 1,667 3,636California, Central 44.3 2,762 6,230Washington, Western 43.7 1,112 2,544Kentucky, Eastern 42.1 999 2,374District of Columbia 41.2 555 1,346Oregon 39.4 766 1,946Utah 38.4 1,177 3,066Washington, Eastern 37.7 524 1,389Idaho 37.3 431 1,155Ohio, Southern 36.5 865 2,371New York, Western 34.6 819 2,370Pennsylvania, Eastern 34.3 1,124 3,273North Carolina, Eastern 34.1 881 2,585California, Northern 33.7 820 2,431Kentucky, Western 33.6 441 1,313Wisconsin, Eastern 32.9 593 1,804Maryland 32.3 839 2,600Hawaii 32.2 270 838New Hampshire 32.2 259 805Pennsylvania, Middle 31.8 662 2,083New Jersey 30.4 987 3,248Kansas 29.8 743 2,491Maine 29.8 220 739New Mexico 29.2 3,616 12,389North Carolina, Western 29.0 617 2,128Minnesota 28.5 559 1,961North Dakota 28.0 265 946New York, Eastern 27.8 1,159 4,169Alaska 27.6 143 519Tennessee, Middle 27.1 300 1,105Iowa, Southern 26.8 428 1,599Tennessee, Eastern 26.4 739 2,799Mississippi, Northern 26.1 160 614Vermont 25.5 166 651Alabama, Middle 25.4 229 901Tennessee, Western 25.0 569 2,274Massachusetts 24.7 443 1,793Ohio, Northern 24.4 610 2,502Virginia, Western 24.1 363 1,506Illinois, Central 24.0 328 1,365
Spread of Rates of Government Sponsored Below Range SentencesAll Offenses
GallPeriod
(12/11/07 - 9/30/11)
90

District Percent
Number of Govt Sponsored Below Range Sentences
ImposedTotal Number of
Sentences ImposedNew York, Northern 23.5 413 1,754Indiana, Northern 23.3 370 1,588Colorado 23.1 455 1,969Missouri, Western 23.0 619 2,687Michigan, Eastern 22.8 635 2,782Texas, Southern 22.5 6,506 28,907Alabama, Northern 21.8 354 1,627Alabama, Southern 21.2 329 1,555South Carolina 20.9 898 4,301Indiana, Southern 20.8 219 1,052Florida, Middle 20.6 1,261 6,134Louisiana, Middle 20.4 131 641Wyoming 19.8 264 1,330Connecticut 19.7 288 1,461Iowa, Northern 19.6 341 1,744Missouri, Eastern 19.2 698 3,639Georgia, Northern 18.3 479 2,612Florida, Northern 18.0 252 1,397Illinois, Northern 17.6 559 3,184Oklahoma, Northern 17.5 126 720New York, Southern 17.4 942 5,414Delaware 17.2 88 511Pennsylvania, Western 16.7 276 1,649Nevada 16.0 299 1,874Texas, Eastern 15.8 547 3,466Texas, Northern 15.7 560 3,570Virgin Islands 15.5 39 252Puerto Rico 15.2 431 2,837Georgia, Southern 15.1 234 1,554Michigan, Western 15.0 254 1,688Arkansas, Eastern 15.0 203 1,354Oklahoma, Eastern 14.9 56 377West Virginia, Northern 14.9 180 1,212Georgia, Middle 14.5 172 1,183Guam 14.5 31 214Nebraska 14.5 318 2,200Montana 13.9 189 1,363North Carolina, Middle 13.8 246 1,788Arkansas, Western 12.7 126 992Louisiana, Eastern 12.7 195 1,536West Virginia, Southern 10.9 111 1,020Texas, Western 10.5 2,589 24,597Florida, Southern 10.5 830 7,929Oklahoma, Western 10.0 122 1,216Rhode Island 10.0 56 561Illinois, Southern 9.8 114 1,162Wisconsin, Western 9.3 65 696Northern Mariana Islands 9.1 6 66Louisiana, Western 8.3 98 1,175Mississippi, Southern 8.3 103 1,238Virginia, Eastern 7.6 360 4,714South Dakota 5.1 85 1,658_______SOURCE: U.S. Sentencing Commission, 2011 Booker Report Datafiles.
Spread of Rates of Government Sponsored Below Range SentencesAll Offenses (cont.)
GallPeriod
(12/11/07 - 9/30/11)
91
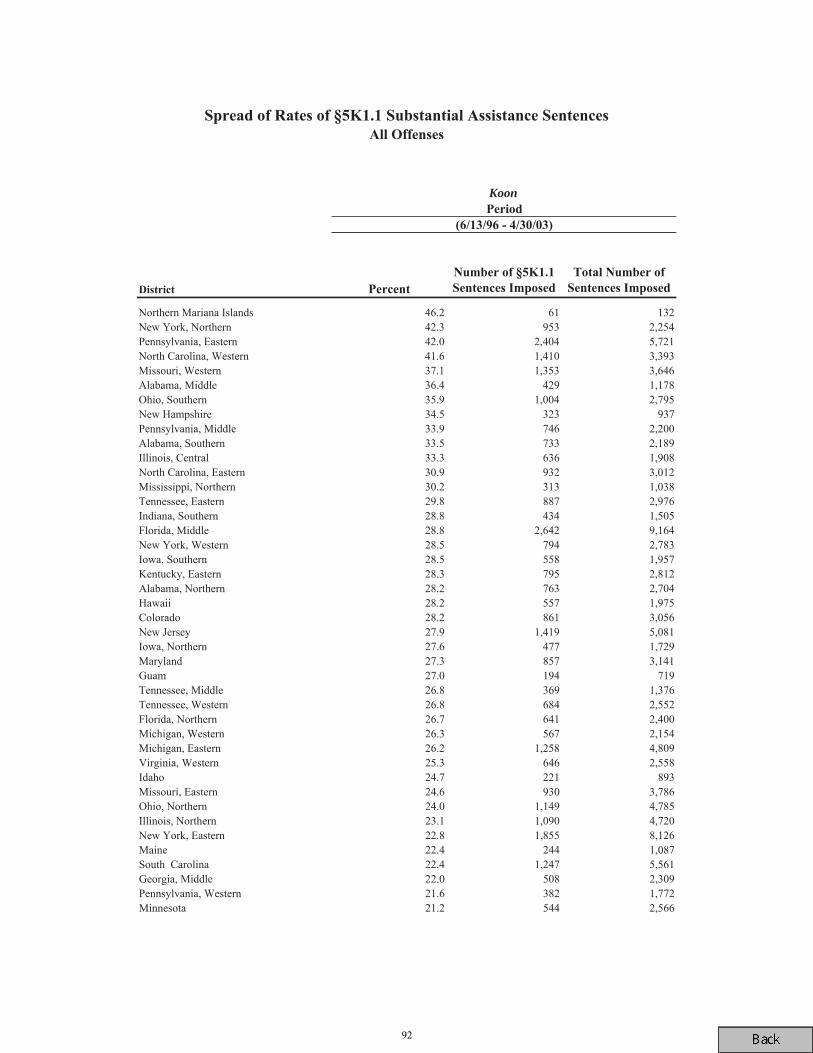
Koon
92
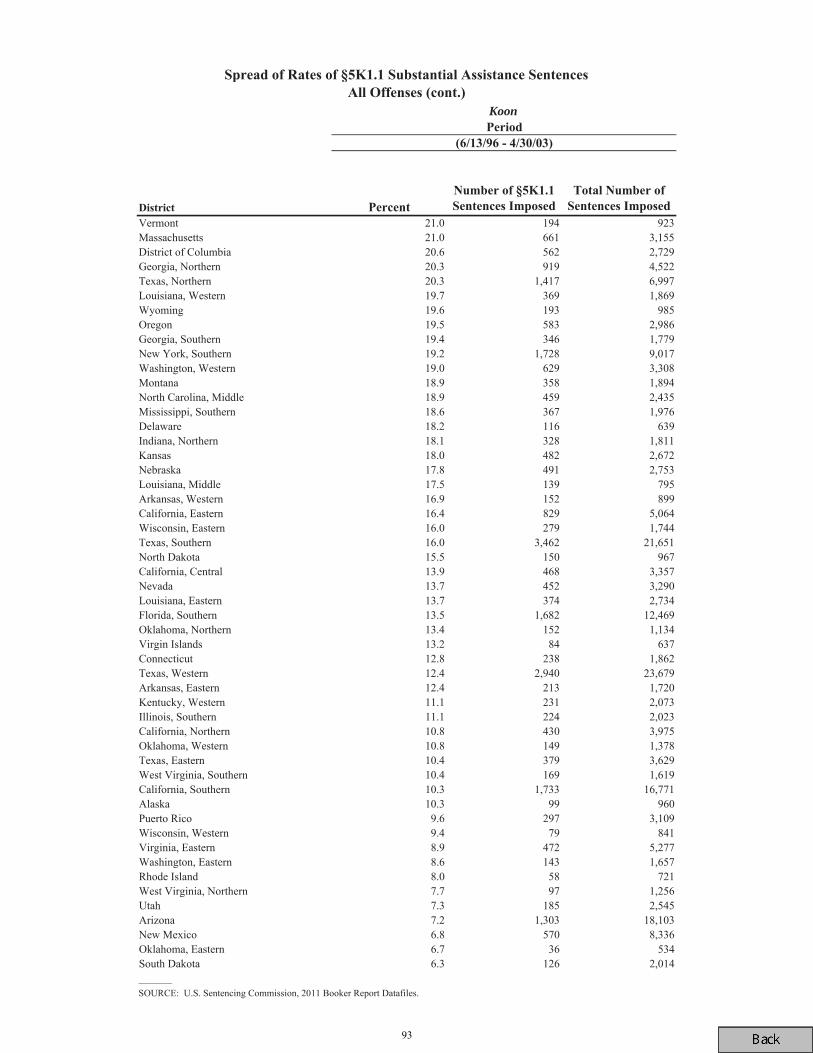
Koon
93
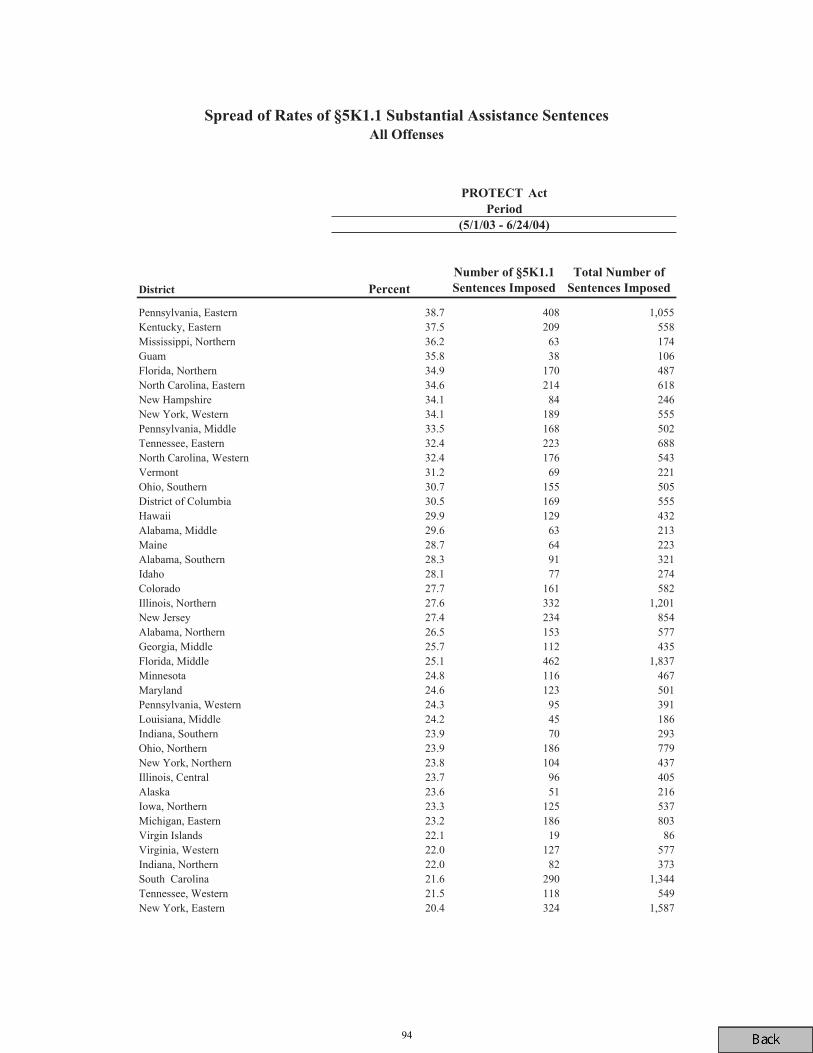
94
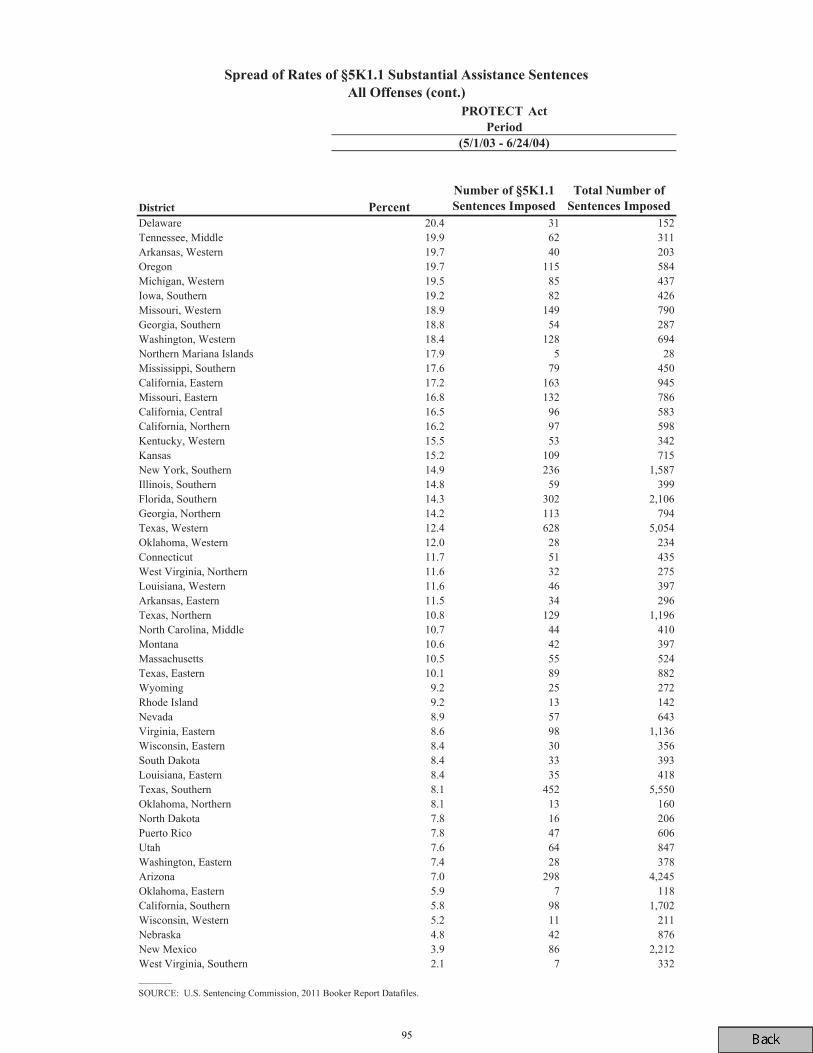
95
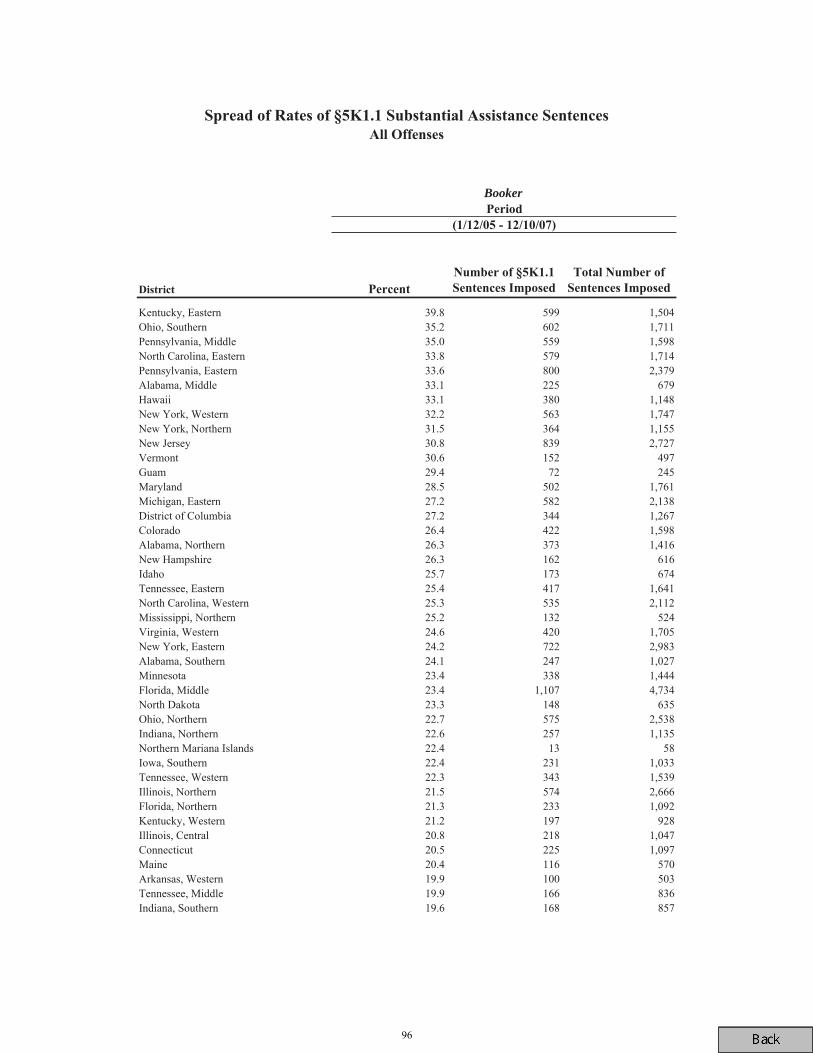
Booker
96
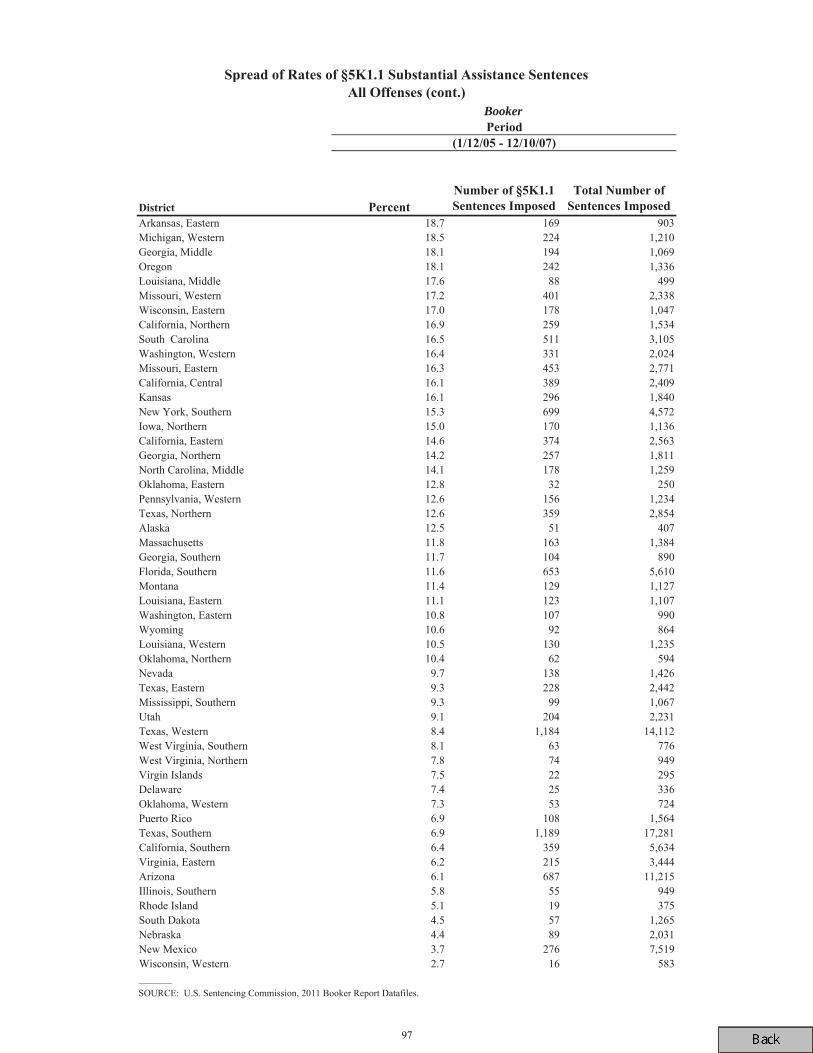
Booker
97

Gall
98
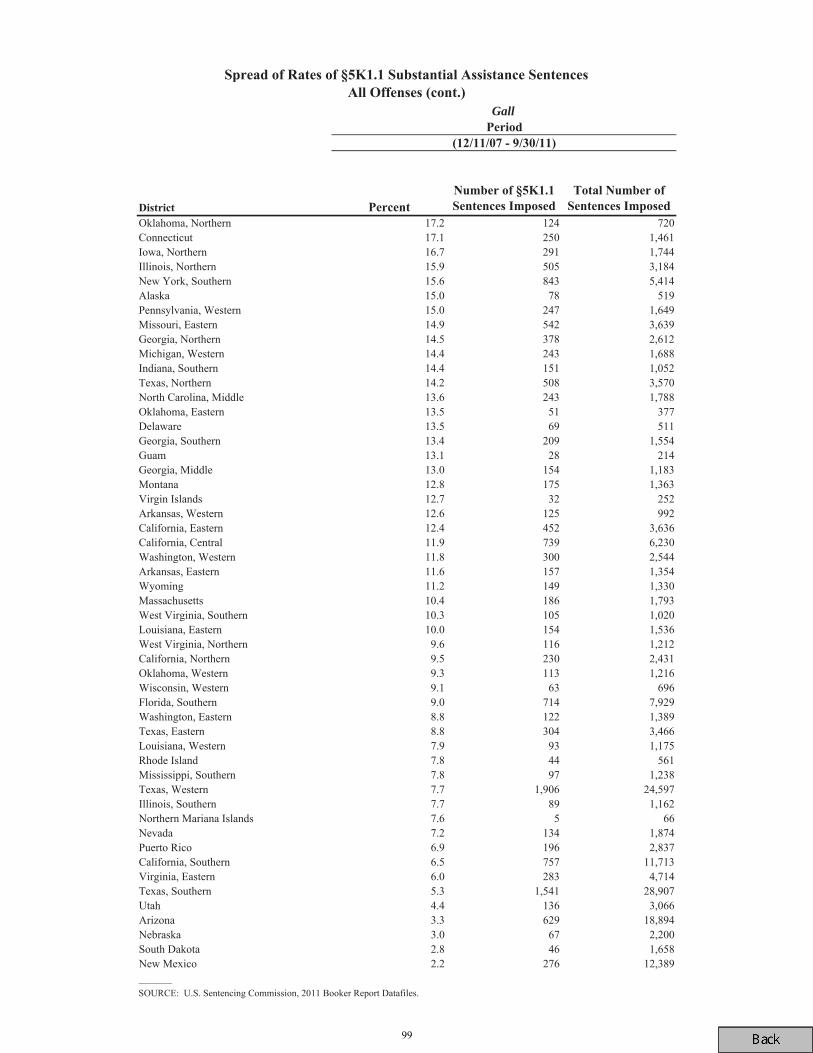
Gall
99
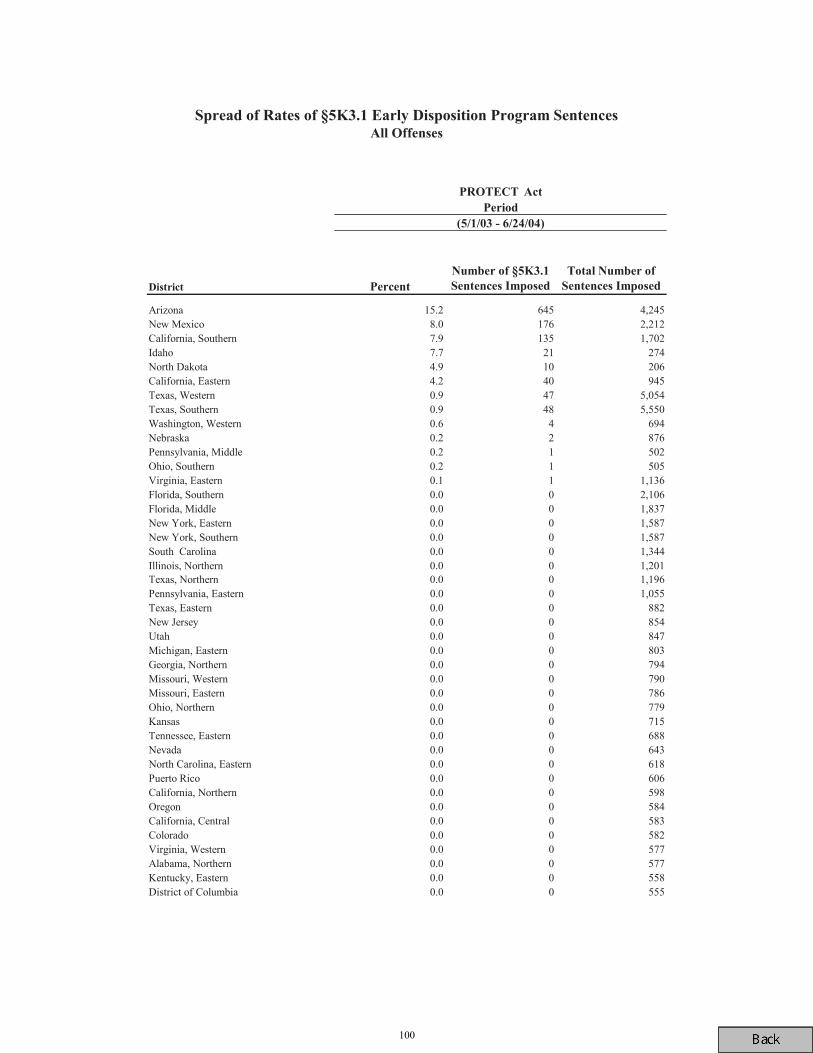
Arizona 15.2 645 4,245New Mexico 8.0 176 2,212California, Southern 7.9 135 1,702Idaho 7.7 21 274North Dakota 4.9 10 206California, Eastern 4.2 40 945Texas, Western 0.9 47 5,054Texas, Southern 0.9 48 5,550Washington, Western 0.6 4 694Nebraska 0.2 2 876Pennsylvania, Middle 0.2 1 502Ohio, Southern 0.2 1 505Virginia, Eastern 0.1 1 1,136Florida, Southern 0.0 0 2,106Florida, Middle 0.0 0 1,837New York, Eastern 0.0 0 1,587New York, Southern 0.0 0 1,587South Carolina 0.0 0 1,344Illinois, Northern 0.0 0 1,201Texas, Northern 0.0 0 1,196Pennsylvania, Eastern 0.0 0 1,055Texas, Eastern 0.0 0 882New Jersey 0.0 0 854Utah 0.0 0 847Michigan, Eastern 0.0 0 803Georgia, Northern 0.0 0 794Missouri, Western 0.0 0 790Missouri, Eastern 0.0 0 786Ohio, Northern 0.0 0 779Kansas 0.0 0 715Tennessee, Eastern 0.0 0 688Nevada 0.0 0 643North Carolina, Eastern 0.0 0 618Puerto Rico 0.0 0 606California, Northern 0.0 0 598Oregon 0.0 0 584California, Central 0.0 0 583Colorado 0.0 0 582Virginia, Western 0.0 0 577Alabama, Northern 0.0 0 577Kentucky, Eastern 0.0 0 558District of Columbia 0.0 0 555
100
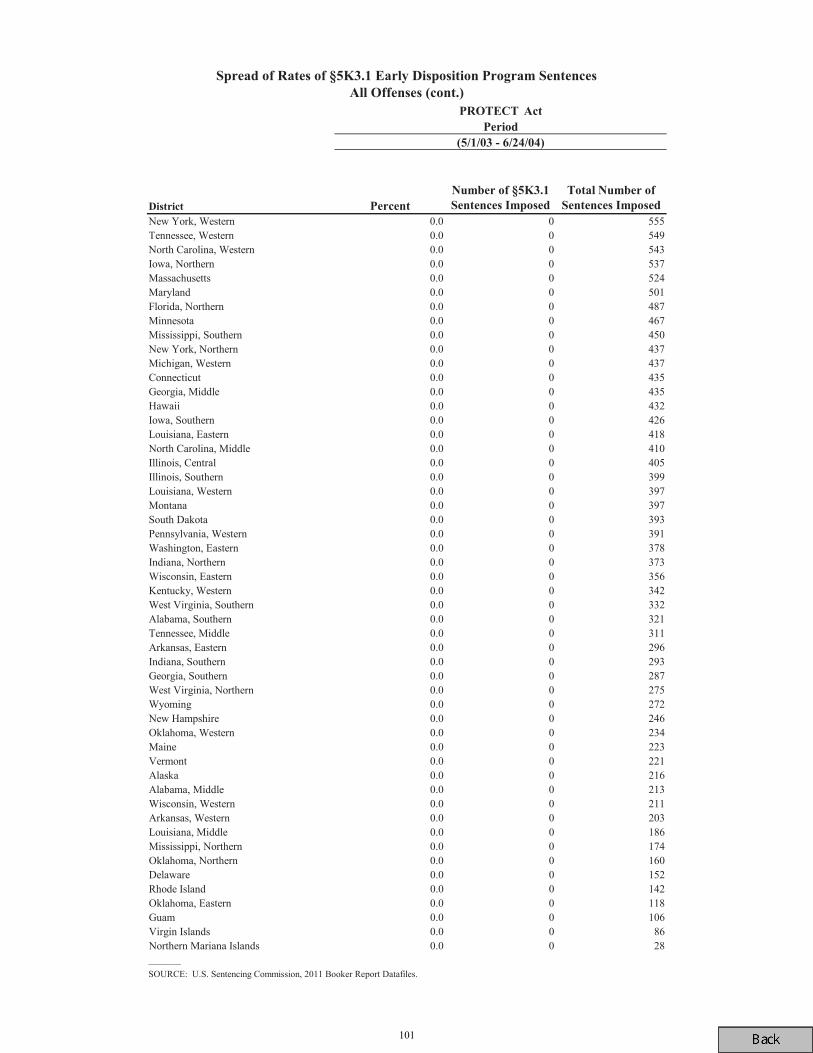
New York, Western 0.0 0 555Tennessee, Western 0.0 0 549North Carolina, Western 0.0 0 543Iowa, Northern 0.0 0 537Massachusetts 0.0 0 524Maryland 0.0 0 501Florida, Northern 0.0 0 487Minnesota 0.0 0 467Mississippi, Southern 0.0 0 450New York, Northern 0.0 0 437Michigan, Western 0.0 0 437Connecticut 0.0 0 435Georgia, Middle 0.0 0 435Hawaii 0.0 0 432Iowa, Southern 0.0 0 426Louisiana, Eastern 0.0 0 418North Carolina, Middle 0.0 0 410Illinois, Central 0.0 0 405Illinois, Southern 0.0 0 399Louisiana, Western 0.0 0 397Montana 0.0 0 397South Dakota 0.0 0 393Pennsylvania, Western 0.0 0 391Washington, Eastern 0.0 0 378Indiana, Northern 0.0 0 373Wisconsin, Eastern 0.0 0 356Kentucky, Western 0.0 0 342West Virginia, Southern 0.0 0 332Alabama, Southern 0.0 0 321Tennessee, Middle 0.0 0 311Arkansas, Eastern 0.0 0 296Indiana, Southern 0.0 0 293Georgia, Southern 0.0 0 287West Virginia, Northern 0.0 0 275Wyoming 0.0 0 272New Hampshire 0.0 0 246Oklahoma, Western 0.0 0 234Maine 0.0 0 223Vermont 0.0 0 221Alaska 0.0 0 216Alabama, Middle 0.0 0 213Wisconsin, Western 0.0 0 211Arkansas, Western 0.0 0 203Louisiana, Middle 0.0 0 186Mississippi, Northern 0.0 0 174Oklahoma, Northern 0.0 0 160Delaware 0.0 0 152Rhode Island 0.0 0 142Oklahoma, Eastern 0.0 0 118Guam 0.0 0 106Virgin Islands 0.0 0 86Northern Mariana Islands 0.0 0 28_______SOURCE: U.S. Sentencing Commission, 2011 Booker Report Datafiles.
101
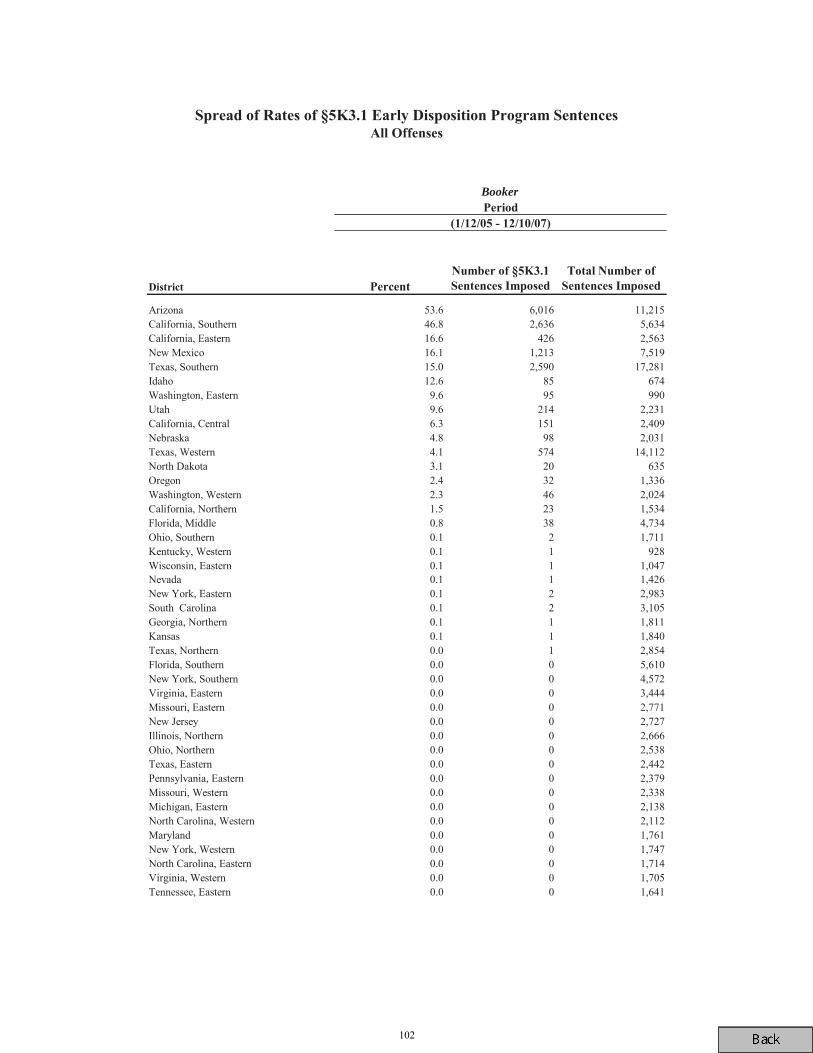
Arizona 53.6 6,016 11,215California, Southern 46.8 2,636 5,634California, Eastern 16.6 426 2,563New Mexico 16.1 1,213 7,519Texas, Southern 15.0 2,590 17,281Idaho 12.6 85 674Washington, Eastern 9.6 95 990Utah 9.6 214 2,231California, Central 6.3 151 2,409Nebraska 4.8 98 2,031Texas, Western 4.1 574 14,112North Dakota 3.1 20 635Oregon 2.4 32 1,336Washington, Western 2.3 46 2,024California, Northern 1.5 23 1,534Florida, Middle 0.8 38 4,734Ohio, Southern 0.1 2 1,711Kentucky, Western 0.1 1 928Wisconsin, Eastern 0.1 1 1,047Nevada 0.1 1 1,426New York, Eastern 0.1 2 2,983South Carolina 0.1 2 3,105Georgia, Northern 0.1 1 1,811Kansas 0.1 1 1,840Texas, Northern 0.0 1 2,854Florida, Southern 0.0 0 5,610New York, Southern 0.0 0 4,572Virginia, Eastern 0.0 0 3,444Missouri, Eastern 0.0 0 2,771New Jersey 0.0 0 2,727Illinois, Northern 0.0 0 2,666Ohio, Northern 0.0 0 2,538Texas, Eastern 0.0 0 2,442Pennsylvania, Eastern 0.0 0 2,379Missouri, Western 0.0 0 2,338Michigan, Eastern 0.0 0 2,138North Carolina, Western 0.0 0 2,112Maryland 0.0 0 1,761New York, Western 0.0 0 1,747North Carolina, Eastern 0.0 0 1,714Virginia, Western 0.0 0 1,705Tennessee, Eastern 0.0 0 1,641
Booker
102
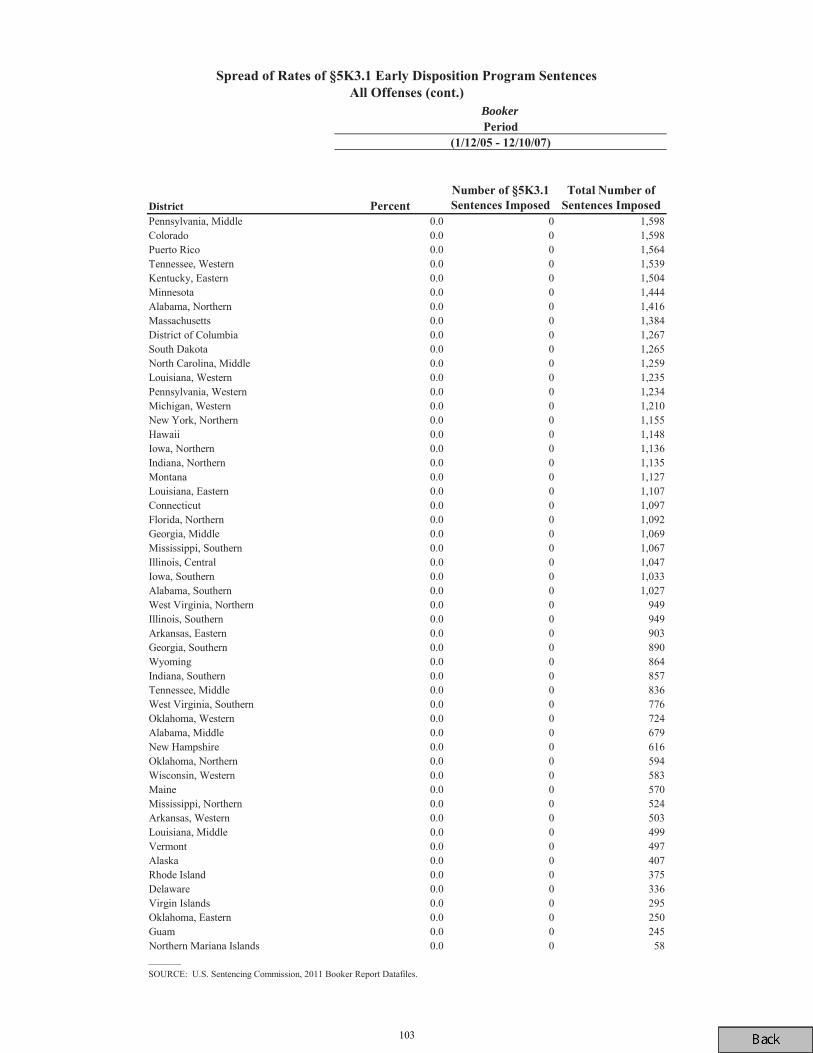
Pennsylvania, Middle 0.0 0 1,598Colorado 0.0 0 1,598Puerto Rico 0.0 0 1,564Tennessee, Western 0.0 0 1,539Kentucky, Eastern 0.0 0 1,504Minnesota 0.0 0 1,444Alabama, Northern 0.0 0 1,416Massachusetts 0.0 0 1,384District of Columbia 0.0 0 1,267South Dakota 0.0 0 1,265North Carolina, Middle 0.0 0 1,259Louisiana, Western 0.0 0 1,235Pennsylvania, Western 0.0 0 1,234Michigan, Western 0.0 0 1,210New York, Northern 0.0 0 1,155Hawaii 0.0 0 1,148Iowa, Northern 0.0 0 1,136Indiana, Northern 0.0 0 1,135Montana 0.0 0 1,127Louisiana, Eastern 0.0 0 1,107Connecticut 0.0 0 1,097Florida, Northern 0.0 0 1,092Georgia, Middle 0.0 0 1,069Mississippi, Southern 0.0 0 1,067Illinois, Central 0.0 0 1,047Iowa, Southern 0.0 0 1,033Alabama, Southern 0.0 0 1,027West Virginia, Northern 0.0 0 949Illinois, Southern 0.0 0 949Arkansas, Eastern 0.0 0 903Georgia, Southern 0.0 0 890Wyoming 0.0 0 864Indiana, Southern 0.0 0 857Tennessee, Middle 0.0 0 836West Virginia, Southern 0.0 0 776Oklahoma, Western 0.0 0 724Alabama, Middle 0.0 0 679New Hampshire 0.0 0 616Oklahoma, Northern 0.0 0 594Wisconsin, Western 0.0 0 583Maine 0.0 0 570Mississippi, Northern 0.0 0 524Arkansas, Western 0.0 0 503Louisiana, Middle 0.0 0 499Vermont 0.0 0 497Alaska 0.0 0 407Rhode Island 0.0 0 375Delaware 0.0 0 336Virgin Islands 0.0 0 295Oklahoma, Eastern 0.0 0 250Guam 0.0 0 245Northern Mariana Islands 0.0 0 58_______SOURCE: U.S. Sentencing Commission, 2011 Booker Report Datafiles.
Booker
103
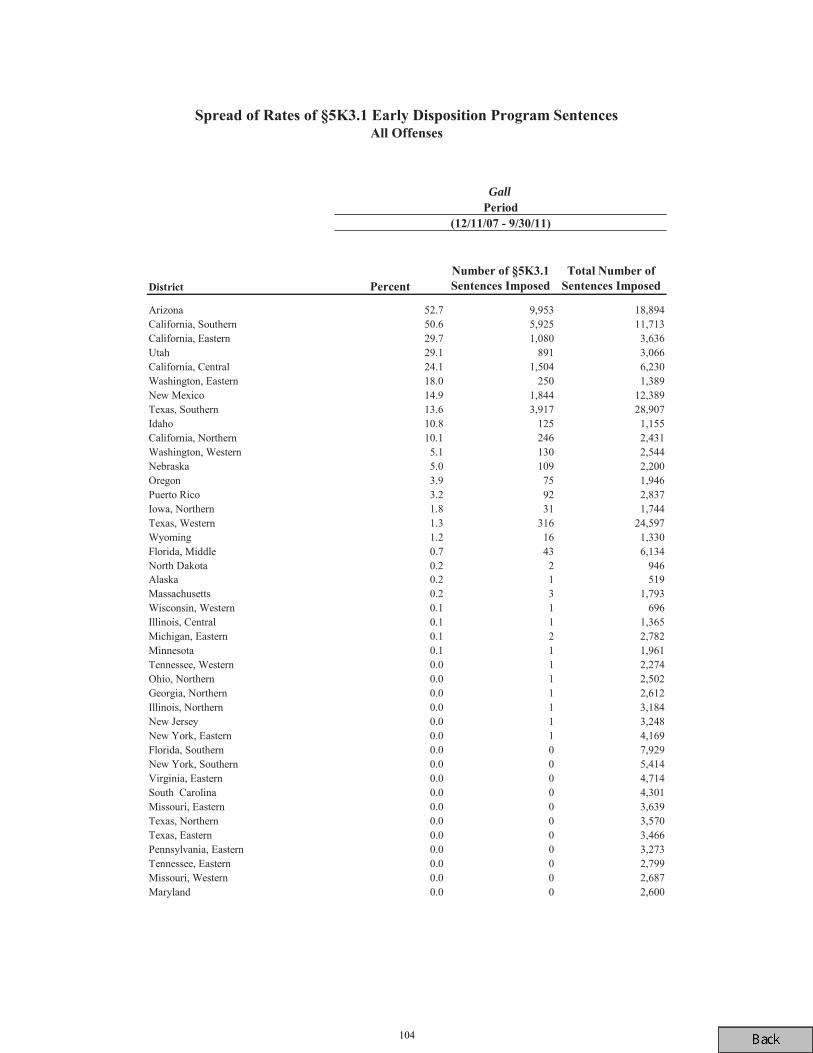
Arizona 52.7 9,953 18,894California, Southern 50.6 5,925 11,713California, Eastern 29.7 1,080 3,636Utah 29.1 891 3,066California, Central 24.1 1,504 6,230Washington, Eastern 18.0 250 1,389New Mexico 14.9 1,844 12,389Texas, Southern 13.6 3,917 28,907Idaho 10.8 125 1,155California, Northern 10.1 246 2,431Washington, Western 5.1 130 2,544Nebraska 5.0 109 2,200Oregon 3.9 75 1,946Puerto Rico 3.2 92 2,837Iowa, Northern 1.8 31 1,744Texas, Western 1.3 316 24,597Wyoming 1.2 16 1,330Florida, Middle 0.7 43 6,134North Dakota 0.2 2 946Alaska 0.2 1 519Massachusetts 0.2 3 1,793Wisconsin, Western 0.1 1 696Illinois, Central 0.1 1 1,365Michigan, Eastern 0.1 2 2,782Minnesota 0.1 1 1,961Tennessee, Western 0.0 1 2,274Ohio, Northern 0.0 1 2,502Georgia, Northern 0.0 1 2,612Illinois, Northern 0.0 1 3,184New Jersey 0.0 1 3,248New York, Eastern 0.0 1 4,169Florida, Southern 0.0 0 7,929New York, Southern 0.0 0 5,414Virginia, Eastern 0.0 0 4,714South Carolina 0.0 0 4,301Missouri, Eastern 0.0 0 3,639Texas, Northern 0.0 0 3,570Texas, Eastern 0.0 0 3,466Pennsylvania, Eastern 0.0 0 3,273Tennessee, Eastern 0.0 0 2,799Missouri, Western 0.0 0 2,687Maryland 0.0 0 2,600
Gall
104
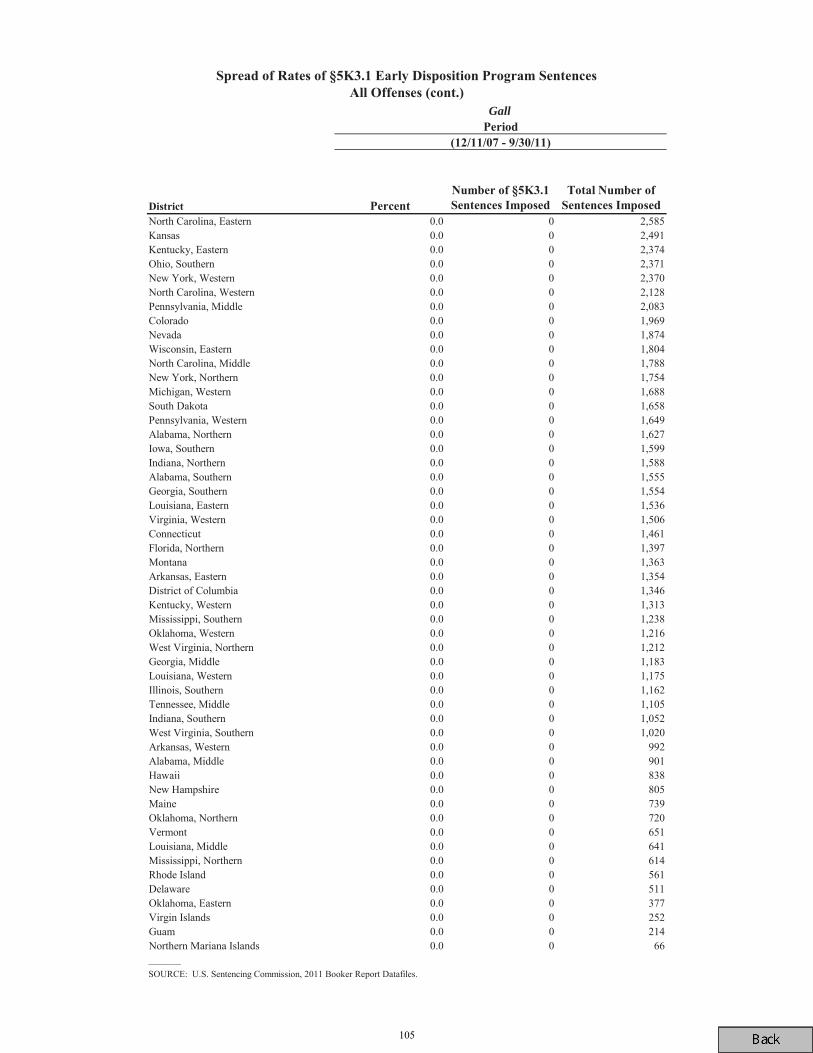
North Carolina, Eastern 0.0 0 2,585Kansas 0.0 0 2,491Kentucky, Eastern 0.0 0 2,374Ohio, Southern 0.0 0 2,371New York, Western 0.0 0 2,370North Carolina, Western 0.0 0 2,128Pennsylvania, Middle 0.0 0 2,083Colorado 0.0 0 1,969Nevada 0.0 0 1,874Wisconsin, Eastern 0.0 0 1,804North Carolina, Middle 0.0 0 1,788New York, Northern 0.0 0 1,754Michigan, Western 0.0 0 1,688South Dakota 0.0 0 1,658Pennsylvania, Western 0.0 0 1,649Alabama, Northern 0.0 0 1,627Iowa, Southern 0.0 0 1,599Indiana, Northern 0.0 0 1,588Alabama, Southern 0.0 0 1,555Georgia, Southern 0.0 0 1,554Louisiana, Eastern 0.0 0 1,536Virginia, Western 0.0 0 1,506Connecticut 0.0 0 1,461Florida, Northern 0.0 0 1,397Montana 0.0 0 1,363Arkansas, Eastern 0.0 0 1,354District of Columbia 0.0 0 1,346Kentucky, Western 0.0 0 1,313Mississippi, Southern 0.0 0 1,238Oklahoma, Western 0.0 0 1,216West Virginia, Northern 0.0 0 1,212Georgia, Middle 0.0 0 1,183Louisiana, Western 0.0 0 1,175Illinois, Southern 0.0 0 1,162Tennessee, Middle 0.0 0 1,105Indiana, Southern 0.0 0 1,052West Virginia, Southern 0.0 0 1,020Arkansas, Western 0.0 0 992Alabama, Middle 0.0 0 901Hawaii 0.0 0 838New Hampshire 0.0 0 805Maine 0.0 0 739Oklahoma, Northern 0.0 0 720Vermont 0.0 0 651Louisiana, Middle 0.0 0 641Mississippi, Northern 0.0 0 614Rhode Island 0.0 0 561Delaware 0.0 0 511Oklahoma, Eastern 0.0 0 377Virgin Islands 0.0 0 252Guam 0.0 0 214Northern Mariana Islands 0.0 0 66_______SOURCE: U.S. Sentencing Commission, 2011 Booker Report Datafiles.
Gall
105
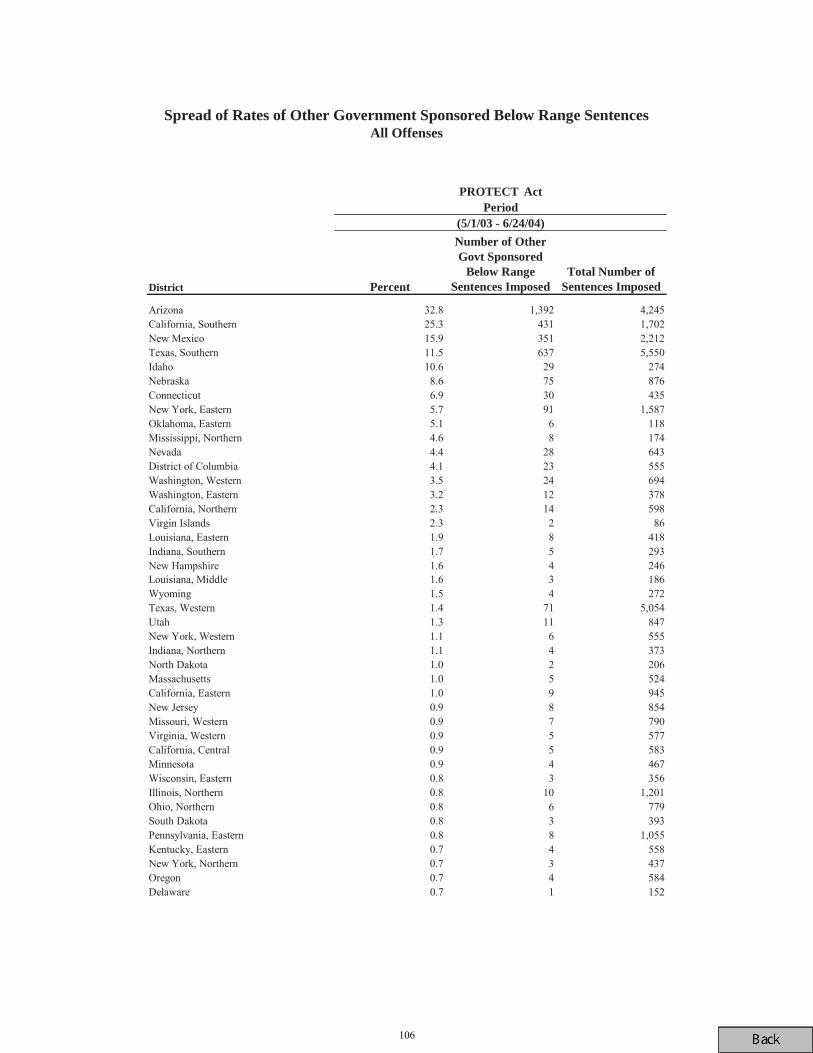
District Percent
Number of Other Govt Sponsored
Below Range Sentences Imposed
Total Number of Sentences Imposed
Arizona 32.8 1,392 4,245California, Southern 25.3 431 1,702New Mexico 15.9 351 2,212Texas, Southern 11.5 637 5,550Idaho 10.6 29 274Nebraska 8.6 75 876Connecticut 6.9 30 435New York, Eastern 5.7 91 1,587Oklahoma, Eastern 5.1 6 118Mississippi, Northern 4.6 8 174Nevada 4.4 28 643District of Columbia 4.1 23 555Washington, Western 3.5 24 694Washington, Eastern 3.2 12 378California, Northern 2.3 14 598Virgin Islands 2.3 2 86Louisiana, Eastern 1.9 8 418Indiana, Southern 1.7 5 293New Hampshire 1.6 4 246Louisiana, Middle 1.6 3 186Wyoming 1.5 4 272Texas, Western 1.4 71 5,054Utah 1.3 11 847New York, Western 1.1 6 555Indiana, Northern 1.1 4 373North Dakota 1.0 2 206Massachusetts 1.0 5 524California, Eastern 1.0 9 945New Jersey 0.9 8 854Missouri, Western 0.9 7 790Virginia, Western 0.9 5 577California, Central 0.9 5 583Minnesota 0.9 4 467Wisconsin, Eastern 0.8 3 356Illinois, Northern 0.8 10 1,201Ohio, Northern 0.8 6 779South Dakota 0.8 3 393Pennsylvania, Eastern 0.8 8 1,055Kentucky, Eastern 0.7 4 558New York, Northern 0.7 3 437Oregon 0.7 4 584Delaware 0.7 1 152
Spread of Rates of Other Government Sponsored Below Range SentencesAll Offenses
PROTECT ActPeriod
(5/1/03 - 6/24/04)
106
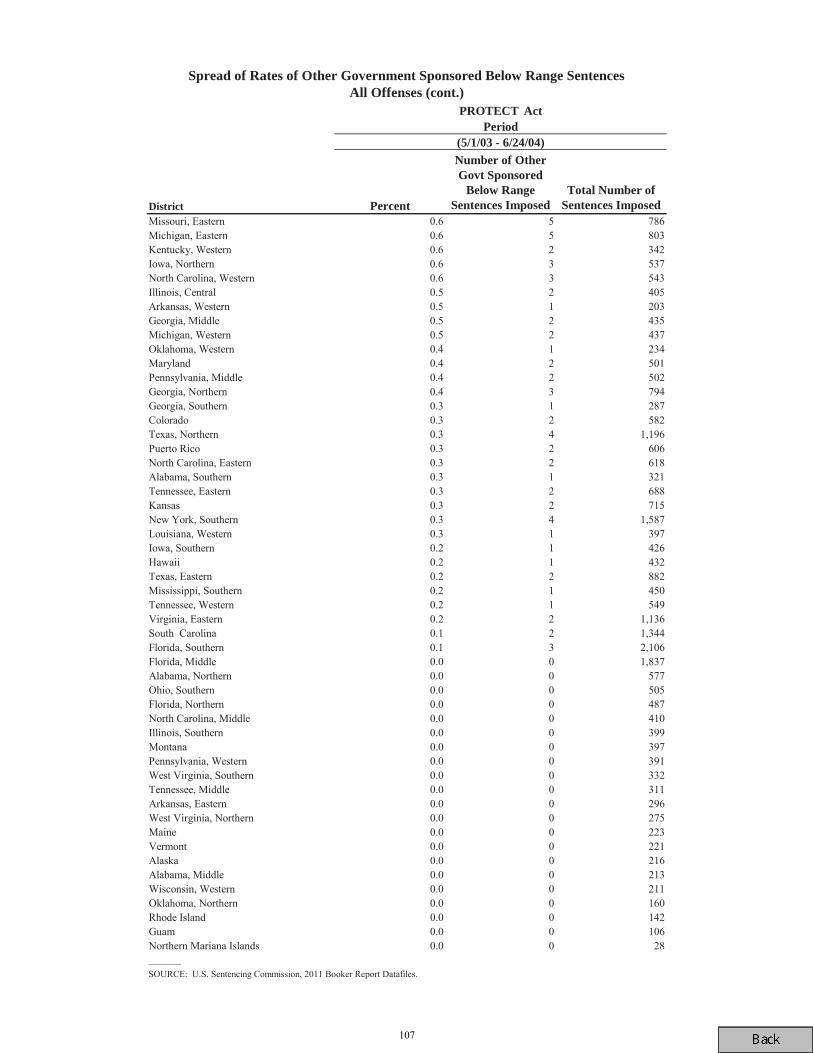
District Percent
Number of Other Govt Sponsored
Below Range Sentences Imposed
Total Number of Sentences Imposed
Missouri, Eastern 0.6 5 786Michigan, Eastern 0.6 5 803Kentucky, Western 0.6 2 342Iowa, Northern 0.6 3 537North Carolina, Western 0.6 3 543Illinois, Central 0.5 2 405Arkansas, Western 0.5 1 203Georgia, Middle 0.5 2 435Michigan, Western 0.5 2 437Oklahoma, Western 0.4 1 234Maryland 0.4 2 501Pennsylvania, Middle 0.4 2 502Georgia, Northern 0.4 3 794Georgia, Southern 0.3 1 287Colorado 0.3 2 582Texas, Northern 0.3 4 1,196Puerto Rico 0.3 2 606North Carolina, Eastern 0.3 2 618Alabama, Southern 0.3 1 321Tennessee, Eastern 0.3 2 688Kansas 0.3 2 715New York, Southern 0.3 4 1,587Louisiana, Western 0.3 1 397Iowa, Southern 0.2 1 426Hawaii 0.2 1 432Texas, Eastern 0.2 2 882Mississippi, Southern 0.2 1 450Tennessee, Western 0.2 1 549Virginia, Eastern 0.2 2 1,136South Carolina 0.1 2 1,344Florida, Southern 0.1 3 2,106Florida, Middle 0.0 0 1,837Alabama, Northern 0.0 0 577Ohio, Southern 0.0 0 505Florida, Northern 0.0 0 487North Carolina, Middle 0.0 0 410Illinois, Southern 0.0 0 399Montana 0.0 0 397Pennsylvania, Western 0.0 0 391West Virginia, Southern 0.0 0 332Tennessee, Middle 0.0 0 311Arkansas, Eastern 0.0 0 296West Virginia, Northern 0.0 0 275Maine 0.0 0 223Vermont 0.0 0 221Alaska 0.0 0 216Alabama, Middle 0.0 0 213Wisconsin, Western 0.0 0 211Oklahoma, Northern 0.0 0 160Rhode Island 0.0 0 142Guam 0.0 0 106Northern Mariana Islands 0.0 0 28_______SOURCE: U.S. Sentencing Commission, 2011 Booker Report Datafiles.
Spread of Rates of Other Government Sponsored Below Range SentencesAll Offenses (cont.)
PROTECT ActPeriod
(5/1/03 - 6/24/04)
107
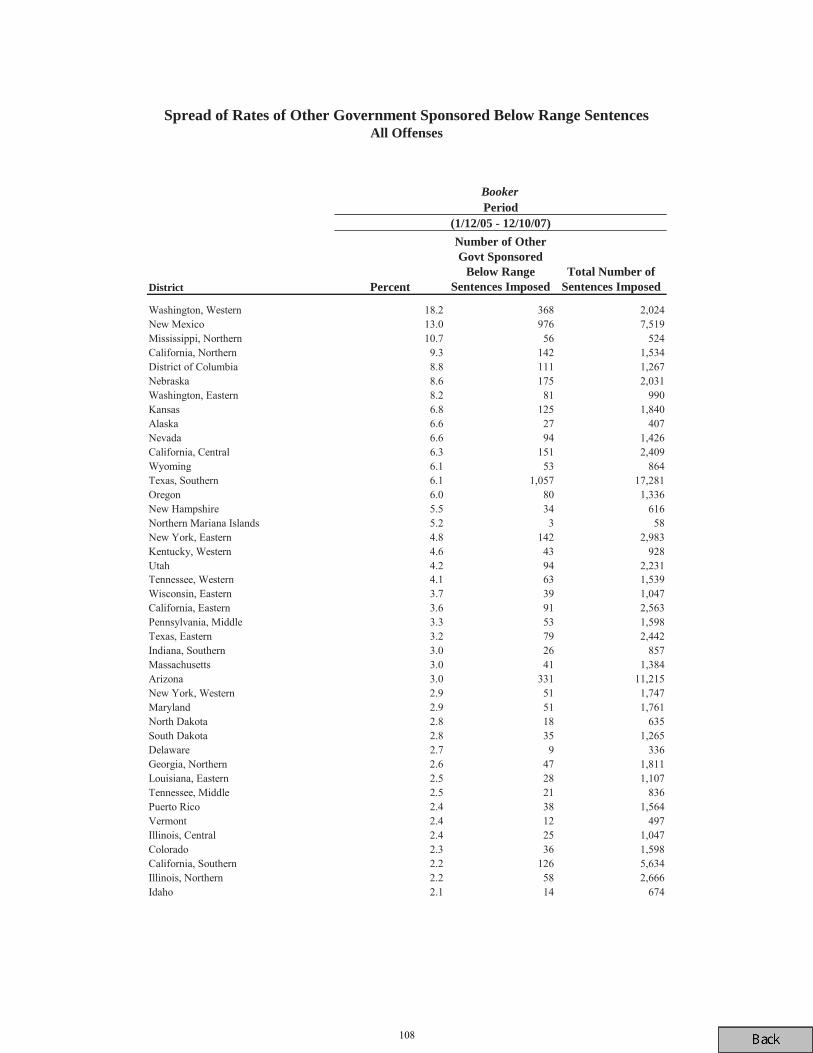
District Percent
Number of Other Govt Sponsored
Below Range Sentences Imposed
Total Number of Sentences Imposed
Washington, Western 18.2 368 2,024New Mexico 13.0 976 7,519Mississippi, Northern 10.7 56 524California, Northern 9.3 142 1,534District of Columbia 8.8 111 1,267Nebraska 8.6 175 2,031Washington, Eastern 8.2 81 990Kansas 6.8 125 1,840Alaska 6.6 27 407Nevada 6.6 94 1,426California, Central 6.3 151 2,409Wyoming 6.1 53 864Texas, Southern 6.1 1,057 17,281Oregon 6.0 80 1,336New Hampshire 5.5 34 616Northern Mariana Islands 5.2 3 58New York, Eastern 4.8 142 2,983Kentucky, Western 4.6 43 928Utah 4.2 94 2,231Tennessee, Western 4.1 63 1,539Wisconsin, Eastern 3.7 39 1,047California, Eastern 3.6 91 2,563Pennsylvania, Middle 3.3 53 1,598Texas, Eastern 3.2 79 2,442Indiana, Southern 3.0 26 857Massachusetts 3.0 41 1,384Arizona 3.0 331 11,215New York, Western 2.9 51 1,747Maryland 2.9 51 1,761North Dakota 2.8 18 635South Dakota 2.8 35 1,265Delaware 2.7 9 336Georgia, Northern 2.6 47 1,811Louisiana, Eastern 2.5 28 1,107Tennessee, Middle 2.5 21 836Puerto Rico 2.4 38 1,564Vermont 2.4 12 497Illinois, Central 2.4 25 1,047Colorado 2.3 36 1,598California, Southern 2.2 126 5,634Illinois, Northern 2.2 58 2,666Idaho 2.1 14 674
Spread of Rates of Other Government Sponsored Below Range SentencesAll Offenses
BookerPeriod
(1/12/05 - 12/10/07)
108
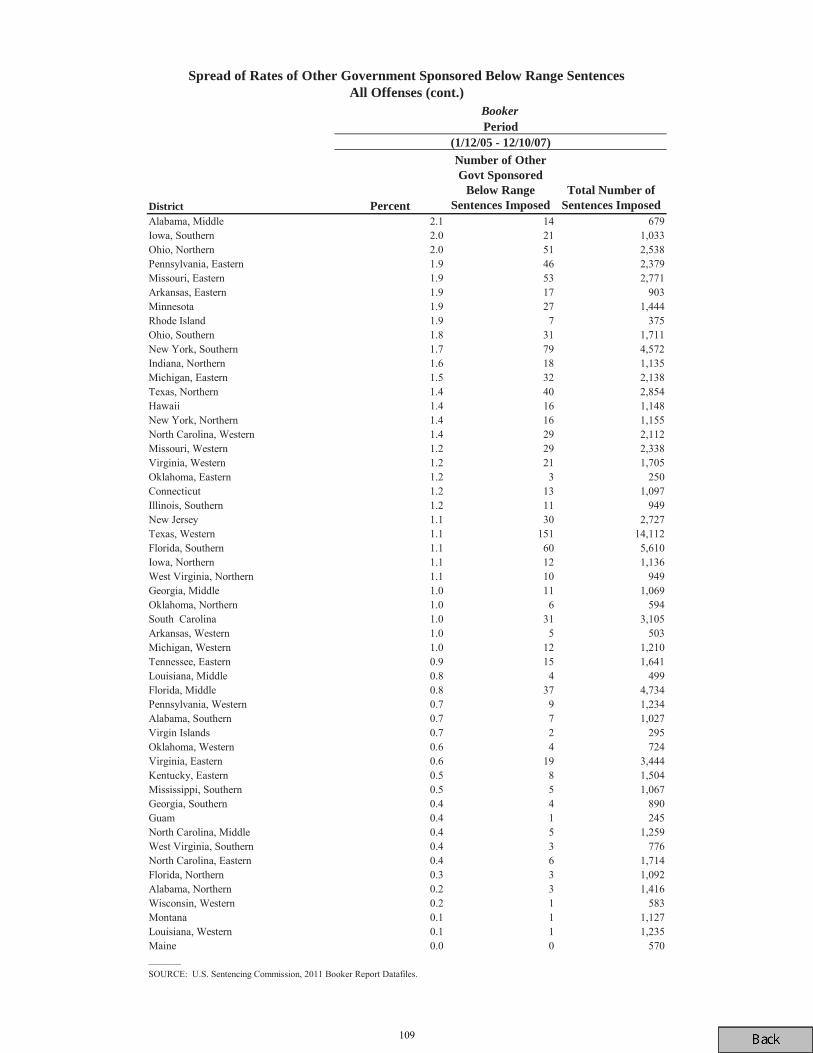
District Percent
Number of Other Govt Sponsored
Below Range Sentences Imposed
Total Number of Sentences Imposed
Alabama, Middle 2.1 14 679Iowa, Southern 2.0 21 1,033Ohio, Northern 2.0 51 2,538Pennsylvania, Eastern 1.9 46 2,379Missouri, Eastern 1.9 53 2,771Arkansas, Eastern 1.9 17 903Minnesota 1.9 27 1,444Rhode Island 1.9 7 375Ohio, Southern 1.8 31 1,711New York, Southern 1.7 79 4,572Indiana, Northern 1.6 18 1,135Michigan, Eastern 1.5 32 2,138Texas, Northern 1.4 40 2,854Hawaii 1.4 16 1,148New York, Northern 1.4 16 1,155North Carolina, Western 1.4 29 2,112Missouri, Western 1.2 29 2,338Virginia, Western 1.2 21 1,705Oklahoma, Eastern 1.2 3 250Connecticut 1.2 13 1,097Illinois, Southern 1.2 11 949New Jersey 1.1 30 2,727Texas, Western 1.1 151 14,112Florida, Southern 1.1 60 5,610Iowa, Northern 1.1 12 1,136West Virginia, Northern 1.1 10 949Georgia, Middle 1.0 11 1,069Oklahoma, Northern 1.0 6 594South Carolina 1.0 31 3,105Arkansas, Western 1.0 5 503Michigan, Western 1.0 12 1,210Tennessee, Eastern 0.9 15 1,641Louisiana, Middle 0.8 4 499Florida, Middle 0.8 37 4,734Pennsylvania, Western 0.7 9 1,234Alabama, Southern 0.7 7 1,027Virgin Islands 0.7 2 295Oklahoma, Western 0.6 4 724Virginia, Eastern 0.6 19 3,444Kentucky, Eastern 0.5 8 1,504Mississippi, Southern 0.5 5 1,067Georgia, Southern 0.4 4 890Guam 0.4 1 245North Carolina, Middle 0.4 5 1,259West Virginia, Southern 0.4 3 776North Carolina, Eastern 0.4 6 1,714Florida, Northern 0.3 3 1,092Alabama, Northern 0.2 3 1,416Wisconsin, Western 0.2 1 583Montana 0.1 1 1,127Louisiana, Western 0.1 1 1,235Maine 0.0 0 570_______SOURCE: U.S. Sentencing Commission, 2011 Booker Report Datafiles.
Spread of Rates of Other Government Sponsored Below Range SentencesAll Offenses (cont.)
BookerPeriod
(1/12/05 - 12/10/07)
109
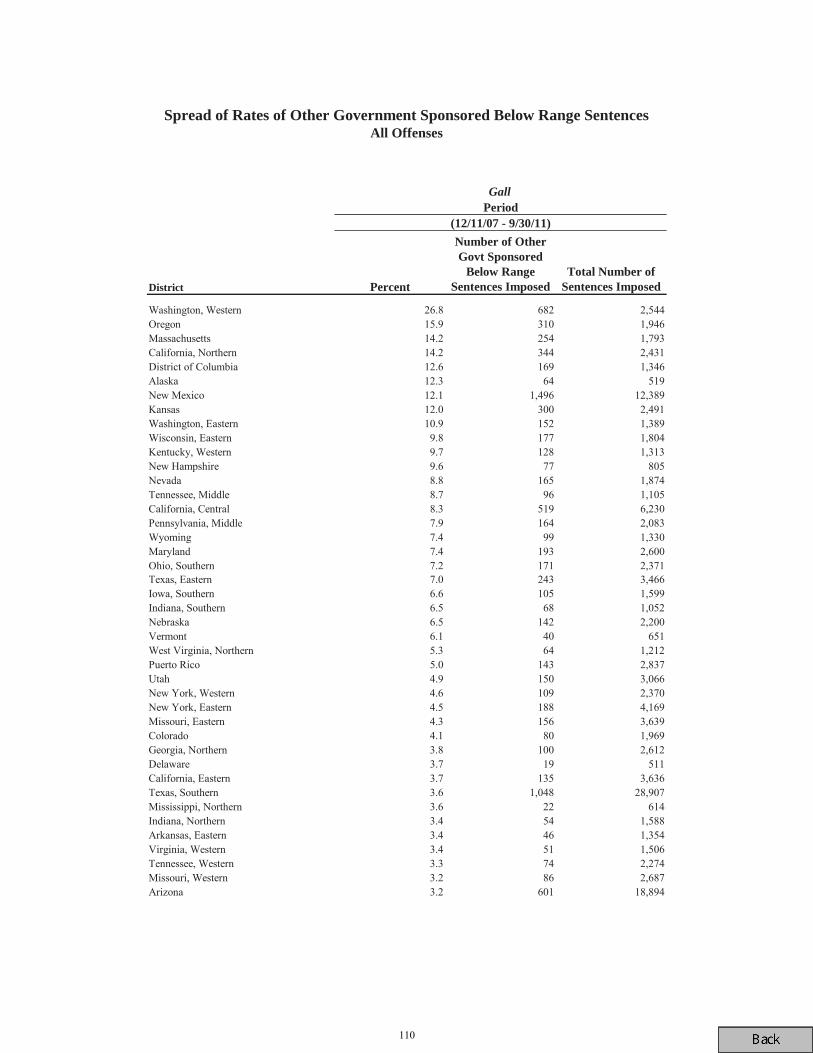
District Percent
Number of Other Govt Sponsored
Below Range Sentences Imposed
Total Number of Sentences Imposed
Washington, Western 26.8 682 2,544Oregon 15.9 310 1,946Massachusetts 14.2 254 1,793California, Northern 14.2 344 2,431District of Columbia 12.6 169 1,346Alaska 12.3 64 519New Mexico 12.1 1,496 12,389Kansas 12.0 300 2,491Washington, Eastern 10.9 152 1,389Wisconsin, Eastern 9.8 177 1,804Kentucky, Western 9.7 128 1,313New Hampshire 9.6 77 805Nevada 8.8 165 1,874Tennessee, Middle 8.7 96 1,105California, Central 8.3 519 6,230Pennsylvania, Middle 7.9 164 2,083Wyoming 7.4 99 1,330Maryland 7.4 193 2,600Ohio, Southern 7.2 171 2,371Texas, Eastern 7.0 243 3,466Iowa, Southern 6.6 105 1,599Indiana, Southern 6.5 68 1,052Nebraska 6.5 142 2,200Vermont 6.1 40 651West Virginia, Northern 5.3 64 1,212Puerto Rico 5.0 143 2,837Utah 4.9 150 3,066New York, Western 4.6 109 2,370New York, Eastern 4.5 188 4,169Missouri, Eastern 4.3 156 3,639Colorado 4.1 80 1,969Georgia, Northern 3.8 100 2,612Delaware 3.7 19 511California, Eastern 3.7 135 3,636Texas, Southern 3.6 1,048 28,907Mississippi, Northern 3.6 22 614Indiana, Northern 3.4 54 1,588Arkansas, Eastern 3.4 46 1,354Virginia, Western 3.4 51 1,506Tennessee, Western 3.3 74 2,274Missouri, Western 3.2 86 2,687Arizona 3.2 601 18,894
Spread of Rates of Other Government Sponsored Below Range SentencesAll Offenses
GallPeriod
(12/11/07 - 9/30/11)
110
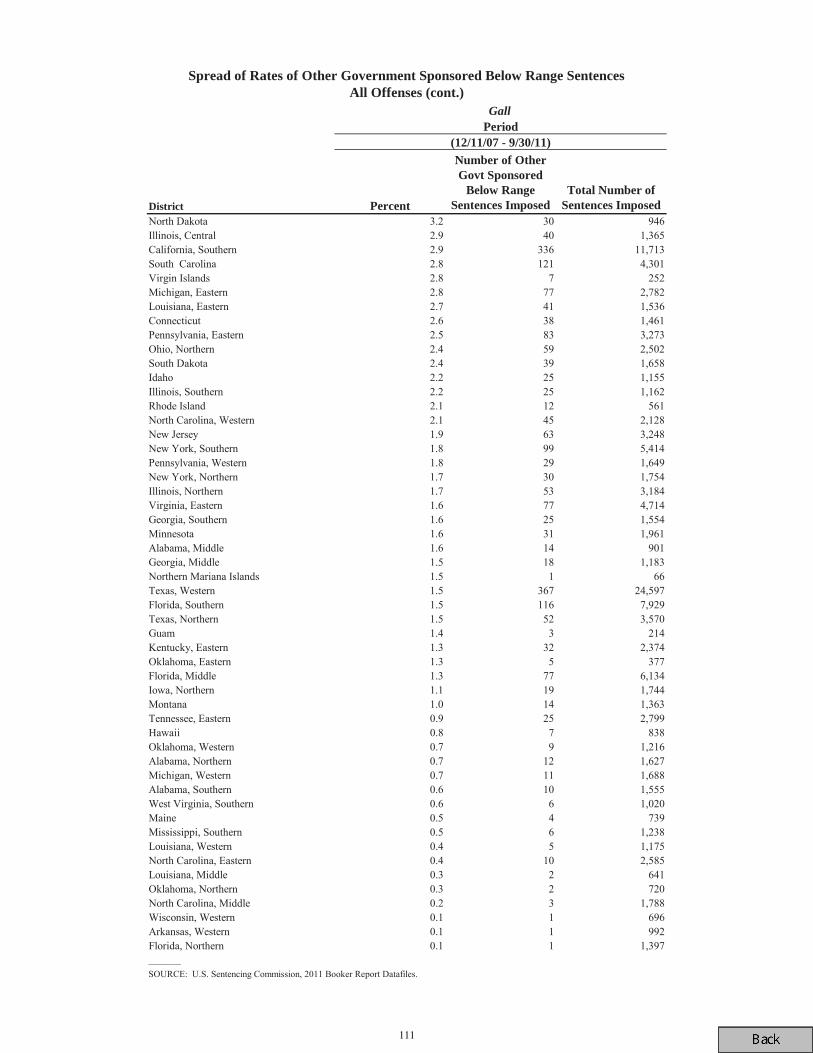
District Percent
Number of Other Govt Sponsored
Below Range Sentences Imposed
Total Number of Sentences Imposed
North Dakota 3.2 30 946Illinois, Central 2.9 40 1,365California, Southern 2.9 336 11,713South Carolina 2.8 121 4,301Virgin Islands 2.8 7 252Michigan, Eastern 2.8 77 2,782Louisiana, Eastern 2.7 41 1,536Connecticut 2.6 38 1,461Pennsylvania, Eastern 2.5 83 3,273Ohio, Northern 2.4 59 2,502South Dakota 2.4 39 1,658Idaho 2.2 25 1,155Illinois, Southern 2.2 25 1,162Rhode Island 2.1 12 561North Carolina, Western 2.1 45 2,128New Jersey 1.9 63 3,248New York, Southern 1.8 99 5,414Pennsylvania, Western 1.8 29 1,649New York, Northern 1.7 30 1,754Illinois, Northern 1.7 53 3,184Virginia, Eastern 1.6 77 4,714Georgia, Southern 1.6 25 1,554Minnesota 1.6 31 1,961Alabama, Middle 1.6 14 901Georgia, Middle 1.5 18 1,183Northern Mariana Islands 1.5 1 66Texas, Western 1.5 367 24,597Florida, Southern 1.5 116 7,929Texas, Northern 1.5 52 3,570Guam 1.4 3 214Kentucky, Eastern 1.3 32 2,374Oklahoma, Eastern 1.3 5 377Florida, Middle 1.3 77 6,134Iowa, Northern 1.1 19 1,744Montana 1.0 14 1,363Tennessee, Eastern 0.9 25 2,799Hawaii 0.8 7 838Oklahoma, Western 0.7 9 1,216Alabama, Northern 0.7 12 1,627Michigan, Western 0.7 11 1,688Alabama, Southern 0.6 10 1,555West Virginia, Southern 0.6 6 1,020Maine 0.5 4 739Mississippi, Southern 0.5 6 1,238Louisiana, Western 0.4 5 1,175North Carolina, Eastern 0.4 10 2,585Louisiana, Middle 0.3 2 641Oklahoma, Northern 0.3 2 720North Carolina, Middle 0.2 3 1,788Wisconsin, Western 0.1 1 696Arkansas, Western 0.1 1 992Florida, Northern 0.1 1 1,397_______SOURCE: U.S. Sentencing Commission, 2011 Booker Report Datafiles.
Spread of Rates of Other Government Sponsored Below Range SentencesAll Offenses (cont.)
GallPeriod
(12/11/07 - 9/30/11)
111

Koon
112

Koon
113
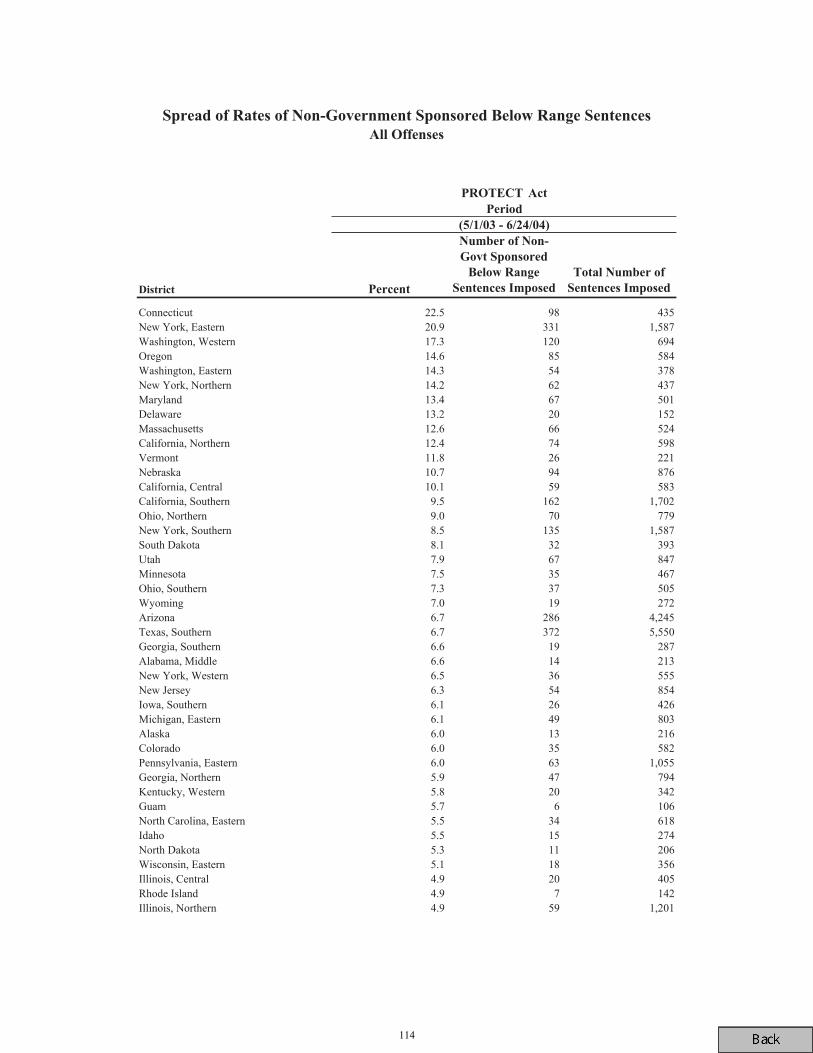
114

115
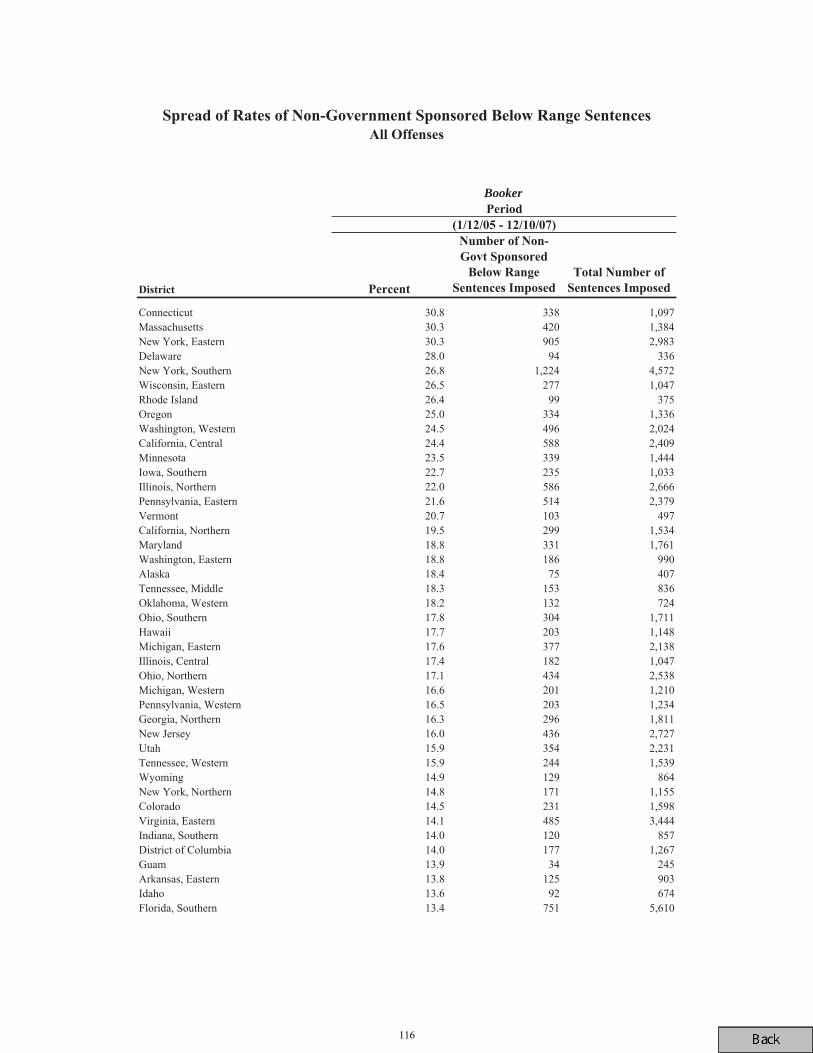
Booker
116
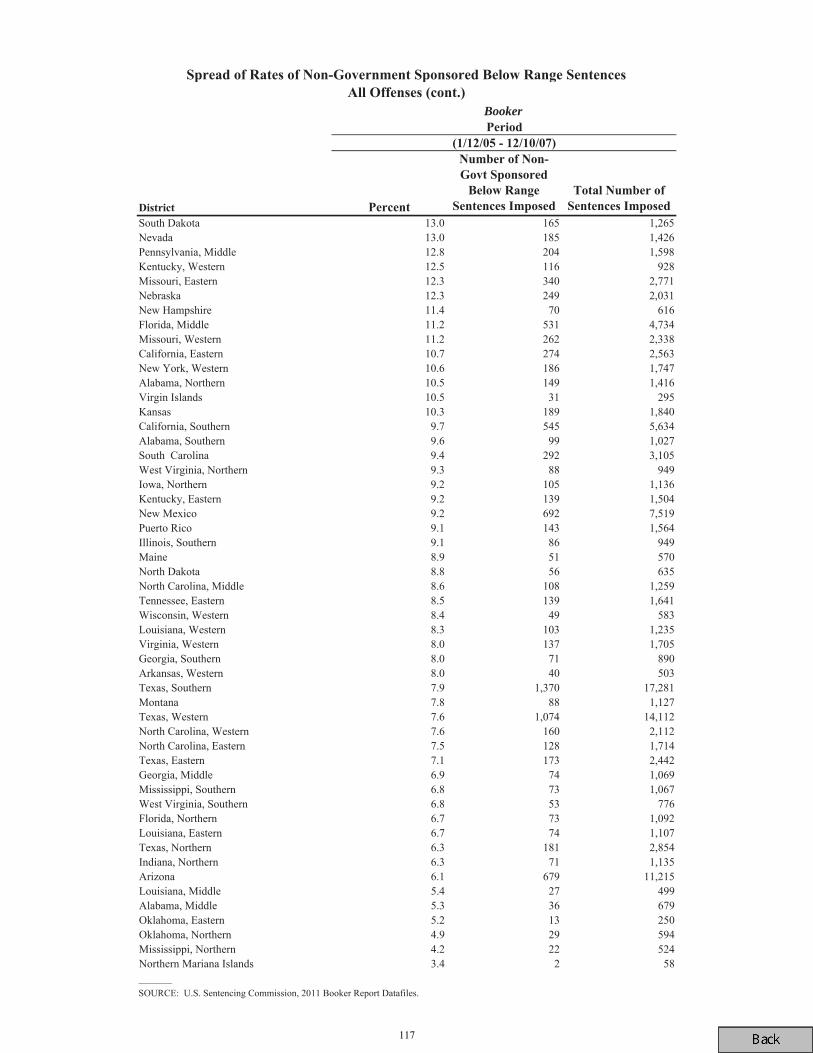
Booker
117
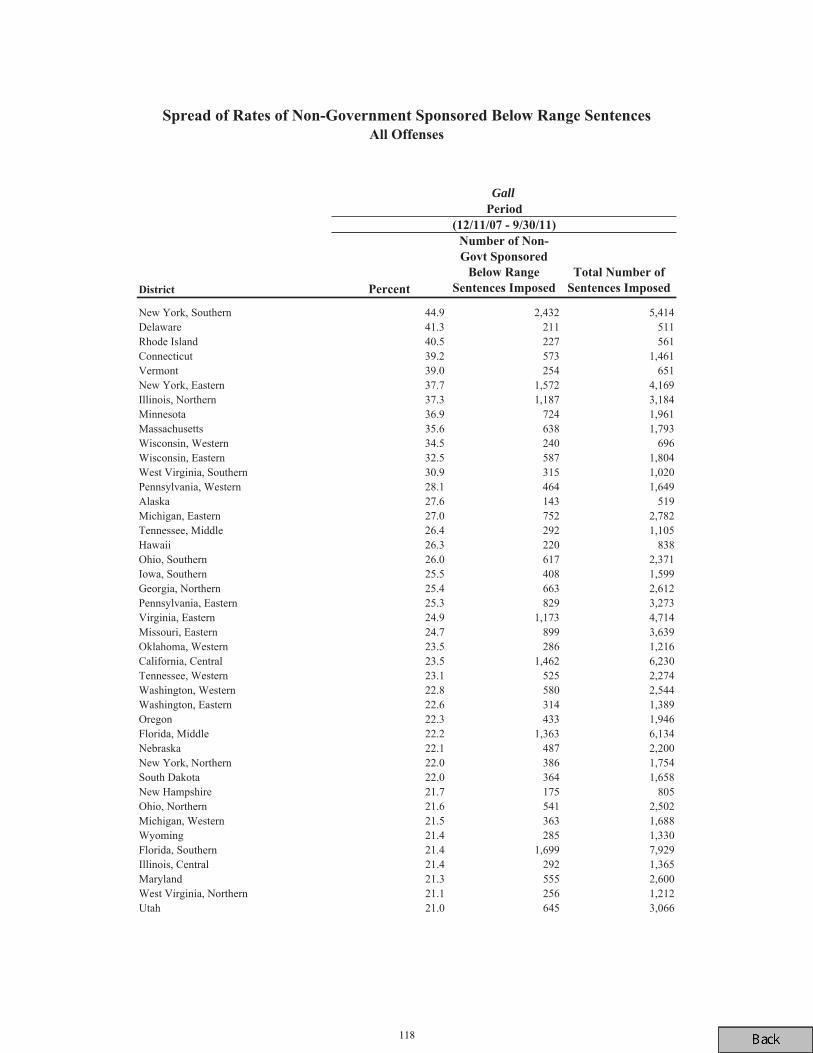
Gall
118
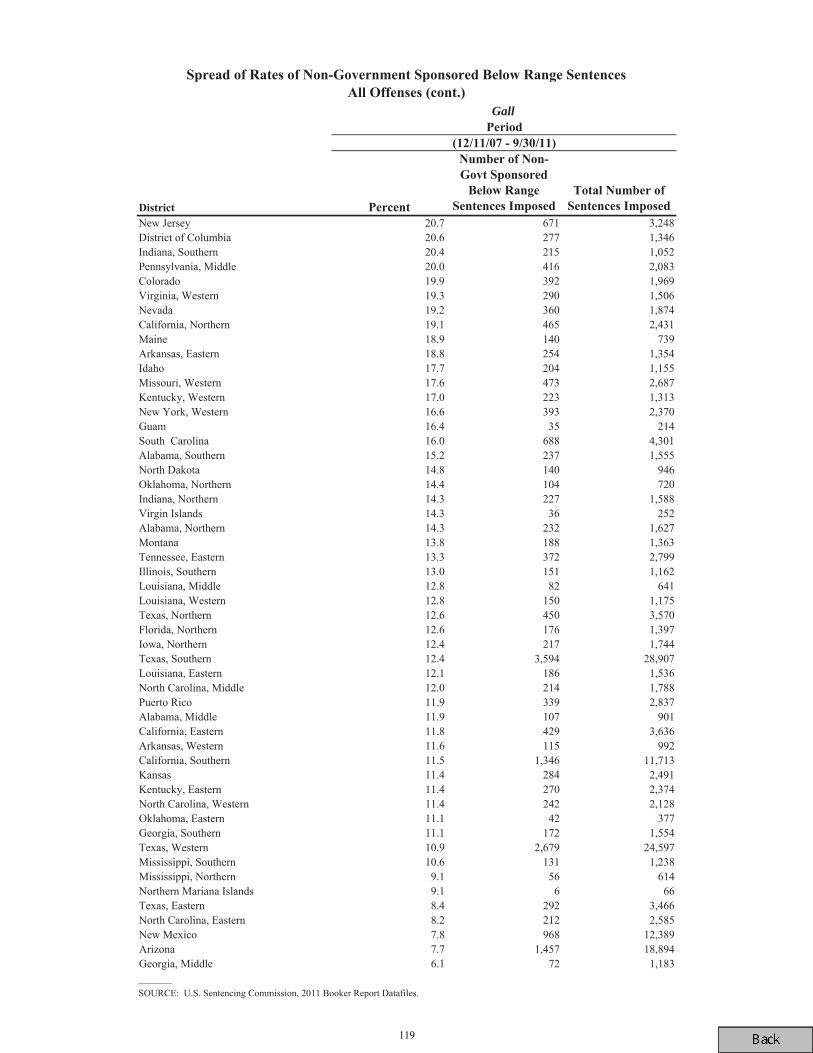
Gall
119