statistical annex of european economyec.europa.eu/economy_finance/publications/european... · data...
TRANSCRIPT

Economic and Financial Affairs
STATISTICAL ANNEX of European Economy
SPRING 2014

X X
X X
1
EUROPEAN COMMISSION DIRECTORATE GENERAL ECFIN ECONOMIC AND FINANCIAL AFFAIRS
SSttaattiissttiiccaall AAnnnneexx
ooff
EEuurrooppeeaann EEccoonnoommyy
SSPPRRIINNGG 22001144
FFoorr iinnqquuiirriieess ccoonncceerrnniinngg tthhee ddaattaa ccoonnttaacctt:: CCuutt--ooffff ddaattee:: 2244 AApprriill 22001144 AA.. AAvvddoouullooss tteell.. ++3322..22..2299 993333 6633 eemmaaiill:: aannttoonniiss..aavvddoouullooss@@eecc..eeuurrooppaa..eeuu NN.. DDooyyllee tteell.. ++3322..22..2299 993344 6600 eemmaaiill:: nnooeell..ddooyyllee@@eecc..eeuurrooppaa..eeuu

2
X X
X X

3
NOTES ON THE STATISTICAL ANNEX 7
SYMBOLS AND ABBREVIATIONS 8
NOTES ON THE TABLES 9
TABLES 29
POPULATION AND LABOUR MARKET1. Total population (National accounts) 301. Total population (National accounts) 312. Employment, persons; all domestic industries (National accounts) 322. Employment, persons; all domestic industries (National accounts) 333. Unemployment rate; total 343. Unemployment rate; total 35
OUTPUT4. Gross domestic product at current market prices 364. Gross domestic product at current market prices 375. Gross domestic product at current market prices 385. Gross domestic product at current market prices 396. Gross domestic product at current market prices 406. Gross domestic product at current market prices 417. Gross domestic product at current market prices 427. Gross domestic product at current market prices 438. Gross domestic product at current market prices per head of population 448. Gross domestic product at current market prices per head of population 459. Gross domestic product at current market prices per head of population 469. Gross domestic product at current market prices per head of population 4710. Gross domestic product at 2005 market prices 4810. Gross domestic product at 2005 market prices 4911. Gross domestic product at 2005 market prices per person employed 5011. Gross domestic product at 2005 market prices per person employed 5112. Industrial production; construction excluded 5212. Industrial production; construction excluded 53
NATIONAL FINAL USES13. Private final consumption expenditure at current prices 5413. Private final consumption expenditure at current prices 5514. Private final consumption expenditure at current prices per head of population 5614. Private final consumption expenditure at current prices per head of population 5715. Private final consumption expenditure at current prices per head of population 5815. Private final consumption expenditure at current prices per head of population 5916. Private final consumption expenditure at 2005 prices 6016. Private final consumption expenditure at 2005 prices 6117. Final consumption expenditure of general government at current prices 6217. Final consumption expenditure of general government at current prices 6318. Final consumption expenditure of general government at 2005 prices 6418. Final consumption expenditure of general government at 2005 prices 6519. Gross fixed capital formation at current prices; total economy 6619. Gross fixed capital formation at current prices; total economy 6720. Gross fixed capital formation at 2005 prices; total economy 6820. Gross fixed capital formation at 2005 prices; total economy 6921. Changes in inventories and acquisitions less disposals of valuables at current prices; total economy ……………………………………………………………………………………… 70
………………………………………………………………………………………
………………………………………………………………………………………
………………………………………………………………………………………
………………………………………………………………………………………
………………………………………………………………………………………
………………………………………………………………………………………………………………………………………………………………………………
………………………………………………………………………………………………………………………………………………………………………………
………………………………………………………………………………………
………………………………………………………………………………………………………………………………………………………………………………
………………………………………………………………………………………………………………………………………………………………………………
………………………………………………………………………………………
………………………………………………………………………………………………………………………………………………………………………………………………………………………………………………………………………
………………………………………………………………………………………………………………………………………………………………………………
………………………………………………………………………………………
………………………………………………………………………………………………………………………………………………………………………………
………………………………………………………………………………………
………………………………………………………………………………………
………………………………………………………………………………………
………………………………………………………………………………………
………………………………………………………………………………………………………………………………………………………………………………
………………………………………………………………………………………………………………………………………………………………………………
………………………………………………………………………………………
………………………………………………………………………………………
………………………………………………………………………………………
………………………………………………………………………………………
………………………………………………………………………………………
………………………………………………………………………………………………………………………………………………………………………………………………………………………………………………………………………
………………………………………………………………………………………………………………………………………………………………………………………………………………………………………………………………………
………………………………………………………………………………………
………………………………………………………………………………………
4
21. Changes in inventories and acquisitions less disposals of valuables at current prices; total economy 7122. Domestic demand including stocks at current prices 7222. Domestic demand including stocks at current prices 7323. Domestic demand including stocks at 2005 prices 7423. Domestic demand including stocks at 2005 prices 75
PRICES24. Price deflator gross domestic product at market prices ………………………………………… 7624. Price deflator gross domestic product at market prices 7725. Price deflator private final consumption expenditure 7825. Price deflator private final consumption expenditure 7926. Price deflator exports of goods and services 8026. Price deflator exports of goods and services 8127. Price deflator imports of goods and services 8227. Price deflator imports of goods and services 8328. Terms of trade goods and services (National accounts) 8428. Terms of trade goods and services (National accounts) 85
WAGE COSTS29. Nominal compensation per employee; total economy 8629. Nominal compensation per employee; total economy 8730. Real compensation per employee, deflator GDP; total economy 8830. Real compensation per employee, deflator GDP; total economy 8931. Real compensation per employee, deflator private consumption; total economy 9031. Real compensation per employee, deflator private consumption; total economy 9132. Adjusted wage share; total economy; as percentage of GDP at current factor cost 1) 9232. Adjusted wage share; total economy; as percentage of GDP at current factor cost 1) 9333. Nominal unit labour costs; total economy 1) 9433. Nominal unit labour costs; total economy 1) 9534. Real unit labour costs; total economy 1) 9634. Real unit labour costs; total economy 1) 9735. Nominal unit labour costs; total economy 1) 9835. Nominal unit labour costs; total economy 1) 99
FOREIGN TRADE AND CURRENT BALANCE36. Exports of goods and services at current prices (National accounts) 10036. Exports of goods and services at current prices (National accounts) 10137. Exports of goods and services at 2005 prices 10237. Exports of goods and services at 2005 prices 10338. Intra EU exports of goods 1) 10438. Intra EU exports of goods 1) 10539. Extra EU exports of goods 1) 10639. Extra EU exports of goods 1) 10740. Imports of goods and services at current prices (National accounts) 10840. Imports of goods and services at current prices (National accounts) 10941. Imports of goods and services at 2005 prices 11041. Imports of goods and services at 2005 prices 11142. Intra EU imports of goods 1) 11242. Intra EU imports of goods 1) 11343. Extra EU imports of goods 1) 11443. Extra EU imports of goods 1) 11544. Balance on current transactions with the rest of the world (National accounts) 11644. Balance on current transactions with the rest of the world (National accounts) 117
SAVING45. Gross national saving …………………………………………………………………………………… 11845. Gross national saving …………………………………………………………………………………… 11946. Gross saving; private sector …………………………………………………………………………………… 12046. Gross saving; private sector …………………………………………………………………………………… 12147. Gross saving; general government …………………………………………………………………………………… 12247. Gross saving; general government …………………………………………………………………………………… 123
………………………………………………………………………………………
………………………………………………………………………………………………………………………………………………………………………………
………………………………………………………………………………………………………………………………………………………………………………
………………………………………………………………………………………
………………………………………………………………………………………
………………………………………………………………………………………
………………………………………………………………………………………
………………………………………………………………………………………
………………………………………………………………………………………
………………………………………………………………………………………………………………………………………………………………………………………………………………………………………………………………………
………………………………………………………………………………………
………………………………………………………………………………………………………………………………………………………………………………………………………………………………………………………………………………………………………………………………………………………………
………………………………………………………………………………………
………………………………………………………………………………………
………………………………………………………………………………………………………………………………………………………………………………
………………………………………………………………………………………………………………………………………………………………………………
………………………………………………………………………………………
………………………………………………………………………………………
………………………………………………………………………………………………………………………………………………………………………………
………………………………………………………………………………………
………………………………………………………………………………………………………………………………………………………………………………
………………………………………………………………………………………………………………………………………………………………………………
………………………………………………………………………………………………………………………………………………………………………………
………………………………………………………………………………………
………………………………………………………………………………………
………………………………………………………………………………………………………………………………………………………………………………
………………………………………………………………………………………
………………………………………………………………………………………
………………………………………………………………………………………………………………………………………………………………………………………………………………………………………………………………………
………………………………………………………………………………………
5
MONEY INTEREST RATES AND EXCHANGE RATES48. Nominal short-term interest rates 12448. Nominal short-term interest rates 12549. Nominal long-term interest rates 12649. Nominal long-term interest rates 12750. ECU-EUR exchange rates 1) 12850. ECU-EUR exchange rates 1) 12951. Conversion rates between the euro and the former national currencies of the Euro-Zone 13152. Nominal effective exchange rates 13252. Nominal effective exchange rates 133
GENERAL GOVERNMENT (% OF GDP AT MARKET PRICES)53. Taxes linked to imports and production (indirect taxes); general government 13453. Taxes linked to imports and production (indirect taxes); general government 13554. Current taxes on income and wealth (direct taxes); general government 13654. Current taxes on income and wealth (direct taxes); general government 13755. Social contributions received; general government 13855. Social contributions received; general government 13956. Actual social contributions received; general government 14056. Actual social contributions received; general government 14157. Other current revenue including sales; general government 14257. Other current revenue including sales; general government 14358. Total current revenue; general government 14458. Total current revenue; general government 14559. Final consumption expenditure of general government 14659. Final consumption expenditure of general government 14760. Collective consumption expenditure 14860. Collective consumption expenditure 14961. Social transfers in kind 15061. Social transfers in kind 15162. Compensation of employees; general government 15262. Compensation of employees; general government 15363. Intermediate consumption; general government 15463. Intermediate consumption; general government 15564. Social benefits other than social transfers in kind; general government 15664. Social benefits other than social transfers in kind; general government 15765. Social transfers in kind supplied to households via market producers; general government 15865. Social transfers in kind supplied to households via market producers; general government 15966. Interest including flows on swaps and FRAs (Forward Rate Agreements); general government 16066. Interest including flows on swaps and FRAs (Forward Rate Agreements); general government 16167. Subsidies; general government 16267. Subsidies; general government 16368. Other current expenditure; general government 16468. Other current expenditure; general government 16569. Total current expenditure; general government 16669. Total current expenditure; general government 16770. Gross saving; general government 16870. Gross saving; general government 16971. Capital transfers received; general government 17071. Capital transfers received; general government 17172. Total revenue; general government 17272. Total revenue; general government 17373. Gross fixed capital formation; general government ……………………………………………………………………………………174
………………………………………………………………………………………………………………………………………………………………………………………………………………………………………………………………………………………………………………………………………………………………
………………………………………………………………………………………………………………………………………………………………………………………………………………………………………………………………………
………………………………………………………………………………………………………………………………………………………………………………………………………………………………………………………………………………………………………………………………………………………………
………………………………………………………………………………………………………………………………………………………………………………
………………………………………………………………………………………
………………………………………………………………………………………
………………………………………………………………………………………………………………………………………………………………………………………………………………………………………………………………………
………………………………………………………………………………………
………………………………………………………………………………………………………………………………………………………………………………………………………………………………………………………………………………………………………………………………………………………………
………………………………………………………………………………………………………………………………………………………………………………………………………………………………………………………………………………………………………………………………………………………………………………………………………………………………………………………
………………………………………………………………………………………………………………………………………………………………………………
………………………………………………………………………………………………………………………………………………………………………………
………………………………………………………………………………………………………………………………………………………………………………………………………………………………………………………………………………………………………………………………………………………………………………………………………………………………………………………………………………………………………………………………………………
………………………………………………………………………………………………………………………………………………………………………………………………………………………………………………………………………………………………………………………………………………………………
………………………………………………………………………………………………………………………………………………………………………………………………………………………………………………………………………
………………………………………………………………………………………………………………………………………………………………………………………………………………………………………………………………………………………………………………………………………………………………

6
73. Gross fixed capital formation; general government 17574. Other capital expenditure, including capital transfers; general government 1) 17674. Other capital expenditure, including capital transfers; general government 1) 17775. Total expenditure; general government 1) 17875. Total expenditure; general government 1) 17976. Net lending (+) or net borrowing (-); general government 1) 18076. Net lending (+) or net borrowing (-); general government 1) 18177. Net lending (+) or net borrowing (-) excluding interest; general government 1) 18277. Net lending (+) or net borrowing (-) excluding interest; general government 1) 18378. General government consolidated gross debt 18478. General government consolidated gross debt 185
MAIN ECONOMIC INDICATORS 1961-201579. Belgium 18680. Germany 18781. Estonia 18882. Ireland 18983. Greece 19084. Spain 19185. France 19286. Italy 19387. Cyprus 19488. Latvia 19589. Luxembourg 19690. Malta 19791. Netherlands 19892. Austria 19993. Portugal 20094. Slovenia 20195. Slovakia 20296. Finland 20397. EA-18 20498. EA-12 1) 20599. Bulgaria 206100. Czech Republic 207101. Denmark 208102. Croatia 209103. Lithuania 210104. Hungary 211105. Poland 212106. Romania 213107. Sweden 214108. United Kingdom 215109. EU-28 216110. EU-15 1) 217111. Macedonia, the former Yugoslav R 218112. Iceland 219113. Turkey 220114. Montenegro 221115. Serbia 222116. United States 223117. Japan 224
………………………………………………………………………………………
………………………………………………………………………………………………………………………………………………………………………………
………………………………………………………………………………………
………………………………………………………………………………………
………………………………………………………………………………………
………………………………………………………………………………………………………………………………………………………………………………………………………………………………………………………………………
………………………………………………………………………………………
………………………………………………………………………………………
………………………………………………………………………………………………………………………………………………………………………………………………………………………………………………………………………………………………………………………………………………………………………………………………………………………………………………………
………………………………………………………………………………………
………………………………………………………………………………………
………………………………………………………………………………………………………………………………………………………………………………
………………………………………………………………………………………………………………………………………………………………………………………………………………………………………………………………………………………………………………………………………………………………
………………………………………………………………………………………
………………………………………………………………………………………………………………………………………………………………………………
………………………………………………………………………………………………………………………………………………………………………………
………………………………………………………………………………………………………………………………………………………………………………
………………………………………………………………………………………………………………………………………………………………………………
………………………………………………………………………………………
………………………………………………………………………………………
………………………………………………………………………………………………………………………………………………………………………………………………………………………………………………………………………
………………………………………………………………………………………………………………………………………………………………………………
………………………………………………………………………………………………………………………………………………………………………………………………………………………………………………………………………………………………………………………………………………………………
………………………………………………………………………………………
………………………………………………………………………………………………………………………………………………………………………………………………………………………………………………………………………
………………………………………………………………………………………
………………………………………………………………………………………

7
SSTTAATTIISSTTIICCAALL AANNNNEEXX
LLoonngg--tteerrmm mmaaccrrooeeccoonnoommiicc sseerriieess
NNootteess oonn tthhee ssttaattiissttiiccaall aannnneexx GGeenneerraall rreemmaarrkkss TThhiiss eeddiittiioonn ooff EEuurrooppeeaann EEccoonnoommyy ggiivveess iinn iittss ssttaattiissttiiccaall aannnneexx uuppddaatteedd ttiimmee sseerriieess ooff aannnnuuaall ddaattaa.. UUnnlleessss ootthheerrwwiissee ssttaatteedd,, ddaattaa ffoorr MMeemmbbeerr SSttaatteess aarree bbaasseedd oonn tthhee EESSAA 9955 ssyysstteemm.. FFoorr GGeerrmmaannyy,, IIrreellaanndd aanndd PPoorrttuuggaall,, ddaattaa ssttaarrtt iinn tthhee llaattee 11998800ss oorr eeaarrllyy 11999900ss.. FFoorr BBuullggaarriiaa,, CCyypprruuss,, CCrrooaattiiaa,, CCzzeecchh RReeppuubblliicc,, EEssttoonniiaa,, HHuunnggaarryy,, LLaattvviiaa,, LLiitthhuuaanniiaa,, MMaallttaa,, PPoollaanndd,, RRoommaanniiaa,, SSlloovvaakkiiaa aanndd SSlloovveenniiaa ddaattaa ssttaarrtt iinn tthhee eeaarrllyy oorr mmiidd--11999900ss.. FFoorr aallll ootthheerr MMeemmbbeerr SSttaatteess mmoosstt ddaattaa hhaavvee bbeeeenn rreeppoorrtteedd ffoorr lloonnggeerr ppeerriiooddss.. EESSAA 7799 ddaattaa aarree uusseedd ffoorr tthhee eeaarrlliieerr yyeeaarrss.. PPuubblliicc ffiinnaannccee EESSAA 9955 ddaattaa ssttaarrtt aatt tthhee eeaarrlliieesstt iinn 11997700,, tthheeyy aarree ggrraadduuaallllyy bbeeccoommiinngg aavvaaiillaabbllee aanndd ccaannnnoott bbee lliinnkkeedd wwiitthh tthhee ffoorrmmeerr ddeeffiinniittiioonnss sseerriieess.. SSeeee aallssoo tthhee eexxppllaannaattoorryy nnootteess oonn tthhee rreessppeeccttiivvee ttaabblleess.. DDaattaa ffoorr TTuurrkkeeyy,, MMoonntteenneeggrroo,, tthhee FFYYRROOMM,, IIcceellaanndd aanndd SSeerrbbiiaa aarree iinncclluuddeedd iinn tthhiiss ppuubblliiccaattiioonn.. FFoorr tthhee UUSSAA aanndd JJaappaann tthhee ddeeffiinniittiioonnss aarree aass iinn tthhee SSNNAA.. DDaattaa ssoouurrcceess aarree EEuurroossttaatt,, nnaattiioonnaall ppuubblliiccaattiioonnss,, tthhee OOEECCDD aanndd tthhee EEuurrooppeeaann CCeennttrraall BBaannkk.. FFiigguurreess ffoorr 22001144 aanndd 22001155 aarree ffoorreeccaassttss mmaaddee bbyy CCoommmmiissssiioonn ssttaaffff uussiinngg tthhee ddeeffiinniittiioonnss aanndd llaatteesstt ffiigguurreess aavvaaiillaabbllee ffrroomm nnaattiioonnaall ssoouurrcceess.. TThheessee sseerriieess aarree nnoott ffuullllyy ccoommppaarraabbllee wwiitthh tthhee ccoorrrreessppoonnddiinngg ffiigguurreess ffoorr eeaarrlliieerr yyeeaarrss;; hhoowweevveerr,, tthhee ddiissccoonnttiinnuuiittiieess ooff tthhee lleevveellss ooff tthheessee sseerriieess hhaavvee bbeeeenn eelliimmiinnaatteedd.. TThhee ffoorreeccaassttss ffoorr 22001144 aanndd 22001155 aarree bbaasseedd oonn ddaattaa aavvaaiillaabbllee uupp ttoo 2244 AApprriill 22001144.. SSeeee aallssoo tthhee eexxppllaannaattoorryy nnootteess oonn tthhee ttaabblleess ffoorr ssppeecciiffiicc ddeeffiinniittiioonnss..

8
Symbols and abbreviations
- nil HU Hungary: not available MT Malta% percent or percentage NL NetherlandsMio million AT AustriaMrd 1000 million PL PolandEUR euro PT PortugalECU European currency unit RO RomaniaPPS purchasing power standard SI SloveniaGDP gross domestic product, at market prices SK SlovakiaESA European system of accounts FI FinlandSNA System of national accounts SE SwedenULC Unit labour costs UK United Kingdom
D-W Germany prior to unification in 1990 MK F.Y.R. of MacedoniaEU-28 European Union ME MontenegroEA-18 euro area IS IcelandEU-15 former EU-15 TR TurkeyEA-12 former euro area RS Serbia
BE Belgium US United StatesBG Bulgaria JP JapanCZ Czech RepublicDK DenmarkDE GermanyEE EstoniaIE IrelandEL GreeceES SpainFR FranceHR Croatia IT ItalyCY CyprusLV LatviaLT LithuaniaLU Luxembourg

9
Notes on the tables PPrreelliimmiinnaarryy rreemmaarrkkss NNootteess ddrraaww hheeaavviillyy oonn tthhee mmeetthhooddoollooggiiccaall gguuiiddee ttoo tthhee EEuurrooppeeaann SSyysstteemm ooff AAccccoouunnttss ((EESSAA 9955)).. FFoorr kkeeyy vvaarriiaabblleess,, EESSAA 9955 ccooddeess aarree mmeennttiioonneedd iinn bbrraacckkeettss.. FFoorr mmoorree iinnffoorrmmaattiioonn iinn aaddddiittiioonn ttoo tthhee nnootteess pprreesseenntteedd ffoorr iinnddiivviidduuaall ttaabblleess,, tthhee rreeaaddeerr ccaann rreeffeerr ttoo tthhee rreessppeeccttiivvee ppaarrttss ooff tthhee EESSAA 9955 mmeetthhooddoollooggyy GGeenneerraall rreemmaarrkkss oonn tthhee iinnssttiittuuttiioonnaall sseeccttoorrss
TThhee EEuurrooppeeaann SSyysstteemm ooff AAccccoouunnttss ((EESSAA 11999955)) ssuubbddiivviiddeess tthhee ttoottaall eeccoonnoommyy ((EESSAA 11999955--ccooddee:: SS..11)) iinnttoo iinnssttiittuuttiioonnaall sseeccttoorrss::
CCoorrppoorraattiioonnss TThhee sseeccttoorr nnoonn--ffiinnaanncciiaall ccoorrppoorraattiioonnss ((SS..1111)) ccoonnssiissttss ooff rreessiiddeenntt iinnssttiittuuttiioonnaall uunniittss wwhhoossee ddiissttrriibbuuttiivvee aanndd ffiinnaanncciiaall ttrraannssaaccttiioonnss aarree ddiissttiinncctt ffrroomm tthhoossee ooff tthheeiirr oowwnneerrss.. TThhee sseeccttoorr aallssoo iinncclluuddeess qquuaassii--ccoorrppoorraattiioonnss,, wwhhiicchh kkeeeepp aa ccoommpplleettee sseett ooff aaccccoouunnttss bbuutt hhaavvee nnoo iinnddeeppeennddeenntt lleeggaall ssttaattuuss.. HHoowweevveerr,, qquuaassii--ccoorrppoorraattiioonnss hhaavvee aann eeccoonnoommiicc aanndd ffiinnaanncciiaall bbeehhaavviioouurr tthhaatt iiss ddiiffffeerreenntt ffrroomm tthhaatt ooff tthheeiirr oowwnneerrss aanndd ssiimmiillaarr ttoo tthhaatt ooff ccoorrppoorraattiioonnss.. TThheerreeffoorree tthheeyy aarree ddeeeemmeedd ttoo hhaavvee aauuttoonnoommyy ooff ddeecciissiioonn aanndd aarree ccoonnssiiddeerreedd aass ddiissttiinncctt iinnssttiittuuttiioonnaall uunniittss.. TThhee sseeccttoorr ffiinnaanncciiaall ccoorrppoorraattiioonnss ((SS..1122)) ccoonnssiissttss ooff aallll rreessiiddeenntt ccoorrppoorraattiioonnss aanndd qquuaassii--ccoorrppoorraattiioonnss wwhhiicchh aarree pprriinncciippaallllyy eennggaaggeedd iinn ffiinnaanncciiaall iinntteerrmmeeddiiaattiioonn aanndd//oorr aauuxxiilliiaarryy ffiinnaanncciiaall aaccttiivviittiieess,, iinncclluuddiinngg iinnssuurraannccee ccoorrppoorraattiioonnss aanndd ppeennssiioonn ffuunnddss aass wweellll aass tthhee cceennttrraall bbaannkk.. RReeffeerreennccee:: EESSAA 11999955,, ppaarraaggrraapphhss 22..2211,, 22..1133 ((ff)) ,, 22..3322 ff GGeenneerraall ggoovveerrnnmmeenntt GGeenneerraall ggoovveerrnnmmeenntt ((SS..1133)) pprroodduucceess nnoonn--mmaarrkkeett oouuttppuutt ffoorr iinnddiivviidduuaall aanndd ccoolllleeccttiivvee ccoonnssuummppttiioonn aanndd iiss eennggaaggeedd iinn tthhee rreeddiissttrriibbuuttiioonn ooff nnaattiioonnaall iinnccoommee aanndd wweeaalltthh.. TThhee sseeccttoorr ccoommpprriisseess ffoouurr ssuubb--sseeccttoorrss:: cceennttrraall ggoovveerrnnmmeenntt,, ssttaattee ggoovveerrnnmmeenntt,, llooccaall ggoovveerrnnmmeenntt aanndd ssoocciiaall sseeccuurriittyy ffuunnddss.. RReeffeerreennccee:: EESSAA 11999955,, ppaarraaggrraapphh 22..6688 ff HHoouusseehhoollddss TThhee hhoouusseehhoollddss sseeccttoorr ((SS..1144)) ccoovveerrss iinnddiivviidduuaallss oorr ggrroouuppss ooff iinnddiivviidduuaallss aass ccoonnssuummeerrss aanndd aass pprroodduucceerrss ooff ggooooddss aanndd nnoonn--ffiinnaanncciiaall sseerrvviicceess ffoorr oowwnn ffiinnaall uussee.. NNoottaabbllyy,, tthhee hhoouusseehhoollddss sseeccttoorr ccoonnttaaiinnss aallssoo ssoollee pprroopprriieettoorrsshhiippss aanndd ppaarrttnneerrsshhiippss wwiitthhoouutt iinnddeeppeennddeenntt lleeggaall ssttaattuuss –– ootthheerr tthhaann tthhoossee ttrreeaatteedd aass qquuaassii--ccoorrppoorraattiioonnss –– wwhhiicchh aarree mmaarrkkeett pprroodduucceerrss.. RReeffeerreennccee:: EESSAA 11999955,, ppaarraaggrraapphhss 22..7755,, 22..7766 NNoonn--pprrooffiitt iinnssttiittuuttiioonnss sseerrvviinngg hhoouusseehhoollddss ((NNPPIISSHH)) TThhiiss sseeccttoorr ((SS..1155)) ccoonnssiissttss ooff nnoonn--pprrooffiitt iinnssttiittuuttiioonnss wwhhiicchh aarree sseeppaarraattee lleeggaall eennttiittiieess aanndd wwhhiicchh pprroovviiddee ggooooddss oorr sseerrvviicceess ttoo hhoouusseehhoollddss ffrreeee oorr aatt pprriicceess tthhaatt aarree nnoott eeccoonnoommiiccaallllyy ssiiggnniiffiiccaanntt.. TThheeiirr pprriinncciippaall rreessoouurrcceess,, aappaarrtt ffrroomm tthhoossee ddeerriivveedd ffrroomm ooccccaassiioonnaall ssaalleess,, aarree ddeerriivveedd ffrroomm vvoolluunnttaarryy ccoonnttrriibbuuttiioonnss iinn ccaasshh oorr iinn kkiinndd ffrroomm hhoouusseehhoollddss iinn tthheeiirr ccaappaacciittyy aass ccoonnssuummeerrss,, ffrroomm ppaayymmeennttss mmaaddee bbyy ggeenneerraall ggoovveerrnnmmeenntt ((hhoowweevveerr,, NNPPIISSHH aarree nnoott ccoonnttrroolllleedd aanndd nnoott mmaaiinnllyy ffiinnaanncceedd bbyy ggeenneerraall ggoovveerrnnmmeenntt)) aanndd ffrroomm pprrooppeerrttyy iinnccoommee.. EExxaammpplleess aarree iinn ppaarrttiiccuullaarr cchhuurrcchheess,, ssppoorrttss cclluubbss,, cchhaarriittiieess,, ppoolliittiiccaall ppaarrttiieess aanndd ttrraaddee uunniioonnss.. RReeffeerreennccee:: EESSAA 11999955,, ppaarraaggrraapphhss 22..8877,, 22..8888 FFuurrtthheerrmmoorree,, EESSAA 11999955 ddeeffiinneess tthhee rreesstt ooff tthhee wwoorrlldd sseeccttoorr ((SS..22)) tthhaatt ccoonnssiissttss ooff nnoonn--rreessiiddeenntt uunniittss wwhhiicchh hhaavvee eeccoonnoommiicc lliinnkkss wwiitthh rreessiiddeenntt uunniittss.. IInncclluuddeedd aarree tthhee IInnssttiittuuttiioonnss ooff tthhee EEUU aanndd iinntteerrnnaattiioonnaall oorrggaanniissaattiioonnss.. IIttss aaccccoouunnttss pprroovviiddee aann oovveerraallll vviieeww ooff tthhee eeccoonnoommiicc rreellaattiioonnsshhiippss lliinnkkiinngg tthhee nnaattiioonnaall eeccoonnoommyy wwiitthh tthhee rreesstt ooff tthhee wwoorrlldd.. RReeffeerreennccee:: EESSAA 11999955,, ppaarraaggrraapphh 22..8899

10
TTaabbllee 11 TToottaall PPooppuullaattiioonn ((NNaattiioonnaall aaccccoouunnttss))
TThhee ttoottaall ppooppuullaattiioonn ooff aa ccoouunnttrryy ccoonnssiissttss ooff aallll ppeerrssoonnss,, nnaattiioonnaall oorr ffoorreeiiggnn,, wwhhoo aarree ppeerrmmaanneennttllyy sseettttlleedd ((ii..ee.. ffoorr aa ppeerriioodd ooff oonnee yyeeaarr oorr mmoorree)) iinn tthhee eeccoonnoommiicc tteerrrriittoorryy ooff tthhee ccoouunnttrryy.. TThhee ttoottaall ppooppuullaattiioonn ooff aa ccoouunnttrryy ddooeess nnoott iinncclluuddee::
ffoorreeiiggnn cciivviilliiaannss ssttaayyiinngg oonn tthhee tteerrrriittoorryy ffoorr lleessss tthhaann aa yyeeaarr ((ii..ee.. ffrroonnttiieerr wwoorrkkeerrss,, sseeaassoonnaall wwoorrkkeerrss,, ttoouurriissttss,, ppaattiieennttss eettcc..));; nnaattiioonnaall cciivviilliiaannss ssttaayyiinngg aabbrrooaadd ffoorr aa ppeerriioodd ooff oonnee yyeeaarr oorr mmoorree;; nnaattiioonnaall mmiilliittaarryy ppeerrssoonnnneell wwoorrkkiinngg wwiitthh iinntteerrnnaattiioonnaall oorrggaanniissaattiioonnss llooccaatteedd iinn tthhee rreesstt ooff tthhee wwoorrlldd;; nnaattiioonnaall tteecchhnniiccaall aassssiissttaannccee ppeerrssoonnnneell oonn lloonngg--tteerrmm aassssiiggnnmmeennttss wwhhoo wwoorrkk aabbrrooaadd aanndd aarree ddeeeemmeedd ttoo bbee eemmppllooyyeedd bbyy tthheeiirr hhoosstt ggoovveerrnnmmeenntt,, oorr iinntteerrnnaattiioonnaall oorrggaanniissaattiioonn,, wwhhiicchh iiss
aaccttuuaallllyy ffiinnaanncciinngg tthheeiirr wwoorrkk;; ffoorreeiiggnn ssttuuddeennttss hhoowweevveerr lloonngg tthheeyy ssttuuddyy iinn tthhee ccoouunnttrryy;; mmeemmbbeerrss ooff aarrmmeedd ffoorrcceess ooff aa ffoorreeiiggnn ccoouunnttrryy wwhhoo aarree ssttaattiioonneedd iinn tthhee ccoouunnttrryy;; tthhee ffoorreeiiggnn ppeerrssoonnnneell ooff ffoorreeiiggnn sscciieennttiiffiicc bbaasseess llooccaatteedd oonn tthhee ggeeooggrraapphhiicc tteerrrriittoorryy ooff tthhee ccoouunnttrryy;; mmeemmbbeerrss ooff ffoorreeiiggnn ddiipplloommaattiicc mmiissssiioonnss ssttaattiioonneedd iinn tthhee ccoouunnttrryy..
NNaattiioonnaall aaccccoouunnttss ddaattaa oonn ppooppuullaattiioonn iiss bbaasseedd oonn aann aannnnuuaall aavveerraaggee..
NNoottee:: DDaattaa ffoorr FFrraannccee aarree ffoorr FFrraannccee aass aa wwhhoollee,, ii..ee.. iinncclluuddiinngg tthhee ‘‘ddeeppaarrtteemmeennttss dd’’oouuttrree mmeerr’’..
RReeffeerreennccee:: EESSAA 11999955,, ppaarraaggrraapphhss 1111..0055 ff TTaabbllee 22 EEmmppllooyymmeenntt,, ppeerrssoonnss;; aallll ddoommeessttiicc iinndduussttrriieess ((NNaattiioonnaall aaccccoouunnttss))
EEmmppllooyymmeenntt ccoovveerrss eemmppllooyyeeeess aanndd sseellff--eemmppllooyyeedd ppeerrssoonnss.. IItt iiss aann aannnnuuaall aavveerraaggee,, aanndd uusseess tthhee ddoommeessttiicc ccoonncceepptt,, wwhhiicchh iinncclluuddeess rreessiiddeennttss aass wweellll aass nnoonn--rreessiiddeennttss wwhhoo wwoorrkk ffoorr rreessiiddeenntt pprroodduucceerr uunniittss.. RReeffeerreennccee:: EESSAA 11999955,, ppaarraaggrraapphh 1111..1111 ff TTaabbllee 33 UUnneemmppllooyymmeenntt rraattee,, ttoottaall;; mmeemmbbeerr ssttaatteess:: ddeeffiinniittiioonn EEuurroossttaatt
TToottaall uunneemmppllooyyeedd iinnddiivviidduuaallss aass aa sshhaarree ooff tthhee ttoottaall aaccttiivvee ppooppuullaattiioonn.. UUnneemmppllooyyeedd ppeerrssoonnss aarree tthhoossee aaggeedd aatt lleeaasstt 1155 yyeeaarrss nnoott lliivviinngg iinn ccoolllleeccttiivvee hhoouusseehhoollddss wwhhoo aarree wwiitthhoouutt wwoorrkk wwiitthhiinn tthhee nneexxtt ttwwoo wweeeekkss,, aavvaaiillaabbllee ttoo ssttaarrtt wwoorrkk wwiitthhiinn tthhee nneexxtt ttwwoo wweeeekkss aanndd aarree sseeeekkiinngg wwoorrkk ((ii..ee.. hhaavvee aaccttiivveellyy ssoouugghhtt eemmppllooyymmeenntt aatt ssoommee ttiimmee dduurriinngg tthhee pprreevviioouuss ffoouurr wweeeekkss oorr aarree nnoott sseeeekkiinngg aa jjoobb bbeeccaauussee hhaavvee aallrreeaaddyy ffoouunndd aa jjoobb ttoo ssttaarrtt llaatteerr)).. TThhee ttoottaall aaccttiivvee ppooppuullaattiioonn ((llaabboouurr ffoorrccee)) iiss tthhee ttoottaall nnuummbbeerr ooff tthhee eemmppllooyyeedd aanndd uunneemmppllooyyeedd ppooppuullaattiioonn.. RReeffeerreennccee:: EEuurroossttaatt,, uunneemmppllooyymmeenntt ssttaattiissttiiccss

11
TTaabbllee 44 GGrroossss ddoommeessttiicc pprroodduucctt aatt ccuurrrreenntt mmaarrkkeett pprriicceess ((NNaattiioonnaall ccuurrrreennccyy))
GGrroossss ddoommeessttiicc pprroodduucctt ((GGDDPP)),, aatt mmaarrkkeett pprriicceess ((EESSAA--ccooddee BB..11**gg)) ccaann bbee ddeeffiinneedd iinn tthhrreeee wwaayyss::
IItt iiss tthhee ssuumm ooff ggrroossss vvaalluuee aaddddeedd ooff tthhee vvaarriioouuss iinnssttiittuuttiioonnaall sseeccttoorrss oorr tthhee vvaarriioouuss iinndduussttrriieess pplluuss ttaaxxeess lleessss ssuubbssiiddiieess oonn pprroodduuccttss ((wwhhiicchh aarree nnoott aallllooccaatteedd ttoo sseeccttoorrss aanndd iinndduussttrriieess)).. IInn tthhiiss ccoonntteexxtt,, GGDDPP iiss tthhee bbaallaanncciinngg iitteemm iinn tthhee ttoottaall eeccoonnoommyy pprroodduuccttiioonn aaccccoouunntt;;
GGDDPP iiss tthhee ssuumm ooff ffiinnaall uusseess ooff ggooooddss aanndd sseerrvviicceess bbyy rreessiiddeenntt iinnssttiittuuttiioonnaall uunniittss,, pplluuss eexxppoorrttss aanndd mmiinnuuss iimmppoorrttss ooff ggooooddss aanndd sseerrvviicceess;; GGDDPP iiss tthhee ssuumm ooff uusseess iinn tthhee ttoottaall eeccoonnoommyy ggeenneerraattiioonn ooff iinnccoommee aaccccoouunntt ((ii..ee.. ccoommppeennssaattiioonn ooff eemmppllooyyeeeess,, ttaaxxeess oonn pprroodduuccttiioonn aanndd iimmppoorrttss lleessss ssuubbssiiddiieess,, ggrroossss ooppeerraattiinngg ssuurrpplluuss
aanndd mmiixxeedd iinnccoommee ooff tthhee ttoottaall eeccoonnoommyy)).. RReeffeerreennccee:: EESSAA 11999955,, ppaarraaggrraapphh 88..8899 TTaabbllee 66 GGrroossss ddoommeessttiicc pprroodduucctt aatt ccuurrrreenntt mmaarrkkeett pprriicceess ((PPPPSS))
PPuurrcchhaassiinngg PPoowweerr SSttaannddaarrdd ((PPPPSS)) iiss tthhee aarrttiiffiicciiaall ccoommmmoonn rreeffeerreennccee ccuurrrreennccyy uunniitt uusseedd iinn tthhee EEUU ttoo eexxpprreessss tthhee vvoolluummee ooff eeccoonnoommiicc aaggggrreeggaatteess ffoorr tthhee ppuurrppoossee ooff ssppaattiiaall ccoommppaarriissoonnss iinn rreeaall tteerrmmss.. VVoolluummee aaggggrreeggaatteess iinn PPPPSS aarree oobbttaaiinneedd bbyy ddiivviiddiinngg tthheeiirr oorriiggiinnaall vvaalluuee iinn nnaattiioonnaall ccuurrrreennccyy uunniittss bbyy tthhee rreessppeeccttiivvee PPuurrcchhaassiinngg PPoowweerr PPaarriittiieess ((PPPPPPss)).. OOnnee PPPPSS bbuuyyss tthhee ssaammee ggiivveenn aavveerraaggee vvoolluummee ooff ggooooddss aanndd sseerrvviicceess iinn aallll ccoouunnttrriieess,, wwhheerreeaass ddiiffffeerreenntt aammoouunnttss ooff nnaattiioonnaall ccuurrrreennccyy uunniittss aarree nneeeeddeedd ttoo bbuuyy tthhiiss vvoolluummee ooff ggooooddss aanndd sseerrvviicceess,, ddeeppeennddiinngg oonn tthhee nnaattiioonnaall pprriiccee lleevveell.. FFoorr aa ggiivveenn pprroodduucctt tthhee PPPPPP bbeettwweeeenn ttwwoo ccoouunnttrriieess AA aanndd BB iiss ddeeffiinneedd aass tthhee nnuummbbeerr ooff uunniittss ooff ccoouunnttrryy BB’’ss ccuurrrreennccyy tthhaatt aarree nneeeeddeedd iinn ccoouunnttrryy BB ttoo ppuurrcchhaassee tthhee ssaammee qquuaannttiittyy ooff tthhee pprroodduucctt aass oonnee uunniitt ooff ccoouunnttrryy AA’’ss ccuurrrreennccyy wwiillll ppuurrcchhaassee iinn ccoouunnttrryy AA.. PPPPPPss ffoorr ggrroouuppss ooff pprroodduuccttss aanndd hhiigghheerr aaggggrreeggaatteess uupp ttoo GGDDPP aarree oobbttaaiinneedd bbyy wweeiigghhttiinngg PPPPPPss ffoorr pprroodduuccttss bbyy tthheeiirr sshhaarree iinn eexxppeennddiittuurree.. TTaabbllee 88 GGrroossss ddoommeessttiicc pprroodduucctt aatt ccuurrrreenntt mmaarrkkeett pprriicceess ppeerr hheeaadd ooff ppooppuullaattiioonn ((EEUURR,, EEUU--1155 == 110000))
PPooppuullaattiioonn iiss ddeeffiinneedd aaccccoorrddiinngg ttoo tthhee nnaattiioonnaall aaccccoouunnttss ((sseeee nnoottee oonn TTaabbllee 11)).. TTaabbllee 1111 GGrroossss ddoommeessttiicc pprroodduucctt aatt 22000055 mmaarrkkeett pprriicceess ppeerr ppeerrssoonn eemmppllooyyeedd ((NNaattiioonnaall ccuurrrreennccyy,, aannnnuuaall ppeerrcceennttaaggee cchhaannggee))
TThhee ccaallccuullaattiioonn iiss bbaasseedd oonn eemmppllooyyeedd ppeerrssoonnss,, aallll ddoommeessttiicc iinndduussttrriieess,, oorr,, wwhheerree aapppplliiccaabbllee oonn ffuullll--ttiimmee eeqquuiivvaalleennttss.. FFuullll--ttiimmee eeqquuiivvaalleenntt eemmppllooyymmeenntt,, wwhhiicchh eeqquuaallss tthhee nnuummbbeerr ooff ffuullll--ttiimmee eeqquuiivvaalleenntt jjoobbss,, iiss ddeeffiinneedd aass ttoottaall hhoouurrss wwoorrkkeedd ddiivviiddeedd bbyy tthhee aavveerraaggee aannnnuuaall nnuummbbeerr ooff hhoouurrss wwoorrkkeedd iinn ffuullll--ttiimmee jjoobbss wwiitthhiinn tthhee eeccoonnoommiicc tteerrrriittoorryy.. RReeffeerreennccee:: EESSAA 11999955,, ppaarraaggrraapphh 1111..3322 TTaabbllee 1122 IInndduussttrriiaall pprroodduuccttiioonn;; ccoonnssttrruuccttiioonn eexxcclluuddeedd ((AAnnnnuuaall ppeerrcceennttaaggee cchhaannggee))
IInndduussttrriiaall pprroodduuccttiioonn iiss ccaallccuullaatteedd aass aann iinnddeexx ((pprroodduuccttiioonn iinnddeexx)) wwhhiicchh sshhoowwss tthhee oouuttppuutt aanndd tthhee aaccttiivviittyy ooff tthhee iinndduussttrriiaall bbrraanncchheess;; iitt pprroovviiddeess aa mmeeaassuurree ooff tthhee vvoolluummee ttrreenndd iinn vvaalluuee aaddddeedd aatt ffaaccttoorr ccoosstt oovveerr aa ggiivveenn rreeffeerreennccee ppeerriioodd.. TThhee tteerrmm ""pprroodduuccttiioonn"" iiss uusseedd wwiitthhiinn tthhee ssccooppee ooff EEuurrooppeeaann aanndd NNaattiioonnaall sshhoorrtt tteerrmm iinnddiiccaattoorrss ((sshhoorrtt--tteerrmm bbuussiinneessss ssttaattiissttiiccss)).. IInndduussttrriiaall pprroodduuccttiioonn,, ccoonnssttrruuccttiioonn eexxcclluuddeedd,, ccoovveerrss tthhee NNAACCEE sseeccttiioonnss CC,, DD aanndd EE..
12
TTaabbllee 1133
PPrriivvaattee ffiinnaall ccoonnssuummppttiioonn eexxppeennddiittuurree aatt ccuurrrreenntt pprriicceess ((PPeerrcceennttaaggee ooff ggrroossss ddoommeessttiicc pprroodduucctt aatt mmaarrkkeett pprriicceess))
PPrriivvaattee ffiinnaall ccoonnssuummppttiioonn eexxppeennddiittuurree ((PP..33)) iinncclluuddeess ffiinnaall ccoonnssuummppttiioonn eexxppeennddiittuurree ooff pprriivvaattee hhoouusseehhoollddss aanndd ooff nnoonn--pprrooffiitt iinnssttiittuuttiioonnss sseerrvviinngg hhoouusseehhoollddss ((NNPPIISSHH)).. FFiinnaall ccoonnssuummppttiioonn eexxppeennddiittuurree ccoonnssiissttss ooff eexxppeennddiittuurree iinnccuurrrreedd bbyy rreessiiddeenntt iinnssttiittuuttiioonnaall uunniittss oonn ggooooddss oorr sseerrvviicceess tthhaatt aarree uusseedd ffoorr tthhee ddiirreecctt ssaattiissffaaccttiioonn ooff iinnddiivviidduuaall nneeeeddss oorr wwaannttss oorr tthhee ccoolllleeccttiivvee nneeeeddss ooff mmeemmbbeerrss ooff tthhee ccoommmmuunniittyy.. FFiinnaall ccoonnssuummppttiioonn eexxppeennddiittuurree ooff hhoouusseehhoollddss aallssoo iinncclluuddeess tthhee ffoolllloowwiinngg bboorrddeerrlliinnee ccaasseess::
sseerrvviiccee ooff oowwnneerr--ooccccuuppiieedd ddwweelllliinngg;; iitteemmss nnoott ttrreeaatteedd aass iinntteerrmmeeddiiaattee ccoonnssuummppttiioonn,, lliikkee mmaatteerriiaallss ffoorr ssmmaallll rreeppaaiirrss ttoo aanndd iinntteerriioorr ddeeccoorraattiioonn ooff ddwweelllliinnggss ooff aa kkiinndd ttyyppiiccaallllyy ccaarrrriieedd oouutt bbyy tteennaannttss aass wweellll aass oowwnneerrss;; iitteemmss nnoott ttrreeaatteedd aass ccaappiittaall ffoorrmmaattiioonn,, iinn ppaarrttiiccuullaarr ccoonnssuummeerr dduurraabblleess,, tthhaatt ccoonnttiinnuuee ttoo ppeerrffoorrmm tthheeiirr ffuunnccttiioonn iinn sseevveerraall aaccccoouunnttiinngg ppeerriiooddss..
GGooooddss aanndd sseerrvviicceess ffiinnaanncceedd bbyy tthhee ggoovveerrnnmmeenntt aanndd ssuupppplliieedd ttoo hhoouusseehhoollddss aass ssoocciiaall ttrraannssffeerrss iinn kkiinndd aarree nnoott iinncclluuddeedd.. RReeffeerreennccee:: EESSAA 11999955,, ppaarraaggrraapphhss 33..7755,, 33..7766 TTaabbllee 1177 FFiinnaall ccoonnssuummppttiioonn eexxppeennddiittuurree ooff ggeenneerraall ggoovveerrnnmmeenntt aatt ccuurrrreenntt pprriicceess ((PPeerrcceennttaaggee ooff ggrroossss ddoommeessttiicc pprroodduucctt aatt mmaarrkkeett pprriicceess))
FFiinnaall ccoonnssuummppttiioonn eexxppeennddiittuurree ooff ggeenneerraall ggoovveerrnnmmeenntt ((PP..33)) iinncclluuddeess ttwwoo ccaatteeggoorriieess ooff eexxppeennddiittuurreess::
TThhee vvaalluuee ooff ggooooddss aanndd sseerrvviicceess pprroodduucceedd bbyy ggeenneerraall ggoovveerrnnmmeenntt iittsseellff ootthheerr tthhaann oowwnn--aaccccoouunntt ccaappiittaall ffoorrmmaattiioonn aanndd ssaalleess ((ccoolllleeccttiivvee ccoonnssuummppttiioonn)).. PPuurrcchhaasseess bbyy ggeenneerraall ggoovveerrnnmmeenntt ooff ggooooddss aanndd sseerrvviicceess pprroodduucceedd bbyy mmaarrkkeett pprroodduucceerrss tthhaatt aarree ssuupppplliieedd ttoo hhoouusseehhoollddss –– wwiitthhoouutt aannyy ttrraannssffoorrmmaattiioonn –– aass ssoocciiaall ttrraannssffeerrss iinn kkiinndd..
TThhiiss iimmpplliieess tthhaatt ggeenneerraall ggoovveerrnnmmeenntt jjuusstt ppaayyss ffoorr ggooooddss aanndd sseerrvviicceess tthhaatt tthhee sseelllleerrss pprroovviiddee ttoo hhoouusseehhoollddss ((iinnddiivviidduuaall ccoonnssuummppttiioonn))..
IInnddiivviidduuaall ccoonnssuummppttiioonn eexxppeennddiittuurree ooff ggeenneerraall ggoovveerrnnmmeenntt iinncclluuddeess ee..gg.. eexxppeennddiittuurree ffoorr hheeaalltthh,, ffoorr ssoocciiaall sseeccuurriittyy aanndd wweellffaarree aanndd ffoorr ccuullttuurree,, eexxcceepptt ffoorr eexxppeennddiittuurreess oonn ggeenneerraall aaddmmiinniissttrraattiioonn,, rreegguullaattiioonn,, rreesseeaarrcchh eettcc.. iinn eeaacchh ooff tthheessee ccaatteeggoorriieess.. CCoolllleeccttiivvee ccoonnssuummppttiioonn eexxppeennddiittuurree aammoonngg ootthheerr tthhiinnggss ccoonnssiissttss ooff eexxppeennsseess ffoorr mmaannaaggeemmeenntt aanndd rreegguullaattiioonn ooff ssoocciieettyy,, ffoorr tthhee pprroovviissiioonn ooff sseeccuurriittyy aanndd ddeeffeennccee aass wweellll aass ffoorr tthhee pprrootteeccttiioonn ooff tthhee eennvviirroonnmmeenntt.. RReeffeerreennccee:: EESSAA 11999955,, ppaarraaggrraapphhss 33..7799,, 33..8855 TTaabbllee 1199 GGrroossss ffiixxeedd ccaappiittaall ffoorrmmaattiioonn aatt ccuurrrreenntt pprriicceess;; ttoottaall eeccoonnoommyy ((PPeerrcceennttaaggee ooff ggrroossss ddoommeessttiicc pprroodduucctt aatt mmaarrkkeett pprriicceess))
GGrroossss ffiixxeedd ccaappiittaall ffoorrmmaattiioonn ((PP..5511)) ccoonnssiissttss ooff rreessiiddeenntt pprroodduucceerrss’’ aaccqquuiissiittiioonnss,, lleessss ddiissppoossaallss,, ooff ffiixxeedd aasssseettss dduurriinngg aa ggiivveenn ppeerriioodd pplluuss cceerrttaaiinn aaddddiittiioonnss ttoo tthhee vvaalluuee ooff nnoonn--pprroodduucceedd aasssseettss rreeaalliisseedd bbyy tthhee pprroodduuccttiivvee aaccttiivviittyy ooff pprroodduucceerr oorr iinnssttiittuuttiioonnaall uunniittss.. FFiixxeedd aasssseettss aarree ttaannggiibbllee oorr iinnttaannggiibbllee aasssseettss pprroodduucceedd aass oouuttppuuttss ffrroomm pprroocceessss ooff pprroodduuccttiioonn tthhaatt aarree tthheemmsseellvveess uusseedd rreeppeeaatteeddllyy,, oorr ccoonnttiinnuuoouussllyy,, iinn pprroocceessss ooff pprroodduuccttiioonn ffoorr mmoorree tthhaann oonnee yyeeaarr.. AAddddiittiioonnss ttoo tthhee vvaalluuee ooff nnoonn--pprroodduucceedd aasssseettss ppeerrttaaiinniinngg iinn ppaarrttiiccuullaarr ttoo llaanndd,, ee..gg.. ddrraaiinniinngg ooff mmaarrsshheess oorr tthhee iirrrriiggaattiioonn ooff ddeesseerrttss bbyy tthhee ccoonnssttrruuccttiioonn ooff ddyykkeess,, ddiittcchheess aanndd iirrrriiggaattiioonn cchhaannnneellss.. EExxaammpplleess ffoorr iinnttaannggiibbllee ffiixxeedd aasssseettss aarree mmiinneerraall eexxpplloorraattiioonn aanndd ccoommppuutteerr ssooffttwwaarree.. RReeffeerreennccee:: EESSAA 11999955,, ppaarraaggrraapphhss 33..110022 –– 33..111111

13
TTaabbllee 2211 CChhaannggee iinn iinnvveennttoorriieess aanndd nneett aaccqquuiissiittiioonn ooff vvaalluuaabblleess;; ccuurrrreenntt pprriicceess;; ttoottaall eeccoonnoommyy ((PPeerrcceennttaaggee ooff ggrroossss ddoommeessttiicc pprroodduucctt aatt mmaarrkkeett pprriicceess))
CChhaannggeess iinn iinnvveennttoorriieess ((PP..5522)) aarree mmeeaassuurreedd bbyy tthhee vvaalluuee ooff eennttrriieess iinnttoo iinnvveennttoorriieess lleessss tthhee vvaalluuee ooff wwiitthhddrraawwaallss aanndd tthhee vvaalluuee ooff aannyy rreeccuurrrreenntt lloosssseess ooff ggooooddss hheelldd iinn iinnvveennttoorriieess.. IInnvveennttoorriieess ccoonnssiisstt ooff mmaatteerriiaallss aanndd ssuuppppllyy,, wwoorrkk iinn pprrooggrreessss,, ffiinniisshheedd ggooooddss aanndd ggooooddss ffoorr rreessaallee.. VVaalluuaabblleess ((PP..5533 aarree nnoonn--ffiinnaanncciiaall ggooooddss tthhaatt aarree nnoott uusseedd pprriimmaarriillyy ffoorr pprroodduuccttiioonn oorr ccoonnssuummppttiioonn,, ddoo nnoott ddeetteerriioorraattee ((pphhyyssiiccaallllyy)) oovveerr ttiimmee aanndd hheelldd pprriimmaarriillyy aass ssttoorreess ooff vvaalluuee.. TThheeyy eennccoommppaassss ee..gg.. pprreecciioouuss mmeettaallss ((ggoolldd,, ssiillvveerr,, ppllaattiinnuumm)),, aannttiiqquueess,, ppaaiinnttiinnggss eettcc.. RReeffeerreennccee:: EESSAA 11999955,, ppaarraaggrraapphhss 33..111177,, 33..111199,, 33..112255 –– 33..112266 TTaabbllee 2222 DDoommeessttiicc ddeemmaanndd iinncclluuddiinngg ssttoocckkss aatt ccuurrrreenntt pprriicceess ((PPeerrcceennttaaggee ooff ggrroossss ddoommeessttiicc pprroodduucctt aatt mmaarrkkeett pprriicceess))
DDoommeessttiicc ddeemmaanndd iiss tthhee ssuumm ooff
FFiinnaall ccoonnssuummppttiioonn eexxppeennddiittuurree ((PP..33)) ++ GGrroossss ffiixxeedd ccaappiittaall ffoorrmmaattiioonn ((PP..5511)) ++ CChhaannggeess iinn iinnvveennttoorriieess ((PP..5522)) ++ AAccqquuiissiittiioonnss lleessss ddiissppoossaallss ooff vvaalluuaabblleess ((PP..5533))
TTaabbllee 2244 PPrriiccee ddeeffllaattoorr ggrroossss ddoommeessttiicc pprroodduucctt aatt mmaarrkkeett pprriicceess ((NNaattiioonnaall ccuurrrreennccyy;; aannnnuuaall ppeerrcceennttaaggee cchhaannggee))
RRaattiioo ooff GGDDPP aatt ccuurrrreenntt mmaarrkkeett pprriicceess ttoo GGDDPP aatt ccoonnssttaanntt pprriicceess.. TTaabbllee 2288 TTeerrmmss ooff ttrraaddee ggooooddss aanndd sseerrvviicceess ((NNaattiioonnaall aaccccoouunnttss;; 22000055 == 110000))
TThhee tteerrmmss ooff ttrraaddee iinnddiiccaattee tthhee rraattiioo ooff tthhee cchhaannggee ooff eexxppoorrtt pprriicceess ooff ggooooddss aanndd sseerrvviicceess ttoo tthhee cchhaannggee ooff iimmppoorrtt pprriicceess ooff ggooooddss aanndd sseerrvviicceess.. TThheeyy aarree eeqquuaall ttoo tthhee rraattiioo ooff tthhee pprriiccee iinnddeexx ffoorr eexxppoorrttss ooff ggooooddss aanndd sseerrvviicceess ttoo tthhee pprriiccee iinnddeexx ffoorr iimmppoorrttss ooff ggooooddss aanndd sseerrvviicceess.. TTaabbllee 2299 NNoommiinnaall ccoommppeennssaattiioonn ppeerr eemmppllooyyeeee;; ttoottaall eeccoonnoommyy ((NNaattiioonnaall ccuurrrreennccyy;; aannnnuuaall ppeerrcceennttaaggee cchhaannggee))
CCoommppeennssaattiioonn ooff eemmppllooyyeeeess ((DD..11)) iiss tthhee ttoottaall rreemmuunneerraattiioonn ppaayyaabbllee bbyy aann eemmppllooyyeerr ttoo aann eemmppllooyyeeee iinn rreettuurrnn ffoorr wwoorrkk ddoonnee bbyy tthhee llaatttteerr dduurriinngg tthhee aaccccoouunnttiinngg ppeerriioodd.. CCoommppeennssaattiioonn ooff eemmppllooyyeeeess eennccoommppaassss wwaaggeess aanndd ssaallaarriieess iinn ccaasshh aanndd wwaaggeess aanndd ssaallaarriieess iinn kkiinndd ((DD..1111)) aass wweellll aass eemmppllooyyeerrss’’ ssoocciiaall ccoonnttrriibbuuttiioonnss ((DD..1122)).. TThhee ssyysstteemm ooff aaccccoouunnttss rreeccoorrddss tthhee eemmppllooyyeerrss ccoonnttrriibbuuttiioonnss ttoo ssoocciiaall iinnssuurraannccee ffuunnddss aass ttwwoo ttrraannssaaccttiioonnss:: eemmppllooyyeerrss ppaayy eemmppllooyyeerr’’ss ssoocciiaall ccoonnttrriibbuuttiioonnss ttoo tthheeiirr eemmppllooyyeeeess,, aanndd eemmppllooyyeeeess ppaayy tthhee ssaammee ccoonnttrriibbuuttiioonnss ttoo ssoocciiaall iinnssuurraannccee ffuunnddss ((rreerroouuttiinngg)).. FFoorr sseevveerraall ccoouunnttrriieess nnoommiinnaall ccoommppeennssaattiioonn ppeerr eemmppllooyyeeee iiss bbaasseedd oonn ffuullll--ttiimmee eeqquuiivvaalleennttss ((sseeee nnoottee oonn TTaabbllee 1111)).. DDeeppeennddiinngg oonn tthhee aavvaaiillaabbiilliittyy,, ddaattaa rreellaattee ttoo ddoommeessttiicc oorr nnaattiioonnaall ccoonncceepptt.. RReeffeerreennccee:: EESSAA 11999955,, ppaarraaggrraapphhss 44..0022,, 11..3399,, 1111..1122,, 1111..3322

14
TTaabbllee 3322 AAddjjuusstteedd wwaaggee sshhaarree;; ttoottaall eeccoonnoommyy
CCoommppeennssaattiioonn ppeerr eemmppllooyyeeee aass ppeerrcceennttaaggee ooff ggrroossss ddoommeessttiicc pprroodduucctt aatt ffaaccttoorr ccoosstt ppeerr ppeerrssoonn eemmppllooyyeedd.. GGDDPP aatt ffaaccttoorr ccoosstt,, wwhhiicchh iiss nnoott aann EESSAA 11999955 tteerrmm,, ccaann eeaassiillyy bbee ddeerriivveedd bbyy ssuubbttrraaccttiinngg nneett ttaaxxeess oonn pprroodduuccttiioonn ffrroomm GGDDPP aatt mmaarrkkeett pprriicceess.. FFoorr sseevveerraall ccoouunnttrriieess aaddjjuusstteedd wwaaggee sshhaarree iiss bbaasseedd oonn ffuullll--ttiimmee eeqquuiivvaalleennttss ((sseeee nnoottee oonn TTaabbllee 1111)).. TTaabbllee 3333 NNoommiinnaall uunniitt llaabboouurr ccoossttss;; ttoottaall eeccoonnoommyy ((NNaattiioonnaall ccuurrrreennccyy;; 22000055 == 110000))
RRaattiioo ooff ccoommppeennssaattiioonn ppeerr eemmppllooyyeeee ttoo rreeaall GGDDPP ppeerr ppeerrssoonn eemmppllooyyeedd ((llaabboouurr pprroodduuccttiivviittyy)).. FFoorr sseevveerraall ccoouunnttrriieess nnoommiinnaall uunniitt llaabboouurr ccoossttss aarree bbaasseedd oonn ffuullll--ttiimmee eeqquuiivvaalleennttss ((sseeee nnoottee oonn TTaabbllee 1111)).. TTaabbllee 3344 RReeaall uunniitt llaabboouurr ccoossttss;; ttoottaall eeccoonnoommyy ((22000055 == 110000))
RRaattiioo ooff ccoommppeennssaattiioonn ppeerr eemmppllooyyeeee ttoo nnoommiinnaall GGDDPP ppeerr ppeerrssoonn eemmppllooyyeedd.. FFoorr sseevveerraall ccoouunnttrriieess rreeaall uunniitt llaabboouurr ccoossttss aarree bbaasseedd oonn ffuullll--ttiimmee eeqquuiivvaalleennttss ((sseeee nnoottee oonn TTaabbllee 1111)).. TTaabbllee 3355 NNoommiinnaall uunniitt llaabboouurr ccoossttss;; ttoottaall eeccoonnoommyy;; ppeerrffoorrmmaannccee rreellaattiivvee ttoo tthhee rreesstt ooff 3355 iinndduussttrriiaall ccoouunnttrriieess;; ddoouubbllee eexxppoorrtt wweeiigghhttss ((UUSSDD;; 22000055 == 110000))
RRaattiioo ooff ccoommppeennssaattiioonn ppeerr eemmppllooyyeeee ttoo rreeaall GGDDPP ppeerr ppeerrssoonn eemmppllooyyeedd.. FFoorr sseevveerraall ccoouunnttrriieess nnoommiinnaall uunniitt llaabboouurr ccoossttss aarree bbaasseedd oonn ffuullll--ttiimmee eeqquuiivvaalleennttss ((sseeee nnoottee oonn TTaabbllee 1111)).. DDoouubbllee eexxppoorrtt wweeiigghhttss ccaallccuullaattee ffoorr eeaacchh mmaarrkkeett tthhee ttoottaall ssuuppppllyy aass tthhee ssuumm ooff hhoommee ssuuppppllyy ((ii..ee.. tthhee ppaarrtt ooff tthhee ddoommeessttiicc pprroodduuccttiioonn tthhaatt iiss nnoott eexxppoorrtteedd)) aanndd ffoorreeiiggnn ssuuppppllyy ((aallll ccoommppeettiittoorr ccoouunnttrriieess’’ eexxppoorrttss ttoo tthhee mmaarrkkeett)).. TThhee sshhaarree ooff eeaacchh ccoouunnttrryy iinn tthhee ttoottaall mmaarrkkeett iiss tthheenn ccaallccuullaatteedd.. IInn aa ffuurrtthheerr sstteepp tthheessee wweeiigghhttss ppeerr mmaarrkkeett aarree wweeiigghhtteedd ttooggeetthheerr ffoorr eeaacchh eexxppoorrttiinngg ccoouunnttrryy iinn tthhee ttoottaall mmaarrkkeett.. DDoouubbllee eexxppoorrtt wweeiigghhttss ttaakkee iinnttoo aaccccoouunntt tthhaatt eexxppoorrtteerrss ttoo aa ggiivveenn mmaarrkkeett ccoommppeettee nnoott oonnllyy wwiitthh ddoommeessttiicc pprroodduucceerrss tthheerree,, bbuutt aallssoo wwiitthh ootthheerr eexxppoorrtteerrss ttoo tthhaatt mmaarrkkeett ((""tthhiirrdd mmaarrkkeett eeffffeecctt"")).. TTaabbllee 3366 EExxppoorrttss ooff ggooooddss aanndd sseerrvviicceess aatt ccuurrrreenntt pprriicceess;; nnaattiioonnaall aaccccoouunnttss ((PPeerrcceennttaaggee ooff ggrroossss ddoommeessttiicc pprroodduucctt aatt mmaarrkkeett pprriicceess))
EExxppoorrttss ooff ggooooddss ((PP..6611)) aarree ttoo bbee vvaalluueedd ffrreeee oonn bbooaarrdd ((ff..oo..bb..)) aatt tthhee bboorrddeerr ooff tthhee eexxppoorrttiinngg ccoouunnttrryy.. TThhiiss vvaalluuee ccoonnssiissttss ooff
tthhee vvaalluuee ooff tthhee ggooooddss aatt bbaassiicc pprriicceess;; tthhee rreellaatteedd ttrraannssppoorrtt aanndd ddiissttrriibbuuttiivvee sseerrvviicceess uupp ttoo tthhaatt ppooiinntt ooff tthhee bboorrddeerr;; aannyy ttaaxxeess lleessss ssuubbssiiddiieess oonn tthhee ggooooddss eexxppoorrtteedd;; ffoorr iinnttrraa--EEUU ddeelliivveerriieess tthhiiss iinncclluuddeess VVAATT aanndd ootthheerr ttaaxxeess oonn tthhee ggooooddss ppaaiidd iinn tthhee eexxppoorrttiinngg ccoouunnttrryy..
EExxppoorrttss ooff sseerrvviicceess ((PP..6622)) ccoonnssiisstt ooff aallll sseerrvviicceess rreennddeerreedd bbyy rreessiiddeennttss ttoo nnoonn--rreessiiddeennttss.. TThheeyy iinncclluuddee ee..gg.. eexxppeennddiittuurreess bbyy nnoonn--rreessiiddeenntt ttoouurriissttss aanndd bbuussiinneessss ttrraavveelllleerrss,, rrooyyaallttiieess aanndd lliicceennssee ffeeeess,, iinnssttaallllaattiioonn ooff eeqquuiippmmeenntt aabbrrooaadd wwhheenn aa pprroojjeecctt iiss ooff lliimmiitteedd dduurraattiioonn bbyy iittss nnaattuurree,, eettcc.. RReeffeerreennccee:: EESSAA 11999955,, ppaarraaggrraapphhss 33..113388,, 33..114400,, 33..114422

15
TTaabbllee 3388 IInnttrraa EEUU eexxppoorrttss ooff ggooooddss;; ffoorreeiiggnn ttrraaddee ssttaattiissttiiccss ((PPeerrcceennttaaggee ooff ggrroossss ddoommeessttiicc pprroodduucctt aatt mmaarrkkeett pprriicceess))
IItt sshhoouulldd bbee rreemmeemmbbeerreedd tthhaatt tthheerree mmiigghhtt bbee ssoommee mmiinnoorr ddiiffffeerreenncceess bbeettwweeeenn eexxppoorrttss aaccccoorrddiinngg ttoo nnaattiioonnaall aaccccoouunnttss aanndd aaccccoorrddiinngg ttoo ffoorreeiiggnn ttrraaddee ssttaattiissttiiccss.. TThheeyy aarree dduuee ttoo ddiiffffeerreenntt ddaattaa vviinnttaaggeess aanndd rreevviissiioonn sscchheemmeess,, iinn ssoommee ccaasseess ttoo ccoonncceeppttuuaall ddiiffffeerreenncceess aanndd ppaarrttllyy ttoo ddiiffffeerreenntt bbaassiicc ddaattaa ssoouurrcceess.. TTaabbllee 4400 IImmppoorrttss ooff ggooooddss aanndd sseerrvviicceess aatt ccuurrrreenntt pprriicceess;; nnaattiioonnaall aaccccoouunnttss ((PPeerrcceennttaaggee ooff ggrroossss ddoommeessttiicc pprroodduucctt aatt mmaarrkkeett pprriicceess))
TThhee iimmppoorrttss ooff ggooooddss ((PP..7711)) aarree vvaalluueedd aatt tthhee ccoosstt--iinnssuurraannccee--ffrreeiigghhtt ((cc..ii..ff..)) pprriiccee aatt tthhee bboorrddeerr ooff tthhee iimmppoorrttiinngg ccoouunnttrryy.. TThhee cc..ii..ff.. pprriiccee iiss tthhee pprriiccee ooff aa ggoooodd ddeelliivveerreedd aatt tthhee ffrroonnttiieerr ooff tthhee iimmppoorrttiinngg ccoouunnttrryy bbeeffoorree tthhee ppaayymmeenntt ooff aannyy iimmppoorrtt dduuttiieess oorr ootthheerr ttaaxxeess oonn iimmppoorrttss oorr ttrraaddee aanndd ttrraannssppoorrtt mmaarrggiinnss wwiitthhiinn tthhee ccoouunnttrryy.. IImmppoorrttss ooff sseerrvviicceess ((PP..7722)) ccoonnssiisstt ooff aallll sseerrvviicceess rreennddeerreedd bbyy nnoonn--rreessiiddeennttss ttoo rreessiiddeennttss ((sseeee aallssoo nnoottee oonn TTaabbllee 3366)).. RReeffeerreennccee:: EESSAA 11999955,, ppaarraaggrraapphhss 33..113388,, 33..114411,, 33..114422 ff TTaabbllee 4422 IInnttrraa EEUU iimmppoorrttss ooff ggooooddss;; ffoorreeiiggnn ttrraaddee ssttaattiissttiiccss ((PPeerrcceennttaaggee ooff ggrroossss ddoommeessttiicc pprroodduucctt aatt mmaarrkkeett pprriicceess))
IItt sshhoouulldd bbee rreemmeemmbbeerreedd tthhaatt tthheerree mmiigghhtt bbee ssoommee mmiinnoorr ddiiffffeerreenncceess bbeettwweeeenn iimmppoorrttss aaccccoorrddiinngg ttoo nnaattiioonnaall aaccccoouunnttss aanndd aaccccoorrddiinngg ttoo ffoorreeiiggnn ttrraaddee ssttaattiissttiiccss.. TThheeyy aarree dduuee ttoo ddiiffffeerreenntt ddaattaa vviinnttaaggeess aanndd rreevviissiioonn sscchheemmeess,, iinn ssoommee ccaasseess ttoo ccoonncceeppttuuaall ddiiffffeerreenncceess aanndd ppaarrttllyy ttoo ddiiffffeerreenntt bbaassiicc ddaattaa ssoouurrcceess.. TTaabbllee 4444 BBaallaannccee oonn ccuurrrreenntt ttrraannssaaccttiioonnss wwiitthh tthhee rreesstt ooff tthhee wwoorrlldd;; nnaattiioonnaall aaccccoouunnttss ((PPeerrcceennttaaggee ooff ggrroossss ddoommeessttiicc pprroodduucctt aatt mmaarrkkeett pprriicceess))
‘‘BBaallaannccee oonn ccuurrrreenntt ttrraannssaaccttiioonnss wwiitthh tthhee rreesstt ooff tthhee wwoorrlldd’’ iiss iiddeennttiiccaall wwiitthh tthhee ‘‘CCuurrrreenntt eexxtteerrnnaall bbaallaannccee’’ ((BB..1122)).. IItt iiss tthhee ssuumm ooff
tthhee eexxtteerrnnaall bbaallaannccee ooff ggooooddss aanndd sseerrvviicceess ((eexxppoorrttss mmiinnuuss iimmppoorrttss)) ++ tthhee nneett ffaaccttoorr iinnccoommee ffrroomm tthhee rreesstt ooff tthhee wwoorrlldd ++ tthhee nneett ccuurrrreenntt ttrraannssffeerrss ffrroomm tthhee rreesstt ooff tthhee wwoorrlldd
FFaaccttoorr iinnccoommee ((pprriimmaarryy iinnccoommee)) ffrroomm tthhee rreesstt ooff tthhee wwoorrlldd ccoonnttaaiinnss ccoommppeennssaattiioonn ooff eemmppllooyyeeeess,, pprrooppeerrttyy iinnccoommee,, ssuubbssiiddiieess aanndd ttaaxxeess oonn pprroodduuccttiioonn aanndd iimmppoorrttss RReeffeerreennccee:: sseeee EESSAA 11999955,, TTaabbllee 88..1166 ((eexxtteerrnnaall aaccccoouunntt ooff pprriimmaarryy iinnccoommeess aanndd ccuurrrreenntt ttrraannssffeerrss))
TTaabbllee 4455 GGrroossss nnaattiioonnaall ssaavviinngg ((PPeerrcceennttaaggee ooff ggrroossss ddoommeessttiicc pprroodduucctt aatt mmaarrkkeett pprriicceess))
GGrroossss nnaattiioonnaall ssaavviinngg ((BB..88gg)) mmeeaassuurreess tthhee pprrooppoorrttiioonn ooff nnaattiioonnaall ddiissppoossaabbllee iinnccoommee tthhaatt iiss nnoott uusseedd ffoorr ffiinnaall ccoonnssuummppttiioonn eexxppeennddiittuurree.. GGrroossss ((nnaattiioonnaall)) ssaavviinngg aallwwaayyss mmeeaannss tthhee ssaavviinngg bbeeffoorree ddeedduuccttiinngg ccoonnssuummppttiioonn ooff ffiixxeedd ccaappiittaall.. RReeffeerreennccee:: EESSAA 11999955,, ppaarraaggrraapphh 88..9966

16
TTaabbllee 4466 GGrroossss ssaavviinngg;; pprriivvaattee sseeccttoorr;; EESSAA 9955 ((PPeerrcceennttaaggee ooff ggrroossss ddoommeessttiicc pprroodduucctt))
TThhee pprriivvaattee sseeccttoorr iinncclluuddeess nnoonn--ffiinnaanncciiaall ccoorrppoorraattiioonnss,, ffiinnaanncciiaall ccoorrppoorraattiioonnss,, pprriivvaattee hhoouusseehhoollddss aanndd nnoonn--pprrooffiitt iinnssttiittuuttiioonnss sseerrvviinngg hhoouusseehhoollddss ((NNPPIISSHH)).. FFoorr tthhee pprriivvaattee hhoouusseehhoollddss aanndd tthhee NNPPIISSHH ggrroossss ssaavviinngg ((BB..88gg)) mmeeaassuurreess tthhee pprrooppoorrttiioonn ooff ddiissppoossaabbllee iinnccoommee tthhaatt iiss nnoott uusseedd ffoorr ffiinnaall ccoonnssuummppttiioonn eexxppeennddiittuurree.. FFoorr ffiinnaanncciiaall aanndd nnoonn--ffiinnaanncciiaall ccoorrppoorraattiioonnss ggrroossss ssaavviinngg eeqquuaallss ddiissppoossaabbllee iinnccoommee mmiinnuuss aaddjjuussttmmeenntt ffoorr tthhee cchhaannggee iinn nneett eeqquuiittyy ooff hhoouusseehhoollddss iinn ppeennssiioonn ffuunnddss rreesseerrvveess.. TThhee aaddjjuussttmmeenntt ffoorr tthhee cchhaannggee iinn nneett eeqquuiittyy ooff hhoouusseehhoollddss iinn ppeennssiioonn ffuunnddss rreesseerrvveess ((DD..88)),, rreepprreesseennttss tthhee aaddjjuussttmmeenntt nneeeeddeedd ttoo mmaakkee aappppeeaarr iinn tthhee ssaavviinngg ooff hhoouusseehhoollddss tthhee cchhaannggee iinn tthhee aaccttuuaarriiaall rreesseerrvveess oonn wwhhiicchh hhoouusseehhoollddss hhaavvee aa ddeeffiinniittee ccllaaiimm..
RReeffeerreennccee:: EESSAA 11999955,, ppaarraaggrraapphhss 88..3366,, 44..114411 ff TTaabbllee 4477 GGrroossss ssaavviinngg;; ggeenneerraall ggoovveerrnnmmeenntt;; EESSAA 9955 ((PPeerrcceennttaaggee ooff ggrroossss ddoommeessttiicc pprroodduucctt aatt mmaarrkkeett pprriicceess))
SSaavviinngg ((BB..88)) iiss oobbttaaiinneedd bbyy ssuubbttrraaccttiinngg ffiinnaall ccoonnssuummppttiioonn eexxppeennddiittuurree ffrroomm ddiissppoossaabbllee iinnccoommee oorr bbyy ssuubbttrraaccttiinngg aaccttuuaall ffiinnaall ccoonnssuummppttiioonn ffrroomm aaddjjuusstteedd ddiissppoossaabbllee iinnccoommee.. IItt iiss tthhee ((ppoossiittiivvee oorr nneeggaattiivvee)) aammoouunntt rreessuullttiinngg ffrroomm ccuurrrreenntt ttrraannssaaccttiioonnss wwhhiicchh eessttaabblliisshheess tthhee lliinnkk wwiitthh aaccccuummuullaattiioonn.. IIff ssaavviinngg iiss ppoossiittiivvee,, nnoonn--ssppeenntt iinnccoommee iiss uusseedd ffoorr tthhee aaccqquuiissiittiioonn ooff aasssseettss oorr ffoorr ppaayyiinngg ooffff lliiaabbiilliittiieess.. IIff ssaavviinngg iiss nneeggaattiivvee,, cceerrttaaiinn aasssseettss aarree lliiqquuiiddaatteedd oorr cceerrttaaiinn lliiaabbiilliittiieess iinnccrreeaassee.. RReeffeerreennccee:: EESSAA 11999955,, ppaarraaggrraapphhss 88..3366,, 88..4422,, 88..4433 TTaabbllee 4488 NNoommiinnaall sshhoorrtt tteerrmm iinntteerreesstt rraatteess ((%%))
DDeeffiinniittiioonnss:: BBEE:: 11996611 –– 11998844,, 44--mmoonntthh cceerrttiiffiiccaatteess ooff ‘‘FFoonnddss ddeess RReenntteess’’;; ffrroomm 11998855,, 33--mmoonntthh TTrreeaassuurryy cceerrttiiffiiccaatteess.. DDKK:: 11996611 –– 11997766,, ddiissccoouunntt rraattee;; 11997777 –– 11998888,, ccaallll mmoonneeyy;; ffrroomm 11998899,, 33--mmoonntthh iinntteerrbbaannkk rraatteess.. DDEE:: 33--mmoonntthh iinntteerrbbaannkk rraatteess.. EELL:: 11996600 –– AApprriill 11998800 ccrreeddiitt ffoorr wwoorrkkiinngg ccaappiittaall ttoo iinndduussttrryy;; MMaayy 11998800 –– 11998877,, iinntteerrbbaannkk ssiigghhtt ddeeppoossiittss;; ffrroomm 11998888,, 11--mmoonntthh iinntteerrbbaannkk rraatteess;; ssiinnccee
DDeecceemmbbeerr 11999944,, 33--mmoonntthh AAtthhiibboorr.. EESS:: 33--mmoonntthh iinntteerrbbaannkk rraatteess.. FFRR:: 11996600 –– 11996688,, ccaallll mmoonneeyy;; 11996699 –– 11998811,, 11--mmoonntthh ssaallee aanndd rreeppuurrcchhaassee aaggrreeeemmeennttss oonn pprriivvaattee sseeccttoorr ppaappeerr;; ffrroomm 11998822,, 33--mmoonntthh ssaallee aanndd rreeppuurrcchhaassee
aaggrreeeemmeenntt oonn pprriivvaattee sseeccttoorr ppaappeerr ((PPiibboorr)).. IIEE:: 11996611 –– 11997700,, 33--mmoonntthh iinntteerrbbaannkk ddeeppoossiittss iinn LLoonnddoonn;; ffrroomm 11997711,, 33--mmoonntthh iinntteerrbbaannkk rraatteess iinn DDuubblliinn.. IITT:: 11996600 –– 11997700,, 1122--mmoonntthh TTrreeaassuurryy bbiillllss;; 11997711 –– 11998844,, iinntteerrbbaannkk ssiigghhtt ddeeppoossiittss;; ffrroomm 11998855,, 33--mmoonntthh iinntteerrbbaannkk rraatteess.. NNLL:: 11996600 –– SSeepptteemmbbeerr 11997722,, 33--mmoonntthh ttrreeaassuurryy bbiillllss;; ffrroomm OOccttoobbeerr 11997722,, 33--mmoonntthh iinntteerrbbaannkk rraatteess.. AATT:: 11996600 –– 11997799,, ddaayy--ttoo--ddaayy mmoonneeyy;; 11998800 –– 11999944 oonnwwaarrddss,, 33--mmoonntthh iinntteerrbbaannkk rraatteess;; ffrroomm 11999955,, 33--mmoonntthh VViibboorr.. PPTT:: 11996666 –– JJuullyy 11998855,, 66--mmoonntthh ddeeppoossiittss;; AAuugguusstt 11998855 –– 11999922,, 33--mmoonntthh TTrreeaassuurryy bbiillllss;; ffrroomm JJaannuuaarryy 11999933,, 33--mmoonntthh iinntteerrbbaannkk rraatteess.. FFII:: 33--mmoonntthh HHeelliibboorr.. SSEE:: 11998822 –– 11998866,, 33--mmoonntthh TTrreeaassuurryy ddiissccoouunntt nnootteess;; ffrroomm 11998877 oonnwwaarrddss,, 33--mmoonntthh SSttiibboorr.. UUKK:: 11996611 –– SSeepptteemmbbeerr 11996644,, 33--mmoonntthh TTrreeaassuurryy bbiillllss;; ffrroomm OOccttoobbeerr 11996644,, 33--mmoonntthh iinntteerrbbaannkk rraatteess.. EEUU--1155:: WWeeiigghhtteedd ggeeoommeettrriicc mmeeaann;; wweeiigghhttss:: GGrroossss ddoommeessttiicc pprroodduucctt aatt ccuurrrreenntt mmaarrkkeett pprriicceess aanndd PPPPSS.. UUSS:: 33--mmoonntthh mmoonneeyy mmaarrkkeett.. JJPP:: BBoonnddss ttrraaddeedd wwiitthh 33--mmoonntthh rreeppuurrcchhaassee aaggrreeeemmeennttss ;; ffrroomm JJaannuuaarryy 11998899,, rraatteess ooff 33--mmoonntthh CCeerrttiiffiiccaattee ooff DDeeppoossiitt..
17
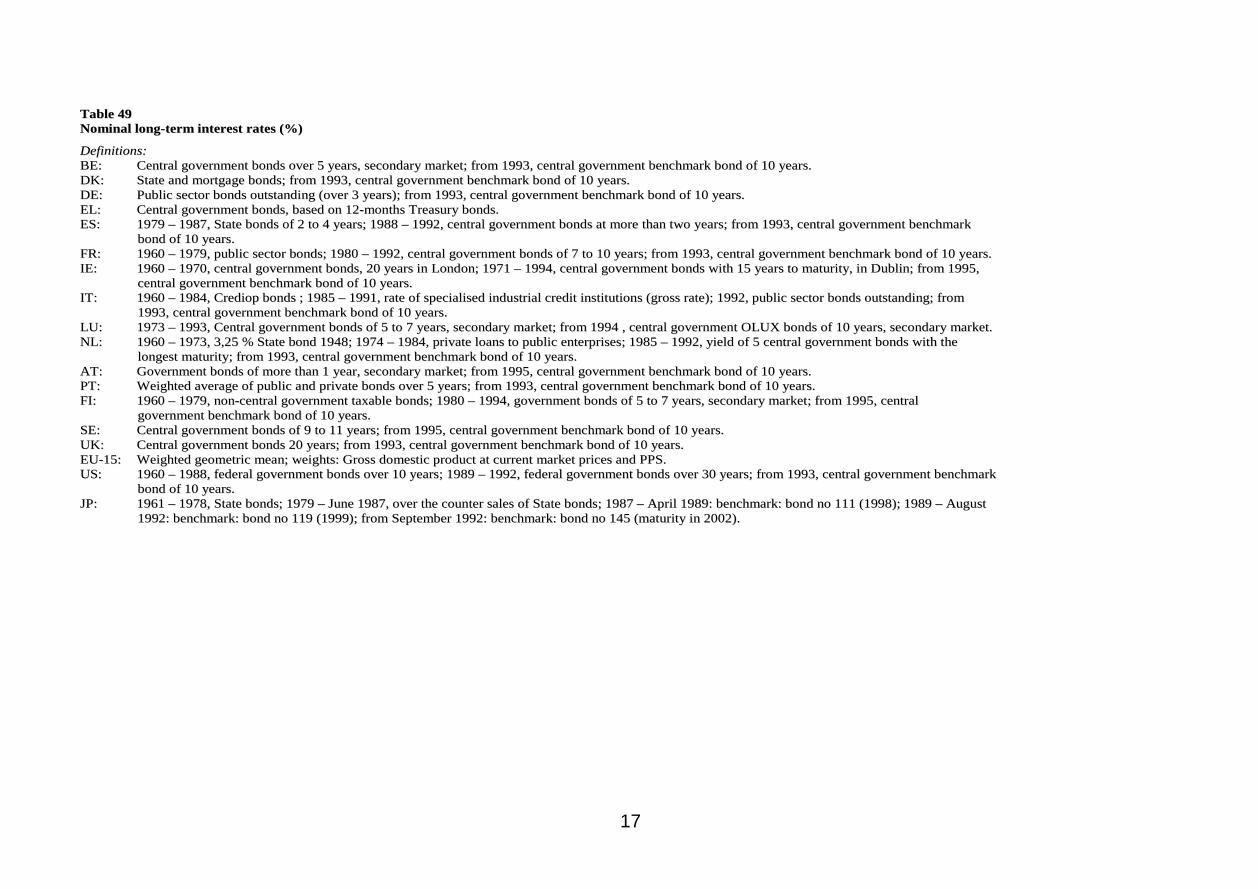
TTaabbllee 4499 NNoommiinnaall lloonngg--tteerrmm iinntteerreesstt rraatteess ((%%))
DDeeffiinniittiioonnss:: BBEE:: CCeennttrraall ggoovveerrnnmmeenntt bboonnddss oovveerr 55 yyeeaarrss,, sseeccoonnddaarryy mmaarrkkeett;; ffrroomm 11999933,, cceennttrraall ggoovveerrnnmmeenntt bbeenncchhmmaarrkk bboonndd ooff 1100 yyeeaarrss.. DDKK:: SSttaattee aanndd mmoorrttggaaggee bboonnddss;; ffrroomm 11999933,, cceennttrraall ggoovveerrnnmmeenntt bbeenncchhmmaarrkk bboonndd ooff 1100 yyeeaarrss.. DDEE:: PPuubblliicc sseeccttoorr bboonnddss oouuttssttaannddiinngg ((oovveerr 33 yyeeaarrss));; ffrroomm 11999933,, cceennttrraall ggoovveerrnnmmeenntt bbeenncchhmmaarrkk bboonndd ooff 1100 yyeeaarrss.. EELL:: CCeennttrraall ggoovveerrnnmmeenntt bboonnddss,, bbaasseedd oonn 1122--mmoonntthhss TTrreeaassuurryy bboonnddss.. EESS:: 11997799 –– 11998877,, SSttaattee bboonnddss ooff 22 ttoo 44 yyeeaarrss;; 11998888 –– 11999922,, cceennttrraall ggoovveerrnnmmeenntt bboonnddss aatt mmoorree tthhaann ttwwoo yyeeaarrss;; ffrroomm 11999933,, cceennttrraall ggoovveerrnnmmeenntt bbeenncchhmmaarrkk
bboonndd ooff 1100 yyeeaarrss.. FFRR:: 11996600 –– 11997799,, ppuubblliicc sseeccttoorr bboonnddss;; 11998800 –– 11999922,, cceennttrraall ggoovveerrnnmmeenntt bboonnddss ooff 77 ttoo 1100 yyeeaarrss;; ffrroomm 11999933,, cceennttrraall ggoovveerrnnmmeenntt bbeenncchhmmaarrkk bboonndd ooff 1100 yyeeaarrss.. IIEE:: 11996600 –– 11997700,, cceennttrraall ggoovveerrnnmmeenntt bboonnddss,, 2200 yyeeaarrss iinn LLoonnddoonn;; 11997711 –– 11999944,, cceennttrraall ggoovveerrnnmmeenntt bboonnddss wwiitthh 1155 yyeeaarrss ttoo mmaattuurriittyy,, iinn DDuubblliinn;; ffrroomm 11999955,,
cceennttrraall ggoovveerrnnmmeenntt bbeenncchhmmaarrkk bboonndd ooff 1100 yyeeaarrss.. IITT:: 11996600 –– 11998844,, CCrreeddiioopp bboonnddss ;; 11998855 –– 11999911,, rraattee ooff ssppeecciiaalliisseedd iinndduussttrriiaall ccrreeddiitt iinnssttiittuuttiioonnss ((ggrroossss rraattee));; 11999922,, ppuubblliicc sseeccttoorr bboonnddss oouuttssttaannddiinngg;; ffrroomm
11999933,, cceennttrraall ggoovveerrnnmmeenntt bbeenncchhmmaarrkk bboonndd ooff 1100 yyeeaarrss.. LLUU:: 11997733 –– 11999933,, CCeennttrraall ggoovveerrnnmmeenntt bboonnddss ooff 55 ttoo 77 yyeeaarrss,, sseeccoonnddaarryy mmaarrkkeett;; ffrroomm 11999944 ,, cceennttrraall ggoovveerrnnmmeenntt OOLLUUXX bboonnddss ooff 1100 yyeeaarrss,, sseeccoonnddaarryy mmaarrkkeett.. NNLL:: 11996600 –– 11997733,, 33,,2255 %% SSttaattee bboonndd 11994488;; 11997744 –– 11998844,, pprriivvaattee llooaannss ttoo ppuubblliicc eenntteerrpprriisseess;; 11998855 –– 11999922,, yyiieelldd ooff 55 cceennttrraall ggoovveerrnnmmeenntt bboonnddss wwiitthh tthhee
lloonnggeesstt mmaattuurriittyy;; ffrroomm 11999933,, cceennttrraall ggoovveerrnnmmeenntt bbeenncchhmmaarrkk bboonndd ooff 1100 yyeeaarrss.. AATT:: GGoovveerrnnmmeenntt bboonnddss ooff mmoorree tthhaann 11 yyeeaarr,, sseeccoonnddaarryy mmaarrkkeett;; ffrroomm 11999955,, cceennttrraall ggoovveerrnnmmeenntt bbeenncchhmmaarrkk bboonndd ooff 1100 yyeeaarrss.. PPTT:: WWeeiigghhtteedd aavveerraaggee ooff ppuubblliicc aanndd pprriivvaattee bboonnddss oovveerr 55 yyeeaarrss;; ffrroomm 11999933,, cceennttrraall ggoovveerrnnmmeenntt bbeenncchhmmaarrkk bboonndd ooff 1100 yyeeaarrss.. FFII:: 11996600 –– 11997799,, nnoonn--cceennttrraall ggoovveerrnnmmeenntt ttaaxxaabbllee bboonnddss;; 11998800 –– 11999944,, ggoovveerrnnmmeenntt bboonnddss ooff 55 ttoo 77 yyeeaarrss,, sseeccoonnddaarryy mmaarrkkeett;; ffrroomm 11999955,, cceennttrraall
ggoovveerrnnmmeenntt bbeenncchhmmaarrkk bboonndd ooff 1100 yyeeaarrss.. SSEE:: CCeennttrraall ggoovveerrnnmmeenntt bboonnddss ooff 99 ttoo 1111 yyeeaarrss;; ffrroomm 11999955,, cceennttrraall ggoovveerrnnmmeenntt bbeenncchhmmaarrkk bboonndd ooff 1100 yyeeaarrss.. UUKK:: CCeennttrraall ggoovveerrnnmmeenntt bboonnddss 2200 yyeeaarrss;; ffrroomm 11999933,, cceennttrraall ggoovveerrnnmmeenntt bbeenncchhmmaarrkk bboonndd ooff 1100 yyeeaarrss.. EEUU--1155:: WWeeiigghhtteedd ggeeoommeettrriicc mmeeaann;; wweeiigghhttss:: GGrroossss ddoommeessttiicc pprroodduucctt aatt ccuurrrreenntt mmaarrkkeett pprriicceess aanndd PPPPSS.. UUSS:: 11996600 –– 11998888,, ffeeddeerraall ggoovveerrnnmmeenntt bboonnddss oovveerr 1100 yyeeaarrss;; 11998899 –– 11999922,, ffeeddeerraall ggoovveerrnnmmeenntt bboonnddss oovveerr 3300 yyeeaarrss;; ffrroomm 11999933,, cceennttrraall ggoovveerrnnmmeenntt bbeenncchhmmaarrkk
bboonndd ooff 1100 yyeeaarrss.. JJPP:: 11996611 –– 11997788,, SSttaattee bboonnddss;; 11997799 –– JJuunnee 11998877,, oovveerr tthhee ccoouunntteerr ssaalleess ooff SSttaattee bboonnddss;; 11998877 –– AApprriill 11998899:: bbeenncchhmmaarrkk:: bboonndd nnoo 111111 ((11999988));; 11998899 –– AAuugguusstt
11999922:: bbeenncchhmmaarrkk:: bboonndd nnoo 111199 ((11999999));; ffrroomm SSeepptteemmbbeerr 11999922:: bbeenncchhmmaarrkk:: bboonndd nnoo 114455 ((mmaattuurriittyy iinn 22000022))..

18
TTaabbllee 5522 NNoommiinnaall eeffffeeccttiivvee eexxcchhaannggee rraatteess;; ppeerrffoorrmmaannccee rreellaattiivvee ttoo tthhee rreesstt ooff 3355 iinndduussttrriiaall ccoouunnttrriieess;; ddoouubbllee eexxppoorrtt wweeiigghhttss ((22000055 == 110000))
TThhee nnoommiinnaall eeffffeeccttiivvee eexxcchhaannggee rraattee ooff aa ccoouunnttrryy oorr ooff aa ccuurrrreennccyy aarreeaa ddiissppllaayyss cchhaannggeess iinn tthhee vvaalluuee ooff tthhaatt ccoouunnttrryy’’ss ccuurrrreennccyy rreellaattiivvee ttoo tthhee ccuurrrreenncciieess ooff iittss pprriinncciippaall ttrraaddiinngg ppaarrttnneerrss.. IItt iiss ccaallccuullaatteedd aass aa wweeiigghhtteedd aavveerraaggee ooff tthhee bbiillaatteerraall eexxcchhaannggee rraatteess wwiitthh tthhoossee ccuurrrreenncciieess.. FFoorr ddoouubbllee eexxppoorrtt wweeiigghhttss sseeee nnoottee oonn TTaabbllee 3355.. TTaabblleess 5533 ttoo 7777 MMeemmbbeerr SSttaatteess hhaavvee pprroovviiddeedd ffiigguurreess ffoorr tthhee llaasstt ssttaattiissttiiccaall ppeerriioodd aaccccoorrddiinngg ttoo EESSAA 9955 ssppeecciiffiiccaattiioonnss ssttaarrttiinngg ffrroomm tthhee yyeeaarrss mmeennttiioonneedd bbeellooww::
11996699:: NNLL 11998800:: IITT 11997700:: BBEE,, UUKK,, DDEE 11998855:: IIEE 11997711:: DDKK 11998888:: EELL 11997755:: FFII 11999900:: LLUU,, LLVV 11997766:: AATT 11999911:: BBGG,, PPLL 11997777:: PPTT 11999933:: SSEE,, EEEE,, LLTT ,, SSKK 11997788:: FFRR 11999955:: CCYY,,CCZZ,, EESS,,HHUU,, MMTT,, RROO,, SSII 22000099:: HHRR TTaabbllee 5533 TTaaxxeess lliinnkkeedd ttoo iimmppoorrttss aanndd pprroodduuccttiioonn ((iinnddiirreecctt ttaaxxeess));; ggeenneerraall ggoovveerrnnmmeenntt;; EESSAA 9955 ((PPeerrcceennttaaggee ooff ggrroossss ddoommeessttiicc pprroodduucctt aatt ccuurrrreenntt mmaarrkkeett pprriicceess))
TTaaxxeess oonn pprroodduuccttiioonn aanndd iimmppoorrttss ((DD..22)) lleevviieedd bbyy ggeenneerraall ggoovveerrnnmmeenntt ccoonnssiisstt ooff ccoommppuullssoorryy,, uunnrreeqquuiitteedd ppaayymmeennttss,, wwhhiicchh aarree lleevviieedd iinn rreessppeecctt ooff tthhee pprroodduuccttiioonn aanndd iimmppoorrttaattiioonn ooff ggooooddss aanndd sseerrvviicceess,, tthhee eemmppllooyymmeenntt ooff llaabboouurr,, tthhee oowwnneerrsshhiipp oorr uussee ooff llaanndd,, bbuuiillddiinnggss oorr ootthheerr aasssseettss uusseedd iinn pprroodduuccttiioonn.. ((TTaaxxeess oonn pprroodduuccttiioonn aanndd iimmppoorrttss aarree aallssoo lleevviieedd bbyy tthhee IInnssttiittuuttiioonnss ooff tthhee EEUU.. HHoowweevveerr,, tthheeyy aarree nnoott iinncclluuddeedd iinn tthhiiss ttaabbllee..)) TTaaxxeess oonn pprroodduuccttiioonn aanndd iimmppoorrttss ccoommpprriissee
VVaalluuee aaddddeedd ttyyppee ttaaxxeess ((DD..221111)) TTaaxxeess aanndd dduuttiieess oonn iimmppoorrttss eexxcclluuddiinngg VVAATT ((DD..221122)) TTaaxxeess oonn pprroodduuccttss,, eexxcceepptt VVAATT aanndd iimmppoorrtt ttaaxxeess ((DD..221144)) OOtthheerr ttaaxxeess oonn pprroodduuccttiioonn ((DD..2299))
TTaaxxeess oonn pprroodduuccttss ((eexxcceepptt VVAATT aanndd iimmppoorrtt ttaaxxeess)),, DD..221144,, iinncclluuddee ee..gg.. ccaarr rreeggiissttrraattiioonn ttaaxxeess;; ttaaxxeess oonn eenntteerrttaaiinnmmeenntt;; ttaaxxeess oonn iinnssuurraannccee pprreemmiiuummss aanndd ttaaxxeess oonn llootttteerriieess,, ggaammbblliinngg aanndd bbeettttiinngg,, ootthheerr tthhaann tthhoossee oonn wwiinnnniinnggss.. OOtthheerr ttaaxxeess oonn pprroodduuccttiioonn ((DD..2299)) ccoonnssiisstt ooff aallll ttaaxxeess tthhaatt eenntteerrpprriisseess iinnccuurr aass aa rreessuulltt ooff eennggaaggiinngg iinn pprroodduuccttiioonn,, iinnddeeppeennddeennttllyy ooff tthhee qquuaannttiittyy oorr vvaalluuee ooff tthhee ggooooddss aanndd sseerrvviicceess pprroodduucceedd oorr ssoolldd.. TThheeyy iinncclluuddee ttaaxxeess oonn tthhee ttoottaall wwaaggee bbiillll aanndd ppaayyrroollll ttaaxxeess;; ttaaxxeess oonn tthhee uussee ooff ffiixxeedd aasssseettss ((vveehhiicclleess,, mmaacchhiinneerryy,, eeqquuiippmmeenntt)) ffoorr ppuurrppoosseess ooff pprroodduuccttiioonn aass wweellll aass ttaaxxeess oonn tthhee oowwnneerrsshhiipp oorr uussee ooff llaanndd,, bbuuiillddiinnggss,, oorr ootthheerr ssttrruuccttuurreess uuttiilliisseedd bbyy eenntteerrpprriisseess iinn pprroodduuccttiioonn.. RReeffeerreennccee:: EESSAA 11999955,, ppaarraaggrraapphhss 44..1144 –– 44..2233
19
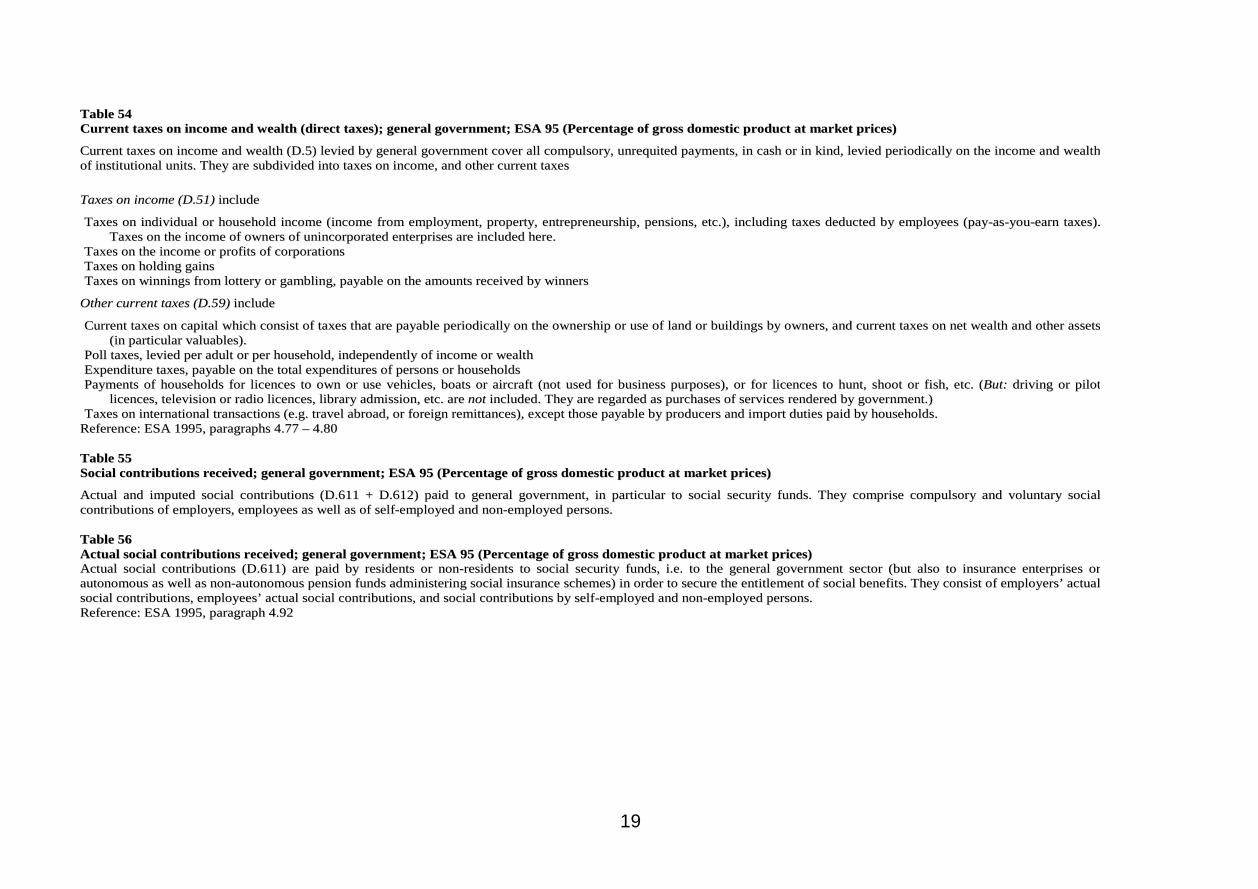
TTaabbllee 5544 CCuurrrreenntt ttaaxxeess oonn iinnccoommee aanndd wweeaalltthh ((ddiirreecctt ttaaxxeess));; ggeenneerraall ggoovveerrnnmmeenntt;; EESSAA 9955 ((PPeerrcceennttaaggee ooff ggrroossss ddoommeessttiicc pprroodduucctt aatt mmaarrkkeett pprriicceess))
CCuurrrreenntt ttaaxxeess oonn iinnccoommee aanndd wweeaalltthh ((DD..55)) lleevviieedd bbyy ggeenneerraall ggoovveerrnnmmeenntt ccoovveerr aallll ccoommppuullssoorryy,, uunnrreeqquuiitteedd ppaayymmeennttss,, iinn ccaasshh oorr iinn kkiinndd,, lleevviieedd ppeerriiooddiiccaallllyy oonn tthhee iinnccoommee aanndd wweeaalltthh ooff iinnssttiittuuttiioonnaall uunniittss.. TThheeyy aarree ssuubbddiivviiddeedd iinnttoo ttaaxxeess oonn iinnccoommee,, aanndd ootthheerr ccuurrrreenntt ttaaxxeess TTaaxxeess oonn iinnccoommee ((DD..5511)) iinncclluuddee
TTaaxxeess oonn iinnddiivviidduuaall oorr hhoouusseehhoolldd iinnccoommee ((iinnccoommee ffrroomm eemmppllooyymmeenntt,, pprrooppeerrttyy,, eennttrreepprreenneeuurrsshhiipp,, ppeennssiioonnss,, eettcc..)),, iinncclluuddiinngg ttaaxxeess ddeedduucctteedd bbyy eemmppllooyyeeeess ((ppaayy--aass--yyoouu--eeaarrnn ttaaxxeess)).. TTaaxxeess oonn tthhee iinnccoommee ooff oowwnneerrss ooff uunniinnccoorrppoorraatteedd eenntteerrpprriisseess aarree iinncclluuddeedd hheerree..
TTaaxxeess oonn tthhee iinnccoommee oorr pprrooffiittss ooff ccoorrppoorraattiioonnss TTaaxxeess oonn hhoollddiinngg ggaaiinnss TTaaxxeess oonn wwiinnnniinnggss ffrroomm llootttteerryy oorr ggaammbblliinngg,, ppaayyaabbllee oonn tthhee aammoouunnttss rreecceeiivveedd bbyy wwiinnnneerrss
OOtthheerr ccuurrrreenntt ttaaxxeess ((DD..5599)) iinncclluuddee
CCuurrrreenntt ttaaxxeess oonn ccaappiittaall wwhhiicchh ccoonnssiisstt ooff ttaaxxeess tthhaatt aarree ppaayyaabbllee ppeerriiooddiiccaallllyy oonn tthhee oowwnneerrsshhiipp oorr uussee ooff llaanndd oorr bbuuiillddiinnggss bbyy oowwnneerrss,, aanndd ccuurrrreenntt ttaaxxeess oonn nneett wweeaalltthh aanndd ootthheerr aasssseettss ((iinn ppaarrttiiccuullaarr vvaalluuaabblleess))..
PPoollll ttaaxxeess,, lleevviieedd ppeerr aadduulltt oorr ppeerr hhoouusseehhoolldd,, iinnddeeppeennddeennttllyy ooff iinnccoommee oorr wweeaalltthh EExxppeennddiittuurree ttaaxxeess,, ppaayyaabbllee oonn tthhee ttoottaall eexxppeennddiittuurreess ooff ppeerrssoonnss oorr hhoouusseehhoollddss PPaayymmeennttss ooff hhoouusseehhoollddss ffoorr lliicceenncceess ttoo oowwnn oorr uussee vveehhiicclleess,, bbooaattss oorr aaiirrccrraafftt ((nnoott uusseedd ffoorr bbuussiinneessss ppuurrppoosseess)),, oorr ffoorr lliicceenncceess ttoo hhuunntt,, sshhoooott oorr ffiisshh,, eettcc.. ((BBuutt:: ddrriivviinngg oorr ppiilloott
lliicceenncceess,, tteelleevviissiioonn oorr rraaddiioo lliicceenncceess,, lliibbrraarryy aaddmmiissssiioonn,, eettcc.. aarree nnoott iinncclluuddeedd.. TThheeyy aarree rreeggaarrddeedd aass ppuurrcchhaasseess ooff sseerrvviicceess rreennddeerreedd bbyy ggoovveerrnnmmeenntt..)) TTaaxxeess oonn iinntteerrnnaattiioonnaall ttrraannssaaccttiioonnss ((ee..gg.. ttrraavveell aabbrrooaadd,, oorr ffoorreeiiggnn rreemmiittttaanncceess)),, eexxcceepptt tthhoossee ppaayyaabbllee bbyy pprroodduucceerrss aanndd iimmppoorrtt dduuttiieess ppaaiidd bbyy hhoouusseehhoollddss..
RReeffeerreennccee:: EESSAA 11999955,, ppaarraaggrraapphhss 44..7777 –– 44..8800 TTaabbllee 5555 SSoocciiaall ccoonnttrriibbuuttiioonnss rreecceeiivveedd;; ggeenneerraall ggoovveerrnnmmeenntt;; EESSAA 9955 ((PPeerrcceennttaaggee ooff ggrroossss ddoommeessttiicc pprroodduucctt aatt mmaarrkkeett pprriicceess))
AAccttuuaall aanndd iimmppuutteedd ssoocciiaall ccoonnttrriibbuuttiioonnss ((DD..661111 ++ DD..661122)) ppaaiidd ttoo ggeenneerraall ggoovveerrnnmmeenntt,, iinn ppaarrttiiccuullaarr ttoo ssoocciiaall sseeccuurriittyy ffuunnddss.. TThheeyy ccoommpprriissee ccoommppuullssoorryy aanndd vvoolluunnttaarryy ssoocciiaall ccoonnttrriibbuuttiioonnss ooff eemmppllooyyeerrss,, eemmppllooyyeeeess aass wweellll aass ooff sseellff--eemmppllooyyeedd aanndd nnoonn--eemmppllooyyeedd ppeerrssoonnss.. TTaabbllee 5566 AAccttuuaall ssoocciiaall ccoonnttrriibbuuttiioonnss rreecceeiivveedd;; ggeenneerraall ggoovveerrnnmmeenntt;; EESSAA 9955 ((PPeerrcceennttaaggee ooff ggrroossss ddoommeessttiicc pprroodduucctt aatt mmaarrkkeett pprriicceess)) AAccttuuaall ssoocciiaall ccoonnttrriibbuuttiioonnss ((DD..661111)) aarree ppaaiidd bbyy rreessiiddeennttss oorr nnoonn--rreessiiddeennttss ttoo ssoocciiaall sseeccuurriittyy ffuunnddss,, ii..ee.. ttoo tthhee ggeenneerraall ggoovveerrnnmmeenntt sseeccttoorr ((bbuutt aallssoo ttoo iinnssuurraannccee eenntteerrpprriisseess oorr aauuttoonnoommoouuss aass wweellll aass nnoonn--aauuttoonnoommoouuss ppeennssiioonn ffuunnddss aaddmmiinniisstteerriinngg ssoocciiaall iinnssuurraannccee sscchheemmeess)) iinn oorrddeerr ttoo sseeccuurree tthhee eennttiittlleemmeenntt ooff ssoocciiaall bbeenneeffiittss.. TThheeyy ccoonnssiisstt ooff eemmppllooyyeerrss’’ aaccttuuaall ssoocciiaall ccoonnttrriibbuuttiioonnss,, eemmppllooyyeeeess’’ aaccttuuaall ssoocciiaall ccoonnttrriibbuuttiioonnss,, aanndd ssoocciiaall ccoonnttrriibbuuttiioonnss bbyy sseellff--eemmppllooyyeedd aanndd nnoonn--eemmppllooyyeedd ppeerrssoonnss.. RReeffeerreennccee:: EESSAA 11999955,, ppaarraaggrraapphh 44..9922

20
TTaabbllee 5577 OOtthheerr ccuurrrreenntt rreevveennuuee iinncclluuddiinngg;; ggeenneerraall ggoovveerrnnmmeenntt;; EESSAA 9955 ((PPeerrcceennttaaggee ooff ggrroossss ddoommeessttiicc pprroodduucctt aatt mmaarrkkeett pprriicceess))
OOtthheerr ccuurrrreenntt rreevveennuuee iinncclluuddiinngg ssaalleess ooff ggeenneerraall ggoovveerrnnmmeenntt iiss tthhee ssuumm ooff
SSaalleess ((PP..1111 ++ PP1122 ++ PP113311)) ++ OOtthheerr ssuubbssiiddiieess oonn pprroodduuccttiioonn,, rreecceeiivvaabbllee ++ PPrrooppeerrttyy iinnccoommee ((DD..44)),, rreecceeiivvaabbllee ++ OOtthheerr ccuurrrreenntt ttrraannssffeerrss ((DD..77)),, rreecceeiivvaabbllee
((ccoonnssoolliiddaatteedd))
RReeggaarrddiinngg tthhee ‘‘ootthheerr ccuurrrreenntt ttrraannssffeerrss’’ ooff ppaarrttiiccuullaarr iimmppoorrttaannccee aarree ttrraannssffeerrss ccoonnnneecctteedd wwiitthh ccuurrrreenntt iinntteerrnnaattiioonnaall ccooooppeerraattiioonn,, nnoonn--lliiffee iinnssuurraannccee ccllaaiimmss aanndd mmiisscceellllaanneeoouuss ccuurrrreenntt ttrraannssffeerrss.. TThhee llaatttteerr iinncclluuddee ee..gg.. rreeffuunnddss ooff hhoouusseehhoollddss oorr ccoorrppoorraattiioonnss ttoo ggeenneerraall ggoovveerrnnmmeenntt,, ffiinneess aanndd ppeennaallttiieess eettcc.. RReeffeerreennccee:: EESSAA 11999955,, ppaarraaggrraapphhss 44..110099 ff TTaabbllee 5588 TToottaall ccuurrrreenntt rreevveennuuee;; ggeenneerraall ggoovveerrnnmmeenntt;; EESSAA 9955 ((PPeerrcceennttaaggee ooff ggrroossss ddoommeessttiicc pprroodduucctt aatt mmaarrkkeett pprriicceess))
TToottaall ccuurrrreenntt rreevveennuuee ooff ggeenneerraall ggoovveerrnnmmeenntt iiss tthhee ssuumm ooff
SSaalleess ((PP..1111 ++ PP1122 ++ PP113311)) ++ OOtthheerr ssuubbssiiddiieess oonn pprroodduuccttiioonn ((DD..3399)),, rreecceeiivvaabbllee ++ PPrrooppeerrttyy iinnccoommee ((DD..44)),, rreecceeiivvaabbllee ++ OOtthheerr ccuurrrreenntt ttrraannssffeerrss ((DD..77)),, rreecceeiivvaabbllee ++ TTaaxxeess oonn pprroodduuccttiioonn aanndd iimmppoorrttss ((DD..22)),, rreecceeiivvaabbllee ++ CCuurrrreenntt ttaaxxeess oonn iinnccoommee aanndd wweeaalltthh ((DD..55)),, rreecceeiivvaabbllee ++ SSoocciiaall ccoonnttrriibbuuttiioonnss ((DD..6611)),, rreecceeiivvaabbllee ((ccoonnssoolliiddaatteedd)) TTaabbllee 5599 FFiinnaall ccoonnssuummppttiioonn eexxppeennddiittuurree ooff ggeenneerraall ggoovveerrnnmmeenntt;; EESSAA 9955 ((PPeerrcceennttaaggee ooff ggrroossss ddoommeessttiicc pprroodduucctt aatt mmaarrkkeett pprriicceess))
FFiinnaall ccoonnssuummppttiioonn eexxppeennddiittuurree ((PP..33)) ooff ggeenneerraall ggoovveerrnnmmeenntt iinncclluuddeess ttwwoo ccaatteeggoorriieess ooff eexxppeennddiittuurreess:: TThhee vvaalluuee ooff ggooooddss aanndd sseerrvviicceess pprroodduucceedd bbyy ggeenneerraall ggoovveerrnnmmeenntt iittsseellff ootthheerr tthhaann oowwnn--aaccccoouunntt ccaappiittaall ffoorrmmaattiioonn aanndd ssaalleess ((ccoolllleeccttiivvee ccoonnssuummppttiioonn)).. PPuurrcchhaasseess bbyy ggeenneerraall ggoovveerrnnmmeenntt ooff ggooooddss aanndd sseerrvviicceess pprroodduucceedd bbyy mmaarrkkeett pprroodduucceerrss tthhaatt aarree ssuupppplliieedd ttoo hhoouusseehhoollddss -- wwiitthhoouutt aannyy ttrraannssffoorrmmaattiioonn –– aass ssoocciiaall ttrraannssffeerrss iinn kkiinndd..
TThhiiss iimmpplliieess tthhaatt ggeenneerraall ggoovveerrnnmmeenntt jjuusstt ppaayyss ffoorr ggooooddss aanndd sseerrvviicceess tthhaatt tthhee sseelllleerrss pprroovviiddee ttoo hhoouusseehhoollddss ((iinnddiivviidduuaall ccoonnssuummppttiioonn))..
FFoorr aaddddiittiioonnaall iinnffoorrmmaattiioonn oonn iinnddiivviidduuaall aanndd ccoolllleeccttiivvee ccoonnssuummppttiioonn sseeee nnootteess oonn TTaabbllee 1177 aanndd oonn TTaabbllee 6622.. RReeffeerreennccee:: EESSAA 11999955,, ppaarraaggrraapphhss 33..7799,, 33..8855 TTaabbllee 6600 CCoolllleeccttiivvee ccoonnssuummppttiioonn eexxppeennddiittuurree;; EESSAA 9955 ((PPeerrcceennttaaggee ooff ggrroossss ddoommeessttiicc pprroodduucctt aatt mmaarrkkeett pprriicceess))
SSeerrvviicceess ffoorr ccoolllleeccttiivvee ccoonnssuummppttiioonn ((PP..4422)) aarree pprroovviiddeedd ssiimmuullttaanneeoouussllyy ttoo aallll mmeemmbbeerrss ooff tthhee ccoommmmuunniittyy oorr aallll mmeemmbbeerrss ooff aa ppaarrttiiccuullaarr sseeccttiioonn ooff tthhee ccoommmmuunniittyy..
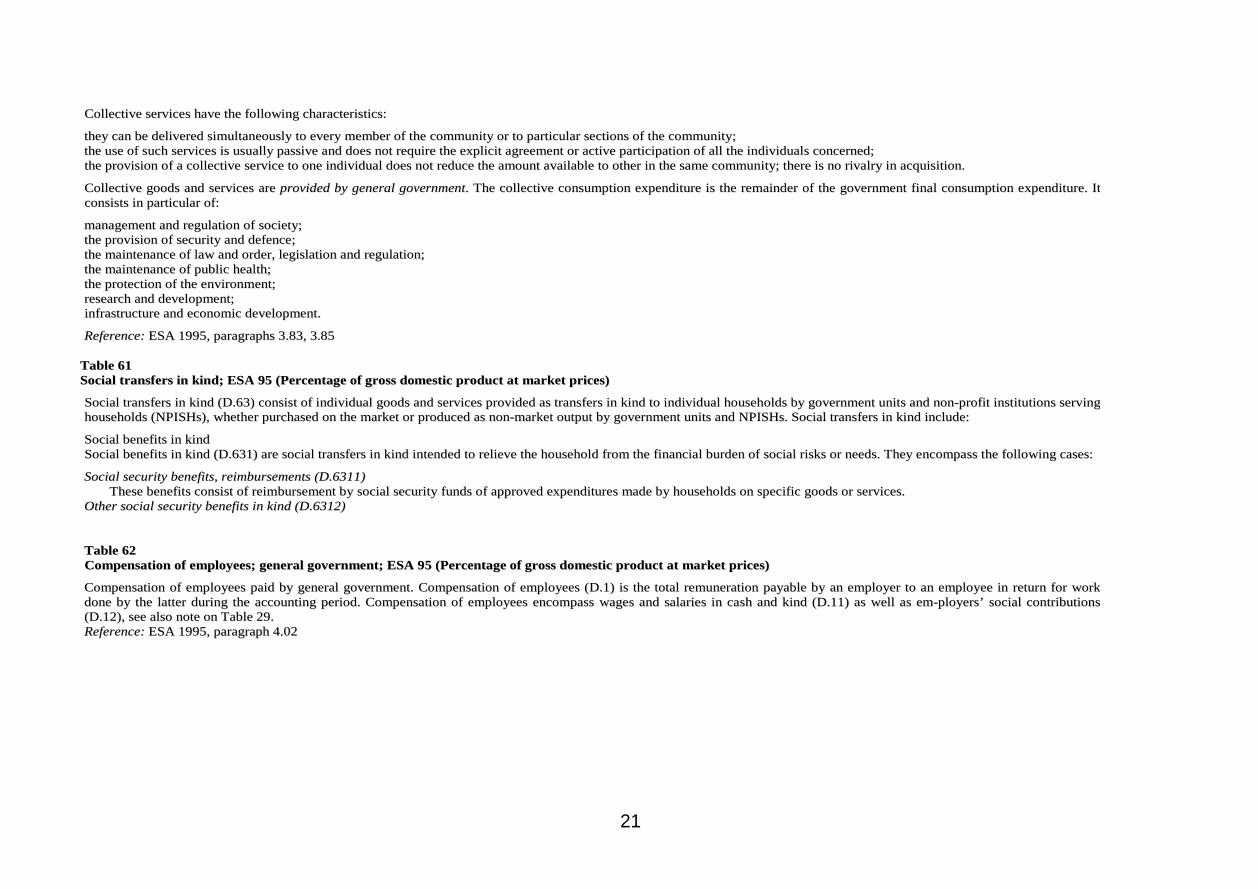
21
CCoolllleeccttiivvee sseerrvviicceess hhaavvee tthhee ffoolllloowwiinngg cchhaarraacctteerriissttiiccss::
tthheeyy ccaann bbee ddeelliivveerreedd ssiimmuullttaanneeoouussllyy ttoo eevveerryy mmeemmbbeerr ooff tthhee ccoommmmuunniittyy oorr ttoo ppaarrttiiccuullaarr sseeccttiioonnss ooff tthhee ccoommmmuunniittyy;; tthhee uussee ooff ssuucchh sseerrvviicceess iiss uussuuaallllyy ppaassssiivvee aanndd ddooeess nnoott rreeqquuiirree tthhee eexxpplliicciitt aaggrreeeemmeenntt oorr aaccttiivvee ppaarrttiicciippaattiioonn ooff aallll tthhee iinnddiivviidduuaallss ccoonncceerrnneedd;; tthhee pprroovviissiioonn ooff aa ccoolllleeccttiivvee sseerrvviiccee ttoo oonnee iinnddiivviidduuaall ddooeess nnoott rreedduuccee tthhee aammoouunntt aavvaaiillaabbllee ttoo ootthheerr iinn tthhee ssaammee ccoommmmuunniittyy;; tthheerree iiss nnoo rriivvaallrryy iinn aaccqquuiissiittiioonn..
CCoolllleeccttiivvee ggooooddss aanndd sseerrvviicceess aarree pprroovviiddeedd bbyy ggeenneerraall ggoovveerrnnmmeenntt.. TThhee ccoolllleeccttiivvee ccoonnssuummppttiioonn eexxppeennddiittuurree iiss tthhee rreemmaaiinnddeerr ooff tthhee ggoovveerrnnmmeenntt ffiinnaall ccoonnssuummppttiioonn eexxppeennddiittuurree.. IItt ccoonnssiissttss iinn ppaarrttiiccuullaarr ooff::
mmaannaaggeemmeenntt aanndd rreegguullaattiioonn ooff ssoocciieettyy;; tthhee pprroovviissiioonn ooff sseeccuurriittyy aanndd ddeeffeennccee;; tthhee mmaaiinntteennaannccee ooff llaaww aanndd oorrddeerr,, lleeggiissllaattiioonn aanndd rreegguullaattiioonn;; tthhee mmaaiinntteennaannccee ooff ppuubblliicc hheeaalltthh;; tthhee pprrootteeccttiioonn ooff tthhee eennvviirroonnmmeenntt;; rreesseeaarrcchh aanndd ddeevveellooppmmeenntt;; iinnffrraassttrruuccttuurree aanndd eeccoonnoommiicc ddeevveellooppmmeenntt..
RReeffeerreennccee:: EESSAA 11999955,, ppaarraaggrraapphhss 33..8833,, 33..8855
TTaabbllee 6611 SSoocciiaall ttrraannssffeerrss iinn kkiinndd;; EESSAA 9955 ((PPeerrcceennttaaggee ooff ggrroossss ddoommeessttiicc pprroodduucctt aatt mmaarrkkeett pprriicceess))
SSoocciiaall ttrraannssffeerrss iinn kkiinndd ((DD..6633)) ccoonnssiisstt ooff iinnddiivviidduuaall ggooooddss aanndd sseerrvviicceess pprroovviiddeedd aass ttrraannssffeerrss iinn kkiinndd ttoo iinnddiivviidduuaall hhoouusseehhoollddss bbyy ggoovveerrnnmmeenntt uunniittss aanndd nnoonn--pprrooffiitt iinnssttiittuuttiioonnss sseerrvviinngg hhoouusseehhoollddss ((NNPPIISSHHss)),, wwhheetthheerr ppuurrcchhaasseedd oonn tthhee mmaarrkkeett oorr pprroodduucceedd aass nnoonn--mmaarrkkeett oouuttppuutt bbyy ggoovveerrnnmmeenntt uunniittss aanndd NNPPIISSHHss.. SSoocciiaall ttrraannssffeerrss iinn kkiinndd iinncclluuddee::
SSoocciiaall bbeenneeffiittss iinn kkiinndd SSoocciiaall bbeenneeffiittss iinn kkiinndd ((DD..663311)) aarree ssoocciiaall ttrraannssffeerrss iinn kkiinndd iinntteennddeedd ttoo rreelliieevvee tthhee hhoouusseehhoolldd ffrroomm tthhee ffiinnaanncciiaall bbuurrddeenn ooff ssoocciiaall rriisskkss oorr nneeeeddss.. TThheeyy eennccoommppaassss tthhee ffoolllloowwiinngg ccaasseess::
SSoocciiaall sseeccuurriittyy bbeenneeffiittss,, rreeiimmbbuurrsseemmeennttss ((DD..66331111)) TThheessee bbeenneeffiittss ccoonnssiisstt ooff rreeiimmbbuurrsseemmeenntt bbyy ssoocciiaall sseeccuurriittyy ffuunnddss ooff aapppprroovveedd eexxppeennddiittuurreess mmaaddee bbyy hhoouusseehhoollddss oonn ssppeecciiffiicc ggooooddss oorr sseerrvviicceess..
OOtthheerr ssoocciiaall sseeccuurriittyy bbeenneeffiittss iinn kkiinndd ((DD..66331122)) TTaabbllee 6622 CCoommppeennssaattiioonn ooff eemmppllooyyeeeess;; ggeenneerraall ggoovveerrnnmmeenntt;; EESSAA 9955 ((PPeerrcceennttaaggee ooff ggrroossss ddoommeessttiicc pprroodduucctt aatt mmaarrkkeett pprriicceess))
CCoommppeennssaattiioonn ooff eemmppllooyyeeeess ppaaiidd bbyy ggeenneerraall ggoovveerrnnmmeenntt.. CCoommppeennssaattiioonn ooff eemmppllooyyeeeess ((DD..11)) iiss tthhee ttoottaall rreemmuunneerraattiioonn ppaayyaabbllee bbyy aann eemmppllooyyeerr ttoo aann eemmppllooyyeeee iinn rreettuurrnn ffoorr wwoorrkk ddoonnee bbyy tthhee llaatttteerr dduurriinngg tthhee aaccccoouunnttiinngg ppeerriioodd.. CCoommppeennssaattiioonn ooff eemmppllooyyeeeess eennccoommppaassss wwaaggeess aanndd ssaallaarriieess iinn ccaasshh aanndd kkiinndd ((DD..1111)) aass wweellll aass eemm--ppllooyyeerrss’’ ssoocciiaall ccoonnttrriibbuuttiioonnss ((DD..1122)),, sseeee aallssoo nnoottee oonn TTaabbllee 2299.. RReeffeerreennccee:: EESSAA 11999955,, ppaarraaggrraapphh 44..0022
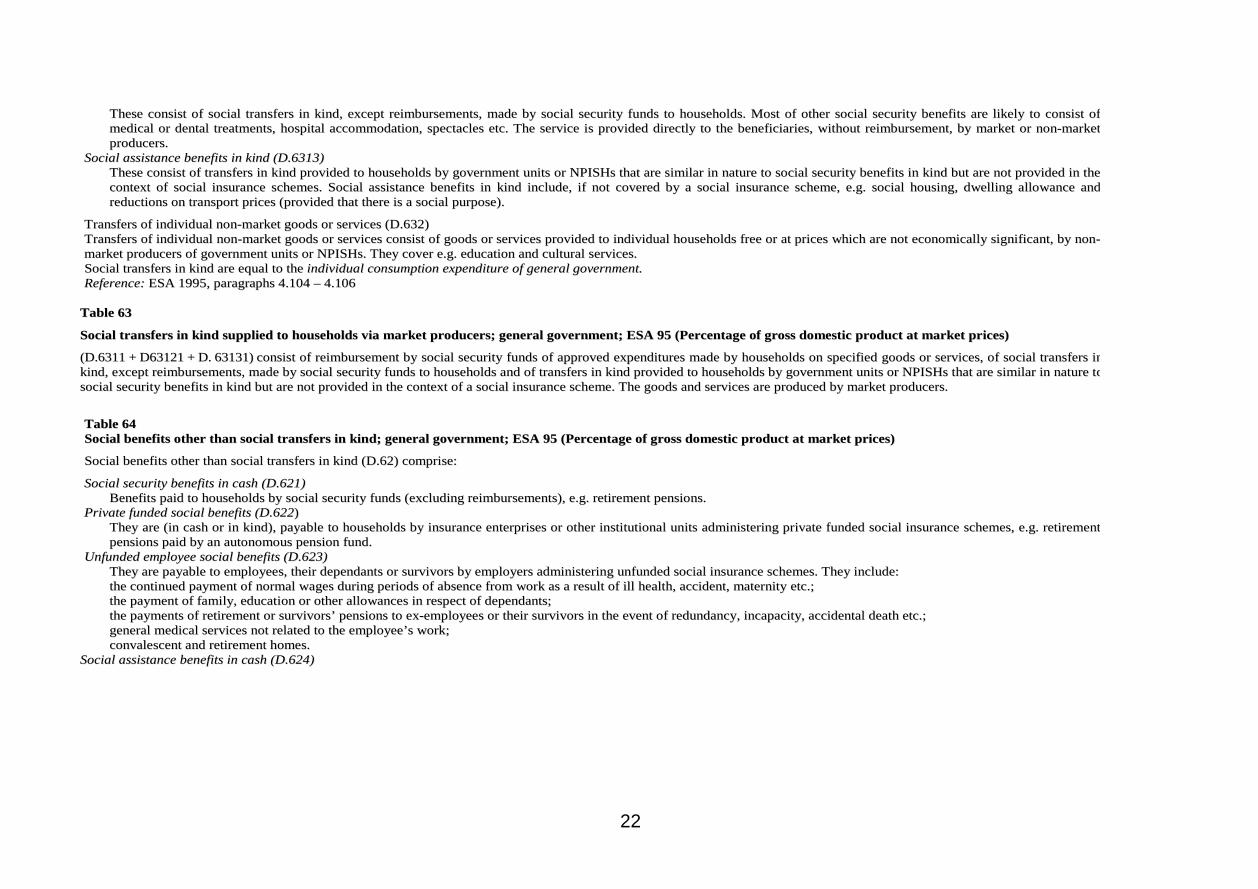
22
TThheessee ccoonnssiisstt ooff ssoocciiaall ttrraannssffeerrss iinn kkiinndd,, eexxcceepptt rreeiimmbbuurrsseemmeennttss,, mmaaddee bbyy ssoocciiaall sseeccuurriittyy ffuunnddss ttoo hhoouusseehhoollddss.. MMoosstt ooff ootthheerr ssoocciiaall sseeccuurriittyy bbeenneeffiittss aarree lliikkeellyy ttoo ccoonnssiisstt ooff mmeeddiiccaall oorr ddeennttaall ttrreeaattmmeennttss,, hhoossppiittaall aaccccoommmmooddaattiioonn,, ssppeeccttaacclleess eettcc.. TThhee sseerrvviiccee iiss pprroovviiddeedd ddiirreeccttllyy ttoo tthhee bbeenneeffiicciiaarriieess,, wwiitthhoouutt rreeiimmbbuurrsseemmeenntt,, bbyy mmaarrkkeett oorr nnoonn--mmaarrkkeett pprroodduucceerrss..
SSoocciiaall aassssiissttaannccee bbeenneeffiittss iinn kkiinndd ((DD..66331133)) TThheessee ccoonnssiisstt ooff ttrraannssffeerrss iinn kkiinndd pprroovviiddeedd ttoo hhoouusseehhoollddss bbyy ggoovveerrnnmmeenntt uunniittss oorr NNPPIISSHHss tthhaatt aarree ssiimmiillaarr iinn nnaattuurree ttoo ssoocciiaall sseeccuurriittyy bbeenneeffiittss iinn kkiinndd bbuutt aarree nnoott pprroovviiddeedd iinn tthhee ccoonntteexxtt ooff ssoocciiaall iinnssuurraannccee sscchheemmeess.. SSoocciiaall aassssiissttaannccee bbeenneeffiittss iinn kkiinndd iinncclluuddee,, iiff nnoott ccoovveerreedd bbyy aa ssoocciiaall iinnssuurraannccee sscchheemmee,, ee..gg.. ssoocciiaall hhoouussiinngg,, ddwweelllliinngg aalllloowwaannccee aanndd rreedduuccttiioonnss oonn ttrraannssppoorrtt pprriicceess ((pprroovviiddeedd tthhaatt tthheerree iiss aa ssoocciiaall ppuurrppoossee))..
TTrraannssffeerrss ooff iinnddiivviidduuaall nnoonn--mmaarrkkeett ggooooddss oorr sseerrvviicceess ((DD..663322)) TTrraannssffeerrss ooff iinnddiivviidduuaall nnoonn--mmaarrkkeett ggooooddss oorr sseerrvviicceess ccoonnssiisstt ooff ggooooddss oorr sseerrvviicceess pprroovviiddeedd ttoo iinnddiivviidduuaall hhoouusseehhoollddss ffrreeee oorr aatt pprriicceess wwhhiicchh aarree nnoott eeccoonnoommiiccaallllyy ssiiggnniiffiiccaanntt,, bbyy nnoonn--mmaarrkkeett pprroodduucceerrss ooff ggoovveerrnnmmeenntt uunniittss oorr NNPPIISSHHss.. TThheeyy ccoovveerr ee..gg.. eedduuccaattiioonn aanndd ccuullttuurraall sseerrvviicceess.. SSoocciiaall ttrraannssffeerrss iinn kkiinndd aarree eeqquuaall ttoo tthhee iinnddiivviidduuaall ccoonnssuummppttiioonn eexxppeennddiittuurree ooff ggeenneerraall ggoovveerrnnmmeenntt.. RReeffeerreennccee:: EESSAA 11999955,, ppaarraaggrraapphhss 44..110044 –– 44..110066
TTaabbllee 6633
SSoocciiaall ttrraannssffeerrss iinn kkiinndd ssuupppplliieedd ttoo hhoouusseehhoollddss vviiaa mmaarrkkeett pprroodduucceerrss;; ggeenneerraall ggoovveerrnnmmeenntt;; EESSAA 9955 ((PPeerrcceennttaaggee ooff ggrroossss ddoommeessttiicc pprroodduucctt aatt mmaarrkkeett pprriicceess))
((DD..66331111 ++ DD6633112211 ++ DD.. 6633113311)) ccoonnssiisstt ooff rreeiimmbbuurrsseemmeenntt bbyy ssoocciiaall sseeccuurriittyy ffuunnddss ooff aapppprroovveedd eexxppeennddiittuurreess mmaaddee bbyy hhoouusseehhoollddss oonn ssppeecciiffiieedd ggooooddss oorr sseerrvviicceess,, ooff ssoocciiaall ttrraannssffeerrss iinn kkiinndd,, eexxcceepptt rreeiimmbbuurrsseemmeennttss,, mmaaddee bbyy ssoocciiaall sseeccuurriittyy ffuunnddss ttoo hhoouusseehhoollddss aanndd ooff ttrraannssffeerrss iinn kkiinndd pprroovviiddeedd ttoo hhoouusseehhoollddss bbyy ggoovveerrnnmmeenntt uunniittss oorr NNPPIISSHHss tthhaatt aarree ssiimmiillaarr iinn nnaattuurree ttoo ssoocciiaall sseeccuurriittyy bbeenneeffiittss iinn kkiinndd bbuutt aarree nnoott pprroovviiddeedd iinn tthhee ccoonntteexxtt ooff aa ssoocciiaall iinnssuurraannccee sscchheemmee.. TThhee ggooooddss aanndd sseerrvviicceess aarree pprroodduucceedd bbyy mmaarrkkeett pprroodduucceerrss..
TTaabbllee 6644 SSoocciiaall bbeenneeffiittss ootthheerr tthhaann ssoocciiaall ttrraannssffeerrss iinn kkiinndd;; ggeenneerraall ggoovveerrnnmmeenntt;; EESSAA 9955 ((PPeerrcceennttaaggee ooff ggrroossss ddoommeessttiicc pprroodduucctt aatt mmaarrkkeett pprriicceess))
SSoocciiaall bbeenneeffiittss ootthheerr tthhaann ssoocciiaall ttrraannssffeerrss iinn kkiinndd ((DD..6622)) ccoommpprriissee::
SSoocciiaall sseeccuurriittyy bbeenneeffiittss iinn ccaasshh ((DD..662211)) BBeenneeffiittss ppaaiidd ttoo hhoouusseehhoollddss bbyy ssoocciiaall sseeccuurriittyy ffuunnddss ((eexxcclluuddiinngg rreeiimmbbuurrsseemmeennttss)),, ee..gg.. rreettiirreemmeenntt ppeennssiioonnss..
PPrriivvaattee ffuunnddeedd ssoocciiaall bbeenneeffiittss ((DD..662222)) TThheeyy aarree ((iinn ccaasshh oorr iinn kkiinndd)),, ppaayyaabbllee ttoo hhoouusseehhoollddss bbyy iinnssuurraannccee eenntteerrpprriisseess oorr ootthheerr iinnssttiittuuttiioonnaall uunniittss aaddmmiinniisstteerriinngg pprriivvaattee ffuunnddeedd ssoocciiaall iinnssuurraannccee sscchheemmeess,, ee..gg.. rreettiirreemmeenntt ppeennssiioonnss ppaaiidd bbyy aann aauuttoonnoommoouuss ppeennssiioonn ffuunndd..
UUnnffuunnddeedd eemmppllooyyeeee ssoocciiaall bbeenneeffiittss ((DD..662233)) TThheeyy aarree ppaayyaabbllee ttoo eemmppllooyyeeeess,, tthheeiirr ddeeppeennddaannttss oorr ssuurrvviivvoorrss bbyy eemmppllooyyeerrss aaddmmiinniisstteerriinngg uunnffuunnddeedd ssoocciiaall iinnssuurraannccee sscchheemmeess.. TThheeyy iinncclluuddee:: tthhee ccoonnttiinnuueedd ppaayymmeenntt ooff nnoorrmmaall wwaaggeess dduurriinngg ppeerriiooddss ooff aabbsseennccee ffrroomm wwoorrkk aass aa rreessuulltt ooff iillll hheeaalltthh,, aacccciiddeenntt,, mmaatteerrnniittyy eettcc..;; tthhee ppaayymmeenntt ooff ffaammiillyy,, eedduuccaattiioonn oorr ootthheerr aalllloowwaanncceess iinn rreessppeecctt ooff ddeeppeennddaannttss;; tthhee ppaayymmeennttss ooff rreettiirreemmeenntt oorr ssuurrvviivvoorrss’’ ppeennssiioonnss ttoo eexx--eemmppllooyyeeeess oorr tthheeiirr ssuurrvviivvoorrss iinn tthhee eevveenntt ooff rreedduunnddaannccyy,, iinnccaappaacciittyy,, aacccciiddeennttaall ddeeaatthh eettcc..;; ggeenneerraall mmeeddiiccaall sseerrvviicceess nnoott rreellaatteedd ttoo tthhee eemmppllooyyeeee’’ss wwoorrkk;; ccoonnvvaalleesscceenntt aanndd rreettiirreemmeenntt hhoommeess..
SSoocciiaall aassssiissttaannccee bbeenneeffiittss iinn ccaasshh ((DD..662244))

23
TThheeyy aarree ppaayyaabbllee ttoo hhoouusseehhoollddss bbyy ggoovveerrnnmmeenntt uunniittss oorr NNPPIISSHHss ttoo mmeeeett tthhee ssaammee nneeeeddss aass ssoocciiaall iinnssuurraannccee bbeenneeffiittss bbuutt wwhhiicchh aarree nnoott mmaaddee uunnddeerr aa ssoocciiaall iinnssuurraannccee sscchheemmee iinnccoorrppoorraattiinngg ssoocciiaall ccoonnttrriibbuuttiioonnss aanndd ssoocciiaall iinnssuurraannccee bbeenneeffiittss.. IInncclluuddeedd aarree ee..gg.. cchhiillddrreenn’’ss aalllloowwaannccee,, wweellffaarree aaffffaaiirrss aanndd sseerrvviicceess,, ggrraannttss rreeffeerrrriinngg ttoo ssttuuddeennttss ffiinnaanncciiaall aassssiissttaannccee sscchheemmee,, eettcc..
RReeffeerreennccee:: EESSAA 11999955,, ppaarraaggrraapphh 44..110033 TTaabbllee 6655 IInntteerrmmeeddiiaattee ccoonnssuummppttiioonn;; ggeenneerraall ggoovveerrnnmmeenntt;; EESSAA 9955 ((PPeerrcceennttaaggee ooff ggrroossss ddoommeessttiicc pprroodduucctt aatt mmaarrkkeett pprriicceess)) Intermediate consumption (P.2) consists of the value of the goods and services consumed as inputs by a process of production, excluding fixed assets whose consumption is recorded as consumption of fixed capital. The goods and services may be either transformed or used up by the production process (ESA 1995, paragraph 3.69-3.73 and 8.10).
TTaabbllee 6666 IInntteerreesstt;; ggeenneerraall ggoovveerrnnmmeenntt;; EExxcceessssiivvee ddeeffiicciitt pprroocceedduurree ((PPeerrcceennttaaggee ooff ggrroossss ddoommeessttiicc pprroodduucctt aatt mmaarrkkeett pprriicceess))
IInntteerreesstt ((EEDDPP DD..4411)) ppaaiidd bbyy ggeenneerraall ggoovveerrnnmmeenntt,, ccoonnssoolliiddaatteedd.. IInntteerreesstt fflloowwss eexxcchhaannggeedd bbeettwweeeenn ttwwoo ccoouunntteerrppaarrttss uunnddeerr aannyy kkiinnddss ooff sswwaappss aanndd uunnddeerr ffoorrwwaarrdd rraattee aaggrreeeemmeennttss aarree rreeccoorrddeedd iinn tthhiiss iitteemm.. IInn EESSAA 9955,, tthheessee fflloowwss aarree ccoonnssiiddeerreedd aass ffiinnaanncciiaall ttrraannssaaccttiioonnss..
RReeffeerreennccee:: EESSAA 11999955,, ppaarraaggrraapphh 44..4422 ff,, CCoommmmiissssiioonn rreegguullaattiioonn ((EECC)) NNoo 335511//22000022 TTaabbllee 6677 SSuubbssiiddiieess;; ggeenneerraall ggoovveerrnnmmeenntt;; EESSAA 9955 ((PPeerrcceennttaaggee ooff ggrroossss ddoommeessttiicc pprroodduucctt aatt mmaarrkkeett pprriicceess))
SSuubbssiiddiieess ((DD..33)) aarree ddeeffiinneedd bbyy EESSAA 9955 aass ccuurrrreenntt uunnrreeqquuiitteedd ppaayymmeennttss wwhhiicchh ggeenneerraall ggoovveerrnnmmeenntt oorr tthhee IInnssttiittuuttiioonnss ooff tthhee EEuurrooppeeaann UUnniioonn mmaakkee ttoo rreessiiddeenntt pprroodduucceerrss,, wwiitthh tthhee oobbjjeeccttiivvee ooff iinnfflluueenncciinngg tthheeiirr lleevveellss ooff pprroodduuccttiioonn,, tthheeiirr pprriicceess oorr tthhee rreemmuunneerraattiioonn ooff tthhee ffaaccttoorrss ooff pprroodduuccttiioonn.. TThhee ttaabbllee oonnllyy ccoonnttaaiinnss ssuubbssiiddiieess ppaaiidd bbyy ggeenneerraall ggoovveerrnnmmeenntt.. DDaattaa ccoovveerrss SSuubbssiiddiieess oonn pprroodduuccttss aass wweellll aass OOtthheerr ssuubbssiiddiieess oonn pprroodduuccttiioonn.. SSuubbssiiddiieess oonn pprroodduuccttss ((DD..3311)) aarree ssuubbssiiddiieess ppaayyaabbllee ppeerr uunniitt ooff aa ggoooodd oorr sseerrvviiccee pprroodduucceedd oorr iimmppoorrtteedd.. TThhee ssuubbssiiddyy mmaayy bbee aa ssppeecciiffiicc aammoouunntt ooff mmoonneeyy ppeerr uunniitt ooff qquuaannttiittyy ooff aa ggoooodd oorr sseerrvviiccee,, oorr iitt mmaayy bbee ccaallccuullaatteedd aadd vvaalloorreemm aass aa ssppeecciiffiieedd ppeerrcceennttaaggee ooff tthhee pprriiccee ppeerr uunniitt.. AA ssuubbssiiddyy mmaayy aallssoo bbee ccaallccuullaatteedd aass tthhee ddiiffffeerreennccee bbeettwweeeenn aa ssppeecciiffiieedd ttaarrggeett pprriiccee aanndd tthhee mmaarrkkeett pprriiccee aaccttuuaallllyy ppaaiidd bbyy tthhee bbuuyyeerr..
OOtthheerr ssuubbssiiddiieess oonn pprroodduuccttiioonn ((DD..3399)) ccoonnssiisstt ooff ssuubbssiiddiieess eexxcceepptt ssuubbssiiddiieess oonn pprroodduuccttss wwhhiicchh rreessiiddeenntt pprroodduucceerr uunniittss mmaayy rreecceeiivvee aass aa ccoonnsseeqquueennccee ooff eennggaaggiinngg iinn pprroodduuccttiioonn.. TThheeyy iinncclluuddee iinn ppaarrttiiccuullaarr:: SSuubbssiiddiieess oonn ppaayyrroollll oorr wwoorrkk ffoorrccee,, ee..gg.. ppaayymmeennttss oonn tthhee eemmppllooyymmeenntt ooff ppaarrttiiccuullaarr ttyyppeess ooff ppeerrssoonnss ssuucchh aass pphhyyssiiccaallllyy hhaannddiiccaappppeedd ppeerrssoonnss oorr ppeerrssoonnss wwhhoo hhaavvee bbeeeenn uunneemmppllooyyeedd
ffoorr lloonngg ppeerriiooddss;; SSuubbssiiddiieess ttoo rreedduuccee ppoolllluuttiioonn;; GGrraannttss ffoorr iinntteerreesstt rreelliieeff mmaaddee ttoo rreessiiddeenntt pprroodduucceerr uunniittss;;
IItt sshhoouulldd bbee nnootteedd tthhaatt iinnvveessttmmeenntt ggrraannttss aarree nnoott ttrreeaatteedd aass ssuubbssiiddiieess,, tthheeyy aarree ppaarrtt ooff tthhee ccaappiittaall ttrraannssffeerrss.. RReeffeerreennccee:: EESSAA 11999955,, ppaarraaggrraapphhss 44..3300,, 44..3333,, 44..3366,, 44..3377
TTaabbllee 6688 OOtthheerr ccuurrrreenntt eexxppeennddiittuurree;; ggeenneerraall ggoovveerrnnmmeenntt;; EESSAA 9955 ((PPeerrcceennttaaggee ooff ggrroossss ddoommeessttiicc pprroodduucctt aatt mmaarrkkeett pprriicceess))
OOtthheerr ccuurrrreenntt eexxppeennddiittuurree ooff ggeenneerraall ggoovveerrnnmmeenntt ccoonnssiisstt ooff:: pprrooppeerrttyy iinnccoommee eexxcceepptt iinntteerreesstt,, ppaayyaabbllee ccuurrrreenntt ttaaxxeess oonn iinnccoommee aanndd wweeaalltthh ((DD..55)),, ppaayyaabbllee

24
ootthheerr ccuurrrreenntt ttrraannssffeerrss ((DD..77)),, ppaayyaabbllee ((ccoonnssoolliiddaatteedd))
PPrrooppeerrttyy iinnccoommee eexxcceepptt iinntteerreesstt oonnllyy ccoommpprriissee rreennttss ((DD..4455)),, ssiinnccee tthhee rreemmaaiinniinngg kkiinnddss ooff pprrooppeerrttyy iinnccoommee aass ccllaassssiiffiieedd bbyy tthhee EESSAA 11999955 -- ddiissttrriibbuutteedd iinnccoommee ooff ccoorrppoorraattiioonnss,, rreeiinnvveesstteedd eeaarrnniinnggss oonn ddiirreecctt ffoorreeiiggnn iinnvveessttmmeenntt aanndd pprrooppeerrttyy iinnccoommee aattttrriibbuutteedd ttoo iinnssuurraannccee ppoolliiccyy hhoollddeerrss –– aarree nnoott iinncclluuddeedd iinn ggeenneerraall ggoovveerrnnmmeennttss’’ uusseess..
AAmmoonngg ootthheerr ccuurrrreenntt ttrraannssffeerrss ((DD..77)) rreelleevvaanntt aarree iinn ppaarrttiiccuullaarr nneett nnoonn--lliiffee iinnssuurraannccee pprreemmiiuummss ((DD..7711)),, ccuurrrreenntt iinntteerrnnaattiioonnaall ccooooppeerraattiioonn ((DD..7744)) aanndd mmiisscceellllaanneeoouuss ccuurrrreenntt ttrraannssffeerrss ((DD..7755)).. TThhee llaatttteerr ccoommpprriissee ee..gg..::
TTrraannssffeerrss ooff EEUU mmeemmbbeerr ssttaatteess ttoo tthhee IInnssttiittuuttiioonnss ooff tthhee EEuurrooppeeaann UUnniioonn aaccccoorrddiinngg ttoo tthhee GGNNPP bbaasseedd ffoouurrtthh oowwnn rreessoouurrccee;; BBoonnuuss ppaayymmeennttss oonn ssaavviinnggss ggrraanntteedd aatt iinntteerrvvaallss bbyy ggeenneerraall ggoovveerrnnmmeenntt ttoo hhoouusseehhoollddss iinn oorrddeerr ttoo rreewwaarrdd tthheemm ffoorr tthheeiirr ssaavviinngg dduurriinngg tthhee ppeerriioodd;; EExx ggrraattiiaa ppaayymmeennttss mmaaddee bbyy ggoovveerrnnmmeenntt uunniittss ttoo ootthheerr iinnssttiittuuttiioonnaall uunniittss iinn ccoommppeennssaattiioonn ffoorr iinnjjuurriieess oorr ddaammaaggee ccaauusseedd bbyy nnaattuurraall ddiissaasstteerrss ootthheerr tthhaann tthhoossee ccllaassssiiffiieedd aass ccaappiittaall
ttrraannssffeerrss
RReeffeerreennccee:: EESSAA 11999955,, ppaarraaggrraapphhss 44..113366 –– 44..113399
TTaabbllee 6699 TToottaall ccuurrrreenntt eexxppeennddiittuurree;; ggeenneerraall ggoovveerrnnmmeenntt;; EExxcceessssiivvee ddeeffiicciitt pprroocceedduurree ((PPeerrcceennttaaggee ooff ggrroossss ddoommeessttiicc pprroodduucctt aatt mmaarrkkeett pprriicceess))
TToottaall ccuurrrreenntt eexxppeennddiittuurree ooff ggeenneerraall ggoovveerrnnmmeenntt iiss tthhee ssuumm ooff:: IInntteerrmmeeddiiaattee ccoonnssuummppttiioonn ((PP..22)) ++ CCoommppeennssaattiioonn ooff eemmppllooyyeeeess ((DD..1111)) ++ OOtthheerr ttaaxxeess oonn pprroodduuccttiioonn ((DD..2299)),, ppaayyaabbllee ++ PPrrooppeerrttyy iinnccoommee ((DD..44)),, ppaayyaabbllee ((iinncclluuddiinngg iinntteerreesstt EEDDPP DD..4411)) ++ SSuubbssiiddiieess ((DD..33)),, ppaayyaabbllee ++ CCuurrrreenntt ttaaxxeess oonn iinnccoommee aanndd wweeaalltthh ((DD..55)),, ppaayyaabbllee ++ SSoocciiaall bbeenneeffiittss ootthheerr tthhaann ssoocciiaall ttrraannssffeerrss iinn kkiinndd ((DD..6622)),, ppaayyaabbllee ++ TTrraannssffeerrss iinn kkiinndd ssuupppplliieedd ttoo hhoouusseehhoollddss vviiaa mmaarrkkeett pprroodduucceerrss ((DD66331111 ++ DD6633112211 ++ DD6633113311)) ++ OOtthheerr ccuurrrreenntt ttrraannssffeerrss ((DD..77)),, ppaayyaabbllee
TTaabbllee 7711 CCaappiittaall ttrraannssffeerrss rreecceeiivveedd;; ggeenneerraall ggoovveerrnnmmeenntt;; EESSAA 9955 ((PPeerrcceennttaaggee ooff ggrroossss ddoommeessttiicc pprroodduucctt aatt mmaarrkkeett pprriicceess))
CCaappiittaall ttrraannssffeerrss ((DD..99)) aarree mmaaddee iinn ccaasshh oorr iinn kkiinndd.. AA ccaappiittaall ttrraannssffeerr iinn kkiinndd ccoonnssiissttss ooff tthhee ttrraannssffeerr ooff oowwnneerrsshhiipp ooff aann aasssseett ((ootthheerr tthhaann iinnvveennttoorriieess aanndd ccaasshh)),, oorr tthhee ccaanncceellllaattiioonn ooff aa lliiaabbiilliittyy bbyy aa ccrreeddiittoorr,, wwiitthhoouutt aannyy ccoouunntteerrppaarrtt bbeeiinngg rreecceeiivveedd iinn rreettuurrnn.. AA ccaappiittaall ttrraannssffeerr iinn ccaasshh ccoonnssiissttss ooff tthhee ttrraannssffeerr ooff ccaasshh tthhaatt tthhee ffiirrsstt ppaarrttyy hhaass rraaiisseedd bbyy ddiissppoossiinngg ooff aann aasssseett ((ootthheerr tthhaann iinnvveennttoorriieess)),, oorr tthhaatt tthhee sseeccoonndd ppaarrttyy,, tthhee rreecciippiieenntt,, iiss eexxppeecctteedd,, oorr rreeqquuiirreedd,, ttoo uussee ffoorr tthhee aaccqquuiissiittiioonn ooff aann aasssseett ((ootthheerr tthhaann iinnvveennttoorriieess)) aass aa ccoonnddiittiioonn oonn wwhhiicchh tthhee ttrraannssffeerr iiss mmaaddee.. CCaappiittaall ttrraannssffeerrss ccoovveerr ccaappiittaall ttaaxxeess,, iinnvveessttmmeenntt ggrraannttss aanndd ootthheerr ccaappiittaall ttrraannssffeerrss..
CCaappiittaall ttaaxxeess ((DD..9911))

25
ccoonnssiisstt ooff ttaaxxeess lleevviieedd aatt iirrrreegguullaarr oorr vveerryy iinnffrreeqquueenntt iinntteerrvvaallss oonn tthhee vvaalluueess ooff tthhee aasssseettss oorr nneett wwoorrtthh oowwnneedd bbyy iinnssttiittuuttiioonnaall uunniittss oorr oonn tthhee vvaalluueess ooff aasssseettss ttrraannssffeerrrreedd bbeettwweeeenn iinnssttiittuuttiioonnaall uunniittss aass aa rreessuulltt ooff lleeggaacciieess,, ggiiffttss iinntteerr vviivvooss oorr ootthheerr ttrraannssffeerrss.. TThheeyy iinncclluuddee iinn ppaarrttiiccuullaarr iinnhheerriittaannccee ttaaxxeess,, ddeeaatthh dduuttiieess aanndd ttaaxxeess oonn ggiiffttss iinntteerr vviivvooss aass wweellll aass cceerrttaaiinn bbeetttteerrmmeenntt lleevviieess ((ee..gg.. ttaaxxeess oonn tthhee iinnccrreeaassee iinn tthhee vvaalluuee ooff aaggrriiccuullttuurraall llaanndd dduuee ttoo ppllaannnniinngg ppeerrmmiissssiioonn ttoo ddeevveelloopp tthhee llaanndd ffoorr ccoommmmeerrcciiaall oorr rreessiiddeennttiiaall ppuurrppoosseess))..
IInnvveessttmmeenntt ggrraannttss ((DD..9922)) ccoonnssiisstt ooff ccaappiittaall ttrraannssffeerrss iinn ccaasshh oorr iinn kkiinndd mmaaddee bbyy ggoovveerrnnmmeenntt oorr bbyy tthhee rreesstt ooff tthhee wwoorrlldd ((ee..gg.. bbyy tthhee IInnssttiittuuttiioonnss ooff tthhee EEuurrooppeeaann UUnniioonn)) ttoo ootthheerr rreessiiddeenntt oorr nnoonn--rreessiiddeenntt iinnssttiittuuttiioonnaall uunniittss ttoo ffiinnaannccee aallll oorr ppaarrtt ooff tthhee ccoossttss ooff tthheeiirr aaccqquuiirriinngg ffiixxeedd aasssseettss.. IInnvveessttmmeenntt ggrraannttss ttoo ggeenneerraall ggoovveerrnnmmeenntt iinncclluuddee aallll ppaayymmeennttss ((eexxcceepptt ggrraannttss ffoorr iinntteerreesstt rreelliieeff)) mmaaddee ttoo ssuubb--sseeccttoorrss ooff ggeenneerraall ggoovveerrnnmmeenntt,, ee..gg.. ttrraannssffeerrss ffrroomm cceennttrraall ggoovveerrnnmmeenntt ttoo llooccaall aauutthhoorriittiieess,, ffoorr tthhee ppuurrppoossee ooff ffiinnaanncciinngg ccaappiittaall ffoorrmmaattiioonn.. HHoowweevveerr,, iinnvveessttmmeenntt ggrraannttss wwiitthhiinn ggeenneerraall ggoovveerrnnmmeenntt aarree fflloowwss iinntteerrnnaall ttoo tthhee ggeenneerraall ggoovveerrnnmmeenntt sseeccttoorr aanndd ddoo nnoott aappppeeaarr iinn aa ccoonnssoolliiddaatteedd aaccccoouunntt ffoorr tthhee sseeccttoorr aass aa wwhhoollee ((ssuucchh aass iinn tthhiiss ttaabbllee)).. IInnvveessttmmeenntt ggrraannttss rreecceeiivveedd bbyy ggeenneerraall ggoovveerrnnmmeenntt aallssoo iinncclluuddee ttrraannssffeerrss ffrroomm tthhee rreesstt ooff tthhee wwoorrlldd,, wwiitthh tthhee oobbjjeeccttiivvee ooff ffiinnaanncciinngg ccaappiittaall ffoorrmmaattiioonn bbyy nnoonn--rreessiiddeenntt uunniittss..
OOtthheerr ccaappiittaall ttrraannssffeerrss ((DD..9999)) ccoovveerr ttrraannssffeerrss ootthheerr tthhaann iinnvveessttmmeenntt ggrraannttss aanndd ccaappiittaall ttaaxxeess wwhhiicchh ddoo nnoott tthheemmsseellvveess rreeddiissttrriibbuuttee iinnccoommee bbuutt rreeddiissttrriibbuuttee ssaavviinngg oorr wweeaalltthh aammoonngg tthhee ddiiffffeerreenntt sseeccttoorrss oorr ssuubb--sseeccttoorrss ooff tthhee eeccoonnoommyy oorr tthhee rreesstt ooff tthhee wwoorrlldd.. TThheeyy iinncclluuddee ee..gg..:: LLeeggaacciieess,, llaarrggee ggiiffttss iinntteerr vviivvooss aanndd ddoonnaattiioonnss bbeettwweeeenn uunniittss bbeelloonnggiinngg ttoo ddiiffffeerreenntt sseeccttoorrss;; TTrraannssffeerrss bbeettwweeeenn ssuubb--sseeccttoorrss ooff ggeenneerraall ggoovveerrnnmmeenntt ddeessiiggnneedd ttoo ccoovveerr uunneexxppeecctteedd eexxppeennddiittuurree oorr aaccccuummuullaatteedd ddeeffiicciittss.. TThheessee ttrraannssffeerrss aarree fflloowwss wwiitthhiinn tthhee ggeenneerraall ggoovveerrnnmmeenntt
sseeccttoorr aanndd ddoo nnoott aappppeeaarr iinn aa ccoonnssoolliiddaatteedd aaccccoouunntt ffoorr tthhee sseeccttoorr aass aa wwhhoollee;; TThhee ccoouunntteerrppaarrtt ttrraannssaaccttiioonn ooff ccaanncceellllaattiioonn ooff ddeebbttss bbyy aaggrreeeemmeenntt bbeettwweeeenn iinnssttiittuuttiioonnaall uunniittss bbeelloonnggiinngg ttoo ddiiffffeerreenntt sseeccttoorrss oorr ssuubb--sseeccttoorrss,, ee..gg.. tthhee ccaanncceellllaattiioonn bbyy tthhee ggoovveerrnnmmeenntt ooff
aa ddeebbtt oowweedd ttoo iitt bbyy aa ffoorreeiiggnn ccoouunnttrryy.. RReeffeerreennccee:: EESSAA 11999955,, ppaarraaggrraapphhss 44..114455 –– 44..116655 TTaabbllee 7722 TToottaall rreevveennuuee;; ggeenneerraall ggoovveerrnnmmeenntt;; EESSAA 9955 ((PPeerrcceennttaaggee ooff ggrroossss ddoommeessttiicc pprroodduucctt aatt mmaarrkkeett pprriicceess))
TToottaall ggeenneerraall ggoovveerrnnmmeenntt rreevveennuuee iiss tthhee ssuumm ooff:: SSaalleess ooff mmaarrkkeett oouuttppuutt ((PP..1111)) aanndd oouuttppuutt ffoorr oowwnn ffiinnaall uussee ((PP..1122)) ++ PPaayymmeennttss ffoorr ootthheerr nnoonn--mmaarrkkeett oouuttppuutt ((PP..113311)) ++ OOtthheerr ssuubbssiiddiieess oonn pprroodduuccttiioonn ((DD..3399)),, rreecceeiivvaabbllee ++ TTaaxxeess oonn pprroodduuccttiioonn aanndd iimmppoorrttss ((DD..22)),, rreecceeiivvaabbllee ++ PPrrooppeerrttyy iinnccoommee ((DD..44)),, rreecceeiivvaabbllee ++ CCuurrrreenntt ttaaxxeess oonn iinnccoommee aanndd wweeaalltthh ((DD..55)),, rreecceeiivvaabbllee ++ SSoocciiaall ccoonnttrriibbuuttiioonnss ((DD..6611)),, rreecceeiivvaabbllee ++ OOtthheerr ccuurrrreenntt ttrraannssffeerrss ((DD..77)),, rreecceeiivvaabbllee ++ CCaappiittaall ttrraannssffeerrss ((DD..99)),, rreecceeiivvaabbllee
FFoorr ttoottaall ggeenneerraall ggoovveerrnnmmeenntt rreevveennuuee sseeee aallssoo AAnnnneexx ooff RReegguullaattiioonn NNoo 11222211//22000022 ooff tthhee EEuurrooppeeaann PPaarrlliiaammeenntt aanndd ooff tthhee CCoouunncciill ooff 1100 JJuunnee 22000022,, aanndd TTaabbllee 22 --""MMaaiinn aaggggrreeggaatteess ooff ggeenneerraall ggoovveerrnnmmeenntt"" -- ooff tthhee EESSAA 9955 ttrraannssmmiissssiioonn pprrooggrraammmmee..
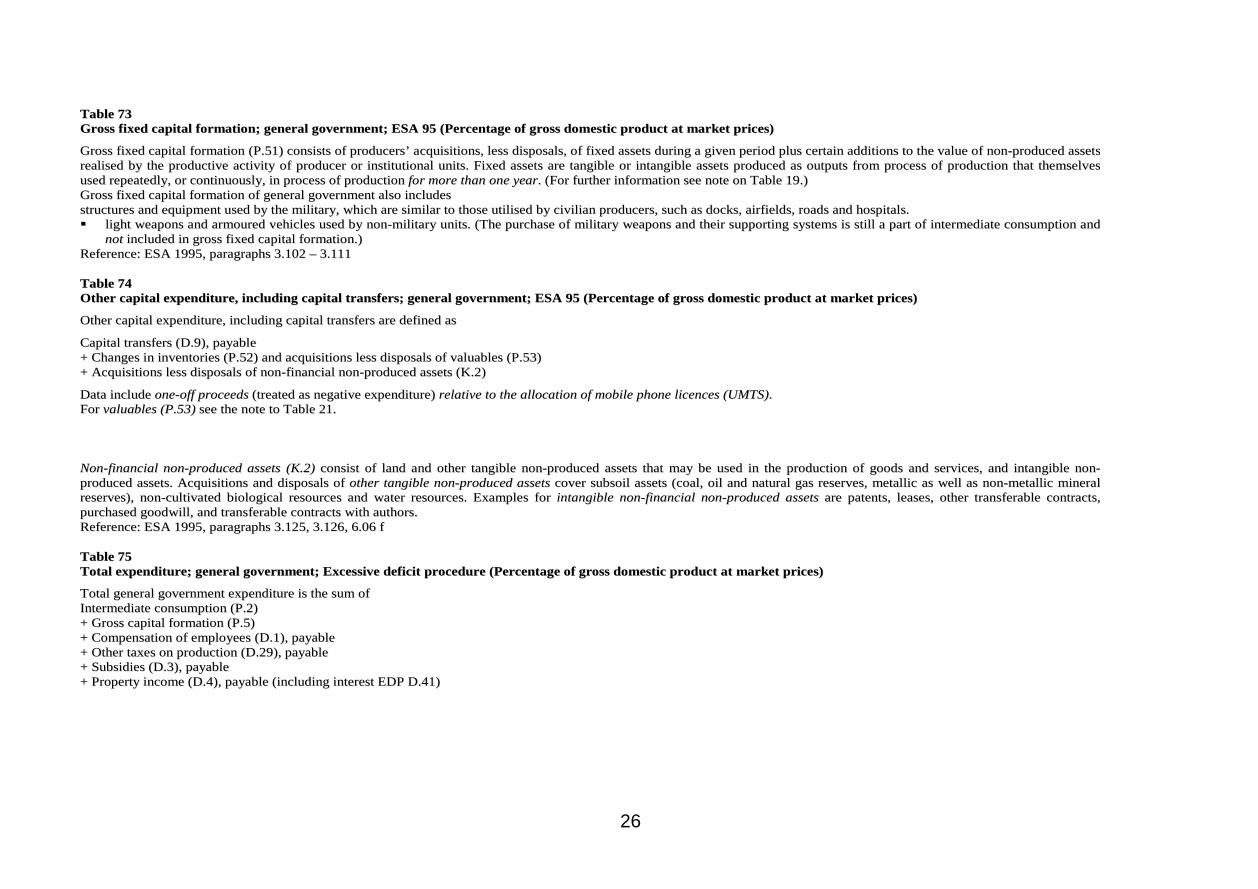
26
TTaabbllee 7733 GGrroossss ffiixxeedd ccaappiittaall ffoorrmmaattiioonn;; ggeenneerraall ggoovveerrnnmmeenntt;; EESSAA 9955 ((PPeerrcceennttaaggee ooff ggrroossss ddoommeessttiicc pprroodduucctt aatt mmaarrkkeett pprriicceess))
GGrroossss ffiixxeedd ccaappiittaall ffoorrmmaattiioonn ((PP..5511)) ccoonnssiissttss ooff pprroodduucceerrss’’ aaccqquuiissiittiioonnss,, lleessss ddiissppoossaallss,, ooff ffiixxeedd aasssseettss dduurriinngg aa ggiivveenn ppeerriioodd pplluuss cceerrttaaiinn aaddddiittiioonnss ttoo tthhee vvaalluuee ooff nnoonn--pprroodduucceedd aasssseettss rreeaalliisseedd bbyy tthhee pprroodduuccttiivvee aaccttiivviittyy ooff pprroodduucceerr oorr iinnssttiittuuttiioonnaall uunniittss.. FFiixxeedd aasssseettss aarree ttaannggiibbllee oorr iinnttaannggiibbllee aasssseettss pprroodduucceedd aass oouuttppuuttss ffrroomm pprroocceessss ooff pprroodduuccttiioonn tthhaatt tthheemmsseellvveess uusseedd rreeppeeaatteeddllyy,, oorr ccoonnttiinnuuoouussllyy,, iinn pprroocceessss ooff pprroodduuccttiioonn ffoorr mmoorree tthhaann oonnee yyeeaarr.. ((FFoorr ffuurrtthheerr iinnffoorrmmaattiioonn sseeee nnoottee oonn TTaabbllee 1199..)) GGrroossss ffiixxeedd ccaappiittaall ffoorrmmaattiioonn ooff ggeenneerraall ggoovveerrnnmmeenntt aallssoo iinncclluuddeess ssttrruuccttuurreess aanndd eeqquuiippmmeenntt uusseedd bbyy tthhee mmiilliittaarryy,, wwhhiicchh aarree ssiimmiillaarr ttoo tthhoossee uuttiilliisseedd bbyy cciivviilliiaann pprroodduucceerrss,, ssuucchh aass ddoocckkss,, aaiirrffiieellddss,, rrooaaddss aanndd hhoossppiittaallss.. lliigghhtt wweeaappoonnss aanndd aarrmmoouurreedd vveehhiicclleess uusseedd bbyy nnoonn--mmiilliittaarryy uunniittss.. ((TThhee ppuurrcchhaassee ooff mmiilliittaarryy wweeaappoonnss aanndd tthheeiirr ssuuppppoorrttiinngg ssyysstteemmss iiss ssttiillll aa ppaarrtt ooff iinntteerrmmeeddiiaattee ccoonnssuummppttiioonn aanndd
nnoott iinncclluuddeedd iinn ggrroossss ffiixxeedd ccaappiittaall ffoorrmmaattiioonn..)) RReeffeerreennccee:: EESSAA 11999955,, ppaarraaggrraapphhss 33..110022 –– 33..111111
TTaabbllee 7744 OOtthheerr ccaappiittaall eexxppeennddiittuurree,, iinncclluuddiinngg ccaappiittaall ttrraannssffeerrss;; ggeenneerraall ggoovveerrnnmmeenntt;; EESSAA 9955 ((PPeerrcceennttaaggee ooff ggrroossss ddoommeessttiicc pprroodduucctt aatt mmaarrkkeett pprriicceess))
OOtthheerr ccaappiittaall eexxppeennddiittuurree,, iinncclluuddiinngg ccaappiittaall ttrraannssffeerrss aarree ddeeffiinneedd aass
CCaappiittaall ttrraannssffeerrss ((DD..99)),, ppaayyaabbllee ++ CChhaannggeess iinn iinnvveennttoorriieess ((PP..5522)) aanndd aaccqquuiissiittiioonnss lleessss ddiissppoossaallss ooff vvaalluuaabblleess ((PP..5533)) ++ AAccqquuiissiittiioonnss lleessss ddiissppoossaallss ooff nnoonn--ffiinnaanncciiaall nnoonn--pprroodduucceedd aasssseettss ((KK..22))
DDaattaa iinncclluuddee oonnee--ooffff pprroocceeeeddss ((ttrreeaatteedd aass nneeggaattiivvee eexxppeennddiittuurree)) rreellaattiivvee ttoo tthhee aallllooccaattiioonn ooff mmoobbiillee pphhoonnee lliicceenncceess ((UUMMTTSS)).. FFoorr vvaalluuaabblleess ((PP..5533)) sseeee tthhee nnoottee ttoo TTaabbllee 2211.. NNoonn--ffiinnaanncciiaall nnoonn--pprroodduucceedd aasssseettss ((KK..22)) ccoonnssiisstt ooff llaanndd aanndd ootthheerr ttaannggiibbllee nnoonn--pprroodduucceedd aasssseettss tthhaatt mmaayy bbee uusseedd iinn tthhee pprroodduuccttiioonn ooff ggooooddss aanndd sseerrvviicceess,, aanndd iinnttaannggiibbllee nnoonn--pprroodduucceedd aasssseettss.. AAccqquuiissiittiioonnss aanndd ddiissppoossaallss ooff ootthheerr ttaannggiibbllee nnoonn--pprroodduucceedd aasssseettss ccoovveerr ssuubbssooiill aasssseettss ((ccooaall,, ooiill aanndd nnaattuurraall ggaass rreesseerrvveess,, mmeettaalllliicc aass wweellll aass nnoonn--mmeettaalllliicc mmiinneerraall rreesseerrvveess)),, nnoonn--ccuullttiivvaatteedd bbiioollooggiiccaall rreessoouurrcceess aanndd wwaatteerr rreessoouurrcceess.. EExxaammpplleess ffoorr iinnttaannggiibbllee nnoonn--ffiinnaanncciiaall nnoonn--pprroodduucceedd aasssseettss aarree ppaatteennttss,, lleeaasseess,, ootthheerr ttrraannssffeerraabbllee ccoonnttrraaccttss,, ppuurrcchhaasseedd ggooooddwwiillll,, aanndd ttrraannssffeerraabbllee ccoonnttrraaccttss wwiitthh aauutthhoorrss.. RReeffeerreennccee:: EESSAA 11999955,, ppaarraaggrraapphhss 33..112255,, 33..112266,, 66..0066 ff
TTaabbllee 7755 TToottaall eexxppeennddiittuurree;; ggeenneerraall ggoovveerrnnmmeenntt;; EExxcceessssiivvee ddeeffiicciitt pprroocceedduurree ((PPeerrcceennttaaggee ooff ggrroossss ddoommeessttiicc pprroodduucctt aatt mmaarrkkeett pprriicceess))
TToottaall ggeenneerraall ggoovveerrnnmmeenntt eexxppeennddiittuurree iiss tthhee ssuumm ooff IInntteerrmmeeddiiaattee ccoonnssuummppttiioonn ((PP..22)) ++ GGrroossss ccaappiittaall ffoorrmmaattiioonn ((PP..55)) ++ CCoommppeennssaattiioonn ooff eemmppllooyyeeeess ((DD..11)),, ppaayyaabbllee ++ OOtthheerr ttaaxxeess oonn pprroodduuccttiioonn ((DD..2299)),, ppaayyaabbllee ++ SSuubbssiiddiieess ((DD..33)),, ppaayyaabbllee ++ PPrrooppeerrttyy iinnccoommee ((DD..44)),, ppaayyaabbllee ((iinncclluuddiinngg iinntteerreesstt EEDDPP DD..4411))

27
++ CCuurrrreenntt ttaaxxeess oonn iinnccoommee aanndd wweeaalltthh ((DD..55)),, ppaayyaabbllee ++ SSoocciiaall bbeenneeffiittss ootthheerr tthhaann ssoocciiaall ttrraannssffeerrss iinn kkiinndd ((DD..6622)),, ppaayyaabbllee ++ SSoocciiaall ttrraannssffeerrss iinn kkiinndd rreellaatteedd ttoo eexxppeennddiittuurree oonn pprroodduuccttss ssuupppplliieedd ttoo hhoouusseehhoollddss vviiaa mmaarrkkeett pprroodduucceerrss ((DD..66331111 ++ DD..6633112211 ++ DD..6633113311)),, ppaayyaabbllee ++ OOtthheerr ccuurrrreenntt ttrraannssffeerrss ((DD..77)),, ppaayyaabbllee ++ AAddjjuussttmmeenntt ffoorr tthhee cchhaannggee iinn tthhee nneett eeqquuiittyy ooff hhoouusseehhoollddss oonn ppeennssiioonn ffuunnddss rreesseerrvveess ((DD..88)) ++ CCaappiittaall ttrraannssffeerrss ((DD..99)),, ppaayyaabbllee ++ AAccqquuiissiittiioonn ooff nnoonn--pprroodduucceedd nnoonn--ffiinnaanncciiaall aasssseettss ((KK..22))
FFoorr ttoottaall ggeenneerraall ggoovveerrnnmmeenntt eexxppeennddiittuurree sseeee aallssoo AAnnnneexx ooff RReegguullaattiioonn NNoo 11222211//22000022 ooff tthhee EEuurrooppeeaann PPaarrlliiaammeenntt aanndd ooff tthhee CCoouunncciill ooff 1100 JJuunnee 22000022,, aanndd TTaabbllee 22 –– ""MMaaiinn aaggggrreeggaatteess ooff ggeenneerraall ggoovveerrnnmmeenntt"" -- ooff tthhee EESSAA 11999955 ttrraannssmmiissssiioonn pprrooggrraammmmee..
IInntteerrmmeeddiiaattee ccoonnssuummppttiioonn ((PP..22)) ccoonnssiissttss ooff tthhee vvaalluuee ooff ggooooddss aanndd sseerrvviicceess ccoonnssuummeedd aass iinnppuuttss bbyy aa pprroocceessss ooff pprroodduuccttiioonn,, eexxcclluuddiinngg ffiixxeedd aasssseettss wwhhoossee ccoonnssuummppttiioonn iiss rreeccoorrddeedd aass ccoonnssuummppttiioonn ooff ffiixxeedd ccaappiittaall.. TThhee ggooooddss aanndd sseerrvviicceess mmaayy bbee eeiitthheerr ttrraannssffoorrmmeedd oorr uusseedd uupp bbyy tthhee pprroodduuccttiioonn pprroocceessss.. IInntteerrmmeeddiiaattee ccoonnssuummppttiioonn bbaassiiccaallllyy aallssoo ccoommpprriisseess tthhee ccoossttss ooff uussiinngg rreenntteedd ffiixxeedd aasssseettss,, ee..gg.. tthhee lleeaassiinngg ooff ccaarrss,, aanndd ssmmaallll dduurraabbllee ggooooddss wwhhiicchh aarree iinneexxppeennssiivvee aanndd uusseedd ffoorr rreellaattiivveellyy ssiimmppllee ooppeerraattiioonnss lliikkee hhaanndd ttoooollss aanndd ssmmaallll ddeevviicceess ssuucchh aass ppoocckkeett ccaallccuullaattoorrss.. FFuurrtthheerrmmoorree,, iinntteerrmmeeddiiaattee ccoonnssuummppttiioonn ooff ggeenneerraall ggoovveerrnnmmeenntt iinncclluuddeess iinn ppaarrttiiccuullaarr mmiilliittaarryy wweeaappoonnss ooff ddeessttrruuccttiioonn aanndd tthhee eeqquuiippmmeenntt nneeeeddeedd ttoo ddeelliivveerr tthheemm ((iinn ccoonnttrraasstt,, lliigghhtt wweeaappoonnss oorr aarrmmoouurreedd vveehhiicclleess aaccqquuiirreedd bbyy ppoolliiccee aanndd sseeccuurriittyy ffoorrcceess aarree ttrreeaatteedd aass ggrroossss ffiixxeedd ccaappiittaall ffoorrmmaattiioonn));; TThhee aaddjjuussttmmeenntt ffoorr tthhee cchhaannggee iinn tthhee nneett eeqquuiittyy ooff hhoouusseehhoollddss iinn ppeennssiioonn ffuunnddss rreesseerrvveess ((DD..88)) rreepprreesseennttss tthhee aaddjjuussttmmeenntt nneeeeddeedd ttoo mmaakkee aappppeeaarr iinn tthhee ssaavviinngg ooff hhoouusseehhoollddss tthhee cchhaannggee iinn tthhee aaccttuuaarriiaall rreesseerrvveess oonn wwhhiicchh hhoouusseehhoollddss hhaavvee aa ddeeffiinniittee ccllaaiimm.. TThhee aaddjjuussttmmeenntt ffoorr tthhee cchhaannggee iinn nneett eeqquuiittyy ooff hhoouusseehhoollddss iinn ppeennssiioonn ffuunnddss rreesseerrvveess iiss ppaarrtt ooff tthhee eexxppeennddiittuurree ooff tthhee iinnssuurraannccee eenntteerrpprriisseess sseeccttoorr aanndd ootthheerr sseeccttoorrss,, aass ffoorr iinnssttaannccee tthhee ggeenneerraall ggoovveerrnnmmeenntt sseeccttoorr,, aaddmmiinniisstteerriinngg nnoonn--aauuttoonnoommoouuss ppeennssiioonn ffuunnddss.. RReeffeerreennccee:: EESSAA 11999955,, ppaarraaggrraapphhss 33..6699,, 33..7700,, 44..114411,, 44..114444
TTaabbllee 7766 NNeett lleennddiinngg ((++)) oorr nneett bboorrrroowwiinngg ((––));; ggeenneerraall ggoovveerrnnmmeenntt;; EExxcceessssiivvee ddeeffiicciitt pprroocceedduurree ((PPeerrcceennttaaggee ooff ggrroossss ddoommeessttiicc pprroodduucctt aatt mmaarrkkeett pprriicceess))
NNeett lleennddiinngg//nneett bboorrrroowwiinngg ((BB..99)) iiss tthhee bbaallaanncciinngg iitteemm iinn tthhee ccaappiittaall aaccccoouunntt.. IItt iiss ddeeffiinneedd aass:: NNeett ssaavviinngg ((BB..88nn)) ++ CCaappiittaall ttrraannssffeerrss ((DD..99)),, rreecceeiivvaabbllee –– CCaappiittaall ttrraannssffeerrss ((DD..99)),, ppaayyaabbllee –– GGrroossss ccaappiittaall ffoorrmmaattiioonn ((PP..55)) ++ CCoonnssuummppttiioonn ooff ffiixxeedd ccaappiittaall ((KK..11)) –– AAccqquuiissiittiioonn lleessss ddiissppoossaallss ooff nnoonn--ffiinnaanncciiaall nnoonn--pprroodduucceedd aasssseettss ((KK..22))
NNeett lleennddiinngg//nneett bboorrrroowwiinngg ooff ggeenneerraall ggoovveerrnnmmeenntt ccaann aallssoo bbee ddeeffiinneedd aass::
TToottaall ggeenneerraall ggoovveerrnnmmeenntt rreevveennuuee ((sseeee TTaabbllee 7711)) mmiinnuuss TToottaall ggeenneerraall ggoovveerrnnmmeenntt eexxppeennddiittuurree ((sseeee TTaabbllee 7744)) RReeffeerreennccee:: EESSAA 11999955,, ppaarraaggrraapphh 88..4477

28
TTaabbllee 7777 NNeett lleennddiinngg ((++)) oorr nneett bboorrrroowwiinngg ((––)) eexxcclluuddiinngg iinntteerreesstt;; ggeenneerraall ggoovveerrnnmmeenntt;; EExxcceessssiivvee ddeeffiicciitt pprroocceedduurree ((PPeerrcceennttaaggee ooff ggrroossss ddoommeessttiicc pprroodduucctt aatt mmaarrkkeett pprriicceess))
NNeett lleennddiinngg//nneett bboorrrroowwiinngg eexxcclluuddiinngg iinntteerreesstt iiss ccaallccuullaatteedd aass::
TToottaall ggeenneerraall ggoovveerrnnmmeenntt rreevveennuuee mmiinnuuss TToottaall ggeenneerraall ggoovveerrnnmmeenntt eexxppeennddiittuurree eexxcclluuddiinngg iinntteerreesstt,, ppaayyaabbllee
TTaabbllee 7788 GGeenneerraall ggoovveerrnnmmeenntt ccoonnssoolliiddaatteedd ggrroossss ddeebbtt;; EEUU--MMeemmbbeerr SSttaatteess:: EExxcceessssiivvee ddeeffiicciitt pprroocceedduurree ((bbaasseedd oonn EESSAA 9955)) aanndd ffoorrmmeerr ddeeffiinniittiioonn ((lliinnkkeedd sseerriieess));; ((PPeerrcceennttaaggee ooff ggrroossss ddoommeessttiicc pprroodduucctt aatt mmaarrkkeett pprriicceess))
GGeenneerraall ggoovveerrnnmmeenntt ggrroossss ddeebbtt iiss ddeeffiinneedd bbyy AArrttiiccllee 11 ((55)) ooff CCoouunncciill RReegguullaattiioonn ((EECC)) NNoo 33660055//9933 ((AArrttiiccllee 11 ((55)))),, aass aammeennddeedd bbyy CCoouunncciill RReegguullaattiioonn ((EECC)) NNoo 447755//22000000.. AAccccoorrddiinngg ttoo tthhee ssaaiidd rreegguullaattiioonn ::
““GGoovveerrnnmmeenntt ddeebbtt mmeeaannss tthhee ttoottaall ggrroossss ddeebbtt aatt nnoommiinnaall vvaalluuee oouuttssttaannddiinngg aatt tthhee eenndd ooff tthhee yyeeaarr ooff tthhee sseeccttoorr ooff ggeenneerraall ggoovveerrnnmmeenntt ((SS..1133)),, wwiitthh tthhee eexxcceeppttiioonn ooff tthhoossee lliiaabbiilliittiieess tthhee ccoorrrreessppoonnddiinngg ffiinnaanncciiaall aasssseettss ooff wwhhiicchh aarree hheelldd bbyy tthhee sseeccttoorr ooff ggeenneerraall ggoovveerrnnmmeenntt ((SS..1133)).. GGoovveerrnnmmeenntt ddeebbtt iiss ccoonnssttiittuutteedd bbyy tthhee lliiaabbiilliittiieess ooff ggeenneerraall ggoovveerrnnmmeenntt iinn tthhee ffoolllloowwiinngg ccaatteeggoorriieess:: ccuurrrreennccyy aanndd ddeeppoossiittss ((AAFF..22));; sseeccuurriittiieess ootthheerr tthhaann sshhaarreess,, eexxcclluuddiinngg ffiinnaanncciiaall ddeerriivvaattiivveess ((AAFF..3333)) aanndd llooaannss ((AAFF..44)) aass ddeeffiinneedd iinn EESSAA 9955.. TThhee nnoommiinnaall vvaalluuee ooff aa lliiaabbiilliittyy oouuttssttaannddiinngg aatt tthhee eenndd ooff tthhee yyeeaarr iiss tthhee ffaaccee vvaalluuee.. TThhee nnoommiinnaall vvaalluuee ooff aann iinnddeexx--lliinnkkeedd lliiaabbiilliittyy ccoorrrreessppoonnddss ttoo iittss ffaaccee vvaalluuee aaddjjuusstteedd bbyy tthhee iinnddeexx--rreellaatteedd cchhaannggee iinn tthhee vvaalluuee ooff tthhee pprriinncciippaall aaccccrruueedd ttoo tthhee eenndd ooff tthhee yyeeaarr.. LLiiaabbiilliittiieess ddeennoommiinnaatteedd iinn aa ffoorreeiiggnn ccuurrrreennccyy,, oorr eexxcchhaannggeedd ffrroomm oonnee ffoorreeiiggnn ccuurrrreennccyy tthhrroouugghh ccoonnttrraaccttuuaall aaggrreeeemmeennttss ttoo oonnee oorr mmoorree ootthheerr ffoorreeiiggnn ccuurrrreenncciieess sshhaallll bbee ccoonnvveerrtteedd iinnttoo tthhee ootthheerr ffoorreeiiggnn ccuurrrreenncciieess aatt tthhee rraattee aaggrreeeedd uuppoonn iinn tthhoossee ccoonnttrraaccttss aanndd sshhaallll bbee ccoonnvveerrtteedd iinnttoo tthhee nnaattiioonnaall ccuurrrreennccyy oonn tthhee bbaassiiss ooff tthhee rreepprreesseennttaattiivvee mmaarrkkeett eexxcchhaannggee rraattee pprreevvaaiilliinngg oonn tthhee llaasstt wwoorrkkiinngg ddaayy ooff eeaacchh yyeeaarr.. LLiiaabbiilliittiieess ddeennoommiinnaatteedd iinn tthhee nnaattiioonnaall ccuurrrreennccyy aanndd eexxcchhaannggeedd tthhrroouugghh ccoonnttrraaccttuuaall aaggrreeeemmeennttss ttoo aa ffoorreeiiggnn ccuurrrreennccyy sshhaallll bbee ccoonnvveerrtteedd iinnttoo tthhee ffoorreeiiggnn ccuurrrreennccyy aatt tthhee rraattee aaggrreeeedd uuppoonn iinn tthhoossee ccoonnttrraaccttss aanndd sshhaallll bbee ccoonnvveerrtteedd iinnttoo tthhee nnaattiioonnaall ccuurrrreennccyy oonn tthhee bbaassiiss ooff tthhee rreepprreesseennttaattiivvee mmaarrkkeett eexxcchhaannggee rraattee pprreevvaaiilliinngg oonn tthhee llaasstt wwoorrkkiinngg ddaayy ooff eeaacchh yyeeaarr.. LLiiaabbiilliittiieess ddeennoommiinnaatteedd iinn aa ffoorreeiiggnn ccuurrrreennccyy aanndd eexxcchhaannggeedd tthhrroouugghh ccoonnttrraaccttuuaall aaggrreeeemmeennttss ttoo tthhee nnaattiioonnaall ccuurrrreennccyy sshhaallll bbee ccoonnvveerrtteedd iinnttoo tthhee nnaattiioonnaall ccuurrrreennccyy aatt tthhee rraattee aaggrreeeedd uuppoonn iinn tthhoossee ccoonnttrraaccttss..””
FFoorr ccuurrrreennccyy aanndd ddeeppoossiittss ((AAFF..22)),, ffiinnaanncciiaall ddeerriivvaattiivveess ((AAFF..3333)) aanndd ffoorr llooaannss ((AAFF..44)) sseeee EESSAA 11999955 ppaarraaggrraapphhss 77..4466 –– 77..5511..
NNOOTTEESS OONN TTAABBLLEESS 7799 –– 111177 ((ccoouunnttrryy ttaabblleess)):: ""MMaaiinn eeccoonnoommiicc iinnddiiccaattoorrss 11996611 –– 22001155""
IItteemm 44..44 PPrrooffiittaabbiilliittyy iinnddeexx ((11996611 –– 11997733 == 110000))
TThhee pprrooffiittaabbiilliittyy iinnddeexx mmeeaassuurreess tthhee nneett rreettuurrnnss oonn nneett ccaappiittaall ssttoocckk ffoorr ttoottaall eeccoonnoommyy.. IInn ffoorrmmaall tteerrmmss,, tthhee nneett rreettuurrnnss oonn nneett ccaappiittaall ssttoocckk ccaann bbee ccaallccuullaatteedd aass ffoolllloowwss::
[[UUVVNNDD –– ((UUWWCCDD xx ((NNEETTDD//NNWWTTDD))))]] xx 110000 // ((OOKKNNDD xx PPIIGGTT))
WWhheerree:: UUVVNNDD:: NNeett ddoommeessttiicc pprroodduucctt aatt mmaarrkkeett pprriicceess

29
-oOo-
TABLES
UUWWCCDD:: CCoommppeennssaattiioonn ooff eemmppllooyyeeeess,, ttoottaall eeccoonnoommyy,, ddoommeessttiicc NNEETTDD:: EEmmppllooyymmeenntt,, ttoottaall eeccoonnoommyy,, ddoommeessttiicc NNWWTTDD:: EEmmppllooyyeeeess,, ttoottaall eeccoonnoommyy,, ddoommeessttiicc OOKKNNDD:: NNeett ccaappiittaall ssttoocckk aatt ccoonnssttaanntt pprriicceess PPIIGGTT:: PPrriiccee ddeeffllaattoorr ggrroossss ffiixxeedd ccaappiittaall ffoorrmmaattiioonn IItteemm 55..11 GGrroowwtthh ooff nneett ccaappiittaall ssttoocckk ((rreeaall))
TThhee nneett ccaappiittaall ssttoocckk iiss tthhee ssuumm ooff tthhee wwrriitttteenn--ddoowwnn vvaalluueess ooff aallll ffiixxeedd aasssseettss ssttiillll iinn uussee aatt tthhee eenndd ooff aann aaccccoouunnttiinngg ppeerriioodd.. TThhee nneett ccaappiittaall ssttoocckk aatt ccoonnssttaanntt pprriicceess iinn yyeeaarr tt iiss ccaallccuullaatteedd aass ffoolllloowwss:: NNeett ccaappiittaall ssttoocckk aatt ccoonnssttaanntt pprriicceess iinn yyeeaarr tt--11 ++ GGrroossss ffiixxeedd ccaappiittaall ffoorrmmaattiioonn aatt ccoonnssttaanntt pprriicceess iinn yyeeaarr tt –– CCaappiittaall ccoonnssuummppttiioonn aatt ccoonnssttaanntt pprriicceess iinn yyeeaarr tt
IItteemm 55..22 NNeett ccaappiittaall//oouuttppuutt rraattiioo ((rreeaall))
NNeett ccaappiittaall ssttoocckk ppeerr uunniitt ooff ggrroossss ddoommeessttiicc pprroodduucctt;; rraattiioo ooff nneett ccaappiittaall ssttoocckk aatt ccoonnssttaanntt pprriicceess ttoo ggrroossss ddoommeessttiicc pprroodduucctt aatt ccoonnssttaanntt mmaarrkkeett pprriicceess..
IItteemm 55..33 GGrroowwtthh ooff ccaappiittaall iinntteennssiittyy
CCaappiittaall iinntteennssiittyy iiss tthhee nneett ccaappiittaall ssttoocckk aatt ccoonnssttaanntt pprriicceess ppeerr ppeerrssoonn eemmppllooyyeedd.. IItteemm 55..44 LLaabboouurr pprroodduuccttiivviittyy ggrroowwtthh
LLaabboouurr pprroodduuccttiivviittyy iiss tthhee ggrroossss ddoommeessttiicc pprroodduucctt aatt ccoonnssttaanntt mmaarrkkeett pprriicceess ppeerr ppeerrssoonn eemmppllooyyeedd..
IItteemm 66..22 AAccttiivviittyy rraattee
TThhee aaccttiivviittyy rraattee iiss ddeeffiinneedd aass tthhee rraattiioo ooff cciivviilliiaann llaabboouurr ffoorrccee ((eemmppllooyyeedd aanndd uunneemmppllooyyeedd)) ttoo tthhee ttoottaall ppooppuullaattiioonn aaggeedd 1155 ttoo 6644 yyeeaarrss..
IItteemm 66..33 EEmmppllooyymmeenntt rraattee
TThhee eemmppllooyymmeenntt rraattee iiss ddeeffiinneedd aass tthhee rraattiioo ooff cciivviilliiaann eemmppllooyymmeenntt ((nnaattiioonnaall ddeeffiinniittiioonn)) ttoo ttoottaall ppooppuullaattiioonn aaggeedd 1155 ttoo 6644 yyeeaarrss.. PPeerrssoonnss ccaarrrryyiinngg oouutt oobblliiggaattoorryy mmiilliittaarryy sseerrvviiccee aarree nnoott iinncclluuddeedd.. IItteemm 66..44 EEmmppllooyymmeenntt rraattee ((ffuullll--ttiimmee eeqquuiivvaalleenntt))

30
Population and labour market
1. Total population (National accounts)
(1000)
BE DE EE IE EL ES FR IT CY LV LU MT NL AT PT SI SK FI EA-18 EA-12 1) 2) 3)
1960 9153 55433 : 2835 8332 30234 46611 50200 573 2121 332 333 11487 7047 8858 1585 4068 4430 : 234952
1965 9464 58619 : 2877 8550 31931 49794 52112 591 2266 350 323 12295 7271 8999 1649 4371 4564 : 246825
1970 9656 60651 : 2951 8793 33729 51902 53822 614 2359 358 327 13032 7467 8680 1725 4538 4606 : 255646
1975 9801 61829 : 3178 9047 35531 53883 55441 502 2456 365 309 13660 7579 9093 1794 4739 4711 : 264118
1980 9859 61566 : 3402 9643 37439 55097 56434 509 2512 364 321 14148 7549 9766 1901 4980 4780 : 270047
1981 9858 61682 : 3444 9729 37741 55407 56502 515 2519 365 324 14247 7569 9851 1907 5016 4800 : 2711951982 9856 61638 : 3481 9790 37943 55739 56544 521 2531 366 331 14312 7574 9912 1910 5055 4827 : 2719801983 9854 61423 : 3506 9847 38122 56036 56564 528 2546 366 335 14368 7562 9958 1922 5092 4856 : 2724611984 9855 61175 : 3530 9896 38279 56305 56577 535 2562 366 335 14423 7561 9996 1932 5127 4882 : 2728451985 9857 61024 : 3541 9934 38419 56582 56593 542 2579 367 341 14488 7565 10024 1942 5162 4902 : 2732961986 9859 61066 : 3542 9967 38536 56866 56596 548 2600 368 347 14567 7570 10033 1966 5194 4918 : 2738881987 9870 61077 : 3543 10001 38631 57169 56602 554 2627 371 350 14664 7575 10030 1990 5223 4932 : 2744631988 9904 61449 : 3531 10037 38716 57492 56629 560 2653 374 353 14760 7585 10020 1995 5251 4947 : 2754431989 9940 62063 : 3510 10089 38791 57828 56672 568 2667 378 356 14846 7620 10005 1996 5276 4964 : 2767061990 9968 63253 : 3506 10157 38850 58138 56719 580 2663 382 360 14947 7678 9983 1998 5299 4986 : 278568
1991 64074 280169
1991 10006 79984 : 3526 10256 38939 58426 56759 595 2651 387 364 15068 7755 9960 2000 5303 5014 : 2960791992 10047 80594 : 3549 10370 39068 58712 56797 611 2614 392 367 15182 7841 9952 1996 5305 5042 : 2975461993 10086 81179 1511 3563 10466 39189 58961 56832 626 2563 398 371 15290 7906 9974 1991 5325 5066 311298 2989101994 10116 81422 1477 3571 10553 39295 59175 56843 639 2521 404 375 15381 7936 9998 1989 5347 5088 312130 2997821995 10137 81661 1448 3601 10634 39388 59384 56844 651 2485 410 378 15460 7948 10030 1989 5363 5108 312919 3006061996 10155 81896 1425 3626 10709 39479 59589 56860 661 2457 415 380 15526 7959 10058 1990 5374 5125 313684 3013971997 10180 82052 1406 3661 10777 39583 59795 56890 671 2433 420 383 15608 7968 10091 1986 5383 5140 314427 3021651998 10203 82029 1393 3714 10835 39722 60011 56907 679 2410 425 385 15703 7977 10129 1982 5391 5154 315050 3028091999 10223 82087 1379 3755 10883 39927 60315 56916 687 2391 431 387 15809 7992 10172 1984 5396 5166 315899 3036762000 10246 82188 1372 3804 10917 40264 60725 56942 694 2368 437 390 15922 8012 10226 1989 5401 5176 317073 304859
2001 10281 82340 1367 3864 10952 40721 61163 56977 702 2338 442 393 16043 8042 10293 1992 5380 5188 318477 3063062002 10330 82482 1361 3932 10984 41314 61605 57157 710 2310 447 396 16147 8082 10368 1995 5379 5201 320199 3080482003 10373 82520 1356 3997 11018 42005 62038 57605 718 2288 452 399 16223 8118 10441 1996 5379 5213 322139 3100022004 10417 82501 1351 4067 11056 42692 62491 58175 728 2263 459 401 16276 8169 10502 1997 5382 5228 324156 3120332005 10474 82464 1348 4160 11093 43398 62958 58607 739 2239 466 404 16317 8225 10549 2001 5387 5246 326074 3139582006 10543 82366 1345 4270 11128 44068 63393 58941 751 2219 473 405 16341 8268 10584 2008 5391 5266 327760 3156422007 10622 82263 1342 4400 11163 44874 63781 59375 767 2201 481 407 16378 8295 10608 2019 5397 5289 329662 3175292008 10707 82120 1341 4496 11186 45593 64133 59832 787 2178 489 409 16440 8322 10622 2022 5406 5313 331397 3192552009 10790 81875 1340 4539 11187 45929 64459 60193 808 2142 498 412 16526 8341 10632 2042 5418 5339 332471 3203092010 10883 81757 1340 4560 11153 46073 64781 60483 829 2097 508 414 16612 8361 10637 2049 5430 5363 333332 321172
2011 10978 81779 1340 4577 11123 46125 65115 60724 851 2059 519 416 16693 8389 10622 2053 5398 5388 334148 3220312012 11054 81917 1340 4590 11093 46163 65433 60905 864 2034 532 420 16752 8426 10579 2057 5406 5414 334978 3228582013 11116 82098 1340 4602 11093 46062 65741 61049 867 2014 545 423 16800 8469 10481 2059 5413 5439 335609 3234932014 11176 82320 1335 4639 11093 45957 66070 61277 876 1998 555 425 16847 8494 10481 2064 5430 5464 336500 3243732015 11236 82394 1330 4708 11093 45849 66387 61486 885 1984 565 427 16894 8519 10481 2068 5447 5489 337243 325102
1) 1960-91 D_W 2) Euro area; 1960-91 including D_W 3) Former Euro area 12; 1960-91 including D_W

31
Population and labour market
1. Total population (National accounts)
(1000)
BG CZ DK HR LT HU PL RO SE UK EU-28 EU-15 MK IS TR ME RS US JP 1) 2)
1960 7867 9629 4562 4140 2779 9984 29575 18468 7485 52372 : 299371 1392 177 27506 : : 180760 93419
1965 8204 9807 4741 4281 2971 10148 31379 19094 7734 54350 : 313650 1500 194 31149 : : 194347 98275
1970 8490 9886 4938 4412 3140 10338 32596 20241 8043 55632 : 324259 1629 204 35321 : : 205089 103720
1975 8721 10087 5060 4512 3302 10541 33944 21283 8192 56226 : 333596 1756 218 40078 : : 215981 111940
1980 8862 10333 5124 4600 3413 10711 35500 22196 8310 56330 : 339811 1891 228 44438 : : 227726 117060
1981 8891 10330 5122 4612 3433 10712 35823 22342 8320 56358 : 340995 1917 231 45540 : : 230008 1178841982 8917 10344 5118 4634 3457 10706 36155 22465 8325 56291 : 341714 1942 234 46688 : : 232218 1186931983 8940 10353 5114 4658 3485 10689 36495 22550 8329 56316 : 342220 1968 237 47864 : : 234333 1194831984 8961 10360 5111 4680 3514 10668 36827 22630 8337 56409 : 342702 1992 240 49070 : : 236394 1202351985 8961 10367 5113 4701 3545 10649 37124 22722 8350 56554 : 343313 2017 241 50306 : : 238506 1210491986 8958 10372 5120 4721 3579 10631 37378 22826 8370 56684 : 344062 2041 243 51480 : : 240683 1216721987 8971 10377 5127 4740 3616 10613 37589 22938 8398 56804 : 344792 2065 246 52370 : : 242843 1222641988 8981 10385 5130 4755 3655 10596 37745 23046 8436 56916 : 345925 2089 250 53268 : : 245061 1227831989 8877 10391 5132 4767 3684 10482 37882 23150 8493 57077 : 347408 1987 253 54192 : : 247387 1232551990 8718 10363 5140 4777 3698 10374 38031 23191 8559 57238 : 349505 1882 255 55120 : : 250181 123611
1991 351371
.................................................................................................................................................................
1991 8632 10309 5146 4689 3704 10373 38109 22990 8617 57439 : 367281 1900 258 56055 : : 253530 1240431992 8540 10318 5171 4576 3700 10369 38173 22783 8668 57585 : 368970 1985 261 56986 : : 256922 1244521993 8472 10331 5189 4600 3683 10358 38221 22752 8719 57714 481337 370532 1999 264 57913 : : 260282 1247641994 8444 10336 5206 4652 3657 10343 38252 22719 8781 57862 482383 371631 1947 266 58837 : : 263455 1250341995 8406 10331 5230 4620 3629 10329 38275 22673 8827 58025 483265 372688 1966 267 59756 : : 266588 1255701996 8363 10315 5262 4557 3602 10311 38289 22608 8841 58164 483996 373664 1983 269 60671 : : 269714 1258641997 8312 10304 5285 4535 3575 10290 38292 22546 8846 58314 484726 374610 1997 271 61582 : : 272958 1261661998 8257 10295 5303 4532 3549 10267 38283 22503 8851 58475 485365 375438 2008 274 62464 : : 276154 1264861999 8211 10283 5321 4513 3524 10238 38270 22458 8858 58684 486259 376539 2017 277 63364 : 7540 279328 1266862000 8170 10273 5338 4468 3500 10211 38259 22435 8872 58886 487484 377955 2026 281 64252 614 7516 282398 126926
2001 7913 10224 5357 4442 3471 10188 38248 22408 8896 59113 488737 379672 2035 285 65133 616 7503 285225 1272912002 7869 10201 5376 4444 3443 10159 38230 21676 8925 59319 489840 381668 2020 288 66008 618 7500 287955 1274352003 7801 10202 5390 4442 3415 10130 38205 21574 8958 59552 491808 383902 2027 289 66873 620 7481 290626 1276192004 7761 10207 5403 4443 3377 10107 38182 21452 8994 59842 493924 386272 2033 293 67723 622 7463 293262 1276872005 7719 10234 5419 4443 3323 10087 38165 21320 9030 60235 496049 388642 2037 296 68566 623 7441 295993 1277682006 7699 10267 5437 4442 3270 10071 38141 21194 9081 60584 497947 390744 2040 304 69395 624 7412 298818 1277702007 7660 10323 5460 4439 3231 10056 38121 20883 9148 60986 499968 393123 2044 311 70215 626 7382 301696 1277712008 7623 10430 5492 4436 3198 10038 38126 20538 9220 61398 501896 395365 2047 319 71095 629 7350 304543 1276922009 7585 10491 5522 4430 3163 10023 38152 20367 9299 61792 503296 396922 2051 319 72050 623 7321 307240 1275102010 7534 10517 5546 4419 3097 10000 38514 20247 9379 62262 504846 398358 2055 318 73003 618 7291 309776 128057
2011 7348 10497 5569 4344 3028 9972 38534 20148 9450 62735 505773 399785 2059 319 73950 621 7234 312036 1277992012 7306 10509 5590 4269 2988 9920 38536 20096 9520 63705 507417 401672 2061 321 74855 622 7199 314278 1275152013 7271 10513 5612 4263 2958 9894 38514 20046 9601 64087 508367 402793 2066 324 75753 621 6948 316497 1272822014 7220 10518 5632 4256 2937 9883 38475 19996 9685 64536 509637 404225 2070 325 76662 622 6902 318724 1271552015 7169 10534 5649 4248 2935 9872 38437 19946 9768 64974 510775 405495 2074 326 77582 620 6853 320957 127028
_________________________________________________________________________________________________________________________________________________________________ 1) 1960-91 including D_W 2) Former EU-15; 1960-91 including D_W

32
Population and labour market
2. Employment, persons; all domestic industries (National accounts)
(Annual percentage change)
BE DE EE IE EL ES FR IT CY LV LU MT NL AT PT SI SK FI EA-18 EA-12 1) 2) 3)
1961-1970 0.5 0.2 : 0.0 -0.8 0.6 0.6 -0.5 : : 0.6 : 1.9 -0.4 0.2 : : 0.4 : 0.2
1971-1980 0.2 0.3 : 0.9 0.7 -0.6 0.6 0.7 : : 1.2 : 0.9 0.7 0.1 : : 0.3 : 0.4
1981 -1.9 0.1 : -0.9 5.2 -2.4 -0.2 -0.1 : : 0.3 : -0.5 -0.4 1.1 : : 1.3 : -0.21982 -1.3 -0.8 : 0.0 -1.1 -0.9 0.2 0.2 : : -0.3 : -1.5 -1.4 -1.9 : : 1.1 : -0.51983 -1.3 -0.9 : -1.9 0.5 -0.3 -0.1 0.3 : : -0.3 : -0.9 -0.7 -1.1 : : 0.4 : -0.41984 0.0 0.9 : -1.9 -0.2 -2.2 -0.6 0.0 : : 0.6 : 0.8 -0.1 -1.5 : : 0.6 : -0.21985 0.5 1.4 : -2.6 2.5 -1.0 -0.3 0.9 : : 0.9 : 1.9 0.3 0.0 : : 0.2 : 0.61986 0.6 1.9 : 0.7 0.3 2.3 0.5 0.7 : : 2.4 : 2.4 0.3 -2.7 : : -0.3 : 1.01987 0.7 1.4 : 0.9 -0.1 4.8 0.8 0.2 : : 2.7 : 2.1 -0.1 2.3 : : 0.6 : 1.31988 1.9 1.4 : 0.0 1.7 3.5 1.0 1.1 : : 3.0 : 1.8 0.9 2.2 : : 1.0 : 1.51989 1.5 1.9 : -0.2 0.4 3.6 1.7 0.7 : : 3.4 : 2.7 1.3 1.9 : : 0.9 : 1.71990 1.1 3.2 : 4.3 1.3 3.8 0.9 1.6 : : 4.2 : 3.0 2.0 1.7 : : -0.5 : 2.2
1981-1990 0.2 1.0 : -0.2 1.0 1.1 0.4 0.6 : : 1.7 : 1.2 0.2 0.2 : : 0.5 : 0.7
1991 0.3 2.8 -2.8 -0.3 -1.8 1.2 0.1 1.9 : -0.8 4.0 1.9 1.9 1.2 2.8 : : -5.6 : 1.41992 -0.1 -1.4 -6.0 0.3 1.4 -1.4 -0.7 -0.7 : -7.3 2.8 1.3 1.4 0.4 -1.6 : : -7.0 : -0.91993 -0.6 -1.3 -7.9 1.5 0.8 -2.8 -1.2 -2.7 : -6.9 1.8 0.9 0.4 -0.5 -2.0 : : -6.0 : -1.61994 -0.4 -0.1 -3.3 3.1 1.9 -0.5 0.4 -1.6 : -10.1 2.7 0.5 0.7 0.0 -1.0 : : -1.4 : -0.21995 1.6 0.4 -6.2 4.1 0.9 1.9 0.9 -0.2 : -10.4 2.6 3.2 2.3 -0.4 -0.7 : : 1.8 : 0.71996 0.3 -0.1 -2.4 3.6 -0.4 1.7 0.6 0.6 0.5 -1.9 2.6 1.6 2.2 0.4 1.7 -2.0 2.1 1.4 0.6 0.61997 0.7 -0.1 0.0 5.6 -0.5 3.6 0.7 0.3 0.6 4.4 3.1 0.3 3.1 0.7 2.6 -1.8 -1.0 3.4 0.9 1.01998 1.7 1.1 -1.9 8.5 2.9 4.5 1.7 1.0 1.6 -0.3 4.5 -0.2 2.6 1.0 2.8 -0.1 -0.5 1.8 1.8 1.91999 1.4 1.5 -4.5 6.5 0.3 4.6 2.3 1.1 1.8 -1.8 5.0 0.7 2.6 1.5 1.4 1.5 -2.5 2.5 1.9 2.02000 2.0 1.7 -1.5 4.5 0.5 5.1 2.6 1.9 1.7 -3.2 5.6 -1.2 2.2 1.0 2.1 1.5 -2.0 2.1 2.2 2.4
1991-2000 0.7 0.4 -3.7 3.7 0.6 1.7 0.7 0.1 : -3.9 3.4 0.9 1.9 0.5 0.8 : : -0.8 : 0.7
2001 1.4 0.3 0.8 3.1 0.1 3.2 1.5 2.0 2.2 1.2 5.5 1.8 2.1 0.7 1.8 0.6 0.6 1.3 1.4 1.42002 -0.1 -0.6 1.4 1.6 2.3 2.5 0.5 1.7 2.1 2.9 3.2 0.3 0.5 -0.1 0.6 1.6 0.1 0.9 0.7 0.72003 -0.1 -0.9 1.4 1.9 1.2 3.2 0.1 1.5 3.6 1.9 1.8 -0.4 -0.5 0.6 -0.6 -0.3 1.1 0.1 0.5 0.52004 1.0 0.3 0.0 3.4 2.4 3.6 0.1 0.4 4.0 1.2 2.2 0.4 -0.9 0.6 -0.1 0.4 -0.2 0.4 0.8 0.82005 1.4 -0.1 2.0 4.9 3.0 4.1 0.7 0.6 3.5 1.6 2.9 1.6 0.5 1.2 -0.3 -0.5 1.6 1.4 1.0 1.02006 1.1 0.6 5.4 4.6 1.9 4.0 1.1 2.0 1.8 4.9 3.6 1.2 1.7 1.7 0.5 1.6 2.1 1.8 1.7 1.62007 1.7 1.7 0.8 4.4 1.4 3.0 1.4 1.3 3.4 -1.4 4.5 2.4 2.6 1.8 0.0 3.3 2.1 2.2 1.8 1.82008 1.8 1.2 0.2 -0.6 1.2 -0.1 0.5 0.3 2.0 -0.8 5.0 2.5 1.5 2.0 0.5 2.6 3.2 2.6 0.8 0.82009 -0.2 0.1 -10.0 -7.8 -0.6 -6.5 -1.3 -1.6 -0.4 -14.3 0.9 -0.2 -0.7 -0.7 -2.6 -1.8 -2.0 -2.6 -1.9 -1.82010 0.7 0.5 -4.8 -4.1 -2.6 -2.2 0.1 -0.7 -0.2 -6.7 1.8 2.1 -0.4 1.0 -1.5 -2.2 -1.5 -0.1 -0.5 -0.4
2001-2010 0.9 0.3 -0.4 1.1 1.0 1.4 0.5 0.7 2.2 -1.1 3.1 1.1 0.6 0.9 -0.2 0.5 0.7 0.8 0.6 0.6
2011 1.4 1.4 7.0 -1.8 -5.6 -1.9 0.6 0.3 0.5 1.5 3.0 2.5 0.7 1.7 -1.5 -1.6 1.8 1.5 0.3 0.22012 0.2 1.1 2.2 -0.6 -8.3 -4.2 0.0 -0.3 -4.2 1.4 2.5 2.4 -0.2 1.3 -4.2 -0.8 0.1 0.1 -0.6 -0.72013 -0.2 0.6 1.1 2.4 -4.1 -3.0 -0.3 -2.0 -5.2 2.3 1.7 3.1 -1.0 0.7 -2.8 -2.0 -0.8 -1.3 -0.9 -0.92014 0.3 0.6 0.2 2.4 0.6 0.6 0.3 -0.3 -4.4 1.6 2.0 2.1 -0.8 0.8 0.9 0.0 0.5 -0.2 0.3 0.32015 0.8 0.3 0.3 2.3 2.6 1.4 0.8 0.5 0.8 1.7 2.1 2.1 0.6 0.9 0.8 0.3 0.6 0.3 0.7 0.7
1) 1961-91 D_W 2) Euro area 3) Former Euro area 12; 1961-91 including D_W

33
Population and labour market
2. Employment, persons; all domestic industries (National accounts)
(Annual percentage change)
BG CZ DK HR LT HU PL RO SE UK EU-28 EU-15 MK IS TR ME RS US JP 1)
1961-1970 : : 1.3 : : : : : 0.7 0.3 : 0.3 : : 1.0 : : 1.8 1.4
1971-1980 : : 0.4 : : : : : 0.8 0.2 : 0.4 : 2.7 1.9 : : 2.1 0.8
1981 : : -1.5 : : : : : 0.2 -3.2 : -0.7 : 4.8 0.9 : : 0.7 0.81982 : : 0.4 : : : : : -0.2 -1.8 : -0.7 : 3.1 1.1 : : -1.3 0.81983 : : 0.1 : : : : : 0.2 -0.5 : -0.4 : 0.4 1.0 : : 0.7 1.51984 : : 1.6 : : : : : 0.8 2.0 : 0.2 : 1.4 1.6 : : 4.0 0.31985 : : 2.4 : : : : : 1.0 1.1 : 0.7 : 3.6 1.7 : : 2.4 0.51986 : : 2.5 : : : : : 0.6 0.1 : 0.9 : 3.2 1.9 : : 1.6 0.51987 : : 0.5 : : : : : 0.8 2.6 : 1.5 : 5.7 2.3 : : 5.1 0.41988 : : -0.7 : : : : : 1.4 4.3 : 2.0 : -3.0 1.5 : : 2.2 1.21989 : : -0.4 : : : : : 1.5 2.4 : 1.8 : -1.4 2.6 : : 2.0 1.51990 : : -0.5 : : : : : 0.9 0.3 : 1.7 : -0.9 1.7 : : 1.2 1.7
1981-1990 : : 0.4 : : : : : 0.7 0.7 : 0.7 : 1.7 1.6 : : 1.8 0.9
1991 : : -0.6 : 2.4 : : -0.5 -1.5 -3.0 : 0.5 : -0.1 4.0 : : -0.9 2.01992 : : -1.1 : -2.2 : : -3.0 -4.5 -1.9 : -1.2 : 0.0 0.9 : : 0.5 1.11993 : : -1.5 : -4.2 : -1.9 -3.8 -4.7 -0.8 : -1.5 : -0.2 -4.9 : : 1.3 0.41994 : 1.1 1.6 : -5.8 : -1.6 -0.5 -1.0 0.8 : -0.1 : 0.8 8.1 : : 2.2 0.11995 : 0.7 0.8 : -1.9 : 0.9 -5.2 1.6 1.2 : 0.8 : 3.0 2.9 : : 1.4 0.31996 2.7 0.5 0.9 : 0.9 0.1 1.2 -1.2 -0.8 0.9 : 0.6 : 0.1 3.0 : : 1.3 0.11997 -3.1 -0.7 1.4 -13.5 0.6 0.2 1.4 -3.8 -1.3 1.8 0.5 1.1 : 0.0 0.1 : : 2.2 0.71998 -1.0 -1.8 1.5 10.2 -0.8 1.6 1.2 -2.3 1.7 1.0 1.3 1.8 3.4 4.2 2.7 : : 1.4 -1.21999 -4.3 -2.2 0.8 -1.4 -2.2 2.8 -3.9 -4.5 2.1 1.4 0.8 1.9 -0.6 3.7 1.2 : : 1.5 -1.42000 -2.4 -0.8 0.5 -0.5 -4.0 1.0 -1.6 -0.8 2.5 1.2 1.4 2.1 0.3 2.0 -2.1 : : 2.5 -0.6
1991-2000 : : 0.4 : -1.7 : : -2.6 -0.6 0.2 : 0.6 : 1.3 1.5 : : 1.3 0.2
2001 -0.8 -0.3 0.9 0.5 -3.8 -0.2 -2.2 -1.1 2.1 0.8 0.8 1.3 -1.7 1.7 -0.3 : 0.4 0.0 -0.82002 0.2 0.6 0.0 0.8 3.6 -0.1 -3.0 -10.2 0.0 0.8 -0.1 0.7 -0.6 -1.4 -0.8 : -3.4 -0.3 -1.22003 3.0 -0.8 -1.1 3.9 2.2 0.0 -1.2 0.0 -0.6 0.9 0.4 0.5 -1.9 0.1 -1.0 : -2.7 0.9 0.12004 2.6 -0.3 -0.6 1.5 0.0 -1.0 1.1 -1.7 -0.7 1.1 0.7 0.8 -2.2 -0.5 -7.2 : 0.4 1.1 0.62005 2.7 2.1 1.0 0.7 2.5 -0.3 2.2 -1.5 0.3 1.0 1.0 1.0 2.1 3.3 2.2 : -6.7 1.7 0.72006 3.3 1.3 2.1 3.9 1.8 0.4 3.2 0.7 1.7 0.9 1.6 1.5 3.2 5.1 1.8 -0.5 -3.8 1.9 0.52007 3.2 2.1 2.8 1.4 2.8 0.7 4.5 0.4 2.3 0.7 1.8 1.6 4.3 4.5 1.5 19.3 1.0 1.1 0.42008 2.4 2.3 1.7 3.1 -0.7 -1.8 3.8 0.0 0.9 0.7 1.0 0.8 6.2 0.8 2.2 4.5 6.3 -0.4 -0.52009 -1.7 -1.8 -3.4 -1.8 -6.8 -2.5 0.4 -2.0 -2.4 -1.6 -1.8 -1.8 2.5 -6.2 0.4 -3.8 -7.3 -3.7 -1.52010 -3.9 -1.0 -2.5 -5.1 -11.9 0.8 -2.7 -0.3 1.0 0.2 -0.7 -0.3 1.5 -0.4 6.2 -2.0 -8.4 -0.6 -0.4
2001-2010 1.1 0.4 0.1 0.8 -1.1 -0.4 0.6 -1.6 0.4 0.5 0.5 0.6 1.3 0.7 0.5 : -2.5 0.2 -0.2
2011 -2.2 0.0 -0.2 -2.3 0.5 0.3 0.6 -0.8 2.1 0.5 0.2 0.3 3.1 0.0 6.7 -6.2 -6.0 0.6 -0.22012 -2.5 0.4 -0.3 -3.9 1.8 0.0 0.1 1.3 0.7 1.2 -0.2 -0.3 0.8 1.1 3.0 2.8 -1.1 1.8 0.02013 -0.3 0.9 0.4 -1.0 1.3 0.4 -0.1 -0.3 1.0 1.2 -0.4 -0.5 4.3 3.3 3.0 0.2 3.7 1.0 0.42014 0.3 0.2 0.5 -2.5 1.4 0.7 0.5 0.4 1.2 1.6 0.5 0.5 1.9 2.1 2.0 1.9 -0.6 1.8 0.52015 0.4 0.4 0.5 -1.0 1.3 0.6 0.6 0.7 1.1 1.0 0.7 0.8 1.9 2.0 2.7 2.6 -0.3 1.6 0.3
1) Former EU-15; 1961-91 including D_W

34
Population and labour market
3. Unemployment rate; totalMember States: definition EUROSTAT
BE DE EE IE EL ES FR IT CY LV LU MT NL AT PT SI SK FI EA-18 EA-12 1) 2) 3)
1960-1970 1.9 0.6 : 5.4 5.0 2.4 1.8 4.9 : : 0.0 : 0.9 2.0 2.4 : : 2.2 : 2.4
1971-1980 4.6 2.2 : 7.7 2.2 5.4 3.9 6.1 : : 0.6 : 3.7 1.5 5.1 : : 4.0 : 4.1
1981 9.4 3.9 : 10.8 4.0 14.2 6.5 7.4 : : 2.4 : 7.7 2.8 7.3 : : 4.9 : 7.01982 11.0 5.6 : 12.5 5.8 16.0 7.1 8.0 : : 2.4 : 10.6 3.3 7.2 : : 5.4 : 8.21983 10.7 6.9 : 13.9 7.1 14.3 7.1 7.4 : : 3.4 : 8.3 3.4 8.2 : : 5.5 : 8.11984 10.8 7.1 : 15.5 7.2 16.7 8.5 7.9 : : 3.0 : 8.1 3.4 8.9 : : 5.2 : 8.91985 10.1 7.2 : 16.8 7.0 17.8 8.9 8.2 : : 2.9 : 7.3 3.7 9.1 : : 4.9 : 9.11986 10.0 6.6 : 16.8 6.6 17.4 9.1 8.9 : : 2.6 : 6.5 3.9 8.8 : : 5.2 : 9.11987 9.8 6.4 : 16.6 6.7 18.5 9.3 9.6 : : 2.5 : 6.3 3.7 7.2 : : 4.8 : 9.31988 8.8 6.3 : 16.2 6.8 17.5 8.8 9.7 : : 2.0 : 6.2 3.3 5.8 : : 4.2 : 9.01989 7.4 5.6 : 14.7 6.7 15.5 8.4 9.7 : : 1.8 : 5.7 2.9 5.2 : : 3.1 : 8.31990 6.6 4.8 : 13.4 6.4 14.4 8.0 8.9 : 1 1.7 4.9 5.1 3.1 4.8 : : 3.2 : 7.6
1981-1990 9.5 6.0 : 14.7 6.4 16.2 8.2 8.6 : : 2.5 : 7.2 3.4 7.3 : : 4.6 : 8.5
1991 4.2 7.6
1991 6.4 5.6 : 14.7 7.1 14.5 8.4 8.5 : 1 1.6 4.5 4.8 3.4 4.2 : : 6.6 : 8.01992 7.1 6.6 : 15.4 7.9 16.3 9.3 8.8 : 4 2.1 5.0 4.9 3.4 4.1 : : 11.7 : 8.51993 8.6 7.8 7 15.6 8.6 20.1 10.6 9.7 : 9 2.6 5.5 5.5 4.0 5.5 : : 16.3 : 10.11994 9.8 8.5 8 14.3 8.9 21.3 11.1 10.6 : 17 3.2 5.5 6.2 3.8 6.8 : : 16.6 : 10.91995 9.7 8.3 10 12.3 9.2 20.0 10.5 11.2 2.6 19 2.9 5.0 7.1 3.9 7.2 7 13 15.4 : 10.71996 9.5 8.9 10 11.7 9.6 19.1 11.0 11.2 3.1 21 2.9 5.3 6.4 4.3 7.2 7 12 14.6 : 10.81997 9.2 9.7 10 9.9 9.8 17.8 11.1 11.2 3.4 15 2.7 6.1 5.5 4.4 6.7 7 12 12.7 : 10.81998 9.3 9.4 9 7.5 11.1 15.9 10.7 11.3 3.3 14 2.7 6.4 4.3 4.5 5.6 7 13 11.4 : 10.31999 8.5 8.6 11 5.6 12.0 13.2 10.4 10.9 3.6 14 2.4 6.9 3.5 3.9 5.0 7 17 10.2 10 9.52000 6.9 8.0 14 4.2 11.2 11.7 9.0 10.0 4.8 14 2.2 6.7 3.1 3.6 4.5 7 19 9.8 9 8.5
1991-2000 8.5 8.1 : 11.1 9.5 17.0 10.2 10.3 : 13 2.5 5.7 5.1 3.9 5.7 : : 12.5 : 9.8
2001 6.6 7.9 12.6 3.9 10.7 10.5 8.2 9.0 3.9 13.5 1.9 7.6 2.5 3.6 4.6 6.2 19.5 9.1 8.2 7.92002 7.5 8.7 10.3 4.5 10.3 11.4 8.3 8.5 3.5 12.5 2.6 7.4 3.1 4.2 5.7 6.3 18.8 9.1 8.5 8.32003 8.2 9.8 10.1 4.6 9.7 11.4 8.6 8.4 4.1 11.6 3.8 7.7 4.2 4.3 7.1 6.7 17.7 9.0 9.0 8.82004 8.4 10.5 9.7 4.5 10.5 10.9 8.9 8.0 4.6 11.7 5.0 7.2 5.1 4.9 7.5 6.3 18.4 8.8 9.2 9.12005 8.5 11.3 7.9 4.4 9.9 9.2 8.9 7.7 5.3 10.0 4.6 6.9 5.3 5.2 8.6 6.5 16.4 8.4 9.1 9.02006 8.3 10.3 5.9 4.5 8.9 8.5 8.9 6.8 4.6 7.0 4.6 6.9 4.4 4.8 8.6 6.0 13.5 7.7 8.4 8.42007 7.5 8.7 4.6 4.7 8.3 8.3 8.0 6.1 3.9 6.1 4.2 6.5 3.6 4.4 8.9 4.9 11.2 6.9 7.5 7.52008 7.0 7.5 5.5 6.4 7.7 11.3 7.5 6.7 3.7 7.7 4.9 6.0 3.1 3.8 8.5 4.4 9.6 6.4 7.6 7.62009 7.9 7.8 13.5 12.0 9.5 18.0 9.1 7.8 5.4 17.5 5.1 6.9 3.7 4.8 10.6 5.9 12.1 8.2 9.6 9.52010 8.3 7.1 16.7 13.9 12.6 20.1 9.3 8.4 6.3 19.5 4.6 6.9 4.5 4.4 12.0 7.3 14.5 8.4 10.1 10.0
2001-2010 7.8 9.0 9.7 6.3 9.8 12.0 8.6 7.7 4.5 11.7 4.1 7.0 4.0 4.4 8.2 6.1 15.2 8.2 8.7 8.6
2011 7.2 5.9 12.3 14.7 17.7 21.7 9.2 8.4 7.9 16.2 4.8 6.5 4.4 4.2 12.9 8.2 13.7 7.8 10.1 10.02012 7.6 5.5 10.0 14.7 24.3 25.0 9.8 10.7 11.9 15.0 5.1 6.4 5.3 4.3 15.9 8.9 14.0 7.7 11.3 11.32013 8.4 5.3 8.6 13.1 27.3 26.4 10.3 12.2 15.9 11.9 5.8 6.5 6.7 4.9 16.5 10.1 14.2 8.2 12.0 11.92014 8.5 5.1 8.1 11.4 26.0 25.5 10.4 12.8 19.2 10.7 5.7 6.5 7.4 4.8 15.4 10.1 13.6 8.5 11.8 11.72015 8.2 5.1 7.5 10.2 24.0 24.0 10.2 12.5 18.4 9.6 5.5 6.5 7.3 4.7 14.8 9.8 12.9 8.4 11.4 11.3
1) 1960-91 D_W 2) Euro area; 1960-91 including D_W 3) Former Euro area 12; 1960-91 including D_W

35
Population and labour market
3. Unemployment rate; totalMember States: definition EUROSTAT
BG CZ DK HR LT HU PL RO SE UK EU-28 EU-15 MK IS TR ME RS US JP 1) 2) 3)
1960-1970 : : 1.1 : : : : : 1.7 1.7 : 2.2 : 1.0 9.7 : : 4.8 1.3
1971-1980 : : 3.6 : : : : : 2.1 3.8 : 4.0 : 0.8 7.9 : : 6.4 1.8
1981 : : 7.9 : : : : : 2.5 8.8 : 7.2 : 0.6 7.1 : : 7.6 2.21982 : : 8.4 : : : : : 3.2 10.1 : 8.4 : 1.2 7.0 : : 9.7 2.41983 : : 8.4 : : : : : 3.7 10.8 : 8.5 : 1.8 7.7 : : 9.6 2.61984 : : 7.9 : : : : : 3.3 10.9 : 9.1 : 2.2 7.6 : : 7.5 2.71985 : : 6.7 : : : : : 2.9 11.2 : 9.3 : 1.6 7.1 : : 7.2 2.61986 : : 5.0 : : : : : 2.7 11.2 : 9.2 : 1.1 7.9 : : 7.0 2.81987 : : 5.0 : : : : : 2.2 10.3 : 9.2 : 0.8 8.3 : : 6.2 2.81988 : : 5.7 : : : : : 1.8 8.5 : 8.6 : 1.1 8.3 : : 5.5 2.51989 : : 6.8 : : : : : 1.6 7.1 : 7.8 : 2.8 8.4 : : 5.3 2.31990 : : 7.2 : 0 : : : 1.7 6.9 : 7.3 : 3.1 7.7 : : 5.5 2.1
1981-1990 : : 6.9 : : : : : 2.6 9.6 : 8.5 : 1.6 7.7 : : 7.1 2.5
1991 7.6
1991 : : 7.9 : 0.3 : : : 3.1 8.6 : 8.0 : 2.6 7.8 : : 6.7 2.11992 : : 8.6 : 1.4 : 13.3 5 5.6 9.8 : 8.4 : 4.3 8.0 : : 7.4 2.21993 : 4.1 9.6 : 4.8 : 14.0 7 9.1 10.2 : 10.1 : 5.3 8.3 : : 6.8 2.51994 : 4.1 7.7 : 4.2 : 14.4 7 9.4 9.3 : 10.5 : 5.3 7.9 : : 6.1 2.91995 12.0 4.0 6.7 : 6.9 10.1 13.2 6 8.8 8.5 : 10.2 : 4.8 6.8 : : 5.6 3.11996 11.6 4.0 6.3 10.6 7.7 9.9 12.1 4 9.6 7.9 : 10.2 31.9 3.7 5.7 : : 5.4 3.41997 14.5 4.9 5.2 13.4 6.5 9.1 10.9 5.3 9.9 6.8 : 10.0 36.0 3.9 5.8 : : 4.9 3.41998 13.2 6.5 4.9 12.4 13.2 8.7 10.2 5.4 8.2 6.1 : 9.5 34.5 2.8 5.8 : : 4.5 4.11999 15.1 8.7 5.2 14.1 14.6 6.9 13.4 6.2 6.7 5.9 : 8.7 32.4 2.0 6.5 : : 4.2 4.72000 16.4 8.8 4.3 15.8 16.4 6.3 16.1 6.8 5.6 5.4 8.9 7.9 32.2 2.3 5.2 : 12.1 4.0 4.7
1991-2000 : : 6.6 : 7.6 : : : 7.6 7.9 : 9.4 : 3.7 6.8 : : 5.6 3.3
2001 19.5 8.1 4.5 15.9 17.4 5.6 18.3 6.6 5.8 5.0 8.6 7.3 30.5 2.3 8.4 : 12.2 4.8 5.02002 18.2 7.3 4.6 15.1 13.9 5.6 20.0 7.5 6.0 5.1 9.0 7.7 31.9 3.3 10.3 : 13.3 5.8 5.42003 13.7 7.8 5.4 14.1 12.6 5.8 19.8 6.8 6.6 5.0 9.1 8.1 36.7 3.3 10.5 : 14.6 6.0 5.32004 12.1 8.3 5.5 13.8 11.6 6.1 19.1 8.0 7.4 4.7 9.2 8.3 37.1 3.1 10.8 : 18.5 5.5 4.72005 10.1 7.9 4.8 12.8 8.5 7.2 17.9 7.2 7.7 4.8 9.0 8.2 37.3 2.6 9.2 30.3 20.8 5.1 4.42006 9.0 7.1 3.9 11.4 5.8 7.5 13.9 7.3 7.1 5.4 8.2 7.8 36.0 2.9 8.7 29.6 20.9 4.6 4.12007 6.9 5.3 3.8 9.6 4.3 7.4 9.6 6.4 6.1 5.3 7.2 7.1 34.9 2.3 8.8 19.4 18.1 4.6 3.92008 5.6 4.4 3.5 8.4 5.8 7.8 7.1 5.8 6.2 5.6 7.0 7.2 33.8 3.0 9.7 16.8 13.6 5.8 4.02009 6.8 6.7 6.0 9.1 13.8 10.0 8.1 6.9 8.3 7.6 9.0 9.1 32.2 7.2 12.5 19.1 16.1 9.3 5.12010 10.3 7.3 7.5 11.8 17.8 11.2 9.7 7.3 8.6 7.8 9.6 9.6 32.0 7.6 10.7 19.7 19.2 9.6 5.1
2001-2010 11.2 7.0 5.0 12.2 11.2 7.4 14.4 7.0 7.0 5.6 8.6 8.0 34.2 3.8 10.0 : 16.7 6.1 4.7
2011 11.3 6.7 7.6 13.5 15.4 10.9 9.7 7.4 7.8 8.0 9.6 9.6 31.4 7.1 8.8 19.7 23.0 8.9 4.62012 12.3 7.0 7.5 15.9 13.4 10.9 10.1 7.0 8.0 7.9 10.4 10.6 31.0 6.0 8.1 19.6 23.9 8.1 4.32013 13.0 7.0 7.0 17.2 11.8 10.2 10.3 7.3 8.0 7.5 10.8 11.0 29.0 5.4 8.7 19.5 22.1 7.4 4.02014 12.8 6.7 6.8 18.0 10.6 9.0 9.9 7.2 7.6 6.6 10.5 10.7 28.5 5.0 9.4 19.1 22.6 6.4 3.92015 12.5 6.6 6.6 18.0 9.7 8.9 9.5 7.1 7.2 6.3 10.1 10.3 27.5 4.5 9.3 18.2 22.5 5.9 3.8
1) Break in series in 2001 2) 1960-91 including D_W 3) Former EU-15; 1960-91 including D_W

36
Output
4. Gross domestic product at current market prices
(National currency)
BE DE EE IE EL ES FR IT CY LV LU MT NL AT PT SI SK FI EA-18 EA-12 1) 2) 3)
Mrd Mrd Mrd Mrd Mrd Mrd Mrd Mrd Mrd Mrd Mrd Mrd Mrd Mrd Mrd Mrd Mrd Mrd Mrd Mrd EURO- EURO- EURO- EURO- EURO- EURO- EURO- EURO- EURO- EURO- EURO- EURO- EURO- EURO- EURO- EURO- EURO- EURO- EUR EUR
BEF DEM EEK IEP GRD ESP FRF ITL CYP LVL LUF MTL NLG ATS PTE SIT SKK FIM
1960 14.8 162 : 0.9 0.4 4 46 13 0.16 : 0.85 0.128 21.3 12.5 0.5 : : 2.8 : 223
1965 22.0 245 : 1.4 0.6 9 75 22 0.24 : 1.14 0.141 34.5 18.9 0.7 : : 4.6 : 362
1970 33.4 361 : 2.3 1.1 17 124 35 0.40 : 1.79 0.253 58.1 28.7 1.2 : : 8.0 : 591
1975 59.4 551 : 5.4 2.6 39 232 74 0.45 : 2.82 0.442 106.6 50.2 2.6 : : 18.0 : 1141
1980 90.8 789 : 13.3 6.8 97 445 204 1.35 : 4.33 1.045 163.1 76.4 8.1 : : 33.3 : 2002
1981 95.2 826 : 16.2 8.1 109 501 245 1.55 : 4.61 1.164 172.2 81.4 9.8 : : 37.6 : 21751982 103.0 860 : 19.1 10.2 126 576 289 1.81 : 5.17 1.231 177.9 87.5 11.8 : : 42.3 : 23901983 109.2 898 : 21.1 12.2 143 639 336 2.01 : 5.68 1.220 184.1 93.2 15.1 : : 47.1 : 25681984 117.9 942 : 23.4 15.1 161 695 384 2.37 : 6.30 1.229 194.1 97.8 18.6 : : 52.7 : 27851985 125.4 984 : 25.4 18.5 179 744 431 2.62 : 6.68 1.269 200.8 103.3 22.8 : : 57.3 : 29721986 131.3 1037 : 26.9 22.1 205 801 477 2.83 : 7.34 1.365 206.9 108.8 27.9 : : 61.7 : 32191987 136.6 1065 : 28.8 24.9 230 841 522 3.15 : 7.63 1.464 208.6 112.9 32.8 : : 66.6 : 33871988 146.1 1123 : 31.0 30.3 256 909 580 3.52 : 8.51 1.617 217.6 118.4 39.2 : : 75.4 : 36371989 158.5 1201 : 34.7 36.0 286 979 637 3.99 : 9.72 1.787 230.3 126.7 46.3 : : 84.3 : 39871990 168.0 1307 : 37.2 43.4 319 1033 704 4.52 0.10 10.49 1.959 243.7 136.1 55.6 0.86 9.32 89.3 : 4345
1991 1416 4640
1991 176.0 1535 : 38.6 53.6 350 1071 769 4.73 0.23 11.61 2.151 257.4 145.9 63.8 1.53 10.71 85.2 : 47531992 184.8 1648 : 41.0 62.0 377 1108 810 5.49 1.61 12.26 2.332 268.3 154.2 71.7 4.44 11.14 83.0 : 50081993 190.4 1697 1.47 44.3 69.8 390 1120 834 5.81 2.35 13.54 2.506 276.0 159.3 75.0 6.26 13.79 83.9 5098 50631994 200.6 1782 2.01 47.6 79.2 415 1158 882 6.48 3.27 14.56 2.742 290.0 167.2 81.3 8.09 16.61 88.4 5325 52841995 207.9 1849 2.77 53.8 88.7 447 1196 952 7.09 3.73 15.11 3.054 305.3 174.8 87.8 10.36 19.32 96.1 5579 55321996 211.7 1875 3.64 59.0 97.5 474 1227 1009 7.39 4.44 15.79 3.200 319.8 180.6 93.2 11.95 21.53 99.1 5811 57591997 221.5 1913 4.48 68.1 107.9 504 1265 1054 7.73 5.19 16.42 3.388 342.2 184.3 101.1 13.61 23.87 107.4 5943 58851998 230.0 1960 5.03 78.6 117.3 539 1321 1098 8.37 5.81 17.41 3.554 362.5 191.9 110.4 15.08 26.17 116.6 6174 61111999 238.9 2000 5.36 90.7 125.0 580 1367 1134 9.01 6.11 19.88 3.760 386.2 199.3 118.7 16.92 28.11 122.3 6453 63872000 252.5 2048 6.16 105.6 135.0 630 1440 1198 9.76 6.71 22.00 4.121 418.0 208.5 127.3 18.57 31.18 132.2 6791 6718
2001 259.8 2102 6.97 117.5 145.1 680 1496 1256 10.55 7.34 22.57 4.219 447.7 214.2 134.5 20.76 33.88 139.3 7092 70142002 268.6 2132 7.78 130.7 155.2 729 1543 1302 10.89 8.11 23.98 4.433 465.2 220.5 140.6 23.19 36.81 143.6 7339 72552003 276.2 2148 8.72 140.6 170.9 783 1588 1342 11.63 9.06 25.82 4.605 476.9 225.0 143.5 25.20 40.61 145.5 7555 74652004 291.3 2196 9.69 150.0 183.6 841 1656 1398 12.52 10.56 27.44 4.656 491.2 234.7 149.3 27.16 45.16 152.3 7869 77702005 303.4 2224 11.18 162.9 193.0 909 1718 1436 13.40 12.81 30.27 4.938 513.4 245.2 154.3 28.72 49.31 157.4 8158 80482006 318.8 2314 13.39 177.6 208.6 986 1798 1493 14.43 15.83 33.91 5.207 540.2 259.0 160.9 31.05 55.00 165.8 8580 84552007 335.8 2429 16.07 189.7 223.2 1053 1887 1554 15.83 20.95 37.50 5.575 571.8 274.0 169.3 34.59 61.45 179.8 9052 89042008 346.4 2474 16.24 180.2 233.2 1088 1933 1575 17.16 22.89 37.37 5.963 594.5 282.7 172.0 37.24 66.84 185.7 9266 91022009 340.7 2374 13.97 162.3 231.1 1047 1886 1520 16.85 18.60 35.58 5.956 573.2 276.2 168.5 35.42 62.79 172.3 8940 87862010 355.7 2495 14.37 158.1 222.2 1046 1937 1552 17.41 18.19 39.30 6.449 586.8 285.2 172.9 35.48 65.90 178.7 9186 9028
2011 369.3 2610 16.22 162.6 208.5 1046 2001 1580 17.88 20.31 41.73 6.694 599.0 299.2 171.1 36.15 68.97 188.7 9444 92782012 375.9 2666 17.42 163.9 193.3 1029 2032 1567 17.72 22.08 42.92 6.880 599.3 307.0 165.1 35.32 71.10 192.4 9505 93352013 381.4 2738 18.43 164.1 182.1 1023 2060 1560 16.50 23.32 45.48 7.186 602.7 313.2 165.7 35.27 72.13 193.4 9601 94282014 392.5 2833 19.31 168.8 181.9 1038 2106 1583 15.79 24.61 47.95 7.493 616.9 324.3 168.9 35.88 74.09 196.9 9835 96582015 404.0 2935 20.57 175.5 187.9 1067 2164 1624 16.18 26.33 49.63 7.852 632.1 335.8 172.9 36.87 77.04 201.7 10134 9949
1) 1960-91 D_W 2) 1960-1998 ECU; Euro area; 1960-91 including D_W 3) 1960-1998 ECU; Former Euro area 12; 1960-91 including D_W

37
Output
4. Gross domestic product at current market prices
(National currency)
BG CZ DK HR LT HU PL RO SE UK EU-28 EU-15 MK IS TR ME RS US JP 1) 2) Mrd Mrd Mrd Mrd Mrd Mrd Mrd Mrd Mrd Mrd Mrd Mrd Mrd Mrd Mrd Mrd Mrd Mrd Mrd BGN CZK DKK HRK LTL HUF PLN RON SEK GBP EUR EUR MKD ISK TRY EUR RSD USD JPY
1960 : : 43 : : : : : 77 26 : 312 : 0 0 : : 542 16429
1965 : : 73 : : : : : 120 36 : 488 : 0 0 : : 743 33727
1970 : : 124 : : 339 : : 183 52 : 764 : 0 0 : : 1076 75265
1975 : : 228 : : 492 : : 319 107 : 1426 : 2 0 : : 1689 152211
1980 : : 393 : : 736 0 0.1 570 234 : 2541 : 16 0 : : 2863 246465
1981 : : 430 : : 796 0 0.1 623 257 : 2805 : 25 0 : : 3211 2649661982 : : 491 : : 865 1 0.1 682 282 : 3065 : 39 0 : : 3345 2781791983 : : 541 : : 914 1 0.1 764 309 : 3272 : 68 0 : : 3638 2893151984 : : 598 : : 998 1 0.1 857 331 : 3551 : 89 0 : : 4041 3074991985 : : 649 : : 1055 1 0.1 932 363 : 3813 : 122 0 : : 4347 3302611986 : : 699 : : 1111 1 0.1 1017 391 : 4034 : 162 0 : : 4590 3456441987 : : 734 : : 1251 2 0.1 1101 431 : 4242 : 210 0 : : 4870 3594581988 : : 762 : : 1470 3 0.1 1203 481 : 4623 : 259 0 : : 5253 3864281989 : : 805 : : 1758 12 0.1 1333 529 : 5061 : 319 0 : : 5658 4162461990 0.05 703 841 0.3 0.1 2132 61 0.1 1470 575 : 5454 0.5 371 1 : : 5980 449392
1991 5823
............
1991 0.14 846 874 0.4 0.4 2549 89 0.2 1573 605 : 5937 0.9 402 1 : : 6174 4764311992 0.20 945 907 2.5 3.6 3002 126 0.6 1571 630 : 6187 11.8 401 1 : : 6539 4879611993 0.30 1145 912 36.6 12.2 3620 171 2.1 1573 665 6434 6208 59.2 414 3 : : 6879 4909341994 0.53 1323 977 88.2 17.8 4453 246 5.3 1679 706 6764 6507 146.4 440 5 : : 7309 4957431995 0.88 1534 1020 115.3 26.9 5728 337 7.6 1810 748 7061 6767 169.5 454 10 : : 7664 5017071996 1.58 1762 1069 126.8 33.7 7011 422 11.4 1854 796 7424 7100 176.4 488 20 : : 8100 5119351997 16.91 1885 1126 144.8 40.5 8692 515 25.5 1933 845 7840 7480 186.0 526 39 : 121 8609 5231981998 22.99 2062 1164 159.8 45.0 10281 601 37.1 2025 892 8210 7813 195.0 588 70 : 163 9089 5124391999 24.31 2149 1213 164.1 43.9 11443 666 55.2 2138 938 8622 8218 209.0 632 105 : 206 9666 5049032000 27.40 2270 1294 178.1 46.0 13089 744 81.0 2265 987 9242 8780 236.4 684 167 1.066 384 10290 509860
2001 30.30 2449 1336 192.3 48.9 15104 780 117.9 2348 1032 9627 9106 233.8 772 240 1.295 762 10625 5055432002 33.19 2568 1373 208.8 52.4 17119 809 152.0 2444 1081 9982 9426 244.0 816 350 1.360 973 10980 4991472003 35.81 2688 1401 228.9 57.2 18738 843 197.4 2545 1149 10150 9592 258.4 841 455 1.510 1126 11512 4988552004 39.82 2929 1466 247.4 63.0 20665 925 247.4 2661 1213 10656 10046 272.5 930 559 1.670 1381 12277 5037252005 45.48 3116 1545 266.7 72.4 22018 983 289.0 2769 1277 11129 10421 295.1 1026 649 1.815 1683 13095 5039032006 51.78 3353 1632 291.0 83.2 23675 1060 344.7 2944 1349 11765 10972 320.1 1169 758 2.149 1962 13858 5066872007 60.18 3663 1695 318.3 99.2 24990 1177 416.0 3126 1428 12474 11556 365.0 1309 843 2.680 2277 14480 5129752008 69.30 3848 1753 343.4 111.9 26543 1276 514.7 3204 1462 12549 11507 411.7 1480 951 3.086 2661 14720 5012092009 68.32 3759 1665 328.7 92.0 25626 1345 501.1 3106 1417 11816 10893 410.7 1498 953 2.981 2720 14418 4711392010 70.51 3791 1760 323.8 95.7 26513 1417 523.7 3338 1486 12337 11346 434.1 1536 1099 3.104 2882 14958 482384
2011 75.31 3823 1792 328.7 106.9 27635 1528 557.3 3481 1537 12711 11675 459.8 1628 1298 3.234 3209 15534 4713112012 78.09 3846 1826 328.6 113.7 28048 1596 586.7 3550 1558 12960 11910 458.6 1699 1417 3.149 3349 16245 4737772013 78.12 3884 1858 328.3 119.5 29114 1636 628.6 3634 1613 13068 11997 474.2 1786 1562 3.338 3618 16800 4783682014 80.16 4015 1913 328.9 125.4 30452 1705 662.0 3780 1686 13474 12375 490.0 1842 1722 3.477 3807 17554 4940132015 83.05 4181 1977 335.0 133.1 31903 1791 698.6 3963 1766 13942 12790 506.9 1940 1920 3.675 4055 18448 506091
_________________________________________________________________________________________________________________________________________________________________ 1) 1960-1998 ECU; 1960-91 including D_W 2) 1960-1998 ECU; Former EU-15; 1960-91 including D_W
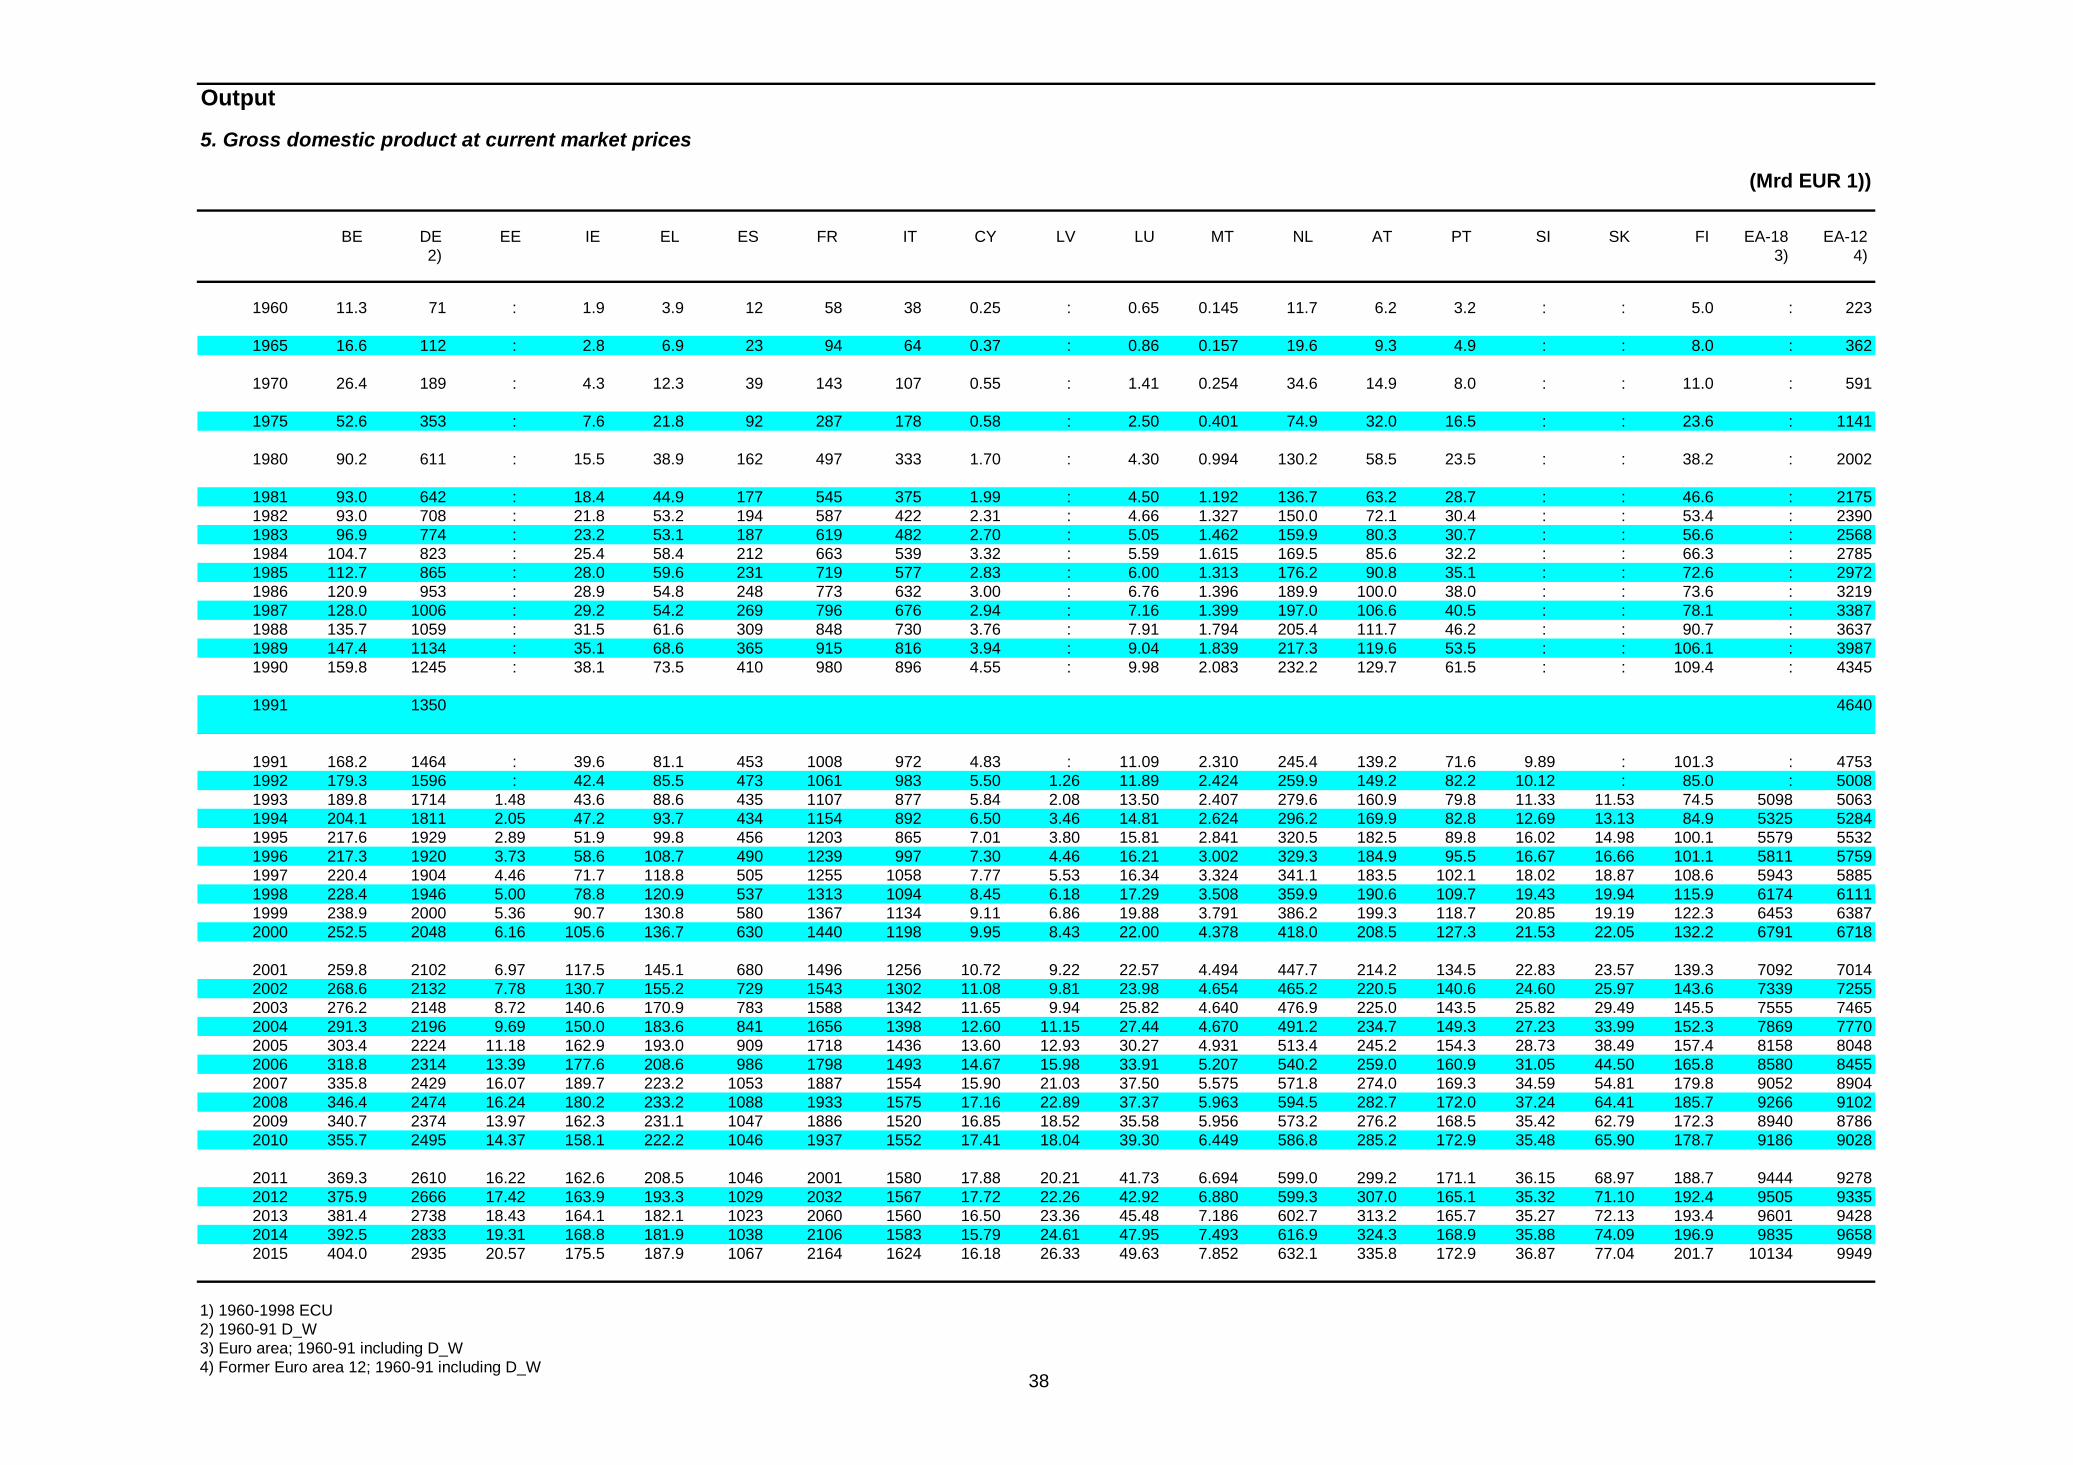
38
Output
5. Gross domestic product at current market prices
(Mrd EUR 1))
BE DE EE IE EL ES FR IT CY LV LU MT NL AT PT SI SK FI EA-18 EA-12 2) 3) 4)
1960 11.3 71 : 1.9 3.9 12 58 38 0.25 : 0.65 0.145 11.7 6.2 3.2 : : 5.0 : 223
1965 16.6 112 : 2.8 6.9 23 94 64 0.37 : 0.86 0.157 19.6 9.3 4.9 : : 8.0 : 362
1970 26.4 189 : 4.3 12.3 39 143 107 0.55 : 1.41 0.254 34.6 14.9 8.0 : : 11.0 : 591
1975 52.6 353 : 7.6 21.8 92 287 178 0.58 : 2.50 0.401 74.9 32.0 16.5 : : 23.6 : 1141
1980 90.2 611 : 15.5 38.9 162 497 333 1.70 : 4.30 0.994 130.2 58.5 23.5 : : 38.2 : 2002
1981 93.0 642 : 18.4 44.9 177 545 375 1.99 : 4.50 1.192 136.7 63.2 28.7 : : 46.6 : 21751982 93.0 708 : 21.8 53.2 194 587 422 2.31 : 4.66 1.327 150.0 72.1 30.4 : : 53.4 : 23901983 96.9 774 : 23.2 53.1 187 619 482 2.70 : 5.05 1.462 159.9 80.3 30.7 : : 56.6 : 25681984 104.7 823 : 25.4 58.4 212 663 539 3.32 : 5.59 1.615 169.5 85.6 32.2 : : 66.3 : 27851985 112.7 865 : 28.0 59.6 231 719 577 2.83 : 6.00 1.313 176.2 90.8 35.1 : : 72.6 : 29721986 120.9 953 : 28.9 54.8 248 773 632 3.00 : 6.76 1.396 189.9 100.0 38.0 : : 73.6 : 32191987 128.0 1006 : 29.2 54.2 269 796 676 2.94 : 7.16 1.399 197.0 106.6 40.5 : : 78.1 : 33871988 135.7 1059 : 31.5 61.6 309 848 730 3.76 : 7.91 1.794 205.4 111.7 46.2 : : 90.7 : 36371989 147.4 1134 : 35.1 68.6 365 915 816 3.94 : 9.04 1.839 217.3 119.6 53.5 : : 106.1 : 39871990 159.8 1245 : 38.1 73.5 410 980 896 4.55 : 9.98 2.083 232.2 129.7 61.5 : : 109.4 : 4345
1991 1350 4640
1991 168.2 1464 : 39.6 81.1 453 1008 972 4.83 : 11.09 2.310 245.4 139.2 71.6 9.89 : 101.3 : 47531992 179.3 1596 : 42.4 85.5 473 1061 983 5.50 1.26 11.89 2.424 259.9 149.2 82.2 10.12 : 85.0 : 50081993 189.8 1714 1.48 43.6 88.6 435 1107 877 5.84 2.08 13.50 2.407 279.6 160.9 79.8 11.33 11.53 74.5 5098 50631994 204.1 1811 2.05 47.2 93.7 434 1154 892 6.50 3.46 14.81 2.624 296.2 169.9 82.8 12.69 13.13 84.9 5325 52841995 217.6 1929 2.89 51.9 99.8 456 1203 865 7.01 3.80 15.81 2.841 320.5 182.5 89.8 16.02 14.98 100.1 5579 55321996 217.3 1920 3.73 58.6 108.7 490 1239 997 7.30 4.46 16.21 3.002 329.3 184.9 95.5 16.67 16.66 101.1 5811 57591997 220.4 1904 4.46 71.7 118.8 505 1255 1058 7.77 5.53 16.34 3.324 341.1 183.5 102.1 18.02 18.87 108.6 5943 58851998 228.4 1946 5.00 78.8 120.9 537 1313 1094 8.45 6.18 17.29 3.508 359.9 190.6 109.7 19.43 19.94 115.9 6174 61111999 238.9 2000 5.36 90.7 130.8 580 1367 1134 9.11 6.86 19.88 3.791 386.2 199.3 118.7 20.85 19.19 122.3 6453 63872000 252.5 2048 6.16 105.6 136.7 630 1440 1198 9.95 8.43 22.00 4.378 418.0 208.5 127.3 21.53 22.05 132.2 6791 6718
2001 259.8 2102 6.97 117.5 145.1 680 1496 1256 10.72 9.22 22.57 4.494 447.7 214.2 134.5 22.83 23.57 139.3 7092 70142002 268.6 2132 7.78 130.7 155.2 729 1543 1302 11.08 9.81 23.98 4.654 465.2 220.5 140.6 24.60 25.97 143.6 7339 72552003 276.2 2148 8.72 140.6 170.9 783 1588 1342 11.65 9.94 25.82 4.640 476.9 225.0 143.5 25.82 29.49 145.5 7555 74652004 291.3 2196 9.69 150.0 183.6 841 1656 1398 12.60 11.15 27.44 4.670 491.2 234.7 149.3 27.23 33.99 152.3 7869 77702005 303.4 2224 11.18 162.9 193.0 909 1718 1436 13.60 12.93 30.27 4.931 513.4 245.2 154.3 28.73 38.49 157.4 8158 80482006 318.8 2314 13.39 177.6 208.6 986 1798 1493 14.67 15.98 33.91 5.207 540.2 259.0 160.9 31.05 44.50 165.8 8580 84552007 335.8 2429 16.07 189.7 223.2 1053 1887 1554 15.90 21.03 37.50 5.575 571.8 274.0 169.3 34.59 54.81 179.8 9052 89042008 346.4 2474 16.24 180.2 233.2 1088 1933 1575 17.16 22.89 37.37 5.963 594.5 282.7 172.0 37.24 64.41 185.7 9266 91022009 340.7 2374 13.97 162.3 231.1 1047 1886 1520 16.85 18.52 35.58 5.956 573.2 276.2 168.5 35.42 62.79 172.3 8940 87862010 355.7 2495 14.37 158.1 222.2 1046 1937 1552 17.41 18.04 39.30 6.449 586.8 285.2 172.9 35.48 65.90 178.7 9186 9028
2011 369.3 2610 16.22 162.6 208.5 1046 2001 1580 17.88 20.21 41.73 6.694 599.0 299.2 171.1 36.15 68.97 188.7 9444 92782012 375.9 2666 17.42 163.9 193.3 1029 2032 1567 17.72 22.26 42.92 6.880 599.3 307.0 165.1 35.32 71.10 192.4 9505 93352013 381.4 2738 18.43 164.1 182.1 1023 2060 1560 16.50 23.36 45.48 7.186 602.7 313.2 165.7 35.27 72.13 193.4 9601 94282014 392.5 2833 19.31 168.8 181.9 1038 2106 1583 15.79 24.61 47.95 7.493 616.9 324.3 168.9 35.88 74.09 196.9 9835 96582015 404.0 2935 20.57 175.5 187.9 1067 2164 1624 16.18 26.33 49.63 7.852 632.1 335.8 172.9 36.87 77.04 201.7 10134 9949
1) 1960-1998 ECU 2) 1960-91 D_W 3) Euro area; 1960-91 including D_W 4) Former Euro area 12; 1960-91 including D_W

39
Output
5. Gross domestic product at current market prices
(Mrd EUR 1))
BG CZ DK HR LT HU PL RO SE UK EU-28 EU-15 MK IS TR ME RS US JP 2) 3)
1960 : : 5.9 : : : : : 14.0 69 : 312 : 0.25 17.3 : : 513 43
1965 : : 9.9 : : : : : 21.7 94 : 488 : 0.49 15.1 : : 695 88
1970 : : 16.2 : : : : : 34.6 122 : 764 : 0.51 24.1 : : 1053 205
1975 : : 31.9 : : : : : 62.1 191 : 1426 : 1.12 50.6 : : 1361 422
1980 : : 50.2 : : 17.3 41.9 27.7 97.0 391 : 2541 : 2.40 70.6 : : 2056 782
1981 : : 54.3 : : 21.4 26.0 40.6 110.6 465 : 2805 : 3.09 88.0 : : 2876 10801982 : : 60.2 : : 24.4 58.6 53.1 111.0 504 : 3065 : 3.25 89.7 : : 3414 11421983 : : 66.6 : : 24.1 86.9 57.3 112.0 526 : 3272 : 3.08 100.2 : : 4087 13691984 : : 73.4 : : 26.3 98.2 57.4 131.6 561 : 3551 : 3.59 113.7 : : 5121 16441985 : : 80.9 : : 47.4 163.5 114.1 142.9 617 : 3813 : 3.86 101.8 : : 5696 18291986 : : 88.1 : : 25.4 79.3 57.6 145.4 582 : 4034 : 4.00 95.1 : : 4664 20951987 : : 93.1 : : 17.3 42.5 39.9 150.6 611 : 4242 : 4.72 89.9 : : 4219 21581988 : : 95.9 : : 17.6 42.6 38.4 166.1 725 : 4623 : 5.10 104.2 : : 4442 25511989 : : 100.0 : : 22.3 62.9 42.6 187.8 786 : 5061 : 5.07 120.3 : : 5135 27401990 10.04 26.1 107.0 : : 16.3 31.3 19.7 195.5 806 : 5454 : 5.02 158.7 : : 4696 2447
1991 5823
1991 4.01 24.4 110.6 : : 17.9 43.9 16.1 210.4 863 : 5937 : 5.50 164.4 : : 4982 28621992 3.93 25.7 116.1 : 1.67 17.4 42.3 9.5 208.5 855 : 6187 : 5.38 164.6 : : 5038 29711993 9.25 33.5 120.1 8.73 2.40 33.6 80.3 24.0 172.4 852 6434 6208 : 5.23 206.9 : : 5874 37721994 8.16 38.7 129.5 12.36 3.76 35.6 91.2 26.8 183.2 910 6764 6507 2.850 5.30 146.3 : : 6144 40861995 9.99 44.2 139.1 16.87 5.15 34.8 106.4 28.7 193.9 903 7061 6767 3.422 5.36 174.2 : : 5859 40791996 7.02 51.1 145.3 18.39 6.64 36.2 123.4 29.0 217.7 978 7424 7100 3.477 5.76 192.4 : : 6379 37071997 8.89 52.5 150.4 20.74 8.93 41.1 138.7 31.5 223.4 1221 7840 7480 3.282 6.54 225.6 : 18.04 7591 38171998 11.68 57.2 155.2 22.41 10.04 42.7 153.4 37.1 227.1 1319 8210 7813 3.197 7.38 239.0 : 14.47 8107 35001999 12.43 58.3 163.2 21.65 10.29 45.3 157.5 33.8 242.8 1425 8622 8218 3.448 8.19 233.9 : 16.55 9069 41622000 14.04 63.8 173.6 23.31 12.45 50.3 185.7 40.7 268.3 1620 9242 8780 3.893 9.42 289.9 1.066 6.60 11141 5126
2001 15.55 71.9 179.2 25.70 13.64 58.9 212.3 45.4 253.7 1659 9627 9106 3.839 8.83 217.9 1.295 12.73 11863 46522002 17.03 83.4 184.7 28.17 15.13 70.5 209.6 48.6 266.7 1720 9982 9426 4.001 9.47 243.4 1.360 16.03 11612 42282003 18.37 84.4 188.5 30.25 16.58 73.9 191.6 52.6 278.9 1660 10150 9592 4.217 9.71 268.3 1.510 17.29 10177 38092004 20.39 91.8 197.1 33.01 18.24 82.1 204.2 61.1 291.6 1787 10656 10046 4.442 10.67 314.6 1.670 18.99 9870 37472005 23.26 104.6 207.4 36.03 20.97 88.8 244.4 79.8 298.4 1867 11129 10421 4.813 13.11 386.9 1.815 20.28 10526 36822006 26.48 118.3 218.7 39.73 24.10 89.6 272.1 97.7 318.2 1979 11765 10972 5.231 13.32 419.2 2.149 23.33 11037 34702007 30.77 131.9 227.5 43.38 28.74 99.4 311.0 124.7 337.9 2087 12474 11556 5.967 14.93 472.0 2.680 28.47 10566 31812008 35.43 154.3 235.1 47.54 32.41 105.5 363.2 139.8 333.3 1836 12549 11507 6.693 10.29 498.6 3.086 32.68 10009 32882009 34.93 142.2 223.6 44.78 26.65 91.4 310.7 118.2 292.5 1591 11816 10893 6.702 8.68 440.4 2.981 28.95 10337 36152010 36.05 149.9 236.3 44.42 27.71 96.2 354.6 124.3 349.9 1732 12337 11346 7.057 9.49 550.4 3.104 27.97 11283 4150
2011 38.50 155.5 240.5 44.19 30.96 98.9 370.8 131.5 385.4 1771 12711 11675 7.479 10.09 555.1 3.234 31.47 11160 42482012 39.93 152.9 245.3 43.68 32.94 97.0 381.5 131.6 407.8 1922 12960 11910 7.454 10.57 612.4 3.149 29.63 12644 46232013 39.94 149.5 249.1 43.31 34.60 98.1 389.7 142.2 420.1 1900 13068 11997 7.701 10.98 616.3 3.338 31.90 12649 36892014 40.99 146.3 256.2 43.08 36.33 99.2 408.1 148.0 420.9 2039 13474 12375 7.943 11.85 582.9 3.477 32.94 12745 34982015 42.46 152.4 264.8 43.90 38.55 104.1 428.8 156.5 439.3 2137 13942 12790 8.216 12.51 655.5 3.675 35.11 13371 3581
1) 1960-1998 ECU 2) 1960-91 including D_W 3) Former EU-15; 1960-91 including D_W

40
Output
6. Gross domestic product at current market prices
(Mrd PPS)
BE DE EE IE EL ES FR IT CY LV LU MT NL AT PT SI SK FI EA-18 EA-12 1) 2) 3)
1960 9.8 76 : 2.0 4.9 20 46 45 : : 0.57 : 13.9 7.6 3.9 : : 4.0 : 233
1965 15.4 118 : 2.9 9.3 36 75 71 : : 0.83 : 21.5 11.4 6.6 : : 6.2 : 373
1970 24.1 178 : 4.5 16.9 60 121 119 : : 1.22 : 34.7 18.3 10.4 : : 9.7 : 599
1975 45.8 320 : 9.1 34.3 124 235 222 : : 2.24 : 65.1 35.4 20.7 : : 19.4 : 1134
1980 81.8 578 : 17.4 64.4 207 424 423 : : 3.83 : 113.2 63.6 40.8 : : 34.7 : 2052
1981 89.9 640 : 19.8 69.8 228 472 470 : : 4.20 : 123.7 70.0 46.0 : : 38.8 : 22721982 97.9 690 : 21.9 74.7 250 523 510 : : 4.59 : 132.2 77.3 50.8 : : 43.2 : 24761983 103.0 735 : 22.9 77.5 267 556 542 : : 4.96 : 141.6 83.5 53.9 : : 46.7 : 26331984 111.8 800 : 25.3 83.8 288 597 592 : : 5.58 : 154.5 88.4 56.4 : : 51.0 : 28541985 119.0 858 : 27.3 89.9 308 636 637 : : 6.01 : 166.0 94.9 60.1 : : 55.2 : 30581986 124.7 903 : 28.2 93.1 328 669 675 : : 6.81 : 175.7 100.0 63.9 : : 58.3 : 32261987 130.5 937 : 30.2 93.0 354 701 712 : : 7.24 : 183.1 103.6 70.3 : : 61.7 : 33831988 142.8 1015 : 32.9 101.4 389 767 776 : : 8.21 : 198.0 111.9 77.4 : : 67.9 : 36871989 156.0 1114 : 36.9 111.1 430 843 847 : : 9.51 : 218.2 122.7 87.2 : : 75.3 : 40511990 168.3 1226 : 41.6 116.2 467 905 904 6.14 20.47 10.48 : 237.8 133.9 98.4 21.33 : 79.2 : 4388
1991 1351 4719
1991 179.6 1464 : 44.4 125.6 502 958 962 6.49 18.75 11.93 4.01 255.3 145.2 106.6 20.37 : 78.0 : 48331992 187.6 1534 : 47.2 130.1 521 1000 997 7.32 13.09 12.49 4.32 267.1 152.5 113.0 19.80 31.9 77.4 : 50401993 186.6 1526 7.65 48.7 128.6 518 998 993 7.40 11.65 13.08 4.53 271.6 154.0 112.8 20.46 34.3 77.1 5114 50281994 196.2 1593 7.67 52.4 133.6 540 1040 1034 7.98 12.13 13.83 4.88 284.9 160.6 116.6 21.95 37.1 81.5 5338 52461995 190.8 1538 7.61 54.7 129.5 527 1007 1010 8.33 11.42 13.32 4.93 279.0 156.6 113.3 21.70 37.3 80.4 5191 51001996 196.1 1597 8.31 60.3 136.3 558 1049 1055 8.76 12.17 14.10 4.80 297.4 164.1 119.4 23.26 41.0 83.5 5428 53291997 207.2 1648 9.54 68.0 146.1 597 1108 1102 9.22 13.67 14.62 5.17 320.8 170.1 128.4 25.15 44.7 91.8 5709 56011998 212.6 1695 10.02 76.2 151.5 641 1168 1161 9.88 14.92 15.70 5.41 341.9 178.8 136.1 26.58 47.5 99.4 5991 58771999 223.8 1771 10.42 84.2 158.6 683 1229 1196 10.60 15.39 18.23 5.78 367.6 187.6 147.0 28.61 48.5 105.3 6291 61722000 246.0 1838 11.74 95.3 172.9 745 1330 1273 11.56 16.43 20.31 6.43 406.4 201.0 157.9 30.30 51.5 115.3 6728 6600
2001 251.4 1885 12.53 101.4 185.3 788 1395 1332 12.49 17.80 20.40 6.31 423.3 200.1 163.3 31.48 55.7 118.0 7000 68642002 264.8 1931 13.89 111.0 200.5 848 1454 1313 12.85 19.49 21.89 6.67 439.9 210.0 169.3 33.62 59.5 122.1 7231 70852003 265.1 1974 15.29 116.9 209.2 877 1428 1325 13.14 20.76 23.12 6.78 433.9 214.5 171.4 34.55 61.7 121.4 7311 71592004 273.2 2059 16.76 125.4 221.9 932 1481 1346 14.29 22.77 25.01 6.91 454.3 225.7 175.3 37.39 66.3 131.3 7615 74502005 281.9 2145 18.62 134.8 226.0 994 1555 1385 15.39 24.91 26.55 7.27 478.8 231.2 188.4 39.25 72.8 134.6 7959 77812006 293.5 2246 20.93 146.7 242.6 1089 1619 1456 16.53 27.77 30.15 7.53 505.9 245.9 197.6 41.52 80.6 141.9 8410 82152007 307.0 2370 23.48 160.4 251.8 1172 1713 1542 18.05 31.52 32.88 7.96 540.6 256.1 208.0 44.57 91.3 155.0 8926 87092008 309.5 2379 23.09 147.9 259.6 1179 1710 1558 19.55 31.79 32.19 8.31 550.8 258.9 206.8 45.83 97.9 157.9 8977 87502009 298.3 2205 20.02 136.7 249.0 1109 1646 1466 18.94 27.12 29.48 8.18 512.0 245.9 200.0 41.31 92.3 143.4 8449 82412010 320.4 2389 20.91 143.0 241.4 1111 1723 1517 19.60 28.24 32.49 8.82 526.7 258.4 208.5 42.18 98.5 149.6 8839 8620
2011 331.1 2521 23.28 147.8 226.3 1116 1782 1547 19.99 30.94 34.64 9.02 541.8 271.2 205.1 43.48 102.0 156.5 9109 88812012 339.0 2579 24.40 151.0 216.4 1129 1815 1561 20.18 33.31 35.68 9.22 545.2 279.3 204.9 43.99 104.9 159.2 9250 90142013 342.3 2609 24.79 151.6 209.6 1123 1832 1544 19.22 34.94 36.71 9.51 544.7 282.4 203.6 43.82 106.7 158.1 9275 90362014 352.3 2695 25.63 156.4 213.9 1152 1876 1575 18.56 36.78 38.21 9.87 559.0 291.3 209.2 44.79 110.6 160.7 9526 92802015 362.9 2788 26.77 163.4 223.2 1193 1931 1617 18.99 38.85 39.81 10.23 574.8 300.9 215.3 46.07 115.6 164.7 9831 9575
1) 1960-91 D_W 2) Euro area; 1960-91 including D_W 3) Former Euro area 12; 1960-91 including D_W

41
Output
6. Gross domestic product at current market prices
(Mrd PPS)
BG CZ DK HR LT HU PL RO SE UK EU-28 EU-15 MK IS TR ME RS US JP 1) 2)
1960 : : 5.6 : : : : : 10.0 63 : 312 : 0.21 11 : : 302 54
1965 : : 8.8 : : : : : 15.8 90 : 488 : 0.36 17 : : 472 102
1970 : : 13.6 : : : : : 24.0 127 : 764 : 0.49 29 : : 693 215
1975 : : 23.6 : : : : : 43.5 225 : 1426 : 1.07 60 : : 1260 427
1980 : : 41.4 : : : : : 71.7 376 : 2541 : 2.22 104 : : 2307 809
1981 : : 45.2 : : : : : 78.8 409 : 2805 : 2.55 120 : : 2607 9291982 : : 50.7 : : : : : 86.3 452 : 3065 : 2.82 134 : : 2767 10391983 : : 54.6 : : : : : 92.3 492 : 3272 : 2.89 148 : : 3038 11241984 : : 60.2 : : : : : 101.9 535 : 3551 : 3.19 167 : : 3450 12431985 : : 65.6 : : : : : 109.0 581 : 3813 : 3.45 182 : : 3767 13851986 : : 70.9 : : : : : 115.3 622 : 4034 : 3.77 201 : : 4015 14661987 : : 72.7 : : : : : 121.8 665 : 4242 : 4.19 225 : : 4247 15601988 : : 75.9 : : : : : 130.6 730 : 4623 : 4.37 240 : : 4626 17481989 : : 80.6 : : : : : 141.5 788 : 5061 : 4.63 254 : : 5064 19441990 : 115.0 85.6 : 31.07 : 205.4 115.3 149.2 831 : 5454 9.57 4.90 290 : : 5399 2147
1991 5823
1991 40.76 106.5 90.9 : 30.71 76.5 200.2 105.0 154.5 859 : 5937 9.41 5.12 307 : : 5654 23251992 38.88 108.9 95.4 : 24.87 77.0 211.0 98.6 157.1 894 : 6187 9.04 5.09 335 : : 6021 24101993 38.48 109.5 95.7 : 20.93 76.9 219.9 100.5 154.5 930 : 6208 8.40 5.18 363 : : 6215 24261994 39.91 114.8 102.9 : 19.24 80.6 235.9 106.4 163.7 994 : 6507 8.41 5.47 350 : : 6586 24921995 38.98 115.8 100.7 31.23 18.87 77.7 239.6 108.3 161.6 977 7061 6339 7.90 5.20 356 : : 6424 24131996 32.84 124.5 107.1 34.23 20.32 81.0 262.8 114.5 169.5 1049 7424 6655 8.23 5.50 394 : : 6853 25441997 34.46 126.4 113.9 37.42 22.32 87.2 289.6 106.9 177.3 1136 7840 7028 8.57 6.03 436 : : 7345 26511998 38.59 126.8 118.5 38.80 24.29 93.3 309.7 101.8 184.7 1182 8210 7362 9.02 6.51 457 : : 7767 26301999 40.15 131.2 123.7 39.19 24.39 97.7 330.2 104.8 198.6 1241 8622 7735 9.60 6.85 447 : : 8344 26902000 44.14 138.6 133.5 41.95 26.31 105.3 350.9 111.1 215.2 1347 9242 8296 10.36 7.04 511 3.455 : 8919 2852
2001 46.46 147.5 135.2 44.38 28.65 117.0 359.0 123.0 215.3 1411 9627 8625 10.08 7.44 481 3.563 40.31 9097 28912002 50.86 152.9 141.0 47.60 31.43 127.1 377.0 130.9 222.8 1469 9982 8919 10.41 7.62 488 3.712 43.00 9364 29612003 54.18 161.5 138.4 50.25 35.22 131.1 386.2 140.7 229.9 1511 10150 9039 11.01 7.51 496 3.805 44.08 9705 30092004 58.03 172.3 146.7 53.90 37.64 137.6 417.6 159.8 245.7 1612 10656 9455 12.00 8.30 579 4.058 49.23 10327 31572005 63.45 181.9 150.3 56.92 40.70 143.1 439.7 169.7 246.8 1677 11129 9855 13.41 8.65 653 4.315 52.96 10944 32512006 69.33 194.2 159.3 60.69 44.52 149.8 467.3 195.4 263.5 1751 11765 10389 14.57 8.86 728 5.261 56.89 11254 33012007 76.66 212.9 166.9 67.21 49.98 154.3 517.6 223.0 285.2 1794 12474 10955 15.74 9.38 791 6.233 60.48 11749 34602008 82.80 210.6 170.8 69.96 51.47 160.1 536.2 251.6 285.1 1753 12549 10959 17.18 9.84 834 6.703 66.15 11489 33482009 78.06 203.3 159.7 64.12 43.01 153.4 542.0 237.7 261.8 1624 11816 10286 17.33 9.01 785 6.102 61.35 10795 30562010 81.24 207.1 173.0 63.07 46.86 161.1 593.4 250.9 282.9 1639 12337 10715 18.22 8.88 891 6.300 61.67 11404 3296
2011 85.80 213.5 175.3 65.04 51.30 168.1 630.4 259.6 296.8 1656 12711 11009 18.51 9.17 989 6.595 64.73 11685 32992012 88.57 217.2 179.6 66.83 54.64 168.6 659.7 272.0 306.4 1697 12960 11196 18.64 9.42 1031 6.435 65.07 12197 33982013 89.99 216.8 181.6 66.63 56.83 171.7 674.8 283.6 313.3 1738 13068 11268 19.36 9.80 1080 6.711 67.19 12517 34762014 92.86 224.3 187.1 67.17 59.58 178.3 706.7 294.8 326.7 1810 13474 11604 20.24 10.22 1125 7.005 68.91 13059 35802015 96.05 233.1 193.3 68.59 62.69 184.7 741.4 306.9 341.4 1882 13942 11992 21.18 10.70 1178 7.361 71.22 13670 3677
1) 1960-91 including D_W 2) Former EU-15; 1960-91 including D_W

42
Output
7. Gross domestic product at current market prices
(National currency; annual percentage change)
BE DE EE IE EL ES FR IT CY LV LU MT NL AT PT SI SK FI EA-18 EA-12 1) 2) 3)
1961-1970 8.5 8.4 : 9.9 11.7 14.3 10.3 10.5 9.5 : 7.7 7.0 10.5 8.7 9.1 : : 10.9 : 9.9
1971-1980 10.5 8.1 : 19.2 19.9 19.2 13.6 19.1 12.9 : 9.2 15.3 10.9 10.3 21.4 : : 15.4 : 13.0
1981 4.8 4.7 : 21.4 19.7 12.2 12.8 19.8 15.2 : 6.6 11.4 5.6 6.6 20.1 : : 13.0 : 10.71982 8.2 4.2 : 17.8 25.8 15.0 14.8 18.0 17.0 : 12.1 5.8 3.3 7.5 20.9 : : 12.5 : 11.31983 5.9 4.4 : 10.6 19.3 13.9 11.1 16.4 10.9 : 10.0 -0.9 3.5 6.5 27.8 : : 11.4 : 9.91984 8.0 4.9 : 11.0 24.4 12.8 8.7 14.3 17.7 : 10.9 0.8 5.4 5.0 22.8 : : 11.8 : 9.11985 6.4 4.5 : 8.5 22.0 11.1 7.1 12.2 10.8 : 6.0 3.2 3.5 5.5 22.8 : : 8.8 : 7.91986 4.7 5.4 : 6.1 19.5 14.5 7.6 10.6 7.9 : 9.9 7.5 3.0 5.3 22.2 : : 7.6 : 8.01987 4.0 2.7 : 7.0 12.6 11.8 5.0 9.4 11.3 : 4.0 7.3 0.9 3.8 17.8 : : 8.0 : 5.81988 7.0 5.5 : 7.8 21.7 11.3 8.1 11.1 11.9 : 11.5 10.4 4.3 4.9 19.4 : : 13.3 : 8.31989 8.4 6.9 : 11.6 18.8 12.1 7.7 9.8 13.2 : 14.2 10.5 5.8 7.0 18.1 : : 11.8 : 8.61990 6.0 8.8 : 7.3 20.7 11.4 5.4 10.6 13.3 : 8.0 9.6 5.8 7.5 20.1 : : 6.0 : 8.6
1981-1990 6.3 5.2 : 10.8 20.4 12.6 8.8 13.2 12.9 : 9.3 6.5 4.1 6.0 21.2 : : 10.4 : 8.8
1991 4.8 8.4 : 3.8 23.5 9.7 3.7 9.2 4.7 129.5 10.6 9.8 5.6 7.2 14.7 77.6 15.0 -4.6 : 7.31992 5.0 7.4 : 6.2 15.6 7.7 3.4 5.2 16.0 600.9 5.6 8.4 4.2 5.6 12.4 191.3 3.9 -2.6 : 5.81993 3.0 2.9 : 8.0 12.6 3.5 1.1 3.0 5.9 46.0 10.4 7.5 2.9 3.3 4.6 41.0 23.8 1.1 : 2.81994 5.4 5.0 37.4 7.5 13.4 6.4 3.4 5.8 11.5 39.2 7.5 9.4 5.1 5.0 8.4 29.1 20.5 5.4 5.3 5.21995 3.6 3.7 37.4 13.0 12.1 7.8 3.3 8.0 9.4 14.0 3.8 11.4 5.2 4.5 8.1 28.0 16.3 8.7 5.3 5.21996 1.8 1.4 31.4 9.7 9.9 6.0 2.5 6.0 4.2 18.9 4.5 4.8 4.7 3.3 6.1 15.3 11.4 3.2 3.5 3.41997 4.6 2.0 23.2 15.3 10.7 6.3 3.1 4.5 4.7 16.9 4.0 5.9 7.0 2.1 8.5 13.9 10.9 8.3 4.0 4.01998 3.8 2.5 12.3 15.5 8.7 7.1 4.4 4.1 8.2 11.9 6.1 4.9 5.9 4.1 9.1 10.8 9.7 8.6 4.5 4.41999 3.9 2.1 6.5 15.3 6.6 7.5 3.5 3.3 7.7 5.1 14.2 5.8 6.5 3.8 7.5 12.2 7.4 4.9 3.9 3.92000 5.7 2.4 15.0 16.5 8.0 8.7 5.3 5.7 8.3 9.9 10.6 9.6 8.2 4.6 7.3 9.7 10.9 8.1 5.3 5.2
1991-2000 4.2 3.8 : 11.0 12.0 7.0 3.4 5.5 8.0 52.3 7.7 7.7 5.5 4.4 8.6 36.0 12.8 4.0 : 4.7
2001 2.9 2.7 13.2 11.2 7.4 8.0 3.9 4.8 8.1 9.5 2.6 2.4 7.1 2.7 5.6 11.8 8.7 5.4 4.5 4.42002 3.4 1.4 11.6 11.2 7.0 7.2 3.2 3.7 3.3 10.5 6.3 5.1 3.9 3.0 4.5 11.7 8.6 3.1 3.5 3.42003 2.8 0.7 12.1 7.6 10.1 7.4 2.9 3.1 6.8 11.7 7.7 3.9 2.5 2.0 2.1 8.6 10.3 1.3 3.0 2.92004 5.5 2.2 11.1 6.7 7.4 7.4 4.3 4.2 7.7 16.5 6.3 1.1 3.0 4.3 4.1 7.8 11.2 4.6 4.2 4.12005 4.2 1.3 15.5 8.6 5.2 8.1 3.8 2.8 7.0 21.3 10.3 6.1 4.5 4.5 3.3 5.7 9.2 3.4 3.7 3.62006 5.1 4.0 19.8 9.0 8.1 8.4 4.7 3.9 7.7 23.6 12.0 5.4 5.2 5.6 4.3 8.1 11.5 5.3 5.2 5.12007 5.3 5.0 20.0 6.8 7.0 6.9 4.9 4.1 9.7 32.3 10.6 7.1 5.8 5.8 5.3 11.4 11.7 8.5 5.4 5.32008 3.1 1.9 1.0 -5.0 4.5 3.3 2.5 1.3 8.4 9.3 -0.3 7.0 4.0 3.2 1.6 7.7 8.8 3.2 2.3 2.22009 -1.6 -4.0 -14.0 -10.0 -0.9 -3.8 -2.5 -3.5 -1.8 -18.7 -4.8 -0.1 -3.6 -2.3 -2.0 -4.9 -6.1 -7.2 -3.5 -3.52010 4.4 5.1 2.9 -2.6 -3.9 -0.1 2.7 2.1 3.3 -2.2 10.5 8.3 2.4 3.2 2.6 0.2 4.9 3.7 2.7 2.7
2001-2010 3.5 2.0 8.8 4.1 5.1 5.2 3.0 2.6 6.0 10.5 6.0 4.6 3.5 3.2 3.1 6.7 7.8 3.1 3.1 3.0
2011 3.8 4.6 12.8 2.8 -6.1 0.1 3.3 1.8 2.7 11.7 6.2 3.8 2.1 4.9 -1.0 1.9 4.7 5.6 2.8 2.82012 1.8 2.2 7.4 0.8 -7.3 -1.6 1.5 -0.8 -0.9 8.7 2.8 2.8 0.0 2.6 -3.5 -2.3 3.1 1.9 0.6 0.62013 1.5 2.7 5.9 0.1 -5.8 -0.6 1.4 -0.4 -6.9 5.6 6.0 4.4 0.6 2.0 0.3 -0.1 1.5 0.6 1.0 1.02014 2.9 3.5 4.7 2.9 -0.1 1.4 2.3 1.5 -4.3 5.6 5.4 4.3 2.4 3.5 2.0 1.7 2.7 1.8 2.4 2.42015 2.9 3.6 6.6 4.0 3.3 2.8 2.7 2.5 2.4 7.0 3.5 4.8 2.5 3.5 2.4 2.8 4.0 2.4 3.0 3.0
1) 1961-91 D_W 2) Weighted in common currency; Euro area 3) Weighted in common currency; Former Euro area 12; 1961-91 including D_W

43
Output
7. Gross domestic product at current market prices
(National currency; annual percentage change)
BG CZ DK HR LT HU PL RO SE UK EU-28 EU-15 MK IS TR ME RS US JP 1) 2)
1961-1970 : : 11.2 : : : : : 9.1 7.1 : 9.3 : 17.6 12.0 : : 7.1 16.4
1971-1980 : : 12.2 : : 8.0 : : 12.1 16.3 : 13.4 : 42.7 38.2 : : 10.3 12.6
1981 : : 9.5 : : 8.2 9.6 1.1 9.3 9.9 : 10.5 : 55.5 51.1 : : 12.2 7.51982 : : 14.2 : : 8.7 101.5 16.6 9.4 9.7 : 11.0 : 57.0 32.8 : : 4.2 5.01983 : : 10.3 : : 5.7 24.8 5.7 12.0 9.3 : 9.9 : 73.5 32.5 : : 8.8 4.01984 : : 10.4 : : 9.2 23.9 6.2 12.2 7.4 : 9.0 : 32.1 58.2 : : 11.1 6.31985 : : 8.5 : : 5.6 21.8 0.2 8.7 9.7 : 8.2 : 36.4 59.5 : : 7.6 7.41986 : : 7.7 : : 5.3 24.0 2.6 9.2 7.6 : 8.0 : 32.4 45.5 : : 5.6 4.71987 : : 5.1 : : 12.6 30.8 0.8 8.2 10.2 : 6.5 : 30.2 46.3 : : 6.1 4.01988 : : 3.8 : : 17.4 74.9 1.4 9.3 11.8 : 8.7 : 23.0 72.9 : : 7.9 7.51989 : : 5.6 : : 19.6 299.3 -6.6 10.8 9.9 : 8.8 : 23.2 75.9 : : 7.7 7.71990 : : 4.5 : : 21.3 406.5 7.2 10.3 8.7 : 8.6 : 16.5 72.9 : : 5.7 8.0
1981-1990 : : 7.9 : : 11.2 72.9 3.4 9.9 9.4 : 8.9 : 37.0 54.0 : : 7.6 6.2
1991 199.0 20.4 4.0 43.9 209.3 19.6 44.4 156.9 7.0 5.1 : 6.9 81.8 8.1 60.3 : : 3.3 6.01992 48.0 11.8 3.7 521.2 721.3 17.8 42.1 173.6 -0.2 4.2 : 5.4 1182.0 0.0 73.5 : : 5.9 2.41993 48.8 21.1 0.6 1355.7 240.3 20.6 35.5 232.3 0.1 5.4 : 3.1 401.7 3.2 81.3 : : 5.2 0.61994 75.8 15.6 7.1 141.1 45.9 23.0 44.5 148.4 6.7 6.2 6.9 5.4 147.5 6.3 95.2 : : 6.3 1.01995 67.0 15.9 4.4 30.8 51.3 28.6 36.9 44.9 7.8 6.0 6.3 5.3 15.8 3.1 100.7 : : 4.9 1.21996 80.1 14.9 4.9 10.0 25.2 22.4 25.3 48.8 2.5 6.4 4.7 3.8 4.1 7.4 90.3 : : 5.7 2.01997 969.2 7.0 5.3 14.1 20.2 24.0 22.0 124.3 4.3 6.2 6.2 4.3 5.4 8.0 95.2 : : 6.3 2.21998 36.0 9.4 3.4 10.3 11.1 18.3 16.6 45.1 4.8 5.5 5.2 4.6 4.8 11.8 81.1 : 34.5 5.6 -2.11999 5.7 4.2 4.3 2.7 -2.5 11.3 10.8 48.9 5.6 5.2 4.6 4.2 7.2 7.5 49.0 : 26.5 6.3 -1.52000 12.7 5.6 6.6 8.5 4.8 14.4 11.8 46.7 5.9 5.2 5.7 5.3 13.1 8.1 59.3 : 86.9 6.5 1.0
1991-2000 89.7 12.4 4.4 90.6 78.4 19.9 28.4 97.2 4.4 5.5 : 4.8 84.9 6.3 77.8 : : 5.6 1.3
2001 10.6 7.9 3.2 8.0 6.3 15.4 4.7 45.6 3.7 4.5 4.7 4.4 -1.1 12.9 44.1 21.5 98.4 3.3 -0.82002 9.5 4.9 2.8 8.6 7.1 13.3 3.7 28.9 4.1 4.8 3.9 3.7 4.3 5.8 45.9 5.0 27.6 3.3 -1.32003 7.9 4.7 2.0 9.6 9.3 9.5 4.3 29.9 4.1 6.2 3.8 3.5 5.9 3.1 29.8 11.0 15.8 4.8 -0.12004 11.2 9.0 4.7 8.1 10.1 10.3 9.7 25.3 4.6 5.6 4.7 4.4 5.5 10.5 22.9 10.6 22.6 6.6 1.02005 14.2 6.4 5.4 7.8 14.9 6.5 6.4 16.8 4.1 5.3 4.2 3.9 8.3 10.3 16.1 8.7 21.9 6.7 0.02006 13.8 7.6 5.6 9.1 15.0 7.5 7.8 19.3 6.3 5.7 5.5 5.2 8.5 13.9 16.9 18.4 16.5 5.8 0.62007 16.2 9.2 3.9 9.4 19.2 5.6 11.0 20.7 6.2 5.8 5.9 5.4 14.0 12.0 11.2 24.7 16.0 4.5 1.22008 15.1 5.1 3.4 7.9 12.8 6.2 8.4 23.7 2.5 2.4 2.9 2.3 12.8 13.1 12.7 15.1 16.9 1.7 -2.32009 -1.4 -2.3 -5.0 -4.3 -17.8 -3.5 5.4 -2.6 -3.1 -3.1 -3.2 -3.4 -0.2 1.2 0.2 -3.4 2.2 -2.1 -6.02010 3.2 0.8 5.7 -1.5 4.0 3.5 5.4 4.5 7.5 4.8 3.3 3.2 5.7 2.5 15.4 4.1 5.9 3.7 2.4
2001-2010 9.9 5.3 3.1 6.2 7.6 7.3 6.6 20.5 4.0 4.2 3.5 3.2 6.3 8.4 20.8 11.3 22.3 3.8 -0.6
2011 6.8 0.9 1.8 1.5 11.7 4.2 7.9 6.4 4.3 3.5 3.1 2.9 5.9 6.0 18.1 4.2 11.3 3.8 -2.32012 3.7 0.6 1.9 -0.1 6.4 1.5 4.5 5.3 2.0 1.4 1.0 0.8 -0.3 4.4 9.2 -2.6 4.4 4.6 0.52013 0.0 1.0 1.8 -0.1 5.0 3.8 2.5 7.1 2.4 3.5 1.6 1.5 3.4 5.1 10.2 6.0 8.0 3.4 1.02014 2.6 3.4 3.0 0.2 5.0 4.6 4.3 5.3 4.0 4.5 2.9 2.8 3.3 3.1 10.3 4.1 5.2 4.5 3.32015 3.6 4.2 3.4 1.8 6.1 4.8 5.0 5.5 4.8 4.8 3.5 3.4 3.5 5.3 11.5 5.7 6.5 5.1 2.4
1) Weighted in common currency 2) Weighted in common currency; Former EU-15; 1961-91 including D_W
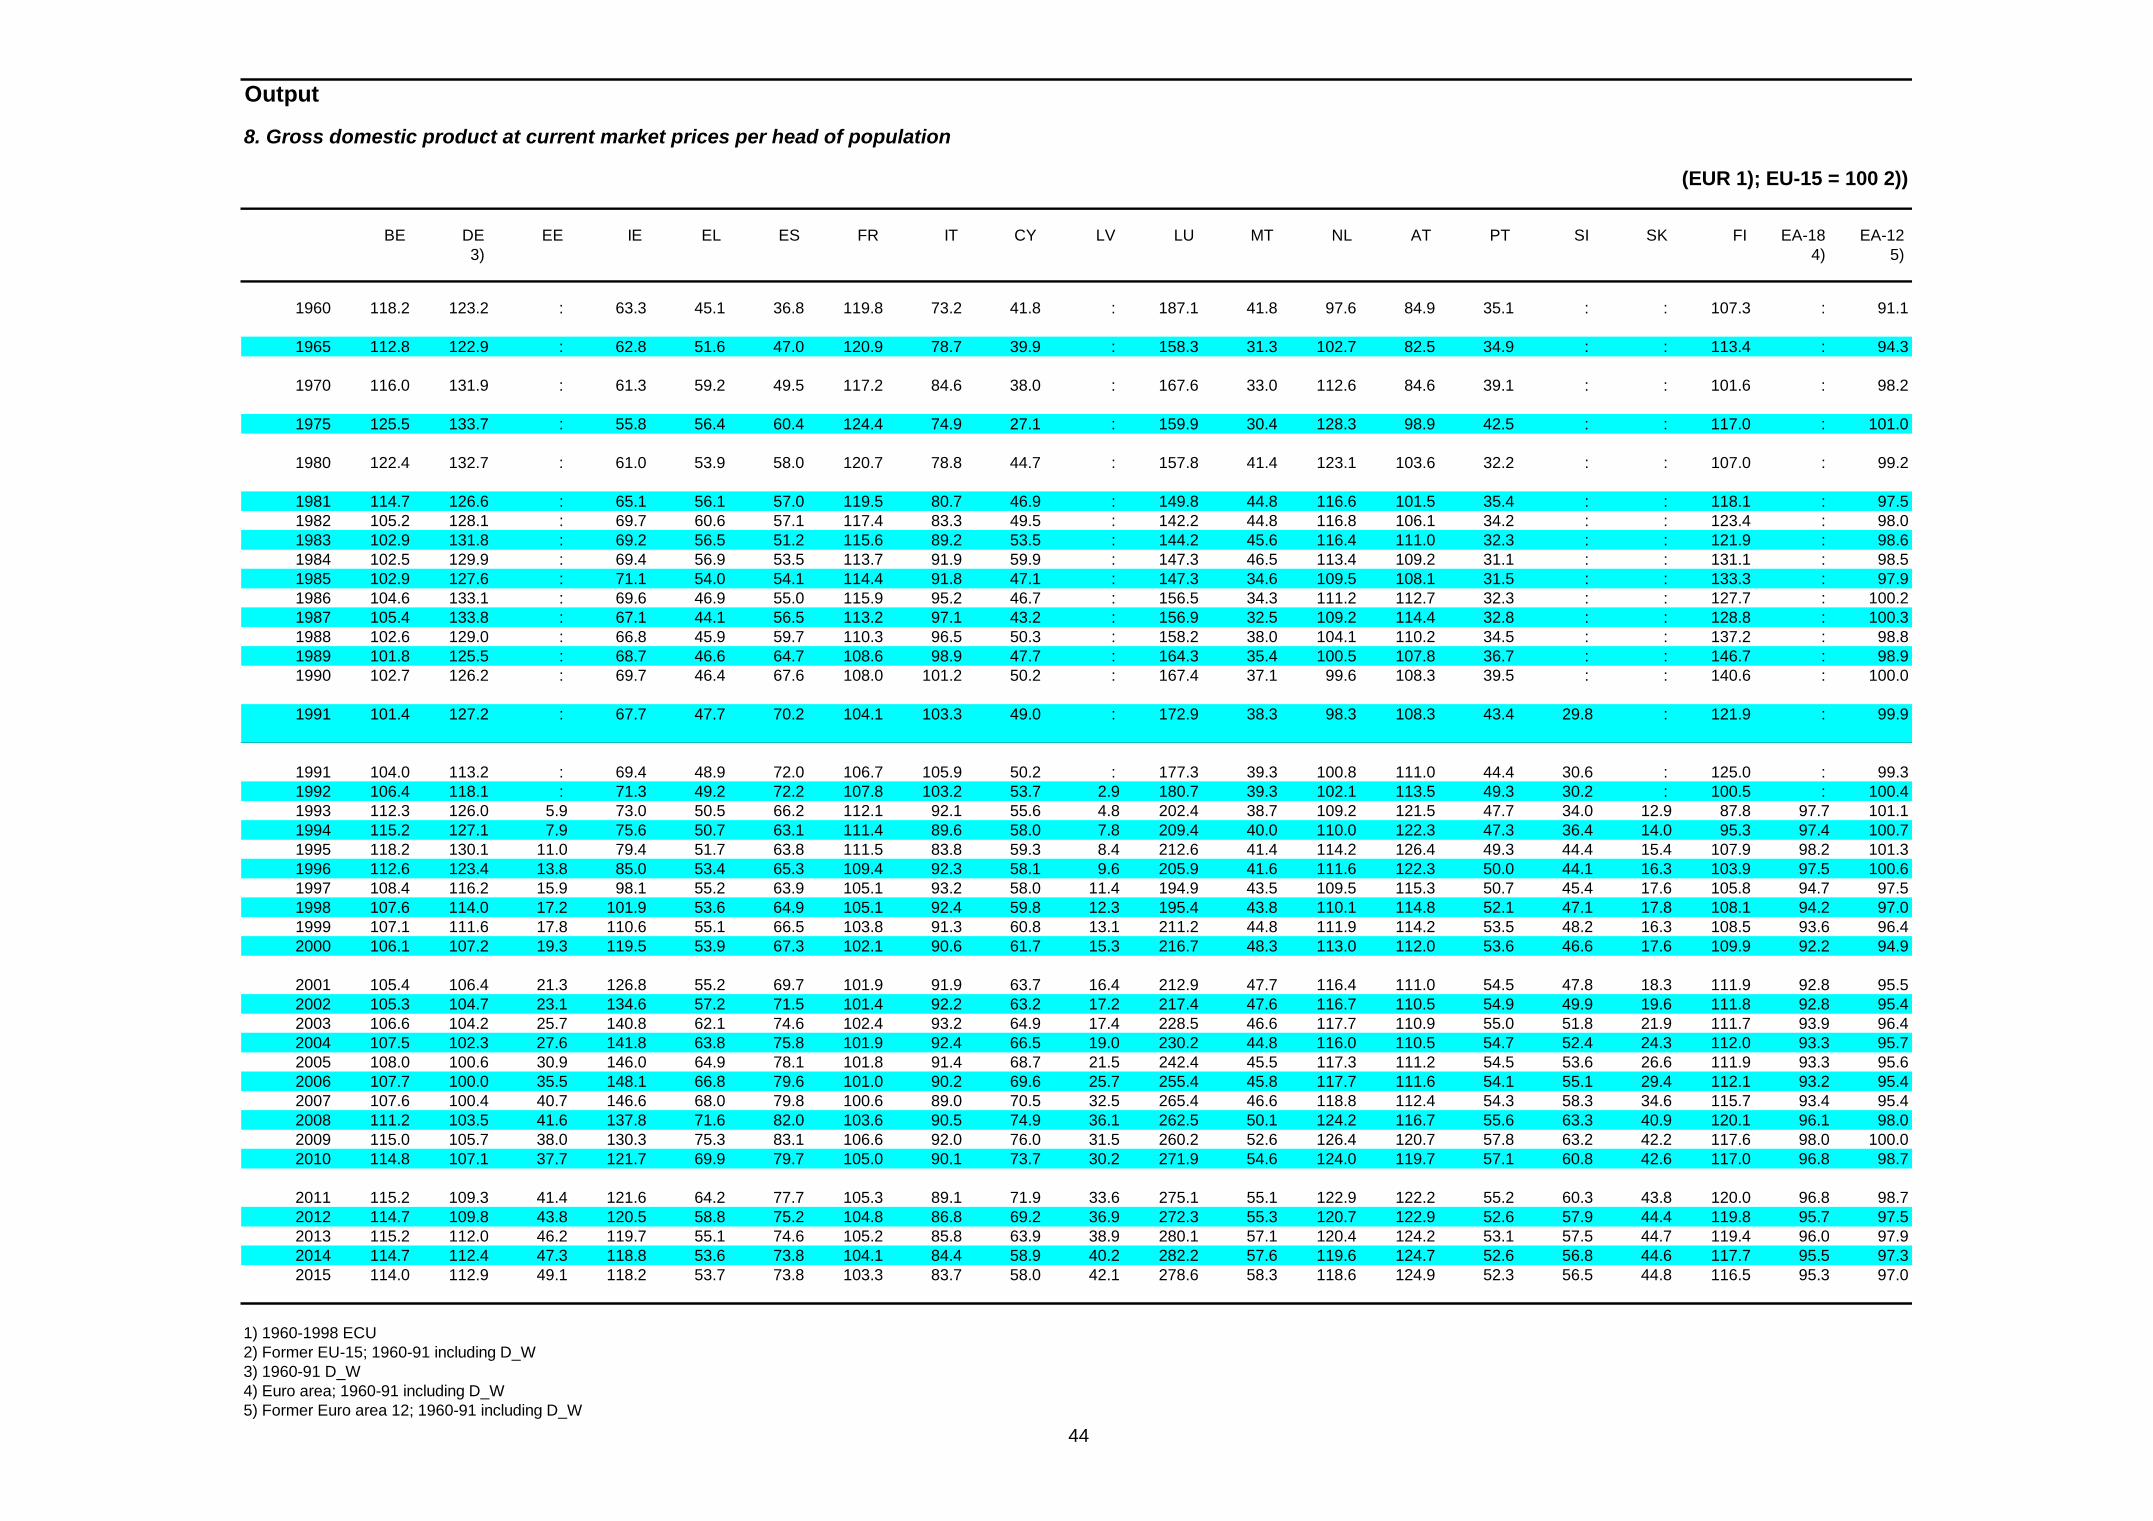
44
Output
8. Gross domestic product at current market prices per head of population
(EUR 1); EU-15 = 100 2))
BE DE EE IE EL ES FR IT CY LV LU MT NL AT PT SI SK FI EA-18 EA-12 3) 4) 5)
1960 118.2 123.2 : 63.3 45.1 36.8 119.8 73.2 41.8 : 187.1 41.8 97.6 84.9 35.1 : : 107.3 : 91.1
1965 112.8 122.9 : 62.8 51.6 47.0 120.9 78.7 39.9 : 158.3 31.3 102.7 82.5 34.9 : : 113.4 : 94.3
1970 116.0 131.9 : 61.3 59.2 49.5 117.2 84.6 38.0 : 167.6 33.0 112.6 84.6 39.1 : : 101.6 : 98.2
1975 125.5 133.7 : 55.8 56.4 60.4 124.4 74.9 27.1 : 159.9 30.4 128.3 98.9 42.5 : : 117.0 : 101.0
1980 122.4 132.7 : 61.0 53.9 58.0 120.7 78.8 44.7 : 157.8 41.4 123.1 103.6 32.2 : : 107.0 : 99.2
1981 114.7 126.6 : 65.1 56.1 57.0 119.5 80.7 46.9 : 149.8 44.8 116.6 101.5 35.4 : : 118.1 : 97.51982 105.2 128.1 : 69.7 60.6 57.1 117.4 83.3 49.5 : 142.2 44.8 116.8 106.1 34.2 : : 123.4 : 98.01983 102.9 131.8 : 69.2 56.5 51.2 115.6 89.2 53.5 : 144.2 45.6 116.4 111.0 32.3 : : 121.9 : 98.61984 102.5 129.9 : 69.4 56.9 53.5 113.7 91.9 59.9 : 147.3 46.5 113.4 109.2 31.1 : : 131.1 : 98.51985 102.9 127.6 : 71.1 54.0 54.1 114.4 91.8 47.1 : 147.3 34.6 109.5 108.1 31.5 : : 133.3 : 97.91986 104.6 133.1 : 69.6 46.9 55.0 115.9 95.2 46.7 : 156.5 34.3 111.2 112.7 32.3 : : 127.7 : 100.21987 105.4 133.8 : 67.1 44.1 56.5 113.2 97.1 43.2 : 156.9 32.5 109.2 114.4 32.8 : : 128.8 : 100.31988 102.6 129.0 : 66.8 45.9 59.7 110.3 96.5 50.3 : 158.2 38.0 104.1 110.2 34.5 : : 137.2 : 98.81989 101.8 125.5 : 68.7 46.6 64.7 108.6 98.9 47.7 : 164.3 35.4 100.5 107.8 36.7 : : 146.7 : 98.91990 102.7 126.2 : 69.7 46.4 67.6 108.0 101.2 50.2 : 167.4 37.1 99.6 108.3 39.5 : : 140.6 : 100.0
1991 101.4 127.2 : 67.7 47.7 70.2 104.1 103.3 49.0 : 172.9 38.3 98.3 108.3 43.4 29.8 : 121.9 : 99.9
1991 104.0 113.2 : 69.4 48.9 72.0 106.7 105.9 50.2 : 177.3 39.3 100.8 111.0 44.4 30.6 : 125.0 : 99.31992 106.4 118.1 : 71.3 49.2 72.2 107.8 103.2 53.7 2.9 180.7 39.3 102.1 113.5 49.3 30.2 : 100.5 : 100.41993 112.3 126.0 5.9 73.0 50.5 66.2 112.1 92.1 55.6 4.8 202.4 38.7 109.2 121.5 47.7 34.0 12.9 87.8 97.7 101.11994 115.2 127.1 7.9 75.6 50.7 63.1 111.4 89.6 58.0 7.8 209.4 40.0 110.0 122.3 47.3 36.4 14.0 95.3 97.4 100.71995 118.2 130.1 11.0 79.4 51.7 63.8 111.5 83.8 59.3 8.4 212.6 41.4 114.2 126.4 49.3 44.4 15.4 107.9 98.2 101.31996 112.6 123.4 13.8 85.0 53.4 65.3 109.4 92.3 58.1 9.6 205.9 41.6 111.6 122.3 50.0 44.1 16.3 103.9 97.5 100.61997 108.4 116.2 15.9 98.1 55.2 63.9 105.1 93.2 58.0 11.4 194.9 43.5 109.5 115.3 50.7 45.4 17.6 105.8 94.7 97.51998 107.6 114.0 17.2 101.9 53.6 64.9 105.1 92.4 59.8 12.3 195.4 43.8 110.1 114.8 52.1 47.1 17.8 108.1 94.2 97.01999 107.1 111.6 17.8 110.6 55.1 66.5 103.8 91.3 60.8 13.1 211.2 44.8 111.9 114.2 53.5 48.2 16.3 108.5 93.6 96.42000 106.1 107.2 19.3 119.5 53.9 67.3 102.1 90.6 61.7 15.3 216.7 48.3 113.0 112.0 53.6 46.6 17.6 109.9 92.2 94.9
2001 105.4 106.4 21.3 126.8 55.2 69.7 101.9 91.9 63.7 16.4 212.9 47.7 116.4 111.0 54.5 47.8 18.3 111.9 92.8 95.52002 105.3 104.7 23.1 134.6 57.2 71.5 101.4 92.2 63.2 17.2 217.4 47.6 116.7 110.5 54.9 49.9 19.6 111.8 92.8 95.42003 106.6 104.2 25.7 140.8 62.1 74.6 102.4 93.2 64.9 17.4 228.5 46.6 117.7 110.9 55.0 51.8 21.9 111.7 93.9 96.42004 107.5 102.3 27.6 141.8 63.8 75.8 101.9 92.4 66.5 19.0 230.2 44.8 116.0 110.5 54.7 52.4 24.3 112.0 93.3 95.72005 108.0 100.6 30.9 146.0 64.9 78.1 101.8 91.4 68.7 21.5 242.4 45.5 117.3 111.2 54.5 53.6 26.6 111.9 93.3 95.62006 107.7 100.0 35.5 148.1 66.8 79.6 101.0 90.2 69.6 25.7 255.4 45.8 117.7 111.6 54.1 55.1 29.4 112.1 93.2 95.42007 107.6 100.4 40.7 146.6 68.0 79.8 100.6 89.0 70.5 32.5 265.4 46.6 118.8 112.4 54.3 58.3 34.6 115.7 93.4 95.42008 111.2 103.5 41.6 137.8 71.6 82.0 103.6 90.5 74.9 36.1 262.5 50.1 124.2 116.7 55.6 63.3 40.9 120.1 96.1 98.02009 115.0 105.7 38.0 130.3 75.3 83.1 106.6 92.0 76.0 31.5 260.2 52.6 126.4 120.7 57.8 63.2 42.2 117.6 98.0 100.02010 114.8 107.1 37.7 121.7 69.9 79.7 105.0 90.1 73.7 30.2 271.9 54.6 124.0 119.7 57.1 60.8 42.6 117.0 96.8 98.7
2011 115.2 109.3 41.4 121.6 64.2 77.7 105.3 89.1 71.9 33.6 275.1 55.1 122.9 122.2 55.2 60.3 43.8 120.0 96.8 98.72012 114.7 109.8 43.8 120.5 58.8 75.2 104.8 86.8 69.2 36.9 272.3 55.3 120.7 122.9 52.6 57.9 44.4 119.8 95.7 97.52013 115.2 112.0 46.2 119.7 55.1 74.6 105.2 85.8 63.9 38.9 280.1 57.1 120.4 124.2 53.1 57.5 44.7 119.4 96.0 97.92014 114.7 112.4 47.3 118.8 53.6 73.8 104.1 84.4 58.9 40.2 282.2 57.6 119.6 124.7 52.6 56.8 44.6 117.7 95.5 97.32015 114.0 112.9 49.1 118.2 53.7 73.8 103.3 83.7 58.0 42.1 278.6 58.3 118.6 124.9 52.3 56.5 44.8 116.5 95.3 97.0
1) 1960-1998 ECU 2) Former EU-15; 1960-91 including D_W 3) 1960-91 D_W 4) Euro area; 1960-91 including D_W 5) Former Euro area 12; 1960-91 including D_W

45
Output
8. Gross domestic product at current market prices per head of population
(EUR 1); EU-15 = 100 2))
BG CZ DK HR LT HU PL RO SE UK EU-28 EU-15 MK IS TR ME RS US JP 3) 2)
1960 : : 123.4 : : : : : 179.3 126.5 : 100.0 : 133.9 60.4 : : 272.2 44.3
1965 : : 134.4 : : : : : 180.1 111.6 : 100.0 : 162.5 31.1 : : 229.8 57.3
1970 : : 139.5 : : : : : 182.4 93.0 : 100.0 : 105.6 29.0 : : 217.8 83.7
1975 : : 147.6 : : : : : 177.3 79.6 : 100.0 : 120.0 29.5 : : 147.4 88.2
1980 : : 131.0 : : 21.6 15.8 16.7 156.0 92.9 : 100.0 : 140.7 21.3 : : 120.7 89.4
1981 : : 128.8 : : 24.3 8.8 22.1 161.5 100.4 : 100.0 : 163.0 23.5 : : 152.0 111.31982 : : 131.1 : : 25.4 18.1 26.4 148.6 99.7 : 100.0 : 154.7 21.4 : : 163.9 107.31983 : : 136.2 : : 23.6 24.9 26.6 140.6 97.6 : 100.0 : 135.9 21.9 : : 182.4 119.81984 : : 138.5 : : 23.8 25.7 24.5 152.4 96.0 : 100.0 : 144.9 22.4 : : 209.1 131.91985 : : 142.4 : : 40.0 39.7 45.2 154.0 98.2 : 100.0 : 143.9 18.2 : : 215.0 136.11986 : : 146.7 : : 20.4 18.1 21.5 148.1 87.6 : 100.0 : 140.2 15.8 : : 165.3 146.81987 : : 147.7 : : 13.3 9.2 14.1 145.8 87.4 : 100.0 : 155.8 14.0 : : 141.2 143.41988 : : 139.8 : : 12.4 8.4 12.5 147.4 95.3 : 100.0 : 152.7 14.6 : : 135.6 155.51989 : : 133.7 : : 14.6 11.4 12.6 151.8 94.5 : 100.0 : 137.7 15.2 : : 142.5 152.61990 7.4 16.1 133.4 : : 10.1 5.3 5.4 146.4 90.2 : 100.0 : 126.2 18.5 : : 120.3 126.9
1991 2.8 14.3 129.6 : : 10.4 6.9 4.2 147.3 90.6 : 100.0 : 128.7 17.7 : : 118.6 139.2
1991 2.9 14.7 132.9 : : 10.7 7.1 4.3 151.0 92.9 : 100.0 : 131.9 18.1 : : 121.6 142.71992 2.7 14.8 133.9 : 2.7 10.0 6.6 2.5 143.5 88.5 : 100.0 : 122.8 17.2 : : 116.9 142.41993 6.5 19.4 138.1 11.3 3.9 19.4 12.5 6.3 118.0 88.1 79.8 100.0 : 118.3 21.3 : : 134.7 180.51994 5.5 21.4 142.1 15.2 5.9 19.7 13.6 6.7 119.2 89.8 80.1 100.0 8.4 113.8 14.2 : : 133.2 186.71995 6.5 23.6 146.5 20.1 7.8 18.6 15.3 7.0 121.0 85.7 80.5 100.0 9.6 110.4 16.1 : : 121.0 178.91996 4.4 26.1 145.3 21.2 9.7 18.5 17.0 6.8 129.6 88.5 80.7 100.0 9.2 112.7 16.7 : : 124.5 155.01997 5.4 25.5 142.5 22.9 12.5 20.0 18.1 7.0 126.5 104.9 81.0 100.0 8.2 121.0 18.3 : : 139.3 151.51998 6.8 26.7 140.6 23.8 13.6 20.0 19.3 7.9 123.3 108.4 81.3 100.0 7.7 129.6 18.4 : : 141.1 133.01999 6.9 26.0 140.5 22.0 13.4 20.3 18.9 6.9 125.6 111.2 81.2 100.0 7.8 135.4 16.9 : 10.1 148.8 150.52000 7.4 26.7 140.0 22.5 15.3 21.2 20.9 7.8 130.2 118.4 81.6 100.0 8.3 144.2 19.4 7.5 3.8 169.8 173.8
2001 8.2 29.3 139.5 24.1 16.4 24.1 23.1 8.4 118.9 117.0 82.1 100.0 7.9 129.2 13.9 8.8 7.1 173.4 152.42002 8.8 33.1 139.1 25.7 17.8 28.1 22.2 9.1 121.0 117.4 82.5 100.0 8.0 133.4 14.9 8.9 8.7 163.3 134.32003 9.4 33.1 140.0 27.3 19.4 29.2 20.1 9.8 124.6 111.5 82.6 100.0 8.3 134.4 16.1 9.7 9.2 140.2 119.52004 10.1 34.6 140.2 28.6 20.8 31.2 20.6 10.9 124.7 114.8 83.0 100.0 8.4 140.3 17.9 10.3 9.8 129.4 112.82005 11.2 38.1 142.7 30.2 23.5 32.8 23.9 14.0 123.2 115.6 83.7 100.0 8.8 165.3 21.0 10.9 10.2 132.6 107.52006 12.2 41.0 143.3 31.9 26.3 31.7 25.4 16.4 124.8 116.4 84.1 100.0 9.1 155.8 21.5 12.3 11.2 131.5 96.72007 13.7 43.5 141.8 33.2 30.3 33.6 27.8 20.3 125.7 116.4 84.9 100.0 9.9 163.1 22.9 14.6 13.1 119.1 84.72008 16.0 50.8 147.1 36.8 34.8 36.1 32.7 23.4 124.2 102.8 85.9 100.0 11.2 110.7 24.1 16.9 15.3 112.9 88.52009 16.8 49.4 147.5 36.8 30.7 33.2 29.7 21.1 114.6 93.8 85.5 100.0 11.9 99.0 22.3 17.4 14.4 122.6 103.32010 16.8 50.1 149.6 35.3 31.4 33.8 32.3 21.6 131.0 97.7 85.8 100.0 12.1 104.7 26.5 17.6 13.5 127.9 113.8
2011 17.9 50.7 147.9 34.8 35.0 34.0 33.0 22.3 139.7 96.7 86.1 100.0 12.4 108.3 25.7 17.8 14.9 122.5 113.82012 18.4 49.1 148.0 34.5 37.2 33.0 33.4 22.1 144.5 101.7 86.1 100.0 12.2 111.2 27.6 17.1 13.9 135.7 122.32013 18.4 47.7 149.0 34.1 39.3 33.3 34.0 23.8 146.9 99.5 86.3 100.0 12.5 113.9 27.3 18.1 15.4 134.2 97.32014 18.5 45.4 148.6 33.1 40.4 32.8 34.6 24.2 142.0 103.2 86.4 100.0 12.5 119.2 24.8 18.3 15.6 130.6 89.92015 18.8 45.9 148.6 32.8 41.6 33.4 35.4 24.9 142.6 104.3 86.5 100.0 12.6 121.7 26.8 18.8 16.2 132.1 89.4
1) 1960-1998 ECU 2) Former EU-15; 1960-91 including D_W 3) 1960-91 including D_W

46
Output
9. Gross domestic product at current market prices per head of population
(PPS; EU-15 = 100 1))
BE DE EE IE EL ES FR IT CY LV LU MT NL AT PT SI SK FI EA-18 EA-12 2) 3) 4)
1960 103.1 131.6 : 66.5 56.6 61.8 94.5 86.2 : : 163.6 : 115.8 103.6 42.2 : : 86.4 : 95.2
1965 104.5 129.1 : 64.5 69.6 72.0 96.2 87.8 : : 152.6 : 112.3 100.8 47.0 : : 87.3 : 97.2
1970 106.1 124.8 : 64.8 81.4 75.7 99.3 94.2 : : 144.4 : 113.0 104.2 50.8 : : 89.4 : 99.5
1975 109.3 121.2 : 67.1 88.8 81.8 102.0 93.8 : : 143.3 : 111.5 109.2 53.2 : : 96.5 : 100.4
1980 111.0 125.5 : 68.3 89.3 74.1 103.0 100.2 : : 140.5 : 107.0 112.7 55.9 : : 97.2 : 101.6
1981 110.9 126.1 : 69.8 87.3 73.5 103.6 101.0 : : 139.6 : 105.5 112.4 56.7 : : 98.2 : 101.91982 110.7 124.8 : 70.1 85.1 73.5 104.7 100.6 : : 140.1 : 103.0 113.7 57.2 : : 99.8 : 101.51983 109.3 125.2 : 68.3 82.4 73.2 103.7 100.1 : : 141.8 : 103.0 115.4 56.6 : : 100.6 : 101.11984 109.4 126.3 : 69.2 81.7 72.5 102.4 101.0 : : 146.9 : 103.4 112.9 54.5 : : 100.8 : 100.91985 108.7 126.6 : 69.5 81.5 72.3 101.2 101.4 : : 147.7 : 103.2 113.0 54.0 : : 101.4 : 100.71986 107.9 126.2 : 68.0 79.6 72.6 100.4 101.7 : : 157.7 : 102.8 112.7 54.3 : : 101.2 : 100.51987 107.5 124.6 : 69.3 75.6 74.4 99.6 102.3 : : 158.7 : 101.5 111.2 57.0 : : 101.7 : 100.21988 107.9 123.6 : 69.8 75.6 75.1 99.8 102.5 : : 164.2 : 100.4 110.4 57.8 : : 102.7 : 100.21989 107.8 123.2 : 72.2 75.6 76.1 100.1 102.6 : : 172.9 : 100.9 110.6 59.8 : : 104.1 : 100.51990 108.2 124.2 : 76.0 73.3 77.0 99.8 102.1 67.9 49.3 175.9 : 102.0 111.8 63.2 68.4 : 101.8 : 100.9
1991 108.3 127.2 : 76.0 73.9 77.8 99.0 102.2 65.8 42.7 186.0 66.5 102.2 113.0 64.6 61.4 : 93.9 : 101.6
1991 111.1 113.2 : 77.9 75.8 79.7 101.5 104.8 67.4 43.8 190.7 68.2 104.8 115.8 66.2 63.0 : 96.2 : 101.01992 111.3 113.5 : 79.3 74.8 79.5 101.6 104.7 71.4 29.9 189.9 70.1 104.9 116.0 67.7 59.2 35.8 91.6 : 101.01993 110.4 112.2 30.2 81.5 73.3 78.9 101.0 104.3 70.6 27.1 196.1 72.9 106.0 116.2 67.5 61.3 38.4 90.9 98.0 100.41994 110.8 111.7 29.6 83.9 72.3 78.5 100.3 103.9 71.3 27.5 195.6 74.4 105.8 115.6 66.6 63.0 39.6 91.4 97.7 99.91995 110.7 110.7 30.9 89.2 71.6 78.7 99.7 104.4 75.3 27.0 191.3 76.6 106.1 115.8 66.4 64.1 40.9 92.6 97.5 99.71996 108.4 109.5 32.7 93.4 71.4 79.3 98.9 104.1 74.4 27.8 191.0 70.9 107.6 115.8 66.6 65.6 42.9 91.5 97.1 99.31997 108.5 107.0 36.2 99.1 72.3 80.4 98.7 103.2 73.3 29.9 185.6 72.0 109.5 113.8 67.8 67.5 44.3 95.2 96.8 98.81998 106.3 105.4 36.7 104.6 71.3 82.3 99.2 104.0 74.2 31.6 188.3 71.7 111.0 114.3 68.5 68.4 45.0 98.3 97.0 99.01999 106.6 105.0 36.8 109.1 70.9 83.3 99.2 102.3 75.1 31.3 205.8 72.5 113.2 114.2 70.4 70.2 43.7 99.2 96.9 98.92000 109.4 101.9 39.0 114.1 72.1 84.3 99.8 101.8 75.9 31.6 211.8 75.1 116.3 114.3 70.4 69.4 43.4 101.5 96.7 98.6
2001 107.6 100.8 40.3 115.5 74.5 85.2 100.4 102.9 78.4 33.5 203.2 70.7 116.2 109.5 69.8 69.6 45.5 100.1 96.8 98.62002 109.7 100.2 43.7 120.9 78.1 87.8 101.0 98.3 77.5 36.1 209.7 72.1 116.6 111.2 69.9 72.1 47.3 100.5 96.6 98.42003 108.5 101.6 47.9 124.3 80.6 88.7 97.8 97.7 77.7 38.5 217.1 72.2 113.6 112.2 69.7 73.5 48.7 98.9 96.4 98.12004 107.1 102.0 50.7 125.9 82.0 89.2 96.8 94.6 80.2 41.1 222.8 70.4 114.0 112.9 68.2 76.5 50.3 102.6 96.0 97.52005 106.1 102.6 54.5 127.8 80.3 90.3 97.4 93.2 82.2 43.9 224.8 71.0 115.7 110.9 70.4 77.4 53.3 101.2 96.3 97.72006 104.7 102.6 58.5 129.2 82.0 93.0 96.1 92.9 82.8 47.1 239.8 69.9 116.4 111.9 70.2 77.8 56.2 101.3 96.5 97.92007 103.7 103.4 62.8 130.8 80.9 93.7 96.4 93.2 84.4 51.4 245.5 70.2 118.4 110.8 70.4 79.2 60.7 105.2 97.2 98.42008 104.3 104.5 62.1 118.6 83.7 93.3 96.2 94.0 89.6 52.7 237.4 73.2 120.9 112.2 70.2 81.8 65.4 107.2 97.7 98.92009 106.7 103.9 57.6 116.2 85.9 93.2 98.5 93.9 90.5 48.8 228.3 76.5 119.6 113.8 72.6 78.1 65.8 103.6 98.1 99.32010 109.5 108.6 58.0 116.6 80.5 89.7 98.9 93.2 87.8 50.1 238.0 79.1 117.9 114.9 72.9 76.5 67.4 103.7 98.6 99.8
2011 109.5 112.0 63.1 117.3 73.9 87.8 99.4 92.5 85.3 54.6 242.2 78.7 117.9 117.4 70.1 76.9 68.6 105.5 99.0 100.12012 110.0 112.9 65.3 118.0 70.0 87.7 99.5 92.0 83.8 58.8 240.9 78.9 116.8 118.9 69.5 76.7 69.6 105.5 99.1 100.22013 110.1 113.6 66.1 117.7 67.5 87.1 99.6 90.4 79.2 62.0 240.7 80.4 115.9 119.2 69.4 76.0 70.5 103.9 98.8 99.82014 109.8 114.1 66.9 117.5 67.2 87.3 98.9 89.5 73.8 64.1 239.8 80.9 115.6 119.4 69.5 75.6 71.0 102.5 98.6 99.72015 109.2 114.4 68.1 117.4 68.0 88.0 98.4 88.9 72.6 66.2 238.4 81.0 115.0 119.4 69.5 75.3 71.8 101.5 98.6 99.6
1) Former EU-15; 1960-91 including D_W 2) 1960-91 D_W 3) Euro area; 1960-91 including D_W 4) Former Euro area 12; 1960-91 including D_W

47
Output
9. Gross domestic product at current market prices per head of population
(PPS; EU-15 = 100 1))
BG CZ DK HR LT HU PL RO SE UK EU-28 EU-15 MK IS TR ME RS US JP 2) 1)
1960 : : 117.5 : : : : : 128.7 115.9 : 100.0 : 111.5 37.8 : : 160.1 55.4
1965 : : 119.8 : : : : : 131.4 106.5 : 100.0 : 117.8 34.5 : : 156.0 67.0
1970 : : 116.9 : : : : : 126.8 96.9 : 100.0 : 102.4 34.3 : : 143.5 88.2
1975 : : 109.3 : : : : : 124.2 93.7 : 100.0 : 114.8 35.2 : : 136.4 89.3
1980 : : 108.0 : : : : : 115.4 89.2 : 100.0 : 130.0 31.2 : : 135.5 92.5
1981 : : 107.2 : : : : : 115.2 88.2 : 100.0 : 134.2 32.0 : : 137.8 95.81982 : : 110.4 : : : : : 115.6 89.6 : 100.0 : 134.2 32.0 : : 132.9 97.61983 : : 111.7 : : : : : 115.9 91.4 : 100.0 : 127.5 32.3 : : 135.6 98.41984 : : 113.7 : : : : : 117.9 91.5 : 100.0 : 128.4 32.8 : : 140.9 99.81985 : : 115.6 : : : : : 117.6 92.4 : 100.0 : 128.6 32.6 : : 142.2 103.01986 : : 118.1 : : : : : 117.4 93.6 : 100.0 : 132.3 33.3 : : 142.3 102.81987 : : 115.3 : : : : : 117.9 95.1 : 100.0 : 138.4 34.9 : : 142.1 103.71988 : : 110.7 : : : : : 115.8 96.0 : 100.0 : 131.0 33.7 : : 141.3 106.51989 : : 107.8 : : : : : 114.4 94.8 : 100.0 : 125.7 32.2 : : 140.5 108.31990 : 71.1 106.8 : 54 : 34.6 31.9 111.7 93.0 : 100.0 33 123.2 33.8 : : 138.3 111.3
1991 28.5 62.3 106.6 : 50 44.5 31.7 27.6 108.2 90.2 : 100.0 30 119.8 33.1 : : 134.6 113.1
1991 29.2 63.9 109.3 : 51 45.6 32.5 28.3 110.9 92.5 : 100.0 31 122.8 33.9 : : 138.0 115.91992 27.2 63.0 110.0 : 40.1 44.3 33.0 25.8 108.1 92.6 : 100.0 27 116.3 35.0 : : 139.8 115.51993 27.1 63.3 110.1 : 33.9 44.3 34.3 26.4 105.8 96.2 : 100.0 25 117.2 37.4 : : 142.5 116.01994 27.0 63.4 112.9 : 30.0 44.5 35.2 26.8 106.5 98.1 : 100.0 24.7 117.4 34.0 : : 142.8 113.81995 27.3 65.9 113.2 39.7 30.6 44.2 36.8 28.1 107.6 99.0 85.9 100.0 23.6 114.3 35.0 : : 141.7 112.91996 22.0 67.8 114.3 42.2 31.7 44.1 38.5 28.4 107.6 101.3 86.1 100.0 23.3 114.8 36.4 : : 142.7 113.51997 22.1 65.4 114.8 44.0 33.3 45.1 40.3 25.3 106.8 103.8 86.2 100.0 22.9 118.6 37.7 : : 143.4 112.01998 23.8 62.8 113.9 43.7 34.9 46.3 41.2 23.1 106.4 103.1 86.3 100.0 22.9 121.3 37.3 : : 143.4 106.11999 23.8 62.1 113.1 42.3 33.7 46.5 42.0 22.7 109.2 103.0 86.3 100.0 23.2 120.3 34.3 : : 145.4 103.42000 24.6 61.5 114.0 42.8 34.3 47.0 41.8 22.6 110.5 104.2 86.4 100.0 23.3 114.0 36.3 25.7 : 143.9 102.4
2001 25.8 63.5 111.1 44.0 36.3 50.5 41.3 24.2 106.5 105.1 86.7 100.0 21.8 114.9 32.5 25.5 23.7 140.4 100.02002 27.7 64.2 112.2 45.8 39.1 53.5 42.2 25.8 106.9 106.0 87.2 100.0 22.1 113.4 31.6 25.7 24.5 139.2 99.42003 29.5 67.2 109.0 48.0 43.8 55.0 42.9 27.7 109.0 107.8 87.7 100.0 23.1 110.3 31.5 26.1 25.0 141.8 100.12004 30.5 69.0 110.9 49.6 45.5 55.6 44.7 30.4 111.6 110.1 88.1 100.0 24.1 115.9 34.9 26.7 27.0 143.9 101.02005 32.4 70.1 109.4 50.5 48.3 55.9 45.4 31.4 107.8 109.8 88.5 100.0 26.0 115.3 37.6 27.3 28.1 145.8 100.32006 33.9 71.1 110.2 51.4 51.2 55.9 46.1 34.7 109.2 108.7 88.9 100.0 26.9 109.5 39.4 31.7 28.9 141.7 97.22007 35.9 74.0 109.7 54.3 55.5 55.0 48.7 38.3 111.9 105.5 89.5 100.0 27.6 108.1 40.4 35.7 29.4 139.7 97.22008 39.2 72.8 112.2 56.9 58.1 57.5 50.7 44.2 111.5 103.0 90.2 100.0 30.3 111.2 42.3 38.5 32.5 136.1 94.62009 39.7 74.8 111.6 55.9 52.5 59.1 54.8 45.0 108.6 101.4 90.6 100.0 32.6 108.9 42.0 37.8 32.3 135.6 92.52010 40.1 73.2 116.0 53.1 56.3 59.9 57.3 46.1 112.1 97.9 90.9 100.0 33.0 103.8 45.4 37.9 31.4 136.9 95.7
2011 42.4 73.9 114.3 54.4 61.5 61.2 59.4 46.8 114.1 95.9 91.3 100.0 32.7 104.4 48.6 38.6 32.5 136.0 93.82012 43.5 74.1 115.3 56.2 65.6 61.0 61.4 48.5 115.5 95.5 91.6 100.0 32.4 105.4 49.4 37.1 32.4 139.2 95.62013 44.2 73.7 115.7 55.9 68.7 62.0 62.6 50.6 116.7 96.9 91.9 100.0 33.5 108.2 51.0 38.6 34.6 141.4 97.62014 44.8 74.3 115.7 55.0 70.7 62.8 64.0 51.4 117.5 97.7 92.1 100.0 34.1 109.6 51.1 39.2 34.8 142.7 98.12015 45.3 74.8 115.7 54.6 72.2 63.3 65.2 52.0 118.2 98.0 92.3 100.0 34.5 111.1 51.4 40.1 35.1 144.0 97.9
1) Former EU-15; 1960-91 including D_W 2) 1960-91 including D_W
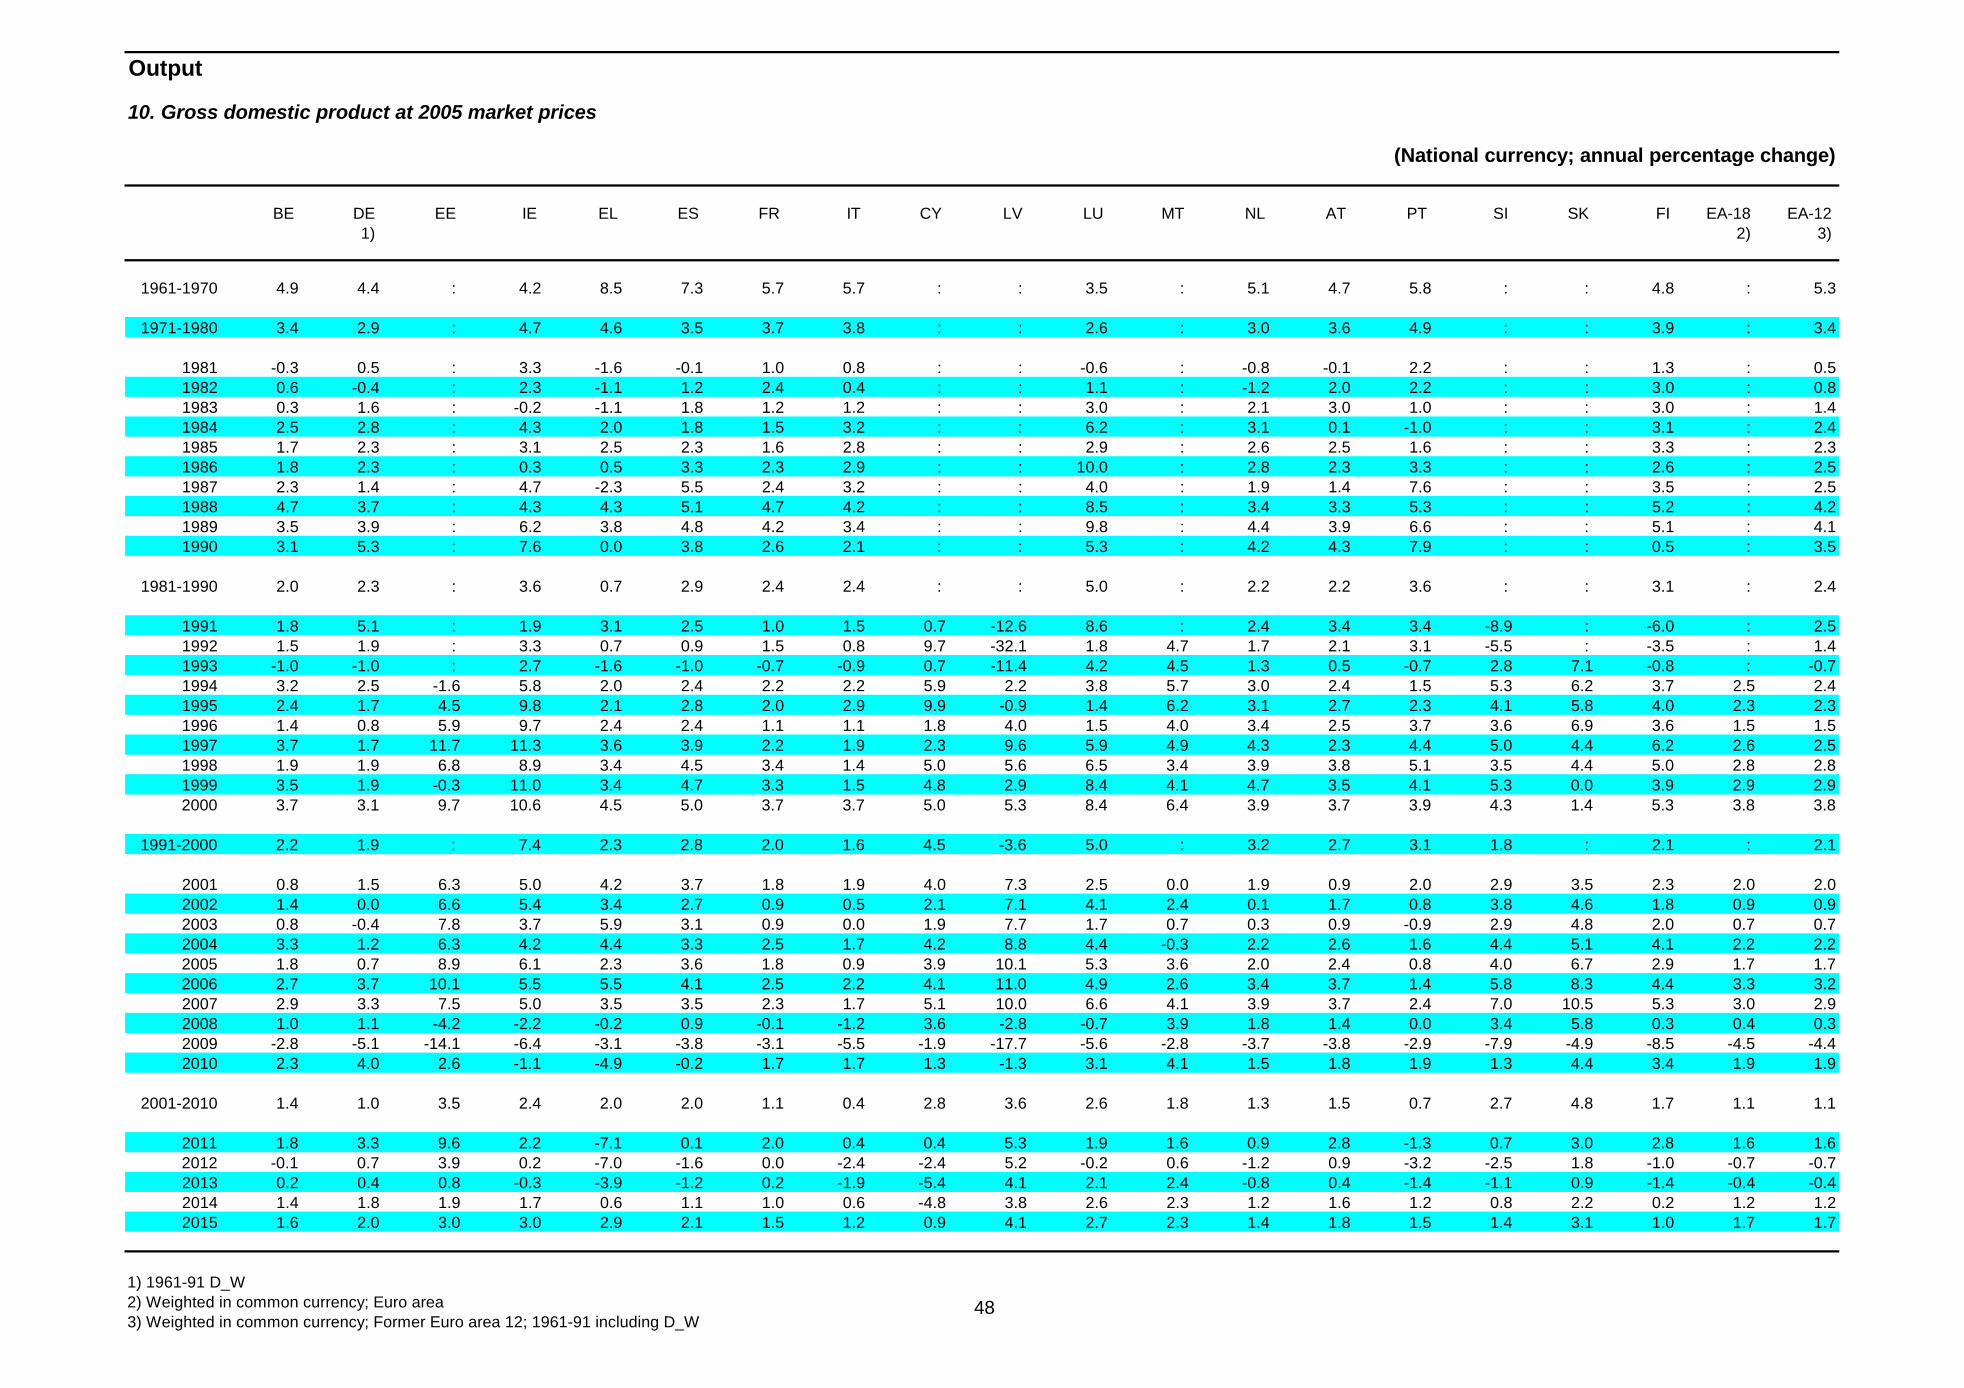
48
Output
10. Gross domestic product at 2005 market prices
(National currency; annual percentage change)
BE DE EE IE EL ES FR IT CY LV LU MT NL AT PT SI SK FI EA-18 EA-12 1) 2) 3)
1961-1970 4.9 4.4 : 4.2 8.5 7.3 5.7 5.7 : : 3.5 : 5.1 4.7 5.8 : : 4.8 : 5.3
1971-1980 3.4 2.9 : 4.7 4.6 3.5 3.7 3.8 : : 2.6 : 3.0 3.6 4.9 : : 3.9 : 3.4
1981 -0.3 0.5 : 3.3 -1.6 -0.1 1.0 0.8 : : -0.6 : -0.8 -0.1 2.2 : : 1.3 : 0.51982 0.6 -0.4 : 2.3 -1.1 1.2 2.4 0.4 : : 1.1 : -1.2 2.0 2.2 : : 3.0 : 0.81983 0.3 1.6 : -0.2 -1.1 1.8 1.2 1.2 : : 3.0 : 2.1 3.0 1.0 : : 3.0 : 1.41984 2.5 2.8 : 4.3 2.0 1.8 1.5 3.2 : : 6.2 : 3.1 0.1 -1.0 : : 3.1 : 2.41985 1.7 2.3 : 3.1 2.5 2.3 1.6 2.8 : : 2.9 : 2.6 2.5 1.6 : : 3.3 : 2.31986 1.8 2.3 : 0.3 0.5 3.3 2.3 2.9 : : 10.0 : 2.8 2.3 3.3 : : 2.6 : 2.51987 2.3 1.4 : 4.7 -2.3 5.5 2.4 3.2 : : 4.0 : 1.9 1.4 7.6 : : 3.5 : 2.51988 4.7 3.7 : 4.3 4.3 5.1 4.7 4.2 : : 8.5 : 3.4 3.3 5.3 : : 5.2 : 4.21989 3.5 3.9 : 6.2 3.8 4.8 4.2 3.4 : : 9.8 : 4.4 3.9 6.6 : : 5.1 : 4.11990 3.1 5.3 : 7.6 0.0 3.8 2.6 2.1 : : 5.3 : 4.2 4.3 7.9 : : 0.5 : 3.5
1981-1990 2.0 2.3 : 3.6 0.7 2.9 2.4 2.4 : : 5.0 : 2.2 2.2 3.6 : : 3.1 : 2.4
1991 1.8 5.1 : 1.9 3.1 2.5 1.0 1.5 0.7 -12.6 8.6 : 2.4 3.4 3.4 -8.9 : -6.0 : 2.51992 1.5 1.9 : 3.3 0.7 0.9 1.5 0.8 9.7 -32.1 1.8 4.7 1.7 2.1 3.1 -5.5 : -3.5 : 1.41993 -1.0 -1.0 : 2.7 -1.6 -1.0 -0.7 -0.9 0.7 -11.4 4.2 4.5 1.3 0.5 -0.7 2.8 7.1 -0.8 : -0.71994 3.2 2.5 -1.6 5.8 2.0 2.4 2.2 2.2 5.9 2.2 3.8 5.7 3.0 2.4 1.5 5.3 6.2 3.7 2.5 2.41995 2.4 1.7 4.5 9.8 2.1 2.8 2.0 2.9 9.9 -0.9 1.4 6.2 3.1 2.7 2.3 4.1 5.8 4.0 2.3 2.31996 1.4 0.8 5.9 9.7 2.4 2.4 1.1 1.1 1.8 4.0 1.5 4.0 3.4 2.5 3.7 3.6 6.9 3.6 1.5 1.51997 3.7 1.7 11.7 11.3 3.6 3.9 2.2 1.9 2.3 9.6 5.9 4.9 4.3 2.3 4.4 5.0 4.4 6.2 2.6 2.51998 1.9 1.9 6.8 8.9 3.4 4.5 3.4 1.4 5.0 5.6 6.5 3.4 3.9 3.8 5.1 3.5 4.4 5.0 2.8 2.81999 3.5 1.9 -0.3 11.0 3.4 4.7 3.3 1.5 4.8 2.9 8.4 4.1 4.7 3.5 4.1 5.3 0.0 3.9 2.9 2.92000 3.7 3.1 9.7 10.6 4.5 5.0 3.7 3.7 5.0 5.3 8.4 6.4 3.9 3.7 3.9 4.3 1.4 5.3 3.8 3.8
1991-2000 2.2 1.9 : 7.4 2.3 2.8 2.0 1.6 4.5 -3.6 5.0 : 3.2 2.7 3.1 1.8 : 2.1 : 2.1
2001 0.8 1.5 6.3 5.0 4.2 3.7 1.8 1.9 4.0 7.3 2.5 0.0 1.9 0.9 2.0 2.9 3.5 2.3 2.0 2.02002 1.4 0.0 6.6 5.4 3.4 2.7 0.9 0.5 2.1 7.1 4.1 2.4 0.1 1.7 0.8 3.8 4.6 1.8 0.9 0.92003 0.8 -0.4 7.8 3.7 5.9 3.1 0.9 0.0 1.9 7.7 1.7 0.7 0.3 0.9 -0.9 2.9 4.8 2.0 0.7 0.72004 3.3 1.2 6.3 4.2 4.4 3.3 2.5 1.7 4.2 8.8 4.4 -0.3 2.2 2.6 1.6 4.4 5.1 4.1 2.2 2.22005 1.8 0.7 8.9 6.1 2.3 3.6 1.8 0.9 3.9 10.1 5.3 3.6 2.0 2.4 0.8 4.0 6.7 2.9 1.7 1.72006 2.7 3.7 10.1 5.5 5.5 4.1 2.5 2.2 4.1 11.0 4.9 2.6 3.4 3.7 1.4 5.8 8.3 4.4 3.3 3.22007 2.9 3.3 7.5 5.0 3.5 3.5 2.3 1.7 5.1 10.0 6.6 4.1 3.9 3.7 2.4 7.0 10.5 5.3 3.0 2.92008 1.0 1.1 -4.2 -2.2 -0.2 0.9 -0.1 -1.2 3.6 -2.8 -0.7 3.9 1.8 1.4 0.0 3.4 5.8 0.3 0.4 0.32009 -2.8 -5.1 -14.1 -6.4 -3.1 -3.8 -3.1 -5.5 -1.9 -17.7 -5.6 -2.8 -3.7 -3.8 -2.9 -7.9 -4.9 -8.5 -4.5 -4.42010 2.3 4.0 2.6 -1.1 -4.9 -0.2 1.7 1.7 1.3 -1.3 3.1 4.1 1.5 1.8 1.9 1.3 4.4 3.4 1.9 1.9
2001-2010 1.4 1.0 3.5 2.4 2.0 2.0 1.1 0.4 2.8 3.6 2.6 1.8 1.3 1.5 0.7 2.7 4.8 1.7 1.1 1.1
2011 1.8 3.3 9.6 2.2 -7.1 0.1 2.0 0.4 0.4 5.3 1.9 1.6 0.9 2.8 -1.3 0.7 3.0 2.8 1.6 1.62012 -0.1 0.7 3.9 0.2 -7.0 -1.6 0.0 -2.4 -2.4 5.2 -0.2 0.6 -1.2 0.9 -3.2 -2.5 1.8 -1.0 -0.7 -0.72013 0.2 0.4 0.8 -0.3 -3.9 -1.2 0.2 -1.9 -5.4 4.1 2.1 2.4 -0.8 0.4 -1.4 -1.1 0.9 -1.4 -0.4 -0.42014 1.4 1.8 1.9 1.7 0.6 1.1 1.0 0.6 -4.8 3.8 2.6 2.3 1.2 1.6 1.2 0.8 2.2 0.2 1.2 1.22015 1.6 2.0 3.0 3.0 2.9 2.1 1.5 1.2 0.9 4.1 2.7 2.3 1.4 1.8 1.5 1.4 3.1 1.0 1.7 1.7
1) 1961-91 D_W 2) Weighted in common currency; Euro area 3) Weighted in common currency; Former Euro area 12; 1961-91 including D_W
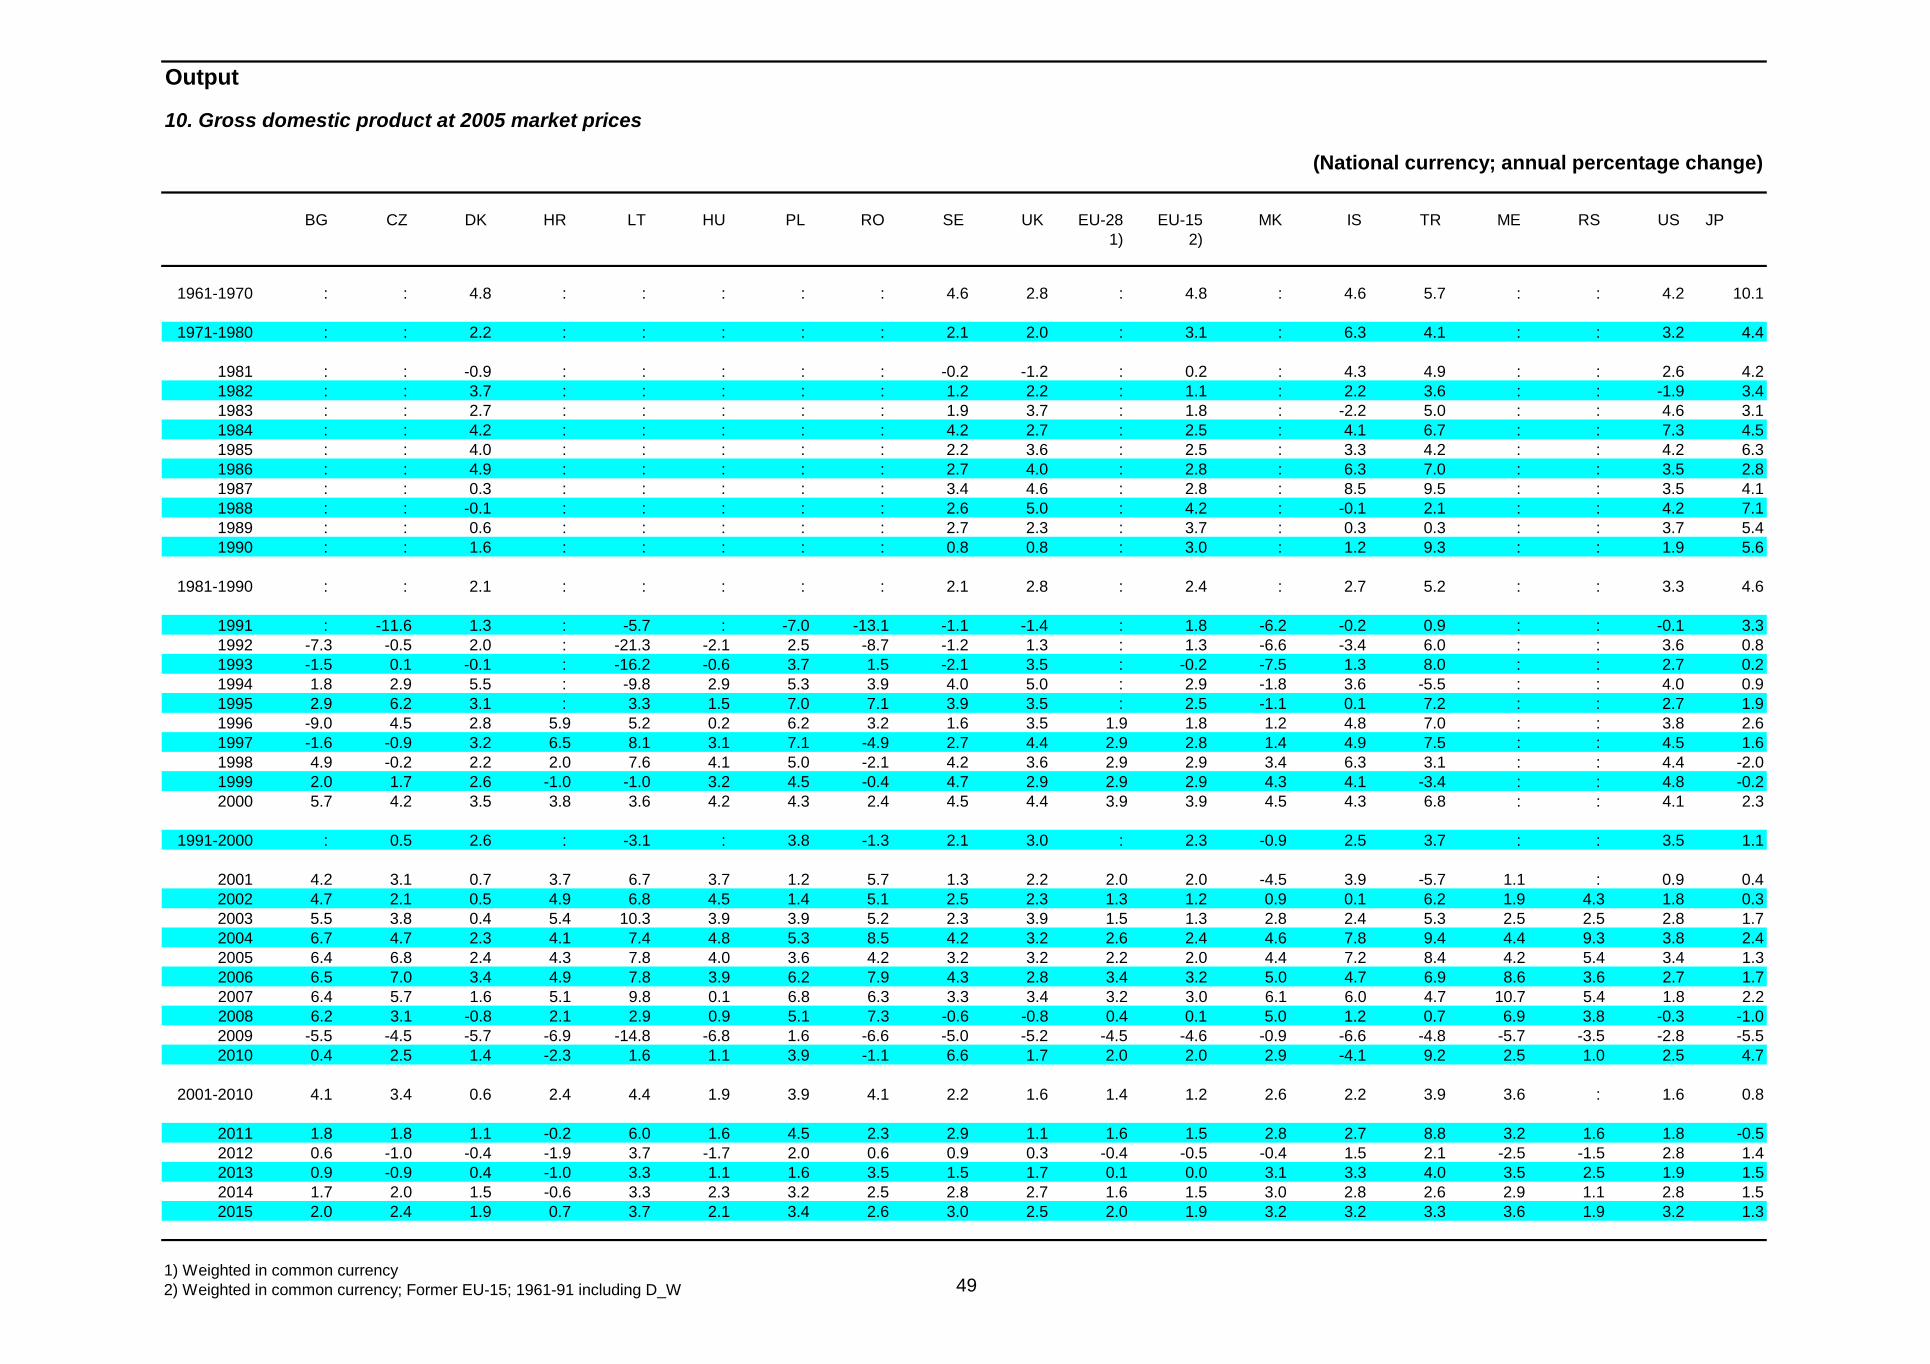
49
Output
10. Gross domestic product at 2005 market prices
(National currency; annual percentage change)
BG CZ DK HR LT HU PL RO SE UK EU-28 EU-15 MK IS TR ME RS US JP 1) 2)
1961-1970 : : 4.8 : : : : : 4.6 2.8 : 4.8 : 4.6 5.7 : : 4.2 10.1
1971-1980 : : 2.2 : : : : : 2.1 2.0 : 3.1 : 6.3 4.1 : : 3.2 4.4
1981 : : -0.9 : : : : : -0.2 -1.2 : 0.2 : 4.3 4.9 : : 2.6 4.21982 : : 3.7 : : : : : 1.2 2.2 : 1.1 : 2.2 3.6 : : -1.9 3.41983 : : 2.7 : : : : : 1.9 3.7 : 1.8 : -2.2 5.0 : : 4.6 3.11984 : : 4.2 : : : : : 4.2 2.7 : 2.5 : 4.1 6.7 : : 7.3 4.51985 : : 4.0 : : : : : 2.2 3.6 : 2.5 : 3.3 4.2 : : 4.2 6.31986 : : 4.9 : : : : : 2.7 4.0 : 2.8 : 6.3 7.0 : : 3.5 2.81987 : : 0.3 : : : : : 3.4 4.6 : 2.8 : 8.5 9.5 : : 3.5 4.11988 : : -0.1 : : : : : 2.6 5.0 : 4.2 : -0.1 2.1 : : 4.2 7.11989 : : 0.6 : : : : : 2.7 2.3 : 3.7 : 0.3 0.3 : : 3.7 5.41990 : : 1.6 : : : : : 0.8 0.8 : 3.0 : 1.2 9.3 : : 1.9 5.6
1981-1990 : : 2.1 : : : : : 2.1 2.8 : 2.4 : 2.7 5.2 : : 3.3 4.6
1991 : -11.6 1.3 : -5.7 : -7.0 -13.1 -1.1 -1.4 : 1.8 -6.2 -0.2 0.9 : : -0.1 3.31992 -7.3 -0.5 2.0 : -21.3 -2.1 2.5 -8.7 -1.2 1.3 : 1.3 -6.6 -3.4 6.0 : : 3.6 0.81993 -1.5 0.1 -0.1 : -16.2 -0.6 3.7 1.5 -2.1 3.5 : -0.2 -7.5 1.3 8.0 : : 2.7 0.21994 1.8 2.9 5.5 : -9.8 2.9 5.3 3.9 4.0 5.0 : 2.9 -1.8 3.6 -5.5 : : 4.0 0.91995 2.9 6.2 3.1 : 3.3 1.5 7.0 7.1 3.9 3.5 : 2.5 -1.1 0.1 7.2 : : 2.7 1.91996 -9.0 4.5 2.8 5.9 5.2 0.2 6.2 3.2 1.6 3.5 1.9 1.8 1.2 4.8 7.0 : : 3.8 2.61997 -1.6 -0.9 3.2 6.5 8.1 3.1 7.1 -4.9 2.7 4.4 2.9 2.8 1.4 4.9 7.5 : : 4.5 1.61998 4.9 -0.2 2.2 2.0 7.6 4.1 5.0 -2.1 4.2 3.6 2.9 2.9 3.4 6.3 3.1 : : 4.4 -2.01999 2.0 1.7 2.6 -1.0 -1.0 3.2 4.5 -0.4 4.7 2.9 2.9 2.9 4.3 4.1 -3.4 : : 4.8 -0.22000 5.7 4.2 3.5 3.8 3.6 4.2 4.3 2.4 4.5 4.4 3.9 3.9 4.5 4.3 6.8 : : 4.1 2.3
1991-2000 : 0.5 2.6 : -3.1 : 3.8 -1.3 2.1 3.0 : 2.3 -0.9 2.5 3.7 : : 3.5 1.1
2001 4.2 3.1 0.7 3.7 6.7 3.7 1.2 5.7 1.3 2.2 2.0 2.0 -4.5 3.9 -5.7 1.1 : 0.9 0.42002 4.7 2.1 0.5 4.9 6.8 4.5 1.4 5.1 2.5 2.3 1.3 1.2 0.9 0.1 6.2 1.9 4.3 1.8 0.32003 5.5 3.8 0.4 5.4 10.3 3.9 3.9 5.2 2.3 3.9 1.5 1.3 2.8 2.4 5.3 2.5 2.5 2.8 1.72004 6.7 4.7 2.3 4.1 7.4 4.8 5.3 8.5 4.2 3.2 2.6 2.4 4.6 7.8 9.4 4.4 9.3 3.8 2.42005 6.4 6.8 2.4 4.3 7.8 4.0 3.6 4.2 3.2 3.2 2.2 2.0 4.4 7.2 8.4 4.2 5.4 3.4 1.32006 6.5 7.0 3.4 4.9 7.8 3.9 6.2 7.9 4.3 2.8 3.4 3.2 5.0 4.7 6.9 8.6 3.6 2.7 1.72007 6.4 5.7 1.6 5.1 9.8 0.1 6.8 6.3 3.3 3.4 3.2 3.0 6.1 6.0 4.7 10.7 5.4 1.8 2.22008 6.2 3.1 -0.8 2.1 2.9 0.9 5.1 7.3 -0.6 -0.8 0.4 0.1 5.0 1.2 0.7 6.9 3.8 -0.3 -1.02009 -5.5 -4.5 -5.7 -6.9 -14.8 -6.8 1.6 -6.6 -5.0 -5.2 -4.5 -4.6 -0.9 -6.6 -4.8 -5.7 -3.5 -2.8 -5.52010 0.4 2.5 1.4 -2.3 1.6 1.1 3.9 -1.1 6.6 1.7 2.0 2.0 2.9 -4.1 9.2 2.5 1.0 2.5 4.7
2001-2010 4.1 3.4 0.6 2.4 4.4 1.9 3.9 4.1 2.2 1.6 1.4 1.2 2.6 2.2 3.9 3.6 : 1.6 0.8
2011 1.8 1.8 1.1 -0.2 6.0 1.6 4.5 2.3 2.9 1.1 1.6 1.5 2.8 2.7 8.8 3.2 1.6 1.8 -0.52012 0.6 -1.0 -0.4 -1.9 3.7 -1.7 2.0 0.6 0.9 0.3 -0.4 -0.5 -0.4 1.5 2.1 -2.5 -1.5 2.8 1.42013 0.9 -0.9 0.4 -1.0 3.3 1.1 1.6 3.5 1.5 1.7 0.1 0.0 3.1 3.3 4.0 3.5 2.5 1.9 1.52014 1.7 2.0 1.5 -0.6 3.3 2.3 3.2 2.5 2.8 2.7 1.6 1.5 3.0 2.8 2.6 2.9 1.1 2.8 1.52015 2.0 2.4 1.9 0.7 3.7 2.1 3.4 2.6 3.0 2.5 2.0 1.9 3.2 3.2 3.3 3.6 1.9 3.2 1.3
1) Weighted in common currency 2) Weighted in common currency; Former EU-15; 1961-91 including D_W
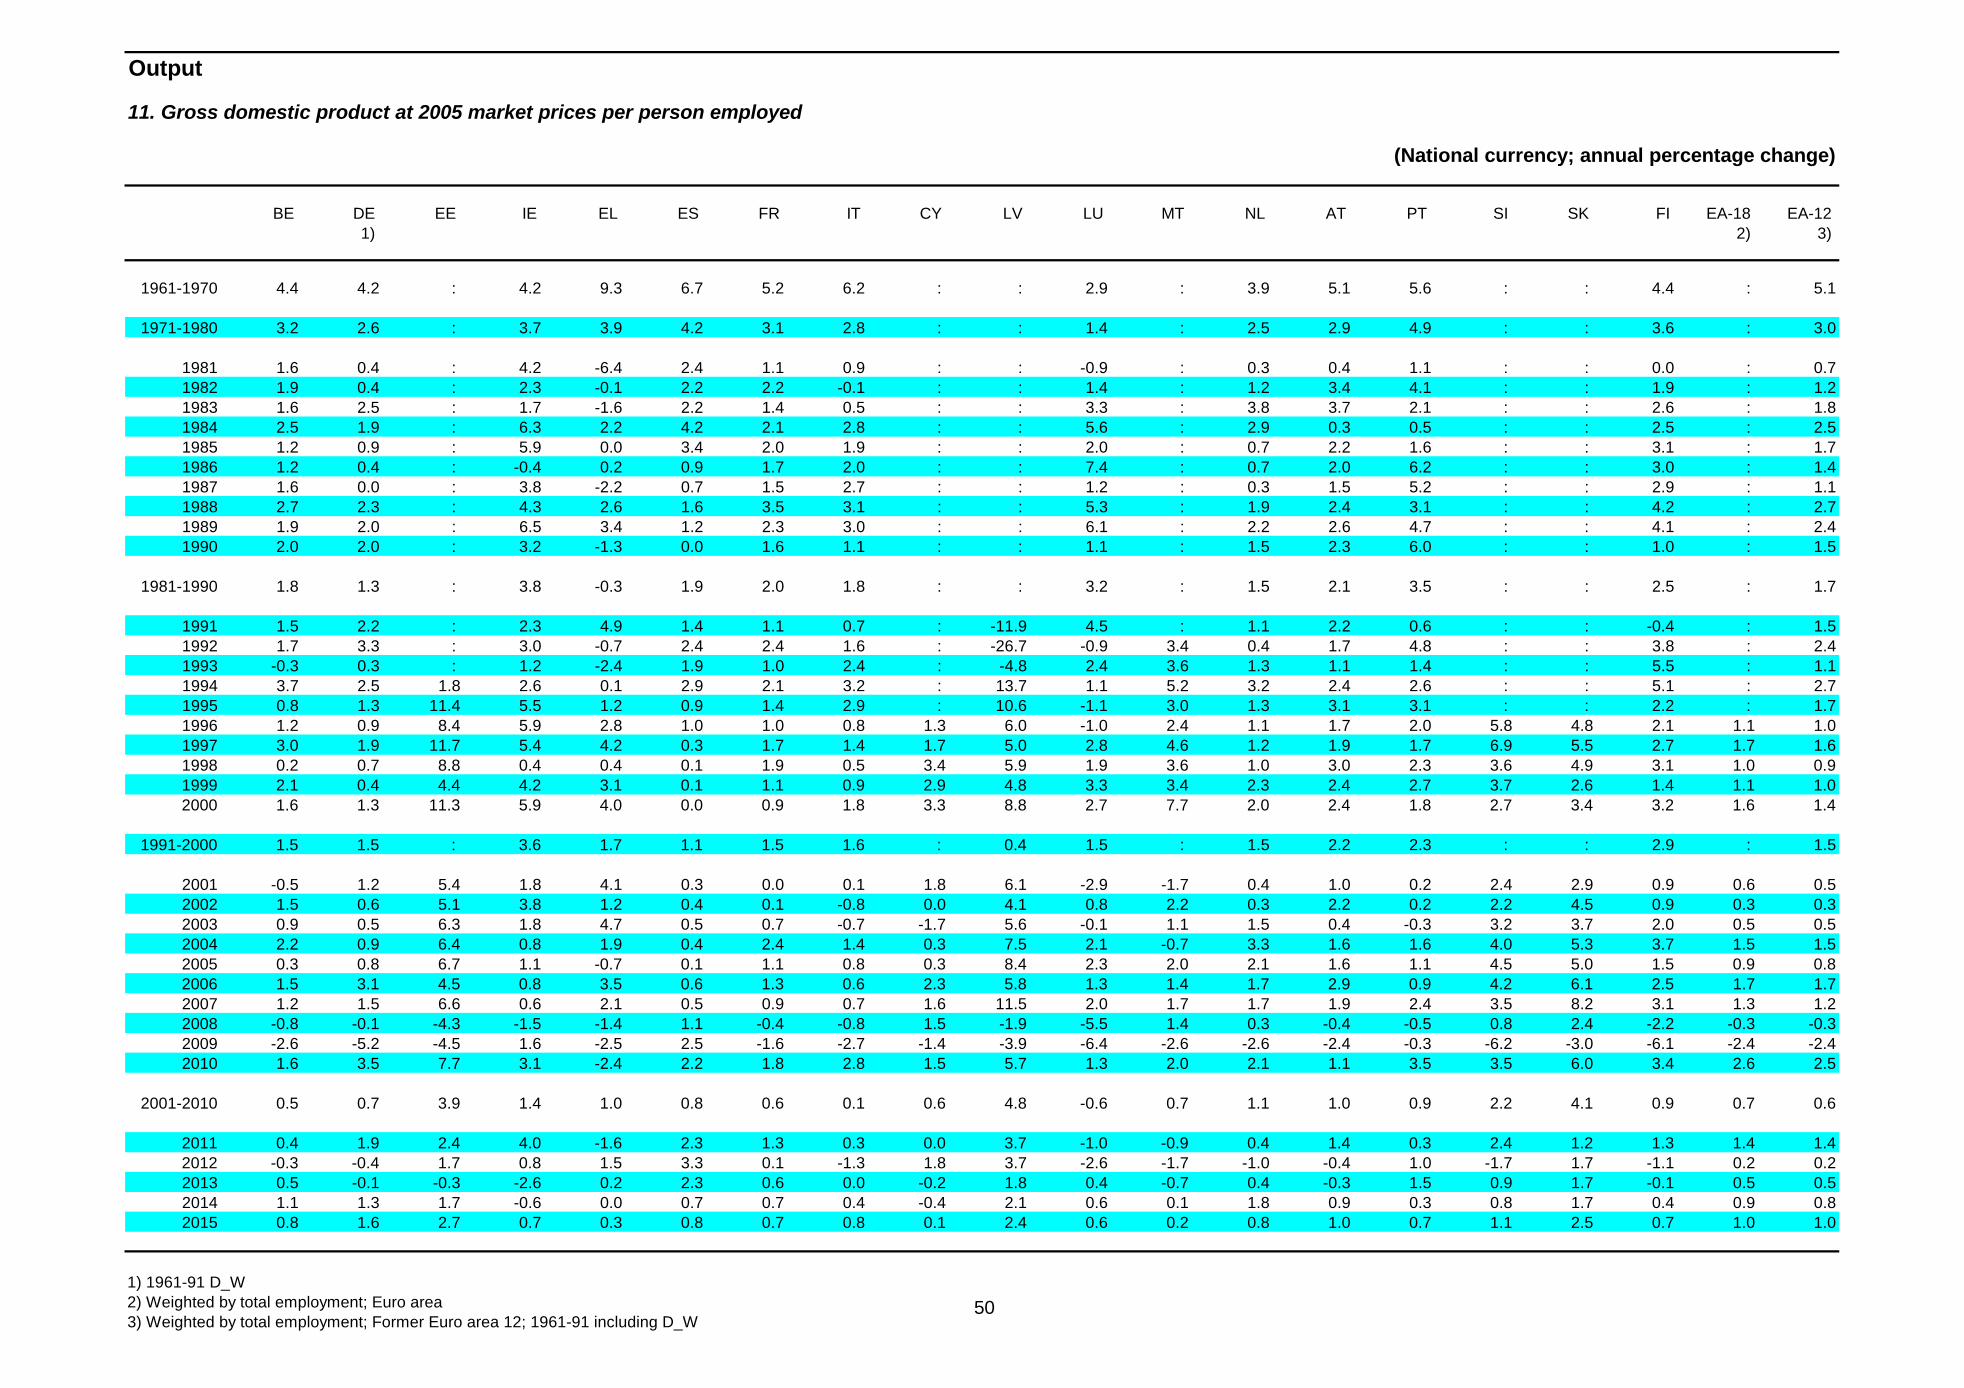
50
Output
11. Gross domestic product at 2005 market prices per person employed
(National currency; annual percentage change)
BE DE EE IE EL ES FR IT CY LV LU MT NL AT PT SI SK FI EA-18 EA-12 1) 2) 3)
1961-1970 4.4 4.2 : 4.2 9.3 6.7 5.2 6.2 : : 2.9 : 3.9 5.1 5.6 : : 4.4 : 5.1
1971-1980 3.2 2.6 : 3.7 3.9 4.2 3.1 2.8 : : 1.4 : 2.5 2.9 4.9 : : 3.6 : 3.0
1981 1.6 0.4 : 4.2 -6.4 2.4 1.1 0.9 : : -0.9 : 0.3 0.4 1.1 : : 0.0 : 0.71982 1.9 0.4 : 2.3 -0.1 2.2 2.2 -0.1 : : 1.4 : 1.2 3.4 4.1 : : 1.9 : 1.21983 1.6 2.5 : 1.7 -1.6 2.2 1.4 0.5 : : 3.3 : 3.8 3.7 2.1 : : 2.6 : 1.81984 2.5 1.9 : 6.3 2.2 4.2 2.1 2.8 : : 5.6 : 2.9 0.3 0.5 : : 2.5 : 2.51985 1.2 0.9 : 5.9 0.0 3.4 2.0 1.9 : : 2.0 : 0.7 2.2 1.6 : : 3.1 : 1.71986 1.2 0.4 : -0.4 0.2 0.9 1.7 2.0 : : 7.4 : 0.7 2.0 6.2 : : 3.0 : 1.41987 1.6 0.0 : 3.8 -2.2 0.7 1.5 2.7 : : 1.2 : 0.3 1.5 5.2 : : 2.9 : 1.11988 2.7 2.3 : 4.3 2.6 1.6 3.5 3.1 : : 5.3 : 1.9 2.4 3.1 : : 4.2 : 2.71989 1.9 2.0 : 6.5 3.4 1.2 2.3 3.0 : : 6.1 : 2.2 2.6 4.7 : : 4.1 : 2.41990 2.0 2.0 : 3.2 -1.3 0.0 1.6 1.1 : : 1.1 : 1.5 2.3 6.0 : : 1.0 : 1.5
1981-1990 1.8 1.3 : 3.8 -0.3 1.9 2.0 1.8 : : 3.2 : 1.5 2.1 3.5 : : 2.5 : 1.7
1991 1.5 2.2 : 2.3 4.9 1.4 1.1 0.7 : -11.9 4.5 : 1.1 2.2 0.6 : : -0.4 : 1.51992 1.7 3.3 : 3.0 -0.7 2.4 2.4 1.6 : -26.7 -0.9 3.4 0.4 1.7 4.8 : : 3.8 : 2.41993 -0.3 0.3 : 1.2 -2.4 1.9 1.0 2.4 : -4.8 2.4 3.6 1.3 1.1 1.4 : : 5.5 : 1.11994 3.7 2.5 1.8 2.6 0.1 2.9 2.1 3.2 : 13.7 1.1 5.2 3.2 2.4 2.6 : : 5.1 : 2.71995 0.8 1.3 11.4 5.5 1.2 0.9 1.4 2.9 : 10.6 -1.1 3.0 1.3 3.1 3.1 : : 2.2 : 1.71996 1.2 0.9 8.4 5.9 2.8 1.0 1.0 0.8 1.3 6.0 -1.0 2.4 1.1 1.7 2.0 5.8 4.8 2.1 1.1 1.01997 3.0 1.9 11.7 5.4 4.2 0.3 1.7 1.4 1.7 5.0 2.8 4.6 1.2 1.9 1.7 6.9 5.5 2.7 1.7 1.61998 0.2 0.7 8.8 0.4 0.4 0.1 1.9 0.5 3.4 5.9 1.9 3.6 1.0 3.0 2.3 3.6 4.9 3.1 1.0 0.91999 2.1 0.4 4.4 4.2 3.1 0.1 1.1 0.9 2.9 4.8 3.3 3.4 2.3 2.4 2.7 3.7 2.6 1.4 1.1 1.02000 1.6 1.3 11.3 5.9 4.0 0.0 0.9 1.8 3.3 8.8 2.7 7.7 2.0 2.4 1.8 2.7 3.4 3.2 1.6 1.4
1991-2000 1.5 1.5 : 3.6 1.7 1.1 1.5 1.6 : 0.4 1.5 : 1.5 2.2 2.3 : : 2.9 : 1.5
2001 -0.5 1.2 5.4 1.8 4.1 0.3 0.0 0.1 1.8 6.1 -2.9 -1.7 0.4 1.0 0.2 2.4 2.9 0.9 0.6 0.52002 1.5 0.6 5.1 3.8 1.2 0.4 0.1 -0.8 0.0 4.1 0.8 2.2 0.3 2.2 0.2 2.2 4.5 0.9 0.3 0.32003 0.9 0.5 6.3 1.8 4.7 0.5 0.7 -0.7 -1.7 5.6 -0.1 1.1 1.5 0.4 -0.3 3.2 3.7 2.0 0.5 0.52004 2.2 0.9 6.4 0.8 1.9 0.4 2.4 1.4 0.3 7.5 2.1 -0.7 3.3 1.6 1.6 4.0 5.3 3.7 1.5 1.52005 0.3 0.8 6.7 1.1 -0.7 0.1 1.1 0.8 0.3 8.4 2.3 2.0 2.1 1.6 1.1 4.5 5.0 1.5 0.9 0.82006 1.5 3.1 4.5 0.8 3.5 0.6 1.3 0.6 2.3 5.8 1.3 1.4 1.7 2.9 0.9 4.2 6.1 2.5 1.7 1.72007 1.2 1.5 6.6 0.6 2.1 0.5 0.9 0.7 1.6 11.5 2.0 1.7 1.7 1.9 2.4 3.5 8.2 3.1 1.3 1.22008 -0.8 -0.1 -4.3 -1.5 -1.4 1.1 -0.4 -0.8 1.5 -1.9 -5.5 1.4 0.3 -0.4 -0.5 0.8 2.4 -2.2 -0.3 -0.32009 -2.6 -5.2 -4.5 1.6 -2.5 2.5 -1.6 -2.7 -1.4 -3.9 -6.4 -2.6 -2.6 -2.4 -0.3 -6.2 -3.0 -6.1 -2.4 -2.42010 1.6 3.5 7.7 3.1 -2.4 2.2 1.8 2.8 1.5 5.7 1.3 2.0 2.1 1.1 3.5 3.5 6.0 3.4 2.6 2.5
2001-2010 0.5 0.7 3.9 1.4 1.0 0.8 0.6 0.1 0.6 4.8 -0.6 0.7 1.1 1.0 0.9 2.2 4.1 0.9 0.7 0.6
2011 0.4 1.9 2.4 4.0 -1.6 2.3 1.3 0.3 0.0 3.7 -1.0 -0.9 0.4 1.4 0.3 2.4 1.2 1.3 1.4 1.42012 -0.3 -0.4 1.7 0.8 1.5 3.3 0.1 -1.3 1.8 3.7 -2.6 -1.7 -1.0 -0.4 1.0 -1.7 1.7 -1.1 0.2 0.22013 0.5 -0.1 -0.3 -2.6 0.2 2.3 0.6 0.0 -0.2 1.8 0.4 -0.7 0.4 -0.3 1.5 0.9 1.7 -0.1 0.5 0.52014 1.1 1.3 1.7 -0.6 0.0 0.7 0.7 0.4 -0.4 2.1 0.6 0.1 1.8 0.9 0.3 0.8 1.7 0.4 0.9 0.82015 0.8 1.6 2.7 0.7 0.3 0.8 0.7 0.8 0.1 2.4 0.6 0.2 0.8 1.0 0.7 1.1 2.5 0.7 1.0 1.0
1) 1961-91 D_W 2) Weighted by total employment; Euro area 3) Weighted by total employment; Former Euro area 12; 1961-91 including D_W
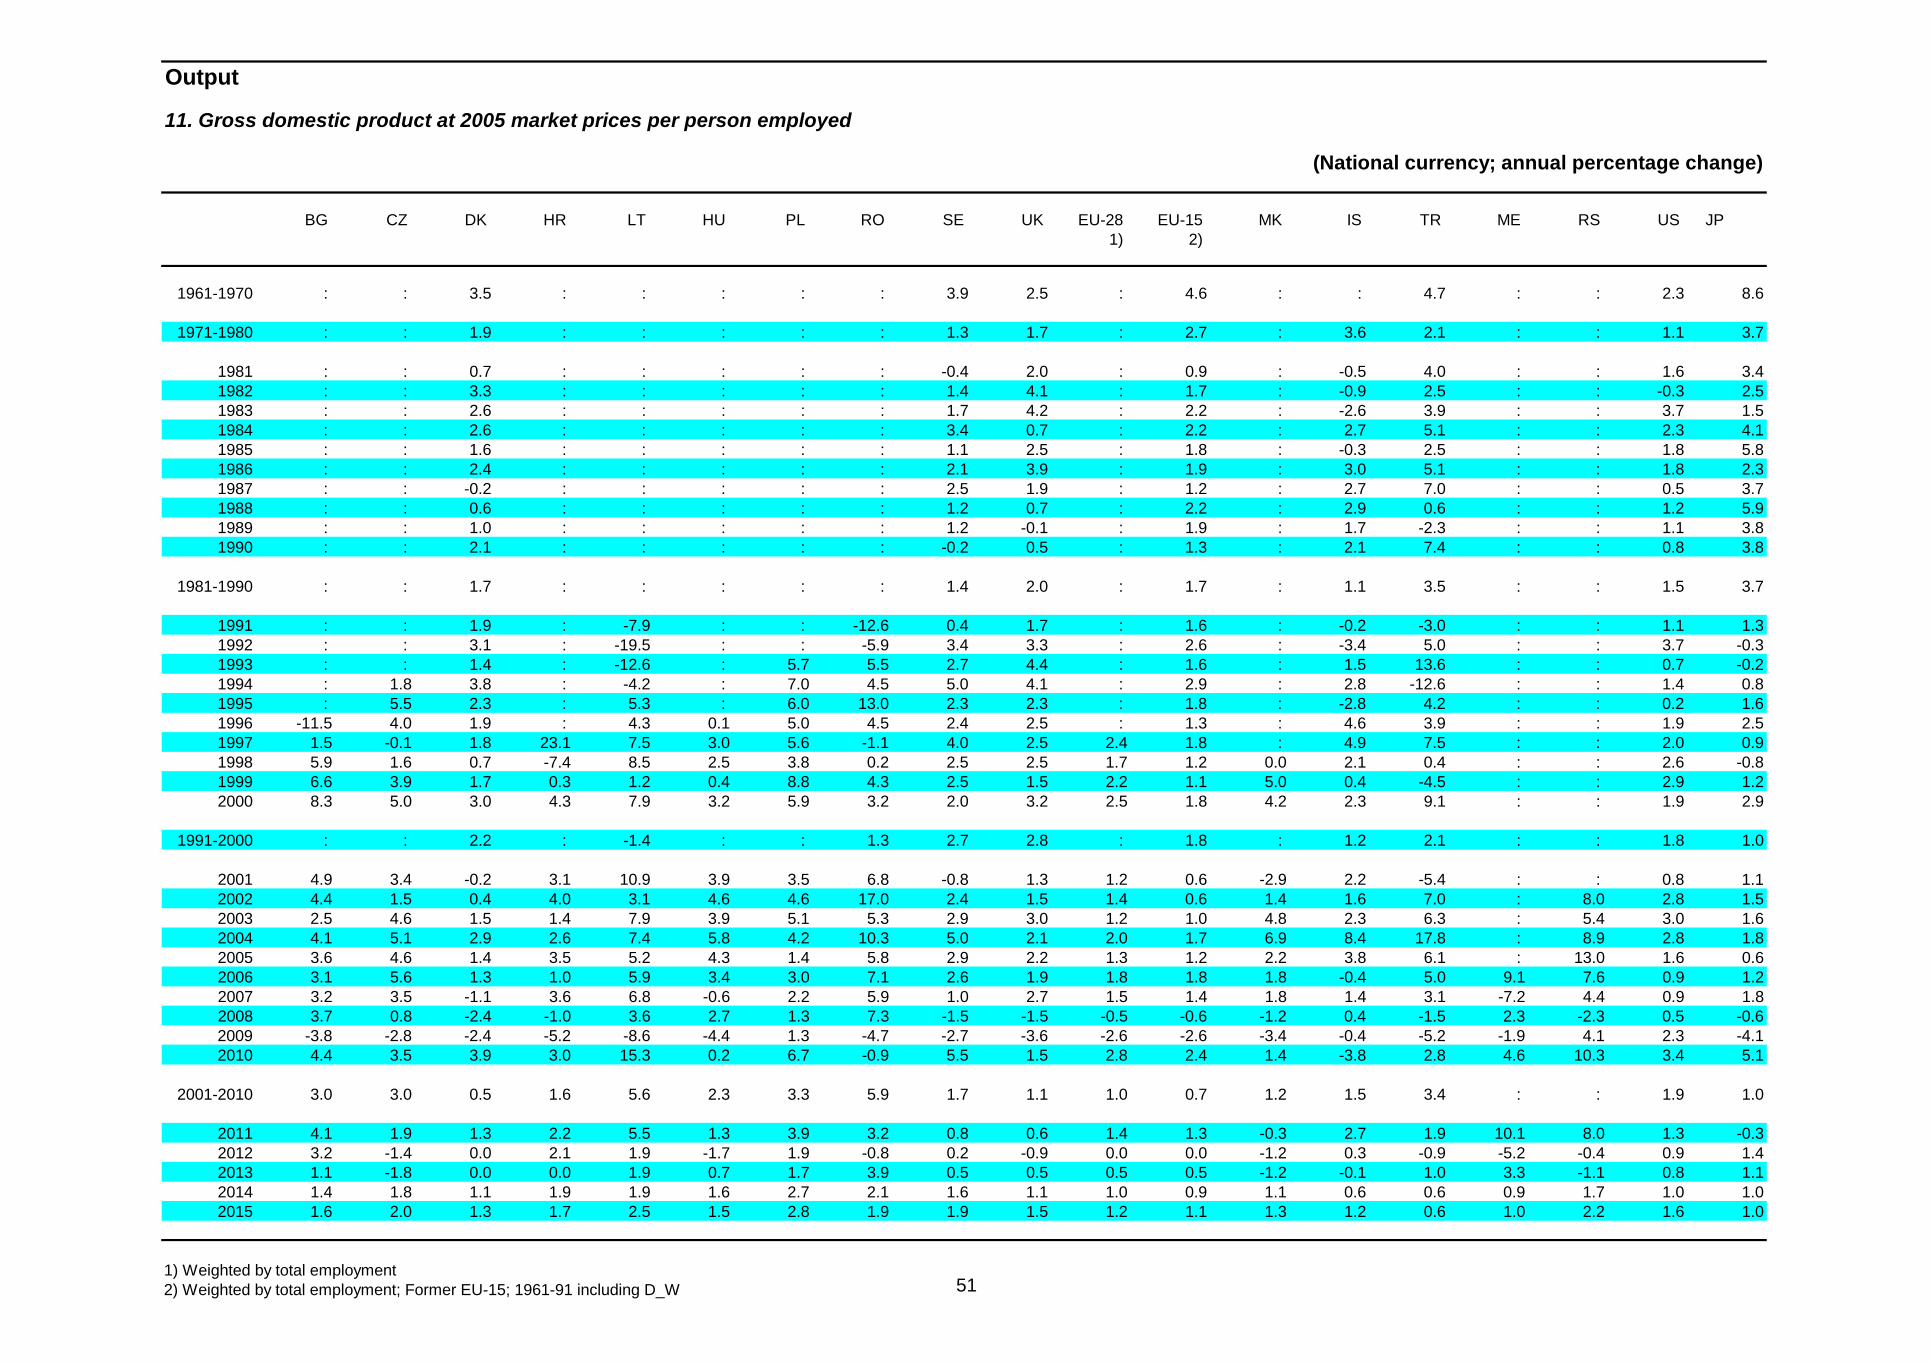
51
Output
11. Gross domestic product at 2005 market prices per person employed
(National currency; annual percentage change)
BG CZ DK HR LT HU PL RO SE UK EU-28 EU-15 MK IS TR ME RS US JP 1) 2)
1961-1970 : : 3.5 : : : : : 3.9 2.5 : 4.6 : : 4.7 : : 2.3 8.6
1971-1980 : : 1.9 : : : : : 1.3 1.7 : 2.7 : 3.6 2.1 : : 1.1 3.7
1981 : : 0.7 : : : : : -0.4 2.0 : 0.9 : -0.5 4.0 : : 1.6 3.41982 : : 3.3 : : : : : 1.4 4.1 : 1.7 : -0.9 2.5 : : -0.3 2.51983 : : 2.6 : : : : : 1.7 4.2 : 2.2 : -2.6 3.9 : : 3.7 1.51984 : : 2.6 : : : : : 3.4 0.7 : 2.2 : 2.7 5.1 : : 2.3 4.11985 : : 1.6 : : : : : 1.1 2.5 : 1.8 : -0.3 2.5 : : 1.8 5.81986 : : 2.4 : : : : : 2.1 3.9 : 1.9 : 3.0 5.1 : : 1.8 2.31987 : : -0.2 : : : : : 2.5 1.9 : 1.2 : 2.7 7.0 : : 0.5 3.71988 : : 0.6 : : : : : 1.2 0.7 : 2.2 : 2.9 0.6 : : 1.2 5.91989 : : 1.0 : : : : : 1.2 -0.1 : 1.9 : 1.7 -2.3 : : 1.1 3.81990 : : 2.1 : : : : : -0.2 0.5 : 1.3 : 2.1 7.4 : : 0.8 3.8
1981-1990 : : 1.7 : : : : : 1.4 2.0 : 1.7 : 1.1 3.5 : : 1.5 3.7
1991 : : 1.9 : -7.9 : : -12.6 0.4 1.7 : 1.6 : -0.2 -3.0 : : 1.1 1.31992 : : 3.1 : -19.5 : : -5.9 3.4 3.3 : 2.6 : -3.4 5.0 : : 3.7 -0.31993 : : 1.4 : -12.6 : 5.7 5.5 2.7 4.4 : 1.6 : 1.5 13.6 : : 0.7 -0.21994 : 1.8 3.8 : -4.2 : 7.0 4.5 5.0 4.1 : 2.9 : 2.8 -12.6 : : 1.4 0.81995 : 5.5 2.3 : 5.3 : 6.0 13.0 2.3 2.3 : 1.8 : -2.8 4.2 : : 0.2 1.61996 -11.5 4.0 1.9 : 4.3 0.1 5.0 4.5 2.4 2.5 : 1.3 : 4.6 3.9 : : 1.9 2.51997 1.5 -0.1 1.8 23.1 7.5 3.0 5.6 -1.1 4.0 2.5 2.4 1.8 : 4.9 7.5 : : 2.0 0.91998 5.9 1.6 0.7 -7.4 8.5 2.5 3.8 0.2 2.5 2.5 1.7 1.2 0.0 2.1 0.4 : : 2.6 -0.81999 6.6 3.9 1.7 0.3 1.2 0.4 8.8 4.3 2.5 1.5 2.2 1.1 5.0 0.4 -4.5 : : 2.9 1.22000 8.3 5.0 3.0 4.3 7.9 3.2 5.9 3.2 2.0 3.2 2.5 1.8 4.2 2.3 9.1 : : 1.9 2.9
1991-2000 : : 2.2 : -1.4 : : 1.3 2.7 2.8 : 1.8 : 1.2 2.1 : : 1.8 1.0
2001 4.9 3.4 -0.2 3.1 10.9 3.9 3.5 6.8 -0.8 1.3 1.2 0.6 -2.9 2.2 -5.4 : : 0.8 1.12002 4.4 1.5 0.4 4.0 3.1 4.6 4.6 17.0 2.4 1.5 1.4 0.6 1.4 1.6 7.0 : 8.0 2.8 1.52003 2.5 4.6 1.5 1.4 7.9 3.9 5.1 5.3 2.9 3.0 1.2 1.0 4.8 2.3 6.3 : 5.4 3.0 1.62004 4.1 5.1 2.9 2.6 7.4 5.8 4.2 10.3 5.0 2.1 2.0 1.7 6.9 8.4 17.8 : 8.9 2.8 1.82005 3.6 4.6 1.4 3.5 5.2 4.3 1.4 5.8 2.9 2.2 1.3 1.2 2.2 3.8 6.1 : 13.0 1.6 0.62006 3.1 5.6 1.3 1.0 5.9 3.4 3.0 7.1 2.6 1.9 1.8 1.8 1.8 -0.4 5.0 9.1 7.6 0.9 1.22007 3.2 3.5 -1.1 3.6 6.8 -0.6 2.2 5.9 1.0 2.7 1.5 1.4 1.8 1.4 3.1 -7.2 4.4 0.9 1.82008 3.7 0.8 -2.4 -1.0 3.6 2.7 1.3 7.3 -1.5 -1.5 -0.5 -0.6 -1.2 0.4 -1.5 2.3 -2.3 0.5 -0.62009 -3.8 -2.8 -2.4 -5.2 -8.6 -4.4 1.3 -4.7 -2.7 -3.6 -2.6 -2.6 -3.4 -0.4 -5.2 -1.9 4.1 2.3 -4.12010 4.4 3.5 3.9 3.0 15.3 0.2 6.7 -0.9 5.5 1.5 2.8 2.4 1.4 -3.8 2.8 4.6 10.3 3.4 5.1
2001-2010 3.0 3.0 0.5 1.6 5.6 2.3 3.3 5.9 1.7 1.1 1.0 0.7 1.2 1.5 3.4 : : 1.9 1.0
2011 4.1 1.9 1.3 2.2 5.5 1.3 3.9 3.2 0.8 0.6 1.4 1.3 -0.3 2.7 1.9 10.1 8.0 1.3 -0.32012 3.2 -1.4 0.0 2.1 1.9 -1.7 1.9 -0.8 0.2 -0.9 0.0 0.0 -1.2 0.3 -0.9 -5.2 -0.4 0.9 1.42013 1.1 -1.8 0.0 0.0 1.9 0.7 1.7 3.9 0.5 0.5 0.5 0.5 -1.2 -0.1 1.0 3.3 -1.1 0.8 1.12014 1.4 1.8 1.1 1.9 1.9 1.6 2.7 2.1 1.6 1.1 1.0 0.9 1.1 0.6 0.6 0.9 1.7 1.0 1.02015 1.6 2.0 1.3 1.7 2.5 1.5 2.8 1.9 1.9 1.5 1.2 1.1 1.3 1.2 0.6 1.0 2.2 1.6 1.0
1) Weighted by total employment 2) Weighted by total employment; Former EU-15; 1961-91 including D_W

52
Output
12. Industrial production; construction excluded
(Annual percentage change)
BE DE EE IE EL ES FR IT CY LV LU MT NL AT PT SI SK FI EA-18 EA-12 1) 2) 3)
1961-1970 5.0 5.7 : : : : 5.4 7.0 : : 2.4 : 7.3 5.6 5.0 : : 7.5 : :
1971-1980 2.2 1.9 : : 6.9 5.1 2.9 3.5 : : 0.0 : 2.9 4.0 6.5 : : 4.6 : :
1981 -2.7 -1.8 : 5.1 0.8 -1.0 -1.2 -2.2 : : -5.7 : -1.9 -1.7 2.4 : : 2.5 : -1.61982 0.0 -3.3 : 0.0 0.9 -1.1 -0.7 -3.1 : : 2.4 : -3.8 -0.7 7.7 : : 0.9 : -2.11983 1.8 0.8 : 7.3 -0.3 2.7 0.0 -2.3 : : 5.3 : 1.8 1.0 3.6 : : 3.3 : 0.21984 2.5 3.0 : 9.8 2.3 0.9 1.8 3.2 : : 11.7 : 5.1 5.2 2.5 : : 4.7 : 2.71985 2.6 4.8 : 3.4 3.3 2.0 0.2 0.2 : : 6.9 : 4.8 4.7 0.7 : : 3.9 : 2.41986 0.7 1.9 : 2.0 -0.3 3.1 2.5 4.1 : : 1.9 : 0.1 0.9 7.3 : : 1.6 : 2.51987 2.2 0.3 : 9.2 -1.3 4.6 1.8 2.7 : : -0.6 : 1.0 0.9 4.4 : : 4.6 : 1.81988 5.7 3.7 : 10.8 5.1 3.0 3.5 6.8 : : 8.7 : 0.0 4.4 3.8 : : 4.2 : 4.31989 3.4 4.9 : 11.4 1.8 4.5 3.5 3.9 : : 7.9 : 5.1 6.0 6.8 : : 2.5 : 4.31990 3.1 5.2 : 4.9 -2.5 0.1 6.3 -0.6 : : -0.5 : 2.4 7.0 8.9 : : 0.3 : 3.4
1981-1990 1.9 1.9 : 6.3 1.0 1.9 1.8 1.2 : : 3.7 : 1.4 2.7 4.8 : : 2.8 : 1.8
1991 -1.9 2.8 : 3.7 -1.0 -0.8 -1.2 -1.0 : : 0.3 : 1.8 1.9 0.1 : : -8.6 : 0.3
1992 -0.5 -1.4 : 8.9 -1.0 -2.8 -1.8 -0.2 : : -0.8 : -0.1 -1.3 -2.4 : : 0.9 : -1.21993 -5.0 -7.4 : 5.7 -2.9 -4.7 -4.3 -2.4 : : -4.3 : -1.2 -1.7 -4.8 : : 5.0 : -4.61994 2.1 2.8 : 12.0 1.3 7.3 3.4 5.2 : : 6.0 : 4.9 4.2 -0.2 : : 11.2 : 4.11995 6.5 0.9 : 19.0 1.9 4.7 2.5 5.4 : : 1.3 : 2.8 4.9 4.7 : : 6.5 : 3.21996 0.5 -0.1 : 8.1 0.8 -0.7 -0.3 -0.9 : : 0.1 : 2.5 1.0 5.3 : : 3.1 : 0.01997 4.7 2.9 : 17.5 1.9 6.9 3.7 3.3 : : 5.7 : -0.5 6.4 2.6 : : 8.0 : 3.61998 3.3 4.2 : 19.9 8.9 5.3 3.1 1.9 : : 0.0 : 1.8 8.1 5.6 : : 7.3 : 3.71999 0.9 1.4 -3.3 14.7 1.9 2.7 1.4 0.1 : : 11.5 : 3.0 6.0 3.0 -0.5 : 5.0 : 1.62000 1.9 5.0 14.5 14.3 7.2 4.0 3.1 3.1 4.4 : 4.3 : 5.3 9.2 0.4 6.2 : 9.0 : 4.3
1992-2000 1.5 0.9 : 13.3 2.2 2.4 1.2 1.7 : : 2.6 : 2.0 4.0 1.5 : : 6.2 : 1.6
2001 5.1 -0.1 8.9 11.1 -3.3 -1.1 0.3 -0.8 4.8 10.5 5.0 -6.2 1.2 3.1 2.0 2.9 3.6 0.1 : 0.12002 0.5 -1.1 8.4 8.1 0.1 -0.1 -1.8 -1.3 1.7 6.9 4.9 0.6 1.0 1.0 0.5 2.4 7.0 1.4 : -0.82003 2.6 0.5 11.0 5.7 0.6 1.5 -1.4 -1.0 0.0 7.8 5.3 4.5 -1.4 1.8 -1.2 1.4 15.5 -0.1 : -0.12004 8.1 4.2 10.4 1.3 0.6 1.9 2.0 0.9 1.8 7.1 5.5 -0.9 4.6 7.0 -4.1 4.9 3.6 5.3 : 2.92005 3.2 3.0 11.0 4.0 -1.6 0.2 0.0 -1.8 0.5 7.1 2.3 -5.5 0.4 4.0 -3.8 3.6 -0.8 -0.9 : 0.82006 6.1 5.4 10.0 3.1 0.9 3.7 0.6 3.2 0.4 6.5 2.2 7.1 2.1 7.1 3.2 5.7 15.7 10.1 : 3.82007 6.7 5.8 6.4 5.2 2.3 2.4 1.2 2.5 4.8 1.1 -0.2 7.6 4.2 5.8 0.3 7.2 16.8 4.7 : 3.72008 4.0 0.5 -5.2 -2.1 -4.4 -7.2 -3.0 -3.3 4.4 -3.2 -5.0 -4.3 0.7 2.2 -4.1 2.4 14.5 1.1 : -1.52009 -10.4 -16.3 -24.0 -4.5 -9.0 -16.2 -14.5 -18.7 -9.3 -18.1 -16.0 -14.4 -7.6 -11.8 -8.6 -17.3 -15.5 -18.0 : -15.42010 11.4 11.2 23.6 7.5 -6.6 0.9 5.4 6.9 -1.8 14.9 9.0 8.7 7.7 7.1 1.7 7.2 8.2 5.7 : 7.7
2001-2010 3.6 1.1 5.3 3.8 -2.1 -1.6 -1.3 -1.6 0.7 3.7 1.0 -0.5 1.2 2.6 -1.5 1.8 6.4 0.7 : -0.1
2011 4.3 7.0 19.9 0.0 -8.1 -2.1 2.1 0.3 -8.5 9.0 1.8 -0.3 -0.7 6.2 -1.3 1.3 5.3 1.7 : 3.22012 -3.2 -0.8 1.0 -1.3 -3.6 -6.6 -2.8 -6.1 -9.4 6.1 -4.0 6.5 -0.6 -0.1 -5.8 -1.1 7.9 -2.2 : -2.72013 0.5 -0.3 2.9 -2.0 -3.6 -1.9 -0.9 -3.0 -12.4 -0.8 -2.6 -4.4 0.7 0.2 1.1 -0.5 4.9 -3.3 : -1.0
1) 1961-91 D_W 2) Euro area; 1961-91 including D_W
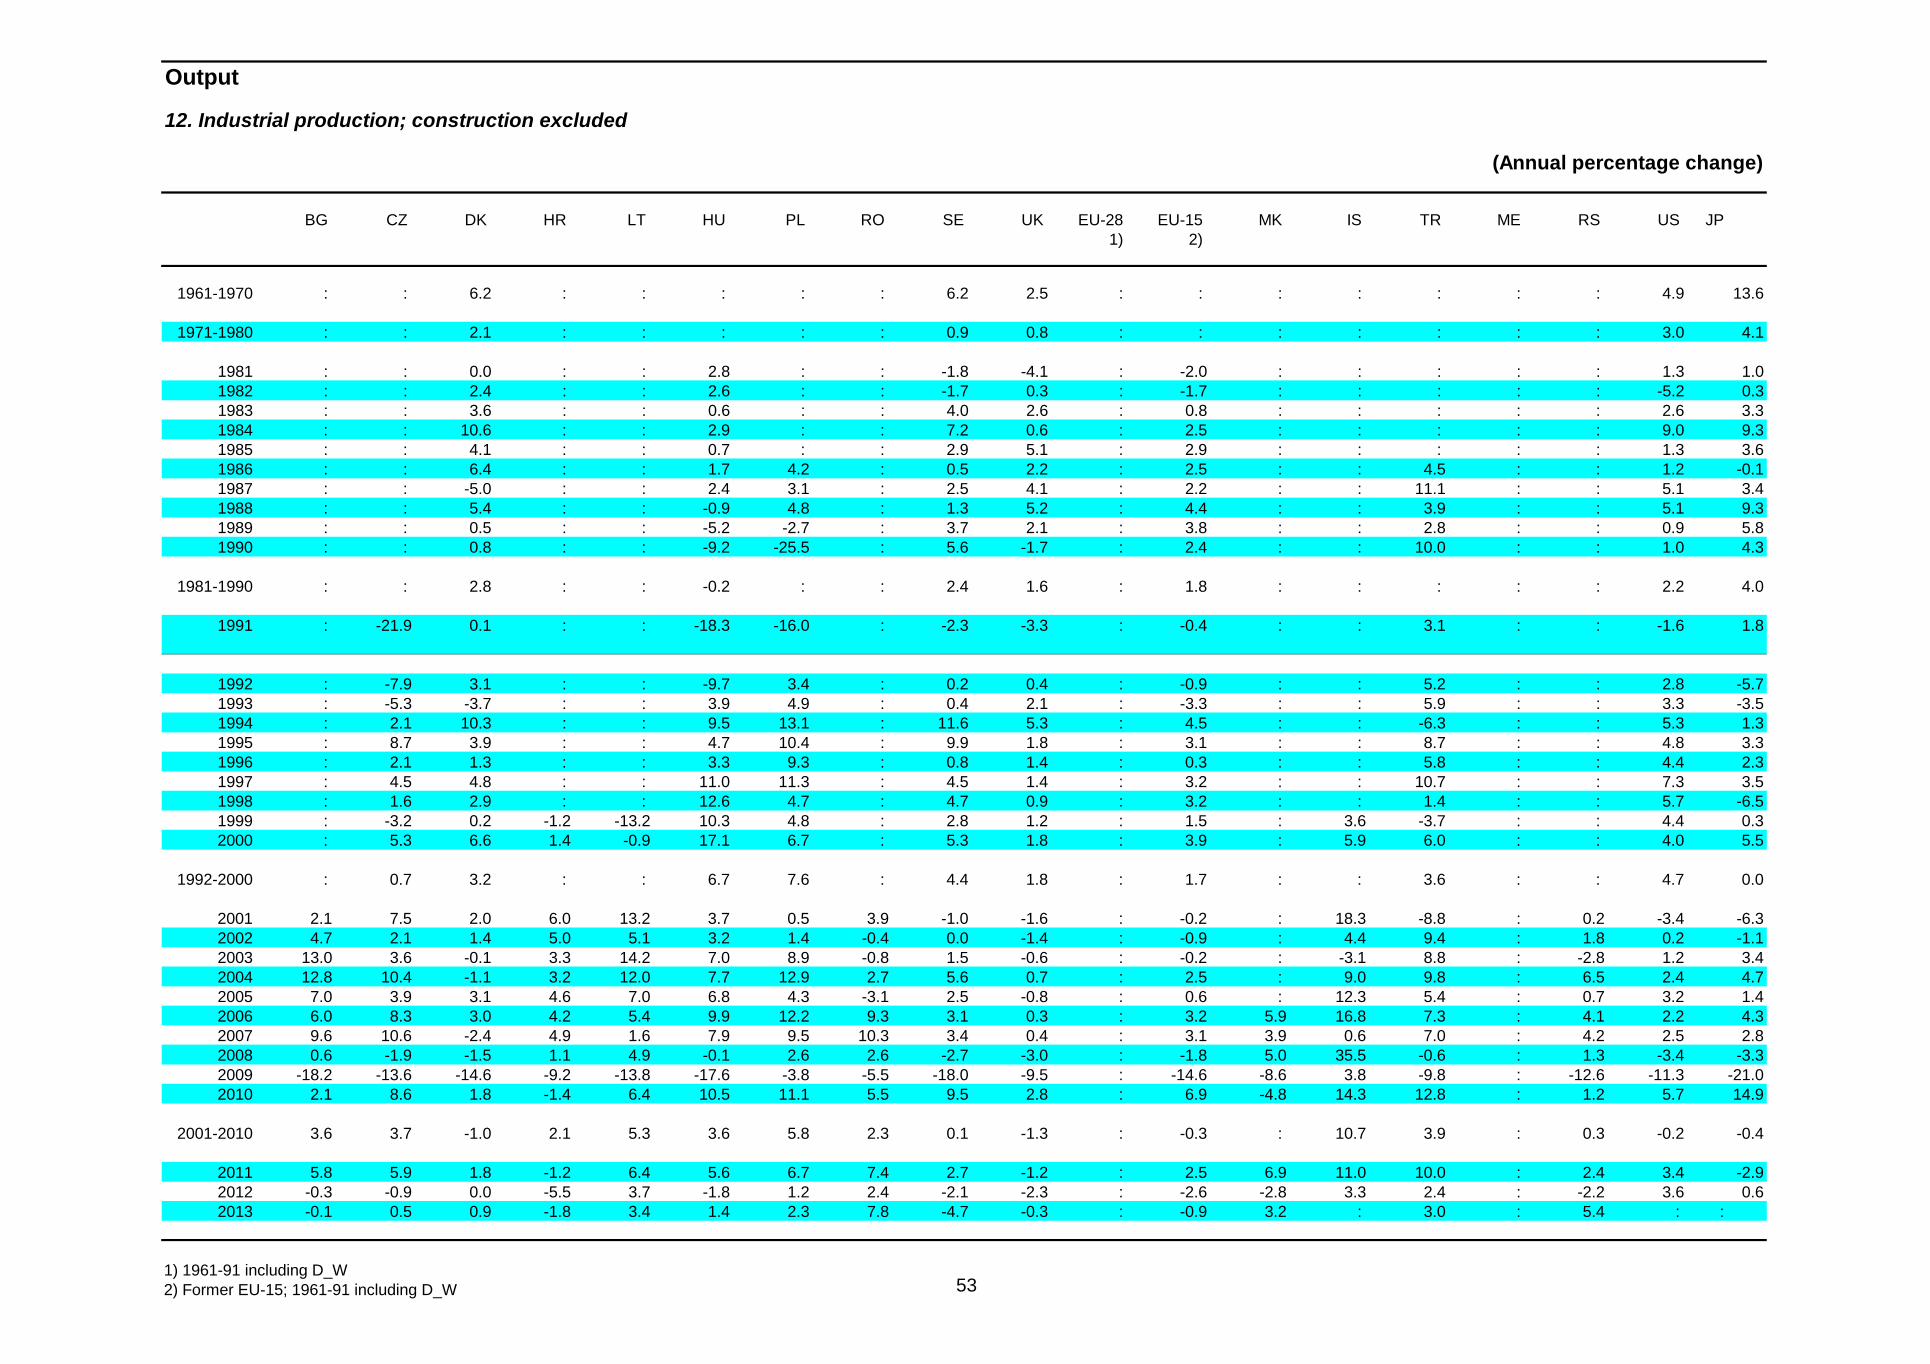
53
Output
12. Industrial production; construction excluded
(Annual percentage change)
BG CZ DK HR LT HU PL RO SE UK EU-28 EU-15 MK IS TR ME RS US JP 1) 2)
1961-1970 : : 6.2 : : : : : 6.2 2.5 : : : : : : : 4.9 13.6
1971-1980 : : 2.1 : : : : : 0.9 0.8 : : : : : : : 3.0 4.1
1981 : : 0.0 : : 2.8 : : -1.8 -4.1 : -2.0 : : : : : 1.3 1.01982 : : 2.4 : : 2.6 : : -1.7 0.3 : -1.7 : : : : : -5.2 0.31983 : : 3.6 : : 0.6 : : 4.0 2.6 : 0.8 : : : : : 2.6 3.31984 : : 10.6 : : 2.9 : : 7.2 0.6 : 2.5 : : : : : 9.0 9.31985 : : 4.1 : : 0.7 : : 2.9 5.1 : 2.9 : : : : : 1.3 3.61986 : : 6.4 : : 1.7 4.2 : 0.5 2.2 : 2.5 : : 4.5 : : 1.2 -0.11987 : : -5.0 : : 2.4 3.1 : 2.5 4.1 : 2.2 : : 11.1 : : 5.1 3.41988 : : 5.4 : : -0.9 4.8 : 1.3 5.2 : 4.4 : : 3.9 : : 5.1 9.31989 : : 0.5 : : -5.2 -2.7 : 3.7 2.1 : 3.8 : : 2.8 : : 0.9 5.81990 : : 0.8 : : -9.2 -25.5 : 5.6 -1.7 : 2.4 : : 10.0 : : 1.0 4.3
1981-1990 : : 2.8 : : -0.2 : : 2.4 1.6 : 1.8 : : : : : 2.2 4.0
1991 : -21.9 0.1 : : -18.3 -16.0 : -2.3 -3.3 : -0.4 : : 3.1 : : -1.6 1.8
1992 : -7.9 3.1 : : -9.7 3.4 : 0.2 0.4 : -0.9 : : 5.2 : : 2.8 -5.71993 : -5.3 -3.7 : : 3.9 4.9 : 0.4 2.1 : -3.3 : : 5.9 : : 3.3 -3.51994 : 2.1 10.3 : : 9.5 13.1 : 11.6 5.3 : 4.5 : : -6.3 : : 5.3 1.31995 : 8.7 3.9 : : 4.7 10.4 : 9.9 1.8 : 3.1 : : 8.7 : : 4.8 3.31996 : 2.1 1.3 : : 3.3 9.3 : 0.8 1.4 : 0.3 : : 5.8 : : 4.4 2.31997 : 4.5 4.8 : : 11.0 11.3 : 4.5 1.4 : 3.2 : : 10.7 : : 7.3 3.51998 : 1.6 2.9 : : 12.6 4.7 : 4.7 0.9 : 3.2 : : 1.4 : : 5.7 -6.51999 : -3.2 0.2 -1.2 -13.2 10.3 4.8 : 2.8 1.2 : 1.5 : 3.6 -3.7 : : 4.4 0.32000 : 5.3 6.6 1.4 -0.9 17.1 6.7 : 5.3 1.8 : 3.9 : 5.9 6.0 : : 4.0 5.5
1992-2000 : 0.7 3.2 : : 6.7 7.6 : 4.4 1.8 : 1.7 : : 3.6 : : 4.7 0.0
2001 2.1 7.5 2.0 6.0 13.2 3.7 0.5 3.9 -1.0 -1.6 : -0.2 : 18.3 -8.8 : 0.2 -3.4 -6.32002 4.7 2.1 1.4 5.0 5.1 3.2 1.4 -0.4 0.0 -1.4 : -0.9 : 4.4 9.4 : 1.8 0.2 -1.12003 13.0 3.6 -0.1 3.3 14.2 7.0 8.9 -0.8 1.5 -0.6 : -0.2 : -3.1 8.8 : -2.8 1.2 3.42004 12.8 10.4 -1.1 3.2 12.0 7.7 12.9 2.7 5.6 0.7 : 2.5 : 9.0 9.8 : 6.5 2.4 4.72005 7.0 3.9 3.1 4.6 7.0 6.8 4.3 -3.1 2.5 -0.8 : 0.6 : 12.3 5.4 : 0.7 3.2 1.42006 6.0 8.3 3.0 4.2 5.4 9.9 12.2 9.3 3.1 0.3 : 3.2 5.9 16.8 7.3 : 4.1 2.2 4.32007 9.6 10.6 -2.4 4.9 1.6 7.9 9.5 10.3 3.4 0.4 : 3.1 3.9 0.6 7.0 : 4.2 2.5 2.82008 0.6 -1.9 -1.5 1.1 4.9 -0.1 2.6 2.6 -2.7 -3.0 : -1.8 5.0 35.5 -0.6 : 1.3 -3.4 -3.32009 -18.2 -13.6 -14.6 -9.2 -13.8 -17.6 -3.8 -5.5 -18.0 -9.5 : -14.6 -8.6 3.8 -9.8 : -12.6 -11.3 -21.02010 2.1 8.6 1.8 -1.4 6.4 10.5 11.1 5.5 9.5 2.8 : 6.9 -4.8 14.3 12.8 : 1.2 5.7 14.9
2001-2010 3.6 3.7 -1.0 2.1 5.3 3.6 5.8 2.3 0.1 -1.3 : -0.3 : 10.7 3.9 : 0.3 -0.2 -0.4
2011 5.8 5.9 1.8 -1.2 6.4 5.6 6.7 7.4 2.7 -1.2 : 2.5 6.9 11.0 10.0 : 2.4 3.4 -2.92012 -0.3 -0.9 0.0 -5.5 3.7 -1.8 1.2 2.4 -2.1 -2.3 : -2.6 -2.8 3.3 2.4 : -2.2 3.6 0.62013 -0.1 0.5 0.9 -1.8 3.4 1.4 2.3 7.8 -4.7 -0.3 : -0.9 3.2 : 3.0 : 5.4 : :
1) 1961-91 including D_W2) Former EU-15; 1961-91 including D_W

54
National final uses
13. Private final consumption expenditure at current prices
(Percentage of gross domestic product at market prices)
BE DE EE IE EL ES FR IT CY LV LU MT NL AT PT SI SK FI EA-18 EA-12 1) 2) 3)
1960-1970 57.0 55.7 : 74.2 68.8 66.2 58.2 58.3 79.0 : 51.4 74.0 54.0 59.5 68.9 : : 58.5 : 58.2
1971-1980 54.1 55.8 : 67.0 60.6 63.7 56.2 58.5 75.5 : 50.4 71.8 51.9 56.4 64.8 : : 53.7 : 56.9
1981 57.3 57.9 : 67.6 64.3 65.0 58.3 59.0 66.7 : 55.5 63.9 51.5 58.0 66.6 : : 52.6 : 58.51982 58.1 57.8 : 61.4 64.0 64.6 58.6 59.1 67.4 : 55.0 66.1 51.6 58.2 66.2 : : 53.4 : 58.61983 58.6 57.9 : 61.3 65.4 64.0 58.3 58.4 68.6 : 54.4 66.9 51.9 59.5 65.2 : : 53.4 : 58.41984 57.5 57.7 : 60.4 62.9 62.6 58.4 58.5 64.8 : 53.0 68.7 50.9 58.4 67.4 : : 52.6 : 58.11985 58.3 57.1 : 61.2 62.0 62.3 58.9 58.4 65.0 : 53.6 69.9 51.2 58.3 65.0 : : 52.9 : 58.01986 57.4 55.7 : 61.5 62.6 61.5 58.3 58.5 62.3 : 50.5 67.0 50.9 57.5 63.9 : : 53.0 : 57.31987 57.1 56.1 : 60.9 66.9 61.5 59.0 58.2 60.6 : 51.2 63.8 51.2 57.3 63.7 : : 53.0 : 57.61988 55.8 55.6 : 61.3 67.2 60.8 57.9 57.7 61.8 : 49.8 63.8 50.3 56.8 64.9 : : 51.8 : 57.01989 55.2 55.7 : 60.5 68.1 61.0 57.6 58.2 60.6 : 47.2 63.4 49.9 56.5 63.8 : : 51.4 : 57.01990 55.2 54.9 : 58.0 69.4 60.5 57.5 57.2 61.0 69.4 47.0 62.6 49.7 56.4 63.3 53.4 : 51.0 : 56.5
1981-1990 57.1 56.6 : 61.4 65.3 62.4 58.3 58.3 63.9 : 51.7 65.6 50.9 57.7 65.0 : : 52.5 : 57.7
1991 54.4 56.6
1991 55.8 57.5 : 58.4 69.1 60.4 57.3 57.5 66.8 41.2 47.0 61.2 50.1 55.9 65.9 55.0 : 54.3 : 57.51992 55.1 57.6 : 58.2 70.8 61.0 57.4 58.4 63.6 35.5 45.3 60.6 49.9 56.6 65.5 55.3 : 55.4 : 57.81993 54.6 58.3 56.7 56.7 71.2 60.9 57.6 57.9 59.9 47.3 43.5 59.6 49.9 56.6 66.5 58.7 55.0 55.0 57.9 57.91994 54.3 57.9 57.0 56.5 71.1 60.7 57.3 58.5 58.7 52.6 43.3 59.0 49.7 56.2 66.0 56.8 52.3 53.7 57.7 57.71995 54.0 57.7 54.4 53.1 71.2 60.1 57.0 58.3 64.8 62.7 43.3 61.0 49.5 55.5 65.2 59.8 51.8 52.1 57.3 57.31996 54.5 58.1 57.8 53.6 71.8 59.8 57.4 57.9 66.1 67.8 43.2 63.0 50.2 56.2 65.2 59.3 52.8 52.8 57.6 57.61997 53.9 58.1 57.7 50.8 70.3 59.6 56.4 58.5 65.7 66.0 43.8 62.8 49.7 56.0 64.2 58.2 53.6 51.2 57.3 57.31998 53.8 57.7 57.8 49.3 69.9 59.5 56.2 59.1 65.4 62.2 44.4 63.1 50.4 55.3 63.3 57.8 55.1 50.4 57.2 57.21999 53.0 58.1 57.2 48.2 68.8 59.6 55.9 59.8 63.9 62.8 41.3 64.2 50.7 54.6 63.5 58.4 56.6 50.1 57.3 57.32000 53.2 58.4 55.5 47.9 69.9 59.7 56.2 59.9 65.1 63.0 40.7 63.6 50.4 54.9 63.6 57.3 56.5 49.4 57.5 57.4
1991-2000 54.2 57.9 : 53.3 70.4 60.1 56.9 58.6 64.0 56.1 43.6 61.8 50.0 55.8 64.9 57.7 : 52.4 : 57.5
2001 53.5 58.7 55.8 47.0 70.1 59.1 56.5 59.1 64.3 63.2 41.9 63.7 50.1 55.1 63.1 56.5 57.9 49.4 57.4 57.42002 52.6 58.2 56.6 46.2 70.5 58.3 56.4 58.7 64.8 62.7 41.9 61.7 50.1 54.4 62.9 55.8 57.9 50.2 57.0 57.02003 52.4 58.9 56.0 45.9 68.3 57.6 56.8 59.1 64.3 62.4 37.7 62.6 49.9 54.9 63.3 55.9 56.9 51.6 57.3 57.32004 51.7 58.5 56.3 45.4 67.9 57.9 56.6 58.6 64.8 63.0 37.1 64.0 49.4 54.8 64.0 55.0 57.4 51.3 57.0 57.02005 51.5 58.8 55.5 45.4 69.8 57.8 56.9 59.0 64.8 63.1 35.5 63.1 48.8 55.0 64.7 54.3 57.5 51.5 57.2 57.12006 51.3 57.9 55.4 45.6 69.7 57.4 56.7 59.0 64.7 65.7 33.5 63.5 47.2 54.2 65.1 52.8 57.2 51.7 56.7 56.72007 50.9 55.9 54.1 46.9 69.6 57.4 56.5 58.6 67.2 62.4 32.0 61.0 46.2 52.9 65.3 52.5 56.1 50.4 55.9 55.92008 52.0 56.2 54.8 50.0 72.3 57.2 56.9 59.2 69.8 62.5 32.9 61.3 45.5 52.8 66.8 52.6 57.2 51.5 56.3 56.32009 52.8 58.7 54.0 48.9 72.4 56.6 58.1 60.3 66.2 61.4 34.5 63.4 46.0 54.7 65.1 55.6 61.0 54.6 57.6 57.52010 53.0 57.5 52.4 49.3 73.4 57.9 58.1 60.8 66.4 63.1 32.5 59.7 45.7 55.0 65.9 57.1 58.4 55.4 57.5 57.5
2001-2010 52.2 57.9 55.1 47.0 70.4 57.7 57.0 59.2 65.7 63.0 35.9 62.4 47.9 54.4 64.6 54.8 57.8 51.8 57.0 57.0
2011 52.7 57.4 50.5 48.1 74.6 58.6 57.7 61.3 67.7 62.2 31.8 59.9 45.4 54.8 66.0 57.5 57.6 55.7 57.5 57.42012 52.9 57.5 51.2 47.8 73.6 59.3 57.7 60.9 68.8 62.4 32.1 59.4 45.6 55.1 65.7 56.9 57.7 56.4 57.5 57.52013 53.1 57.4 52.1 48.0 72.4 59.2 57.5 60.4 69.4 62.5 31.3 58.3 45.4 55.0 64.6 56.0 57.6 56.6 57.2 57.22014 52.8 57.0 52.8 47.5 70.6 59.3 57.1 60.2 68.3 62.8 30.9 57.8 44.8 54.4 64.0 55.3 57.0 56.3 56.9 56.82015 52.9 56.8 53.0 46.5 69.6 59.1 57.0 59.9 68.1 63.3 31.2 57.6 44.8 53.9 63.7 55.1 57.0 55.8 56.6 56.6
1) 1960-91 D_W 2) Euro area; 1960-91 including D_W 3) Former Euro area 12; 1960-91 including D_W

55
National final uses
13. Private final consumption expenditure at current prices
(Percentage of gross domestic product at market prices)
BG CZ DK HR LT HU PL RO SE UK EU-28 EU-15 MK IS TR ME RS US JP 1) 2)
1960-1970 : : 60.1 : : : : : 55.9 62.9 : 59.0 : 59.4 73.9 : : 59.8 52.7
1971-1980 : : 55.0 : : : : : 52.3 59.9 : 57.1 : 55.6 70.9 : : 60.6 52.4
1981 : : 55.0 : : : 74.2 61.9 51.0 59.2 : 58.3 : 56.7 68.6 : : 60.3 54.21982 : : 53.9 : : : 62.7 61.2 51.8 59.2 : 58.3 : 57.8 70.5 : : 62.0 55.41983 : : 53.1 : : : 64.8 57.2 50.1 59.4 : 58.2 : 57.9 71.4 : : 62.8 56.11984 : : 53.5 : : : 63.3 57.7 48.8 59.6 : 57.9 : 59.4 72.6 : : 61.8 55.51985 : : 53.3 : : : 52.8 57.2 49.2 59.5 : 57.9 : 60.7 68.3 : : 62.6 54.61986 : : 53.7 : : : 52.5 56.6 49.6 61.4 : 57.6 : 58.9 64.7 : : 63.1 54.31987 : : 52.3 : : : 51.6 58.8 50.7 61.3 : 57.8 : 60.7 65.6 : : 63.5 54.71988 : : 51.6 : : : 49.3 59.4 50.6 62.1 : 57.4 : 59.3 61.0 : : 63.7 53.71989 : : 51.3 : : : 51.4 59.7 49.3 62.0 : 57.4 : 58.9 63.1 : : 63.5 53.31990 : 51.4 50.3 : 54.0 : 48.0 66.9 48.8 62.1 : 56.9 : 59.8 65.9 : : 64.0 53.3
1981-1990 : : 52.8 : : : 57.1 59.7 50.0 60.6 : 57.8 : 59.0 67.2 : : 62.7 54.5
1991 57.1
1991 54.1 49.4 50.6 : 53.5 : 59.4 61.7 50.5 62.6 : 57.9 : 60.6 67.9 : : 64.1 52.81992 65.6 53.9 50.6 : 64.5 58.3 61.9 63.7 51.0 63.3 : 58.2 : 60.8 66.8 : : 64.5 53.51993 73.5 52.7 50.6 : 69.5 60.4 63.2 64.7 52.1 64.1 : 58.5 : 58.2 66.4 : : 65.0 54.31994 74.0 51.9 51.6 : 64.6 58.7 62.7 64.5 51.2 63.5 : 58.2 : 57.3 67.2 : : 64.9 55.31995 65.5 51.4 51.2 67.0 63.5 54.5 60.4 68.7 49.4 63.2 57.8 57.7 70.4 58.0 67.6 : : 65.0 55.41996 74.7 51.9 50.7 64.4 63.8 53.4 62.3 72.7 49.6 63.9 58.2 58.1 72.1 58.5 64.7 : : 65.0 55.51997 71.3 53.7 50.6 66.1 61.3 51.8 62.7 72.5 49.6 64.0 58.2 58.0 72.8 58.1 65.4 : 71.0 64.6 55.41998 65.3 52.6 50.7 63.1 61.1 52.2 62.5 77.2 49.1 64.5 58.2 58.1 72.4 58.1 66.5 : 77.2 64.9 56.11999 69.0 52.6 49.4 61.6 65.0 54.7 63.2 72.0 49.0 65.1 58.4 58.2 69.7 59.9 68.5 : 77.5 65.4 57.22000 68.4 51.9 47.7 61.8 65.2 54.9 64.1 68.5 49.2 65.6 58.6 58.5 74.4 60.6 70.5 70.0 77.6 66.1 56.5
1991-2000 68.1 52.2 50.4 : 63.2 : 62.2 68.6 50.1 64.0 : 58.1 : 59.0 67.1 : : 65.0 55.2
2001 70.3 51.5 47.3 62.4 65.5 54.4 65.0 69.2 48.8 65.7 58.6 58.5 70.0 56.2 68.4 75.0 83.0 66.9 57.32002 69.5 51.3 47.5 63.5 64.6 55.0 66.9 68.6 48.8 65.6 58.4 58.2 77.1 54.9 68.0 80.9 84.3 67.3 57.92003 69.3 51.5 47.6 61.5 64.7 56.7 65.8 66.2 48.8 65.0 58.3 58.2 77.0 57.2 71.2 74.2 80.3 67.4 57.62004 69.3 50.5 48.2 60.4 65.5 55.3 64.7 69.0 48.3 64.6 58.1 57.9 78.5 57.1 71.3 73.1 77.3 67.3 57.32005 69.2 49.3 48.2 60.2 64.9 55.0 63.4 69.5 48.2 64.7 58.2 58.1 77.3 59.4 71.7 69.9 77.1 67.1 57.82006 67.5 48.6 48.2 58.9 65.0 53.8 62.5 68.9 47.2 63.9 57.7 57.5 78.2 58.2 70.5 77.3 77.1 67.1 57.92007 69.0 47.7 48.4 59.0 64.3 55.0 60.5 66.9 46.7 63.6 57.0 56.9 76.7 57.4 71.3 88.4 76.3 67.3 57.32008 66.4 48.9 47.9 58.5 65.6 54.2 61.6 64.9 47.0 63.5 57.2 57.0 80.2 53.4 69.8 91.2 77.0 68.0 58.32009 63.2 50.6 49.4 58.4 68.5 54.5 61.1 62.1 49.3 64.4 58.2 58.1 76.5 51.0 71.5 84.0 79.7 68.3 60.12010 62.8 50.6 48.6 59.4 64.3 53.1 61.3 63.8 48.5 64.5 58.2 58.1 74.7 51.5 71.7 82.2 80.2 68.2 59.3
2001-2010 67.6 50.0 48.1 60.2 65.3 54.7 63.3 66.9 48.2 64.5 58.0 57.8 76.6 55.6 70.6 79.6 79.2 67.5 58.1
2011 62.4 50.6 48.7 60.2 62.8 53.3 61.1 63.4 48.0 64.6 58.1 58.0 75.1 51.9 71.2 82.5 77.0 69.0 60.32012 65.8 50.6 49.1 60.4 63.3 54.8 61.4 63.6 48.4 65.8 58.4 58.3 74.7 53.7 70.2 83.6 77.0 68.6 60.72013 63.1 50.7 48.7 61.0 63.8 53.8 60.8 62.8 48.5 66.4 58.2 58.2 76.9 53.6 70.9 80.8 74.1 68.5 61.22014 62.2 49.9 48.7 60.8 63.8 52.7 60.3 62.6 48.3 66.1 58.0 57.9 78.4 55.6 69.9 79.7 72.1 68.3 61.12015 62.0 49.7 48.7 60.5 63.8 52.5 60.1 63.0 48.2 65.8 57.7 57.7 79.4 56.5 68.1 78.6 69.8 68.1 60.9
1) 1960-91 including D_W 2) Former EU-15; 1960-91 including D_W

56
National final uses
14. Private final consumption expenditure at current prices per head of population
(EUR 1); EU-15 = 100 2))
BE DE EE IE EL ES FR IT CY LV LU MT NL AT PT SI SK FI EA-18 EA-12 3) 4) 5)
1960 119.7 115.1 : 82.6 57.4 41.4 117.6 71.0 59.3 : 153.2 49.3 86.3 85.7 42.3 : : 105.3 : 89.3
1965 108.5 116.0 : 78.4 59.0 53.9 118.7 77.5 51.0 : 142.7 39.5 94.4 84.5 41.0 : : 116.1 : 93.0
1970 107.7 125.5 : 76.0 65.9 55.1 116.0 86.7 51.5 : 135.8 45.2 105.0 82.8 45.1 : : 98.2 : 97.3
1975 117.6 131.7 : 63.8 59.5 66.7 122.1 77.8 39.0 : 146.5 37.7 114.9 98.4 50.0 : : 108.9 : 100.9
1980 118.5 132.2 : 71.5 59.0 65.0 119.0 80.6 52.9 : 146.9 46.4 112.9 102.6 36.2 : : 97.7 : 99.6
1981 112.8 125.8 : 75.4 61.9 63.5 119.5 81.6 53.7 : 142.8 49.1 103.2 101.1 40.4 : : 106.5 : 97.91982 104.7 126.9 : 73.3 66.5 63.2 117.9 84.4 57.1 : 134.1 50.7 103.3 105.9 38.8 : : 113.0 : 98.41983 103.7 131.1 : 72.9 63.4 56.3 115.9 89.5 63.1 : 134.9 52.5 103.8 113.5 36.2 : : 111.9 : 99.01984 101.9 129.4 : 72.4 61.9 57.8 114.6 92.8 67.1 : 135.0 55.2 99.7 110.1 36.2 : : 119.2 : 98.91985 103.7 125.9 : 75.2 57.9 58.3 116.4 92.7 52.9 : 136.4 41.8 97.0 108.9 35.4 : : 122.0 : 98.31986 104.4 128.7 : 74.4 51.0 58.8 117.3 96.7 50.6 : 137.4 39.9 98.2 112.5 35.8 : : 117.5 : 99.81987 104.1 129.8 : 70.7 51.0 60.2 115.5 97.7 45.3 : 139.0 35.9 96.8 113.5 36.2 : : 118.0 : 100.01988 99.6 124.8 : 71.3 53.7 63.2 111.1 97.0 54.2 : 137.2 42.2 91.2 109.0 39.0 : : 123.6 : 98.01989 97.8 121.7 : 72.4 55.3 68.7 108.9 100.3 50.3 : 135.1 39.1 87.3 106.1 40.8 : : 131.4 : 98.31990 99.5 121.6 : 70.9 56.5 71.8 109.0 101.7 53.9 : 138.2 40.8 86.9 107.3 43.9 : : 126.0 : 99.2
1991 99.0 121.1 : 69.2 57.8 74.2 104.4 103.9 57.2 : 142.2 41.0 86.1 106.0 50.0 28.7 : 115.8 : 98.9
1991 100.2 112.5 : 70.1 58.5 75.1 105.7 105.2 57.9 : 144.0 41.5 87.2 107.3 50.7 29.1 : 117.3 : 98.71992 100.7 116.9 : 71.3 59.8 75.7 106.2 103.5 58.7 1.8 140.7 41.0 87.5 110.4 55.5 28.7 : 95.7 : 99.71993 104.9 125.7 5.7 70.8 61.5 69.0 110.5 91.3 57.0 3.9 150.8 39.4 93.2 117.5 54.3 34.1 12.2 82.7 96.8 100.21994 107.5 126.5 7.8 73.3 61.9 65.8 109.6 90.0 58.5 7.1 155.6 40.5 93.9 118.1 53.6 35.6 12.6 87.9 96.6 99.81995 110.6 130.0 10.4 73.1 63.7 66.3 110.0 84.7 66.6 9.2 159.4 43.8 97.8 121.4 55.7 46.0 13.8 97.3 97.5 100.61996 105.6 123.4 13.7 78.4 66.1 67.3 108.2 92.0 66.1 11.1 153.2 45.1 96.6 118.4 56.1 45.0 14.8 94.3 96.7 99.71997 100.7 116.3 15.8 85.9 66.9 65.7 102.1 93.8 65.7 12.9 147.1 47.1 93.8 111.3 56.1 45.5 16.2 93.4 93.5 96.31998 99.7 113.3 17.2 86.5 64.6 66.5 101.7 94.1 67.4 13.2 149.5 47.5 95.5 109.5 56.7 46.9 16.9 93.8 92.8 95.51999 97.4 111.3 17.5 91.5 65.1 68.1 99.7 93.8 66.7 14.2 149.7 49.4 97.4 107.1 58.3 48.3 15.8 93.3 92.1 94.82000 96.5 107.0 18.3 97.8 64.4 68.7 98.0 92.8 68.7 16.5 150.9 52.5 97.4 105.0 58.3 45.7 17.0 92.9 90.6 93.1
2001 96.4 106.8 20.3 101.9 66.3 70.5 98.6 92.9 70.1 17.8 152.5 51.9 99.7 104.7 58.8 46.2 18.1 94.7 91.2 93.72002 95.3 104.7 22.5 106.9 69.3 71.7 98.4 93.1 70.4 18.5 156.7 50.5 100.5 103.4 59.3 47.9 19.5 96.5 91.0 93.52003 95.9 105.5 24.8 111.1 72.9 74.0 100.1 94.7 71.8 18.7 148.1 50.1 101.0 104.7 59.9 49.7 21.5 99.2 92.4 94.92004 95.9 103.3 26.8 111.1 74.9 75.8 99.6 93.5 74.4 20.6 147.6 49.4 99.0 104.5 60.4 49.8 24.1 99.1 91.9 94.22005 95.8 101.8 29.6 114.3 78.0 77.7 99.7 92.9 76.6 23.4 148.2 49.5 98.5 105.3 60.8 50.1 26.4 99.3 91.9 94.12006 96.0 100.6 34.1 117.3 80.9 79.5 99.6 92.6 78.3 29.3 148.7 50.5 96.5 105.0 61.2 50.6 29.2 100.8 91.9 94.02007 96.3 98.7 38.8 120.9 83.2 80.6 100.0 91.8 83.3 35.6 149.3 50.0 96.5 104.5 62.4 53.8 34.1 102.6 91.8 93.72008 101.4 102.0 40.0 120.8 90.9 82.3 103.3 93.9 91.7 39.6 151.6 53.8 99.1 108.1 65.2 58.4 41.1 108.5 94.9 96.72009 104.4 106.6 35.3 109.5 93.7 80.9 106.5 95.4 86.5 33.3 154.4 57.4 99.9 113.6 64.7 60.4 44.3 110.5 97.0 98.92010 104.7 106.1 33.9 103.4 88.4 79.4 105.0 94.3 84.2 32.8 151.9 56.1 97.6 113.4 64.8 59.8 42.8 111.6 95.8 97.7
2011 104.6 108.1 36.1 100.8 82.5 78.4 104.7 94.1 84.0 36.0 150.6 56.8 96.1 115.3 62.8 59.7 43.4 115.1 95.8 97.72012 104.1 108.3 38.5 98.6 74.2 76.5 103.6 90.6 81.6 39.5 149.9 56.3 94.3 116.0 59.3 56.5 43.9 115.9 94.3 96.12013 105.1 110.5 41.4 98.8 68.6 75.9 103.9 89.0 76.2 41.8 150.6 57.2 93.9 117.4 58.9 55.3 44.3 116.1 94.5 96.22014 104.7 110.7 43.0 97.6 65.3 75.5 102.8 87.7 69.5 43.6 150.7 57.6 92.6 117.1 58.2 54.3 43.9 114.4 93.8 95.52015 104.6 111.3 45.0 95.3 64.8 75.5 102.1 86.9 68.5 46.1 150.7 58.1 92.1 116.8 57.7 54.0 44.3 112.8 93.5 95.2
1) 1960-1998 ECU 2) Former EU-15; 1960-91 including D_W 3) 1960-91 D_W 4) Euro area; 1960-91 including D_W 5) Former Euro area 12; 1960-91 including D_W
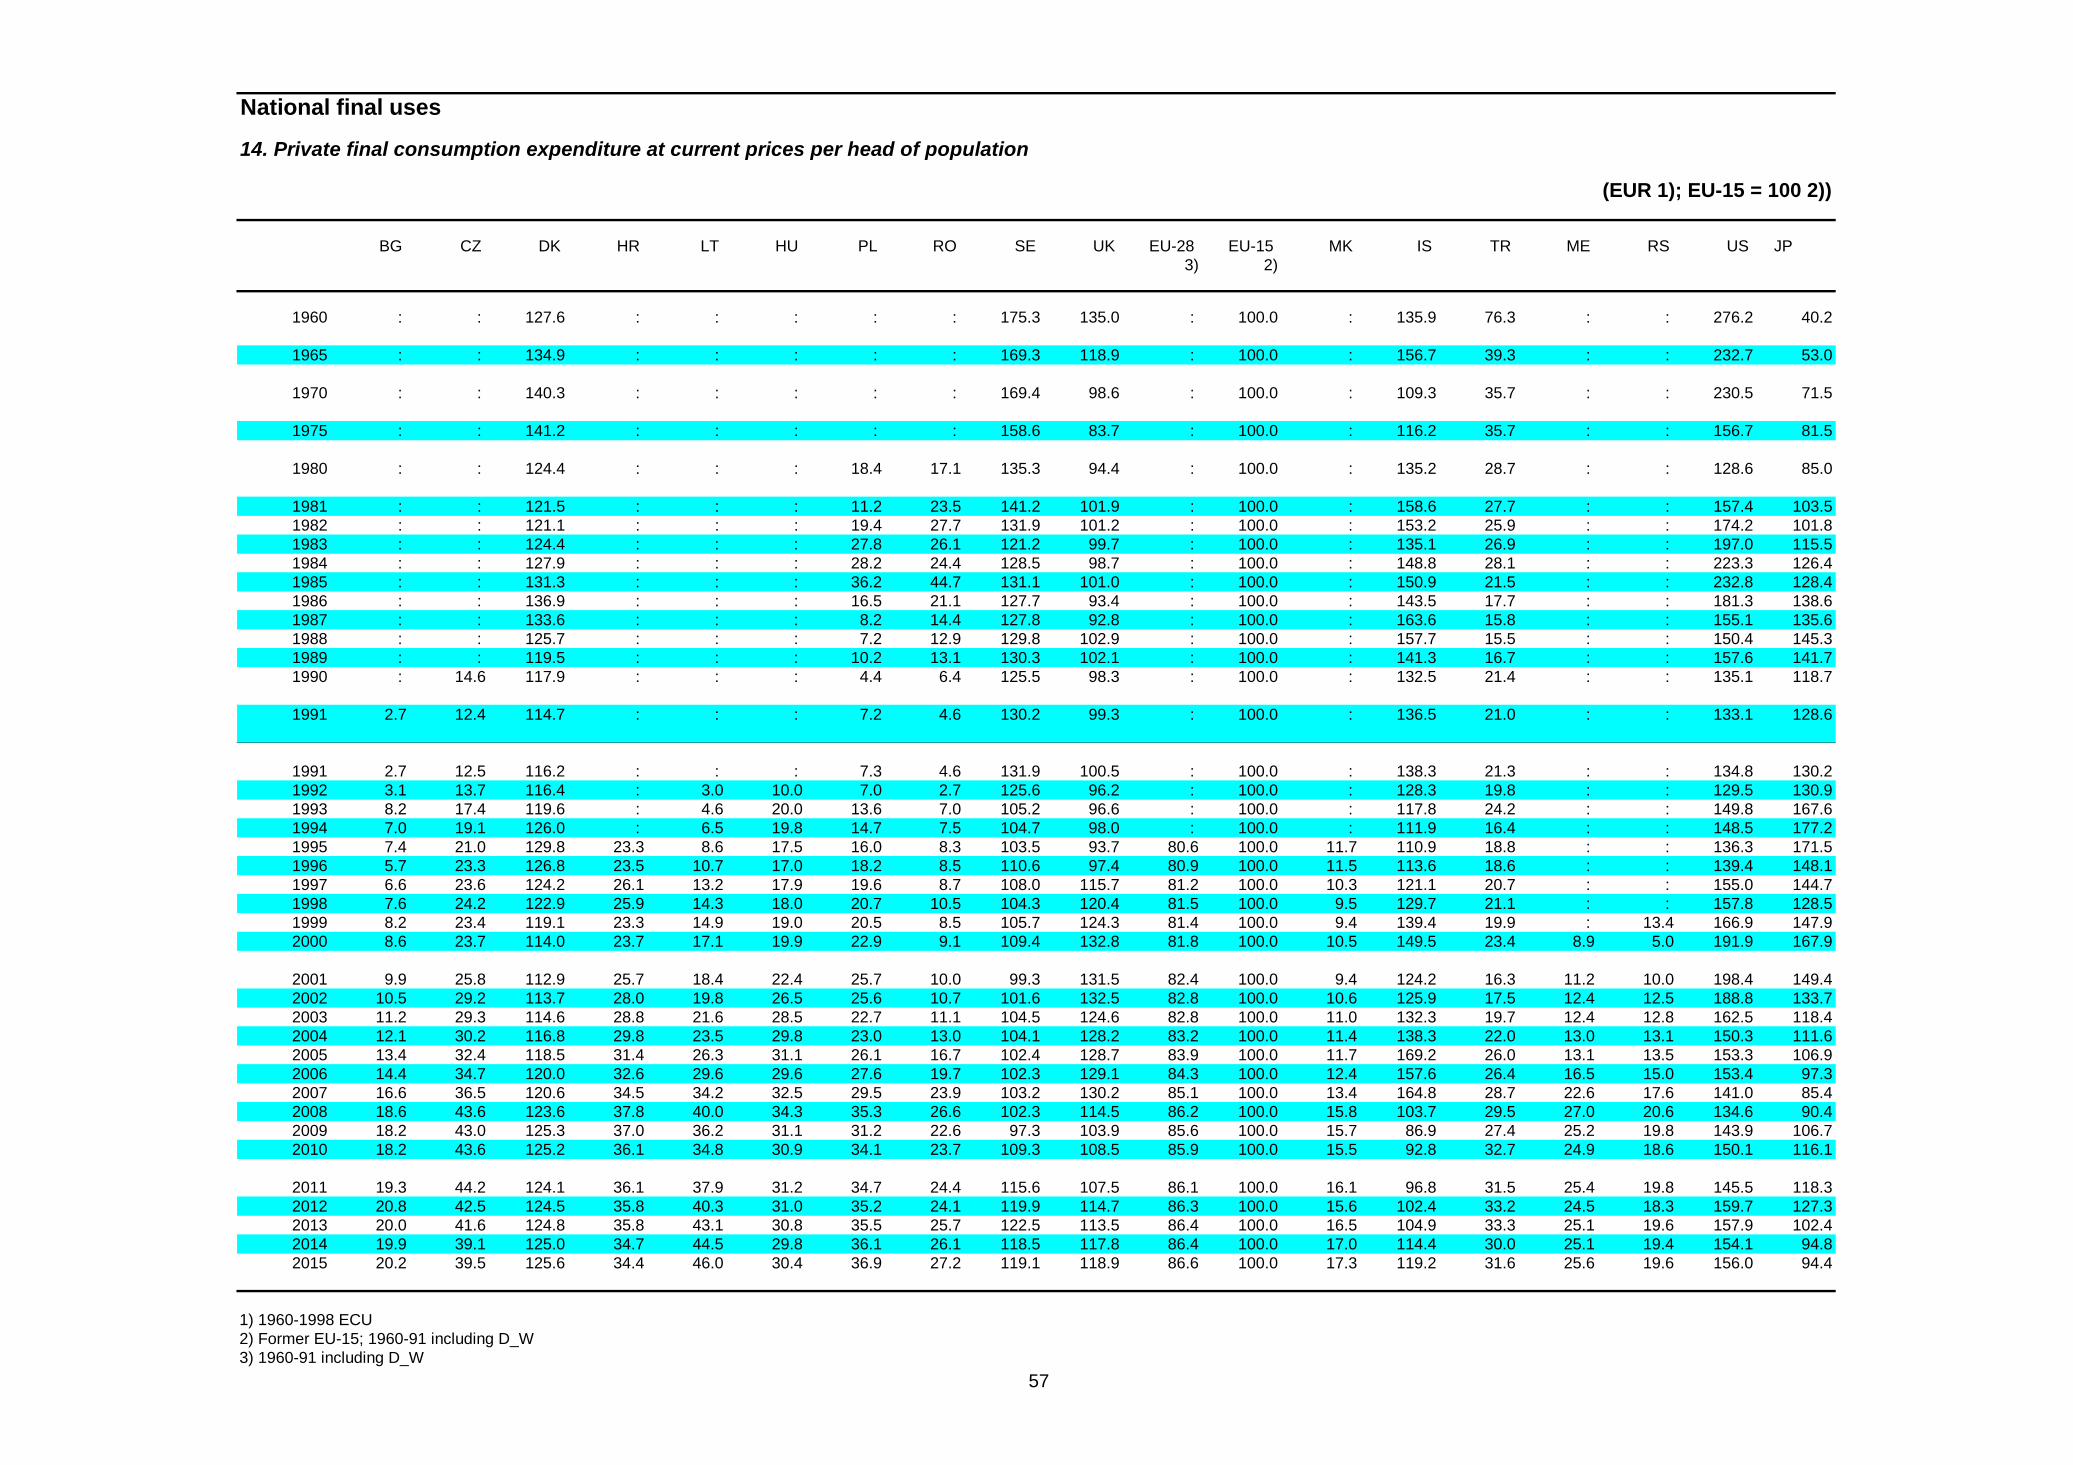
57
National final uses
14. Private final consumption expenditure at current prices per head of population
(EUR 1); EU-15 = 100 2))
BG CZ DK HR LT HU PL RO SE UK EU-28 EU-15 MK IS TR ME RS US JP 3) 2)
1960 : : 127.6 : : : : : 175.3 135.0 : 100.0 : 135.9 76.3 : : 276.2 40.2
1965 : : 134.9 : : : : : 169.3 118.9 : 100.0 : 156.7 39.3 : : 232.7 53.0
1970 : : 140.3 : : : : : 169.4 98.6 : 100.0 : 109.3 35.7 : : 230.5 71.5
1975 : : 141.2 : : : : : 158.6 83.7 : 100.0 : 116.2 35.7 : : 156.7 81.5
1980 : : 124.4 : : : 18.4 17.1 135.3 94.4 : 100.0 : 135.2 28.7 : : 128.6 85.0
1981 : : 121.5 : : : 11.2 23.5 141.2 101.9 : 100.0 : 158.6 27.7 : : 157.4 103.51982 : : 121.1 : : : 19.4 27.7 131.9 101.2 : 100.0 : 153.2 25.9 : : 174.2 101.81983 : : 124.4 : : : 27.8 26.1 121.2 99.7 : 100.0 : 135.1 26.9 : : 197.0 115.51984 : : 127.9 : : : 28.2 24.4 128.5 98.7 : 100.0 : 148.8 28.1 : : 223.3 126.41985 : : 131.3 : : : 36.2 44.7 131.1 101.0 : 100.0 : 150.9 21.5 : : 232.8 128.41986 : : 136.9 : : : 16.5 21.1 127.7 93.4 : 100.0 : 143.5 17.7 : : 181.3 138.61987 : : 133.6 : : : 8.2 14.4 127.8 92.8 : 100.0 : 163.6 15.8 : : 155.1 135.61988 : : 125.7 : : : 7.2 12.9 129.8 102.9 : 100.0 : 157.7 15.5 : : 150.4 145.31989 : : 119.5 : : : 10.2 13.1 130.3 102.1 : 100.0 : 141.3 16.7 : : 157.6 141.71990 : 14.6 117.9 : : : 4.4 6.4 125.5 98.3 : 100.0 : 132.5 21.4 : : 135.1 118.7
1991 2.7 12.4 114.7 : : : 7.2 4.6 130.2 99.3 : 100.0 : 136.5 21.0 : : 133.1 128.6
1991 2.7 12.5 116.2 : : : 7.3 4.6 131.9 100.5 : 100.0 : 138.3 21.3 : : 134.8 130.21992 3.1 13.7 116.4 : 3.0 10.0 7.0 2.7 125.6 96.2 : 100.0 : 128.3 19.8 : : 129.5 130.91993 8.2 17.4 119.6 : 4.6 20.0 13.6 7.0 105.2 96.6 : 100.0 : 117.8 24.2 : : 149.8 167.61994 7.0 19.1 126.0 : 6.5 19.8 14.7 7.5 104.7 98.0 : 100.0 : 111.9 16.4 : : 148.5 177.21995 7.4 21.0 129.8 23.3 8.6 17.5 16.0 8.3 103.5 93.7 80.6 100.0 11.7 110.9 18.8 : : 136.3 171.51996 5.7 23.3 126.8 23.5 10.7 17.0 18.2 8.5 110.6 97.4 80.9 100.0 11.5 113.6 18.6 : : 139.4 148.11997 6.6 23.6 124.2 26.1 13.2 17.9 19.6 8.7 108.0 115.7 81.2 100.0 10.3 121.1 20.7 : : 155.0 144.71998 7.6 24.2 122.9 25.9 14.3 18.0 20.7 10.5 104.3 120.4 81.5 100.0 9.5 129.7 21.1 : : 157.8 128.51999 8.2 23.4 119.1 23.3 14.9 19.0 20.5 8.5 105.7 124.3 81.4 100.0 9.4 139.4 19.9 : 13.4 166.9 147.92000 8.6 23.7 114.0 23.7 17.1 19.9 22.9 9.1 109.4 132.8 81.8 100.0 10.5 149.5 23.4 8.9 5.0 191.9 167.9
2001 9.9 25.8 112.9 25.7 18.4 22.4 25.7 10.0 99.3 131.5 82.4 100.0 9.4 124.2 16.3 11.2 10.0 198.4 149.42002 10.5 29.2 113.7 28.0 19.8 26.5 25.6 10.7 101.6 132.5 82.8 100.0 10.6 125.9 17.5 12.4 12.5 188.8 133.72003 11.2 29.3 114.6 28.8 21.6 28.5 22.7 11.1 104.5 124.6 82.8 100.0 11.0 132.3 19.7 12.4 12.8 162.5 118.42004 12.1 30.2 116.8 29.8 23.5 29.8 23.0 13.0 104.1 128.2 83.2 100.0 11.4 138.3 22.0 13.0 13.1 150.3 111.62005 13.4 32.4 118.5 31.4 26.3 31.1 26.1 16.7 102.4 128.7 83.9 100.0 11.7 169.2 26.0 13.1 13.5 153.3 106.92006 14.4 34.7 120.0 32.6 29.6 29.6 27.6 19.7 102.3 129.1 84.3 100.0 12.4 157.6 26.4 16.5 15.0 153.4 97.32007 16.6 36.5 120.6 34.5 34.2 32.5 29.5 23.9 103.2 130.2 85.1 100.0 13.4 164.8 28.7 22.6 17.6 141.0 85.42008 18.6 43.6 123.6 37.8 40.0 34.3 35.3 26.6 102.3 114.5 86.2 100.0 15.8 103.7 29.5 27.0 20.6 134.6 90.42009 18.2 43.0 125.3 37.0 36.2 31.1 31.2 22.6 97.3 103.9 85.6 100.0 15.7 86.9 27.4 25.2 19.8 143.9 106.72010 18.2 43.6 125.2 36.1 34.8 30.9 34.1 23.7 109.3 108.5 85.9 100.0 15.5 92.8 32.7 24.9 18.6 150.1 116.1
2011 19.3 44.2 124.1 36.1 37.9 31.2 34.7 24.4 115.6 107.5 86.1 100.0 16.1 96.8 31.5 25.4 19.8 145.5 118.32012 20.8 42.5 124.5 35.8 40.3 31.0 35.2 24.1 119.9 114.7 86.3 100.0 15.6 102.4 33.2 24.5 18.3 159.7 127.32013 20.0 41.6 124.8 35.8 43.1 30.8 35.5 25.7 122.5 113.5 86.4 100.0 16.5 104.9 33.3 25.1 19.6 157.9 102.42014 19.9 39.1 125.0 34.7 44.5 29.8 36.1 26.1 118.5 117.8 86.4 100.0 17.0 114.4 30.0 25.1 19.4 154.1 94.82015 20.2 39.5 125.6 34.4 46.0 30.4 36.9 27.2 119.1 118.9 86.6 100.0 17.3 119.2 31.6 25.6 19.6 156.0 94.4
1) 1960-1998 ECU 2) Former EU-15; 1960-91 including D_W 3) 1960-91 including D_W

58
National final uses
15. Private final consumption expenditure at current prices per head of population
(PPS; EU-15 = 100 1))
BE DE EE IE EL ES FR IT CY LV LU MT NL AT PT SI SK FI EA-18 EA-12 2) 3) 4)
1960 104.2 122.7 : 86.5 71.8 69.4 92.5 83.5 : : 133.7 : 102.2 104.4 50.8 : : 84.7 : 93.6
1965 99.9 121.3 : 80.2 79.3 82.2 94.0 86.0 : : 136.9 : 102.7 102.7 54.9 : : 88.9 : 96.1
1970 97.8 117.9 : 79.8 90.1 83.7 97.6 95.8 : : 116.1 : 104.6 101.2 58.2 : : 85.8 : 98.7
1975 101.5 118.2 : 75.9 92.7 89.5 99.2 96.4 : : 130.1 : 98.9 107.6 62.0 : : 89.0 : 100.1
1980 106.6 124.1 : 79.4 97.0 82.4 100.8 101.7 : : 129.9 : 97.4 110.8 62.4 : : 88.1 : 102.1
1981 108.3 124.5 : 80.4 95.7 81.4 103.0 101.5 : : 132.2 : 92.7 111.2 64.4 : : 88.0 : 102.31982 109.6 122.9 : 73.3 92.8 80.9 104.5 101.4 : : 131.3 : 90.6 112.8 64.5 : : 90.9 : 101.91983 109.5 123.8 : 71.5 92.0 80.1 103.3 99.9 : : 131.8 : 91.4 117.3 63.0 : : 91.8 : 101.51984 108.1 125.1 : 71.8 88.3 78.0 102.6 101.4 : : 133.9 : 90.3 113.1 63.1 : : 91.2 : 101.31985 109.0 124.3 : 73.2 87.0 77.5 102.5 102.0 : : 136.1 : 90.9 113.2 60.4 : : 92.3 : 101.01986 107.1 121.3 : 72.2 86.1 77.1 101.0 102.7 : : 137.6 : 90.3 111.8 59.9 : : 92.6 : 100.01987 105.5 120.1 : 72.5 87.0 78.7 101.0 102.3 : : 139.8 : 89.4 109.6 62.4 : : 92.6 : 99.81988 104.2 119.0 : 74.0 87.9 79.0 99.9 102.4 : : 141.6 : 87.4 108.6 65.0 : : 92.0 : 99.31989 103.0 118.8 : 75.7 89.2 80.5 99.8 103.5 : : 141.4 : 87.1 108.2 66.1 : : 92.7 : 99.81990 104.2 119.1 : 76.9 88.9 81.3 100.1 102.0 72.4 59.7 144.4 : 88.5 110.2 69.8 63.8 : 90.7 : 100.1
1991 105.3 120.6 : 77.3 89.0 81.8 98.9 102.4 76.5 30.6 152.3 70.9 89.2 110.1 74.2 58.8 : 88.8 : 100.6
1991 106.6 112.1 : 78.3 90.2 82.9 100.2 103.7 77.5 31.0 154.3 71.8 90.3 111.5 75.1 59.6 : 89.9 : 100.31992 104.9 111.9 : 78.9 90.5 83.0 99.7 104.6 77.7 18.1 147.1 72.7 89.4 112.3 75.9 55.9 : 86.7 : 100.21993 102.7 111.3 29.2 78.6 88.9 81.8 99.1 102.9 72.0 21.9 145.4 73.9 90.1 111.9 76.4 61.2 36.0 85.1 96.9 99.31994 102.7 110.6 28.9 80.9 87.8 81.5 98.2 103.7 71.5 24.7 144.6 75.0 89.8 111.0 75.1 61.2 35.4 83.9 96.6 99.01995 102.8 109.9 28.9 81.6 87.7 81.2 97.7 104.8 83.9 29.1 142.4 80.4 90.3 110.4 74.5 66.0 36.4 82.9 96.6 98.81996 101.1 108.8 32.4 85.6 87.8 81.2 97.1 103.1 84.2 32.3 141.2 76.5 92.5 111.4 74.4 66.6 38.8 82.6 96.1 98.21997 100.4 106.7 35.8 86.4 87.3 82.3 95.6 103.6 82.7 33.9 139.5 77.6 93.5 109.5 74.8 67.4 40.8 83.8 95.6 97.61998 98.1 104.4 36.4 88.5 85.6 84.1 95.7 105.7 83.3 33.7 143.6 77.6 96.0 108.6 74.5 67.8 42.5 85.1 95.6 97.61999 96.8 104.5 36.0 90.0 83.6 85.0 95.0 104.8 82.2 33.7 145.5 79.8 98.3 106.8 76.5 70.2 42.4 85.1 95.5 97.52000 99.4 101.5 36.9 93.3 86.1 85.9 95.8 104.2 84.3 34.0 147.3 81.5 100.1 107.0 76.4 67.9 41.8 85.6 95.2 97.1
2001 98.4 101.0 38.4 92.8 89.2 86.1 96.9 103.9 86.1 36.2 145.3 76.9 99.4 103.1 75.3 67.2 45.0 84.6 95.2 97.02002 99.2 100.1 42.5 95.9 94.5 88.0 97.9 99.1 86.2 38.9 151.0 76.4 100.3 103.9 75.5 69.1 47.1 86.6 95.0 96.72003 97.4 102.6 46.0 97.7 94.5 87.7 95.3 99.0 85.7 41.2 140.3 77.5 97.2 105.7 75.6 70.4 47.5 87.6 95.0 96.62004 95.3 102.7 49.2 98.4 96.0 89.0 94.4 95.5 89.5 44.6 142.5 77.6 97.1 106.5 75.2 72.4 49.8 90.6 94.5 96.02005 93.8 103.5 52.0 99.7 96.3 89.6 95.2 94.5 91.4 47.6 137.1 77.0 96.9 104.7 78.3 72.1 52.6 89.5 94.8 96.32006 93.1 102.9 56.2 102.0 99.0 92.6 94.5 95.1 92.9 53.6 139.2 76.9 95.2 105.0 79.2 71.2 55.8 90.9 95.2 96.62007 92.7 101.4 59.6 107.7 98.9 94.5 95.6 95.9 99.6 56.3 137.9 75.2 96.0 102.9 80.7 72.9 59.8 93.1 95.7 96.92008 94.7 102.5 59.5 103.6 105.8 93.2 95.6 97.1 109.3 57.5 136.5 78.4 96.0 103.5 82.0 75.1 65.3 96.5 96.5 97.62009 96.4 104.4 53.3 97.3 106.4 90.3 98.0 97.0 102.5 51.4 134.8 83.1 94.1 106.6 80.9 74.3 68.7 97.0 97.0 98.12010 99.4 107.1 52.1 98.6 101.2 89.0 98.5 97.2 100.0 54.2 132.4 80.9 92.4 108.4 82.4 74.9 67.5 98.6 97.5 98.7
2011 99.1 110.3 54.7 96.8 94.6 88.3 98.4 97.2 99.1 58.2 132.0 80.9 91.7 110.3 79.4 75.8 67.8 100.8 98.0 99.12012 99.5 111.0 57.2 96.3 88.1 88.9 98.1 95.7 98.4 62.6 132.1 80.0 91.0 111.9 78.0 74.6 68.7 101.7 97.7 98.72013 100.0 111.7 59.0 96.8 83.7 88.4 97.9 93.4 94.1 66.4 128.9 80.3 90.0 112.3 76.8 72.9 69.5 100.6 97.2 98.22014 99.8 112.0 60.7 96.1 81.6 89.1 97.3 92.7 86.8 69.3 127.6 80.6 89.2 111.8 76.5 72.0 69.7 99.3 96.9 97.92015 99.9 112.4 62.3 94.4 81.9 89.8 96.9 92.0 85.5 72.4 128.6 80.6 89.0 111.3 76.4 71.8 70.7 97.9 96.9 97.8
1) Former EU-15; 1960-91 including D_W 2) 1960-91 D_W 3) Euro area; 1960-91 including D_W 4) Former Euro area 12; 1960-91 including D_W

59
National final uses
15. Private final consumption expenditure at current prices per head of population
(PPS; EU-15 = 100 1))
BG CZ DK HR LT HU PL RO SE UK EU-28 EU-15 MK IS TR ME RS US JP 2) 1)
1960 : : 121.2 : : : : : 125.6 123.4 : 100.0 : 113.0 47.6 : : 162.2 50.1
1965 : : 119.7 : : : : : 122.9 113.0 : 100.0 : 113.0 43.3 : : 157.3 61.7
1970 : : 116.8 : : : : : 116.9 102.1 : 100.0 : 105.3 42.0 : : 150.8 74.8
1975 : : 103.5 : : : : : 110.0 97.5 : 100.0 : 110.1 42.2 : : 143.6 81.7
1980 : : 101.8 : : : : : 99.3 89.9 : 100.0 : 124.0 41.8 : : 143.2 87.3
1981 : : 100.4 : : : : : 100.0 89.0 : 100.0 : 129.7 37.4 : : 141.7 88.51982 : : 101.4 : : : : : 102.0 90.3 : 100.0 : 132.1 38.5 : : 140.4 92.11983 : : 101.4 : : : : : 99.3 92.8 : 100.0 : 126.1 39.4 : : 145.6 94.21984 : : 104.4 : : : : : 98.9 93.6 : 100.0 : 131.1 41.0 : : 149.6 95.01985 : : 106.0 : : : : : 99.5 94.6 : 100.0 : 134.3 38.3 : : 153.2 96.71986 : : 109.6 : : : : : 100.6 99.2 : 100.0 : 134.7 37.2 : : 155.2 96.41987 : : 103.7 : : : : : 102.7 100.3 : 100.0 : 144.4 39.4 : : 155.1 97.51988 : : 99.0 : : : : : 101.5 103.1 : 100.0 : 134.5 35.6 : : 155.8 99.01989 : : 95.8 : : : : : 97.7 101.8 : 100.0 : 128.2 35.2 : : 154.6 100.01990 : 63.8 93.9 : 51 : 29.0 37.2 95.2 100.8 : 100.0 : 128.7 38.9 : : 154.5 103.6
1991 26.9 53.6 94.0 : 47 : 32.8 29.6 95.2 98.4 : 100.0 : 126.6 39.1 : : 150.4 104.0
1991 27.2 54.3 95.2 : 47 : 33.3 30.0 96.5 99.7 : 100.0 : 128.2 39.6 : : 152.3 105.31992 30.5 58.1 95.2 : 44.2 44.1 34.9 28.1 94.2 100.3 : 100.0 : 120.9 40.0 : : 154.1 105.71993 33.9 56.7 94.8 : 40.1 45.5 36.9 29.0 93.8 104.9 : 100.0 : 116.2 42.3 : : 157.6 107.21994 34.1 56.3 99.5 : 33.2 44.6 37.7 29.5 93.1 106.5 : 100.0 : 114.9 39.0 : : 158.2 107.51995 30.7 58.2 99.6 45.8 33.4 41.4 38.2 33.2 91.5 107.6 86.1 100.0 28.6 114.0 40.7 : : 158.4 107.51996 28.2 60.2 99.1 46.5 34.6 40.3 41.1 35.4 91.3 110.8 86.6 100.0 28.8 115.0 40.3 : : 158.8 107.81997 27.0 60.3 99.7 49.9 35.0 40.2 43.4 31.5 90.9 114.1 86.7 100.0 28.6 118.4 42.3 : : 159.1 106.61998 26.7 56.7 99.3 47.4 36.6 41.6 44.3 30.6 89.7 114.2 86.7 100.0 28.5 121.1 42.6 : : 160.0 102.21999 28.1 55.9 95.7 44.6 37.5 43.6 45.5 28.0 91.7 114.8 86.8 100.0 27.7 123.5 40.3 : : 162.8 101.32000 28.7 54.5 92.7 45.1 38.1 44.0 45.7 26.4 92.8 116.7 86.8 100.0 29.6 118.0 43.7 30.6 : 162.4 98.8
2001 31.1 55.9 89.7 46.9 40.6 47.0 45.9 28.6 88.8 117.9 87.2 100.0 26.1 110.3 38.0 32.6 33.5 160.4 97.92002 33.0 56.5 91.6 50.0 43.3 50.6 48.5 30.4 89.6 119.5 87.8 100.0 29.2 106.9 36.9 35.7 35.5 160.7 98.92003 35.0 59.3 89.0 50.7 48.6 53.5 48.5 31.5 91.1 120.0 88.2 100.0 30.5 108.2 38.5 33.1 34.5 164.0 99.02004 36.5 60.0 92.2 51.6 51.4 52.9 49.8 36.2 92.9 122.6 88.7 100.0 32.6 113.9 42.9 33.6 35.9 166.7 99.72005 38.5 59.4 90.6 52.2 53.8 52.8 49.5 37.5 89.3 121.9 88.9 100.0 34.4 117.7 46.3 32.8 37.2 168.1 99.62006 39.6 59.9 92.1 52.4 57.7 52.1 49.9 41.4 89.3 120.3 89.3 100.0 36.4 110.5 48.2 42.5 38.6 164.7 97.52007 43.5 62.0 93.2 56.3 62.6 53.2 51.7 45.0 91.7 117.9 89.9 100.0 37.2 109.0 50.6 55.4 39.4 165.1 97.82008 45.4 62.3 93.9 58.2 66.5 54.4 54.5 50.1 91.5 114.3 90.6 100.0 42.4 103.6 51.6 61.3 43.7 161.6 96.32009 42.9 64.7 94.4 55.9 61.5 55.1 57.3 47.9 91.8 111.8 90.8 100.0 42.7 95.1 51.4 54.3 44.1 158.5 95.12010 43.1 63.5 96.6 54.1 62.0 54.5 60.2 50.4 93.1 108.2 91.0 100.0 42.2 91.7 55.7 53.4 43.2 160.0 97.2
2011 45.4 64.2 95.5 56.1 66.3 56.0 62.3 50.9 94.0 106.2 91.4 100.0 42.1 92.9 59.3 54.6 42.9 160.9 97.02012 48.9 64.1 96.6 58.0 70.9 57.1 64.5 52.7 95.5 107.4 91.9 100.0 41.4 96.7 59.2 53.0 42.7 163.3 99.22013 47.7 64.0 96.5 58.4 75.0 57.2 65.2 54.3 96.9 110.1 92.0 100.0 44.1 99.2 61.9 53.4 43.8 165.7 102.22014 48.0 63.8 97.0 57.5 77.5 57.0 66.4 55.3 97.7 111.2 92.2 100.0 46.0 104.9 61.5 53.9 43.1 167.8 103.12015 48.5 64.2 97.5 57.1 79.6 57.4 67.8 56.7 98.4 111.3 92.5 100.0 47.4 108.5 60.4 54.5 42.4 169.5 103.1
1) Former EU-15; 1960-91 including D_W 2) 1960-91 including D_W

60
National final uses
16. Private final consumption expenditure at 2005 prices
(National currency; annual percentage change)
BE DE EE IE EL ES FR IT CY LV LU MT NL AT PT SI SK FI EA-18 EA-12 1) 2) 3)
1961-1970 3.7 5.1 : 3.4 7.1 7.3 5.4 6.4 : : 4.4 : 6.2 4.1 5.3 : : 5.2 : 5.5
1971-1980 4.0 3.4 : 4.1 5.2 3.8 3.8 3.9 : : 4.1 : 3.3 4.1 4.9 : : 3.2 : 3.7
1981 0.4 -0.4 : 1.7 -0.7 -1.0 2.1 1.6 : : 1.7 : -2.4 1.3 2.5 : : 1.7 : 0.61982 2.4 -1.0 : -6.9 3.4 0.0 3.2 1.0 : : 0.4 : -1.4 1.9 2.0 : : 4.8 : 0.91983 -0.2 1.4 : 0.8 2.1 0.4 0.9 -0.2 : : 0.5 : 1.3 5.4 -0.3 : : 3.4 : 1.01984 0.4 2.0 : 2.0 0.4 -0.2 0.7 3.0 : : 1.4 : 0.6 -2.1 0.0 : : 3.3 : 1.41985 2.7 1.9 : 4.6 0.5 2.3 1.9 2.9 : : 2.7 : 1.4 1.8 1.3 : : 3.7 : 2.11986 2.7 3.8 : 2.9 -1.5 3.4 3.5 4.1 : : 3.3 : 2.4 2.2 6.3 : : 3.8 : 3.51987 1.7 3.6 : 3.3 2.7 6.0 3.2 3.6 : : 4.6 : 2.1 2.4 8.2 : : 4.8 : 3.61988 3.3 2.7 : 4.4 6.2 4.9 3.2 4.1 : : 6.0 : 1.6 2.4 8.7 : : 5.9 : 3.51989 3.3 3.0 : 5.9 6.2 5.4 3.0 4.0 : : 4.8 : 3.2 3.6 4.3 : : 5.4 : 3.61990 3.2 4.2 : 0.6 2.6 3.5 2.4 2.1 : : 3.7 : 4.0 4.2 7.8 : : -1.0 : 3.1
1981-1990 2.0 2.1 : 1.9 2.2 2.4 2.4 2.6 : : 2.9 : 1.2 2.3 4.0 : : 3.6 : 2.3
1991 3.0 4.4 : 1.8 2.8 2.9 0.5 2.7 : : 7.0 : 2.7 3.0 8.3 -10.9 : -3.6 : 2.61992 1.9 3.2 : 2.9 2.3 2.2 1.0 1.7 : : -2.3 : 0.7 3.5 3.6 -3.6 : -3.8 : 2.01993 -0.4 0.5 : 2.9 -0.7 -1.9 -0.2 -3.0 : : 2.0 : 0.8 0.1 0.6 13.8 : -3.5 : -0.71994 2.4 1.8 0.9 4.4 2.0 1.1 1.5 1.5 : : 4.0 : 2.0 2.0 0.8 4.0 : 2.4 : 1.71995 1.6 1.8 5.1 3.4 2.9 1.7 1.7 1.5 24.4 : 1.9 : 2.7 0.9 1.7 9.1 5.4 4.5 : 1.81996 2.0 1.1 12.3 7.4 2.4 2.3 1.6 1.1 3.1 10.4 3.0 7.1 4.3 3.0 3.2 3.2 9.3 3.8 1.8 1.71997 2.0 0.8 11.9 6.5 2.7 3.2 0.3 3.2 2.4 4.7 3.8 1.6 3.5 -0.1 3.7 2.9 4.4 3.3 1.7 1.71998 2.6 1.2 5.3 7.8 3.5 4.8 3.7 3.5 5.6 0.8 5.7 2.5 5.1 2.3 5.1 2.8 6.6 4.6 3.0 3.01999 2.0 2.4 0.9 9.4 2.5 5.3 3.4 2.6 2.6 4.0 3.6 6.1 5.3 2.0 5.5 6.6 0.4 2.8 3.2 3.22000 2.6 2.0 7.8 10.5 2.0 5.0 3.4 2.4 7.4 7.1 5.0 7.4 3.7 2.7 3.8 0.8 2.2 2.2 3.0 2.9
1991-2000 2.0 1.9 : 5.7 2.2 2.6 1.7 1.7 : : 3.4 : 3.1 1.9 3.6 2.7 : 1.2 : 2.0
2001 1.5 1.3 7.0 4.5 5.0 3.5 2.4 0.7 3.6 8.0 3.4 0.2 1.8 1.4 1.3 2.5 5.5 3.0 1.9 1.82002 0.6 -0.6 9.5 3.9 4.7 2.8 2.0 0.2 1.7 8.0 5.8 0.2 0.9 1.0 1.3 2.6 5.7 2.5 0.9 0.92003 0.8 0.3 9.2 2.8 3.3 2.9 1.7 0.9 2.4 6.8 -5.3 4.8 -0.2 1.3 -0.2 3.4 1.7 4.8 1.2 1.22004 1.7 0.4 8.1 3.7 3.8 4.2 1.7 0.8 6.5 9.5 2.2 1.2 1.0 2.1 2.7 3.0 4.6 3.4 1.5 1.52005 1.1 0.2 9.5 7.1 4.5 4.1 2.5 1.2 3.5 11.7 2.3 1.6 1.0 2.2 1.7 2.1 6.5 3.1 1.8 1.72006 1.7 1.5 13.5 6.7 4.4 4.0 2.2 1.4 4.7 21.3 3.2 4.3 -0.3 1.8 1.8 2.8 5.9 4.3 2.1 2.12007 1.7 -0.2 8.8 6.7 3.6 3.5 2.4 1.1 10.2 14.0 3.3 0.8 1.8 0.9 2.5 6.3 6.8 3.5 1.7 1.62008 2.0 0.8 -5.2 -0.2 4.3 -0.6 0.2 -0.8 7.8 -5.8 -0.8 4.1 1.3 0.7 1.3 2.3 6.1 1.9 0.4 0.42009 0.6 0.2 -14.8 -5.4 -1.6 -3.7 0.3 -1.6 -7.5 -22.6 -1.4 0.6 -2.1 0.9 -2.3 -0.1 0.2 -2.9 -1.0 -0.92010 2.8 1.0 -2.6 0.4 -6.2 0.2 1.6 1.5 1.5 2.3 2.6 -1.1 0.3 2.0 2.5 1.5 -0.7 3.3 1.0 1.0
2001-2010 1.4 0.5 3.9 3.0 2.5 2.0 1.7 0.5 3.3 4.6 1.5 1.7 0.5 1.4 1.2 2.6 4.2 2.7 1.2 1.1
2011 0.2 2.3 3.8 -1.4 -7.7 -1.2 0.6 -0.3 1.3 4.8 1.3 3.3 -1.1 0.8 -3.3 0.8 -0.5 2.5 0.3 0.32012 -0.3 0.8 4.9 -0.3 -9.3 -2.8 -0.3 -4.0 -2.0 5.8 2.2 -0.2 -1.6 0.5 -5.3 -4.8 -0.2 0.3 -1.3 -1.42013 0.7 0.9 4.2 -1.1 -6.0 -2.1 0.3 -2.6 -5.7 5.4 1.7 1.8 -2.1 -0.2 -1.7 -2.7 -0.1 -0.8 -0.7 -0.72014 1.6 1.5 4.5 0.4 -1.8 1.3 0.6 0.4 -6.3 4.8 2.4 2.2 -0.2 0.7 0.7 0.2 1.3 -0.1 0.8 0.82015 1.9 1.8 3.8 0.8 1.6 1.6 1.2 0.8 0.7 5.1 2.5 2.3 0.9 1.0 0.8 1.1 2.3 0.3 1.3 1.3
1) 1961-91 D_W 2) Weighted in common currency; Euro area 3) Weighted in common currency; Former Euro area 12; 1961-91 including D_W

61
National final uses
16. Private final consumption expenditure at 2005 prices
(National currency; annual percentage change)
BG CZ DK HR LT HU PL RO SE UK EU-28 EU-15 MK IS TR ME RS US JP 1) 2)
1961-1970 : : 4.8 : : : : : 3.7 2.4 : 4.8 : 5.6 4.9 : : 4.4 9.0
1971-1980 : : 1.8 : : : : : 1.6 2.2 : 3.4 : 6.2 5.1 : : 3.2 4.7
1981 : : -1.7 : : : : : 1.4 0.2 : 0.5 : 6.2 -7.6 : : 1.5 1.81982 : : 1.4 : : : : : 0.9 1.1 : 0.9 : 5.0 6.9 : : 1.4 4.61983 : : 2.0 : : : : : -2.2 4.2 : 1.4 : -5.6 6.7 : : 5.7 3.31984 : : 3.8 : : : : : 1.8 2.3 : 1.6 : 3.7 8.1 : : 5.3 2.91985 : : 4.3 : : : : : 2.6 3.9 : 2.5 : 4.2 -0.6 : : 5.3 4.11986 : : 7.5 : : : : : 4.8 6.5 : 4.1 : 6.9 5.8 : : 4.2 3.71987 : : -1.9 : : : : : 5.0 5.5 : 3.8 : 16.2 -0.3 : : 3.4 4.41988 : : -1.7 : : : : : 2.9 7.8 : 4.0 : -3.8 1.2 : : 4.2 5.11989 : : 0.0 : : : : : 1.1 3.5 : 3.5 : -4.2 -1.0 : : 2.9 4.81990 : : 0.8 : : : : : -0.7 1.0 : 2.6 : 0.5 13.1 : : 2.1 5.2
1981-1990 : : 1.4 : : : : : 1.7 3.6 : 2.5 : 2.7 3.1 : : 3.6 4.0
1991 : -21.4 1.7 : : : 6.6 -16.3 0.2 -1.5 : 1.9 : 3.0 2.7 : : 0.2 2.21992 1.0 8.8 2.6 : : : 2.4 -7.5 -1.5 1.6 : 1.8 : -3.2 3.2 : : 3.7 2.11993 -0.8 1.2 -0.5 : : : 5.4 0.9 -2.9 4.3 : 0.0 : -4.6 8.6 : : 3.5 1.01994 -2.6 4.2 6.3 : : : 3.9 2.4 2.1 3.5 : 2.1 : 2.9 -5.4 : : 3.9 2.31995 -0.5 4.6 1.6 : : : 3.7 12.9 1.1 2.2 : 1.8 : 2.2 4.8 : : 3.0 1.71996 1.2 7.4 2.2 1.9 6.5 -2.7 8.8 7.9 1.8 4.9 2.4 2.2 3.0 5.7 8.5 : : 3.5 2.31997 -10.4 1.6 3.0 11.9 5.6 2.0 7.2 -4.0 2.8 4.8 2.3 2.2 3.1 6.3 8.4 : : 3.8 0.91998 3.3 -1.3 2.3 -0.8 4.8 4.9 5.0 6.0 3.3 4.2 3.2 3.2 3.3 10.2 0.6 : : 5.3 -0.81999 9.2 2.2 -0.4 -3.4 5.0 6.8 5.7 -4.3 4.0 5.1 3.5 3.5 3.6 7.9 0.1 : : 5.5 1.22000 7.3 0.9 0.2 3.2 7.0 3.1 3.1 1.4 5.3 5.3 3.4 3.4 11.2 4.2 5.9 : : 5.1 0.4
1991-2000 : 0.5 1.9 : : : 5.2 -0.4 1.6 3.4 : 2.2 : 3.3 3.7 : : 3.7 1.3
2001 7.9 3.1 0.1 4.1 4.2 4.6 2.2 9.4 0.7 3.7 2.3 2.2 -11.6 -2.8 -6.6 : : 2.5 1.62002 3.6 3.1 1.5 8.1 6.2 8.2 3.4 6.2 2.6 3.8 1.7 1.6 12.5 -1.5 4.7 : : 2.5 1.22003 6.8 5.3 1.0 3.9 11.2 8.4 2.1 8.3 2.3 3.6 1.9 1.7 -1.5 6.2 10.2 : : 3.1 0.52004 7.7 3.2 4.7 4.0 11.7 1.7 4.7 15.9 2.8 3.1 2.1 1.9 9.1 7.0 11.0 : 7.5 3.8 1.22005 6.7 3.1 3.8 3.9 11.2 2.3 2.1 10.1 2.8 2.7 2.1 2.0 5.9 12.7 7.9 : 6.0 3.5 1.52006 8.6 4.4 3.6 3.2 10.0 1.7 5.0 12.7 2.7 1.8 2.3 2.0 7.5 3.6 4.6 : 5.8 3.0 1.12007 9.0 4.2 3.0 6.5 11.3 1.1 4.9 11.9 3.7 2.7 2.2 1.9 8.1 5.7 5.5 : 7.9 2.2 0.92008 3.4 2.8 -0.3 1.4 3.7 -0.7 5.7 9.0 0.0 -1.0 0.4 0.1 7.4 -7.8 -0.3 : 6.7 -0.4 -0.92009 -7.6 0.2 -3.6 -7.5 -17.8 -6.6 2.0 -10.1 -0.3 -3.6 -1.6 -1.4 -4.7 -15.0 -2.3 : -2.8 -1.6 -0.72010 0.1 0.9 1.3 -1.3 -3.6 -3.0 3.1 -0.3 4.0 1.0 1.1 1.1 2.1 0.1 6.7 : -0.9 2.0 2.8
2001-2010 4.5 3.0 1.5 2.5 4.4 1.7 3.5 7.1 2.1 1.8 1.4 1.3 3.2 0.5 4.0 : : 2.1 0.9
2011 1.5 0.5 -0.7 0.4 4.8 0.4 2.6 1.4 1.7 -0.4 0.3 0.2 2.9 2.6 7.7 : -1.1 2.5 0.32012 3.7 -2.1 -0.1 -3.0 3.9 -1.6 1.3 1.5 1.6 1.4 -0.7 -0.8 -3.0 2.4 -0.5 : -1.8 2.2 2.02013 -2.3 0.1 0.0 -1.0 4.8 0.2 0.8 1.3 2.0 2.2 0.0 -0.1 4.2 1.2 4.6 : -1.4 2.0 1.92014 1.3 0.7 1.2 -1.2 3.8 1.4 2.3 2.0 2.9 2.1 1.2 1.1 3.0 4.3 0.2 : -1.1 2.6 0.62015 1.7 1.9 1.7 0.0 4.3 1.6 2.8 3.0 2.8 2.2 1.6 1.5 2.7 4.0 1.2 : -0.5 2.9 0.7
1) Weighted in common currency 2) Weighted in common currency; Former EU-15; 1961-91 including D_W

62
National final uses
17. Final consumption expenditure of general government at current prices
(Percentage of gross domestic product at market prices)
BE DE EE IE EL ES FR IT CY LV LU MT NL AT PT SI SK FI EA-18 EA-12 1) 2) 3)
1960-1970 15.9 14.6 : 14.0 11.7 9.1 16.4 15.5 8.3 : 11.3 15.2 18.2 13.9 10.7 : : 14.2 : 15.0
1971-1980 20.6 18.5 : 18.2 13.1 11.5 19.5 16.4 11.2 : 14.3 15.9 22.6 16.8 12.4 : : 17.4 : 18.0
1981 24.2 20.2 : 21.0 15.8 14.9 22.2 18.2 12.4 : 17.8 15.1 24.5 18.6 13.9 : : 19.0 : 20.11982 23.8 19.9 : 20.9 15.3 15.1 22.7 18.3 12.6 : 16.8 16.2 25.0 19.0 14.0 : : 19.2 : 20.11983 23.5 19.6 : 20.4 15.9 15.5 22.8 18.7 12.9 : 16.2 15.8 24.9 19.0 13.9 : : 19.6 : 20.21984 23.4 19.4 : 19.7 16.4 15.3 23.0 18.5 12.0 : 15.7 15.3 23.4 19.0 13.7 : : 19.6 : 20.01985 22.9 19.4 : 19.6 17.1 15.5 23.1 18.6 12.0 : 16.1 15.5 23.7 19.2 14.2 : : 20.6 : 20.11986 22.8 19.3 : 19.8 16.2 15.3 22.8 18.3 12.2 : 15.8 15.3 23.7 19.5 14.1 : : 20.8 : 19.91987 22.6 19.5 : 18.8 16.4 15.8 22.6 19.0 14.1 : 16.7 15.7 24.6 19.4 13.9 : : 21.2 : 20.21988 21.2 19.2 : 17.4 15.0 15.7 22.2 19.4 14.2 : 15.8 15.2 24.0 19.2 14.3 : : 20.5 : 19.91989 20.5 18.3 : 16.2 16.0 16.2 21.7 19.2 13.6 : 15.4 15.6 23.2 18.8 14.9 : : 20.2 : 19.41990 20.3 18.0 : 17.5 16.0 16.6 21.7 20.0 14.7 7.2 15.8 15.4 23.0 18.6 15.1 16.3 23.1 21.8 : 19.5
1981-1990 22.5 19.3 : 19.1 16.0 15.6 22.5 18.8 13.1 : 16.2 15.5 24.0 19.0 14.2 : : 20.2 : 19.9
1991 17.8 19.7
1991 20.9 18.8 : 18.5 15.1 17.3 22.2 20.1 15.7 8.6 15.3 16.0 23.2 18.8 16.8 17.8 21.7 24.9 : 20.01992 21.0 19.3 : 19.0 14.6 18.2 22.8 20.0 16.2 10.0 15.9 16.5 23.8 19.1 17.0 19.0 27.0 25.4 : 20.31993 21.4 19.4 21.4 18.7 15.2 18.8 24.0 19.8 14.3 16.8 15.8 17.6 24.1 20.0 17.7 19.7 25.6 24.2 20.7 20.71994 21.2 19.3 24.1 18.6 14.7 18.2 23.7 19.1 14.1 16.8 15.4 17.9 23.9 20.1 17.4 18.9 21.9 23.5 20.4 20.41995 21.4 19.4 25.5 17.5 16.3 18.0 23.6 17.8 13.7 22.6 15.9 18.0 23.8 20.3 17.5 18.4 21.7 22.7 20.3 20.31996 21.8 19.7 23.2 16.8 15.5 17.9 23.9 18.1 15.5 21.3 16.4 19.2 22.8 20.2 17.7 18.3 23.9 23.2 20.4 20.41997 21.3 19.3 20.9 16.2 16.1 17.4 23.9 18.2 17.1 20.5 16.7 18.6 22.3 19.3 17.7 18.1 21.8 22.5 20.1 20.11998 21.2 19.1 20.7 15.4 16.3 17.3 23.1 18.0 16.7 22.6 15.8 18.7 22.2 19.2 17.9 18.1 22.2 21.8 19.8 19.81999 21.4 19.2 22.0 14.9 16.4 17.1 23.2 18.1 17.4 22.5 15.5 18.1 22.2 19.6 18.1 18.1 20.1 21.4 19.8 19.82000 21.3 19.0 19.8 14.7 18.9 17.1 22.9 18.3 16.2 20.9 15.1 17.8 22.0 19.0 19.0 18.7 20.1 20.6 19.8 19.8
1991-2000 21.3 19.3 : 17.0 15.9 17.7 23.3 18.7 15.7 18.3 15.8 17.8 23.0 19.6 17.7 18.5 22.6 23.0 : 20.2
2001 21.7 19.0 18.8 15.5 18.4 17.0 22.8 18.8 17.2 20.7 16.1 19.2 22.6 18.7 19.4 19.3 20.6 20.7 19.9 19.92002 22.5 19.2 18.4 16.0 19.4 17.1 23.5 19.0 18.2 21.4 16.5 19.2 23.7 18.4 19.7 19.1 20.3 21.4 20.2 20.32003 22.9 19.3 18.3 16.1 18.1 17.3 23.8 19.5 19.8 21.8 16.4 19.6 24.5 18.7 20.0 19.0 20.4 22.1 20.5 20.52004 22.5 18.9 17.6 16.4 18.3 17.8 23.8 19.7 17.9 19.8 16.9 20.1 24.2 18.4 20.3 18.8 19.0 22.2 20.4 20.42005 22.7 18.8 17.2 16.3 18.1 18.0 23.8 20.1 18.0 17.8 16.5 19.1 23.7 18.4 21.1 19.0 18.3 22.5 20.5 20.52006 22.4 18.4 16.2 16.5 17.1 18.0 23.5 20.0 18.4 16.8 15.4 19.4 25.1 18.3 20.5 18.8 18.8 22.2 20.3 20.32007 22.2 17.9 16.4 17.2 17.8 18.3 23.1 19.5 17.5 17.8 14.8 18.7 25.2 18.0 19.8 17.3 17.1 21.5 20.0 20.02008 23.1 18.3 19.3 19.1 18.1 19.5 23.3 20.0 18.0 20.0 15.5 20.5 25.7 18.7 20.1 18.1 17.5 22.5 20.5 20.62009 24.7 20.0 21.7 20.5 20.5 21.4 24.8 21.4 20.1 19.6 17.7 20.7 28.6 19.8 22.1 20.2 19.9 25.2 22.3 22.32010 24.2 19.5 20.8 19.2 18.3 21.5 24.9 21.1 20.0 18.4 16.9 20.0 28.5 19.5 21.6 20.8 19.3 24.7 22.0 22.0
2001-2010 22.9 18.9 18.5 17.3 18.4 18.6 23.7 19.9 18.5 19.4 16.3 19.6 25.2 18.7 20.5 19.0 19.1 22.5 20.7 20.7
2011 24.4 19.1 19.2 18.4 17.4 21.2 24.5 20.4 20.1 17.7 16.7 20.2 27.9 19.0 19.9 20.8 18.0 24.5 21.5 21.62012 25.0 19.3 19.2 18.0 17.5 20.2 24.7 20.0 19.2 16.6 17.5 21.1 28.5 19.0 18.2 20.8 17.6 25.1 21.5 21.52013 25.2 19.5 19.5 17.9 17.2 20.1 24.9 19.9 18.7 16.5 17.5 20.8 28.3 18.8 19.0 20.2 17.8 25.7 21.6 21.62014 25.0 19.6 19.6 17.0 16.7 19.7 24.9 19.4 19.1 16.6 17.4 20.9 28.0 18.6 17.7 19.8 17.9 25.7 21.4 21.42015 25.0 19.6 19.5 16.4 15.9 19.2 24.5 19.3 18.4 16.6 17.9 20.7 27.3 18.4 16.7 19.6 17.6 25.6 21.1 21.2
1) 1960-91 D_W 2) Euro area; 1960-91 including D_W 3) Former Euro area 12; 1960-91 including D_W

63
National final uses
17. Final consumption expenditure of general government at current prices
(Percentage of gross domestic product at market prices)
BG CZ DK HR LT HU PL RO SE UK EU-28 EU-15 MK IS TR ME RS US JP 1) 2)
1960-1970 : : 16.8 : : : : : 18.6 17.6 : 15.7 : 12.2 6.9 : : 17.2 11.2
1971-1980 : : 23.9 : : : : : 25.6 20.4 : 18.8 : 16.7 9.0 : : 16.8 13.3
1981 : : 27.9 : : : 9.3 4.9 29.0 22.2 : 21.0 : 17.9 8.8 : : 15.8 14.11982 : : 28.4 : : : 8.1 3.9 28.8 22.1 : 20.9 : 18.9 7.6 : : 16.5 14.21983 : : 27.6 : : : 8.7 3.8 28.2 21.9 : 20.9 : 18.9 8.4 : : 16.3 14.51984 : : 25.7 : : : 9.2 3.6 27.2 21.6 : 20.7 : 17.4 7.2 : : 15.6 14.31985 : : 25.3 : : : 17.8 3.7 26.9 20.8 : 20.6 : 18.3 7.2 : : 15.8 13.91986 : : 24.2 : : : 17.5 3.5 26.6 20.8 : 20.4 : 18.8 7.3 : : 16.0 13.91987 : : 25.3 : : : 17.1 3.1 25.8 20.3 : 20.5 : 19.6 6.3 : : 15.9 13.91988 : : 25.8 : : : 15.8 3.5 25.1 19.5 : 20.1 : 20.7 6.1 : : 15.6 13.51989 : : 25.5 : : : 5.9 11.1 25.4 19.2 : 19.7 : 20.1 7.5 : : 15.6 13.41990 18.2 22.0 25.1 : 21.4 : 20.8 12.7 26.5 19.6 : 19.9 : 19.9 8.8 : : 15.9 13.3
1981-1990 : : 26.1 : : : 13.0 5.4 27.0 20.8 : 20.5 : 19.1 7.5 : : 15.9 13.9
1991 20.2
1991 19.0 21.7 25.3 : 12.1 : 24.3 14.5 27.4 20.5 : 20.4 : 20.6 10.0 : : 16.3 13.41992 20.3 18.6 25.3 : 14.6 26.4 23.1 13.7 28.5 20.9 : 20.8 : 21.2 10.4 : : 16.0 13.81993 18.9 20.8 26.4 : 17.4 28.4 21.7 11.8 28.8 20.1 : 21.0 : 21.7 10.5 : : 15.6 14.31994 17.2 21.1 25.5 : 21.9 26.1 18.7 13.2 27.9 19.6 : 20.6 : 21.6 9.4 : : 15.2 14.71995 16.7 20.1 25.2 25.7 24.5 23.4 18.7 13.1 26.6 19.1 20.4 20.4 18.6 22.1 8.7 : : 14.9 15.21996 13.7 19.5 25.4 23.1 24.4 22.1 18.3 12.6 27.3 18.7 20.4 20.5 18.1 21.9 9.3 : : 14.5 15.41997 13.2 20.3 25.0 22.2 24.3 21.9 17.8 13.5 26.7 17.9 20.0 20.0 19.7 21.7 9.9 : 23.6 14.2 15.41998 16.8 19.4 25.6 23.3 26.0 21.4 17.3 12.7 26.8 17.6 19.7 19.7 20.3 22.2 10.3 : 21.2 14.0 15.91999 17.8 20.5 25.7 24.2 23.8 21.7 17.4 17.4 26.7 18.0 19.8 19.8 20.6 22.9 12.2 : 18.7 14.0 16.52000 19.0 20.3 25.1 22.4 22.6 21.5 17.4 17.5 25.8 18.3 19.7 19.8 18.2 23.4 11.7 21.9 19.6 14.0 16.9
1991-2000 17.3 20.2 25.5 : 21.2 : 19.5 14.0 27.3 19.1 : 20.3 : 21.9 10.2 : : 14.9 15.2
2001 18.8 20.3 25.7 20.0 21.3 21.4 17.9 16.2 26.3 18.8 19.9 20.0 24.8 23.6 12.4 25.2 21.0 14.5 17.72002 18.9 21.7 26.2 19.6 20.8 22.2 17.9 15.1 27.0 19.7 20.4 20.5 22.4 25.4 12.7 24.9 22.7 15.0 18.32003 19.9 22.7 26.5 19.1 19.7 23.5 18.1 19.3 27.3 20.3 20.7 20.8 20.3 26.0 12.2 26.8 22.7 15.2 18.32004 19.4 21.5 26.5 19.2 19.3 22.4 17.6 16.3 26.5 20.8 20.7 20.8 19.6 25.0 11.9 26.3 19.8 15.2 18.22005 18.3 21.4 26.0 19.0 18.6 22.6 18.1 17.4 26.2 21.0 20.7 20.8 18.4 24.6 11.8 29.9 18.8 15.1 18.42006 18.0 20.7 25.9 18.8 19.1 23.0 18.3 16.7 26.0 21.2 20.6 20.7 18.1 24.4 12.3 27.0 18.9 15.1 18.22007 16.7 19.8 26.0 19.2 17.8 21.6 17.9 16.0 25.5 20.7 20.3 20.4 17.1 24.2 12.8 20.1 20.6 15.3 18.12008 16.6 19.7 26.5 18.8 19.2 21.8 18.5 16.9 26.1 21.6 20.8 21.0 18.2 24.8 12.8 22.6 20.1 16.1 18.62009 16.3 21.5 29.8 20.2 21.9 22.7 18.5 18.5 27.7 23.2 22.5 22.7 19.1 26.5 14.7 22.2 19.8 16.9 19.92010 16.2 21.3 29.0 20.1 20.4 22.0 18.9 16.3 26.7 22.7 22.2 22.4 19.1 26.0 14.3 23.4 19.7 16.9 19.7
2001-2010 17.9 21.1 26.8 19.4 19.8 22.3 18.2 16.9 26.5 21.0 20.9 21.0 19.7 25.1 12.8 24.8 20.4 15.5 18.5
2011 15.7 20.7 28.4 19.8 18.7 21.0 18.0 15.1 26.6 21.9 21.6 21.9 18.3 25.4 13.9 21.5 19.3 16.3 20.42012 15.5 20.5 28.5 19.9 17.6 20.4 17.8 15.2 26.9 21.9 21.6 21.9 18.5 25.3 14.8 21.6 19.9 15.7 20.52013 16.9 20.7 28.2 19.8 17.1 20.5 18.0 14.9 27.5 21.3 21.6 21.9 17.5 25.5 15.1 20.1 19.1 15.0 20.62014 17.1 20.5 28.1 19.2 16.7 21.0 18.0 14.9 27.4 20.6 21.4 21.6 17.7 24.9 15.0 18.9 18.2 14.6 20.62015 17.2 20.2 27.9 18.5 16.3 20.6 18.0 14.6 27.0 19.9 21.0 21.3 17.7 24.7 14.7 17.8 17.3 14.3 20.5
1) 1960-91 including D_W 2) Former EU-15; 1960-91 including D_W
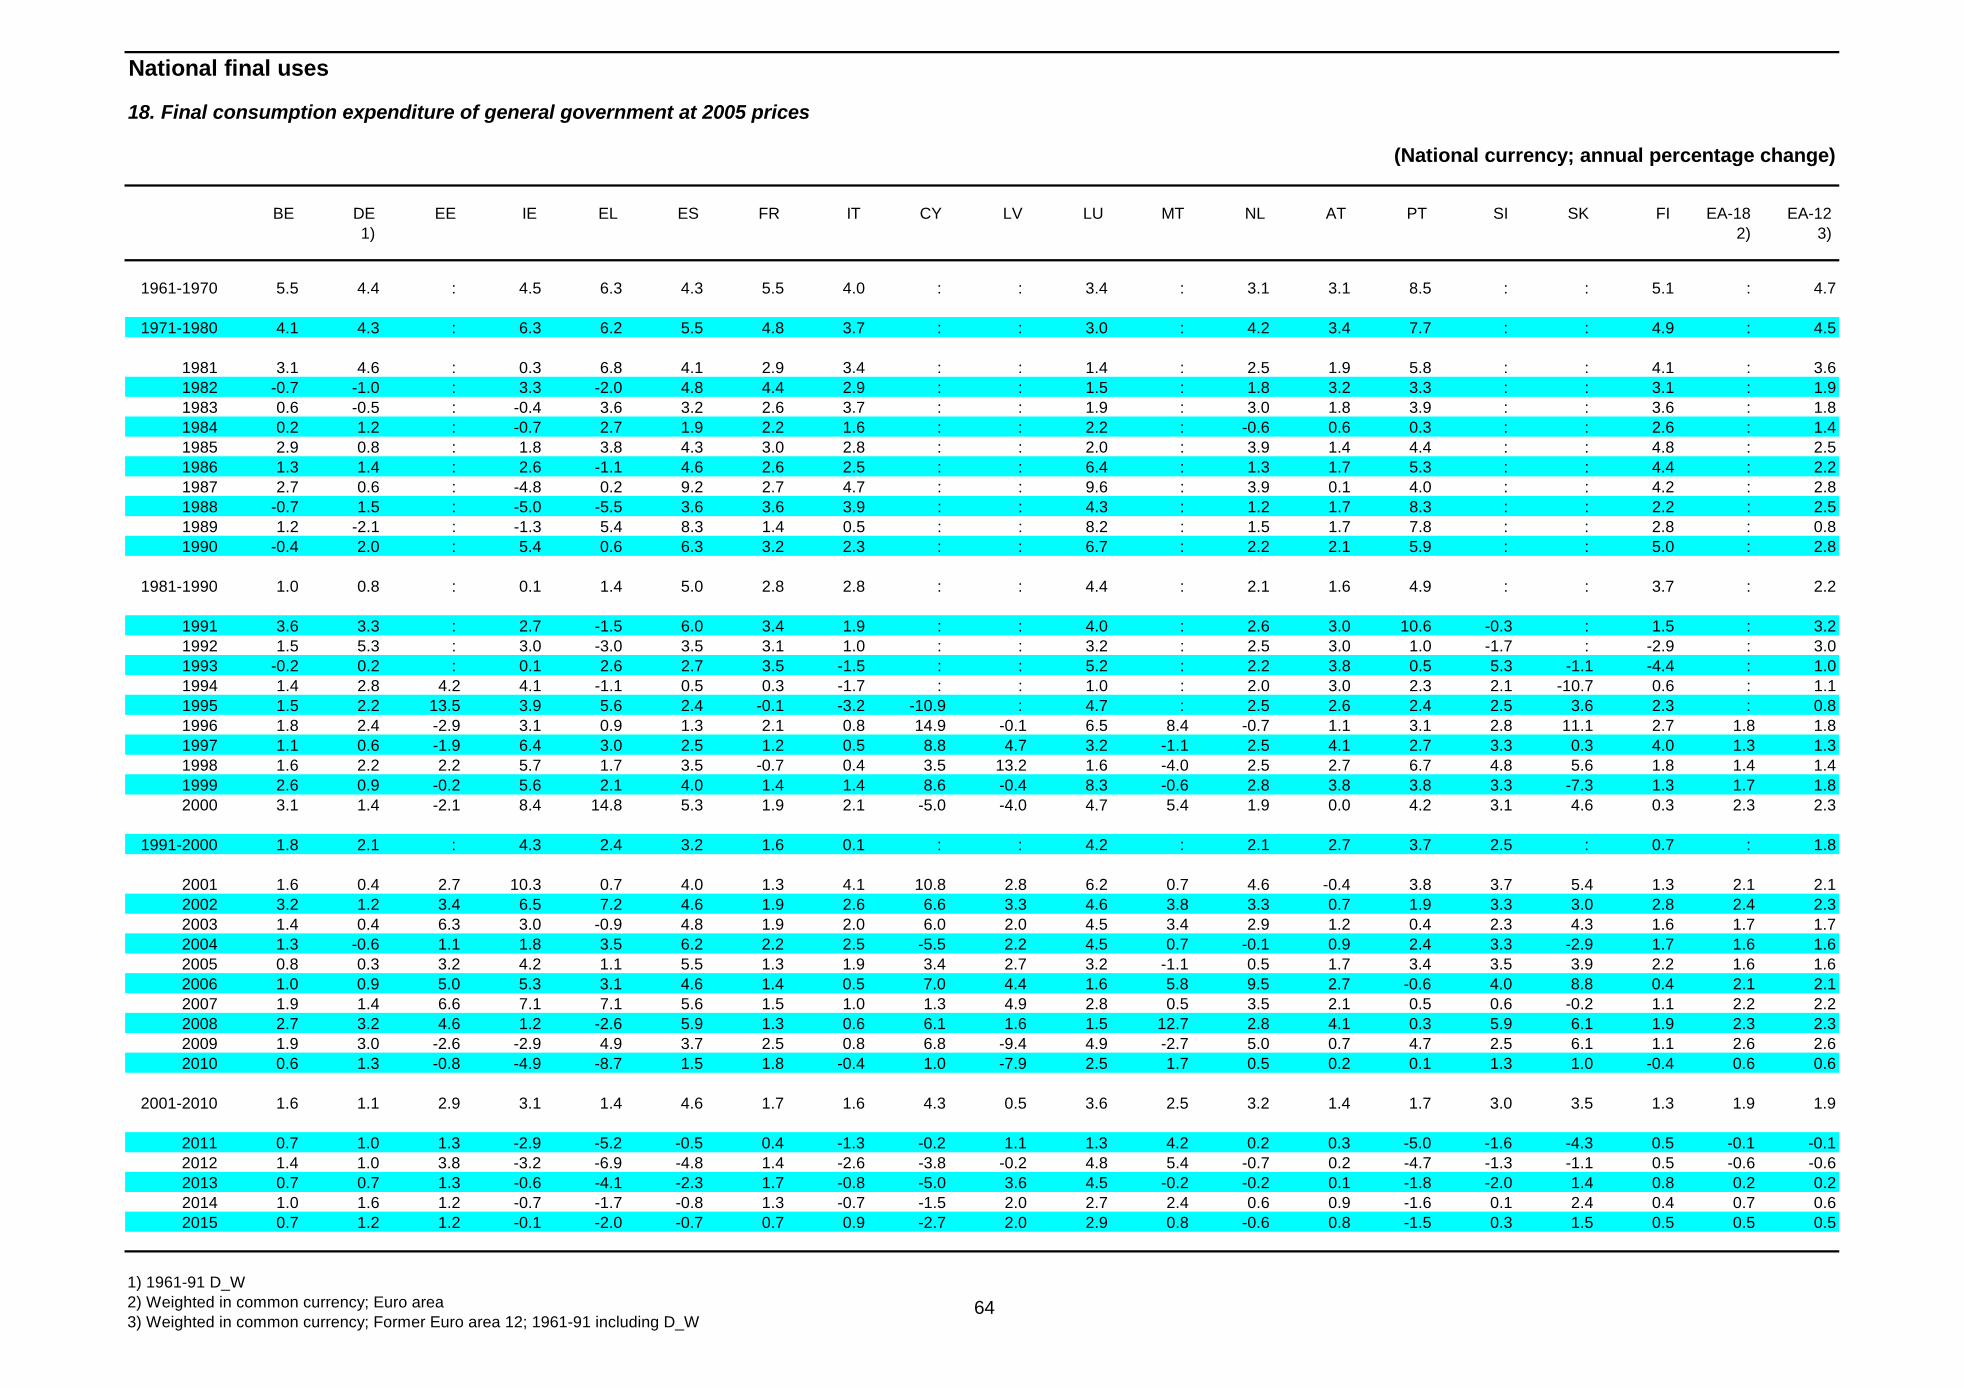
64
National final uses
18. Final consumption expenditure of general government at 2005 prices
(National currency; annual percentage change)
BE DE EE IE EL ES FR IT CY LV LU MT NL AT PT SI SK FI EA-18 EA-12 1) 2) 3)
1961-1970 5.5 4.4 : 4.5 6.3 4.3 5.5 4.0 : : 3.4 : 3.1 3.1 8.5 : : 5.1 : 4.7
1971-1980 4.1 4.3 : 6.3 6.2 5.5 4.8 3.7 : : 3.0 : 4.2 3.4 7.7 : : 4.9 : 4.5
1981 3.1 4.6 : 0.3 6.8 4.1 2.9 3.4 : : 1.4 : 2.5 1.9 5.8 : : 4.1 : 3.61982 -0.7 -1.0 : 3.3 -2.0 4.8 4.4 2.9 : : 1.5 : 1.8 3.2 3.3 : : 3.1 : 1.91983 0.6 -0.5 : -0.4 3.6 3.2 2.6 3.7 : : 1.9 : 3.0 1.8 3.9 : : 3.6 : 1.81984 0.2 1.2 : -0.7 2.7 1.9 2.2 1.6 : : 2.2 : -0.6 0.6 0.3 : : 2.6 : 1.41985 2.9 0.8 : 1.8 3.8 4.3 3.0 2.8 : : 2.0 : 3.9 1.4 4.4 : : 4.8 : 2.51986 1.3 1.4 : 2.6 -1.1 4.6 2.6 2.5 : : 6.4 : 1.3 1.7 5.3 : : 4.4 : 2.21987 2.7 0.6 : -4.8 0.2 9.2 2.7 4.7 : : 9.6 : 3.9 0.1 4.0 : : 4.2 : 2.81988 -0.7 1.5 : -5.0 -5.5 3.6 3.6 3.9 : : 4.3 : 1.2 1.7 8.3 : : 2.2 : 2.51989 1.2 -2.1 : -1.3 5.4 8.3 1.4 0.5 : : 8.2 : 1.5 1.7 7.8 : : 2.8 : 0.81990 -0.4 2.0 : 5.4 0.6 6.3 3.2 2.3 : : 6.7 : 2.2 2.1 5.9 : : 5.0 : 2.8
1981-1990 1.0 0.8 : 0.1 1.4 5.0 2.8 2.8 : : 4.4 : 2.1 1.6 4.9 : : 3.7 : 2.2
1991 3.6 3.3 : 2.7 -1.5 6.0 3.4 1.9 : : 4.0 : 2.6 3.0 10.6 -0.3 : 1.5 : 3.21992 1.5 5.3 : 3.0 -3.0 3.5 3.1 1.0 : : 3.2 : 2.5 3.0 1.0 -1.7 : -2.9 : 3.01993 -0.2 0.2 : 0.1 2.6 2.7 3.5 -1.5 : : 5.2 : 2.2 3.8 0.5 5.3 -1.1 -4.4 : 1.01994 1.4 2.8 4.2 4.1 -1.1 0.5 0.3 -1.7 : : 1.0 : 2.0 3.0 2.3 2.1 -10.7 0.6 : 1.11995 1.5 2.2 13.5 3.9 5.6 2.4 -0.1 -3.2 -10.9 : 4.7 : 2.5 2.6 2.4 2.5 3.6 2.3 : 0.81996 1.8 2.4 -2.9 3.1 0.9 1.3 2.1 0.8 14.9 -0.1 6.5 8.4 -0.7 1.1 3.1 2.8 11.1 2.7 1.8 1.81997 1.1 0.6 -1.9 6.4 3.0 2.5 1.2 0.5 8.8 4.7 3.2 -1.1 2.5 4.1 2.7 3.3 0.3 4.0 1.3 1.31998 1.6 2.2 2.2 5.7 1.7 3.5 -0.7 0.4 3.5 13.2 1.6 -4.0 2.5 2.7 6.7 4.8 5.6 1.8 1.4 1.41999 2.6 0.9 -0.2 5.6 2.1 4.0 1.4 1.4 8.6 -0.4 8.3 -0.6 2.8 3.8 3.8 3.3 -7.3 1.3 1.7 1.82000 3.1 1.4 -2.1 8.4 14.8 5.3 1.9 2.1 -5.0 -4.0 4.7 5.4 1.9 0.0 4.2 3.1 4.6 0.3 2.3 2.3
1991-2000 1.8 2.1 : 4.3 2.4 3.2 1.6 0.1 : : 4.2 : 2.1 2.7 3.7 2.5 : 0.7 : 1.8
2001 1.6 0.4 2.7 10.3 0.7 4.0 1.3 4.1 10.8 2.8 6.2 0.7 4.6 -0.4 3.8 3.7 5.4 1.3 2.1 2.12002 3.2 1.2 3.4 6.5 7.2 4.6 1.9 2.6 6.6 3.3 4.6 3.8 3.3 0.7 1.9 3.3 3.0 2.8 2.4 2.32003 1.4 0.4 6.3 3.0 -0.9 4.8 1.9 2.0 6.0 2.0 4.5 3.4 2.9 1.2 0.4 2.3 4.3 1.6 1.7 1.72004 1.3 -0.6 1.1 1.8 3.5 6.2 2.2 2.5 -5.5 2.2 4.5 0.7 -0.1 0.9 2.4 3.3 -2.9 1.7 1.6 1.62005 0.8 0.3 3.2 4.2 1.1 5.5 1.3 1.9 3.4 2.7 3.2 -1.1 0.5 1.7 3.4 3.5 3.9 2.2 1.6 1.62006 1.0 0.9 5.0 5.3 3.1 4.6 1.4 0.5 7.0 4.4 1.6 5.8 9.5 2.7 -0.6 4.0 8.8 0.4 2.1 2.12007 1.9 1.4 6.6 7.1 7.1 5.6 1.5 1.0 1.3 4.9 2.8 0.5 3.5 2.1 0.5 0.6 -0.2 1.1 2.2 2.22008 2.7 3.2 4.6 1.2 -2.6 5.9 1.3 0.6 6.1 1.6 1.5 12.7 2.8 4.1 0.3 5.9 6.1 1.9 2.3 2.32009 1.9 3.0 -2.6 -2.9 4.9 3.7 2.5 0.8 6.8 -9.4 4.9 -2.7 5.0 0.7 4.7 2.5 6.1 1.1 2.6 2.62010 0.6 1.3 -0.8 -4.9 -8.7 1.5 1.8 -0.4 1.0 -7.9 2.5 1.7 0.5 0.2 0.1 1.3 1.0 -0.4 0.6 0.6
2001-2010 1.6 1.1 2.9 3.1 1.4 4.6 1.7 1.6 4.3 0.5 3.6 2.5 3.2 1.4 1.7 3.0 3.5 1.3 1.9 1.9
2011 0.7 1.0 1.3 -2.9 -5.2 -0.5 0.4 -1.3 -0.2 1.1 1.3 4.2 0.2 0.3 -5.0 -1.6 -4.3 0.5 -0.1 -0.12012 1.4 1.0 3.8 -3.2 -6.9 -4.8 1.4 -2.6 -3.8 -0.2 4.8 5.4 -0.7 0.2 -4.7 -1.3 -1.1 0.5 -0.6 -0.62013 0.7 0.7 1.3 -0.6 -4.1 -2.3 1.7 -0.8 -5.0 3.6 4.5 -0.2 -0.2 0.1 -1.8 -2.0 1.4 0.8 0.2 0.22014 1.0 1.6 1.2 -0.7 -1.7 -0.8 1.3 -0.7 -1.5 2.0 2.7 2.4 0.6 0.9 -1.6 0.1 2.4 0.4 0.7 0.62015 0.7 1.2 1.2 -0.1 -2.0 -0.7 0.7 0.9 -2.7 2.0 2.9 0.8 -0.6 0.8 -1.5 0.3 1.5 0.5 0.5 0.5
1) 1961-91 D_W 2) Weighted in common currency; Euro area 3) Weighted in common currency; Former Euro area 12; 1961-91 including D_W
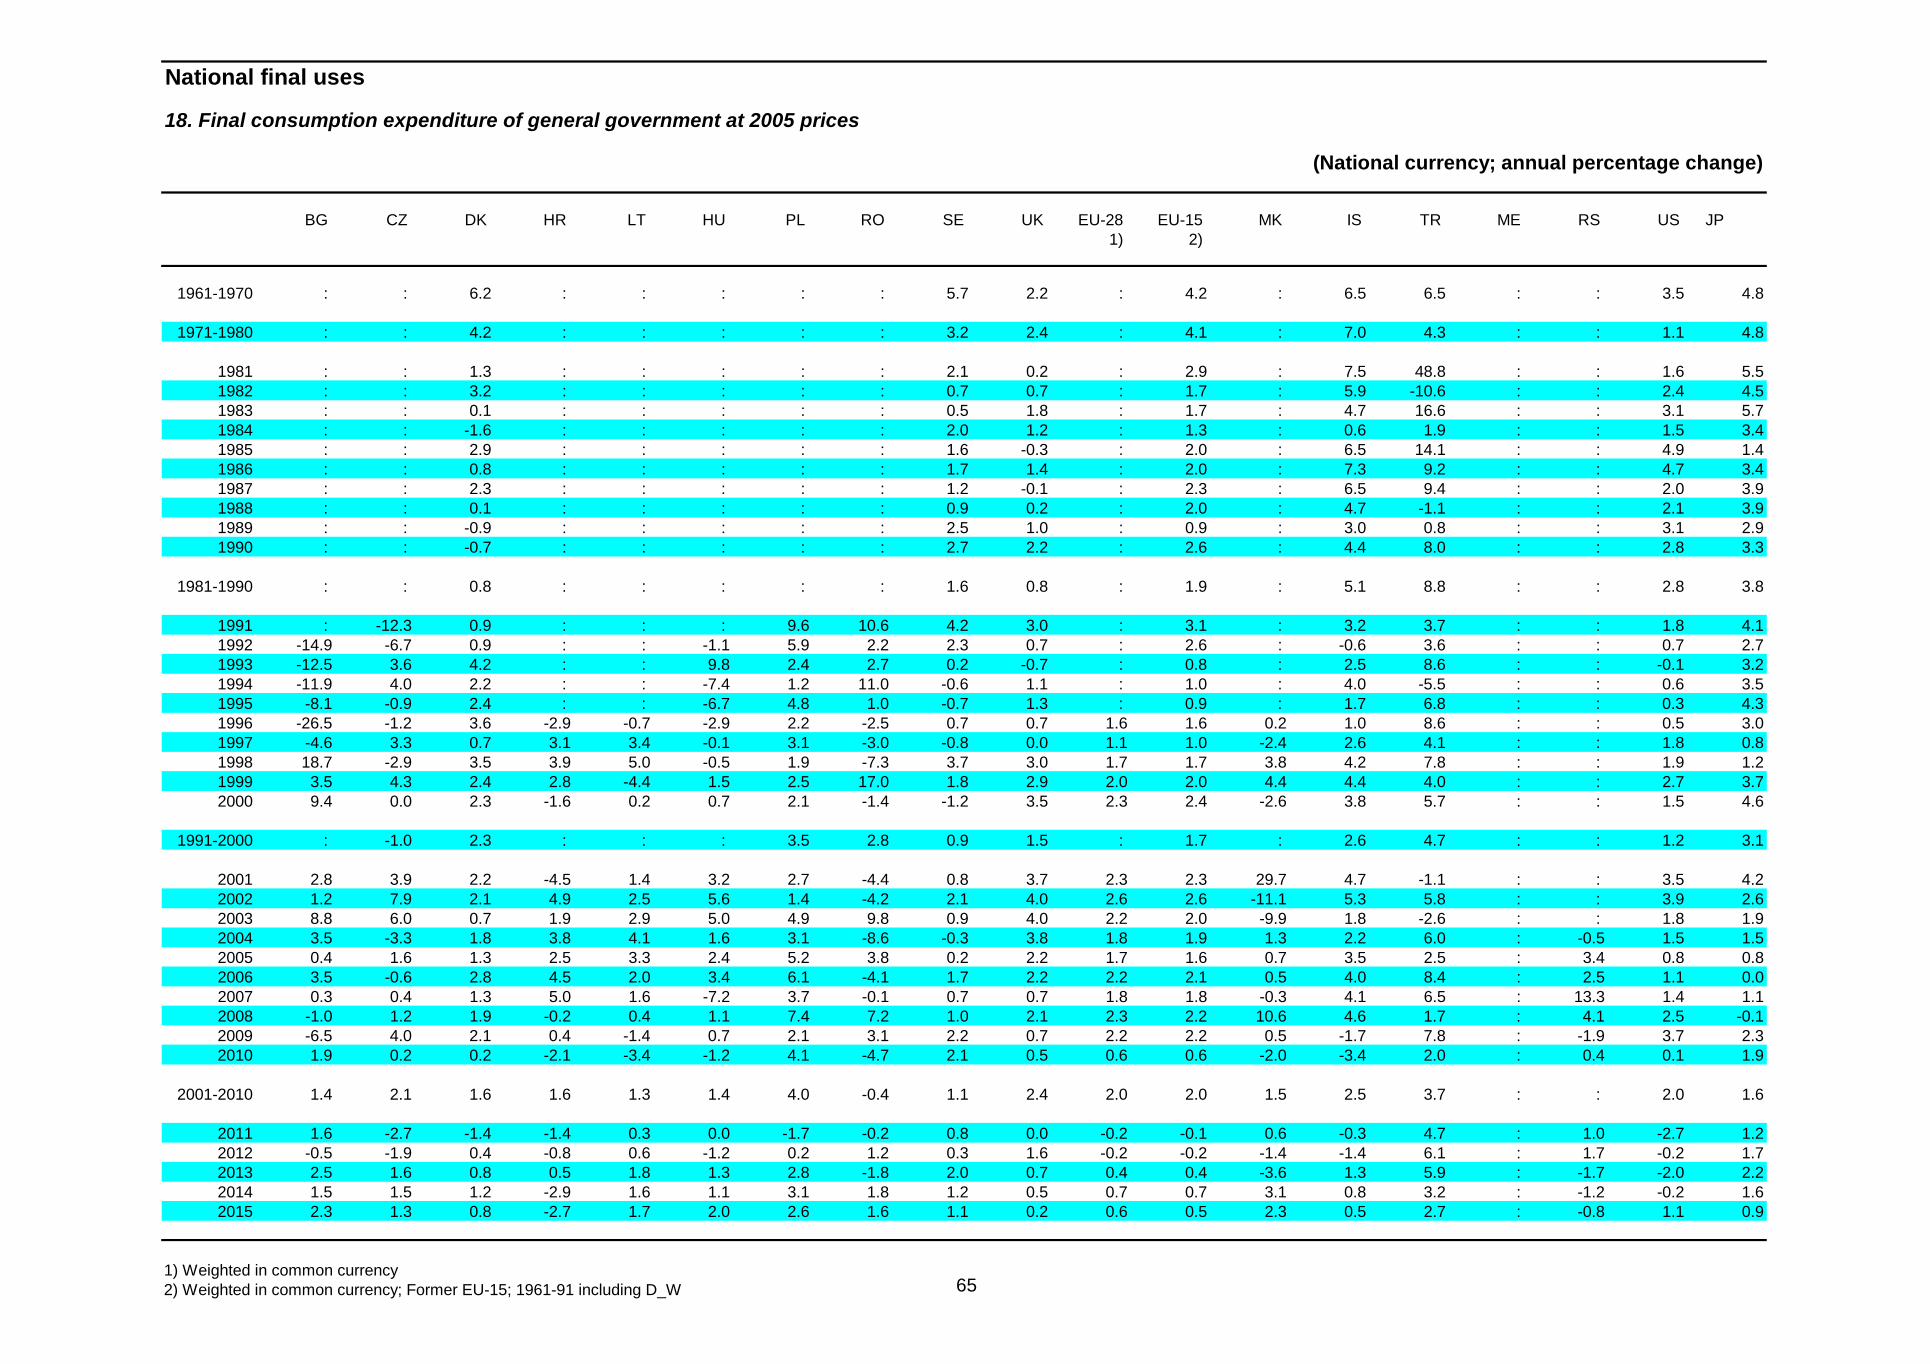
65
National final uses
18. Final consumption expenditure of general government at 2005 prices
(National currency; annual percentage change)
BG CZ DK HR LT HU PL RO SE UK EU-28 EU-15 MK IS TR ME RS US JP 1) 2)
1961-1970 : : 6.2 : : : : : 5.7 2.2 : 4.2 : 6.5 6.5 : : 3.5 4.8
1971-1980 : : 4.2 : : : : : 3.2 2.4 : 4.1 : 7.0 4.3 : : 1.1 4.8
1981 : : 1.3 : : : : : 2.1 0.2 : 2.9 : 7.5 48.8 : : 1.6 5.51982 : : 3.2 : : : : : 0.7 0.7 : 1.7 : 5.9 -10.6 : : 2.4 4.51983 : : 0.1 : : : : : 0.5 1.8 : 1.7 : 4.7 16.6 : : 3.1 5.71984 : : -1.6 : : : : : 2.0 1.2 : 1.3 : 0.6 1.9 : : 1.5 3.41985 : : 2.9 : : : : : 1.6 -0.3 : 2.0 : 6.5 14.1 : : 4.9 1.41986 : : 0.8 : : : : : 1.7 1.4 : 2.0 : 7.3 9.2 : : 4.7 3.41987 : : 2.3 : : : : : 1.2 -0.1 : 2.3 : 6.5 9.4 : : 2.0 3.91988 : : 0.1 : : : : : 0.9 0.2 : 2.0 : 4.7 -1.1 : : 2.1 3.91989 : : -0.9 : : : : : 2.5 1.0 : 0.9 : 3.0 0.8 : : 3.1 2.91990 : : -0.7 : : : : : 2.7 2.2 : 2.6 : 4.4 8.0 : : 2.8 3.3
1981-1990 : : 0.8 : : : : : 1.6 0.8 : 1.9 : 5.1 8.8 : : 2.8 3.8
1991 : -12.3 0.9 : : : 9.6 10.6 4.2 3.0 : 3.1 : 3.2 3.7 : : 1.8 4.11992 -14.9 -6.7 0.9 : : -1.1 5.9 2.2 2.3 0.7 : 2.6 : -0.6 3.6 : : 0.7 2.71993 -12.5 3.6 4.2 : : 9.8 2.4 2.7 0.2 -0.7 : 0.8 : 2.5 8.6 : : -0.1 3.21994 -11.9 4.0 2.2 : : -7.4 1.2 11.0 -0.6 1.1 : 1.0 : 4.0 -5.5 : : 0.6 3.51995 -8.1 -0.9 2.4 : : -6.7 4.8 1.0 -0.7 1.3 : 0.9 : 1.7 6.8 : : 0.3 4.31996 -26.5 -1.2 3.6 -2.9 -0.7 -2.9 2.2 -2.5 0.7 0.7 1.6 1.6 0.2 1.0 8.6 : : 0.5 3.01997 -4.6 3.3 0.7 3.1 3.4 -0.1 3.1 -3.0 -0.8 0.0 1.1 1.0 -2.4 2.6 4.1 : : 1.8 0.81998 18.7 -2.9 3.5 3.9 5.0 -0.5 1.9 -7.3 3.7 3.0 1.7 1.7 3.8 4.2 7.8 : : 1.9 1.21999 3.5 4.3 2.4 2.8 -4.4 1.5 2.5 17.0 1.8 2.9 2.0 2.0 4.4 4.4 4.0 : : 2.7 3.72000 9.4 0.0 2.3 -1.6 0.2 0.7 2.1 -1.4 -1.2 3.5 2.3 2.4 -2.6 3.8 5.7 : : 1.5 4.6
1991-2000 : -1.0 2.3 : : : 3.5 2.8 0.9 1.5 : 1.7 : 2.6 4.7 : : 1.2 3.1
2001 2.8 3.9 2.2 -4.5 1.4 3.2 2.7 -4.4 0.8 3.7 2.3 2.3 29.7 4.7 -1.1 : : 3.5 4.22002 1.2 7.9 2.1 4.9 2.5 5.6 1.4 -4.2 2.1 4.0 2.6 2.6 -11.1 5.3 5.8 : : 3.9 2.62003 8.8 6.0 0.7 1.9 2.9 5.0 4.9 9.8 0.9 4.0 2.2 2.0 -9.9 1.8 -2.6 : : 1.8 1.92004 3.5 -3.3 1.8 3.8 4.1 1.6 3.1 -8.6 -0.3 3.8 1.8 1.9 1.3 2.2 6.0 : -0.5 1.5 1.52005 0.4 1.6 1.3 2.5 3.3 2.4 5.2 3.8 0.2 2.2 1.7 1.6 0.7 3.5 2.5 : 3.4 0.8 0.82006 3.5 -0.6 2.8 4.5 2.0 3.4 6.1 -4.1 1.7 2.2 2.2 2.1 0.5 4.0 8.4 : 2.5 1.1 0.02007 0.3 0.4 1.3 5.0 1.6 -7.2 3.7 -0.1 0.7 0.7 1.8 1.8 -0.3 4.1 6.5 : 13.3 1.4 1.12008 -1.0 1.2 1.9 -0.2 0.4 1.1 7.4 7.2 1.0 2.1 2.3 2.2 10.6 4.6 1.7 : 4.1 2.5 -0.12009 -6.5 4.0 2.1 0.4 -1.4 0.7 2.1 3.1 2.2 0.7 2.2 2.2 0.5 -1.7 7.8 : -1.9 3.7 2.32010 1.9 0.2 0.2 -2.1 -3.4 -1.2 4.1 -4.7 2.1 0.5 0.6 0.6 -2.0 -3.4 2.0 : 0.4 0.1 1.9
2001-2010 1.4 2.1 1.6 1.6 1.3 1.4 4.0 -0.4 1.1 2.4 2.0 2.0 1.5 2.5 3.7 : : 2.0 1.6
2011 1.6 -2.7 -1.4 -1.4 0.3 0.0 -1.7 -0.2 0.8 0.0 -0.2 -0.1 0.6 -0.3 4.7 : 1.0 -2.7 1.22012 -0.5 -1.9 0.4 -0.8 0.6 -1.2 0.2 1.2 0.3 1.6 -0.2 -0.2 -1.4 -1.4 6.1 : 1.7 -0.2 1.72013 2.5 1.6 0.8 0.5 1.8 1.3 2.8 -1.8 2.0 0.7 0.4 0.4 -3.6 1.3 5.9 : -1.7 -2.0 2.22014 1.5 1.5 1.2 -2.9 1.6 1.1 3.1 1.8 1.2 0.5 0.7 0.7 3.1 0.8 3.2 : -1.2 -0.2 1.62015 2.3 1.3 0.8 -2.7 1.7 2.0 2.6 1.6 1.1 0.2 0.6 0.5 2.3 0.5 2.7 : -0.8 1.1 0.9
1) Weighted in common currency 2) Weighted in common currency; Former EU-15; 1961-91 including D_W

66
National final uses
19. Gross fixed capital formation at current prices; total economy
(Percentage of gross domestic product at market prices)
BE DE EE IE EL ES FR IT CY LV LU MT NL AT PT SI SK FI EA-18 EA-12 1) 2) 3)
1960-1970 24.2 24.9 : 19.3 21.7 24.0 22.6 25.5 19.4 : 21.4 17.1 26.7 26.0 22.9 : : 26.3 : 24.4
1971-1980 24.0 22.5 : 24.8 26.8 24.7 22.8 25.3 26.6 : 21.9 16.6 23.4 26.9 29.1 : : 28.0 : 23.7
1981 20.3 21.6 : 28.1 24.8 22.3 21.4 25.9 30.8 : 21.3 17.2 20.6 25.7 32.9 : : 26.1 : 22.71982 19.1 20.3 : 25.2 22.4 22.0 20.7 24.4 29.0 : 21.0 18.5 19.9 23.2 32.4 : : 26.2 : 21.71983 17.6 20.5 : 22.0 24.1 21.4 19.4 23.0 27.2 : 17.8 20.4 19.8 22.3 30.7 : : 26.4 : 21.01984 17.3 20.1 : 20.4 19.5 19.7 18.6 22.8 30.1 : 16.8 19.5 20.3 21.9 27.0 : : 25.0 : 20.41985 17.7 19.7 : 18.1 20.9 20.2 18.5 22.4 26.6 : 14.8 18.8 21.1 22.5 25.4 : : 25.1 : 20.31986 17.6 19.6 : 17.4 21.7 20.7 18.6 21.6 23.5 : 18.8 17.0 21.7 22.3 24.5 : : 24.4 : 20.21987 18.0 19.7 : 16.3 20.6 21.9 19.2 21.6 22.9 : 21.7 19.9 22.0 22.8 27.6 : : 25.2 : 20.51988 19.8 20.0 : 15.6 20.5 23.7 20.0 22.0 24.1 : 21.8 19.5 23.4 23.5 29.5 : : 26.5 : 21.31989 21.5 20.5 : 16.8 21.4 25.1 20.5 22.1 26.9 : 21.3 20.0 23.1 23.8 28.7 : : 29.0 : 21.81990 22.6 21.3 : 18.4 22.0 25.3 20.6 22.2 24.0 20.6 21.6 22.5 22.7 23.9 27.5 19.8 31.0 28.0 : 22.1
1981-1990 19.2 20.3 : 19.8 21.8 22.2 19.8 22.8 26.5 : 19.7 19.3 21.5 23.2 28.6 : : 26.2 : 21.2
1991 21.7 21.9
1991 21.1 23.2 : 16.8 21.5 24.6 20.4 21.8 23.8 5.5 23.3 21.1 22.1 25.0 26.9 21.8 28.0 24.0 : 22.41992 20.8 23.5 : 16.5 20.3 22.6 19.4 21.3 25.1 10.0 19.7 19.6 21.9 24.6 26.7 19.7 32.6 19.9 : 21.81993 20.1 22.5 24.7 15.2 19.3 20.8 18.0 19.0 22.0 12.3 21.8 20.9 21.1 24.1 24.1 19.9 29.7 16.9 20.5 20.51994 19.6 22.5 27.4 16.2 17.7 20.7 17.8 18.7 20.0 13.3 20.6 21.1 20.6 24.7 23.2 21.2 26.3 16.3 20.3 20.31995 20.0 21.9 26.9 17.2 17.7 21.5 17.5 19.3 18.8 13.6 19.9 22.7 20.8 23.9 23.1 21.8 24.8 17.1 20.2 20.21996 20.1 21.3 26.4 18.9 18.5 21.4 17.3 19.1 19.9 16.5 20.1 23.1 21.6 24.4 23.6 22.5 31.7 18.0 20.1 20.01997 20.6 21.0 28.1 20.2 18.8 21.8 16.9 19.0 18.7 16.9 21.7 21.6 21.9 24.2 25.8 23.8 33.9 18.7 20.0 20.01998 20.7 21.1 30.4 21.7 20.1 23.1 17.4 19.4 18.9 24.2 21.8 23.0 22.2 24.2 27.0 24.9 35.7 19.5 20.5 20.41999 20.8 21.3 24.6 23.2 21.6 24.6 18.2 19.8 17.7 23.0 23.5 21.0 22.9 23.7 27.3 26.6 29.5 19.6 21.0 21.02000 21.2 21.5 25.7 23.1 22.5 25.8 18.9 20.5 17.2 24.6 20.8 21.3 21.9 24.2 27.7 26.2 25.8 20.0 21.4 21.4
1991-2000 20.5 22.0 : 18.9 19.8 22.7 18.2 19.8 20.2 16.0 21.3 21.5 21.7 24.3 25.5 22.8 29.8 19.0 : 20.8
2001 20.9 20.1 26.4 22.4 22.5 26.0 18.9 20.5 16.9 25.3 22.6 19.2 21.1 23.5 27.0 25.0 28.5 20.2 21.0 20.92002 19.1 18.4 29.7 21.6 23.4 26.3 18.2 21.1 18.2 24.2 22.5 15.3 20.0 22.0 25.6 23.3 27.4 18.7 20.2 20.22003 18.9 17.8 31.6 22.5 24.2 27.2 18.3 20.5 17.8 24.7 22.1 19.7 19.5 22.8 23.6 24.1 24.7 18.9 20.1 20.12004 19.9 17.4 30.9 24.5 22.9 28.1 18.7 20.6 19.2 27.7 21.4 19.6 18.8 22.3 23.2 25.0 24.0 19.3 20.2 20.22005 20.7 17.3 32.1 26.8 20.7 29.4 19.3 20.9 19.4 31.0 20.4 21.2 18.9 21.9 23.0 25.4 26.5 20.1 20.6 20.62006 20.9 18.1 36.0 27.2 22.6 30.6 20.0 21.4 20.6 32.9 19.2 21.3 19.7 21.3 22.3 26.5 26.5 20.0 21.4 21.32007 21.7 18.4 35.5 25.6 26.6 30.7 20.9 21.5 22.1 34.1 20.8 21.1 20.0 21.4 22.2 27.8 26.2 21.3 21.9 21.82008 22.3 18.6 30.3 22.0 22.6 28.7 21.3 21.0 22.9 29.7 21.4 18.4 20.5 21.6 22.5 28.6 24.8 21.4 21.5 21.52009 20.8 17.2 21.2 16.1 19.9 23.6 19.5 19.4 20.5 21.6 19.2 16.8 19.0 20.7 20.5 23.1 20.7 19.7 19.4 19.42010 20.1 17.4 19.0 12.2 17.6 22.2 19.5 19.4 19.1 18.2 17.4 20.0 17.4 20.2 19.6 19.7 21.0 18.9 19.0 18.9
2001-2010 20.5 18.1 29.3 22.1 22.3 27.3 19.5 20.6 19.7 26.9 20.7 19.3 19.5 21.8 22.9 24.9 25.0 19.8 20.5 20.5
2011 20.7 18.1 23.6 10.6 15.1 20.7 20.0 19.1 16.6 21.3 18.5 15.1 17.8 21.2 18.0 18.6 23.1 19.4 19.0 19.02012 20.4 17.6 25.2 10.7 13.2 19.2 19.8 18.0 13.9 22.8 19.3 15.1 17.0 21.4 16.0 17.8 20.1 19.7 18.4 18.32013 19.7 17.2 25.3 11.2 12.1 17.7 19.2 17.3 11.6 21.1 17.6 14.5 16.1 21.1 14.8 17.9 19.1 18.9 17.7 17.72014 19.8 17.7 25.3 12.4 12.7 17.1 19.4 17.5 10.0 20.9 17.1 15.5 16.7 21.2 15.4 18.2 19.1 18.4 17.9 17.92015 20.2 18.0 25.3 12.9 13.8 17.5 20.0 18.1 10.1 21.2 17.3 15.7 17.0 21.5 15.8 18.2 19.4 18.8 18.4 18.4
1) 1960-91 D_W 2) Euro area; 1960-91 including D_W 3) Former Euro area 12; 1960-91 including D_W

67
National final uses
19. Gross fixed capital formation at current prices; total economy
(Percentage of gross domestic product at market prices)
BG CZ DK HR LT HU PL RO SE UK EU-28 EU-15 MK IS TR ME RS US JP 1) 2)
1960-1970 : : 23.9 : : : : : 24.9 18.6 : 23.3 : 28.8 14.8 : : 21.5 31.9
1971-1980 : : 23.3 : : 33.7 : : 21.9 19.8 : 23.1 : 29.6 17.6 : : 22.3 32.7
1981 : : 16.5 : : 27.3 19.0 33.1 19.4 17.1 : 21.5 : 25.8 18.0 : : 23.3 30.61982 : : 17.3 : : 26.0 20.5 29.3 19.3 17.1 : 20.7 : 25.7 17.9 : : 22.5 29.41983 : : 17.6 : : 25.3 20.5 29.6 19.6 17.0 : 20.3 : 22.6 17.6 : : 22.4 27.71984 : : 18.6 : : 23.7 21.1 29.5 19.9 18.0 : 20.0 : 22.3 17.6 : : 23.5 27.31985 : : 20.4 : : 23.1 21.5 29.7 20.9 18.0 : 19.9 : 21.6 20.3 : : 23.6 27.61986 : : 22.2 : : 24.8 22.3 29.2 20.0 17.9 : 19.9 : 19.7 23.2 : : 23.5 27.51987 : : 21.8 : : 25.5 22.9 28.6 20.8 18.8 : 20.3 : 20.9 23.0 : : 23.0 28.41988 : : 20.1 : : 22.2 22.9 27.6 21.7 20.4 : 21.1 : 20.1 24.3 : : 22.4 30.01989 : : 20.0 : : 22.3 16.6 29.4 23.8 21.5 : 21.8 : 19.0 21.2 : : 22.0 31.11990 21.3 23.2 19.5 : 26.2 19.9 20.0 19.5 23.5 20.4 : 21.9 : 19.5 21.3 : : 21.2 32.0
1981-1990 : : 19.4 : : 24.0 20.7 28.5 20.9 18.6 : 20.7 : 21.7 20.4 : : 22.7 29.1
1991 21.2
1991 18.2 22.1 18.6 : 21.3 21.6 18.5 14.2 21.0 17.9 : 21.6 : 19.7 22.2 : : 20.1 31.61992 16.2 25.6 17.6 : 21.8 20.5 16.0 18.9 18.5 16.7 : 20.9 : 18.1 22.0 : : 19.8 30.41993 13.0 26.0 16.9 : 21.9 19.5 15.1 17.6 15.6 15.9 : 19.6 : 16.4 24.7 : : 20.0 29.21994 13.8 27.4 17.2 : 21.9 20.7 17.1 20.0 15.5 16.1 : 19.5 : 15.9 22.9 : : 20.3 28.21995 15.3 31.5 18.4 13.5 20.3 20.7 17.7 21.1 16.0 16.6 19.6 19.6 16.5 15.7 22.2 : : 20.8 27.81996 15.1 32.0 18.6 17.7 20.5 21.8 19.8 22.3 16.2 16.8 19.6 19.4 17.4 18.9 23.3 : : 21.3 28.11997 11.3 30.0 19.6 21.0 22.3 22.0 22.4 21.3 15.8 16.8 19.5 19.3 17.3 19.7 24.6 : 10.4 21.5 27.61998 13.1 28.5 20.4 20.4 23.8 23.1 24.1 18.3 16.6 17.9 20.1 19.9 17.4 24.0 22.9 : 10.2 22.1 25.81999 15.0 27.6 19.8 20.4 21.9 23.9 24.4 17.6 17.5 17.7 20.4 20.3 16.6 21.8 18.9 : 11.0 22.7 25.52000 15.8 28.7 20.2 19.0 18.9 24.4 23.7 18.8 18.0 17.4 20.7 20.5 16.2 22.9 20.4 16.9 12.7 23.0 25.2
1991-2000 14.7 27.9 18.7 : 21.5 21.8 19.9 19.0 17.1 17.0 : 20.1 : 19.3 22.4 : : 21.2 27.9
2001 18.3 28.4 19.8 19.5 20.3 23.6 20.7 20.5 17.9 17.1 20.2 20.1 14.8 21.5 15.9 17.5 10.7 22.4 24.32002 18.3 27.5 19.6 21.4 20.4 23.4 18.7 21.3 17.4 17.1 19.7 19.5 16.6 18.2 16.7 14.6 12.4 21.4 22.92003 19.0 26.8 19.3 25.0 21.2 22.4 18.2 21.5 16.8 16.7 19.5 19.4 16.3 19.9 17.0 13.3 16.8 21.5 22.52004 20.4 25.9 19.3 24.8 22.4 22.7 18.1 21.8 17.0 16.9 19.6 19.5 17.4 23.6 20.3 17.1 19.2 22.0 22.22005 25.7 25.8 19.5 24.7 22.9 22.8 18.2 23.7 17.9 16.8 20.0 19.8 16.6 28.3 21.0 18.0 19.0 22.8 22.32006 27.6 25.7 21.7 26.0 25.3 21.7 19.7 25.6 18.7 17.2 20.7 20.5 17.6 34.5 22.3 21.9 21.0 22.8 22.72007 28.7 27.0 21.7 26.2 28.1 21.8 21.6 30.2 19.6 17.8 21.3 21.0 19.6 28.5 21.4 32.3 24.3 22.1 22.62008 33.6 26.8 21.0 27.4 25.3 21.7 22.3 31.9 20.0 16.8 21.1 20.7 21.0 24.4 19.9 38.2 23.8 21.0 22.42009 28.9 24.6 18.1 24.5 17.2 20.7 21.2 24.4 18.0 14.9 19.0 18.7 19.9 13.8 16.9 26.8 18.8 18.5 20.82010 22.8 24.5 16.9 20.8 16.3 18.6 19.9 24.7 18.0 14.9 18.5 18.2 19.1 12.7 18.9 21.1 17.8 18.0 20.0
2001-2010 24.3 26.3 19.7 24.0 21.9 21.9 19.8 24.6 18.1 16.6 19.9 19.7 17.9 22.5 19.0 22.1 18.4 21.3 22.3
2011 21.5 24.1 17.4 19.6 18.0 17.9 20.2 26.1 18.7 14.4 18.5 18.2 20.6 14.1 21.8 18.4 18.5 18.2 20.62012 21.4 23.1 17.4 18.6 16.6 17.4 19.2 26.3 19.0 14.5 17.9 17.7 23.0 14.6 20.3 18.5 21.4 18.6 21.12013 20.7 22.1 17.2 18.4 18.3 18.1 18.4 23.6 18.3 14.0 17.3 17.1 18.2 13.6 20.3 19.2 20.5 18.9 21.72014 21.6 22.1 17.2 18.5 19.3 18.8 18.7 23.7 18.8 14.4 17.5 17.3 17.7 13.9 19.9 20.7 22.3 19.4 22.22015 21.8 22.1 17.4 18.9 20.2 19.3 19.5 23.9 19.3 15.0 18.0 17.8 17.3 14.7 19.7 22.5 25.1 20.2 22.2
1) 1960-91 including D_W 2) Former EU-15; 1960-91 including D_W

68
National final uses
20. Gross fixed capital formation at 2005 prices; total economy
(National currency; annual percentage change)
BE DE EE IE EL ES FR IT CY LV LU MT NL AT PT SI SK FI EA-18 EA-12 1) 2) 3)
1961-1970 5.8 4.2 : 9.6 8.4 11.3 7.8 5.1 : : 3.4 : 7.1 5.9 6.9 : : 4.4 : 6.1
1971-1980 2.3 1.6 : 5.7 1.7 1.6 2.8 2.7 : : 2.6 : 0.0 3.9 4.5 : : 2.5 : 2.1
1981 -15.5 -4.7 : 7.3 -10.1 -1.7 -1.9 -1.6 : : -7.4 : -9.4 -0.1 14.8 : : 2.6 : -3.41982 -4.0 -4.6 : -3.4 -3.6 1.0 -1.5 -3.4 : : -0.5 : -2.8 -8.3 2.0 : : 5.4 : -2.81983 -5.3 3.0 : -9.0 -3.7 -1.2 -3.6 -1.4 : : -11.8 : 2.2 -0.4 -2.7 : : 3.5 : -0.61984 2.3 0.1 : -2.7 -7.6 -4.8 -1.5 4.0 : : 0.1 : 7.2 -0.2 -11.9 : : -1.0 : 0.21985 4.5 0.7 : -7.8 9.6 6.7 2.3 1.0 : : -9.5 : 7.6 6.2 -0.9 : : 4.0 : 2.41986 3.1 3.2 : 0.0 4.3 10.5 4.6 2.8 : : 37.1 : 6.8 1.9 6.0 : : 1.0 : 4.21987 4.9 2.1 : -2.3 -15.7 12.2 4.9 4.8 : : 17.7 : 1.5 4.4 22.0 : : 5.5 : 4.31988 16.0 5.0 : -1.6 12.2 13.6 9.4 7.2 : : 11.5 : 9.8 7.1 15.3 : : 11.3 : 8.31989 11.8 7.2 : 15.6 3.7 12.0 7.4 4.4 : : 6.9 : 3.3 4.5 3.4 : : 12.6 : 7.11990 8.6 8.0 : 12.1 1.7 6.5 3.9 4.3 : : 3.4 : 2.9 5.5 7.0 : : -3.8 : 5.3
1981-1990 2.3 1.9 : 0.5 -1.3 5.3 2.3 2.2 : : 3.9 : 2.8 1.9 5.1 : : 4.0 : 2.4
1991 -4.1 5.3 : -7.0 7.4 1.7 -0.3 1.3 : : 15.8 : 1.3 8.3 4.7 -11.5 : -18.2 : 1.61992 1.1 4.6 : 0.0 -5.9 -4.1 -2.0 -1.4 : : -15.1 : 1.8 0.1 7.8 -12.9 : -15.8 : 0.11993 -2.5 -4.3 : -5.1 -4.7 -8.9 -6.0 -11.2 : : 20.6 : -1.6 -1.2 -9.0 10.7 13.0 -13.7 : -6.31994 0.4 4.2 9.2 11.8 -1.4 1.9 1.7 0.7 : : 0.0 : 2.0 5.1 0.5 14.1 -2.5 -0.2 : 2.61995 3.4 -0.2 5.6 15.1 3.1 7.7 1.8 7.0 -0.6 : -1.5 : 5.9 0.2 4.2 16.8 0.6 14.5 : 2.91996 1.6 -0.6 18.2 16.3 8.4 2.6 0.7 1.9 6.3 22.3 4.9 -8.4 8.5 4.5 5.4 8.7 30.1 9.3 1.8 1.71997 5.9 0.9 23.6 16.4 6.8 5.0 0.5 1.5 -4.5 20.7 10.4 -4.5 8.5 0.4 14.2 13.2 14.0 10.5 2.7 2.61998 3.3 4.0 21.4 13.2 10.6 11.3 7.4 3.9 5.7 61.4 6.1 -3.4 6.8 3.3 11.8 8.6 9.4 11.1 6.0 5.91999 2.6 4.5 -15.5 13.4 11.0 10.4 8.5 4.0 -0.7 -6.8 22.0 4.0 8.7 1.2 6.0 14.7 -15.7 3.3 6.0 6.12000 5.1 2.6 16.7 6.2 8.0 6.6 6.8 6.4 3.5 10.1 -4.7 17.5 0.6 5.2 3.9 2.6 -9.6 6.4 4.7 4.8
1991-2000 1.6 2.1 : 7.7 4.2 3.2 1.8 1.3 : : 5.3 : 4.2 2.7 4.8 6.0 : 0.0 : 2.2
2001 1.0 -3.3 13.1 0.2 4.8 4.8 2.2 2.7 3.0 11.4 8.8 -9.8 0.2 -1.0 0.6 1.3 12.9 2.9 0.7 0.62002 -4.5 -6.1 24.2 2.5 9.5 3.4 -1.9 3.4 8.6 12.9 5.2 -18.8 -4.5 -4.0 -3.2 0.3 0.2 -3.7 -1.5 -1.62003 0.1 -1.2 16.7 6.5 11.8 5.9 2.2 -1.3 2.4 12.3 6.2 32.8 -1.5 4.8 -7.1 7.6 -2.7 3.0 1.1 1.02004 7.8 -0.2 6.0 9.7 0.4 5.1 3.4 2.0 11.6 23.7 2.7 -0.2 -1.6 0.6 0.0 5.0 4.8 4.9 2.3 2.22005 6.4 0.8 15.2 14.8 -6.3 7.1 4.4 1.3 4.1 23.5 2.5 18.2 3.7 0.6 -0.5 3.0 17.5 3.6 3.2 3.12006 2.6 8.2 23.0 4.8 14.9 7.1 4.0 3.4 10.2 16.3 4.1 -0.4 7.5 0.5 -1.3 10.4 9.3 1.9 5.6 5.52007 6.3 4.7 9.3 2.5 22.8 4.5 6.3 1.8 13.4 7.9 18.4 2.0 5.5 3.6 2.6 13.3 9.1 10.7 5.2 5.12008 2.0 1.3 -13.3 -9.5 -14.3 -4.7 0.3 -3.7 6.0 -13.8 2.0 -13.6 4.5 0.7 -0.3 7.1 1.0 -0.6 -1.4 -1.42009 -8.4 -11.7 -39.0 -27.0 -13.7 -18.0 -10.6 -11.7 -9.7 -37.4 -16.2 -14.2 -12.0 -7.8 -8.6 -23.8 -19.7 -13.2 -12.8 -12.62010 -1.1 5.7 -7.3 -22.7 -15.0 -5.5 1.4 0.6 -4.9 -18.1 -0.7 22.2 -7.4 -1.4 -3.1 -15.3 6.5 1.7 -0.4 -0.4
2001-2010 1.1 -0.3 2.8 -2.8 0.7 0.7 1.1 -0.3 4.2 1.8 3.0 0.6 -0.8 -0.4 -2.1 0.2 3.4 0.9 0.1 0.0
2011 4.1 6.9 37.6 -9.1 -19.6 -5.4 2.9 -2.2 -8.7 27.9 12.1 -26.1 6.1 8.5 -10.5 -5.5 14.2 5.8 1.6 1.52012 -2.0 -2.1 10.9 -0.6 -19.2 -7.0 -1.2 -8.0 -18.3 8.7 3.5 -2.0 -4.0 1.6 -14.4 -8.2 -10.5 -0.8 -4.0 -3.92013 -2.5 -0.7 1.1 3.6 -12.8 -5.1 -2.3 -4.7 -21.6 -4.3 -4.4 -3.8 -4.8 -0.9 -6.6 0.2 -4.3 -4.6 -2.9 -2.92014 1.6 4.5 0.9 12.0 5.3 -1.4 1.3 1.6 -18.1 3.2 0.3 10.5 4.9 2.2 3.3 2.7 2.3 -3.3 2.3 2.32015 3.2 4.5 3.7 6.5 11.7 4.2 4.5 4.0 1.3 6.8 2.7 3.0 2.9 3.4 3.8 1.4 3.5 2.6 4.2 4.2
1) 1961-91 D_W 2) Weighted in common currency; Euro area 3) Weighted in common currency; Former Euro area 12; 1961-91 including D_W

69
National final uses
20. Gross fixed capital formation at 2005 prices; total economy
(National currency; annual percentage change)
BG CZ DK HR LT HU PL RO SE UK EU-28 EU-15 MK IS TR ME RS US JP 1) 2)
1961-1970 : : 7.6 : : : : : 5.1 5.2 : 5.9 : 2.7 8.1 : : 4.7 15.7
1971-1980 : : 0.9 : : : : : 0.6 0.5 : 1.8 : 7.1 2.1 : : 3.5 3.5
1981 : : -17.6 : : : : : -3.1 -8.7 : -4.3 : 1.2 31.6 : : 1.9 2.91982 : : 10.2 : : : : : 0.7 6.0 : -1.3 : 0.1 -5.7 : : -5.4 0.01983 : : 4.4 : : : : : 3.4 5.0 : 0.4 : -12.7 2.6 : : 7.3 -1.41984 : : 11.2 : : : : : 8.1 9.1 : 1.9 : 9.4 0.9 : : 15.0 4.31985 : : 15.4 : : : : : 7.9 4.2 : 3.1 : 1.0 11.5 : : 7.0 8.31986 : : 19.3 : : : : : 1.3 2.2 : 4.1 : -1.6 8.4 : : 3.1 5.61987 : : 2.4 : : : : : 6.1 9.5 : 5.0 : 18.8 45.1 : : 1.8 7.91988 : : -6.7 : : : : : 5.6 14.8 : 8.7 : -0.2 -1.0 : : 2.4 13.31989 : : 1.8 : : : : : 11.4 6.1 : 7.0 : -7.9 2.2 : : 2.9 9.21990 : : -1.2 : : : : : 0.2 -2.2 : 3.8 : 3.0 15.9 : : -0.1 7.9
1981-1990 : : 3.4 : : : : : 4.1 4.4 : 2.8 : 0.8 10.2 : : 3.5 5.7
1991 : -27.3 -3.2 : : : -4.5 -31.6 -8.8 -8.1 : -0.2 : 2.6 0.4 : : -4.1 2.51992 : 16.5 -0.2 : : -2.6 2.4 11.0 -10.6 0.9 : -0.1 : -10.4 6.4 : : 4.1 -2.21993 : 0.2 -3.7 : : 2.0 2.9 8.3 -16.9 1.6 : -5.7 : -9.8 26.4 : : 5.1 -2.71994 : 11.7 8.5 : : 12.5 9.2 20.7 7.0 6.4 : 3.2 : -0.2 -16.0 : : 6.1 -1.51995 16.1 23.3 11.9 : 14.9 -4.3 16.6 6.9 9.9 4.7 : 3.4 : -1.7 9.1 : : 5.2 0.81996 -20.1 9.1 5.8 37.6 21.1 4.4 19.7 5.7 4.7 7.2 2.9 2.5 6.5 25.0 14.1 : : 7.7 4.61997 -20.7 -6.5 10.3 26.4 25.5 7.0 21.8 0.3 0.6 9.0 3.8 3.5 -4.3 9.3 14.8 : : 7.4 -0.11998 31.3 -1.0 8.1 2.5 21.1 12.8 14.0 -4.7 8.8 12.4 7.1 7.0 -2.6 34.4 -3.9 : : 8.9 -6.91999 18.4 -2.1 -0.1 -3.9 -5.9 7.4 6.6 -1.7 8.7 1.9 5.2 5.4 -1.4 -4.1 -16.2 : : 8.3 -0.62000 16.8 6.5 7.6 -3.9 -8.4 6.0 2.7 6.3 5.7 2.6 4.4 4.5 -1.5 11.8 17.5 : : 6.3 0.7
1991-2000 : 2.1 4.4 : : : 8.8 1.1 0.5 3.7 : 2.3 : 4.8 4.4 : : 5.4 -0.6
2001 20.9 4.5 -1.4 7.0 13.2 1.9 -9.7 9.9 0.5 -1.9 0.2 0.2 -8.6 -4.3 -30.0 : : -0.5 -2.12002 7.6 3.8 0.1 14.1 10.7 7.4 -6.3 8.9 -1.3 2.7 -0.7 -0.9 17.6 -14.0 14.7 : : -1.8 -4.92003 13.0 0.6 -0.2 24.6 13.5 1.5 -0.1 8.8 1.6 2.3 1.4 1.2 1.1 11.1 14.2 : : 3.9 0.22004 13.7 3.0 3.9 5.1 15.7 7.2 6.4 11.0 5.7 6.2 3.2 2.9 9.8 28.7 28.4 : 23.8 5.8 0.42005 30.7 6.0 4.7 4.9 11.2 4.5 6.5 15.3 8.1 3.7 3.7 3.3 -6.1 34.4 17.4 : 4.8 5.6 0.82006 13.1 5.8 14.3 11.1 19.3 -2.7 14.9 19.9 9.2 5.6 6.2 5.8 7.7 24.4 13.3 : 17.2 2.2 1.52007 11.8 13.2 0.4 7.1 21.8 3.8 17.6 30.3 8.9 7.5 6.2 5.5 17.1 -12.2 3.1 : 29.7 -1.3 0.32008 21.9 4.1 -4.2 8.7 -5.2 2.9 9.6 15.6 1.4 -6.9 -1.4 -2.2 5.4 -20.4 -6.2 : 8.5 -4.9 -4.12009 -17.6 -11.0 -15.9 -14.2 -39.5 -11.1 -1.2 -28.1 -15.5 -16.7 -13.4 -13.3 -4.3 -51.4 -19.0 : -22.1 -13.1 -10.62010 -18.3 1.0 -2.1 -15.0 1.9 -8.5 -0.4 -1.8 7.2 2.8 -0.2 0.2 -2.7 -9.4 30.5 : -5.5 1.1 -0.2
2001-2010 8.5 2.9 -0.3 4.7 4.5 0.5 3.4 7.8 2.3 0.3 0.4 0.1 3.3 -4.9 4.8 : : -0.4 -1.9
2011 -6.5 0.4 3.3 -3.4 20.7 -5.9 8.5 7.7 8.2 -2.4 1.6 1.2 12.3 14.1 18.0 : 8.4 3.5 1.42012 4.0 -4.5 0.8 -4.7 -3.6 -3.7 -1.6 3.8 3.3 0.8 -2.9 -3.0 20.0 5.5 -2.7 : 14.4 5.5 3.42013 -0.3 -3.5 0.6 -1.0 12.8 5.9 -0.2 -3.3 -1.3 -0.6 -2.3 -2.5 -11.5 -3.4 4.3 : -7.7 2.9 2.62014 5.5 2.3 2.4 0.0 6.5 7.0 4.8 2.7 5.5 6.6 3.1 3.0 10.6 5.0 1.3 : 5.5 4.9 3.82015 2.5 2.6 3.0 3.0 6.9 4.3 7.3 4.3 6.5 7.1 4.7 4.7 9.0 10.0 3.0 : 9.8 7.5 1.6
1) Weighted in common currency 2) Weighted in common currency; Former EU-15; 1961-91 including D_W

70
National final uses
21. Changes in inventories and acquisitions less disposals of valuables at current prices; total economy
(Percentage of gross domestic product at market prices)
BE DE EE IE EL ES FR IT CY LV LU MT NL AT PT SI SK FI EA-18 EA-12 1) 2) 3)
1960-1970 0.9 1.8 : 1.4 2.1 2.0 1.9 1.1 1.1 : 0.8 2.4 1.7 1.7 2.0 : : 0.9 : 1.7
1971-1980 0.9 1.3 : 1.4 3.4 1.2 1.3 0.2 2.9 : -1.7 2.1 0.2 1.4 2.7 : : 1.3 : 1.1
1981 0.6 -0.2 : -1.1 -4.9 -0.2 -0.4 -1.0 2.3 : -0.9 2.9 -0.5 -0.2 3.8 : : 1.3 : -0.41982 0.9 -0.2 : 1.4 2.0 -0.1 0.6 -0.5 2.0 : -0.1 5.5 -0.9 0.1 4.4 : : 1.3 : 0.11983 -0.2 0.3 : 0.7 -0.8 -0.3 -0.2 -0.6 2.3 : 3.1 1.2 0.0 -0.5 0.8 : : 0.6 : -0.11984 1.1 0.5 : 1.4 5.0 0.4 -0.1 0.6 2.8 : 4.7 1.5 0.1 0.6 -0.2 : : 0.9 : 0.51985 -0.1 0.4 : 0.9 4.6 0.0 0.0 0.9 3.2 : 2.0 1.7 -0.3 0.7 0.3 : : 0.3 : 0.41986 -0.4 0.5 : 0.6 3.0 0.4 0.5 0.2 1.9 : 1.2 1.6 0.3 0.2 0.5 : : -0.1 : 0.41987 0.2 -0.1 : 0.1 -1.8 0.6 0.4 0.6 2.1 : 1.1 -0.4 -0.1 0.0 1.9 : : -0.1 : 0.21988 0.4 0.3 : -0.2 0.6 0.9 0.7 0.7 2.9 : 1.8 1.4 -0.2 0.7 1.6 : : 0.9 : 0.51989 0.3 0.5 : 1.0 -0.2 0.8 1.1 0.4 3.4 : 2.0 1.5 0.9 1.3 0.8 : : 1.5 : 0.71990 0.0 0.3 : 2.3 -0.3 0.8 1.0 0.3 2.4 15.4 2.4 0.0 0.7 1.3 2.5 -1.6 2.2 0.5 : 0.6
1981-1990 0.3 0.2 : 0.7 0.7 0.3 0.4 0.1 2.5 : 1.7 1.7 0.0 0.4 1.7 : : 0.7 : 0.3
1991 0.7 0.5
1991 0.1 0.8 : 2.1 0.9 0.7 0.4 0.4 1.5 24.9 2.4 0.0 0.5 0.5 -0.3 -3.7 6.9 -1.8 : 0.51992 0.1 0.0 : -0.6 -0.3 0.7 -0.1 0.3 3.0 27.1 2.7 0.0 0.7 0.3 -0.3 -1.0 -4.8 -1.2 : 0.11993 0.3 -0.3 2.4 -0.4 -0.4 0.0 -1.2 0.0 1.4 -4.1 0.5 0.0 -0.5 -0.2 -0.9 0.5 -5.3 -0.6 -0.4 -0.41994 0.8 -0.1 0.6 -0.4 0.1 0.4 -0.1 0.2 4.9 3.8 0.5 0.0 0.3 0.0 1.0 0.8 -5.6 1.2 0.1 0.11995 0.7 0.4 1.3 0.8 0.3 0.4 0.4 0.7 2.8 3.4 -0.3 11.1 0.2 1.5 0.9 1.9 -0.4 1.1 0.5 0.51996 0.4 0.0 1.7 0.7 0.3 0.3 -0.2 0.2 1.4 1.6 0.1 7.2 0.1 0.6 0.6 0.9 2.3 -0.2 0.1 0.11997 0.4 0.3 2.8 1.2 0.3 0.2 -0.1 0.4 0.3 4.0 0.5 4.7 0.3 0.8 0.5 0.7 0.4 0.4 0.3 0.31998 0.5 0.7 0.6 1.6 0.2 0.4 0.8 0.3 0.0 2.7 1.5 0.5 0.6 0.7 1.1 0.8 -2.2 0.8 0.6 0.61999 0.6 0.4 0.7 0.5 -0.1 0.6 0.6 0.4 -0.8 0.9 0.5 1.8 0.0 1.2 1.5 1.2 -1.7 0.0 0.5 0.52000 1.4 0.8 2.7 0.8 1.7 0.4 1.0 0.3 0.6 -1.4 2.4 5.2 0.1 0.3 0.8 1.2 0.2 0.8 0.7 0.7
1991-2000 0.5 0.3 : 0.6 0.3 0.4 0.2 0.3 1.5 6.3 1.1 3.0 0.2 0.6 0.5 0.3 -1.0 0.1 : 0.3
2001 0.3 0.3 1.5 0.3 1.6 0.4 0.7 0.2 -0.5 0.4 1.8 0.2 0.3 0.4 0.7 0.0 1.1 0.3 0.4 0.42002 0.0 -0.3 2.6 0.5 -0.2 0.3 0.4 0.2 0.3 1.5 -0.6 0.1 -0.3 0.1 0.1 0.7 1.7 0.5 0.1 0.12003 0.5 0.1 1.6 0.9 1.2 0.2 0.2 0.4 -0.7 3.8 0.0 -2.1 -0.2 0.3 -0.1 1.3 -0.1 0.5 0.2 0.22004 1.0 0.2 2.2 0.3 0.5 0.2 0.5 0.4 0.6 5.1 0.3 -1.3 0.2 0.5 0.7 2.5 2.3 0.7 0.4 0.42005 1.3 0.0 1.7 0.5 0.7 0.1 0.6 0.0 0.4 2.5 2.0 -0.2 0.1 0.8 0.6 1.8 2.3 1.8 0.3 0.32006 1.5 0.1 2.7 0.9 2.0 0.4 0.8 0.4 0.0 6.1 1.1 0.6 0.3 1.0 0.7 2.4 1.5 1.3 0.6 0.52007 1.3 0.8 3.1 0.6 0.1 0.3 1.0 0.7 -0.5 5.9 0.2 0.5 0.4 1.7 0.6 4.2 1.6 1.6 0.8 0.82008 1.7 0.7 -0.3 -0.2 1.5 0.4 0.6 0.6 0.4 1.6 0.1 1.6 0.0 1.2 0.7 3.2 2.9 0.9 0.7 0.72009 -1.0 -0.8 -2.5 -0.9 -1.3 0.3 -0.5 -0.5 -1.2 -1.1 -2.4 1.3 -0.6 0.3 -0.3 -1.0 -1.2 -1.2 -0.6 -0.52010 0.6 -0.1 0.8 -0.3 -0.1 0.6 -0.2 0.6 0.7 1.6 2.5 0.6 0.4 0.9 0.6 0.9 1.5 -0.4 0.2 0.2
2001-2010 0.7 0.1 1.3 0.3 0.6 0.3 0.4 0.3 -0.1 2.7 0.5 0.1 0.1 0.7 0.4 1.6 1.4 0.6 0.3 0.3
2011 1.3 0.1 3.2 0.6 1.0 0.5 0.8 0.7 -0.1 3.6 2.6 1.1 0.3 1.8 0.4 1.6 0.7 1.1 0.6 0.62012 0.7 -0.4 3.0 0.2 0.5 0.6 0.0 0.0 1.3 2.2 2.0 -1.5 0.5 1.2 0.6 -0.3 -0.7 0.2 0.1 0.12013 0.1 -0.5 1.6 0.3 0.9 0.5 0.4 0.0 -1.1 1.7 0.9 0.8 0.1 0.4 0.5 -0.7 -0.8 -0.2 0.0 0.12014 0.0 -0.8 1.5 0.2 1.2 0.5 0.6 -0.1 -1.1 1.7 0.9 0.7 0.1 0.4 0.4 -0.9 -0.7 -0.2 0.0 0.02015 0.0 -0.7 1.4 0.2 0.9 0.5 0.6 -0.2 -0.9 1.5 0.8 0.5 0.1 0.4 0.4 -0.9 -0.7 -0.1 0.0 0.0
1) 1960-91 D_W 2) Euro area; 1960-91 including D_W 3) Former Euro area 12; 1960-91 including D_W

71
National final uses
21. Changes in inventories and acquisitions less disposals of valuables at current prices; total economy
(Percentage of gross domestic product at market prices)
BG CZ DK HR LT HU PL RO SE UK EU-28 EU-15 MK IS TR ME RS US JP 1) 2)
1960-1970 : : 1.7 : : : : : 2.5 1.0 : 1.6 : 0.2 0.6 : : 0.9 3.1
1971-1980 : : 0.7 : : 3.6 : : 1.5 0.5 : 1.0 : 1.8 0.2 : : 0.7 1.1
1981 : : 0.1 : : 3.2 -0.2 2.7 -0.1 -1.1 : -0.5 : 1.0 2.0 : : 0.9 0.51982 : : 0.5 : : 3.3 7.8 4.0 -0.3 -0.4 : 0.0 : 2.3 0.1 : : -0.4 0.41983 : : 0.2 : : 1.9 4.9 4.0 -0.8 0.5 : 0.0 : -1.6 -0.7 : : -0.2 0.11984 : : 1.5 : : 2.7 5.6 4.2 -0.3 0.4 : 0.5 : 0.9 -0.6 : : 1.6 0.31985 : : 1.2 : : 2.5 6.5 2.9 0.6 0.2 : 0.4 : -0.8 0.0 : : 0.5 0.71986 : : 1.1 : : 2.9 7.0 4.7 0.1 0.2 : 0.4 : -1.3 0.4 : : 0.1 0.51987 : : -0.4 : : 1.9 6.3 2.8 0.2 0.3 : 0.2 : -0.2 0.5 : : 0.6 0.11988 : : 0.2 : : 3.7 10.1 0.4 0.3 0.9 : 0.6 : 0.7 -1.3 : : 0.4 0.71989 : : 0.6 : : 5.0 22.1 -3.1 0.5 0.5 : 0.7 : -0.2 0.3 : : 0.5 0.71990 9.1 -0.1 0.4 : : 6.1 4.3 10.5 0.4 -0.3 : 0.5 : -0.5 1.0 : : 0.2 0.6
1981-1990 : : 0.5 : : 3.3 7.4 3.3 0.1 0.1 : 0.3 : 0.0 0.2 : : 0.4 0.5
1991 0.2
1991 4.4 -1.1 0.0 : : -0.5 0.4 13.7 -0.9 -0.8 : 0.3 : 0.3 -1.4 : : 0.0 0.71992 3.7 -1.7 0.2 : : -3.8 -1.5 12.2 0.0 -0.3 : 0.0 : 0.0 -0.2 : : 0.2 0.21993 2.3 -0.9 -0.7 : : 1.1 -0.3 11.0 -0.3 0.0 : -0.4 : 0.6 0.6 : : 0.3 0.11994 -4.4 0.9 0.4 : : 2.1 -0.3 4.5 1.0 0.5 : 0.2 : 0.1 -3.2 : : 0.9 -0.21995 0.4 0.7 1.1 2.2 2.4 1.1 1.0 2.1 1.2 0.6 0.6 0.6 4.2 0.7 1.1 : : 0.4 0.31996 -6.0 1.7 0.5 1.5 0.5 2.0 1.1 0.2 0.4 0.2 0.1 0.1 2.7 0.0 -0.9 : : 0.4 0.51997 -1.1 0.5 1.2 3.8 2.2 3.0 1.0 -0.5 0.5 0.6 0.4 0.3 3.6 0.0 -1.6 : 1.3 0.8 0.51998 3.8 0.1 1.1 0.1 0.5 4.5 1.0 -0.4 0.8 0.6 0.6 0.6 4.8 0.2 -0.7 : -2.4 0.7 0.31999 2.7 -0.1 0.0 -0.2 -0.6 2.2 0.9 -2.4 0.3 0.7 0.5 0.5 3.1 0.0 0.2 : -2.0 0.6 -0.82000 2.2 1.2 1.0 0.0 -0.4 2.7 1.1 0.5 0.7 0.5 0.7 0.7 6.0 0.4 0.4 : -4.6 0.5 -0.1
1991-2000 0.8 0.1 0.5 : : 1.4 0.4 4.1 0.4 0.3 : 0.3 : 0.2 -0.6 : : 0.5 0.2
2001 2.0 1.3 0.6 1.8 -1.5 1.6 0.1 1.7 0.3 0.6 0.5 0.4 4.2 -0.3 -0.9 : 1.0 -0.4 0.02002 1.4 0.6 0.8 3.7 0.0 1.3 -0.1 0.7 0.1 0.3 0.2 0.1 4.0 0.0 0.9 : -1.4 0.2 -0.42003 2.1 0.2 0.4 2.1 0.3 1.2 0.5 0.4 0.3 0.4 0.3 0.2 2.8 -0.2 0.6 : -2.3 0.2 -0.12004 2.4 1.2 1.1 1.8 -0.1 3.2 2.0 1.9 0.0 0.4 0.5 0.4 4.6 -0.1 -1.0 : 9.0 0.5 0.32005 1.8 0.7 1.3 2.3 0.7 1.8 1.0 -0.4 -0.2 0.3 0.4 0.3 4.8 -0.1 -1.0 : 4.7 0.5 0.12006 4.5 2.0 1.1 3.0 0.7 2.4 1.4 0.8 0.0 0.4 0.6 0.5 3.9 1.2 -0.2 : 3.1 0.5 0.02007 5.4 2.8 1.6 2.8 3.1 0.6 2.9 0.8 0.7 0.4 0.9 0.7 5.0 0.5 -0.4 : 4.7 0.2 0.32008 3.9 2.1 1.3 3.1 1.7 1.8 1.6 -0.7 0.2 0.3 0.7 0.6 5.8 0.2 1.9 : 6.0 -0.2 0.52009 0.5 -0.8 -1.1 0.5 -5.7 -2.7 -0.8 0.9 -1.5 -0.8 -0.6 -0.6 6.3 0.0 -1.9 : -0.7 -1.0 -1.12010 0.1 0.2 0.0 0.2 1.0 0.7 1.1 0.9 0.7 0.1 0.2 0.2 5.8 -0.2 0.6 : -0.5 0.4 -0.2
2001-2010 2.4 1.0 0.7 2.1 0.0 1.2 1.0 0.7 0.1 0.3 0.3 0.3 4.7 0.1 -0.1 : 2.4 0.1 -0.1
2011 0.4 0.4 0.4 0.9 3.2 1.3 1.9 0.8 1.2 0.6 0.7 0.6 5.6 0.3 1.7 : 1.7 0.2 -0.42012 0.4 0.3 0.0 0.5 1.7 0.0 1.3 -0.3 -0.1 0.4 0.2 0.1 6.4 0.3 -0.1 : -0.4 0.4 -0.32013 0.2 0.2 0.3 0.2 0.1 -0.5 0.3 -0.7 0.1 0.6 0.1 0.1 6.3 -0.1 0.3 0.5 -2.1 0.6 -0.72014 0.2 0.0 0.1 0.2 0.1 -0.6 0.6 -0.5 0.2 0.7 0.1 0.1 6.1 -0.1 0.1 1.0 -2.2 0.0 0.02015 0.2 0.0 0.1 0.2 0.1 -0.6 0.6 -0.5 0.2 0.6 0.1 0.1 5.9 -0.1 0.2 1.3 -2.3 0.0 0.0
1) 1960-91 including D_W 2) Former EU-15; 1960-91 including D_W

72
National final uses
22. Domestic demand including stocks at current prices
(Percentage of gross domestic product at market prices)
BE DE EE IE EL ES FR IT CY LV LU MT NL AT PT SI SK FI EA-18 EA-12 1) 2) 3)
1960-1970 100.4 97.8 : 107.5 107.0 102.2 99.1 99.5 106.6 : 85.3 117.0 100.0 100.9 104.9 : : 101.3 : 99.4
1971-1980 100.1 98.1 : 110.5 106.0 101.4 99.8 100.3 115.7 : 85.2 114.6 98.1 101.5 109.4 : : 101.0 : 99.7
1981 102.9 99.5 : 115.0 102.5 101.9 101.5 102.0 112.1 : 93.6 107.5 96.1 102.2 117.5 : : 98.9 : 101.01982 102.5 97.8 : 108.2 106.4 101.6 102.5 101.3 110.9 : 92.5 115.3 95.7 100.5 117.4 : : 100.0 : 100.61983 100.1 98.3 : 103.6 107.3 100.6 100.3 99.4 110.8 : 90.8 114.1 96.7 100.3 111.0 : : 100.0 : 99.61984 99.8 97.7 : 101.1 106.3 97.9 99.9 100.4 109.6 : 89.4 114.3 94.7 99.9 108.4 : : 98.2 : 99.11985 99.3 96.6 : 98.9 107.3 98.1 100.4 100.4 106.5 : 86.2 114.9 95.8 100.7 105.3 : : 98.9 : 98.91986 97.9 95.0 : 98.5 106.1 98.0 100.2 98.6 99.9 : 86.0 109.2 96.5 99.4 103.4 : : 98.2 : 97.91987 98.4 95.1 : 95.1 104.8 99.9 101.2 99.5 100.0 : 90.4 108.5 97.7 99.6 107.4 : : 99.3 : 98.61988 97.8 95.1 : 93.2 106.0 101.2 100.8 99.9 103.3 : 88.8 109.2 97.5 100.3 110.8 : : 99.6 : 98.81989 98.0 95.1 : 93.7 108.1 103.3 100.8 100.0 104.7 : 85.5 110.1 97.0 100.4 108.6 : : 102.0 : 99.11990 98.5 94.4 : 94.8 110.1 103.3 100.9 99.8 102.7 101.3 86.4 112.8 96.2 100.3 108.8 87.8 109.3 101.3 : 98.9
1981-1990 99.5 96.5 : 100.2 106.5 100.6 100.9 100.1 106.0 : 89.0 111.6 96.4 100.4 109.9 : : 99.6 : 99.2
1991 94.6 98.8
1991 98.4 100.4 : 94.5 109.8 103.1 100.4 99.8 108.1 91.3 87.4 110.2 95.9 100.2 109.7 90.8 103.3 101.3 : 100.51992 97.6 100.4 : 91.8 108.5 102.7 99.4 99.9 108.5 93.9 83.2 106.2 96.2 100.6 109.3 93.1 104.2 99.6 : 100.21993 96.8 99.8 104.5 88.9 108.4 100.6 98.4 96.8 98.1 85.4 81.5 108.8 94.6 100.5 107.7 99.0 104.6 95.6 98.8 98.71994 96.3 99.7 110.9 89.6 106.5 100.0 98.6 96.6 98.1 98.3 79.5 109.3 94.4 101.1 107.9 97.9 94.7 94.7 98.6 98.61995 96.1 99.4 108.1 88.6 107.6 100.0 98.5 96.2 100.1 102.3 78.8 112.8 94.3 101.1 106.7 101.9 97.8 93.0 98.4 98.41996 96.9 99.0 109.2 90.0 108.3 99.5 98.4 95.3 102.9 107.2 79.8 112.6 94.7 101.3 107.2 101.0 110.8 93.8 98.2 98.11997 96.2 98.7 109.5 88.4 107.7 99.1 97.1 96.1 101.8 107.4 82.7 107.6 94.3 100.4 108.1 100.9 109.7 93.0 97.8 97.71998 96.2 98.6 109.6 88.0 108.8 100.2 97.5 96.8 101.0 111.7 83.5 105.3 95.3 99.4 109.3 101.5 110.9 92.5 98.1 98.01999 95.8 99.1 104.4 86.7 108.9 101.9 97.9 98.1 98.2 109.2 80.7 105.1 95.8 99.0 110.3 104.2 104.5 91.1 98.7 98.62000 97.1 99.7 103.6 86.5 113.7 103.1 99.0 99.0 99.1 107.1 79.0 107.8 94.5 98.4 111.0 103.5 102.6 90.9 99.4 99.3
1991-2000 96.7 99.5 : 89.3 108.8 101.0 98.5 97.4 101.6 101.4 81.6 108.6 95.0 100.2 108.7 99.4 104.3 94.5 : 98.8
2001 96.4 98.0 102.5 85.3 113.4 102.5 98.9 98.6 97.9 109.6 82.4 102.2 94.2 97.7 110.2 100.8 108.1 90.6 98.6 98.62002 94.3 95.5 107.4 84.3 113.8 102.1 98.5 99.1 101.5 109.8 80.4 96.3 93.5 95.0 108.3 98.8 107.3 90.8 97.6 97.52003 94.6 96.1 107.5 85.4 112.5 102.4 99.1 99.5 101.2 112.6 76.2 99.8 93.7 96.7 106.8 100.2 101.9 93.2 98.1 98.12004 95.1 95.0 107.1 86.5 110.3 104.0 99.6 99.3 102.4 115.6 75.8 102.3 92.6 96.0 108.3 101.3 102.8 93.5 98.0 98.02005 96.1 94.8 106.5 89.0 109.3 105.3 100.6 100.1 102.5 114.5 74.5 103.1 91.5 96.1 109.4 100.4 104.7 95.9 98.6 98.52006 96.2 94.4 110.2 90.2 111.4 106.4 101.0 100.8 103.7 121.6 69.2 104.8 92.3 94.8 108.7 100.5 104.0 95.3 98.9 98.82007 96.2 93.0 109.2 90.2 114.1 106.7 101.5 100.3 106.2 120.1 67.7 101.2 91.8 94.1 108.0 101.7 101.1 94.9 98.6 98.52008 99.1 93.7 104.0 90.9 114.5 105.8 102.1 100.8 111.1 113.7 70.0 101.8 91.7 94.2 110.1 102.5 102.4 96.2 99.1 99.02009 97.3 95.1 94.5 84.5 111.5 101.9 101.8 100.5 105.7 101.5 69.0 102.3 93.0 95.5 107.4 97.8 100.5 98.4 98.7 98.72010 97.9 94.4 92.9 80.4 109.3 102.2 102.3 101.9 106.2 101.4 69.2 100.2 91.9 95.5 107.7 98.5 100.2 98.7 98.7 98.6
2001-2010 96.3 95.0 104.2 86.7 112.0 103.9 100.5 100.1 103.9 112.0 73.4 101.4 92.6 95.6 108.5 100.3 103.3 94.7 98.5 98.4
2011 99.2 94.8 96.5 77.7 108.1 101.1 103.0 101.4 104.4 104.8 69.6 96.3 91.4 96.8 104.4 98.5 99.5 100.7 98.6 98.62012 98.9 94.1 98.6 76.6 104.8 99.3 102.2 98.9 103.2 103.9 70.9 94.0 91.6 96.7 100.6 95.2 94.8 101.4 97.4 97.42013 98.2 93.7 98.5 77.4 102.6 97.6 102.0 97.5 98.5 101.9 67.3 94.4 89.8 95.3 98.9 93.3 93.7 101.1 96.5 96.52014 97.5 93.5 99.1 77.1 101.2 96.7 102.0 97.0 96.4 102.0 66.3 95.0 89.6 94.6 97.5 92.4 93.3 100.2 96.1 96.12015 98.1 93.8 99.2 76.0 100.2 96.3 102.1 97.1 95.7 102.6 67.2 94.5 89.2 94.3 96.7 92.1 93.3 100.1 96.1 96.1
1) 1960-91 D_W 2) Euro area; 1960-91 including D_W 3) Former Euro area 12; 1960-91 including D_W

73
National final uses
22. Domestic demand including stocks at current prices
(Percentage of gross domestic product at market prices)
BG CZ DK HR LT HU PL RO SE UK EU-28 EU-15 MK IS TR ME RS US JP 1) 2)
1960-1970 : : 102.5 : : : : : 102.0 100.1 : 99.8 : 100.5 94.5 : : 99.4 99.6
1971-1980 : : 103.0 : : 104.3 : : 101.3 100.6 : 100.0 : 102.4 97.4 : : 100.3 99.4
1981 : : 99.6 : : 100.7 102.1 101.7 99.3 97.4 : 100.3 : 101.5 97.1 : : 100.4 99.31982 : : 100.0 : : 98.9 98.9 97.6 99.6 97.9 : 100.1 : 104.7 95.6 : : 100.6 99.41983 : : 98.6 : : 97.8 98.7 93.8 97.1 98.8 : 99.4 : 97.8 96.3 : : 101.4 98.31984 : : 99.3 : : 96.5 99.0 94.1 95.7 99.5 : 99.0 : 100.0 96.2 : : 102.5 97.41985 : : 100.2 : : 97.6 98.5 92.7 97.6 98.6 : 98.8 : 99.8 95.2 : : 102.6 96.61986 : : 101.3 : : 101.2 99.1 93.2 96.3 100.2 : 98.3 : 96.1 95.1 : : 102.9 96.11987 : : 99.0 : : 100.1 97.8 92.5 97.5 100.6 : 98.9 : 101.0 94.8 : : 103.0 97.11988 : : 97.7 : : 97.0 97.9 90.0 97.8 102.9 : 99.3 : 100.9 89.6 : : 102.1 97.91989 : : 97.4 : : 96.3 95.8 96.7 99.0 103.3 : 99.7 : 97.7 91.7 : : 101.5 98.51990 : 96.8 95.4 : 108.1 97.1 93.1 108.8 99.1 101.7 : 99.2 : 98.7 96.8 : : 101.3 99.1
1981-1990 : : 98.9 : : 98.3 98.1 96.1 97.9 100.1 : 99.3 : 99.8 94.8 : : 101.8 98.0
1991 98.9
1991 95.7 92.4 94.6 : 91.0 100.6 102.8 103.4 98.1 100.2 : 100.2 : 101.2 98.5 : : 100.5 98.41992 105.8 98.5 93.8 : 96.2 99.9 99.5 107.8 98.0 100.5 : 100.0 : 100.1 99.0 : : 100.5 97.91993 107.6 98.6 93.3 : 107.4 107.8 99.8 104.4 96.3 100.1 : 98.8 : 96.8 102.2 : : 100.9 97.81994 100.6 101.3 94.8 : 105.6 106.1 98.2 101.5 95.6 99.8 : 98.6 : 94.8 96.1 : : 101.3 98.01995 98.0 103.6 95.9 108.4 110.6 99.7 97.8 105.0 93.2 99.4 98.4 98.3 109.8 96.4 99.3 : : 101.2 98.61996 97.4 105.2 95.1 106.6 109.2 99.3 101.4 107.9 93.4 99.6 98.3 98.1 110.3 99.4 96.3 : : 101.2 99.51997 94.7 104.5 96.3 113.1 110.1 98.8 103.9 106.8 92.5 99.3 98.1 97.8 113.5 99.5 98.2 : 106.3 101.2 98.91998 99.0 100.5 97.9 106.9 111.4 101.3 104.8 107.8 93.3 100.6 98.6 98.3 114.9 104.4 98.8 : 106.3 101.8 98.11999 104.6 100.6 95.0 106.1 110.1 102.5 105.9 104.5 93.5 101.5 99.1 98.9 110.0 104.7 99.8 : 105.3 102.7 98.42000 105.3 102.1 94.0 103.1 106.3 103.4 106.4 105.3 93.6 101.9 99.8 99.5 114.9 107.3 103.0 114.3 105.4 103.7 98.6
1991-2000 100.9 100.7 95.1 : 105.8 102.0 102.1 105.4 94.8 100.3 : 98.9 : 100.5 99.1 : : 101.5 98.4
2001 109.4 101.5 93.4 103.8 105.5 101.0 103.7 107.6 93.3 102.3 99.2 99.0 113.9 101.1 95.9 123.6 115.7 103.5 99.42002 108.1 101.2 94.2 108.2 105.7 101.9 103.5 105.6 93.3 102.7 98.6 98.3 120.1 98.4 98.4 124.5 118.0 103.9 98.72003 110.3 101.2 93.7 107.7 105.9 103.8 102.7 107.5 93.2 102.3 98.8 98.6 116.4 103.1 101.0 116.4 117.5 104.4 98.32004 111.5 99.1 95.1 106.2 107.1 103.6 102.4 109.0 91.8 102.7 98.9 98.6 120.1 105.6 102.6 116.1 125.4 105.0 98.02005 115.1 97.3 95.1 106.2 107.1 102.1 100.7 110.2 92.2 102.8 99.3 99.0 117.0 112.3 103.5 117.5 119.6 105.5 98.62006 117.6 97.0 96.8 106.7 110.1 100.9 101.8 112.0 91.9 102.6 99.6 99.2 117.8 118.2 104.9 129.7 120.1 105.5 98.72007 119.7 97.3 97.7 107.2 113.3 99.1 102.9 113.9 92.5 102.6 99.4 99.0 118.4 110.7 105.2 142.3 125.9 104.9 98.32008 120.5 97.6 96.8 107.8 111.8 99.5 104.0 113.0 93.2 102.2 99.8 99.3 125.3 102.8 104.4 154.4 126.9 104.8 99.82009 108.8 96.0 96.1 103.5 101.8 95.1 99.9 106.0 93.5 101.6 99.0 98.9 121.9 91.4 101.1 133.3 117.6 102.7 99.62010 101.9 96.6 94.5 100.4 101.9 94.3 101.2 105.7 93.8 102.2 99.1 99.0 118.7 89.9 105.6 128.4 117.1 103.5 98.8
2001-2010 112.3 98.5 95.3 105.8 107.0 100.1 102.3 109.1 92.9 102.4 99.2 98.9 119.0 103.3 102.3 128.6 120.4 104.4 98.8
2011 100.0 95.9 94.8 100.5 102.7 93.5 101.2 105.3 94.4 101.5 98.9 98.8 119.6 91.6 108.7 122.2 116.4 103.7 100.92012 103.1 94.4 94.9 99.4 99.2 92.7 99.7 104.7 94.2 102.5 98.1 98.1 122.7 93.9 105.2 124.7 118.0 103.4 102.02013 100.9 93.6 94.4 99.4 99.4 92.0 97.6 100.6 94.4 102.3 97.3 97.3 118.8 92.6 106.6 120.5 111.7 103.0 102.82014 101.2 92.5 94.2 98.6 99.9 91.9 97.7 100.6 94.7 101.8 97.0 97.0 119.8 94.4 104.9 120.4 110.4 102.9 103.22015 101.2 92.1 94.2 98.0 100.4 91.8 98.2 101.1 94.7 101.2 96.9 96.9 120.3 95.8 102.7 120.3 109.9 103.2 103.0
1) 1960-91 including D_W 2) Former EU-15; 1960-91 including D_W

74
National final uses
23. Domestic demand including stocks at 2005 prices
(National currency; annual percentage change)
BE DE EE IE EL ES FR IT CY LV LU MT NL AT PT SI SK FI EA-18 EA-12 1) 2) 3)
1961-1970 4.6 4.7 : 4.6 8.8 7.8 5.9 5.7 : : 3.6 : 5.7 4.5 6.4 : : 5.2 : 5.5
1971-1980 3.6 2.9 : 4.6 4.2 3.5 3.6 3.6 : : 3.0 : 2.7 3.8 5.1 : : 3.7 : 3.3
1981 -3.0 -2.0 : 2.8 -1.8 -1.9 -0.4 -0.2 : : 1.2 : -3.7 -0.6 4.1 : : -0.3 : -1.21982 -0.2 -1.6 : -2.4 1.0 1.0 3.5 0.8 : : 1.1 : -1.3 -0.1 3.0 : : 4.3 : 0.71983 -1.8 2.4 : -2.2 0.1 0.3 -0.4 -0.2 : : -0.6 : 2.8 2.8 -4.8 : : 2.7 : 0.71984 2.2 1.7 : 0.7 0.3 -0.2 0.7 3.9 : : 2.5 : 1.7 0.0 -4.6 : : 2.3 : 1.61985 1.8 1.2 : 1.2 2.9 3.2 2.3 2.9 : : 0.1 : 2.9 2.8 1.0 : : 3.2 : 2.21986 2.8 3.7 : 2.1 0.4 5.3 4.1 3.7 : : 8.8 : 3.3 1.6 7.4 : : 3.0 : 3.71987 3.2 2.5 : 0.3 -2.7 7.9 3.4 4.5 : : 8.2 : 1.7 2.2 13.1 : : 5.0 : 3.61988 5.1 3.5 : 1.3 5.9 6.8 4.7 4.3 : : 7.8 : 3.1 4.1 10.0 : : 7.3 : 4.51989 4.3 3.1 : 7.7 5.3 7.3 3.9 3.4 : : 6.2 : 3.9 4.0 4.4 : : 7.7 : 4.01990 3.3 4.8 : 5.5 2.2 4.6 2.8 2.5 : : 4.7 : 3.2 4.2 9.5 : : -1.5 : 3.5
1981-1990 1.7 1.9 : 1.7 1.3 3.4 2.4 2.6 : : 4.0 : 1.8 2.1 4.2 : : 3.3 : 2.3
1991 1.7 4.7 : 0.2 3.5 3.0 0.4 2.3 : : 8.6 : 2.1 3.5 5.9 -8.7 : -8.6 : 2.41992 1.8 2.8 : -0.1 -0.6 1.0 0.6 0.8 : : -4.3 : 1.6 2.3 5.2 -2.4 : -5.7 : 1.41993 -0.9 -1.2 : 1.0 -1.0 -3.3 -1.5 -4.5 : : 4.6 : -0.8 0.1 -1.4 10.8 6.7 -5.3 : -2.11994 2.4 2.5 2.6 5.1 1.1 1.5 2.3 1.6 : : 2.4 : 2.8 3.2 2.4 5.5 -4.8 3.7 : 2.31995 2.1 1.8 5.1 7.0 3.5 3.1 1.8 1.9 10.2 : 0.7 : 3.3 2.6 2.1 9.5 10.0 5.7 : 2.21996 1.7 0.3 10.5 8.1 3.3 2.1 0.7 0.7 3.8 8.2 4.7 2.8 3.9 2.0 3.4 3.3 17.1 3.0 1.2 1.11997 2.8 1.0 13.3 9.2 3.5 3.4 0.9 2.6 0.9 5.9 6.0 -0.1 4.5 1.1 5.7 5.1 5.4 5.6 2.0 2.01998 2.4 2.3 6.9 9.2 4.5 6.2 4.1 2.8 5.0 12.3 6.3 -1.1 5.1 2.5 7.5 4.6 4.7 5.8 3.6 3.61999 2.3 2.6 -3.9 8.3 3.7 6.4 3.8 2.8 2.0 2.4 8.0 5.8 4.9 2.8 5.8 8.5 -6.2 1.5 3.5 3.52000 3.6 2.2 10.1 9.3 5.5 5.3 4.1 3.1 6.1 2.1 4.5 10.8 2.7 1.9 3.3 1.7 1.2 3.8 3.3 3.3
1991-2000 2.0 1.9 : 5.7 2.7 2.8 1.7 1.4 : : 4.1 : 3.0 2.2 4.0 3.6 : 0.8 : 2.0
2001 0.1 -0.2 6.9 3.9 4.1 3.8 1.7 1.6 3.5 10.5 4.5 -6.3 2.3 0.5 1.7 1.3 8.2 2.0 1.4 1.42002 -0.1 -1.9 14.3 4.2 4.4 3.2 1.0 1.3 4.6 6.6 2.5 -2.9 -0.4 -0.5 -0.2 2.8 4.0 1.4 0.4 0.42003 0.8 0.5 10.3 4.3 5.6 3.8 1.5 0.8 1.9 11.0 0.6 6.7 0.4 2.3 -1.9 4.9 -0.7 3.6 1.4 1.42004 3.1 0.0 7.0 4.2 2.4 4.8 2.8 1.4 6.5 12.5 3.4 1.6 0.5 1.7 2.9 4.9 5.8 3.5 1.9 1.82005 2.6 -0.2 9.7 9.0 1.1 5.0 2.5 0.9 3.3 8.5 5.1 5.4 1.3 2.1 1.4 1.8 8.5 4.2 1.8 1.82006 2.2 2.7 16.1 6.4 7.4 5.2 2.4 2.1 5.7 17.7 2.0 4.4 4.1 1.9 0.8 5.6 6.5 2.4 3.1 3.02007 3.0 1.9 9.2 5.0 6.2 4.1 3.2 1.4 8.8 12.9 6.0 0.9 3.2 2.5 2.0 9.0 6.3 4.7 2.8 2.72008 2.1 1.2 -9.4 -3.3 -0.2 -0.5 0.3 -1.2 8.0 -8.5 0.5 3.1 2.0 0.7 0.8 3.2 5.7 0.7 0.3 0.32009 -2.2 -2.3 -21.4 -10.8 -5.5 -6.4 -2.6 -4.4 -7.0 -26.4 -7.7 -3.0 -2.8 -2.0 -3.3 -10.3 -7.4 -6.2 -3.8 -3.62010 1.8 2.4 0.1 -4.5 -7.0 -0.6 1.7 2.1 1.9 -1.4 9.1 2.3 -0.1 1.4 1.8 -0.5 3.7 2.9 1.2 1.2
2001-2010 1.3 0.4 3.6 1.7 1.7 2.2 1.4 0.6 3.6 3.5 2.5 1.1 1.0 1.0 0.6 2.1 4.0 1.9 1.0 1.0
2011 2.0 2.8 13.1 -1.8 -8.7 -2.0 2.0 -1.0 -1.4 10.8 4.2 -1.5 0.8 3.2 -5.1 -0.3 1.0 4.2 0.8 0.72012 -0.6 -0.3 5.5 -1.6 -10.2 -4.1 -0.9 -5.0 -3.8 2.5 2.5 -2.0 -1.6 0.1 -6.7 -6.4 -4.1 -0.8 -2.2 -2.22013 -0.4 0.5 1.5 -0.1 -5.8 -2.7 0.2 -2.7 -9.8 2.3 -0.8 3.2 -2.4 -1.1 -2.6 -2.5 -0.8 -1.4 -1.0 -1.02014 1.3 1.8 2.7 1.7 -0.9 0.4 1.0 0.3 -6.8 3.9 1.9 3.2 1.0 1.1 0.6 0.5 1.7 -0.6 1.0 1.02015 1.9 2.2 3.2 1.5 1.9 1.6 1.7 1.3 0.1 4.9 2.6 1.9 0.7 1.5 0.8 1.0 2.5 0.8 1.7 1.7
1) 1961-91 D_W 2) Weighted in common currency; Euro area 3) Weighted in common currency; Former Euro area 12; 1961-91 including D_W

75
National final uses
23. Domestic demand including stocks at 2005 prices
(National currency; annual percentage change)
BG CZ DK HR LT HU PL RO SE UK EU-28 EU-15 MK IS TR ME RS US JP 1) 2)
1961-1970 : : 5.4 : : : : : 4.5 2.7 : 4.9 : 5.2 5.7 : : 4.2 10.1
1971-1980 : : 1.9 : : : : : 1.6 1.7 : 3.0 : 6.9 4.7 : : 2.9 4.1
1981 : : -3.5 : : : : : -1.2 -1.3 : -1.3 : 5.6 1.0 : : 2.7 2.71982 : : 3.7 : : : : : 0.6 2.7 : 1.1 : 4.9 2.2 : : -1.3 3.31983 : : 1.6 : : : : : -0.9 4.8 : 1.4 : -8.5 6.1 : : 5.9 2.31984 : : 5.0 : : : : : 3.5 3.1 : 2.0 : 6.3 6.7 : : 8.7 3.71985 : : 5.5 : : : : : 4.4 2.9 : 2.5 : 2.8 2.6 : : 4.5 4.61986 : : 8.0 : : : : : 2.7 4.7 : 3.9 : 4.7 6.8 : : 3.7 4.51987 : : -1.5 : : : : : 4.3 5.1 : 3.7 : 15.6 7.2 : : 3.2 4.91988 : : -1.6 : : : : : 3.1 8.2 : 4.8 : -0.7 -0.9 : : 3.3 7.71989 : : 0.6 : : : : : 4.0 3.1 : 3.8 : -4.1 1.0 : : 3.1 5.91990 : : -0.1 : : : : : 0.4 -0.3 : 2.7 : 1.5 14.2 : : 1.5 5.6
1981-1990 : : 1.7 : : : : : 2.1 3.3 : 2.5 : 2.6 4.6 : : 3.5 4.5
1991 : -21.4 0.1 : : : 1.9 -17.5 -2.0 -2.5 : 1.5 : 4.9 0.0 : : -0.7 2.71992 : 4.7 1.9 : : -2.7 0.7 -8.5 -1.4 1.8 : 1.4 : -4.7 5.2 : : 3.6 0.51993 : 2.2 -0.9 : : 8.5 5.7 0.6 -5.1 3.2 : -1.4 : -2.8 13.1 : : 3.3 0.21994 : 8.1 6.8 : : 2.1 4.1 -0.6 3.5 4.1 : 2.7 : 1.4 -11.2 : : 4.4 1.21995 5.3 8.3 4.5 : : -4.7 7.0 10.8 2.2 2.5 : 2.3 : 2.9 10.2 : : 2.6 2.41996 -12.3 7.4 2.5 4.6 8.7 -0.8 9.6 4.2 1.1 4.1 1.8 1.6 1.6 6.0 7.8 : : 3.9 3.21997 -7.4 -1.9 4.7 14.7 12.4 3.6 9.3 -3.9 1.5 5.0 2.6 2.5 3.0 6.1 8.8 : : 4.8 0.61998 15.3 -2.1 3.7 -2.5 8.2 7.4 6.4 2.2 4.7 5.2 3.9 3.9 3.5 14.1 0.8 : : 5.5 -2.41999 8.1 1.3 -0.6 -2.4 -0.5 4.0 5.2 -3.2 3.7 4.1 3.5 3.5 1.4 4.0 -0.7 : : 5.7 -0.12000 8.5 3.6 3.2 0.9 2.1 3.5 3.1 4.7 4.0 4.5 3.5 3.6 9.3 6.6 7.6 : : 4.7 1.9
1991-2000 : 0.7 2.6 : : : 5.3 -1.4 1.2 3.2 : 2.1 : 3.7 3.9 : : 3.8 1.0
2001 8.6 3.8 0.0 4.7 5.8 1.9 -1.3 8.4 0.3 2.9 1.6 1.6 -5.7 -3.1 -11.6 : : 1.1 1.22002 3.5 3.6 1.7 10.4 7.4 6.6 1.0 4.1 1.5 3.2 1.1 0.9 7.5 -1.9 9.4 : : 2.3 -0.52003 9.0 3.7 0.2 6.1 10.4 5.9 2.8 8.3 2.0 3.9 2.0 1.8 -3.2 5.8 8.2 : : 3.1 1.02004 8.3 2.7 4.3 4.0 13.2 4.7 6.2 12.0 2.1 3.8 2.5 2.2 8.0 10.1 10.4 : 19.0 4.2 1.52005 9.6 3.1 3.4 4.4 8.3 1.4 2.5 7.9 3.0 2.8 2.2 2.0 3.3 15.4 9.2 : 1.9 3.5 1.02006 10.8 4.9 5.2 6.1 9.0 1.6 7.3 12.9 3.9 2.4 3.3 3.0 6.5 9.9 6.8 : 5.6 2.6 0.92007 8.8 6.6 2.3 6.1 13.9 -1.4 8.7 14.2 4.6 3.4 3.3 2.9 9.4 -0.4 6.0 : 14.1 1.1 1.12008 6.5 2.2 -0.9 3.1 3.2 0.7 5.6 7.3 0.0 -1.5 0.2 -0.1 7.5 -8.6 -0.8 : 7.5 -1.3 -1.32009 -12.8 -5.1 -7.0 -10.0 -24.5 -10.5 -1.1 -12.0 -4.6 -5.9 -4.4 -4.1 -3.0 -20.4 -7.5 : -11.4 -3.8 -4.02010 -4.8 1.9 1.6 -5.0 2.2 0.2 4.6 -1.1 6.5 2.1 1.5 1.5 -0.5 -3.1 13.8 : -1.3 2.9 2.9
2001-2010 4.5 2.7 1.0 2.8 4.3 1.0 3.6 5.9 1.9 1.7 1.3 1.2 2.8 -0.2 4.1 : : 1.5 0.4
2011 0.0 -0.1 0.2 -0.1 5.9 -0.5 3.6 2.4 3.2 -0.1 0.8 0.7 3.9 5.2 9.0 : 2.5 1.7 0.42012 3.1 -2.8 -0.1 -3.3 -0.5 -3.5 -0.1 1.0 0.3 1.2 -1.5 -1.5 2.3 1.5 -2.1 : -0.3 2.6 2.32013 -1.1 -0.7 0.6 -1.0 3.5 0.8 0.0 -0.8 1.5 1.8 -0.4 -0.4 -0.7 -0.6 7.0 : -2.5 1.7 1.82014 2.2 1.0 1.3 -1.3 4.0 2.5 3.3 2.2 3.1 2.5 1.4 1.3 4.0 3.5 0.7 : 0.2 2.6 1.42015 1.9 2.0 1.7 0.0 4.3 2.2 3.6 3.1 3.1 2.4 1.9 1.8 3.4 4.0 1.9 : 1.6 3.5 0.9
1) Weighted in common currency 2) Weighted in common currency; Former EU-15; 1961-91 including D_W

76
Prices
24. Price deflator gross domestic product at market prices
(National currency; annual percentage change)
BE DE EE IE EL ES FR IT CY LV LU MT NL AT PT SI SK FI EA-18 EA-12 1) 2) 3)
1961-1970 3.4 3.8 : 5.5 3.0 6.5 4.4 4.5 : : 4.1 : 5.2 3.8 3.1 : : 5.9 : 4.3
1971-1980 6.9 5.1 : 13.8 14.6 15.1 9.6 14.8 : : 6.5 : 7.7 6.4 15.7 : : 11.0 : 9.3
1981 5.1 4.2 : 17.5 21.6 12.3 11.7 18.8 : : 7.2 : 6.4 6.7 17.6 : : 11.6 : 10.11982 7.6 4.6 : 15.2 27.2 13.6 12.1 17.5 : : 10.8 : 4.6 5.4 18.4 : : 9.2 : 10.51983 5.6 2.8 : 10.8 20.6 11.9 9.7 15.1 : : 6.8 : 1.4 3.5 26.5 : : 8.1 : 8.31984 5.4 2.0 : 6.4 21.9 10.9 7.1 10.8 : : 4.4 : 2.3 4.9 24.1 : : 8.5 : 6.61985 4.6 2.1 : 5.3 19.0 8.6 5.4 9.2 : : 3.0 : 0.9 3.0 20.8 : : 5.3 : 5.51986 2.8 3.0 : 5.8 18.9 10.9 5.2 7.5 : : -0.1 : 0.2 3.0 18.3 : : 4.8 : 5.41987 1.7 1.3 : 2.2 15.3 5.9 2.6 6.0 : : 0.1 : -1.0 2.4 9.5 : : 4.3 : 3.21988 2.2 1.7 : 3.4 16.7 5.9 3.3 6.7 : : 2.8 : 0.8 1.5 13.3 : : 7.6 : 3.91989 4.8 2.9 : 5.1 14.5 6.9 3.4 6.2 : : 4.0 : 1.3 3.0 10.8 : : 6.4 : 4.41990 2.8 3.4 : -0.3 20.7 7.3 2.8 8.4 : : 2.5 : 1.6 3.0 11.3 : : 5.4 : 4.9
1981-1990 4.3 2.8 : 7.0 19.6 9.4 6.3 10.5 : : 4.1 : 1.8 3.6 16.9 : : 7.1 : 6.3
1991 2.9 3.1 : 1.8 19.8 6.9 2.7 7.6 3.9 162.6 1.8 : 3.1 3.6 10.9 94.9 : 1.5 : 4.61992 3.4 5.4 : 2.8 14.8 6.7 1.9 4.4 5.8 932.2 3.7 3.6 2.5 3.5 9.0 208.2 : 0.9 : 4.41993 4.0 4.0 : 5.2 14.4 4.5 1.7 3.9 5.1 64.8 6.0 2.8 1.6 2.8 5.3 37.1 15.6 1.9 : 3.61994 2.1 2.5 39.7 1.7 11.2 3.9 1.1 3.5 5.3 36.2 3.5 3.5 2.1 2.5 6.8 22.6 13.4 1.6 2.8 2.71995 1.2 2.0 31.4 2.9 9.8 4.9 1.2 4.9 -0.5 15.1 2.3 4.8 2.1 1.8 5.6 23.0 9.9 4.5 2.9 2.81996 0.4 0.6 24.1 0.0 7.3 3.5 1.5 4.8 2.3 14.4 3.0 0.8 1.3 0.8 2.3 11.3 4.2 -0.4 1.9 1.91997 0.9 0.3 10.2 3.7 6.8 2.4 0.9 2.6 2.3 6.6 -1.9 1.0 2.6 -0.2 3.9 8.5 6.2 2.0 1.4 1.41998 1.9 0.6 5.2 6.0 5.2 2.5 1.0 2.7 3.1 5.9 -0.4 1.4 1.9 0.3 3.8 7.0 5.1 3.4 1.6 1.61999 0.3 0.2 6.8 3.9 3.0 2.6 0.2 1.8 2.7 2.2 5.3 1.7 1.8 0.3 3.3 6.6 7.4 0.9 1.0 1.02000 2.0 -0.7 4.8 5.3 3.4 3.5 1.6 1.9 3.1 4.3 2.0 3.0 4.1 0.9 3.3 5.2 9.4 2.6 1.5 1.4
1991-2000 1.9 1.8 : 3.3 9.5 4.1 1.4 3.8 3.3 57.9 2.5 : 2.3 1.6 5.4 33.5 : 1.9 : 2.5
2001 2.1 1.1 6.5 6.0 3.1 4.2 2.0 2.9 3.9 2.0 0.1 2.4 5.1 1.9 3.6 8.7 5.0 3.0 2.5 2.42002 2.0 1.4 4.7 5.5 3.4 4.4 2.2 3.2 1.1 3.1 2.1 2.6 3.8 1.2 3.7 7.6 3.9 1.3 2.6 2.52003 2.0 1.1 4.0 3.7 3.9 4.2 2.0 3.1 4.8 3.8 5.9 3.2 2.2 1.1 3.0 5.5 5.3 -0.7 2.2 2.22004 2.1 1.1 4.5 2.4 2.9 4.0 1.7 2.4 3.3 7.0 1.8 1.4 0.7 1.7 2.5 3.3 5.8 0.5 1.9 1.92005 2.4 0.6 6.1 2.4 2.8 4.3 1.9 1.8 3.0 10.2 4.8 2.4 2.4 2.0 2.5 1.7 2.4 0.5 1.9 1.92006 2.3 0.3 8.8 3.3 2.4 4.1 2.1 1.7 3.4 11.4 6.8 2.8 1.8 1.9 2.8 2.1 2.9 0.8 1.8 1.82007 2.4 1.6 11.6 1.7 3.3 3.3 2.6 2.4 4.4 20.3 3.7 2.9 1.8 2.0 2.8 4.2 1.1 3.0 2.4 2.32008 2.1 0.8 5.4 -2.9 4.7 2.4 2.5 2.5 4.6 12.4 0.4 3.0 2.1 1.7 1.6 4.1 2.9 2.9 1.9 1.92009 1.2 1.2 0.2 -3.8 2.3 0.1 0.7 2.1 0.1 -1.3 0.8 2.8 0.1 1.6 0.9 3.3 -1.2 1.5 1.0 1.02010 2.1 1.0 0.3 -1.5 1.1 0.1 1.0 0.4 1.9 -0.9 7.2 4.0 0.8 1.4 0.6 -1.1 0.5 0.3 0.8 0.8
2001-2010 2.1 1.0 5.2 1.6 3.0 3.1 1.9 2.2 3.1 6.6 3.3 2.7 2.1 1.7 2.4 3.9 2.8 1.3 1.9 1.9
2011 2.0 1.2 3.0 0.7 1.0 0.0 1.3 1.4 2.3 6.0 4.2 2.2 1.1 2.0 0.3 1.2 1.6 2.7 1.2 1.22012 1.9 1.5 3.3 0.7 -0.3 0.0 1.5 1.6 1.6 3.3 3.0 2.1 1.3 1.7 -0.3 0.2 1.3 2.9 1.3 1.32013 1.2 2.2 5.0 0.4 -2.1 0.6 1.1 1.4 -1.5 1.4 3.7 2.0 1.4 1.6 1.7 1.0 0.5 2.0 1.4 1.42014 1.4 1.6 2.8 1.1 -0.7 0.3 1.3 0.9 0.6 1.7 2.8 2.0 1.2 1.9 0.7 0.9 0.5 1.6 1.2 1.22015 1.4 1.6 3.5 0.9 0.4 0.7 1.2 1.3 1.5 2.7 0.8 2.5 1.1 1.7 0.9 1.3 0.9 1.4 1.3 1.3
1) 1961-91 D_W 2) Weighted in common currency; Euro area 3) Weighted in common currency; Former Euro area 12; 1961-91 including D_W
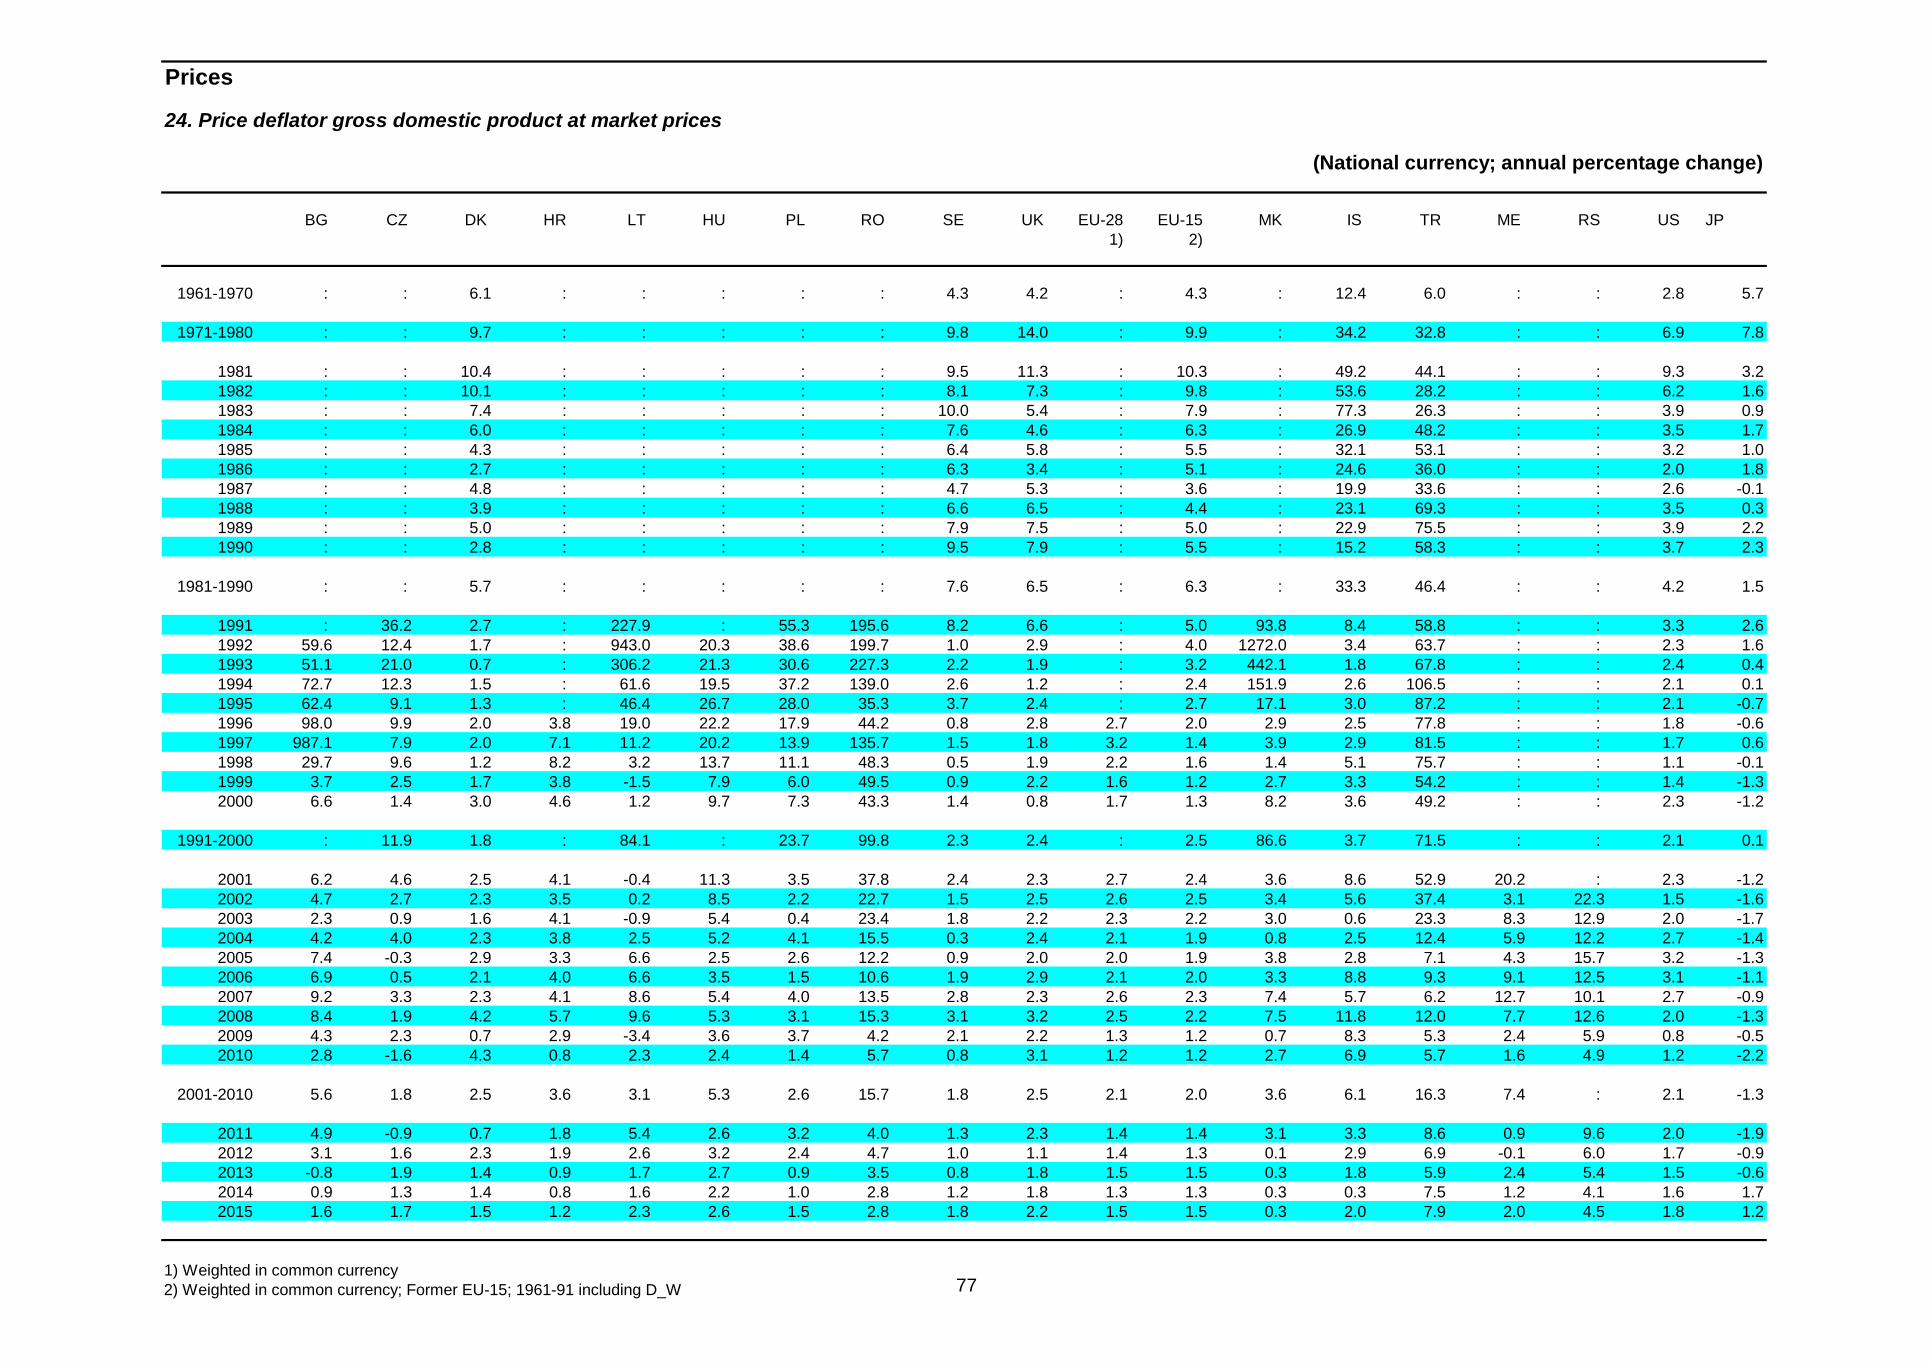
77
Prices
24. Price deflator gross domestic product at market prices
(National currency; annual percentage change)
BG CZ DK HR LT HU PL RO SE UK EU-28 EU-15 MK IS TR ME RS US JP 1) 2)
1961-1970 : : 6.1 : : : : : 4.3 4.2 : 4.3 : 12.4 6.0 : : 2.8 5.7
1971-1980 : : 9.7 : : : : : 9.8 14.0 : 9.9 : 34.2 32.8 : : 6.9 7.8
1981 : : 10.4 : : : : : 9.5 11.3 : 10.3 : 49.2 44.1 : : 9.3 3.21982 : : 10.1 : : : : : 8.1 7.3 : 9.8 : 53.6 28.2 : : 6.2 1.61983 : : 7.4 : : : : : 10.0 5.4 : 7.9 : 77.3 26.3 : : 3.9 0.91984 : : 6.0 : : : : : 7.6 4.6 : 6.3 : 26.9 48.2 : : 3.5 1.71985 : : 4.3 : : : : : 6.4 5.8 : 5.5 : 32.1 53.1 : : 3.2 1.01986 : : 2.7 : : : : : 6.3 3.4 : 5.1 : 24.6 36.0 : : 2.0 1.81987 : : 4.8 : : : : : 4.7 5.3 : 3.6 : 19.9 33.6 : : 2.6 -0.11988 : : 3.9 : : : : : 6.6 6.5 : 4.4 : 23.1 69.3 : : 3.5 0.31989 : : 5.0 : : : : : 7.9 7.5 : 5.0 : 22.9 75.5 : : 3.9 2.21990 : : 2.8 : : : : : 9.5 7.9 : 5.5 : 15.2 58.3 : : 3.7 2.3
1981-1990 : : 5.7 : : : : : 7.6 6.5 : 6.3 : 33.3 46.4 : : 4.2 1.5
1991 : 36.2 2.7 : 227.9 : 55.3 195.6 8.2 6.6 : 5.0 93.8 8.4 58.8 : : 3.3 2.61992 59.6 12.4 1.7 : 943.0 20.3 38.6 199.7 1.0 2.9 : 4.0 1272.0 3.4 63.7 : : 2.3 1.61993 51.1 21.0 0.7 : 306.2 21.3 30.6 227.3 2.2 1.9 : 3.2 442.1 1.8 67.8 : : 2.4 0.41994 72.7 12.3 1.5 : 61.6 19.5 37.2 139.0 2.6 1.2 : 2.4 151.9 2.6 106.5 : : 2.1 0.11995 62.4 9.1 1.3 : 46.4 26.7 28.0 35.3 3.7 2.4 : 2.7 17.1 3.0 87.2 : : 2.1 -0.71996 98.0 9.9 2.0 3.8 19.0 22.2 17.9 44.2 0.8 2.8 2.7 2.0 2.9 2.5 77.8 : : 1.8 -0.61997 987.1 7.9 2.0 7.1 11.2 20.2 13.9 135.7 1.5 1.8 3.2 1.4 3.9 2.9 81.5 : : 1.7 0.61998 29.7 9.6 1.2 8.2 3.2 13.7 11.1 48.3 0.5 1.9 2.2 1.6 1.4 5.1 75.7 : : 1.1 -0.11999 3.7 2.5 1.7 3.8 -1.5 7.9 6.0 49.5 0.9 2.2 1.6 1.2 2.7 3.3 54.2 : : 1.4 -1.32000 6.6 1.4 3.0 4.6 1.2 9.7 7.3 43.3 1.4 0.8 1.7 1.3 8.2 3.6 49.2 : : 2.3 -1.2
1991-2000 : 11.9 1.8 : 84.1 : 23.7 99.8 2.3 2.4 : 2.5 86.6 3.7 71.5 : : 2.1 0.1
2001 6.2 4.6 2.5 4.1 -0.4 11.3 3.5 37.8 2.4 2.3 2.7 2.4 3.6 8.6 52.9 20.2 : 2.3 -1.22002 4.7 2.7 2.3 3.5 0.2 8.5 2.2 22.7 1.5 2.5 2.6 2.5 3.4 5.6 37.4 3.1 22.3 1.5 -1.62003 2.3 0.9 1.6 4.1 -0.9 5.4 0.4 23.4 1.8 2.2 2.3 2.2 3.0 0.6 23.3 8.3 12.9 2.0 -1.72004 4.2 4.0 2.3 3.8 2.5 5.2 4.1 15.5 0.3 2.4 2.1 1.9 0.8 2.5 12.4 5.9 12.2 2.7 -1.42005 7.4 -0.3 2.9 3.3 6.6 2.5 2.6 12.2 0.9 2.0 2.0 1.9 3.8 2.8 7.1 4.3 15.7 3.2 -1.32006 6.9 0.5 2.1 4.0 6.6 3.5 1.5 10.6 1.9 2.9 2.1 2.0 3.3 8.8 9.3 9.1 12.5 3.1 -1.12007 9.2 3.3 2.3 4.1 8.6 5.4 4.0 13.5 2.8 2.3 2.6 2.3 7.4 5.7 6.2 12.7 10.1 2.7 -0.92008 8.4 1.9 4.2 5.7 9.6 5.3 3.1 15.3 3.1 3.2 2.5 2.2 7.5 11.8 12.0 7.7 12.6 2.0 -1.32009 4.3 2.3 0.7 2.9 -3.4 3.6 3.7 4.2 2.1 2.2 1.3 1.2 0.7 8.3 5.3 2.4 5.9 0.8 -0.52010 2.8 -1.6 4.3 0.8 2.3 2.4 1.4 5.7 0.8 3.1 1.2 1.2 2.7 6.9 5.7 1.6 4.9 1.2 -2.2
2001-2010 5.6 1.8 2.5 3.6 3.1 5.3 2.6 15.7 1.8 2.5 2.1 2.0 3.6 6.1 16.3 7.4 : 2.1 -1.3
2011 4.9 -0.9 0.7 1.8 5.4 2.6 3.2 4.0 1.3 2.3 1.4 1.4 3.1 3.3 8.6 0.9 9.6 2.0 -1.92012 3.1 1.6 2.3 1.9 2.6 3.2 2.4 4.7 1.0 1.1 1.4 1.3 0.1 2.9 6.9 -0.1 6.0 1.7 -0.92013 -0.8 1.9 1.4 0.9 1.7 2.7 0.9 3.5 0.8 1.8 1.5 1.5 0.3 1.8 5.9 2.4 5.4 1.5 -0.62014 0.9 1.3 1.4 0.8 1.6 2.2 1.0 2.8 1.2 1.8 1.3 1.3 0.3 0.3 7.5 1.2 4.1 1.6 1.72015 1.6 1.7 1.5 1.2 2.3 2.6 1.5 2.8 1.8 2.2 1.5 1.5 0.3 2.0 7.9 2.0 4.5 1.8 1.2
1) Weighted in common currency 2) Weighted in common currency; Former EU-15; 1961-91 including D_W

78
Prices
25. Price deflator private final consumption expenditure
(National currency; annual percentage change)
BE DE EE IE EL ES FR IT CY LV LU MT NL AT PT SI SK FI EA-18 EA-12 1) 2) 3)
1961-1970 3.1 2.7 : 5.1 2.4 5.8 4.2 3.8 : : 2.5 : 4.1 3.5 2.6 : : 4.7 : 3.7
1971-1980 6.8 5.2 : 14.0 13.9 15.0 9.6 14.8 : : 6.5 : 7.3 6.2 15.5 : : 11.3 : 9.4
1981 7.4 6.1 : 19.6 23.1 14.1 13.5 18.0 : : 8.6 : 5.6 7.1 20.7 : : 11.1 : 11.51982 7.1 5.0 : 14.9 21.1 14.4 11.8 17.2 : : 10.6 : 5.0 5.8 17.9 : : 9.1 : 10.61983 7.1 3.2 : 9.5 19.4 12.3 9.7 15.2 : : 8.3 : 2.8 3.2 26.3 : : 7.7 : 8.71984 5.6 2.5 : 7.3 19.3 10.6 8.0 11.2 : : 6.5 : 2.7 5.3 26.9 : : 6.8 : 7.21985 5.0 1.5 : 5.1 19.6 8.1 6.0 9.1 : : 4.3 : 2.8 3.5 16.9 : : 5.5 : 5.61986 0.4 -1.1 : 3.7 22.4 9.3 2.9 6.3 : : 0.3 : -0.2 1.6 12.8 : : 3.8 : 3.21987 1.7 -0.1 : 2.4 17.3 5.5 3.0 5.1 : : 0.9 : -0.5 1.2 8.6 : : 3.0 : 2.81988 1.2 1.9 : 4.0 15.1 4.8 2.8 5.9 : : 2.3 : 0.8 1.5 11.9 : : 4.5 : 3.51989 3.8 3.9 : 4.0 13.5 6.7 4.0 6.5 : : 3.3 : 1.7 2.7 11.2 : : 5.3 : 4.91990 2.7 3.0 : 2.1 19.8 6.6 2.8 6.5 : : 3.7 : 1.4 3.0 10.6 : : 6.3 : 4.5
1981-1990 4.2 2.6 : 7.1 19.0 9.2 6.4 10.0 : : 4.8 : 2.2 3.5 16.2 : : 6.3 : 6.2
1991 2.8 2.9 : 2.7 19.7 6.4 2.9 6.9 : : 3.4 : 3.6 3.2 10.2 105.3 : 5.3 : 4.71992 1.8 4.3 : 3.0 15.7 6.6 2.5 5.2 : : 4.3 : 3.1 3.4 7.8 204.0 : 3.3 : 4.41993 2.5 3.6 : 2.2 14.1 5.3 1.7 5.4 : : 4.0 : 2.2 3.0 5.5 31.5 : 4.1 : 3.91994 2.3 2.5 37.0 2.7 11.0 4.9 1.3 5.1 : : 2.6 : 2.6 2.3 6.8 20.3 : 0.4 : 3.11995 1.5 1.4 24.7 2.8 9.0 4.8 1.1 6.1 -2.8 : 2.0 : 2.1 2.2 5.1 23.4 9.2 0.8 : 2.71996 0.7 1.0 24.4 3.0 8.2 3.2 1.7 4.1 3.0 16.5 1.3 1.1 2.0 1.7 2.8 10.9 4.0 0.8 2.1 2.11997 1.6 1.3 9.8 2.8 5.6 2.7 0.9 2.2 1.7 8.7 1.4 3.9 2.3 1.8 3.0 8.6 7.7 1.9 1.8 1.71998 1.0 0.5 6.9 3.9 4.5 1.9 0.4 1.8 1.9 4.7 1.7 2.7 2.0 0.5 2.4 7.0 5.7 2.1 1.2 1.21999 0.3 0.4 4.3 3.0 2.3 2.3 -0.5 1.8 2.6 2.0 2.5 1.6 1.9 0.4 2.3 6.4 9.9 1.4 0.9 0.92000 3.5 0.8 3.5 4.9 7.5 3.7 2.4 3.4 2.7 3.0 4.0 1.0 3.8 2.3 3.5 6.9 8.3 4.3 2.6 2.5
1991-2000 1.8 1.9 : 3.1 9.6 4.2 1.4 4.2 : : 2.7 : 2.6 2.1 4.9 33.4 : 2.4 : 2.7
2001 1.9 1.9 6.3 4.5 2.7 3.4 2.0 2.6 3.1 1.6 2.0 2.4 4.5 1.8 3.5 7.5 5.6 2.4 2.5 2.42002 1.2 1.2 3.5 5.2 2.6 2.9 1.0 2.8 2.2 1.6 0.5 1.6 3.0 0.7 2.8 7.5 2.9 2.2 1.9 1.92003 1.4 1.6 1.6 4.0 3.4 3.2 1.9 2.8 3.6 4.1 2.2 0.6 2.4 1.6 3.0 5.2 6.5 -0.5 2.2 2.22004 2.4 1.2 3.3 1.7 2.9 3.6 2.1 2.6 1.8 7.4 2.4 2.1 1.0 1.9 2.5 3.0 7.3 0.4 2.1 2.02005 2.7 1.7 3.9 1.5 3.4 3.5 1.8 2.2 3.4 8.7 3.1 3.0 2.1 2.6 2.7 2.3 2.6 0.8 2.2 2.22006 3.0 1.0 5.2 2.5 3.4 3.6 2.1 2.6 2.8 6.0 2.4 1.6 2.2 2.1 3.0 2.4 4.9 1.4 2.2 2.12007 2.8 1.5 7.9 3.0 3.1 3.2 2.1 2.2 3.3 10.2 2.2 2.1 1.8 2.4 3.0 4.1 2.6 2.2 2.2 2.22008 3.3 1.6 7.8 1.5 4.2 3.6 2.9 3.1 4.4 16.2 3.4 3.3 1.1 2.3 2.6 5.5 4.5 3.5 2.7 2.62009 -0.7 0.0 -0.4 -7.0 0.7 -1.1 -0.6 -0.1 0.7 3.1 1.1 2.7 -0.5 0.4 -2.2 0.6 0.1 1.4 -0.4 -0.42010 2.0 2.0 2.4 -2.1 4.0 1.9 1.1 1.5 2.1 -1.7 1.4 2.9 1.5 1.8 1.3 1.5 1.0 1.9 1.6 1.6
2001-2010 2.0 1.4 4.1 1.4 3.0 2.8 1.6 2.2 2.7 5.6 2.1 2.2 1.9 1.8 2.2 3.9 3.8 1.6 1.9 1.9
2011 3.1 2.1 4.9 1.7 3.4 2.5 2.1 2.8 3.3 4.9 2.6 0.9 2.4 3.6 2.5 1.7 3.8 3.5 2.4 2.42012 2.4 1.6 3.6 0.5 0.9 2.5 1.8 2.7 2.6 3.1 1.6 2.0 2.2 2.6 1.5 1.6 3.4 2.9 2.1 2.02013 1.1 1.6 3.4 1.8 -1.5 1.3 0.7 1.3 -0.3 0.5 1.6 0.8 2.2 2.2 0.3 0.9 1.3 1.7 1.3 1.32014 0.7 1.2 1.5 1.3 -0.8 0.2 1.1 0.7 0.6 1.2 1.7 1.2 1.4 1.6 0.3 0.3 0.4 1.4 0.9 0.92015 1.2 1.4 3.0 0.9 0.3 0.8 1.3 1.2 1.5 2.5 1.9 1.9 1.5 1.7 1.1 1.2 1.5 1.3 1.3 1.3
1) 1961-91 D_W 2) Weighted in common currency; Euro area 3) Weighted in common currency; Former Euro area 12; 1961-91 including D_W

79
Prices
25. Price deflator private final consumption expenditure
(National currency; annual percentage change)
BG CZ DK HR LT HU PL RO SE UK EU-28 EU-15 MK IS TR ME RS US JP 1) 2)
1961-1970 : : 5.3 : : : : : 4.0 4.0 : 3.8 : 11.0 5.9 : : 2.4 5.6
1971-1980 : : 9.7 : : : : : 9.6 13.4 : 10.0 : 33.6 32.9 : : 7.0 8.8
1981 : : 11.9 : : : : : 10.0 11.1 : 11.4 : 50.3 44.4 : : 8.8 4.61982 : : 10.3 : : : : : 10.2 8.4 : 10.2 : 52.4 27.5 : : 5.5 2.61983 : : 6.6 : : : : : 10.9 5.4 : 8.2 : 84.0 25.8 : : 4.3 1.91984 : : 6.9 : : : : : 7.3 5.2 : 6.8 : 30.9 49.0 : : 3.8 2.21985 : : 3.8 : : : : : 6.8 5.4 : 5.6 : 33.7 50.9 : : 3.5 1.51986 : : 1.0 : : : : : 5.0 4.2 : 3.4 : 20.2 30.4 : : 2.2 0.41987 : : 4.3 : : : : : 5.3 4.3 : 3.1 : 15.5 48.8 : : 3.2 0.31988 : : 4.2 : : : : : 6.1 5.0 : 3.8 : 25.0 58.9 : : 3.9 0.41989 : : 4.8 : : : : : 6.7 6.1 : 5.2 : 27.6 83.7 : : 4.3 2.01990 : : 1.8 : : : : : 10.0 7.8 : 5.1 : 17.8 59.8 : : 4.3 2.6
1981-1990 : : 5.5 : : : : : 7.8 6.3 : 6.3 : 34.4 47.0 : : 4.4 1.8
1991 : 47.3 2.8 : : : 67.8 182.9 10.5 7.7 : 5.3 : 6.4 60.7 : : 3.3 2.81992 77.6 12.2 1.1 : : : 44.4 205.5 2.3 3.7 : 4.2 : 3.6 65.6 : : 2.6 1.71993 68.0 16.8 1.1 : : : 31.5 234.5 5.4 2.3 : 3.6 : 3.7 65.9 : : 2.5 1.01994 81.9 9.4 2.7 : : : 37.9 141.9 2.6 1.7 : 2.9 : 1.6 108.9 : : 2.1 0.51995 48.6 9.6 1.8 : : : 27.2 36.7 3.0 3.2 : 2.8 : 2.2 92.4 : : 2.1 -0.31996 102.9 8.1 1.6 3.7 18.2 23.3 18.7 45.9 0.9 2.6 3.0 2.1 3.5 2.5 67.8 : : 2.1 0.01997 1038.9 9.0 2.0 4.7 9.3 17.9 14.6 133.0 1.4 1.5 3.8 1.7 3.2 0.8 82.1 : : 1.7 1.21998 20.6 8.4 1.4 6.3 5.7 13.6 10.6 45.8 0.4 2.1 1.9 1.3 0.8 1.5 83.0 : : 0.8 -0.11999 2.3 2.0 1.9 3.8 -1.2 9.2 6.1 45.1 1.4 1.1 1.4 0.9 -0.3 2.8 53.4 : : 1.5 -0.72000 4.1 3.4 2.7 5.5 -1.7 11.3 10.0 37.6 0.9 0.6 2.5 2.1 8.6 5.0 54.9 : : 2.5 -0.6
1991-2000 : 12.0 1.9 : : : 25.6 98.4 2.9 2.6 : 2.7 : 3.0 72.7 : : 2.1 0.5
2001 5.5 3.7 2.3 4.6 2.4 9.4 3.8 34.5 2.2 0.9 2.4 2.1 5.3 7.8 49.7 : : 1.9 -1.02002 4.5 1.3 1.7 2.3 -0.4 5.8 3.3 20.3 1.5 0.8 1.8 1.6 2.1 4.8 38.5 : : 1.3 -1.42003 0.7 -0.2 1.3 2.3 -1.6 4.2 0.4 15.8 1.7 1.4 2.0 2.0 7.3 1.3 23.4 : : 2.0 -1.02004 3.4 3.6 1.3 2.1 -0.2 5.6 3.0 12.7 0.8 1.9 2.1 2.0 -1.5 3.0 10.8 : 9.7 2.4 -0.82005 6.8 0.8 1.5 3.3 2.3 3.6 2.1 6.9 1.1 2.5 2.2 2.2 0.7 1.9 8.3 : 14.8 2.8 -0.62006 2.2 1.5 1.9 3.4 4.7 3.5 1.2 4.9 1.2 2.6 2.2 2.2 2.2 7.6 9.8 : 10.2 2.7 -0.32007 9.0 2.9 1.2 2.9 5.9 6.9 2.4 4.8 1.4 2.6 2.4 2.2 3.5 4.6 6.6 : 6.5 2.5 -0.72008 7.2 4.8 2.7 5.6 10.9 5.3 4.3 10.0 3.1 3.2 3.0 2.7 9.9 14.1 10.8 : 10.6 3.1 0.22009 1.5 0.8 1.5 3.2 4.5 3.9 2.5 3.7 2.1 1.9 0.3 0.1 -0.2 13.7 4.9 : 8.9 -0.1 -2.52010 2.4 -0.2 2.7 1.5 1.3 3.9 2.5 7.7 1.5 4.0 2.1 2.0 1.0 3.4 8.5 : 7.5 1.7 -1.7
2001-2010 4.3 1.9 1.8 3.1 2.9 5.2 2.5 11.8 1.6 2.2 2.1 1.9 3.0 6.1 16.3 : : 2.0 -1.0
2011 4.6 0.5 2.7 2.4 4.1 4.2 4.9 4.3 1.7 3.9 2.8 2.7 3.5 4.1 8.9 : 8.1 2.4 -0.82012 5.4 2.7 2.8 3.5 3.1 6.1 3.7 3.9 1.2 1.8 2.1 2.0 2.4 5.6 8.1 : 6.4 1.8 -0.82013 -1.9 1.1 1.0 1.9 1.1 1.7 0.7 4.4 0.6 2.2 1.4 1.4 2.1 3.6 6.4 : 5.4 1.1 -0.22014 0.0 1.0 1.7 1.0 1.0 1.0 1.1 2.9 0.6 1.9 1.1 1.1 2.3 2.5 8.6 : 3.5 1.6 2.52015 1.5 1.8 1.7 1.4 1.8 2.8 1.9 3.2 1.6 2.0 1.5 1.4 2.1 3.0 7.2 : 3.6 1.9 1.5
1) Weighted in common currency 2) Weighted in common currency; Former EU-15; 1961-91 including D_W

80
Prices
26. Price deflator exports of goods and services
(National currency; annual percentage change)
BE DE EE IE EL ES FR IT CY LV LU MT NL AT PT SI SK FI EA-18 EA-12 1) 2) 3)
1961-1970 2.4 1.7 : 1.9 1.0 6.6 2.0 1.8 : : 2.0 : 1.3 2.3 1.5 : : 4.8 : 2.0
1971-1980 6.9 5.0 : 14.3 14.9 13.2 9.0 15.4 : : 5.9 : 6.9 4.9 16.1 : : 11.6 : 8.4
1981 9.4 5.6 : 16.4 22.2 14.9 12.7 20.3 : : 9.6 : 11.7 5.8 14.2 : : 8.5 : 11.11982 13.2 4.1 : 10.8 21.2 13.6 13.2 16.6 : : 15.5 : 4.4 3.5 17.2 : : 5.7 : 9.41983 7.3 2.0 : 9.1 21.3 16.7 11.1 8.0 : : 5.9 : 0.6 0.7 24.4 : : 6.3 : 6.41984 8.2 3.1 : 8.1 14.3 12.5 8.2 9.7 : : 5.2 : 4.7 4.2 27.5 : : 8.0 : 6.81985 2.8 2.7 : 3.1 15.1 8.1 2.7 8.9 : : 3.9 : 1.6 3.3 16.6 : : 2.8 : 4.11986 -6.6 -1.1 : -6.3 12.2 -0.4 -5.1 -3.7 : : -2.3 : -14.4 0.6 4.1 : : -3.9 : -4.11987 -3.3 -0.9 : 0.5 8.9 3.5 -1.7 1.0 : : -2.1 : -5.4 -1.5 9.2 : : 1.9 : -1.01988 3.8 1.8 : 5.6 11.9 4.7 3.6 3.3 : : 2.0 : 0.2 2.0 9.7 : : 4.7 : 2.81989 7.3 2.5 : 7.3 13.9 6.0 4.4 6.6 : : 4.3 : 3.6 2.5 6.8 : : 6.0 : 4.51990 -1.7 0.1 : -8.1 15.9 0.8 -1.7 3.1 : : 0.1 : -1.0 0.9 4.0 : : 0.5 : 0.1
1981-1990 3.9 2.0 : 4.4 15.6 7.9 4.5 7.2 : : 4.1 : 0.4 2.2 13.1 : : 4.0 : 3.9
1991 -0.6 1.4 : -0.3 14.0 1.5 -0.8 3.9 : : 1.2 : 0.3 0.9 1.1 104.7 : -0.4 : 1.11992 -1.1 1.0 : -2.0 10.1 2.9 -2.3 0.6 : : 1.8 : -1.9 -0.1 -1.9 187.9 : 6.2 : 0.01993 -1.3 0.3 : 6.8 9.1 5.0 -2.0 10.3 : : 5.7 : -2.5 0.4 1.7 30.4 0.0 6.5 : 1.71994 1.3 0.9 43.0 0.2 8.6 4.6 -0.5 3.4 : : 3.1 : 0.6 1.5 4.7 17.3 10.7 1.3 : 1.41995 1.6 1.3 24.3 1.9 8.7 5.9 -0.6 8.2 -7.4 : 1.5 : 0.7 1.7 3.7 9.1 8.4 4.9 : 2.51996 -1.4 -0.4 19.1 -0.3 5.6 1.4 0.8 0.3 2.6 12.5 6.8 3.1 0.8 0.6 -0.8 13.0 4.3 -0.6 0.4 0.21997 1.2 1.1 13.0 1.2 3.6 3.0 1.3 1.3 3.4 0.6 1.6 0.4 2.5 1.0 3.3 5.4 10.7 -1.0 1.6 1.51998 -1.0 -0.7 2.9 2.7 4.1 0.5 -1.4 1.4 2.0 4.3 0.6 0.9 -2.0 0.1 1.4 2.6 -4.8 -1.0 -0.4 -0.41999 -0.2 -0.7 0.2 2.3 1.9 0.0 -1.5 0.8 2.4 -1.1 5.3 2.3 -1.2 0.7 0.4 2.1 -1.1 -5.0 -0.4 -0.42000 5.6 2.6 8.3 5.5 8.0 7.3 2.5 4.4 5.6 3.0 9.8 15.1 6.0 1.3 5.4 10.3 17.3 3.4 4.2 4.1
1991-2000 0.4 0.7 : 1.8 7.3 3.2 -0.4 3.4 : : 3.7 : 0.3 0.8 1.9 29.8 : 1.4 : 1.2
2001 1.4 0.5 2.7 4.8 3.9 1.8 -0.3 2.3 2.5 2.1 -4.0 -5.4 0.9 0.7 0.7 8.1 4.9 -1.3 1.0 1.02002 -0.6 -0.2 1.8 -0.2 2.4 0.7 -1.5 1.4 -1.5 2.9 -0.1 2.3 -1.8 0.3 0.0 4.4 1.0 -2.6 -0.3 -0.42003 -1.4 -1.6 1.5 -5.1 1.6 -0.2 -1.7 0.0 -0.4 8.6 -1.8 1.1 -0.8 -0.3 -1.4 2.9 1.5 -1.4 -1.2 -1.32004 2.1 -0.3 2.4 -0.7 2.3 1.6 0.4 1.1 3.8 11.0 6.4 -2.3 0.6 1.1 1.5 3.0 1.8 -0.4 0.7 0.62005 4.0 0.8 3.5 1.4 2.9 4.3 1.7 2.1 2.6 10.3 8.0 3.5 3.4 1.8 1.7 2.9 1.6 1.2 2.2 2.12006 2.3 1.3 5.6 1.1 3.3 4.1 2.0 2.3 2.9 8.7 8.1 8.8 2.6 2.6 4.4 2.8 2.2 2.3 2.3 2.22007 2.4 0.7 6.8 -0.1 2.6 2.5 1.9 2.3 3.5 11.8 5.0 7.2 1.3 1.6 1.9 2.3 0.5 1.0 1.6 1.52008 4.1 1.1 6.0 -0.3 4.3 2.8 3.1 2.9 3.5 8.2 -1.3 4.4 4.8 2.4 2.5 1.2 1.4 -0.3 2.4 2.42009 -5.3 -2.7 -1.8 1.3 -1.8 -3.4 -3.8 -2.4 -2.0 -4.6 -2.6 -2.9 -6.0 -2.2 -5.0 -1.0 -5.1 -6.0 -3.4 -3.42010 4.7 2.4 3.2 1.3 5.5 2.2 2.5 2.6 2.2 6.0 8.6 3.9 5.3 2.6 3.9 2.3 3.0 3.8 3.1 3.1
2001-2010 1.3 0.2 3.1 0.3 2.7 1.6 0.4 1.5 1.7 6.4 2.5 2.0 1.0 1.0 1.0 2.9 1.2 -0.4 0.8 0.8
2011 3.9 2.9 4.5 0.4 5.4 4.8 3.3 4.0 2.1 9.0 5.1 7.1 4.6 3.7 5.5 4.1 4.0 4.3 3.6 3.62012 1.3 1.3 1.7 4.2 2.7 2.0 1.2 1.8 1.6 4.1 4.2 -1.2 1.7 1.2 1.4 1.2 1.3 1.2 1.6 1.62013 -0.6 -0.5 1.0 0.1 -1.2 -0.9 -0.1 0.0 0.6 1.3 2.4 -0.6 -0.4 -0.3 -0.7 -0.3 -1.8 -0.9 -0.4 -0.32014 0.5 -0.2 0.5 0.6 -0.6 -0.5 0.0 0.0 1.2 0.6 1.6 0.0 -0.3 0.5 -0.2 0.2 -1.3 -1.6 -0.1 -0.12015 1.0 0.9 1.6 1.2 0.1 0.9 0.7 1.0 1.5 1.5 0.6 1.3 0.8 1.3 0.7 1.2 1.0 1.1 0.9 0.9
1) 1961-91 D_W 2) Weighted in common currency; Euro area 3) Weighted in common currency; Former Euro area 12; 1961-91 including D_W

81
Prices
26. Price deflator exports of goods and services
(National currency; annual percentage change)
BG CZ DK HR LT HU PL RO SE UK EU-28 EU-15 MK IS TR ME RS US JP 1) 2)
1961-1970 : : 3.1 : : : : : 1.9 3.2 : 2.3 : 12.3 4.8 : : 2.2 0.6
1971-1980 : : 7.9 : : : : : 10.0 13.4 : 9.1 : 31.7 36.2 : : 8.9 5.4
1981 : : 12.6 : : : : : 8.6 8.6 : 10.6 : 47.1 43.5 : : 7.4 1.81982 : : 10.1 : : : : : 10.9 6.9 : 9.1 : 60.2 42.7 : : 0.5 2.11983 : : 5.4 : : : : : 12.3 7.9 : 6.9 : 92.8 25.9 : : 0.4 -4.91984 : : 7.9 : : : : : 6.8 7.6 : 6.9 : 23.6 57.1 : : 0.9 -0.51985 : : 2.7 : : : : : 4.1 5.1 : 4.2 : 30.1 64.4 : : -3.0 -2.31986 : : -6.1 : : : : : -1.5 -8.0 : -4.6 : 19.8 28.8 : : -1.7 -13.11987 : : -1.8 : : : : : 2.7 2.9 : -0.3 : 12.0 30.8 : : 2.2 -4.81988 : : 1.0 : : : : : 4.8 1.0 : 2.6 : 18.2 74.9 : : 5.1 -3.01989 : : 6.3 : : : : : 6.6 8.5 : 5.1 : 26.3 53.2 : : 1.7 3.21990 : : 0.5 : : : : : 1.8 4.8 : 0.8 : 16.9 38.2 : : 0.6 1.2
1981-1990 : : 3.7 : : : : : 5.6 4.4 : 4.0 : 32.8 45.2 : : 1.4 -2.2
1991 : 49.5 1.3 : : : 20.6 231.7 2.0 2.1 : 1.3 : 6.9 61.0 : : 1.1 -3.31992 : 5.8 1.3 : : 10.1 29.2 314.8 -2.8 0.7 : 0.0 : -1.3 62.5 : : -0.5 -2.91993 : 4.7 -1.7 : : 12.9 27.2 148.8 8.8 9.1 : 2.8 : 4.8 59.9 : : 0.2 -7.11994 : 3.5 -0.3 : : 18.6 31.7 125.8 3.6 1.2 : 1.4 : 6.2 164.8 : : 1.2 -3.41995 : 5.7 0.9 : : 33.9 19.6 37.3 6.6 3.3 : 2.7 : 4.8 73.0 : : 2.2 -2.31996 108.1 4.3 1.5 4.3 11.0 19.3 7.6 45.6 -4.7 1.7 1.1 0.3 2.0 -0.2 69.0 : : -1.3 3.31997 820.6 4.4 2.7 8.9 4.2 15.8 14.0 114.7 0.0 -4.1 3.2 0.7 7.9 2.1 87.0 : : -1.8 1.81998 7.1 2.9 -2.1 3.2 -7.2 13.2 13.1 20.4 -1.6 -5.3 -0.7 -1.2 6.7 4.5 60.1 : : -2.4 1.11999 5.0 0.7 -0.5 5.4 -0.1 4.8 5.8 60.5 -1.4 0.4 0.0 -0.4 2.7 0.0 52.0 : : -0.8 -8.62000 20.9 2.9 8.2 10.6 10.1 10.3 1.8 40.4 2.4 1.7 4.1 3.8 8.9 3.8 42.0 : : 2.1 -4.1
1991-2000 : 7.7 1.1 : : : 16.6 97.4 1.2 1.0 : 1.1 : 3.1 70.7 : : 0.0 -2.6
2001 0.7 -0.7 1.6 3.4 -2.4 3.0 1.3 31.1 2.5 0.6 1.2 1.0 3.0 21.5 89.4 : : -0.4 2.42002 -2.8 -5.8 -1.3 1.2 -4.4 -4.1 4.7 17.7 -1.6 -1.1 -0.4 -0.5 -2.0 -1.7 25.4 : : -0.5 -1.42003 -0.2 -0.2 -1.1 2.2 -2.1 0.1 6.2 16.9 -2.0 1.8 -0.6 -0.9 12.4 -7.1 10.7 : : 2.2 -3.72004 6.4 2.2 1.9 3.4 7.6 -1.1 8.3 13.2 -0.4 -0.5 0.8 0.5 -1.0 1.3 13.3 : 18.2 3.7 -1.42005 8.1 -2.5 5.4 2.4 8.6 -0.4 -2.6 0.2 2.9 1.9 2.0 2.2 5.6 -4.5 -0.2 : 17.6 4.4 2.02006 14.1 -1.8 3.0 4.2 5.1 6.5 2.3 5.4 3.0 1.8 2.3 2.2 5.9 21.3 13.7 : 10.8 3.6 3.32007 6.4 0.1 1.4 4.1 5.8 -4.0 2.7 1.6 1.9 0.2 1.4 1.4 14.6 2.2 2.1 : 1.3 3.4 2.22008 9.4 -4.5 4.9 5.5 12.1 1.0 -0.9 18.7 4.0 11.8 3.5 3.7 17.1 35.5 17.5 : 9.2 4.6 -3.92009 -9.4 0.3 -8.7 -0.7 -14.4 2.2 11.8 4.7 0.8 2.5 -2.1 -2.7 -8.8 12.6 2.9 : 4.2 -5.5 -11.12010 8.7 -1.3 8.7 2.0 10.6 1.9 0.7 6.8 -0.5 4.3 3.1 3.2 1.7 8.8 1.5 : 12.3 4.4 -1.6
2001-2010 3.9 -1.4 1.5 2.8 2.3 0.5 3.4 11.3 1.0 2.3 1.1 1.0 4.6 8.2 15.5 : : 2.0 -1.4
2011 10.2 0.8 1.2 6.3 11.7 3.6 6.9 7.7 -0.9 5.5 3.7 3.6 12.9 7.1 23.8 : 9.5 6.4 -2.22012 4.4 3.1 3.6 2.2 3.5 3.1 4.1 8.6 -1.4 -1.2 1.5 1.2 -2.5 1.1 2.9 : 12.9 0.9 -2.02013 -3.3 1.6 0.8 0.1 -1.4 0.0 0.4 -2.1 -2.8 1.2 -0.2 -0.2 -0.8 -3.4 7.6 : 3.0 0.2 9.32014 -1.8 3.5 0.3 1.3 -2.0 2.2 -1.0 -0.3 0.6 1.4 0.2 0.1 0.3 -6.9 13.6 : 3.3 0.4 1.12015 1.4 1.1 1.0 1.5 1.9 0.6 1.0 1.0 1.0 1.7 1.0 1.0 1.7 -0.3 4.1 : 3.8 0.8 1.1
1) Weighted in common currency 2) Weighted in common currency; Former EU-15; 1961-91 including D_W

82
Prices
27. Price deflator imports of goods and services
(National currency; annual percentage change)
BE DE EE IE EL ES FR IT CY LV LU MT NL AT PT SI SK FI EA-18 EA-12 1) 2) 3)
1961-1970 2.3 0.0 : 2.0 0.8 3.0 2.0 1.2 : : 1.8 : 0.8 2.2 0.4 : : 4.5 : 1.3
1971-1980 7.6 6.2 : 15.7 16.8 14.8 10.5 18.7 : : 7.2 : 7.7 5.7 17.9 : : 13.3 : 10.1
1981 13.4 11.7 : 18.6 14.6 28.7 19.1 25.2 : : 10.1 : 9.7 8.0 22.1 : : 11.8 : 16.01982 13.7 2.7 : 7.5 23.6 12.2 12.9 11.9 : : 13.8 : 3.7 2.0 14.7 : : 4.2 : 8.51983 7.6 0.7 : 5.2 16.6 22.0 8.6 6.5 : : 7.9 : 1.0 1.1 26.5 : : 7.2 : 5.91984 8.0 4.9 : 9.4 24.0 11.9 9.7 9.4 : : 7.4 : 3.7 4.1 31.1 : : 4.7 : 7.81985 1.9 2.3 : 2.6 17.6 2.1 2.2 8.1 : : 3.1 : 2.9 4.0 10.1 : : 3.2 : 3.71986 -10.3 -11.5 : -10.1 8.0 -16.2 -12.7 -14.8 : : -1.7 : -14.9 -0.6 -9.1 : : -7.4 : -11.81987 -4.3 -4.7 : 1.3 6.9 -2.8 -1.5 -1.7 : : -1.2 : -2.8 -1.8 5.9 : : -0.1 : -2.61988 2.2 2.0 : 6.4 9.2 0.1 1.3 4.6 : : 0.8 : 0.3 2.1 7.0 : : 1.2 : 2.21989 6.4 5.2 : 6.2 14.7 1.9 6.0 6.9 : : 3.8 : 3.8 3.0 8.1 : : 5.3 : 5.51990 -1.4 -1.3 : -3.7 13.7 -2.8 -2.0 -0.5 : : 1.6 : -1.0 0.3 2.5 : : 1.3 : -0.9
1981-1990 3.5 1.0 : 4.1 14.7 5.0 4.0 5.1 : : 4.5 : 0.4 2.2 11.3 : : 3.0 : 3.2
1991 -0.7 2.8 : 2.4 12.3 -1.5 0.1 0.0 : : 2.5 : 0.1 1.0 -0.3 116.2 : 3.4 : 1.11992 -2.8 -2.2 : -1.2 12.3 1.2 -2.9 1.7 : : 2.7 : -1.4 0.6 -5.3 186.1 : 7.7 : -1.01993 -2.8 -1.6 : 4.5 7.4 6.1 -3.4 15.5 : : 3.2 : -2.4 0.8 0.4 23.1 2.1 8.2 : 1.31994 1.8 -0.2 43.6 2.4 5.6 5.8 0.1 4.8 : : 2.1 : 0.3 1.2 3.0 14.4 12.3 -0.5 : 1.41995 1.7 -0.3 19.6 3.8 7.5 4.4 0.2 11.4 -2.3 : 1.3 : 0.3 1.3 1.6 6.6 7.3 0.1 : 2.21996 -0.6 0.0 16.7 -0.5 5.0 0.4 1.6 -2.6 3.5 14.2 5.8 4.0 0.7 2.4 1.7 11.6 9.6 0.3 0.5 0.31997 1.5 2.8 8.6 0.9 2.8 3.4 1.2 1.8 3.7 8.9 5.2 0.3 1.5 1.8 2.6 5.0 5.8 0.4 2.1 2.11998 -1.8 -2.4 2.2 2.5 3.8 -1.5 -2.9 -1.6 0.5 0.2 1.7 3.1 -2.4 0.4 -1.4 1.9 -2.4 -2.8 -1.8 -1.81999 1.0 -1.5 0.8 2.4 1.7 0.3 -1.8 0.7 2.4 -4.2 3.0 0.0 -0.9 0.6 -0.8 1.9 0.3 -2.0 -0.5 -0.52000 7.8 7.5 5.9 7.4 11.4 10.6 5.3 11.2 5.6 6.0 12.3 12.6 5.8 2.8 8.5 13.9 14.1 7.4 7.7 7.6
1991-2000 0.5 0.5 : 2.4 6.9 2.9 -0.3 4.1 : : 3.9 : 0.1 1.3 0.9 29.1 : 2.1 : 1.2
2001 1.3 0.6 0.8 3.7 3.0 -0.2 -0.6 1.5 1.0 0.9 -3.2 -4.0 -0.4 0.4 0.4 6.3 6.0 -3.0 0.5 0.42002 -1.8 -2.4 -1.0 -1.1 0.8 -2.0 -3.2 -0.3 0.4 4.4 -1.0 0.8 -2.9 -1.0 -1.6 2.5 1.0 -2.7 -2.0 -2.02003 -1.2 -2.6 -1.2 -4.3 -0.3 -1.5 -1.7 -1.8 -1.0 6.2 -5.8 -1.0 -0.9 -0.5 -1.7 2.1 1.9 0.0 -1.8 -1.92004 3.0 -0.5 1.2 -0.1 2.1 2.2 1.3 1.9 1.7 8.5 7.6 -1.2 1.4 1.3 2.2 4.1 2.1 1.9 1.2 1.22005 4.4 2.8 2.1 1.7 3.7 3.7 3.1 5.2 3.9 11.3 7.7 2.5 2.7 2.6 3.0 5.0 1.7 4.8 3.4 3.42006 3.0 2.8 3.5 1.9 3.5 3.8 3.6 5.6 2.2 9.9 6.0 8.7 3.0 3.3 3.9 3.3 3.6 5.7 3.6 3.52007 2.1 0.2 3.8 1.5 2.4 1.9 0.6 1.2 1.7 6.8 4.5 6.5 1.5 2.4 1.3 1.4 1.6 1.2 1.2 1.22008 6.6 2.7 6.9 1.9 5.4 4.7 3.8 5.1 4.4 10.4 -0.8 5.8 4.7 3.8 5.0 2.7 3.0 1.7 3.9 3.92009 -8.4 -6.6 -3.0 -0.4 -1.2 -7.1 -6.4 -7.7 -1.5 -4.9 -2.9 -2.1 -6.0 -3.7 -9.2 -4.5 -4.1 -7.1 -6.3 -6.42010 6.3 4.5 5.2 2.9 5.1 4.4 4.0 6.6 2.1 5.8 6.0 3.5 6.5 3.9 4.6 6.5 3.6 6.1 5.0 5.0
2001-2010 1.4 0.1 1.8 0.8 2.4 0.9 0.4 1.6 1.5 5.8 1.7 1.9 0.9 1.2 0.7 2.9 2.0 0.8 0.8 0.8
2011 5.3 5.3 5.6 3.2 6.5 8.2 5.6 7.0 2.3 5.7 4.5 6.0 4.5 5.9 7.3 5.6 5.3 6.2 5.7 5.72012 1.5 1.7 2.7 3.9 4.1 4.3 1.9 3.0 2.2 7.2 4.1 -1.1 2.4 2.3 1.4 2.2 2.5 2.4 2.4 2.32013 -0.7 -1.8 -0.4 0.3 -1.6 -1.6 -0.9 -1.9 1.1 0.8 1.0 -1.3 -1.0 -0.8 -1.8 -1.1 -1.4 -1.0 -1.3 -1.32014 -0.2 -0.8 0.3 0.2 -0.3 -1.0 -0.1 -1.2 1.2 0.6 0.9 -0.2 -0.5 0.0 -1.9 -0.8 -1.4 -1.8 -0.6 -0.62015 1.2 0.9 1.4 1.2 -0.1 1.0 0.6 1.1 1.6 1.5 1.3 1.1 0.9 1.3 0.3 1.2 1.5 1.2 1.0 0.9
1) 1961-91 D_W2) Weighted in common currency; Euro area including Latvia3) Weighted in common currency; Former Euro area 12; 1961-91 including D_W

83
Prices
27. Price deflator imports of goods and services
(National currency; annual percentage change)
BG CZ DK HR LT HU PL RO SE UK EU-28 EU-15 MK IS TR ME RS US JP 1) 2)
1961-1970 : : 2.0 : : : : : 2.3 2.9 : 1.7 : 9.5 4.7 : : 1.7 1.0
1971-1980 : : 8.3 : : : : : 12.0 13.8 : 10.7 : 31.3 36.8 : : 13.7 11.4
1981 : : 14.6 : : : : : 10.4 7.9 : 14.6 : 47.7 43.5 : : 5.4 0.41982 : : 11.6 : : : : : 14.4 7.0 : 8.6 : 61.4 42.8 : : -3.4 4.61983 : : 4.2 : : : : : 13.4 7.4 : 6.4 : 95.4 25.8 : : -3.8 -5.01984 : : 7.5 : : : : : 4.0 8.8 : 7.8 : 22.7 57.1 : : -0.8 -2.61985 : : 1.4 : : : : : 3.6 4.0 : 3.7 : 31.3 64.4 : : -3.3 -2.11986 : : -10.4 : : : : : -6.6 -4.3 : -10.4 : 13.7 28.8 : : 0.0 -32.01987 : : -3.2 : : : : : 3.9 2.4 : -1.6 : 7.4 33.1 : : 6.0 -5.21988 : : 1.2 : : : : : 3.9 -0.8 : 1.8 : 19.2 79.0 : : 4.8 -4.01989 : : 5.3 : : : : : 6.2 6.6 : 5.7 : 31.5 66.7 : : 2.2 4.61990 : : -0.9 : : : : : 3.3 3.4 : -0.1 : 19.3 28.4 : : 2.9 7.0
1981-1990 : : 2.9 : : : : : 5.5 4.2 : 3.4 : 32.9 45.9 : : 0.9 -4.1
1991 : 92.5 2.1 : : : 31.7 209.7 0.8 0.4 : 1.0 : 3.4 60.2 : : -0.8 -5.11992 : 1.4 -1.1 : : 10.0 21.7 353.9 -2.5 0.0 : -0.9 : -0.7 63.1 : : 0.1 -4.71993 : -1.8 -1.3 : : 9.7 18.7 146.1 15.0 8.6 : 2.7 : 8.7 48.9 : : -0.8 -8.41994 : -0.9 0.5 : : 15.6 27.0 142.1 3.1 3.0 : 1.7 : 5.9 163.3 : : 0.9 -4.71995 : 6.5 0.5 : : 32.7 18.0 37.6 4.7 5.9 : 2.7 : 3.7 85.0 : : 2.8 -0.31996 120.5 2.4 -0.1 3.1 3.6 20.8 10.4 53.6 -3.9 0.1 1.1 0.1 2.6 3.1 80.4 : : -1.7 7.11997 851.3 5.5 2.4 4.8 0.2 13.7 15.7 106.7 0.4 -7.0 3.3 0.7 10.1 0.0 74.1 : : -3.5 5.51998 -0.4 -0.7 -2.1 1.2 -4.2 12.0 10.9 14.6 -1.0 -6.1 -1.9 -2.5 7.7 -0.7 62.5 : : -5.4 -3.11999 4.3 1.4 -0.5 6.9 -4.1 5.6 7.1 58.1 1.1 -0.7 0.0 -0.5 -0.4 0.6 47.9 : : 0.7 -8.12000 14.7 6.6 7.2 10.0 4.1 12.7 7.9 35.5 4.1 2.6 7.0 6.7 8.6 6.3 56.7 : : 4.5 0.2
1991-2000 : 8.9 0.7 : : : 16.6 97.4 2.1 0.6 : 1.2 : 3.0 71.8 : : -0.4 -2.3
2001 0.8 -2.5 1.5 2.7 -2.0 2.4 1.3 30.9 4.0 -0.2 0.7 0.5 3.9 21.1 93.4 : : -2.4 2.32002 -2.1 -8.2 -2.5 -0.5 -4.6 -5.3 5.4 15.7 0.1 -2.4 -1.9 -2.0 -2.4 -2.3 22.1 : : -1.1 -0.62003 -2.0 -0.1 -2.0 0.0 -1.9 0.4 6.7 14.9 -2.1 0.5 -1.1 -1.5 17.0 -3.1 7.1 : : 3.6 -0.92004 5.2 2.0 0.7 0.7 -0.9 -1.0 4.8 8.9 0.9 -0.7 1.1 0.9 -0.5 2.6 10.8 : 16.6 4.9 3.02005 8.4 -0.2 3.3 2.3 7.5 1.3 -3.6 -2.9 4.6 3.6 3.2 3.5 1.9 -5.4 0.2 : 19.8 6.2 10.12006 9.2 0.7 3.3 2.8 8.3 8.0 2.4 -0.4 3.3 2.4 3.4 3.3 3.9 17.4 19.0 : 4.6 4.2 11.22007 6.5 -0.7 1.8 3.0 4.9 -4.3 1.1 -7.6 0.6 0.2 0.9 1.0 7.9 2.1 0.1 : -2.9 3.6 6.52008 9.8 -3.1 3.3 4.3 8.9 1.7 0.9 15.4 4.4 12.7 4.9 5.1 20.4 44.3 21.3 : 10.0 10.5 6.22009 -10.7 -1.7 -8.2 -1.9 -10.4 1.4 8.0 3.3 0.2 3.1 -4.4 -5.0 -6.7 24.8 0.8 : 2.1 -10.5 -21.52010 6.1 0.6 4.8 1.5 9.7 1.9 2.1 5.7 0.2 4.6 4.6 4.8 3.2 2.7 4.7 : 15.8 6.0 4.5
2001-2010 2.9 -1.4 0.5 1.5 1.7 0.6 2.9 7.9 1.6 2.3 1.1 1.0 4.6 9.4 15.6 : : 2.4 1.7
2011 10.1 2.5 3.7 6.0 12.8 5.1 8.8 6.0 -0.4 7.2 5.7 5.6 9.5 8.9 30.2 : 3.9 7.8 5.82012 5.2 3.6 3.7 3.1 4.2 4.1 5.5 5.6 -1.0 -0.9 2.1 1.8 -2.0 4.8 5.6 : 12.6 0.5 -0.62013 -3.4 0.1 -0.8 0.2 -1.4 -0.6 -0.9 -1.5 -2.8 0.3 -1.1 -1.1 0.5 -1.0 4.2 : 2.6 -0.9 11.32014 -2.1 3.3 0.2 0.7 -2.2 1.9 -1.0 0.4 0.5 0.3 -0.3 -0.4 0.1 -5.7 13.2 : 3.5 0.3 2.82015 1.5 1.0 1.4 1.6 1.9 0.3 1.8 0.9 0.8 0.5 0.9 0.9 1.6 1.1 2.3 : 3.8 0.9 1.1
1) Weighted in common currency 2) Weighted in common currency; Former EU-15; 1961-91 including D_W

84
Prices
28. Terms of trade goods and services (National accounts)
(2005 = 100)
BE DE EE IE EL ES FR IT CY LV LU MT NL AT PT SI SK FI 1)
1960 103.7 83.1 : 118.3 98.7 56.7 112.1 109.0 : : 113.5 : 97.9 111.4 82.0 : : 116.9
1965 102.2 85.5 : 121.8 101.7 61.1 113.7 113.1 : : 104.4 : 101.9 115.5 85.7 : : 125.4
1970 104.3 98.2 : 116.8 101.1 79.7 111.4 115.3 : : 116.4 : 103.2 112.2 91.1 : : 120.2
1975 101.5 95.1 : 110.2 89.0 74.2 104.4 93.0 : : 106.3 : 99.8 110.6 82.8 : : 120.3
1980 97.3 87.9 : 103.2 85.9 69.6 96.9 87.5 : : 102.5 : 96.2 104.2 77.5 : : 103.7
1981 93.9 83.1 : 101.2 91.6 62.1 91.7 84.1 : : 102.0 : 98.0 102.0 72.5 : : 100.61982 93.4 84.3 : 104.3 89.8 62.9 91.9 87.6 : : 103.5 : 98.8 103.5 74.1 : : 102.21983 93.1 85.4 : 108.2 93.5 60.1 94.1 88.8 : : 101.6 : 98.3 103.1 72.8 : : 101.31984 93.3 84.0 : 106.8 86.2 60.5 92.7 89.0 : : 99.5 : 99.3 103.2 70.9 : : 104.41985 94.1 84.3 : 107.4 84.3 64.0 93.2 89.7 : : 100.3 : 98.0 102.5 75.0 : : 104.01986 98.0 94.2 : 112.0 87.6 76.1 101.3 101.4 : : 99.7 : 98.6 103.7 85.9 : : 107.91987 99.0 98.0 : 111.0 89.2 81.1 101.1 104.2 : : 98.7 : 96.0 104.0 88.5 : : 110.11988 100.5 97.8 : 110.3 91.5 84.8 103.3 102.9 : : 99.8 : 96.0 104.0 90.8 : : 113.81989 101.4 95.2 : 111.4 90.9 88.2 101.8 102.6 : : 100.3 : 95.8 103.4 89.7 : : 114.61990 101.0 96.5 : 106.4 92.7 91.4 102.1 106.3 : : 98.9 : 95.9 104.1 91.0 93.7 : 113.6
1991 101.1 95.2 : 103.6 94.0 94.2 101.2 110.5 : : 97.7 : 96.1 104.0 92.3 88.7 : 109.51992 102.8 98.3 : 102.8 92.2 95.8 101.8 109.4 : : 96.7 : 95.6 103.3 95.6 89.2 106.0 108.01993 104.4 100.1 80.3 105.1 93.7 94.7 103.3 104.5 : : 99.1 : 95.5 102.9 96.9 94.6 103.8 106.31994 103.9 101.2 80.0 102.8 96.4 93.6 102.7 103.1 104.3 : 100.1 : 95.8 103.2 98.4 97.0 102.3 108.21995 103.8 102.8 83.1 100.9 97.5 94.9 102.0 100.1 98.8 101.8 100.4 96.7 96.3 103.6 100.5 99.3 103.5 113.51996 103.0 102.3 84.8 101.2 98.0 95.8 101.2 103.2 98.0 100.2 101.2 95.9 96.3 101.7 98.0 100.5 98.4 112.51997 102.6 100.6 88.3 101.4 98.8 95.4 101.2 102.7 97.7 92.6 97.7 96.0 97.3 100.9 98.7 101.0 103.0 110.91998 103.5 102.4 88.9 101.6 99.1 97.2 102.7 105.8 99.2 96.4 96.7 93.9 97.8 100.7 101.6 101.7 100.4 112.91999 102.2 103.2 88.4 101.6 99.3 97.0 103.0 105.8 99.2 99.6 98.8 96.0 97.5 100.8 102.8 101.9 99.1 109.52000 100.2 98.5 90.4 99.8 96.3 94.1 100.3 99.4 99.2 96.7 96.6 98.2 97.7 99.2 99.8 98.7 101.9 105.4
2001 100.3 98.5 92.1 100.9 97.1 96.1 100.5 100.2 100.6 97.8 95.8 96.7 98.9 99.5 100.1 100.4 100.8 107.22002 101.5 100.8 94.8 101.9 98.6 98.7 102.3 101.9 98.6 96.4 96.7 98.0 100.0 100.8 101.7 102.3 100.8 107.42003 101.3 101.8 97.4 101.0 100.5 100.0 102.2 103.8 99.3 98.6 100.8 100.1 100.1 101.0 102.0 103.1 100.4 105.92004 100.4 101.9 98.6 100.4 100.7 99.4 101.3 103.1 101.3 100.9 99.7 99.0 99.3 100.8 101.3 102.1 100.1 103.62005 100.0 100.0 100.0 100.0 100.0 100.0 100.0 100.0 100.0 100.0 100.0 100.0 100.0 100.0 100.0 100.0 100.0 100.02006 99.3 98.6 102.0 99.2 99.8 100.3 98.5 96.9 100.7 98.9 102.0 100.1 99.6 99.4 100.5 99.5 98.6 96.82007 99.5 99.1 105.0 97.7 100.0 100.8 99.7 97.9 102.6 103.6 102.5 100.8 99.4 98.5 101.2 100.4 97.5 96.62008 97.1 97.6 104.1 95.5 98.9 98.9 99.0 95.9 101.7 101.5 102.0 99.4 99.5 97.1 98.7 98.9 96.0 94.72009 100.5 101.6 105.4 97.2 98.2 103.0 101.8 101.3 101.2 101.8 102.4 98.6 99.4 98.6 103.4 102.6 95.0 95.92010 98.9 99.5 103.3 95.7 98.6 100.7 100.3 97.6 101.3 102.0 104.9 99.0 98.3 97.4 102.8 98.5 94.5 93.8
2011 97.6 97.3 102.3 93.2 97.6 97.6 98.1 94.8 101.1 105.2 105.5 100.0 98.4 95.4 101.0 97.1 93.2 92.12012 97.4 96.9 101.4 93.5 96.2 95.4 97.4 93.7 100.5 102.2 105.7 99.9 97.8 94.3 101.1 96.2 92.1 91.02013 97.5 98.2 102.7 93.3 96.6 96.0 98.1 95.6 100.0 102.6 107.1 100.6 98.4 94.8 102.3 97.0 91.7 91.12014 98.1 98.8 103.0 93.6 96.3 96.5 98.2 96.7 100.0 102.7 107.8 100.8 98.7 95.4 104.1 97.9 91.8 91.32015 97.9 98.7 103.1 93.6 96.5 96.4 98.4 96.7 99.9 102.7 107.1 101.0 98.5 95.4 104.6 97.9 91.3 91.2
1) 1960-91 D
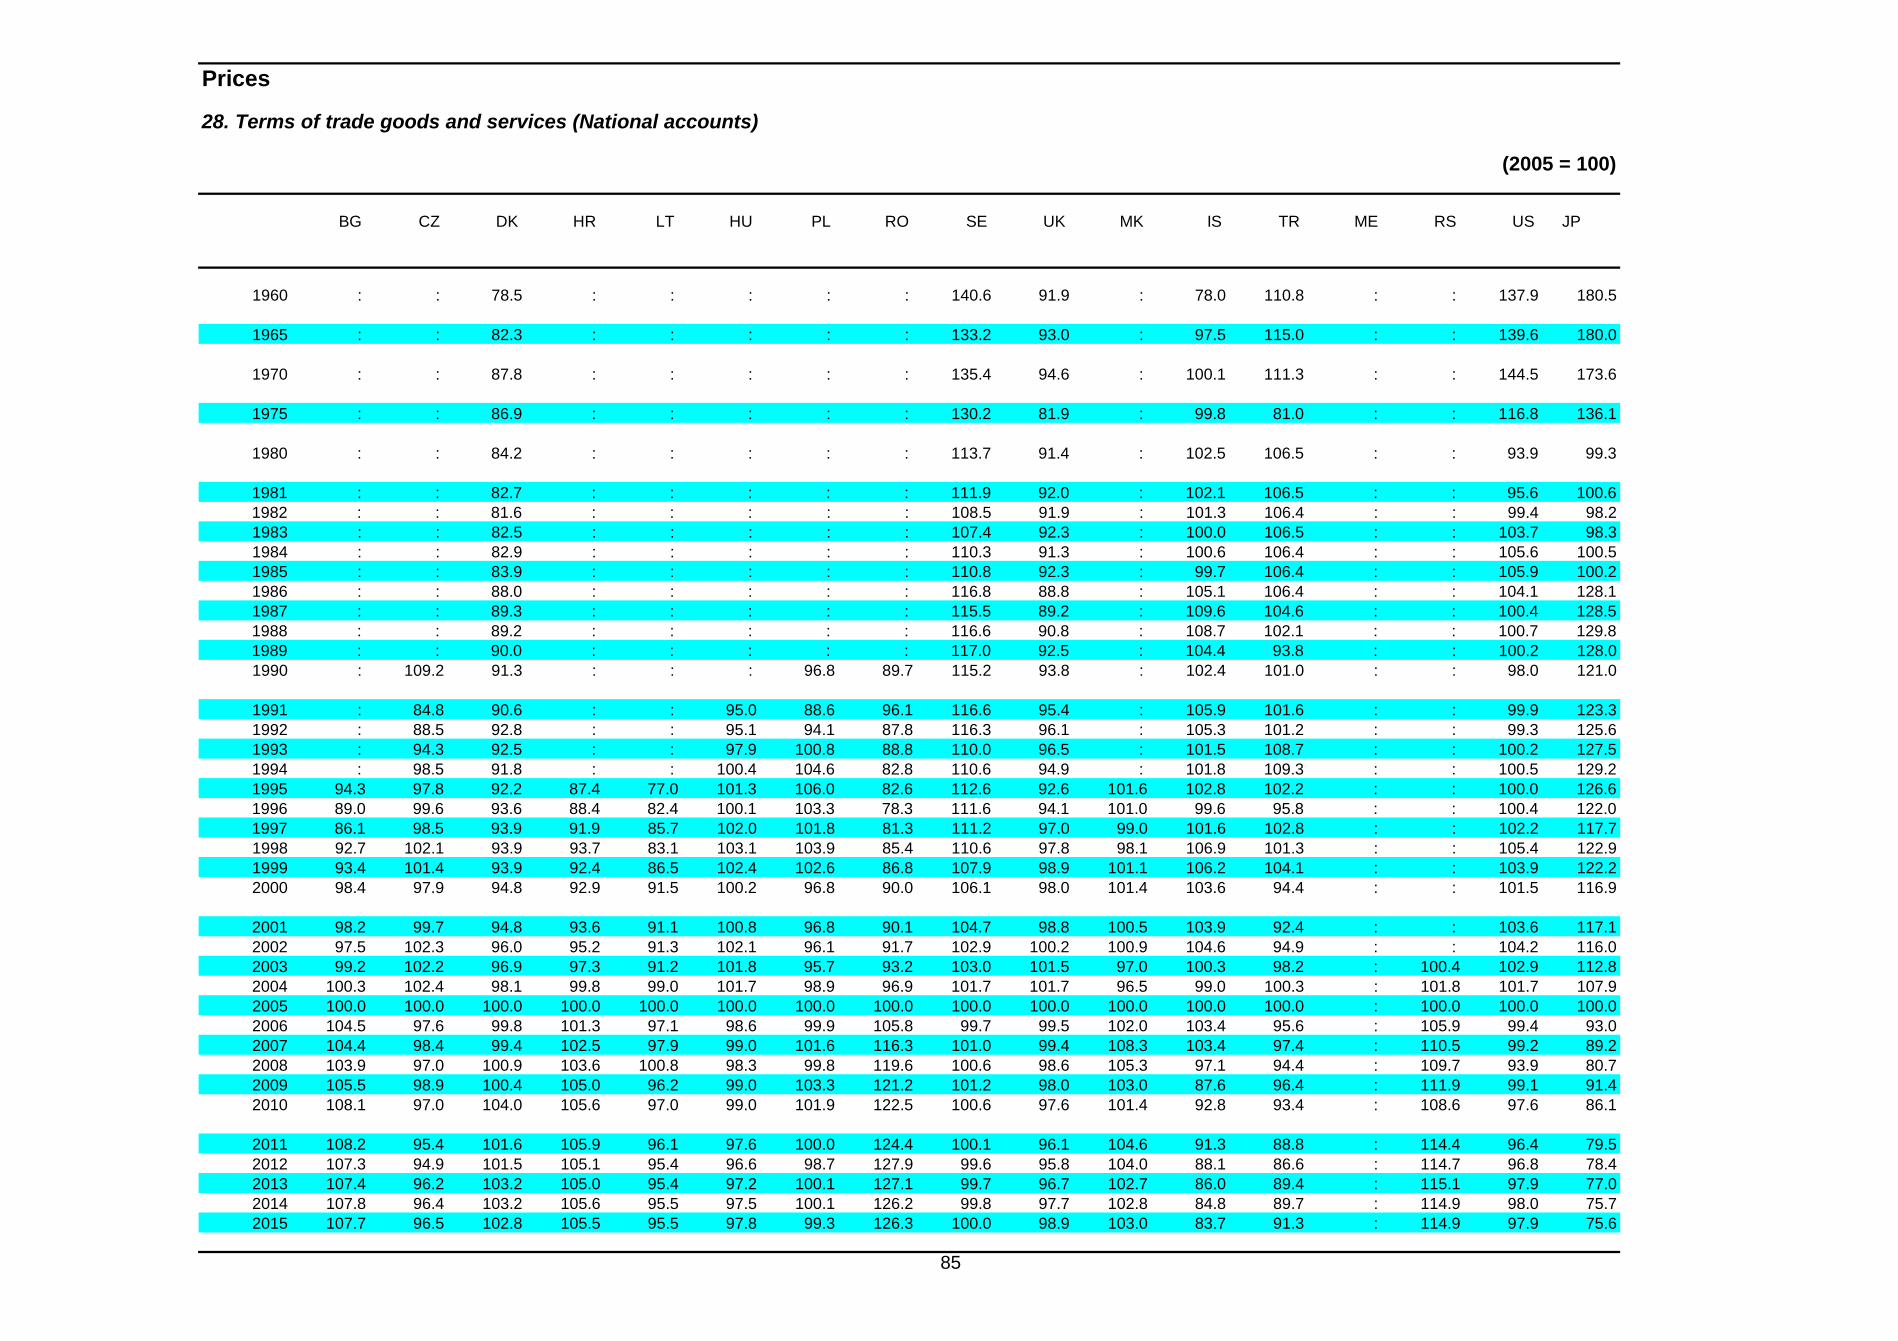
85
Prices
28. Terms of trade goods and services (National accounts)
(2005 = 100)
BG CZ DK HR LT HU PL RO SE UK MK IS TR ME RS US JP
1960 : : 78.5 : : : : : 140.6 91.9 : 78.0 110.8 : : 137.9 180.5
1965 : : 82.3 : : : : : 133.2 93.0 : 97.5 115.0 : : 139.6 180.0
1970 : : 87.8 : : : : : 135.4 94.6 : 100.1 111.3 : : 144.5 173.6
1975 : : 86.9 : : : : : 130.2 81.9 : 99.8 81.0 : : 116.8 136.1
1980 : : 84.2 : : : : : 113.7 91.4 : 102.5 106.5 : : 93.9 99.3
1981 : : 82.7 : : : : : 111.9 92.0 : 102.1 106.5 : : 95.6 100.61982 : : 81.6 : : : : : 108.5 91.9 : 101.3 106.4 : : 99.4 98.21983 : : 82.5 : : : : : 107.4 92.3 : 100.0 106.5 : : 103.7 98.31984 : : 82.9 : : : : : 110.3 91.3 : 100.6 106.4 : : 105.6 100.51985 : : 83.9 : : : : : 110.8 92.3 : 99.7 106.4 : : 105.9 100.21986 : : 88.0 : : : : : 116.8 88.8 : 105.1 106.4 : : 104.1 128.11987 : : 89.3 : : : : : 115.5 89.2 : 109.6 104.6 : : 100.4 128.51988 : : 89.2 : : : : : 116.6 90.8 : 108.7 102.1 : : 100.7 129.81989 : : 90.0 : : : : : 117.0 92.5 : 104.4 93.8 : : 100.2 128.01990 : 109.2 91.3 : : : 96.8 89.7 115.2 93.8 : 102.4 101.0 : : 98.0 121.0
1991 : 84.8 90.6 : : 95.0 88.6 96.1 116.6 95.4 : 105.9 101.6 : : 99.9 123.31992 : 88.5 92.8 : : 95.1 94.1 87.8 116.3 96.1 : 105.3 101.2 : : 99.3 125.61993 : 94.3 92.5 : : 97.9 100.8 88.8 110.0 96.5 : 101.5 108.7 : : 100.2 127.51994 : 98.5 91.8 : : 100.4 104.6 82.8 110.6 94.9 : 101.8 109.3 : : 100.5 129.21995 94.3 97.8 92.2 87.4 77.0 101.3 106.0 82.6 112.6 92.6 101.6 102.8 102.2 : : 100.0 126.61996 89.0 99.6 93.6 88.4 82.4 100.1 103.3 78.3 111.6 94.1 101.0 99.6 95.8 : : 100.4 122.01997 86.1 98.5 93.9 91.9 85.7 102.0 101.8 81.3 111.2 97.0 99.0 101.6 102.8 : : 102.2 117.71998 92.7 102.1 93.9 93.7 83.1 103.1 103.9 85.4 110.6 97.8 98.1 106.9 101.3 : : 105.4 122.91999 93.4 101.4 93.9 92.4 86.5 102.4 102.6 86.8 107.9 98.9 101.1 106.2 104.1 : : 103.9 122.22000 98.4 97.9 94.8 92.9 91.5 100.2 96.8 90.0 106.1 98.0 101.4 103.6 94.4 : : 101.5 116.9
2001 98.2 99.7 94.8 93.6 91.1 100.8 96.8 90.1 104.7 98.8 100.5 103.9 92.4 : : 103.6 117.12002 97.5 102.3 96.0 95.2 91.3 102.1 96.1 91.7 102.9 100.2 100.9 104.6 94.9 : : 104.2 116.02003 99.2 102.2 96.9 97.3 91.2 101.8 95.7 93.2 103.0 101.5 97.0 100.3 98.2 : 100.4 102.9 112.82004 100.3 102.4 98.1 99.8 99.0 101.7 98.9 96.9 101.7 101.7 96.5 99.0 100.3 : 101.8 101.7 107.92005 100.0 100.0 100.0 100.0 100.0 100.0 100.0 100.0 100.0 100.0 100.0 100.0 100.0 : 100.0 100.0 100.02006 104.5 97.6 99.8 101.3 97.1 98.6 99.9 105.8 99.7 99.5 102.0 103.4 95.6 : 105.9 99.4 93.02007 104.4 98.4 99.4 102.5 97.9 99.0 101.6 116.3 101.0 99.4 108.3 103.4 97.4 : 110.5 99.2 89.22008 103.9 97.0 100.9 103.6 100.8 98.3 99.8 119.6 100.6 98.6 105.3 97.1 94.4 : 109.7 93.9 80.72009 105.5 98.9 100.4 105.0 96.2 99.0 103.3 121.2 101.2 98.0 103.0 87.6 96.4 : 111.9 99.1 91.42010 108.1 97.0 104.0 105.6 97.0 99.0 101.9 122.5 100.6 97.6 101.4 92.8 93.4 : 108.6 97.6 86.1
2011 108.2 95.4 101.6 105.9 96.1 97.6 100.0 124.4 100.1 96.1 104.6 91.3 88.8 : 114.4 96.4 79.52012 107.3 94.9 101.5 105.1 95.4 96.6 98.7 127.9 99.6 95.8 104.0 88.1 86.6 : 114.7 96.8 78.42013 107.4 96.2 103.2 105.0 95.4 97.2 100.1 127.1 99.7 96.7 102.7 86.0 89.4 : 115.1 97.9 77.02014 107.8 96.4 103.2 105.6 95.5 97.5 100.1 126.2 99.8 97.7 102.8 84.8 89.7 : 114.9 98.0 75.72015 107.7 96.5 102.8 105.5 95.5 97.8 99.3 126.3 100.0 98.9 103.0 83.7 91.3 : 114.9 97.9 75.6

86
Wage costs
29. Nominal compensation per employee; total economy
(National currency; annual percentage change)
BE DE EE IE EL ES FR IT CY LV LU MT NL AT PT SI SK FI EA-18 EA-12 1) 2) 3)
1961-1970 7.9 8.6 : 9.8 9.4 14.1 9.8 10.7 : : 6.7 : 10.6 8.6 10.3 : : 9.8 : 9.8
1971-1980 12.3 8.3 : 18.6 18.3 20.4 13.5 18.4 : : 10.6 : 10.7 10.1 20.3 : : 15.1 : 12.8
1981 7.0 4.6 : 18.1 21.3 15.6 13.4 22.5 : : 8.3 : 3.6 7.9 21.3 : : 14.0 : 11.21982 7.3 3.9 : 14.2 27.5 13.8 14.1 16.2 : : 6.9 : 5.8 5.8 23.3 : : 9.6 : 10.31983 6.3 3.1 : 12.8 21.6 13.9 9.8 15.7 : : 6.9 : 3.3 4.3 19.0 : : 10.0 : 8.61984 7.4 2.9 : 10.7 20.8 10.4 7.8 11.6 : : 7.1 : 0.4 5.4 15.2 : : 10.4 : 7.11985 4.8 2.4 : 9.2 21.0 9.2 6.0 10.0 : : 4.3 : 1.8 5.4 22.4 : : 10.3 : 6.11986 3.6 3.2 : 5.1 12.0 9.5 4.2 7.4 : : 5.1 : 2.1 5.4 21.2 : : 7.3 : 5.11987 1.9 2.8 : 5.1 11.3 7.1 3.1 7.9 : : 3.8 : 1.6 3.9 15.7 : : 7.7 : 4.31988 2.1 2.5 : 7.0 20.1 7.5 4.2 8.2 : : 3.6 : 1.2 2.8 13.2 : : 8.9 : 4.61989 5.6 2.6 : 6.5 23.2 7.4 3.9 8.5 : : 8.5 : 0.8 4.5 18.4 : : 10.3 : 4.91990 6.7 4.6 : 4.2 17.9 10.1 5.0 10.4 : : 4.7 : 3.2 5.4 17.2 : : 9.5 : 6.6
1981-1990 5.3 3.3 : 9.2 19.6 10.4 7.1 11.7 : : 5.9 : 2.4 5.1 18.7 : : 9.8 : 6.8
1991 7.4 5.9 : 4.5 15.3 10.1 3.9 8.9 : : 5.4 9.3 4.8 6.7 16.7 : : 6.3 : 6.61992 5.3 10.3 : 7.8 11.5 11.3 4.1 5.7 : : 6.5 6.8 4.7 6.2 18.7 : : 2.0 : 7.61993 4.6 4.0 : 5.5 9.8 7.4 2.8 4.5 : 138.1 5.7 10.2 3.3 4.7 7.3 : : 0.6 : 4.21994 4.4 2.9 56.5 2.2 10.9 3.7 1.4 3.4 : 63.9 3.9 6.4 3.2 4.1 5.3 : : 3.4 : 3.01995 1.0 3.4 42.6 3.0 13.0 3.7 2.5 4.3 : 8.8 1.4 9.0 1.7 3.5 10.3 : : 4.1 : 3.41996 1.6 1.1 28.7 4.4 8.8 4.0 2.4 6.1 4.7 27.3 1.9 3.0 1.7 1.2 6.0 13.6 13.1 2.6 2.6 2.51997 3.3 0.6 20.2 5.0 13.7 2.3 1.7 4.2 5.5 13.0 2.6 3.2 2.5 1.4 5.7 12.4 16.8 1.6 2.1 1.91998 1.3 0.9 13.6 3.7 5.3 2.0 1.9 -1.4 2.9 6.2 0.9 4.5 3.8 2.8 5.6 8.6 9.9 4.5 1.4 1.21999 3.5 0.9 8.5 5.0 6.5 2.0 2.1 2.3 4.5 7.5 4.0 3.3 4.0 2.4 5.1 8.4 6.6 2.1 2.1 2.02000 2.1 1.8 14.6 7.7 6.0 2.9 2.3 2.4 6.0 7.4 5.3 6.7 5.0 2.4 6.3 10.2 13.2 3.8 2.7 2.6
1991-2000 3.4 3.2 : 4.9 10.1 4.9 2.5 4.0 : : 3.7 6.2 3.5 3.5 8.6 : : 3.1 : 3.5
2001 3.7 1.7 9.6 7.9 3.7 3.5 2.3 2.9 3.7 4.3 3.5 5.2 5.4 2.1 4.0 11.6 5.6 4.6 2.7 2.62002 3.8 1.3 9.1 5.4 11.4 3.4 3.1 2.6 4.8 2.8 3.1 4.4 5.2 2.6 3.4 8.3 8.9 1.7 2.7 2.62003 1.9 1.4 11.6 6.4 6.3 3.4 2.7 3.7 7.9 11.0 1.1 6.0 4.2 1.6 3.5 7.8 7.8 2.7 2.6 2.62004 1.6 0.3 12.3 5.2 4.2 2.9 3.4 3.4 2.2 14.5 3.3 1.8 3.5 0.7 2.6 7.7 8.1 3.7 2.2 2.12005 1.7 -0.1 10.8 5.6 2.6 3.5 3.0 3.0 2.0 25.1 4.6 1.5 1.7 2.7 4.7 6.0 9.1 3.7 2.0 2.02006 3.6 1.0 14.0 4.4 2.4 3.9 3.1 2.7 3.2 23.2 2.6 5.0 2.4 3.9 1.8 5.4 7.9 2.9 2.5 2.42007 3.4 0.8 25.0 5.6 4.7 4.7 2.6 2.3 2.8 42.2 3.7 3.1 3.4 2.6 3.6 6.2 8.7 3.7 2.6 2.52008 3.6 2.1 9.7 5.2 3.6 6.9 2.8 3.8 3.4 17.7 3.4 4.2 3.3 3.1 3.0 7.2 7.0 4.4 3.5 3.42009 1.2 0.1 -3.1 -1.1 3.5 4.2 2.0 1.7 2.6 -11.5 1.8 3.2 2.5 2.5 2.8 1.8 2.5 2.3 1.8 1.82010 1.4 2.4 2.3 -3.8 -2.6 0.4 2.5 2.8 2.6 -4.9 2.6 1.5 1.5 1.2 2.0 3.9 5.1 1.8 2.0 1.9
2001-2010 2.6 1.1 9.9 4.0 3.9 3.7 2.7 2.9 3.5 11.5 3.0 3.6 3.3 2.3 3.2 6.6 7.1 3.1 2.5 2.4
2011 3.1 3.0 0.5 -0.1 -3.4 1.3 2.5 1.3 2.5 5.0 2.4 2.1 1.6 2.4 -0.6 1.6 2.0 3.2 2.2 2.22012 3.7 2.6 6.0 0.8 -3.7 0.2 2.2 1.0 -0.9 7.3 2.0 2.2 1.9 2.6 -2.0 -1.0 2.8 3.5 2.0 2.12013 2.0 2.0 7.4 -1.7 -6.6 0.7 1.7 1.4 -6.0 5.4 3.1 0.6 2.3 2.1 3.5 0.1 0.8 2.1 1.7 1.72014 0.6 2.9 6.0 0.4 -2.7 0.2 1.2 1.1 -3.0 4.1 2.0 1.9 2.3 2.0 -0.9 1.0 2.4 1.5 1.6 1.62015 2.2 3.3 6.7 0.5 0.0 0.3 1.3 1.3 0.9 4.6 2.7 2.1 1.7 2.0 1.0 1.6 2.7 1.6 1.9 1.9
1) 1961-91 D_W2) Weighted in common currency; Euro area including Latvia3) Weighted in common currency; Former Euro area 12; 1961-91 including D_W

87
Wage costs
29. Nominal compensation per employee; total economy
(National currency; annual percentage change)
BG CZ DK HR LT HU PL RO SE UK EU-28 EU-15 MK IS TR ME RS US JP 1) 2)
1961-1970 : : 10.5 : : : : : 8.5 7.0 : 9.1 : : : : : 5.2 13.5
1971-1980 : : 12.1 : : : : : 11.4 16.1 : 13.3 : : : : : 7.8 13.1
1981 : : 9.6 : : : : : 9.1 13.2 : 11.5 : : : : : 9.4 6.21982 : : 12.4 : : : : : 6.1 8.6 : 9.9 : : : : : 7.7 3.81983 : : 9.0 : : : : : 7.9 8.3 : 8.5 : : : : : 5.6 2.11984 : : 6.1 : : : : : 8.2 5.8 : 6.9 : : : : : 4.8 3.81985 : : 5.2 : : : : : 7.6 7.7 : 6.4 : : : : : 4.9 2.81986 : : 4.8 : : : : : 8.7 8.1 : 5.8 : : : : : 4.6 3.21987 : : 8.4 : : : : : 7.1 6.1 : 4.7 : : : : : 4.1 3.21988 : : 5.6 : : : : : 7.5 7.6 : 5.1 : : : : : 5.2 4.01989 : : 4.2 : : : : : 11.3 9.5 : 5.9 : : 100.7 : : 3.8 4.81990 : : 4.3 : : : : : 11.3 10.1 : 7.4 : : 90.1 : : 5.2 5.2
1981-1990 : : 6.9 : : : : : 8.5 8.5 : 7.2 : : : : : 5.5 3.9
1991 : : 4.0 : : : : 127.4 6.8 9.4 : 7.1 : : 85.2 : : 4.8 4.91992 : : 4.3 : : : 56.8 187.8 4.0 5.5 : 7.0 : : 63.4 : : 6.2 1.31993 : : 2.3 : : : 31.5 207.6 2.9 3.7 : 4.0 : : 75.0 : : 2.2 0.81994 : 19.6 1.2 : 67.7 : 41.3 132.6 6.0 0.1 : 2.5 : : 53.8 : : 2.1 1.41995 : 13.7 3.8 : 67.5 : 34.1 54.3 2.7 3.7 : 3.4 : : 67.0 : : 1.9 1.51996 71.8 17.1 4.3 : 33.1 21.3 27.1 55.0 7.2 3.3 : 2.7 : : 93.4 : : 3.1 0.81997 857.7 10.5 3.1 35.3 23.0 22.1 20.5 109.1 4.8 4.1 4.4 2.3 : : 101.8 : : 3.9 1.01998 59.0 8.7 4.1 5.9 15.5 14.5 14.0 77.5 2.5 6.8 3.2 2.2 3.0 : 74.2 : : 5.4 -1.01999 6.4 6.2 3.9 7.5 2.6 6.5 13.7 50.1 1.3 4.9 4.0 2.5 6.2 : 74.8 : : 4.3 -0.92000 9.9 7.9 3.5 6.7 -0.7 15.0 10.8 70.1 7.3 5.6 4.3 3.3 4.9 : 44.9 : : 5.9 0.3
1991-2000 : : 3.4 : : : : 100.7 4.5 4.7 : 3.7 : : 72.6 : : 4.0 1.0
2001 13.4 8.4 4.2 1.5 7.1 15.2 10.2 55.0 4.3 5.2 4.1 3.2 -0.2 7.4 43.6 : : 3.0 -1.12002 6.0 7.8 3.8 9.7 5.0 13.6 2.3 16.7 2.9 2.8 2.9 2.7 4.5 8.8 37.9 : : 2.5 -2.12003 4.2 7.9 3.7 6.8 8.9 9.9 1.6 27.4 3.2 4.8 3.3 3.0 8.0 2.0 27.9 : : 4.1 -2.42004 6.2 8.2 3.3 4.2 10.9 10.3 1.9 13.8 4.0 4.1 2.5 2.6 -2.9 10.3 16.5 : : 4.9 -0.92005 9.3 3.8 3.6 5.5 11.5 7.1 1.7 29.1 3.1 3.6 2.5 2.4 -3.3 8.9 7.1 : : 3.3 -0.42006 6.3 6.0 3.5 3.3 16.7 5.6 1.9 12.4 2.1 5.3 2.8 3.0 11.7 12.4 10.8 : : 4.0 -1.02007 12.7 6.3 3.6 8.2 13.9 5.5 4.9 22.0 5.2 4.8 3.2 3.0 -4.8 9.8 9.4 : : 4.1 -1.02008 16.8 4.2 3.5 4.4 14.3 7.2 8.6 31.9 1.5 1.7 3.3 3.0 9.0 2.8 7.5 : : 2.8 -0.52009 8.1 -0.6 3.3 1.0 -9.9 -1.7 3.6 -1.9 1.6 2.4 1.8 1.9 6.9 -4.5 4.7 : : 1.6 -3.32010 9.9 3.1 3.5 1.9 7.2 -0.5 8.2 -3.3 3.1 3.1 2.6 2.2 6.0 7.2 7.0 : : 3.1 0.4
2001-2010 9.2 5.5 3.6 4.6 8.3 7.1 4.4 19.2 3.1 3.8 2.9 2.7 3.3 6.4 16.5 : : 3.3 -1.2
2011 6.8 2.3 1.3 1.9 6.3 3.6 5.1 -4.1 0.9 2.0 2.1 2.1 -3.9 8.2 -2.1 : : 3.1 0.62012 7.8 1.9 1.4 3.2 3.8 0.8 3.5 4.2 3.1 1.6 1.9 2.0 2.8 5.6 11.8 : : 2.1 -0.12013 6.0 -1.9 1.2 1.9 4.8 4.7 2.7 5.9 1.2 2.1 1.7 1.8 2.4 3.2 10.7 : : 1.7 0.02014 3.6 2.1 1.8 2.5 3.3 3.6 3.5 5.4 2.7 2.1 1.8 1.7 4.3 2.5 7.8 : : 2.3 1.12015 3.3 2.4 2.0 2.0 4.6 3.4 4.4 4.5 3.0 2.8 2.2 2.1 3.2 3.5 8.1 : : 2.9 0.8
1) Weighted in common currency 2) Weighted in common currency; Former EU-15; 1961-91 including D_W
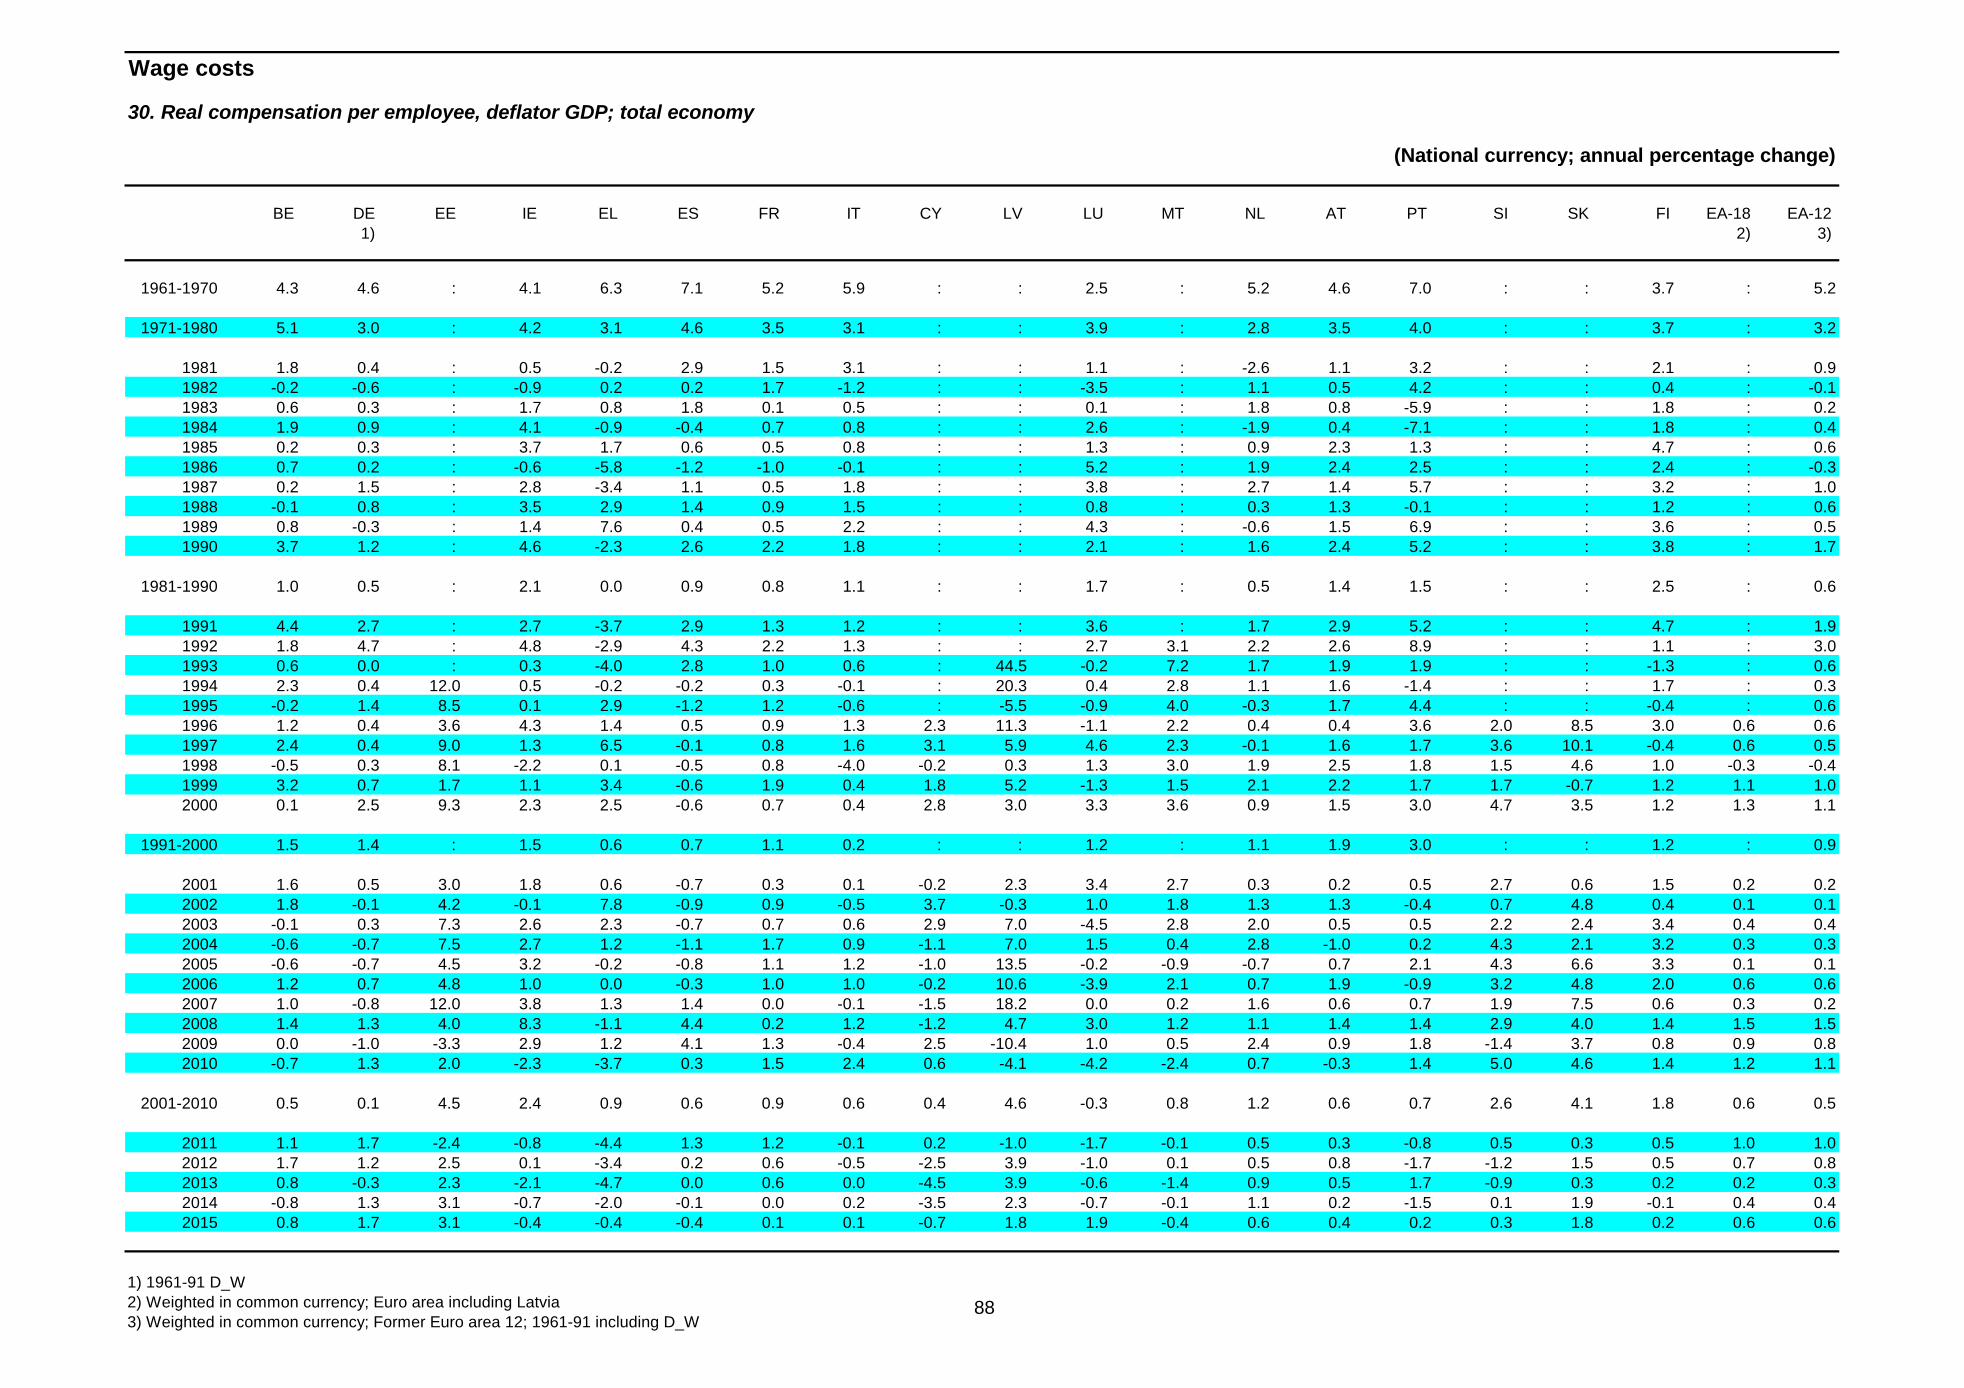
88
Wage costs
30. Real compensation per employee, deflator GDP; total economy
(National currency; annual percentage change)
BE DE EE IE EL ES FR IT CY LV LU MT NL AT PT SI SK FI EA-18 EA-12 1) 2) 3)
1961-1970 4.3 4.6 : 4.1 6.3 7.1 5.2 5.9 : : 2.5 : 5.2 4.6 7.0 : : 3.7 : 5.2
1971-1980 5.1 3.0 : 4.2 3.1 4.6 3.5 3.1 : : 3.9 : 2.8 3.5 4.0 : : 3.7 : 3.2
1981 1.8 0.4 : 0.5 -0.2 2.9 1.5 3.1 : : 1.1 : -2.6 1.1 3.2 : : 2.1 : 0.91982 -0.2 -0.6 : -0.9 0.2 0.2 1.7 -1.2 : : -3.5 : 1.1 0.5 4.2 : : 0.4 : -0.11983 0.6 0.3 : 1.7 0.8 1.8 0.1 0.5 : : 0.1 : 1.8 0.8 -5.9 : : 1.8 : 0.21984 1.9 0.9 : 4.1 -0.9 -0.4 0.7 0.8 : : 2.6 : -1.9 0.4 -7.1 : : 1.8 : 0.41985 0.2 0.3 : 3.7 1.7 0.6 0.5 0.8 : : 1.3 : 0.9 2.3 1.3 : : 4.7 : 0.61986 0.7 0.2 : -0.6 -5.8 -1.2 -1.0 -0.1 : : 5.2 : 1.9 2.4 2.5 : : 2.4 : -0.31987 0.2 1.5 : 2.8 -3.4 1.1 0.5 1.8 : : 3.8 : 2.7 1.4 5.7 : : 3.2 : 1.01988 -0.1 0.8 : 3.5 2.9 1.4 0.9 1.5 : : 0.8 : 0.3 1.3 -0.1 : : 1.2 : 0.61989 0.8 -0.3 : 1.4 7.6 0.4 0.5 2.2 : : 4.3 : -0.6 1.5 6.9 : : 3.6 : 0.51990 3.7 1.2 : 4.6 -2.3 2.6 2.2 1.8 : : 2.1 : 1.6 2.4 5.2 : : 3.8 : 1.7
1981-1990 1.0 0.5 : 2.1 0.0 0.9 0.8 1.1 : : 1.7 : 0.5 1.4 1.5 : : 2.5 : 0.6
1991 4.4 2.7 : 2.7 -3.7 2.9 1.3 1.2 : : 3.6 : 1.7 2.9 5.2 : : 4.7 : 1.91992 1.8 4.7 : 4.8 -2.9 4.3 2.2 1.3 : : 2.7 3.1 2.2 2.6 8.9 : : 1.1 : 3.01993 0.6 0.0 : 0.3 -4.0 2.8 1.0 0.6 : 44.5 -0.2 7.2 1.7 1.9 1.9 : : -1.3 : 0.61994 2.3 0.4 12.0 0.5 -0.2 -0.2 0.3 -0.1 : 20.3 0.4 2.8 1.1 1.6 -1.4 : : 1.7 : 0.31995 -0.2 1.4 8.5 0.1 2.9 -1.2 1.2 -0.6 : -5.5 -0.9 4.0 -0.3 1.7 4.4 : : -0.4 : 0.61996 1.2 0.4 3.6 4.3 1.4 0.5 0.9 1.3 2.3 11.3 -1.1 2.2 0.4 0.4 3.6 2.0 8.5 3.0 0.6 0.61997 2.4 0.4 9.0 1.3 6.5 -0.1 0.8 1.6 3.1 5.9 4.6 2.3 -0.1 1.6 1.7 3.6 10.1 -0.4 0.6 0.51998 -0.5 0.3 8.1 -2.2 0.1 -0.5 0.8 -4.0 -0.2 0.3 1.3 3.0 1.9 2.5 1.8 1.5 4.6 1.0 -0.3 -0.41999 3.2 0.7 1.7 1.1 3.4 -0.6 1.9 0.4 1.8 5.2 -1.3 1.5 2.1 2.2 1.7 1.7 -0.7 1.2 1.1 1.02000 0.1 2.5 9.3 2.3 2.5 -0.6 0.7 0.4 2.8 3.0 3.3 3.6 0.9 1.5 3.0 4.7 3.5 1.2 1.3 1.1
1991-2000 1.5 1.4 : 1.5 0.6 0.7 1.1 0.2 : : 1.2 : 1.1 1.9 3.0 : : 1.2 : 0.9
2001 1.6 0.5 3.0 1.8 0.6 -0.7 0.3 0.1 -0.2 2.3 3.4 2.7 0.3 0.2 0.5 2.7 0.6 1.5 0.2 0.22002 1.8 -0.1 4.2 -0.1 7.8 -0.9 0.9 -0.5 3.7 -0.3 1.0 1.8 1.3 1.3 -0.4 0.7 4.8 0.4 0.1 0.12003 -0.1 0.3 7.3 2.6 2.3 -0.7 0.7 0.6 2.9 7.0 -4.5 2.8 2.0 0.5 0.5 2.2 2.4 3.4 0.4 0.42004 -0.6 -0.7 7.5 2.7 1.2 -1.1 1.7 0.9 -1.1 7.0 1.5 0.4 2.8 -1.0 0.2 4.3 2.1 3.2 0.3 0.32005 -0.6 -0.7 4.5 3.2 -0.2 -0.8 1.1 1.2 -1.0 13.5 -0.2 -0.9 -0.7 0.7 2.1 4.3 6.6 3.3 0.1 0.12006 1.2 0.7 4.8 1.0 0.0 -0.3 1.0 1.0 -0.2 10.6 -3.9 2.1 0.7 1.9 -0.9 3.2 4.8 2.0 0.6 0.62007 1.0 -0.8 12.0 3.8 1.3 1.4 0.0 -0.1 -1.5 18.2 0.0 0.2 1.6 0.6 0.7 1.9 7.5 0.6 0.3 0.22008 1.4 1.3 4.0 8.3 -1.1 4.4 0.2 1.2 -1.2 4.7 3.0 1.2 1.1 1.4 1.4 2.9 4.0 1.4 1.5 1.52009 0.0 -1.0 -3.3 2.9 1.2 4.1 1.3 -0.4 2.5 -10.4 1.0 0.5 2.4 0.9 1.8 -1.4 3.7 0.8 0.9 0.82010 -0.7 1.3 2.0 -2.3 -3.7 0.3 1.5 2.4 0.6 -4.1 -4.2 -2.4 0.7 -0.3 1.4 5.0 4.6 1.4 1.2 1.1
2001-2010 0.5 0.1 4.5 2.4 0.9 0.6 0.9 0.6 0.4 4.6 -0.3 0.8 1.2 0.6 0.7 2.6 4.1 1.8 0.6 0.5
2011 1.1 1.7 -2.4 -0.8 -4.4 1.3 1.2 -0.1 0.2 -1.0 -1.7 -0.1 0.5 0.3 -0.8 0.5 0.3 0.5 1.0 1.02012 1.7 1.2 2.5 0.1 -3.4 0.2 0.6 -0.5 -2.5 3.9 -1.0 0.1 0.5 0.8 -1.7 -1.2 1.5 0.5 0.7 0.82013 0.8 -0.3 2.3 -2.1 -4.7 0.0 0.6 0.0 -4.5 3.9 -0.6 -1.4 0.9 0.5 1.7 -0.9 0.3 0.2 0.2 0.32014 -0.8 1.3 3.1 -0.7 -2.0 -0.1 0.0 0.2 -3.5 2.3 -0.7 -0.1 1.1 0.2 -1.5 0.1 1.9 -0.1 0.4 0.42015 0.8 1.7 3.1 -0.4 -0.4 -0.4 0.1 0.1 -0.7 1.8 1.9 -0.4 0.6 0.4 0.2 0.3 1.8 0.2 0.6 0.6
1) 1961-91 D_W2) Weighted in common currency; Euro area including Latvia3) Weighted in common currency; Former Euro area 12; 1961-91 including D_W
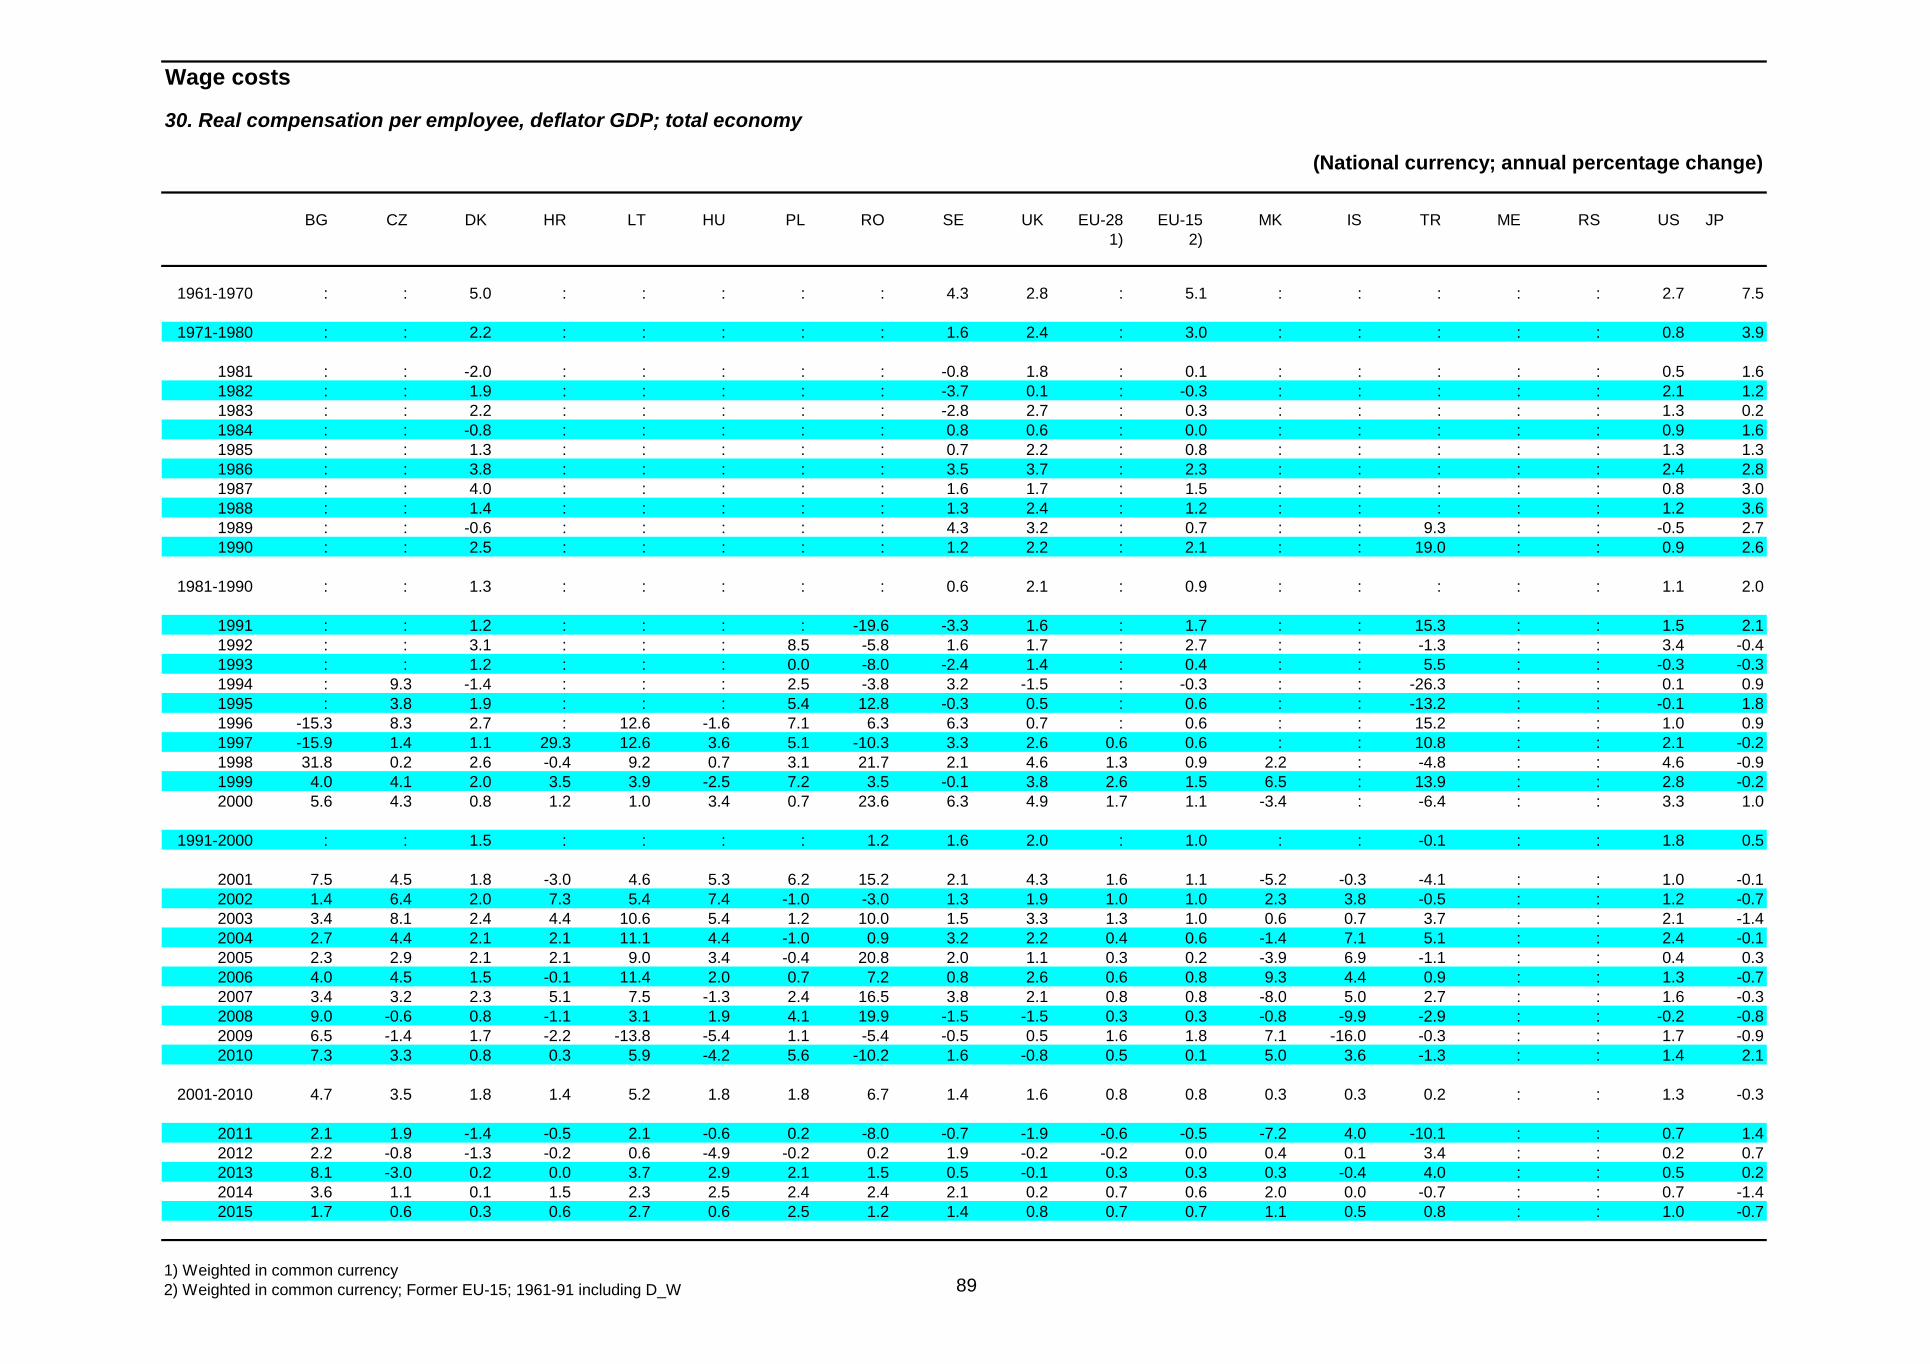
89
Wage costs
30. Real compensation per employee, deflator GDP; total economy
(National currency; annual percentage change)
BG CZ DK HR LT HU PL RO SE UK EU-28 EU-15 MK IS TR ME RS US JP 1) 2)
1961-1970 : : 5.0 : : : : : 4.3 2.8 : 5.1 : : : : : 2.7 7.5
1971-1980 : : 2.2 : : : : : 1.6 2.4 : 3.0 : : : : : 0.8 3.9
1981 : : -2.0 : : : : : -0.8 1.8 : 0.1 : : : : : 0.5 1.61982 : : 1.9 : : : : : -3.7 0.1 : -0.3 : : : : : 2.1 1.21983 : : 2.2 : : : : : -2.8 2.7 : 0.3 : : : : : 1.3 0.21984 : : -0.8 : : : : : 0.8 0.6 : 0.0 : : : : : 0.9 1.61985 : : 1.3 : : : : : 0.7 2.2 : 0.8 : : : : : 1.3 1.31986 : : 3.8 : : : : : 3.5 3.7 : 2.3 : : : : : 2.4 2.81987 : : 4.0 : : : : : 1.6 1.7 : 1.5 : : : : : 0.8 3.01988 : : 1.4 : : : : : 1.3 2.4 : 1.2 : : : : : 1.2 3.61989 : : -0.6 : : : : : 4.3 3.2 : 0.7 : : 9.3 : : -0.5 2.71990 : : 2.5 : : : : : 1.2 2.2 : 2.1 : : 19.0 : : 0.9 2.6
1981-1990 : : 1.3 : : : : : 0.6 2.1 : 0.9 : : : : : 1.1 2.0
1991 : : 1.2 : : : : -19.6 -3.3 1.6 : 1.7 : : 15.3 : : 1.5 2.11992 : : 3.1 : : : 8.5 -5.8 1.6 1.7 : 2.7 : : -1.3 : : 3.4 -0.41993 : : 1.2 : : : 0.0 -8.0 -2.4 1.4 : 0.4 : : 5.5 : : -0.3 -0.31994 : 9.3 -1.4 : : : 2.5 -3.8 3.2 -1.5 : -0.3 : : -26.3 : : 0.1 0.91995 : 3.8 1.9 : : : 5.4 12.8 -0.3 0.5 : 0.6 : : -13.2 : : -0.1 1.81996 -15.3 8.3 2.7 : 12.6 -1.6 7.1 6.3 6.3 0.7 : 0.6 : : 15.2 : : 1.0 0.91997 -15.9 1.4 1.1 29.3 12.6 3.6 5.1 -10.3 3.3 2.6 0.6 0.6 : : 10.8 : : 2.1 -0.21998 31.8 0.2 2.6 -0.4 9.2 0.7 3.1 21.7 2.1 4.6 1.3 0.9 2.2 : -4.8 : : 4.6 -0.91999 4.0 4.1 2.0 3.5 3.9 -2.5 7.2 3.5 -0.1 3.8 2.6 1.5 6.5 : 13.9 : : 2.8 -0.22000 5.6 4.3 0.8 1.2 1.0 3.4 0.7 23.6 6.3 4.9 1.7 1.1 -3.4 : -6.4 : : 3.3 1.0
1991-2000 : : 1.5 : : : : 1.2 1.6 2.0 : 1.0 : : -0.1 : : 1.8 0.5
2001 7.5 4.5 1.8 -3.0 4.6 5.3 6.2 15.2 2.1 4.3 1.6 1.1 -5.2 -0.3 -4.1 : : 1.0 -0.12002 1.4 6.4 2.0 7.3 5.4 7.4 -1.0 -3.0 1.3 1.9 1.0 1.0 2.3 3.8 -0.5 : : 1.2 -0.72003 3.4 8.1 2.4 4.4 10.6 5.4 1.2 10.0 1.5 3.3 1.3 1.0 0.6 0.7 3.7 : : 2.1 -1.42004 2.7 4.4 2.1 2.1 11.1 4.4 -1.0 0.9 3.2 2.2 0.4 0.6 -1.4 7.1 5.1 : : 2.4 -0.12005 2.3 2.9 2.1 2.1 9.0 3.4 -0.4 20.8 2.0 1.1 0.3 0.2 -3.9 6.9 -1.1 : : 0.4 0.32006 4.0 4.5 1.5 -0.1 11.4 2.0 0.7 7.2 0.8 2.6 0.6 0.8 9.3 4.4 0.9 : : 1.3 -0.72007 3.4 3.2 2.3 5.1 7.5 -1.3 2.4 16.5 3.8 2.1 0.8 0.8 -8.0 5.0 2.7 : : 1.6 -0.32008 9.0 -0.6 0.8 -1.1 3.1 1.9 4.1 19.9 -1.5 -1.5 0.3 0.3 -0.8 -9.9 -2.9 : : -0.2 -0.82009 6.5 -1.4 1.7 -2.2 -13.8 -5.4 1.1 -5.4 -0.5 0.5 1.6 1.8 7.1 -16.0 -0.3 : : 1.7 -0.92010 7.3 3.3 0.8 0.3 5.9 -4.2 5.6 -10.2 1.6 -0.8 0.5 0.1 5.0 3.6 -1.3 : : 1.4 2.1
2001-2010 4.7 3.5 1.8 1.4 5.2 1.8 1.8 6.7 1.4 1.6 0.8 0.8 0.3 0.3 0.2 : : 1.3 -0.3
2011 2.1 1.9 -1.4 -0.5 2.1 -0.6 0.2 -8.0 -0.7 -1.9 -0.6 -0.5 -7.2 4.0 -10.1 : : 0.7 1.42012 2.2 -0.8 -1.3 -0.2 0.6 -4.9 -0.2 0.2 1.9 -0.2 -0.2 0.0 0.4 0.1 3.4 : : 0.2 0.72013 8.1 -3.0 0.2 0.0 3.7 2.9 2.1 1.5 0.5 -0.1 0.3 0.3 0.3 -0.4 4.0 : : 0.5 0.22014 3.6 1.1 0.1 1.5 2.3 2.5 2.4 2.4 2.1 0.2 0.7 0.6 2.0 0.0 -0.7 : : 0.7 -1.42015 1.7 0.6 0.3 0.6 2.7 0.6 2.5 1.2 1.4 0.8 0.7 0.7 1.1 0.5 0.8 : : 1.0 -0.7
1) Weighted in common currency 2) Weighted in common currency; Former EU-15; 1961-91 including D_W
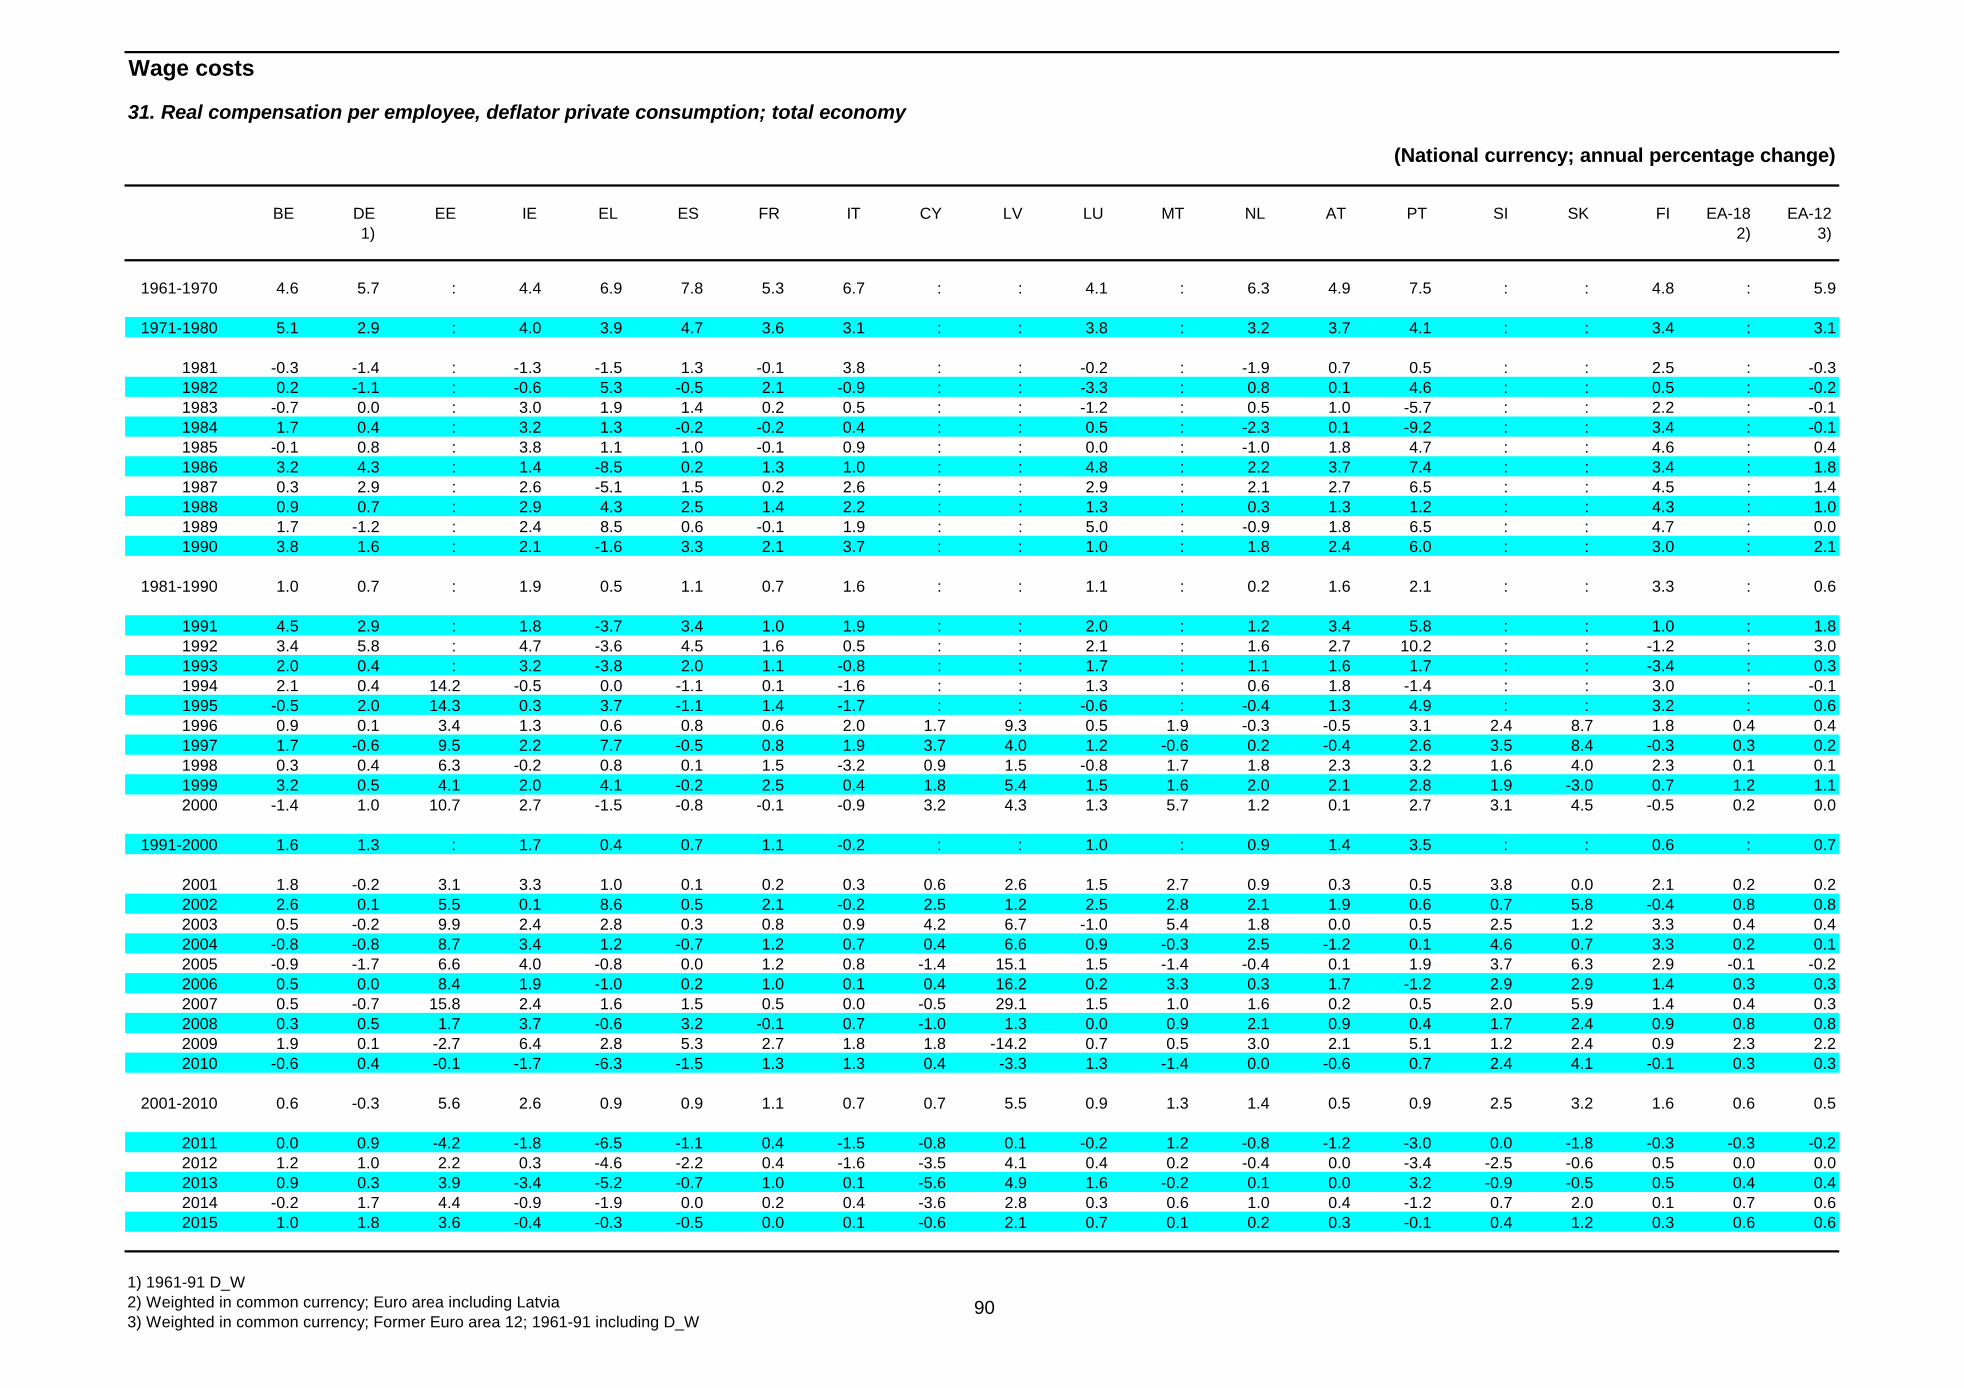
90
Wage costs
31. Real compensation per employee, deflator private consumption; total economy
(National currency; annual percentage change)
BE DE EE IE EL ES FR IT CY LV LU MT NL AT PT SI SK FI EA-18 EA-12 1) 2) 3)
1961-1970 4.6 5.7 : 4.4 6.9 7.8 5.3 6.7 : : 4.1 : 6.3 4.9 7.5 : : 4.8 : 5.9
1971-1980 5.1 2.9 : 4.0 3.9 4.7 3.6 3.1 : : 3.8 : 3.2 3.7 4.1 : : 3.4 : 3.1
1981 -0.3 -1.4 : -1.3 -1.5 1.3 -0.1 3.8 : : -0.2 : -1.9 0.7 0.5 : : 2.5 : -0.31982 0.2 -1.1 : -0.6 5.3 -0.5 2.1 -0.9 : : -3.3 : 0.8 0.1 4.6 : : 0.5 : -0.21983 -0.7 0.0 : 3.0 1.9 1.4 0.2 0.5 : : -1.2 : 0.5 1.0 -5.7 : : 2.2 : -0.11984 1.7 0.4 : 3.2 1.3 -0.2 -0.2 0.4 : : 0.5 : -2.3 0.1 -9.2 : : 3.4 : -0.11985 -0.1 0.8 : 3.8 1.1 1.0 -0.1 0.9 : : 0.0 : -1.0 1.8 4.7 : : 4.6 : 0.41986 3.2 4.3 : 1.4 -8.5 0.2 1.3 1.0 : : 4.8 : 2.2 3.7 7.4 : : 3.4 : 1.81987 0.3 2.9 : 2.6 -5.1 1.5 0.2 2.6 : : 2.9 : 2.1 2.7 6.5 : : 4.5 : 1.41988 0.9 0.7 : 2.9 4.3 2.5 1.4 2.2 : : 1.3 : 0.3 1.3 1.2 : : 4.3 : 1.01989 1.7 -1.2 : 2.4 8.5 0.6 -0.1 1.9 : : 5.0 : -0.9 1.8 6.5 : : 4.7 : 0.01990 3.8 1.6 : 2.1 -1.6 3.3 2.1 3.7 : : 1.0 : 1.8 2.4 6.0 : : 3.0 : 2.1
1981-1990 1.0 0.7 : 1.9 0.5 1.1 0.7 1.6 : : 1.1 : 0.2 1.6 2.1 : : 3.3 : 0.6
1991 4.5 2.9 : 1.8 -3.7 3.4 1.0 1.9 : : 2.0 : 1.2 3.4 5.8 : : 1.0 : 1.81992 3.4 5.8 : 4.7 -3.6 4.5 1.6 0.5 : : 2.1 : 1.6 2.7 10.2 : : -1.2 : 3.01993 2.0 0.4 : 3.2 -3.8 2.0 1.1 -0.8 : : 1.7 : 1.1 1.6 1.7 : : -3.4 : 0.31994 2.1 0.4 14.2 -0.5 0.0 -1.1 0.1 -1.6 : : 1.3 : 0.6 1.8 -1.4 : : 3.0 : -0.11995 -0.5 2.0 14.3 0.3 3.7 -1.1 1.4 -1.7 : : -0.6 : -0.4 1.3 4.9 : : 3.2 : 0.61996 0.9 0.1 3.4 1.3 0.6 0.8 0.6 2.0 1.7 9.3 0.5 1.9 -0.3 -0.5 3.1 2.4 8.7 1.8 0.4 0.41997 1.7 -0.6 9.5 2.2 7.7 -0.5 0.8 1.9 3.7 4.0 1.2 -0.6 0.2 -0.4 2.6 3.5 8.4 -0.3 0.3 0.21998 0.3 0.4 6.3 -0.2 0.8 0.1 1.5 -3.2 0.9 1.5 -0.8 1.7 1.8 2.3 3.2 1.6 4.0 2.3 0.1 0.11999 3.2 0.5 4.1 2.0 4.1 -0.2 2.5 0.4 1.8 5.4 1.5 1.6 2.0 2.1 2.8 1.9 -3.0 0.7 1.2 1.12000 -1.4 1.0 10.7 2.7 -1.5 -0.8 -0.1 -0.9 3.2 4.3 1.3 5.7 1.2 0.1 2.7 3.1 4.5 -0.5 0.2 0.0
1991-2000 1.6 1.3 : 1.7 0.4 0.7 1.1 -0.2 : : 1.0 : 0.9 1.4 3.5 : : 0.6 : 0.7
2001 1.8 -0.2 3.1 3.3 1.0 0.1 0.2 0.3 0.6 2.6 1.5 2.7 0.9 0.3 0.5 3.8 0.0 2.1 0.2 0.22002 2.6 0.1 5.5 0.1 8.6 0.5 2.1 -0.2 2.5 1.2 2.5 2.8 2.1 1.9 0.6 0.7 5.8 -0.4 0.8 0.82003 0.5 -0.2 9.9 2.4 2.8 0.3 0.8 0.9 4.2 6.7 -1.0 5.4 1.8 0.0 0.5 2.5 1.2 3.3 0.4 0.42004 -0.8 -0.8 8.7 3.4 1.2 -0.7 1.2 0.7 0.4 6.6 0.9 -0.3 2.5 -1.2 0.1 4.6 0.7 3.3 0.2 0.12005 -0.9 -1.7 6.6 4.0 -0.8 0.0 1.2 0.8 -1.4 15.1 1.5 -1.4 -0.4 0.1 1.9 3.7 6.3 2.9 -0.1 -0.22006 0.5 0.0 8.4 1.9 -1.0 0.2 1.0 0.1 0.4 16.2 0.2 3.3 0.3 1.7 -1.2 2.9 2.9 1.4 0.3 0.32007 0.5 -0.7 15.8 2.4 1.6 1.5 0.5 0.0 -0.5 29.1 1.5 1.0 1.6 0.2 0.5 2.0 5.9 1.4 0.4 0.32008 0.3 0.5 1.7 3.7 -0.6 3.2 -0.1 0.7 -1.0 1.3 0.0 0.9 2.1 0.9 0.4 1.7 2.4 0.9 0.8 0.82009 1.9 0.1 -2.7 6.4 2.8 5.3 2.7 1.8 1.8 -14.2 0.7 0.5 3.0 2.1 5.1 1.2 2.4 0.9 2.3 2.22010 -0.6 0.4 -0.1 -1.7 -6.3 -1.5 1.3 1.3 0.4 -3.3 1.3 -1.4 0.0 -0.6 0.7 2.4 4.1 -0.1 0.3 0.3
2001-2010 0.6 -0.3 5.6 2.6 0.9 0.9 1.1 0.7 0.7 5.5 0.9 1.3 1.4 0.5 0.9 2.5 3.2 1.6 0.6 0.5
2011 0.0 0.9 -4.2 -1.8 -6.5 -1.1 0.4 -1.5 -0.8 0.1 -0.2 1.2 -0.8 -1.2 -3.0 0.0 -1.8 -0.3 -0.3 -0.22012 1.2 1.0 2.2 0.3 -4.6 -2.2 0.4 -1.6 -3.5 4.1 0.4 0.2 -0.4 0.0 -3.4 -2.5 -0.6 0.5 0.0 0.02013 0.9 0.3 3.9 -3.4 -5.2 -0.7 1.0 0.1 -5.6 4.9 1.6 -0.2 0.1 0.0 3.2 -0.9 -0.5 0.5 0.4 0.42014 -0.2 1.7 4.4 -0.9 -1.9 0.0 0.2 0.4 -3.6 2.8 0.3 0.6 1.0 0.4 -1.2 0.7 2.0 0.1 0.7 0.62015 1.0 1.8 3.6 -0.4 -0.3 -0.5 0.0 0.1 -0.6 2.1 0.7 0.1 0.2 0.3 -0.1 0.4 1.2 0.3 0.6 0.6
1) 1961-91 D_W2) Weighted in common currency; Euro area including Latvia3) Weighted in common currency; Former Euro area 12; 1961-91 including D_W

91
Wage costs
31. Real compensation per employee, deflator private consumption; total economy
(National currency; annual percentage change)
BG CZ DK HR LT HU PL RO SE UK EU-28 EU-15 MK IS TR ME RS US JP 1) 2)
1961-1970 : : 5.0 : : : : : 4.3 2.8 : 5.1 : : : : : 2.7 7.5
1971-1980 : : 2.2 : : : : : 1.6 2.4 : 3.0 : : : : : 0.8 3.9
1981 : : -2.0 : : : : : -0.8 1.8 : 0.1 : : : : : 0.5 1.61982 : : 1.9 : : : : : -3.7 0.1 : -0.3 : : : : : 2.1 1.21983 : : 2.2 : : : : : -2.8 2.7 : 0.3 : : : : : 1.3 0.21984 : : -0.8 : : : : : 0.8 0.6 : 0.0 : : : : : 0.9 1.61985 : : 1.3 : : : : : 0.7 2.2 : 0.8 : : : : : 1.3 1.31986 : : 3.8 : : : : : 3.5 3.7 : 2.3 : : : : : 2.4 2.81987 : : 4.0 : : : : : 1.6 1.7 : 1.5 : : : : : 0.8 3.01988 : : 1.4 : : : : : 1.3 2.4 : 1.2 : : : : : 1.2 3.61989 : : -0.6 : : : : : 4.3 3.2 : 0.7 : : 9.3 : : -0.5 2.71990 : : 2.5 : : : : : 1.2 2.2 : 2.1 : : 19.0 : : 0.9 2.6
1981-1990 : : 1.3 : : : : : 0.6 2.1 : 0.9 : : : : : 1.1 2.0
1991 : : 1.2 : : : : -19.6 -3.3 1.6 : 1.7 : : 15.3 : : 1.5 2.11992 : : 3.1 : : : 8.5 -5.8 1.6 1.7 : 2.7 : : -1.3 : : 3.4 -0.41993 : : 1.2 : : : 0.0 -8.0 -2.4 1.4 : 0.4 : : 5.5 : : -0.3 -0.31994 : 9.3 -1.4 : : : 2.5 -3.8 3.2 -1.5 : -0.3 : : -26.3 : : 0.1 0.91995 : 3.8 1.9 : : : 5.4 12.8 -0.3 0.5 : 0.6 : : -13.2 : : -0.1 1.81996 -15.3 8.3 2.7 : 12.6 -1.6 7.1 6.3 6.3 0.7 : 0.6 : : 15.2 : : 1.0 0.91997 -15.9 1.4 1.1 29.3 12.6 3.6 5.1 -10.3 3.3 2.6 0.6 0.6 : : 10.8 : : 2.1 -0.21998 31.8 0.2 2.6 -0.4 9.2 0.7 3.1 21.7 2.1 4.6 1.3 0.9 2.2 : -4.8 : : 4.6 -0.91999 4.0 4.1 2.0 3.5 3.9 -2.5 7.2 3.5 -0.1 3.8 2.6 1.5 6.5 : 13.9 : : 2.8 -0.22000 5.6 4.3 0.8 1.2 1.0 3.4 0.7 23.6 6.3 4.9 1.7 1.1 -3.4 : -6.4 : : 3.3 1.0
1991-2000 : : 1.5 : : : : 1.2 1.6 2.0 : 1.0 : : -0.1 : : 1.8 0.5
2001 7.5 4.5 1.8 -3.0 4.6 5.3 6.2 15.2 2.1 4.3 1.6 1.1 -5.2 -0.3 -4.1 : : 1.0 -0.12002 1.4 6.4 2.0 7.3 5.4 7.4 -1.0 -3.0 1.3 1.9 1.0 1.0 2.3 3.8 -0.5 : : 1.2 -0.72003 3.4 8.1 2.4 4.4 10.6 5.4 1.2 10.0 1.5 3.3 1.3 1.0 0.6 0.7 3.7 : : 2.1 -1.42004 2.7 4.4 2.1 2.1 11.1 4.4 -1.0 0.9 3.2 2.2 0.4 0.6 -1.4 7.1 5.1 : : 2.4 -0.12005 2.3 2.9 2.1 2.1 9.0 3.4 -0.4 20.8 2.0 1.1 0.3 0.2 -3.9 6.9 -1.1 : : 0.4 0.32006 4.0 4.5 1.5 -0.1 11.4 2.0 0.7 7.2 0.8 2.6 0.6 0.8 9.3 4.4 0.9 : : 1.3 -0.72007 3.4 3.2 2.3 5.1 7.5 -1.3 2.4 16.5 3.8 2.1 0.8 0.8 -8.0 5.0 2.7 : : 1.6 -0.32008 9.0 -0.6 0.8 -1.1 3.1 1.9 4.1 19.9 -1.5 -1.5 0.3 0.3 -0.8 -9.9 -2.9 : : -0.2 -0.82009 6.5 -1.4 1.7 -2.2 -13.8 -5.4 1.1 -5.4 -0.5 0.5 1.6 1.8 7.1 -16.0 -0.3 : : 1.7 -0.92010 7.3 3.3 0.8 0.3 5.9 -4.2 5.6 -10.2 1.6 -0.8 0.5 0.1 5.0 3.6 -1.3 : : 1.4 2.1
2001-2010 4.7 3.5 1.8 1.4 5.2 1.8 1.8 6.7 1.4 1.6 0.8 0.8 0.3 0.3 0.2 : : 1.3 -0.3
2011 2.1 1.9 -1.4 -0.5 2.1 -0.6 0.2 -8.0 -0.7 -1.9 -0.6 -0.5 -7.2 4.0 -10.1 : : 0.7 1.42012 2.2 -0.8 -1.3 -0.2 0.6 -4.9 -0.2 0.2 1.9 -0.2 -0.2 0.0 0.4 0.1 3.4 : : 0.2 0.72013 8.1 -3.0 0.2 0.0 3.7 2.9 2.1 1.5 0.5 -0.1 0.3 0.3 0.3 -0.4 4.0 : : 0.5 0.22014 3.6 1.1 0.1 1.5 2.3 2.5 2.4 2.4 2.1 0.2 0.7 0.6 2.0 0.0 -0.7 : : 0.7 -1.42015 1.7 0.6 0.3 0.6 2.7 0.6 2.5 1.2 1.4 0.8 0.7 0.7 1.1 0.5 0.8 : : 1.0 -0.7
1) Weighted in common currency 2) Weighted in common currency; Former EU-15; 1961-91 including D_W

92
Wage costs
32. Adjusted wage share; total economy; as percentage of GDP at current factor cost 1)
BE DE EE IE EL ES FR IT CY LV LU MT NL AT PT SI SK FI EA-18 EA-12 2) 3) 4)
1960-1970 63.6 67.8 : 76.9 83.0 70.5 73.9 72.6 : : 51.4 : 67.8 76.1 71.1 : : 75.0 : 70.9
1971-1980 70.3 70.4 : 74.9 66.9 72.4 74.3 72.3 : : 58.4 : 73.9 76.5 80.3 : : 72.8 : 72.4
1981 73.9 70.6 : 75.1 69.6 73.0 76.7 71.5 : : 63.9 : 71.8 76.5 70.3 : : 72.4 : 72.91982 72.7 69.8 : 73.6 70.3 71.6 76.5 71.0 : : 61.3 : 71.8 74.0 72.9 : : 71.4 : 72.31983 72.0 68.3 : 73.9 72.6 71.9 75.5 71.3 : : 60.5 : 70.5 72.0 67.2 : : 70.7 : 71.41984 71.2 67.6 : 72.0 70.6 69.2 74.4 69.6 : : 59.2 : 67.2 72.6 59.9 : : 70.8 : 70.11985 70.6 66.9 : 69.6 70.8 67.7 73.4 68.9 : : 59.1 : 67.4 72.3 61.0 : : 72.1 : 69.51986 70.2 66.6 : 69.7 67.3 66.2 71.1 67.5 : : 57.7 : 68.5 71.9 62.1 : : 72.0 : 68.41987 69.9 67.5 : 69.0 67.1 66.2 70.6 67.3 : : 59.2 : 70.2 71.7 62.4 : : 72.5 : 68.61988 68.0 66.5 : 68.0 67.3 65.6 69.0 66.9 : : 56.7 : 69.2 71.2 61.1 : : 71.4 : 67.61989 67.6 65.3 : 66.4 69.2 65.3 67.7 66.5 : : 55.9 : 67.2 70.5 62.2 : : 71.0 : 66.61990 68.7 65.0 : 65.7 69.8 66.8 68.2 67.7 : : 56.6 : 67.4 70.4 61.5 : : 72.3 : 67.0
1981-1990 70.5 67.4 : 70.3 69.4 68.3 72.3 68.8 : : 59.0 : 69.1 72.3 64.1 : : 71.7 : 69.4
1991 65.5 67.5
1991 70.6 67.0 : 65.8 65.0 67.8 68.2 68.3 : : 56.1 : 67.8 70.7 64.4 : : 75.7 : 67.91992 70.8 68.0 : 67.6 64.1 69.6 67.8 68.1 : 40.0 58.2 : 68.9 71.3 67.6 : : 73.4 : 68.41993 71.7 68.1 59.4 66.2 62.3 69.1 67.9 67.3 : 63.5 57.6 : 69.7 71.9 67.3 : : 68.5 : 68.31994 71.1 66.9 66.1 65.8 62.0 67.3 67.3 65.1 : 68.6 56.9 : 68.1 71.7 65.1 : : 66.5 : 67.01995 70.2 66.7 64.0 62.5 63.2 65.9 67.3 63.2 64.6 59.1 57.1 59.9 67.6 69.9 65.9 79.0 48.0 64.3 66.4 66.51996 70.7 66.3 61.3 61.3 62.8 66.0 67.6 63.2 64.9 61.7 56.9 59.0 67.2 69.2 66.9 76.6 49.9 65.4 66.3 66.31997 70.5 65.5 60.1 59.2 64.6 66.0 67.1 63.8 65.4 62.6 58.5 58.0 66.4 68.7 66.9 73.9 51.4 64.1 65.9 65.91998 70.0 65.3 58.4 57.6 64.5 65.8 66.3 63.0 63.2 59.7 58.4 57.2 66.9 68.0 66.8 72.9 51.9 62.6 65.4 65.51999 70.9 65.9 56.5 56.0 65.5 65.7 66.8 62.5 62.5 59.1 56.2 57.0 66.8 67.9 66.2 72.1 50.1 62.6 65.7 65.72000 69.8 66.8 55.9 54.3 63.2 65.4 66.3 61.6 62.8 55.4 56.9 55.1 65.9 66.8 67.0 72.9 50.3 60.9 65.5 65.5
1991-2000 70.6 66.6 : 61.6 63.7 66.9 67.3 64.6 : : 57.3 : 67.5 69.6 66.4 : : 66.4 : 66.7
2001 70.9 66.3 54.6 53.6 61.3 64.6 66.2 61.2 61.9 53.3 60.1 57.9 66.2 66.1 67.1 73.0 48.7 61.0 65.1 65.22002 71.2 65.8 54.4 51.7 64.6 63.8 66.7 61.3 64.5 50.7 59.9 57.3 66.6 65.4 67.1 72.1 49.2 61.0 65.1 65.12003 70.4 65.9 54.7 52.2 62.6 63.1 66.7 61.7 69.5 51.8 57.0 58.2 66.9 65.3 68.0 71.3 48.8 62.3 65.0 65.12004 68.8 64.7 55.5 53.7 61.9 62.5 66.5 61.5 69.4 51.4 57.2 60.2 66.7 63.9 66.7 71.5 47.2 61.8 64.4 64.42005 67.9 63.7 54.3 55.0 62.2 62.3 66.7 62.0 68.8 54.0 55.8 58.8 65.0 63.2 68.0 71.2 48.3 62.9 64.1 64.12006 67.6 62.2 54.9 55.7 60.7 61.8 66.4 62.7 67.6 56.7 52.6 59.2 64.5 62.5 67.2 70.0 47.1 62.5 63.4 63.52007 67.1 61.2 57.6 57.1 60.4 61.6 65.6 62.1 67.0 59.7 51.5 58.3 64.3 62.0 65.9 68.6 46.8 60.7 62.8 62.82008 68.3 62.1 61.7 62.0 60.4 62.4 65.9 62.7 64.6 62.4 56.0 57.8 64.7 63.2 66.9 69.7 47.0 62.7 63.5 63.62009 70.0 65.1 64.1 61.9 61.9 62.5 67.8 63.5 65.5 57.9 60.5 60.0 67.4 65.6 67.2 72.6 50.3 67.7 65.4 65.52010 68.3 63.4 60.0 58.8 61.9 62.4 67.5 63.6 64.8 52.9 56.9 56.9 66.6 64.8 66.2 73.8 49.5 66.3 64.6 64.7
2001-2010 69.1 64.0 57.2 56.2 61.8 62.7 66.6 62.2 66.4 55.1 56.8 58.5 65.9 64.2 67.0 71.4 48.3 62.9 64.3 64.4
2011 68.6 63.5 57.2 55.9 60.3 61.5 67.9 63.5 64.5 50.8 56.6 57.8 66.3 64.0 65.7 73.1 49.4 66.5 64.5 64.62012 70.2 64.6 57.9 55.6 57.1 60.1 68.5 64.5 61.9 50.8 57.8 58.7 67.3 64.9 63.9 73.8 48.9 67.7 65.1 65.22013 70.5 64.4 59.1 56.0 54.6 59.1 68.6 63.9 58.5 52.2 57.5 58.4 67.9 65.3 63.9 73.2 48.4 68.3 65.0 65.12014 69.0 64.3 60.0 56.0 53.4 58.7 68.3 64.1 56.8 52.4 56.7 58.1 67.6 64.7 62.8 73.2 48.5 68.0 64.7 64.92015 69.0 64.2 60.3 55.3 53.1 58.0 68.0 63.7 56.4 52.2 56.9 57.9 67.7 64.4 62.7 72.6 48.2 67.9 64.5 64.6
1) Compensation per employee as percentage of GDP at factor cost per person employed. 2) 1960-91 D_W 3) Euro area; 1960-91 including D_W 4) Former Euro area 12; 1960-91 including D_W

93
Wage costs
32. Adjusted wage share; total economy; as percentage of GDP at current factor cost 1)
BG CZ DK HR LT HU PL RO SE UK EU-28 EU-15 MK IS TR ME RS US JP 2) 3)
1960-1970 : : 67.0 : : : : : 72.2 72.6 : 71.3 : : : : : 67.2 73.8
1971-1980 : : 70.8 : : : : : 74.0 73.9 : 72.7 : : : : : 66.8 77.7
1981 : : 71.8 : : : : : 72.7 74.8 : 73.2 : : : : : 65.7 78.01982 : : 70.1 : : : : : 70.0 73.0 : 72.3 : : : : : 66.6 77.71983 : : 69.5 : : : : : 68.3 71.4 : 71.3 : : : : : 65.2 77.31984 : : 68.0 : : : : : 66.8 72.0 : 70.3 : : : : : 64.5 76.11985 : : 67.9 : : : : : 67.2 71.2 : 69.6 : : : : : 64.4 73.41986 : : 68.8 : : : : : 67.7 72.1 : 68.9 : : : : : 64.8 72.61987 : : 71.0 : : : : : 68.0 71.3 : 69.0 : : : : : 65.3 72.91988 : : 71.3 : : : : : 67.4 71.5 : 68.3 : : 43.2 : : 65.7 71.51989 : : 69.4 : : : : : 68.6 72.7 : 67.8 : : 50.5 : : 64.9 70.41990 : : 68.5 : : : : 78.8 70.5 73.6 : 68.3 : : 57.1 : : 65.4 70.0
1981-1990 : : 69.6 : : : : : 68.7 72.4 : 69.9 : : : : : 65.3 74.0
1991 68.9
1991 : : 67.9 : : : : 71.2 70.7 74.9 : 69.1 : : 68.9 : : 65.8 70.21992 : : 67.0 : : : 69.9 68.5 69.4 74.4 : 69.3 : : 65.3 : : 65.8 70.61993 : 49.9 67.4 : 41.7 : 68.3 66.0 67.3 72.2 : 68.8 : : 60.4 : : 65.2 70.81994 : 51.7 65.0 : 46.4 : 66.0 61.7 66.0 68.7 : 67.2 : : 50.9 : : 64.5 71.31995 63.1 50.8 65.2 : 51.4 65.9 65.3 62.7 63.9 68.2 : 66.6 : : 44.3 : : 64.2 71.81996 62.1 52.2 65.7 66.0 54.8 64.9 67.2 64.0 67.0 66.6 66.3 66.4 : : 46.5 : : 63.8 71.11997 52.8 53.0 65.6 67.8 57.9 63.2 67.1 58.4 67.0 66.7 65.9 66.0 66.5 : 48.6 : : 63.9 70.91998 62.6 51.4 67.7 72.3 59.8 62.3 65.9 72.3 67.6 68.2 66.0 66.1 67.2 : 47.7 : : 64.9 71.11999 60.1 51.5 67.9 74.6 61.5 61.6 65.4 70.1 67.2 69.3 66.3 66.5 66.6 : 56.9 : : 64.8 70.62000 58.0 52.1 65.7 73.8 55.3 63.0 63.1 80.4 68.4 70.4 66.4 66.6 62.5 80.1 51.7 : : 65.7 69.6
1991-2000 : : 66.5 : : : : 67.5 67.4 70.0 : 67.3 : : 54.1 : : 64.9 70.8
2001 58.8 52.0 67.1 69.8 53.4 61.9 64.9 84.4 70.3 71.1 66.4 66.6 63.2 75.5 51.6 : : 65.6 68.92002 56.5 54.0 67.8 70.8 54.4 61.6 62.6 68.6 69.8 70.2 66.1 66.3 64.9 76.5 49.2 : : 64.6 67.52003 57.3 55.2 68.2 71.4 54.9 62.6 60.3 67.9 68.8 69.7 65.9 66.1 61.4 76.5 48.5 : : 64.0 65.92004 57.4 55.2 67.1 69.1 54.7 62.1 56.1 60.2 67.9 69.4 65.2 65.5 55.0 77.0 42.8 : : 63.6 65.22005 56.7 54.9 67.0 67.9 54.2 61.8 55.3 66.4 67.4 68.7 64.8 65.2 51.3 79.5 40.5 : : 62.6 65.62006 55.2 54.6 67.2 66.8 56.1 60.4 54.3 62.7 65.9 69.0 64.3 64.7 53.8 83.1 39.0 : : 62.7 64.92007 54.5 54.4 68.8 66.7 55.4 61.5 53.6 63.8 66.9 68.8 63.9 64.3 47.1 84.3 : : : 63.0 63.72008 56.9 55.1 69.5 66.4 56.0 61.0 55.7 67.7 68.0 68.5 64.3 64.7 47.8 74.5 : : : 63.2 64.52009 59.5 55.0 72.4 68.3 56.8 61.0 54.2 66.0 70.1 70.8 66.1 66.6 52.2 64.7 : : : 62.3 65.12010 60.7 55.8 69.1 67.4 51.8 59.5 54.7 61.9 67.3 70.7 65.4 65.9 52.9 67.7 : : : 61.3 63.6
2001-2010 57.3 54.6 68.4 68.4 54.8 61.3 57.2 67.0 68.2 69.7 65.2 65.6 55.0 75.9 : : : 63.3 65.5
2011 59.1 56.7 68.7 65.9 49.5 58.9 53.8 56.1 67.1 70.6 65.2 65.8 49.7 69.1 : : : 61.2 65.62012 60.0 57.9 68.1 66.2 48.9 59.3 52.9 56.3 68.3 71.8 65.9 66.5 52.2 71.1 : : : 60.8 65.12013 63.3 57.1 67.9 66.8 49.5 60.1 52.9 55.1 68.4 71.8 65.8 66.4 54.1 72.0 : : : 60.3 64.92014 64.1 56.3 67.3 66.9 49.3 59.9 52.8 55.4 68.5 71.3 65.5 66.2 55.5 73.2 : : : 60.2 64.52015 64.3 55.5 66.8 66.5 49.1 59.3 52.8 55.3 68.2 70.7 65.2 65.9 56.5 73.6 : : : 59.9 64.0
1) Compensation per employee as percentage of GDP at factor cost per person employed. 2) 1960-91 including D_W 3) Former EU-15; 1960-91 including D_W

94
Wage costs
33. Nominal unit labour costs; total economy 1)
(National currency; 2005 = 100)
BE DE EE IE EL ES FR IT CY LV LU NL MT AT PT SI SK FI EA-18 EA-12 2) 3) 4)
1960 17.0 27.0 : 6.8 1.7 3.2 12.5 4.3 : : 15.9 16.6 : 23.4 1.9 : : 9.7 : 11.6
1965 19.7 33.1 : 8.4 1.6 4.6 15.5 5.7 : : 18.9 23.1 : 28.8 2.2 : : 13.0 : 14.5
1970 23.6 40.5 : 11.4 1.7 6.3 19.1 6.5 : : 22.8 31.1 : 32.3 3.0 : : 16.0 : 17.9
1975 40.6 57.6 : 22.0 2.8 11.7 30.9 12.7 : : 40.4 51.4 : 50.2 6.5 : : 31.3 : 29.1
1980 54.9 69.5 : 43.4 6.3 26.8 50.0 26.9 : : 54.6 67.3 : 63.9 12.0 : : 45.9 : 44.9
1981 57.9 72.4 : 49.2 8.1 30.2 56.1 32.7 : : 59.6 69.5 : 68.7 14.4 : : 52.3 : 49.61982 60.9 74.9 : 54.9 10.3 33.6 62.6 38.0 : : 62.9 72.7 : 70.3 17.0 : : 56.3 : 54.21983 63.7 75.4 : 60.9 12.8 37.5 67.8 43.8 : : 65.1 72.3 : 70.7 19.8 : : 60.3 : 57.91984 66.7 76.1 : 63.4 15.1 39.7 71.6 47.5 : : 66.1 70.5 : 74.3 22.7 : : 65.0 : 60.61985 69.2 77.2 : 65.4 18.3 41.9 74.4 51.3 : : 67.6 71.3 : 76.5 27.4 : : 69.5 : 63.21986 70.8 79.4 : 69.0 20.4 45.5 76.2 54.0 : : 66.1 72.2 : 79.1 31.2 : : 72.4 : 65.71987 71.0 81.6 : 69.8 23.2 48.3 77.3 56.8 : : 67.8 73.2 : 81.0 34.4 : : 75.8 : 67.91988 70.6 81.8 : 71.7 27.2 51.1 77.8 59.6 : : 66.8 72.6 : 81.3 37.7 : : 79.3 : 69.31989 73.2 82.3 : 71.7 32.4 54.3 79.1 62.7 : : 68.2 71.6 : 82.9 42.7 : : 84.0 : 71.31990 76.5 84.4 : 72.4 38.7 59.7 81.7 68.5 : : 70.7 72.8 : 85.4 47.2 : : 91.0 : 75.0
1991 81.0 87.4 : 74.0 42.5 64.9 84.0 74.1 : : 71.3 75.5 73.4 89.1 54.7 : : 97.1 : 79.01992 83.9 93.3 : 77.5 47.8 70.5 85.5 77.1 : 17.1 76.7 78.7 75.8 93.0 62.0 : : 95.4 : 82.91993 88.0 96.8 28.7 80.8 53.7 74.3 87.0 78.7 : 42.8 79.2 80.3 80.6 96.3 65.6 : : 91.0 : 85.51994 88.7 97.2 44.1 80.5 59.5 74.9 86.4 78.8 : 61.7 81.4 80.4 81.6 97.9 67.3 : : 89.5 : 85.81995 88.9 99.2 56.4 78.5 66.5 77.0 87.3 79.8 74.1 60.7 83.5 80.7 86.3 98.3 72.0 59.4 59.2 91.1 87.0 87.41996 89.2 99.4 67.0 77.4 70.4 79.3 88.5 84.1 76.6 72.9 85.9 81.2 86.8 97.9 74.9 63.8 63.8 91.6 88.5 88.81997 89.4 98.2 72.0 77.1 76.9 80.8 88.5 86.4 79.5 78.5 85.8 82.3 85.7 97.4 77.8 67.1 70.7 90.6 89.0 89.21998 90.4 98.3 75.2 79.6 80.7 82.3 88.4 84.7 79.1 78.7 84.9 84.6 86.4 97.2 80.4 70.3 74.1 91.8 89.3 89.51999 91.7 98.9 78.2 80.2 83.4 83.9 89.3 85.8 80.3 80.7 85.5 86.0 86.3 97.2 82.3 73.5 77.0 92.5 90.3 90.42000 92.1 99.4 80.5 81.6 85.0 86.2 90.5 86.3 82.4 79.7 87.6 88.6 85.5 97.3 85.9 78.9 84.3 93.0 91.4 91.5
2001 96.0 99.8 83.7 86.5 84.7 89.0 92.6 88.8 84.0 78.4 93.4 93.0 91.5 98.3 89.2 86.0 86.5 96.4 93.4 93.52002 98.2 100.5 86.9 87.8 93.3 91.7 95.4 91.9 88.0 77.4 95.4 97.5 93.5 98.6 92.1 91.1 90.1 97.2 95.8 95.82003 99.2 101.4 91.2 91.8 94.7 94.4 97.2 95.9 96.5 81.4 96.6 100.2 98.1 99.8 95.6 95.2 93.7 97.9 97.9 98.02004 98.6 100.9 96.3 95.8 96.8 96.7 98.2 97.8 98.4 86.7 97.8 100.4 100.5 98.9 96.6 98.6 96.2 97.9 98.7 98.82005 100.0 100.0 100.0 100.0 100.0 100.0 100.0 100.0 100.0 100.0 100.0 100.0 100.0 100.0 100.0 100.0 100.0 100.0 100.0 100.02006 102.0 98.0 109.1 103.5 98.9 103.3 101.8 102.0 100.9 116.5 101.3 100.7 103.5 101.0 100.9 101.1 101.7 100.3 100.8 100.82007 104.2 97.2 128.0 108.7 101.4 107.6 103.5 103.6 102.1 148.6 102.9 102.4 105.0 101.6 102.1 103.7 102.2 100.9 102.2 102.12008 108.8 99.4 146.7 116.1 106.6 113.7 106.8 108.4 103.9 178.4 112.5 105.5 107.9 105.2 105.6 110.3 106.7 107.7 106.1 105.92009 113.0 105.0 148.8 113.1 113.2 115.5 110.8 113.4 108.2 164.3 122.4 111.1 114.4 110.5 108.9 119.8 112.8 117.3 110.7 110.52010 112.7 103.9 141.4 105.5 113.1 113.5 111.5 113.3 109.3 147.7 124.0 110.4 113.9 110.5 107.4 120.2 111.8 115.4 110.1 109.9
2011 115.7 105.0 138.8 101.3 111.0 112.4 112.9 114.4 112.0 149.5 128.3 111.7 117.4 111.6 106.5 119.4 112.7 117.6 110.9 110.72012 120.4 108.2 144.7 101.3 105.4 109.1 115.3 117.1 109.0 154.7 134.3 114.9 122.0 114.9 103.2 120.3 113.8 123.0 112.8 112.72013 122.3 110.4 155.8 102.3 98.1 107.4 116.6 118.7 102.7 160.2 138.0 117.1 123.7 117.7 105.3 119.3 112.8 125.7 114.1 114.02014 121.6 112.3 162.4 103.4 95.5 106.8 117.2 119.6 100.0 163.2 139.9 117.7 125.8 119.0 104.1 119.6 113.6 127.0 114.9 114.72015 123.4 114.1 168.7 103.2 95.3 106.3 117.9 120.2 100.8 166.7 142.8 118.9 128.1 120.3 104.4 120.2 113.8 128.2 115.8 115.7
1) Ratio of co employed. employed. 2) 1960-91 D 3) Weighted in common currency; Euro area 4) Weighted in common currency; Former Euro area 12; 1960-91 including D_W

95
Wage costs
33. Nominal unit labour costs; total economy 1)
(National currency; 2005 = 100)
BG CZ DK HR LT HU PL RO SE UK EU-28 EU-15 MK IS TR ME RS US JP 2) 3)
1960 : : 9.3 : : : : : 10.2 7.1 : 10.7 : : : : : 20.4 30.0
1965 : : 12.9 : : : : : 12.6 8.6 : 13.3 : : : : : 21.1 38.1
1970 : : 18.0 : : : : : 15.7 10.9 : 16.5 : : : : : 27.0 46.5
1975 : : 31.5 : : : : : 24.1 22.1 : 27.7 : : : : : 36.0 88.8
1980 : : 47.0 : : : : : 40.7 40.9 : 44.0 : : : : : 51.4 111.4
1981 : : 51.2 : : : : : 44.6 45.3 : 48.7 : : : : : 55.3 114.41982 : : 55.7 : : : : : 46.7 47.3 : 52.7 : : : : : 59.7 115.91983 : : 59.2 : : : : : 49.5 49.1 : 56.0 : : : : : 60.8 116.61984 : : 61.2 : : : : : 51.8 51.6 : 58.6 : : : : : 62.3 116.21985 : : 63.4 : : : : : 55.1 54.2 : 61.2 : : : : : 64.2 113.01986 : : 64.9 : : : : : 58.7 56.5 : 63.7 : : : : : 66.0 114.01987 : : 70.5 : : : : : 61.3 58.8 : 66.0 : : : : : 68.3 113.51988 : : 74.0 : : : : : 65.1 62.8 : 67.9 : : 0.1 : : 70.9 111.51989 : : 76.4 : : : : : 71.7 68.8 : 70.7 : : 0.1 : : 72.8 112.51990 : : 78.0 : : : : 0.0 79.9 75.4 : 75.1 : : 0.2 : : 76.0 114.0
1991 : : 79.6 : : : : 0.1 85.0 81.2 : 79.2 : : 0.4 : : 78.8 118.11992 : : 80.5 : : : 29.4 0.4 85.5 82.9 : 82.7 : : 0.7 : : 80.7 120.01993 : 48.1 81.2 : 22.8 : 36.5 1.1 85.6 82.4 : 84.8 : : 1.0 : : 81.9 121.21994 : 56.5 79.2 : 39.9 : 48.2 2.5 86.4 79.2 : 84.5 : : 1.8 : : 82.5 122.01995 3.0 60.9 80.3 : 63.5 38.6 61.0 3.4 86.7 80.3 : 85.9 : : 2.9 : : 83.9 121.81996 5.8 68.6 82.2 64.2 81.0 46.8 73.9 5.1 90.8 80.9 84.3 87.3 : : 5.4 : : 84.9 119.81997 54.8 75.9 83.2 70.6 92.8 55.5 84.3 10.8 91.5 82.2 86.3 87.9 101.8 : 10.1 : : 86.5 119.91998 82.2 81.2 86.1 80.7 98.7 62.0 92.6 19.1 91.5 85.6 87.7 88.8 104.8 : 17.5 : : 88.9 119.71999 82.1 83.0 87.9 86.5 100.1 65.8 96.8 27.5 90.4 88.4 89.2 90.0 106.0 : 32.0 : : 90.0 117.32000 83.3 85.2 88.4 88.4 92.0 73.3 101.2 45.4 95.1 90.5 90.9 91.3 106.7 83.4 42.6 : : 93.5 114.4
2001 90.0 89.4 92.3 87.0 88.8 81.3 107.8 65.8 100.0 93.9 93.6 93.7 109.6 87.7 64.6 : : 95.6 111.92002 91.3 94.9 95.3 91.8 90.4 88.3 105.4 65.7 100.5 95.1 95.6 95.8 113.0 93.9 83.2 : : 95.4 107.92003 92.8 97.9 97.4 96.6 91.3 93.4 101.9 79.5 100.7 96.7 97.7 97.8 116.3 93.7 100.1 : : 96.4 103.62004 94.7 100.8 97.8 98.1 94.3 97.3 99.7 81.9 99.8 98.7 98.6 98.8 105.7 95.3 99.0 : : 98.4 100.92005 100.0 100.0 100.0 100.0 100.0 100.0 100.0 100.0 100.0 100.0 100.0 100.0 100.0 100.0 100.0 : : 100.0 100.02006 103.1 100.4 102.2 102.2 110.2 102.0 99.0 104.9 99.5 103.4 101.3 101.2 109.7 112.9 105.5 : : 103.1 97.82007 112.7 103.0 107.1 106.7 117.4 108.4 101.6 120.9 103.7 105.5 103.1 102.8 102.6 122.2 112.0 : : 106.4 95.22008 126.9 106.5 113.6 112.6 129.6 113.1 108.9 148.6 106.9 108.8 107.3 106.6 113.2 125.2 122.3 : : 108.9 95.22009 142.5 108.9 120.2 120.0 127.7 116.3 111.4 152.9 111.6 115.6 112.2 111.6 125.2 120.0 135.0 : : 108.2 95.92010 150.0 108.5 119.6 118.6 118.8 115.6 113.0 149.2 109.0 117.5 111.9 111.3 130.9 133.6 140.6 : : 107.9 91.6
2011 153.8 109.0 119.6 118.3 119.6 118.3 114.3 138.8 109.2 119.1 112.7 112.2 126.2 140.9 135.0 : : 109.8 92.42012 160.7 112.6 121.4 119.6 121.9 121.3 116.1 145.7 112.4 122.2 114.9 114.3 131.3 148.3 152.2 : : 111.1 90.92013 168.4 112.5 122.8 121.9 125.3 126.1 117.3 148.5 113.1 124.1 116.3 115.7 136.0 153.2 166.8 : : 112.0 89.92014 172.0 112.8 123.7 122.7 127.0 128.5 118.2 153.4 114.4 125.3 117.2 116.6 140.3 156.1 178.8 : : 113.4 90.02015 174.9 113.3 124.5 123.1 129.6 130.9 120.1 157.3 115.7 127.0 118.3 117.6 142.9 159.7 192.2 : : 114.8 89.9
1) Ratio of compensation per employee to real GDP per person employed. 2) Weighted in common currency 3) Weighted in common currency; Former EU-15; 1960-91 including D_W

96
Wage costs
34. Real unit labour costs; total economy 1)
(2005 = 100)
BE DE EE IE EL ES FR IT CY LV LU NL MT AT PT SI SK FI EA-18 EA-12 2) 3) 4)
1960 94.2 106.2 : 139.2 154.0 111.8 111.5 120.0 : : 98.2 100.0 : 115.1 107.2 : : 122.3 : 118.1
1965 93.8 108.6 : 137.3 127.4 116.7 113.0 120.6 : : 104.0 108.4 : 114.9 108.7 : : 126.2 : 119.7
1970 93.4 110.4 : 138.0 116.1 116.3 111.0 117.1 : : 94.4 113.0 : 109.1 122.4 : : 114.3 : 118.7
1975 107.8 115.8 : 144.3 104.4 121.3 116.2 126.4 : : 122.4 119.8 : 118.1 147.8 : : 123.8 : 124.9
1980 111.5 115.1 : 143.6 108.2 121.0 116.1 121.2 : : 120.8 116.5 : 116.0 112.5 : : 115.2 : 121.9
1981 111.7 115.1 : 138.6 115.3 121.5 116.6 123.9 : : 123.1 113.1 : 116.8 114.8 : : 117.6 : 122.21982 109.4 113.9 : 134.3 115.6 119.1 116.0 122.6 : : 117.2 113.0 : 113.5 114.9 : : 115.8 : 120.61983 108.3 111.4 : 134.4 118.4 118.7 114.6 122.6 : : 113.6 111.0 : 110.3 105.8 : : 114.8 : 118.81984 107.6 110.3 : 131.6 114.8 113.4 113.0 120.2 : : 110.4 105.8 : 110.4 97.7 : : 114.1 : 116.31985 106.6 109.6 : 128.8 116.7 110.3 111.3 118.9 : : 109.7 105.9 : 110.5 97.5 : : 115.8 : 115.01986 106.1 109.4 : 128.6 109.8 107.9 108.4 116.4 : : 107.4 107.1 : 110.9 94.0 : : 115.2 : 113.11987 104.7 111.1 : 127.4 108.3 108.2 107.3 115.4 : : 110.1 109.7 : 110.9 94.5 : : 115.5 : 113.01988 101.9 109.5 : 126.4 108.7 108.1 104.5 113.6 : : 105.4 108.0 : 109.7 91.5 : : 112.2 : 110.71989 100.8 107.1 : 120.4 113.0 107.3 102.7 112.6 : : 103.6 105.0 : 108.5 93.5 : : 111.8 : 108.71990 102.4 106.2 : 121.9 111.9 110.1 103.3 113.5 : : 104.7 105.2 101.6 108.6 92.8 : : 114.9 : 108.9
1991 105.4 106.7 : 122.4 102.7 111.8 103.5 114.1 : : 103.7 105.8 103.0 109.3 97.0 : : 120.8 : 109.41992 105.5 108.1 : 124.6 100.5 113.8 103.3 113.7 : 78.4 107.5 107.6 102.8 110.3 100.8 : : 117.6 : 110.11993 106.5 107.8 108.9 123.5 98.8 114.8 103.4 111.7 : 119.0 104.8 108.1 106.3 111.1 101.3 : : 110.0 : 109.51994 105.1 105.6 119.9 121.0 98.5 111.3 101.5 108.1 : 125.9 104.0 106.0 103.9 110.2 97.4 : : 106.4 : 107.01995 104.1 105.6 116.7 114.8 100.2 109.1 101.3 104.4 99.4 107.6 104.2 104.3 104.9 108.7 98.6 111.6 100.5 103.7 105.8 105.81996 104.1 105.2 111.6 113.1 98.8 108.6 101.1 104.9 100.4 113.0 104.1 103.6 104.7 107.4 100.1 107.7 104.1 104.6 105.3 105.41997 103.5 103.6 108.9 108.7 101.1 108.1 100.3 105.0 101.7 114.0 106.0 102.3 102.4 107.0 100.1 104.3 108.6 101.5 104.2 104.21998 102.7 103.2 108.1 105.9 100.8 107.4 99.2 100.3 98.2 107.9 105.3 103.2 101.7 106.4 99.7 102.2 108.3 99.4 102.9 102.91999 103.8 103.6 105.3 102.7 101.1 106.7 99.9 99.8 97.1 108.4 100.7 103.0 99.9 106.2 98.8 100.2 104.8 99.2 102.8 102.92000 102.2 104.8 103.4 99.2 99.7 106.0 99.7 98.5 96.6 102.5 101.2 101.9 96.2 105.3 99.9 102.2 104.9 97.3 102.6 102.6
2001 104.4 104.1 101.0 99.2 96.3 105.0 100.0 98.5 94.7 98.9 107.7 101.8 100.5 104.4 100.2 102.5 102.6 97.9 102.2 102.22002 104.7 103.3 100.2 95.4 102.6 103.7 100.8 98.7 98.2 94.7 107.8 102.8 100.1 103.5 99.7 101.0 102.9 97.4 102.0 102.12003 103.8 103.1 101.1 96.2 100.2 102.4 100.7 100.0 102.8 96.0 103.1 103.3 101.8 103.6 100.5 99.9 101.6 98.9 101.9 101.92004 100.9 101.5 102.1 98.0 99.5 100.9 100.1 99.6 101.4 95.5 102.5 102.8 102.9 100.9 99.0 100.2 98.5 98.3 100.7 100.72005 100.0 100.0 100.0 100.0 100.0 100.0 100.0 100.0 100.0 100.0 100.0 100.0 100.0 100.0 100.0 100.0 100.0 100.0 100.0 100.02006 99.6 97.7 100.3 100.2 96.6 99.2 99.6 100.3 97.6 104.6 94.8 98.9 100.7 99.1 98.2 99.0 98.8 99.5 98.9 98.92007 99.5 95.4 105.4 103.4 95.9 100.0 98.7 99.5 94.6 110.9 92.9 98.8 99.2 97.8 96.6 97.4 98.1 97.1 97.9 97.92008 101.6 96.8 114.6 113.7 96.2 103.3 99.4 101.6 92.0 118.5 101.2 99.7 99.1 99.5 98.4 99.5 99.7 100.7 99.7 99.62009 104.3 101.0 116.1 115.1 99.9 104.8 102.4 104.0 95.7 110.5 109.2 104.8 102.2 102.9 100.5 104.7 106.6 108.1 103.0 102.92010 102.0 98.9 110.0 109.1 98.6 103.0 102.1 103.6 94.9 100.3 103.3 103.3 97.8 101.4 98.5 106.2 105.1 106.0 101.6 101.5
2011 102.7 98.7 104.8 104.1 95.8 101.9 102.0 103.2 95.1 95.7 102.5 103.3 98.7 100.4 97.4 104.2 104.2 105.2 101.2 101.12012 104.8 100.3 105.7 103.4 91.2 98.9 102.6 104.0 91.1 95.8 104.2 104.9 100.5 101.7 94.7 104.8 104.0 106.9 101.7 101.72013 105.2 100.1 108.5 104.0 86.8 96.8 102.6 103.9 87.1 97.8 103.2 105.5 99.8 102.4 95.0 102.9 102.5 107.1 101.5 101.52014 103.1 100.2 110.0 104.0 85.0 96.0 101.8 103.7 84.4 98.0 101.8 104.9 99.5 101.7 93.2 102.2 102.7 106.5 101.0 101.12015 103.2 100.2 110.5 102.8 84.4 94.8 101.2 102.9 83.8 97.4 103.1 104.7 99.0 101.1 92.7 101.4 102.0 106.0 100.6 100.7
1) Ratio of co son employe son employed. 2) 1960-91 D 3) Weighted in common currency; Euro area 4) Weighted in common currency; Former Euro area 12; 1960-91 including D_W

97
Wage costs
34. Real unit labour costs; total economy 1)
(2005 = 100)
BG CZ DK HR LT HU PL RO SE UK EU-28 EU-15 MK IS TR ME RS US JP 2) 3)
1960 : : 99.5 : : : : : 110.2 106.3 : 115.3 : : : : : 108.2 121.5
1965 : : 104.3 : : : : : 112.0 107.3 : 115.7 : : : : : 104.0 116.9
1970 : : 105.8 : : : : : 112.0 108.0 : 115.0 : : : : : 108.9 108.0
1975 : : 110.5 : : : : : 111.8 117.7 : 121.6 : : : : : 105.4 127.0
1980 : : 109.5 : : : : : 114.1 108.7 : 118.4 : : : : : 106.4 121.9
1981 : : 108.0 : : : : : 114.1 108.4 : 118.6 : : : : : 104.8 121.41982 : : 106.7 : : : : : 110.5 105.4 : 116.7 : : : : : 106.5 121.11983 : : 105.5 : : : : : 106.6 103.8 : 114.8 : : : : : 104.4 120.71984 : : 103.0 : : : : : 103.6 104.4 : 112.9 : : : : : 103.2 118.21985 : : 102.2 : : : : : 103.6 103.6 : 111.8 : : : : : 103.0 113.81986 : : 101.9 : : : : : 103.8 104.3 : 110.5 : : : : : 103.8 112.81987 : : 105.7 : : : : : 103.5 103.1 : 110.3 : : : : : 104.8 112.41988 : : 106.8 : : : : : 103.2 103.4 : 108.7 : : 117.0 : : 105.2 110.11989 : : 105.0 : : : : : 105.2 105.5 : 107.6 : : 137.1 : : 103.9 108.61990 : : 104.3 : : : : 133.3 107.1 107.2 : 108.2 : : 153.4 : : 104.5 107.7
1991 : : 103.6 : : : : 117.4 105.3 108.2 : 108.6 : : 184.4 : : 104.9 108.81992 : : 103.1 : : : 129.7 119.8 104.9 107.4 : 109.0 : : 175.2 : : 105.0 108.81993 : 89.5 103.3 : 79.4 : 123.5 106.7 102.8 104.7 : 108.1 : : 160.8 : : 104.2 109.41994 : 93.6 99.2 : 86.0 : 118.8 99.4 101.0 99.5 : 105.1 : : 137.0 : : 102.7 110.01995 117.4 92.5 99.4 : 93.5 104.7 117.5 100.3 97.8 98.5 : 103.9 : : 117.3 : : 102.4 110.61996 115.0 94.8 99.7 97.3 100.2 103.8 120.6 103.2 101.5 96.6 105.4 103.4 : : 122.8 : : 101.7 109.41997 99.8 97.2 99.0 99.8 103.2 102.4 120.8 92.6 100.8 96.4 104.1 102.4 132.4 : 127.0 : : 101.9 108.81998 115.5 94.9 101.1 105.5 106.4 100.7 119.5 110.6 100.2 98.5 103.4 101.8 134.5 : 125.4 : : 103.6 108.71999 111.3 94.6 101.6 108.9 109.5 99.0 117.8 106.5 98.2 99.6 103.5 101.9 132.4 : 148.9 : : 103.5 107.92000 105.9 95.8 99.1 106.4 99.6 100.5 114.9 122.6 101.8 101.1 103.6 102.1 123.2 101.6 132.6 : : 105.1 106.5
2001 107.8 96.0 101.0 100.6 96.5 100.2 118.2 129.1 104.6 102.6 103.8 102.3 122.2 98.2 131.7 : : 105.0 105.52002 104.5 99.3 102.0 102.4 98.0 100.3 113.1 105.0 103.5 101.4 102.6 101.9 121.7 99.6 123.5 : : 103.1 103.32003 103.8 101.5 102.6 103.6 99.8 100.7 108.9 102.9 101.9 101.0 102.3 101.7 121.7 98.7 120.5 : : 102.2 101.02004 101.7 100.4 100.7 101.4 100.6 99.8 102.4 91.9 100.7 100.6 100.7 100.7 109.7 98.0 106.0 : : 101.5 99.72005 100.0 100.0 100.0 100.0 100.0 100.0 100.0 100.0 100.0 100.0 100.0 100.0 100.0 100.0 100.0 : : 100.0 100.02006 96.5 99.9 100.1 98.3 103.3 98.6 97.5 94.9 97.6 100.5 98.9 99.2 106.2 103.7 96.5 : : 100.0 98.92007 96.6 99.2 102.5 98.6 101.4 99.3 96.3 96.3 99.0 100.2 98.1 98.5 92.5 106.3 96.4 : : 100.5 97.22008 100.2 100.6 104.4 98.4 102.1 98.5 100.1 102.7 98.9 100.2 99.4 99.8 94.9 97.4 94.0 : : 100.9 98.52009 108.0 100.6 109.6 101.9 104.2 97.8 98.8 101.4 101.2 104.2 102.6 103.2 104.2 86.2 98.6 : : 99.5 99.72010 110.6 101.8 104.7 100.0 94.7 94.9 98.7 93.6 98.1 102.7 101.1 101.7 106.1 89.8 97.1 : : 98.1 97.3
2011 108.1 103.2 103.9 98.0 90.6 94.6 96.8 83.7 96.9 101.7 100.4 101.2 99.3 91.7 85.9 : : 97.9 100.02012 109.5 105.0 103.1 97.3 89.9 94.0 95.9 83.9 98.7 103.2 100.9 102.0 103.2 93.8 90.6 : : 97.3 99.32013 115.7 102.9 102.9 98.2 90.8 95.2 96.1 82.7 98.5 102.9 100.7 101.8 106.6 95.2 93.7 : : 96.6 98.82014 117.2 101.8 102.2 98.0 90.6 94.9 95.9 83.1 98.5 102.1 100.2 101.3 109.6 96.7 93.5 : : 96.3 97.22015 117.3 100.5 101.4 97.2 90.4 94.3 95.9 82.9 97.9 101.3 99.7 100.8 111.4 97.0 93.1 : : 95.8 95.9
1) Ratio of compensation per employee to nominal GDP per person employed. 2) Weighted in common currency 3) Weighted in common currency; Former EU-15; 1960-91 including D_W
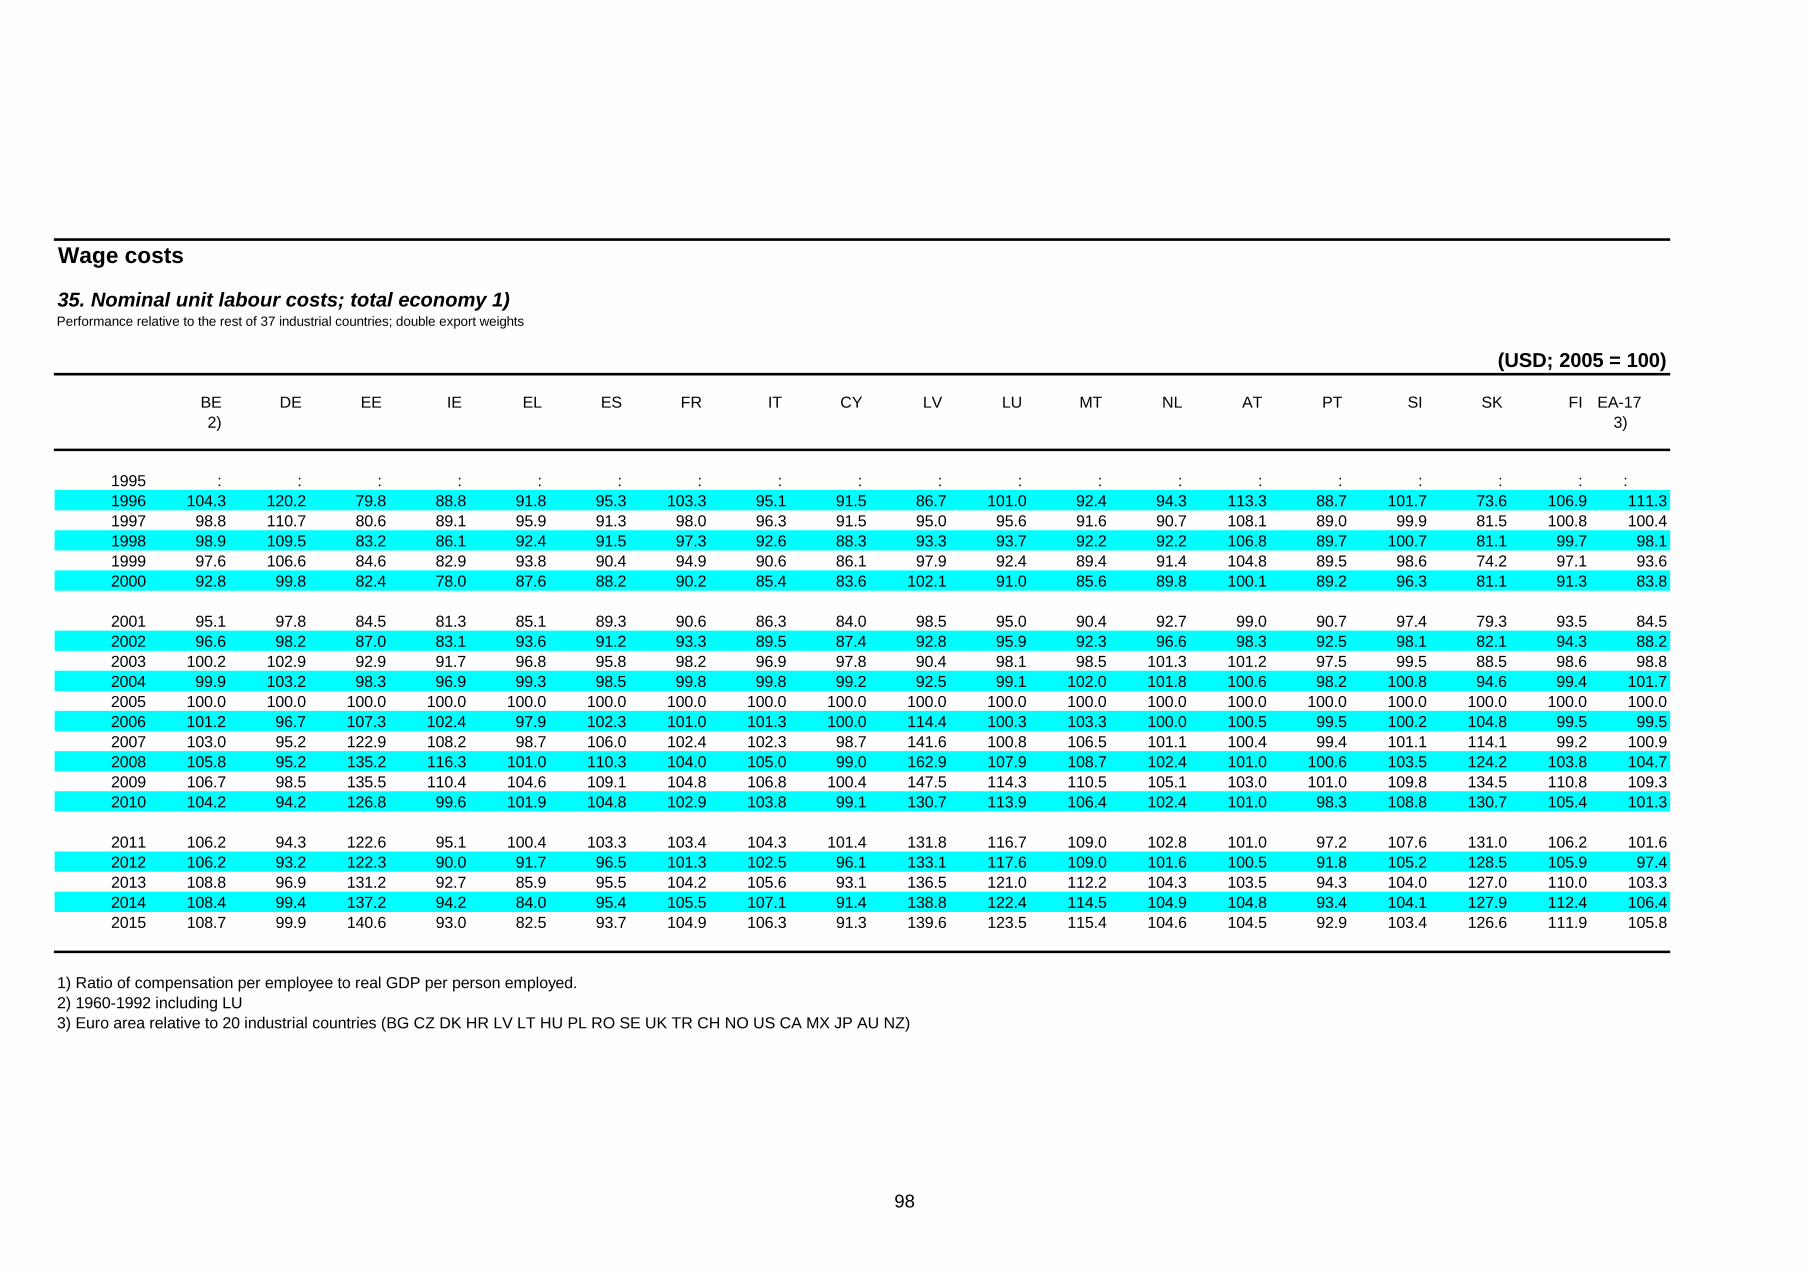
98
Wage costs
35. Nominal unit labour costs; total economy 1)Performance relative to the rest of 37 industrial countries; double export weights
(USD; 2005 = 100)
BE DE EE IE EL ES FR IT CY LV LU MT NL AT PT SI SK FI EA-17 2) 3)
1995 : : : : : : : : : : : : : : : : : : : 1996 104.3 120.2 79.8 88.8 91.8 95.3 103.3 95.1 91.5 86.7 101.0 92.4 94.3 113.3 88.7 101.7 73.6 106.9 111.31997 98.8 110.7 80.6 89.1 95.9 91.3 98.0 96.3 91.5 95.0 95.6 91.6 90.7 108.1 89.0 99.9 81.5 100.8 100.41998 98.9 109.5 83.2 86.1 92.4 91.5 97.3 92.6 88.3 93.3 93.7 92.2 92.2 106.8 89.7 100.7 81.1 99.7 98.11999 97.6 106.6 84.6 82.9 93.8 90.4 94.9 90.6 86.1 97.9 92.4 89.4 91.4 104.8 89.5 98.6 74.2 97.1 93.62000 92.8 99.8 82.4 78.0 87.6 88.2 90.2 85.4 83.6 102.1 91.0 85.6 89.8 100.1 89.2 96.3 81.1 91.3 83.8
2001 95.1 97.8 84.5 81.3 85.1 89.3 90.6 86.3 84.0 98.5 95.0 90.4 92.7 99.0 90.7 97.4 79.3 93.5 84.52002 96.6 98.2 87.0 83.1 93.6 91.2 93.3 89.5 87.4 92.8 95.9 92.3 96.6 98.3 92.5 98.1 82.1 94.3 88.22003 100.2 102.9 92.9 91.7 96.8 95.8 98.2 96.9 97.8 90.4 98.1 98.5 101.3 101.2 97.5 99.5 88.5 98.6 98.82004 99.9 103.2 98.3 96.9 99.3 98.5 99.8 99.8 99.2 92.5 99.1 102.0 101.8 100.6 98.2 100.8 94.6 99.4 101.72005 100.0 100.0 100.0 100.0 100.0 100.0 100.0 100.0 100.0 100.0 100.0 100.0 100.0 100.0 100.0 100.0 100.0 100.0 100.02006 101.2 96.7 107.3 102.4 97.9 102.3 101.0 101.3 100.0 114.4 100.3 103.3 100.0 100.5 99.5 100.2 104.8 99.5 99.52007 103.0 95.2 122.9 108.2 98.7 106.0 102.4 102.3 98.7 141.6 100.8 106.5 101.1 100.4 99.4 101.1 114.1 99.2 100.92008 105.8 95.2 135.2 116.3 101.0 110.3 104.0 105.0 99.0 162.9 107.9 108.7 102.4 101.0 100.6 103.5 124.2 103.8 104.72009 106.7 98.5 135.5 110.4 104.6 109.1 104.8 106.8 100.4 147.5 114.3 110.5 105.1 103.0 101.0 109.8 134.5 110.8 109.32010 104.2 94.2 126.8 99.6 101.9 104.8 102.9 103.8 99.1 130.7 113.9 106.4 102.4 101.0 98.3 108.8 130.7 105.4 101.3
2011 106.2 94.3 122.6 95.1 100.4 103.3 103.4 104.3 101.4 131.8 116.7 109.0 102.8 101.0 97.2 107.6 131.0 106.2 101.62012 106.2 93.2 122.3 90.0 91.7 96.5 101.3 102.5 96.1 133.1 117.6 109.0 101.6 100.5 91.8 105.2 128.5 105.9 97.42013 108.8 96.9 131.2 92.7 85.9 95.5 104.2 105.6 93.1 136.5 121.0 112.2 104.3 103.5 94.3 104.0 127.0 110.0 103.32014 108.4 99.4 137.2 94.2 84.0 95.4 105.5 107.1 91.4 138.8 122.4 114.5 104.9 104.8 93.4 104.1 127.9 112.4 106.42015 108.7 99.9 140.6 93.0 82.5 93.7 104.9 106.3 91.3 139.6 123.5 115.4 104.6 104.5 92.9 103.4 126.6 111.9 105.8
1) Ratio of compensation per employee to real GDP per person employed. 2) 1960-1992 including LU 3) Euro area relative to 20 industrial countries (BG CZ DK HR LV LT HU PL RO SE UK TR CH NO US CA MX JP AU NZ)

99
Wage costs
35. Nominal unit labour costs; total economy 1)Performance relative to the rest of 37 industrial countries; double export weights
BG CZ DK HR LT HU PL RO SE UK EU-27 MK IS TR ME RS US JP 2)
1995 : : : : : : : : : : : : : : : : : 1996 59.0 66.3 93.7 78.9 63.6 67.6 99.0 54.4 114.6 76.2 96.5 : : 101.0 : : 98.3 142.41997 63.3 69.2 90.9 84.9 79.1 72.4 102.6 53.8 109.3 88.7 91.1 : : 110.5 : : 105.2 132.61998 91.2 73.0 93.3 93.8 84.1 70.4 106.6 77.6 105.3 94.7 92.6 : : 111.4 : : 111.7 122.31999 88.1 72.0 92.8 92.1 86.8 69.5 100.1 66.0 100.7 96.3 86.5 : : 129.9 : : 110.1 138.02000 85.7 73.5 87.3 90.2 87.6 72.1 106.0 85.5 103.6 99.4 77.3 : : 125.5 : : 117.0 146.2
2001 92.8 78.9 90.2 88.9 85.4 79.4 121.2 94.0 97.4 99.3 79.1 : : 100.0 : : 122.4 126.52002 93.1 92.0 93.1 93.3 89.9 90.6 111.1 77.0 98.6 99.8 84.1 : : 96.8 : : 119.0 114.42003 95.5 92.9 98.3 96.3 93.2 92.9 94.7 78.1 103.4 95.8 94.9 : : 100.6 : : 107.6 107.72004 97.8 95.7 99.3 98.7 96.7 97.9 90.0 74.6 103.7 101.2 100.9 : : 95.4 : : 101.8 105.02005 100.0 100.0 100.0 100.0 100.0 100.0 100.0 100.0 100.0 100.0 100.0 : : 100.0 : : 100.0 100.02006 102.5 105.1 101.3 102.5 107.9 95.1 101.4 107.1 98.5 103.0 101.4 : : 97.1 : : 100.8 90.12007 109.7 108.6 105.4 105.7 111.4 104.5 105.5 128.4 101.8 104.6 106.8 : : 103.0 : : 97.1 80.42008 119.6 121.2 110.0 109.7 117.4 105.4 118.6 138.7 98.8 90.7 108.9 : : 103.5 : : 92.1 86.72009 131.8 114.3 114.4 111.4 114.9 95.1 95.7 120.6 90.8 82.9 105.5 : : 97.7 : : 93.6 98.92010 136.0 117.3 109.8 109.1 105.4 94.7 103.6 116.2 95.5 85.2 97.5 : : 107.7 : : 90.7 99.9
2011 141.5 120.4 108.1 106.3 105.6 95.4 101.0 107.7 99.9 84.7 98.2 : : 87.8 : : 86.1 105.02012 143.2 117.7 104.6 102.6 103.4 91.2 97.3 103.6 101.7 89.1 93.4 : : 95.8 : : 88.9 104.82013 151.1 113.6 106.9 104.1 106.1 92.6 98.0 106.7 104.3 87.9 101.0 : : 97.5 : : 91.2 83.42014 155.6 107.4 108.4 104.2 107.6 91.3 99.2 109.3 102.3 92.2 106.5 : : 89.6 : : 92.3 77.82015 155.6 106.5 107.7 103.3 108.2 91.9 99.5 110.6 101.5 92.4 105.5 : : 96.2 : : 91.8 76.5
1) Ratio of compensation per employee to real GDP per person employed. 2) EU-27 relative to 10 industrial countries (HR TR CH NO US CA MX JP AU NZ)

100
Foreign trade and current balance
36. Exports of goods and services at current prices (National accounts)
(Percentage of gross domestic product at market prices)
BE DE EE IE EL ES FR IT CY LV LU MT NL AT PT SI SK FI EA-18 EA-12 1) 2) 3)
1960 35.9 19.2 : 28.9 12.2 8.3 14.9 12.4 35.3 : 89.0 50.3 47.8 22.2 15.6 : : 21.3 : 18.9
1965 39.8 18.2 : 31.6 9.4 8.1 13.6 14.1 37.2 : 82.9 46.3 42.9 23.0 18.1 : : 19.2 : 18.2
1970 48.1 21.4 : 33.6 9.7 12.3 16.0 15.6 41.0 : 91.3 42.6 44.8 28.5 18.8 : : 24.4 : 21.2
1975 50.0 24.2 : 38.8 17.4 12.6 19.0 19.3 38.4 : 95.0 71.1 49.3 29.2 15.4 : : 22.4 : 24.1
1980 54.5 26.3 : 45.0 23.7 14.7 21.4 20.8 48.9 : 90.9 78.1 52.3 32.9 21.5 : : 31.2 : 26.7
1981 58.8 28.5 : 44.0 26.3 16.7 22.4 22.4 54.3 : 89.0 70.0 57.0 34.3 20.3 : : 31.7 : 28.41982 63.2 29.5 : 43.6 21.1 17.4 21.9 21.8 55.0 : 91.4 59.4 57.0 33.0 20.6 : : 29.2 : 28.41983 65.7 28.7 : 47.5 20.2 19.6 22.9 21.0 54.5 : 92.7 57.7 56.6 31.7 24.2 : : 29.1 : 28.51984 70.0 30.7 : 54.0 20.6 21.9 24.3 21.7 59.1 : 103.9 60.2 60.6 34.0 28.8 : : 29.9 : 30.31985 67.9 32.4 : 54.6 19.8 21.4 23.8 21.8 52.7 : 111.6 62.3 62.1 36.3 29.6 : : 28.4 : 30.61986 62.3 30.1 : 49.8 21.7 18.7 20.8 19.3 48.7 : 102.1 62.1 52.7 33.2 27.2 : : 25.8 : 27.61987 60.7 29.2 : 53.2 22.3 18.2 20.0 18.6 51.1 : 99.3 67.1 51.3 32.6 27.8 : : 25.2 : 26.81988 64.6 29.8 : 56.7 20.0 17.8 20.8 18.1 52.1 : 100.9 67.9 53.7 34.4 27.7 : : 24.0 : 27.21989 69.1 31.5 : 60.1 19.6 17.0 22.1 19.1 55.6 : 103.7 69.6 57.1 36.4 29.7 : : 23.4 : 28.41990 67.0 32.3 : 56.1 18.1 16.1 21.5 19.0 55.7 42.2 101.5 73.2 56.5 37.1 29.1 87.1 26.3 22.5 : 28.1
1991 33.5 28.2
1991 65.5 25.7 : 56.9 17.4 16.2 21.8 17.8 51.0 31.2 101.4 74.7 57.2 35.9 25.8 80.2 45.9 21.7 : 25.91992 63.9 24.0 : 59.8 18.3 16.6 21.8 18.2 53.8 70.7 100.4 78.9 55.4 34.4 23.7 60.6 69.7 26.0 : 25.51993 61.0 22.0 66.2 64.9 17.2 18.2 21.2 21.3 51.2 64.7 100.7 81.9 54.6 32.7 23.4 56.4 56.2 31.8 25.8 25.61994 63.5 22.8 71.4 69.6 17.7 20.8 22.0 22.8 51.4 41.1 104.0 83.0 56.8 33.4 24.9 57.6 59.3 34.8 27.3 27.11995 65.4 23.7 68.1 75.3 17.7 22.4 23.0 25.7 50.5 41.8 106.4 80.5 59.4 34.8 27.2 49.6 57.8 36.5 29.0 28.71996 65.6 24.8 61.9 77.0 17.6 23.6 23.4 24.7 51.2 46.4 111.1 74.6 59.6 35.5 27.2 49.9 53.3 37.2 29.4 29.11997 69.8 27.4 71.7 79.4 19.8 26.3 25.9 25.2 52.3 46.0 120.9 73.6 63.3 39.2 27.8 51.3 56.3 38.8 31.8 31.61998 69.7 28.6 74.6 86.8 20.0 26.7 26.5 25.2 50.3 45.4 127.5 76.5 62.6 40.9 27.9 51.1 59.2 38.6 32.6 32.31999 70.0 29.4 70.4 89.1 22.5 26.7 26.4 24.3 52.1 40.1 134.3 80.0 63.0 42.1 27.1 47.2 61.2 38.8 32.9 32.72000 78.1 33.4 84.6 97.5 25.7 29.1 28.8 26.8 56.1 41.9 150.0 88.8 70.1 46.2 28.9 53.7 70.4 43.6 36.8 36.5
2001 77.8 34.8 79.8 99.6 24.9 28.5 28.4 26.9 56.5 42.0 146.6 78.3 67.3 48.1 28.1 55.2 72.7 41.5 37.0 36.72002 76.7 35.7 70.9 93.8 21.8 27.3 27.5 25.5 51.2 41.3 140.7 81.4 64.2 48.7 27.6 55.1 71.1 40.5 36.3 36.02003 73.9 35.7 69.2 83.3 20.7 26.3 25.9 24.4 47.5 42.2 137.0 77.0 63.0 48.2 27.6 53.8 75.8 38.7 35.3 35.02004 75.9 38.5 73.1 83.5 23.1 25.9 26.1 25.2 48.3 44.0 152.4 76.3 66.4 51.5 28.0 57.8 74.5 39.9 36.8 36.42005 78.7 41.3 77.7 81.4 23.2 25.7 26.4 25.9 48.6 48.2 155.8 74.9 69.6 53.8 27.7 62.2 76.3 41.8 38.1 37.72006 80.8 45.5 72.7 79.2 23.2 26.3 27.0 27.6 48.1 45.1 169.9 88.8 72.8 56.4 30.9 66.5 84.5 45.5 40.4 40.02007 82.5 47.2 67.1 80.4 23.8 26.9 26.9 28.9 48.2 42.5 175.9 92.2 74.2 58.9 32.2 69.5 86.9 45.8 41.5 41.12008 84.4 48.2 71.0 83.3 24.1 26.5 26.9 28.5 45.8 43.1 181.8 91.8 76.3 59.3 32.4 67.9 83.5 46.8 42.0 41.52009 73.7 42.5 63.9 90.2 19.3 23.9 23.4 23.7 40.8 43.9 162.0 81.8 68.6 50.1 28.0 59.4 70.6 37.3 36.9 36.52010 79.8 47.6 79.2 99.8 22.2 27.4 25.5 26.6 42.0 53.6 170.8 90.8 78.7 54.4 31.3 66.8 80.4 40.4 41.3 40.8
2011 85.0 50.6 90.5 102.7 25.1 30.8 26.9 28.8 43.5 58.8 178.3 98.2 83.9 57.3 35.7 73.0 89.5 41.0 44.3 43.72012 86.1 51.8 90.6 107.8 27.3 32.6 27.4 30.2 43.5 61.6 177.3 102.5 88.0 57.2 38.7 76.1 96.6 40.6 45.9 45.22013 85.9 50.6 88.0 108.0 29.1 34.1 27.2 30.4 45.0 59.7 175.7 92.0 88.3 57.4 40.7 78.1 97.6 40.1 45.9 45.22014 86.3 51.2 87.0 108.6 30.1 35.3 27.4 30.9 46.3 58.9 174.9 90.7 88.9 58.2 42.1 80.0 99.1 39.8 46.6 45.92015 88.6 52.7 87.1 109.6 30.7 37.0 28.3 31.8 46.8 59.1 178.0 92.9 91.9 60.3 43.7 83.1 102.5 41.1 48.0 47.3
1) 1960-91 D_W 2) Euro area; 1960-91 including D_W 3) Former Euro area 12; 1960-91 including D_W

101
Foreign trade and current balance
36. Exports of goods and services at current prices (National accounts)
(Percentage of gross domestic product at market prices)
BG CZ DK HR LT HU PL RO SE UK EU-28 EU-15 MK IS TR ME RS US JP 1) 2)
1960 : : 32.6 : : : : : 23.0 19.8 : 19.5 : 41.4 4.0 : : 5.0 10.5
1965 : : 29.6 : : : : : 21.9 18.4 : 18.6 : 36.2 4.0 : : 5.0 10.3
1970 : : 28.0 : : : : : 24.2 22.3 : 21.6 : 45.0 3.8 : : 5.5 10.6
1975 : : 30.2 : : : : : 28.2 25.4 : 24.6 : 33.3 4.4 : : 8.2 12.5
1980 : : 33.2 : : 39.6 27.5 20.8 29.2 27.2 : 27.0 : 35.5 4.8 : : 9.8 13.4
1981 : : 37.1 : : 40.0 22.7 25.8 30.0 26.7 : 28.3 : 34.6 7.4 : : 9.5 14.41982 : : 36.9 : : 38.5 19.0 21.9 32.4 26.3 : 28.3 : 32.2 10.6 : : 8.5 14.21983 : : 36.9 : : 40.8 16.8 24.5 35.6 26.5 : 28.6 : 39.7 11.4 : : 7.6 13.61984 : : 37.3 : : 41.6 17.3 25.7 36.3 28.4 : 30.3 : 38.0 14.2 : : 7.5 14.71985 : : 37.4 : : 42.8 17.8 26.6 35.2 28.8 : 30.6 : 40.3 14.4 : : 7.0 14.11986 : : 33.0 : : 40.2 17.8 25.0 32.8 25.7 : 27.6 : 38.6 12.1 : : 7.0 11.11987 : : 32.4 : : 38.4 20.9 24.5 32.4 25.4 : 26.9 : 34.3 13.7 : : 7.5 10.11988 : : 34.3 : : 37.3 22.3 23.6 32.1 23.1 : 26.9 : 31.8 16.4 : : 8.5 9.81989 : : 36.2 : : 36.5 18.7 19.3 31.9 23.8 : 28.0 : 33.5 14.2 : : 8.9 10.21990 : 39.4 37.2 : 50 31.6 26.2 15.4 30.1 24.2 : 27.8 : 33.6 11.6 : : 9.2 10.3
1991 27.7
1991 43.5 45.9 38.5 : 28 33.2 21.5 16.3 28.1 23.4 : 25.8 : 31.3 12.1 : : 9.6 9.91992 47.1 47.7 37.9 : 22.2 31.9 21.7 25.7 28.0 23.7 : 25.6 : 30.3 12.6 : : 9.7 9.81993 38.2 47.8 37.4 : 78.5 26.8 21.0 21.3 32.7 25.6 : 26.0 : 32.8 12.0 : : 9.5 9.11994 45.1 44.4 37.7 : 52.6 29.3 21.6 23.0 36.1 26.7 : 27.5 : 35.8 18.7 : : 9.9 9.01995 51.9 48.1 37.6 33.1 47.5 45.2 23.2 25.5 39.7 28.4 29.5 29.2 33.0 35.5 17.4 : : 10.6 9.11996 59.4 46.5 37.9 35.9 50.1 49.0 22.3 26.5 38.6 29.2 29.9 29.6 28.2 36.3 18.9 : : 10.7 9.71997 58.7 49.8 38.8 35.7 51.6 55.4 23.4 28.2 42.1 28.3 31.9 31.5 37.3 36.2 21.5 : 19 11.1 10.71998 59.1 52.3 38.3 35.3 45.1 61.7 26.0 23.0 43.0 26.3 32.1 31.7 41.2 34.7 21.3 : 23 10.5 10.81999 56.0 53.3 40.8 36.5 38.7 64.6 24.2 27.8 43.1 25.8 32.4 32.0 42.2 33.6 19.4 : 12.4 10.2 10.22000 50.5 60.9 46.6 41.7 44.5 74.6 27.1 32.8 46.5 27.3 35.8 35.3 48.6 33.6 20.1 36.8 11.3 10.6 10.9
2001 48.7 62.6 47.3 43.4 49.6 72.0 27.1 33.1 46.3 26.9 35.9 35.4 42.7 38.8 27.4 38.4 25.6 9.7 10.42002 47.4 57.6 47.3 40.9 52.4 63.3 28.6 35.4 44.4 25.9 35.2 34.6 38.0 37.4 25.2 35.4 23.8 9.2 11.32003 48.5 59.1 45.4 42.6 50.9 61.4 33.3 34.8 43.5 25.5 34.5 33.8 38.1 34.3 23.0 30.6 25.9 9.1 11.92004 51.9 63.0 45.4 42.9 51.9 63.3 37.5 35.8 46.0 25.2 35.7 34.9 39.9 34.1 23.6 42.0 25.5 9.6 13.22005 40.5 64.4 49.0 42.3 57.3 65.9 37.1 33.1 48.4 26.6 37.1 36.3 44.1 31.7 21.9 43.5 28.3 10.0 14.32006 61.2 67.0 52.1 42.8 58.8 77.7 40.4 32.3 51.1 28.7 39.5 38.5 46.6 32.2 22.7 49.4 31.4 10.7 16.22007 59.5 68.2 52.2 42.3 53.8 81.3 40.8 29.3 51.9 26.6 40.0 39.0 52.4 34.6 22.3 44.4 30.6 11.5 17.72008 58.2 64.4 54.7 42.1 59.6 81.7 39.9 30.4 53.5 29.4 41.2 40.2 50.9 44.4 23.9 39.6 31.4 12.5 17.72009 47.5 59.0 47.6 36.6 54.2 77.6 39.4 30.6 48.0 28.4 36.9 35.8 39.2 52.9 23.3 32.1 29.4 11.0 12.72010 57.4 66.6 50.4 39.7 67.7 85.1 42.2 35.4 49.5 30.1 40.9 39.6 46.6 56.4 21.2 34.7 36.0 12.3 15.2
2011 66.5 72.9 53.7 42.3 77.2 91.6 45.1 40.0 49.9 32.1 43.8 42.4 54.9 59.1 24.0 42.8 36.6 13.5 15.12012 66.7 78.0 54.8 43.7 83.9 94.7 46.7 40.6 48.5 31.8 44.9 43.4 53.6 59.4 26.3 44.1 40.3 13.5 14.72013 70.2 78.6 54.9 43.0 86.3 96.0 47.8 42.2 45.7 31.4 44.9 43.3 53.8 57.5 25.7 43.7 44.7 13.5 16.22014 70.4 82.6 55.2 44.6 85.6 99.2 47.4 42.5 45.8 31.3 45.3 43.7 55.7 54.5 28.4 42.6 46.3 13.6 16.52015 73.4 85.2 56.0 46.1 87.7 101.1 48.3 43.0 46.5 31.3 46.5 44.8 58.9 54.4 29.0 43.1 47.3 13.8 17.1
1) 1960-91 including D_W 2) Former EU-15; 1960-91 including D_W
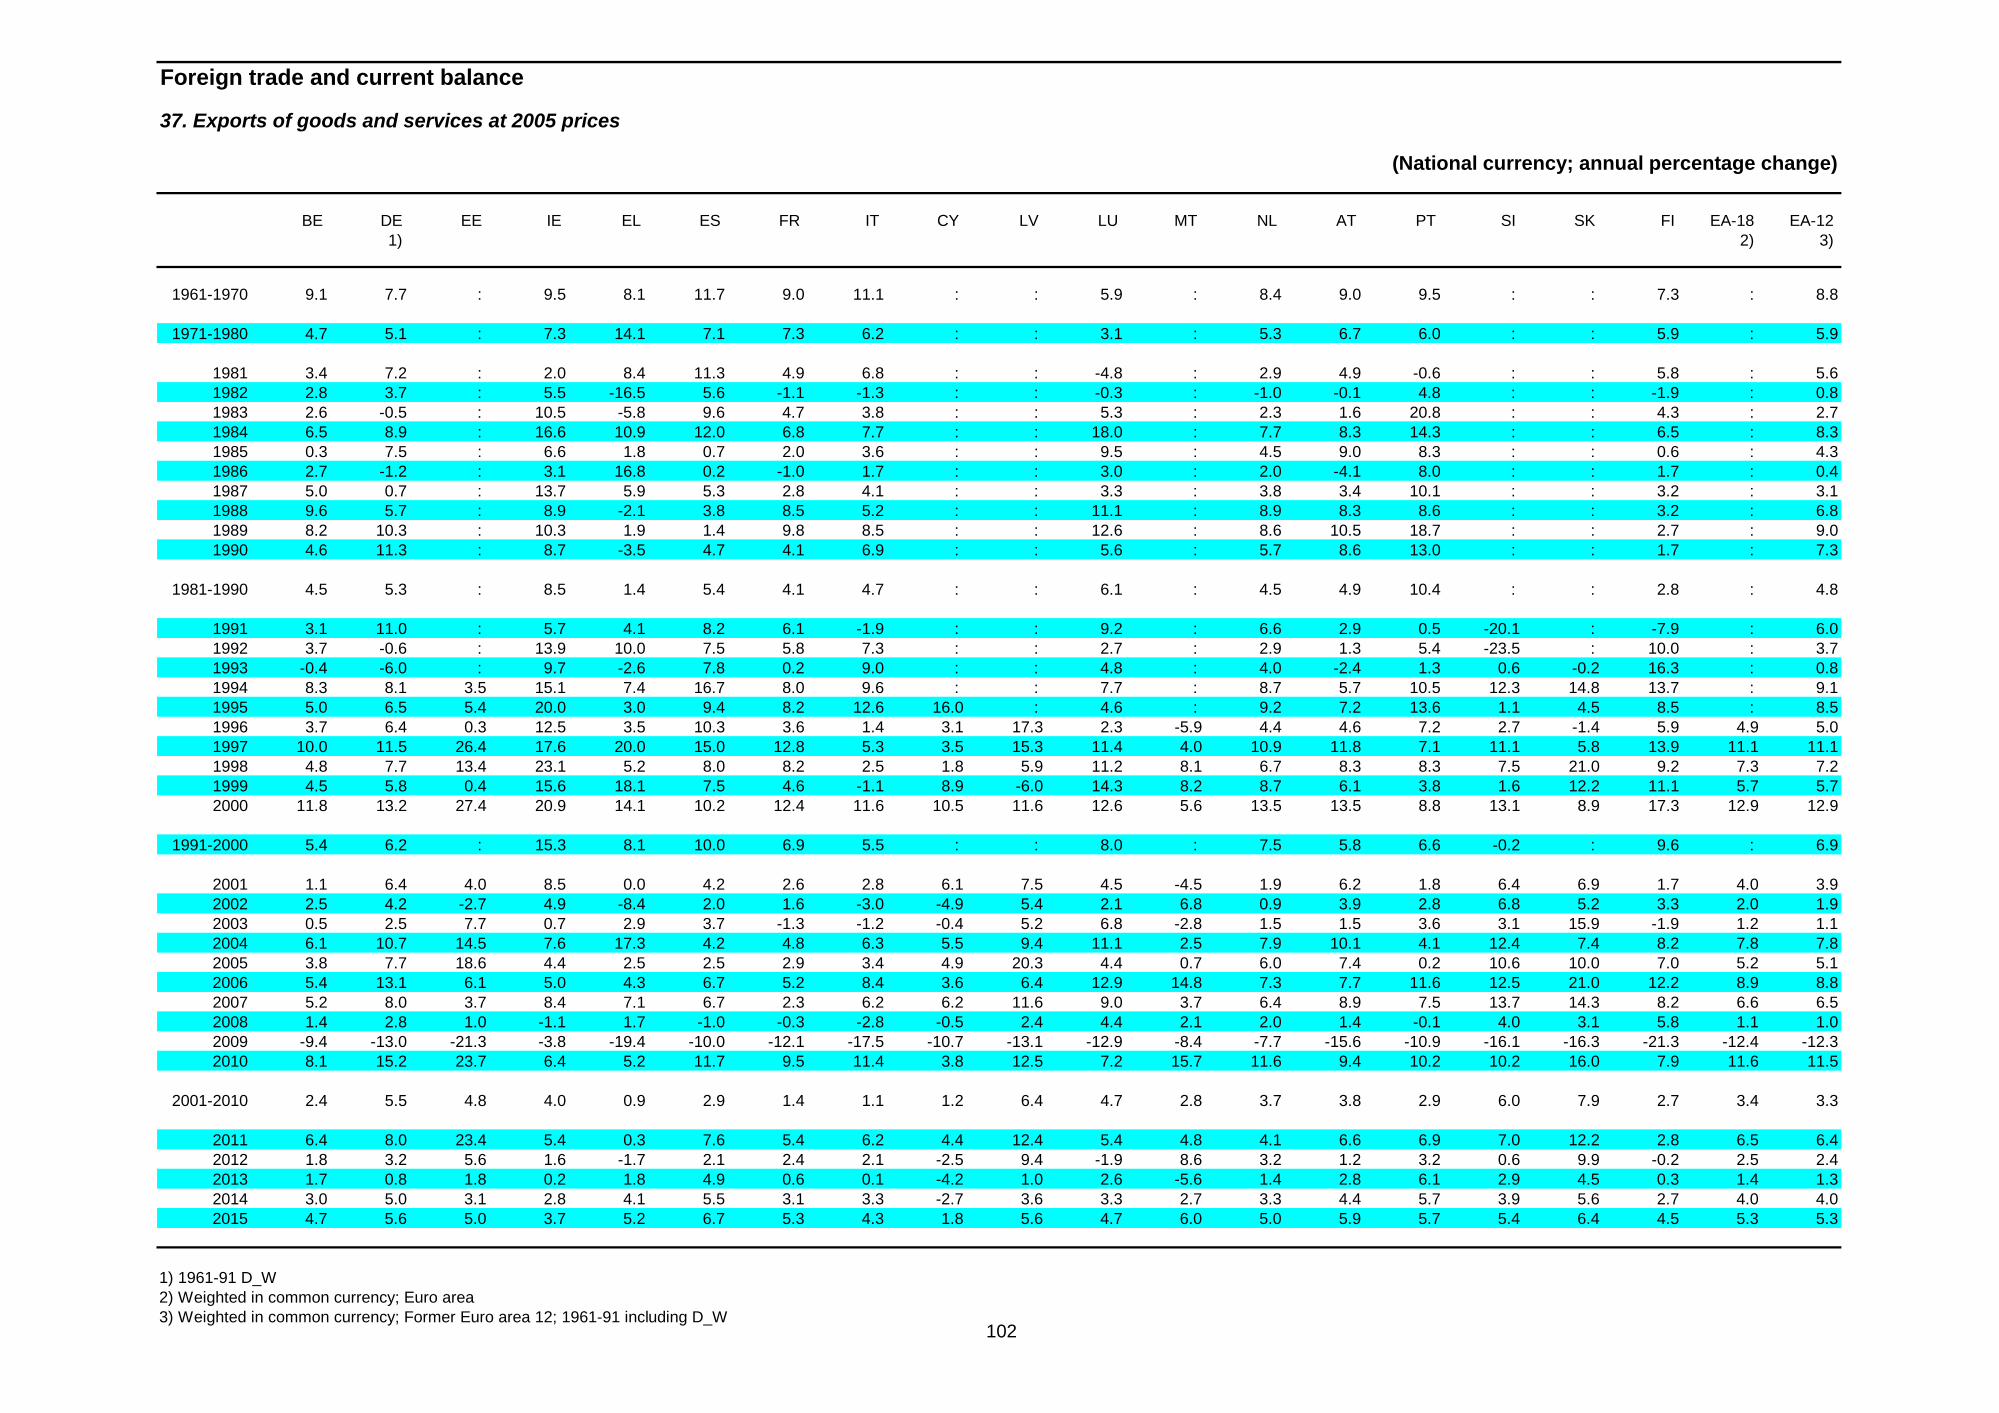
102
Foreign trade and current balance
37. Exports of goods and services at 2005 prices
(National currency; annual percentage change)
BE DE EE IE EL ES FR IT CY LV LU MT NL AT PT SI SK FI EA-18 EA-12 1) 2) 3)
1961-1970 9.1 7.7 : 9.5 8.1 11.7 9.0 11.1 : : 5.9 : 8.4 9.0 9.5 : : 7.3 : 8.8
1971-1980 4.7 5.1 : 7.3 14.1 7.1 7.3 6.2 : : 3.1 : 5.3 6.7 6.0 : : 5.9 : 5.9
1981 3.4 7.2 : 2.0 8.4 11.3 4.9 6.8 : : -4.8 : 2.9 4.9 -0.6 : : 5.8 : 5.61982 2.8 3.7 : 5.5 -16.5 5.6 -1.1 -1.3 : : -0.3 : -1.0 -0.1 4.8 : : -1.9 : 0.81983 2.6 -0.5 : 10.5 -5.8 9.6 4.7 3.8 : : 5.3 : 2.3 1.6 20.8 : : 4.3 : 2.71984 6.5 8.9 : 16.6 10.9 12.0 6.8 7.7 : : 18.0 : 7.7 8.3 14.3 : : 6.5 : 8.31985 0.3 7.5 : 6.6 1.8 0.7 2.0 3.6 : : 9.5 : 4.5 9.0 8.3 : : 0.6 : 4.31986 2.7 -1.2 : 3.1 16.8 0.2 -1.0 1.7 : : 3.0 : 2.0 -4.1 8.0 : : 1.7 : 0.41987 5.0 0.7 : 13.7 5.9 5.3 2.8 4.1 : : 3.3 : 3.8 3.4 10.1 : : 3.2 : 3.11988 9.6 5.7 : 8.9 -2.1 3.8 8.5 5.2 : : 11.1 : 8.9 8.3 8.6 : : 3.2 : 6.81989 8.2 10.3 : 10.3 1.9 1.4 9.8 8.5 : : 12.6 : 8.6 10.5 18.7 : : 2.7 : 9.01990 4.6 11.3 : 8.7 -3.5 4.7 4.1 6.9 : : 5.6 : 5.7 8.6 13.0 : : 1.7 : 7.3
1981-1990 4.5 5.3 : 8.5 1.4 5.4 4.1 4.7 : : 6.1 : 4.5 4.9 10.4 : : 2.8 : 4.8
1991 3.1 11.0 : 5.7 4.1 8.2 6.1 -1.9 : : 9.2 : 6.6 2.9 0.5 -20.1 : -7.9 : 6.01992 3.7 -0.6 : 13.9 10.0 7.5 5.8 7.3 : : 2.7 : 2.9 1.3 5.4 -23.5 : 10.0 : 3.71993 -0.4 -6.0 : 9.7 -2.6 7.8 0.2 9.0 : : 4.8 : 4.0 -2.4 1.3 0.6 -0.2 16.3 : 0.81994 8.3 8.1 3.5 15.1 7.4 16.7 8.0 9.6 : : 7.7 : 8.7 5.7 10.5 12.3 14.8 13.7 : 9.11995 5.0 6.5 5.4 20.0 3.0 9.4 8.2 12.6 16.0 : 4.6 : 9.2 7.2 13.6 1.1 4.5 8.5 : 8.51996 3.7 6.4 0.3 12.5 3.5 10.3 3.6 1.4 3.1 17.3 2.3 -5.9 4.4 4.6 7.2 2.7 -1.4 5.9 4.9 5.01997 10.0 11.5 26.4 17.6 20.0 15.0 12.8 5.3 3.5 15.3 11.4 4.0 10.9 11.8 7.1 11.1 5.8 13.9 11.1 11.11998 4.8 7.7 13.4 23.1 5.2 8.0 8.2 2.5 1.8 5.9 11.2 8.1 6.7 8.3 8.3 7.5 21.0 9.2 7.3 7.21999 4.5 5.8 0.4 15.6 18.1 7.5 4.6 -1.1 8.9 -6.0 14.3 8.2 8.7 6.1 3.8 1.6 12.2 11.1 5.7 5.72000 11.8 13.2 27.4 20.9 14.1 10.2 12.4 11.6 10.5 11.6 12.6 5.6 13.5 13.5 8.8 13.1 8.9 17.3 12.9 12.9
1991-2000 5.4 6.2 : 15.3 8.1 10.0 6.9 5.5 : : 8.0 : 7.5 5.8 6.6 -0.2 : 9.6 : 6.9
2001 1.1 6.4 4.0 8.5 0.0 4.2 2.6 2.8 6.1 7.5 4.5 -4.5 1.9 6.2 1.8 6.4 6.9 1.7 4.0 3.92002 2.5 4.2 -2.7 4.9 -8.4 2.0 1.6 -3.0 -4.9 5.4 2.1 6.8 0.9 3.9 2.8 6.8 5.2 3.3 2.0 1.92003 0.5 2.5 7.7 0.7 2.9 3.7 -1.3 -1.2 -0.4 5.2 6.8 -2.8 1.5 1.5 3.6 3.1 15.9 -1.9 1.2 1.12004 6.1 10.7 14.5 7.6 17.3 4.2 4.8 6.3 5.5 9.4 11.1 2.5 7.9 10.1 4.1 12.4 7.4 8.2 7.8 7.82005 3.8 7.7 18.6 4.4 2.5 2.5 2.9 3.4 4.9 20.3 4.4 0.7 6.0 7.4 0.2 10.6 10.0 7.0 5.2 5.12006 5.4 13.1 6.1 5.0 4.3 6.7 5.2 8.4 3.6 6.4 12.9 14.8 7.3 7.7 11.6 12.5 21.0 12.2 8.9 8.82007 5.2 8.0 3.7 8.4 7.1 6.7 2.3 6.2 6.2 11.6 9.0 3.7 6.4 8.9 7.5 13.7 14.3 8.2 6.6 6.52008 1.4 2.8 1.0 -1.1 1.7 -1.0 -0.3 -2.8 -0.5 2.4 4.4 2.1 2.0 1.4 -0.1 4.0 3.1 5.8 1.1 1.02009 -9.4 -13.0 -21.3 -3.8 -19.4 -10.0 -12.1 -17.5 -10.7 -13.1 -12.9 -8.4 -7.7 -15.6 -10.9 -16.1 -16.3 -21.3 -12.4 -12.32010 8.1 15.2 23.7 6.4 5.2 11.7 9.5 11.4 3.8 12.5 7.2 15.7 11.6 9.4 10.2 10.2 16.0 7.9 11.6 11.5
2001-2010 2.4 5.5 4.8 4.0 0.9 2.9 1.4 1.1 1.2 6.4 4.7 2.8 3.7 3.8 2.9 6.0 7.9 2.7 3.4 3.3
2011 6.4 8.0 23.4 5.4 0.3 7.6 5.4 6.2 4.4 12.4 5.4 4.8 4.1 6.6 6.9 7.0 12.2 2.8 6.5 6.42012 1.8 3.2 5.6 1.6 -1.7 2.1 2.4 2.1 -2.5 9.4 -1.9 8.6 3.2 1.2 3.2 0.6 9.9 -0.2 2.5 2.42013 1.7 0.8 1.8 0.2 1.8 4.9 0.6 0.1 -4.2 1.0 2.6 -5.6 1.4 2.8 6.1 2.9 4.5 0.3 1.4 1.32014 3.0 5.0 3.1 2.8 4.1 5.5 3.1 3.3 -2.7 3.6 3.3 2.7 3.3 4.4 5.7 3.9 5.6 2.7 4.0 4.02015 4.7 5.6 5.0 3.7 5.2 6.7 5.3 4.3 1.8 5.6 4.7 6.0 5.0 5.9 5.7 5.4 6.4 4.5 5.3 5.3
1) 1961-91 D_W 2) Weighted in common currency; Euro area 3) Weighted in common currency; Former Euro area 12; 1961-91 including D_W

103
Foreign trade and current balance
37. Exports of goods and services at 2005 prices
(National currency; annual percentage change)
BG CZ DK HR LT HU PL RO SE UK EU-28 EU-15 MK IS TR ME RS US JP 1) 2)
1961-1970 : : 6.3 : : : : : 7.6 5.0 : 7.9 : 5.6 6.5 : : 5.9 15.9
1971-1980 : : 5.8 : : : : : 3.8 4.6 : 5.6 : 5.8 3.7 : : 7.2 9.4
1981 : : 8.5 : : : : : 3.1 -0.5 : 4.7 : 3.2 63.5 : : 1.2 13.31982 : : 3.2 : : : : : 6.8 1.1 : 1.2 : -8.9 34.0 : : -7.6 1.41983 : : 4.6 : : : : : 9.5 2.0 : 2.9 : 11.0 13.1 : : -2.6 5.01984 : : 3.5 : : : : : 7.1 6.7 : 7.9 : 2.4 25.4 : : 8.2 15.31985 : : 6.0 : : : : : 1.3 5.9 : 4.5 : 11.1 -1.9 : : 3.3 5.31986 : : 1.3 : : : : : 3.5 4.2 : 1.2 : 5.9 -5.1 : : 7.7 -5.11987 : : 4.9 : : : : : 4.0 5.9 : 3.5 : 3.3 26.4 : : 10.9 -0.11988 : : 8.8 : : : : : 3.3 0.6 : 5.8 : -3.6 18.4 : : 16.2 6.71989 : : 4.7 : : : : : 3.2 4.6 : 8.0 : 2.9 -0.3 : : 11.6 9.51990 : : 6.7 : : : : : 2.3 5.3 : 6.8 : 0.0 2.6 : : 8.8 7.2
1981-1990 : : 5.2 : : : : : 4.4 3.5 : 4.6 : 2.6 16.0 : : 5.5 5.7
1991 : -6.0 6.5 : : : -1.7 -18.5 -2.0 -0.2 : 4.9 : -5.9 3.7 : : 6.6 5.21992 : 9.5 0.5 : : 2.7 10.8 4.1 2.2 4.5 : 3.7 : -2.0 11.0 : : 6.9 4.41993 : 15.8 1.0 : : -10.3 3.2 10.6 7.8 4.6 : 1.6 : 6.5 7.7 : : 3.3 0.41994 : 3.8 8.4 : : 13.6 13.1 19.0 13.5 9.2 : 9.2 : 9.3 15.2 : : 8.8 3.91995 : 18.8 3.2 : : 48.2 22.9 17.0 11.3 9.4 : 8.5 : -2.3 8.0 : : 10.3 4.21996 -1.0 6.5 4.2 14.3 19.0 11.1 12.0 6.1 4.4 7.4 5.4 5.3 -12.9 9.9 22.0 : : 8.2 5.91997 14.8 9.7 4.9 4.2 18.8 21.0 12.2 11.2 13.8 7.6 10.7 10.6 29.4 5.6 19.1 : : 11.9 11.11998 27.8 11.6 4.1 5.8 4.7 16.5 14.4 -1.6 9.0 3.3 7.0 6.6 8.5 2.5 12.0 : : 2.3 -2.71999 -4.6 5.7 11.6 0.9 -16.4 11.1 -2.5 12.4 7.2 3.1 5.4 5.5 6.9 4.0 -10.7 : : 4.6 1.82000 -15.9 17.3 12.7 11.9 9.6 19.7 23.2 23.2 11.7 9.4 12.6 12.4 19.7 4.2 16.0 : : 8.4 12.6
1991-2000 : 9.0 5.6 : : : 10.4 7.7 7.8 5.8 : 6.8 : 3.1 10.0 : : 7.1 4.6
2001 6.0 11.6 3.1 8.8 21.2 8.0 3.1 11.9 0.6 2.4 3.8 3.6 -15.7 7.4 3.9 : : -5.7 -7.02002 9.8 2.4 4.1 1.1 18.6 3.8 4.8 17.1 1.3 1.9 2.2 2.0 -5.1 3.8 6.9 : : -1.9 7.92003 10.6 7.6 -0.9 11.6 8.4 6.2 14.2 9.3 4.2 2.8 1.9 1.4 -5.7 1.6 6.9 : : 1.6 9.52004 11.9 13.6 2.8 5.4 4.1 15.0 14.0 14.1 10.8 4.8 7.8 7.4 11.7 8.4 11.2 : 2.0 9.4 14.02005 -17.5 11.6 7.9 3.8 17.0 11.3 8.0 7.6 6.6 9.1 6.0 5.7 13.4 7.5 7.9 : 15.1 6.0 6.22006 50.7 13.8 9.0 6.0 12.2 19.1 14.6 10.4 9.0 12.0 9.8 9.2 8.2 -4.6 6.6 : 16.9 8.9 9.92007 6.1 11.2 2.8 3.7 3.1 15.0 9.1 7.8 5.7 -2.0 5.7 5.2 11.8 17.7 7.3 : 11.7 8.9 8.72008 3.0 4.0 3.3 1.7 11.4 5.7 7.1 8.3 1.7 1.1 1.5 1.1 -6.3 7.0 2.7 : 9.8 5.7 1.42009 -11.2 -10.9 -9.5 -16.2 -12.6 -10.2 -6.8 -6.4 -13.8 -8.7 -11.7 -11.8 -15.8 7.0 -5.0 : -8.0 -9.1 -24.22010 14.7 15.4 3.0 4.8 17.4 11.3 12.1 13.2 11.4 6.7 11.0 10.7 23.6 0.5 3.4 : 15.3 11.5 24.4
2001-2010 7.1 7.8 2.4 2.8 9.6 8.2 7.8 9.1 3.5 2.9 3.6 3.3 1.2 5.5 5.1 : : 3.3 4.3
2011 12.3 9.5 7.0 1.7 14.1 8.4 7.7 11.6 6.1 4.5 6.5 6.2 10.5 3.8 7.9 : 3.4 7.1 -0.42012 -0.4 4.5 0.4 0.9 11.8 1.7 3.9 -1.5 0.7 1.7 2.4 2.2 0.0 3.8 16.3 : 1.8 3.5 -0.12013 8.9 0.2 1.2 -1.8 9.5 5.3 4.6 13.5 -0.9 1.0 1.6 1.2 4.5 5.3 0.1 : 16.6 2.7 1.62014 4.9 5.0 3.1 2.6 6.3 5.7 4.4 6.5 3.7 2.6 4.0 3.8 6.8 5.0 7.4 : 5.3 5.0 4.02015 6.5 6.2 4.0 3.7 6.6 6.1 6.0 5.6 5.4 3.2 5.1 5.0 7.6 5.5 9.0 : 4.9 5.6 4.9
1) Weighted in common currency 2) Weighted in common currency; Former EU-15; 1961-91 including D_W _________________________________________________________________________________________________________________________________________________________

104
Foreign trade and current balance
38. Intra EU exports of goods 1)Foreign trade statistics
(Percentage of gross domestic product at market prices)
BE DE EE IE EL ES FR IT CY LV LU NL MT AT PT SI SK FI 2) 3)
1960 19.2 6.1 : 17.5 2.1 3.5 4.3 3.6 : : : 20.0 : 10.4 3.7 : : 12.0
1965 26.6 8.8 : 17.3 2.2 2.2 5.5 5.9 : : : 22.7 : 9.7 5.4 : : 10.5
1970 33.7 10.5 : 18.3 2.9 3.1 7.4 6.7 : : : 25.5 : 10.7 6.1 : : 13.2
1975 33.5 11.5 : 27.7 4.6 3.4 8.2 8.3 : : : 28.7 : 10.1 6.0 : : 10.7
1980 38.8 13.7 : 30.7 4.7 5.0 9.3 9.4 : : : 31.3 : 13.5 9.3 : : 15.6
1981 39.7 14.2 : 27.9 3.8 4.9 9.1 8.8 : : : 34.0 : 13.5 8.3 : : 13.71982 43.0 15.0 : 28.3 4.0 5.3 8.9 9.2 : : : 34.8 : 13.4 9.5 : : 12.41983 44.7 14.5 : 30.5 5.1 6.1 9.2 8.9 : : : 35.4 : 13.4 11.5 : : 12.71984 45.5 15.5 : 34.9 6.0 7.3 9.9 8.8 : : : 37.7 : 14.3 13.9 : : 13.51985 45.6 16.3 : 35.1 5.7 7.4 10.0 9.3 : : : 39.2 : 15.2 14.6 : : 12.71986 44.1 13.6 : 33.3 6.9 6.9 9.5 9.1 : : : 33.8 : 14.9 14.4 : : 12.31987 43.6 15.8 : 36.3 7.3 7.3 9.9 9.1 : : : 32.1 : 15.2 15.4 : : 13.01988 43.2 16.5 : 38.8 5.1 7.5 10.4 9.1 : : : 31.5 : 16.2 15.8 : : 12.21989 47.3 17.7 : 41.2 6.9 7.4 11.8 9.5 : : : 38.1 : 16.7 16.9 : : 11.51990 45.6 16.1 : 38.1 5.8 7.5 11.6 9.3 : : : 38.2 : 16.7 16.7 : : 11.1
1991 44.2 14.0 : 38.2 5.8 7.8 12.1 8.9 : : : 38.7 : 16.0 15.0 : : 11.21992 41.5 13.2 : 39.6 6.1 7.7 11.8 8.6 : : : 36.3 : 15.4 13.9 : : 13.41993 42.9 11.1 : 40.3 4.8 8.2 10.6 9.4 : : : 33.3 : 13.7 13.2 : : 14.81994 43.7 11.5 : 44.1 4.8 9.9 11.6 10.4 : : : 35.7 : 14.2 14.6 : : 16.01995 46.3 12.1 : 48.7 5.1 11.1 12.1 11.8 : : : 34.0 : 15.9 15.5 : : 17.81996 48.5 12.3 : 46.3 4.6 11.7 12.1 11.0 : : : 40.0 : 15.9 16.4 : : 17.51997 51.3 13.2 : 45.2 4.3 12.0 13.2 11.0 : : : 42.5 : 17.8 16.7 : : 17.91998 54.2 14.1 : 50.5 4.3 13.2 13.6 11.4 : : : 41.9 : 19.2 16.5 : : 18.91999 55.4 16.7 35.8 49.6 5.3 12.4 14.6 12.5 2.5 18.3 33.9 43.5 24.0 23.7 16.3 28.4 44.7 21.22000 62.0 18.9 49.3 51.4 5.8 14.5 16.0 13.4 2.6 19.4 35.8 49.1 20.6 26.3 16.9 31.8 52.2 23.8
2001 63.7 19.3 43.1 50.5 5.7 14.2 15.5 13.3 2.5 19.0 42.6 46.9 23.8 27.6 16.3 32.0 54.0 21.02002 64.3 19.4 38.3 47.2 4.3 13.6 14.8 12.7 2.3 19.2 39.8 44.7 21.9 28.7 15.9 34.5 52.8 20.32003 63.2 20.2 37.9 36.4 4.5 13.3 14.6 12.5 2.2 20.4 40.7 44.2 20.9 29.2 15.9 33.7 56.6 19.52004 65.3 21.6 39.6 35.3 4.8 13.0 14.5 12.7 4.1 22.4 43.0 46.8 21.4 30.4 15.4 37.1 57.2 18.92005 68.0 22.7 43.4 34.5 5.0 12.3 13.8 12.9 6.3 24.6 45.4 50.9 20.4 30.0 16.2 41.6 58.3 19.02006 70.1 24.4 37.8 30.9 5.5 12.3 14.4 13.8 5.1 22.2 48.2 54.2 22.2 30.8 17.3 46.0 65.4 21.32007 71.3 25.8 35.1 29.7 5.6 12.4 14.2 14.5 4.6 20.9 39.2 55.0 19.9 32.2 17.4 49.1 67.9 20.82008 71.3 25.3 36.6 29.8 5.6 12.3 13.9 14.0 4.5 20.7 41.4 57.7 16.0 32.0 16.8 47.6 64.4 19.82009 59.1 21.2 32.3 31.4 4.4 10.9 11.5 11.2 3.6 20.2 37.6 48.3 13.8 25.9 14.2 40.8 55.3 14.62010 63.1 23.0 41.7 32.3 5.2 12.6 12.4 12.6 4.0 26.8 31.8 57.1 17.3 29.2 16.3 48.2 62.7 16.0
2011 66.7 24.1 49.1 32.1 6.0 14.0 13.1 13.5 5.0 30.8 30.6 61.7 19.4 30.4 18.6 53.4 70.8 16.82012 64.7 23.4 47.5 32.7 6.3 14.2 12.8 13.5 4.6 31.4 27.0 64.5 18.8 29.6 19.5 53.2 74.3 15.92013 64.9 22.8 47.2 29.8 7.0 14.7 12.6 13.4 5.3 31.0 24.7 63.2 15.6 29.4 20.1 54.6 74.6 16.02014 64.1 23.0 46.5 29.4 7.1 15.1 12.6 13.6 5.0 30.6 24.5 62.5 14.6 29.6 20.3 55.8 75.1 15.82015 65.3 23.6 46.0 29.2 7.1 15.9 13.1 14.0 4.7 30.7 24.9 63.4 15.2 30.6 20.8 58.0 77.2 16.3
1) 1960-1998 Former EU-15, 1999-2001 Former EU-27 2) 1960-1998 including LU 3) 1960-90 D_W
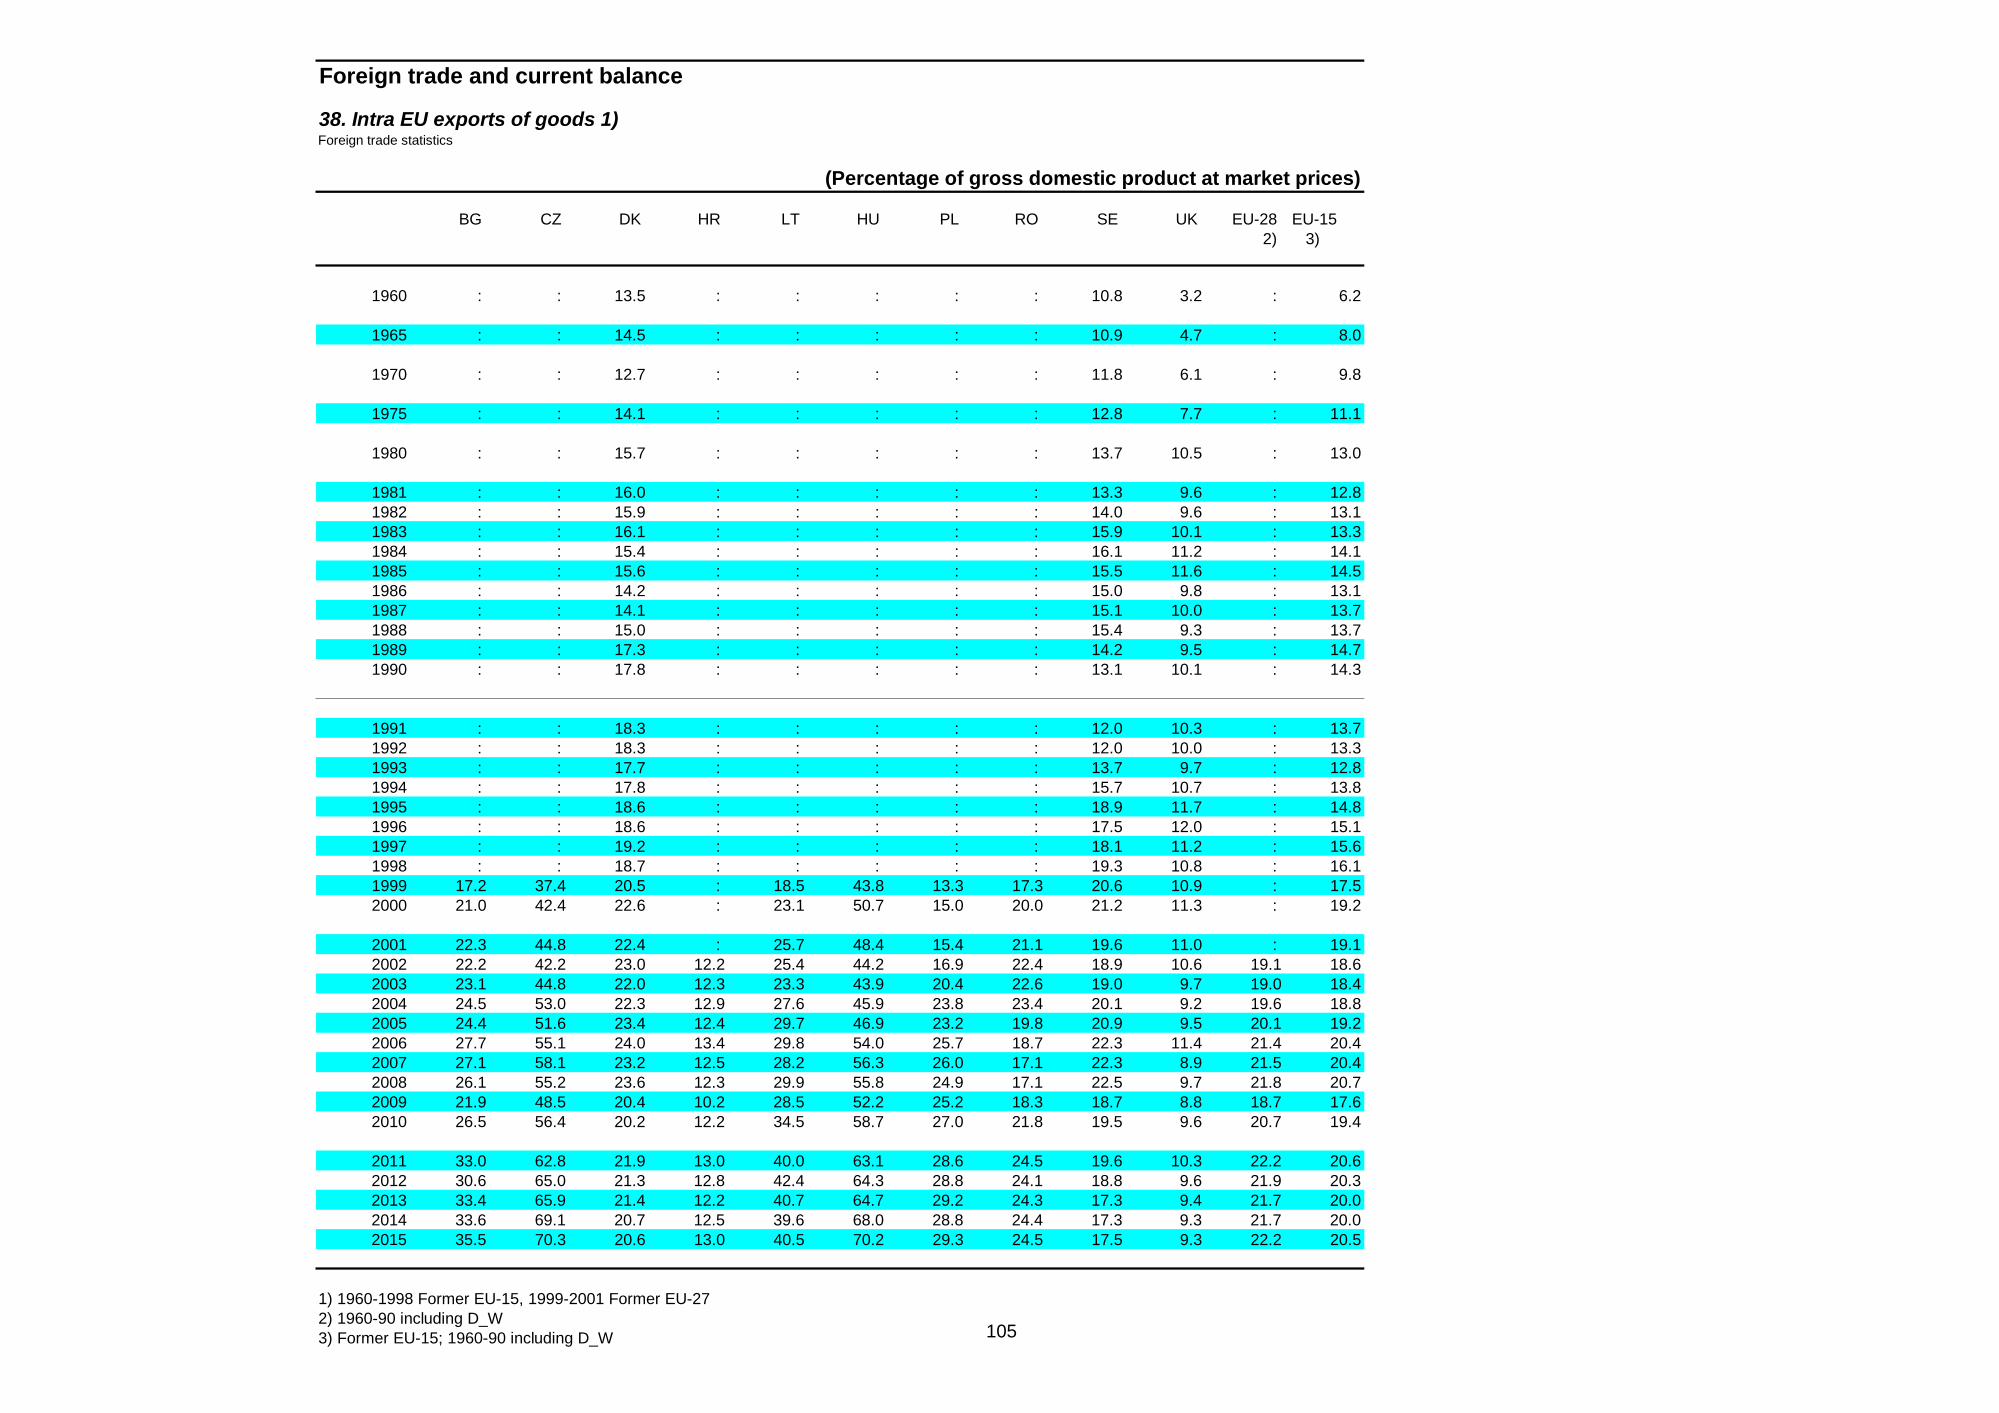
105
Foreign trade and current balance
38. Intra EU exports of goods 1)Foreign trade statistics
(Percentage of gross domestic product at market prices)
BG CZ DK HR LT HU PL RO SE UK EU-28 EU-15 2) 3)
1960 : : 13.5 : : : : : 10.8 3.2 : 6.2
1965 : : 14.5 : : : : : 10.9 4.7 : 8.0
1970 : : 12.7 : : : : : 11.8 6.1 : 9.8
1975 : : 14.1 : : : : : 12.8 7.7 : 11.1
1980 : : 15.7 : : : : : 13.7 10.5 : 13.0
1981 : : 16.0 : : : : : 13.3 9.6 : 12.81982 : : 15.9 : : : : : 14.0 9.6 : 13.11983 : : 16.1 : : : : : 15.9 10.1 : 13.31984 : : 15.4 : : : : : 16.1 11.2 : 14.11985 : : 15.6 : : : : : 15.5 11.6 : 14.51986 : : 14.2 : : : : : 15.0 9.8 : 13.11987 : : 14.1 : : : : : 15.1 10.0 : 13.71988 : : 15.0 : : : : : 15.4 9.3 : 13.71989 : : 17.3 : : : : : 14.2 9.5 : 14.71990 : : 17.8 : : : : : 13.1 10.1 : 14.3
1991 : : 18.3 : : : : : 12.0 10.3 : 13.71992 : : 18.3 : : : : : 12.0 10.0 : 13.31993 : : 17.7 : : : : : 13.7 9.7 : 12.81994 : : 17.8 : : : : : 15.7 10.7 : 13.81995 : : 18.6 : : : : : 18.9 11.7 : 14.81996 : : 18.6 : : : : : 17.5 12.0 : 15.11997 : : 19.2 : : : : : 18.1 11.2 : 15.61998 : : 18.7 : : : : : 19.3 10.8 : 16.11999 17.2 37.4 20.5 : 18.5 43.8 13.3 17.3 20.6 10.9 : 17.52000 21.0 42.4 22.6 : 23.1 50.7 15.0 20.0 21.2 11.3 : 19.2
2001 22.3 44.8 22.4 : 25.7 48.4 15.4 21.1 19.6 11.0 : 19.12002 22.2 42.2 23.0 12.2 25.4 44.2 16.9 22.4 18.9 10.6 19.1 18.62003 23.1 44.8 22.0 12.3 23.3 43.9 20.4 22.6 19.0 9.7 19.0 18.42004 24.5 53.0 22.3 12.9 27.6 45.9 23.8 23.4 20.1 9.2 19.6 18.82005 24.4 51.6 23.4 12.4 29.7 46.9 23.2 19.8 20.9 9.5 20.1 19.22006 27.7 55.1 24.0 13.4 29.8 54.0 25.7 18.7 22.3 11.4 21.4 20.42007 27.1 58.1 23.2 12.5 28.2 56.3 26.0 17.1 22.3 8.9 21.5 20.42008 26.1 55.2 23.6 12.3 29.9 55.8 24.9 17.1 22.5 9.7 21.8 20.72009 21.9 48.5 20.4 10.2 28.5 52.2 25.2 18.3 18.7 8.8 18.7 17.62010 26.5 56.4 20.2 12.2 34.5 58.7 27.0 21.8 19.5 9.6 20.7 19.4
2011 33.0 62.8 21.9 13.0 40.0 63.1 28.6 24.5 19.6 10.3 22.2 20.62012 30.6 65.0 21.3 12.8 42.4 64.3 28.8 24.1 18.8 9.6 21.9 20.32013 33.4 65.9 21.4 12.2 40.7 64.7 29.2 24.3 17.3 9.4 21.7 20.02014 33.6 69.1 20.7 12.5 39.6 68.0 28.8 24.4 17.3 9.3 21.7 20.02015 35.5 70.3 20.6 13.0 40.5 70.2 29.3 24.5 17.5 9.3 22.2 20.5
1) 1960-1998 Former EU-15, 1999-2001 Former EU-27 2) 1960-90 including D_W 3) Former EU-15; 1960-90 including D_W
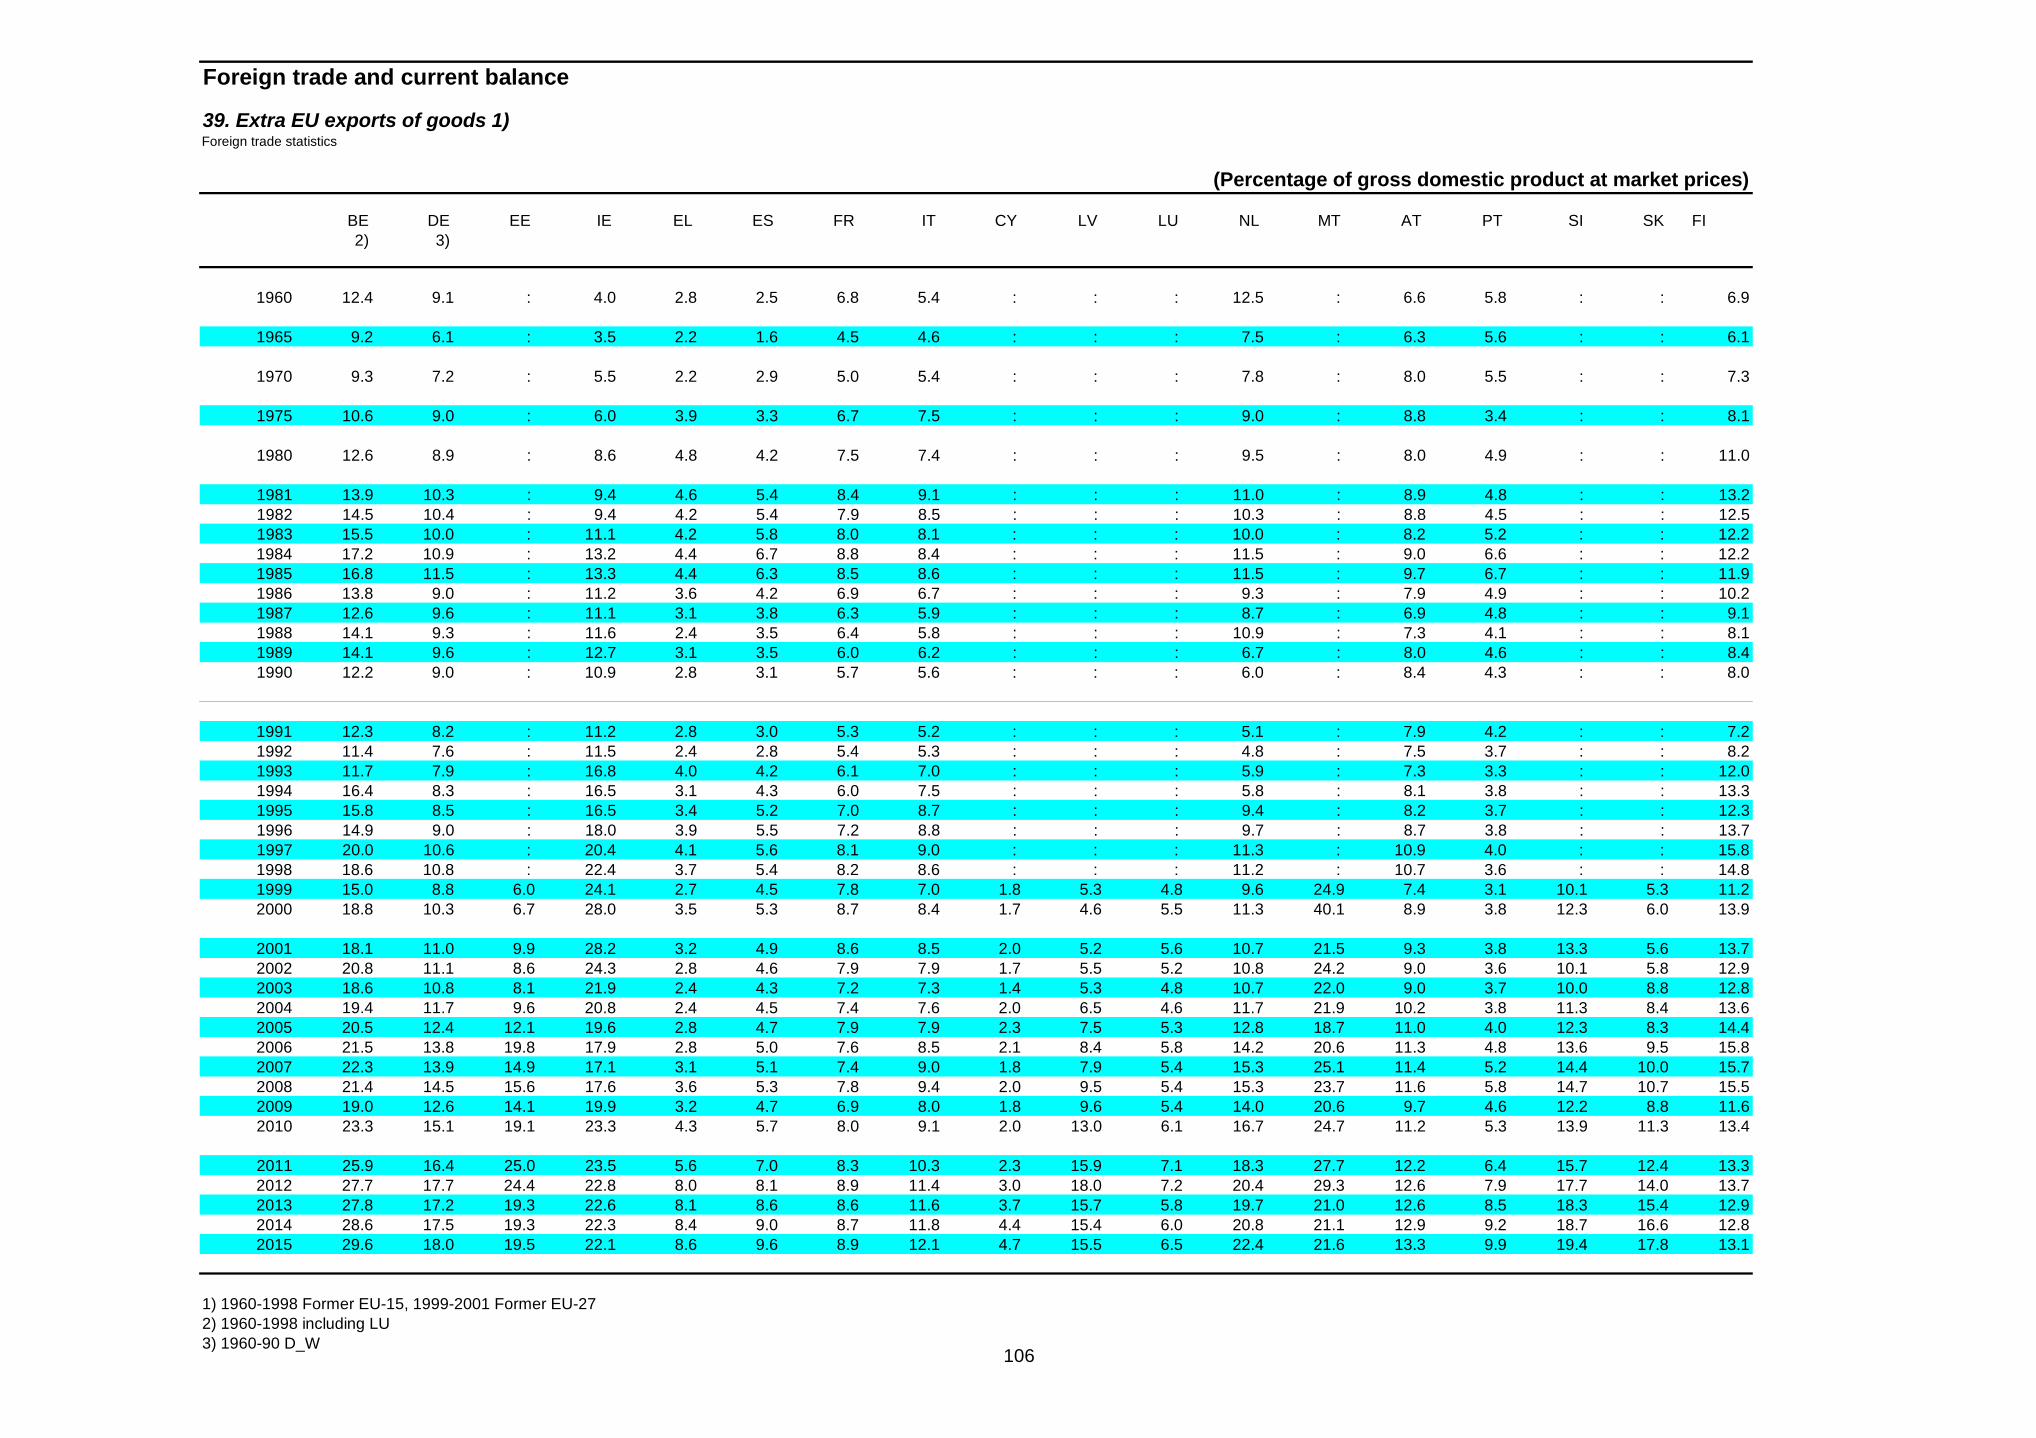
106
Foreign trade and current balance
39. Extra EU exports of goods 1)Foreign trade statistics
(Percentage of gross domestic product at market prices)
BE DE EE IE EL ES FR IT CY LV LU NL MT AT PT SI SK FI 2) 3)
1960 12.4 9.1 : 4.0 2.8 2.5 6.8 5.4 : : : 12.5 : 6.6 5.8 : : 6.9
1965 9.2 6.1 : 3.5 2.2 1.6 4.5 4.6 : : : 7.5 : 6.3 5.6 : : 6.1
1970 9.3 7.2 : 5.5 2.2 2.9 5.0 5.4 : : : 7.8 : 8.0 5.5 : : 7.3
1975 10.6 9.0 : 6.0 3.9 3.3 6.7 7.5 : : : 9.0 : 8.8 3.4 : : 8.1
1980 12.6 8.9 : 8.6 4.8 4.2 7.5 7.4 : : : 9.5 : 8.0 4.9 : : 11.0
1981 13.9 10.3 : 9.4 4.6 5.4 8.4 9.1 : : : 11.0 : 8.9 4.8 : : 13.21982 14.5 10.4 : 9.4 4.2 5.4 7.9 8.5 : : : 10.3 : 8.8 4.5 : : 12.51983 15.5 10.0 : 11.1 4.2 5.8 8.0 8.1 : : : 10.0 : 8.2 5.2 : : 12.21984 17.2 10.9 : 13.2 4.4 6.7 8.8 8.4 : : : 11.5 : 9.0 6.6 : : 12.21985 16.8 11.5 : 13.3 4.4 6.3 8.5 8.6 : : : 11.5 : 9.7 6.7 : : 11.91986 13.8 9.0 : 11.2 3.6 4.2 6.9 6.7 : : : 9.3 : 7.9 4.9 : : 10.21987 12.6 9.6 : 11.1 3.1 3.8 6.3 5.9 : : : 8.7 : 6.9 4.8 : : 9.11988 14.1 9.3 : 11.6 2.4 3.5 6.4 5.8 : : : 10.9 : 7.3 4.1 : : 8.11989 14.1 9.6 : 12.7 3.1 3.5 6.0 6.2 : : : 6.7 : 8.0 4.6 : : 8.41990 12.2 9.0 : 10.9 2.8 3.1 5.7 5.6 : : : 6.0 : 8.4 4.3 : : 8.0
1991 12.3 8.2 : 11.2 2.8 3.0 5.3 5.2 : : : 5.1 : 7.9 4.2 : : 7.21992 11.4 7.6 : 11.5 2.4 2.8 5.4 5.3 : : : 4.8 : 7.5 3.7 : : 8.21993 11.7 7.9 : 16.8 4.0 4.2 6.1 7.0 : : : 5.9 : 7.3 3.3 : : 12.01994 16.4 8.3 : 16.5 3.1 4.3 6.0 7.5 : : : 5.8 : 8.1 3.8 : : 13.31995 15.8 8.5 : 16.5 3.4 5.2 7.0 8.7 : : : 9.4 : 8.2 3.7 : : 12.31996 14.9 9.0 : 18.0 3.9 5.5 7.2 8.8 : : : 9.7 : 8.7 3.8 : : 13.71997 20.0 10.6 : 20.4 4.1 5.6 8.1 9.0 : : : 11.3 : 10.9 4.0 : : 15.81998 18.6 10.8 : 22.4 3.7 5.4 8.2 8.6 : : : 11.2 : 10.7 3.6 : : 14.81999 15.0 8.8 6.0 24.1 2.7 4.5 7.8 7.0 1.8 5.3 4.8 9.6 24.9 7.4 3.1 10.1 5.3 11.22000 18.8 10.3 6.7 28.0 3.5 5.3 8.7 8.4 1.7 4.6 5.5 11.3 40.1 8.9 3.8 12.3 6.0 13.9
2001 18.1 11.0 9.9 28.2 3.2 4.9 8.6 8.5 2.0 5.2 5.6 10.7 21.5 9.3 3.8 13.3 5.6 13.72002 20.8 11.1 8.6 24.3 2.8 4.6 7.9 7.9 1.7 5.5 5.2 10.8 24.2 9.0 3.6 10.1 5.8 12.92003 18.6 10.8 8.1 21.9 2.4 4.3 7.2 7.3 1.4 5.3 4.8 10.7 22.0 9.0 3.7 10.0 8.8 12.82004 19.4 11.7 9.6 20.8 2.4 4.5 7.4 7.6 2.0 6.5 4.6 11.7 21.9 10.2 3.8 11.3 8.4 13.62005 20.5 12.4 12.1 19.6 2.8 4.7 7.9 7.9 2.3 7.5 5.3 12.8 18.7 11.0 4.0 12.3 8.3 14.42006 21.5 13.8 19.8 17.9 2.8 5.0 7.6 8.5 2.1 8.4 5.8 14.2 20.6 11.3 4.8 13.6 9.5 15.82007 22.3 13.9 14.9 17.1 3.1 5.1 7.4 9.0 1.8 7.9 5.4 15.3 25.1 11.4 5.2 14.4 10.0 15.72008 21.4 14.5 15.6 17.6 3.6 5.3 7.8 9.4 2.0 9.5 5.4 15.3 23.7 11.6 5.8 14.7 10.7 15.52009 19.0 12.6 14.1 19.9 3.2 4.7 6.9 8.0 1.8 9.6 5.4 14.0 20.6 9.7 4.6 12.2 8.8 11.62010 23.3 15.1 19.1 23.3 4.3 5.7 8.0 9.1 2.0 13.0 6.1 16.7 24.7 11.2 5.3 13.9 11.3 13.4
2011 25.9 16.4 25.0 23.5 5.6 7.0 8.3 10.3 2.3 15.9 7.1 18.3 27.7 12.2 6.4 15.7 12.4 13.32012 27.7 17.7 24.4 22.8 8.0 8.1 8.9 11.4 3.0 18.0 7.2 20.4 29.3 12.6 7.9 17.7 14.0 13.72013 27.8 17.2 19.3 22.6 8.1 8.6 8.6 11.6 3.7 15.7 5.8 19.7 21.0 12.6 8.5 18.3 15.4 12.92014 28.6 17.5 19.3 22.3 8.4 9.0 8.7 11.8 4.4 15.4 6.0 20.8 21.1 12.9 9.2 18.7 16.6 12.82015 29.6 18.0 19.5 22.1 8.6 9.6 8.9 12.1 4.7 15.5 6.5 22.4 21.6 13.3 9.9 19.4 17.8 13.1
1) 1960-1998 Former EU-15, 1999-2001 Former EU-27 2) 1960-1998 including LU 3) 1960-90 D_W

107
Foreign trade and current balance
39. Extra EU exports of goods 1)Foreign trade statistics
(Percentage of gross domestic product at market prices)
BG CZ DK HR LT HU PL RO SE UK EU-28 EU-15 2) 3)
1960 : : 10.3 : : : : : 6.5 10.9 : 8.3
1965 : : 7.3 : : : : : 6.2 8.6 : 6.0
1970 : : 7.5 : : : : : 7.4 9.5 : 6.7
1975 : : 7.9 : : : : : 9.7 11.1 : 8.1
1980 : : 8.6 : : : : : 9.2 9.7 : 8.3
1981 : : 10.6 : : : : : 9.9 10.1 : 9.41982 : : 10.2 : : : : : 10.6 10.0 : 9.21983 : : 11.0 : : : : : 11.6 9.5 : 9.11984 : : 12.1 : : : : : 12.2 10.0 : 9.91985 : : 12.1 : : : : : 12.2 9.9 : 9.91986 : : 10.3 : : : : : 11.0 8.9 : 8.11987 : : 9.7 : : : : : 10.5 8.6 : 7.71988 : : 9.3 : : : : : 9.9 7.8 : 7.61989 : : 7.9 : : : : : 10.5 8.3 : 7.61990 : : 7.1 : : : : : 9.8 7.9 : 7.0
1991 : : 7.3 : : : : : 9.2 7.1 : 6.51992 : : 9.0 : : : : : 8.7 7.1 : 6.41993 : : 7.8 : : : : : 10.9 8.4 : 7.31994 : : 8.0 : : : : : 12.4 8.2 : 7.71995 : : 7.7 : : : : : 10.6 8.2 : 8.31996 : : 7.6 : : : : : 10.6 8.6 : 8.51997 : : 9.7 : : : : : 14.5 9.0 : 9.71998 : : 9.5 : : : : : 14.0 7.8 : 9.41999 12.9 5.3 8.4 : 6.6 8.1 3.0 6.4 12.3 7.0 : 8.12000 16.4 7.0 9.4 : 7.8 9.9 3.5 7.7 14.0 7.7 : 9.3
2001 14.4 7.0 9.8 : 9.3 9.4 3.6 6.9 13.7 7.4 : 9.42002 13.4 6.7 9.9 6.3 11.2 7.6 3.8 7.8 13.4 6.6 8.9 9.02003 13.2 6.2 9.2 5.7 13.8 7.7 4.4 7.1 13.3 6.6 8.5 8.62004 14.6 7.4 9.2 6.7 13.4 8.5 5.7 7.6 13.9 6.4 8.9 8.92005 15.3 8.4 9.6 7.2 15.5 10.1 6.2 8.1 14.4 7.3 9.4 9.52006 16.7 8.8 9.7 7.4 17.0 12.9 6.7 7.7 14.7 6.8 9.8 9.82007 16.8 9.6 9.8 8.2 15.3 13.7 6.8 6.5 14.1 6.5 9.9 9.92008 16.8 9.5 10.2 7.9 19.7 14.2 7.0 7.0 14.9 7.8 10.4 10.52009 11.6 8.5 9.7 6.6 15.8 12.9 6.3 6.3 13.3 7.2 9.3 9.32010 16.7 10.5 10.6 7.8 22.0 16.2 7.0 8.3 14.6 8.6 11.0 11.0
2011 19.7 12.5 11.6 8.7 25.1 18.4 8.0 9.9 15.3 10.2 12.2 12.32012 21.4 14.9 12.2 9.2 27.6 18.8 9.0 10.1 14.2 9.5 13.0 13.02013 22.1 15.4 12.2 8.7 30.2 18.3 9.8 10.6 12.7 12.1 13.3 13.22014 22.3 16.4 12.8 8.9 30.2 17.9 9.9 10.7 12.6 12.0 13.5 13.52015 22.9 17.8 13.4 9.3 30.8 17.4 10.2 11.0 12.8 12.0 13.9 13.9
1) 1960-1998 Former EU-15, 1999-2001 Former EU-27 2) 1960-90 including D_W 3) Former EU-15; 1960-90 including D_W

108
Foreign trade and current balance
40. Imports of goods and services at current prices (National accounts)
(Percentage of gross domestic product at market prices)
BE DE EE IE EL ES FR IT CY LV LU MT NL AT PT SI SK FI EA-18 EA-12 1) 2) 3)
1960 36.7 16.6 : 34.4 17.4 6.9 12.4 12.7 43.9 : 69.3 60.6 45.5 23.5 20.1 : : 22.3 : 17.5
1965 40.0 17.9 : 40.5 20.3 13.0 12.3 12.0 40.9 : 75.1 61.6 43.1 24.2 23.6 : : 21.1 : 18.1
1970 46.0 19.2 : 41.5 18.1 13.2 15.3 15.4 48.1 : 71.2 69.1 45.9 28.3 25.5 : : 25.9 : 20.6
1975 49.8 21.8 : 45.0 25.1 16.2 17.8 19.2 57.4 : 82.8 83.6 45.6 29.4 24.5 : : 28.5 : 23.5
1980 57.8 27.0 : 58.1 29.9 16.9 23.0 23.4 63.8 : 83.8 83.7 52.4 36.2 35.1 : : 32.5 : 28.5
1981 61.3 27.9 : 57.8 30.5 18.6 23.9 24.3 64.1 : 84.1 78.1 53.0 36.5 38.0 : : 30.7 : 29.41982 65.3 27.3 : 51.1 29.2 19.1 24.4 23.0 65.0 : 85.2 74.2 52.6 33.4 38.2 : : 29.0 : 29.01983 65.5 27.0 : 50.9 29.3 20.2 23.2 20.4 64.8 : 84.6 71.4 53.3 33.0 35.4 : : 29.1 : 28.21984 69.7 28.4 : 55.1 28.5 19.8 24.2 22.0 67.9 : 93.4 74.1 55.3 34.9 37.0 : : 27.5 : 29.41985 67.1 29.0 : 53.8 28.7 19.5 24.3 22.1 59.6 : 97.1 76.7 57.9 36.2 34.7 : : 27.8 : 29.61986 60.1 25.1 : 48.4 29.6 16.7 21.0 18.0 49.3 : 88.4 71.5 49.2 33.0 30.7 : : 24.7 : 25.51987 59.0 24.4 : 48.7 28.7 18.1 21.2 18.1 50.9 : 90.1 76.0 49.0 32.4 35.1 : : 24.9 : 25.41988 62.2 24.9 : 50.4 27.6 18.9 21.6 18.0 54.3 : 90.0 77.4 51.2 34.5 38.3 : : 24.6 : 26.01989 67.0 26.6 : 54.4 29.4 20.3 22.9 19.1 60.6 : 89.3 79.9 54.1 36.6 38.0 : : 25.3 : 27.51990 65.3 26.7 : 51.3 30.0 19.4 22.4 18.8 57.7 43.5 88.2 85.9 52.6 36.9 37.7 75.6 35.4 24.1 : 27.0
1991 28.1 27.0
1991 63.7 26.1 : 51.9 28.9 19.2 22.2 17.5 57.8 22.6 89.2 85.1 53.1 36.5 35.5 71.4 49.1 22.6 : 26.41992 61.4 24.4 : 52.1 28.4 19.3 21.2 18.1 61.4 64.9 84.1 85.9 51.6 35.5 33.2 54.1 74.0 25.2 : 25.71993 57.8 21.8 70.3 54.3 27.2 18.8 19.6 18.1 48.4 50.6 82.7 91.2 49.2 32.8 31.4 55.5 60.8 27.3 24.6 24.41994 59.8 22.5 81.7 59.7 25.7 20.8 20.6 19.3 48.5 39.4 83.8 92.8 51.2 34.9 33.0 55.6 53.9 29.1 25.9 25.71995 61.4 23.1 75.6 63.8 26.9 22.4 21.5 21.9 50.5 44.1 85.2 93.3 53.7 35.8 33.9 51.5 55.5 29.0 27.4 27.11996 62.5 23.8 72.9 65.3 27.5 23.1 21.8 20.0 54.1 53.6 90.9 87.2 54.4 37.0 34.4 50.9 64.1 30.2 27.5 27.31997 66.0 26.1 82.6 66.5 29.1 25.5 23.1 21.3 54.1 53.4 103.6 81.2 57.6 39.8 35.9 52.2 66.0 31.4 29.6 29.31998 65.9 27.2 84.6 75.2 30.4 26.9 23.9 21.9 51.2 57.0 111.1 81.8 57.9 40.3 37.2 52.6 70.0 30.5 30.7 30.41999 65.8 28.5 75.3 75.2 33.4 28.5 24.2 22.4 50.3 49.3 115.0 85.1 58.8 40.9 37.4 51.4 65.7 29.7 31.6 31.32000 75.2 33.1 88.2 84.2 39.6 32.2 27.8 25.8 55.2 49.0 129.0 96.6 64.5 44.5 39.9 57.2 73.0 34.4 36.2 35.9
2001 74.2 32.8 82.3 84.2 38.4 31.1 27.2 25.5 54.3 51.7 129.0 80.5 61.5 45.9 38.3 56.0 80.8 32.1 35.6 35.32002 71.0 31.2 78.3 76.6 35.7 29.4 26.0 24.5 52.7 51.1 121.1 77.7 57.6 43.9 35.9 53.9 78.4 31.3 33.9 33.62003 68.5 31.8 76.7 67.3 33.3 28.7 25.0 23.9 48.8 54.8 113.2 76.8 56.7 44.7 34.4 54.0 77.8 31.9 33.4 33.02004 71.0 33.5 80.1 68.6 33.5 29.9 25.7 24.5 50.8 59.7 128.2 78.6 59.0 47.7 36.4 59.1 77.3 33.3 34.8 34.42005 74.7 36.1 84.2 69.6 32.5 30.9 27.0 25.9 51.2 62.6 130.3 78.1 61.1 49.9 37.1 62.6 80.9 37.7 36.7 36.22006 77.0 39.9 82.9 69.6 34.6 32.7 28.1 28.4 51.8 66.6 139.1 93.5 65.1 51.3 39.6 67.1 88.5 40.8 39.3 38.82007 78.7 40.2 76.3 71.4 37.9 33.6 28.4 29.1 54.5 62.6 143.6 93.4 66.0 53.2 40.2 71.2 88.0 40.7 40.1 39.52008 83.6 41.9 75.1 74.3 38.6 32.3 29.1 29.3 57.0 56.8 151.8 93.6 68.0 53.5 42.5 70.4 85.9 43.1 41.1 40.52009 71.0 37.5 58.3 74.2 30.7 25.8 25.2 24.3 46.5 45.4 131.0 84.1 61.6 45.6 35.4 57.2 71.1 35.7 35.6 35.12010 77.7 42.0 72.3 81.2 31.5 29.5 27.8 28.5 48.2 54.9 140.0 91.0 70.6 50.0 39.0 65.3 80.6 39.0 40.0 39.5
2011 84.2 45.4 86.8 81.1 33.1 31.9 29.9 30.2 47.9 63.6 148.0 94.5 75.3 54.3 40.1 71.5 89.0 41.7 43.0 42.32012 85.0 45.9 90.3 83.6 32.1 31.9 29.7 29.2 46.7 65.5 148.2 96.5 79.6 54.0 39.3 71.3 91.4 41.6 43.3 42.72013 84.0 44.3 87.2 84.6 31.8 31.7 29.2 28.0 43.5 61.5 143.1 86.4 78.2 52.8 39.5 71.5 91.3 40.2 42.4 41.72014 83.7 44.7 86.8 84.9 31.3 32.0 29.4 27.9 42.7 60.9 141.2 85.7 78.5 52.9 39.6 72.5 92.5 39.4 42.7 42.02015 86.6 46.4 87.0 84.9 30.9 33.3 30.4 28.9 42.5 61.7 145.3 87.4 81.1 54.6 40.4 75.1 95.8 40.5 44.1 43.4
1) 1960-91 D_W 2) Euro area; 1960-91 including D_W 3) Former Euro area 12; 1960-91 including D_W

109
Foreign trade and current balance
40. Imports of goods and services at current prices (National accounts)
(Percentage of gross domestic product at market prices)
BG CZ DK HR LT HU PL RO SE UK EU-28 EU-15 MK IS TR ME RS US JP 1) 2)
1960 : : 34.7 : : : : : 22.8 21.1 : 18.9 : 45.7 4.2 : : 4.2 10.1
1965 : : 31.9 : : : : : 22.0 19.2 : 18.8 : 34.7 3.7 : : 4.2 9.0
1970 : : 31.7 : : : : : 23.9 21.3 : 21.1 : 43.3 4.2 : : 5.2 9.4
1975 : : 31.9 : : : : : 27.5 26.7 : 24.3 : 41.6 8.2 : : 7.3 12.6
1980 : : 34.8 : : 41.5 30.4 20.4 30.1 24.6 : 28.1 : 35.5 8.5 : : 10.3 14.4
1981 : : 36.6 : : 40.8 24.7 23.1 29.2 23.5 : 28.6 : 36.1 9.1 : : 9.9 13.71982 : : 36.9 : : 37.4 17.0 17.0 32.0 24.0 : 28.4 : 36.9 10.6 : : 9.1 13.61983 : : 35.5 : : 38.5 15.1 17.1 32.7 25.2 : 28.0 : 37.5 11.7 : : 9.0 12.01984 : : 36.6 : : 38.1 15.4 18.4 31.9 28.0 : 29.4 : 38.0 14.0 : : 10.0 12.11985 : : 37.7 : : 40.3 16.5 18.3 32.8 27.2 : 29.5 : 40.1 13.4 : : 9.6 10.81986 : : 34.3 : : 41.3 16.4 16.6 29.1 25.9 : 25.9 : 34.7 11.5 : : 9.9 7.21987 : : 31.4 : : 38.6 18.6 16.3 29.9 26.0 : 25.8 : 35.3 12.8 : : 10.4 7.21988 : : 32.0 : : 34.3 19.6 14.4 29.9 26.0 : 26.2 : 32.6 12.7 : : 10.5 7.61989 : : 33.5 : : 32.9 14.6 16.7 30.8 27.1 : 27.7 : 31.3 12.9 : : 10.4 8.81990 : 36.5 32.6 : 58 28.7 19.7 24.0 29.2 25.9 : 27.0 : 32.3 12.7 : : 10.5 9.4
1991 26.6
1991 39.2 39.2 33.1 : 20 33.9 23.3 19.8 26.2 23.6 : 26.1 : 32.5 12.0 : : 10.1 8.31992 52.9 46.2 31.6 : 19.0 31.9 20.3 33.3 26.0 24.2 : 25.6 : 30.4 12.5 : : 10.2 7.61993 45.8 46.4 30.7 : 86.0 34.8 20.1 25.7 29.0 25.7 : 24.8 : 29.6 14.0 : : 10.5 6.91994 45.7 45.7 32.4 : 58.4 35.6 19.7 24.8 31.6 26.4 : 26.1 : 30.6 14.7 : : 11.1 7.01995 49.9 51.7 33.5 41.5 58.1 44.9 21.0 30.5 32.9 27.9 27.9 27.5 42.8 31.9 17.6 : : 11.8 7.71996 56.8 51.7 33.0 42.5 59.2 48.3 23.7 34.3 31.9 28.7 28.3 27.7 38.5 35.7 20.1 : : 11.9 9.21997 53.4 54.3 35.2 48.8 61.7 54.1 27.3 35.0 34.6 27.7 30.0 29.3 50.8 35.7 22.0 : 25 12.3 9.71998 58.1 52.8 36.2 42.2 56.5 63.0 30.8 30.8 36.4 26.9 30.8 30.1 56.1 39.2 20.2 : 30 12.3 8.91999 60.6 53.9 35.7 42.7 48.7 67.1 30.1 32.4 36.6 27.3 31.5 30.9 52.2 38.3 19.3 : 17.7 12.9 8.62000 55.8 63.1 40.6 44.8 50.8 78.1 33.5 38.1 40.2 29.2 35.6 34.9 63.5 40.9 23.1 51.1 16.7 14.3 9.4
2001 58.1 64.1 40.6 47.2 55.1 73.0 30.7 40.7 39.6 29.2 35.2 34.4 56.6 39.9 23.3 62.0 41.3 13.2 9.82002 55.5 58.8 41.4 49.1 58.2 65.1 32.1 41.0 37.6 28.6 33.8 32.9 58.2 35.9 23.6 59.9 41.8 13.0 9.92003 58.9 60.3 39.1 50.3 56.8 65.2 36.0 42.3 36.7 27.8 33.3 32.3 54.5 37.4 24.0 47.0 43.4 13.4 10.22004 63.4 62.1 40.5 49.1 58.9 66.9 39.8 44.8 37.8 27.9 34.6 33.4 60.1 39.7 26.2 58.1 50.8 14.6 11.32005 55.6 61.7 44.1 48.6 64.4 68.1 37.8 43.2 40.6 29.4 36.4 35.3 61.1 44.0 25.4 61.1 47.9 15.5 12.92006 78.8 64.0 48.9 49.6 69.0 78.7 42.2 44.3 43.0 31.3 39.1 37.8 64.5 50.5 27.6 79.1 51.5 16.2 14.92007 79.2 65.6 49.9 49.5 67.1 80.4 43.6 43.2 44.4 29.2 39.5 38.0 70.8 45.3 27.5 86.7 56.5 16.4 16.12008 78.7 62.1 51.6 49.8 71.5 81.2 43.9 43.5 46.8 31.6 41.0 39.5 76.2 47.2 28.3 94.0 58.2 17.4 17.52009 56.3 54.9 43.7 40.1 56.0 72.7 39.4 36.6 41.5 30.0 35.9 34.7 61.0 44.2 24.4 65.4 47.1 13.7 12.32010 59.3 63.2 44.9 40.2 69.7 79.4 43.4 41.2 43.3 32.3 39.9 38.6 65.3 46.3 26.8 63.1 53.0 15.8 14.0
2011 66.5 68.7 48.4 42.8 79.9 85.2 46.2 45.3 44.3 33.6 42.7 41.2 74.5 50.7 32.6 64.9 53.0 17.2 16.02012 69.7 72.4 49.7 43.0 83.1 87.3 46.4 45.4 42.7 33.9 43.0 41.4 76.3 53.3 31.5 68.8 58.2 16.9 16.72013 71.2 72.2 49.3 42.4 85.7 88.0 45.4 42.7 40.0 33.0 42.1 40.5 72.6 50.1 32.3 64.3 56.4 16.4 19.02014 71.6 75.1 49.3 43.2 85.5 91.1 45.0 43.1 40.5 32.3 42.2 40.5 75.5 48.9 33.4 63.0 56.8 16.3 19.82015 74.6 77.2 50.2 44.1 88.1 92.9 46.5 44.0 41.3 31.9 43.3 41.6 79.2 50.3 31.6 63.4 57.4 16.6 20.1
1) 1960-91 including D_W 2) Former EU-15; 1960-91 including D_W

110
Foreign trade and current balance
41. Imports of goods and services at 2005 prices
(National currency; annual percentage change)
BE DE EE IE EL ES FR IT CY LV LU MT NL AT PT SI SK FI EA-18 EA-12 1) 2) 3)
1961-1970 8.5 9.9 : 9.8 11.3 18.5 10.5 11.3 : : 6.1 : 9.8 8.3 11.2 : : 7.8 : 10.2
1971-1980 5.0 5.3 : 6.5 8.0 6.3 7.0 4.7 : : 3.5 : 4.3 6.9 6.3 : : 4.2 : 5.6
1981 -1.9 -3.0 : 1.7 6.5 -3.6 -1.3 -0.8 : : -2.9 : -2.6 -0.6 6.6 : : -4.6 : -1.81982 1.4 -0.8 : -3.1 -2.6 4.9 3.6 -0.1 : : -0.3 : -1.1 -3.6 5.9 : : 2.2 : 0.71983 -1.2 2.7 : 4.7 2.6 -1.2 -2.6 -3.1 : : 1.2 : 3.7 4.2 -6.5 : : 4.1 : 0.31984 6.4 5.3 : 9.9 -2.1 -1.3 3.4 12.8 : : 13.9 : 5.6 6.6 -2.1 : : 0.9 : 5.51985 0.4 4.0 : 3.2 4.4 7.5 4.8 4.3 : : 7.0 : 5.2 5.5 4.6 : : 6.4 : 4.31986 4.6 3.2 : 6.3 13.9 17.2 6.7 5.3 : : 1.7 : 2.8 -3.5 18.8 : : 3.5 : 5.21987 6.8 4.6 : 6.2 2.1 24.8 7.7 12.0 : : 7.3 : 3.5 3.8 27.4 : : 8.8 : 7.71988 10.4 5.5 : 4.9 7.3 16.1 8.5 6.0 : : 10.5 : 8.5 9.4 21.6 : : 10.6 : 8.11989 9.7 8.6 : 13.5 10.5 17.7 8.1 8.5 : : 9.1 : 7.8 10.2 8.5 : : 9.0 : 9.31990 4.9 10.8 : 5.1 8.4 9.6 5.0 9.6 : : 5.0 : 4.0 8.0 16.1 : : -0.3 : 7.7
1981-1990 4.0 4.0 : 5.1 5.0 8.8 4.3 5.3 : : 5.1 : 3.7 3.9 9.6 : : 4.0 : 4.6
1991 2.9 10.9 : 2.4 5.8 10.3 2.9 1.9 : : 9.1 : 6.3 5.1 8.4 -22.4 : -13.3 : 5.81992 4.1 2.8 : 8.2 1.1 6.8 1.7 7.1 : : -3.1 : 2.9 2.1 11.0 -22.9 : 0.6 : 3.71993 -0.4 -6.5 : 7.5 0.6 -5.2 -3.4 -11.2 : : 5.2 : 0.4 -5.5 -1.5 17.6 -0.4 1.3 : -4.51994 7.3 8.5 11.2 15.5 1.5 11.4 8.8 8.0 : : 6.7 : 9.0 10.3 10.6 13.1 -4.7 13.0 : 8.81995 4.7 7.0 6.3 16.4 8.9 11.1 7.4 9.6 16.6 : 4.2 : 10.2 5.9 9.4 11.3 11.6 8.2 : 8.01996 4.2 4.4 8.5 12.8 7.0 8.8 2.2 -0.7 7.9 26.4 5.4 -5.9 5.3 4.4 5.8 2.1 17.3 7.2 4.2 4.11997 8.9 8.6 28.6 16.5 14.2 13.3 7.9 9.5 0.9 7.0 12.6 -1.7 11.9 7.7 10.5 11.3 7.9 11.9 9.7 9.71998 5.6 9.5 12.5 27.5 9.2 14.8 11.6 9.0 1.9 19.3 11.8 2.5 9.0 5.2 14.7 9.6 19.1 8.7 10.3 10.21999 2.7 8.6 -5.9 12.6 15.0 13.7 6.6 4.5 3.3 -5.1 14.8 10.1 9.3 4.7 9.0 7.8 0.4 4.2 7.7 7.82000 12.2 10.5 27.1 21.5 15.1 10.8 14.8 9.7 12.6 3.1 10.5 10.4 12.2 10.7 5.6 7.1 8.1 16.7 11.9 11.9
1991-2000 5.2 6.3 : 13.9 7.7 9.4 5.9 4.5 : : 7.6 : 7.6 5.0 8.3 2.4 : 5.5 : 6.5
2001 0.2 1.2 4.8 7.3 1.2 4.5 2.2 1.9 5.3 14.3 6.0 -11.1 2.5 5.6 1.0 3.1 13.4 1.3 2.4 2.32002 0.7 -1.2 7.2 2.4 -1.3 3.7 1.7 0.2 -0.2 4.7 0.8 0.5 0.3 -0.5 -0.5 4.9 4.4 3.2 0.6 0.52003 0.5 5.5 11.2 -1.3 3.0 6.2 0.8 2.1 -0.3 12.9 6.9 3.9 1.8 4.5 -0.5 6.7 7.4 3.2 3.1 3.02004 6.1 8.2 14.7 8.7 5.7 9.6 5.9 4.8 10.3 16.9 11.8 4.7 5.7 9.8 7.6 13.3 8.3 7.4 7.2 7.12005 5.0 6.2 18.9 8.4 -1.5 7.7 5.6 3.5 3.7 14.4 4.2 2.8 5.4 6.4 2.3 6.7 12.3 11.4 5.7 5.62006 5.0 11.8 13.9 6.9 11.1 10.2 5.1 7.9 6.8 19.6 12.8 16.1 8.8 5.2 7.2 12.2 17.8 7.9 8.8 8.62007 5.5 5.4 6.3 7.9 14.5 8.0 5.5 5.2 13.4 16.4 9.3 0.5 5.6 7.1 5.5 16.7 9.2 7.0 6.3 6.12008 2.7 3.4 -7.0 -3.0 0.9 -5.2 0.9 -3.0 8.5 -10.2 6.1 1.3 2.3 0.0 2.3 3.7 3.1 7.5 0.8 0.82009 -8.8 -7.8 -31.1 -9.8 -20.2 -17.2 -9.6 -13.4 -18.6 -31.7 -15.4 -8.4 -7.1 -13.6 -10.0 -19.2 -18.9 -17.2 -11.0 -10.62010 7.5 12.5 21.1 3.6 -6.2 9.3 8.9 12.6 4.8 11.8 11.4 13.3 10.3 9.1 8.0 7.4 14.9 6.8 10.0 9.9
2001-2010 2.3 4.4 4.8 3.0 0.3 3.3 2.6 2.0 3.0 5.6 5.1 2.0 3.5 3.1 2.2 5.1 6.7 3.6 3.2 3.2
2011 6.8 7.4 28.4 -0.4 -7.3 -0.1 5.1 0.8 -0.2 22.3 7.4 1.6 4.2 7.6 -5.3 5.6 9.7 6.2 4.5 4.32012 1.3 1.4 8.8 0.0 -13.8 -5.7 -1.1 -7.0 -5.4 4.5 -1.0 6.2 3.3 -0.3 -6.6 -4.7 3.3 -0.7 -0.9 -1.02013 0.9 0.9 2.6 1.0 -5.3 0.4 0.5 -2.8 -14.1 -1.7 1.2 -5.2 -0.2 0.6 2.8 1.3 2.9 -1.8 0.2 0.12014 2.7 5.4 3.9 3.1 -1.2 3.4 3.1 2.7 -7.2 3.9 3.2 3.6 3.4 3.7 4.1 3.9 5.4 1.6 3.8 3.82015 5.1 6.5 5.3 2.6 2.2 5.8 5.8 4.8 0.2 6.8 5.1 5.7 4.8 5.7 4.2 5.3 6.1 4.0 5.5 5.5
1) 1961-91 D_W 2) Weighted in common currency; Euro area 3) Weighted in common currency; Former Euro area 12; 1961-91 including D_W

111
Foreign trade and current balance
41. Imports of goods and services at 2005 prices
(National currency; annual percentage change)
BG CZ DK HR LT HU PL RO SE UK EU-28 EU-15 MK IS TR ME RS US JP 1) 2)
1961-1970 : : 8.1 : : : : : 7.2 4.2 : 8.7 : 6.8 7.0 : : 7.5 14.5
1971-1980 : : 4.5 : : : : : 2.4 3.7 : 5.1 : 6.5 8.3 : : 3.8 5.4
1981 : : 0.5 : : : : : -3.9 -2.7 : -1.9 : 7.1 12.5 : : 2.6 2.11982 : : 3.1 : : : : : 4.7 4.9 : 1.5 : -0.6 8.3 : : -1.3 -0.71983 : : 1.8 : : : : : 1.0 6.6 : 1.2 : -9.7 16.9 : : 12.6 -3.41984 : : 6.0 : : : : : 5.3 9.9 : 6.2 : 9.1 19.7 : : 24.3 10.51985 : : 10.1 : : : : : 7.9 2.5 : 4.4 : 9.4 -6.6 : : 6.5 -2.71986 : : 9.5 : : : : : 3.6 6.9 : 5.5 : 0.9 -3.5 : : 8.5 3.81987 : : -0.5 : : : : : 7.3 7.9 : 7.5 : 23.3 23.0 : : 5.9 9.01988 : : 4.4 : : : : : 5.0 12.8 : 8.6 : -4.6 -4.5 : : 3.9 18.71989 : : 5.0 : : : : : 7.7 7.4 : 8.8 : -10.3 6.9 : : 4.4 18.01990 : : 2.3 : : : : : 1.1 0.6 : 6.2 : 1.0 33.0 : : 3.6 8.1
1981-1990 : : 4.2 : : : : : 3.9 5.6 : 4.7 : 2.1 9.9 : : 6.9 6.1
1991 : -32.8 3.6 : : : 29.7 -31.8 -4.9 -4.4 : 3.9 : 5.3 -5.2 : : -0.2 -1.11992 : 29.7 0.1 : : 0.7 1.8 1.3 1.6 6.8 : 3.9 : -6.0 10.9 : : 7.0 -1.11993 : 23.8 -1.1 : : 20.0 13.1 4.4 -2.7 3.3 : -3.4 : -7.5 35.8 : : 8.6 -1.31994 : 15.0 12.8 : : 8.8 11.3 -1.2 12.9 5.9 : 8.6 : 3.8 -21.9 : : 11.9 8.21995 : 23.2 7.4 : : 22.3 24.2 29.7 7.1 5.5 : 7.6 : 3.6 29.6 : : 8.0 11.41996 -7.0 12.1 3.3 9.2 23.2 9.0 28.0 9.0 3.4 9.6 5.3 4.8 -8.6 16.5 20.5 : : 8.7 14.31997 5.7 6.6 9.5 24.9 25.0 22.2 21.4 10.5 12.4 10.0 10.2 9.9 26.4 8.0 22.4 : : 13.5 1.21998 48.5 7.1 8.5 -5.7 6.1 22.9 18.6 11.5 11.3 9.3 10.3 10.1 7.4 23.4 2.3 : : 11.7 -6.71999 5.7 4.9 3.5 -2.8 -12.4 12.3 1.0 -0.8 5.1 7.5 7.3 7.6 0.1 4.4 -3.7 : : 11.4 3.32000 -9.5 16.0 13.0 3.6 5.0 18.0 15.5 27.5 11.7 9.5 11.7 11.6 26.8 8.6 21.8 : : 12.8 10.7
1991-2000 : 9.0 6.0 : : : 16.1 4.6 5.6 6.2 : 6.4 : 5.7 9.8 : : 9.3 3.7
2001 14.3 12.5 1.9 10.7 17.6 5.4 -5.3 18.7 -1.7 4.8 2.7 2.5 -15.2 -9.1 -24.8 : : -2.9 0.92002 6.8 4.7 7.5 13.6 18.6 6.7 2.8 12.3 -1.3 5.2 1.7 1.3 9.8 -2.6 20.9 : : 3.4 0.32003 16.7 7.4 -1.6 12.2 8.9 9.3 9.6 16.5 3.7 2.7 3.4 2.9 -15.2 10.7 23.5 : : 4.3 3.92004 13.9 10.0 7.7 4.9 15.2 14.3 15.8 22.1 6.6 7.0 7.6 7.1 16.7 14.5 20.8 : 23.2 11.0 7.92005 -7.6 5.9 10.9 4.2 16.8 6.9 4.7 16.0 7.0 6.9 6.1 6.0 8.2 29.3 12.2 : -4.1 6.1 4.22006 47.7 10.8 13.4 8.3 13.7 15.1 17.3 22.6 9.0 10.0 9.6 8.9 10.1 11.3 6.9 : 20.0 6.1 4.52007 9.6 12.8 4.3 6.1 10.6 12.8 13.7 27.3 9.0 -1.5 5.9 5.0 16.1 -1.5 10.7 : 31.0 2.3 2.32008 4.2 2.7 3.3 4.0 10.3 5.5 8.0 7.9 3.5 -1.7 1.1 0.6 0.8 -18.4 -4.1 : 9.6 -2.6 0.32009 -21.0 -12.1 -12.3 -21.4 -28.1 -14.8 -12.4 -20.5 -14.3 -10.7 -11.5 -10.8 -14.3 -24.0 -14.3 : -19.1 -13.7 -15.72010 2.4 15.4 3.5 -2.8 17.9 10.9 13.9 11.1 12.0 7.9 9.8 9.6 9.5 4.5 20.7 : 3.1 12.8 11.1
2001-2010 7.4 6.7 3.6 3.5 9.2 6.9 6.4 12.6 3.1 2.9 3.5 3.2 1.9 0.3 6.0 : : 2.4 1.7
2011 8.8 7.0 5.9 2.1 13.7 6.4 5.5 10.5 7.1 0.3 4.4 4.0 10.4 6.7 10.7 : 7.0 4.9 5.92012 3.3 2.3 0.9 -2.5 6.1 -0.1 -0.7 -0.2 -0.6 3.4 -0.2 -0.4 4.2 4.7 -0.4 : 1.9 2.2 5.32013 5.7 0.6 1.7 -1.7 9.8 5.3 1.2 2.4 -1.2 0.5 0.4 0.2 -2.1 -0.1 8.5 : 2.0 1.4 3.42014 5.5 4.0 2.8 1.3 7.1 6.2 4.5 5.9 4.7 2.0 3.7 3.5 7.4 6.6 0.7 : 2.4 3.5 4.32015 6.4 6.0 3.8 2.3 7.4 6.5 6.5 6.8 5.9 2.8 5.2 5.1 6.8 7.2 3.3 : 3.6 6.0 2.8
1) Weighted in common currency 2) Weighted in common currency; Former EU-15; 1961-91 including D_W

112
Foreign trade and current balance
42. Intra EU imports of goods 1)Foreign trade statistics
(Percentage of gross domestic product at market prices)
BE DE EE IE EL ES FR IT CY LV LU NL MT AT PT SI SK FI 2) 3)
1960 18.8 5.3 : 20.5 7.6 2.3 3.6 4.3 : : : 19.8 : : 8.2 : : :
1965 24.1 7.9 : 24.6 9.0 6.3 5.1 4.6 : : : 23.6 : 14.5 9.8 : : 11.8
1970 29.1 8.9 : 27.2 8.9 5.3 7.6 7.0 : : : 25.4 : 16.0 11.2 : : 14.5
1975 33.2 9.7 : 29.6 9.7 5.5 8.3 8.3 : : : 22.4 : 15.7 9.1 : : 14.5
1980 37.7 12.0 : 38.7 8.7 5.1 10.1 10.7 : : : 24.6 : 19.6 13.8 : : 14.1
1981 38.6 12.5 : 38.7 9.5 5.2 10.1 9.9 : : : 24.5 : 18.4 15.0 : : 12.61982 42.4 12.5 : 33.7 9.8 5.7 10.8 9.7 : : : 25.1 : 17.8 16.1 : : 12.31983 45.1 12.7 : 31.8 10.4 6.3 10.8 8.9 : : : 25.3 : 17.9 14.3 : : 12.01984 47.5 13.3 : 33.4 10.8 6.4 11.3 9.7 : : : 27.2 : 18.5 14.2 : : 12.01985 47.5 13.8 : 32.5 11.4 6.7 11.5 10.4 : : : 30.0 : 19.4 13.8 : : 12.31986 43.7 12.1 : 28.6 12.9 7.7 10.6 9.6 : : : 27.4 : 18.9 15.6 : : 12.21987 42.7 11.9 : 27.6 13.3 9.2 11.0 9.7 : : : 27.3 : 18.7 19.1 : : 12.81988 43.8 11.9 : 28.9 11.1 10.0 11.3 9.9 : : : 27.8 : 19.6 23.0 : : 11.31989 45.6 12.7 : 32.3 14.2 10.2 13.6 10.4 : : : 29.8 : 22.3 22.9 : : 13.71990 45.7 12.9 : 31.3 14.4 10.1 13.3 9.8 : : : 29.3 : 22.5 22.6 : : 13.0
1991 45.1 13.3 : 30.5 13.7 10.0 13.4 9.4 : : : 28.2 : 22.1 22.3 : : 11.41992 42.3 12.3 : 29.5 14.3 10.0 12.9 9.3 : : : 27.4 : 21.1 21.8 : : 13.01993 37.3 10.1 : 27.8 13.4 9.9 11.2 8.6 : : : 24.8 : 19.1 19.3 : : 13.51994 37.9 10.5 : 30.1 13.1 11.4 12.2 9.7 : : : 26.3 : 20.1 20.2 : : 14.31995 39.9 11.1 : 30.8 13.9 13.0 12.6 11.1 : : : 23.2 : 21.1 20.5 : : 14.61996 42.9 11.4 : 30.7 13.2 13.5 12.7 10.0 : : : 28.1 : 21.7 22.2 : : 16.01997 45.2 12.2 : 29.7 13.0 13.3 13.2 10.7 : : : 28.9 : 23.2 23.1 : : 16.51998 46.9 12.7 : 30.1 14.7 16.0 14.1 11.1 : : : 28.2 : 24.0 24.4 : : 16.71999 46.8 14.7 44.1 30.4 15.3 15.3 14.9 12.0 18.1 30.6 43.6 28.7 46.5 27.6 24.9 35.2 41.2 17.02000 53.9 16.6 52.9 33.1 17.2 18.2 17.2 13.2 20.0 30.5 46.6 30.1 51.2 30.1 26.0 39.2 44.0 18.9
2001 55.3 16.7 45.7 32.1 16.3 17.4 16.6 13.0 20.6 32.3 49.7 28.0 40.7 31.3 25.2 38.4 50.3 18.22002 56.9 16.0 45.0 28.4 12.0 16.6 15.5 12.7 20.3 33.8 46.5 27.5 41.0 30.5 24.1 38.2 49.3 17.62003 55.3 16.5 42.6 21.3 13.5 16.3 15.6 12.5 18.5 35.2 42.9 26.9 41.9 32.2 23.1 38.0 50.4 17.62004 57.4 17.2 51.1 21.8 15.4 16.8 15.9 12.8 24.4 38.7 44.6 27.8 45.9 34.3 22.8 45.0 55.8 18.32005 60.9 18.1 56.2 22.6 14.6 16.4 15.9 12.9 25.9 40.7 43.5 28.2 46.0 33.8 25.8 47.6 56.4 20.02006 62.8 19.9 59.6 22.5 15.0 16.4 16.6 13.7 25.9 44.1 44.9 30.6 46.6 33.9 27.0 51.0 60.7 21.32007 63.1 20.5 56.0 22.6 15.7 17.0 17.0 14.0 27.3 41.2 40.2 31.5 46.5 34.7 27.1 52.2 60.3 21.22008 64.0 20.8 53.6 22.1 15.5 15.6 17.2 13.3 28.7 36.2 43.7 32.0 46.2 34.9 27.9 51.0 57.1 20.92009 52.5 18.1 41.8 18.2 13.0 12.5 14.9 11.3 24.2 28.7 36.5 27.2 40.4 29.1 24.0 40.4 47.7 16.52010 57.3 20.2 51.5 19.4 11.9 13.9 16.3 13.1 26.2 37.2 38.7 30.9 41.5 32.8 25.9 46.4 53.7 18.6
2011 61.7 21.9 61.6 20.5 12.0 14.7 17.4 13.8 24.1 45.0 41.1 33.3 49.9 35.5 25.5 51.0 61.0 19.72012 61.4 21.5 61.6 19.9 11.7 13.8 17.3 12.9 22.2 47.1 38.4 34.6 57.5 34.6 24.4 50.8 62.5 19.42013 59.0 21.1 60.6 21.1 12.1 13.8 16.9 12.8 20.2 45.4 34.9 34.1 42.6 33.5 24.7 50.1 63.4 19.92014 58.2 21.6 59.9 21.3 12.0 13.9 16.9 12.9 18.5 45.0 33.9 32.7 43.0 33.3 24.4 50.2 63.7 19.62015 60.0 22.5 59.6 21.3 11.8 14.6 17.6 13.3 18.5 45.7 35.0 33.2 44.9 34.5 24.7 52.0 65.4 20.2
1) 1960-1998 Former EU-15, 1999-2001 Former EU-27 2) 1960-1998 including LU 3) 1960-90 D_W

113
Foreign trade and current balance
42. Intra EU imports of goods 1)Foreign trade statistics
(Percentage of gross domestic product at market prices)
BG CZ DK HR LT HU PL RO SE UK EU-28 EU-15 2) 3)
1960 : : 15.8 : : : : : : 3.9 :
1965 : : 17.7 : : : : : 11.9 5.1 : 8.2
1970 : : 18.3 : : : : : 12.8 6.2 : 9.9
1975 : : 17.1 : : : : : 14.5 10.1 : 11.2
1980 : : 18.6 : : : : : 14.6 10.4 : 12.9
1981 : : 18.6 : : : : : 13.6 9.9 : 12.71982 : : 18.9 : : : : : 15.0 10.5 : 13.01983 : : 18.4 : : : : : 15.9 11.4 : 13.21984 : : 18.9 : : : : : 15.8 12.6 : 13.91985 : : 19.4 : : : : : 16.7 12.6 : 14.41986 : : 17.9 : : : : : 14.9 12.7 : 13.51987 : : 16.2 : : : : : 15.3 12.8 : 13.61988 : : 15.7 : : : : : 15.0 12.9 : 13.71989 : : 16.9 : : : : : 15.3 12.9 : 14.71990 : : 16.5 : : : : : 14.3 12.2 : 14.4
1991 : : 16.7 : : : : : 12.5 10.8 : 14.01992 : : 16.1 : : : : : 12.2 11.1 : 13.61993 : : 15.4 : : : : : 14.0 11.2 : 12.51994 : : 16.5 : : : : : 15.6 11.8 : 13.31995 : : 18.1 : : : : : 17.6 12.3 : 14.11996 : : 17.3 : : : : : 16.6 12.5 : 14.41997 : : 18.5 : : : : : 17.5 11.9 : 14.81998 : : 19.0 : : : : : 18.6 11.6 : 15.51999 22.7 35.1 19.3 : 25.5 41.6 19.7 20.0 18.9 11.7 : 16.42000 26.7 40.8 20.5 : 25.0 45.7 19.7 22.9 20.1 12.1 : 18.2
2001 29.8 42.1 20.5 : 27.1 42.0 18.4 25.7 19.5 12.4 : 18.02002 28.6 37.5 21.5 28.9 29.9 36.9 19.5 26.5 18.9 12.8 18.2 17.52003 30.3 38.7 19.8 30.3 28.9 37.0 21.9 27.5 19.1 12.1 18.1 17.42004 32.6 49.2 19.7 28.7 34.7 40.7 26.6 28.4 20.0 11.9 18.9 17.82005 33.8 47.9 20.8 28.2 35.5 42.2 25.2 25.8 21.2 12.5 19.4 18.42006 35.8 50.6 22.5 28.9 40.2 49.0 27.2 26.5 22.3 13.9 20.7 19.52007 41.8 52.4 22.9 28.1 42.4 48.9 28.5 29.4 23.5 12.0 21.0 19.62008 40.3 48.2 22.7 28.1 37.6 48.1 28.1 28.5 23.8 12.5 21.2 19.82009 29.1 41.4 18.6 21.3 29.1 42.0 25.1 24.1 20.0 11.6 18.2 17.02010 31.3 47.8 18.5 20.5 36.1 47.0 26.8 27.4 21.5 12.6 20.1 18.8
2011 36.2 52.5 20.1 22.8 41.8 51.9 28.6 30.4 22.5 13.3 21.7 20.22012 37.5 54.3 20.6 23.2 43.5 54.0 27.5 30.6 20.8 13.4 21.4 19.82013 38.6 55.3 20.7 23.7 45.4 55.1 27.2 29.4 19.7 13.5 21.1 19.52014 37.5 57.8 20.5 24.1 46.3 58.5 26.8 29.9 19.9 13.1 21.1 19.52015 39.1 59.3 20.9 24.5 47.9 60.8 27.8 30.7 20.1 13.0 21.7 20.0
1) 1960-1998 Former EU-15, 1999-2001 Former EU-27 2) 1960-90 including D_W 3) Former EU-15; 1960-90 including D_W

114
Foreign trade and current balance
43. Extra EU imports of goods 1)Foreign trade statistics
(Percentage of gross domestic product at market prices)
BE DE EE IE EL ES FR IT CY LV LU NL MT AT PT SI SK FI 2) 3)
1960 14.2 8.1 : 11.4 9.2 3.4 6.5 7.1 : : : 16.6 : : 7.5 : : :
1965 11.7 6.7 : 9.9 6.4 5.7 5.2 6.1 : : : 11.8 : 6.5 7.8 : : 7.2
1970 13.2 6.6 : 8.9 6.7 6.5 5.4 6.7 : : : 12.5 : 7.3 7.9 : : 9.0
1975 13.8 7.2 : 10.5 10.0 8.8 6.9 9.1 : : : 15.9 : 7.9 9.5 : : 11.5
1980 19.4 9.9 : 12.9 10.9 10.0 9.4 10.8 : : : 18.4 : 10.4 14.8 : : 15.2
1981 21.2 10.3 : 12.8 8.1 11.0 9.8 11.9 : : : 19.4 : 11.4 16.0 : : 14.71982 21.4 9.9 : 11.8 9.5 10.8 9.3 11.1 : : : 18.3 : 9.8 15.7 : : 13.31983 18.6 9.4 : 12.5 9.6 11.3 8.4 9.8 : : : 18.1 : 9.3 15.4 : : 13.41984 19.6 10.2 : 14.9 9.7 10.9 8.6 10.2 : : : 19.4 : 10.6 17.2 : : 11.71985 17.9 10.2 : 14.4 10.9 10.2 8.2 10.3 : : : 18.4 : 10.9 14.8 : : 11.61986 14.0 8.2 : 12.3 8.1 6.6 6.4 6.4 : : : 13.0 : 8.4 10.2 : : 9.01987 13.6 7.8 : 12.8 7.7 6.6 6.2 6.3 : : : 12.8 : 7.9 12.0 : : 9.11988 13.6 8.1 : 13.0 5.7 6.5 6.7 6.1 : : : 13.1 : 8.1 8.7 : : 8.41989 14.9 8.9 : 12.9 7.0 7.4 5.6 6.7 : : : 13.7 : 7.2 9.3 : : 7.21990 13.0 8.7 : 11.6 6.8 6.8 5.5 6.1 : : : 12.5 : 7.4 9.5 : : 6.3
1991 12.7 8.1 : 11.9 7.8 7.2 5.2 5.8 : : : 13.1 : 7.4 7.9 : : 5.91992 11.2 7.4 : 11.3 6.3 6.3 4.6 5.3 : : : 11.1 : 6.9 7.0 : : 6.11993 13.9 7.0 : 14.4 6.1 6.2 4.4 5.8 : : : 9.8 : 6.4 6.7 : : 7.21994 16.7 7.2 : 14.8 5.4 6.4 4.9 6.1 : : : 10.8 : 7.3 7.3 : : 8.71995 15.7 7.0 : 16.2 5.9 5.9 5.6 7.1 : : : 15.2 : 6.6 6.9 : : 7.01996 15.2 7.1 : 14.8 7.2 5.9 5.7 6.3 : : : 17.1 : 7.4 6.7 : : 7.51997 21.5 8.4 : 16.7 7.0 6.9 6.8 6.8 : : : 20.4 : 8.4 7.2 : : 9.21998 20.7 8.9 : 18.8 7.7 6.7 6.8 6.8 : : : 20.3 : 8.6 6.8 : : 8.71999 17.9 7.6 16.1 18.0 6.6 6.6 6.8 6.3 12.7 9.8 9.3 21.4 23.8 6.0 6.7 10.3 14.1 7.62000 22.2 9.7 22.0 19.2 9.3 8.7 8.3 8.4 14.1 10.6 8.9 26.4 33.2 7.5 8.0 11.8 18.7 9.3
2001 21.5 9.1 23.1 15.9 9.1 7.9 8.0 8.0 14.4 10.2 11.3 24.0 22.2 7.6 7.6 11.3 19.6 8.02002 21.2 8.3 20.3 13.9 9.5 7.4 7.1 7.4 14.9 9.8 9.3 22.3 19.1 7.0 6.1 8.9 18.1 7.62003 19.9 8.4 23.0 12.6 9.7 7.2 6.6 7.1 12.2 11.4 12.5 22.1 19.6 6.9 6.0 9.4 17.2 8.22004 21.4 9.0 18.1 11.3 9.2 7.9 6.9 7.6 10.7 12.4 14.1 24.5 16.8 6.8 6.8 7.5 14.9 8.92005 23.5 9.9 17.4 11.3 9.4 9.1 7.6 8.6 11.5 13.3 16.6 28.8 14.6 7.9 7.5 9.3 15.9 10.02006 25.1 11.3 20.4 10.3 10.4 10.1 7.4 9.9 11.8 13.5 18.8 30.9 19.3 8.3 8.0 10.9 19.8 12.02007 26.3 11.2 15.2 9.7 11.3 10.0 7.4 10.1 12.2 12.0 14.4 31.3 16.4 8.7 8.3 14.4 20.4 11.92008 27.5 11.8 13.5 9.5 12.3 10.7 8.0 10.9 13.5 11.7 14.8 34.5 14.2 9.5 9.4 16.6 20.9 12.82009 22.1 9.9 10.2 9.5 9.5 7.6 6.5 8.2 9.2 9.3 14.6 28.2 13.5 8.0 6.5 13.3 15.9 8.82010 25.6 11.7 13.0 9.4 10.8 9.7 7.5 10.6 11.0 11.7 9.4 35.4 17.7 9.3 8.0 17.6 20.8 10.4
2011 29.1 12.6 16.8 9.0 11.3 11.1 8.4 11.7 10.7 12.9 9.2 38.6 17.7 10.4 9.1 19.7 22.2 12.32012 29.5 12.5 16.2 9.9 13.8 11.7 8.5 11.3 9.9 13.1 11.4 42.0 17.1 10.6 9.6 19.7 22.3 11.52013 30.0 11.6 13.5 8.9 13.6 11.2 8.0 10.3 8.5 11.5 9.3 39.7 18.6 10.3 9.5 21.3 22.0 10.22014 30.2 11.6 13.5 9.4 13.4 11.4 8.1 10.0 9.1 11.4 9.2 41.5 18.2 10.4 10.0 21.4 22.7 9.52015 31.5 11.9 13.7 9.4 13.3 12.0 8.3 10.4 8.9 11.6 9.3 43.3 17.8 10.8 10.5 22.2 24.2 9.7
1) 1960-1998 Former EU-15, 1999-2001 Former EU-27 2) 1960-1998 including LU 3) 1960-90 D_W
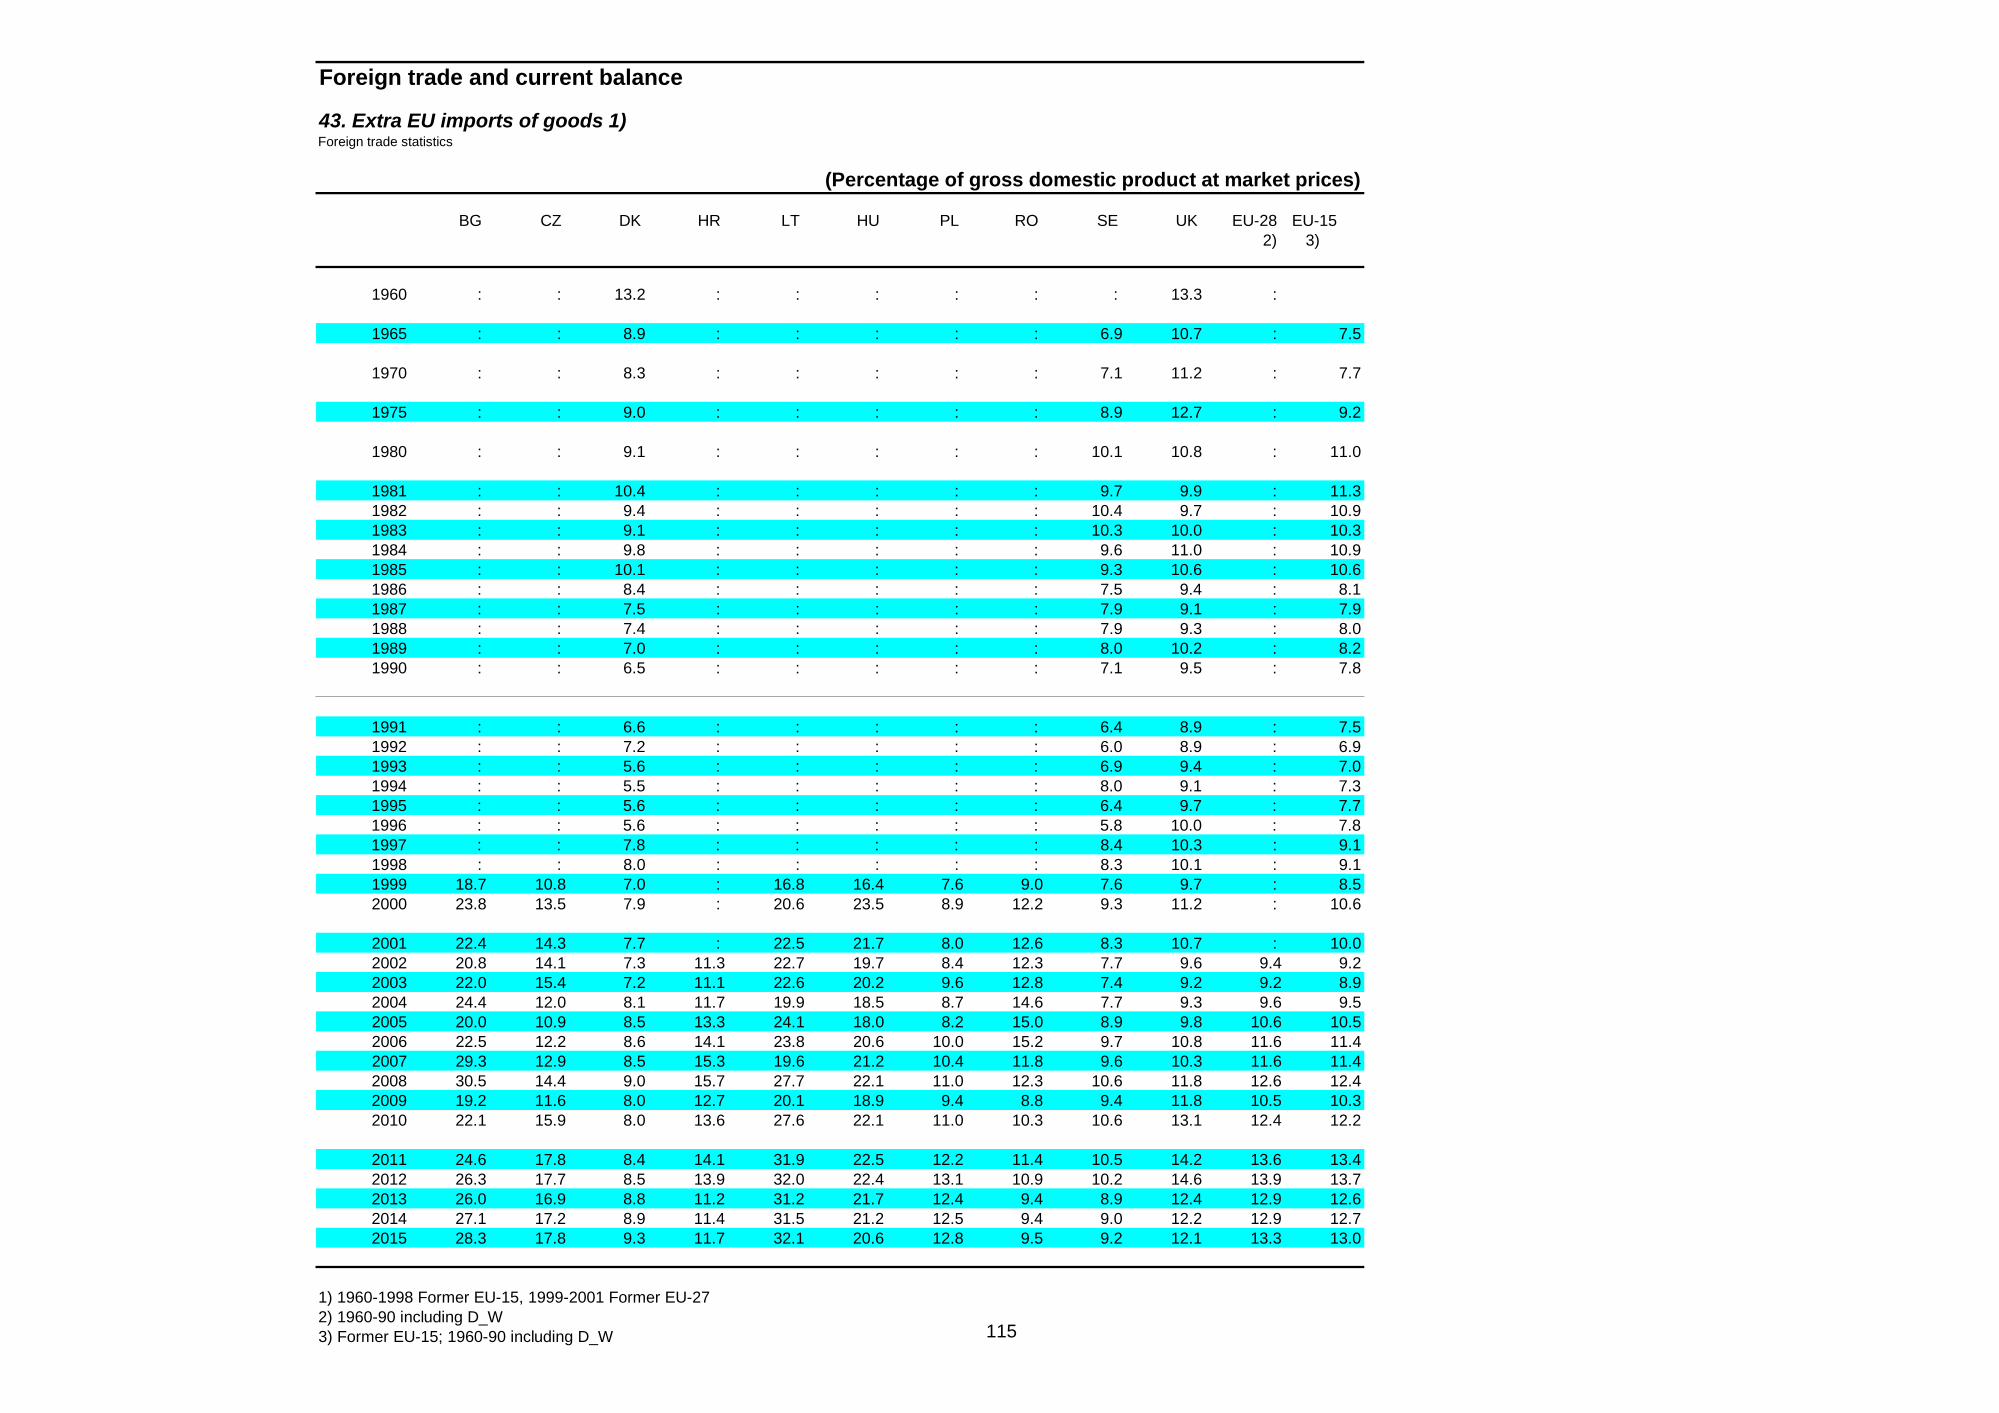
115
Foreign trade and current balance
43. Extra EU imports of goods 1)Foreign trade statistics
(Percentage of gross domestic product at market prices)
BG CZ DK HR LT HU PL RO SE UK EU-28 EU-15 2) 3)
1960 : : 13.2 : : : : : : 13.3 :
1965 : : 8.9 : : : : : 6.9 10.7 : 7.5
1970 : : 8.3 : : : : : 7.1 11.2 : 7.7
1975 : : 9.0 : : : : : 8.9 12.7 : 9.2
1980 : : 9.1 : : : : : 10.1 10.8 : 11.0
1981 : : 10.4 : : : : : 9.7 9.9 : 11.31982 : : 9.4 : : : : : 10.4 9.7 : 10.91983 : : 9.1 : : : : : 10.3 10.0 : 10.31984 : : 9.8 : : : : : 9.6 11.0 : 10.91985 : : 10.1 : : : : : 9.3 10.6 : 10.61986 : : 8.4 : : : : : 7.5 9.4 : 8.11987 : : 7.5 : : : : : 7.9 9.1 : 7.91988 : : 7.4 : : : : : 7.9 9.3 : 8.01989 : : 7.0 : : : : : 8.0 10.2 : 8.21990 : : 6.5 : : : : : 7.1 9.5 : 7.8
1991 : : 6.6 : : : : : 6.4 8.9 : 7.51992 : : 7.2 : : : : : 6.0 8.9 : 6.91993 : : 5.6 : : : : : 6.9 9.4 : 7.01994 : : 5.5 : : : : : 8.0 9.1 : 7.31995 : : 5.6 : : : : : 6.4 9.7 : 7.71996 : : 5.6 : : : : : 5.8 10.0 : 7.81997 : : 7.8 : : : : : 8.4 10.3 : 9.11998 : : 8.0 : : : : : 8.3 10.1 : 9.11999 18.7 10.8 7.0 : 16.8 16.4 7.6 9.0 7.6 9.7 : 8.52000 23.8 13.5 7.9 : 20.6 23.5 8.9 12.2 9.3 11.2 : 10.6
2001 22.4 14.3 7.7 : 22.5 21.7 8.0 12.6 8.3 10.7 : 10.02002 20.8 14.1 7.3 11.3 22.7 19.7 8.4 12.3 7.7 9.6 9.4 9.22003 22.0 15.4 7.2 11.1 22.6 20.2 9.6 12.8 7.4 9.2 9.2 8.92004 24.4 12.0 8.1 11.7 19.9 18.5 8.7 14.6 7.7 9.3 9.6 9.52005 20.0 10.9 8.5 13.3 24.1 18.0 8.2 15.0 8.9 9.8 10.6 10.52006 22.5 12.2 8.6 14.1 23.8 20.6 10.0 15.2 9.7 10.8 11.6 11.42007 29.3 12.9 8.5 15.3 19.6 21.2 10.4 11.8 9.6 10.3 11.6 11.42008 30.5 14.4 9.0 15.7 27.7 22.1 11.0 12.3 10.6 11.8 12.6 12.42009 19.2 11.6 8.0 12.7 20.1 18.9 9.4 8.8 9.4 11.8 10.5 10.32010 22.1 15.9 8.0 13.6 27.6 22.1 11.0 10.3 10.6 13.1 12.4 12.2
2011 24.6 17.8 8.4 14.1 31.9 22.5 12.2 11.4 10.5 14.2 13.6 13.42012 26.3 17.7 8.5 13.9 32.0 22.4 13.1 10.9 10.2 14.6 13.9 13.72013 26.0 16.9 8.8 11.2 31.2 21.7 12.4 9.4 8.9 12.4 12.9 12.62014 27.1 17.2 8.9 11.4 31.5 21.2 12.5 9.4 9.0 12.2 12.9 12.72015 28.3 17.8 9.3 11.7 32.1 20.6 12.8 9.5 9.2 12.1 13.3 13.0
1) 1960-1998 Former EU-15, 1999-2001 Former EU-27 2) 1960-90 including D_W 3) Former EU-15; 1960-90 including D_W

116
Foreign trade and current balance
44. Balance on current transactions with the rest of the world (National accounts)
(Percentage of gross domestic product at market prices)
BE DE EE IE EL ES FR IT CY LV LU MT NL AT PT SI SK FI EA-18 EA-12 1) 2) 3) 4)
1960 0.2 1.6 : -0.1 -0.4 3.8 1.9 0.8 : : 12.3 : 3.0 -1.1 -2.5 : : -0.9 : 1.4
1965 1.0 -1.3 : -4.4 -4.6 -3.8 0.9 3.6 : : 2.0 : 0.1 -0.5 -3.4 : : -2.3 : 0.1
1970 2.9 1.1 : -4.0 -1.8 0.2 0.1 0.8 : : 14.0 : 1.2 0.6 -1.9 : : -2.4 : 0.6
1975 0.0 1.2 : -1.5 0.5 -2.9 0.4 -0.1 : : 12.0 : 3.9 -0.1 -5.8 : : -7.5 : 0.2
1980 -4.0 -1.8 : -11.7 1.9 -2.5 -2.2 -2.3 : : 13.7 : 0.1 -4.5 -8.6 : : -3.0 : -2.2
1981 -3.2 -0.7 : -14.6 3.1 -2.7 -2.3 -2.3 : : 12.2 : 3.3 -3.6 -14.4 : : -1.2 : -1.71982 -3.2 0.9 : -10.5 -0.6 -2.5 -3.8 -1.7 : : 15.2 : 3.8 -1.7 -16.0 : : -2.4 : -1.51983 -0.9 0.7 : -6.8 -1.7 -1.7 -2.2 0.2 : : 16.0 : 3.4 -2.4 -10.5 : : -2.6 : -0.51984 -0.5 1.5 : -5.8 -1.3 1.1 -1.8 -0.7 : : 17.9 : 5.5 -2.0 -7.9 : : 0.0 : 0.11985 0.4 2.8 : -3.8 -3.2 1.2 -1.9 -1.0 : : 19.4 : 3.4 -1.1 -4.3 : : -1.5 : 0.31986 1.8 4.2 : -3.3 -2.2 1.3 -1.1 0.4 : : 17.1 : 2.6 -1.2 -1.7 : : -1.0 : 1.31987 1.7 4.0 : -0.2 0.7 -0.2 -1.9 -0.3 : : 12.3 : 2.6 -1.2 -4.3 : : -1.9 : 0.81988 2.3 4.5 : 0.6 -0.3 -1.3 -1.7 -0.7 : : 14.8 : 2.6 -1.3 -7.9 : : -2.5 : 0.71989 1.9 4.6 : -1.1 -2.2 -3.4 -1.8 -1.2 : : 18.5 : 3.2 -1.3 -5.4 : : -4.9 : 0.31990 1.5 3.7 : -1.8 -2.9 -3.8 -1.8 -1.6 : 0.1 15.8 : 2.5 -0.8 -5.9 2.4 : -5.1 : -0.1
1991 0.4 -1.1
1991 2.0 -1.3 : -0.4 -2.1 -3.7 -1.6 -2.0 : : 12.3 : 3.0 -2.2 -7.5 8.5 : -5.5 : -1.61992 2.7 -1.1 : 0.4 -0.2 -3.7 -0.3 -2.4 : 12.7 14.5 : 2.3 -2.5 -6.9 7.3 : -4.7 : -1.21993 4.4 -0.8 1.2 3.7 -0.8 -1.2 0.8 0.9 : 17.8 12.7 : 4.4 -1.4 -5.5 2.2 -4.1 -1.4 : 0.21994 5.6 -1.4 -6.8 2.9 1.3 -1.6 0.3 1.2 : 5.0 13.3 : 5.3 -2.9 -7.2 3.9 5.3 0.9 : 0.11995 4.8 -1.2 -6.2 2.7 -0.8 -0.2 0.5 2.2 -1.9 -0.4 12.1 -10.3 6.2 -2.9 -3.5 -0.8 2.4 4.0 0.5 0.51996 3.9 -0.6 -9.2 3.0 -2.1 -0.2 1.1 3.1 -4.8 -4.9 11.2 -11.1 5.0 -2.8 -4.4 -0.1 -9.5 3.7 0.8 0.91997 4.7 -0.5 -12.0 2.8 -1.9 0.1 2.6 2.8 -4.3 -5.5 10.4 -5.9 5.8 -2.3 -6.2 -0.3 -9.2 4.9 1.3 1.41998 4.5 -0.8 -9.7 0.6 -3.2 -1.1 2.4 1.8 5.6 -9.3 9.2 -5.8 2.5 -1.5 -7.6 -1.1 -9.4 5.0 0.6 0.71999 5.0 -1.3 -5.2 0.2 -5.1 -2.7 2.6 1.0 -0.8 -8.8 8.4 -3.3 4.2 -1.4 -8.9 -3.7 -4.1 7.0 0.3 0.42000 4.2 -1.8 -5.2 -0.4 -12.0 -4.0 1.2 -0.2 -3.9 -4.8 13.2 -12.1 6.4 -0.7 -10.7 -3.2 -2.6 7.6 -0.5 -0.4
2001 4.3 -0.2 -5.0 -0.5 -11.4 -4.3 1.3 0.3 -3.2 -7.6 8.8 -3.7 5.2 -0.8 -10.6 -0.4 -7.2 8.4 0.0 0.12002 6.0 2.0 -10.4 -0.4 -12.7 -3.8 1.0 -0.3 -3.7 -6.7 10.5 2.4 6.1 2.7 -8.5 0.9 -7.5 8.5 0.8 0.82003 5.6 1.9 -11.4 0.8 -12.3 -4.0 0.5 -0.8 -2.3 -8.2 8.1 -3.0 6.1 1.7 -6.7 -0.9 -6.4 5.1 0.4 0.52004 4.5 4.7 -11.4 -0.1 -10.5 -5.9 0.2 -0.4 -5.7 -12.9 11.9 -5.7 8.6 2.2 -8.3 -2.6 -6.7 6.3 1.1 1.22005 3.2 5.1 -10.1 -3.0 -10.8 -7.5 -0.6 -0.9 -6.1 -12.6 11.5 -8.5 7.5 2.2 -10.3 -1.7 -8.6 3.5 0.4 0.52006 3.4 6.5 -15.7 -3.7 -13.7 -9.0 -0.8 -1.5 -7.2 -22.6 10.4 -9.7 9.0 3.2 -10.7 -2.3 -8.3 4.6 0.5 0.62007 3.9 7.5 -15.7 -5.5 -17.6 -10.0 -1.4 -1.3 -11.6 -22.4 10.1 -4.0 8.4 4.0 -10.2 -4.6 -5.6 4.2 0.4 0.52008 1.1 6.2 -8.5 -5.6 -18.0 -9.6 -1.9 -2.9 -12.2 -13.1 5.4 -4.8 4.7 4.8 -12.6 -6.1 -6.3 3.1 -0.7 -0.62009 0.7 6.1 4.0 -2.3 -14.4 -4.8 -1.8 -2.0 -10.7 8.6 7.3 -8.9 3.2 2.7 -10.8 -0.4 -2.5 2.0 0.1 0.12010 2.6 6.4 3.5 1.1 -12.8 -4.4 -1.9 -3.5 -9.2 2.9 7.7 -5.3 5.0 3.6 -10.4 -0.2 -3.7 1.7 0.3 0.4
2011 0.5 6.3 0.3 1.2 -11.7 -4.0 -2.5 -3.1 -3.5 -2.2 6.6 -1.0 7.4 1.5 -7.2 0.2 -2.6 -1.5 0.4 0.42012 -0.2 7.0 -2.8 4.4 -4.6 -1.2 -2.1 -0.4 -7.0 -2.5 5.8 1.1 7.7 1.8 -2.2 3.1 1.6 -1.4 1.8 1.82013 -0.3 7.4 -1.8 6.6 -2.4 0.8 -1.9 0.9 -1.4 -0.8 5.2 0.6 7.8 2.7 0.4 5.3 2.5 -0.8 2.6 2.62014 0.3 7.3 -2.7 7.4 -2.3 1.4 -1.8 1.5 0.0 -1.3 6.4 0.3 8.2 3.4 1.0 6.0 2.4 -0.4 2.9 2.92015 -0.3 7.0 -2.8 8.8 -2.2 1.5 -2.0 1.5 0.4 -2.0 5.0 1.0 8.6 3.8 1.4 6.2 2.4 -0.2 2.9 2.9
1) 1960-91 D_W 2) Data before 2006 are based on balance of payments statistics. From 2006 onwards data follow national accounts definitions 3) Euro area; 1960-91 including D_W 4) Former Euro area 12; 1960-91 including D_W

117
Foreign trade and current balance
44. Balance on current transactions with the rest of the world (National accounts)
(Percentage of gross domestic product at market prices)
BG CZ DK HR LT HU PL RO SE UK EU-28 EU-15 MK IS TR ME RS US JP 1) 2)
1960 : : -1.1 : : : : : 0.2 -0.8 : 0.8 : -4.4 -1.3 : : 0.6 0.5
1965 : : -1.8 : : : : : -0.1 -0.1 : 0.0 : 0.9 -0.8 : : 0.9 1.1
1970 : : -4.0 : : : : : 0.0 1.6 : 0.7 : 1.8 0.0 : : 0.3 1.0
1975 : : -2.0 : : : : : 0.5 -1.6 : 0.0 : -10.5 -2.6 : : 1.2 -0.1
1980 : : -3.5 : : : : : -2.3 0.7 : -1.7 : -2.0 -3.7 : : 0.3 -1.1
1981 : : -2.6 : : : : : -1.0 1.9 : -1.1 : -4.1 -2.0 : : 0.1 0.51982 : : -4.1 : : : : : -1.7 0.8 : -1.1 : -8.0 -1.1 : : -0.1 0.71983 : : -2.6 : : : : : 0.4 0.4 : -0.4 : -1.8 -2.3 : : -1.0 1.81984 : : -3.3 : : : : : 2.0 -0.4 : 0.0 : -4.5 -1.8 : : -2.2 2.81985 : : -4.5 : : : : : -0.1 -0.2 : 0.1 : -3.8 -1.1 : : -2.6 3.71986 : : -5.5 : : : : : 1.8 -0.9 : 0.8 : 0.7 -1.4 : : -3.1 4.21987 : : -3.2 : : : : : 1.1 -1.6 : 0.4 : -3.3 -0.7 : : -3.2 3.41988 : : -1.5 : : : : : 0.8 -3.9 : -0.1 : -3.4 1.3 : : -2.2 2.71989 : : -1.5 : : : : : -0.7 -4.6 : -0.5 : -1.3 0.7 : : -1.6 2.11990 : : 0.4 : : : : : -1.5 -3.5 : -0.6 : -2.1 -1.3 : : -1.3 1.5
1991 -1.1
1991 -4.3 : 0.9 : : : -3.8 : -1.0 -1.4 : -1.5 : -4.0 0.1 : : 0.1 2.01992 -7.4 1.7 2.1 : : : 0.3 : -2.0 -1.7 : -1.3 : -2.4 -0.5 : : -0.7 3.01993 -9.4 1.8 2.9 : -3.1 -8.0 0.2 : -0.9 -1.4 : 0.0 : 0.7 -2.7 : : -1.1 3.01994 -2.4 -0.7 1.6 : : -7.0 2.3 : 1.4 -0.5 : 0.1 : 1.9 1.5 : : -1.6 2.71995 -1.2 -3.6 0.9 -4.2 -9.1 -2.9 1.4 -4.9 3.8 -0.7 0.4 0.5 -6.7 0.7 -1.0 : : -1.4 2.11996 -0.7 -5.9 1.5 -2.2 -8.6 -3.3 -1.0 -7.2 4.0 -0.6 0.6 0.8 -7.7 -1.8 -1.0 : : -1.4 1.41997 4.1 -5.5 0.6 -9.4 -9.7 -3.9 -3.4 -6.1 4.7 -0.1 0.9 1.2 -7.7 -1.8 -1.0 : -6 -1.5 2.21998 0.6 -1.7 -0.9 -4.7 -11.5 -6.4 -3.8 -7.2 4.4 -0.4 0.3 0.6 -7.8 -6.8 0.7 : -3 -2.2 3.01999 -3.6 -2.2 1.9 -5.5 -10.9 -7.6 -5.1 -4.1 4.6 -2.7 -0.2 0.0 -1.8 -6.8 -0.4 : -2.6 -3.0 2.62000 -5.5 -4.0 1.4 -0.9 -5.9 -7.8 -5.4 -3.9 4.6 -2.9 -0.9 -0.7 -2.9 -10.2 -3.7 : -2.4 -4.0 2.5
2001 -5.6 -4.4 3.1 -1.3 -4.7 -5.6 -2.4 -5.6 4.9 -2.3 -0.4 -0.2 -6.8 -4.3 1.9 : -0.2 -3.7 2.12002 -2.4 -5.0 2.5 -5.7 -5.1 -6.8 -2.1 -1.1 5.1 -2.1 0.2 0.4 -10.0 1.5 -0.3 : -5.8 -4.1 2.82003 -5.3 -5.1 3.4 -6.9 -6.8 -8.3 -1.7 -4.9 6.9 -1.7 0.1 0.3 -4.0 -4.8 -2.5 : -5.2 -4.5 3.22004 -6.5 -4.1 3.0 -4.2 -7.5 -9.5 -5.2 -5.8 6.8 -2.0 0.4 0.8 -8.1 -9.8 -3.7 : -10.9 -5.1 3.72005 -11.7 -2.0 4.3 -5.1 -7.1 -8.2 -2.2 -8.9 7.1 -1.8 0.0 0.4 -2.5 -16.0 -4.5 -16.6 -7.3 -5.6 3.62006 -17.6 -2.6 3.0 -6.3 -10.2 -7.5 -4.0 -10.6 7.9 -2.8 -0.2 0.2 -0.4 -24.3 -6.0 -31.3 -10.4 -5.7 3.92007 -25.2 -5.1 1.4 -6.9 -15.0 -7.4 -6.1 -13.6 8.6 -2.2 -0.4 0.3 -7.1 -15.9 -5.8 -39.5 -17.8 -4.9 4.92008 -23.2 -2.9 2.9 -8.3 -13.0 -6.9 -5.6 -11.4 8.8 -0.9 -0.9 -0.3 -12.9 -24.6 -5.5 -49.8 -21.9 -4.6 3.32009 -9.0 -3.3 3.4 -4.5 2.1 -0.1 -3.1 -4.2 6.9 -1.4 -0.1 0.1 -6.8 -11.5 -2.0 -27.9 -7.2 -2.6 2.92010 -0.4 -5.0 5.8 -0.9 -0.4 0.4 -4.3 -4.4 6.9 -2.7 -0.1 0.2 -2.0 -8.0 -6.2 -22.9 -7.6 -3.0 3.7
2011 0.1 -3.5 5.9 -0.7 -3.9 0.6 -4.5 -4.5 6.2 -1.5 0.2 0.4 -2.5 -6.3 -9.7 -17.7 -8.8 -2.9 2.02012 -0.9 -2.6 6.0 -0.4 -1.1 1.1 -3.4 -4.4 6.5 -3.8 0.9 1.2 -3.0 -5.3 -6.2 -18.7 -10.6 -2.7 1.02013 1.9 -1.2 7.3 0.5 1.3 3.1 -1.6 -1.1 6.6 -4.4 1.6 1.8 -1.9 3.9 -7.9 -14.6 -5.3 -2.3 0.72014 1.0 -0.4 6.9 1.5 -0.8 3.0 -1.7 -1.2 6.1 -3.8 1.8 2.0 -3.7 0.2 -6.0 -14.4 -4.6 -2.2 0.72015 0.2 -0.2 6.8 1.6 -1.5 2.7 -2.3 -1.6 6.0 -3.3 1.8 2.0 -3.8 -1.3 -3.9 -14.5 -4.3 -2.4 1.2
1) 1960-91 including D_W 2) Former EU-15; 1960-91 including D_W
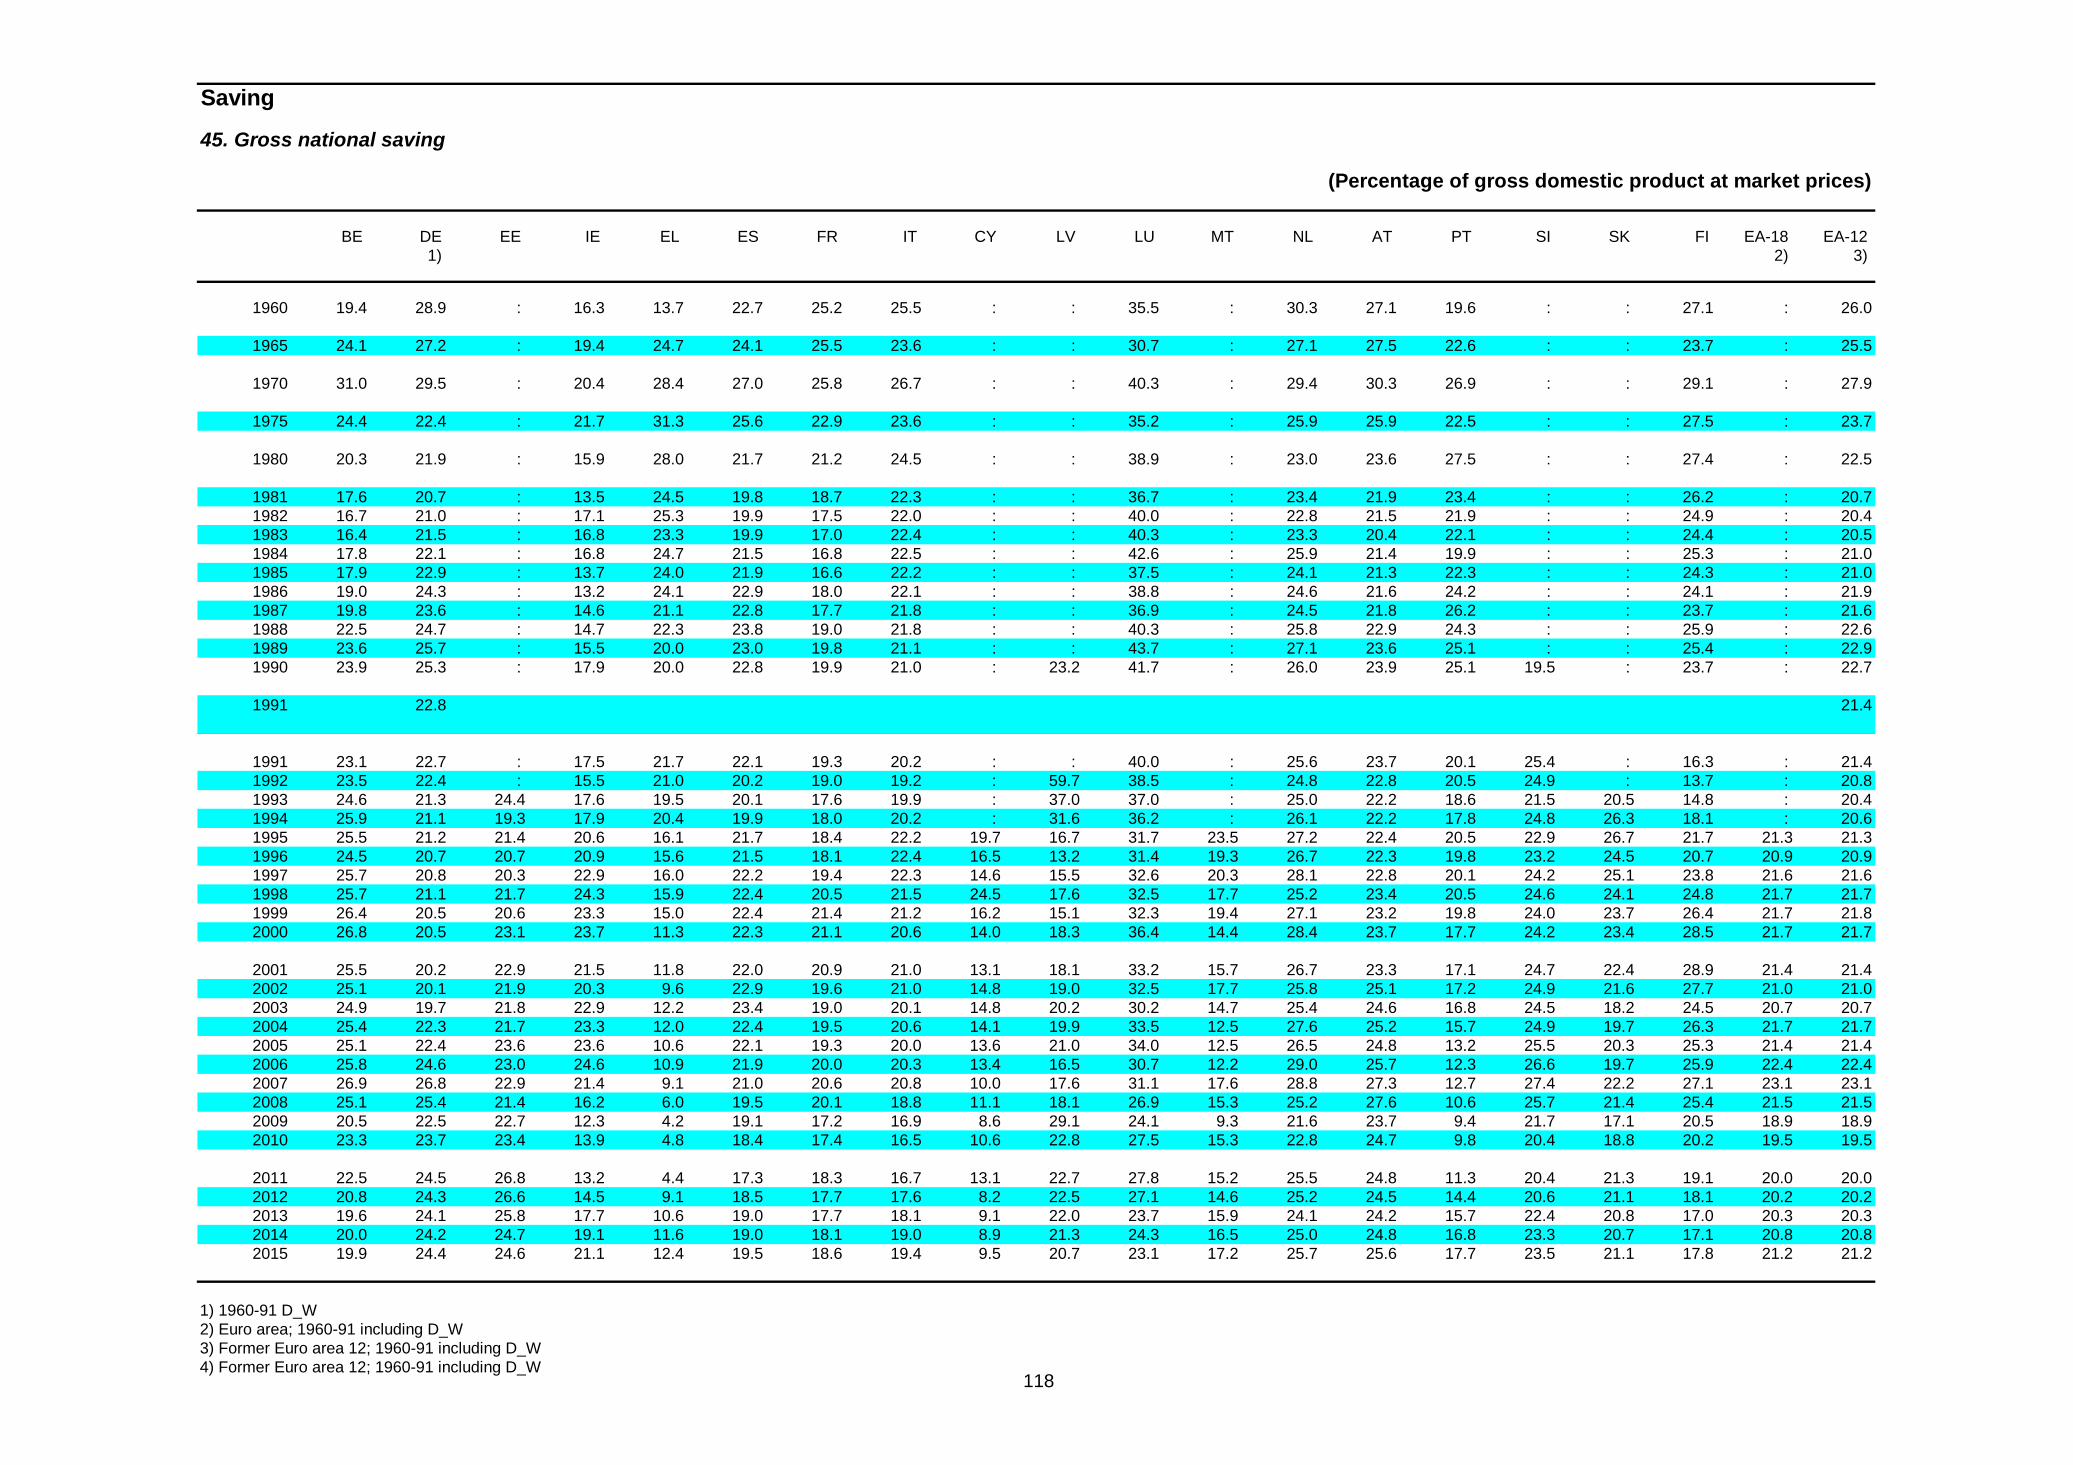
118
Saving
45. Gross national saving
(Percentage of gross domestic product at market prices)
BE DE EE IE EL ES FR IT CY LV LU MT NL AT PT SI SK FI EA-18 EA-12 1) 2) 3)
1960 19.4 28.9 : 16.3 13.7 22.7 25.2 25.5 : : 35.5 : 30.3 27.1 19.6 : : 27.1 : 26.0
1965 24.1 27.2 : 19.4 24.7 24.1 25.5 23.6 : : 30.7 : 27.1 27.5 22.6 : : 23.7 : 25.5
1970 31.0 29.5 : 20.4 28.4 27.0 25.8 26.7 : : 40.3 : 29.4 30.3 26.9 : : 29.1 : 27.9
1975 24.4 22.4 : 21.7 31.3 25.6 22.9 23.6 : : 35.2 : 25.9 25.9 22.5 : : 27.5 : 23.7
1980 20.3 21.9 : 15.9 28.0 21.7 21.2 24.5 : : 38.9 : 23.0 23.6 27.5 : : 27.4 : 22.5
1981 17.6 20.7 : 13.5 24.5 19.8 18.7 22.3 : : 36.7 : 23.4 21.9 23.4 : : 26.2 : 20.71982 16.7 21.0 : 17.1 25.3 19.9 17.5 22.0 : : 40.0 : 22.8 21.5 21.9 : : 24.9 : 20.41983 16.4 21.5 : 16.8 23.3 19.9 17.0 22.4 : : 40.3 : 23.3 20.4 22.1 : : 24.4 : 20.51984 17.8 22.1 : 16.8 24.7 21.5 16.8 22.5 : : 42.6 : 25.9 21.4 19.9 : : 25.3 : 21.01985 17.9 22.9 : 13.7 24.0 21.9 16.6 22.2 : : 37.5 : 24.1 21.3 22.3 : : 24.3 : 21.01986 19.0 24.3 : 13.2 24.1 22.9 18.0 22.1 : : 38.8 : 24.6 21.6 24.2 : : 24.1 : 21.91987 19.8 23.6 : 14.6 21.1 22.8 17.7 21.8 : : 36.9 : 24.5 21.8 26.2 : : 23.7 : 21.61988 22.5 24.7 : 14.7 22.3 23.8 19.0 21.8 : : 40.3 : 25.8 22.9 24.3 : : 25.9 : 22.61989 23.6 25.7 : 15.5 20.0 23.0 19.8 21.1 : : 43.7 : 27.1 23.6 25.1 : : 25.4 : 22.91990 23.9 25.3 : 17.9 20.0 22.8 19.9 21.0 : 23.2 41.7 : 26.0 23.9 25.1 19.5 : 23.7 : 22.7
1991 22.8 21.4
1991 23.1 22.7 : 17.5 21.7 22.1 19.3 20.2 : : 40.0 : 25.6 23.7 20.1 25.4 : 16.3 : 21.41992 23.5 22.4 : 15.5 21.0 20.2 19.0 19.2 : 59.7 38.5 : 24.8 22.8 20.5 24.9 : 13.7 : 20.81993 24.6 21.3 24.4 17.6 19.5 20.1 17.6 19.9 : 37.0 37.0 : 25.0 22.2 18.6 21.5 20.5 14.8 : 20.41994 25.9 21.1 19.3 17.9 20.4 19.9 18.0 20.2 : 31.6 36.2 : 26.1 22.2 17.8 24.8 26.3 18.1 : 20.61995 25.5 21.2 21.4 20.6 16.1 21.7 18.4 22.2 19.7 16.7 31.7 23.5 27.2 22.4 20.5 22.9 26.7 21.7 21.3 21.31996 24.5 20.7 20.7 20.9 15.6 21.5 18.1 22.4 16.5 13.2 31.4 19.3 26.7 22.3 19.8 23.2 24.5 20.7 20.9 20.91997 25.7 20.8 20.3 22.9 16.0 22.2 19.4 22.3 14.6 15.5 32.6 20.3 28.1 22.8 20.1 24.2 25.1 23.8 21.6 21.61998 25.7 21.1 21.7 24.3 15.9 22.4 20.5 21.5 24.5 17.6 32.5 17.7 25.2 23.4 20.5 24.6 24.1 24.8 21.7 21.71999 26.4 20.5 20.6 23.3 15.0 22.4 21.4 21.2 16.2 15.1 32.3 19.4 27.1 23.2 19.8 24.0 23.7 26.4 21.7 21.82000 26.8 20.5 23.1 23.7 11.3 22.3 21.1 20.6 14.0 18.3 36.4 14.4 28.4 23.7 17.7 24.2 23.4 28.5 21.7 21.7
2001 25.5 20.2 22.9 21.5 11.8 22.0 20.9 21.0 13.1 18.1 33.2 15.7 26.7 23.3 17.1 24.7 22.4 28.9 21.4 21.42002 25.1 20.1 21.9 20.3 9.6 22.9 19.6 21.0 14.8 19.0 32.5 17.7 25.8 25.1 17.2 24.9 21.6 27.7 21.0 21.02003 24.9 19.7 21.8 22.9 12.2 23.4 19.0 20.1 14.8 20.2 30.2 14.7 25.4 24.6 16.8 24.5 18.2 24.5 20.7 20.72004 25.4 22.3 21.7 23.3 12.0 22.4 19.5 20.6 14.1 19.9 33.5 12.5 27.6 25.2 15.7 24.9 19.7 26.3 21.7 21.72005 25.1 22.4 23.6 23.6 10.6 22.1 19.3 20.0 13.6 21.0 34.0 12.5 26.5 24.8 13.2 25.5 20.3 25.3 21.4 21.42006 25.8 24.6 23.0 24.6 10.9 21.9 20.0 20.3 13.4 16.5 30.7 12.2 29.0 25.7 12.3 26.6 19.7 25.9 22.4 22.42007 26.9 26.8 22.9 21.4 9.1 21.0 20.6 20.8 10.0 17.6 31.1 17.6 28.8 27.3 12.7 27.4 22.2 27.1 23.1 23.12008 25.1 25.4 21.4 16.2 6.0 19.5 20.1 18.8 11.1 18.1 26.9 15.3 25.2 27.6 10.6 25.7 21.4 25.4 21.5 21.52009 20.5 22.5 22.7 12.3 4.2 19.1 17.2 16.9 8.6 29.1 24.1 9.3 21.6 23.7 9.4 21.7 17.1 20.5 18.9 18.92010 23.3 23.7 23.4 13.9 4.8 18.4 17.4 16.5 10.6 22.8 27.5 15.3 22.8 24.7 9.8 20.4 18.8 20.2 19.5 19.5
2011 22.5 24.5 26.8 13.2 4.4 17.3 18.3 16.7 13.1 22.7 27.8 15.2 25.5 24.8 11.3 20.4 21.3 19.1 20.0 20.02012 20.8 24.3 26.6 14.5 9.1 18.5 17.7 17.6 8.2 22.5 27.1 14.6 25.2 24.5 14.4 20.6 21.1 18.1 20.2 20.22013 19.6 24.1 25.8 17.7 10.6 19.0 17.7 18.1 9.1 22.0 23.7 15.9 24.1 24.2 15.7 22.4 20.8 17.0 20.3 20.32014 20.0 24.2 24.7 19.1 11.6 19.0 18.1 19.0 8.9 21.3 24.3 16.5 25.0 24.8 16.8 23.3 20.7 17.1 20.8 20.82015 19.9 24.4 24.6 21.1 12.4 19.5 18.6 19.4 9.5 20.7 23.1 17.2 25.7 25.6 17.7 23.5 21.1 17.8 21.2 21.2
1) 1960-91 D_W 2) Euro area; 1960-91 including D_W 3) Former Euro area 12; 1960-91 including D_W 4) Former Euro area 12; 1960-91 including D_W

119
Saving
45. Gross national saving
(Percentage of gross domestic product at market prices)
BG CZ DK HR LT HU PL RO SE UK EU-28 EU-15 MK IS TR ME RS US JP 1) 2)
1960 : : 24.9 : : : : : 25.0 19.1 : 24.5 : : 14.7 : : 19.0 33.4
1965 : : 24.6 : : : : : 26.7 20.6 : 24.6 : 29.4 14.1 : : 21.2 33.0
1970 : : 22.2 : : : : : 25.1 22.1 : 26.7 : 25.9 -4.8 : : 21.2 40.0
1975 : : 19.9 : : : : : 24.1 16.9 : 22.7 : 24.3 22.3 : : 20.6 32.7
1980 : : 16.4 : : : : : 19.9 18.1 : 21.6 : 25.1 15.5 : : 22.0 31.3
1981 : : 14.1 : : : : : 18.3 17.2 : 19.9 : 22.6 22.2 : : 23.2 31.71982 : : 13.8 : : : : : 17.2 17.2 : 19.6 : 20.1 20.7 : : 21.8 30.61983 : : 15.3 : : : : : 19.2 17.7 : 19.9 : 19.2 18.2 : : 19.8 29.71984 : : 16.9 : : : : : 21.6 18.1 : 20.5 : 18.6 18.1 : : 21.9 30.61985 : : 17.1 : : : : : 21.5 18.0 : 20.4 : 17.0 22.4 : : 20.3 32.01986 : : 17.9 : : : : : 21.9 17.1 : 21.1 : 19.1 26.0 : : 18.9 32.31987 : : 18.2 : : : : : 22.2 17.3 : 20.9 : 17.4 26.6 : : 19.6 32.11988 : : 18.7 : : : : : 22.8 17.4 : 21.7 : 17.4 30.5 : : 20.6 33.51989 : : 19.1 : : : : : 23.6 17.4 : 22.0 : 17.5 28.7 : : 19.7 34.11990 : : 20.3 : : : : 21.7 22.4 16.6 : 21.8 : 16.9 25.0 : : 18.7 34.2
1991 20.4
1991 : : 19.5 : : : 13.7 26.9 19.2 15.7 : 20.5 : 16.1 22.2 : : 18.8 34.41992 : 29.7 20.0 : : : 13.4 24.5 16.6 14.7 : 19.8 : 15.7 22.3 : : 17.6 33.71993 : 27.0 19.1 : 16.0 11.9 13.9 26.9 14.4 14.5 : 19.4 : 17.6 22.4 : : 17.0 32.51994 : 27.5 19.3 : : 15.1 18.7 24.9 18.0 16.2 : 19.8 : 17.9 20.9 : : 17.8 30.71995 : 28.6 20.4 11.5 13.5 18.9 20.1 18.3 21.0 16.5 : 20.6 : 17.1 22.9 : : 18.7 30.21996 : 27.8 20.5 16.9 12.4 20.4 19.8 15.3 20.6 16.4 : 20.3 : 17.2 26.2 : : 19.5 30.01997 : 24.9 21.4 15.4 14.8 21.2 20.1 14.6 21.0 17.3 : 20.9 : 17.9 24.1 : : 20.7 30.31998 14.9 26.9 20.7 15.7 12.7 21.3 21.2 10.7 21.8 18.1 21.0 21.1 : 17.4 22.9 : : 21.3 29.11999 14.1 25.3 21.7 14.8 10.4 18.5 20.2 11.1 22.3 15.7 20.7 20.7 : 15.0 18.8 : : 20.6 27.32000 12.5 26.0 22.6 18.0 12.6 19.3 19.5 15.5 23.3 15.0 20.5 20.5 19.4 13.1 17.1 : : 20.5 27.6
2001 14.7 25.2 23.5 20.0 14.0 19.7 18.4 16.6 23.2 15.4 20.3 20.4 12.2 17.0 17.0 : 11.5 19.4 26.42002 17.3 23.2 22.9 19.4 15.2 17.9 16.5 20.9 22.5 15.4 20.0 20.1 10.6 19.7 17.3 : 5.3 18.1 25.32003 15.8 21.9 23.1 20.2 14.6 15.3 17.0 17.1 24.0 15.4 19.8 19.9 15.1 15.0 15.1 : 9.3 17.3 25.62004 16.3 23.0 23.4 22.3 14.8 16.4 14.8 17.9 23.7 15.3 20.5 20.7 13.8 13.7 15.7 : 17.4 17.5 26.22005 15.9 24.5 25.2 22.0 16.6 16.4 17.0 14.4 24.8 15.3 20.3 20.5 18.8 12.2 15.5 : 16.5 17.9 26.12006 14.5 25.1 25.7 22.8 15.8 16.6 17.0 15.9 26.6 14.7 21.0 21.2 21.1 11.4 16.0 : 13.7 19.1 26.62007 8.8 24.7 24.7 22.2 16.2 15.0 18.4 17.4 28.9 16.0 21.8 22.0 17.6 13.1 15.2 : 11.1 17.3 27.72008 14.4 26.0 25.2 22.2 14.0 16.6 18.3 19.8 29.0 16.2 20.9 21.0 13.9 0.0 16.3 : 7.8 15.5 26.32009 20.4 20.6 20.3 20.5 13.5 17.9 17.3 21.2 23.4 12.7 18.2 18.2 19.4 2.4 13.0 : 10.8 14.4 22.62010 22.5 19.8 22.7 20.1 16.9 19.6 16.7 21.2 25.6 12.3 18.7 18.7 22.9 4.5 13.3 : 9.6 15.1 23.5
2011 22.0 21.0 23.7 19.8 17.4 19.8 17.6 22.4 26.1 13.5 19.3 19.3 23.7 8.0 13.9 : 11.3 15.8 22.22012 20.9 20.7 23.4 18.7 17.2 18.6 17.1 21.5 25.3 10.7 19.0 18.9 26.4 9.5 14.0 : 10.4 16.5 21.82013 22.8 21.1 24.7 19.1 19.7 20.7 17.1 21.9 25.0 9.5 18.9 18.9 22.5 17.4 12.7 5.0 13.2 18.0 21.72014 22.8 21.7 24.2 20.2 18.6 21.1 17.6 22.0 25.1 10.6 19.4 19.3 20.1 14.1 13.9 7.3 15.5 17.6 22.22015 22.2 21.9 24.3 20.7 18.9 21.4 17.8 21.9 25.5 11.7 19.8 19.8 19.4 13.4 16.0 9.3 18.5 18.0 22.7
1) 1960-91 including D_W 2) Former EU-15; 1960-91 including D_W

120
Saving
46. Gross saving; private sectorESA 1995
(Percentage of gross domestic product at market prices)
BE DE EE IE EL ES FR IT CY LV LU MT NL AT PT SI SK FI EA-18 EA-12 1) 2) 3)
1975 24.6 22.4 : : : : : : : : : : 23.1 : : : : 17.2 : : 1976 25.8 21.2 : : : : : : : : : : 23.2 20.5 : : : 13.6 : : 1977 24.3 20.1 : : : : : : : : : : 21.1 18.8 24.1 : : 13.8 : : 1978 24.4 21.1 : : : : 19.9 : : : : : 20.5 20.3 28.3 : : 17.0 : : 1979 23.0 20.6 : : : : 18.0 : : : : : 20.6 21.2 30.2 : : 19.3 : : 1980 24.4 19.7 : : : : 17.3 27.2 : : : : 21.0 19.6 29.6 : : 19.4 : :
1975-1980 24.4 20.8 : : : : : : : : : : 21.6 : : : : 16.7 : :
1981 25.3 20.0 : : : : 16.9 28.6 : : : : 22.3 17.8 26.7 : : 17.1 : : 1982 23.6 20.2 : : : : 15.8 27.8 : : : : 23.2 19.4 23.4 : : 17.4 : : 1983 23.8 20.4 : : : : 15.7 28.9 : : : : 23.7 19.0 22.3 : : 18.7 : : 1984 24.3 20.3 : : : : 15.5 29.7 : : : : 25.8 18.6 21.5 : : 18.2 : : 1985 24.0 20.4 : 20.1 : : 15.7 29.7 : : : : 22.8 18.6 24.8 : : 17.2 : : 1986 25.4 21.9 : 19.7 : : 17.4 29.0 : : : : 24.0 20.0 27.8 : : 16.4 : : 1987 24.5 21.9 : 20.1 : : 16.2 28.2 : : : : 24.4 21.2 29.7 : : 18.0 : : 1988 26.5 23.4 : 17.4 29.3 : 17.5 27.8 : : : : 25.4 21.5 24.6 : : 16.4 : : 1989 28.8 22.3 : 16.4 28.5 : 17.5 27.7 : : : : 27.9 22.1 24.8 : : 15.2 : : 1990 28.5 24.0 : 19.0 28.4 : 17.7 27.4 : 14.1 32.5 : 27.4 21.8 27.8 : : 14.4 : :
1981-1990 25.5 21.5 : : : : 16.6 28.5 : : : : 24.7 20.0 25.3 : : 16.9 : :
1991 22.0 .................... ................. ................. ................. ................. ................. ................. ................. ................. ................. ................. ................. ................. ................. ................. ................. ................. ................. ................. ................. .................
1991 28.1 21.3 : 18.9 27.2 : 18.0 27.1 : : 33.9 : 24.5 21.8 23.8 : : 13.1 : : 1992 29.1 20.8 : 16.8 27.1 : 19.0 27.2 : 56.2 32.8 : 25.5 20.1 21.3 : : 15.4 : : 1993 29.1 20.5 10.0 18.7 26.4 : 19.3 26.6 : 32.0 30.0 : 24.5 21.5 22.3 : 23.6 18.8 : : 1994 28.2 20.2 8.4 17.4 26.3 : 19.0 26.0 : 29.4 28.7 : 26.4 22.1 21.8 : 24.6 20.1 : : 1995 27.5 21.1 15.5 20.7 22.2 23.6 19.3 26.0 16.4 15.7 24.3 24.3 28.0 23.7 22.2 19.6 22.4 22.4 22.5 22.51996 26.1 21.2 16.5 19.3 20.3 22.7 18.2 26.1 16.1 11.1 24.3 24.8 25.8 21.9 20.5 20.3 24.4 20.0 21.9 21.91997 25.4 21.0 13.5 19.8 18.4 22.0 19.4 22.6 15.8 13.7 24.9 24.2 26.5 21.1 19.5 22.8 24.2 22.0 21.5 21.51998 24.1 20.7 17.0 20.2 16.2 21.2 19.5 21.4 25.3 15.4 23.9 23.3 23.3 21.8 19.7 22.3 23.3 20.3 20.8 20.81999 24.4 19.3 19.7 16.7 14.4 19.8 19.4 19.8 17.4 15.3 23.8 22.3 23.7 22.1 18.6 22.0 22.8 21.5 19.9 19.92000 24.2 19.0 19.6 15.8 11.4 19.2 19.0 19.4 12.9 18.1 25.7 16.7 23.9 22.5 17.4 23.4 23.7 19.0 19.5 19.5
1991-2000 26.6 20.5 : 18.4 21.0 : 19.0 24.2 : : 27.2 : 25.2 21.9 20.7 : : 19.3 : :
2001 23.2 20.2 18.7 16.4 11.9 18.4 18.8 20.3 12.0 16.8 23.4 18.1 23.2 20.2 17.9 24.2 23.8 21.2 19.8 19.82002 23.3 21.0 16.2 16.9 10.4 18.9 19.4 21.0 15.7 18.0 24.4 19.6 24.1 22.9 17.8 23.5 23.5 20.9 20.4 20.42003 24.4 21.1 15.8 19.2 14.1 19.6 19.7 21.1 17.3 19.1 24.1 16.5 24.8 23.4 18.3 22.7 18.0 19.4 20.8 20.82004 24.0 23.5 16.6 18.7 15.0 18.1 19.6 21.1 14.8 17.3 29.0 15.0 26.2 23.3 18.1 22.8 19.3 21.3 21.4 21.42005 23.5 23.2 18.4 18.8 13.4 16.7 19.1 20.8 13.4 17.5 28.2 13.9 23.7 23.5 16.4 23.1 19.3 20.2 20.7 20.72006 23.8 24.0 16.2 18.5 14.9 15.2 18.7 19.0 10.8 11.1 24.2 13.4 25.6 24.4 14.3 23.8 20.0 19.7 20.4 20.52007 25.0 24.3 15.3 17.2 13.5 14.2 19.5 18.7 2.5 12.1 23.0 17.2 25.4 24.9 13.3 22.7 21.5 19.4 20.4 20.52008 24.2 23.0 18.2 17.7 12.6 18.9 19.4 18.0 6.3 17.7 19.4 17.4 21.1 25.3 11.9 22.1 20.6 18.6 20.2 20.22009 23.5 22.9 20.7 19.8 16.1 24.4 20.5 18.9 9.3 33.5 19.5 11.0 22.3 24.3 16.4 22.7 21.0 20.3 21.5 21.52010 25.2 24.4 21.2 21.4 13.9 23.0 20.8 17.9 10.7 26.5 22.9 17.1 23.4 25.1 16.8 21.4 23.5 20.5 21.8 21.8
2001-2010 24.0 22.8 17.7 18.5 13.6 18.8 19.6 19.7 11.3 19.0 23.8 15.9 24.0 23.7 16.1 22.9 21.1 20.1 20.7 20.8
2011 24.0 22.9 23.5 19.9 13.2 22.6 19.8 17.9 14.9 22.6 22.8 16.5 26.0 23.8 16.2 21.7 23.1 17.6 21.2 21.12012 22.1 22.1 22.4 20.5 14.0 23.0 18.9 17.7 10.8 20.5 22.4 16.5 25.4 23.1 19.4 21.1 23.3 17.7 20.7 20.72013 20.6 22.1 22.5 22.9 11.6 23.9 18.2 18.8 10.9 20.3 19.5 16.7 23.6 22.9 19.2 23.2 21.6 16.8 20.6 20.62014 21.2 22.3 21.9 22.9 11.8 22.7 18.4 19.1 12.0 19.9 20.4 17.6 23.9 23.3 19.8 23.4 21.8 17.0 20.7 20.72015 21.0 22.5 22.0 23.9 11.8 23.7 18.7 19.2 12.8 19.5 20.4 17.9 24.1 23.7 19.1 23.4 21.8 16.8 21.0 21.0
1) 1975-91 D_W 2) Euro area; 1975-91 including D_W 3) Former Euro area 12; 1975-91 including D_W
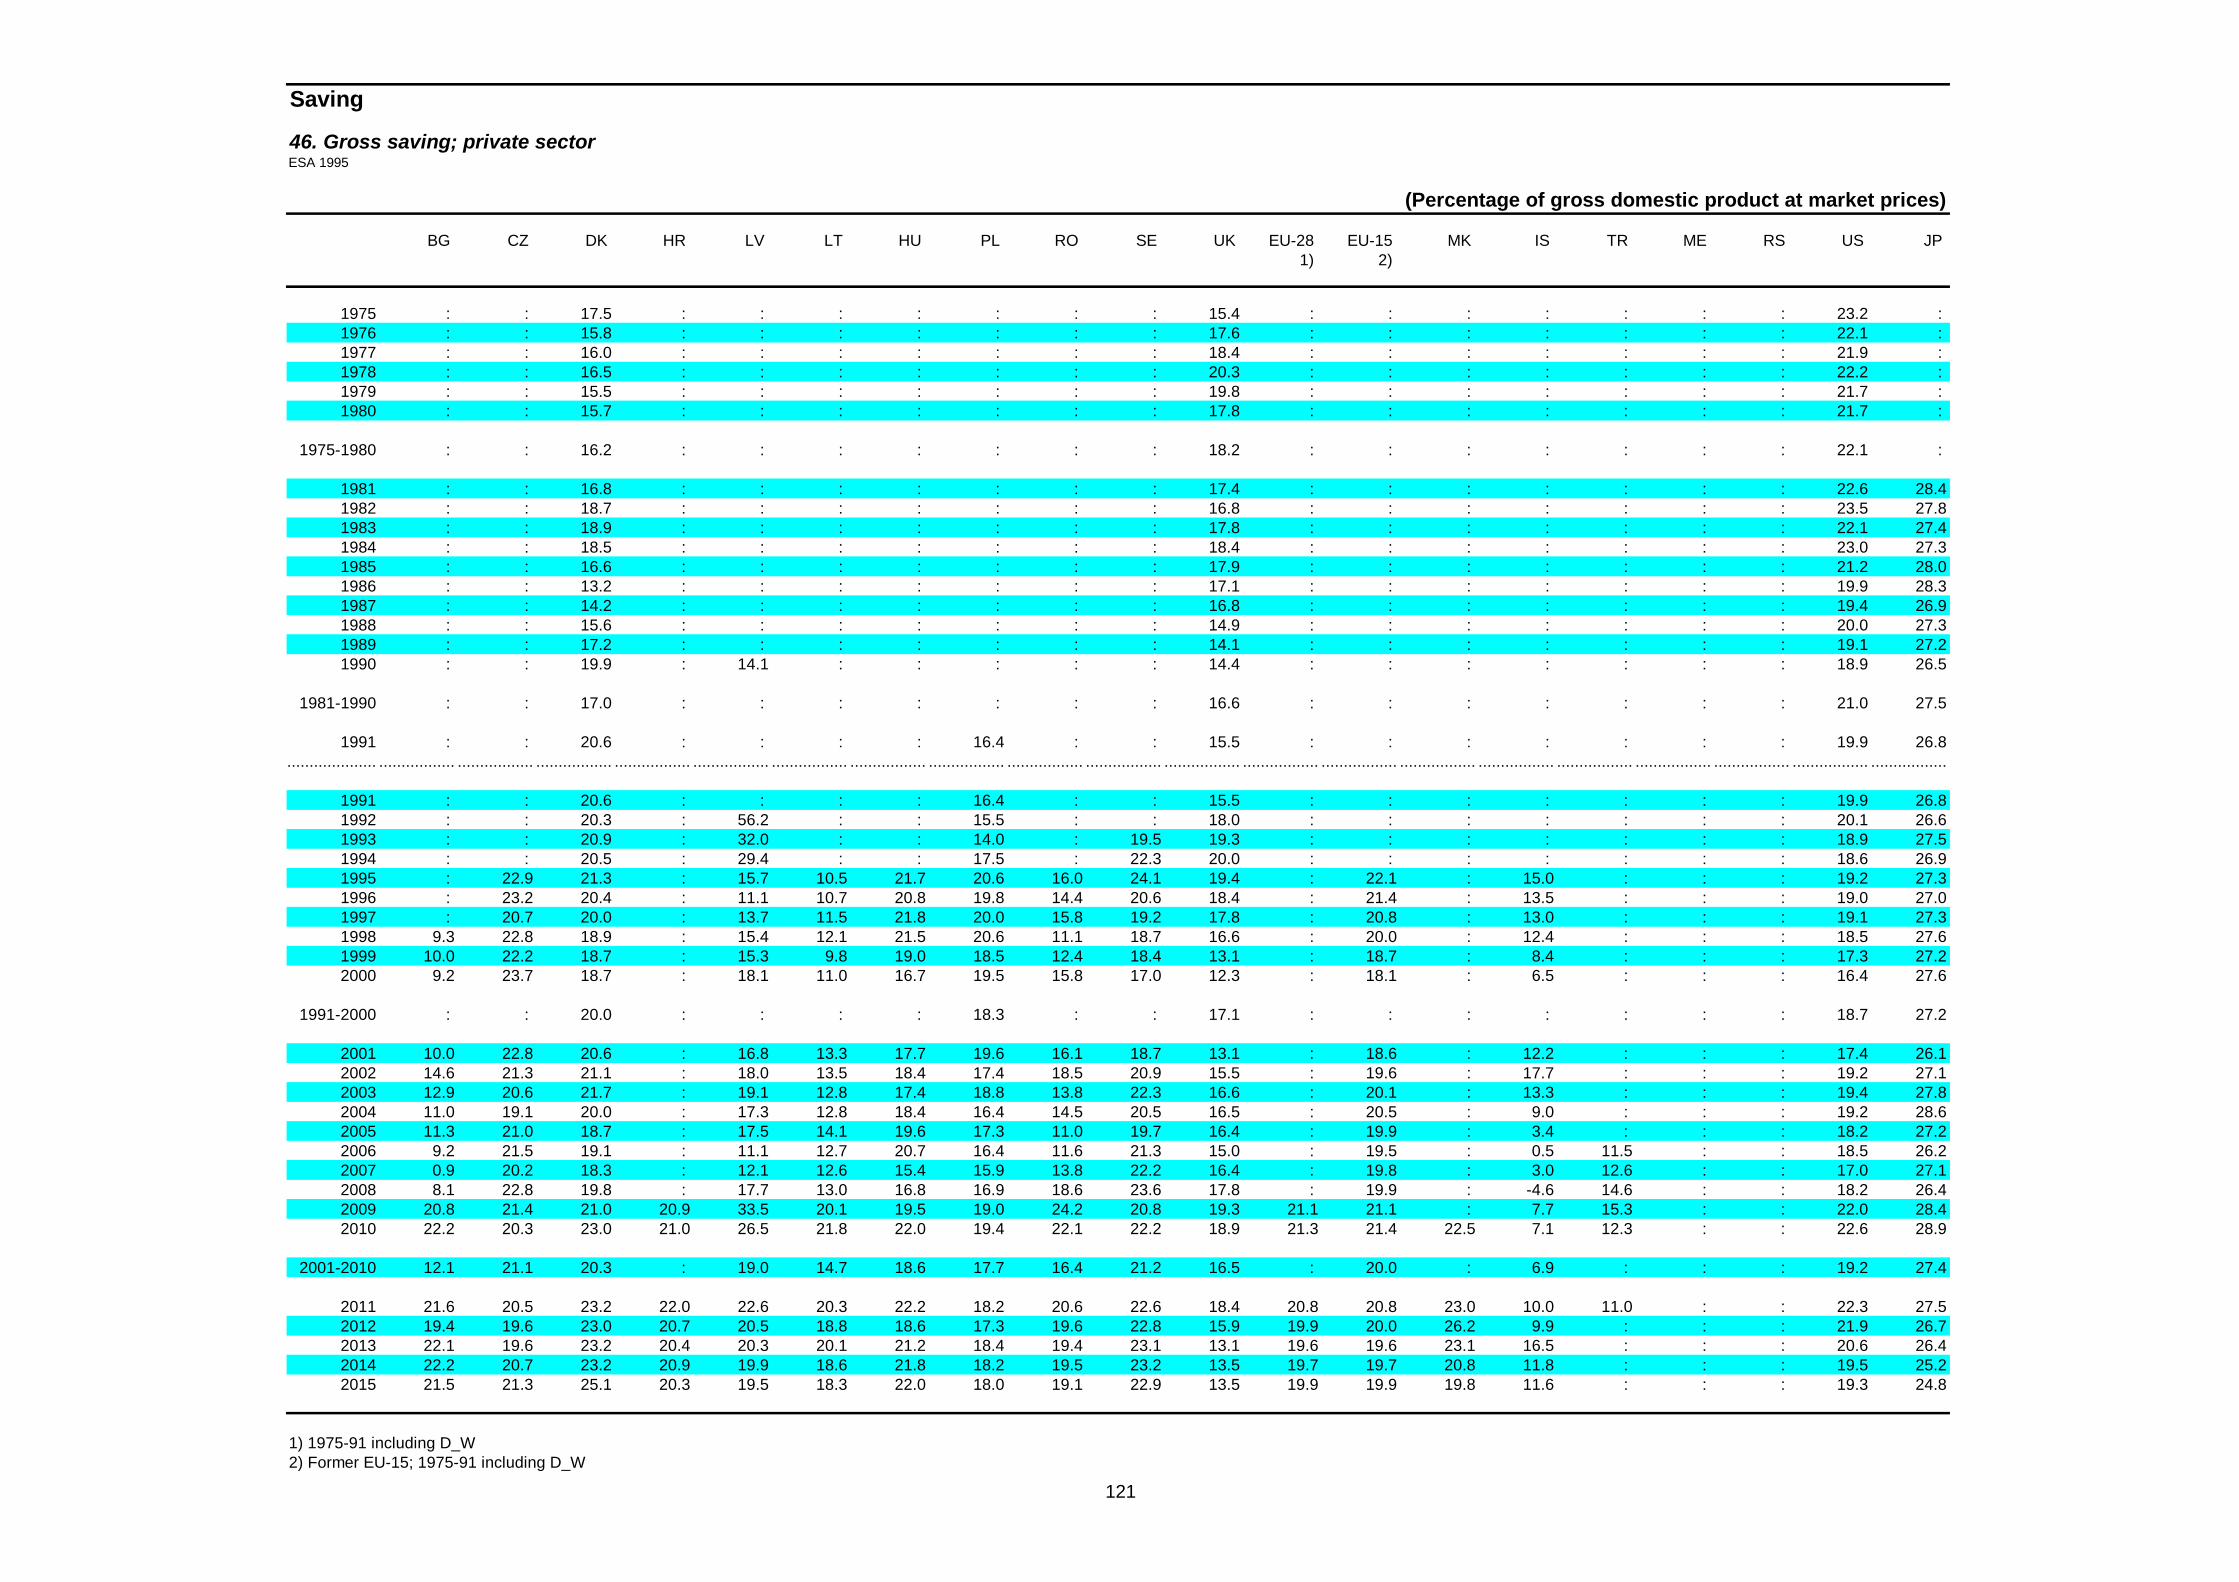
121
Saving
46. Gross saving; private sectorESA 1995
(Percentage of gross domestic product at market prices)
BG CZ DK HR LV LT HU PL RO SE UK EU-28 EU-15 MK IS TR ME RS US JP 1) 2)
1975 : : 17.5 : : : : : : : 15.4 : : : : : : : 23.2 : 1976 : : 15.8 : : : : : : : 17.6 : : : : : : : 22.1 : 1977 : : 16.0 : : : : : : : 18.4 : : : : : : : 21.9 : 1978 : : 16.5 : : : : : : : 20.3 : : : : : : : 22.2 : 1979 : : 15.5 : : : : : : : 19.8 : : : : : : : 21.7 : 1980 : : 15.7 : : : : : : : 17.8 : : : : : : : 21.7 :
1975-1980 : : 16.2 : : : : : : : 18.2 : : : : : : : 22.1 :
1981 : : 16.8 : : : : : : : 17.4 : : : : : : : 22.6 28.41982 : : 18.7 : : : : : : : 16.8 : : : : : : : 23.5 27.81983 : : 18.9 : : : : : : : 17.8 : : : : : : : 22.1 27.41984 : : 18.5 : : : : : : : 18.4 : : : : : : : 23.0 27.31985 : : 16.6 : : : : : : : 17.9 : : : : : : : 21.2 28.01986 : : 13.2 : : : : : : : 17.1 : : : : : : : 19.9 28.31987 : : 14.2 : : : : : : : 16.8 : : : : : : : 19.4 26.91988 : : 15.6 : : : : : : : 14.9 : : : : : : : 20.0 27.31989 : : 17.2 : : : : : : : 14.1 : : : : : : : 19.1 27.21990 : : 19.9 : 14.1 : : : : : 14.4 : : : : : : : 18.9 26.5
1981-1990 : : 17.0 : : : : : : : 16.6 : : : : : : : 21.0 27.5
1991 : : 20.6 : : : : 16.4 : : 15.5 : : : : : : : 19.9 26.8.................... ................. ................. ................. ................. ................. ................. ................. ................. ................. ................. ................. ................. ................. ................. ................. ................. ................. ................. ................. .................
1991 : : 20.6 : : : : 16.4 : : 15.5 : : : : : : : 19.9 26.81992 : : 20.3 : 56.2 : : 15.5 : : 18.0 : : : : : : : 20.1 26.61993 : : 20.9 : 32.0 : : 14.0 : 19.5 19.3 : : : : : : : 18.9 27.51994 : : 20.5 : 29.4 : : 17.5 : 22.3 20.0 : : : : : : : 18.6 26.91995 : 22.9 21.3 : 15.7 10.5 21.7 20.6 16.0 24.1 19.4 : 22.1 : 15.0 : : : 19.2 27.31996 : 23.2 20.4 : 11.1 10.7 20.8 19.8 14.4 20.6 18.4 : 21.4 : 13.5 : : : 19.0 27.01997 : 20.7 20.0 : 13.7 11.5 21.8 20.0 15.8 19.2 17.8 : 20.8 : 13.0 : : : 19.1 27.31998 9.3 22.8 18.9 : 15.4 12.1 21.5 20.6 11.1 18.7 16.6 : 20.0 : 12.4 : : : 18.5 27.61999 10.0 22.2 18.7 : 15.3 9.8 19.0 18.5 12.4 18.4 13.1 : 18.7 : 8.4 : : : 17.3 27.22000 9.2 23.7 18.7 : 18.1 11.0 16.7 19.5 15.8 17.0 12.3 : 18.1 : 6.5 : : : 16.4 27.6
1991-2000 : : 20.0 : : : : 18.3 : : 17.1 : : : : : : : 18.7 27.2
2001 10.0 22.8 20.6 : 16.8 13.3 17.7 19.6 16.1 18.7 13.1 : 18.6 : 12.2 : : : 17.4 26.12002 14.6 21.3 21.1 : 18.0 13.5 18.4 17.4 18.5 20.9 15.5 : 19.6 : 17.7 : : : 19.2 27.12003 12.9 20.6 21.7 : 19.1 12.8 17.4 18.8 13.8 22.3 16.6 : 20.1 : 13.3 : : : 19.4 27.82004 11.0 19.1 20.0 : 17.3 12.8 18.4 16.4 14.5 20.5 16.5 : 20.5 : 9.0 : : : 19.2 28.62005 11.3 21.0 18.7 : 17.5 14.1 19.6 17.3 11.0 19.7 16.4 : 19.9 : 3.4 : : : 18.2 27.22006 9.2 21.5 19.1 : 11.1 12.7 20.7 16.4 11.6 21.3 15.0 : 19.5 : 0.5 11.5 : : 18.5 26.22007 0.9 20.2 18.3 : 12.1 12.6 15.4 15.9 13.8 22.2 16.4 : 19.8 : 3.0 12.6 : : 17.0 27.12008 8.1 22.8 19.8 : 17.7 13.0 16.8 16.9 18.6 23.6 17.8 : 19.9 : -4.6 14.6 : : 18.2 26.42009 20.8 21.4 21.0 20.9 33.5 20.1 19.5 19.0 24.2 20.8 19.3 21.1 21.1 : 7.7 15.3 : : 22.0 28.42010 22.2 20.3 23.0 21.0 26.5 21.8 22.0 19.4 22.1 22.2 18.9 21.3 21.4 22.5 7.1 12.3 : : 22.6 28.9
2001-2010 12.1 21.1 20.3 : 19.0 14.7 18.6 17.7 16.4 21.2 16.5 : 20.0 : 6.9 : : : 19.2 27.4
2011 21.6 20.5 23.2 22.0 22.6 20.3 22.2 18.2 20.6 22.6 18.4 20.8 20.8 23.0 10.0 11.0 : : 22.3 27.52012 19.4 19.6 23.0 20.7 20.5 18.8 18.6 17.3 19.6 22.8 15.9 19.9 20.0 26.2 9.9 : : : 21.9 26.72013 22.1 19.6 23.2 20.4 20.3 20.1 21.2 18.4 19.4 23.1 13.1 19.6 19.6 23.1 16.5 : : : 20.6 26.42014 22.2 20.7 23.2 20.9 19.9 18.6 21.8 18.2 19.5 23.2 13.5 19.7 19.7 20.8 11.8 : : : 19.5 25.22015 21.5 21.3 25.1 20.3 19.5 18.3 22.0 18.0 19.1 22.9 13.5 19.9 19.9 19.8 11.6 : : : 19.3 24.8
1) 1975-91 including D_W 2) Former EU-15; 1975-91 including D_W

122
Saving
47. Gross saving; general governmentESA 1995
(Percentage of gross domestic product at market prices)
BE DE EE IE EL ES FR IT CY LV LU MT NL AT PT SI SK FI EA-18 EA-12 1) 2) 3)
1975 -0.2 0.1 : : : : : : : : : : 2.8 : : : : 10.3 : : 1976 -0.6 1.9 : : : : : : : : : : 3.2 3.0 : : : 12.3 : : 1977 -0.7 2.7 : : : : : : : : : : 3.5 3.9 0.9 : : 10.8 : : 1978 -1.5 2.5 : : : : 2.2 : : : : : 2.3 3.5 -1.6 : : 8.0 : : 1979 -2.3 2.5 : : : : 3.9 : : : : : 2.4 3.2 -0.9 : : 7.4 : : 1980 -4.1 2.1 : : : : 3.9 -2.7 : : : : 2.0 4.0 -2.1 : : 8.0 : :
1975-1980 -1.5 2.0 : : : : : : : : : : 2.7 : : : : 9.5 : :
1981 -7.7 0.7 : : : : 1.8 -6.2 : : : : 1.1 4.1 -3.3 : : 9.2 : : 1982 -6.9 0.8 : : : : 1.6 -5.8 : : : : -0.4 2.0 -1.4 : : 7.4 : : 1983 -7.4 1.1 : : : : 1.4 -6.5 : : : : -0.4 1.5 -0.1 : : 5.8 : : 1984 -6.6 1.8 : : : : 1.3 -7.2 : : : : 0.1 2.8 -1.6 : : 7.1 : : 1985 -6.2 2.5 : -6.5 : : 0.9 -7.5 : : : : 1.4 2.7 -2.6 : : 7.1 : : 1986 -6.4 2.4 : -6.5 : : 0.6 -7.0 : : : : 0.6 1.6 -3.6 : : 7.7 : : 1987 -4.7 1.7 : -5.4 : : 1.5 -6.4 : : : : 0.1 0.6 -3.5 : : 5.7 : : 1988 -4.0 1.4 : -2.7 -7.0 : 1.5 -6.0 : : : : 0.4 1.4 -0.3 : : 9.5 : : 1989 -5.2 3.4 : -0.9 -8.5 : 2.3 -6.6 : : : : -0.7 1.5 0.3 : : 10.2 : : 1990 -4.6 1.3 : -1.1 -8.3 : 2.2 -6.4 : 9.1 9.3 : -1.4 2.2 -2.7 : : 9.3 : :
1981-1990 -6.0 1.7 : : : : 1.5 -6.6 : : : : 0.1 2.1 -1.9 : : 7.9 : :
1991 0.8 .................... ................. ................. ................. ................. ................. ................. ................. ................. ................. ................. ................. ................. ................. ................. ................. ................. ................. ................. ................. .................
1991 -5.1 1.4 : -1.4 -5.5 : 1.3 -6.9 : 7.5 6.1 : 1.0 1.9 -3.7 : : 3.2 : : 1992 -5.6 1.6 : -1.4 -6.0 : -0.1 -8.0 : 3.5 5.7 : -0.7 2.8 -0.8 : : -1.7 : : 1993 -4.4 0.8 14.4 -1.2 -7.0 : -1.7 -6.7 : 5.0 7.0 : 0.5 0.6 -3.7 : -3.1 -4.0 : : 1994 -2.4 0.9 10.9 0.4 -5.8 : -1.0 -5.9 : 2.3 7.5 : -0.3 0.1 -4.1 : 1.7 -2.0 : : 1995 -2.0 0.1 5.9 -0.2 -6.1 -2.0 -0.9 -3.8 3.2 0.9 7.4 -0.8 -0.8 -1.4 -1.7 3.3 4.3 -0.8 -1.2 -1.21996 -1.6 -0.5 4.2 1.6 -4.7 -1.2 -0.1 -3.7 0.4 2.1 7.1 -5.5 0.9 0.4 -0.7 3.0 0.1 0.7 -1.0 -1.01997 0.3 -0.2 6.7 3.1 -2.4 0.2 0.0 -0.3 -1.1 1.7 7.7 -3.9 1.6 1.7 0.6 1.5 0.9 1.7 0.1 0.11998 1.5 0.4 4.7 4.1 -0.3 1.1 1.0 0.1 -0.8 2.2 8.6 -5.6 2.0 1.6 0.8 2.3 0.8 4.5 0.9 0.91999 2.0 1.2 0.9 6.6 0.6 2.6 2.0 1.4 -1.2 -0.3 8.5 -2.9 3.4 1.1 1.2 2.1 0.9 4.8 1.8 1.82000 2.6 1.5 3.5 7.9 -0.2 3.0 2.1 1.3 1.1 0.2 10.7 -2.4 4.5 1.2 0.4 0.8 -0.3 9.4 2.2 2.2
1991-2000 -1.5 0.7 : 2.0 -3.8 : 0.3 -3.3 : 2.5 7.6 : 1.2 1.0 -1.2 : : 1.6 : :
2001 2.3 0.0 4.3 5.1 -0.1 3.6 2.0 0.7 1.1 1.3 9.8 -2.5 3.5 3.1 -0.8 0.4 -1.4 7.7 1.5 1.52002 1.9 -0.9 5.7 3.4 -0.7 3.9 0.2 0.0 -0.9 1.0 8.1 -1.8 1.7 2.1 -0.6 1.4 -1.9 6.8 0.6 0.62003 0.6 -1.3 6.0 3.6 -1.9 3.7 -0.7 -1.0 -2.6 1.1 6.1 -1.8 0.7 1.3 -1.5 1.8 0.2 5.1 -0.1 -0.12004 1.4 -1.2 5.1 4.6 -3.0 4.3 -0.2 -0.5 -0.7 2.7 4.5 -2.5 1.4 1.9 -2.4 2.2 0.3 5.0 0.3 0.32005 1.7 -0.9 5.3 4.8 -2.9 5.4 0.3 -0.8 0.2 3.5 5.7 -1.5 2.8 1.3 -3.2 2.4 1.0 5.2 0.7 0.72006 2.1 0.7 6.8 6.1 -4.0 6.7 1.3 1.3 2.5 5.4 6.5 -1.2 3.5 1.4 -2.0 2.7 -0.2 6.2 1.9 1.92007 1.9 2.5 7.6 4.2 -4.4 6.8 1.1 2.1 7.4 5.5 8.0 0.4 3.4 2.5 -0.7 4.7 0.7 7.7 2.6 2.62008 0.9 2.4 3.2 -1.5 -6.5 0.6 0.6 0.8 4.9 0.4 7.5 -2.1 4.1 2.3 -1.3 3.6 0.8 6.7 1.3 1.32009 -3.0 -0.4 2.0 -7.5 -11.9 -5.3 -3.3 -2.0 -0.7 -4.4 4.6 -1.7 -0.7 -0.6 -6.9 -1.0 -4.0 0.2 -2.6 -2.62010 -1.9 -0.7 2.2 -7.5 -9.1 -4.6 -3.3 -1.4 -0.1 -3.7 4.6 -1.8 -0.6 -0.4 -7.0 -1.0 -4.6 -0.3 -2.3 -2.3
2001-2010 0.8 0.0 4.8 1.5 -4.5 2.5 -0.2 -0.1 1.1 1.3 6.5 -1.6 2.0 1.5 -2.6 1.7 -0.9 5.0 0.4 0.4
2011 -1.5 1.6 3.3 -6.7 -8.9 -5.4 -1.5 -1.2 -1.9 0.2 5.0 -1.3 -0.5 1.0 -4.9 -1.3 -1.8 1.5 -1.1 -1.12012 -1.3 2.2 4.2 -6.0 -4.9 -4.5 -1.1 -0.2 -2.7 2.0 4.6 -1.9 -0.2 1.4 -5.0 -0.4 -2.2 0.4 -0.4 -0.42013 -1.0 2.0 3.3 -5.2 -0.9 -4.9 -0.5 -0.7 -1.8 1.7 4.2 -0.8 0.5 1.3 -3.5 -0.8 -0.8 0.2 -0.3 -0.32014 -1.2 1.9 2.8 -3.8 -0.2 -3.7 -0.3 -0.1 -3.0 1.4 3.9 -1.1 1.2 1.5 -3.0 -0.1 -1.0 0.1 0.0 0.02015 -1.2 1.8 2.7 -2.7 0.7 -4.2 -0.1 0.3 -3.3 1.2 2.7 -0.7 1.6 1.8 -1.4 0.2 -0.7 1.0 0.2 0.2
1) 1975-91 D_W 2) Euro area; 1975-91 including D_W 3) Former Euro area 12; 1975-91 including D_W

123
Saving
47. Gross saving; general governmentESA 1995
(Percentage of gross domestic product at market prices)
BG CZ DK HR LV LT HU PL RO SE UK EU-28 EU-15 MK IS TR ME RS US JP 1) 2)
1975 : : 2.4 : : : : : : : 1.5 : : : : : : : -2.6 : 1976 : : 3.8 : : : : : : : 0.8 : : : : : : : -0.8 : 1977 : : 3.7 : : : : : : : 1.2 : : : : : : : 0.1 : 1978 : : 3.6 : : : : : : : -0.3 : : : : : : : 1.1 : 1979 : : 2.5 : : : : : : : 0.0 : : : : : : : 1.6 : 1980 : : 0.7 : : : : : : : 0.3 : : : : : : : 0.4 :
1975-1980 : : 2.8 : : : : : : : 0.6 : : : : : : : 0.0 :
1981 : : -2.7 : : : : : : : -0.2 : : : : : : : 0.7 3.31982 : : -5.0 : : : : : : : 0.4 : : : : : : : -1.7 2.81983 : : -3.6 : : : : : : : -0.1 : : : : : : : -2.3 2.31984 : : -1.6 : : : : : : : -0.3 : : : : : : : -1.1 3.31985 : : 0.4 : : : : : : : 0.1 : : : : : : : -0.9 4.01986 : : 4.7 : : : : : : : 0.0 : : : : : : : -1.0 4.01987 : : 4.0 : : : : : : : 0.5 : : : : : : : 0.2 5.21988 : : 3.1 : : : : : : : 2.5 : : : : : : : 0.5 6.21989 : : 1.9 : : : : : : : 3.3 : : : : : : : 0.6 7.01990 : : 0.5 : 9.1 : : : : : 2.2 : : : : : : : -0.2 7.7
1981-1990 : : 0.2 : : : : : : : 0.8 : : : : : : : -0.5 4.6
1991 -7.0 : -1.1 : 7.5 : : -2.7 : : 0.2 : : : : : : : -1.1 7.61992 0.0 : -0.4 : 3.5 : : -2.1 : : -3.3 : : : : : : : -2.5 7.11993 -6.1 : -1.7 : 5.0 : : -0.1 : -5.1 -4.8 : : : : : : : -2.0 5.01994 -3.2 : -1.2 : 2.3 : : 1.1 : -4.3 -3.8 : : : : : : : -0.8 3.91995 -7.1 5.7 -0.9 : 0.9 3.0 -2.8 -0.5 2.3 -3.1 -2.9 : -1.5 : 2.1 : : : -0.6 2.91996 -10.6 4.6 0.1 : 2.1 1.7 -0.3 0.0 0.9 0.0 -2.0 : -1.1 : 3.7 : : : 0.5 3.01997 2.5 4.2 1.4 : 1.7 3.3 -0.7 0.0 -1.2 1.8 -0.5 : 0.1 : 4.9 : : : 1.7 3.11998 5.6 4.1 1.8 : 2.2 0.7 -0.2 0.6 -0.4 3.1 1.5 : 1.1 : 4.9 : : : 2.8 1.51999 4.2 3.1 3.0 : -0.3 0.6 -0.5 1.6 -1.3 3.9 2.5 : 2.1 : 6.7 : : : 3.3 0.12000 3.3 2.3 3.9 : 0.2 1.6 2.5 -0.1 -0.3 6.3 2.8 : 2.5 : 6.6 : : : 4.1 0.0
1991-2000 -1.8 : 0.5 : 2.5 : : -0.2 : : -1.0 : : : : : : : 0.5 3.4
2001 4.7 2.4 2.9 : 1.3 0.7 2.0 -1.2 0.5 4.4 2.4 : 1.8 : 4.7 : : : 2.0 0.32002 2.7 1.9 1.8 : 1.0 1.7 -0.5 -1.0 2.4 1.6 -0.1 : 0.5 : 2.1 : : : -1.1 -1.82003 2.9 1.3 1.4 : 1.1 1.8 -2.1 -1.8 3.3 1.7 -1.2 : -0.2 : 1.7 : : : -2.1 -2.22004 5.3 3.9 3.3 : 2.7 2.0 -2.1 -1.5 3.4 3.3 -1.2 : 0.2 : 4.7 : : : -1.7 -2.42005 4.6 3.5 6.5 : 3.5 2.5 -3.2 -0.2 3.4 5.1 -1.1 : 0.6 : 8.7 : : : -0.3 -1.12006 5.3 3.5 6.6 : 5.4 3.1 -4.1 0.7 4.3 5.3 -0.3 : 1.7 : 10.8 4.5 : : 0.6 0.42007 7.9 4.5 6.5 : 5.5 3.6 -0.4 2.5 3.6 6.7 -0.4 : 2.3 : 10.1 2.6 : : 0.3 0.62008 6.3 3.2 5.5 : 0.4 1.0 -0.2 1.3 1.2 5.4 -1.6 : 1.1 : 4.6 1.7 : : -2.7 -0.12009 -0.4 -0.8 -0.6 -0.4 -4.4 -6.6 -1.6 -1.8 -3.0 2.5 -6.6 -2.9 -3.0 : -5.3 -2.3 : : -7.6 -5.82010 0.3 -0.5 -0.3 -0.9 -3.7 -4.8 -2.4 -2.7 -0.9 3.4 -6.6 -2.7 -2.7 0.4 -2.6 1.0 : : -7.5 -5.4
2001-2010 4.0 2.3 3.4 : 1.3 0.5 -1.4 -0.6 1.8 3.9 -1.7 : 0.2 : 4.0 : : : -2.0 -1.7
2011 0.4 0.5 0.5 -2.1 0.2 -2.9 -2.4 -0.6 1.8 3.5 -4.8 -1.4 -1.5 0.7 -2.0 2.8 : : -6.4 -5.32012 1.5 1.1 0.3 -2.1 2.0 -1.6 -0.1 -0.2 2.0 2.6 -5.2 -1.0 -1.1 0.2 -0.4 : : : -5.4 -4.92013 0.7 1.5 1.5 -1.2 1.7 -0.4 -0.5 -1.2 2.5 1.9 -3.5 -0.6 -0.7 -0.6 0.9 : : : -2.6 -4.72014 0.6 1.0 1.1 -0.7 1.4 0.0 -0.6 -0.6 2.5 1.9 -2.9 -0.3 -0.3 -0.7 2.3 : : : -1.9 -3.02015 0.8 0.7 -0.7 0.4 1.2 0.6 -0.6 -0.2 2.8 2.6 -1.9 0.0 -0.1 -0.4 1.8 : : : -1.3 -2.1
1) 1975-91 including D_W 2) Former EU-15; 1975-91 including D_W

124
Money interest rates and exchange rates
48. Nominal short-term interest rates
(%)
BE DE EE IE EL ES FR IT CY LV MT NL AT PT SI SK FI EA-17 EA-12 1) 2) 3)
1961-1970 5.2 5.0 : : : : 5.4 3.7 : : : 3.8 : : : : : : :
1971 5.4 7.1 : 6.5 : : 6.0 5.7 : : : 4.5 4.4 4.3 : : 8.1 : : 1972 4.2 5.7 : 7.1 : : 5.3 5.2 : : : 2.7 5.2 4.4 : : 7.8 : : 1973 6.6 12.2 : 12.2 : : 9.3 7.0 : : : 7.5 6.9 4.4 : : 9.3 : : 1974 10.6 9.8 : 14.6 : : 13.0 14.9 : : : 10.4 7.3 5.3 : : 10.4 : : 1975 7.0 4.9 : 10.9 : : 7.6 10.4 : : : 5.4 5.5 6.8 : : 11.7 : : 1976 10.3 4.3 : 11.7 : : 8.7 16.0 : : : 7.4 4.7 8.4 : : 12.4 : : 1977 7.4 4.3 : 8.4 : 15.5 9.1 14.0 : : : 4.8 7.5 11.1 : : 11.8 : 9.01978 7.3 3.7 : 9.9 : 17.6 7.8 11.5 : : : 7.0 6.4 15.5 : : 8.6 : 8.41979 10.9 6.9 : 16.0 : 15.5 9.7 12.0 : : : 9.6 5.6 16.1 : : 8.5 : 10.01980 14.3 9.5 : 16.2 16.4 16.5 12.0 16.9 : : : 10.6 10.3 16.3 : : 13.8 : 13.0
1971-1980 8.4 6.9 : 11.3 : : 8.8 11.3 : : : 7.0 6.4 9.3 : : 10.2 : :
1981 15.6 12.4 : 16.7 16.8 16.2 15.3 19.3 : : : 11.8 11.4 16.0 : : 12.7 : 15.11982 14.3 8.8 : 17.5 18.9 16.3 14.6 19.9 : : : 8.2 8.8 16.8 : : 13.7 : 13.81983 10.4 5.8 : 14.0 16.6 20.1 12.5 18.3 : : : 5.7 5.4 20.9 : : 14.2 : 12.11984 11.5 6.0 : 13.2 15.7 14.9 11.7 17.3 : : : 6.1 6.6 22.5 : : 15.8 : 11.41985 9.6 5.4 : 12.0 17.0 12.2 10.0 15.0 : : : 6.3 6.2 21.0 : : 12.8 : 10.11986 8.1 4.6 : 12.4 19.8 11.7 7.7 12.8 : : : 5.7 5.3 15.6 : : 11.7 : 8.71987 7.1 4.0 : 11.1 14.9 15.8 8.3 11.4 : : : 5.4 4.4 13.9 : : 10.0 : 8.51988 6.7 4.3 : 8.1 15.9 11.6 7.9 11.3 : : : 4.8 4.6 13.0 : : 10.0 : 8.01989 8.7 7.1 : 9.8 18.7 15.0 9.4 12.7 : : : 7.4 7.5 13.7 : : 12.6 : 10.21990 9.8 8.4 : 11.4 19.9 15.2 10.3 12.3 : : : 8.7 8.5 16.9 : : 14.0 : 11.0
1981-1990 10.2 6.7 12.6 17.4 14.9 10.8 15.0 7.0 6.9 17.0 12.7 10.9...........................................................................................................................................................................................................................................................................................................................................................................
1991 9.4 9.2 : 10.4 22.7 13.2 9.6 12.2 : : : 9.3 9.1 17.7 : : 13.1 : 10.91992 9.4 9.5 : 12.4 23.5 13.3 10.4 14.0 : : : 9.4 9.3 16.2 : : 13.3 : 11.51993 8.1 7.2 : 9.3 23.5 11.7 8.6 10.2 : : : 6.9 7.2 13.3 : : 7.8 : 9.11994 5.6 5.3 : 5.9 24.6 8.0 5.9 8.5 : : : 5.2 5.0 11.1 : : 5.3 : 6.91995 4.7 4.5 : 6.3 16.4 9.4 6.6 10.3 : : 4.8 4.4 4.5 9.8 : 8.4 5.8 : 7.01996 3.2 3.3 8.1 5.4 13.8 7.5 3.9 8.7 : : 5.0 3.0 3.3 7.4 : 11.9 3.6 : 5.31997 3.4 3.3 8.6 6.1 12.8 5.4 3.5 6.8 : 6.0 5.1 3.3 3.5 5.7 : 21.8 3.2 : 4.61998 3.5 3.5 13.9 5.5 14.0 4.3 3.6 4.9 : 8.4 5.4 3.4 3.6 4.3 10.3 21.1 3.6 : 4.21999 3.0 3.0 7.8 3.0 10.1 3.0 3.0 3.0 6.3 8.4 5.2 3.0 3.0 3.0 8.6 15.7 3.0 3.3 3.12000 4.4 4.4 5.7 4.4 7.7 4.4 4.4 4.4 6.4 5.4 4.9 4.4 4.4 4.4 10.9 8.6 4.4 4.5 4.5
1991-2000 5.5 5.3 : 6.9 16.9 8.0 5.9 8.3 : : : 5.2 5.3 9.3 : : 6.3 : 6.7
2001 4.3 4.3 5.3 4.3 4.3 4.3 4.3 4.3 5.9 6.9 4.9 4.3 4.3 4.3 10.9 7.8 4.3 4.3 4.32002 3.3 3.3 3.9 3.3 3.3 3.3 3.3 3.3 4.4 4.4 4.0 3.3 3.3 3.3 8.0 7.8 3.3 3.4 3.32003 2.3 2.3 2.9 2.3 2.3 2.3 2.3 2.3 3.9 3.8 3.3 2.3 2.3 2.3 6.8 6.2 2.3 2.4 2.32004 2.1 2.1 2.5 2.1 2.1 2.1 2.1 2.1 4.7 4.2 2.9 2.1 2.1 2.1 4.7 4.7 2.1 2.2 2.12005 2.2 2.2 2.4 2.2 2.2 2.2 2.2 2.2 4.3 3.1 3.2 2.2 2.2 2.2 4.0 2.9 2.2 2.2 2.22006 3.1 3.1 3.2 3.1 3.1 3.1 3.1 3.1 3.4 4.4 3.5 3.1 3.1 3.1 3.6 4.3 3.1 3.1 3.12007 4.3 4.3 4.9 4.3 4.3 4.3 4.3 4.3 4.2 8.7 4.3 4.3 4.3 4.3 4.3 4.3 4.3 4.3 4.32008 4.6 4.6 6.7 4.6 4.6 4.6 4.6 4.6 4.6 8.0 4.6 4.6 4.6 4.6 4.6 4.2 4.6 4.6 4.62009 1.2 1.2 5.9 1.2 1.2 1.2 1.2 1.2 1.2 13.1 1.2 1.2 1.2 1.2 1.2 1.2 1.2 1.2 1.22010 0.8 0.8 1.6 0.8 0.8 0.8 0.8 0.8 0.8 2.0 0.8 0.8 0.8 0.8 0.8 0.8 0.8 0.8 0.8
2001-2010 2.8 2.8 3.9 2.8 2.8 2.8 2.8 2.8 3.7 5.8 3.3 2.8 2.8 2.8 4.9 4.4 2.8 2.9 2.8
2011 1.4 1.4 1.4 1.4 1.4 1.4 1.4 1.4 1.4 1.0 1.4 1.4 1.4 1.4 1.4 1.4 1.4 1.4 1.42012 0.6 0.6 0.6 0.6 0.6 0.6 0.6 0.6 0.6 0.9 0.6 0.6 0.6 0.6 0.6 0.6 0.6 0.6 0.62013 0.2 0.2 0.2 0.2 0.2 0.2 0.2 0.2 0.2 0.4 0.2 0.2 0.2 0.2 0.2 0.2 0.2 0.2 0.2
_________________________________________________________________________________________________________________________________________________________________ 1) 1961-90 D_W 2) Former Euro area 17; 1961-90 including D_W 3) Former Euro area 12; 1961-90 including D_W

125
Money interest rates and exchange rates
48. Nominal short-term interest rates
(%)
BG CZ DK HR LT HU PL RO SE UK EU-7 EU-27 EU-15 MK IS TR ME RS US JP 1) 2) 3)
1961-1970 : : 6.8 : : : : : : 6.3 5.1 : : : : : : : 4.3 :
1971 : : 7.6 : : : : : : 6.2 6.2 : : : : : : : 4.3 6.51972 : : 7.3 : : : : : : 6.8 5.5 : : : : : : : 4.2 5.21973 : : 7.6 : : : : : : 11.8 9.9 : : : : : : : 7.2 8.31974 : : 10.0 : : : : : : 13.4 12.2 : : : : : : : 7.9 14.71975 : : 8.0 : : : : : : 10.6 7.8 : : : : : : : 5.8 10.11976 : : 9.3 : : : : : : 11.6 9.4 : : : : : : : 5.0 7.31977 : : 14.7 : : : : : : 8.0 8.2 : : : : : : : 5.3 6.41978 : : 15.4 : : : : : : 9.5 7.8 : : : : : : : 7.4 5.11979 : : 12.5 : : : : : : 13.9 10.2 : : : : : : : 10.1 5.91980 : : 16.8 : : : : : : 16.8 13.3 : : : : : : : 11.6 10.7
1971-1980 : : 10.9 : : : : : : 10.8 9.1 : : : : : : : 6.9 8.0
1981 : : 14.9 : : : : : : 14.2 14.9 : : : : : : : 14.0 7.41982 : : 16.4 : : : : : 13.3 12.2 13.2 : 13.6 : : : : : 10.6 6.91983 : : 11.9 : : : : : 11.4 10.1 10.8 : 11.8 : : : : : 8.7 6.51984 : : 11.5 : : : : : 11.9 10.0 10.5 : 11.2 : : : : : 9.5 6.31985 : : 10.0 : : : : : 14.2 12.2 9.9 : 10.5 : : : : : 8.4 6.51986 : : 9.1 : : : : : 9.8 11.0 8.4 : 9.1 : : : : : 6.8 5.21987 : : 9.9 : : : : : 9.6 9.7 7.8 : 8.7 : : : : : 7.2 4.31988 : : 8.5 : : : : : 10.3 10.4 7.9 : 8.5 : : : : : 8.0 4.51989 : : 9.4 : : : : : 11.6 13.9 10.2 : 10.8 : : : : : 9.3 5.51990 : : 11.2 : : : : : 13.8 14.8 10.9 : 11.7 : : 52.4 : : 8.3 7.8
1981-1990 11.3 : 11.8 10.5 : : 9.1 6.1.................... ................. ................. ................. ................. ................. ................. ................. ................. ................. ................. ................. ................. ................. ................. ................. ................. ................. ................. ................. .................
1991 : : 9.9 : : : : : 11.8 11.6 10.3 : 11.0 : : 86.0 : : 6.0 7.41992 : : 11.7 : : : : : 13.4 9.7 10.6 : 11.3 : : 94.3 : : 3.8 4.51993 : 13.1 10.8 : : : : : 8.8 6.0 7.9 : 8.7 : : 85.8 : : 3.3 3.01994 : 9.1 6.3 : : 27.8 : : 7.7 5.6 6.1 : 6.7 : : 161.1 : : 4.8 2.31995 : 11.0 6.2 : : 31.3 27.6 43.0 8.8 6.8 6.5 : 7.0 : : 123.2 : : 6.0 1.21996 : 12.0 4.0 : : 24.3 21.4 53.7 6.0 6.1 5.0 : 5.4 : : 111.9 : : 5.5 0.61997 : 16.0 3.7 : : 20.4 23.7 80.8 4.4 6.9 4.7 : 4.9 : : : : : 5.7 0.61998 5.9 14.3 4.3 : : 17.9 20.4 69.5 4.4 7.4 4.6 : 4.7 : 7.6 106.6 : : 5.6 0.61999 5.9 6.9 3.4 : 13.9 15.1 14.7 79.6 3.3 5.6 3.5 5.0 3.5 : 9.5 97.0 : : 5.4 0.22000 4.6 5.4 5.0 : 8.6 11.4 18.8 50.7 4.1 6.2 4.8 5.9 4.8 : 11.3 36.8 : : 6.5 0.3
1991-2000 : : 6.5 : : : : : 7.3 7.2 6.4 : 6.8 : : : : : 5.3 2.1
2001 5.1 5.2 4.7 : 5.9 10.9 16.1 41.3 4.1 5.0 4.4 5.4 4.4 : 12.1 83.4 : : 3.8 0.22002 4.9 3.5 3.5 : 3.7 9.2 9.0 27.3 4.3 4.1 3.5 4.1 3.5 : 8.8 60.5 : : 1.8 0.12003 3.7 2.3 2.4 : 2.8 8.5 5.7 17.7 3.2 3.7 2.6 3.0 2.6 : 5.3 37.8 : : 1.2 0.12004 3.7 2.4 2.2 : 2.7 11.4 6.2 19.1 2.3 4.6 2.7 3.1 2.5 : 6.4 23.8 : : 1.6 0.12005 3.6 2.0 2.2 : 2.4 7.2 5.3 8.4 1.9 4.8 2.7 2.9 2.6 : 9.4 15.7 : : 3.6 0.12006 3.7 2.3 3.2 : 3.1 7.0 4.2 8.1 2.6 4.9 3.5 3.5 3.4 : 12.4 18.7 : : 5.2 0.32007 4.9 3.1 4.4 : 5.1 7.9 4.7 7.2 3.9 6.0 4.6 4.6 4.6 : 14.3 17.8 : : 5.3 0.82008 7.1 4.0 5.3 : 6.0 8.7 6.4 12.3 4.7 5.5 4.8 5.1 4.8 : 15.8 17.0 : : 2.9 0.92009 5.7 2.2 2.5 : 7.1 9.3 4.4 11.3 0.9 1.2 1.2 1.8 1.2 : 11.3 10.2 : : 0.7 0.52010 4.1 1.3 1.3 : 1.8 6.2 3.9 6.5 0.9 0.7 0.8 1.2 0.8 : 6.8 7.6 : : 0.3 0.2
2001-2010 4.7 2.8 3.2 : 4.1 8.6 6.6 15.9 2.9 4.1 3.1 3.5 3.0 : 10.2 29.2 : : 2.6 0.3
2011 3.8 1.2 1.4 2.9 1.7 6.6 4.5 5.6 2.5 0.9 1.3 1.7 1.3 : 4.3 : : : 0.3 0.22012 2.3 1.0 0.6 2.7 1.1 8.1 4.9 5.1 2.0 0.8 0.6 1.1 0.6 : 5.5 : : : 0.4 0.22013 1.1 0.5 0.3 1.3 0.5 4.2 3.0 4.0 1.2 0.5 0.3 0.6 0.3 : : : : : 0.3 0.2
_________________________________________________________________________________________________________________________________________________________________________ 1) BE DK DE FR IT NL UK; 1961-90 including D_W 2) Former EU-27; 1961-90 including D_W 3) Former EU-15; 1961-90 including D_W

126
Money interest rates and exchange rates
49. Nominal long-term interest rates
(%)
BE DE EE IE EL ES FR IT CY LV MT NL AT PT SI SK FI EA-17 EA-12 1) 2) 3)
1961-1970 6.3 6.8 : : : : 6.4 5.7 : : : 5.6 : : : : 7.9 : :
1971 7.3 8.0 : 9.2 : : 7.8 7.0 : : : 7.1 7.7 : : : 8.1 : : 1972 7.0 8.0 : 9.1 : : 7.4 6.6 : : : 6.7 7.4 : : : 8.0 : : 1973 7.5 9.3 : 10.7 9.3 : 8.3 6.9 : : : 7.3 8.3 : : : 8.3 : : 1974 8.8 10.4 : 14.6 10.5 : 10.5 9.6 : : : 10.7 9.7 : : : 8.8 : : 1975 8.5 8.7 : 14.0 9.4 : 9.5 10.0 : : : 9.2 9.6 : : : 9.6 : : 1976 9.1 8.2 : 14.6 10.2 : 9.3 12.7 : : : 9.2 8.8 : : : 10.2 : : 1977 8.8 6.6 : 12.9 9.5 : 9.9 14.7 : : : 8.5 8.7 : : : 10.8 : : 1978 8.9 6.2 : 12.8 10.0 12.0 9.5 13.1 : : : 8.1 8.2 : : : 9.8 : 9.41979 9.7 7.6 : 15.1 11.2 13.3 9.9 13.0 : : : 9.2 8.0 : : : 9.5 : 10.21980 11.9 8.5 : 15.4 17.1 16.0 13.1 15.3 : : : 10.7 9.3 : : : 11.6 : 12.3
1971-1980 8.8 8.1 : 12.8 : : 9.5 10.9 : : : 8.7 8.6 : : : 9.5 : :
1981 13.4 10.1 : 17.3 17.7 15.8 15.9 19.4 : : : 12.2 10.6 : : : 12.4 : 14.41982 13.4 9.0 : 17.0 15.4 16.0 15.7 20.2 : : : 10.5 9.9 : : : 12.4 : 14.01983 11.9 8.0 : 13.9 18.2 16.9 13.6 18.3 : : : 8.8 8.2 : : : 13.1 : 12.91984 12.2 8.0 : 14.6 18.5 16.5 12.5 15.6 : : : 8.6 8.0 : : : 14.0 : 12.11985 11.0 7.0 : 12.7 15.8 13.4 11.1 13.7 : : : 7.3 7.8 27.7 : : 12.7 : 10.81986 8.6 5.9 : 11.1 15.8 11.4 8.5 11.5 : : : 6.2 7.4 15.8 : : 11.7 : 8.91987 8.2 6.1 : 11.3 17.4 12.8 9.5 10.6 : : : 6.4 7.0 15.1 : : 10.4 : 9.21988 8.0 6.5 : 8.6 16.6 11.8 9.1 10.9 : : : 6.4 6.9 14.2 : : 10.6 : 9.11989 8.7 7.4 : 8.9 : 13.7 8.8 12.8 : : : 7.2 7.2 14.9 : : 12.1 : 9.81990 10.0 8.7 : 10.1 : 14.7 9.9 13.5 : : : 8.9 8.8 15.4 : : 13.3 : 10.9
1981-1990 10.6 7.7 12.5 14.3 11.5 14.7 8.3 8.2 : 12.3 11.2.................... ................. ................. ................. ................. ................. ................. ................. ................. ................. ................. ................. ................. ................. ................. ................. ................. ................. ................. .................
1991 9.3 8.5 : 9.2 : 11.4 9.1 13.2 : : : 8.7 8.6 14.5 : : 11.2 : 10.11992 8.7 7.8 : 9.1 24.1 11.7 8.6 13.3 : : : 8.1 7.4 13.8 : : 12.0 : 10.11993 7.2 6.5 : 7.7 23.3 10.2 6.8 11.2 : : : 6.4 6.7 9.7 : : 8.8 : 8.41994 7.8 6.9 : 7.9 20.7 10.0 7.2 10.5 : : : 6.9 7.0 10.5 : : 9.0 : 8.51995 7.5 6.9 : 8.3 17.0 11.3 7.5 12.2 : : : 6.9 7.1 11.5 : : 8.8 : 8.91996 6.5 6.2 : 7.3 14.4 8.7 6.3 9.4 : : : 6.2 6.3 8.6 : : 7.1 : 7.41997 5.8 5.6 : 6.3 9.9 6.4 5.6 6.9 6.9 : : 5.6 5.7 6.4 : : 6.0 : 6.11998 4.8 4.6 13.2 4.8 8.5 4.8 4.6 4.9 6.7 : : 4.6 4.7 4.9 : : 4.8 : 4.81999 4.8 4.5 11.4 4.7 6.3 4.7 4.6 4.7 7.4 : : 4.6 4.7 4.8 : : 4.7 : 4.72000 5.6 5.3 10.5 5.5 6.1 5.5 5.4 5.6 7.6 : 5.8 5.4 5.6 5.6 : 8.3 5.5 : 5.4
1991-2000 6.8 6.3 : 7.1 : 8.5 6.6 9.2 : : : 6.3 6.4 9.0 : : 7.8 : 7.4
2001 5.1 4.8 10.2 5.0 5.3 5.1 4.9 5.2 7.6 7.6 6.2 5.0 5.1 5.2 : 8.0 5.0 : 5.02002 5.0 4.8 8.4 5.0 5.1 5.0 4.9 5.0 5.7 5.4 5.8 4.9 5.0 5.0 8.7 6.9 5.0 4.9 4.92003 4.2 4.1 5.3 4.1 4.3 4.1 4.1 4.3 4.7 4.9 5.0 4.1 4.1 4.2 6.4 5.0 4.1 4.2 4.12004 4.2 4.0 4.4 4.1 4.3 4.1 4.1 4.3 5.8 4.9 4.7 4.1 4.1 4.1 4.7 5.0 4.1 4.1 4.12005 3.4 3.4 4.2 3.3 3.6 3.4 3.4 3.6 5.2 3.9 4.6 3.4 3.4 3.4 3.8 3.5 3.4 3.4 3.42006 3.8 3.8 5.0 3.8 4.1 3.8 3.8 4.1 4.1 4.1 4.3 3.8 3.8 3.9 3.9 4.4 3.8 3.8 3.82007 4.3 4.2 6.1 4.3 4.5 4.3 4.3 4.5 4.5 5.3 4.7 4.3 4.3 4.4 4.5 4.5 4.3 4.3 4.32008 4.4 4.0 8.2 4.5 4.8 4.4 4.2 4.7 4.6 6.4 4.8 4.2 4.4 4.5 4.6 4.7 4.3 4.3 4.32009 3.9 3.2 7.8 5.2 5.2 4.0 3.7 4.3 4.6 12.4 4.5 3.7 3.9 4.2 4.4 4.7 3.7 3.8 3.82010 3.5 2.7 5.9 5.7 9.1 4.3 3.1 4.0 4.6 10.3 4.2 3.0 3.2 5.4 3.8 3.9 3.0 3.6 3.6
2001-2010 4.2 3.9 6.5 4.5 5.0 4.2 4.1 4.4 5.1 6.5 4.9 4.0 4.1 4.4 : 5.1 4.1 : 4.1
2011 4.2 2.6 : 9.6 15.8 5.4 3.3 5.4 5.8 5.9 4.5 3.0 3.3 10.2 5.0 4.5 3.0 4.3 4.32012 3.0 1.5 : 6.2 22.5 5.9 2.5 5.5 7.0 4.6 4.1 1.9 2.4 10.6 5.8 4.6 1.9 3.8 3.82013 2.4 1.6 : 3.8 10.1 4.6 2.2 4.3 11.1 3.3 3.4 2.0 2.0 6.3 5.8 3.2 1.9 3.0 2.9
_________________________________________________________________________________________________________________________________________________________________ 1) 1961-90 D_W 2) Former Euro area 17; 1961-90 including D_W 3) Former Euro area 12; 1961-90 including D_W

127
Money interest rates and exchange rates
49. Nominal long-term interest rates
(%)
BG CZ DK HR LT HU PL RO SE UK EU-9 EU-27 EU-15 MK IS TR ME RS US JP 1) 2) 3)
1961-1970 : : 8.3 : : : : : 6.0 7.0 6.5 : : : : : : : 4.8 :
1971 : : 11.0 : : : : : 7.2 8.9 7.9 : : : : : : : 5.7 : 1972 : : 11.0 : : : : : 7.3 9.0 7.7 : : : : : : : 5.6 6.91973 : : 12.6 : : : : : 7.4 10.8 8.8 : : : : : : : 6.3 7.01974 : : 15.9 : : : : : 7.8 15.0 11.1 : : : : : : : 7.0 8.11975 : : 12.7 : : : : : 8.8 14.5 10.3 : : : : : : : 7.0 8.41976 : : 14.9 : : : : : 9.3 14.6 10.7 : : : : : : : 6.8 8.21977 : : 16.2 : : : : : 9.7 12.5 10.4 : : : : : : : 7.1 7.41978 : : 16.8 : : : : : 10.1 12.6 9.9 : 10.0 : : : : : 7.9 6.31979 : : 16.7 : : : : : 10.5 13.0 10.5 : 10.7 : : : : : 8.7 8.31980 : : 18.7 : : : : : 11.7 13.9 12.3 : 12.6 : : : : : 10.8 8.9
1971-1980 : : 14.6 : : : : : 9.0 12.5 9.9 : : : : : : : 7.3 :
1981 : : 19.3 : : : : : 13.5 14.8 14.4 : 14.5 : : : : : 12.9 8.41982 : : 20.5 : : : : : 13.0 12.7 13.8 : 13.9 : : : : : 12.2 8.31983 : : 14.4 : : : : : 12.3 10.8 12.1 : 12.6 : : : : : 10.8 7.81984 : : 14.4 : : : : : 12.3 11.1 11.5 : 12.0 : : : : : 12.0 7.31985 : : 11.6 : : : : : 13.0 11.0 10.4 : 10.9 : : : : : 10.8 6.51986 : : 10.1 : : : : : 10.3 10.1 8.7 : 9.2 : : : : : 8.1 5.21987 : : 11.3 : : : : : 11.7 9.6 8.8 : 9.4 : : : : : 8.7 4.71988 : : 9.9 : : : : : 11.4 9.7 8.8 : 9.3 : : : : : 9.0 4.71989 : : 9.7 : : : : : 11.2 10.2 9.5 : 9.9 : : : : : 8.5 5.21990 : : 10.6 : : : : : 13.2 11.8 10.8 : 11.1 : : : : : 8.7 7.5
1981-1990 13.2 12.2 11.2 10.9 11.3 10.2 6.6.................... ................. ................. ................. ................. ................. ................. ................. ................. ................. ................. ................. ................. ................. ................. ................. ................. ................. ................. ................. .................
1991 : : 9.3 : : : : : 10.7 10.1 9.9 : 10.1 : : : : : 8.0 6.51992 : : 9.0 : : : : : 10.0 9.1 9.4 : 9.9 : : : : : 7.1 5.21993 : : 7.3 : : : : : 8.6 7.6 7.7 : 8.3 : : : : : 6.0 4.11994 : : 7.8 : : : : : 9.7 8.2 8.0 : 8.4 : : : : : 7.2 4.21995 : : 8.3 : : : : : 10.2 8.3 8.4 : 8.8 : : : : : 6.7 3.31996 : : 7.2 : : : : : 8.0 7.9 7.2 : 7.5 : : : : : 6.5 3.01997 : : 6.3 : : : : : 6.6 7.1 6.2 : 6.3 : : : : : 6.5 2.21998 : : 4.9 : : : : : 5.0 5.6 4.9 : 4.9 : : : : : 5.3 1.31999 : : 4.9 : : 9.9 9.5 : 5.0 5.0 4.7 : 4.7 : : : : : 5.6 1.82000 : : 5.6 : : 8.6 11.8 : 5.4 5.3 5.4 : 5.4 : : : : : 6.0 1.8
1991-2000 : : 7.1 : : : : : 7.9 7.4 7.2 : 7.4 : : : : : 6.5 3.3
2001 : 6.3 5.1 : 8.2 8.0 10.7 : 5.1 5.0 5.0 : 5.0 : : : : : 5.0 1.32002 8.3 4.9 5.1 : 6.1 7.1 7.4 : 5.3 4.9 4.9 : 4.9 : : : : : 4.6 1.32003 6.5 4.1 4.3 : 5.3 6.8 5.8 : 4.6 4.6 4.2 : 4.2 : 7.6 : : : 4.0 1.02004 5.4 4.8 4.3 : 4.5 8.2 6.9 : 4.4 4.9 4.3 : 4.3 : 7.6 : : : 4.3 1.52005 3.9 3.5 3.4 : 3.7 6.6 5.2 : 3.4 4.5 3.6 : 3.6 : 7.6 11.7 : : 4.3 1.42006 4.2 3.8 3.8 : 4.1 7.1 5.2 7.2 3.7 4.4 3.9 4.1 3.9 : 8.4 16.2 : : 4.8 1.72007 4.5 4.3 4.3 : 4.6 6.7 5.5 7.1 4.2 5.1 4.5 4.6 4.4 : 9.7 16.8 : : 4.6 1.72008 5.4 4.6 4.3 : 5.6 8.2 6.1 7.7 3.9 4.5 4.3 4.5 4.3 : 10.0 18.9 : : 3.7 1.52009 7.2 4.8 3.6 : 14.0 9.1 6.1 9.7 3.3 3.4 3.6 4.1 3.7 : 8.4 12.9 : : 3.3 1.42010 6.0 3.9 2.9 : 5.6 7.3 5.8 7.3 2.9 3.4 3.2 3.8 3.5 : 6.5 9.6 : : 3.2 1.2
2001-2010 : 4.5 4.1 : 6.2 7.5 6.5 : 4.1 4.5 4.2 : 4.2 : : : : : 4.2 1.4
2011 5.4 3.7 2.7 6.5 5.2 7.6 6.0 7.3 2.6 3.1 3.4 4.3 4.0 : : 9.3 : : 2.8 1.12012 4.5 2.8 1.4 6.1 4.8 7.9 5.0 6.7 1.6 1.7 2.5 3.6 3.4 : 7.0 8.5 : : 1.8 0.92013 3.5 2.1 1.8 4.7 3.8 5.9 4.0 5.4 2.1 2.0 2.3 2.9 2.8 : 6.4 : : : 2.3 0.7
_________________________________________________________________________________________________________________________________________________________________________ 1) BE DK DE FR IT NL FI SE UK; 1961-90 including D_W 2) Former EU-27; 1961-90 including D_W 3) Former EU-15; 1961-90 including D_W
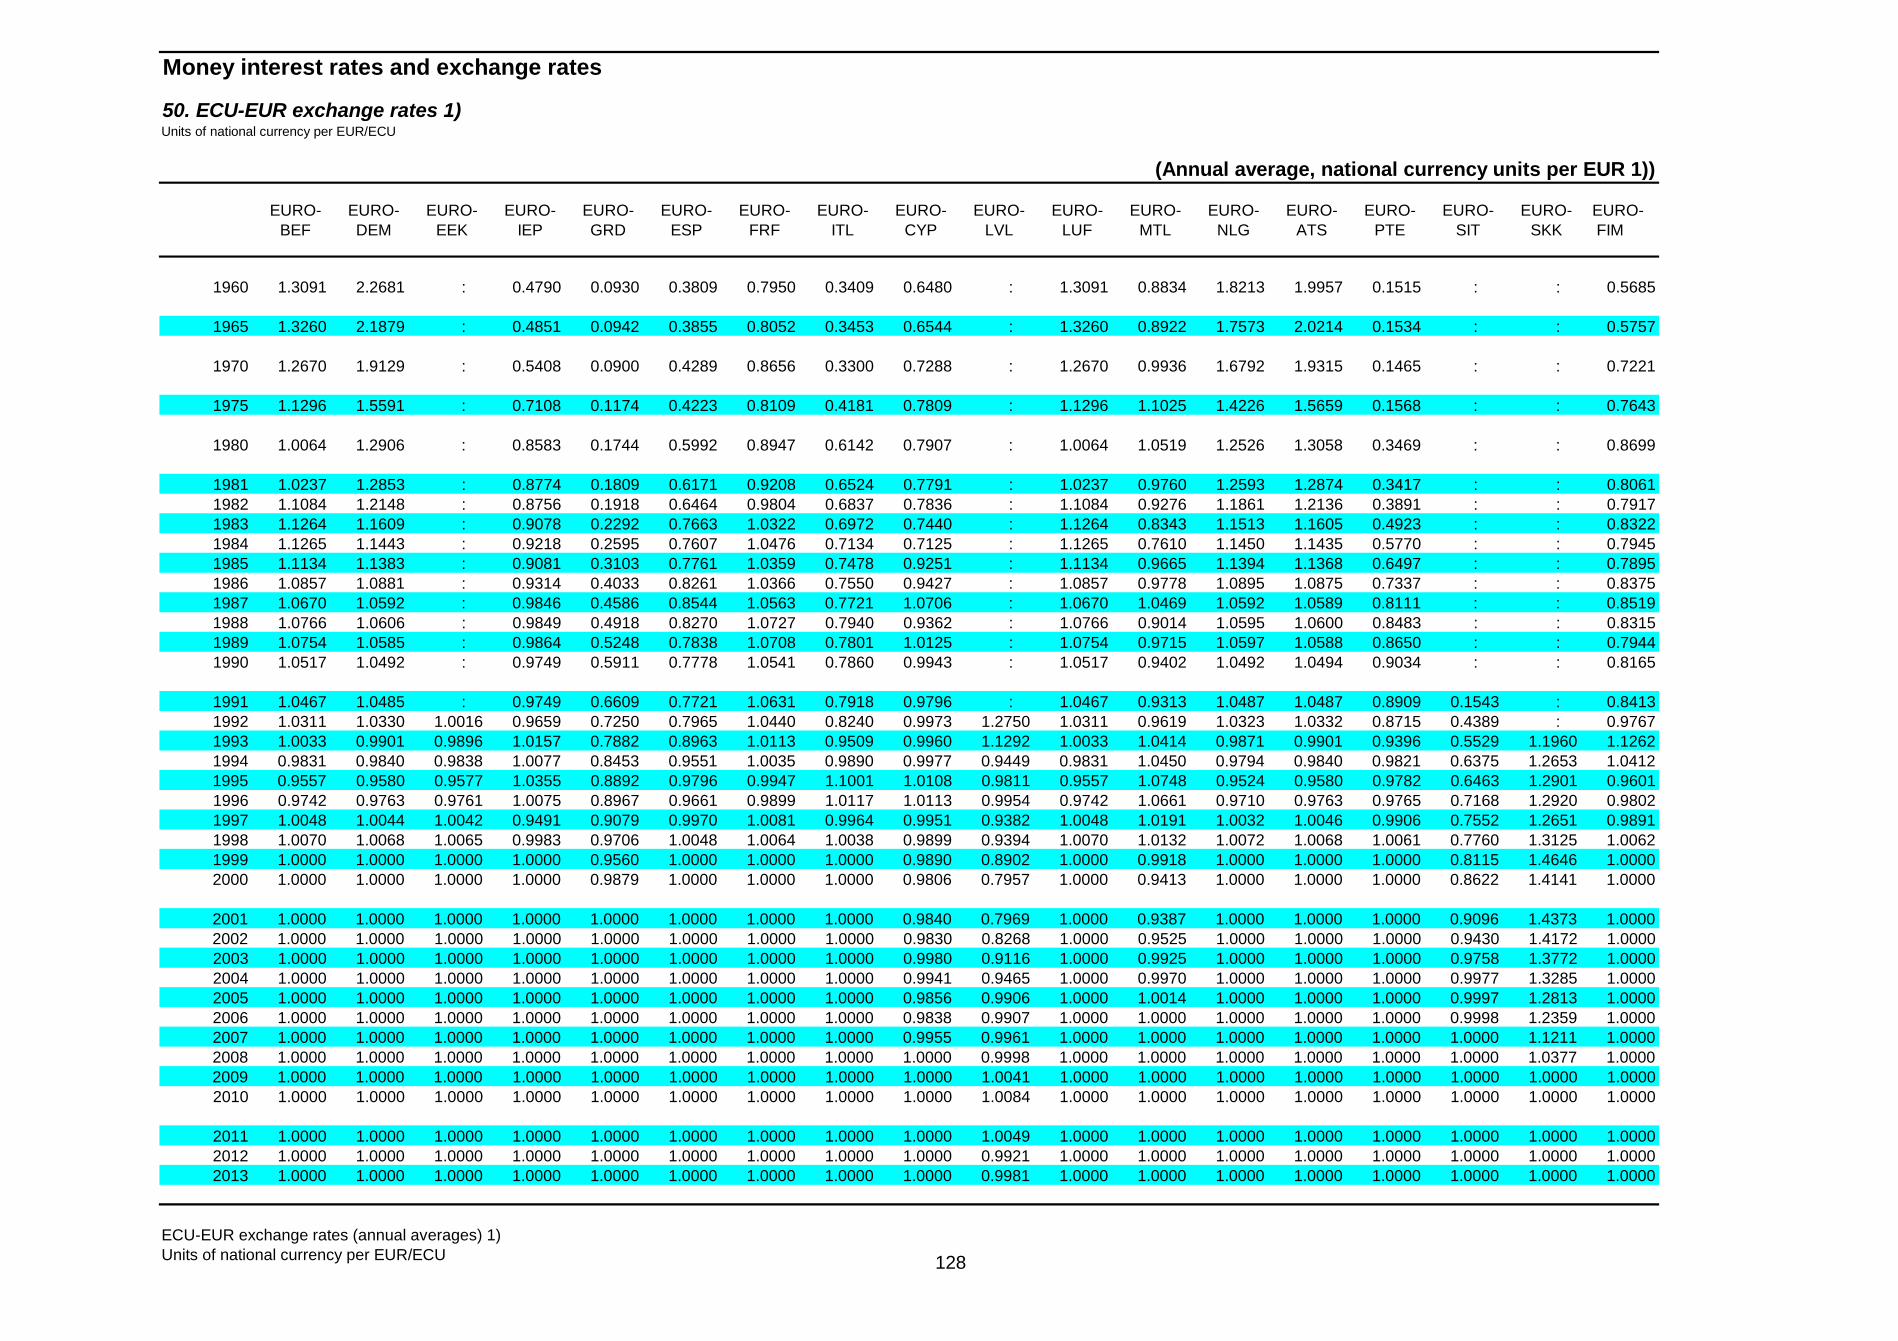
128
Money interest rates and exchange rates
50. ECU-EUR exchange rates 1)Units of national currency per EUR/ECU
(Annual average, national currency units per EUR 1))
EURO- EURO- EURO- EURO- EURO- EURO- EURO- EURO- EURO- EURO- EURO- EURO- EURO- EURO- EURO- EURO- EURO- EURO- BEF DEM EEK IEP GRD ESP FRF ITL CYP LVL LUF MTL NLG ATS PTE SIT SKK FIM
1960 1.3091 2.2681 : 0.4790 0.0930 0.3809 0.7950 0.3409 0.6480 : 1.3091 0.8834 1.8213 1.9957 0.1515 : : 0.5685
1965 1.3260 2.1879 : 0.4851 0.0942 0.3855 0.8052 0.3453 0.6544 : 1.3260 0.8922 1.7573 2.0214 0.1534 : : 0.5757
1970 1.2670 1.9129 : 0.5408 0.0900 0.4289 0.8656 0.3300 0.7288 : 1.2670 0.9936 1.6792 1.9315 0.1465 : : 0.7221
1975 1.1296 1.5591 : 0.7108 0.1174 0.4223 0.8109 0.4181 0.7809 : 1.1296 1.1025 1.4226 1.5659 0.1568 : : 0.7643
1980 1.0064 1.2906 : 0.8583 0.1744 0.5992 0.8947 0.6142 0.7907 : 1.0064 1.0519 1.2526 1.3058 0.3469 : : 0.8699
1981 1.0237 1.2853 : 0.8774 0.1809 0.6171 0.9208 0.6524 0.7791 : 1.0237 0.9760 1.2593 1.2874 0.3417 : : 0.80611982 1.1084 1.2148 : 0.8756 0.1918 0.6464 0.9804 0.6837 0.7836 : 1.1084 0.9276 1.1861 1.2136 0.3891 : : 0.79171983 1.1264 1.1609 : 0.9078 0.2292 0.7663 1.0322 0.6972 0.7440 : 1.1264 0.8343 1.1513 1.1605 0.4923 : : 0.83221984 1.1265 1.1443 : 0.9218 0.2595 0.7607 1.0476 0.7134 0.7125 : 1.1265 0.7610 1.1450 1.1435 0.5770 : : 0.79451985 1.1134 1.1383 : 0.9081 0.3103 0.7761 1.0359 0.7478 0.9251 : 1.1134 0.9665 1.1394 1.1368 0.6497 : : 0.78951986 1.0857 1.0881 : 0.9314 0.4033 0.8261 1.0366 0.7550 0.9427 : 1.0857 0.9778 1.0895 1.0875 0.7337 : : 0.83751987 1.0670 1.0592 : 0.9846 0.4586 0.8544 1.0563 0.7721 1.0706 : 1.0670 1.0469 1.0592 1.0589 0.8111 : : 0.85191988 1.0766 1.0606 : 0.9849 0.4918 0.8270 1.0727 0.7940 0.9362 : 1.0766 0.9014 1.0595 1.0600 0.8483 : : 0.83151989 1.0754 1.0585 : 0.9864 0.5248 0.7838 1.0708 0.7801 1.0125 : 1.0754 0.9715 1.0597 1.0588 0.8650 : : 0.79441990 1.0517 1.0492 : 0.9749 0.5911 0.7778 1.0541 0.7860 0.9943 : 1.0517 0.9402 1.0492 1.0494 0.9034 : : 0.8165
1991 1.0467 1.0485 : 0.9749 0.6609 0.7721 1.0631 0.7918 0.9796 : 1.0467 0.9313 1.0487 1.0487 0.8909 0.1543 : 0.84131992 1.0311 1.0330 1.0016 0.9659 0.7250 0.7965 1.0440 0.8240 0.9973 1.2750 1.0311 0.9619 1.0323 1.0332 0.8715 0.4389 : 0.97671993 1.0033 0.9901 0.9896 1.0157 0.7882 0.8963 1.0113 0.9509 0.9960 1.1292 1.0033 1.0414 0.9871 0.9901 0.9396 0.5529 1.1960 1.12621994 0.9831 0.9840 0.9838 1.0077 0.8453 0.9551 1.0035 0.9890 0.9977 0.9449 0.9831 1.0450 0.9794 0.9840 0.9821 0.6375 1.2653 1.04121995 0.9557 0.9580 0.9577 1.0355 0.8892 0.9796 0.9947 1.1001 1.0108 0.9811 0.9557 1.0748 0.9524 0.9580 0.9782 0.6463 1.2901 0.96011996 0.9742 0.9763 0.9761 1.0075 0.8967 0.9661 0.9899 1.0117 1.0113 0.9954 0.9742 1.0661 0.9710 0.9763 0.9765 0.7168 1.2920 0.98021997 1.0048 1.0044 1.0042 0.9491 0.9079 0.9970 1.0081 0.9964 0.9951 0.9382 1.0048 1.0191 1.0032 1.0046 0.9906 0.7552 1.2651 0.98911998 1.0070 1.0068 1.0065 0.9983 0.9706 1.0048 1.0064 1.0038 0.9899 0.9394 1.0070 1.0132 1.0072 1.0068 1.0061 0.7760 1.3125 1.00621999 1.0000 1.0000 1.0000 1.0000 0.9560 1.0000 1.0000 1.0000 0.9890 0.8902 1.0000 0.9918 1.0000 1.0000 1.0000 0.8115 1.4646 1.00002000 1.0000 1.0000 1.0000 1.0000 0.9879 1.0000 1.0000 1.0000 0.9806 0.7957 1.0000 0.9413 1.0000 1.0000 1.0000 0.8622 1.4141 1.0000
2001 1.0000 1.0000 1.0000 1.0000 1.0000 1.0000 1.0000 1.0000 0.9840 0.7969 1.0000 0.9387 1.0000 1.0000 1.0000 0.9096 1.4373 1.00002002 1.0000 1.0000 1.0000 1.0000 1.0000 1.0000 1.0000 1.0000 0.9830 0.8268 1.0000 0.9525 1.0000 1.0000 1.0000 0.9430 1.4172 1.00002003 1.0000 1.0000 1.0000 1.0000 1.0000 1.0000 1.0000 1.0000 0.9980 0.9116 1.0000 0.9925 1.0000 1.0000 1.0000 0.9758 1.3772 1.00002004 1.0000 1.0000 1.0000 1.0000 1.0000 1.0000 1.0000 1.0000 0.9941 0.9465 1.0000 0.9970 1.0000 1.0000 1.0000 0.9977 1.3285 1.00002005 1.0000 1.0000 1.0000 1.0000 1.0000 1.0000 1.0000 1.0000 0.9856 0.9906 1.0000 1.0014 1.0000 1.0000 1.0000 0.9997 1.2813 1.00002006 1.0000 1.0000 1.0000 1.0000 1.0000 1.0000 1.0000 1.0000 0.9838 0.9907 1.0000 1.0000 1.0000 1.0000 1.0000 0.9998 1.2359 1.00002007 1.0000 1.0000 1.0000 1.0000 1.0000 1.0000 1.0000 1.0000 0.9955 0.9961 1.0000 1.0000 1.0000 1.0000 1.0000 1.0000 1.1211 1.00002008 1.0000 1.0000 1.0000 1.0000 1.0000 1.0000 1.0000 1.0000 1.0000 0.9998 1.0000 1.0000 1.0000 1.0000 1.0000 1.0000 1.0377 1.00002009 1.0000 1.0000 1.0000 1.0000 1.0000 1.0000 1.0000 1.0000 1.0000 1.0041 1.0000 1.0000 1.0000 1.0000 1.0000 1.0000 1.0000 1.00002010 1.0000 1.0000 1.0000 1.0000 1.0000 1.0000 1.0000 1.0000 1.0000 1.0084 1.0000 1.0000 1.0000 1.0000 1.0000 1.0000 1.0000 1.0000
2011 1.0000 1.0000 1.0000 1.0000 1.0000 1.0000 1.0000 1.0000 1.0000 1.0049 1.0000 1.0000 1.0000 1.0000 1.0000 1.0000 1.0000 1.00002012 1.0000 1.0000 1.0000 1.0000 1.0000 1.0000 1.0000 1.0000 1.0000 0.9921 1.0000 1.0000 1.0000 1.0000 1.0000 1.0000 1.0000 1.00002013 1.0000 1.0000 1.0000 1.0000 1.0000 1.0000 1.0000 1.0000 1.0000 0.9981 1.0000 1.0000 1.0000 1.0000 1.0000 1.0000 1.0000 1.0000
ECU-EUR exchange rates (annual averages) 1) Units of national currency per EUR/ECU

129
Money interest rates and exchange rates
50. ECU-EUR exchange rates 1)Units of national currency per EUR/ECU
(Annual average, national currency units per EUR 1))
BGN CZK DKK HRK LTL HUF PLN RON SEK GBP MKD ISK TRY EUR RSD USD JPY
1960 : : 7.2954 : : : : : 5.464 0.37722 : 0.36 0.0000 : : 1.0562 380.23
1965 : : 7.3893 : : : : : 5.534 0.38207 : 0.46 0.0000 : : 1.0698 385.13
1970 : : 7.6668 : : : : : 5.288 0.42593 : 0.90 0.0000 : : 1.0222 368.00
1975 : : 7.1227 : : : : : 5.141 0.56003 : 1.90 0.0000 : : 1.2408 360.73
1980 : : 7.8274 : : 42.60 0.0061 0.0024 5.881 0.59849 : 6.66 0.0001 : : 1.3923 315.04
1981 : : 7.9226 : : 37.23 0.0109 0.0016 5.635 0.55311 : 8.03 0.0001 : : 1.1165 245.381982 : : 8.1569 : : 35.45 0.0097 0.0015 6.143 0.56046 : 12.02 0.0002 : : 0.9797 243.551983 : : 8.1319 : : 37.99 0.0082 0.0014 6.821 0.58701 : 21.98 0.0002 : : 0.8902 211.351984 : : 8.1465 : : 37.91 0.0089 0.0015 6.511 0.59063 : 24.88 0.0003 : : 0.7890 187.091985 0.0005 : 8.0188 : : 22.27 0.0065 0.0008 6.521 0.58898 : 31.64 0.0005 : : 0.7631 180.561986 0.0009 : 7.9357 : : 43.69 0.0167 0.0015 6.996 0.67154 : 40.41 0.0007 : : 0.9842 165.001987 0.0013 : 7.8847 : : 72.27 0.0408 0.0022 7.310 0.70457 : 44.61 0.0011 : : 1.1544 166.601988 0.0014 : 7.9515 : : 83.35 0.0712 0.0024 7.242 0.66443 : 50.76 0.0017 : : 1.1825 151.461989 0.0011 : 8.0493 : : 78.99 0.1925 0.0020 7.099 0.67330 : 62.85 0.0025 : : 1.1018 151.941990 0.0045 26.927 7.8565 : : 130.52 1.9618 0.0046 7.521 0.71385 : 74.03 0.0033 : : 1.2734 183.66
1991 0.0339 34.597 7.9086 : : 142.20 2.0169 0.0145 7.479 0.70101 : 73.00 0.0052 : : 1.2392 166.491992 0.0511 36.827 7.8093 : 2.1433 172.78 2.9748 0.0674 7.533 0.73765 : 74.66 0.0089 : : 1.2981 164.221993 0.0323 34.169 7.5936 4.1892 5.0868 107.61 2.1222 0.0886 9.122 0.77999 : 79.25 0.0129 : : 1.1710 130.151994 0.0644 34.151 7.5433 7.1325 4.7319 125.03 2.7015 0.1972 9.163 0.77590 51.367 83.11 0.0355 : : 1.1895 121.321995 0.0879 34.696 7.3280 6.8364 5.2320 164.55 3.1705 0.2662 9.332 0.82879 49.539 84.69 0.0599 : : 1.3080 123.011996 0.2251 34.457 7.3593 6.8966 5.0790 193.76 3.4223 0.3922 8.515 0.81380 50.749 84.66 0.1032 : : 1.2698 138.081997 1.9016 35.930 7.4836 6.9797 4.5362 211.65 3.7155 0.8112 8.651 0.69230 56.685 80.44 0.1718 : 6.70 1.1340 137.081998 1.9691 36.049 7.4993 7.1279 4.4844 240.57 3.9165 0.9985 8.916 0.67643 60.985 79.70 0.2937 : 11.23 1.1211 146.421999 1.9558 36.884 7.4355 7.5811 4.2641 252.77 4.2274 1.6345 8.808 0.65874 60.618 77.18 0.4472 : 12.42 1.0658 121.322000 1.9521 35.599 7.4538 7.6427 3.6952 260.04 4.0082 1.9922 8.445 0.60948 60.726 72.58 0.5748 1.0000 58.20 0.9236 99.47
2001 1.9482 34.068 7.4521 7.4820 3.5823 256.59 3.6721 2.6004 9.255 0.62187 60.913 87.42 1.1024 1.0000 59.88 0.8956 108.682002 1.9492 30.804 7.4305 7.4130 3.4594 242.96 3.8574 3.1270 9.161 0.62883 60.979 86.18 1.4397 1.0000 60.66 0.9456 118.062003 1.9490 31.846 7.4307 7.5688 3.4527 253.62 4.3996 3.7551 9.124 0.69199 61.263 86.65 1.6949 1.0000 65.13 1.1312 130.972004 1.9533 31.891 7.4399 7.4967 3.4529 251.66 4.5268 4.0510 9.124 0.67866 61.337 87.14 1.7771 1.0000 72.70 1.2439 134.442005 1.9558 29.782 7.4518 7.4008 3.4528 248.05 4.0230 3.6209 9.282 0.68380 61.297 78.23 1.6771 1.0000 83.00 1.2441 136.852006 1.9558 28.342 7.4591 7.3247 3.4528 264.26 3.8959 3.5258 9.254 0.68173 61.190 87.76 1.8090 1.0000 84.10 1.2556 146.022007 1.9558 27.766 7.4506 7.3376 3.4528 251.35 3.7837 3.3353 9.250 0.68434 61.173 87.63 1.7865 1.0000 79.96 1.3705 161.252008 1.9558 24.946 7.4560 7.2239 3.4528 251.51 3.5121 3.6826 9.615 0.79628 61.520 143.83 1.9064 1.0000 81.44 1.4708 152.452009 1.9558 26.435 7.4462 7.3400 3.4528 280.33 4.3276 4.2399 10.619 0.89094 61.282 172.67 2.1631 1.0000 93.95 1.3948 130.342010 1.9558 25.284 7.4473 7.2891 3.4528 275.48 3.9947 4.2122 9.537 0.85784 61.519 161.89 1.9965 1.0000 103.04 1.3257 116.24
2011 1.9558 24.590 7.4506 7.4390 3.4528 279.37 4.1206 4.2391 9.030 0.86788 61.480 161.42 2.3378 1.0000 101.96 1.3920 110.962012 1.9558 25.149 7.4437 7.5217 3.4528 289.25 4.1847 4.4593 8.704 0.81087 61.524 160.73 2.3135 1.0000 113.02 1.2848 102.492013 1.9558 25.980 7.4579 7.5786 3.4528 296.87 4.1975 4.4190 8.652 0.84926 61.575 162.64 2.5335 1.0000 113.44 1.3281 129.66

130
a a
a a
a a
a a
a a
a a
a a
a a
a a
a a

131
Money interest rates and exchange rates
51. Conversion rates between the euro and the former national currencies of the Euro-Zone
1 euro =
40.3399 Belgian francs1.95583 German marks15.6466 Estonian kroon
0.787564 Irish pounds340.75 Greek drachma
166.386 Spanish pesetas6.55957 French francs1936.27 Italian lire
0.585274 Cyprus pounds0.702804 Latvian lats40.3399 Luxembourg francs0.4293 Malta lira
2.20371 Dutch guilders13.7603 Austrian schillings200.482 Portuguese escudos239.64 Slovenian tolar30.126 Slovak Koruna
5.94573 Finnish marks

132
Money interest rates and exchange rates
52. Nominal effective exchange ratesPerformance relative to the rest of 37 industrial countries; double export weights
BE DE EE IE EL ES FR IT CY LV LU MT NL AT PT SI SK FI EA-17
1993 92.9 88.3 92.3 94.6 89.6 100.8 89.5 89.9 61.4 77.3 94.7 90.2 94.1 89.3 101.6 153.1 92.0 80.5 80.11994 95.6 91.0 93.2 94.7 88.0 96.0 91.7 88.8 64.7 95.9 97.4 91.4 95.9 91.6 98.1 142.8 90.3 88.2 82.81995 100.7 97.6 97.5 95.3 88.4 97.4 96.2 82.1 67.7 95.6 102.4 93.5 100.8 96.6 99.7 144.2 91.5 98.9 89.61996 99.3 96.8 97.1 98.1 91.3 99.0 97.2 91.2 73.7 96.0 101.0 92.8 99.6 96.1 100.6 130.8 93.1 97.2 92.61997 95.6 93.6 95.4 100.4 95.3 95.2 94.4 93.0 90.4 103.5 97.4 94.5 96.1 95.0 98.5 126.4 98.3 95.2 88.61998 96.5 95.4 97.3 96.2 92.2 95.9 96.1 94.4 93.5 104.9 98.2 96.4 96.9 96.6 97.9 125.0 96.5 95.5 91.11999 95.8 94.8 97.2 93.6 94.4 95.2 95.1 93.7 92.8 109.7 97.8 95.2 96.4 96.7 97.0 120.1 86.8 94.5 89.62000 92.6 90.6 93.8 88.5 89.6 92.3 91.2 90.2 90.5 117.9 95.6 93.7 93.6 94.5 94.4 111.5 88.5 90.4 82.3
2001 93.8 91.8 95.4 89.5 92.5 93.8 92.5 91.8 92.8 119.1 96.2 94.7 94.7 95.3 95.1 106.4 87.0 92.3 84.92002 94.9 93.4 96.1 91.3 94.8 95.1 94.1 93.7 94.6 115.5 97.0 95.7 95.7 96.2 96.0 103.4 88.3 93.8 87.92003 99.2 99.0 99.2 97.9 99.6 99.3 99.0 99.0 98.5 108.7 99.8 98.7 99.5 99.7 99.4 102.6 93.4 98.8 98.02004 100.3 100.6 100.1 100.1 100.8 100.4 100.4 100.6 99.3 105.3 100.2 100.5 100.3 100.7 100.2 101.1 97.7 100.4 101.12005 100.0 100.0 100.0 100.0 100.0 100.0 100.0 100.0 100.0 100.0 100.0 100.0 100.0 100.0 100.0 100.0 100.0 100.0 100.02006 100.4 100.5 100.2 100.6 100.6 100.4 100.6 100.5 100.6 100.0 100.2 101.1 100.3 100.3 100.3 100.1 103.6 100.5 101.22007 101.7 102.3 101.3 103.2 101.4 101.7 102.2 102.2 100.3 100.0 100.8 104.2 101.3 101.3 101.4 100.3 114.4 102.1 104.72008 103.6 104.1 102.7 107.3 103.4 103.8 104.4 104.0 103.0 100.8 102.4 106.5 103.4 102.2 103.0 100.7 124.1 104.1 109.02009 104.6 105.5 105.2 108.1 105.4 105.1 105.3 105.1 104.9 102.9 104.0 105.6 104.9 103.5 103.8 102.7 132.5 105.7 112.02010 102.1 101.6 102.0 104.3 102.9 102.6 102.0 101.7 102.3 99.9 102.0 101.8 102.4 100.9 101.9 100.9 129.5 101.5 104.5
2011 102.4 101.7 101.6 105.1 104.0 103.0 102.3 102.1 102.5 100.3 102.0 102.1 102.6 100.8 102.3 101.3 129.8 101.5 105.02012 100.4 99.4 100.0 101.3 102.5 101.2 99.9 99.9 100.5 100.4 100.5 99.9 100.8 99.5 100.8 100.7 129.2 98.8 100.42013 102.7 102.5 101.4 104.5 104.7 103.4 102.9 102.7 103.0 101.4 102.1 102.5 102.9 101.5 102.3 102.1 130.9 101.8 106.52014 104.0 104.4 103.0 106.1 106.6 104.7 104.7 104.6 104.2 102.5 102.9 103.6 104.0 102.8 103.3 103.2 132.3 104.2 110.42015 104.0 104.4 103.1 106.1 106.5 104.7 104.6 104.6 104.2 102.5 102.9 103.6 104.0 102.8 103.3 103.2 132.3 104.2 110.3
1) 1960-1992 including LU 2) Euro area relative to 20 industrial countries (BG CZ DK HR LV LT HU PL RO SE UK TR CH NO US CA MX JP AU NZ)

133
Money interest rates and exchange rates
52. Nominal effective exchange ratesPerformance relative to the rest of 37 industrial countries; double export weights
BG CZ DK HR LT HU PL RO SE UK EU-27 MK IS TR ME RS
1993 3874.5 75.0 91.7 149.6 54.9 194.2 173.0 2958.6 93.3 78.4 72.8 : : 11749.7 : : 1994 2020.4 77.8 93.0 91.5 60.2 175.2 137.9 1444.4 93.6 80.0 74.6 : : 4366.5 : : 1995 1584.3 78.7 98.2 98.9 56.4 136.4 119.3 1134.0 94.6 77.3 80.1 : : 2643.7 : : 1996 646.7 80.9 98.2 98.8 60.2 118.1 112.0 793.0 104.8 79.3 83.8 : : 1555.5 : : 1997 80.3 79.2 95.8 100.7 70.1 111.4 104.8 394.7 101.5 92.9 82.0 : : 941.1 : : 1998 83.2 80.0 97.2 99.6 73.0 99.7 101.7 333.8 100.8 97.4 87.3 : : 560.9 : : 1999 86.2 78.9 96.3 93.6 76.7 95.0 93.1 204.9 99.9 97.9 84.8 : : 364.3 : : 2000 86.3 80.2 92.0 91.6 86.0 90.5 96.1 165.7 99.9 101.0 77.3 : : 270.7 : :
2001 92.5 84.3 93.6 95.1 90.0 92.7 106.1 131.9 92.2 100.0 80.1 : : 146.0 : : 2002 95.6 94.1 94.9 97.0 94.7 99.1 101.5 111.7 94.5 101.0 84.6 : : 111.4 : : 2003 100.1 93.8 99.3 97.5 99.4 97.9 91.3 96.3 100.4 96.9 95.1 : : 98.0 : : 2004 101.3 94.2 100.5 99.2 100.6 99.4 89.2 90.0 102.4 101.2 100.8 : : 94.9 : : 2005 100.0 100.0 100.0 100.0 100.0 100.0 100.0 100.0 100.0 100.0 100.0 : : 100.0 : : 2006 100.8 105.2 100.3 101.4 100.1 93.9 103.5 103.6 100.8 101.0 102.7 : : 93.3 : : 2007 101.4 107.6 101.7 101.9 100.8 99.0 107.0 110.0 102.4 102.7 109.2 : : 95.2 : : 2008 103.1 120.7 103.9 104.4 101.8 99.8 116.7 100.8 100.6 89.5 110.5 : : 91.3 : : 2009 105.8 116.3 106.3 103.9 104.3 91.5 96.1 89.1 92.2 79.3 104.6 : : 81.1 : : 2010 103.5 119.3 102.0 102.6 101.6 91.2 102.0 88.0 99.0 79.6 96.9 : : 85.4 : :
2011 104.8 123.0 101.6 101.0 102.0 90.3 99.1 88.3 104.9 78.8 97.9 : : 73.2 : : 2012 104.1 119.1 99.0 98.8 100.6 86.3 96.4 83.1 106.1 82.3 92.8 : : 72.1 : : 2013 106.2 116.9 101.5 99.7 102.3 85.5 97.6 85.5 109.9 80.9 100.5 : : 67.7 : : 2014 108.5 111.5 103.4 100.3 103.6 83.7 99.2 85.9 107.8 84.9 106.9 : : 58.6 : : 2015 108.4 111.5 103.4 100.3 103.6 83.8 99.2 86.0 107.3 84.9 106.8 : : 59.1 : :
1) EU-27 relative to 10 industrial countries (HR TR CH NO US CA MX JP AU NZ)

134
General government (% of GDP at market prices)
53. Taxes linked to imports and production (indirect taxes); general governmentESA 1995 (Percentage of GDP at market prices (excessive deficit procedure))
BE DE EE IE EL ES FR IT CY LV LU MT NL AT PT SI SK FI EA-18 1) 2)
1970 13.2 12.2 : : : : : : : : : : 9.6 : : : : : :
1971 13.0 12.2 : : : : : : : : : : 9.8 : : : : : : 1972 12.0 12.2 : : : : : : : : : : 10.0 : : : : : : 1973 11.9 11.8 : : : : : : : : : : 10.0 : : : : : : 1974 11.8 11.3 : : : : : : : : : : 9.2 : : : : : : 1975 11.5 11.2 : : : : : : : : : : 9.6 : : : : 12.1 : 1976 11.9 11.2 : : : : : : : : : : 10.0 15.6 : : : 12.2 : 1977 12.3 11.2 : : : : : : : : : : 10.9 15.9 10.3 : : 13.2 : 1978 12.3 11.5 : : : : 14.3 : : : : : 10.9 15.5 9.9 : : 13.5 : 1979 12.1 11.6 : : : : 14.9 : : : : : 10.6 15.2 9.6 : : 13.2 : 1980 11.3 11.5 : : : : 14.8 8.2 : : : : 10.1 15.3 10.9 : : 13.1 :
1981 11.5 11.1 : : : : 14.8 7.7 : : : : 9.6 15.4 11.0 : : 13.4 : 1982 11.5 10.9 : : : : 15.0 8.4 : : : : 9.8 15.1 11.6 : : 13.3 : 1983 11.8 11.0 : : : : 15.0 9.0 : : : : 9.9 15.2 11.9 : : 13.4 : 1984 11.5 11.0 : : : : 15.3 9.1 : : : : 10.1 15.9 11.7 : : 14.1 : 1985 11.5 10.8 : 15.1 : : 15.4 8.8 : : : : 10.2 15.8 11.6 : : 14.3 : 1986 11.2 10.5 : 15.0 : : 15.0 8.8 : : : : 10.5 15.5 12.5 : : 14.6 : 1987 11.4 10.6 : 14.7 : : 15.2 9.2 : : : : 11.0 15.5 11.9 : : 14.8 : 1988 11.4 10.5 : 14.9 11.3 : 14.9 9.9 : : : : 10.9 15.7 12.6 : : 15.9 : 1989 11.4 10.6 : 14.8 10.2 : 14.4 10.0 : : : : 10.2 15.6 12.1 : : 15.7 : 1990 11.5 10.8 : 14.0 11.6 : 14.4 10.3 : 19.4 10.3 : 10.3 15.2 11.8 : : 15.0 :
1991 10.8
1991 11.5 9.5 : 13.6 12.1 : 14.2 10.8 : 11.3 9.4 : 10.4 15.3 11.9 : : 15.1 : 1992 11.5 9.5 : 13.7 13.3 : 14.1 10.9 : 6.4 10.4 : 10.4 15.3 12.6 : : 14.8 : 1993 11.8 9.9 13.1 12.8 12.6 : 14.5 11.6 : 10.4 11.4 : 11.0 15.4 12.0 : 13.3 14.5 : 1994 12.1 10.3 14.4 13.6 12.4 : 15.0 11.4 : 12.1 11.6 : 10.6 15.5 12.5 : 16.3 14.6 : 1995 11.9 9.9 13.1 13.2 12.2 10.0 15.2 11.7 11.5 14.0 11.0 12.1 10.7 14.0 12.6 15.4 14.5 13.5 11.81996 12.5 9.9 13.4 13.5 12.6 10.1 15.9 11.5 11.1 13.0 11.1 11.4 11.1 14.4 13.0 15.6 13.8 13.7 12.01997 12.7 9.9 13.7 13.3 12.8 10.4 15.9 12.1 10.3 13.8 12.1 12.0 11.2 14.8 12.7 15.2 13.1 14.3 12.21998 12.6 10.1 12.5 12.9 13.0 11.0 15.8 15.0 10.8 14.6 12.5 11.1 11.4 14.8 13.2 15.9 12.8 14.0 12.91999 13.1 10.8 11.7 13.0 13.7 11.5 15.8 14.8 10.4 13.6 12.7 12.1 11.9 15.0 13.5 16.5 12.4 14.0 13.12000 12.9 10.6 12.3 12.9 13.8 11.4 15.2 14.6 12.2 12.4 13.5 12.0 11.7 14.6 13.0 15.7 12.5 13.5 12.9
2001 12.5 10.6 12.3 11.9 13.5 11.1 14.8 14.1 12.6 11.9 13.1 12.7 12.2 14.7 13.0 15.5 11.3 13.0 12.72002 12.6 10.6 12.5 12.1 13.0 11.2 15.0 14.2 12.9 11.3 12.7 12.6 12.1 14.8 13.7 15.8 11.4 13.4 12.82003 12.6 10.8 12.1 12.3 12.1 11.5 15.0 13.9 15.4 12.1 12.3 12.6 12.1 14.8 14.3 16.0 11.9 14.0 12.82004 12.9 10.6 12.1 12.9 11.8 11.9 15.3 14.0 16.2 11.7 13.3 13.7 12.4 14.7 13.7 15.6 12.1 13.8 12.92005 13.0 10.5 13.1 13.4 11.8 12.4 15.4 14.1 16.3 12.5 13.2 14.5 12.4 14.5 14.5 15.5 12.4 13.8 13.02006 13.1 10.5 13.2 13.9 12.4 12.5 15.3 14.8 16.9 12.9 12.6 14.6 12.6 14.0 14.9 14.9 11.2 13.7 13.12007 12.7 10.9 13.1 13.4 12.7 11.6 15.1 14.6 18.5 12.3 12.4 14.4 12.5 13.9 14.5 14.5 11.1 13.0 13.02008 12.5 10.9 12.0 12.3 12.4 9.8 14.9 13.7 17.7 10.9 12.4 14.0 12.2 14.1 14.1 14.0 10.4 12.9 12.52009 12.5 11.5 14.5 11.2 11.3 8.8 15.2 13.6 15.2 10.7 12.8 13.6 11.9 14.6 12.7 13.7 10.4 13.4 12.62010 12.8 11.1 13.9 11.4 12.1 10.5 15.0 14.0 15.4 11.3 12.3 13.1 12.2 14.5 13.3 14.0 10.1 13.4 12.7
2011 12.6 11.2 13.6 10.8 12.8 10.0 15.4 14.0 14.6 11.4 12.4 13.5 11.6 14.4 13.7 14.0 10.5 14.2 12.82012 12.9 11.2 13.9 11.0 12.5 10.5 15.6 15.0 14.9 11.5 12.9 13.3 11.4 14.6 13.7 14.3 9.9 14.4 13.02013 12.9 11.1 13.4 11.6 12.8 11.0 15.8 14.5 14.5 11.6 13.2 13.5 11.7 14.5 13.6 15.1 10.4 14.8 13.02014 12.8 10.9 13.6 11.6 12.6 11.1 16.1 15.0 14.7 11.9 13.1 13.7 12.0 14.4 13.7 15.5 10.3 15.1 13.12015 12.8 10.7 13.6 11.4 12.8 11.1 16.2 14.7 14.9 12.0 12.4 13.6 12.0 14.3 13.9 15.4 10.3 15.3 13.1
1) 1970-91 D_W 2) Euro area; 1970-91 including D_W

135
General government (% of GDP at market prices)
53. Taxes linked to imports and production (indirect taxes); general governmentESA 1995 (Percentage of GDP at market prices (excessive deficit procedure))
BG CZ DK HR LT HU PL RO SE UK EU-28 EU-27 MK IS TR ME RS US JP 1) 2) 2)
1970 : : : : : : : : : 14.3 : : : : : : : 8.5 :
1971 : : 17.4 : : : : : : 13.2 : : : : : : : 8.6 : 1972 : : 17.8 : : : : : : 12.4 : : : : : : : 8.4 : 1973 : : 15.6 : : : : : : 11.0 : : : : : : : 8.2 : 1974 : : 14.7 : : : : : : 11.3 : : : : : : : 8.1 : 1975 : : 14.3 : : : : : : 11.0 : : : : : : : 8.0 : 1976 : : 14.9 : : : : : : 10.8 : : : : : : : 7.8 : 1977 : : 15.9 : : : : : : 11.2 : : : : : : : 7.7 : 1978 : : 17.0 : : : : : : 11.1 : : : : : : : 7.3 : 1979 : : 17.7 : : : : : : 11.8 : : : : : : : 6.8 : 1980 : : 17.4 : : : : : : 13.0 : : : : : : : 7.0 :
1981 : : 17.1 : : : : : : 13.3 : : : : : : : 7.3 7.21982 : : 16.3 : : : : : : 13.5 : : : : : : : 7.2 7.21983 : : 16.5 : : : : : : 13.1 : : : : : : : 7.2 7.01984 : : 16.7 : : : : : : 13.3 : : : : : : : 7.2 7.31985 : : 16.9 : : : : : : 12.7 : : : : : : : 7.1 7.41986 : : 18.3 : : : : : : 12.8 : : : : : : : 7.0 7.21987 : : 18.1 : : : : : : 12.8 : : : : : : : 7.1 7.81988 : : 18.0 : : : : : : 12.8 : : : : : : : 7.1 7.81989 : : 17.0 : : : : : : 12.2 : : : : : : : 7.0 7.41990 : : 16.4 : : : : : : 11.5 : : : 21.0 : : : 7.1 7.8
1991 9.6 : 16.0 : : : 15.0 : : 12.4 : : : 20.7 : : : 7.4 7.21992 10.5 : 15.9 : : : 12.8 : : 12.3 : : : 19.4 : : : 7.4 7.71993 12.3 : 16.4 : 9.1 : 14.7 : 16.6 11.9 : : : 18.4 : : : 7.3 7.41994 14.0 : 16.8 : 10.7 : 15.1 : 16.0 12.3 : : : 17.6 : : : 7.5 7.51995 12.3 11.7 16.8 : 12.0 17.5 14.2 9.3 15.3 12.2 : 12.1 : 17.9 : : : 7.3 7.71996 12.4 11.5 17.2 : 11.5 16.9 14.4 8.8 15.8 12.4 : 12.3 : 18.2 : : : 7.2 7.91997 10.7 11.0 17.4 : 13.5 15.4 13.9 9.1 15.9 12.6 : 12.5 : 17.8 : : : 7.1 7.81998 13.8 10.6 18.1 : 13.8 15.6 13.1 11.4 16.7 12.6 : 13.0 : 17.5 : : : 7.0 8.41999 13.3 11.1 18.1 : 13.7 16.3 13.6 12.2 17.9 13.0 : 13.3 : 18.7 : : : 7.0 8.52000 13.8 10.8 17.0 : 12.6 16.6 12.6 12.2 15.9 13.1 : 13.1 : 18.2 : : : 6.9 8.5
2001 13.4 10.5 17.2 : 12.2 15.5 12.5 11.3 15.9 12.8 : 12.8 : 15.9 : : : 6.8 8.52002 12.6 10.3 17.4 : 12.4 15.0 13.2 11.6 16.3 12.9 : 12.9 : 15.9 : : : 6.9 8.32003 14.5 10.6 17.2 : 11.7 15.8 13.2 12.3 16.4 12.7 : 13.0 : 16.7 : : : 7.0 8.22004 16.3 11.1 17.4 : 11.0 16.1 12.9 11.7 16.2 12.8 : 13.0 : 17.8 : : : 7.0 8.32005 16.6 11.0 17.7 : 11.0 15.5 13.6 12.9 16.3 12.4 : 13.1 : 19.1 : : : 7.1 8.42006 17.2 10.5 17.9 : 11.0 15.0 14.2 12.8 16.5 12.4 : 13.2 : 19.4 12.3 : : 7.2 8.62007 16.7 10.8 17.7 : 11.5 15.9 14.1 12.3 16.5 12.3 : 13.1 : 18.6 11.9 : : 7.1 8.42008 17.4 10.6 17.0 : 11.4 15.6 14.2 11.7 17.9 11.9 : 12.7 : 15.6 11.7 : : 7.1 8.52009 15.1 11.0 16.8 17.1 11.4 16.6 12.8 10.7 18.7 11.6 12.7 12.7 : 14.0 12.1 : : 7.1 8.22010 14.9 11.1 16.6 18.0 11.7 17.1 13.6 11.9 17.8 12.6 13.0 13.0 13.2 14.3 13.3 : : 7.1 8.3
2011 14.5 11.6 16.8 17.5 11.5 16.9 13.8 13.0 18.6 13.2 13.2 13.1 13.4 14.3 13.4 : : 7.1 8.52012 15.1 12.2 16.7 18.2 11.1 18.2 12.9 13.2 18.5 13.4 13.4 13.3 14.4 15.0 : : : 6.9 8.52013 15.1 12.4 16.6 18.6 11.0 18.3 12.6 12.7 18.8 13.5 13.4 13.4 14.7 15.0 : 13.5 : 7.3 8.72014 15.0 12.2 16.5 18.8 10.8 18.2 12.6 12.7 19.0 13.5 13.5 13.5 14.5 14.9 : 14.7 : 7.4 9.72015 15.1 12.1 16.4 18.8 10.7 18.0 12.6 12.8 19.0 13.6 13.4 13.4 14.7 15.2 : 14.8 : 7.5 10.1
_________________________________________________________________________________________________________________________________________________________________ 1) Former EU-27 2) SNA 93

136
General government (% of GDP at market prices)
54. Current taxes on income and wealth (direct taxes); general governmentESA 1995 (Percentage of GDP at market prices (excessive deficit procedure))
BE DE EE IE EL ES FR IT CY LV LU MT NL AT PT SI SK FI EA-18 1) 2)
1970 10.0 10.7 : : : : : : : : : : 12.7 : : : : : :
1971 10.7 11.1 : : : : : : : : : : 13.5 : : : : : : 1972 11.4 10.9 : : : : : : : : : : 14.1 : : : : : : 1973 12.5 12.4 : : : : : : : : : : 14.3 : : : : : : 1974 13.4 12.6 : : : : : : : : : : 14.1 : : : : : : 1975 15.1 11.7 : : : : : : : : : : 15.0 : : : : 16.1 : 1976 14.7 12.5 : : : : : : : : : : 14.7 10.3 : : : 18.8 : 1977 16.0 13.4 : : : : : : : : : : 14.9 10.7 4.9 : : 17.5 : 1978 16.9 12.7 : : : : 6.7 : : : : : 14.9 11.8 5.1 : : 15.1 : 1979 17.2 12.3 : : : : 7.0 : : : : : 15.0 11.5 5.5 : : 14.1 : 1980 16.6 12.3 : : : : 7.4 9.3 : : : : 15.0 11.6 5.2 : : 14.2 :
1981 16.5 11.7 : : : : 7.6 10.0 : : : : 14.3 12.2 5.9 : : 15.7 : 1982 17.4 11.6 : : : : 7.8 11.3 : : : : 14.3 11.6 6.4 : : 15.4 : 1983 17.4 11.5 : : : : 7.8 11.8 : : : : 13.2 11.2 7.0 : : 15.5 : 1984 17.9 11.6 : : : : 8.1 12.0 : : : : 12.3 11.6 6.8 : : 15.9 : 1985 17.6 12.0 : 12.8 : : 7.9 12.1 : : : : 12.3 12.2 7.1 : : 16.5 : 1986 17.3 11.8 : 13.6 : : 7.9 12.3 : : : : 12.9 12.2 5.6 : : 17.4 : 1987 17.0 11.9 : 14.0 : : 8.0 12.4 : : : : 13.6 11.7 5.0 : : 15.6 : 1988 16.4 11.7 : 14.9 4.7 : 7.6 12.8 : : : : 13.8 11.6 6.1 : : 17.0 : 1989 15.0 12.1 : 12.4 4.5 : 7.7 13.5 : : : : 13.4 10.7 7.1 : : 16.7 : 1990 15.2 10.8 : 12.9 5.0 : 7.9 13.8 : 11.1 14.7 : 15.0 11.4 7.0 : : 17.3 :
1991 11.5
1991 14.9 12.5 : 13.6 5.1 : 8.0 13.9 : 10.8 13.3 : 16.3 11.9 7.8 : : 17.5 : 1992 14.4 12.8 : 13.9 4.6 : 7.8 14.2 : 7.8 12.5 : 15.2 12.5 8.7 : : 16.5 : 1993 15.4 12.5 12.9 14.6 5.1 : 7.9 15.6 : 11.4 14.1 : 16.0 12.5 8.0 : 9.8 15.6 : 1994 15.7 12.0 11.9 14.9 6.2 : 8.1 14.5 : 6.3 14.6 : 13.3 11.1 7.8 : 6.6 17.1 : 1995 16.2 12.0 10.9 13.3 6.7 10.0 8.1 14.4 8.8 7.1 15.3 8.1 12.3 11.7 8.2 6.8 10.8 17.3 11.51996 16.3 11.9 9.2 13.8 6.4 10.3 8.6 15.0 8.5 7.0 15.8 6.7 12.7 12.7 8.8 7.3 9.7 18.9 11.81997 16.7 11.6 9.2 13.8 7.0 10.2 9.2 15.7 8.7 7.5 16.4 8.0 12.1 13.4 8.9 7.4 9.2 18.4 12.01998 17.3 12.0 10.4 13.6 8.6 10.1 11.4 14.2 9.8 7.8 16.0 7.6 11.9 13.6 8.6 7.2 9.0 18.9 12.31999 16.9 12.5 9.8 13.6 8.9 10.0 12.0 14.8 10.7 7.6 14.8 8.6 11.8 13.2 9.0 7.3 9.0 18.5 12.72000 17.0 12.8 7.7 13.4 9.7 10.2 12.0 14.3 11.1 7.3 14.9 8.9 11.6 13.1 9.5 7.3 7.4 21.1 12.8
2001 17.2 11.3 7.2 12.6 8.6 10.1 12.2 14.7 11.2 7.6 15.2 9.6 11.4 14.9 9.1 7.5 7.5 19.0 12.32002 17.1 10.9 7.5 11.5 8.6 10.6 11.3 13.8 11.2 7.9 15.3 10.9 11.4 13.8 9.0 7.7 7.0 18.8 11.92003 16.6 10.8 8.0 11.7 7.9 10.0 11.0 13.3 9.7 7.6 14.6 11.3 10.7 13.6 8.4 7.9 7.1 17.8 11.52004 16.6 10.6 7.9 12.2 8.1 10.4 11.1 13.3 8.1 7.9 13.0 10.8 10.4 13.4 8.3 8.2 6.1 17.5 11.52005 16.9 10.9 7.0 12.1 8.6 11.0 11.3 13.2 9.3 7.9 13.6 11.3 11.4 12.8 8.2 8.7 6.0 17.5 11.72006 16.5 11.7 7.1 13.0 8.1 11.8 11.8 14.3 10.8 8.5 13.0 11.7 11.5 12.8 8.6 9.1 6.1 17.3 12.32007 16.3 12.1 7.4 12.7 8.2 13.0 11.5 15.0 13.8 9.2 13.0 13.0 11.9 13.3 9.5 9.2 6.2 17.5 12.72008 16.5 12.2 7.9 11.5 8.0 10.6 11.6 15.2 12.9 9.8 14.1 12.5 11.7 14.0 9.7 8.9 6.5 17.4 12.52009 15.2 11.6 7.5 10.7 8.3 9.6 9.8 14.6 11.2 7.2 14.8 13.4 11.8 12.7 9.0 8.3 5.5 16.1 11.62010 15.5 11.0 6.8 10.5 8.0 9.5 10.5 14.6 11.1 7.4 14.6 12.5 12.0 12.8 8.8 8.2 5.4 16.0 11.5
2011 16.0 11.5 6.5 11.9 8.7 9.7 11.2 14.3 11.7 7.4 14.4 12.7 11.5 13.0 9.9 8.0 5.5 16.4 11.92012 16.4 12.0 6.8 12.6 10.2 10.3 11.9 15.1 11.1 7.7 14.6 13.6 10.9 13.4 9.3 7.7 5.6 16.0 12.42013 17.1 12.2 7.4 13.2 9.8 10.3 12.4 15.3 11.6 7.7 14.6 14.5 10.9 13.7 11.8 7.3 5.9 16.9 12.72014 17.1 12.4 7.1 13.3 11.1 10.8 12.1 14.9 11.3 7.5 14.3 14.6 11.2 14.0 11.2 7.4 5.9 16.7 12.72015 17.3 12.5 6.8 13.4 11.0 9.7 11.9 15.3 11.2 7.4 14.6 14.6 11.8 14.1 11.3 7.4 6.0 16.8 12.7
1) 1970-91 D_W 2) Euro area; 1970-91 including D_W

137
General government (% of GDP at market prices)
54. Current taxes on income and wealth (direct taxes); general governmentESA 1995 (Percentage of GDP at market prices (excessive deficit procedure))
BG CZ DK HR LT HU PL RO SE UK EU-28 EU-27 MK IS TR ME RS US JP 1) 2) 2)
1970 : : : : : : : : : 16.7 : : : : : : : 12.8 :
1971 : : 23.5 : : : : : : 16.2 : : : : : : : 12.0 : 1972 : : 22.8 : : : : : : 14.8 : : : : : : : 12.9 : 1973 : : 23.7 : : : : : : 14.7 : : : : : : : 12.7 : 1974 : : 26.7 : : : : : : 17.4 : : : : : : : 13.1 : 1975 : : 23.4 : : : : : : 18.0 : : : : : : : 11.8 : 1976 : : 23.7 : : : : : : 17.1 : : : : : : : 12.6 : 1977 : : 23.1 : : : : : : 16.0 : : : : : : : 13.0 : 1978 : : 23.3 : : : : : : 15.3 : : : : : : : 13.3 : 1979 : : 23.6 : : : : : : 14.8 : : : : : : : 13.6 : 1980 : : 24.6 : : : : : : 15.6 : : : : : : : 13.5 :
1981 : : 24.5 : : : : : : 16.6 : : : : : : : 13.3 11.01982 : : 24.1 : : : : : : 17.0 : : : : : : : 12.5 11.11983 : : 25.3 : : : : : : 16.6 : : : : : : : 11.8 11.21984 : : 26.1 : : : : : : 16.6 : : : : : : : 11.7 11.51985 : : 27.2 : : : : : : 16.8 : : : : : : : 11.9 11.71986 : : 28.1 : : : : : : 16.0 : : : : : : : 11.9 11.71987 : : 28.5 : : : : : : 15.6 : : : : : : : 12.7 12.41988 : : 29.8 : : : : : : 15.6 : : : : : : : 12.3 12.61989 : : 29.4 : : : : : : 16.0 : : : : : : : 12.6 12.81990 : : 28.9 : : : : : : 16.5 : : : 11.0 : : : 12.3 13.0
1991 22.5 : 28.6 : : 11.0 11.0 : : 15.6 : : : 11.3 : : : 11.7 13.11992 14.6 : 29.1 : : 9.9 13.4 : : 14.8 : : : 12.8 : : : 11.6 12.31993 11.2 : 30.0 : 10.3 10.2 14.6 : 19.1 13.7 : : : 12.3 : : : 11.8 11.11994 13.8 : 30.6 : 9.8 10.1 13.3 : 20.0 14.0 : : : 12.2 : : : 12.0 10.21995 8.8 9.1 30.7 : 8.4 8.6 11.7 10.6 19.6 14.7 : 12.4 : 12.9 : : : 12.5 9.61996 10.1 8.0 30.7 : 8.0 9.2 11.3 9.8 20.6 14.4 : 12.7 : 13.3 : : : 13.1 9.71997 9.3 8.5 30.3 : 8.7 8.9 11.1 10.3 21.0 14.7 : 13.0 : 14.1 : : : 13.6 9.71998 8.4 8.0 29.9 : 9.0 8.8 10.8 8.4 20.9 15.9 : 13.4 : 14.1 : : : 14.0 8.51999 7.5 8.2 30.1 : 9.1 9.4 7.7 7.8 21.6 15.9 : 13.6 : 15.3 : : : 14.1 8.22000 6.8 7.9 30.3 : 8.4 9.8 7.2 7.0 22.5 16.3 : 13.8 : 16.1 : : : 14.5 8.7
2001 7.4 8.3 29.3 : 7.8 10.1 6.3 6.4 20.7 16.4 : 13.4 : 16.5 : : : 13.5 9.22002 6.2 8.7 29.1 : 7.4 10.1 6.7 5.8 19.4 15.4 : 12.8 : 16.5 : : : 11.3 7.92003 6.0 9.2 29.4 : 7.9 9.5 6.5 6.0 20.1 14.8 : 12.4 : 16.8 : : : 10.8 7.52004 5.7 9.1 30.2 : 8.7 9.0 6.5 6.4 20.8 15.0 : 12.5 : 16.9 : : : 11.0 7.52005 4.7 8.9 31.7 : 9.0 9.0 7.0 5.3 22.0 15.8 : 12.8 : 18.3 : : : 12.3 8.32006 4.8 8.8 30.5 : 9.5 9.4 7.5 6.0 22.2 16.5 : 13.4 : 18.7 6.3 : : 13.1 9.12007 7.6 9.0 29.9 : 9.2 10.3 8.6 6.7 21.2 16.2 : 13.6 : 18.9 7.0 : : 13.3 9.52008 6.1 8.0 29.4 : 9.3 10.6 8.6 6.7 19.8 16.5 : 13.3 : 18.2 7.4 : : 11.8 9.62009 5.6 7.2 29.7 7.2 6.0 9.9 7.4 6.5 19.6 15.5 12.4 12.4 : 16.7 7.6 : : 9.8 7.72010 5.1 6.9 29.6 6.5 4.7 8.1 6.9 6.1 19.2 15.4 12.3 12.3 3.3 16.6 7.8 : : 10.4 7.8
2011 4.9 7.2 29.7 6.2 4.4 6.4 7.0 6.2 18.5 15.5 12.5 12.6 3.8 17.5 7.5 : : 11.4 8.12012 4.9 7.2 30.4 6.1 4.9 7.0 7.2 6.1 18.1 15.0 12.9 12.9 2.9 17.9 : : : 11.8 8.32013 5.2 7.3 31.8 6.3 5.0 6.9 7.0 6.0 18.5 14.9 13.2 13.2 2.9 18.4 : 5.0 : 12.7 8.42014 5.2 7.3 31.5 6.4 5.0 6.8 7.1 5.9 18.2 14.6 13.1 13.1 3.0 18.0 : 4.8 : 12.8 8.52015 5.3 6.9 29.3 6.5 5.0 6.8 7.2 6.0 18.1 14.3 13.0 13.0 3.1 16.9 : 5.2 : 13.2 8.6
_________________________________________________________________________________________________________________________________________________________________ 1) Former EU-27 2) SNA 93

138
General government (% of GDP at market prices)
55. Social contributions received; general governmentESA 1995 (Percentage of GDP at market prices (excessive deficit procedure))
BE DE EE IE EL ES FR IT CY LV LU MT NL AT PT SI SK FI EA-18 1) 2)
1970 10.8 11.8 : : : : : : : : : : 13.7 : : : : : :
1971 11.3 12.3 : : : : : : : : : : 14.3 : : : : : : 1972 11.7 12.9 : : : : : : : : : : 14.6 : : : : : : 1973 12.0 13.8 : : : : : : : : : : 15.9 : : : : : : 1974 12.3 14.3 : : : : : : : : : : 16.3 : : : : : : 1975 13.3 15.2 : : : : : : : : : : 17.3 : : : : 10.5 : 1976 13.4 15.8 : : : : : : : : : : 17.0 12.2 : : : 11.2 : 1977 13.6 15.8 : : : : : : : : : : 17.1 12.6 8.1 : : 11.7 : 1978 13.5 15.7 : : : : 17.7 : : : : : 17.4 14.0 6.9 : : 10.7 : 1979 13.6 15.6 : : : : 18.6 : : : : : 17.9 13.8 6.4 : : 10.5 : 1980 13.6 15.8 : : : : 19.1 13.7 : : : : 17.7 14.1 6.9 : : 10.7 :
1981 13.9 16.3 : : : : 19.1 13.2 : : : : 18.0 14.6 7.5 : : 11.0 : 1982 14.1 16.6 : : : : 19.6 13.7 : : : : 18.9 14.5 7.8 : : 10.5 : 1983 14.7 16.2 : : : : 20.0 14.2 : : : : 20.8 14.4 7.4 : : 10.1 : 1984 15.3 16.2 : : : : 20.4 13.4 : : : : 19.6 14.9 7.0 : : 10.4 : 1985 15.8 16.3 : 7.0 : : 20.3 13.5 : : : : 19.7 15.3 7.3 : : 11.3 : 1986 16.1 16.3 : 6.9 : : 19.9 13.6 : : : : 19.2 15.2 8.7 : : 11.3 : 1987 16.5 16.5 : 6.9 : : 20.1 13.5 : : : : 20.0 15.3 8.7 : : 11.3 : 1988 15.9 16.4 : 7.0 9.8 : 19.9 13.6 : : : : 19.7 15.5 8.7 : : 11.3 : 1989 15.5 16.0 : 6.8 10.3 : 20.0 13.5 : : : : 18.1 15.4 8.6 : : 11.3 : 1990 15.7 15.8 : 7.0 10.5 : 20.1 14.0 : 3.7 10.9 : 16.5 15.3 8.7 : : 12.7 :
1991 15.9
1991 16.3 16.8 : 7.3 10.2 : 20.1 14.3 : 9.2 10.8 : 17.2 15.4 9.1 : : 13.5 : 1992 16.5 17.2 : 7.5 10.0 : 20.4 14.6 : 8.3 11.4 : 17.7 16.1 9.5 : : 14.4 : 1993 16.8 17.7 12.0 7.5 10.9 : 20.5 14.8 : 11.6 11.2 : 17.6 16.7 9.9 : 12.4 14.9 : 1994 16.5 18.2 13.3 7.2 11.0 : 20.4 14.5 : 11.5 10.8 : 18.4 17.1 10.0 : 12.8 15.7 : 1995 16.3 18.5 12.3 6.6 11.3 12.7 20.3 14.2 6.6 12.0 11.0 7.1 17.1 17.2 10.0 16.9 15.1 14.7 17.11996 16.4 19.2 11.6 6.2 11.6 12.9 20.5 14.6 6.7 10.9 10.9 7.3 16.4 17.2 9.9 15.1 16.0 14.2 17.21997 16.3 19.5 11.4 5.9 12.0 12.9 20.0 14.9 6.8 10.6 11.1 7.7 16.2 17.3 10.1 14.4 15.1 13.3 17.21998 16.3 19.2 11.2 5.5 12.2 12.8 17.9 12.6 6.9 10.5 11.2 7.3 16.1 17.1 10.3 14.5 14.9 13.0 16.21999 16.3 19.0 11.1 5.6 12.3 12.8 18.1 12.2 6.7 10.8 11.0 7.4 16.6 17.1 10.2 14.2 14.1 13.0 16.12000 16.0 18.6 11.0 5.5 12.6 12.9 17.9 12.3 6.6 10.2 10.9 7.4 16.4 16.8 10.6 14.4 14.2 12.1 15.8
2001 16.2 18.4 10.7 5.8 12.7 13.0 17.9 12.1 6.8 9.4 11.8 7.9 14.7 16.6 10.8 14.6 14.4 12.2 15.62002 16.5 18.4 11.0 5.7 13.7 13.0 18.0 12.2 6.8 9.5 11.8 7.8 14.3 16.3 11.1 14.5 14.7 12.0 15.62003 16.4 18.5 10.7 5.8 13.9 13.0 18.3 12.5 7.1 9.1 11.7 7.7 14.7 16.4 11.6 14.4 14.0 11.9 15.72004 16.0 18.1 10.4 6.0 13.4 13.0 18.1 12.6 7.8 8.9 11.6 7.7 14.9 16.2 11.5 14.4 13.3 11.8 15.52005 15.8 17.9 10.4 6.0 13.5 12.9 18.2 12.6 8.3 8.6 11.3 7.7 13.9 16.1 11.9 14.5 12.8 12.1 15.42006 15.7 17.3 10.2 6.1 12.4 12.9 18.2 12.6 7.8 8.9 10.8 7.5 14.8 15.9 11.8 14.3 11.9 12.4 15.32007 15.7 16.5 10.6 6.3 13.0 13.0 18.0 13.1 7.5 8.7 10.7 7.1 14.2 15.7 11.6 13.9 11.9 12.0 15.02008 16.1 16.5 11.8 6.8 13.2 13.2 18.1 13.7 7.8 8.5 11.5 7.2 15.2 15.9 11.9 14.3 12.0 12.2 15.32009 16.8 17.3 13.2 7.4 12.7 13.4 18.8 14.0 8.7 9.4 12.9 7.3 14.6 16.5 12.5 15.2 12.7 12.9 15.82010 16.5 16.9 13.2 7.3 13.4 13.4 18.7 13.8 8.9 8.6 12.0 7.1 14.9 16.3 12.3 15.5 12.5 12.8 15.7
2011 16.7 16.7 12.1 6.2 13.1 13.3 18.8 13.7 8.8 8.7 12.2 7.3 15.5 16.3 12.3 15.3 12.5 12.7 15.72012 17.1 16.8 11.6 5.9 13.7 13.0 19.0 13.8 8.5 8.6 12.6 7.3 16.6 16.4 11.6 15.5 12.7 13.3 15.92013 17.3 16.8 11.4 6.2 13.4 12.8 19.4 13.8 8.9 8.3 12.2 7.3 16.9 16.7 12.2 15.2 13.8 13.4 15.92014 17.0 16.6 11.3 6.2 13.7 12.8 19.4 13.7 9.4 8.1 12.1 7.4 16.9 16.6 11.8 15.1 13.4 13.6 15.92015 17.1 16.5 11.4 6.1 13.4 12.7 19.0 13.6 9.2 7.7 12.3 7.2 17.2 16.5 11.5 15.0 13.3 13.7 15.8
1) 1970-91 D_W 2) Euro area; 1970-91 including D_W

139
General government (% of GDP at market prices)
55. Social contributions received; general governmentESA 1995 (Percentage of GDP at market prices (excessive deficit procedure))
BG CZ DK HR LT HU PL RO SE UK EU-28 EU-27 MK IS TR ME RS US JP 1) 2) 2)
1970 : : : : : : : : : 6.2 : : : : : : : 4.3 :
1971 : : 2.4 : : : : : : 6.0 : : : : : : : 4.4 : 1972 : : 2.4 : : : : : : 6.4 : : : : : : : 4.6 : 1973 : : 1.6 : : : : : : 6.5 : : : : : : : 5.3 : 1974 : : 1.4 : : : : : : 7.2 : : : : : : : 5.5 : 1975 : : 1.5 : : : : : : 7.9 : : : : : : : 5.3 : 1976 : : 1.4 : : : : : : 8.2 : : : : : : : 5.4 : 1977 : : 1.5 : : : : : : 7.9 : : : : : : : 5.5 : 1978 : : 1.5 : : : : : : 7.4 : : : : : : : 5.6 : 1979 : : 1.6 : : : : : : 7.2 : : : : : : : 5.8 : 1980 : : 1.8 : : : : : : 7.5 : : : : : : : 5.8 :
1981 : : 2.0 : : : : : : 7.8 : : : : : : : 6.1 7.51982 : : 2.3 : : : : : : 8.0 : : : : : : : 6.3 7.61983 : : 2.8 : : : : : : 8.3 : : : : : : : 6.2 7.71984 : : 2.8 : : : : : : 8.3 : : : : : : : 6.4 7.61985 : : 2.8 : : : : : : 8.2 : : : : : : : 6.5 7.61986 : : 1.9 : : : : : : 8.2 : : : : : : : 6.6 7.81987 : : 2.8 : : : : : : 7.9 : : : : : : : 6.7 7.81988 : : 2.1 : : : : : : 7.8 : : : : : : : 6.9 7.71989 : : 2.1 : : : : : : 7.6 : : : : : : : 6.8 7.71990 : : 1.7 : : : : : : 7.3 : : : 1.0 : : : 6.9 7.9
1991 10.0 : 1.7 : : 17.3 10.7 : : 7.4 : : : 2.3 : : : 7.0 8.21992 15.7 : 1.9 : : 18.3 12.4 : : 7.4 : : : 2.5 : : : 7.0 8.31993 14.7 : 2.0 : : 19.2 12.0 : 13.0 7.4 : : : 2.5 : : : 7.0 8.51994 13.7 : 2.2 : : 17.7 11.1 : 13.1 7.3 : : : 2.5 : : : 7.0 8.71995 9.9 14.7 2.1 : 7.2 14.9 11.3 7.8 12.8 7.2 : 15.2 : 2.5 : : : 7.0 9.21996 9.4 14.6 2.0 : 7.7 13.9 11.6 7.5 13.8 7.2 : 15.3 : 2.7 : : : 6.9 9.41997 8.6 15.1 2.0 : 9.0 14.1 11.7 7.2 13.5 7.3 : 15.0 : 2.7 : : : 6.9 9.61998 9.3 14.9 2.0 : 10.0 13.9 11.6 9.5 13.5 7.2 : 14.2 : 2.7 : : : 6.9 9.81999 10.2 15.0 2.5 : 10.1 13.3 13.7 11.4 12.0 7.4 : 14.2 : 2.8 : : : 6.9 9.82000 10.8 15.1 2.6 : 10.2 13.4 12.9 11.4 13.1 7.5 : 13.9 : 2.9 : : : 6.9 9.9
2001 9.8 15.0 2.6 : 9.7 13.1 13.4 11.2 12.6 7.6 : 13.8 : 2.8 : : : 6.9 10.32002 9.6 15.5 2.1 : 9.4 12.9 12.9 11.1 11.7 7.4 : 13.7 : 2.9 : : : 6.9 10.42003 10.3 15.7 2.1 : 9.3 12.7 12.8 9.9 11.4 7.8 : 13.9 : 3.1 : : : 6.8 10.72004 10.2 15.5 2.1 : 9.4 12.4 12.3 9.7 11.1 8.0 : 13.8 : 3.0 : : : 6.8 10.32005 9.7 15.5 2.0 : 9.2 12.6 12.3 10.3 10.7 8.2 : 13.7 : 3.2 : : : 6.7 10.62006 8.3 15.7 1.9 : 9.4 12.7 12.2 10.3 9.8 8.2 : 13.5 : 3.3 6.7 : : 6.7 10.92007 8.1 15.7 1.9 : 9.5 13.9 12.0 10.5 9.9 8.1 : 13.3 : 3.0 6.8 : : 6.7 11.02008 7.8 15.6 1.8 : 10.0 13.8 11.3 10.1 9.0 8.3 : 13.6 : 2.8 8.6 : : 6.7 11.52009 7.7 14.9 1.9 12.2 13.2 13.3 11.3 10.2 8.7 8.4 14.1 14.1 : 3.1 9.6 : : 6.7 11.82010 7.0 15.2 1.9 12.0 12.2 12.2 11.1 9.5 8.7 8.3 13.9 13.9 8.9 4.1 9.4 : : 6.6 11.8
2011 7.3 15.5 2.0 11.7 11.6 13.3 11.4 9.1 7.7 8.3 13.9 13.9 8.6 4.1 9.2 : : 5.9 12.52012 7.2 15.6 1.9 11.5 11.3 13.3 12.3 9.0 7.7 8.4 14.0 14.0 8.6 3.8 : : : 5.9 12.82013 7.8 15.6 1.8 11.3 11.2 13.4 12.2 8.8 7.5 8.4 14.0 14.0 8.3 3.8 : 12.0 : 6.6 13.02014 7.8 15.4 1.8 11.7 11.3 13.4 12.4 8.8 7.4 8.3 14.0 14.0 8.5 3.9 : 11.8 : 6.7 13.32015 7.9 15.2 1.8 11.8 11.3 13.2 12.7 8.8 7.4 8.2 13.8 13.8 8.6 3.9 : 11.9 : 6.8 13.5
_________________________________________________________________________________________________________________________________________________________________ 1) Former EU-27 2) SNA 93
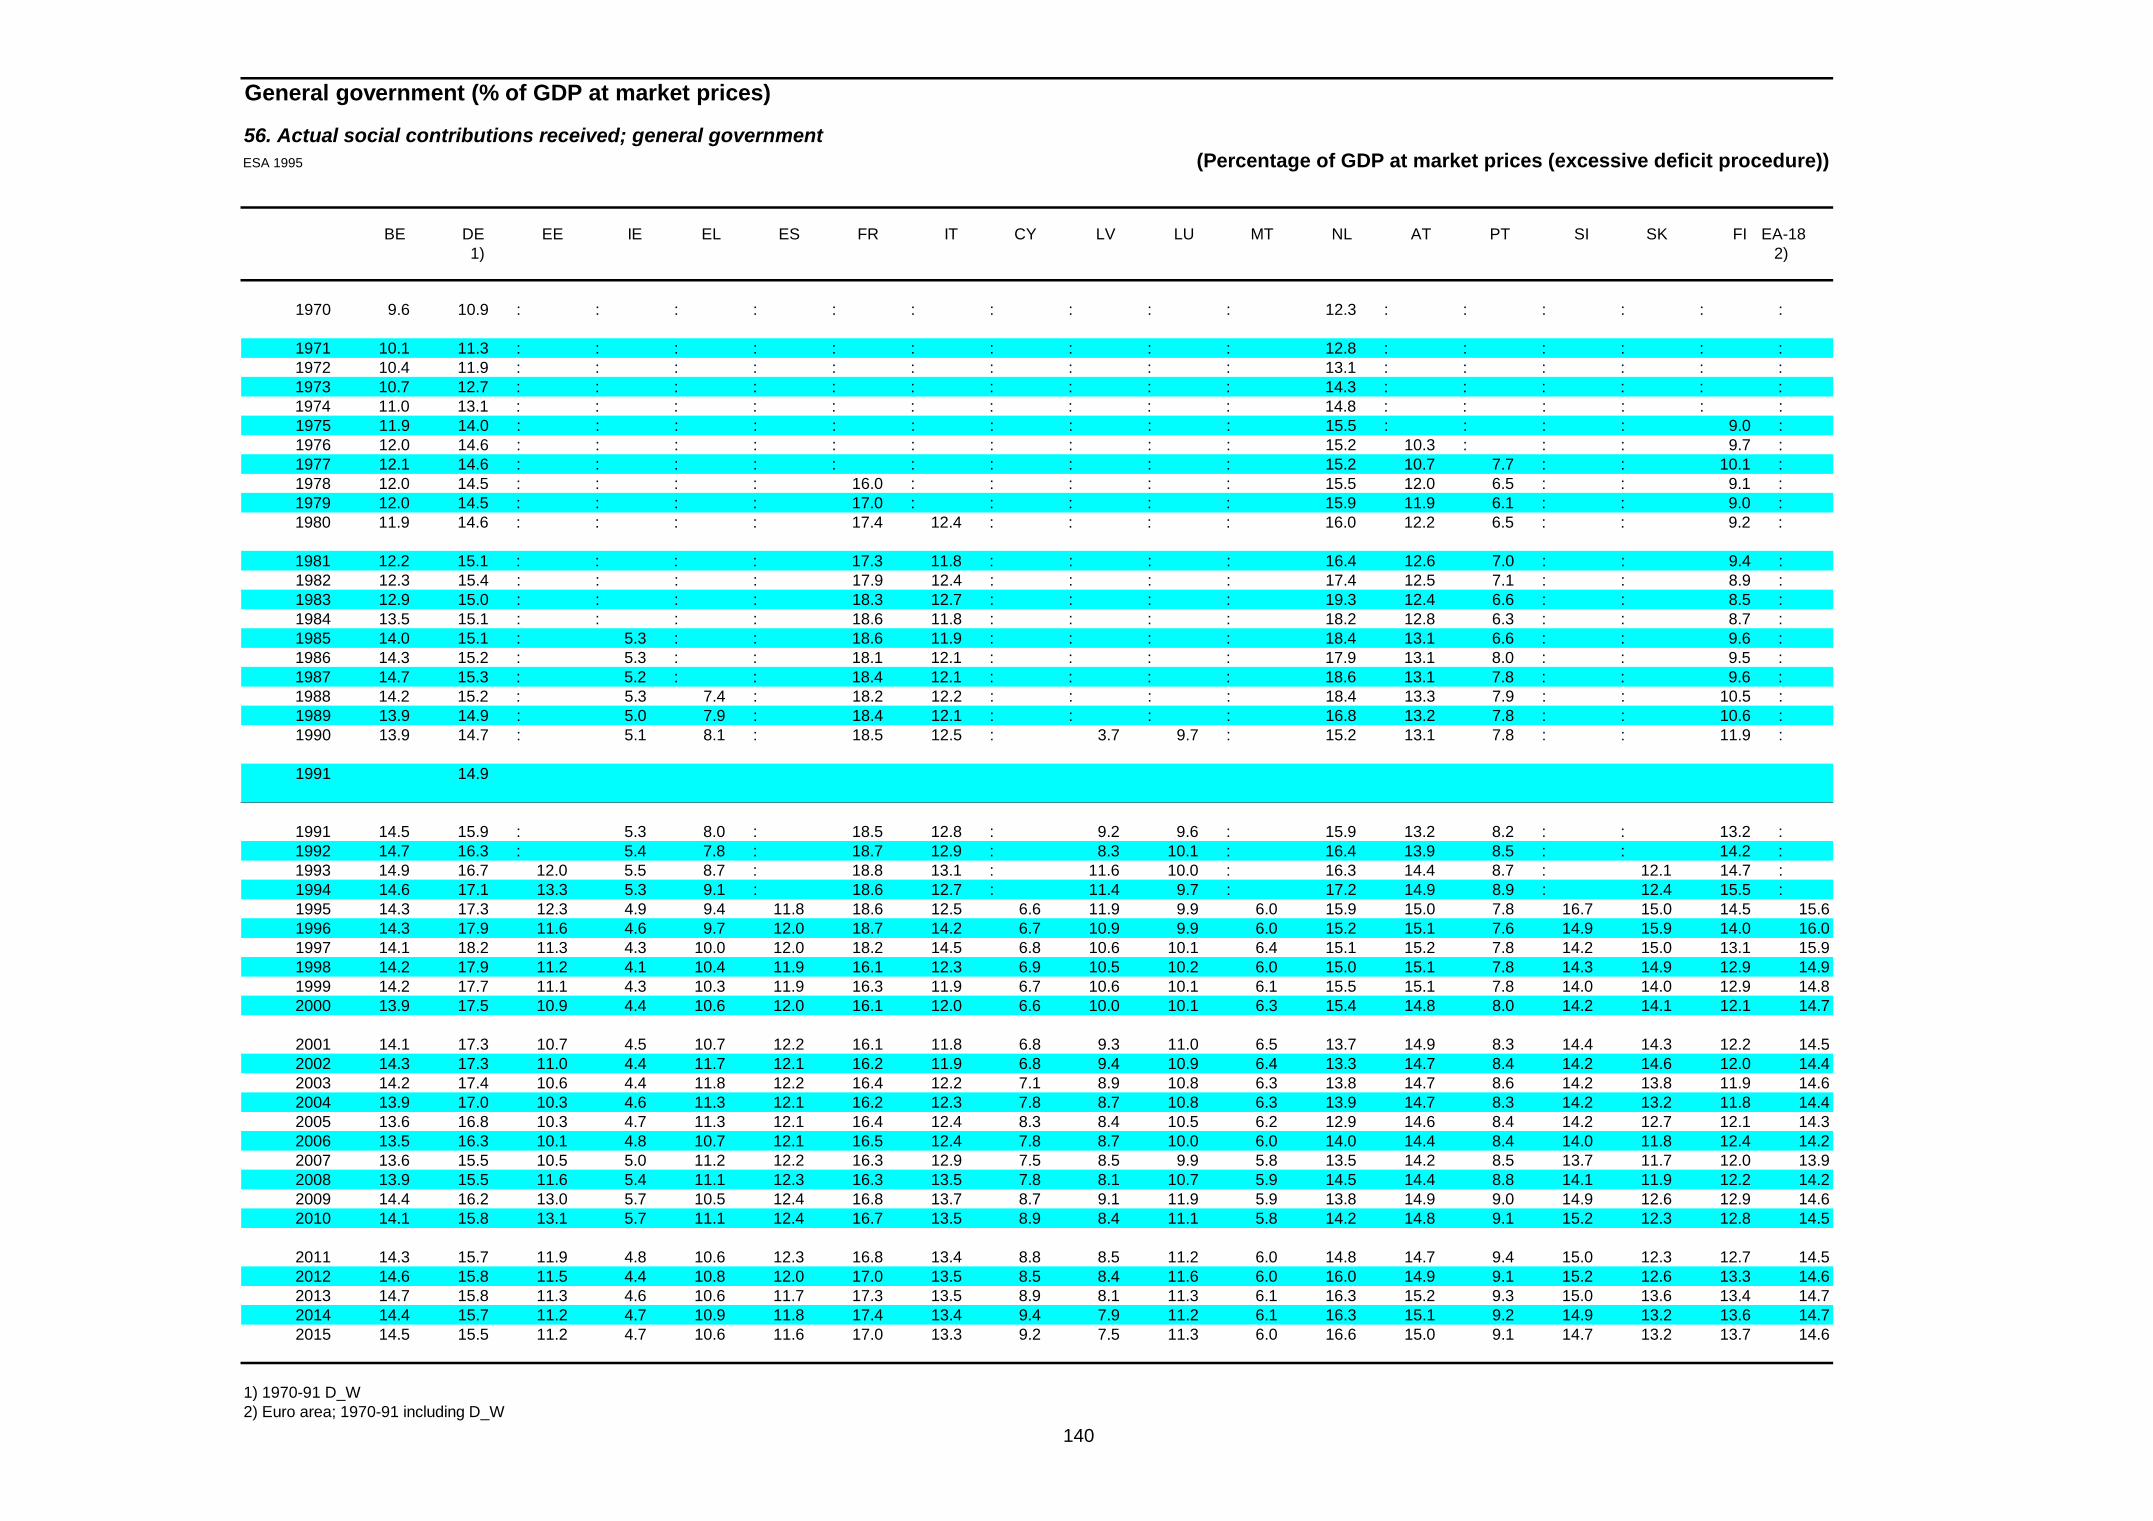
140
General government (% of GDP at market prices)
56. Actual social contributions received; general governmentESA 1995 (Percentage of GDP at market prices (excessive deficit procedure))
BE DE EE IE EL ES FR IT CY LV LU MT NL AT PT SI SK FI EA-18 1) 2)
1970 9.6 10.9 : : : : : : : : : : 12.3 : : : : : :
1971 10.1 11.3 : : : : : : : : : : 12.8 : : : : : : 1972 10.4 11.9 : : : : : : : : : : 13.1 : : : : : : 1973 10.7 12.7 : : : : : : : : : : 14.3 : : : : : : 1974 11.0 13.1 : : : : : : : : : : 14.8 : : : : : : 1975 11.9 14.0 : : : : : : : : : : 15.5 : : : : 9.0 : 1976 12.0 14.6 : : : : : : : : : : 15.2 10.3 : : : 9.7 : 1977 12.1 14.6 : : : : : : : : : : 15.2 10.7 7.7 : : 10.1 : 1978 12.0 14.5 : : : : 16.0 : : : : : 15.5 12.0 6.5 : : 9.1 : 1979 12.0 14.5 : : : : 17.0 : : : : : 15.9 11.9 6.1 : : 9.0 : 1980 11.9 14.6 : : : : 17.4 12.4 : : : : 16.0 12.2 6.5 : : 9.2 :
1981 12.2 15.1 : : : : 17.3 11.8 : : : : 16.4 12.6 7.0 : : 9.4 : 1982 12.3 15.4 : : : : 17.9 12.4 : : : : 17.4 12.5 7.1 : : 8.9 : 1983 12.9 15.0 : : : : 18.3 12.7 : : : : 19.3 12.4 6.6 : : 8.5 : 1984 13.5 15.1 : : : : 18.6 11.8 : : : : 18.2 12.8 6.3 : : 8.7 : 1985 14.0 15.1 : 5.3 : : 18.6 11.9 : : : : 18.4 13.1 6.6 : : 9.6 : 1986 14.3 15.2 : 5.3 : : 18.1 12.1 : : : : 17.9 13.1 8.0 : : 9.5 : 1987 14.7 15.3 : 5.2 : : 18.4 12.1 : : : : 18.6 13.1 7.8 : : 9.6 : 1988 14.2 15.2 : 5.3 7.4 : 18.2 12.2 : : : : 18.4 13.3 7.9 : : 10.5 : 1989 13.9 14.9 : 5.0 7.9 : 18.4 12.1 : : : : 16.8 13.2 7.8 : : 10.6 : 1990 13.9 14.7 : 5.1 8.1 : 18.5 12.5 : 3.7 9.7 : 15.2 13.1 7.8 : : 11.9 :
1991 14.9
1991 14.5 15.9 : 5.3 8.0 : 18.5 12.8 : 9.2 9.6 : 15.9 13.2 8.2 : : 13.2 : 1992 14.7 16.3 : 5.4 7.8 : 18.7 12.9 : 8.3 10.1 : 16.4 13.9 8.5 : : 14.2 : 1993 14.9 16.7 12.0 5.5 8.7 : 18.8 13.1 : 11.6 10.0 : 16.3 14.4 8.7 : 12.1 14.7 : 1994 14.6 17.1 13.3 5.3 9.1 : 18.6 12.7 : 11.4 9.7 : 17.2 14.9 8.9 : 12.4 15.5 : 1995 14.3 17.3 12.3 4.9 9.4 11.8 18.6 12.5 6.6 11.9 9.9 6.0 15.9 15.0 7.8 16.7 15.0 14.5 15.61996 14.3 17.9 11.6 4.6 9.7 12.0 18.7 14.2 6.7 10.9 9.9 6.0 15.2 15.1 7.6 14.9 15.9 14.0 16.01997 14.1 18.2 11.3 4.3 10.0 12.0 18.2 14.5 6.8 10.6 10.1 6.4 15.1 15.2 7.8 14.2 15.0 13.1 15.91998 14.2 17.9 11.2 4.1 10.4 11.9 16.1 12.3 6.9 10.5 10.2 6.0 15.0 15.1 7.8 14.3 14.9 12.9 14.91999 14.2 17.7 11.1 4.3 10.3 11.9 16.3 11.9 6.7 10.6 10.1 6.1 15.5 15.1 7.8 14.0 14.0 12.9 14.82000 13.9 17.5 10.9 4.4 10.6 12.0 16.1 12.0 6.6 10.0 10.1 6.3 15.4 14.8 8.0 14.2 14.1 12.1 14.7
2001 14.1 17.3 10.7 4.5 10.7 12.2 16.1 11.8 6.8 9.3 11.0 6.5 13.7 14.9 8.3 14.4 14.3 12.2 14.52002 14.3 17.3 11.0 4.4 11.7 12.1 16.2 11.9 6.8 9.4 10.9 6.4 13.3 14.7 8.4 14.2 14.6 12.0 14.42003 14.2 17.4 10.6 4.4 11.8 12.2 16.4 12.2 7.1 8.9 10.8 6.3 13.8 14.7 8.6 14.2 13.8 11.9 14.62004 13.9 17.0 10.3 4.6 11.3 12.1 16.2 12.3 7.8 8.7 10.8 6.3 13.9 14.7 8.3 14.2 13.2 11.8 14.42005 13.6 16.8 10.3 4.7 11.3 12.1 16.4 12.4 8.3 8.4 10.5 6.2 12.9 14.6 8.4 14.2 12.7 12.1 14.32006 13.5 16.3 10.1 4.8 10.7 12.1 16.5 12.4 7.8 8.7 10.0 6.0 14.0 14.4 8.4 14.0 11.8 12.4 14.22007 13.6 15.5 10.5 5.0 11.2 12.2 16.3 12.9 7.5 8.5 9.9 5.8 13.5 14.2 8.5 13.7 11.7 12.0 13.92008 13.9 15.5 11.6 5.4 11.1 12.3 16.3 13.5 7.8 8.1 10.7 5.9 14.5 14.4 8.8 14.1 11.9 12.2 14.22009 14.4 16.2 13.0 5.7 10.5 12.4 16.8 13.7 8.7 9.1 11.9 5.9 13.8 14.9 9.0 14.9 12.6 12.9 14.62010 14.1 15.8 13.1 5.7 11.1 12.4 16.7 13.5 8.9 8.4 11.1 5.8 14.2 14.8 9.1 15.2 12.3 12.8 14.5
2011 14.3 15.7 11.9 4.8 10.6 12.3 16.8 13.4 8.8 8.5 11.2 6.0 14.8 14.7 9.4 15.0 12.3 12.7 14.52012 14.6 15.8 11.5 4.4 10.8 12.0 17.0 13.5 8.5 8.4 11.6 6.0 16.0 14.9 9.1 15.2 12.6 13.3 14.62013 14.7 15.8 11.3 4.6 10.6 11.7 17.3 13.5 8.9 8.1 11.3 6.1 16.3 15.2 9.3 15.0 13.6 13.4 14.72014 14.4 15.7 11.2 4.7 10.9 11.8 17.4 13.4 9.4 7.9 11.2 6.1 16.3 15.1 9.2 14.9 13.2 13.6 14.72015 14.5 15.5 11.2 4.7 10.6 11.6 17.0 13.3 9.2 7.5 11.3 6.0 16.6 15.0 9.1 14.7 13.2 13.7 14.6
1) 1970-91 D_W 2) Euro area; 1970-91 including D_W
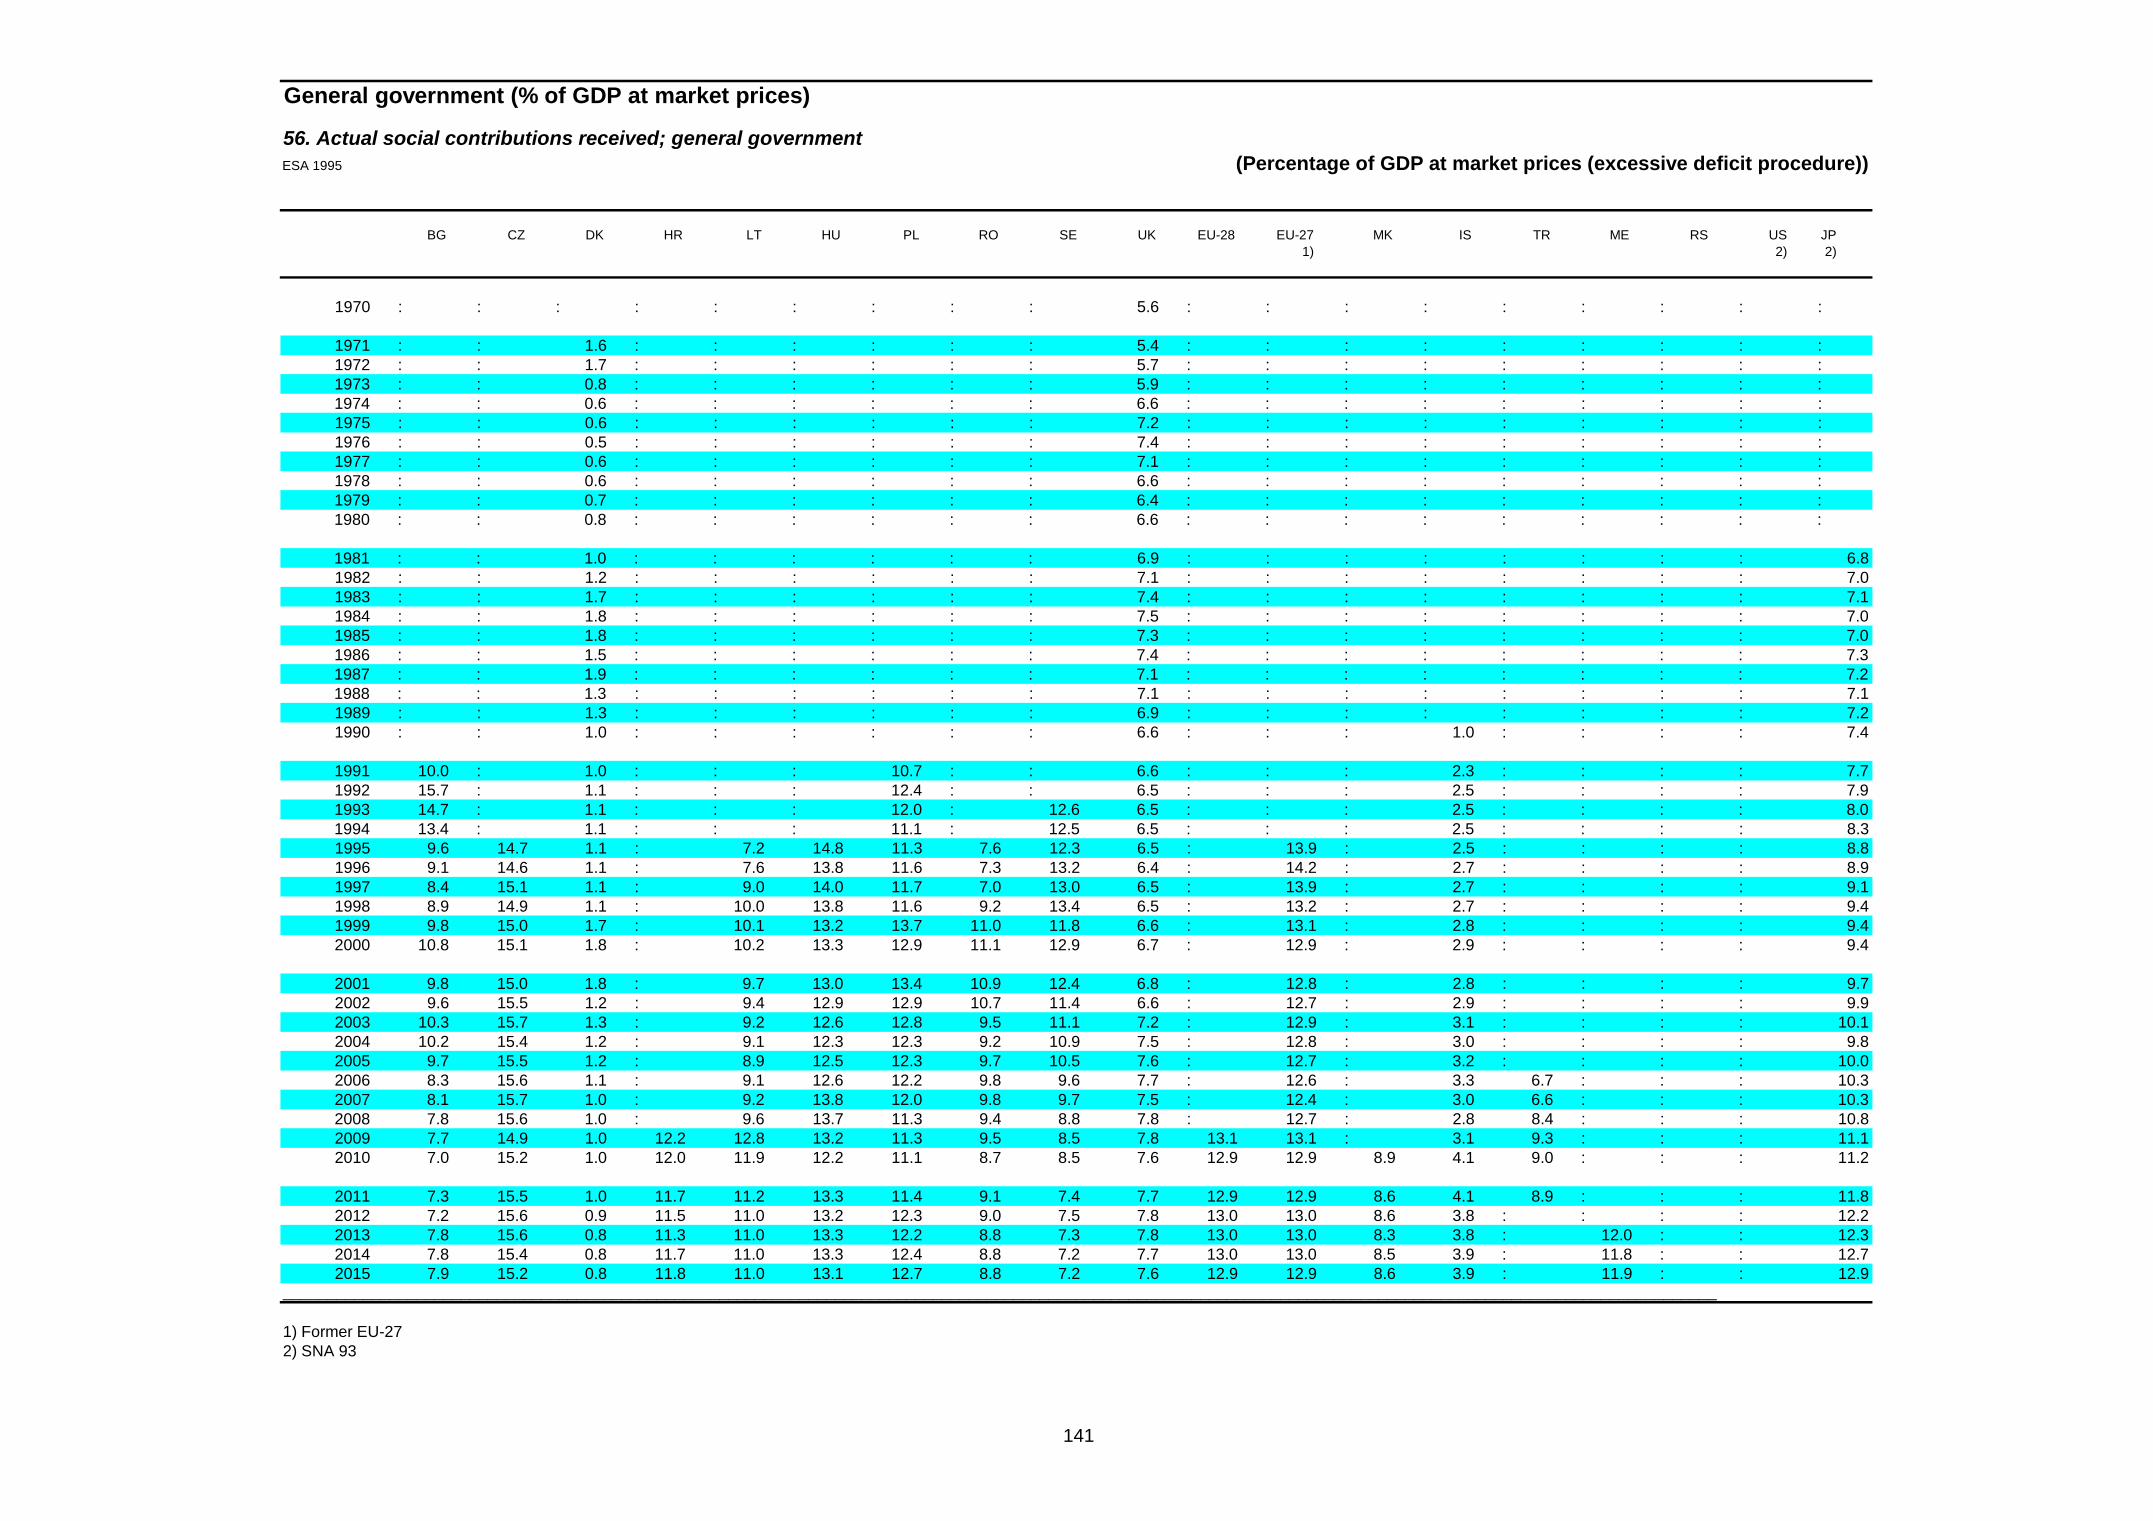
141
General government (% of GDP at market prices)
56. Actual social contributions received; general governmentESA 1995 (Percentage of GDP at market prices (excessive deficit procedure))
BG CZ DK HR LT HU PL RO SE UK EU-28 EU-27 MK IS TR ME RS US JP 1) 2) 2)
1970 : : : : : : : : : 5.6 : : : : : : : : :
1971 : : 1.6 : : : : : : 5.4 : : : : : : : : : 1972 : : 1.7 : : : : : : 5.7 : : : : : : : : : 1973 : : 0.8 : : : : : : 5.9 : : : : : : : : : 1974 : : 0.6 : : : : : : 6.6 : : : : : : : : : 1975 : : 0.6 : : : : : : 7.2 : : : : : : : : : 1976 : : 0.5 : : : : : : 7.4 : : : : : : : : : 1977 : : 0.6 : : : : : : 7.1 : : : : : : : : : 1978 : : 0.6 : : : : : : 6.6 : : : : : : : : : 1979 : : 0.7 : : : : : : 6.4 : : : : : : : : : 1980 : : 0.8 : : : : : : 6.6 : : : : : : : : :
1981 : : 1.0 : : : : : : 6.9 : : : : : : : : 6.81982 : : 1.2 : : : : : : 7.1 : : : : : : : : 7.01983 : : 1.7 : : : : : : 7.4 : : : : : : : : 7.11984 : : 1.8 : : : : : : 7.5 : : : : : : : : 7.01985 : : 1.8 : : : : : : 7.3 : : : : : : : : 7.01986 : : 1.5 : : : : : : 7.4 : : : : : : : : 7.31987 : : 1.9 : : : : : : 7.1 : : : : : : : : 7.21988 : : 1.3 : : : : : : 7.1 : : : : : : : : 7.11989 : : 1.3 : : : : : : 6.9 : : : : : : : : 7.21990 : : 1.0 : : : : : : 6.6 : : : 1.0 : : : : 7.4
1991 10.0 : 1.0 : : : 10.7 : : 6.6 : : : 2.3 : : : : 7.71992 15.7 : 1.1 : : : 12.4 : : 6.5 : : : 2.5 : : : : 7.91993 14.7 : 1.1 : : : 12.0 : 12.6 6.5 : : : 2.5 : : : : 8.01994 13.4 : 1.1 : : : 11.1 : 12.5 6.5 : : : 2.5 : : : : 8.31995 9.6 14.7 1.1 : 7.2 14.8 11.3 7.6 12.3 6.5 : 13.9 : 2.5 : : : : 8.81996 9.1 14.6 1.1 : 7.6 13.8 11.6 7.3 13.2 6.4 : 14.2 : 2.7 : : : : 8.91997 8.4 15.1 1.1 : 9.0 14.0 11.7 7.0 13.0 6.5 : 13.9 : 2.7 : : : : 9.11998 8.9 14.9 1.1 : 10.0 13.8 11.6 9.2 13.4 6.5 : 13.2 : 2.7 : : : : 9.41999 9.8 15.0 1.7 : 10.1 13.2 13.7 11.0 11.8 6.6 : 13.1 : 2.8 : : : : 9.42000 10.8 15.1 1.8 : 10.2 13.3 12.9 11.1 12.9 6.7 : 12.9 : 2.9 : : : : 9.4
2001 9.8 15.0 1.8 : 9.7 13.0 13.4 10.9 12.4 6.8 : 12.8 : 2.8 : : : : 9.72002 9.6 15.5 1.2 : 9.4 12.9 12.9 10.7 11.4 6.6 : 12.7 : 2.9 : : : : 9.92003 10.3 15.7 1.3 : 9.2 12.6 12.8 9.5 11.1 7.2 : 12.9 : 3.1 : : : : 10.12004 10.2 15.4 1.2 : 9.1 12.3 12.3 9.2 10.9 7.5 : 12.8 : 3.0 : : : : 9.82005 9.7 15.5 1.2 : 8.9 12.5 12.3 9.7 10.5 7.6 : 12.7 : 3.2 : : : : 10.02006 8.3 15.6 1.1 : 9.1 12.6 12.2 9.8 9.6 7.7 : 12.6 : 3.3 6.7 : : : 10.32007 8.1 15.7 1.0 : 9.2 13.8 12.0 9.8 9.7 7.5 : 12.4 : 3.0 6.6 : : : 10.32008 7.8 15.6 1.0 : 9.6 13.7 11.3 9.4 8.8 7.8 : 12.7 : 2.8 8.4 : : : 10.82009 7.7 14.9 1.0 12.2 12.8 13.2 11.3 9.5 8.5 7.8 13.1 13.1 : 3.1 9.3 : : : 11.12010 7.0 15.2 1.0 12.0 11.9 12.2 11.1 8.7 8.5 7.6 12.9 12.9 8.9 4.1 9.0 : : : 11.2
2011 7.3 15.5 1.0 11.7 11.2 13.3 11.4 9.1 7.4 7.7 12.9 12.9 8.6 4.1 8.9 : : : 11.82012 7.2 15.6 0.9 11.5 11.0 13.2 12.3 9.0 7.5 7.8 13.0 13.0 8.6 3.8 : : : : 12.22013 7.8 15.6 0.8 11.3 11.0 13.3 12.2 8.8 7.3 7.8 13.0 13.0 8.3 3.8 : 12.0 : : 12.32014 7.8 15.4 0.8 11.7 11.0 13.3 12.4 8.8 7.2 7.7 13.0 13.0 8.5 3.9 : 11.8 : : 12.72015 7.9 15.2 0.8 11.8 11.0 13.1 12.7 8.8 7.2 7.6 12.9 12.9 8.6 3.9 : 11.9 : : 12.9
_________________________________________________________________________________________________________________________________________________________________ 1) Former EU-27 2) SNA 93

142
General government (% of GDP at market prices)
57. Other current revenue including sales; general governmentESA 1995 (Percentage of GDP at market prices (excessive deficit procedure))
BE DE EE IE EL ES FR IT CY LV LU MT NL AT PT SI SK FI EA-18 1) 2)
1970 3.6 4.9 : : : : : : : : : : 5.3 : : : : : :
1971 3.3 5.1 : : : : : : : : : : 4.9 : : : : : : 1972 3.1 5.3 : : : : : : : : : : 5.0 : : : : : : 1973 2.9 5.4 : : : : : : : : : : 4.8 : : : : : : 1974 2.7 5.7 : : : : : : : : : : 5.1 : : : : : : 1975 3.2 5.9 : : : : : : : : : : 5.9 : : : : 4.8 : 1976 3.2 6.1 : : : : : : : : : : 6.8 5.6 : : : 5.2 : 1977 3.1 5.9 : : : : : : : : : : 7.2 5.6 2.4 : : 5.4 : 1978 3.1 5.5 : : : : 4.3 : : : : : 7.1 5.9 2.4 : : 5.9 : 1979 3.1 5.4 : : : : 4.1 : : : : : 7.5 5.9 2.9 : : 5.9 : 1980 3.5 5.5 : : : : 4.4 2.3 : : : : 8.2 6.3 2.2 : : 5.9 :
1981 3.7 5.8 : : : : 4.6 2.4 : : : : 9.3 6.8 2.4 : : 6.2 : 1982 3.9 6.4 : : : : 4.8 2.3 : : : : 9.7 6.7 2.8 : : 6.6 : 1983 3.5 6.3 : : : : 4.9 2.4 : : : : 9.8 6.6 3.2 : : 7.0 : 1984 3.3 6.4 : : : : 4.9 2.6 : : : : 10.4 6.7 3.1 : : 7.3 : 1985 3.2 6.3 : 6.1 : : 5.1 2.7 : : : : 11.2 6.7 2.7 : : 7.6 : 1986 2.8 6.1 : 5.6 : : 5.1 3.3 : : : : 9.5 6.6 3.9 : : 7.7 : 1987 2.6 5.6 : 5.7 : : 5.0 2.7 : : : : 8.2 6.7 4.4 : : 7.7 : 1988 2.5 5.4 : 5.2 2.7 : 4.8 2.6 : : : : 7.4 6.8 4.2 : : 7.6 : 1989 2.5 5.8 : 4.4 2.9 : 4.7 2.7 : : : : 7.4 6.7 4.3 : : 7.7 : 1990 2.7 5.7 : 4.2 3.0 : 4.7 2.9 : : 6.0 : 7.5 6.9 3.6 : : 8.4 :
1991 6.0
1991 3.0 4.2 : 4.9 3.6 : 5.2 3.0 : : 5.4 : 8.1 6.9 4.0 : : 9.9 : 1992 2.9 4.8 : 4.8 4.1 : 5.1 2.9 : : 5.5 : 7.9 7.3 5.3 : : 11.0 : 1993 2.9 4.7 7.9 4.7 4.7 : 5.6 3.1 : : 4.4 : 7.9 7.2 5.1 : 10.5 11.3 : 1994 2.7 4.7 7.5 4.3 5.5 : 5.0 3.3 : 6.2 4.2 : 7.3 7.2 3.5 : 13.9 9.3 : 1995 2.7 4.4 5.6 3.8 5.4 3.9 5.2 3.6 5.6 3.6 4.7 6.8 6.9 7.3 4.4 4.7 4.8 9.8 4.71996 2.8 4.3 4.5 3.8 5.2 3.8 5.2 3.7 5.7 5.0 4.3 5.7 6.8 7.2 4.5 4.9 4.2 9.6 4.61997 2.6 4.0 5.0 3.4 5.5 3.7 5.0 3.6 5.5 3.9 4.6 5.3 6.4 5.7 4.5 5.1 5.2 8.9 4.41998 2.7 3.9 4.1 3.2 4.9 3.5 4.8 3.5 4.9 4.8 4.5 5.3 6.1 5.5 4.3 5.2 3.6 8.4 4.21999 2.6 3.9 3.8 2.8 4.7 3.4 4.6 3.6 4.5 5.0 3.9 5.4 5.7 5.5 4.6 4.9 5.1 7.6 4.12000 2.6 3.8 4.5 2.8 4.4 3.1 4.7 3.3 4.8 4.2 4.1 4.3 5.9 5.5 4.4 5.2 5.6 8.3 4.1
2001 3.0 3.9 4.3 2.7 5.1 3.3 4.9 3.4 5.0 3.9 4.0 4.4 6.3 4.7 4.1 5.5 4.7 8.5 4.22002 2.9 3.9 4.7 2.7 4.0 3.0 4.8 3.3 4.7 4.7 3.7 4.2 5.9 4.7 4.3 5.6 3.6 8.5 4.12003 2.8 3.8 5.2 2.6 3.7 2.8 4.5 3.1 5.7 4.4 3.4 4.5 6.0 4.6 4.2 5.2 4.3 8.7 3.92004 2.5 3.6 4.9 2.7 3.5 2.7 4.6 3.3 5.5 5.8 3.3 4.8 6.2 4.6 4.6 5.0 3.6 9.0 3.92005 2.7 3.9 4.5 2.8 3.5 2.6 4.7 3.0 5.8 5.2 3.2 3.6 6.4 4.6 4.1 4.8 4.0 9.1 4.02006 2.8 3.8 4.9 3.0 3.8 2.8 4.8 3.1 5.8 6.3 3.4 3.4 6.7 4.5 4.5 4.5 4.2 9.5 4.12007 2.7 3.8 4.5 3.0 4.3 3.0 4.9 3.0 4.9 4.4 3.6 3.7 6.5 4.5 4.8 4.3 3.1 9.8 4.12008 3.0 4.0 4.6 3.6 4.8 3.0 5.1 3.1 4.6 4.6 4.0 4.2 7.3 4.2 4.7 4.9 3.7 10.6 4.32009 2.9 4.4 5.9 4.1 4.6 3.2 5.2 3.2 4.9 6.1 3.8 3.5 7.2 4.5 4.6 5.0 4.5 10.5 4.52010 3.1 4.4 5.4 4.8 4.8 3.2 5.1 3.3 5.4 6.6 3.7 3.2 7.0 4.6 4.4 5.8 3.7 10.4 4.5
2011 3.5 4.5 5.1 4.4 5.2 3.2 5.1 3.3 4.8 5.9 3.6 3.3 6.8 4.5 4.6 6.3 4.8 10.4 4.52012 3.6 4.4 5.0 4.4 5.4 3.3 5.0 3.4 4.8 5.6 3.6 3.4 7.2 4.5 4.9 6.7 4.7 10.4 4.52013 3.5 4.3 4.4 4.2 6.5 3.4 5.0 3.6 5.2 5.9 3.4 3.7 7.4 4.4 5.2 6.7 5.2 10.4 4.62014 3.1 4.2 4.7 3.8 6.1 3.3 5.1 3.7 5.9 5.4 3.2 3.6 6.6 4.4 5.3 6.3 5.2 10.6 4.52015 3.0 4.2 4.5 3.7 5.5 3.2 5.3 3.7 4.8 5.0 3.2 3.5 6.4 4.4 5.4 5.9 4.7 10.8 4.5
1) 1970-91 D_W 2) Euro area; 1970-91 including D_W

143
General government (% of GDP at market prices)
57. Other current revenue including sales; general governmentESA 1995 (Percentage of GDP at market prices (excessive deficit procedure))
BG CZ DK HR LT HU PL RO SE UK EU-28 EU-27 MK IS TR ME RS US JP 1)
1970 : : : : : : : : : : : : : : : : : 7.1 :
1971 : : 3.6 : : : : : : : : : : : : : : 7.1 : 1972 : : 3.7 : : : : : : : : : : : : : : 7.1 : 1973 : : 3.2 : : : : : : : : : : : : : : 7.0 : 1974 : : 4.1 : : : : : : : : : : : : : : 7.3 : 1975 : : 4.5 : : : : : : : : : : : : : : 7.3 : 1976 : : 4.7 : : : : : : : : : : : : : : 7.1 : 1977 : : 5.0 : : : : : : : : : : : : : : 7.0 : 1978 : : 5.2 : : : : : : : : : : : : : : 6.9 : 1979 : : 5.5 : : : : : : : : : : : : : : 7.1 : 1980 : : 6.0 : : : : : : : : : : : : : : 7.6 :
1981 : : 6.4 : : : : : : : : : : : : : : 7.8 4.81982 : : 6.6 : : : : : : : : : : : : : : 8.4 4.91983 : : 6.8 : : : : : : : : : : : : : : 8.5 5.01984 : : 7.3 : : : : : : : : : : : : : : 8.4 5.11985 : : 6.8 : : : : : : : : : : : : : : 8.6 5.11986 : : 6.9 : : : : : : 4.5 : : : : : : : 8.8 5.21987 : : 6.6 : : : : : : 4.2 : : : : : : : 8.7 5.31988 : : 7.3 : : : : : : 4.0 : : : : : : : 8.7 5.21989 : : 7.7 : : : : : : 4.1 : : : : : : : 8.7 5.31990 : : 6.5 : : : : : : 3.4 : : : 5.1 : : : 8.9 5.4
1991 : : 6.4 : : : : : : 3.6 : : : 5.5 : : : 9.2 5.51992 : : 7.2 : : : : : : 3.3 : : : 6.1 : : : 9.0 5.51993 : : 7.6 : : : : : 11.6 3.2 : : : 5.9 : : : 9.1 5.51994 : : 6.8 : : : : : 11.3 3.0 : : : 6.2 : : : 9.0 5.91995 6.4 4.2 6.2 : 5.4 5.8 6.0 4.2 9.7 2.9 : 4.6 : 6.3 : : : 9.0 6.01996 5.6 4.3 6.5 : 6.0 6.5 5.2 3.5 9.3 3.0 : 4.6 : 6.2 : : : 8.9 6.11997 6.0 4.3 5.9 : 7.2 5.7 5.2 3.6 8.4 2.8 : 4.3 : 5.9 : : : 8.6 6.11998 8.1 4.6 5.7 : 5.4 5.0 4.5 3.3 8.4 2.8 : 4.1 : 6.4 : : : 8.4 6.21999 8.9 4.3 5.5 : 5.0 4.6 5.4 3.4 7.3 2.9 : 4.1 : 6.3 : : : 8.2 6.32000 9.2 4.0 5.4 : 5.3 4.4 5.4 3.2 7.0 2.8 : 4.0 : 6.3 : : : 8.3 6.2
2001 10.9 4.3 5.8 : 4.1 4.5 6.4 3.7 6.6 3.1 : 4.2 : 6.5 : : : 8.4 6.12002 9.9 4.3 5.7 : 3.8 4.0 6.4 4.4 6.5 2.8 : 4.0 : 6.4 : : : 8.3 6.02003 7.7 4.4 5.7 : 3.2 3.9 6.0 3.8 6.4 2.7 : 3.9 : 6.1 : : : 8.2 5.72004 7.9 4.4 5.9 : 2.9 4.7 5.5 4.2 6.3 3.0 : 3.9 : 6.2 : : : 8.2 5.62005 7.0 4.1 5.7 : 3.6 4.4 5.9 3.6 6.7 3.2 : 4.0 : 6.5 : : : 8.2 5.92006 5.5 4.0 5.7 : 2.7 4.8 5.8 4.0 6.4 3.3 : 4.1 : 6.5 8.3 : : 8.4 6.12007 6.4 4.0 5.5 : 2.7 4.6 5.2 4.6 6.8 3.4 : 4.1 : 7.1 7.2 : : 8.5 6.12008 7.6 4.0 5.9 : 2.8 4.9 5.0 4.3 7.1 3.6 : 4.3 : 7.5 6.2 : : 8.6 6.12009 7.4 4.3 6.4 4.2 3.2 5.5 5.0 4.3 7.0 3.7 4.5 4.5 : 7.2 7.1 : : 9.2 6.22010 5.8 4.3 6.3 4.0 3.7 5.5 4.7 5.2 6.5 3.3 4.4 4.4 5.0 6.5 6.6 : : 9.1 5.8
2011 5.5 4.3 6.4 4.5 3.5 5.1 4.4 4.9 6.5 3.1 4.4 4.4 3.4 5.9 6.4 : : 9.1 5.92012 6.0 4.3 6.1 4.0 3.5 5.3 4.6 4.6 6.4 3.1 4.4 4.4 3.4 6.8 : : : 8.8 5.72013 6.8 4.6 5.5 4.6 3.3 5.7 4.6 4.6 6.4 4.1 4.6 4.6 3.4 7.0 : : : : : 2014 7.0 4.4 5.3 5.0 3.3 5.7 4.4 4.6 6.1 3.8 4.5 4.5 3.4 : : : : : : 2015 7.0 4.3 5.1 5.5 3.2 5.5 4.3 4.7 6.0 3.8 4.5 4.5 3.4 : : : : : :
_________________________________________________________________________________________________________________________________________________________________ 1) Former EU-27

144
General government (% of GDP at market prices)
58. Total current revenue; general governmentESA 1995 (Percentage of GDP at market prices (excessive deficit procedure))
BE DE EE IE EL ES FR IT CY LV LU MT NL AT PT SI SK FI EA-18 1) 2)
1970 37.7 37.5 : : : : : : : : : : 41.2 : : : : : :
1971 38.3 38.4 : : : : : : : : : : 42.5 : : : : : : 1972 38.3 38.8 : : : : : : : : : : 43.8 : : : : : : 1973 39.3 40.7 : : : : : : : : : : 45.0 : : : : : : 1974 40.2 41.0 : : : : : : : : : : 44.8 : : : : : : 1975 43.1 40.9 : : : : : : : : : : 47.8 : : : : 43.4 : 1976 43.2 42.3 : : : : : : : : : : 48.5 43.7 : : : 47.4 : 1977 45.0 43.1 : : : : : : : : : : 50.1 44.7 25.7 : : 47.9 : 1978 45.9 42.8 : : : : 43.0 : : : : : 50.3 47.2 24.2 : : 45.1 : 1979 46.1 42.5 : : : : 44.7 : : : : : 51.0 46.5 24.5 : : 43.7 : 1980 45.1 42.8 : : : : 45.7 33.4 : : : : 51.0 47.4 25.3 : : 43.9 :
1981 45.7 42.6 : : : : 46.1 33.3 : : : : 51.3 48.9 26.8 : : 46.3 : 1982 46.9 43.1 : : : : 47.3 35.7 : : : : 52.7 47.9 28.5 : : 45.9 : 1983 47.3 42.7 : : : : 47.7 37.5 : : : : 53.6 47.4 29.5 : : 46.0 : 1984 47.9 42.9 : : : : 48.7 37.0 : : : : 52.4 49.1 28.7 : : 47.8 : 1985 48.0 43.2 : 41.0 : : 48.8 37.0 : : : : 53.4 49.9 28.7 : : 49.7 : 1986 47.3 42.5 : 41.1 : : 47.9 38.0 : : : : 52.1 49.7 30.8 : : 51.0 : 1987 47.6 42.4 : 41.3 : : 48.2 37.9 : : : : 52.8 49.3 30.0 : : 49.5 : 1988 46.3 41.8 : 42.1 28.4 : 47.1 38.9 : : : : 51.9 49.5 31.6 : : 51.7 : 1989 44.4 42.4 : 38.4 27.9 : 46.8 39.7 : : : : 49.1 48.4 32.0 : : 51.4 : 1990 45.2 41.0 : 38.1 30.1 : 47.1 41.0 : : 41.9 : 49.3 48.8 31.1 : : 53.4 :
1991 42.1
1991 45.7 43.1 : 39.4 31.1 : 47.4 42.0 : : 38.9 : 51.9 49.5 32.7 : : 56.0 : 1992 45.3 44.4 : 39.8 32.0 : 47.3 42.6 : : 39.7 : 51.2 51.2 36.2 : : 56.8 : 1993 47.0 44.8 46.0 39.6 33.2 : 48.5 45.1 : : 41.1 : 52.6 51.8 34.9 : 46.1 56.4 : 1994 47.0 45.2 47.1 40.1 35.1 : 48.4 43.8 : 36.0 41.2 : 49.6 50.9 33.7 : 49.6 56.7 : 1995 47.1 44.9 41.9 36.9 35.6 36.5 48.7 43.9 32.4 36.7 41.9 34.1 46.9 50.2 35.3 43.9 45.2 55.2 45.01996 47.9 45.3 38.8 37.3 35.8 37.1 50.2 44.8 32.1 35.9 42.2 31.2 47.0 51.6 36.3 42.9 43.7 56.4 45.71997 48.3 45.0 39.3 36.3 37.4 37.1 50.1 46.3 31.3 35.9 44.1 33.0 46.0 51.3 36.2 42.0 42.6 55.0 45.71998 48.9 45.2 38.1 35.2 38.7 37.3 49.9 45.3 32.4 37.6 44.2 31.2 45.4 51.1 36.4 42.7 40.4 54.3 45.61999 48.8 46.2 36.4 35.0 39.6 37.7 50.5 45.4 32.3 37.0 42.4 33.6 46.0 50.8 37.3 42.9 40.5 53.1 46.02000 48.5 45.8 35.5 34.6 40.5 37.6 49.8 44.5 34.6 34.1 43.4 32.6 45.7 49.9 37.4 42.6 39.8 55.0 45.6
2001 48.9 44.1 34.6 33.0 39.8 37.4 49.8 44.2 35.6 32.8 44.1 34.6 44.7 50.9 36.9 43.1 37.8 52.7 44.82002 49.1 43.7 35.7 31.9 39.4 37.8 49.2 43.5 35.5 33.4 43.5 35.5 43.7 49.6 38.1 43.6 36.7 52.7 44.32003 48.4 43.9 36.1 32.4 37.7 37.3 48.8 42.8 37.9 33.2 42.0 36.1 43.6 49.4 38.5 43.4 37.3 52.4 44.02004 48.1 42.9 35.3 33.9 36.8 37.9 49.1 43.1 37.5 34.3 41.2 37.1 44.0 49.0 38.1 43.3 35.1 52.1 43.82005 48.3 43.1 34.9 34.4 37.4 38.9 49.6 43.0 39.7 34.3 41.3 37.2 44.1 48.0 38.7 43.5 35.2 52.6 44.12006 48.0 43.3 35.3 36.0 36.7 40.0 50.1 44.7 41.3 36.6 39.8 37.2 45.7 47.3 39.7 42.8 33.3 52.9 44.82007 47.4 43.3 35.6 35.3 38.1 40.6 49.5 45.8 44.8 34.6 39.7 38.2 45.1 47.4 40.4 41.9 32.2 52.4 44.82008 48.0 43.6 36.3 34.2 38.4 36.6 49.7 45.7 43.0 33.8 42.1 37.9 46.4 48.2 40.4 42.1 32.6 53.1 44.62009 47.4 44.8 41.1 33.4 36.9 35.1 49.0 45.4 40.0 33.4 44.3 37.8 45.5 48.4 38.9 42.2 33.1 53.0 44.42010 47.9 43.3 39.3 33.9 38.3 36.6 49.3 45.7 40.8 33.8 42.5 36.0 46.0 48.2 38.8 43.5 31.7 52.6 44.4
2011 48.7 43.9 37.3 33.4 39.8 36.2 50.4 45.4 39.9 33.3 42.6 36.8 45.3 48.2 40.5 43.5 33.4 53.7 44.82012 50.0 44.4 37.3 33.9 41.9 37.0 51.5 47.3 39.3 33.4 43.7 37.7 46.1 49.0 39.4 44.3 32.9 54.1 45.82013 50.8 44.3 36.7 35.2 42.4 37.4 52.5 47.2 40.3 33.5 43.4 38.9 47.0 49.4 42.8 44.3 35.2 55.6 46.32014 50.0 44.1 36.7 34.8 43.5 38.0 52.6 47.2 41.3 33.0 42.7 39.2 46.7 49.4 42.0 44.3 34.8 55.9 46.32015 50.3 44.0 36.3 34.7 42.7 36.7 52.4 47.2 40.0 32.1 42.4 38.9 47.4 49.3 42.1 43.7 34.4 56.6 46.1
1) 1970-91 D_W 2) Euro area; 1970-91 including D_W

145
General government (% of GDP at market prices)
58. Total current revenue; general governmentESA 1995 (Percentage of GDP at market prices (excessive deficit procedure))
BG CZ DK HR LT HU PL RO SE UK EU-28 EU-27 MK IS TR ME RS US JP 1) 2) 2)
1970 : : : : : : : : : : : : : : : : : 30.1 :
1971 : : 46.8 : : : : : : : : : : : : : : 29.4 : 1972 : : 46.8 : : : : : : : : : : : : : : 30.3 : 1973 : : 44.1 : : : : : : : : : : : : : : 30.5 : 1974 : : 46.9 : : : : : : : : : : : : : : 31.2 : 1975 : : 43.6 : : : : : : : : : : : : : : 29.6 : 1976 : : 44.7 : : : : : : : : : : : : : : 30.2 : 1977 : : 45.4 : : : : : : : : : : : : : : 30.3 : 1978 : : 47.0 : : : : : : : : : : : : : : 30.4 : 1979 : : 48.3 : : : : : : : : : : : : : : 30.6 : 1980 : : 49.8 : : : : : : : : : : : : : : 31.0 :
1981 : : 49.9 : : : : : : : : : : : : : : 31.7 29.71982 : : 49.2 : : : : : : : : : : : : : : 31.3 30.01983 : : 51.3 : : : : : : : : : : : : : : 30.7 30.11984 : : 52.8 : : : : : : : : : : : : : : 30.6 30.71985 : : 53.6 : : : : : : : : : : : : : : 31.0 31.01986 : : 55.2 : : : : : : 41.6 : : : : : : : 31.2 31.01987 : : 56.0 : : : : : : 40.4 : : : : : : : 31.9 32.31988 : : 57.2 : : : : : : 40.2 : : : : : : : 31.7 32.41989 : : 56.2 : : : : : : 39.9 : : : : : : : 31.8 32.41990 : : 53.5 : : : : : : 38.7 : : : 38.1 : : : 31.7 33.3
1991 : : 52.7 : : : : : : 39.0 : : : 39.8 : : : 31.6 33.11992 : : 54.1 : : : : : : 37.7 : : : 40.8 : : : 31.2 32.91993 : : 55.9 : : : : : 60.4 36.2 : : : 39.0 : : : 31.3 31.71994 : : 56.4 : : : : : 60.4 36.6 : : : 38.6 : : : 31.5 31.31995 37.4 39.7 55.8 : 32.9 46.8 43.2 31.9 57.4 37.0 : 44.4 : 39.6 : : : 31.8 31.51996 37.6 38.4 56.5 : 33.1 46.5 42.6 29.6 59.4 37.1 : 45.0 : 40.5 : : : 32.1 32.01997 34.7 38.9 55.6 : 38.5 44.0 41.8 30.2 58.8 37.4 : 44.8 : 40.5 : : : 32.3 32.21998 39.5 38.0 55.8 : 38.1 43.2 40.1 32.5 59.5 38.6 : 44.8 : 40.8 : : : 32.5 31.91999 39.9 38.5 56.2 : 37.9 43.6 40.4 34.8 58.7 39.2 : 45.2 : 43.1 : : : 32.5 31.82000 40.6 37.9 55.3 : 36.5 44.3 38.1 33.8 58.5 39.7 : 44.8 : 43.4 : : : 32.8 32.1
2001 41.5 38.0 54.9 : 33.8 43.2 38.5 32.6 55.9 40.0 : 44.2 : 41.8 : : : 31.8 32.92002 38.2 38.9 54.2 : 33.0 42.0 39.3 32.9 53.9 38.5 : 43.5 : 41.6 : : : 29.4 31.62003 38.6 39.9 54.5 : 32.1 42.0 38.4 31.9 54.2 38.0 : 43.2 : 42.7 : : : 28.8 31.12004 40.2 40.1 55.6 : 32.0 42.2 37.2 31.9 54.4 38.8 : 43.2 : 44.0 : : : 29.0 30.62005 38.0 39.4 57.2 : 32.7 41.5 38.8 32.1 55.7 39.6 : 43.6 : 47.0 : : : 30.4 32.02006 35.8 39.0 55.9 : 32.7 41.8 39.7 33.2 54.9 40.4 : 44.2 : 47.9 33.6 : : 31.3 33.62007 38.9 39.5 55.0 : 32.8 44.7 39.8 34.1 54.4 40.1 : 44.1 : 47.6 32.9 : : 31.6 34.02008 38.9 38.2 54.2 : 33.5 44.9 39.1 32.8 53.8 40.3 : 44.0 : 44.1 33.9 : : 30.2 34.52009 35.9 37.5 54.8 40.7 33.8 45.4 36.6 31.8 53.9 39.2 43.7 43.7 : 41.0 36.5 : : 28.4 32.72010 32.8 37.6 54.5 40.4 32.4 42.8 36.3 32.6 52.2 39.6 43.6 43.6 30.4 41.4 37.0 : : 28.8 32.6
2011 32.3 38.6 54.8 40.0 30.9 41.7 36.6 33.2 51.4 40.1 44.0 44.0 29.2 41.8 36.4 : : 29.1 33.82012 33.3 39.2 55.0 39.9 30.7 43.8 37.0 32.8 50.8 39.9 44.7 44.7 29.4 43.5 : : : 29.1 34.22013 34.9 39.9 55.7 40.8 30.6 44.3 36.5 32.1 51.2 41.0 45.2 45.2 29.3 44.1 : : : 30.8 34.62014 35.1 39.3 55.0 41.9 30.4 44.1 36.6 32.0 50.7 40.2 45.0 45.0 29.4 43.8 : : : 31.3 36.02015 35.3 38.6 52.6 42.6 30.1 43.4 36.8 32.2 50.5 39.8 44.7 44.8 29.8 42.9 : : : 31.9 36.6
_________________________________________________________________________________________________________________________________________________________________ 1) Former EU-27 2) SNA 93

146
General government (% of GDP at market prices)
59. Final consumption expenditure of general governmentESA 1995 (Percentage of GDP at market prices (excessive deficit procedure))
BE DE EE IE EL ES FR IT CY LV LU MT NL AT PT SI SK FI EA-18 1) 2)
1970 16.0 15.3 : : : : : : : : : : 19.4 : : : : : :
1971 17.1 16.3 : : : : : : : : : : 20.2 : : : : : : 1972 17.7 16.7 : : : : : : : : : : 20.9 : : : : : : 1973 18.0 17.3 : : : : : : : : : : 20.8 : : : : : : 1974 18.5 18.6 : : : : : : : : : : 21.0 : : : : : : 1975 20.6 19.7 : : : : : : : : : : 22.9 : : : : 17.5 : 1976 20.7 19.2 : : : : : : : : : : 23.0 17.8 : : : 18.6 : 1977 21.2 19.2 : : : : : : : : : : 23.7 17.6 13.1 : : 19.1 : 1978 22.1 19.3 : : : : 20.8 : : : : : 24.1 18.3 12.7 : : 18.7 : 1979 22.3 19.2 : : : : 20.8 : : : : : 24.7 18.1 12.2 : : 18.3 : 1980 22.3 19.6 : : : : 21.4 16.9 : : : : 24.5 18.2 13.3 : : 18.4 :
1981 23.5 20.2 : : : : 22.2 18.2 : : : : 24.5 18.6 13.2 : : 19.0 : 1982 23.2 19.9 : : : : 22.7 18.3 : : : : 25.0 19.0 13.2 : : 19.2 : 1983 22.9 19.6 : : : : 22.8 18.7 : : : : 24.9 19.0 12.8 : : 19.6 : 1984 22.9 19.4 : : : : 23.0 18.5 : : : : 23.4 19.0 12.6 : : 19.6 : 1985 22.8 19.4 : 18.1 : : 23.1 18.6 : : : : 23.7 19.2 13.1 : : 20.6 : 1986 22.7 19.3 : 18.3 : : 22.8 18.3 : : : : 23.7 19.5 13.4 : : 20.8 : 1987 22.4 19.5 : 17.3 : : 22.6 19.0 : : : : 24.6 19.4 12.9 : : 21.2 : 1988 21.0 19.2 : 16.0 12.8 : 22.2 19.4 : : : : 24.0 19.2 13.4 : : 20.5 : 1989 19.9 18.3 : 14.9 13.5 : 21.7 19.3 : : : : 23.2 18.8 14.0 : : 20.2 : 1990 19.7 18.0 : 16.2 13.5 : 21.7 20.0 : 7.6 15.1 : 23.0 18.6 14.5 : : 21.8 :
1991 17.3
1991 20.6 18.8 : 17.1 12.4 : 22.2 20.1 : 9.1 14.6 : 23.2 18.8 16.1 : : 24.9 : 1992 20.9 19.3 : 17.5 12.3 : 22.8 20.0 : 10.6 15.1 : 23.8 19.1 16.2 : : 25.4 : 1993 21.2 19.4 19.9 17.3 12.8 : 24.0 19.8 : 17.8 15.0 : 24.1 20.0 16.8 : 24.0 24.2 : 1994 21.2 19.3 22.6 17.1 12.4 : 23.7 19.1 : 17.8 14.6 : 23.9 20.1 16.7 : 20.6 23.5 : 1995 21.4 19.4 25.5 17.5 16.1 18.0 23.6 17.8 13.7 22.6 15.9 18.0 23.8 20.3 17.5 18.4 21.7 22.7 20.31996 21.8 19.7 23.2 16.8 15.5 17.9 23.9 18.1 15.5 21.3 16.4 19.2 22.8 20.2 17.7 18.3 23.9 23.2 20.41997 21.3 19.3 20.9 16.2 16.1 17.4 23.9 18.2 17.1 20.5 16.7 18.6 22.3 19.3 17.7 18.1 21.8 22.5 20.11998 21.2 19.1 20.7 15.4 16.2 17.3 23.1 18.0 16.7 22.6 15.8 18.7 22.2 19.2 17.9 18.1 22.2 21.8 19.81999 21.4 19.2 22.0 14.9 17.0 17.1 23.2 18.1 17.4 22.5 15.5 18.1 22.2 19.6 18.1 18.1 20.1 21.4 19.82000 21.3 19.0 19.8 14.7 18.0 17.1 22.9 18.3 16.2 20.9 15.1 17.8 22.0 19.0 19.0 18.7 20.1 20.6 19.7
2001 21.7 19.0 18.8 15.5 17.5 17.0 22.8 18.8 17.2 20.7 16.1 19.2 22.6 18.7 19.4 19.3 20.6 20.7 19.82002 22.5 19.2 18.4 16.0 18.5 17.1 23.5 19.0 18.2 21.4 16.5 19.2 23.7 18.4 19.7 19.1 20.3 21.4 20.22003 22.9 19.3 18.3 16.1 17.2 17.3 23.8 19.5 19.8 21.8 16.4 19.6 24.5 18.7 20.0 19.0 20.4 22.1 20.52004 22.5 18.9 17.6 16.4 17.4 17.8 23.8 19.7 17.9 19.8 16.9 20.1 24.2 18.4 20.3 18.8 19.0 22.2 20.42005 22.7 18.8 17.2 16.3 19.6 18.0 23.8 20.1 18.0 17.8 16.5 19.1 23.7 18.4 21.1 19.0 18.3 22.5 20.52006 22.4 18.4 16.2 16.5 19.6 18.0 23.5 20.0 18.4 16.8 15.4 19.4 25.1 18.3 20.5 18.8 18.8 22.2 20.32007 22.2 17.9 16.4 17.2 20.5 18.3 23.1 19.5 17.5 17.8 14.5 18.7 25.2 18.0 19.8 17.3 17.1 21.5 20.12008 23.1 18.3 19.3 19.1 21.0 19.5 23.3 20.0 18.0 20.0 15.5 20.4 25.7 18.7 20.1 18.1 17.5 22.5 20.62009 24.7 20.0 21.7 20.5 23.6 21.4 24.5 21.4 20.1 19.6 17.7 20.7 28.6 19.8 22.1 20.2 19.9 25.2 22.32010 24.3 19.5 20.8 19.2 21.5 21.5 24.5 21.1 20.0 18.4 16.9 20.0 28.5 19.5 21.6 20.8 19.3 24.7 22.0
2011 24.4 19.1 19.2 18.4 20.7 21.2 24.2 20.4 20.1 17.7 16.7 20.2 27.9 18.9 19.9 20.8 18.5 24.5 21.52012 25.0 19.3 19.2 18.0 20.9 20.2 24.4 20.0 19.2 16.6 17.4 21.1 28.5 19.0 18.2 20.8 18.1 25.1 21.52013 25.3 19.5 19.5 18.0 20.0 20.1 24.7 19.9 18.6 16.5 17.5 20.8 28.3 19.0 19.0 20.2 18.3 25.7 21.62014 25.0 19.6 19.6 17.1 18.8 19.7 24.6 19.4 18.9 16.6 17.4 20.9 28.0 18.9 17.7 19.8 17.9 25.7 21.42015 25.0 19.6 19.5 16.5 17.7 19.2 24.3 19.3 18.2 16.6 17.9 20.7 27.3 18.6 16.7 19.6 17.6 25.6 21.1
1) 1970-91 D_W 2) Euro area; 1970-91 including D_W

147
General government (% of GDP at market prices)
59. Final consumption expenditure of general governmentESA 1995 (Percentage of GDP at market prices (excessive deficit procedure))
BG CZ DK HR LT HU PL RO SE UK EU-28 EU-27 MK IS TR ME RS US JP 1) 2) 2)
1970 : : : : : : : : : 17.9 : : : : : : : 18.1 :
1971 : : 21.8 : : : : : : 18.2 : : : : : : : 18.1 : 1972 : : 21.8 : : : : : : 18.6 : : : : : : : 17.7 : 1973 : : 21.7 : : : : : : 18.4 : : : : : : : 16.9 : 1974 : : 23.7 : : : : : : 20.1 : : : : : : : 17.2 : 1975 : : 24.9 : : : : : : 22.0 : : : : : : : 17.7 : 1976 : : 24.3 : : : : : : 21.8 : : : : : : : 16.8 : 1977 : : 24.1 : : : : : : 20.4 : : : : : : : 16.4 : 1978 : : 24.7 : : : : : : 20.0 : : : : : : : 15.8 : 1979 : : 25.2 : : : : : : 19.8 : : : : : : : 15.4 : 1980 : : 26.8 : : : : : : 21.2 : : : : : : : 15.9 :
1981 : : 27.9 : : : : : : 21.8 : : : : : : : 15.8 13.91982 : : 28.2 : : : : : : 21.7 : : : : : : : 16.5 14.11983 : : 27.4 : : : : : : 21.5 : : : : : : : 16.3 14.31984 : : 25.9 : : : : : : 21.2 : : : : : : : 15.6 14.11985 : : 25.3 : : : : : : 20.4 : : : : : : : 15.8 13.71986 : : 24.2 : : : : : : 20.4 : : : : : : : 16.0 13.71987 : : 25.3 : : : : : : 19.9 : : : : : : : 15.9 13.81988 : : 25.8 : : : : : : 19.1 : : : : : : : 15.6 13.41989 : : 25.4 : : : : : : 18.9 : : : : : : : 15.6 13.21990 : : 25.1 : 18.2 : : : : 19.3 : : : 19.7 : : : 15.9 13.1
1991 19.0 : 25.3 : 10.3 25.2 20.0 : : 20.2 : : : 20.3 : : : 16.3 13.21992 20.3 : 25.3 : 12.4 26.0 18.9 : : 20.6 : : : 20.9 : : : 16.0 13.61993 18.9 : 26.4 : 14.7 28.0 17.8 : 28.8 19.9 : : : 21.4 : : : 15.6 14.11994 17.2 : 25.5 : 18.6 25.7 15.4 : 27.8 19.3 : : : 21.3 : : : 15.2 14.71995 16.7 20.1 25.2 : 24.5 23.4 18.7 13.1 26.6 19.0 : 20.3 : 22.1 : : : 14.9 15.21996 13.7 19.5 25.4 : 24.4 22.1 18.3 12.6 27.3 18.7 : 20.4 : 21.9 : : : 14.5 15.41997 13.2 20.3 25.0 : 24.3 21.9 17.8 13.5 26.7 17.9 : 20.0 : 21.7 : : : 14.2 15.41998 16.8 19.4 25.6 : 26.0 21.4 17.3 12.7 26.8 17.6 : 19.7 : 22.2 : : : 14.0 15.91999 17.8 20.5 25.7 : 23.8 21.7 17.4 17.4 26.7 18.0 : 19.8 : 22.9 : : : 14.0 16.52000 19.0 20.3 25.1 : 22.6 21.5 17.4 17.5 25.8 18.3 : 19.7 : 23.4 : : : 14.0 16.9
2001 18.8 20.3 25.7 : 21.3 21.4 17.9 16.2 26.3 18.8 : 19.9 : 23.6 : : : 14.5 17.72002 18.9 21.7 26.2 : 20.8 22.2 17.9 15.1 27.0 19.7 : 20.4 : 25.4 : : : 15.0 18.32003 19.9 22.7 26.5 : 19.7 23.5 18.1 17.0 27.3 20.3 : 20.7 : 26.0 : : : 15.2 18.32004 19.4 21.5 26.5 : 19.3 22.4 17.6 15.7 26.5 20.8 : 20.7 : 25.0 : : : 15.2 18.22005 18.3 21.4 26.0 : 18.6 22.6 18.1 17.1 26.2 21.0 : 20.8 : 24.6 : : : 15.1 18.42006 18.0 20.7 25.9 : 19.1 23.0 18.3 16.7 26.0 21.2 : 20.7 : 24.4 11.9 : : 15.1 18.22007 17.2 19.8 26.0 : 17.8 21.6 18.0 16.9 25.5 20.7 : 20.3 : 24.2 13.0 : : 15.3 18.12008 17.1 19.7 26.5 : 19.2 21.8 18.5 17.7 26.1 21.5 : 20.9 : 24.8 13.3 : : 16.1 18.62009 16.8 21.5 29.8 21.1 21.9 22.7 18.5 18.1 27.7 23.2 22.5 22.5 : 26.5 16.3 : : 16.9 19.92010 16.2 21.3 29.0 20.9 20.4 22.0 18.9 16.3 26.7 22.8 22.2 22.2 19.1 26.0 15.5 : : 16.9 19.7
2011 15.7 20.7 28.4 20.7 18.7 21.0 18.0 15.1 26.6 21.7 21.6 21.6 18.3 25.4 14.6 : : 16.3 20.42012 15.5 20.5 28.5 20.5 17.6 20.4 17.8 15.2 26.9 21.8 21.6 21.6 18.5 25.3 : : : 15.7 20.52013 17.1 20.7 28.2 20.4 16.9 20.5 18.0 14.9 27.5 21.3 21.6 21.6 17.5 25.5 : 20.1 : 15.0 20.62014 17.1 20.5 28.1 19.8 16.7 21.0 18.0 14.8 27.4 20.6 21.4 21.4 17.7 24.9 : 18.9 : 14.6 20.62015 17.2 20.2 27.9 19.0 16.3 20.6 18.0 14.6 27.0 19.9 21.0 21.0 17.7 24.7 : 17.8 : 14.3 20.5
_________________________________________________________________________________________________________________________________________________________________ 1) Former EU-27 2) SNA 93

148
General government (% of GDP at market prices)
60. Collective consumption expenditureESA 1995 (Percentage of GDP at market prices (excessive deficit procedure))
BE DE EE IE EL ES FR IT CY LV LU MT NL AT PT SI SK FI EA-18 1) 2)
1970 7.0 8.5 : : : : : : : : : : 10.4 : : : : : :
1971 7.5 9.0 : : : : : : : : : : 10.6 : : : : : : 1972 7.7 9.0 : : : : : : : : : : 10.8 : : : : : : 1973 7.8 9.3 : : : : : : : : : : 10.7 : : : : : : 1974 7.7 9.8 : : : : : : : : : : 10.8 : : : : : : 1975 8.3 10.1 : : : : : : : : : : 11.6 : : : : 7.2 : 1976 8.2 9.6 : : : : : : : : : : 11.6 8.4 : : : 7.3 : 1977 8.5 9.5 : : : : : : : : : : 12.0 8.2 6.0 : : 7.5 : 1978 8.9 9.6 : : : : 8.4 : : : : : 12.1 8.4 6.2 : : 7.3 : 1979 9.1 9.5 : : : : 8.4 : : : : : 12.4 8.4 6.2 : : 7.0 : 1980 9.2 9.7 : : : : 8.7 : : : : : 12.2 8.2 7.0 : : 7.1 :
1981 9.6 10.0 : : : : 9.1 : : : : : 12.2 8.2 6.6 : : 7.3 : 1982 9.4 10.0 : : : : 9.3 : : : : : 12.4 8.5 6.7 : : 7.4 : 1983 9.1 9.8 : : : : 9.4 : : : : : 12.5 8.7 7.6 : : 7.6 : 1984 9.0 9.5 : : : : 9.5 : : : : : 11.6 8.8 6.5 : : 7.3 : 1985 9.2 9.5 : 7.8 : : 9.5 : : : : : 11.8 8.8 5.8 : : 7.5 : 1986 9.3 9.4 : 7.9 : : 9.4 : : : : : 11.6 8.9 6.2 : : 7.5 : 1987 8.9 9.5 : 7.5 : : 9.4 : : : : : 12.0 8.7 5.8 : : 7.6 : 1988 8.2 9.3 : 6.9 8.5 : 9.2 : : : : : 11.8 8.6 5.7 : : 7.3 : 1989 7.8 9.1 : 6.5 9.0 : 8.8 : : : : : 11.4 8.4 6.1 : : 7.1 : 1990 7.6 8.8 : 6.9 9.2 : 8.7 8.2 : 1.9 6.4 : 11.3 8.2 6.3 : : 7.8 :
1991 7.6
1991 8.2 7.9 : 7.4 8.4 : 8.9 8.2 : 2.9 6.1 : 11.3 8.2 7.2 : : 9.1 : 1992 8.2 7.9 : 7.3 8.0 : 9.1 8.1 : 4.3 6.3 : 11.2 8.2 7.1 : : 9.4 : 1993 8.3 8.0 8.3 6.9 7.7 : 9.7 8.2 : 5.6 6.1 : 11.3 8.5 7.0 : 7.8 9.2 : 1994 8.5 7.7 10.3 6.8 7.3 : 9.4 8.2 : 7.1 6.0 : 11.3 8.5 7.3 : 17.0 9.0 : 1995 8.4 7.6 9.7 6.7 10.8 7.8 9.1 7.7 7.4 11.7 6.8 9.1 11.3 8.7 7.6 7.4 17.3 8.5 8.31996 8.5 7.6 9.2 6.5 10.0 7.6 9.4 7.8 8.5 11.1 6.8 9.8 10.9 8.7 7.5 7.5 13.8 8.7 8.31997 8.4 7.4 9.0 6.1 10.2 7.5 9.5 7.7 9.3 10.6 7.1 8.8 10.5 8.5 7.3 7.3 10.0 8.6 8.21998 8.2 7.3 9.2 6.4 10.3 7.4 8.9 7.6 9.1 12.3 6.5 9.1 10.3 8.3 7.4 7.2 10.3 8.1 8.01999 8.4 7.5 9.9 5.9 11.1 7.2 8.9 7.6 9.6 11.8 6.2 8.9 10.3 8.6 7.4 7.3 10.7 8.0 8.12000 8.4 7.4 9.1 5.4 12.0 7.3 8.7 7.6 8.8 10.3 6.3 8.6 10.0 8.2 7.9 7.5 11.3 7.5 8.0
2001 8.4 7.3 8.7 5.6 10.5 7.3 8.5 7.7 9.7 10.6 6.5 10.6 10.3 8.1 8.1 7.8 11.8 7.4 7.92002 8.9 7.4 8.5 5.6 11.3 7.2 8.6 7.8 10.1 10.7 6.8 10.3 10.6 7.8 8.1 7.6 11.5 7.6 8.02003 8.9 7.3 8.7 5.5 9.9 7.3 8.5 8.2 11.0 11.2 6.7 10.7 10.9 7.9 8.2 7.5 12.2 7.8 8.12004 8.6 7.2 7.9 5.4 10.3 7.5 8.5 8.2 9.8 9.9 6.7 10.5 10.7 7.9 8.4 7.5 11.5 7.7 8.12005 8.6 7.0 7.8 5.6 9.4 7.4 8.5 8.3 10.1 9.1 6.5 9.9 10.3 7.8 8.9 7.7 10.9 7.8 8.02006 8.5 6.8 7.3 5.8 9.7 7.5 8.3 8.1 10.2 8.6 6.0 9.7 10.3 7.7 8.8 7.7 11.1 7.6 7.92007 8.3 6.5 7.5 6.1 10.2 7.6 8.1 7.9 9.8 10.1 5.6 9.7 10.2 7.4 8.8 6.9 9.1 7.4 7.72008 8.5 6.7 8.7 7.0 10.4 8.1 8.1 8.2 10.1 11.2 6.0 10.4 10.5 7.8 9.0 7.5 9.1 7.7 8.02009 9.1 7.2 9.6 6.7 12.3 8.7 8.7 8.9 11.3 10.8 6.8 10.2 11.7 8.3 10.0 8.2 10.5 8.6 8.62010 8.8 7.0 9.3 5.7 10.4 8.9 8.6 8.7 11.3 10.3 6.4 9.5 11.4 8.1 9.8 8.4 10.0 8.2 8.4
2011 8.8 6.9 8.5 5.5 9.9 8.9 8.6 8.5 11.3 9.8 6.4 9.4 10.9 7.8 9.1 8.5 9.8 8.0 8.22012 9.0 7.0 8.7 5.2 10.4 8.4 8.6 8.2 10.8 9.1 6.7 9.9 11.0 7.8 8.2 8.5 9.2 8.2 8.22013 9.1 7.0 9.0 5.0 10.3 8.5 8.8 8.2 10.5 9.1 6.6 9.7 10.9 7.8 8.7 8.3 9.1 8.5 8.22014 8.9 7.0 8.9 4.7 9.6 8.4 8.8 7.9 10.7 9.1 6.5 9.8 10.9 7.7 8.1 8.0 9.0 8.6 8.12015 8.9 7.0 8.8 4.4 8.9 8.1 8.6 7.9 10.3 9.1 6.6 9.7 10.8 7.6 7.7 7.8 8.8 8.6 8.0
1) 1970-91 D_W 2) Euro area; 1970-91 including D_W

149
General government (% of GDP at market prices)
60. Collective consumption expenditureESA 1995 (Percentage of GDP at market prices (excessive deficit procedure))
BG CZ DK HR LT HU PL RO SE UK EU-28 EU-27 MK IS TR ME RS US JP 1) 2) 2)
1970 : : : : : : : : : 9.1 : : : : : : : : :
1971 : : 7.2 : : : : : : 9.2 : : : : : : : : : 1972 : : 7.1 : : : : : : 9.4 : : : : : : : : : 1973 : : 6.9 : : : : : : 9.2 : : : : : : : : : 1974 : : 7.7 : : : : : : 9.3 : : : : : : : : : 1975 : : 7.6 : : : : : : 10.0 : : : : : : : : : 1976 : : 7.1 : : : : : : 10.0 : : : : : : : : : 1977 : : 7.4 : : : : : : 9.5 : : : : : : : : : 1978 : : 7.8 : : : : : : 9.7 : : : : : : : : : 1979 : : 7.9 : : : : : : 9.6 : : : : : : : : : 1980 : : 8.6 : : : : : : 10.3 : : : : : : : : :
1981 : : 8.8 : : : : : : 10.5 : : : : : : : : 6.51982 : : 8.7 : : : : : : 10.4 : : : : : : : : 6.51983 : : 8.4 : : : : : : 10.1 : : : : : : : : 6.51984 : : 8.1 : : : : : : 10.1 : : : : : : : : 6.51985 : : 7.9 : : : : : : 9.8 : : : : : : : : 6.21986 : : 7.5 : : : : : : 9.7 : : : : : : : : 6.11987 : : 8.2 : : : : : : 9.0 : : : : : : : : 6.21988 : : 8.2 : : : : : : 8.5 : : : : : : : : 6.01989 : : 8.1 : : : : : : 8.4 : : : : : : : : 5.91990 : : 8.2 : : : : : : 8.6 : : : 8.5 : : : : 6.0
1991 7.7 : 8.3 : : 10.4 10.6 : : 8.8 : : : 8.7 : : : : 6.11992 8.8 : 8.0 : 4.5 11.2 10.0 : : 8.7 : : : 9.0 : : : : 6.21993 8.4 : 8.4 : 8.0 13.6 8.9 : 9.0 8.5 : : : 9.3 : : : : 6.41994 8.3 : 8.2 : 8.5 11.8 6.3 : 8.8 8.1 : : : 9.4 : : : : 6.71995 8.1 9.7 8.1 : 14.2 11.0 7.3 6.5 8.3 8.0 : 8.3 : 8.4 : : : : 6.91996 6.7 9.1 8.1 : 13.8 10.4 7.4 5.7 8.5 7.7 : 8.3 : 8.3 : : : : 7.01997 6.3 9.8 8.0 : 12.8 10.5 7.3 6.4 8.3 7.8 : 8.2 : 8.2 : : : : 7.01998 8.6 9.1 8.1 : 13.3 10.1 7.3 5.8 8.2 7.5 : 7.9 : 8.3 : : : : 7.31999 9.3 10.1 8.1 : 10.1 10.4 7.3 7.8 8.3 7.6 : 8.0 : 8.5 : : : : 7.52000 10.8 10.2 7.9 : 11.6 10.4 7.3 8.9 8.2 7.8 : 8.0 : 8.6 : : : : 7.6
2001 9.9 9.9 8.1 : 10.5 10.3 7.4 7.3 7.6 8.0 : 8.0 : 8.3 : : : : 8.02002 9.8 10.7 8.0 : 9.9 10.5 7.7 6.7 7.6 8.2 : 8.1 : 8.5 : : : : 8.32003 10.2 11.5 8.0 : 9.4 10.6 7.8 7.6 7.6 8.3 : 8.2 : 8.5 : : : : 8.42004 10.2 10.3 8.0 : 9.2 10.0 7.7 7.3 7.4 8.5 : 8.2 : 8.1 : : : : 8.32005 9.9 10.8 7.9 : 8.5 10.0 8.0 8.1 7.1 8.4 : 8.1 : 8.1 : : : : 8.32006 9.7 10.4 7.8 : 9.0 10.5 8.1 7.7 7.1 8.4 : 8.0 : 8.0 6.4 : : : 8.12007 9.6 9.9 7.7 : 8.1 10.1 8.0 8.3 6.9 7.9 : 7.8 : 7.8 6.2 : : : 8.02008 9.5 9.9 7.7 : 8.7 10.1 8.1 7.9 7.1 8.2 : 8.0 : 8.1 6.4 : : : 8.12009 9.3 10.6 8.6 10.4 9.0 10.5 7.9 8.1 7.6 8.6 8.6 8.6 : 8.9 7.2 : : : 8.62010 8.2 10.5 8.2 9.9 8.7 10.7 8.1 7.1 7.4 8.5 8.4 8.4 11.6 8.8 6.9 : : : 8.4
2011 7.8 9.9 8.0 10.1 7.8 10.2 7.6 6.3 7.4 7.9 8.2 8.2 10.6 8.7 6.2 : : : 8.52012 7.8 9.7 8.2 10.1 7.6 9.9 7.5 6.4 7.5 8.0 8.1 8.1 11.1 8.8 : : : : 8.42013 8.8 9.6 7.9 10.0 7.3 10.0 7.6 6.2 7.7 7.8 8.1 8.1 11.2 8.9 : 10.6 : : 8.32014 8.9 9.5 8.0 : 7.4 10.3 7.6 6.1 7.7 7.6 : 8.0 11.6 8.7 : 9.9 : : 8.42015 9.0 9.3 8.0 : 7.2 10.1 7.6 5.9 7.6 7.4 : 7.9 11.4 8.6 : 9.3 : : 8.3
_________________________________________________________________________________________________________________________________________________________________ 1) Former EU-27 2) SNA 93

150
General government (% of GDP at market prices)
61. Social transfers in kindESA 1995 (Percentage of GDP at market prices (excessive deficit procedure))
BE DE EE IE EL ES FR IT CY LV LU MT NL AT PT SI SK FI EA-18 1) 2)
1970 9.0 6.8 : : : : : : : : : : 9.0 : : : : : :
1971 9.6 7.3 : : : : : : : : : : 9.6 : : : : : : 1972 10.1 7.7 : : : : : : : : : : 10.1 : : : : : : 1973 10.2 8.0 : : : : : : : : : : 10.1 : : : : : : 1974 10.8 8.8 : : : : : : : : : : 10.3 : : : : : : 1975 12.2 9.6 : : : : : : : : : : 11.3 : : : : 10.4 : 1976 12.5 9.6 : : : : : : : : : : 11.4 9.4 : : : 11.2 : 1977 12.8 9.6 : : : : : : : : : : 11.8 9.4 7.1 : : 11.5 : 1978 13.1 9.7 : : : : 12.4 : : : : : 12.0 9.9 6.5 : : 11.5 : 1979 13.2 9.7 : : : : 12.3 : : : : : 12.2 9.8 6.0 : : 11.3 : 1980 13.2 9.9 : : : : 12.7 : : : : : 12.2 9.9 6.3 : : 11.3 :
1981 13.9 10.1 : : : : 13.1 : : : : : 12.3 10.4 6.6 : : 11.7 : 1982 13.8 9.9 : : : : 13.4 : : : : : 12.6 10.5 6.5 : : 11.8 : 1983 13.8 9.8 : : : : 13.4 : : : : : 12.4 10.3 5.1 : : 12.0 : 1984 13.9 9.9 : : : : 13.5 : : : : : 11.8 10.3 6.1 : : 12.3 : 1985 13.5 9.9 : 10.2 : : 13.5 : : : : : 12.0 10.5 7.3 : : 13.0 : 1986 13.4 9.8 : 10.4 : : 13.3 : : : : : 12.1 10.6 7.1 : : 13.4 : 1987 13.5 9.9 : 9.8 : : 13.3 : : : : : 12.6 10.7 7.1 : : 13.6 : 1988 12.8 9.9 : 9.1 4.3 : 13.0 : : : : : 12.2 10.6 7.7 : : 13.1 : 1989 12.0 9.3 : 8.5 4.4 : 12.8 : : : : : 11.8 10.5 7.9 : : 13.1 : 1990 12.0 9.2 : 9.3 4.4 : 13.0 11.9 : 5.7 8.7 : 11.7 10.5 8.2 : : 14.0 :
1991 9.7
1991 12.4 10.9 : 9.7 4.1 : 13.3 12.0 : 6.2 8.5 : 11.9 10.6 8.9 : : 15.8 : 1992 12.7 11.4 : 10.2 4.4 : 13.7 11.9 : 6.3 8.9 : 12.6 11.0 9.1 : : 15.9 : 1993 12.9 11.4 11.6 10.4 5.1 : 14.3 11.6 : 12.2 9.0 : 12.7 11.5 9.8 : 16.2 15.0 : 1994 12.7 11.5 12.2 10.3 5.1 : 14.3 10.9 : 10.7 8.6 : 12.6 11.6 9.5 : 3.5 14.5 : 1995 12.9 11.8 15.8 10.8 5.3 10.2 14.5 10.1 6.2 10.9 9.2 8.9 12.5 11.6 9.9 11.1 4.3 14.2 11.91996 13.4 12.1 13.9 10.3 5.5 10.3 14.5 10.3 7.1 10.2 9.6 9.4 11.8 11.5 10.2 10.8 10.1 14.5 12.01997 13.0 11.9 11.9 10.1 5.9 10.0 14.4 10.5 7.8 9.9 9.6 9.8 11.9 10.9 10.4 10.8 11.7 13.9 11.91998 13.0 11.8 11.5 9.1 5.9 9.9 14.2 10.4 7.6 10.3 9.3 9.6 11.9 10.9 10.5 10.8 11.9 13.6 11.81999 13.0 11.8 12.1 9.0 5.9 9.9 14.2 10.5 7.9 10.7 9.3 9.2 12.0 11.0 10.7 10.8 9.4 13.4 11.82000 12.9 11.7 10.6 9.2 6.0 9.9 14.2 10.7 7.4 10.6 8.9 9.2 12.0 10.8 11.0 11.2 8.8 13.1 11.7
2001 13.3 11.7 10.1 10.0 7.0 9.7 14.3 11.1 7.5 10.1 9.6 8.6 12.3 10.5 11.4 11.5 8.8 13.3 11.92002 13.5 11.9 9.9 10.3 7.2 9.9 14.9 11.3 8.1 10.6 9.7 9.0 13.1 10.6 11.6 11.5 8.8 13.8 12.22003 14.0 12.1 9.6 10.7 7.3 10.0 15.3 11.3 8.8 10.5 9.7 8.9 13.6 10.8 11.8 11.4 8.2 14.3 12.42004 14.0 11.7 9.7 10.9 7.1 10.3 15.2 11.4 8.1 9.9 10.2 9.6 13.5 10.6 11.9 11.3 7.5 14.5 12.32005 14.1 11.8 9.4 10.7 10.1 10.5 15.3 11.8 7.9 8.7 10.0 9.1 13.4 10.6 12.2 11.3 7.4 14.7 12.52006 14.0 11.6 8.9 10.7 9.9 10.5 15.1 11.8 8.2 8.3 9.4 9.7 14.8 10.6 11.7 11.1 7.6 14.7 12.52007 13.9 11.4 9.0 11.1 10.2 10.7 15.0 11.6 7.7 7.7 9.0 9.0 15.0 10.6 11.1 10.4 8.0 14.2 12.32008 14.6 11.6 10.6 12.1 10.6 11.4 15.1 11.8 7.9 8.9 9.5 10.0 15.2 10.9 11.1 10.7 8.4 14.8 12.72009 15.6 12.8 12.2 13.8 11.3 12.7 15.8 12.5 8.8 8.8 10.9 10.5 17.0 11.5 12.1 12.0 9.4 16.6 13.72010 15.4 12.5 11.5 13.5 11.1 12.5 15.8 12.4 8.8 8.1 10.5 10.6 17.1 11.4 11.8 12.4 9.3 16.5 13.6
2011 15.6 12.2 10.7 12.9 10.7 12.3 15.6 11.9 8.8 7.9 10.3 10.8 17.1 11.2 10.8 12.4 8.7 16.4 13.32012 16.0 12.3 10.5 12.7 10.5 11.8 15.7 11.8 8.4 7.4 10.7 11.2 17.5 11.2 10.1 12.3 8.8 16.9 13.32013 16.2 12.5 10.5 13.0 9.7 11.6 15.9 11.7 8.1 7.4 10.9 11.0 17.3 11.3 10.2 11.9 9.2 17.2 13.42014 16.0 12.6 10.6 12.4 9.2 11.3 15.9 11.4 8.3 7.5 10.9 11.1 17.1 11.2 9.6 11.8 8.9 17.2 13.32015 16.1 12.6 10.7 12.1 8.9 11.1 15.7 11.4 7.9 7.5 11.3 11.0 16.5 11.0 9.0 11.8 8.8 17.0 13.1
1) 1970-91 D_W 2) Euro area; 1970-91 including D_W

151
General government (% of GDP at market prices)
61. Social transfers in kindESA 1995 (Percentage of GDP at market prices (excessive deficit procedure))
BG CZ DK HR LT HU PL RO SE UK EU-28 EU-27 MK IS TR ME RS US JP 1) 2) 2)
1970 : : : : : : : : : 8.8 : : : : : : : : :
1971 : : 14.6 : : : : : : 9.0 : : : : : : : : : 1972 : : 14.7 : : : : : : 9.2 : : : : : : : : : 1973 : : 14.8 : : : : : : 9.1 : : : : : : : : : 1974 : : 16.0 : : : : : : 10.9 : : : : : : : : : 1975 : : 17.2 : : : : : : 12.0 : : : : : : : : : 1976 : : 17.1 : : : : : : 11.7 : : : : : : : : : 1977 : : 16.7 : : : : : : 10.9 : : : : : : : : : 1978 : : 16.9 : : : : : : 10.4 : : : : : : : : : 1979 : : 17.3 : : : : : : 10.2 : : : : : : : : : 1980 : : 18.2 : : : : : : 11.0 : : : : : : : : :
1981 : : 19.0 : : : : : : 11.4 : : : : : : : : 7.51982 : : 19.5 : : : : : : 11.3 : : : : : : : : 7.61983 : : 19.1 : : : : : : 11.4 : : : : : : : : 7.81984 : : 17.8 : : : : : : 11.1 : : : : : : : : 7.71985 : : 17.5 : : : : : : 10.6 : : : : : : : : 7.51986 : : 16.7 : : : : : : 10.7 : : : : : : : : 7.61987 : : 17.2 : : : : : : 10.9 : : : : : : : : 7.61988 : : 17.6 : : : : : : 10.7 : : : : : : : : 7.41989 : : 17.3 : : : : : : 10.5 : : : : : : : : 7.31990 : : 16.9 : : : : : : 10.7 : : : 11.1 : : : : 7.2
1991 11.3 : 17.0 : : 14.8 9.4 : : 11.4 : : : 11.6 : : : : 7.21992 11.5 : 17.3 : 7.9 14.8 8.9 : : 11.9 : : : 11.9 : : : : 7.41993 10.4 : 18.1 : 6.8 14.4 8.9 : 19.8 11.4 : : : 12.1 : : : : 7.71994 8.9 : 17.3 : 10.2 13.9 9.0 : 19.0 11.2 : : : 11.9 : : : : 8.01995 8.6 10.4 17.1 : 10.3 12.4 11.3 6.6 18.3 11.0 : 12.0 : 13.7 : : : : 8.21996 7.0 10.4 17.3 : 10.5 11.7 10.9 6.9 18.8 11.0 : 12.1 : 13.7 : : : : 8.41997 7.0 10.5 17.0 : 11.5 11.4 10.4 7.2 18.4 10.1 : 11.8 : 13.5 : : : : 8.41998 8.2 10.3 17.5 : 12.7 11.3 10.1 6.9 18.7 10.1 : 11.7 : 13.9 : : : : 8.61999 8.6 10.4 17.7 : 13.6 11.3 10.1 9.6 18.4 10.4 : 11.8 : 14.4 : : : : 8.92000 8.2 10.1 17.2 : 11.0 11.1 10.2 8.6 17.7 10.5 : 11.7 : 14.8 : : : : 9.3
2001 9.0 10.4 17.6 : 10.8 11.1 10.5 9.0 18.7 10.8 : 11.9 : 15.2 : : : : 9.72002 9.1 11.0 18.2 : 10.9 11.7 10.2 8.3 19.4 11.5 : 12.3 : 16.8 : : : : 10.02003 9.7 11.2 18.5 : 10.3 12.8 10.3 9.4 19.6 11.9 : 12.6 : 17.6 : : : : 9.92004 9.2 11.2 18.6 : 10.1 12.4 9.9 8.4 19.1 12.3 : 12.5 : 16.9 : : : : 9.92005 8.4 10.6 18.2 : 10.1 12.7 10.1 9.0 19.0 12.6 : 12.7 : 16.5 : : : : 10.12006 8.3 10.3 18.1 : 10.1 12.5 10.2 9.1 18.9 12.8 : 12.7 : 16.4 5.5 : : : 10.02007 7.7 9.9 18.2 : 9.6 11.6 10.0 8.6 18.6 12.7 : 12.5 : 16.4 6.8 : : : 10.12008 7.6 9.9 18.8 : 10.5 11.7 10.5 9.8 19.0 13.3 : 12.9 : 16.8 7.0 : : : 10.52009 7.5 10.9 21.2 10.7 12.9 12.1 10.7 10.0 20.1 14.6 13.9 13.9 : 17.6 9.1 : : : 11.42010 8.0 10.8 20.7 10.9 11.7 11.3 10.8 9.2 19.2 14.3 13.8 13.8 7.5 17.1 8.7 : : : 11.3
2011 7.9 10.8 20.3 10.6 10.8 10.8 10.4 8.7 19.1 13.8 13.5 13.5 7.7 16.7 8.4 : : : 11.92012 7.8 10.8 20.3 10.5 10.0 10.5 10.3 8.8 19.4 13.8 13.5 13.5 7.4 16.5 : : : : 12.12013 8.3 11.0 20.3 10.4 9.5 10.5 10.5 8.7 19.7 13.5 13.5 13.5 6.3 16.6 : 9.5 : : 12.32014 8.2 11.0 20.1 : 9.3 10.7 10.4 8.7 19.6 13.0 : 13.3 6.1 16.2 : 9.0 : : 12.32015 8.2 11.0 20.0 : 9.1 10.5 10.4 8.6 19.4 12.5 : 13.1 6.3 16.1 : 8.5 : : 12.2
_________________________________________________________________________________________________________________________________________________________________ 1) Former EU-27 2) SNA 93

152
General government (% of GDP at market prices)
62. Compensation of employees; general governmentESA 1995 (Percentage of GDP at market prices (excessive deficit procedure))
BE DE EE IE EL ES FR IT CY LV LU MT NL AT PT SI SK FI EA-18 1) 2)
1970 9.2 8.4 : : : : : : : : : : 12.4 : : : : : :
1971 9.6 9.0 : : : : : : : : : : 12.7 : : : : : : 1972 10.2 9.3 : : : : : : : : : : 13.1 : : : : : : 1973 10.4 9.8 : : : : : : : : : : 13.0 : : : : : : 1974 10.7 10.5 : : : : : : : : : : 13.1 : : : : : : 1975 11.8 10.9 : : : : : : : : : : 14.0 : : : : 12.0 : 1976 11.8 10.6 : : : : : : : : : : 13.9 11.0 : : : 12.9 : 1977 12.1 10.5 : : : : : : : : : : 14.1 10.8 8.9 : : 13.1 : 1978 12.5 10.0 : : : : 12.5 : : : : : 14.2 11.4 9.0 : : 12.9 : 1979 12.8 9.7 : : : : 12.5 : : : : : 14.2 11.2 8.8 : : 12.7 : 1980 12.9 9.7 : : : : 12.7 10.7 : : : : 13.9 11.1 9.1 : : 12.5 :
1981 13.5 9.7 : : : : 13.1 11.7 : : : : 13.6 11.5 9.3 : : 13.0 : 1982 13.3 9.6 : : : : 13.4 11.6 : : : : 13.6 11.7 9.3 : : 13.3 : 1983 12.8 9.5 : : : : 13.4 11.6 : : : : 13.3 11.7 9.2 : : 13.7 : 1984 13.0 9.2 : : : : 13.5 11.5 : : : : 12.5 11.7 9.1 : : 13.8 : 1985 12.3 9.1 : 11.2 : : 13.5 11.3 : : : : 12.2 11.9 9.2 : : 14.4 : 1986 12.2 9.1 : 11.3 : : 13.3 11.3 : : : : 12.1 12.0 9.6 : : 14.5 : 1987 11.7 9.1 : 11.0 : : 13.0 11.5 : : : : 12.2 12.1 9.7 : : 14.7 : 1988 11.1 8.9 : 10.3 10.0 : 12.5 11.6 : : : : 11.7 11.8 10.0 : : 14.3 : 1989 10.9 8.5 : 9.6 10.9 : 12.2 11.5 : : : : 11.1 11.5 10.7 : : 14.0 : 1990 10.9 8.2 : 10.1 11.2 : 12.2 12.2 : 2.9 8.8 : 10.8 11.5 10.8 : : 14.8 :
1991 8.1
1991 11.4 8.8 : 10.7 10.3 : 12.4 12.2 : 4.1 8.4 : 10.7 11.7 11.8 : : 17.2 : 1992 11.5 9.0 : 11.0 9.8 : 12.7 12.1 : 5.9 8.8 : 10.9 11.9 12.7 : : 17.7 : 1993 11.8 9.1 8.6 11.1 9.8 : 13.3 12.0 : 8.5 8.6 : 11.0 12.4 13.0 : 11.0 16.5 : 1994 11.8 8.8 10.4 10.7 9.6 : 13.3 11.6 : 9.4 8.4 : 10.8 12.4 12.5 : 9.3 15.7 : 1995 11.9 8.8 11.8 10.8 10.2 11.2 13.5 10.9 12.7 11.1 8.5 14.2 10.6 12.6 12.5 11.3 9.5 15.1 10.91996 11.9 8.8 11.3 10.4 9.7 11.2 13.7 11.2 13.3 10.9 8.5 14.6 10.1 12.3 12.7 11.2 9.5 15.4 11.01997 11.8 8.7 10.5 9.9 10.4 10.8 13.6 11.4 13.8 10.4 8.8 13.9 9.8 11.5 12.7 11.1 9.3 14.6 10.91998 11.7 8.5 10.5 9.1 10.5 10.6 13.4 10.5 13.5 10.5 8.5 14.0 9.7 11.3 13.0 10.9 9.5 13.9 10.61999 11.7 8.4 11.8 8.7 10.6 10.5 13.5 10.5 13.5 11.2 7.8 13.3 9.7 11.3 13.3 10.9 9.4 13.6 10.62000 11.5 8.3 10.8 8.4 10.6 10.3 13.3 10.4 13.6 10.9 7.5 12.5 9.5 11.0 13.7 11.3 8.8 13.1 10.4
2001 11.7 8.2 10.2 8.9 10.5 10.1 13.2 10.5 13.2 10.4 7.9 14.2 9.6 9.8 13.9 11.7 8.9 13.0 10.42002 12.1 8.2 10.3 9.2 11.2 10.0 13.4 10.6 13.8 10.6 8.1 13.9 9.8 9.5 14.2 11.6 9.1 13.3 10.52003 12.3 8.2 10.2 9.5 10.9 10.0 13.5 10.8 15.6 10.8 8.0 14.1 10.1 9.6 13.6 11.7 8.9 13.7 10.62004 11.9 8.1 10.2 9.7 11.6 10.1 13.3 10.7 15.0 10.5 8.1 14.1 10.0 9.3 13.6 11.6 8.1 13.6 10.52005 12.0 7.9 9.9 10.2 11.6 10.0 13.2 10.9 14.9 10.1 7.9 13.5 9.6 9.3 14.0 11.5 7.3 13.8 10.52006 11.9 7.7 9.3 10.2 11.2 10.0 13.0 10.9 14.9 10.1 7.4 13.0 9.3 9.3 13.1 11.2 7.2 13.5 10.32007 11.8 7.3 9.5 10.5 11.4 10.2 12.8 10.6 14.6 10.7 7.1 12.7 9.1 9.0 12.1 10.5 6.6 12.9 10.12008 12.1 7.4 11.3 11.8 12.0 10.9 12.8 10.8 14.6 12.1 7.5 13.9 9.2 9.2 12.0 11.0 6.8 13.3 10.32009 12.8 8.0 12.7 12.8 13.4 12.0 13.5 11.3 16.2 12.1 8.5 13.9 10.1 9.8 12.7 12.4 7.7 14.8 11.12010 12.6 7.8 11.9 12.2 12.5 12.0 13.4 11.1 15.8 10.2 8.2 13.1 10.1 9.8 12.2 12.7 7.7 14.5 10.9
2011 12.6 7.6 10.9 11.8 12.3 11.8 13.2 10.7 16.1 9.5 8.2 13.0 9.8 9.5 11.3 12.8 7.4 14.2 10.62012 12.9 7.6 10.5 11.5 12.4 11.2 13.2 10.5 15.9 9.1 8.4 13.3 9.8 9.5 10.0 12.7 7.3 14.5 10.52013 13.1 7.6 10.7 11.2 12.0 11.3 13.3 10.5 15.6 9.2 8.4 13.5 9.5 9.4 10.7 12.3 7.6 14.7 10.52014 12.8 7.6 10.5 10.4 11.7 11.1 13.2 10.3 15.2 9.3 8.4 13.3 9.4 9.2 9.5 12.0 7.4 14.6 10.32015 12.8 7.5 10.5 10.0 10.9 10.5 13.0 10.1 14.6 9.3 8.7 13.1 9.3 9.1 9.0 11.8 7.2 14.4 10.1
1) 1970-91 D_W 2) Euro area; 1970-91 including D_W

153
General government (% of GDP at market prices)
62. Compensation of employees; general governmentESA 1995 (Percentage of GDP at market prices (excessive deficit procedure))
BG CZ DK HR LT HU PL RO SE UK EU-28 EU-27 MK IS TR ME RS US JP 1) 2) 2)
1970 : : : : : : : : : 10.7 : : : : : : : 12.2 :
1971 : : 14.3 : : : : : : 11.3 : : : : : : : 12.4 : 1972 : : 14.4 : : : : : : 11.8 : : : : : : : 12.3 : 1973 : : 14.6 : : : : : : 11.6 : : : : : : : 11.9 : 1974 : : 15.7 : : : : : : 12.8 : : : : : : : 11.8 : 1975 : : 16.9 : : : : : : 14.1 : : : : : : : 12.0 : 1976 : : 16.8 : : : : : : 13.7 : : : : : : : 11.5 : 1977 : : 16.4 : : : : : : 12.7 : : : : : : : 11.2 : 1978 : : 16.7 : : : : : : 12.3 : : : : : : : 10.8 : 1979 : : 17.0 : : : : : : 11.9 : : : : : : : 10.4 : 1980 : : 17.7 : : : : : : 12.8 : : : : : : : 10.6 :
1981 : : 18.6 : : : : : : 13.2 : : : : : : : 10.3 6.91982 : : 19.1 : : : : : : 13.0 : : : : : : : 10.7 6.81983 : : 18.7 : : : : : : 12.9 : : : : : : : 10.5 6.71984 : : 17.5 : : : : : : 12.5 : : : : : : : 10.1 6.61985 : : 17.0 : : : : : : 12.0 : : : : : : : 10.2 6.41986 : : 16.4 : : : : : : 12.0 : : : : : : : 10.3 6.41987 : : 17.1 : : : : : : 11.9 : : : : : : : 10.3 6.31988 : : 17.9 : : : : : : 11.5 : : : : : : : 10.2 6.11989 : : 17.6 : : : : : : 11.1 : : : : : : : 10.3 5.91990 : : 17.3 : : : : : : 11.2 : : : 11.4 : : : 10.5 5.8
1991 7.7 : 17.3 : : 12.4 9.7 : : 11.7 : : : 11.9 : : : 10.8 5.81992 10.9 : 17.3 : : 13.4 11.5 : : 12.0 : : : 12.2 : : : 10.9 5.91993 11.7 : 17.8 : 5.8 13.8 10.8 : 18.2 11.5 : : : 12.5 : : : 10.7 6.01994 10.1 : 17.2 : 8.7 13.8 10.0 : 17.3 10.7 : : : 12.4 : : : 10.4 6.11995 9.7 7.0 17.2 : 9.6 11.8 10.7 6.6 16.3 10.4 : 11.1 : 12.8 : : : 10.2 6.21996 8.0 7.2 17.2 : 10.4 10.8 10.5 6.4 16.8 10.3 : 11.2 : 13.0 : : : 9.9 6.21997 7.1 7.1 17.0 : 11.1 10.6 10.5 5.4 16.4 9.9 : 11.0 : 13.2 : : : 9.7 6.21998 9.8 6.6 17.4 : 12.6 10.7 10.0 5.8 15.8 9.5 : 10.7 : 14.2 : : : 9.6 6.41999 10.3 7.0 17.5 : 13.3 10.9 10.1 8.1 15.4 9.5 : 10.6 : 14.5 : : : 9.5 6.52000 10.2 6.8 17.1 : 12.1 10.8 10.1 7.9 15.2 9.6 : 10.5 : 14.6 : : : 9.5 6.5
2001 8.7 7.1 17.4 : 11.7 11.2 10.7 8.3 15.5 10.0 : 10.6 : 14.7 : : : 9.9 6.52002 9.4 7.5 17.8 : 11.3 12.3 10.8 8.5 15.7 10.2 : 10.7 : 15.7 : : : 10.2 6.72003 10.1 8.0 18.0 : 10.8 13.3 10.7 8.2 16.0 10.6 : 10.9 : 16.3 : : : 10.4 6.52004 10.0 7.6 17.8 : 10.8 12.6 10.1 8.1 15.8 10.9 : 10.8 : 15.6 : : : 10.3 6.42005 9.4 7.6 17.3 : 10.3 12.6 10.0 8.7 15.6 11.1 : 10.8 : 15.6 : : : 10.1 6.32006 8.8 7.5 17.0 : 10.4 12.2 9.8 9.3 15.1 11.1 : 10.7 : 15.3 6.6 : : 10.0 6.22007 8.8 7.3 16.8 : 9.9 11.7 9.6 9.7 14.9 10.8 : 10.4 : 14.8 6.9 : : 10.1 6.22008 9.2 7.3 17.1 : 10.7 11.6 10.0 10.5 14.8 10.8 : 10.6 : 14.6 7.8 : : 10.4 6.22009 9.9 7.8 19.4 12.1 12.8 11.5 10.3 10.9 15.2 11.5 11.3 11.3 : 15.0 8.7 : : 11.0 6.52010 9.5 7.5 19.0 12.1 11.0 11.0 10.2 9.7 14.5 11.4 11.1 11.1 5.2 14.8 8.7 : : 11.0 6.1
2011 9.2 7.3 18.5 12.3 10.3 10.3 9.7 7.9 14.0 10.9 10.8 10.8 5.0 14.5 8.5 : : 10.6 6.32012 9.0 7.4 18.3 12.1 9.8 10.1 9.4 7.8 14.3 10.7 10.7 10.7 5.5 14.8 : : : 10.2 6.22013 9.9 7.6 18.2 11.9 9.6 10.3 9.3 8.1 14.4 10.1 10.6 10.6 5.8 14.9 : 12.2 : 9.5 : 2014 9.9 7.5 18.0 11.9 9.5 10.4 9.2 8.1 14.4 9.6 10.4 10.4 6.2 14.8 : 11.9 : 9.3 : 2015 9.9 7.4 17.8 11.6 9.4 10.2 9.2 8.0 14.2 9.3 10.2 10.2 6.5 14.6 : 11.7 : 9.1 :
_________________________________________________________________________________________________________________________________________________________________ 1) Former EU-27 2) SNA 93

154
General government (% of GDP at market prices)
63. Intermediate consumption; general governmentESA 1995 (Percentage of GDP at market prices (excessive deficit procedure))
BE DE EE IE EL ES FR IT CY LV LU MT NL AT PT SI SK FI EA-18 1) 2)
1970 3.3 4.3 : : : : : : : : : : 4.2 : : : : : :
1971 3.6 4.5 : : : : : : : : : : 4.3 : : : : : : 1972 3.5 4.4 : : : : : : : : : : 4.0 : : : : : : 1973 3.3 4.4 : : : : : : : : : : 3.7 : : : : : : 1974 3.3 4.7 : : : : : : : : : : 3.8 : : : : : : 1975 3.8 4.7 : : : : : : : : : : 4.0 : : : : 5.6 : 1976 3.7 4.5 : : : : : : : : : : 4.1 4.7 : : : 5.9 : 1977 3.8 4.6 : : : : : : : : : : 4.4 4.7 2.7 : : 6.2 : 1978 4.1 4.5 : : : : 5.5 : : : : : 4.5 4.7 2.7 : : 6.3 : 1979 4.0 4.5 : : : : 5.3 : : : : : 4.8 4.8 2.7 : : 6.2 : 1980 3.9 4.6 : : : : 5.6 3.7 : : : : 4.9 4.7 3.1 : : 6.4 :
1981 4.0 4.7 : : : : 5.7 3.9 : : : : 5.0 4.9 2.9 : : 6.5 : 1982 3.8 4.7 : : : : 5.9 4.0 : : : : 5.3 5.2 2.9 : : 6.6 : 1983 3.9 4.7 : : : : 5.9 4.4 : : : : 5.7 5.2 2.5 : : 6.8 : 1984 3.7 4.7 : : : : 5.9 4.5 : : : : 5.5 5.3 2.4 : : 6.9 : 1985 4.2 4.6 : 6.6 : : 6.0 4.7 : : : : 5.6 5.3 3.1 : : 7.2 : 1986 4.3 4.6 : 6.9 : : 5.7 4.6 : : : : 5.6 5.3 3.1 : : 7.5 : 1987 4.1 4.6 : 6.2 : : 5.9 4.9 : : : : 6.2 5.1 2.9 : : 7.7 : 1988 3.8 4.4 : 5.6 3.4 : 5.9 5.0 : : : : 6.2 5.1 2.7 : : 7.3 : 1989 3.1 4.4 : 5.3 3.4 : 5.6 5.0 : : : : 6.2 5.0 2.9 : : 7.1 : 1990 2.9 4.3 : 5.6 3.2 : 5.6 4.9 : 4.7 2.5 : 6.2 5.0 2.9 : : 7.8 :
1991 3.6
1991 3.1 4.3 : 5.8 3.2 : 5.8 5.0 : 5.1 2.5 : 6.3 5.1 3.5 : : 8.9 : 1992 3.1 4.2 : 6.0 3.6 : 5.8 5.1 : 4.5 2.5 : 6.3 5.2 2.8 : : 9.3 : 1993 3.1 4.2 8.8 5.7 4.1 : 6.3 5.2 : 7.8 2.5 : 6.6 5.5 3.0 : 12.5 9.1 : 1994 3.2 4.0 9.4 5.9 4.0 : 5.8 5.2 : 9.6 2.4 : 6.6 5.7 3.2 : 8.3 9.1 : 1995 3.1 4.0 11.5 5.9 5.1 4.5 5.7 4.7 2.7 8.4 3.5 4.7 6.6 5.9 4.2 6.6 8.7 8.9 4.81996 3.3 4.0 10.4 5.6 4.9 4.3 5.8 4.7 3.8 7.3 3.5 4.7 6.7 6.0 4.3 6.7 9.7 9.1 4.91997 3.3 3.9 9.6 5.5 4.7 4.4 5.8 4.7 4.8 7.3 3.6 4.7 6.5 5.1 4.2 6.4 8.4 9.0 4.81998 3.3 3.9 9.1 5.5 4.8 4.2 5.3 4.7 4.8 7.7 3.2 4.4 6.4 5.1 4.1 6.5 7.8 8.6 4.71999 3.3 4.1 9.1 5.4 5.4 4.2 5.2 4.8 5.5 7.6 3.1 4.2 6.6 5.3 4.2 6.5 6.2 8.4 4.82000 3.3 3.9 8.2 5.3 6.5 4.3 5.2 4.9 4.1 7.0 3.2 4.7 6.5 4.9 4.5 6.6 6.8 8.1 4.8
2001 3.4 4.0 7.8 5.5 6.2 4.3 5.0 5.0 5.4 7.7 3.2 4.2 6.9 4.3 4.5 6.6 6.8 8.1 4.82002 3.8 4.1 7.7 5.6 6.6 4.4 5.2 5.1 6.1 8.0 3.4 4.5 7.1 4.3 4.4 6.8 6.2 8.6 4.92003 3.7 4.1 7.9 5.5 6.1 4.6 5.2 5.2 6.0 8.7 3.4 4.8 7.3 4.4 4.1 6.3 6.2 9.0 5.02004 3.7 4.1 7.0 5.6 5.5 4.8 5.3 5.3 4.6 8.7 3.4 5.3 7.2 4.4 4.2 6.1 5.7 9.2 5.02005 3.6 4.2 6.9 5.0 5.6 5.0 5.3 5.4 4.8 7.1 3.4 4.8 7.1 4.4 4.5 6.2 5.0 9.4 5.02006 3.6 4.2 6.5 5.1 5.9 5.0 5.2 5.1 5.2 6.8 3.1 5.5 7.2 4.3 4.3 6.2 5.7 9.4 5.02007 3.5 4.1 6.2 5.3 6.7 5.3 5.0 5.1 4.8 6.1 2.9 5.3 7.2 4.2 4.4 5.6 4.6 9.3 5.02008 3.6 4.4 7.0 5.7 6.5 5.5 5.1 5.4 5.0 6.9 3.3 6.4 7.4 4.5 4.4 6.0 4.5 10.0 5.22009 3.8 4.9 7.6 6.3 7.4 5.9 5.6 5.9 5.4 6.4 3.9 5.8 8.3 4.7 5.0 6.5 5.4 11.4 5.72010 3.7 4.9 7.5 5.9 6.1 5.9 5.8 5.8 5.6 6.9 3.7 5.8 8.0 4.5 5.2 6.8 4.9 11.5 5.7
2011 3.7 4.8 7.0 5.4 4.7 6.0 5.5 5.8 5.3 6.9 3.6 6.2 7.6 4.3 4.6 6.9 4.8 11.5 5.52012 3.7 4.9 7.1 5.2 5.0 5.7 5.7 5.6 4.9 6.4 3.8 6.7 7.6 4.4 4.5 6.9 4.7 11.8 5.52013 3.7 4.9 7.2 5.1 4.5 5.5 5.7 5.6 4.5 6.4 3.8 6.3 7.7 4.4 4.4 6.7 4.6 12.1 5.52014 3.6 4.9 7.6 4.9 4.5 5.3 5.6 5.3 5.1 6.5 3.7 6.5 6.9 4.4 4.6 6.6 4.5 12.4 5.42015 3.5 5.0 7.4 4.6 4.0 5.3 5.6 5.4 5.0 6.5 3.8 6.6 7.0 4.4 4.5 6.5 4.4 12.6 5.4
1) 1970-91 D_W 2) Euro area; 1970-91 including D_W
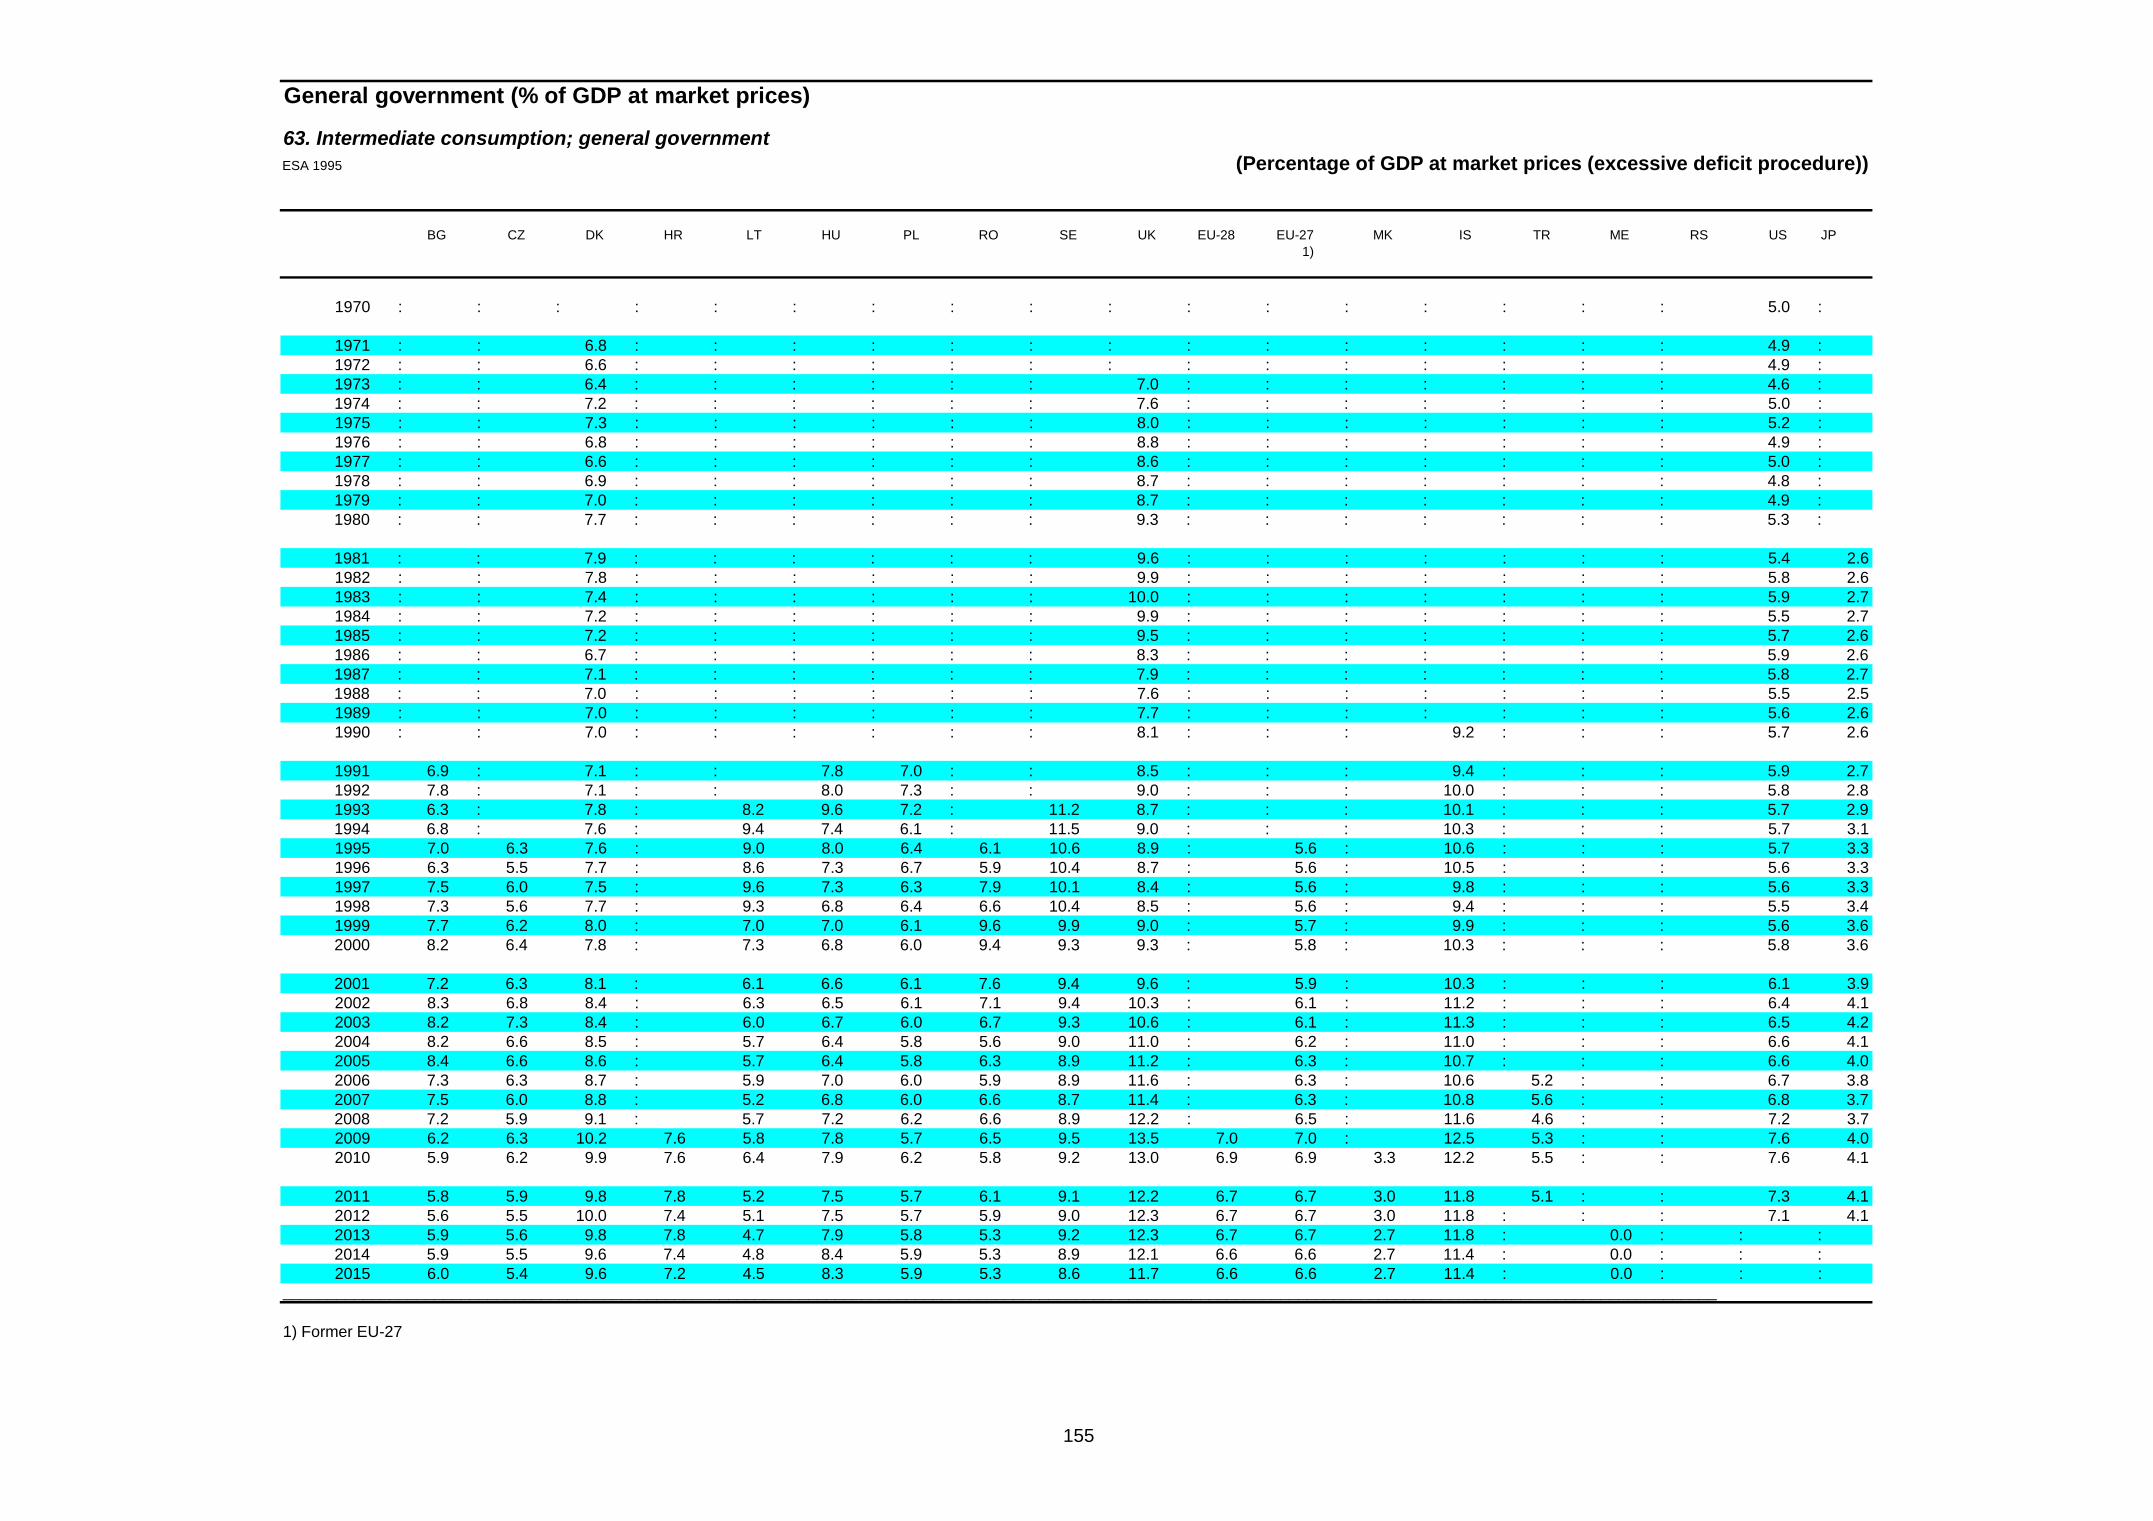
155
General government (% of GDP at market prices)
63. Intermediate consumption; general governmentESA 1995 (Percentage of GDP at market prices (excessive deficit procedure))
BG CZ DK HR LT HU PL RO SE UK EU-28 EU-27 MK IS TR ME RS US JP 1)
1970 : : : : : : : : : : : : : : : : : 5.0 :
1971 : : 6.8 : : : : : : : : : : : : : : 4.9 : 1972 : : 6.6 : : : : : : : : : : : : : : 4.9 : 1973 : : 6.4 : : : : : : 7.0 : : : : : : : 4.6 : 1974 : : 7.2 : : : : : : 7.6 : : : : : : : 5.0 : 1975 : : 7.3 : : : : : : 8.0 : : : : : : : 5.2 : 1976 : : 6.8 : : : : : : 8.8 : : : : : : : 4.9 : 1977 : : 6.6 : : : : : : 8.6 : : : : : : : 5.0 : 1978 : : 6.9 : : : : : : 8.7 : : : : : : : 4.8 : 1979 : : 7.0 : : : : : : 8.7 : : : : : : : 4.9 : 1980 : : 7.7 : : : : : : 9.3 : : : : : : : 5.3 :
1981 : : 7.9 : : : : : : 9.6 : : : : : : : 5.4 2.61982 : : 7.8 : : : : : : 9.9 : : : : : : : 5.8 2.61983 : : 7.4 : : : : : : 10.0 : : : : : : : 5.9 2.71984 : : 7.2 : : : : : : 9.9 : : : : : : : 5.5 2.71985 : : 7.2 : : : : : : 9.5 : : : : : : : 5.7 2.61986 : : 6.7 : : : : : : 8.3 : : : : : : : 5.9 2.61987 : : 7.1 : : : : : : 7.9 : : : : : : : 5.8 2.71988 : : 7.0 : : : : : : 7.6 : : : : : : : 5.5 2.51989 : : 7.0 : : : : : : 7.7 : : : : : : : 5.6 2.61990 : : 7.0 : : : : : : 8.1 : : : 9.2 : : : 5.7 2.6
1991 6.9 : 7.1 : : 7.8 7.0 : : 8.5 : : : 9.4 : : : 5.9 2.71992 7.8 : 7.1 : : 8.0 7.3 : : 9.0 : : : 10.0 : : : 5.8 2.81993 6.3 : 7.8 : 8.2 9.6 7.2 : 11.2 8.7 : : : 10.1 : : : 5.7 2.91994 6.8 : 7.6 : 9.4 7.4 6.1 : 11.5 9.0 : : : 10.3 : : : 5.7 3.11995 7.0 6.3 7.6 : 9.0 8.0 6.4 6.1 10.6 8.9 : 5.6 : 10.6 : : : 5.7 3.31996 6.3 5.5 7.7 : 8.6 7.3 6.7 5.9 10.4 8.7 : 5.6 : 10.5 : : : 5.6 3.31997 7.5 6.0 7.5 : 9.6 7.3 6.3 7.9 10.1 8.4 : 5.6 : 9.8 : : : 5.6 3.31998 7.3 5.6 7.7 : 9.3 6.8 6.4 6.6 10.4 8.5 : 5.6 : 9.4 : : : 5.5 3.41999 7.7 6.2 8.0 : 7.0 7.0 6.1 9.6 9.9 9.0 : 5.7 : 9.9 : : : 5.6 3.62000 8.2 6.4 7.8 : 7.3 6.8 6.0 9.4 9.3 9.3 : 5.8 : 10.3 : : : 5.8 3.6
2001 7.2 6.3 8.1 : 6.1 6.6 6.1 7.6 9.4 9.6 : 5.9 : 10.3 : : : 6.1 3.92002 8.3 6.8 8.4 : 6.3 6.5 6.1 7.1 9.4 10.3 : 6.1 : 11.2 : : : 6.4 4.12003 8.2 7.3 8.4 : 6.0 6.7 6.0 6.7 9.3 10.6 : 6.1 : 11.3 : : : 6.5 4.22004 8.2 6.6 8.5 : 5.7 6.4 5.8 5.6 9.0 11.0 : 6.2 : 11.0 : : : 6.6 4.12005 8.4 6.6 8.6 : 5.7 6.4 5.8 6.3 8.9 11.2 : 6.3 : 10.7 : : : 6.6 4.02006 7.3 6.3 8.7 : 5.9 7.0 6.0 5.9 8.9 11.6 : 6.3 : 10.6 5.2 : : 6.7 3.82007 7.5 6.0 8.8 : 5.2 6.8 6.0 6.6 8.7 11.4 : 6.3 : 10.8 5.6 : : 6.8 3.72008 7.2 5.9 9.1 : 5.7 7.2 6.2 6.6 8.9 12.2 : 6.5 : 11.6 4.6 : : 7.2 3.72009 6.2 6.3 10.2 7.6 5.8 7.8 5.7 6.5 9.5 13.5 7.0 7.0 : 12.5 5.3 : : 7.6 4.02010 5.9 6.2 9.9 7.6 6.4 7.9 6.2 5.8 9.2 13.0 6.9 6.9 3.3 12.2 5.5 : : 7.6 4.1
2011 5.8 5.9 9.8 7.8 5.2 7.5 5.7 6.1 9.1 12.2 6.7 6.7 3.0 11.8 5.1 : : 7.3 4.12012 5.6 5.5 10.0 7.4 5.1 7.5 5.7 5.9 9.0 12.3 6.7 6.7 3.0 11.8 : : : 7.1 4.12013 5.9 5.6 9.8 7.8 4.7 7.9 5.8 5.3 9.2 12.3 6.7 6.7 2.7 11.8 : 0.0 : : : 2014 5.9 5.5 9.6 7.4 4.8 8.4 5.9 5.3 8.9 12.1 6.6 6.6 2.7 11.4 : 0.0 : : : 2015 6.0 5.4 9.6 7.2 4.5 8.3 5.9 5.3 8.6 11.7 6.6 6.6 2.7 11.4 : 0.0 : : :
_________________________________________________________________________________________________________________________________________________________________ 1) Former EU-27

156
General government (% of GDP at market prices)
64. Social benefits other than social transfers in kind; general governmentESA 1995 (Percentage of GDP at market prices (excessive deficit procedure))
BE DE EE IE EL ES FR IT CY LV LU MT NL AT PT SI SK FI EA-18 1) 2)
1970 11.1 12.5 : : : : : : : : : : 12.4 : : : : : :
1971 11.4 12.6 : : : : : : : : : : 13.0 : : : : : : 1972 11.9 13.2 : : : : : : : : : : 13.7 : : : : : : 1973 12.4 13.3 : : : : : : : : : : 14.2 : : : : : : 1974 12.9 14.3 : : : : : : : : : : 14.6 : : : : : : 1975 15.1 17.0 : : : : : : : : : : 16.6 : : : : 9.3 : 1976 15.4 16.8 : : : : : : : : : : 16.9 15.1 : : : 10.3 : 1977 16.0 16.8 : : : : : : : : : : 17.2 15.3 6.0 : : 11.5 : 1978 16.4 16.5 : : : : 14.9 : : : : : 17.8 16.7 6.3 : : 11.9 : 1979 16.7 16.0 : : : : 15.0 : : : : : 18.1 16.5 6.0 : : 11.2 : 1980 16.9 15.8 : : : : 15.3 12.3 : : : : 18.3 16.4 6.6 : : 10.9 :
1981 18.1 16.4 : : : : 16.2 13.8 : : : : 18.9 16.9 7.7 : : 11.1 : 1982 18.3 16.7 : : : : 16.8 14.0 : : : : 20.1 17.2 8.3 : : 12.1 : 1983 18.9 16.2 : : : : 16.9 14.8 : : : : 20.5 17.3 8.2 : : 12.9 : 1984 18.3 15.6 : : : : 17.1 14.4 : : : : 19.6 17.5 8.0 : : 13.1 : 1985 17.8 15.3 : 14.2 : : 17.4 14.7 : : : : 18.6 17.8 8.1 : : 13.8 : 1986 17.6 15.0 : 14.5 : : 17.1 14.7 : : : : 18.1 17.9 8.5 : : 14.2 : 1987 17.2 15.4 : 14.1 : : 16.9 14.6 : : : : 18.2 18.5 8.8 : : 14.4 : 1988 16.5 15.2 : 13.6 12.9 : 16.6 14.6 : : : : 17.8 18.1 8.6 : : 13.7 : 1989 15.9 14.9 : 12.0 13.2 : 16.3 15.0 : : : : 17.2 17.6 8.3 : : 13.4 : 1990 15.8 14.3 : 12.4 13.1 : 16.4 15.0 : 5.6 12.6 : 18.2 17.5 8.5 : : 14.6 :
1991 13.4
1991 16.3 15.4 : 13.1 13.0 : 16.9 15.1 : 9.7 13.3 : 17.8 17.5 9.2 : : 18.3 : 1992 16.4 16.1 : 13.5 12.9 : 17.3 16.0 : 8.6 13.6 : 17.7 18.0 9.4 : : 22.2 : 1993 16.7 17.1 10.7 13.4 13.1 : 18.1 16.5 : 12.3 13.9 : 17.7 19.3 10.4 : 13.9 23.7 : 1994 16.3 17.3 9.9 13.2 13.4 : 18.0 16.7 : 13.1 13.9 : 16.4 19.5 11.7 : 12.7 23.6 : 1995 16.3 17.7 9.5 10.8 13.6 13.6 18.0 16.2 7.9 12.6 14.3 11.0 15.2 19.7 10.8 15.5 14.2 21.9 16.81996 16.4 18.4 9.8 10.5 13.9 13.5 18.1 16.4 8.3 12.9 14.2 11.9 14.6 19.7 11.0 15.3 14.2 21.4 17.01997 16.1 18.5 9.4 10.5 14.0 13.0 18.2 16.9 8.8 12.5 14.5 12.0 13.5 19.3 10.7 15.7 13.6 19.7 17.01998 15.9 18.2 9.6 9.7 14.2 12.5 17.8 16.6 8.9 13.1 14.3 12.2 12.7 18.9 10.9 15.8 13.6 18.3 16.61999 15.6 18.5 10.5 8.5 14.3 12.1 17.7 16.8 9.0 14.8 13.5 12.3 12.1 19.0 10.8 15.7 14.3 17.7 16.52000 15.2 18.0 9.5 7.7 14.9 12.0 17.2 16.3 9.2 12.5 13.1 11.4 11.3 18.9 11.2 15.9 13.5 16.2 16.0
2001 15.4 18.2 9.1 8.3 15.5 11.7 17.1 16.1 9.4 11.3 13.9 12.0 11.1 18.9 11.5 15.9 13.6 15.9 16.02002 15.8 18.7 8.9 8.8 15.6 11.8 17.5 16.5 10.4 10.2 14.5 12.1 11.2 19.2 12.1 15.9 13.7 16.3 16.32003 16.1 19.0 8.8 8.8 16.0 11.7 17.7 16.7 11.5 9.5 15.0 12.1 11.5 19.4 13.3 15.9 11.9 16.8 16.52004 15.8 18.7 9.2 9.1 15.7 11.7 17.7 16.8 12.2 9.2 14.7 12.4 11.4 19.1 13.8 15.8 12.3 16.6 16.42005 15.7 18.5 8.9 9.5 14.1 11.6 17.8 16.9 12.8 8.4 14.4 12.5 10.9 18.8 14.4 15.7 12.4 16.5 16.22006 15.5 17.7 8.7 9.7 14.7 11.4 17.8 16.9 12.3 8.1 13.5 12.2 10.8 18.4 14.5 15.3 11.9 16.0 15.92007 15.4 16.5 8.5 10.3 15.3 11.6 17.7 17.0 11.5 7.1 12.9 12.3 10.3 17.8 14.6 14.3 11.6 15.1 15.62008 15.8 16.3 10.5 12.3 16.7 12.5 17.8 17.6 12.1 8.1 14.4 12.1 10.3 18.1 15.1 14.7 11.4 15.3 15.92009 17.3 18.0 13.9 15.1 18.1 14.7 19.5 19.2 13.3 12.6 16.8 12.9 11.4 19.7 17.0 16.5 13.8 18.2 17.62010 17.0 17.2 13.0 15.3 18.1 15.5 19.6 19.2 14.2 12.5 15.9 12.5 11.7 19.8 17.1 17.2 14.1 18.3 17.5
2011 17.1 16.3 11.5 15.2 19.2 15.6 19.6 19.3 14.6 10.6 15.4 12.5 11.8 19.1 17.4 17.6 13.6 18.0 17.32012 17.7 16.1 11.0 15.0 19.9 16.3 19.9 19.9 14.7 9.6 16.0 12.9 12.2 19.3 18.0 17.6 13.8 18.8 17.62013 18.2 16.1 10.9 14.7 18.6 16.6 20.3 20.5 15.7 9.6 15.9 12.8 12.7 19.6 18.9 17.7 13.9 19.7 17.82014 18.1 16.0 11.0 13.9 19.3 16.6 20.3 20.6 17.0 9.3 15.9 12.8 12.7 19.6 18.2 17.5 13.5 20.1 17.82015 18.4 16.0 10.9 13.4 18.1 16.5 20.1 20.5 16.9 8.9 16.1 12.8 13.1 19.5 17.9 17.1 13.1 19.9 17.7
1) 1970-91 D_W 2) Euro area; 1970-91 including D_W

157
General government (% of GDP at market prices)
64. Social benefits other than social transfers in kind; general governmentESA 1995 (Percentage of GDP at market prices (excessive deficit procedure))
BG CZ DK HR LT HU PL RO SE UK EU-28 EU-27 MK IS TR ME RS US JP 1) 2) 2)
1970 : : : : : : : : : 8.8 : : : : : : : 6.7 :
1971 : : 10.8 : : : : : : 8.7 : : : : : : : 7.4 : 1972 : : 10.9 : : : : : : 9.3 : : : : : : : 7.5 : 1973 : : 10.3 : : : : : : 8.9 : : : : : : : 7.7 : 1974 : : 11.7 : : : : : : 9.6 : : : : : : : 8.4 : 1975 : : 12.9 : : : : : : 10.1 : : : : : : : 9.8 : 1976 : : 12.9 : : : : : : 10.6 : : : : : : : 9.6 : 1977 : : 13.5 : : : : : : 10.8 : : : : : : : 9.2 : 1978 : : 14.2 : : : : : : 11.1 : : : : : : : 8.7 : 1979 : : 14.6 : : : : : : 11.2 : : : : : : : 8.7 : 1980 : : 15.7 : : : : : : 11.7 : : : : : : : 9.6 :
1981 : : 16.9 : : : : : : 13.2 : : : : : : : 9.7 6.91982 : : 17.1 : : : : : : 14.0 : : : : : : : 10.4 7.21983 : : 16.6 : : : : : : 13.9 : : : : : : : 10.3 7.31984 : : 16.2 : : : : : : 13.9 : : : : : : : 9.5 7.11985 : : 15.5 : : : : : : 13.8 : : : : : : : 9.4 7.11986 : : 14.8 : : : : : : 13.9 : : : : : : : 9.4 7.31987 : : 15.5 : : : : : : 13.2 : : : : : : : 9.3 7.51988 : : 16.7 : : : : : : 12.2 : : : : : : : 9.1 7.31989 : : 17.5 : : : : : : 11.5 : : : : : : : 9.3 7.11990 : : 17.0 : : : : : : 11.6 : : : 6.9 : : : 9.7 7.2
1991 14.0 : 17.4 : : 18.3 16.3 : : 13.8 : : : 7.2 : : : 10.6 6.91992 14.5 : 17.9 : : 18.9 18.3 : : 15.2 : : : 7.6 : : : 11.3 7.11993 15.3 : 18.9 : : 19.1 18.1 : 22.2 15.5 : : : 8.0 : : : 11.4 7.51994 13.1 : 20.0 : : 18.0 17.2 : 21.7 15.1 : : : 7.7 : : : 11.2 7.91995 10.1 11.2 19.5 : 8.1 15.1 17.0 8.9 17.9 14.7 : 16.5 : 6.9 : : : 11.3 8.41996 10.3 11.4 18.9 : 8.5 13.4 17.1 8.8 17.1 14.3 : 16.6 : 6.6 : : : 11.2 8.61997 9.0 12.0 17.9 : 9.6 12.6 17.1 9.4 16.6 13.8 : 16.4 : 6.4 : : : 10.9 8.71998 10.2 12.1 17.4 : 10.8 13.1 16.3 10.5 16.4 13.2 : 16.0 : 5.8 : : : 10.6 9.31999 11.2 12.6 16.8 : 12.2 13.3 16.8 10.4 16.1 12.7 : 15.8 : 5.6 : : : 10.3 9.92000 12.4 12.9 16.2 : 11.5 12.8 16.0 9.7 15.6 12.5 : 15.3 : 5.6 : : : 10.2 10.0
2001 11.7 12.7 16.3 : 11.3 12.7 16.9 9.7 15.7 12.8 : 15.4 : 5.6 : : : 10.8 10.42002 11.9 13.0 16.4 : 10.0 13.3 17.0 9.3 15.9 12.8 : 15.6 : 6.3 : : : 11.4 10.92003 11.2 12.8 17.1 : 9.8 13.9 16.9 8.4 16.4 12.7 : 15.8 : 7.1 : : : 11.5 11.02004 11.2 12.3 16.9 : 9.7 14.0 16.0 8.7 16.0 12.7 : 15.6 : 6.8 : : : 11.5 11.12005 10.6 12.0 16.3 : 9.3 14.5 15.7 8.9 15.7 12.6 : 15.5 : 6.2 : : : 11.4 11.22006 10.2 12.2 15.4 : 9.2 15.0 15.2 8.8 15.2 12.4 : 15.1 : 5.7 6.6 : : 11.6 11.52007 9.6 12.5 14.9 : 9.8 15.5 14.2 9.2 14.4 12.5 : 14.8 : 5.8 7.0 : : 11.8 11.62008 10.1 12.4 14.7 : 11.6 15.9 14.0 10.4 14.4 13.0 : 15.2 : 6.1 7.2 : : 12.7 12.12009 12.1 13.5 16.7 13.8 16.3 16.5 14.7 12.7 15.7 14.9 16.9 17.0 : 8.1 8.4 : : 14.7 13.72010 12.6 13.7 16.9 14.0 14.5 16.0 14.8 12.9 14.7 14.9 16.9 16.9 17.4 7.9 7.8 : : 15.0 13.8
2011 11.9 13.8 17.1 14.3 12.6 15.6 14.1 12.0 14.1 14.9 16.6 16.6 14.8 8.5 8.3 : : 14.7 14.42012 11.6 13.9 17.2 14.1 12.1 15.5 14.2 11.3 14.5 15.5 16.9 16.9 15.0 8.0 : : : 14.4 14.32013 12.5 14.0 17.2 13.6 11.3 15.3 14.6 10.8 14.8 15.3 17.1 17.1 15.6 7.4 : 0.6 : 14.3 14.42014 12.7 14.0 17.5 14.0 11.1 14.8 14.6 10.8 14.7 14.9 17.0 17.0 15.6 7.0 : 0.5 : 14.3 14.22015 12.6 13.9 17.4 13.9 10.8 14.5 14.5 10.8 14.5 14.5 16.8 16.8 15.3 7.0 : 0.5 : 14.5 14.0
_________________________________________________________________________________________________________________________________________________________________ 1) Former EU-27 2) SNA 93

158
General government (% of GDP at market prices)
65. Social transfers in kind supplied to households via market producers; general governmentESA 1995 (Percentage of GDP at market prices (excessive deficit procedure))
BE DE EE IE EL ES FR IT CY LV LU MT NL AT PT SI SK FI EA-18 1) 2)
1970 3.1 3.7 : : : : : : : : : : 3.2 : : : : : :
1971 3.3 4.1 : : : : : : : : : : 3.6 : : : : : : 1972 3.5 4.4 : : : : : : : : : : 4.0 : : : : : : 1973 3.6 4.7 : : : : : : : : : : 4.1 : : : : : : 1974 3.8 5.2 : : : : : : : : : : 4.3 : : : : : : 1975 4.3 5.8 : : : : : : : : : : 4.8 : : : : 0.9 : 1976 4.6 5.9 : : : : : : : : : : 4.9 3.6 : : : 1.0 : 1977 4.6 5.8 : : : : : : : : : : 5.1 3.6 1.8 : : 1.1 : 1978 4.7 5.9 : : : : 3.3 : : : : : 5.2 3.8 1.2 : : 1.0 : 1979 4.7 5.8 : : : : 3.3 : : : : : 5.3 3.7 0.9 : : 0.9 : 1980 4.7 6.0 : : : : 3.4 1.9 : : : : 5.5 3.8 1.2 : : 0.9 :
1981 5.0 6.2 : : : : 3.7 1.9 : : : : 5.6 3.9 1.0 : : 1.0 : 1982 5.0 6.1 : : : : 3.8 2.1 : : : : 5.9 3.9 0.9 : : 0.9 : 1983 5.1 6.0 : : : : 3.8 2.1 : : : : 5.9 3.8 0.9 : : 0.9 : 1984 5.1 6.1 : : : : 4.0 2.0 : : : : 5.5 3.8 1.1 : : 0.9 : 1985 5.1 6.2 : 1.6 : : 4.2 2.1 : : : : 6.1 3.8 0.9 : : 0.9 : 1986 5.1 6.2 : 1.6 : : 4.2 2.1 : : : : 6.3 3.8 0.9 : : 1.0 : 1987 5.5 6.3 : 1.6 : : 4.2 2.3 : : : : 6.7 3.9 0.9 : : 1.0 : 1988 5.2 6.4 : 1.5 0.0 : 4.3 2.4 : : : : 6.6 4.0 1.0 : : 1.0 : 1989 5.2 5.9 : 1.5 0.0 : 4.3 2.4 : : : : 6.5 3.8 1.0 : : 1.0 : 1990 5.3 5.9 : 1.4 0.0 : 4.3 2.6 : 0.0 3.6 : 6.5 3.7 1.0 : : 1.1 :
1991 6.1
1991 5.5 6.5 : 1.5 0.0 : 4.4 2.5 : 0.0 3.5 : 6.9 3.7 1.1 : : 1.3 : 1992 5.8 6.9 : 1.5 0.0 : 4.5 2.4 : 0.0 3.6 : 7.4 3.8 1.2 : : 1.3 : 1993 5.8 6.9 0.5 1.5 0.0 : 4.8 2.3 : 0.0 3.8 : 7.5 4.0 1.4 : : 1.3 : 1994 5.6 7.1 0.8 1.5 0.0 : 4.7 2.1 : 0.0 3.7 : 7.5 4.1 1.3 : 3.5 1.3 : 1995 5.9 7.4 1.3 1.4 0.0 2.1 4.8 1.9 0.0 0.0 3.8 0.3 7.4 4.1 1.6 1.7 0.3 1.4 4.91996 6.2 7.6 1.1 1.4 0.0 2.1 4.9 1.9 0.0 0.0 4.2 0.3 6.9 4.1 1.7 1.6 2.5 1.6 4.91997 5.9 7.4 1.1 1.4 0.0 2.1 4.9 1.9 0.0 0.0 4.2 0.3 7.0 4.8 1.7 1.7 2.5 1.4 4.81998 6.0 7.4 1.6 1.3 0.0 2.2 4.9 2.0 0.0 0.0 4.0 0.3 7.0 4.9 1.7 1.8 2.5 1.6 4.81999 6.1 7.4 1.7 1.3 0.0 2.3 4.9 2.1 0.0 0.0 4.4 0.3 6.9 5.1 1.8 1.8 2.6 1.6 4.82000 6.2 7.5 1.6 1.3 0.0 2.3 5.0 2.3 0.0 0.0 4.1 0.3 7.0 5.0 1.8 2.0 2.5 1.6 4.9
2001 6.5 7.5 1.6 1.4 0.0 2.4 5.1 2.5 0.0 0.0 4.7 0.4 7.1 5.0 1.9 2.1 2.5 1.7 4.92002 6.5 7.6 1.4 1.5 0.0 2.5 5.3 2.6 0.0 0.9 4.7 0.4 7.8 5.1 1.9 2.1 2.8 1.8 5.12003 6.9 7.8 1.3 1.6 0.0 2.4 5.5 2.6 0.1 0.9 4.8 0.5 8.2 5.2 3.1 2.1 3.4 2.0 5.22004 7.0 7.4 1.4 1.7 0.0 2.5 5.6 2.7 0.0 0.7 5.2 0.5 8.2 5.3 3.2 2.0 3.1 2.1 5.12005 7.0 7.5 1.3 1.8 2.4 2.6 5.6 2.8 0.1 0.7 5.0 0.6 8.1 5.3 3.4 2.1 4.4 2.2 5.22006 6.8 7.4 1.3 1.8 2.6 2.7 5.6 2.8 0.1 0.6 4.8 0.6 9.6 5.3 3.7 2.0 4.4 2.2 5.22007 6.8 7.3 1.3 1.9 2.6 2.5 5.6 2.7 0.1 0.8 4.4 0.6 9.8 5.4 3.9 1.9 4.5 2.1 5.22008 7.3 7.5 1.6 2.3 2.9 2.7 5.7 2.7 0.1 0.9 4.6 0.6 10.0 5.5 4.2 1.9 4.7 2.3 5.42009 8.0 8.3 1.9 2.4 3.1 3.0 5.9 2.9 0.2 1.0 5.3 0.7 11.2 5.8 5.0 2.2 5.2 2.7 5.82010 7.8 8.1 1.8 2.7 3.3 3.0 5.9 2.9 0.1 1.1 5.0 0.6 11.3 5.7 4.9 2.2 5.3 2.7 5.8
2011 8.0 7.9 1.7 2.6 3.4 2.9 5.9 2.8 0.1 1.1 4.8 0.7 11.4 5.6 4.7 2.2 4.9 2.7 5.82012 8.3 8.0 1.8 2.6 3.0 2.8 5.9 2.8 0.0 1.1 5.0 0.6 11.8 5.7 4.5 2.2 4.9 2.7 5.82013 8.3 8.2 1.8 2.8 2.5 2.7 6.0 2.8 0.0 1.1 5.1 0.7 11.7 5.8 4.6 2.2 5.1 2.9 5.92014 8.4 8.3 1.8 2.7 1.6 2.7 6.0 2.7 0.1 1.1 5.0 0.9 11.8 5.8 4.3 2.2 5.0 2.9 6.02015 8.5 8.4 1.8 2.6 1.6 2.6 6.0 2.7 0.1 1.2 5.1 1.0 11.6 5.7 4.1 2.2 5.0 2.8 5.9
1) 1970-91 D_W 2) Euro area; 1970-91 including D_W
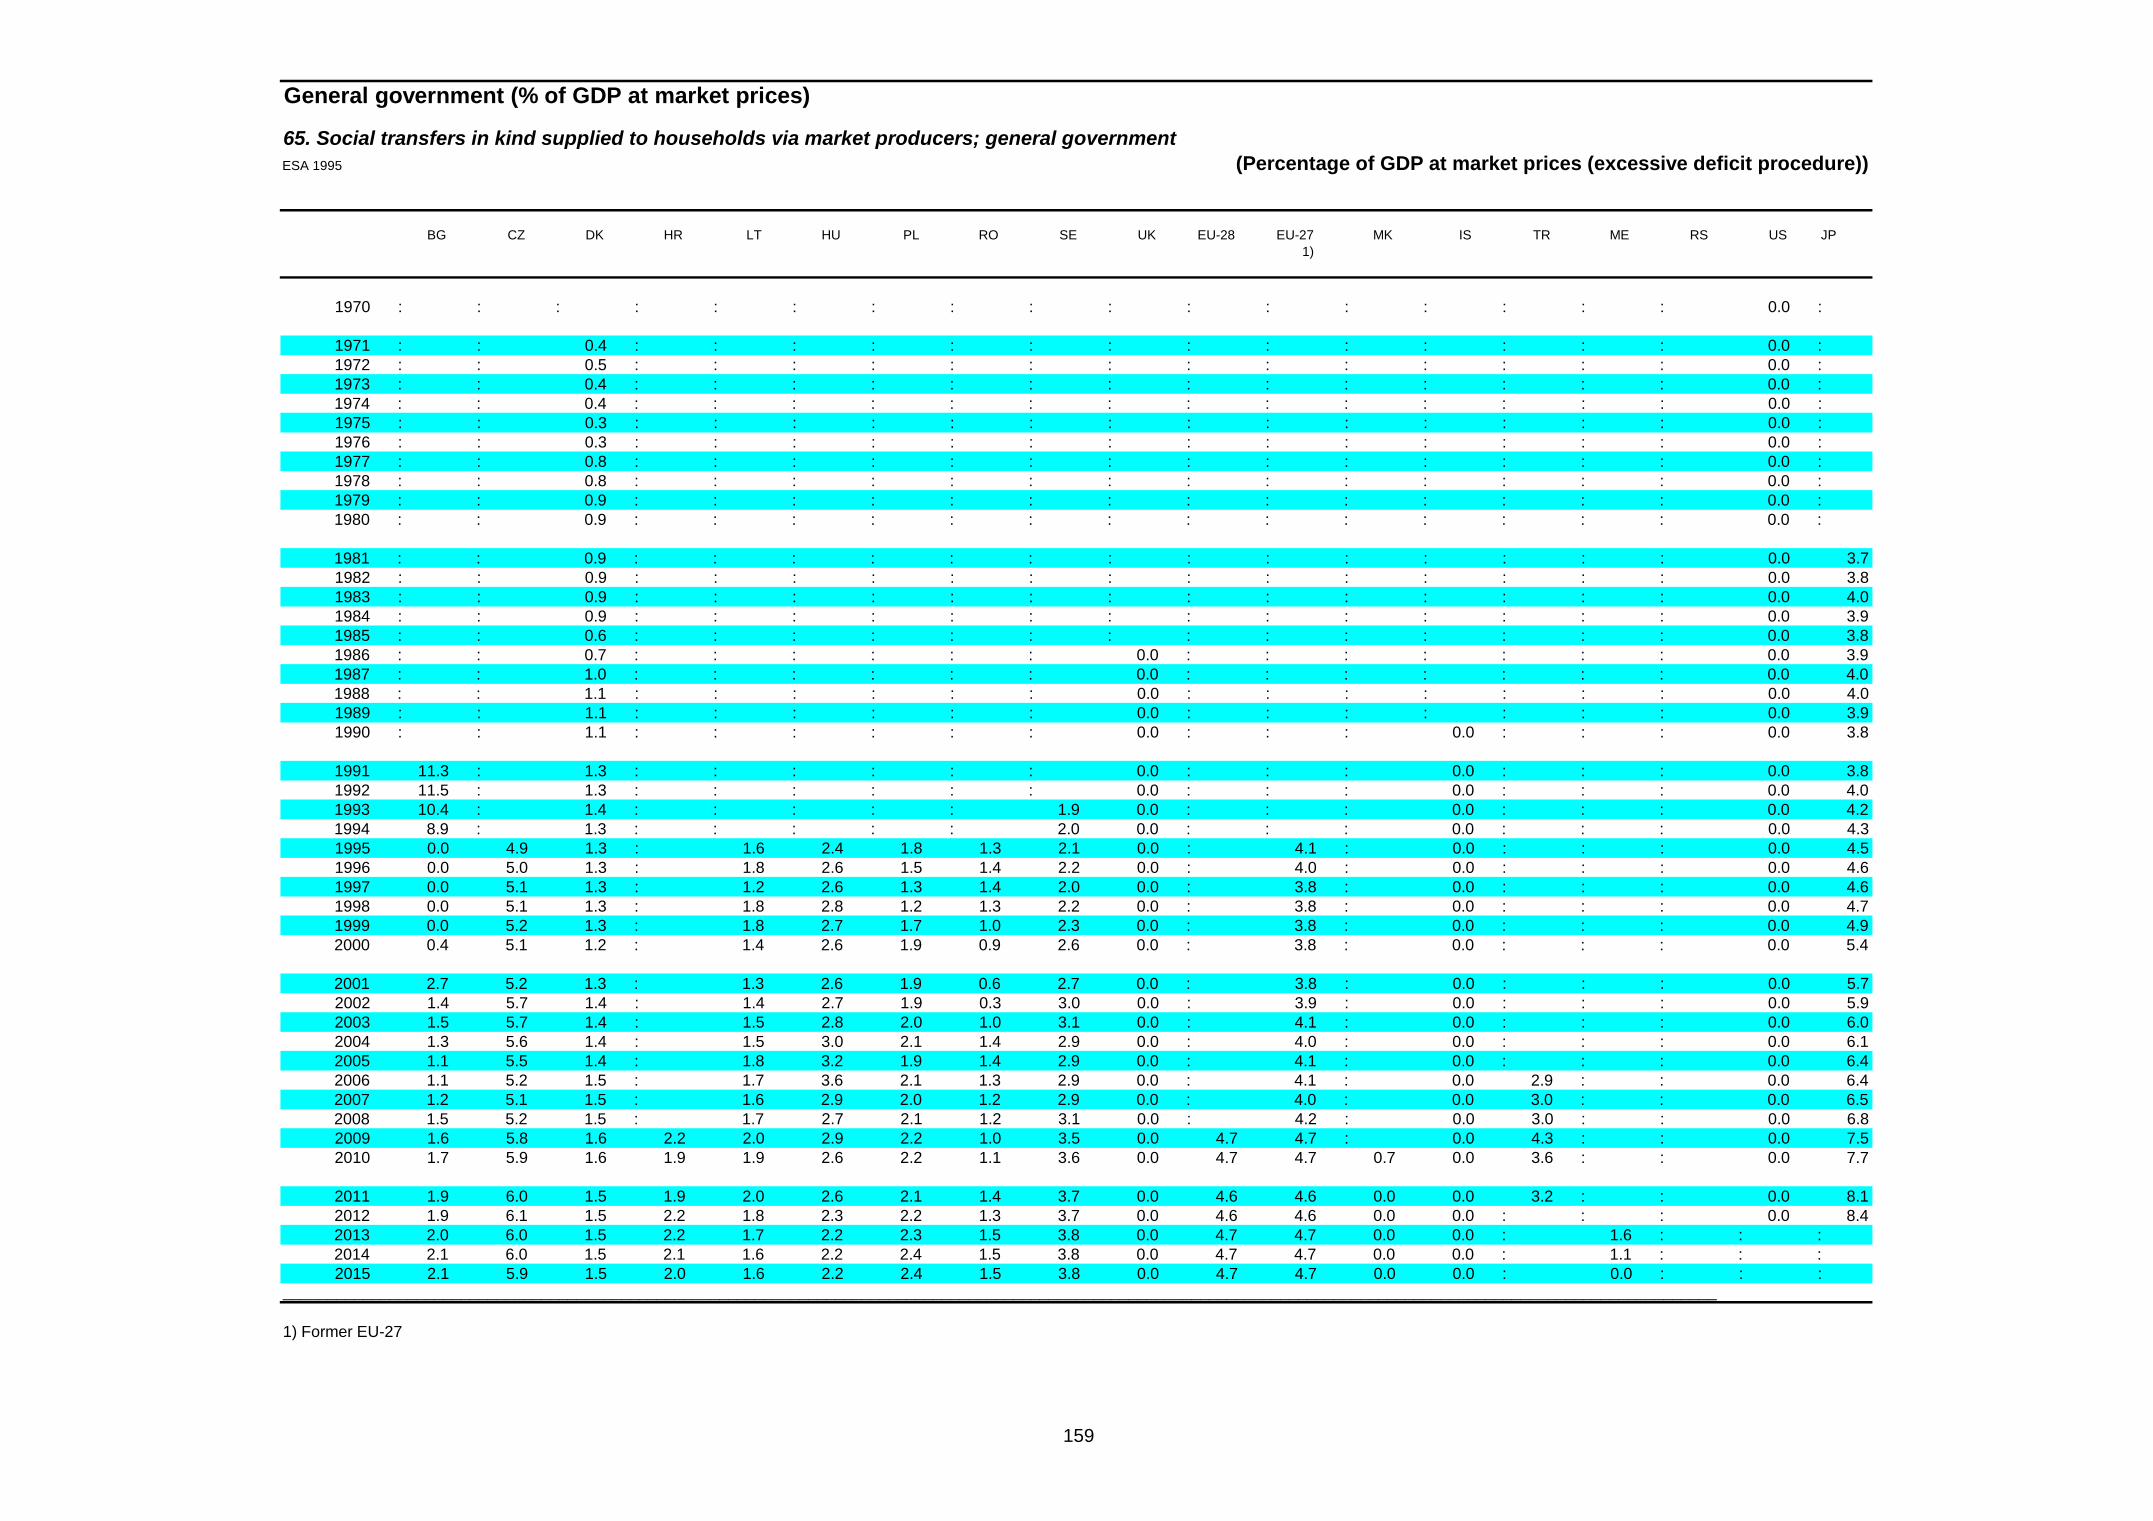
159
General government (% of GDP at market prices)
65. Social transfers in kind supplied to households via market producers; general governmentESA 1995 (Percentage of GDP at market prices (excessive deficit procedure))
BG CZ DK HR LT HU PL RO SE UK EU-28 EU-27 MK IS TR ME RS US JP 1)
1970 : : : : : : : : : : : : : : : : : 0.0 :
1971 : : 0.4 : : : : : : : : : : : : : : 0.0 : 1972 : : 0.5 : : : : : : : : : : : : : : 0.0 : 1973 : : 0.4 : : : : : : : : : : : : : : 0.0 : 1974 : : 0.4 : : : : : : : : : : : : : : 0.0 : 1975 : : 0.3 : : : : : : : : : : : : : : 0.0 : 1976 : : 0.3 : : : : : : : : : : : : : : 0.0 : 1977 : : 0.8 : : : : : : : : : : : : : : 0.0 : 1978 : : 0.8 : : : : : : : : : : : : : : 0.0 : 1979 : : 0.9 : : : : : : : : : : : : : : 0.0 : 1980 : : 0.9 : : : : : : : : : : : : : : 0.0 :
1981 : : 0.9 : : : : : : : : : : : : : : 0.0 3.71982 : : 0.9 : : : : : : : : : : : : : : 0.0 3.81983 : : 0.9 : : : : : : : : : : : : : : 0.0 4.01984 : : 0.9 : : : : : : : : : : : : : : 0.0 3.91985 : : 0.6 : : : : : : : : : : : : : : 0.0 3.81986 : : 0.7 : : : : : : 0.0 : : : : : : : 0.0 3.91987 : : 1.0 : : : : : : 0.0 : : : : : : : 0.0 4.01988 : : 1.1 : : : : : : 0.0 : : : : : : : 0.0 4.01989 : : 1.1 : : : : : : 0.0 : : : : : : : 0.0 3.91990 : : 1.1 : : : : : : 0.0 : : : 0.0 : : : 0.0 3.8
1991 11.3 : 1.3 : : : : : : 0.0 : : : 0.0 : : : 0.0 3.81992 11.5 : 1.3 : : : : : : 0.0 : : : 0.0 : : : 0.0 4.01993 10.4 : 1.4 : : : : : 1.9 0.0 : : : 0.0 : : : 0.0 4.21994 8.9 : 1.3 : : : : : 2.0 0.0 : : : 0.0 : : : 0.0 4.31995 0.0 4.9 1.3 : 1.6 2.4 1.8 1.3 2.1 0.0 : 4.1 : 0.0 : : : 0.0 4.51996 0.0 5.0 1.3 : 1.8 2.6 1.5 1.4 2.2 0.0 : 4.0 : 0.0 : : : 0.0 4.61997 0.0 5.1 1.3 : 1.2 2.6 1.3 1.4 2.0 0.0 : 3.8 : 0.0 : : : 0.0 4.61998 0.0 5.1 1.3 : 1.8 2.8 1.2 1.3 2.2 0.0 : 3.8 : 0.0 : : : 0.0 4.71999 0.0 5.2 1.3 : 1.8 2.7 1.7 1.0 2.3 0.0 : 3.8 : 0.0 : : : 0.0 4.92000 0.4 5.1 1.2 : 1.4 2.6 1.9 0.9 2.6 0.0 : 3.8 : 0.0 : : : 0.0 5.4
2001 2.7 5.2 1.3 : 1.3 2.6 1.9 0.6 2.7 0.0 : 3.8 : 0.0 : : : 0.0 5.72002 1.4 5.7 1.4 : 1.4 2.7 1.9 0.3 3.0 0.0 : 3.9 : 0.0 : : : 0.0 5.92003 1.5 5.7 1.4 : 1.5 2.8 2.0 1.0 3.1 0.0 : 4.1 : 0.0 : : : 0.0 6.02004 1.3 5.6 1.4 : 1.5 3.0 2.1 1.4 2.9 0.0 : 4.0 : 0.0 : : : 0.0 6.12005 1.1 5.5 1.4 : 1.8 3.2 1.9 1.4 2.9 0.0 : 4.1 : 0.0 : : : 0.0 6.42006 1.1 5.2 1.5 : 1.7 3.6 2.1 1.3 2.9 0.0 : 4.1 : 0.0 2.9 : : 0.0 6.42007 1.2 5.1 1.5 : 1.6 2.9 2.0 1.2 2.9 0.0 : 4.0 : 0.0 3.0 : : 0.0 6.52008 1.5 5.2 1.5 : 1.7 2.7 2.1 1.2 3.1 0.0 : 4.2 : 0.0 3.0 : : 0.0 6.82009 1.6 5.8 1.6 2.2 2.0 2.9 2.2 1.0 3.5 0.0 4.7 4.7 : 0.0 4.3 : : 0.0 7.52010 1.7 5.9 1.6 1.9 1.9 2.6 2.2 1.1 3.6 0.0 4.7 4.7 0.7 0.0 3.6 : : 0.0 7.7
2011 1.9 6.0 1.5 1.9 2.0 2.6 2.1 1.4 3.7 0.0 4.6 4.6 0.0 0.0 3.2 : : 0.0 8.12012 1.9 6.1 1.5 2.2 1.8 2.3 2.2 1.3 3.7 0.0 4.6 4.6 0.0 0.0 : : : 0.0 8.42013 2.0 6.0 1.5 2.2 1.7 2.2 2.3 1.5 3.8 0.0 4.7 4.7 0.0 0.0 : 1.6 : : : 2014 2.1 6.0 1.5 2.1 1.6 2.2 2.4 1.5 3.8 0.0 4.7 4.7 0.0 0.0 : 1.1 : : : 2015 2.1 5.9 1.5 2.0 1.6 2.2 2.4 1.5 3.8 0.0 4.7 4.7 0.0 0.0 : 0.0 : : :
_________________________________________________________________________________________________________________________________________________________________ 1) Former EU-27

160
General government (% of GDP at market prices)
66. Interest including flows on swaps and FRAs (Forward Rate Agreements); general governmentExcessive deficit procedure (Percentage of GDP at market prices (excessive deficit procedure))
BE DE EE IE EL ES FR IT CY LV LU MT NL AT PT SI SK FI EA-18 1) 2)
1970 3.4 0.9 : : : : : : : : : : 2.9 : : : : : :
1971 3.6 1.0 : : : : : : : : : : 2.8 : : : : : : 1972 3.6 1.0 : : : : : : : : : : 2.7 : : : : : : 1973 3.6 1.1 : : : : : : : : : : 2.7 : : : : : : 1974 3.7 1.2 : : : : : : : : : : 2.8 : : : : : : 1975 4.0 1.4 : : : : : : : : : : 2.9 : : : : 0.6 : 1976 4.1 1.6 : : : : : : : : : : 2.9 1.4 : : : 0.6 : 1977 4.6 1.6 : : : : : : : : : : 3.0 1.5 1.3 : : 0.7 : 1978 4.9 1.6 : : : : 1.0 : : : : : 3.2 1.9 2.1 : : 0.8 : 1979 5.6 1.8 : : : : 1.1 : : : : : 3.3 1.9 2.3 : : 0.9 : 1980 6.4 2.1 : : : : 1.2 4.4 : : : : 3.7 2.1 2.4 : : 1.0 :
1981 8.1 2.4 : : : : 1.7 5.1 : : : : 4.4 2.4 3.9 : : 1.0 : 1982 9.2 2.8 : : : : 1.7 6.5 : : : : 5.1 2.7 4.3 : : 1.2 : 1983 9.6 2.9 : : : : 2.2 7.8 : : : : 5.6 2.6 4.9 : : 1.4 : 1984 9.8 2.9 : : : : 2.3 8.3 : : : : 5.9 3.0 5.5 : : 1.6 : 1985 10.4 2.9 : 9.6 : : 2.5 8.4 : : : : 6.2 3.1 6.3 : : 1.8 : 1986 10.6 2.7 : 9.1 : : 2.5 8.7 : : : : 6.2 3.2 7.8 : : 1.7 : 1987 10.0 2.7 : 9.1 : : 2.5 7.9 : : : : 6.1 3.5 7.0 : : 1.6 : 1988 9.8 2.7 : 8.5 6.6 : 2.4 8.3 : : : : 6.0 3.5 6.2 : : 1.6 : 1989 11.1 2.6 : 7.6 6.7 : 2.4 9.1 : : : : 5.7 3.6 5.7 : : 1.4 : 1990 11.6 2.6 : 7.7 9.0 : 2.7 10.0 : 0.1 0.5 : 5.8 3.8 7.9 : : 1.4 :
1991 2.9
1991 11.1 2.7 : 7.5 8.7 : 2.8 11.3 : : 0.4 : 6.0 3.9 8.0 : : 1.9 : 1992 10.8 3.1 : 7.0 10.4 : 3.0 12.2 : 0.1 0.4 : 6.2 4.0 7.8 : : 2.5 : 1993 10.8 3.2 0.2 6.5 11.4 : 3.2 12.6 : 0.1 0.4 : 6.1 4.0 7.2 : 2.7 4.4 : 1994 9.2 3.4 0.2 5.9 12.5 : 3.3 11.3 : 0.9 0.5 : 5.5 3.7 6.1 : 3.4 4.1 : 1995 8.9 3.5 0.5 5.2 11.3 5.1 3.4 11.5 2.0 0.9 0.4 2.0 5.6 4.0 5.6 2.1 2.4 3.9 5.41996 8.4 3.5 0.4 4.5 10.6 5.2 3.6 11.5 2.4 1.4 0.4 2.2 5.3 3.9 4.8 2.1 2.5 4.2 5.51997 7.7 3.4 0.3 4.1 9.4 4.7 3.4 9.2 2.5 0.9 0.4 2.6 4.9 3.6 3.7 2.4 2.4 4.2 4.91998 7.3 3.4 0.5 3.3 8.2 4.2 3.3 7.9 3.1 0.7 0.4 3.1 4.7 3.6 3.1 2.2 2.5 3.5 4.51999 6.8 3.2 0.3 2.3 7.4 3.5 3.0 6.6 3.1 0.7 0.3 3.6 4.3 3.4 2.9 2.3 3.4 3.0 4.02000 6.6 3.2 0.2 2.0 7.4 3.2 2.9 6.2 3.4 1.0 0.3 3.5 3.7 3.4 2.9 2.4 4.1 2.8 3.9
2001 6.4 3.1 0.1 1.6 6.5 3.0 3.0 6.2 3.4 0.9 0.3 3.2 3.2 3.4 2.9 2.4 4.0 2.7 3.82002 5.7 3.0 0.2 1.4 5.6 2.7 2.9 5.6 3.2 0.7 0.3 3.4 2.8 3.1 2.8 2.2 3.6 2.1 3.52003 5.3 3.0 0.2 1.3 5.0 2.3 2.8 5.1 3.6 0.7 0.2 3.2 2.6 2.9 2.6 2.0 2.5 1.7 3.32004 4.7 2.9 0.2 1.2 5.0 2.0 2.7 4.7 3.3 0.7 0.2 3.5 2.5 2.8 2.6 1.7 2.2 1.6 3.12005 4.2 2.8 0.2 1.1 4.5 1.8 2.7 4.6 3.5 0.5 0.2 3.6 2.3 2.9 2.6 1.6 1.7 1.5 3.02006 4.0 2.8 0.2 1.1 4.4 1.6 2.6 4.6 3.3 0.4 0.2 3.5 2.2 2.7 2.8 1.4 1.5 1.4 2.92007 3.9 2.8 0.2 1.0 4.5 1.6 2.7 5.0 3.0 0.4 0.2 3.3 2.2 2.7 2.9 1.3 1.4 1.5 3.02008 3.8 2.8 0.2 1.3 5.0 1.6 2.9 5.2 2.8 0.6 0.3 3.1 2.2 2.6 3.0 1.1 1.2 1.4 3.02009 3.6 2.7 0.2 2.0 5.2 1.8 2.4 4.7 2.6 1.5 0.4 3.1 2.2 2.8 2.8 1.4 1.4 1.1 2.92010 3.4 2.5 0.1 3.1 5.8 1.9 2.4 4.6 2.2 1.4 0.4 2.9 2.1 2.7 2.8 1.6 1.3 1.1 2.8
2011 3.3 2.5 0.1 3.3 7.1 2.5 2.6 5.0 2.4 1.5 0.5 3.0 2.1 2.6 4.0 1.9 1.6 1.1 3.12012 3.4 2.4 0.2 3.7 5.0 3.1 2.6 5.5 3.2 1.3 0.5 3.1 1.9 2.6 4.3 2.2 1.8 1.0 3.12013 3.2 2.2 0.1 4.7 4.0 3.4 2.3 5.3 3.4 1.7 0.5 3.0 1.8 2.6 4.3 2.6 2.0 1.0 2.92014 3.0 2.0 0.1 4.7 4.5 3.5 2.4 5.2 4.0 1.6 0.5 3.0 1.7 2.6 4.3 3.0 1.9 1.0 2.92015 3.0 1.8 0.1 4.9 5.1 3.6 2.4 5.2 4.0 1.3 0.6 2.9 1.7 2.6 4.4 2.9 1.9 1.0 2.9
1) 1970-91 D_W 2) Euro area; 1970-91 including D_W

161
General government (% of GDP at market prices)
66. Interest including flows on swaps and FRAs (Forward Rate Agreements); general governmentExcessive deficit procedure (Percentage of GDP at market prices (excessive deficit procedure))
BG CZ DK HR LT HU PL RO SE UK EU-28 EU-27 MK IS TR ME RS US JP 1) 2) 2)
1970 : : : : : : : : : 4.0 : : : : : : : 3.8 :
1971 : : 1.3 : : : : : : 3.8 : : : : : : : 3.8 : 1972 : : 1.3 : : : : : : 3.7 : : : : : : : 3.8 : 1973 : : 1.2 : : : : : : 3.8 : : : : : : : 3.9 : 1974 : : 1.2 : : : : : : 4.3 : : : : : : : 4.0 : 1975 : : 1.1 : : : : : : 4.0 : : : : : : : 4.1 : 1976 : : 1.3 : : : : : : 4.4 : : : : : : : 4.1 : 1977 : : 1.7 : : : : : : 4.5 : : : : : : : 4.0 : 1978 : : 2.1 : : : : : : 4.4 : : : : : : : 4.2 : 1979 : : 3.3 : : : : : : 4.6 : : : : : : : 4.3 : 1980 : : 3.7 : : : : : : 4.9 : : : : : : : 4.6 :
1981 : : 5.0 : : : : : : 5.2 : : : : : : : 5.0 3.31982 : : 5.7 : : : : : : 5.2 : : : : : : : 5.5 3.71983 : : 7.6 : : : : : : 4.9 : : : : : : : 5.5 4.01984 : : 9.0 : : : : : : 5.1 : : : : : : : 5.7 4.21985 : : 9.3 : : : : : : 5.1 : : : : : : : 5.9 4.21986 : : 8.4 : : : : : : 4.7 : : : : : : : 5.8 4.11987 : : 7.8 : : : : : : 4.5 : : : : : : : 5.7 4.11988 : : 7.4 : : : : : : 4.1 : : : : : : : 5.6 3.91989 : : 7.1 : : : : : : 4.0 : : : : : : : 5.7 3.71990 : : 6.6 : : : : : : 3.6 : : : 3.7 : : : 5.7 3.6
1991 16.4 : 6.6 : : : 4.4 : : 3.1 : : : 3.9 : : : 5.8 3.51992 6.4 : 6.0 : : : 5.3 : : 3.0 : : : 3.9 : : : 5.6 3.41993 9.4 : 6.7 : : : 7.9 : 5.7 3.0 : : : 4.0 : : : 5.4 3.41994 14.6 : 6.1 : : : 6.0 : 6.2 3.2 : : : 4.1 : : : 5.2 3.31995 14.1 1.0 5.9 : 0.3 8.9 5.7 1.6 5.4 3.5 : 5.1 : 4.1 : : : 5.5 3.31996 21.7 1.2 5.7 : 0.8 9.2 4.6 1.8 5.3 3.5 : 5.2 : 3.7 : : : 5.2 3.31997 7.3 1.1 5.0 : 0.7 8.9 4.5 4.4 5.1 3.5 : 4.7 : 3.5 : : : 4.9 3.31998 4.1 1.1 4.5 : 1.1 7.5 4.0 4.0 4.7 3.4 : 4.3 : 3.6 : : : 4.6 3.31999 3.7 1.0 4.0 : 1.5 7.1 3.0 5.0 3.9 2.8 : 3.8 : 3.4 : : : 4.1 3.42000 4.2 0.8 3.6 : 1.7 5.3 3.0 3.9 3.5 2.7 : 3.6 : 3.4 10.4 : : 3.8 3.2
2001 4.3 1.0 3.3 : 1.5 4.7 3.1 3.4 2.8 2.3 : 3.5 : 3.4 20.7 : : 3.6 2.72002 2.3 1.1 3.1 : 1.3 4.1 2.9 2.5 2.8 2.0 : 3.2 : 3.0 15.8 : : 3.4 2.32003 2.2 1.1 2.7 : 1.2 4.1 3.0 1.6 2.0 1.9 : 3.0 1.1 2.7 13.6 : : 3.4 2.02004 1.9 1.1 2.3 : 0.9 4.4 2.8 1.5 1.6 1.9 : 2.8 0.8 2.4 8.9 : : 3.3 1.92005 1.6 1.1 1.9 : 0.8 4.1 2.8 1.2 1.6 2.1 : 2.7 0.9 2.2 6.7 : : 3.4 1.72006 1.3 1.1 1.6 : 0.7 3.9 2.7 0.8 1.6 2.0 : 2.6 1.0 2.2 6.0 1.1 : 3.5 1.82007 1.2 1.1 1.6 : 0.7 4.2 2.3 0.7 1.7 2.2 : 2.7 0.8 2.6 5.4 1.0 : 3.6 1.92008 0.9 1.1 1.4 : 0.7 4.2 2.2 0.7 1.7 2.3 : 2.8 0.7 3.3 5.0 0.8 : 3.4 2.02009 0.8 1.3 1.8 2.0 1.3 4.7 2.6 1.5 1.0 2.0 2.6 2.6 0.6 6.6 5.0 0.9 : 3.7 2.02010 0.7 1.4 1.7 2.2 1.8 4.1 2.7 1.5 0.8 3.0 2.7 2.7 0.7 5.5 4.1 1.0 1.2 3.7 2.0
2011 0.7 1.4 1.8 2.6 1.8 4.1 2.7 1.6 1.0 3.3 2.9 2.9 0.8 5.2 3.3 1.5 1.4 3.9 2.12012 0.9 1.5 1.6 3.0 1.8 4.3 2.8 1.8 0.7 3.0 2.9 2.9 0.8 5.6 : 1.9 2.0 3.8 2.12013 0.8 1.4 1.5 3.1 1.7 4.2 2.6 1.8 0.6 3.0 2.8 2.8 0.8 5.3 : 2.1 2.6 3.7 2.12014 0.8 1.4 1.4 3.4 1.6 3.8 2.1 1.8 0.7 2.9 2.7 2.7 0.8 4.6 : 2.3 3.1 3.8 2.12015 0.8 1.3 1.3 3.6 1.5 3.8 2.2 1.8 0.6 2.9 2.7 2.7 0.8 4.5 : 2.0 3.3 4.0 2.0
_________________________________________________________________________________________________________________________________________________________________ 1) Former EU-27 2) SNA 93

162
General government (% of GDP at market prices)
67. Subsidies; general governmentESA 1995 (Percentage of GDP at market prices (excessive deficit procedure))
BE DE EE IE EL ES FR IT CY LV LU MT NL AT PT SI SK FI EA-18 1) 2)
1970 2.2 1.4 : : : : : : : : : : 0.9 : : : : : :
1971 2.1 1.4 : : : : : : : : : : 0.9 : : : : : : 1972 2.3 1.7 : : : : : : : : : : 1.1 : : : : : : 1973 2.4 1.7 : : : : : : : : : : 1.1 : : : : : : 1974 2.3 1.6 : : : : : : : : : : 1.2 : : : : : : 1975 2.5 1.7 : : : : : : : : : : 1.4 : : : : 3.3 : 1976 2.6 1.7 : : : : : : : : : : 1.7 3.0 : : : 3.2 : 1977 2.8 1.7 : : : : : : : : : : 1.7 3.0 3.0 : : 3.2 : 1978 2.9 1.9 : : : : 2.0 : : : : : 1.8 3.2 3.5 : : 3.1 : 1979 2.9 1.9 : : : : 2.0 : : : : : 1.7 3.0 3.8 : : 3.3 : 1980 2.7 1.8 : : : : 2.0 2.6 : : : : 1.7 3.1 4.2 : : 3.1 :
1981 2.9 1.7 : : : : 2.1 2.6 : : : : 1.8 3.1 4.5 : : 3.1 : 1982 2.5 1.7 : : : : 2.2 2.8 : : : : 2.0 3.1 3.6 : : 3.0 : 1983 2.7 1.7 : : : : 2.2 2.7 : : : : 2.1 3.0 3.3 : : 3.1 : 1984 2.9 1.7 : : : : 2.6 2.7 : : : : 2.2 3.0 3.6 : : 3.1 : 1985 2.4 1.8 : 2.0 : : 2.4 2.5 : : : : 2.4 3.1 3.2 : : 3.0 : 1986 2.3 1.8 : 1.8 : : 2.5 2.8 : : : : 2.2 3.5 3.2 : : 3.0 : 1987 2.1 2.0 : 2.5 : : 2.4 2.4 : : : : 2.3 3.5 2.5 : : 2.9 : 1988 2.2 1.9 : 2.9 1.8 : 2.0 2.1 : : : : 2.2 3.2 2.3 : : 2.8 : 1989 1.8 1.9 : 1.2 1.3 : 1.8 2.1 : : : : 2.3 3.1 2.0 : : 2.7 : 1990 1.7 1.7 : 1.1 1.1 : 1.7 1.8 : 13.6 2.2 : 2.2 3.0 1.6 : : 2.8 :
1991 1.6
1991 1.4 2.1 : 1.1 0.6 : 1.7 1.8 : 5.4 2.3 : 2.1 3.3 1.5 : : 3.3 : 1992 1.3 1.9 : 1.1 0.5 : 1.6 1.7 : 0.7 2.4 : 2.2 3.3 1.8 : : 3.4 : 1993 1.3 1.8 0.9 1.3 0.5 : 1.7 1.9 : 0.7 2.1 : 2.0 3.3 2.2 : 4.5 3.2 : 1994 1.2 2.0 0.9 1.1 0.4 : 1.6 1.6 : 0.5 2.4 : 1.9 2.9 1.6 : 4.3 3.0 : 1995 1.2 2.1 0.8 1.0 0.4 1.0 1.6 1.4 0.9 1.2 1.6 1.7 1.0 2.8 1.0 2.2 4.7 2.7 1.71996 1.3 2.0 0.8 1.0 0.4 1.0 1.6 1.4 1.1 0.8 1.8 2.2 1.1 2.5 1.2 1.9 3.9 2.0 1.61997 1.1 1.8 0.8 1.4 0.1 0.9 1.5 1.2 0.8 1.0 1.7 2.3 1.2 3.2 1.1 1.9 4.3 1.8 1.51998 1.2 1.8 1.4 1.2 0.1 1.1 1.5 1.3 1.1 1.1 1.8 2.1 1.4 3.5 1.2 2.0 2.8 1.7 1.51999 1.2 1.8 1.2 1.2 0.2 1.2 1.5 1.2 0.7 1.4 1.4 1.8 1.5 3.3 1.4 1.9 2.7 1.6 1.52000 1.2 1.7 1.1 1.1 0.1 1.1 1.5 1.2 1.4 1.0 1.5 1.4 1.5 3.1 1.2 1.9 2.5 1.5 1.5
2001 1.2 1.5 1.0 1.2 0.1 1.0 1.5 1.2 1.4 0.7 1.5 1.6 1.5 3.3 1.2 1.8 2.1 1.4 1.42002 1.2 1.4 1.0 0.9 0.1 1.1 1.7 1.1 1.1 0.7 1.5 2.0 1.5 3.3 1.1 1.8 1.5 1.4 1.42003 1.3 1.3 0.9 0.9 0.1 1.0 1.6 1.1 1.2 0.8 1.5 2.1 1.4 3.6 1.2 2.0 1.7 1.4 1.42004 1.2 1.2 0.8 0.9 0.1 1.0 1.5 1.1 1.1 0.6 1.6 1.8 1.4 3.5 0.9 1.7 1.9 1.3 1.32005 1.6 1.1 0.7 0.9 0.1 1.0 1.4 0.9 0.7 0.5 1.6 2.0 1.2 3.4 0.9 1.5 1.3 1.3 1.22006 1.7 1.1 0.9 0.9 0.1 1.0 1.4 0.9 0.5 0.7 1.5 2.1 1.1 3.4 0.9 1.6 1.3 1.4 1.22007 1.9 1.0 0.9 0.9 0.1 1.1 1.4 1.0 0.4 0.8 1.6 2.0 1.2 3.3 0.8 1.6 1.2 1.3 1.22008 2.1 1.0 1.0 1.0 0.0 1.1 1.4 1.0 0.4 1.2 1.6 2.1 1.2 3.5 0.7 1.6 1.7 1.3 1.22009 2.2 1.2 1.0 1.0 0.1 1.1 1.6 1.1 0.2 1.1 1.8 1.1 1.6 3.5 0.7 1.9 1.6 1.4 1.42010 2.6 1.2 1.1 1.0 0.1 1.1 1.6 1.1 0.4 0.8 1.7 1.0 1.6 3.5 0.7 2.0 1.4 1.5 1.4
2011 2.8 1.0 1.1 0.8 0.5 1.1 1.4 1.0 0.5 0.5 1.6 1.0 1.4 3.4 0.7 1.1 0.9 1.4 1.32012 2.7 0.9 0.9 0.9 0.3 1.0 1.5 1.0 0.5 0.5 1.8 1.1 1.3 3.6 0.6 1.0 1.0 1.4 1.22013 2.6 0.9 1.0 0.9 0.3 1.0 1.5 1.1 0.6 0.6 1.8 1.1 1.3 3.4 0.7 1.0 1.1 1.4 1.32014 2.6 0.9 1.1 0.9 0.8 1.1 1.5 1.1 0.6 0.6 1.8 1.4 1.2 3.4 0.7 0.9 1.0 1.4 1.32015 2.7 0.9 1.1 0.9 0.7 1.0 1.5 1.0 0.6 0.6 1.8 1.2 1.2 3.3 0.7 0.9 1.0 1.4 1.2
1) 1970-91 D_W 2) Euro area; 1970-91 including D_W

163
General government (% of GDP at market prices)
67. Subsidies; general governmentESA 1995 (Percentage of GDP at market prices (excessive deficit procedure))
BG CZ DK HR LT HU PL RO SE UK EU-28 EU-27 MK IS TR ME RS US JP 1) 2) 2)
1970 : : : : : : : : : 1.8 : : : : : : : 0.4 :
1971 : : 3.2 : : : : : : 1.7 : : : : : : : 0.4 : 1972 : : 3.6 : : : : : : 1.8 : : : : : : : 0.5 : 1973 : : 1.8 : : : : : : 1.9 : : : : : : : 0.4 : 1974 : : 2.2 : : : : : : 3.5 : : : : : : : 0.2 : 1975 : : 1.5 : : : : : : 3.2 : : : : : : : 0.3 : 1976 : : 1.6 : : : : : : 2.7 : : : : : : : 0.3 : 1977 : : 1.2 : : : : : : 2.2 : : : : : : : 0.3 : 1978 : : 1.3 : : : : : : 2.1 : : : : : : : 0.4 : 1979 : : 1.3 : : : : : : 2.1 : : : : : : : 0.3 : 1980 : : 1.6 : : : : : : 2.1 : : : : : : : 0.3 :
1981 : : 1.7 : : : : : : 2.2 : : : : : : : 0.4 1.41982 : : 1.9 : : : : : : 1.7 : : : : : : : 0.4 1.41983 : : 1.9 : : : : : : 1.7 : : : : : : : 0.6 1.41984 : : 1.7 : : : : : : 1.8 : : : : : : : 0.5 1.31985 : : 1.6 : : : : : : 1.7 : : : : : : : 0.5 1.11986 : : 1.4 : : : : : : 1.2 : : : : : : : 0.5 1.11987 : : 1.4 : : : : : : 1.2 : : : : : : : 0.6 1.01988 : : 2.0 : : : : : : 1.0 : : : : : : : 0.6 0.91989 : : 2.1 : : : : : : 0.8 : : : : : : : 0.5 0.71990 : : 2.2 : : : : : : 0.7 : : : 3.4 : : : 0.5 0.8
1991 2.0 : 2.0 : : 3.8 2.5 : : 0.6 : : : 2.9 : : : 0.4 0.91992 1.8 : 2.7 : : 2.1 2.2 : : 0.7 : : : 3.1 : : : 0.5 0.81993 2.9 : 2.6 : 2.2 1.8 1.9 : 4.4 0.6 : : : 2.3 : : : 0.5 0.81994 1.3 : 2.8 : 1.5 2.4 1.9 : 4.0 0.7 : : : 2.0 : : : 0.4 0.81995 1.1 2.6 2.7 : 1.0 2.2 0.9 3.4 3.6 0.6 : 1.6 : 1.9 : : : 0.5 0.81996 0.9 2.2 2.8 : 1.2 2.1 1.0 3.6 3.1 0.5 : 1.5 : 1.9 : : : 0.4 0.81997 1.0 2.6 2.6 : 0.9 1.7 0.8 2.3 2.6 0.5 : 1.4 : 1.8 : : : 0.4 0.81998 1.9 2.8 2.5 : 1.0 1.7 0.6 1.3 2.1 0.4 : 1.4 : 1.7 : : : 0.4 0.71999 1.6 2.8 2.5 : 1.0 1.9 0.5 1.6 2.0 0.4 : 1.4 : 1.8 : : : 0.5 0.82000 1.0 2.7 2.4 : 0.8 1.7 0.5 1.8 1.6 0.4 : 1.3 : 1.8 : : : 0.4 0.9
2001 1.0 2.6 2.4 : 0.8 1.7 0.4 1.3 1.5 0.4 : 1.3 : 1.8 : : : 0.6 0.82002 0.9 2.2 2.4 : 0.8 1.7 0.4 1.6 1.5 0.5 : 1.3 : 1.8 : : : 0.4 0.72003 1.0 2.5 2.4 : 0.8 1.5 0.3 1.4 1.5 0.6 : 1.2 : 1.9 : : : 0.4 0.92004 1.0 2.0 2.2 : 0.7 1.6 0.6 1.5 1.4 0.5 : 1.2 : 1.8 : : : 0.4 0.72005 0.8 1.7 2.3 : 0.7 1.4 0.6 1.5 1.4 0.6 : 1.1 : 2.0 : : : 0.5 0.62006 0.7 1.8 2.2 : 0.7 1.4 0.6 1.8 1.5 0.7 : 1.1 : 1.7 0.7 : : 0.4 0.62007 0.8 1.7 2.2 : 0.9 1.4 0.6 1.3 1.4 0.7 : 1.1 : 1.8 0.6 : : 0.4 0.52008 1.1 1.6 2.2 : 0.7 1.1 0.6 0.8 1.4 0.7 : 1.1 : 1.8 0.7 : : 0.4 0.52009 1.2 2.0 2.6 2.5 0.6 1.0 0.5 0.7 1.5 0.7 1.3 1.3 : 1.9 1.0 : : 0.4 0.72010 1.2 1.9 2.5 2.5 0.5 1.1 0.5 0.6 1.5 0.7 1.3 1.3 2.6 1.8 0.8 : : 0.4 0.6
2011 1.0 2.1 2.6 2.4 0.4 1.3 0.5 0.4 1.5 0.6 1.2 1.2 4.9 1.8 0.8 : : 0.4 0.62012 0.9 2.0 2.6 2.2 0.3 1.4 0.4 0.4 1.5 0.6 1.2 1.2 4.9 1.8 : : : 0.4 0.62013 1.2 2.0 2.6 2.1 0.3 1.5 0.4 0.3 1.6 0.6 1.2 1.2 4.9 1.8 : 0.6 : 0.3 0.62014 1.1 2.0 2.6 1.9 0.3 1.4 0.3 0.3 1.5 0.6 1.2 1.2 4.9 1.7 : 0.6 : 0.4 0.62015 1.1 2.0 2.5 1.8 0.3 1.4 0.3 0.3 1.5 0.6 1.1 1.1 4.9 1.7 : 0.6 : 0.4 0.6
_________________________________________________________________________________________________________________________________________________________________ 1) Former EU-27 2) SNA 93

164
General government (% of GDP at market prices)
68. Other current expenditure; general governmentESA 1995 (Percentage of GDP at market prices (excessive deficit procedure))
BE DE EE IE EL ES FR IT CY LV LU MT NL AT PT SI SK FI EA-18 1) 2)
1970 2.4 0.8 : : : : : : : : : : 0.6 : : : : : :
1971 2.1 0.8 : : : : : : : : : : 0.8 : : : : : : 1972 2.1 0.9 : : : : : : : : : : 0.8 : : : : : : 1973 2.1 0.9 : : : : : : : : : : 0.9 : : : : : : 1974 1.7 0.9 : : : : : : : : : : 0.8 : : : : : : 1975 1.9 1.0 : : : : : : : : : : 1.1 : : : : 1.4 : 1976 1.7 1.1 : : : : : : : : : : 0.9 2.0 : : : 1.3 : 1977 1.7 1.1 : : : : : : : : : : 1.0 2.0 1.0 : : 1.2 : 1978 1.9 1.2 : : : : 1.6 : : : : : 1.3 2.1 0.9 : : 1.2 : 1979 1.7 1.3 : : : : 1.6 : : : : : 1.0 2.1 0.8 : : 1.2 : 1980 1.7 1.3 : : : : 1.6 0.6 : : : : 0.9 2.1 0.8 : : 1.1 :
1981 1.7 1.2 : : : : 1.7 0.5 : : : : 1.0 2.2 0.7 : : 1.3 : 1982 1.7 1.2 : : : : 1.8 0.5 : : : : 1.0 2.1 0.6 : : 1.3 : 1983 1.8 1.2 : : : : 1.9 0.6 : : : : 0.9 2.3 0.6 : : 1.4 : 1984 1.7 1.3 : : : : 2.0 0.6 : : : : 1.0 2.1 0.6 : : 1.3 : 1985 1.9 1.3 : 2.2 : : 1.9 0.7 : : : : 1.0 2.2 0.7 : : 1.4 : 1986 1.6 1.2 : 2.3 : : 1.8 0.8 : : : : 1.0 2.2 1.2 : : 1.4 : 1987 1.6 1.2 : 2.3 : : 1.8 0.8 : : : : 0.9 2.2 1.8 : : 1.5 : 1988 1.7 1.3 : 2.4 0.6 : 1.9 0.9 : : : : 0.9 2.4 1.1 : : 1.5 : 1989 1.7 1.3 : 2.2 0.9 : 1.9 1.1 : : : : 1.0 2.2 1.1 : : 1.6 : 1990 1.6 3.0 : 0.9 0.8 : 2.0 0.9 : 2.3 2.5 : 0.9 2.2 1.1 : : 1.7 :
1991 6.2
1991 1.8 2.0 : 1.1 0.9 : 2.2 1.1 : 0.4 2.4 : 1.0 2.4 1.4 : : 2.0 : 1992 1.8 1.6 : 1.1 0.9 : 2.4 1.1 : 0.1 2.7 : 1.1 2.3 1.3 : : 2.2 : 1993 1.9 1.8 1.4 1.2 1.2 : 2.9 1.4 : 1.9 2.7 : 1.2 2.6 1.5 : 4.5 2.2 : 1994 2.0 1.6 3.6 1.3 1.1 : 2.7 1.2 : 0.3 2.7 : 1.3 2.6 1.5 : 6.5 1.9 : 1995 1.9 1.5 0.6 1.9 1.2 0.9 2.7 1.0 3.0 1.5 2.4 1.2 1.3 2.4 1.3 1.1 1.1 2.0 1.61996 2.0 1.5 0.8 2.3 1.1 1.0 2.8 1.2 2.9 0.4 2.4 0.9 1.4 2.6 1.4 1.1 1.2 2.2 1.71997 2.0 1.6 0.8 0.8 1.0 1.1 2.7 1.2 1.8 2.0 3.2 1.0 1.4 1.9 1.4 1.3 1.2 2.4 1.71998 2.0 1.6 0.7 0.9 1.1 1.3 2.7 1.9 1.8 2.4 3.3 0.6 1.5 2.1 1.6 1.3 0.9 2.3 1.91999 2.1 1.6 0.8 1.0 1.2 1.3 2.7 1.9 1.7 1.7 3.4 0.9 1.6 2.2 1.6 1.7 1.1 2.3 1.92000 2.0 1.7 0.6 0.9 1.1 1.3 2.7 1.9 1.9 1.6 2.9 1.2 1.8 2.2 1.6 1.8 1.9 2.3 1.9
2001 2.0 1.7 0.6 1.1 1.1 1.3 2.7 1.9 1.8 0.6 2.7 1.5 1.9 3.0 1.7 2.3 1.3 2.2 1.92002 2.1 1.6 0.6 1.1 1.0 1.4 2.9 2.1 1.9 1.3 2.8 0.9 1.9 2.8 2.1 1.9 1.6 2.3 2.02003 2.3 1.8 0.8 1.1 1.4 1.5 3.2 2.2 2.6 0.7 2.9 1.1 1.8 2.9 2.0 1.8 2.6 2.5 2.22004 2.4 1.7 1.3 1.2 1.9 1.5 3.2 2.2 1.8 1.3 3.5 1.8 2.0 2.5 2.2 2.3 1.7 2.5 2.22005 2.4 1.8 1.6 1.2 1.7 1.6 3.3 2.3 2.6 3.4 3.0 1.6 2.0 2.6 2.3 2.6 2.0 2.6 2.32006 2.4 1.8 1.7 1.2 1.6 1.6 3.3 2.2 2.4 4.5 2.8 1.6 2.0 2.4 2.4 2.4 1.6 2.6 2.22007 2.2 1.7 1.5 1.2 1.6 1.5 3.3 2.2 2.8 3.2 2.6 1.7 1.8 2.3 2.3 2.0 1.6 2.5 2.22008 2.3 1.9 1.5 1.3 1.7 1.7 3.4 2.3 3.1 3.7 2.8 1.7 1.9 2.4 2.2 2.2 1.5 2.6 2.32009 2.6 2.1 1.9 1.3 1.6 1.9 3.8 2.5 2.9 3.1 3.1 1.9 1.6 2.7 2.5 2.2 1.9 3.0 2.52010 2.6 2.1 1.7 1.2 1.5 1.7 3.8 2.4 2.5 4.7 3.1 1.9 1.9 2.8 2.8 2.0 1.7 3.0 2.5
2011 2.6 2.1 1.6 1.1 1.3 1.7 3.7 2.3 2.8 3.0 3.4 1.8 1.8 2.7 2.6 2.2 2.0 3.0 2.42012 2.6 2.1 1.6 1.1 1.3 1.5 3.8 2.3 2.7 3.4 3.6 1.9 1.8 2.6 2.6 2.1 1.6 3.0 2.52013 2.7 2.4 1.7 1.3 1.6 1.7 4.0 2.4 2.3 3.3 3.7 2.3 1.9 3.0 2.7 2.7 1.8 3.2 2.62014 2.5 2.5 1.7 1.1 1.2 1.4 3.9 2.3 2.4 3.3 3.6 2.3 1.8 2.9 3.3 2.2 2.6 3.2 2.62015 2.5 2.6 1.7 1.0 1.4 1.4 3.8 2.3 2.3 3.1 3.7 2.1 1.8 2.9 2.9 2.0 2.4 3.1 2.6
1) 1970-91 D_W 2) Euro area; 1970-91 including D_W

165
General government (% of GDP at market prices)
68. Other current expenditure; general governmentESA 1995 (Percentage of GDP at market prices (excessive deficit procedure))
BG CZ DK HR LT HU PL RO SE UK EU-28 EU-27 MK IS TR ME RS US JP 1) 2) 2)
1970 : : : : : : : : : : : : : : : : : 0.4 :
1971 : : 0.7 : : : : : : : : : : : : : : 0.5 : 1972 : : 0.9 : : : : : : : : : : : : : : 0.6 : 1973 : : 1.0 : : : : : : : : : : : : : : 0.4 : 1974 : : 1.0 : : : : : : : : : : : : : : 0.4 : 1975 : : 1.1 : : : : : : : : : : : : : : 0.4 : 1976 : : 1.3 : : : : : : : : : : : : : : 0.2 : 1977 : : 1.4 : : : : : : : : : : : : : : 0.2 : 1978 : : 1.4 : : : : : : : : : : : : : : 0.2 : 1979 : : 1.7 : : : : : : : : : : : : : : 0.2 : 1980 : : 1.7 : : : : : : : : : : : : : : 0.3 :
1981 : : 1.7 : : : : : : : : : : : : : : 0.2 0.81982 : : 1.8 : : : : : : : : : : : : : : 0.2 0.81983 : : 1.8 : : : : : : : : : : : : : : 0.2 0.81984 : : 1.9 : : : : : : : : : : : : : : 0.3 0.81985 : : 2.0 : : : : : : : : : : : : : : 0.3 0.81986 : : 2.2 : : : : : : 1.4 : : : : : : : 0.3 0.71987 : : 2.2 : : : : : : 1.3 : : : : : : : 0.3 0.71988 : : 2.0 : : : : : : 1.4 : : : : : : : 0.3 0.71989 : : 2.0 : : : : : : 1.4 : : : : : : : 0.2 0.81990 : : 1.8 : : : : : : 1.2 : : : 0.0 : : : 0.2 0.8
1991 : : 2.1 : : : 1.9 : : 1.2 : : : 0.0 : : : -0.4 1.01992 : : 2.1 : : : 2.9 : : 1.2 : : : 0.0 : : : 0.3 0.81993 : : 2.5 : 0.5 : 1.3 : 1.9 1.7 : : : 0.0 : : : 0.3 0.91994 : : 2.5 : 2.1 : 1.3 : 2.0 1.8 : : : 0.0 : : : 0.3 0.81995 2.6 1.0 2.6 : 0.1 1.1 1.2 1.6 4.6 1.8 : 1.8 : 1.0 : : : 0.2 0.91996 1.0 1.3 2.8 : 0.1 1.4 1.3 0.9 4.3 1.8 : 1.8 : 1.0 : : : 0.3 0.91997 0.2 0.8 2.8 : 2.0 1.2 1.4 0.6 4.2 1.9 : 1.8 : 1.0 : : : 0.2 0.91998 0.5 0.8 3.0 : 0.7 1.3 1.0 3.4 4.9 2.0 : 2.0 : 1.1 : : : 0.2 1.01999 1.3 0.7 2.9 : 0.6 1.5 0.6 0.4 5.1 2.2 : 2.0 : 1.3 : : : 0.2 1.22000 0.9 0.9 2.9 : 0.1 1.7 0.7 0.5 4.5 2.4 : 2.1 : 1.3 : : : 0.2 1.1
2001 1.3 0.8 3.0 : 0.4 1.7 0.6 1.2 3.9 2.5 : 2.1 : 1.4 : : : 0.2 1.12002 1.4 0.9 2.8 : 0.2 1.9 1.3 1.2 3.7 2.8 : 2.2 : 1.6 : : : 0.2 1.12003 1.3 1.2 2.9 : 0.2 1.8 1.3 1.2 4.1 2.9 : 2.3 : 1.7 : : : 0.2 1.12004 1.3 1.2 2.8 : 0.7 2.2 1.4 1.7 4.3 2.9 : 2.4 : 1.5 : : : 0.3 1.12005 1.5 1.4 2.8 : 1.7 2.4 2.2 0.7 4.3 3.0 : 2.4 : 1.6 : : : 0.3 1.22006 1.1 1.4 2.8 : 1.1 2.7 2.6 1.0 4.2 2.9 : 2.4 : 1.6 : : : 0.3 1.22007 1.8 1.5 2.8 : 1.2 2.7 2.6 1.8 3.8 2.9 : 2.3 : 1.8 : : : 0.3 1.22008 2.6 1.5 2.7 : 1.3 2.4 2.6 1.4 4.2 2.9 : 2.4 : 2.0 : : : 0.3 1.42009 4.4 1.6 3.1 0.9 1.5 2.6 2.3 1.4 4.7 3.3 2.7 2.7 : 2.2 : : : 0.4 2.02010 0.9 1.7 3.0 0.9 1.1 2.5 2.4 1.9 4.2 3.3 2.7 2.7 0.0 1.9 : : : 0.3 1.7
2011 1.5 1.7 3.0 0.8 1.5 2.7 2.4 2.0 4.4 3.1 2.6 2.6 0.0 2.1 : : : 0.4 1.62012 1.8 1.8 3.2 0.9 1.3 2.7 2.5 2.3 4.3 3.0 2.6 2.6 0.0 2.0 : : : 0.3 1.62013 1.9 1.9 3.3 1.4 1.5 3.3 2.6 1.8 4.6 3.1 2.8 2.8 0.0 2.0 : 0.0 : 0.1 1.62014 2.0 1.9 3.3 2.0 1.5 3.5 2.6 1.7 4.6 3.0 2.7 2.7 0.0 2.0 : 0.0 : 0.1 1.52015 2.1 1.9 3.1 2.0 1.5 3.6 2.5 1.7 4.6 2.8 2.7 2.7 0.0 2.0 : 0.0 : 0.1 1.5
_________________________________________________________________________________________________________________________________________________________________ 1) Former EU-27 2) SNA 93

166
General government (% of GDP at market prices)
69. Total current expenditure; general governmentExcessive deficit procedure (Percentage of GDP at market prices (excessive deficit procedure))
BE DE EE IE EL ES FR IT CY LV LU MT NL AT PT SI SK FI EA-18 1) 2)
1970 34.5 30.9 : : : : : : : : : : 36.6 : : : : : :
1971 35.7 32.2 : : : : : : : : : : 38.2 : : : : : : 1972 37.1 33.5 : : : : : : : : : : 39.4 : : : : : : 1973 37.9 34.3 : : : : : : : : : : 39.6 : : : : : : 1974 38.3 36.7 : : : : : : : : : : 40.5 : : : : : : 1975 43.3 40.8 : : : : : : : : : : 44.9 : : : : 33.1 : 1976 43.8 40.4 : : : : : : : : : : 45.3 40.7 : : : 35.1 : 1977 45.7 40.3 : : : : : : : : : : 46.6 40.8 24.8 : : 37.0 : 1978 47.4 40.4 : : : : 40.8 : : : : : 48.0 43.7 25.8 : : 37.1 : 1979 48.4 40.1 : : : : 40.8 : : : : : 48.6 43.2 25.3 : : 36.3 : 1980 49.1 40.6 : : : : 41.8 36.2 : : : : 49.0 43.4 27.4 : : 35.9 :
1981 53.4 42.0 : : : : 44.3 39.5 : : : : 50.2 44.8 30.0 : : 37.1 : 1982 53.8 42.3 : : : : 45.6 41.5 : : : : 53.0 45.9 30.0 : : 38.4 : 1983 54.8 41.6 : : : : 46.3 44.0 : : : : 54.0 46.0 29.6 : : 40.2 : 1984 54.5 41.0 : : : : 47.4 44.1 : : : : 52.3 46.3 30.3 : : 40.7 : 1985 54.2 40.6 : 47.5 : : 47.9 44.5 : : : : 52.0 47.2 31.3 : : 42.5 : 1986 53.8 40.0 : 47.5 : : 47.3 45.0 : : : : 51.5 48.0 34.3 : : 43.3 : 1987 52.2 40.7 : 46.8 : : 46.7 44.3 : : : : 52.7 48.7 33.5 : : 43.9 : 1988 50.2 40.4 : 44.8 35.4 : 45.6 44.9 : : : : 51.4 48.1 31.9 : : 42.2 : 1989 49.6 39.1 : 39.3 36.5 : 44.5 46.3 : : : : 49.9 46.9 31.7 : : 41.2 : 1990 49.7 39.6 : 39.2 38.5 : 44.9 47.4 : 29.1 32.6 : 50.7 46.7 33.8 : : 44.2 :
1991 41.3
1991 50.7 41.7 : 40.7 36.6 : 46.1 49.0 : : 32.8 : 50.9 47.6 36.4 : : 52.8 : 1992 50.8 42.9 : 41.2 38.1 : 47.4 50.6 : 20.0 34.0 : 51.9 48.4 37.0 : : 58.5 : 1993 51.4 44.0 31.2 40.8 40.2 : 50.2 51.9 : 31.2 34.1 : 52.1 51.1 38.7 : : 60.4 : 1994 49.4 44.3 35.2 39.7 41.0 : 49.4 49.6 : 33.7 33.8 : 49.9 50.9 37.8 : 48.0 58.8 : 1995 49.1 44.8 36.0 37.1 41.7 38.5 49.6 47.7 29.2 35.8 34.5 35.0 47.7 51.5 36.9 40.6 40.9 56.0 46.21996 49.5 45.8 34.6 35.7 40.6 38.3 50.3 48.5 31.7 33.8 35.1 36.7 46.1 51.0 37.0 40.0 43.5 55.8 46.71997 48.0 45.2 32.6 33.5 39.7 37.0 50.1 46.6 32.5 34.1 36.4 36.9 44.3 49.4 35.6 40.6 41.7 53.2 45.61998 47.3 44.8 33.5 31.0 38.9 36.2 48.9 44.9 33.2 35.5 35.5 36.8 43.5 49.4 35.6 40.5 39.6 49.8 44.71999 46.8 45.0 35.5 28.3 39.0 35.1 48.5 43.9 33.5 37.3 34.0 36.5 42.6 49.5 36.0 40.8 39.6 48.3 44.22000 45.9 44.3 32.0 26.8 40.6 34.6 47.7 43.2 33.5 33.9 32.7 35.0 41.2 48.5 37.0 41.8 40.1 45.5 43.4
2001 46.5 44.2 30.3 28.0 40.0 33.8 47.7 43.5 34.5 31.5 34.3 37.1 41.3 47.7 37.7 42.7 39.3 45.0 43.32002 47.1 44.6 30.1 28.6 40.0 33.8 49.0 43.4 36.4 32.4 35.4 37.3 42.0 47.2 38.6 42.2 38.6 45.9 43.72003 47.8 45.2 30.1 28.8 39.5 33.6 49.5 43.7 40.5 32.1 35.9 37.9 42.9 48.0 39.9 41.7 37.1 47.1 44.12004 46.5 44.1 30.2 29.3 39.9 33.6 49.2 43.5 38.2 31.7 36.7 39.6 42.5 47.0 40.5 41.1 34.8 46.9 43.52005 46.5 44.0 29.6 29.6 40.1 33.5 49.3 43.8 39.5 30.8 35.6 38.7 41.3 46.6 42.0 41.1 34.2 47.3 43.42006 45.9 42.6 28.5 29.9 40.4 33.3 48.8 43.5 38.8 31.2 33.3 38.5 42.2 45.8 41.7 40.1 33.6 46.5 42.82007 45.4 40.9 28.0 31.1 42.2 33.8 48.4 43.6 37.3 29.1 31.7 37.8 41.6 44.8 41.0 37.2 31.5 44.7 42.22008 47.1 41.2 33.1 35.7 44.8 36.0 49.1 44.9 38.2 33.4 34.6 40.0 42.2 45.8 41.7 38.5 31.8 46.3 43.22009 50.3 45.2 39.1 41.0 48.8 40.4 52.3 47.5 40.7 37.8 39.7 39.4 46.3 48.9 45.8 43.1 37.0 52.6 47.02010 49.7 43.9 37.1 41.3 47.3 41.2 52.6 47.2 40.9 37.5 38.0 37.8 46.6 48.7 45.7 44.5 36.3 52.6 46.7
2011 50.1 42.4 34.0 40.2 48.6 41.6 51.9 46.7 41.7 33.1 37.6 38.2 45.9 47.3 45.4 44.8 35.2 51.9 46.02012 51.2 42.1 33.2 40.1 46.7 41.5 52.6 47.6 42.0 31.4 39.1 39.6 46.4 47.6 44.4 44.7 35.1 53.4 46.22013 51.8 42.3 33.4 40.6 43.4 42.3 53.0 48.1 42.1 31.8 39.2 39.8 46.6 48.1 46.2 45.1 36.0 55.0 46.62014 51.1 42.2 33.8 38.6 43.6 41.7 52.9 47.6 44.3 31.6 38.8 40.3 45.5 47.9 45.0 44.4 35.8 55.5 46.22015 51.4 42.1 33.6 37.4 41.8 40.9 52.4 47.2 43.3 30.8 39.7 39.7 45.7 47.5 43.5 43.5 35.1 55.2 45.9
1) 1970-91 D_W 2) Euro area; 1970-91 including D_W

167
General government (% of GDP at market prices)
69. Total current expenditure; general governmentExcessive deficit procedure (Percentage of GDP at market prices (excessive deficit procedure))
BG CZ DK HR LT HU PL RO SE UK EU-28 EU-27 MK IS TR ME RS US JP 1) 2) 2)
1970 : : : : : : : : : : : : : : : : : 29.5 :
1971 : : 37.5 : : : : : : : : : : : : : : 30.2 : 1972 : : 38.1 : : : : : : : : : : : : : : 30.1 : 1973 : : 35.7 : : : : : : : : : : : : : : 29.2 : 1974 : : 39.5 : : : : : : : : : : : : : : 30.2 : 1975 : : 41.2 : : : : : : : : : : : : : : 32.2 : 1976 : : 40.9 : : : : : : : : : : : : : : 31.0 : 1977 : : 41.7 : : : : : : : : : : : : : : 30.2 : 1978 : : 43.4 : : : : : : : : : : : : : : 29.3 : 1979 : : 45.9 : : : : : : : : : : : : : : 29.0 : 1980 : : 49.1 : : : : : : : : : : : : : : 30.7 :
1981 : : 52.6 : : : : : : : : : : : : : : 31.0 26.41982 : : 54.2 : : : : : : : : : : : : : : 33.0 27.11983 : : 55.0 : : : : : : : : : : : : : : 33.0 27.91984 : : 54.4 : : : : : : : : : : : : : : 31.7 27.51985 : : 53.2 : : : : : : : : : : : : : : 31.9 27.01986 : : 50.6 : : : : : : 41.5 : : : : : : : 32.2 27.01987 : : 52.1 : : : : : : 39.9 : : : : : : : 31.8 27.11988 : : 54.1 : : : : : : 37.7 : : : : : : : 31.1 26.21989 : : 54.3 : : : : : : 36.6 : : : : : : : 31.3 25.41990 : : 53.0 : : : : : : 36.5 : : : 34.6 : : : 31.9 25.6
1991 : : 53.8 : : : : : : 38.8 : : : 35.3 : : : 32.7 25.51992 : : 54.5 : : : : : : 41.0 : : : 36.8 : : : 33.7 25.81993 : : 57.7 : : : : : 65.5 41.1 : : : 36.9 : : : 33.3 26.71994 : : 57.6 : : : : : 64.7 40.5 : : : 36.5 : : : 32.3 27.51995 44.5 34.0 56.8 : 29.9 49.5 43.7 29.5 60.6 39.9 : 45.8 : 37.5 : : : 32.4 28.61996 48.3 33.7 56.3 : 31.5 46.8 42.6 28.7 59.3 39.1 : 46.0 : 36.7 : : : 31.6 29.01997 32.1 34.7 54.2 : 35.2 45.0 41.8 31.4 57.0 37.9 : 44.7 : 35.6 : : : 30.6 29.11998 33.9 33.9 53.9 : 37.4 43.9 39.5 32.9 56.5 37.1 : 43.7 : 35.8 : : : 29.7 30.31999 35.7 35.5 53.1 : 37.3 44.3 38.8 36.1 54.7 36.6 : 43.2 : 36.4 : : : 29.1 31.72000 37.3 35.5 51.3 : 35.0 41.7 38.2 34.1 52.2 36.9 : 42.4 : 36.9 : : : 28.7 32.1
2001 36.8 35.6 51.9 : 33.1 41.2 39.8 32.1 51.6 37.6 : 42.4 : 37.1 : : : 29.7 32.62002 35.6 37.0 52.3 : 31.4 42.5 40.2 30.5 52.1 38.6 : 42.9 : 39.5 : : : 30.5 33.42003 35.7 38.6 52.9 : 30.3 44.1 40.2 28.6 52.3 39.2 : 43.4 : 41.0 : : : 30.9 33.32004 35.0 36.2 52.1 : 30.0 44.3 38.7 28.5 50.9 40.0 : 43.0 : 39.3 : : : 30.6 33.02005 33.4 35.9 50.5 : 30.2 44.7 39.0 28.7 50.4 40.7 : 43.0 : 38.3 : : : 30.7 33.12006 30.5 35.5 49.2 : 29.6 45.8 39.0 28.9 49.4 40.7 : 42.4 : 37.1 : : : 30.7 33.22007 30.9 35.1 48.5 : 29.2 45.1 37.3 30.5 47.8 40.4 : 41.8 : 37.5 : : : 31.3 33.32008 32.7 34.9 48.7 : 32.4 45.1 37.7 31.6 48.4 41.9 : 42.8 : 39.5 : : : 32.8 34.62009 36.3 38.3 55.4 41.1 40.4 47.1 38.4 34.8 51.1 45.8 46.6 46.6 : 46.2 : : : 36.1 38.42010 32.5 38.2 54.5 41.3 37.2 45.2 39.0 33.5 48.5 46.2 46.3 46.3 30.0 44.1 : : : 36.4 37.9
2011 31.9 38.1 54.2 42.1 33.8 44.1 37.2 31.5 47.7 44.9 45.4 45.4 28.5 43.8 : : : 35.5 39.12012 31.8 38.1 54.5 42.0 32.2 43.7 37.2 30.9 48.1 45.2 45.7 45.7 29.2 43.9 : : : 34.5 39.12013 34.1 38.5 54.1 42.0 30.9 44.6 37.7 29.6 49.0 44.5 45.9 45.9 29.9 43.2 : 17.1 : 33.5 39.32014 34.5 38.3 53.8 42.7 30.4 44.5 37.2 29.6 48.6 43.1 45.3 45.4 30.1 41.5 : 16.4 : 33.2 39.02015 34.6 37.9 53.2 42.2 29.6 43.8 37.0 29.4 47.7 41.8 44.8 44.8 30.2 41.2 : 14.7 : 33.2 38.6
_________________________________________________________________________________________________________________________________________________________________ 1) Former EU-27 2) SNA 93

168
General government (% of GDP at market prices)
70. Gross saving; general governmentExcessive deficit procedure (Percentage of GDP at market prices (excessive deficit procedure))
BE DE EE IE EL ES FR IT CY LV LU MT NL AT PT SI SK FI EA-18 1) 2)
1970 3.1 6.6 : : : : : : : : : : 4.6 : : : : : :
1971 2.6 6.2 : : : : : : : : : : 4.4 : : : : : : 1972 1.1 5.3 : : : : : : : : : : 4.4 : : : : : : 1973 1.3 6.4 : : : : : : : : : : 5.4 : : : : : : 1974 1.9 4.3 : : : : : : : : : : 4.3 : : : : : : 1975 -0.2 0.1 : : : : : : : : : : 2.8 : : : : 10.3 : 1976 -0.6 1.9 : : : : : : : : : : 3.2 3.0 : : : 12.3 : 1977 -0.7 2.7 : : : : : : : : : : 3.5 3.9 0.9 : : 10.8 : 1978 -1.5 2.5 : : : : 2.2 : : : : : 2.3 3.5 -1.6 : : 8.0 : 1979 -2.3 2.5 : : : : 3.9 : : : : : 2.4 3.2 -0.9 : : 7.4 : 1980 -4.1 2.1 : : : : 3.9 -2.7 : : : : 2.0 4.0 -2.1 : : 8.0 :
1981 -7.7 0.7 : : : : 1.8 -6.2 : : : : 1.1 4.1 -3.3 : : 9.2 : 1982 -6.9 0.8 : : : : 1.6 -5.8 : : : : -0.4 2.0 -1.4 : : 7.4 : 1983 -7.4 1.1 : : : : 1.4 -6.5 : : : : -0.4 1.5 -0.1 : : 5.8 : 1984 -6.6 1.8 : : : : 1.3 -7.2 : : : : 0.1 2.8 -1.6 : : 7.1 : 1985 -6.2 2.5 : -6.5 : : 0.9 -7.5 : : : : 1.4 2.7 -2.6 : : 7.1 : 1986 -6.4 2.4 : -6.5 : : 0.6 -7.0 : : : : 0.6 1.6 -3.6 : : 7.7 : 1987 -4.7 1.7 : -5.4 : : 1.5 -6.4 : : : : 0.1 0.6 -3.5 : : 5.7 : 1988 -3.9 1.4 : -2.7 -7.0 : 1.5 -6.0 : : : : 0.4 1.4 -0.3 : : 9.5 : 1989 -5.2 3.4 : -0.9 -8.5 : 2.3 -6.6 : : : : -0.7 1.5 0.3 : : 10.2 : 1990 -4.5 1.3 : -1.1 -8.3 : 2.2 -6.4 : 9.1 9.3 : -1.4 2.2 -2.7 : : 9.3 :
1991 0.8
1991 -5.0 1.4 : -1.4 -5.5 : 1.3 -6.9 : : 6.1 : 1.0 1.9 -3.7 : : 3.2 : 1992 -5.5 1.6 : -1.4 -6.0 : -0.1 -8.0 : 3.5 5.7 : -0.7 2.8 -0.8 : : -1.7 : 1993 -4.4 0.8 14.4 -1.2 -7.0 : -1.7 -6.7 : 5.0 7.0 : 0.5 0.6 -3.7 : -3.1 -4.0 : 1994 -2.3 0.9 10.9 0.4 -5.8 : -1.0 -5.9 : 2.3 7.5 : -0.3 0.1 -4.1 : 1.7 -2.0 : 1995 -2.0 0.1 5.9 -0.2 -6.1 -2.0 -0.9 -3.8 3.2 0.9 7.4 -0.8 -0.8 -1.3 -1.7 3.3 4.3 -0.8 -1.21996 -1.6 -0.5 4.2 1.6 -4.7 -1.2 -0.1 -3.7 0.4 2.1 7.1 -5.5 0.9 0.5 -0.7 3.0 0.1 0.7 -1.01997 0.3 -0.2 6.7 2.8 -2.4 0.2 0.0 -0.3 -1.1 1.7 7.7 -3.9 1.6 1.9 0.6 1.5 0.9 1.7 0.11998 1.6 0.4 4.7 4.2 -0.3 1.1 1.0 0.4 -0.8 2.2 8.6 -5.6 2.0 1.7 0.8 2.3 0.8 4.5 0.91999 2.0 1.2 0.9 6.7 0.6 2.7 2.0 1.5 -1.2 -0.3 8.5 -2.9 3.4 1.3 1.2 2.1 0.9 4.8 1.92000 2.6 1.5 3.5 7.8 -0.1 3.1 2.1 1.3 1.1 0.2 10.7 -2.4 4.5 1.4 0.4 0.8 -0.3 9.4 2.2
2001 2.4 0.0 4.3 5.0 -0.1 3.6 2.0 0.7 1.1 1.3 9.8 -2.5 3.5 3.2 -0.8 0.4 -1.4 7.7 1.62002 1.9 -0.9 5.7 3.4 -0.6 4.0 0.2 0.1 -0.9 1.0 8.1 -1.8 1.7 2.3 -0.5 1.4 -1.9 6.8 0.62003 0.6 -1.3 6.0 3.6 -1.8 3.8 -0.7 -1.0 -2.6 1.1 6.1 -1.8 0.7 1.4 -1.4 1.8 0.2 5.3 -0.12004 1.5 -1.2 5.1 4.6 -3.1 4.3 -0.1 -0.5 -0.7 2.7 4.5 -2.5 1.4 2.0 -2.4 2.2 0.3 5.2 0.32005 1.8 -0.8 5.3 4.8 -2.7 5.4 0.3 -0.8 0.2 3.5 5.7 -1.5 2.8 1.4 -3.2 2.4 1.0 5.3 0.72006 2.1 0.7 6.8 6.1 -3.7 6.7 1.3 1.3 2.5 5.4 6.5 -1.2 3.5 1.5 -1.9 2.7 -0.2 6.3 2.02007 2.0 2.5 7.6 4.2 -4.1 6.8 1.1 2.1 7.4 5.5 8.0 0.4 3.4 2.6 -0.6 4.7 0.7 7.7 2.62008 1.0 2.4 3.2 -1.5 -6.4 0.6 0.6 0.8 4.9 0.4 7.5 -2.1 4.2 2.4 -1.3 3.6 0.8 6.8 1.32009 -2.9 -0.4 2.0 -7.5 -11.9 -5.3 -3.3 -2.1 -0.7 -4.4 4.6 -1.7 -0.8 -0.5 -6.9 -1.0 -4.0 0.5 -2.62010 -1.8 -0.7 2.1 -7.5 -9.0 -4.6 -3.3 -1.5 -0.1 -3.7 4.6 -1.8 -0.7 -0.4 -6.9 -1.0 -4.6 0.0 -2.3
2011 -1.4 1.5 3.3 -6.8 -8.8 -5.4 -1.5 -1.3 -1.9 0.2 5.0 -1.3 -0.6 0.9 -4.9 -1.3 -1.8 1.8 -1.12012 -1.2 2.2 4.2 -6.2 -4.9 -4.5 -1.1 -0.3 -2.7 2.0 4.6 -1.9 -0.3 1.4 -5.0 -0.4 -2.2 0.8 -0.42013 -0.9 2.0 3.3 -5.4 -0.9 -4.9 -0.5 -0.9 -1.8 1.7 4.2 -0.8 0.4 1.3 -3.4 -0.8 -0.8 0.6 -0.32014 -1.1 1.9 2.8 -3.8 0.0 -3.7 -0.3 -0.4 -3.0 1.4 3.9 -1.1 1.1 1.5 -3.0 -0.1 -1.0 0.5 0.02015 -1.1 1.8 2.7 -2.7 0.9 -4.2 0.0 0.1 -3.3 1.2 2.7 -0.7 1.7 1.8 -1.4 0.2 -0.7 1.4 0.2
1) 1970-91 D_W 2) Euro area; 1970-91 including D_W

169
General government (% of GDP at market prices)
70. Gross saving; general governmentExcessive deficit procedure (Percentage of GDP at market prices (excessive deficit procedure))
BG CZ DK HR LT HU PL RO SE UK EU-28 EU-27 MK IS TR ME RS US JP 1) 2) 2)
1970 : : : : : : : : : 8.8 : : : : : : : 0.6 :
1971 : : 9.3 : : : : : : 7.1 : : : : : : : -0.8 : 1972 : : 8.7 : : : : : : 3.9 : : : : : : : 0.2 : 1973 : : 8.4 : : : : : : 3.1 : : : : : : : 1.3 : 1974 : : 7.5 : : : : : : 2.8 : : : : : : : 0.9 : 1975 : : 2.4 : : : : : : 1.5 : : : : : : : -2.6 : 1976 : : 3.8 : : : : : : 0.8 : : : : : : : -0.8 : 1977 : : 3.7 : : : : : : 1.2 : : : : : : : 0.1 : 1978 : : 3.6 : : : : : : -0.3 : : : : : : : 1.1 : 1979 : : 2.5 : : : : : : 0.0 : : : : : : : 1.6 : 1980 : : 0.7 : : : : : : 0.3 : : : : : : : 0.4 :
1981 : : -2.7 : : : : : : -0.2 : : : : : : : 0.7 3.31982 : : -5.0 : : : : : : 0.4 : : : : : : : -1.7 2.81983 : : -3.6 : : : : : : -0.1 : : : : : : : -2.3 2.31984 : : -1.6 : : : : : : -0.3 : : : : : : : -1.1 3.31985 : : 0.4 : : : : : : 0.1 : : : : : : : -0.9 4.01986 : : 4.7 : : : : : : 0.0 : : : : : : : -1.0 4.01987 : : 4.0 : : : : : : 0.5 : : : : : : : 0.2 5.21988 : : 3.1 : : : : : : 2.5 : : : : : : : 0.5 6.21989 : : 1.9 : : : : : : 3.3 : : : : : : : 0.6 7.01990 : : 0.5 : : : : : : 2.2 : : : : : : : -0.2 7.7
1991 -7.0 : -1.1 : : : -2.7 : : 0.2 : : : : : : : -1.1 7.61992 0.0 : -0.4 : : : -2.1 : : -3.3 : : : : : : : -2.5 7.11993 -6.1 : -1.8 : : : -0.1 : -5.1 -4.8 : : : : : : : -2.0 5.01994 -3.2 : -1.2 : : : 1.1 : -4.3 -3.8 : : : : : : : -0.8 3.91995 -7.1 5.7 -0.9 : 3.0 -2.8 -0.5 2.3 -3.2 -2.9 : -1.4 : 2.1 : : : -0.6 2.91996 -10.6 4.6 0.1 : 1.7 -0.3 0.0 0.9 0.1 -2.0 : -1.0 : 3.7 : : : 0.5 3.01997 2.5 4.2 1.4 : 3.3 -1.0 0.0 -1.2 1.9 -0.5 : 0.1 : 4.9 : : : 1.7 3.11998 5.6 4.1 1.9 : 0.7 -0.6 0.6 -0.4 2.9 1.5 : 1.1 : 4.9 : : : 2.8 1.51999 4.2 3.1 3.1 : 0.6 -0.8 1.6 -1.3 4.1 2.5 : 2.0 : 6.7 : : : 3.3 0.12000 3.3 2.3 4.0 : 1.6 2.6 -0.1 -0.3 6.3 2.7 : 2.4 : 6.6 : : : 4.1 0.0
2001 4.7 2.4 3.0 : 0.7 2.0 -1.2 0.5 4.4 2.4 : 1.7 : 4.7 : : : 2.0 0.32002 2.7 1.9 1.9 : 1.7 -0.5 -1.0 2.4 1.9 -0.1 : 0.5 : 2.1 : : : -1.1 -1.82003 2.9 1.3 1.6 : 1.8 -2.1 -1.8 3.3 1.9 -1.2 : -0.2 : 1.7 : : : -2.1 -2.22004 5.3 3.8 3.5 : 2.0 -2.1 -1.5 3.4 3.5 -1.2 : 0.2 : 4.7 : : : -1.7 -2.42005 4.6 3.5 6.7 : 2.5 -3.2 -0.2 3.4 5.3 -1.1 : 0.6 : 8.7 : : : -0.3 -1.12006 5.3 3.5 6.8 : 3.1 -4.0 0.7 4.3 5.5 -0.3 : 1.8 : 10.8 4.5 : : 0.6 0.42007 7.9 4.4 6.5 : 3.6 -0.4 2.5 3.6 6.7 -0.3 : 2.3 : 10.1 2.6 : : 0.3 0.62008 6.3 3.2 5.5 : 1.0 -0.2 1.3 1.2 5.4 -1.6 : 1.1 : 4.6 1.7 : : -2.7 -0.12009 -0.4 -0.9 -0.5 -0.4 -6.6 -1.7 -1.8 -3.0 2.8 -6.7 -2.9 -2.9 : -5.3 -2.3 : : -7.6 -5.82010 0.3 -0.6 -0.1 -0.9 -4.8 -2.3 -2.7 -0.9 3.7 -6.6 -2.6 -2.7 0.4 -2.6 1.0 : : -7.5 -5.4
2011 0.4 0.5 0.7 -2.1 -2.9 -2.4 -0.6 1.8 3.6 -4.8 -1.4 -1.4 0.7 -2.0 2.8 : : -6.4 -5.32012 1.5 1.1 0.5 -2.1 -1.5 0.0 -0.2 2.0 2.7 -5.2 -1.0 -1.0 0.2 -0.4 : : : -5.4 -4.92013 0.7 1.5 1.6 -1.2 -0.3 -0.3 -1.2 2.5 2.1 -3.5 -0.6 -0.6 -0.6 0.9 : : : -2.6 -4.72014 0.6 1.0 1.2 -0.7 0.0 -0.4 -0.6 2.5 2.1 -2.9 -0.3 -0.3 -0.7 2.3 : : : -1.9 -3.02015 0.8 0.7 -0.6 0.4 0.5 -0.4 -0.2 2.8 2.8 -1.9 0.0 -0.1 -0.4 1.8 : : : -1.3 -2.1
_________________________________________________________________________________________________________________________________________________________________ 1) Former EU-27 2) SNA 93

170
General government (% of GDP at market prices)
71. Capital transfers received; general governmentESA 1995 (Percentage of GDP at market prices (excessive deficit procedure))
BE DE EE IE EL ES FR IT CY LV LU MT NL AT PT SI SK FI EA-18 1) 2)
1970 0.4 0.3 : : : : : : : : : : 0.4 : : : : : :
1971 0.4 0.4 : : : : : : : : : : 0.4 : : : : : : 1972 0.3 0.5 : : : : : : : : : : 0.3 : : : : : : 1973 0.3 0.5 : : : : : : : : : : 0.4 : : : : : : 1974 0.3 0.5 : : : : : : : : : : 0.4 : : : : : : 1975 0.3 0.6 : : : : : : : : : : 0.4 : : : : 0.1 : 1976 0.3 0.7 : : : : : : : : : : 0.6 0.1 : : : 0.1 : 1977 0.4 0.5 : : : : : : : : : : 0.2 0.1 0.2 : : 0.1 : 1978 0.4 0.5 : : : : 0.0 : : : : : 0.3 0.1 0.3 : : 0.1 : 1979 0.4 0.5 : : : : -0.2 : : : : : 0.3 0.1 0.2 : : 0.1 : 1980 0.4 0.5 : : : : 0.0 0.2 : : : : 0.3 0.1 0.1 : : 0.1 :
1981 0.4 0.5 : : : : 0.1 0.3 : : : : 0.3 0.1 0.2 : : 0.1 : 1982 0.3 0.4 : : : : -0.3 0.8 : : : : 0.2 0.1 0.2 : : 0.1 : 1983 0.3 0.4 : : : : 0.0 1.2 : : : : 0.2 0.1 0.3 : : 0.1 : 1984 0.3 0.3 : : : : -0.2 0.5 : : : : 0.3 0.1 0.7 : : 0.1 : 1985 0.3 0.3 : 1.0 : : 0.0 0.3 : : : : 0.3 0.1 0.4 : : 0.3 : 1986 0.3 0.3 : 0.8 : : 0.1 0.3 : : : : 0.3 0.1 0.7 : : 0.1 : 1987 0.3 0.3 : 1.1 : : 0.4 0.2 : : : : 0.3 0.1 0.7 : : 0.1 : 1988 0.3 0.3 : 1.0 0.7 : 0.2 0.3 : : : : 0.3 0.1 1.0 : : 0.1 : 1989 0.3 0.3 : 1.0 0.7 : 0.2 0.3 : : : : 0.3 0.1 1.3 : : 0.1 : 1990 0.3 0.3 : 1.5 0.9 : 0.0 0.2 : : 0.1 : 0.3 0.1 1.3 : : 0.2 :
1991 0.3
1991 0.4 0.3 : 1.7 1.1 : 0.3 0.3 : 0.0 0.1 : 0.3 0.1 1.6 : : 0.2 : 1992 0.3 0.3 : 1.6 1.5 : 0.1 2.1 : 0.4 0.1 : 0.3 0.1 1.9 : : 0.2 : 1993 0.4 0.4 0.0 1.8 1.6 : 0.1 0.9 : 0.5 0.2 : 0.3 0.1 1.7 : 1.1 0.3 : 1994 0.4 0.4 0.0 1.4 1.5 : 0.2 0.4 : 0.5 0.2 : 0.4 0.1 1.6 : 1.6 0.2 : 1995 0.4 0.5 0.4 1.8 1.4 0.7 0.2 0.8 0.1 0.2 0.2 0.7 0.3 0.2 1.3 0.1 0.0 0.2 0.51996 0.5 0.4 0.3 1.6 1.9 0.6 0.3 0.4 0.1 0.7 0.1 2.0 0.5 0.2 1.3 0.1 0.2 0.3 0.51997 0.6 0.4 0.3 1.8 2.0 0.5 0.8 1.0 0.1 1.8 0.2 1.0 0.3 0.3 1.7 0.1 0.0 0.3 0.71998 0.5 0.4 0.4 1.5 2.2 0.7 0.2 0.7 0.1 1.5 0.3 0.9 0.4 0.1 1.2 0.3 0.0 0.3 0.51999 0.6 0.4 0.3 1.6 2.1 0.9 0.3 0.5 0.1 0.8 0.2 1.1 0.4 0.2 1.1 0.2 0.2 0.4 0.52000 0.5 0.4 0.4 1.5 2.9 0.6 0.3 0.4 0.1 0.7 0.2 1.1 0.4 0.2 0.9 0.2 0.1 0.4 0.5
2001 0.6 0.4 0.2 1.2 1.5 0.7 0.2 0.3 0.1 0.1 0.2 0.3 0.4 0.2 1.4 0.2 0.1 0.4 0.42002 0.5 0.4 0.3 1.3 1.2 0.8 0.4 0.4 0.0 0.3 0.2 0.5 0.4 0.2 1.6 0.2 0.1 0.4 0.52003 2.4 0.4 0.4 1.3 1.7 0.8 0.5 1.7 0.1 0.1 0.2 0.5 0.4 0.2 2.4 0.1 0.0 0.4 0.82004 0.9 0.4 0.3 1.2 1.7 0.9 0.5 0.9 0.8 0.5 0.2 1.9 0.4 0.2 3.3 0.1 0.2 0.4 0.72005 0.9 0.4 0.3 1.2 1.6 0.8 1.0 0.4 1.0 1.1 0.2 3.5 0.4 0.2 1.3 0.1 0.0 0.4 0.72006 0.8 0.4 0.8 1.4 2.5 0.7 0.5 0.3 0.1 1.1 0.2 3.2 0.4 0.2 0.8 0.1 0.0 0.4 0.52007 0.7 0.4 0.8 1.5 2.6 0.5 0.3 0.3 0.1 0.7 0.2 1.3 0.4 0.2 0.8 0.3 0.2 0.4 0.52008 0.7 0.4 0.4 1.2 2.3 0.3 0.2 0.3 0.1 0.9 0.2 0.8 0.3 0.1 0.7 0.1 0.2 0.5 0.42009 0.7 0.4 1.7 1.0 1.4 0.0 0.2 1.0 0.1 1.1 0.2 1.1 0.4 0.1 0.7 0.1 0.5 0.4 0.52010 0.8 0.4 1.4 1.0 2.1 0.1 0.2 0.4 0.1 1.5 0.2 1.8 0.4 0.1 2.8 0.1 0.6 0.4 0.4
2011 0.8 0.4 1.4 0.7 2.4 0.0 0.3 0.7 0.1 1.5 0.2 1.8 0.3 0.1 4.6 0.0 0.8 0.3 0.52012 1.0 0.4 1.9 0.7 2.6 0.1 0.3 0.4 0.1 1.7 0.2 2.2 0.3 0.1 1.5 0.1 0.8 0.3 0.42013 1.2 0.4 1.5 0.7 3.4 0.3 0.2 0.6 0.0 1.7 0.2 2.1 0.3 0.3 0.9 0.4 0.7 0.4 0.52014 1.3 0.5 1.3 0.9 2.3 0.1 0.3 0.5 0.0 1.4 0.2 2.4 0.3 0.2 1.1 0.9 0.2 0.4 0.52015 1.1 0.4 1.3 0.5 1.8 0.1 0.3 0.4 0.0 1.1 0.2 2.4 0.3 0.1 1.1 0.7 0.3 0.4 0.4
1) 1970-91 D_W 2) Euro area; 1970-91 including D_W

171
General government (% of GDP at market prices)
71. Capital transfers received; general governmentESA 1995 (Percentage of GDP at market prices (excessive deficit procedure))
BG CZ DK HR LT HU PL RO SE UK EU-28 EU-27 MK IS TR ME RS US JP 1) 2) 2)
1970 : : : : : : : : : 0.8 : : : : : : : 0.4 :
1971 : : 0.3 : : : : : : 0.7 : : : : : : : 0.5 : 1972 : : 0.3 : : : : : : 0.8 : : : : : : : 0.5 : 1973 : : 0.4 : : : : : : 0.6 : : : : : : : 0.5 : 1974 : : 0.4 : : : : : : 0.4 : : : : : : : 0.4 : 1975 : : 0.4 : : : : : : 0.3 : : : : : : : 0.4 : 1976 : : 0.5 : : : : : : 0.3 : : : : : : : 0.4 : 1977 : : 0.6 : : : : : : 0.3 : : : : : : : 0.4 : 1978 : : 0.6 : : : : : : 0.2 : : : : : : : 0.3 : 1979 : : 0.5 : : : : : : 0.2 : : : : : : : 0.3 : 1980 : : 0.6 : : : : : : 0.2 : : : : : : : 0.3 :
1981 : : 0.5 : : : : : : 0.3 : : : : : : : 0.3 0.61982 : : 0.3 : : : : : : 0.3 : : : : : : : 0.3 0.61983 : : 0.3 : : : : : : 0.2 : : : : : : : 0.2 0.71984 : : 0.3 : : : : : : 0.2 : : : : : : : 0.2 0.71985 : : 0.5 : : : : : : 0.3 : : : : : : : 0.2 0.61986 : : 0.3 : : : : : : 0.3 : : : : : : : 0.2 0.71987 : : 0.4 : : : : : : 0.3 : : : : : : : 0.2 0.81988 : : 0.4 : : : : : : 0.3 : : : : : : : 0.2 0.91989 : : 0.3 : : : : : : 0.3 : : : : : : : 0.2 0.71990 : : 0.6 : 0.0 : : : : 0.3 : : : 0.1 : : : 0.3 0.8
1991 2.1 : 0.4 : 0.0 : 0.0 : : 0.3 : : : 0.2 : : : 0.3 0.71992 2.8 : 0.4 : 0.0 : 0.0 : : 0.3 : : : 0.2 : : : 0.2 0.91993 2.1 : 0.5 : 0.1 : 0.0 : 0.2 0.2 : : : 0.2 : : : 0.3 0.91994 2.2 : 0.4 : 0.3 : 8.5 : 0.1 0.3 : : : 0.2 : : : 0.3 0.91995 0.2 0.5 0.5 : 0.0 0.3 0.1 0.3 0.2 0.2 : 0.5 : 0.2 : : : 0.3 0.81996 0.2 0.2 0.4 : 0.0 0.5 3.6 0.0 0.1 0.3 : 0.5 : 0.2 : : : 0.3 0.81997 0.1 0.1 0.5 : 0.0 0.4 0.0 0.0 0.2 0.3 : 0.6 : 0.2 : : : 0.3 0.71998 0.1 0.1 0.5 : 0.0 0.4 0.0 0.0 0.2 0.2 : 0.4 : 0.1 : : : 0.4 0.71999 0.1 0.1 0.6 : 0.1 0.4 0.0 0.0 0.2 0.2 : 0.4 : 0.1 : : : 0.4 0.72000 0.1 0.2 0.5 : 0.1 0.4 0.0 0.1 0.2 0.3 : 0.4 : 0.1 : : : 0.3 0.7
2001 0.1 0.3 0.5 : 0.1 0.5 0.0 0.1 0.2 0.3 : 0.4 : 0.1 : : : 0.4 0.62002 0.1 0.1 0.6 : 0.5 0.5 0.0 0.1 0.2 0.3 : 0.4 : 0.1 : : : 0.3 0.62003 0.2 3.4 0.5 : 0.4 0.4 0.0 0.0 0.2 0.3 : 0.7 : 0.1 : : : 0.2 0.62004 0.2 0.4 0.8 : 0.5 0.4 0.1 0.4 0.2 0.3 : 0.6 : 0.1 : : : 0.2 1.72005 0.3 0.4 0.6 : 0.8 0.6 0.6 0.3 0.1 0.4 : 0.6 : 0.1 : : : 0.2 1.22006 0.4 0.6 0.7 : 1.0 0.9 0.5 0.1 0.1 0.4 : 0.5 : 0.1 0.1 : : 0.2 2.82007 1.5 0.8 0.6 : 1.5 0.9 0.5 1.2 0.1 0.4 : 0.5 : 0.1 0.3 : : 0.2 1.42008 1.1 0.8 0.6 : 1.1 0.6 0.5 0.8 0.1 1.8 : 0.6 : 0.0 0.1 : : 0.2 2.32009 1.3 1.4 0.5 0.1 1.7 1.5 0.6 0.3 0.1 0.4 0.5 0.5 : 0.0 0.1 : : 0.2 2.32010 1.5 1.5 0.5 0.1 2.7 2.7 1.3 0.7 0.1 0.2 0.5 0.5 0.0 0.0 0.3 : : 0.1 1.6
2011 1.3 1.4 0.8 0.3 2.3 12.6 1.8 0.7 0.1 0.2 0.6 0.6 0.0 0.0 0.1 : : 0.1 1.12012 1.7 1.1 0.5 0.8 2.0 2.8 1.3 0.8 0.4 2.1 0.7 0.7 0.0 0.0 : : : 0.1 0.92013 2.3 1.0 0.5 0.2 1.7 3.3 1.0 0.6 0.4 0.3 0.5 0.5 0.0 0.0 : 0.0 : 0.1 0.82014 2.4 1.4 0.6 1.1 1.6 3.2 10.4 0.6 -0.2 0.3 0.8 0.8 0.0 0.0 : 0.0 : 0.2 0.82015 2.3 1.6 0.6 0.9 1.6 3.1 1.4 0.6 0.0 0.3 0.5 0.5 0.0 0.0 : 0.0 : 0.2 0.8
_________________________________________________________________________________________________________________________________________________________________ 1) Former EU-27 2) SNA 93
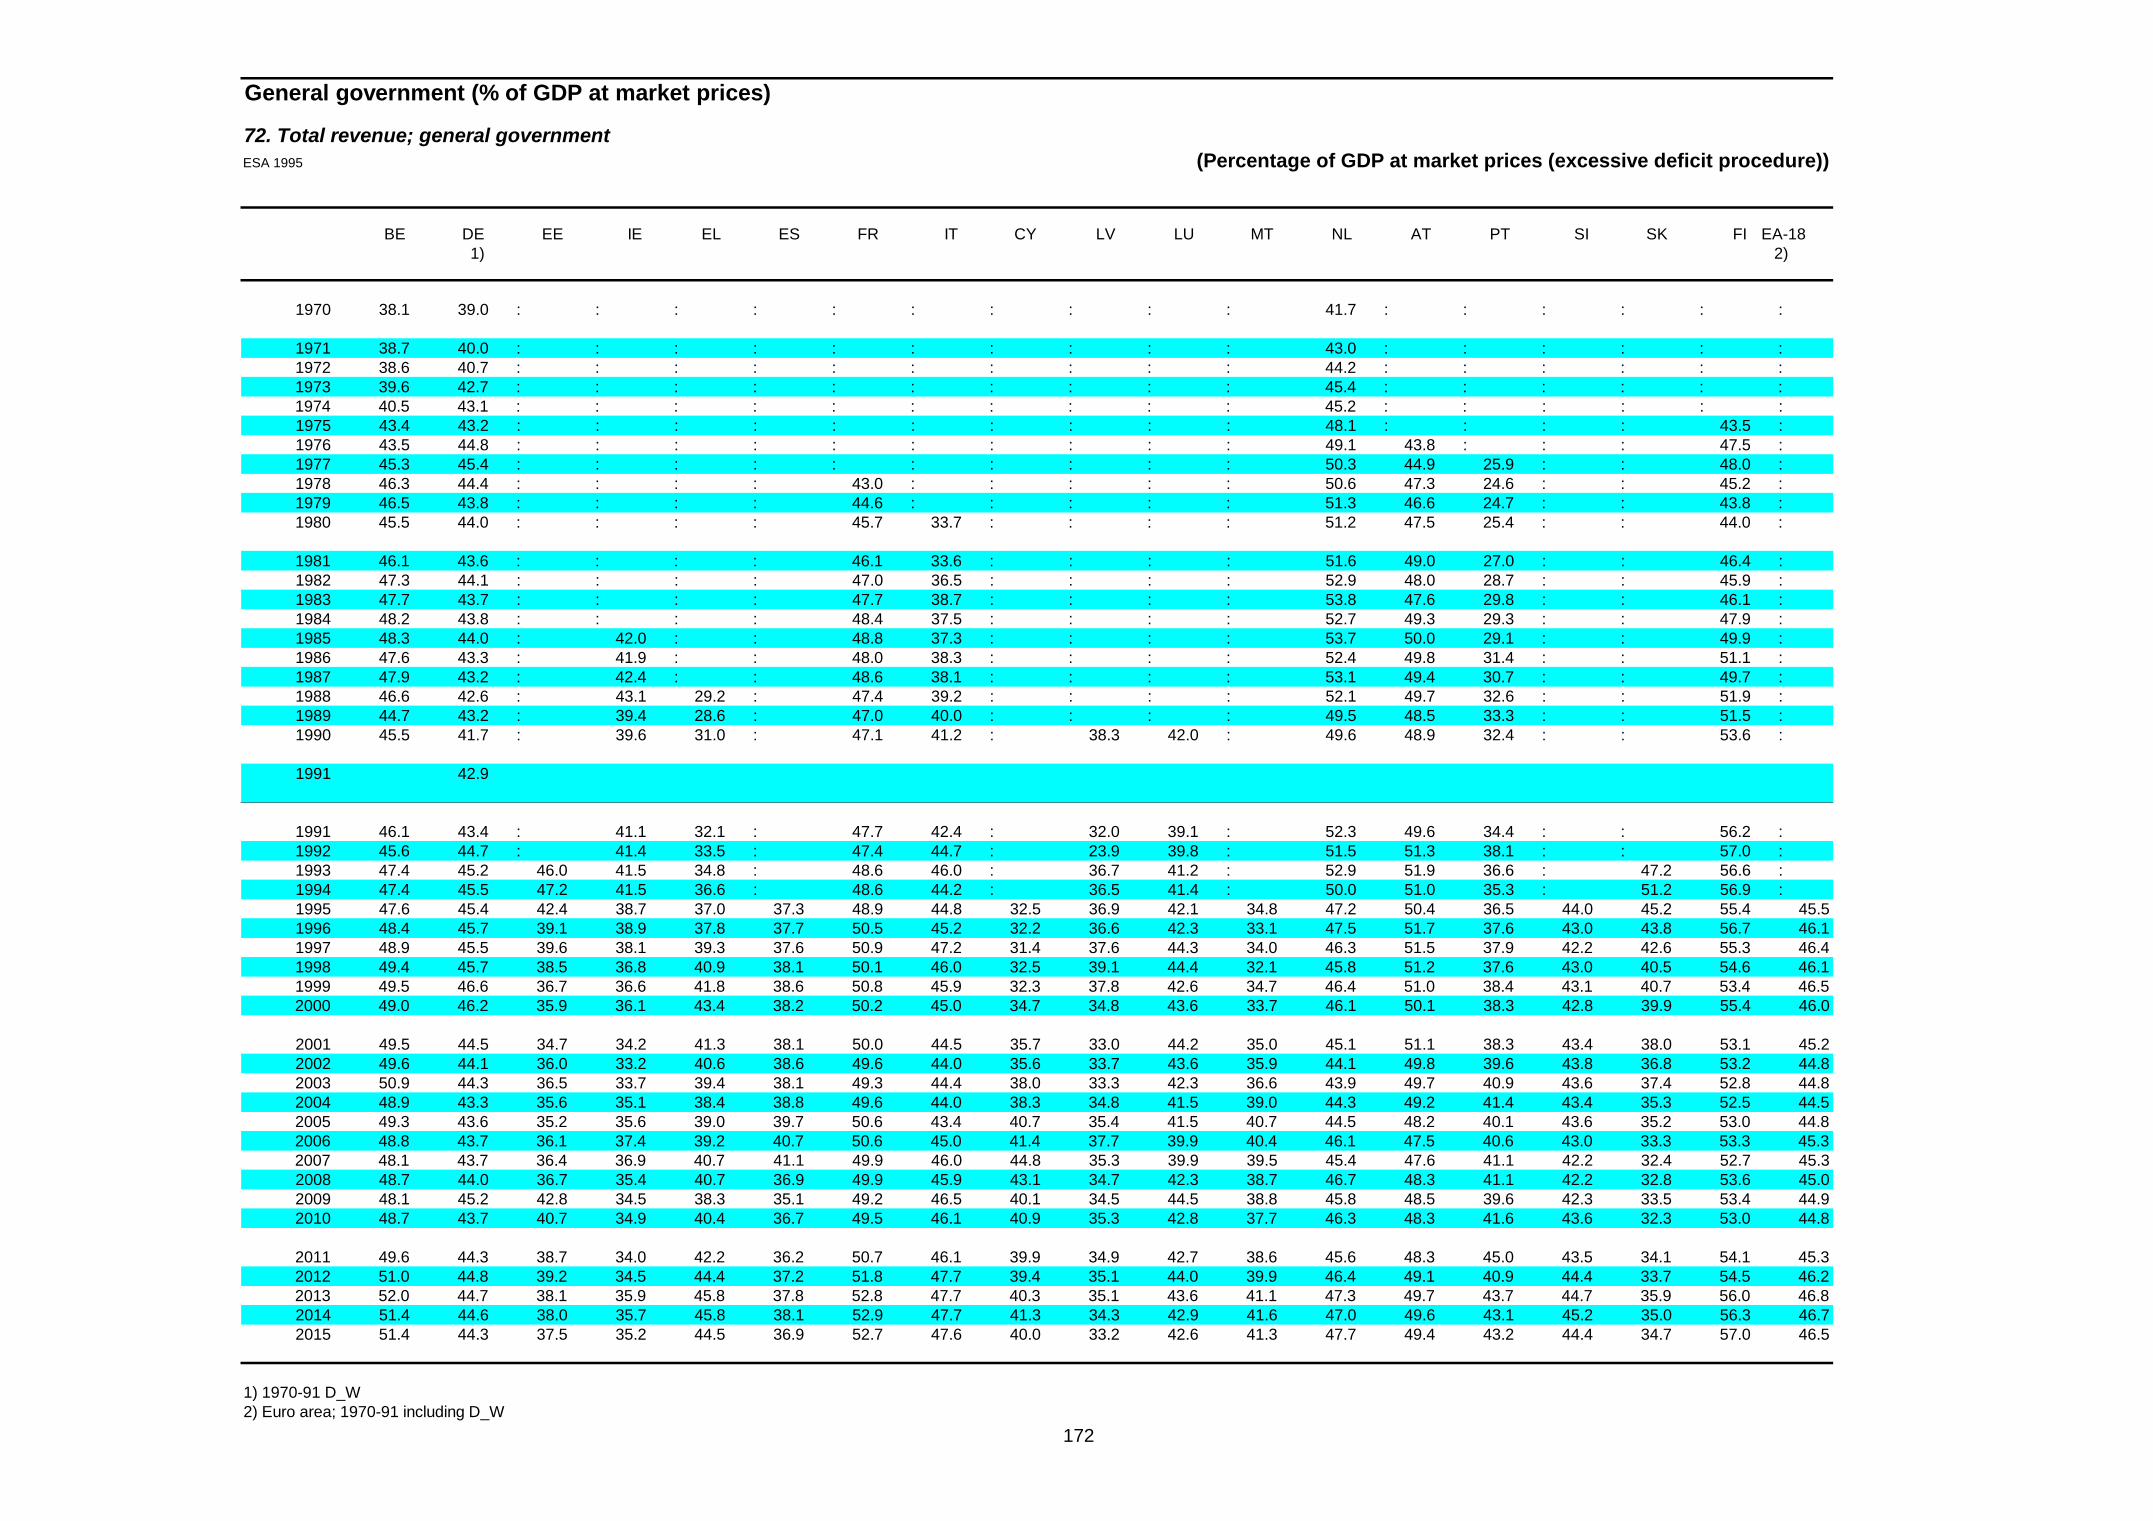
172
General government (% of GDP at market prices)
72. Total revenue; general governmentESA 1995 (Percentage of GDP at market prices (excessive deficit procedure))
BE DE EE IE EL ES FR IT CY LV LU MT NL AT PT SI SK FI EA-18 1) 2)
1970 38.1 39.0 : : : : : : : : : : 41.7 : : : : : :
1971 38.7 40.0 : : : : : : : : : : 43.0 : : : : : : 1972 38.6 40.7 : : : : : : : : : : 44.2 : : : : : : 1973 39.6 42.7 : : : : : : : : : : 45.4 : : : : : : 1974 40.5 43.1 : : : : : : : : : : 45.2 : : : : : : 1975 43.4 43.2 : : : : : : : : : : 48.1 : : : : 43.5 : 1976 43.5 44.8 : : : : : : : : : : 49.1 43.8 : : : 47.5 : 1977 45.3 45.4 : : : : : : : : : : 50.3 44.9 25.9 : : 48.0 : 1978 46.3 44.4 : : : : 43.0 : : : : : 50.6 47.3 24.6 : : 45.2 : 1979 46.5 43.8 : : : : 44.6 : : : : : 51.3 46.6 24.7 : : 43.8 : 1980 45.5 44.0 : : : : 45.7 33.7 : : : : 51.2 47.5 25.4 : : 44.0 :
1981 46.1 43.6 : : : : 46.1 33.6 : : : : 51.6 49.0 27.0 : : 46.4 : 1982 47.3 44.1 : : : : 47.0 36.5 : : : : 52.9 48.0 28.7 : : 45.9 : 1983 47.7 43.7 : : : : 47.7 38.7 : : : : 53.8 47.6 29.8 : : 46.1 : 1984 48.2 43.8 : : : : 48.4 37.5 : : : : 52.7 49.3 29.3 : : 47.9 : 1985 48.3 44.0 : 42.0 : : 48.8 37.3 : : : : 53.7 50.0 29.1 : : 49.9 : 1986 47.6 43.3 : 41.9 : : 48.0 38.3 : : : : 52.4 49.8 31.4 : : 51.1 : 1987 47.9 43.2 : 42.4 : : 48.6 38.1 : : : : 53.1 49.4 30.7 : : 49.7 : 1988 46.6 42.6 : 43.1 29.2 : 47.4 39.2 : : : : 52.1 49.7 32.6 : : 51.9 : 1989 44.7 43.2 : 39.4 28.6 : 47.0 40.0 : : : : 49.5 48.5 33.3 : : 51.5 : 1990 45.5 41.7 : 39.6 31.0 : 47.1 41.2 : 38.3 42.0 : 49.6 48.9 32.4 : : 53.6 :
1991 42.9
1991 46.1 43.4 : 41.1 32.1 : 47.7 42.4 : 32.0 39.1 : 52.3 49.6 34.4 : : 56.2 : 1992 45.6 44.7 : 41.4 33.5 : 47.4 44.7 : 23.9 39.8 : 51.5 51.3 38.1 : : 57.0 : 1993 47.4 45.2 46.0 41.5 34.8 : 48.6 46.0 : 36.7 41.2 : 52.9 51.9 36.6 : 47.2 56.6 : 1994 47.4 45.5 47.2 41.5 36.6 : 48.6 44.2 : 36.5 41.4 : 50.0 51.0 35.3 : 51.2 56.9 : 1995 47.6 45.4 42.4 38.7 37.0 37.3 48.9 44.8 32.5 36.9 42.1 34.8 47.2 50.4 36.5 44.0 45.2 55.4 45.51996 48.4 45.7 39.1 38.9 37.8 37.7 50.5 45.2 32.2 36.6 42.3 33.1 47.5 51.7 37.6 43.0 43.8 56.7 46.11997 48.9 45.5 39.6 38.1 39.3 37.6 50.9 47.2 31.4 37.6 44.3 34.0 46.3 51.5 37.9 42.2 42.6 55.3 46.41998 49.4 45.7 38.5 36.8 40.9 38.1 50.1 46.0 32.5 39.1 44.4 32.1 45.8 51.2 37.6 43.0 40.5 54.6 46.11999 49.5 46.6 36.7 36.6 41.8 38.6 50.8 45.9 32.3 37.8 42.6 34.7 46.4 51.0 38.4 43.1 40.7 53.4 46.52000 49.0 46.2 35.9 36.1 43.4 38.2 50.2 45.0 34.7 34.8 43.6 33.7 46.1 50.1 38.3 42.8 39.9 55.4 46.0
2001 49.5 44.5 34.7 34.2 41.3 38.1 50.0 44.5 35.7 33.0 44.2 35.0 45.1 51.1 38.3 43.4 38.0 53.1 45.22002 49.6 44.1 36.0 33.2 40.6 38.6 49.6 44.0 35.6 33.7 43.6 35.9 44.1 49.8 39.6 43.8 36.8 53.2 44.82003 50.9 44.3 36.5 33.7 39.4 38.1 49.3 44.4 38.0 33.3 42.3 36.6 43.9 49.7 40.9 43.6 37.4 52.8 44.82004 48.9 43.3 35.6 35.1 38.4 38.8 49.6 44.0 38.3 34.8 41.5 39.0 44.3 49.2 41.4 43.4 35.3 52.5 44.52005 49.3 43.6 35.2 35.6 39.0 39.7 50.6 43.4 40.7 35.4 41.5 40.7 44.5 48.2 40.1 43.6 35.2 53.0 44.82006 48.8 43.7 36.1 37.4 39.2 40.7 50.6 45.0 41.4 37.7 39.9 40.4 46.1 47.5 40.6 43.0 33.3 53.3 45.32007 48.1 43.7 36.4 36.9 40.7 41.1 49.9 46.0 44.8 35.3 39.9 39.5 45.4 47.6 41.1 42.2 32.4 52.7 45.32008 48.7 44.0 36.7 35.4 40.7 36.9 49.9 45.9 43.1 34.7 42.3 38.7 46.7 48.3 41.1 42.2 32.8 53.6 45.02009 48.1 45.2 42.8 34.5 38.3 35.1 49.2 46.5 40.1 34.5 44.5 38.8 45.8 48.5 39.6 42.3 33.5 53.4 44.92010 48.7 43.7 40.7 34.9 40.4 36.7 49.5 46.1 40.9 35.3 42.8 37.7 46.3 48.3 41.6 43.6 32.3 53.0 44.8
2011 49.6 44.3 38.7 34.0 42.2 36.2 50.7 46.1 39.9 34.9 42.7 38.6 45.6 48.3 45.0 43.5 34.1 54.1 45.32012 51.0 44.8 39.2 34.5 44.4 37.2 51.8 47.7 39.4 35.1 44.0 39.9 46.4 49.1 40.9 44.4 33.7 54.5 46.22013 52.0 44.7 38.1 35.9 45.8 37.8 52.8 47.7 40.3 35.1 43.6 41.1 47.3 49.7 43.7 44.7 35.9 56.0 46.82014 51.4 44.6 38.0 35.7 45.8 38.1 52.9 47.7 41.3 34.3 42.9 41.6 47.0 49.6 43.1 45.2 35.0 56.3 46.72015 51.4 44.3 37.5 35.2 44.5 36.9 52.7 47.6 40.0 33.2 42.6 41.3 47.7 49.4 43.2 44.4 34.7 57.0 46.5
1) 1970-91 D_W 2) Euro area; 1970-91 including D_W
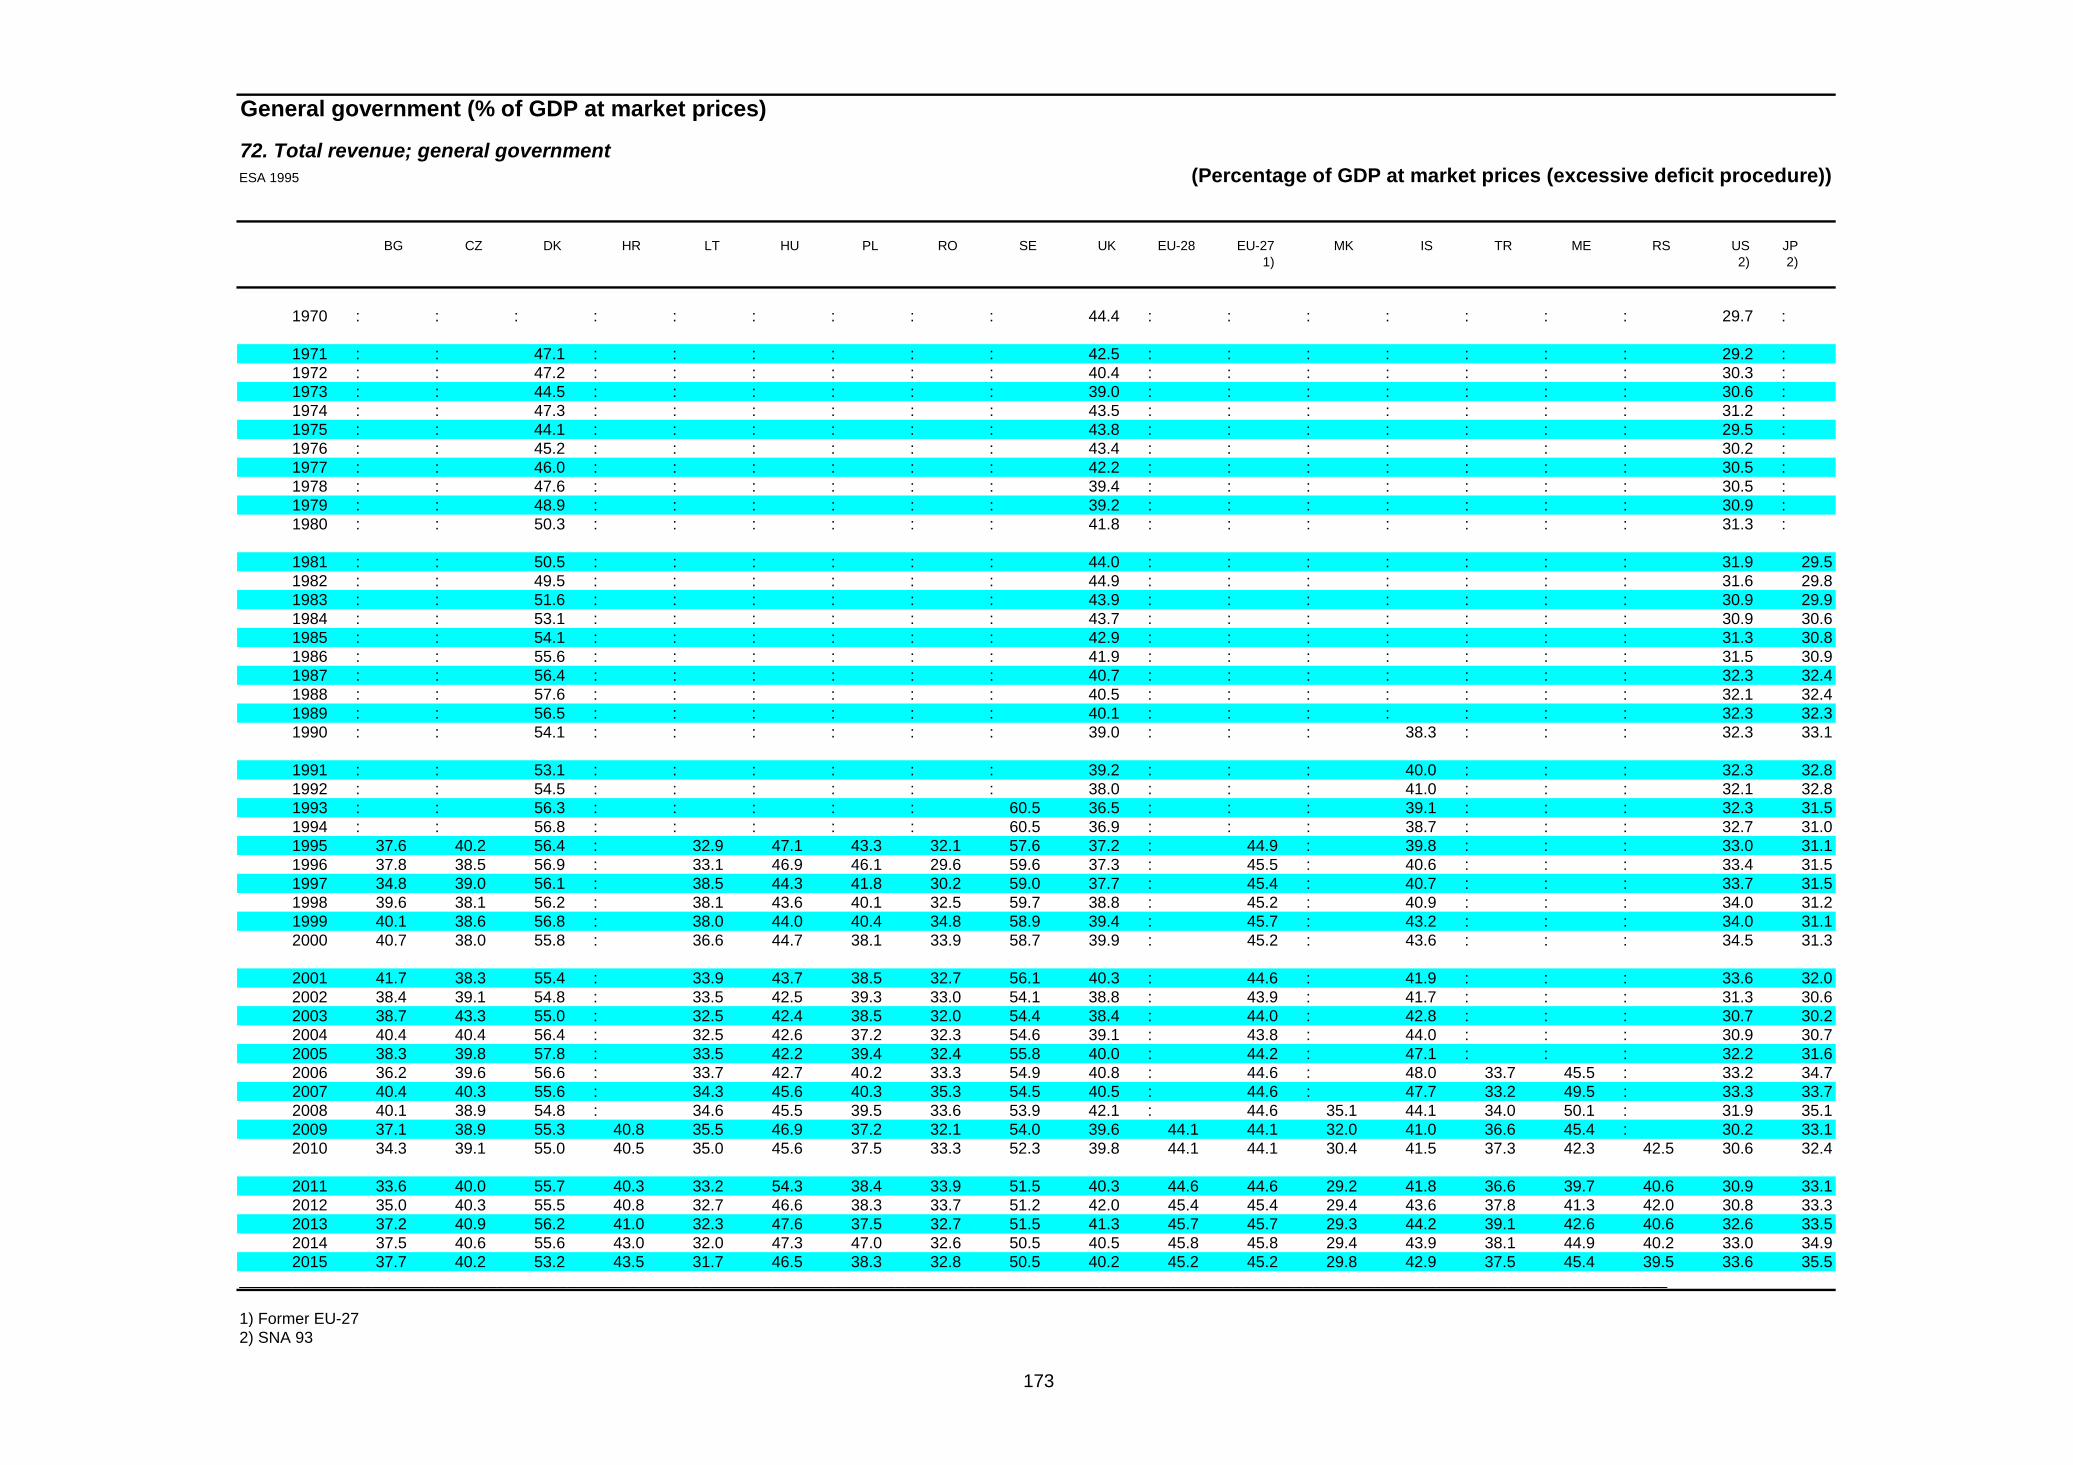
173
General government (% of GDP at market prices)
72. Total revenue; general governmentESA 1995 (Percentage of GDP at market prices (excessive deficit procedure))
BG CZ DK HR LT HU PL RO SE UK EU-28 EU-27 MK IS TR ME RS US JP 1) 2) 2)
1970 : : : : : : : : : 44.4 : : : : : : : 29.7 :
1971 : : 47.1 : : : : : : 42.5 : : : : : : : 29.2 : 1972 : : 47.2 : : : : : : 40.4 : : : : : : : 30.3 : 1973 : : 44.5 : : : : : : 39.0 : : : : : : : 30.6 : 1974 : : 47.3 : : : : : : 43.5 : : : : : : : 31.2 : 1975 : : 44.1 : : : : : : 43.8 : : : : : : : 29.5 : 1976 : : 45.2 : : : : : : 43.4 : : : : : : : 30.2 : 1977 : : 46.0 : : : : : : 42.2 : : : : : : : 30.5 : 1978 : : 47.6 : : : : : : 39.4 : : : : : : : 30.5 : 1979 : : 48.9 : : : : : : 39.2 : : : : : : : 30.9 : 1980 : : 50.3 : : : : : : 41.8 : : : : : : : 31.3 :
1981 : : 50.5 : : : : : : 44.0 : : : : : : : 31.9 29.51982 : : 49.5 : : : : : : 44.9 : : : : : : : 31.6 29.81983 : : 51.6 : : : : : : 43.9 : : : : : : : 30.9 29.91984 : : 53.1 : : : : : : 43.7 : : : : : : : 30.9 30.61985 : : 54.1 : : : : : : 42.9 : : : : : : : 31.3 30.81986 : : 55.6 : : : : : : 41.9 : : : : : : : 31.5 30.91987 : : 56.4 : : : : : : 40.7 : : : : : : : 32.3 32.41988 : : 57.6 : : : : : : 40.5 : : : : : : : 32.1 32.41989 : : 56.5 : : : : : : 40.1 : : : : : : : 32.3 32.31990 : : 54.1 : : : : : : 39.0 : : : 38.3 : : : 32.3 33.1
1991 : : 53.1 : : : : : : 39.2 : : : 40.0 : : : 32.3 32.81992 : : 54.5 : : : : : : 38.0 : : : 41.0 : : : 32.1 32.81993 : : 56.3 : : : : : 60.5 36.5 : : : 39.1 : : : 32.3 31.51994 : : 56.8 : : : : : 60.5 36.9 : : : 38.7 : : : 32.7 31.01995 37.6 40.2 56.4 : 32.9 47.1 43.3 32.1 57.6 37.2 : 44.9 : 39.8 : : : 33.0 31.11996 37.8 38.5 56.9 : 33.1 46.9 46.1 29.6 59.6 37.3 : 45.5 : 40.6 : : : 33.4 31.51997 34.8 39.0 56.1 : 38.5 44.3 41.8 30.2 59.0 37.7 : 45.4 : 40.7 : : : 33.7 31.51998 39.6 38.1 56.2 : 38.1 43.6 40.1 32.5 59.7 38.8 : 45.2 : 40.9 : : : 34.0 31.21999 40.1 38.6 56.8 : 38.0 44.0 40.4 34.8 58.9 39.4 : 45.7 : 43.2 : : : 34.0 31.12000 40.7 38.0 55.8 : 36.6 44.7 38.1 33.9 58.7 39.9 : 45.2 : 43.6 : : : 34.5 31.3
2001 41.7 38.3 55.4 : 33.9 43.7 38.5 32.7 56.1 40.3 : 44.6 : 41.9 : : : 33.6 32.02002 38.4 39.1 54.8 : 33.5 42.5 39.3 33.0 54.1 38.8 : 43.9 : 41.7 : : : 31.3 30.62003 38.7 43.3 55.0 : 32.5 42.4 38.5 32.0 54.4 38.4 : 44.0 : 42.8 : : : 30.7 30.22004 40.4 40.4 56.4 : 32.5 42.6 37.2 32.3 54.6 39.1 : 43.8 : 44.0 : : : 30.9 30.72005 38.3 39.8 57.8 : 33.5 42.2 39.4 32.4 55.8 40.0 : 44.2 : 47.1 : : : 32.2 31.62006 36.2 39.6 56.6 : 33.7 42.7 40.2 33.3 54.9 40.8 : 44.6 : 48.0 33.7 45.5 : 33.2 34.72007 40.4 40.3 55.6 : 34.3 45.6 40.3 35.3 54.5 40.5 : 44.6 : 47.7 33.2 49.5 : 33.3 33.72008 40.1 38.9 54.8 : 34.6 45.5 39.5 33.6 53.9 42.1 : 44.6 35.1 44.1 34.0 50.1 : 31.9 35.12009 37.1 38.9 55.3 40.8 35.5 46.9 37.2 32.1 54.0 39.6 44.1 44.1 32.0 41.0 36.6 45.4 : 30.2 33.12010 34.3 39.1 55.0 40.5 35.0 45.6 37.5 33.3 52.3 39.8 44.1 44.1 30.4 41.5 37.3 42.3 42.5 30.6 32.4
2011 33.6 40.0 55.7 40.3 33.2 54.3 38.4 33.9 51.5 40.3 44.6 44.6 29.2 41.8 36.6 39.7 40.6 30.9 33.12012 35.0 40.3 55.5 40.8 32.7 46.6 38.3 33.7 51.2 42.0 45.4 45.4 29.4 43.6 37.8 41.3 42.0 30.8 33.32013 37.2 40.9 56.2 41.0 32.3 47.6 37.5 32.7 51.5 41.3 45.7 45.7 29.3 44.2 39.1 42.6 40.6 32.6 33.52014 37.5 40.6 55.6 43.0 32.0 47.3 47.0 32.6 50.5 40.5 45.8 45.8 29.4 43.9 38.1 44.9 40.2 33.0 34.92015 37.7 40.2 53.2 43.5 31.7 46.5 38.3 32.8 50.5 40.2 45.2 45.2 29.8 42.9 37.5 45.4 39.5 33.6 35.5
_________________________________________________________________________________________________________________________________________________________________ 1) Former EU-27 2) SNA 93

174
General government (% of GDP at market prices)
73. Gross fixed capital formation; general governmentESA 1995 (Percentage of GDP at market prices (excessive deficit procedure))
BE DE EE IE EL ES FR IT CY LV LU MT NL AT PT SI SK FI EA-18 1) 2)
1970 4.1 4.7 : : : : : : : : : : 5.4 : : : : : :
1971 4.8 4.6 : : : : : : : : : : 5.5 : : : : : : 1972 4.8 4.1 : : : : : : : : : : 4.8 : : : : : : 1973 4.1 3.8 : : : : : : : : : : 4.3 : : : : : : 1974 3.8 4.3 : : : : : : : : : : 4.1 : : : : : : 1975 4.3 4.1 : : : : : : : : : : 4.7 : : : : 3.9 : 1976 4.3 3.7 : : : : : : : : : : 4.5 4.8 : : : 3.6 : 1977 4.2 3.5 : : : : : : : : : : 4.0 4.7 2.6 : : 3.7 : 1978 4.1 3.5 : : : : 3.1 : : : : : 4.1 4.9 4.2 : : 3.6 : 1979 4.2 3.6 : : : : 3.1 : : : : : 3.9 4.5 4.1 : : 3.4 : 1980 4.5 3.6 : : : : 3.2 3.0 : : : : 4.1 4.2 3.8 : : 3.5 :
1981 4.6 3.3 : : : : 3.2 3.5 : : : : 3.9 4.1 4.6 : : 3.5 : 1982 4.3 2.9 : : : : 3.3 3.4 : : : : 3.7 3.8 4.2 : : 3.6 : 1983 3.8 2.7 : : : : 3.1 3.4 : : : : 3.4 3.6 3.6 : : 3.7 : 1984 3.1 2.6 : : : : 3.0 3.3 : : : : 3.6 3.5 3.1 : : 3.4 : 1985 2.9 2.5 : 3.7 : : 3.2 3.4 : : : : 3.4 3.4 3.0 : : 3.4 : 1986 2.6 2.6 : 3.4 : : 3.1 3.3 : : : : 3.1 3.6 3.0 : : 3.3 : 1987 2.3 2.6 : 2.6 : : 3.2 3.3 : : : : 3.2 3.3 3.1 : : 3.6 : 1988 2.4 2.5 : 1.8 2.6 : 3.4 3.2 : : : : 3.3 3.1 3.3 : : 3.6 : 1989 1.8 2.5 : 1.7 2.6 : 3.4 3.1 : : : : 3.1 3.1 3.1 : : 3.0 : 1990 1.6 2.4 : 2.1 2.5 : 3.4 3.2 : 1.2 3.9 : 3.2 3.0 3.0 : : 3.5 :
1991 2.3
1991 1.8 2.6 : 2.1 2.7 : 3.6 3.1 : 1.7 4.1 : 3.2 3.1 3.2 : : 3.6 : 1992 1.8 2.7 : 2.0 3.0 : 3.6 2.9 : 2.6 4.4 : 3.3 3.1 3.6 : : 3.4 : 1993 2.1 2.6 4.7 2.2 2.8 : 3.5 2.5 : 2.0 4.4 : 3.2 3.2 3.7 : 5.5 2.7 : 1994 2.0 2.5 4.7 2.3 2.7 : 3.4 2.2 : 3.1 3.7 : 3.2 3.3 3.4 : 4.5 2.9 : 1995 1.9 2.2 5.0 2.3 2.9 3.7 3.2 2.1 3.6 1.9 3.8 2.8 3.2 3.0 4.2 3.2 2.3 2.6 2.61996 1.7 2.1 4.4 2.4 2.9 3.1 3.1 2.2 3.3 2.3 4.9 3.3 3.3 2.8 4.6 3.1 3.8 2.8 2.61997 1.7 1.9 4.3 2.5 3.1 3.1 2.9 2.2 3.4 1.2 3.0 3.6 2.9 2.0 5.3 2.9 5.4 3.0 2.41998 1.7 1.9 4.9 2.7 3.2 3.3 2.8 2.3 2.9 1.3 4.5 4.4 3.0 1.9 4.7 3.0 4.0 2.8 2.51999 1.9 2.0 4.2 3.1 3.2 3.4 2.9 2.4 2.5 1.4 4.3 4.3 3.0 1.8 4.5 3.4 2.9 2.7 2.52000 2.0 1.9 3.7 3.5 3.7 3.2 3.1 2.3 3.0 1.3 3.8 3.7 3.1 1.6 4.1 3.2 2.8 2.4 2.5
2001 1.7 1.8 4.1 4.2 3.6 3.3 3.0 2.4 2.9 1.1 4.3 3.3 3.3 1.2 4.4 3.2 3.1 2.5 2.52002 1.7 1.8 5.3 4.2 3.4 3.5 2.9 1.7 3.0 1.3 4.9 4.0 3.5 1.4 4.1 3.0 3.3 2.6 2.42003 1.6 1.6 4.4 3.6 3.5 3.6 3.0 2.5 3.4 2.4 4.6 4.5 3.6 1.3 3.9 3.2 2.6 2.8 2.62004 1.6 1.5 3.8 3.5 3.6 3.4 3.1 2.4 4.1 3.1 4.3 3.7 3.2 1.2 3.8 3.4 2.4 2.8 2.52005 1.7 1.4 4.0 3.5 2.8 3.6 3.3 2.4 3.1 3.1 4.5 4.6 3.3 1.2 3.6 3.2 2.1 2.5 2.52006 1.6 1.5 4.7 3.8 3.4 3.7 3.2 2.4 3.0 4.6 3.6 3.9 3.3 1.1 2.8 3.7 2.2 2.3 2.52007 1.6 1.5 5.1 4.7 3.4 4.0 3.3 2.3 3.0 5.7 3.3 3.7 3.3 1.1 2.7 4.2 1.9 2.4 2.62008 1.6 1.6 5.4 5.3 3.7 4.0 3.2 2.2 3.1 4.8 3.4 2.3 3.5 1.1 2.9 4.4 2.0 2.5 2.62009 1.7 1.8 5.1 3.7 3.1 4.5 3.4 2.5 4.2 4.3 3.9 2.3 3.8 1.2 3.0 4.6 2.3 2.8 2.82010 1.6 1.7 3.9 3.4 2.3 4.0 3.1 2.2 3.8 3.7 4.1 2.1 3.6 1.1 3.8 4.5 2.6 2.5 2.6
2011 1.7 1.7 4.1 2.4 1.7 3.0 3.1 2.0 3.6 4.2 3.8 2.5 3.3 1.0 2.6 3.5 2.7 2.5 2.42012 1.8 1.5 5.4 1.9 1.8 1.7 3.2 1.9 2.5 4.2 3.5 3.0 3.3 1.0 1.7 3.3 2.2 2.6 2.12013 1.6 1.6 4.3 1.7 1.9 1.5 3.2 1.7 2.1 3.9 3.1 2.7 3.2 1.0 1.4 3.7 2.1 2.8 2.12014 1.6 1.6 4.0 1.6 2.6 1.3 3.0 1.6 2.3 3.7 3.1 2.7 3.3 1.0 1.8 4.2 1.9 2.9 2.02015 1.6 1.6 3.9 1.5 2.5 1.3 2.9 1.5 2.3 3.4 3.2 2.7 3.2 1.0 1.7 3.9 1.8 2.8 2.0
1) 1970-91 D_W 2) Euro area; 1970-91 including D_W

175
General government (% of GDP at market prices)
73. Gross fixed capital formation; general governmentESA 1995 (Percentage of GDP at market prices (excessive deficit procedure))
BG CZ DK HR LT HU PL RO SE UK EU-28 EU-27 MK IS TR ME RS US JP 1) 2) 2)
1970 : : : : : : : : : 4.7 : : : : : : : 5.2 :
1971 : : 4.2 : : : : : : 4.5 : : : : : : : 4.7 : 1972 : : 3.9 : : : : : : 4.3 : : : : : : : 4.4 : 1973 : : 3.3 : : : : : : 4.9 : : : : : : : 4.3 : 1974 : : 3.4 : : : : : : 5.2 : : : : : : : 4.6 : 1975 : : 3.4 : : : : : : 4.7 : : : : : : : 4.7 : 1976 : : 3.2 : : : : : : 4.3 : : : : : : : 4.4 : 1977 : : 3.3 : : : : : : 3.3 : : : : : : : 4.1 : 1978 : : 3.3 : : : : : : 2.9 : : : : : : : 4.1 : 1979 : : 3.4 : : : : : : 2.7 : : : : : : : 4.2 : 1980 : : 3.1 : : : : : : 2.6 : : : : : : : 4.3 :
1981 : : 2.7 : : : : : : 2.1 : : : : : : : 4.2 5.81982 : : 2.3 : : : : : : 1.9 : : : : : : : 4.3 5.51983 : : 1.9 : : : : : : 2.2 : : : : : : : 4.4 5.21984 : : 1.9 : : : : : : 2.3 : : : : : : : 4.5 4.91985 : : 2.0 : : : : : : 2.2 : : : : : : : 4.7 4.41986 : : 1.8 : : : : : : 2.3 : : : : : : : 4.8 4.51987 : : 2.1 : : : : : : 2.1 : : : : : : : 4.9 4.71988 : : 2.0 : : : : : : 1.8 : : : : : : : 4.6 4.81989 : : 1.8 : : : : : : 2.2 : : : : : : : 4.5 4.61990 : : 1.7 : : : : : : 2.3 : : : 4.3 : : : 4.6 4.8
1991 2.2 : 1.5 : : : 2.7 : : 2.2 : : : 4.5 : : : 4.5 4.81992 2.6 : 1.9 : : : 3.1 : : 2.2 : : : 4.4 : : : 4.2 5.41993 2.2 : 1.8 : 2.9 : 3.4 : 3.7 2.1 : : : 4.8 : : : 4.0 6.11994 1.8 : 1.8 : 3.1 : 3.1 : 4.0 2.1 : : : 4.4 : : : 3.8 6.11995 1.1 5.0 1.8 : 3.2 0.2 3.3 4.1 3.9 1.9 : 2.6 : 3.5 : : : 3.8 5.91996 0.7 4.4 1.9 : 2.4 1.5 3.6 3.9 3.4 1.5 : 2.5 : 3.6 : : : 3.7 6.21997 1.5 4.1 1.8 : 2.3 2.3 3.9 2.7 3.0 1.2 : 2.3 : 3.5 : : : 3.6 5.61998 3.6 4.1 1.7 : 2.5 3.1 3.9 1.8 3.1 1.3 : 2.3 : 4.4 : : : 3.5 5.41999 3.8 3.2 1.7 : 2.6 2.9 3.5 1.6 3.1 1.3 : 2.4 : 4.7 : : : 3.6 5.82000 3.6 3.5 1.7 : 2.4 3.3 2.4 3.4 2.8 1.2 : 2.3 : 4.1 3.8 : : 3.6 5.1
2001 3.4 3.0 1.9 : 2.2 3.7 3.4 2.7 2.9 1.5 : 2.4 : 4.5 4.0 : : 3.7 5.02002 3.1 3.1 1.8 : 2.9 4.9 3.4 3.4 3.1 1.6 : 2.3 : 3.9 4.0 : : 3.8 4.72003 2.9 6.8 1.6 : 3.0 3.5 3.3 3.5 2.9 1.6 : 2.5 : 3.6 3.3 : : 3.8 4.22004 3.2 4.2 1.9 : 3.5 3.6 3.4 3.0 2.9 1.8 : 2.4 : 3.9 2.8 : : 3.8 3.92005 3.4 4.3 1.8 : 3.5 4.0 3.4 3.9 3.0 0.7 : 2.3 : 3.1 3.2 : : 3.7 3.62006 4.0 4.5 1.9 : 4.2 4.5 3.9 5.1 3.0 1.8 : 2.5 2.9 3.9 2.8 : : 3.7 3.32007 5.2 4.2 1.9 : 5.2 3.7 4.2 6.2 3.1 1.9 : 2.6 3.8 4.2 3.1 : : 3.8 3.12008 5.6 4.6 1.9 : 4.9 2.9 4.6 6.6 3.3 2.3 : 2.7 4.9 4.5 3.7 : : 4.0 3.02009 4.9 5.1 2.0 3.6 3.9 3.1 5.2 5.9 3.5 2.7 2.9 2.9 3.3 3.5 3.0 : : 4.2 3.42010 4.6 4.2 2.2 2.4 4.6 3.4 5.6 5.7 3.5 2.5 2.7 2.7 5.3 2.9 2.7 : : 4.1 3.3
2011 3.4 3.6 2.2 2.3 4.4 3.1 5.7 5.5 3.4 2.2 2.5 2.5 3.9 1.8 2.5 : : 3.8 3.12012 3.3 3.2 2.6 2.0 3.7 3.5 4.6 4.7 3.5 2.2 2.3 2.3 4.1 2.0 : : : 3.6 3.22013 4.1 2.8 2.3 2.2 3.4 3.9 3.9 4.5 3.3 2.0 2.2 2.2 3.5 2.2 : 2.4 : 3.6 3.52014 4.4 3.2 2.3 2.5 3.4 4.4 3.8 4.3 3.4 2.0 2.2 2.2 3.5 2.0 : 2.6 : 3.6 3.72015 4.4 3.6 2.1 2.8 3.3 3.8 3.9 4.4 3.3 2.0 2.2 2.2 3.5 1.9 : 2.6 : 3.5 3.3
_________________________________________________________________________________________________________________________________________________________________ 1) Former EU-27 2) SNA 93
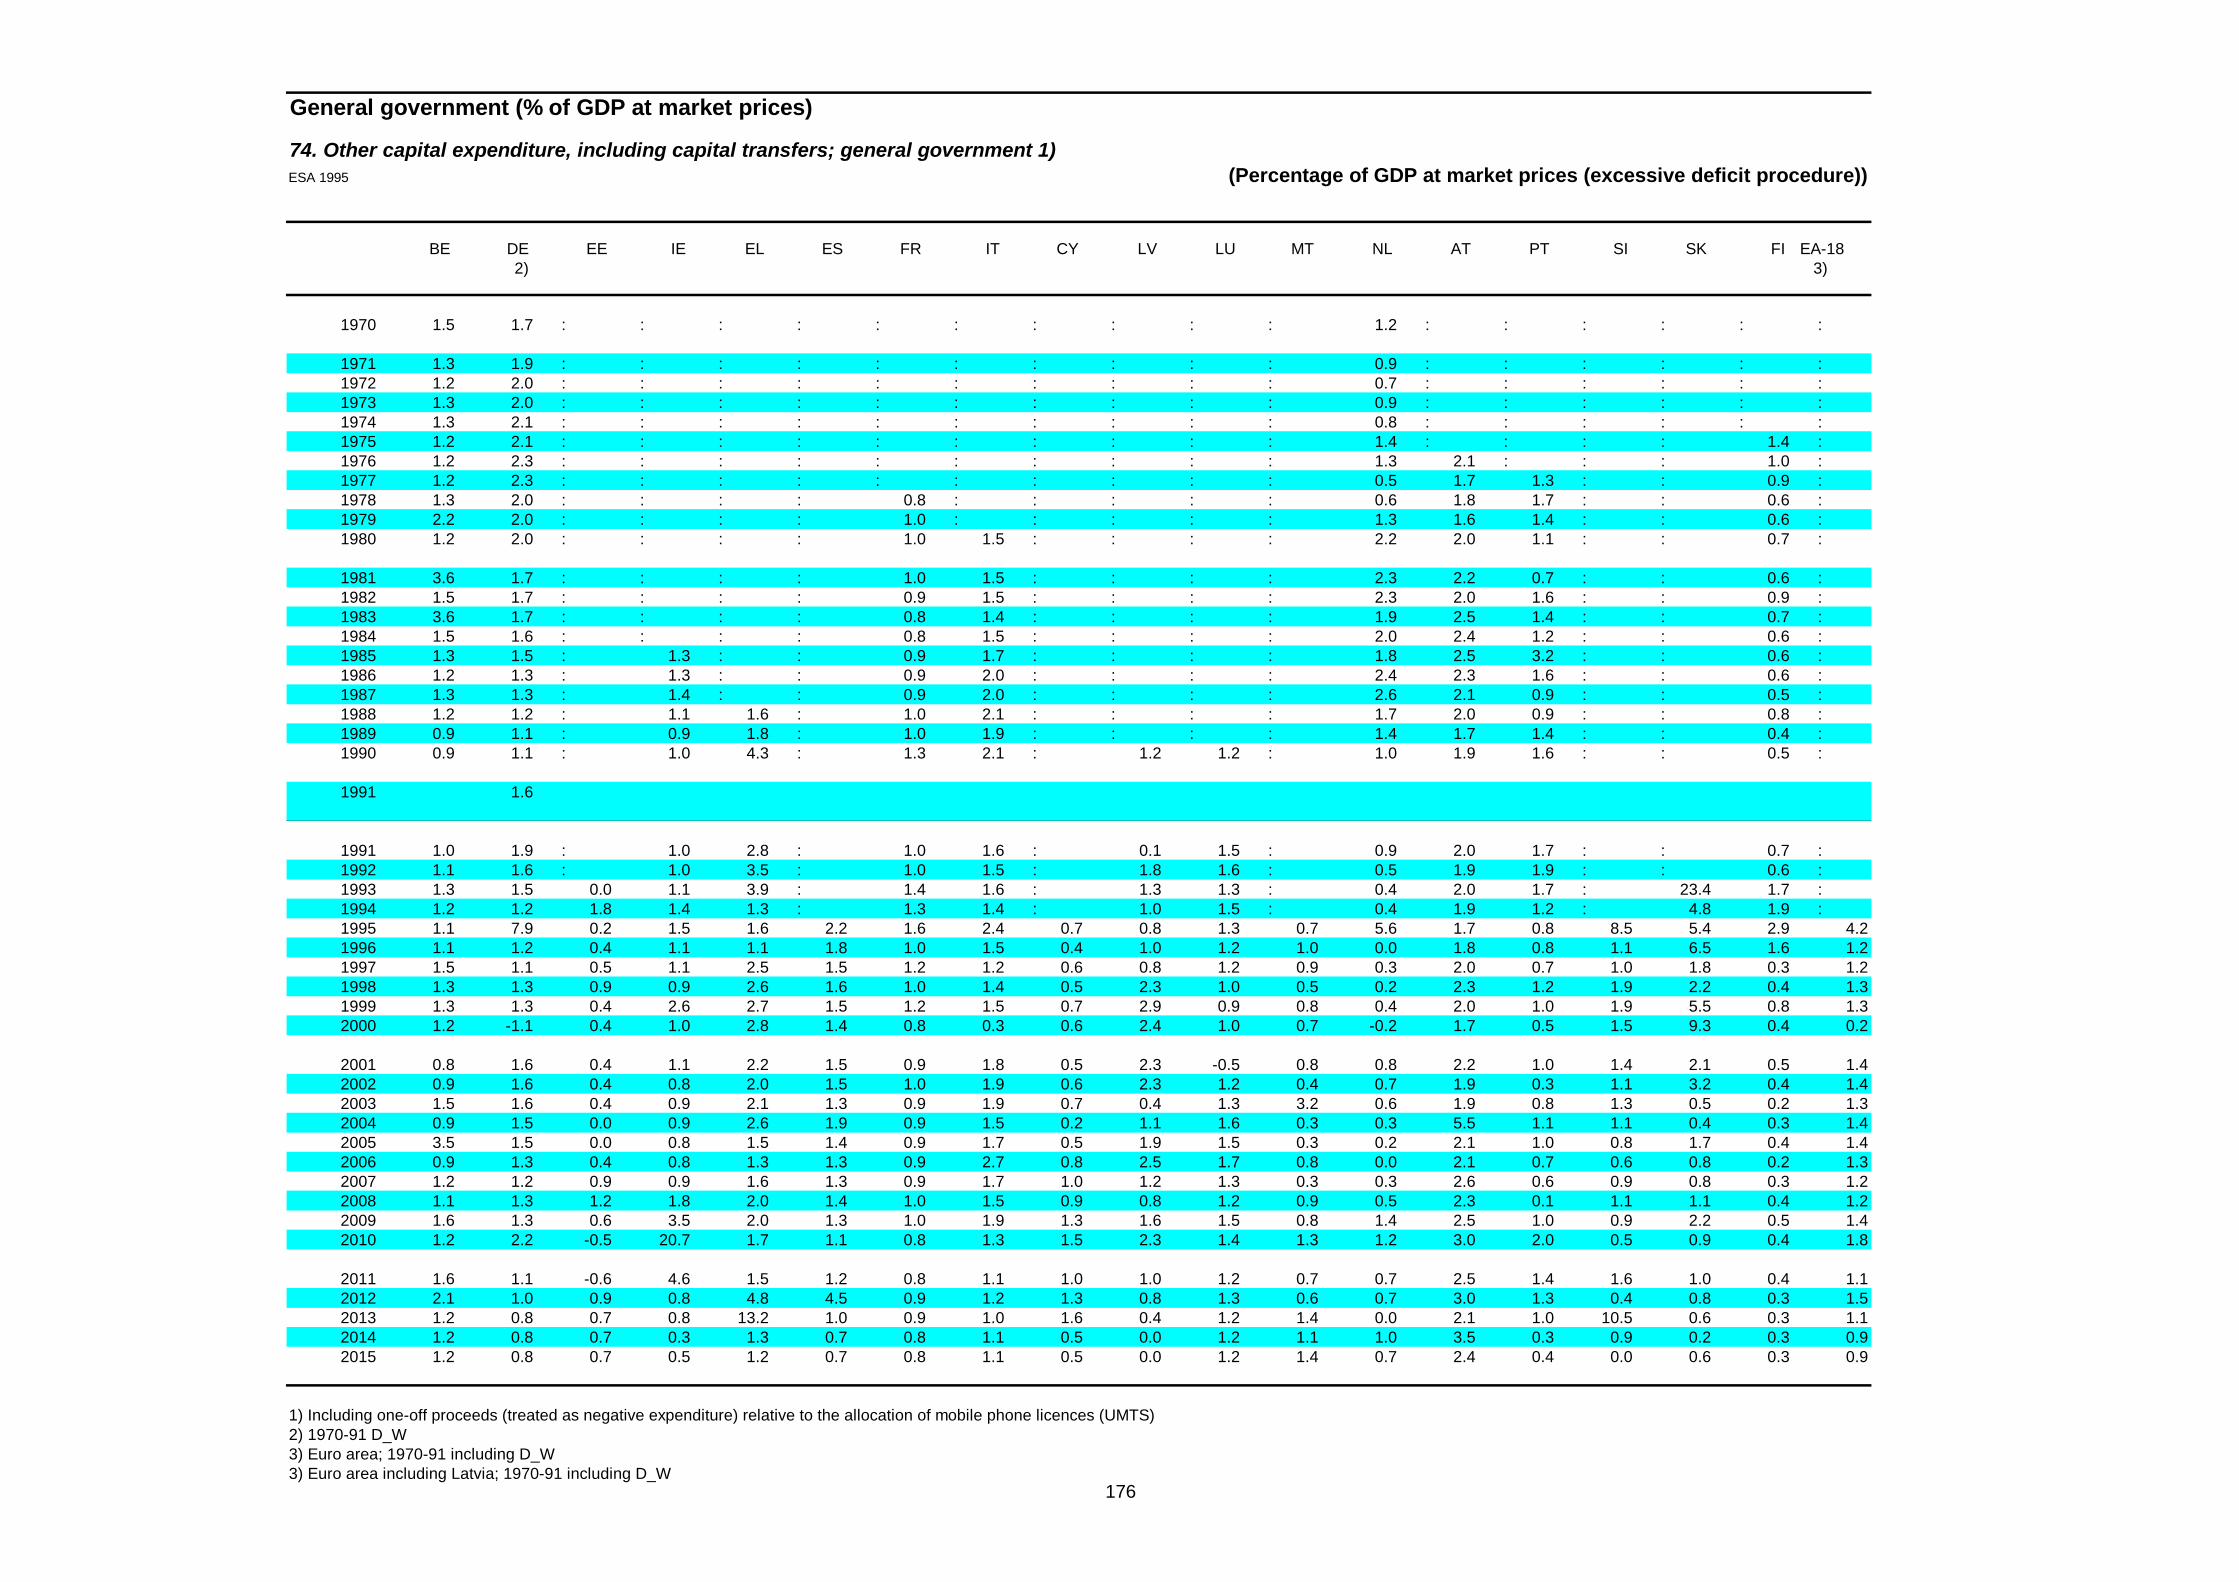
176
General government (% of GDP at market prices)
74. Other capital expenditure, including capital transfers; general government 1)ESA 1995 (Percentage of GDP at market prices (excessive deficit procedure))
BE DE EE IE EL ES FR IT CY LV LU MT NL AT PT SI SK FI EA-18 2) 3)
1970 1.5 1.7 : : : : : : : : : : 1.2 : : : : : :
1971 1.3 1.9 : : : : : : : : : : 0.9 : : : : : : 1972 1.2 2.0 : : : : : : : : : : 0.7 : : : : : : 1973 1.3 2.0 : : : : : : : : : : 0.9 : : : : : : 1974 1.3 2.1 : : : : : : : : : : 0.8 : : : : : : 1975 1.2 2.1 : : : : : : : : : : 1.4 : : : : 1.4 : 1976 1.2 2.3 : : : : : : : : : : 1.3 2.1 : : : 1.0 : 1977 1.2 2.3 : : : : : : : : : : 0.5 1.7 1.3 : : 0.9 : 1978 1.3 2.0 : : : : 0.8 : : : : : 0.6 1.8 1.7 : : 0.6 : 1979 2.2 2.0 : : : : 1.0 : : : : : 1.3 1.6 1.4 : : 0.6 : 1980 1.2 2.0 : : : : 1.0 1.5 : : : : 2.2 2.0 1.1 : : 0.7 :
1981 3.6 1.7 : : : : 1.0 1.5 : : : : 2.3 2.2 0.7 : : 0.6 : 1982 1.5 1.7 : : : : 0.9 1.5 : : : : 2.3 2.0 1.6 : : 0.9 : 1983 3.6 1.7 : : : : 0.8 1.4 : : : : 1.9 2.5 1.4 : : 0.7 : 1984 1.5 1.6 : : : : 0.8 1.5 : : : : 2.0 2.4 1.2 : : 0.6 : 1985 1.3 1.5 : 1.3 : : 0.9 1.7 : : : : 1.8 2.5 3.2 : : 0.6 : 1986 1.2 1.3 : 1.3 : : 0.9 2.0 : : : : 2.4 2.3 1.6 : : 0.6 : 1987 1.3 1.3 : 1.4 : : 0.9 2.0 : : : : 2.6 2.1 0.9 : : 0.5 : 1988 1.2 1.2 : 1.1 1.6 : 1.0 2.1 : : : : 1.7 2.0 0.9 : : 0.8 : 1989 0.9 1.1 : 0.9 1.8 : 1.0 1.9 : : : : 1.4 1.7 1.4 : : 0.4 : 1990 0.9 1.1 : 1.0 4.3 : 1.3 2.1 : 1.2 1.2 : 1.0 1.9 1.6 : : 0.5 :
1991 1.6
1991 1.0 1.9 : 1.0 2.8 : 1.0 1.6 : 0.1 1.5 : 0.9 2.0 1.7 : : 0.7 : 1992 1.1 1.6 : 1.0 3.5 : 1.0 1.5 : 1.8 1.6 : 0.5 1.9 1.9 : : 0.6 : 1993 1.3 1.5 0.0 1.1 3.9 : 1.4 1.6 : 1.3 1.3 : 0.4 2.0 1.7 : 23.4 1.7 : 1994 1.2 1.2 1.8 1.4 1.3 : 1.3 1.4 : 1.0 1.5 : 0.4 1.9 1.2 : 4.8 1.9 : 1995 1.1 7.9 0.2 1.5 1.6 2.2 1.6 2.4 0.7 0.8 1.3 0.7 5.6 1.7 0.8 8.5 5.4 2.9 4.21996 1.1 1.2 0.4 1.1 1.1 1.8 1.0 1.5 0.4 1.0 1.2 1.0 0.0 1.8 0.8 1.1 6.5 1.6 1.21997 1.5 1.1 0.5 1.1 2.5 1.5 1.2 1.2 0.6 0.8 1.2 0.9 0.3 2.0 0.7 1.0 1.8 0.3 1.21998 1.3 1.3 0.9 0.9 2.6 1.6 1.0 1.4 0.5 2.3 1.0 0.5 0.2 2.3 1.2 1.9 2.2 0.4 1.31999 1.3 1.3 0.4 2.6 2.7 1.5 1.2 1.5 0.7 2.9 0.9 0.8 0.4 2.0 1.0 1.9 5.5 0.8 1.32000 1.2 -1.1 0.4 1.0 2.8 1.4 0.8 0.3 0.6 2.4 1.0 0.7 -0.2 1.7 0.5 1.5 9.3 0.4 0.2
2001 0.8 1.6 0.4 1.1 2.2 1.5 0.9 1.8 0.5 2.3 -0.5 0.8 0.8 2.2 1.0 1.4 2.1 0.5 1.42002 0.9 1.6 0.4 0.8 2.0 1.5 1.0 1.9 0.6 2.3 1.2 0.4 0.7 1.9 0.3 1.1 3.2 0.4 1.42003 1.5 1.6 0.4 0.9 2.1 1.3 0.9 1.9 0.7 0.4 1.3 3.2 0.6 1.9 0.8 1.3 0.5 0.2 1.32004 0.9 1.5 0.0 0.9 2.6 1.9 0.9 1.5 0.2 1.1 1.6 0.3 0.3 5.5 1.1 1.1 0.4 0.3 1.42005 3.5 1.5 0.0 0.8 1.5 1.4 0.9 1.7 0.5 1.9 1.5 0.3 0.2 2.1 1.0 0.8 1.7 0.4 1.42006 0.9 1.3 0.4 0.8 1.3 1.3 0.9 2.7 0.8 2.5 1.7 0.8 0.0 2.1 0.7 0.6 0.8 0.2 1.32007 1.2 1.2 0.9 0.9 1.6 1.3 0.9 1.7 1.0 1.2 1.3 0.3 0.3 2.6 0.6 0.9 0.8 0.3 1.22008 1.1 1.3 1.2 1.8 2.0 1.4 1.0 1.5 0.9 0.8 1.2 0.9 0.5 2.3 0.1 1.1 1.1 0.4 1.22009 1.6 1.3 0.6 3.5 2.0 1.3 1.0 1.9 1.3 1.6 1.5 0.8 1.4 2.5 1.0 0.9 2.2 0.5 1.42010 1.2 2.2 -0.5 20.7 1.7 1.1 0.8 1.3 1.5 2.3 1.4 1.3 1.2 3.0 2.0 0.5 0.9 0.4 1.8
2011 1.6 1.1 -0.6 4.6 1.5 1.2 0.8 1.1 1.0 1.0 1.2 0.7 0.7 2.5 1.4 1.6 1.0 0.4 1.12012 2.1 1.0 0.9 0.8 4.8 4.5 0.9 1.2 1.3 0.8 1.3 0.6 0.7 3.0 1.3 0.4 0.8 0.3 1.52013 1.2 0.8 0.7 0.8 13.2 1.0 0.9 1.0 1.6 0.4 1.2 1.4 0.0 2.1 1.0 10.5 0.6 0.3 1.12014 1.2 0.8 0.7 0.3 1.3 0.7 0.8 1.1 0.5 0.0 1.2 1.1 1.0 3.5 0.3 0.9 0.2 0.3 0.92015 1.2 0.8 0.7 0.5 1.2 0.7 0.8 1.1 0.5 0.0 1.2 1.4 0.7 2.4 0.4 0.0 0.6 0.3 0.9
1) Including one-off proceeds (treated as negative expenditure) relative to the allocation of mobile phone licences (UMTS) 2) 1970-91 D_W 3) Euro area; 1970-91 including D_W 3) Euro area including Latvia; 1970-91 including D_W
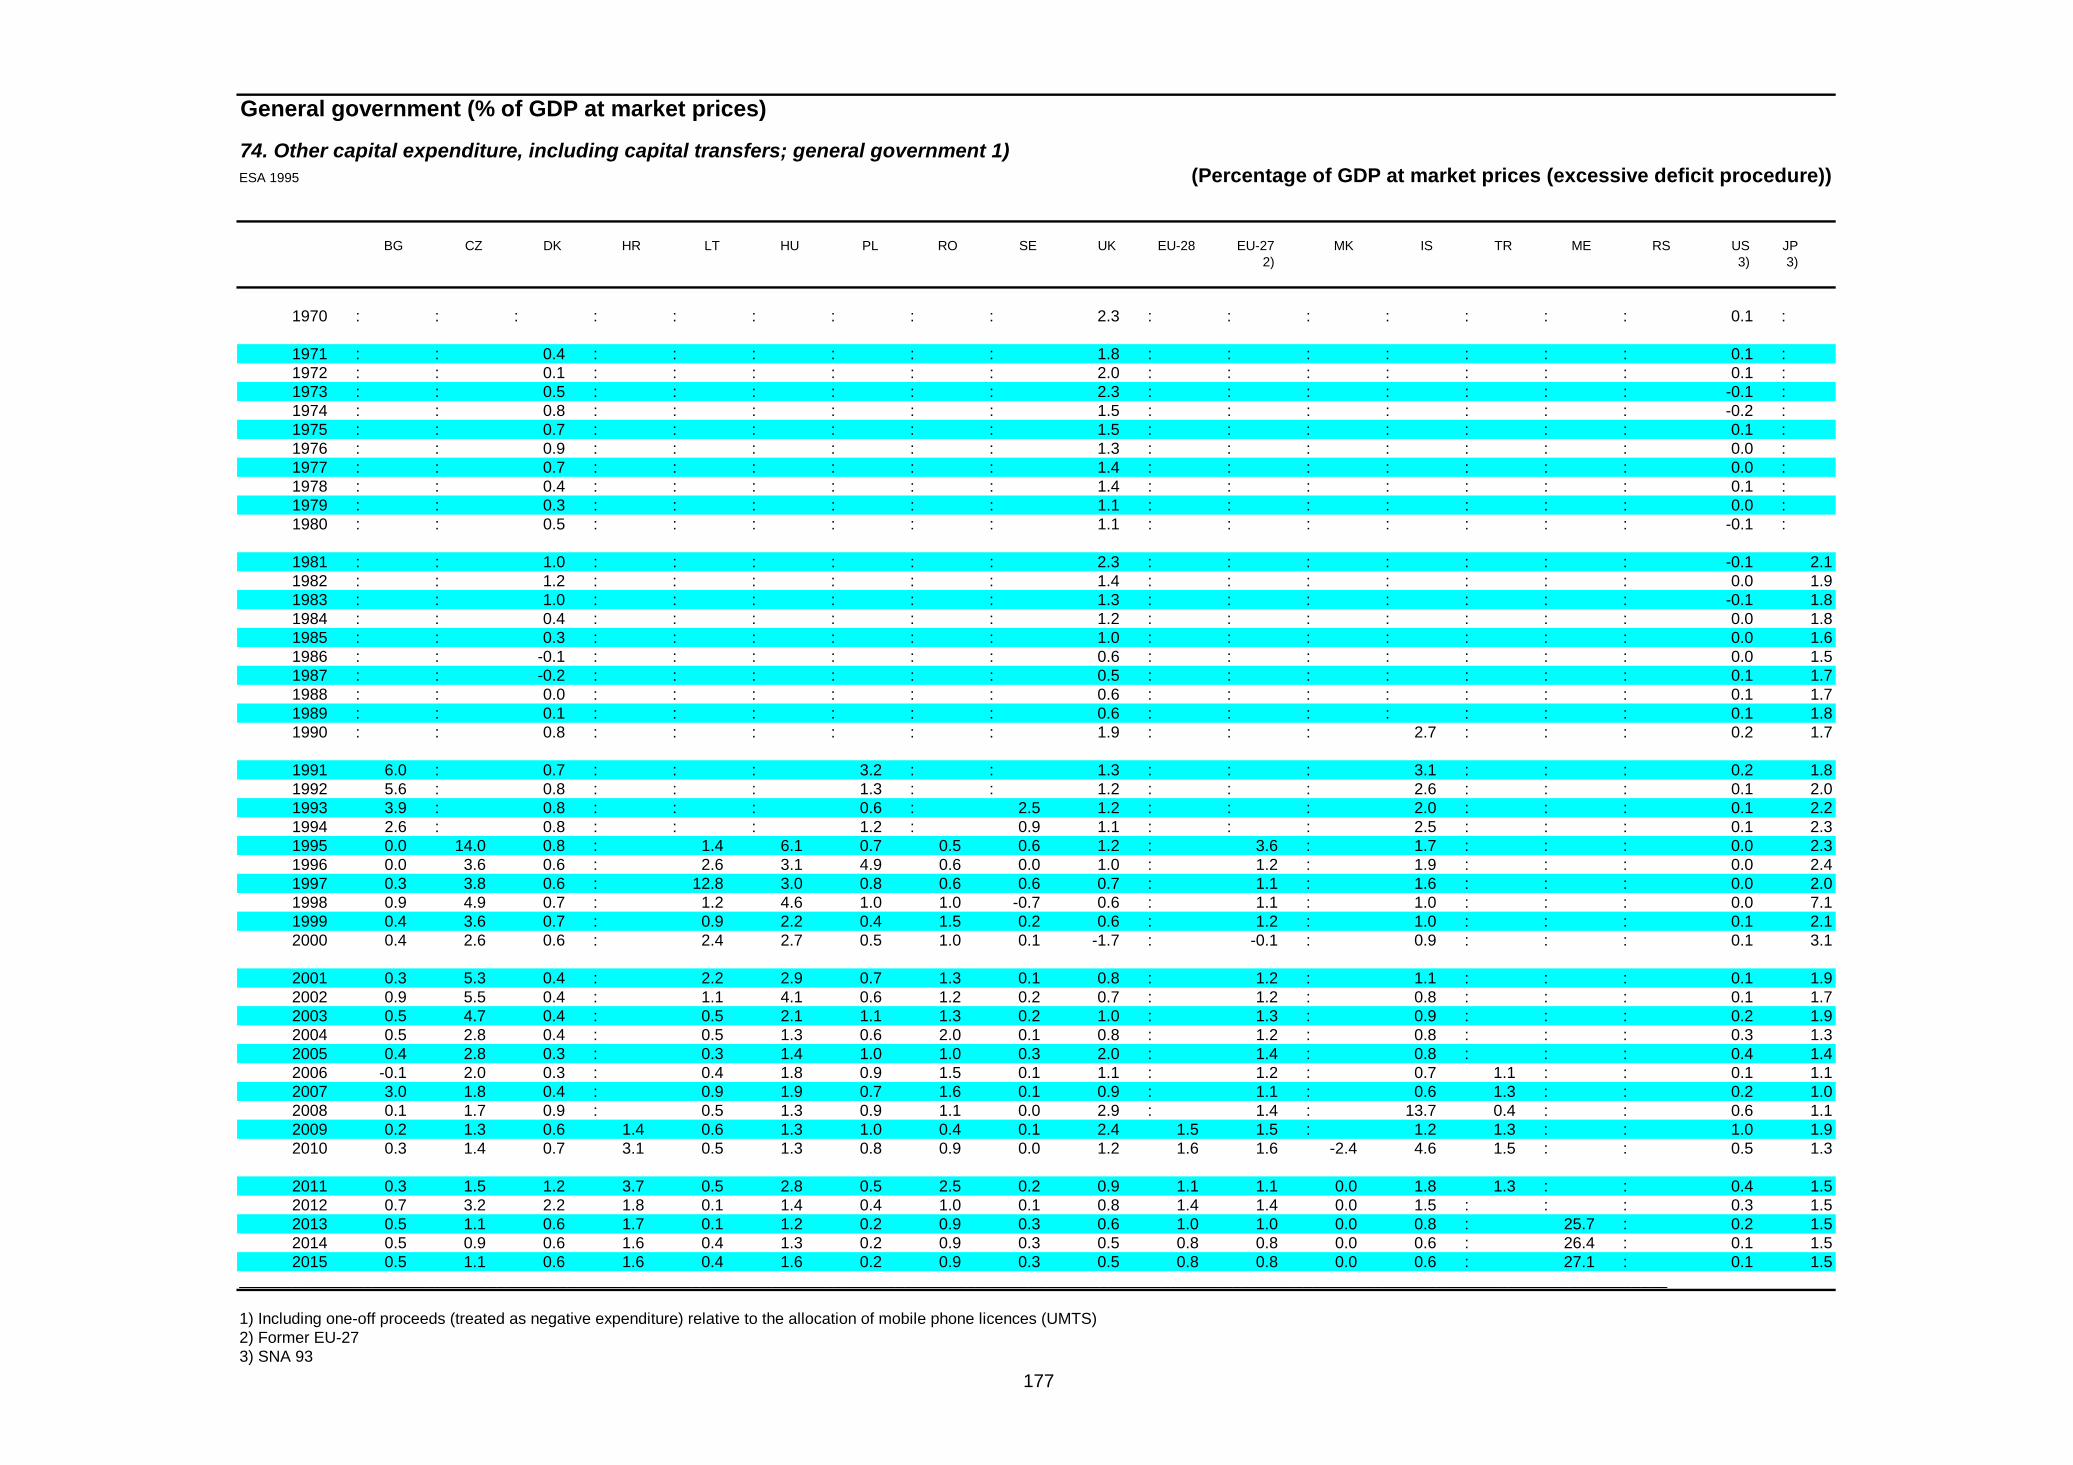
177
General government (% of GDP at market prices)
74. Other capital expenditure, including capital transfers; general government 1)ESA 1995 (Percentage of GDP at market prices (excessive deficit procedure))
BG CZ DK HR LT HU PL RO SE UK EU-28 EU-27 MK IS TR ME RS US JP 2) 3) 3)
1970 : : : : : : : : : 2.3 : : : : : : : 0.1 :
1971 : : 0.4 : : : : : : 1.8 : : : : : : : 0.1 : 1972 : : 0.1 : : : : : : 2.0 : : : : : : : 0.1 : 1973 : : 0.5 : : : : : : 2.3 : : : : : : : -0.1 : 1974 : : 0.8 : : : : : : 1.5 : : : : : : : -0.2 : 1975 : : 0.7 : : : : : : 1.5 : : : : : : : 0.1 : 1976 : : 0.9 : : : : : : 1.3 : : : : : : : 0.0 : 1977 : : 0.7 : : : : : : 1.4 : : : : : : : 0.0 : 1978 : : 0.4 : : : : : : 1.4 : : : : : : : 0.1 : 1979 : : 0.3 : : : : : : 1.1 : : : : : : : 0.0 : 1980 : : 0.5 : : : : : : 1.1 : : : : : : : -0.1 :
1981 : : 1.0 : : : : : : 2.3 : : : : : : : -0.1 2.11982 : : 1.2 : : : : : : 1.4 : : : : : : : 0.0 1.91983 : : 1.0 : : : : : : 1.3 : : : : : : : -0.1 1.81984 : : 0.4 : : : : : : 1.2 : : : : : : : 0.0 1.81985 : : 0.3 : : : : : : 1.0 : : : : : : : 0.0 1.61986 : : -0.1 : : : : : : 0.6 : : : : : : : 0.0 1.51987 : : -0.2 : : : : : : 0.5 : : : : : : : 0.1 1.71988 : : 0.0 : : : : : : 0.6 : : : : : : : 0.1 1.71989 : : 0.1 : : : : : : 0.6 : : : : : : : 0.1 1.81990 : : 0.8 : : : : : : 1.9 : : : 2.7 : : : 0.2 1.7
1991 6.0 : 0.7 : : : 3.2 : : 1.3 : : : 3.1 : : : 0.2 1.81992 5.6 : 0.8 : : : 1.3 : : 1.2 : : : 2.6 : : : 0.1 2.01993 3.9 : 0.8 : : : 0.6 : 2.5 1.2 : : : 2.0 : : : 0.1 2.21994 2.6 : 0.8 : : : 1.2 : 0.9 1.1 : : : 2.5 : : : 0.1 2.31995 0.0 14.0 0.8 : 1.4 6.1 0.7 0.5 0.6 1.2 : 3.6 : 1.7 : : : 0.0 2.31996 0.0 3.6 0.6 : 2.6 3.1 4.9 0.6 0.0 1.0 : 1.2 : 1.9 : : : 0.0 2.41997 0.3 3.8 0.6 : 12.8 3.0 0.8 0.6 0.6 0.7 : 1.1 : 1.6 : : : 0.0 2.01998 0.9 4.9 0.7 : 1.2 4.6 1.0 1.0 -0.7 0.6 : 1.1 : 1.0 : : : 0.0 7.11999 0.4 3.6 0.7 : 0.9 2.2 0.4 1.5 0.2 0.6 : 1.2 : 1.0 : : : 0.1 2.12000 0.4 2.6 0.6 : 2.4 2.7 0.5 1.0 0.1 -1.7 : -0.1 : 0.9 : : : 0.1 3.1
2001 0.3 5.3 0.4 : 2.2 2.9 0.7 1.3 0.1 0.8 : 1.2 : 1.1 : : : 0.1 1.92002 0.9 5.5 0.4 : 1.1 4.1 0.6 1.2 0.2 0.7 : 1.2 : 0.8 : : : 0.1 1.72003 0.5 4.7 0.4 : 0.5 2.1 1.1 1.3 0.2 1.0 : 1.3 : 0.9 : : : 0.2 1.92004 0.5 2.8 0.4 : 0.5 1.3 0.6 2.0 0.1 0.8 : 1.2 : 0.8 : : : 0.3 1.32005 0.4 2.8 0.3 : 0.3 1.4 1.0 1.0 0.3 2.0 : 1.4 : 0.8 : : : 0.4 1.42006 -0.1 2.0 0.3 : 0.4 1.8 0.9 1.5 0.1 1.1 : 1.2 : 0.7 1.1 : : 0.1 1.12007 3.0 1.8 0.4 : 0.9 1.9 0.7 1.6 0.1 0.9 : 1.1 : 0.6 1.3 : : 0.2 1.02008 0.1 1.7 0.9 : 0.5 1.3 0.9 1.1 0.0 2.9 : 1.4 : 13.7 0.4 : : 0.6 1.12009 0.2 1.3 0.6 1.4 0.6 1.3 1.0 0.4 0.1 2.4 1.5 1.5 : 1.2 1.3 : : 1.0 1.92010 0.3 1.4 0.7 3.1 0.5 1.3 0.8 0.9 0.0 1.2 1.6 1.6 -2.4 4.6 1.5 : : 0.5 1.3
2011 0.3 1.5 1.2 3.7 0.5 2.8 0.5 2.5 0.2 0.9 1.1 1.1 0.0 1.8 1.3 : : 0.4 1.52012 0.7 3.2 2.2 1.8 0.1 1.4 0.4 1.0 0.1 0.8 1.4 1.4 0.0 1.5 : : : 0.3 1.52013 0.5 1.1 0.6 1.7 0.1 1.2 0.2 0.9 0.3 0.6 1.0 1.0 0.0 0.8 : 25.7 : 0.2 1.52014 0.5 0.9 0.6 1.6 0.4 1.3 0.2 0.9 0.3 0.5 0.8 0.8 0.0 0.6 : 26.4 : 0.1 1.52015 0.5 1.1 0.6 1.6 0.4 1.6 0.2 0.9 0.3 0.5 0.8 0.8 0.0 0.6 : 27.1 : 0.1 1.5
_________________________________________________________________________________________________________________________________________________________________ 1) Including one-off proceeds (treated as negative expenditure) relative to the allocation of mobile phone licences (UMTS) 2) Former EU-27 3) SNA 93

178
General government (% of GDP at market prices)
75. Total expenditure; general government 1)Excessive deficit procedure (Percentage of GDP at market prices (excessive deficit procedure))
BE DE EE IE EL ES FR IT CY LV LU MT NL AT PT SI SK FI EA-18 2) 3)
1970 40.2 38.5 : : : : : : : : : : 43.2 : : : : : :
1971 41.7 39.9 : : : : : : : : : : 44.6 : : : : : : 1972 43.2 41.0 : : : : : : : : : : 44.9 : : : : : : 1973 43.4 41.6 : : : : : : : : : : 44.8 : : : : : : 1974 43.4 44.8 : : : : : : : : : : 45.4 : : : : : : 1975 48.8 48.8 : : : : : : : : : : 51.0 : : : : 38.5 : 1976 49.3 48.3 : : : : : : : : : : 51.1 47.6 : : : 39.8 : 1977 51.1 47.9 : : : : : : : : : : 51.1 47.3 28.7 : : 41.6 : 1978 52.8 47.0 : : : : 44.7 : : : : : 52.7 50.3 31.7 : : 41.3 : 1979 54.8 46.5 : : : : 44.9 : : : : : 53.7 49.4 30.8 : : 40.3 : 1980 54.9 46.9 : : : : 46.0 40.6 : : : : 55.2 49.6 32.3 : : 40.2 :
1981 61.5 47.5 : : : : 48.5 44.4 : : : : 56.5 51.1 35.3 : : 41.2 : 1982 59.6 47.5 : : : : 49.9 46.5 : : : : 59.1 51.7 35.7 : : 42.8 : 1983 62.2 46.5 : : : : 50.2 48.7 : : : : 59.3 52.1 34.7 : : 44.6 : 1984 59.1 45.8 : : : : 51.2 48.9 : : : : 57.9 52.2 34.6 : : 44.6 : 1985 58.4 45.2 : 52.6 : : 51.9 49.6 : : : : 57.3 53.1 37.5 : : 46.5 : 1986 57.6 44.5 : 52.3 : : 51.3 50.2 : : : : 57.0 53.9 38.9 : : 47.2 : 1987 55.8 45.0 : 50.8 : : 50.7 49.6 : : : : 58.5 54.2 37.5 : : 48.0 : 1988 53.8 44.6 : 47.7 39.6 : 50.1 50.2 : : : : 56.4 53.2 36.1 : : 46.6 : 1989 52.3 43.1 : 42.0 40.9 : 48.9 51.4 : : : : 54.5 51.7 36.2 : : 44.7 : 1990 52.2 43.6 : 42.3 45.2 : 49.6 52.6 : 31.5 37.8 : 54.9 51.5 38.5 : : 48.2 :
1991 45.7
1991 53.4 46.3 : 43.9 42.1 : 50.7 53.7 : : 38.4 : 54.9 52.6 41.3 : : 57.1 : 1992 53.7 47.2 : 44.3 44.5 : 52.0 55.0 : 24.3 40.0 : 55.7 53.4 42.4 : : 62.4 : 1993 54.9 48.2 35.9 44.1 46.8 : 55.1 56.0 : 34.6 39.8 : 55.7 56.4 44.1 : 78.1 64.9 : 1994 52.6 48.0 41.7 43.4 45.0 : 54.1 53.2 : 37.8 39.0 : 53.5 56.0 42.4 : 57.3 63.6 : 1995 52.1 54.9 41.3 40.9 46.2 44.5 54.4 52.2 33.4 38.4 39.7 38.5 56.4 56.2 41.9 52.3 48.6 61.5 53.01996 52.4 49.1 39.4 39.2 44.5 43.2 54.5 52.2 35.4 37.1 41.1 41.0 49.4 55.7 42.4 44.2 53.7 60.1 50.51997 51.2 48.2 37.4 37.1 45.3 41.6 54.2 50.0 36.5 36.2 40.7 41.4 47.5 53.3 41.6 44.5 48.9 56.6 49.21998 50.3 48.0 39.2 34.6 44.7 41.1 52.8 48.6 36.7 39.1 41.1 41.7 46.7 53.6 41.4 45.4 45.8 52.9 48.41999 50.1 48.2 40.1 34.1 44.8 39.9 52.6 47.8 36.7 41.6 39.2 41.6 46.0 53.3 41.5 46.2 48.1 51.7 48.02000 49.0 45.1 36.1 31.2 47.1 39.2 51.7 45.8 37.1 37.6 37.6 39.5 44.2 51.8 41.6 46.5 52.1 48.3 46.1
2001 49.1 47.6 34.8 33.3 45.8 38.6 51.7 47.7 38.0 35.0 38.1 41.2 45.3 51.2 43.1 47.3 44.5 48.0 47.22002 49.7 47.9 35.8 33.6 45.5 38.9 52.9 47.0 40.0 36.0 41.5 41.7 46.2 50.5 43.0 46.2 45.1 49.0 47.52003 51.0 48.5 34.8 33.3 45.1 38.4 53.4 48.0 44.6 34.9 41.8 45.6 47.1 51.2 44.6 46.2 40.1 50.1 48.02004 49.1 47.1 34.0 33.7 46.0 38.9 53.2 47.5 42.4 35.9 42.6 43.6 46.1 53.6 45.4 45.6 37.7 50.0 47.42005 51.7 46.9 33.6 34.0 44.4 38.4 53.5 47.9 43.1 35.8 41.5 43.6 44.8 49.9 46.6 45.1 38.0 50.2 47.32006 48.4 45.3 33.6 34.5 45.1 38.3 52.9 48.5 42.6 38.3 38.6 43.2 45.5 49.0 45.2 44.3 36.5 49.1 46.62007 48.2 43.5 34.0 36.7 47.2 39.2 52.6 47.7 41.3 36.0 36.3 41.8 45.2 48.5 44.3 42.3 34.2 47.4 46.02008 49.7 44.1 39.7 42.8 50.5 41.4 53.3 48.6 42.1 39.1 39.1 43.3 46.2 49.3 44.7 44.1 34.9 49.2 47.12009 53.7 48.3 44.8 48.2 54.0 46.2 56.7 52.0 46.2 43.7 45.2 42.5 51.4 52.6 49.7 48.7 41.6 55.9 51.22010 52.5 47.9 40.5 65.5 51.3 46.3 56.5 50.6 46.2 43.5 43.5 41.2 51.4 52.8 51.5 49.5 39.8 55.5 51.0
2011 53.4 45.2 37.6 47.2 51.8 45.7 55.9 49.8 46.3 38.4 42.6 41.3 49.9 50.8 49.3 49.9 38.9 54.8 49.52012 55.0 44.7 39.5 42.7 53.3 47.8 56.7 50.7 45.8 36.4 43.9 43.1 50.5 51.6 47.4 48.4 38.2 56.3 49.92013 54.6 44.7 38.3 43.1 58.5 44.9 57.0 50.8 45.8 36.1 43.5 43.9 49.9 51.2 48.6 59.4 38.7 58.1 49.82014 53.9 44.6 38.5 40.5 47.4 43.8 56.8 50.3 47.1 35.3 43.1 44.1 49.8 52.4 47.1 49.5 38.0 58.6 49.22015 54.2 44.5 38.2 39.4 45.5 43.0 56.1 49.8 46.1 34.3 44.0 43.8 49.5 50.9 45.6 47.4 37.5 58.3 48.7
1) Including one-off proceeds (treated as negative expenditure) relative to the allocation of mobile phone licences (UMTS) 2) 1970-91 D_W 3) Euro area; 1970-91 including D_W 3) Euro area including Latvia; 1970-91 including D_W

179
General government (% of GDP at market prices)
75. Total expenditure; general government 1)Excessive deficit procedure (Percentage of GDP at market prices (excessive deficit procedure))
BG CZ DK HR LT HU PL RO SE UK EU-28 EU-27 MK IS TR ME RS US JP 2) 3) 3)
1970 : : : : : : : : : 41.8 : : : : : : : 34.0 :
1971 : : 42.2 : : : : : : 41.0 : : : : : : : 34.3 : 1972 : : 42.1 : : : : : : 42.1 : : : : : : : 34.1 : 1973 : : 39.5 : : : : : : 43.3 : : : : : : : 33.0 : 1974 : : 43.6 : : : : : : 47.6 : : : : : : : 34.2 : 1975 : : 45.3 : : : : : : 48.9 : : : : : : : 36.5 : 1976 : : 45.0 : : : : : : 49.0 : : : : : : : 35.0 : 1977 : : 45.6 : : : : : : 46.6 : : : : : : : 34.1 : 1978 : : 47.2 : : : : : : 46.0 : : : : : : : 33.3 : 1979 : : 49.6 : : : : : : 44.9 : : : : : : : 33.1 : 1980 : : 52.7 : : : : : : 47.4 : : : : : : : 34.9 :
1981 : : 56.3 : : : : : : 51.0 : : : : : : : 35.1 33.51982 : : 57.7 : : : : : : 50.5 : : : : : : : 37.3 33.71983 : : 57.9 : : : : : : 50.2 : : : : : : : 37.3 34.01984 : : 56.6 : : : : : : 50.1 : : : : : : : 36.2 33.31985 : : 55.5 : : : : : : 48.5 : : : : : : : 36.7 32.21986 : : 52.3 : : : : : : 44.4 : : : : : : : 37.1 32.31987 : : 54.0 : : : : : : 42.5 : : : : : : : 36.9 32.81988 : : 56.1 : : : : : : 40.0 : : : : : : : 36.0 31.91989 : : 56.2 : : : : : : 39.4 : : : : : : : 36.1 31.01990 : : 55.4 : : : : : : 40.7 : : : : : : : 37.0 31.1
1991 : : 56.1 : : : : : : 42.3 : : : : : : : 37.9 31.11992 : : 57.2 : : : : : : 44.4 : : : : : : : 38.7 32.21993 : : 60.3 : : : : : 71.7 44.3 : : : : : : : 38.1 34.01994 : : 60.2 : : : : : 69.6 43.6 : : : : : : : 37.2 34.71995 45.6 53.0 59.3 : 34.4 55.8 47.7 34.1 65.0 43.0 : 52.0 : 42.7 : : : 37.1 35.71996 49.0 41.7 58.9 : 36.4 51.4 51.0 33.2 62.8 41.5 : 49.7 : 42.2 : : : 36.4 36.41997 33.9 42.6 56.7 : 50.2 50.3 46.4 34.6 60.6 39.8 : 48.1 : 40.7 : : : 35.3 35.31998 38.4 43.0 56.3 : 41.1 51.6 44.3 35.8 58.9 38.9 : 47.1 : 41.3 : : : 34.4 41.51999 40.0 42.2 55.4 : 40.8 49.5 42.7 39.2 58.0 38.5 : 46.7 : 42.0 : : : 34.0 38.22000 41.3 41.6 53.6 : 39.8 47.7 41.1 38.6 55.1 36.4 : 44.7 : 41.9 : : : 33.7 38.8
2001 40.6 43.9 54.1 : 37.5 47.8 43.8 36.2 54.6 39.9 : 46.1 : 42.6 : : : 34.9 38.02002 39.6 45.6 54.4 : 35.4 51.5 44.3 35.0 55.4 40.9 : 46.5 : 44.3 : : : 36.0 38.32003 39.1 50.0 54.9 : 33.8 49.7 44.7 33.5 55.4 41.8 : 47.1 : 45.6 : : : 36.6 37.82004 38.6 43.3 54.3 : 34.0 49.1 42.6 33.6 54.0 42.6 : 46.7 : 44.0 : : : 36.3 36.62005 37.3 43.0 52.6 : 34.0 50.1 43.4 33.6 53.6 43.4 : 46.7 : 42.2 : : : 36.4 36.42006 34.4 42.0 51.5 : 34.2 52.1 43.9 35.5 52.6 43.6 : 46.2 : 41.6 33.0 42.4 : 36.1 36.02007 39.2 41.0 50.8 : 35.3 50.7 42.2 38.2 50.9 43.3 : 45.5 : 42.3 34.7 43.2 : 36.9 35.82008 38.4 41.2 51.6 : 37.9 49.3 43.2 39.3 51.7 47.1 : 47.0 36.1 57.7 36.3 50.4 : 39.0 36.92009 41.4 44.7 58.0 46.1 44.9 51.5 44.6 41.1 54.7 50.9 51.0 51.0 34.6 51.0 43.1 51.1 : 42.9 41.92010 37.4 43.8 57.5 46.9 42.2 49.9 45.4 40.1 52.0 49.9 50.6 50.6 32.9 51.6 40.2 47.2 : 42.6 40.7
2011 35.6 43.2 57.5 48.1 38.7 50.0 43.4 39.4 51.3 48.0 49.0 49.0 31.7 47.4 37.4 45.2 : 41.5 41.92012 35.8 44.5 59.2 45.7 36.0 48.6 42.2 36.7 51.8 48.1 49.4 49.4 33.3 47.4 38.9 46.9 : 40.0 42.02013 38.7 42.4 57.0 45.9 34.4 49.8 41.9 35.0 52.6 47.1 49.1 49.1 33.4 46.3 40.7 45.2 : 38.8 42.52014 39.4 42.5 56.8 46.8 34.2 50.2 41.3 34.8 52.2 45.6 48.4 48.4 33.6 44.1 41.0 45.4 : 38.3 42.32015 39.5 42.6 55.8 46.6 33.3 49.3 41.2 34.7 51.3 44.3 47.7 47.7 33.7 43.6 40.0 44.5 : 38.3 41.7
_________________________________________________________________________________________________________________________________________________________________ 1) Including one-off proceeds (treated as negative expenditure) relative to the allocation of mobile phone licences (UMTS) 2) Former EU-27 3) SNA 93

180
General government (% of GDP at market prices)
76. Net lending (+) or net borrowing (-); general government 1)Excessive deficit procedure (Percentage of GDP at market prices (excessive deficit procedure))
BE DE EE IE EL ES FR IT CY LV LU MT NL AT PT SI SK FI EA-18 2) 3)
1970 -2.1 0.5 : : : : 0.1 : : : : : -1.5 : : : : : :
1971 -3.1 0.2 : : : : -0.2 : : : : : -1.6 : : : : : : 1972 -4.6 -0.4 : : : : 0.4 : : : : : -0.7 : : : : : : 1973 -3.8 1.1 : : : : 0.1 : : : : : 0.5 : : : : : : 1974 -2.9 -1.6 : : : : 0.2 : : : : : -0.3 : : : : : : 1975 -5.3 -5.6 : : : : -2.8 : : : : : -2.8 : : : : 5.0 : 1976 -5.8 -3.4 : : : : -1.5 : : : : : -2.0 -3.8 : : : 7.7 : 1977 -5.8 -2.5 : : : : -1.1 : : : : : -0.8 -2.4 -2.8 : : 6.3 : 1978 -6.5 -2.6 : : : : -1.7 : : : : : -2.1 -3.0 -7.1 : : 3.9 : 1979 -8.3 -2.7 : : : : -0.4 : : : : : -2.5 -2.8 -6.1 : : 3.5 : 1980 -9.4 -2.9 : : : : -0.3 -6.9 : : : : -3.9 -2.1 -6.9 : : 3.8 :
1981 -15.5 -3.9 : : : : -2.4 -10.8 : : : : -4.9 -2.1 -8.3 : : 5.2 : 1982 -12.3 -3.4 : : : : -2.9 -10.0 : : : : -6.2 -3.7 -7.0 : : 3.1 : 1983 -14.5 -2.9 : : : : -2.6 -10.1 : : : : -5.5 -4.5 -4.9 : : 1.5 : 1984 -10.8 -2.0 : : : : -2.8 -11.4 : : : : -5.2 -2.9 -5.2 : : 3.3 : 1985 -10.1 -1.1 : -10.5 : : -3.1 -12.3 : : : : -3.6 -3.1 -8.3 : : 3.4 : 1986 -10.0 -1.2 : -10.4 : : -3.3 -11.9 : : : : -4.6 -4.1 -7.4 : : 3.9 : 1987 -7.9 -1.8 : -8.4 : : -2.1 -11.5 : : : : -5.4 -4.7 -6.8 : : 1.6 : 1988 -7.2 -2.0 : -4.6 -10.4 : -2.7 -11.0 : : : : -4.2 -3.5 -3.5 : : 5.2 : 1989 -7.5 0.1 : -2.6 -12.2 : -1.9 -11.4 : : : : -5.0 -3.1 -2.9 : : 6.8 : 1990 -6.7 -1.9 : -2.7 -14.2 : -2.5 -11.4 : 6.8 4.3 : -5.3 -2.6 -6.1 : : 5.4 :
1991 -2.8
1991 -7.4 -2.9 : -2.8 -9.9 : -3.0 -11.3 : 5.7 0.7 : -2.7 -3.0 -6.9 : : -1.0 : 1992 -8.1 -2.4 : -2.8 -11.0 : -4.6 -10.3 : -0.5 -0.2 : -4.2 -2.1 -4.4 : : -5.5 : 1993 -7.5 -3.0 9.7 -2.6 -12.0 : -6.5 -10.0 : 2.2 1.5 : -2.8 -4.5 -7.4 : -30.9 -8.2 : 1994 -5.1 -2.5 4.4 -1.8 -8.3 : -5.5 -9.0 : -1.3 2.5 : -3.5 -5.0 -7.1 : -6.1 -6.7 : 1995 -4.5 -9.5 1.1 -2.2 -9.1 -7.2 -5.5 -7.4 -0.9 -1.6 2.4 -3.7 -9.2 -5.8 -5.4 -8.3 -3.4 -6.1 -7.51996 -4.0 -3.4 -0.3 -0.3 -6.7 -5.5 -4.0 -7.0 -3.2 -0.4 1.2 -7.9 -1.9 -4.0 -4.9 -1.1 -9.9 -3.4 -4.31997 -2.2 -2.8 2.2 1.0 -5.9 -4.0 -3.3 -2.7 -5.1 1.5 3.7 -7.4 -1.2 -1.8 -3.7 -2.3 -6.3 -1.3 -2.81998 -0.9 -2.3 -0.7 2.2 -3.9 -3.0 -2.6 -2.7 -4.2 0.0 3.4 -9.7 -0.9 -2.4 -3.9 -2.4 -5.3 1.7 -2.31999 -0.6 -1.6 -3.5 2.6 -3.1 -1.3 -1.8 -1.9 -4.3 -3.8 3.4 -6.9 0.4 -2.3 -3.1 -3.0 -7.4 1.7 -1.52000 0.0 1.1 -0.2 4.9 -3.7 -0.9 -1.5 -0.8 -2.3 -2.8 6.0 -5.7 2.0 -1.7 -3.3 -3.7 -12.3 7.0 -0.1
2001 0.4 -3.1 -0.1 0.9 -4.5 -0.5 -1.6 -3.1 -2.2 -2.0 6.1 -6.3 -0.2 0.0 -4.8 -4.0 -6.5 5.1 -2.02002 -0.1 -3.8 0.3 -0.4 -4.9 -0.3 -3.3 -3.1 -4.4 -2.3 2.1 -5.7 -2.1 -0.7 -3.4 -2.4 -8.2 4.2 -2.72003 -0.1 -4.2 1.7 0.4 -5.7 -0.3 -4.1 -3.6 -6.6 -1.6 0.5 -9.0 -3.1 -1.5 -3.7 -2.7 -2.8 2.6 -3.12004 -0.1 -3.8 1.6 1.4 -7.6 -0.1 -3.6 -3.5 -4.1 -1.1 -1.1 -4.6 -1.7 -4.4 -4.0 -2.3 -2.4 2.5 -2.92005 -2.5 -3.3 1.6 1.6 -5.5 1.3 -2.9 -4.4 -2.4 -0.4 0.0 -2.9 -0.3 -1.7 -6.5 -1.5 -2.8 2.9 -2.52006 0.4 -1.6 2.5 2.9 -6.0 2.4 -2.3 -3.4 -1.2 -0.6 1.4 -2.7 0.5 -1.5 -4.6 -1.4 -3.2 4.2 -1.42007 -0.1 0.2 2.4 0.2 -6.5 2.0 -2.7 -1.6 3.5 -0.7 3.7 -2.3 0.2 -0.9 -3.1 0.0 -1.8 5.3 -0.72008 -1.0 -0.1 -3.0 -7.4 -9.8 -4.5 -3.3 -2.7 0.9 -4.4 3.2 -4.6 0.5 -0.9 -3.6 -1.9 -2.1 4.4 -2.12009 -5.6 -3.1 -2.0 -13.7 -15.7 -11.1 -7.5 -5.5 -6.1 -9.2 -0.7 -3.7 -5.6 -4.1 -10.2 -6.3 -8.0 -2.5 -6.32010 -3.8 -4.2 0.2 -30.6 -10.9 -9.6 -7.0 -4.5 -5.3 -8.2 -0.8 -3.5 -5.1 -4.5 -9.8 -5.9 -7.5 -2.5 -6.2
2011 -3.8 -0.8 1.1 -13.1 -9.6 -9.6 -5.2 -3.7 -6.3 -3.5 0.2 -2.7 -4.3 -2.5 -4.3 -6.4 -4.8 -0.7 -4.12012 -4.1 0.1 -0.2 -8.2 -8.9 -10.6 -4.9 -3.0 -6.4 -1.3 0.0 -3.3 -4.1 -2.6 -6.4 -4.0 -4.5 -1.8 -3.72013 -2.6 0.0 -0.2 -7.2 -12.7 -7.1 -4.3 -3.0 -5.4 -1.0 0.1 -2.8 -2.5 -1.5 -4.9 -14.7 -2.8 -2.1 -3.02014 -2.6 0.0 -0.5 -4.8 -1.6 -5.6 -3.9 -2.6 -5.8 -1.0 -0.2 -2.5 -2.8 -2.8 -4.0 -4.3 -2.9 -2.3 -2.52015 -2.8 -0.1 -0.6 -4.2 -1.0 -6.1 -3.4 -2.2 -6.0 -1.1 -1.4 -2.5 -1.8 -1.5 -2.5 -3.1 -2.8 -1.3 -2.3
1) Including one-off proceeds relative to the allocation of mobile phone licences (UMTS) 2) 1970-91 D_W 3) Euro area; 1970-91 including D_W 3) Not including for 1995 a net amount of 14.9 bn EURO-NLG of exceptional expenditure related to the reform of the financing of the social housing societies.4) Euro area including Latvia; 1970-91 including D_W
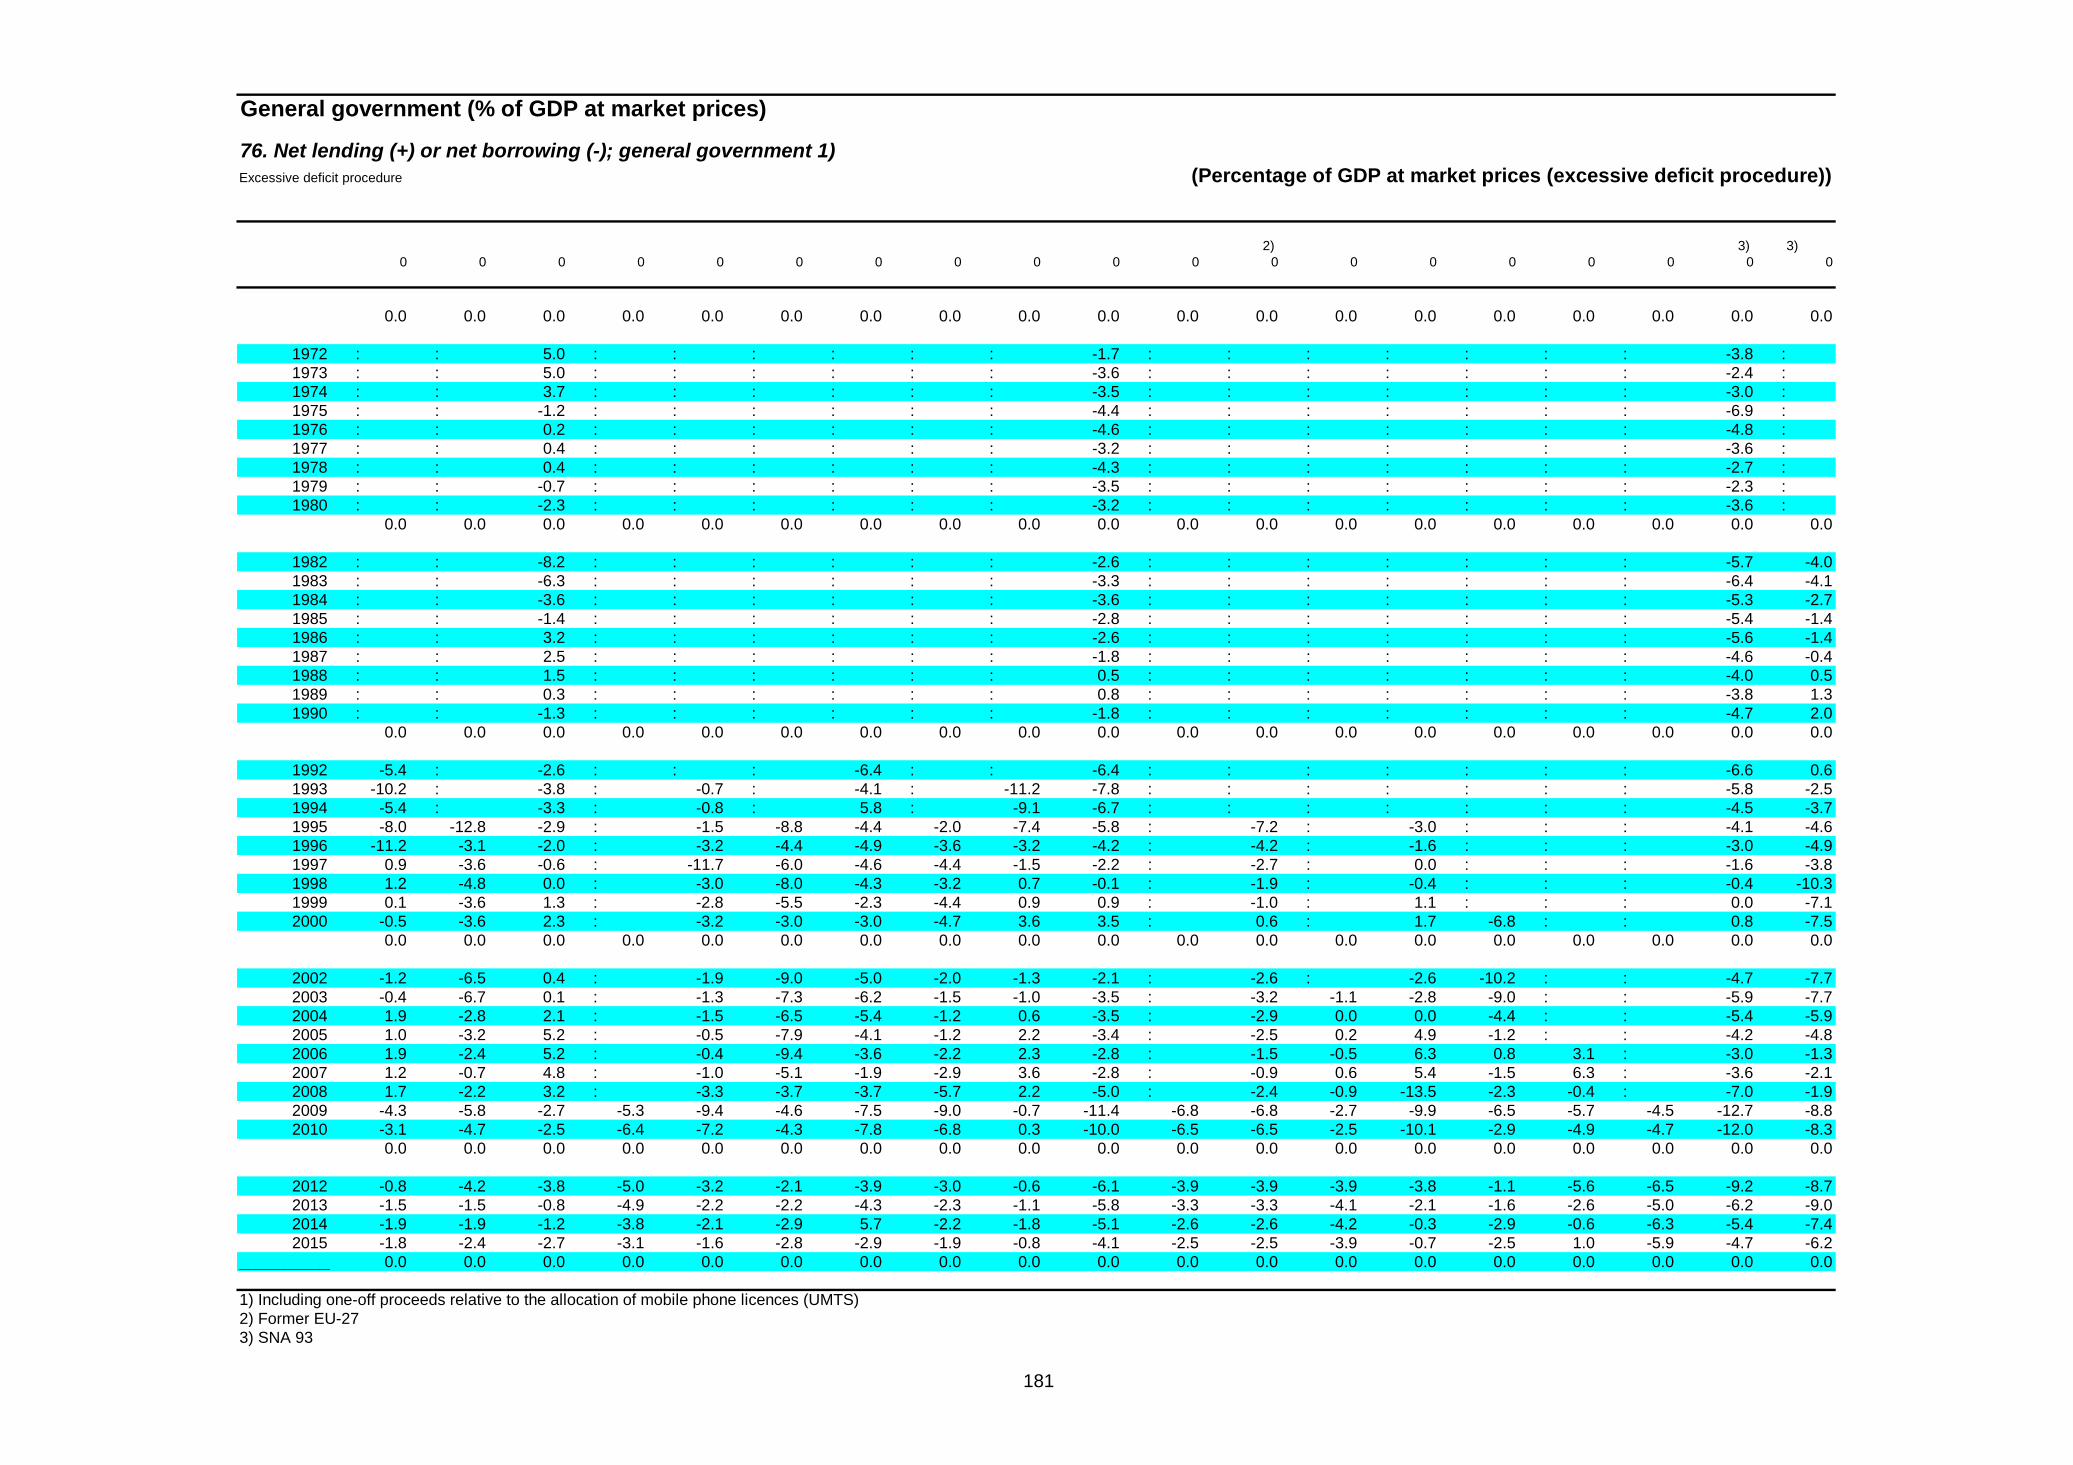
181
General government (% of GDP at market prices)
76. Net lending (+) or net borrowing (-); general government 1)Excessive deficit procedure (Percentage of GDP at market prices (excessive deficit procedure))
2) 3) 3) 0 0 0 0 0 0 0 0 0 0 0 0 0 0 0 0 0 0 0
0.0 0.0 0.0 0.0 0.0 0.0 0.0 0.0 0.0 0.0 0.0 0.0 0.0 0.0 0.0 0.0 0.0 0.0 0.0
1972 : : 5.0 : : : : : : -1.7 : : : : : : : -3.8 : 1973 : : 5.0 : : : : : : -3.6 : : : : : : : -2.4 : 1974 : : 3.7 : : : : : : -3.5 : : : : : : : -3.0 : 1975 : : -1.2 : : : : : : -4.4 : : : : : : : -6.9 : 1976 : : 0.2 : : : : : : -4.6 : : : : : : : -4.8 : 1977 : : 0.4 : : : : : : -3.2 : : : : : : : -3.6 : 1978 : : 0.4 : : : : : : -4.3 : : : : : : : -2.7 : 1979 : : -0.7 : : : : : : -3.5 : : : : : : : -2.3 : 1980 : : -2.3 : : : : : : -3.2 : : : : : : : -3.6 :
0.0 0.0 0.0 0.0 0.0 0.0 0.0 0.0 0.0 0.0 0.0 0.0 0.0 0.0 0.0 0.0 0.0 0.0 0.0
1982 : : -8.2 : : : : : : -2.6 : : : : : : : -5.7 -4.01983 : : -6.3 : : : : : : -3.3 : : : : : : : -6.4 -4.11984 : : -3.6 : : : : : : -3.6 : : : : : : : -5.3 -2.71985 : : -1.4 : : : : : : -2.8 : : : : : : : -5.4 -1.41986 : : 3.2 : : : : : : -2.6 : : : : : : : -5.6 -1.41987 : : 2.5 : : : : : : -1.8 : : : : : : : -4.6 -0.41988 : : 1.5 : : : : : : 0.5 : : : : : : : -4.0 0.51989 : : 0.3 : : : : : : 0.8 : : : : : : : -3.8 1.31990 : : -1.3 : : : : : : -1.8 : : : : : : : -4.7 2.0
0.0 0.0 0.0 0.0 0.0 0.0 0.0 0.0 0.0 0.0 0.0 0.0 0.0 0.0 0.0 0.0 0.0 0.0 0.0
1992 -5.4 : -2.6 : : : -6.4 : : -6.4 : : : : : : : -6.6 0.61993 -10.2 : -3.8 : -0.7 : -4.1 : -11.2 -7.8 : : : : : : : -5.8 -2.51994 -5.4 : -3.3 : -0.8 : 5.8 : -9.1 -6.7 : : : : : : : -4.5 -3.71995 -8.0 -12.8 -2.9 : -1.5 -8.8 -4.4 -2.0 -7.4 -5.8 : -7.2 : -3.0 : : : -4.1 -4.61996 -11.2 -3.1 -2.0 : -3.2 -4.4 -4.9 -3.6 -3.2 -4.2 : -4.2 : -1.6 : : : -3.0 -4.91997 0.9 -3.6 -0.6 : -11.7 -6.0 -4.6 -4.4 -1.5 -2.2 : -2.7 : 0.0 : : : -1.6 -3.81998 1.2 -4.8 0.0 : -3.0 -8.0 -4.3 -3.2 0.7 -0.1 : -1.9 : -0.4 : : : -0.4 -10.31999 0.1 -3.6 1.3 : -2.8 -5.5 -2.3 -4.4 0.9 0.9 : -1.0 : 1.1 : : : 0.0 -7.12000 -0.5 -3.6 2.3 : -3.2 -3.0 -3.0 -4.7 3.6 3.5 : 0.6 : 1.7 -6.8 : : 0.8 -7.5
0.0 0.0 0.0 0.0 0.0 0.0 0.0 0.0 0.0 0.0 0.0 0.0 0.0 0.0 0.0 0.0 0.0 0.0 0.0
2002 -1.2 -6.5 0.4 : -1.9 -9.0 -5.0 -2.0 -1.3 -2.1 : -2.6 : -2.6 -10.2 : : -4.7 -7.72003 -0.4 -6.7 0.1 : -1.3 -7.3 -6.2 -1.5 -1.0 -3.5 : -3.2 -1.1 -2.8 -9.0 : : -5.9 -7.72004 1.9 -2.8 2.1 : -1.5 -6.5 -5.4 -1.2 0.6 -3.5 : -2.9 0.0 0.0 -4.4 : : -5.4 -5.92005 1.0 -3.2 5.2 : -0.5 -7.9 -4.1 -1.2 2.2 -3.4 : -2.5 0.2 4.9 -1.2 : : -4.2 -4.82006 1.9 -2.4 5.2 : -0.4 -9.4 -3.6 -2.2 2.3 -2.8 : -1.5 -0.5 6.3 0.8 3.1 : -3.0 -1.32007 1.2 -0.7 4.8 : -1.0 -5.1 -1.9 -2.9 3.6 -2.8 : -0.9 0.6 5.4 -1.5 6.3 : -3.6 -2.12008 1.7 -2.2 3.2 : -3.3 -3.7 -3.7 -5.7 2.2 -5.0 : -2.4 -0.9 -13.5 -2.3 -0.4 : -7.0 -1.92009 -4.3 -5.8 -2.7 -5.3 -9.4 -4.6 -7.5 -9.0 -0.7 -11.4 -6.8 -6.8 -2.7 -9.9 -6.5 -5.7 -4.5 -12.7 -8.82010 -3.1 -4.7 -2.5 -6.4 -7.2 -4.3 -7.8 -6.8 0.3 -10.0 -6.5 -6.5 -2.5 -10.1 -2.9 -4.9 -4.7 -12.0 -8.3
0.0 0.0 0.0 0.0 0.0 0.0 0.0 0.0 0.0 0.0 0.0 0.0 0.0 0.0 0.0 0.0 0.0 0.0 0.0
2012 -0.8 -4.2 -3.8 -5.0 -3.2 -2.1 -3.9 -3.0 -0.6 -6.1 -3.9 -3.9 -3.9 -3.8 -1.1 -5.6 -6.5 -9.2 -8.72013 -1.5 -1.5 -0.8 -4.9 -2.2 -2.2 -4.3 -2.3 -1.1 -5.8 -3.3 -3.3 -4.1 -2.1 -1.6 -2.6 -5.0 -6.2 -9.02014 -1.9 -1.9 -1.2 -3.8 -2.1 -2.9 5.7 -2.2 -1.8 -5.1 -2.6 -2.6 -4.2 -0.3 -2.9 -0.6 -6.3 -5.4 -7.42015 -1.8 -2.4 -2.7 -3.1 -1.6 -2.8 -2.9 -1.9 -0.8 -4.1 -2.5 -2.5 -3.9 -0.7 -2.5 1.0 -5.9 -4.7 -6.2
___________ 0.0 0.0 0.0 0.0 0.0 0.0 0.0 0.0 0.0 0.0 0.0 0.0 0.0 0.0 0.0 0.0 0.0 0.0 0.0 1) Including one-off proceeds relative to the allocation of mobile phone licences (UMTS) 2) Former EU-27 3) SNA 93

182
77. Net lending (+) or net borrowing (-) excluding interest; general government 1)Excessive deficit procedure (Percentage of GDP at market prices (excessive deficit procedure))
BE DE EE IE EL ES FR IT CY LV LU MT NL AT PT SI SK FI EA-18 2) 3) 4)
1970 1.3 1.4 : : : : : : : : : : 1.4 : : : : : :
1971 0.5 1.1 : : : : : : : : : : 1.3 : : : : : : 1972 -1.1 0.7 : : : : : : : : : : 2.0 : : : : : : 1973 -0.2 2.2 : : : : : : : : : : 3.2 : : : : : : 1974 0.9 -0.4 : : : : : : : : : : 2.6 : : : : : : 1975 -1.4 -4.2 : : : : : : : : : : 0.1 : : : : 5.6 : 1976 -1.7 -1.8 : : : : : : : : : : 0.9 -2.4 : : : 8.3 : 1977 -1.2 -0.9 : : : : : : : : : : 2.3 -0.9 -1.5 : : 7.1 : 1978 -1.6 -1.0 : : : : -0.7 : : : : : 1.1 -1.2 -5.0 : : 4.7 : 1979 -2.8 -0.9 : : : : 0.8 : : : : : 0.8 -0.8 -3.8 : : 4.4 : 1980 -3.0 -0.9 : : : : 0.9 -2.5 : : : : -0.3 0.0 -4.6 : : 4.8 :
1981 -7.4 -1.5 : : : : -0.7 -5.8 : : : : -0.5 0.3 -4.4 : : 6.2 : 1982 -3.1 -0.6 : : : : -1.2 -3.4 : : : : -1.1 -1.0 -2.7 : : 4.3 : 1983 -4.9 0.1 : : : : -0.4 -2.3 : : : : 0.1 -1.9 0.1 : : 3.0 : 1984 -1.1 0.9 : : : : -0.5 -3.1 : : : : 0.7 0.0 0.3 : : 4.9 : 1985 0.3 1.8 : -0.9 : : -0.6 -3.9 : : : : 2.6 0.0 -2.0 : : 5.2 : 1986 0.6 1.6 : -1.3 : : -0.8 -3.2 : : : : 1.6 -0.9 0.4 : : 5.5 : 1987 2.1 0.9 : 0.7 : : 0.3 -3.6 : : : : 0.7 -1.3 0.2 : : 3.3 : 1988 2.5 0.7 : 3.9 -3.8 : -0.3 -2.7 : : : : 1.8 0.0 2.7 : : 6.8 : 1989 3.6 2.7 : 5.0 -5.5 : 0.5 -2.3 : : : : 0.7 0.4 2.9 : : 8.3 : 1990 4.9 0.7 : 5.0 -5.1 : 0.2 -1.4 : 6.8 4.8 : 0.5 1.1 1.8 : : 6.8 :
1991 0.1
1991 3.8 -0.2 : 4.7 -1.3 : -0.2 0.0 : : 1.1 : 3.3 0.9 1.1 : : 0.9 : 1992 2.7 0.7 : 4.1 -0.7 : -1.6 1.8 : -0.3 0.2 : 2.1 1.9 3.5 : : -2.9 : 1993 3.3 0.2 9.9 3.9 -0.7 : -3.2 2.6 : 2.3 1.9 : 3.3 -0.5 -0.3 : -28.2 -3.8 : 1994 4.0 0.9 4.6 4.1 4.2 : -2.2 2.3 : -0.4 2.9 : 2.0 -1.3 -1.0 : -2.7 -2.5 : 1995 4.3 -6.0 1.6 3.0 2.2 -2.1 -2.0 4.1 1.2 -0.6 2.8 -1.7 -3.6 -1.8 0.2 -6.2 -1.0 -2.2 -2.11996 4.4 0.1 0.0 4.2 3.9 -0.3 -0.5 4.5 -0.8 1.0 1.6 -5.8 3.4 -0.1 0.0 1.0 -7.4 0.8 1.21997 5.4 0.6 2.4 5.1 3.4 0.7 0.1 6.5 -2.6 2.4 4.1 -4.7 3.7 1.8 0.1 0.0 -3.9 2.9 2.11998 6.4 1.0 -0.1 5.5 4.4 1.2 0.7 5.2 -1.1 0.7 3.8 -6.5 3.8 1.2 -0.8 -0.2 -2.8 5.2 2.21999 6.2 1.6 -3.2 4.9 4.3 2.2 1.2 4.6 -1.3 -3.2 3.7 -3.3 4.7 1.1 -0.2 -0.7 -4.0 4.7 2.52000 6.5 4.3 0.0 6.9 3.7 2.3 1.4 5.4 1.1 -1.8 6.3 -2.2 5.6 1.8 -0.3 -1.3 -8.2 9.8 3.8
2001 6.8 0.0 0.1 2.5 2.0 2.5 1.4 3.1 1.1 -1.1 6.4 -3.1 2.9 3.3 -1.8 -1.6 -2.5 7.8 1.82002 5.6 -0.9 0.5 1.0 0.7 2.4 -0.3 2.5 -1.2 -1.6 2.4 -2.3 0.7 2.4 -0.6 -0.3 -4.7 6.3 0.82003 5.1 -1.1 1.9 1.7 -0.7 2.0 -1.3 1.5 -3.0 -0.9 0.7 -5.8 -0.6 1.4 -1.0 -0.7 -0.3 4.4 0.22004 4.5 -0.9 1.9 2.6 -2.6 2.0 -0.8 1.2 -0.8 -0.3 -0.9 -1.1 0.7 -1.6 -1.4 -0.6 -0.2 4.0 0.22005 1.7 -0.5 1.8 2.7 -1.0 3.1 -0.3 0.2 1.1 0.1 0.2 0.7 2.1 1.2 -4.0 0.1 -1.1 4.4 0.52006 4.3 1.2 2.6 3.9 -1.6 4.0 0.2 1.2 2.1 -0.1 1.5 0.7 2.7 1.2 -1.8 0.0 -1.7 5.6 1.52007 3.8 3.0 2.6 1.2 -2.0 3.6 0.0 3.4 6.5 -0.3 3.9 0.9 2.4 1.9 -0.2 1.2 -0.4 6.8 2.32008 2.8 2.7 -2.7 -6.1 -4.8 -2.9 -0.4 2.5 3.8 -3.8 3.5 -1.5 2.7 1.7 -0.6 -0.8 -0.8 5.8 0.92009 -1.9 -0.4 -1.8 -11.6 -10.5 -9.3 -5.0 -0.8 -3.6 -7.6 -0.3 -0.6 -3.4 -1.3 -7.3 -5.0 -6.6 -1.3 -3.52010 -0.5 -1.6 0.3 -27.5 -5.1 -7.7 -4.6 0.1 -3.0 -6.8 -0.3 -0.6 -3.1 -1.8 -7.0 -4.2 -6.2 -1.4 -3.4
2011 -0.5 1.7 1.2 -9.9 -2.4 -7.0 -2.5 1.2 -4.0 -2.0 0.7 0.3 -2.3 0.2 -0.3 -4.5 -3.2 0.4 -1.12012 -0.7 2.5 -0.1 -4.5 -3.9 -7.6 -2.3 2.5 -3.2 0.0 0.5 -0.2 -2.2 0.0 -2.1 -1.9 -2.7 -0.8 -0.62013 0.6 2.2 0.0 -2.5 -8.7 -3.7 -2.0 2.2 -2.0 0.7 0.6 0.2 -0.7 1.0 -0.6 -12.1 -0.8 -1.2 -0.12014 0.5 2.0 -0.4 -0.1 2.8 -2.1 -1.5 2.6 -1.8 0.6 0.3 0.4 -1.0 -0.3 0.3 -1.3 -1.1 -1.3 0.42015 0.2 1.7 -0.5 0.6 4.1 -2.6 -1.0 2.9 -2.1 0.2 -0.9 0.4 -0.2 1.0 1.9 -0.1 -0.9 -0.4 0.6
1) Including one-off proceeds relative to the allocation of mobile phone licences (UMTS) 2) 1970-91 D_W 3) Not including unification-related debt and asset assumptions by the federal government in 1995 (Treuhand, eastern housing companies and Deutsche Kreditbank) 3) Not including for 1995 a net amount of 14.9 bn EURO-NLG of exceptional expenditure related to the reform of the financing of the social housing societies.4) Euro area including Latvia; 1970-91 including D_W

183
77. Net lending (+) or net borrowing (-) excluding interest; general government 1)Excessive deficit procedure (Percentage of GDP at market prices (excessive deficit procedure))
0 0 0 0 0 0 0 0 0 0 0 0 0 0 0 0 0 0 0 BG CZ DK HR LT HU PL RO SE UK EU-28 EU-27 MK IS TR ME RS US JP
0.0 0.0 0.0 0.0 0.0 0.0 0.0 0.0 0.0 0.0 0.0 0.0 0.0 0.0 0.0 0.0 0.0 0.0 0.0
0.0 0.0 0.0 0.0 0.0 0.0 0.0 0.0 0.0 0.0 0.0 0.0 0.0 0.0 0.0 0.0 0.0 0.0 0.01971 : : 6.3 : : : : : : 5.2 : : : : : : : -1.3 : 1972 : : 6.3 : : : : : : 2.1 : : : : : : : 0.0 : 1973 : : 6.2 : : : : : : 0.2 : : : : : : : 1.4 : 1974 : : 4.9 : : : : : : 0.8 : : : : : : : 1.0 : 1975 : : -0.1 : : : : : : -0.4 : : : : : : : -2.8 : 1976 : : 1.5 : : : : : : -0.2 : : : : : : : -0.8 : 1977 : : 2.1 : : : : : : 1.2 : : : : : : : 0.5 : 1978 : : 2.5 : : : : : : 0.1 : : : : : : : 1.5 : 1979 : : 2.7 : : : : : : 1.0 : : : : : : : 2.1 :
0.0 0.0 0.0 0.0 0.0 0.0 0.0 0.0 0.0 0.0 0.0 0.0 0.0 0.0 0.0 0.0 0.0 0.0 0.01981 : : -0.8 : : : : : : 0.9 : : : : : : : 1.8 -0.71982 : : -2.6 : : : : : : 2.6 : : : : : : : -0.2 -0.31983 : : 1.3 : : : : : : 1.6 : : : : : : : -0.8 -0.11984 : : 5.5 : : : : : : 1.5 : : : : : : : 0.4 1.51985 : : 8.0 : : : : : : 2.3 : : : : : : : 0.4 2.81986 : : 11.6 : : : : : : 2.2 : : : : : : : 0.2 2.71987 : : 10.3 : : : : : : 2.7 : : : : : : : 1.1 3.71988 : : 8.9 : : : : : : 4.5 : : : : : : : 1.6 4.41989 : : 7.4 : : : : : : 4.7 : : : : : : : 1.9 4.9
0.0 0.0 0.0 0.0 0.0 0.0 0.0 0.0 0.0 0.0 0.0 0.0 0.0 0.0 0.0 0.0 0.0 0.0 0.01991 3.2 : 3.6 : : : -4.2 : : 0.0 : : : 1.0 : : : 0.3 5.21992 1.0 : 3.5 : : : -1.1 : : -3.5 : : : 1.1 : : : -1.0 4.01993 -0.9 : 2.9 : : : 3.8 : -5.5 -4.9 : : : -0.5 : : : -0.4 0.91994 9.2 : 2.9 : : : 11.8 : -2.9 -3.5 : : : -0.6 : : : 0.7 -0.41995 6.1 -11.8 3.0 : -1.2 0.1 1.3 -0.4 -2.0 -2.3 : -2.0 : 1.2 : : : 1.3 -1.21996 10.5 -2.0 3.6 : -2.4 4.7 -0.3 -1.8 2.1 -0.7 : 1.0 : 2.2 : : : 2.2 -1.61997 8.1 -2.5 4.4 : -11.0 3.0 -0.1 0.0 3.6 1.3 : 2.0 : 3.4 : : : 3.3 -0.51998 5.4 -3.7 4.5 : -1.9 -0.4 -0.3 0.7 5.4 3.3 : 2.4 : 3.2 : : : 4.2 -7.01999 3.8 -2.6 5.4 : -1.4 1.6 0.6 0.6 4.8 3.7 : 2.7 : 4.5 : : : 4.1 -3.8
0.0 0.0 0.0 0.0 0.0 0.0 0.0 0.0 0.0 0.0 0.0 0.0 0.0 0.0 0.0 0.0 0.0 0.0 0.02001 5.3 -4.6 4.8 : -2.0 0.6 -2.1 -0.1 4.3 2.7 : 2.0 : 2.7 -3.2 : : 2.3 -3.32002 1.1 -5.4 3.4 : -0.6 -4.9 -2.1 0.5 1.6 -0.1 : 0.5 : 0.4 5.6 : : -1.3 -5.42003 1.8 -5.6 2.8 : 0.0 -3.2 -3.2 0.1 1.0 -1.5 : -0.2 0.0 -0.1 4.6 : : -2.4 -5.62004 3.8 -1.8 4.4 : -0.6 -2.0 -2.6 0.3 2.2 -1.6 : 0.0 0.8 2.5 4.5 : : -2.1 -4.12005 2.7 -2.2 7.1 : 0.3 -3.8 -1.3 0.1 3.8 -1.4 : 0.3 1.1 7.1 5.5 : : -0.8 -3.12006 3.2 -1.3 6.8 : 0.3 -5.5 -1.0 -1.4 3.9 -0.8 : 1.1 0.5 8.5 6.7 4.2 : 0.5 0.52007 2.3 0.4 6.4 : -0.3 -1.0 0.4 -2.2 5.3 -0.7 : 1.8 1.4 8.0 3.9 7.3 : 0.0 -0.22008 2.6 -1.2 4.7 : -2.6 0.5 -1.5 -5.0 3.8 -2.7 : 0.3 -0.3 -10.2 2.6 0.4 : -3.6 0.12009 -3.6 -4.5 -0.9 -3.3 -8.2 0.1 -4.8 -7.5 0.2 -9.4 -4.2 -4.2 -2.1 -3.4 -1.6 -4.9 : -9.0 -6.8
0.0 0.0 0.0 0.0 0.0 0.0 0.0 0.0 0.0 0.0 0.0 0.0 0.0 0.0 0.0 0.0 0.0 0.0 0.02011 -1.2 -1.8 -0.1 -5.2 -3.7 8.5 -2.4 -3.9 1.2 -4.4 -1.5 -1.5 -1.7 -0.4 2.5 -4.0 -3.5 -6.7 -6.72012 0.1 -2.7 -2.2 -2.0 -1.4 2.2 -1.0 -1.2 0.2 -3.1 -1.0 -1.0 -3.1 1.8 : -3.7 -4.5 -5.3 -6.62013 -0.7 -0.1 0.7 -1.9 -0.5 2.1 -1.7 -0.5 -0.5 -2.8 -0.5 -0.5 -3.3 3.2 : -0.5 -2.4 -2.5 -6.92014 -1.1 -0.5 0.2 -0.4 -0.6 0.9 7.8 -0.5 -1.1 -2.2 0.2 0.2 -3.4 4.3 : 1.8 -3.2 -1.5 -5.42015
_________________________________________________________________________________________________________________________________________________________________ 1) Including one-off proceeds relative to the allocation of mobile phone licences (UMTS) 2) Former EU-27

184
78. General government consolidated gross debtExcessive deficit procedure (based on ESA 1995) and former definition (linked series) (Percentage of GDP at market prices (excessive deficit procedure))
BE DE EE IE EL ES FR IT CY LV LU MT NL AT PT SI SK FI EA-18 EA-12 1) 2) 3) 4) 5)
1970 60.0 17.8 : 48.6 17.9 14.7 : 37.2 : : 20.1 : : 18.5 : : : 11.5 : :
1971 59.6 17.9 : 46.5 18.2 15.3 : 41.9 : : 20.3 : : 17.4 : : : 10.4 : : 1972 59.8 18.1 : 43.7 19.1 14.0 : 48.0 : : 18.0 : : 16.7 : : : 9.5 : : 1973 57.7 17.7 : 40.8 15.7 12.3 : 50.1 : : 14.7 : : 16.7 13.6 : : 7.7 : : 1974 54.3 18.5 : 51.2 21.0 11.8 : 50.0 : : 11.9 : : 16.8 13.5 : : 6.1 : : 1975 55.6 23.6 : 57.7 18.2 12.1 : 55.5 : : 13.0 : 40.3 22.9 19.1 : : 6.6 : : 1976 56.2 25.3 : 62.4 17.7 11.8 : 54.4 : : 11.8 : 40.1 26.2 24.5 : : 6.2 : : 1977 59.5 26.3 : 59.3 17.9 12.9 19.8 54.5 : : 11.9 : 39.9 28.5 26.8 : : 7.8 : 29.71978 63.1 27.8 : 61.2 23.2 13.0 21.2 59.7 : : 11.0 : 41.1 32.2 29.9 : : 11.1 : 32.11979 65.7 28.6 : 66.7 22.7 14.7 21.1 59.1 : : 10.2 : 42.9 34.0 33.5 : : 11.2 : 32.81980 74.0 30.3 : 68.2 22.5 16.5 20.7 56.6 : : 9.9 : 45.3 35.4 29.5 : : 11.3 : 33.4
1981 86.4 33.7 : 73.6 26.7 20.1 22.0 58.7 : : 10.3 : 48.7 37.1 37.4 : : 11.6 : 36.91982 96.0 36.5 : 82.7 30.2 25.1 25.3 63.3 : : 10.2 : 54.5 39.4 40.9 : : 14.0 : 40.91983 106.3 38.2 : 92.4 34.6 30.3 26.6 68.1 : : 10.8 : 60.7 43.6 44.4 : : 15.5 : 44.11984 110.4 38.9 : 96.5 41.3 36.4 29.0 74.1 : : 10.8 : 64.3 46.1 48.7 : : 15.3 : 48.01985 115.0 39.5 : 99.3 48.3 41.4 30.6 80.2 : : 10.3 : 69.7 48.0 56.5 : : 16.0 : 50.21986 120.1 39.5 : 110.4 50.2 42.8 31.1 84.2 : : 9.9 : 71.6 52.3 56.8 : : 16.7 : 52.61987 124.5 40.7 : 111.5 56.4 43.1 33.4 88.2 : : 8.7 : 74.0 56.1 54.4 : : 17.9 : 54.41988 125.0 41.1 : 107.3 61.6 39.5 33.3 90.2 : : 6.9 : 76.6 57.3 54.0 : : 16.8 : 55.11989 121.8 39.6 : 98.1 64.8 40.9 34.0 92.7 : : 5.7 : 76.7 56.6 52.6 : : 14.5 : 55.61990 125.6 41.3 : 92.0 71.7 42.7 35.2 94.3 : : 4.7 : 76.8 56.2 53.3 : : 14.0 : 56.5
1991 42.4 58.5
1991 126.9 39.5 : 93.3 74.0 43.4 36.0 97.6 : : 4.1 : 76.6 56.4 55.6 : : 22.3 : 57.31992 128.5 42.0 : 90.4 79.1 45.9 39.7 104.7 : : 4.8 : 77.3 56.3 50.0 : : 40.1 : 59.11993 134.1 45.8 : 92.9 99.2 57.2 46.0 115.1 : : 6.0 : 78.5 60.9 54.6 : : 55.3 : 65.01994 132.1 48.0 : 87.5 97.2 59.9 49.2 121.2 : : 5.5 : 75.7 64.0 57.3 : : 57.6 : 67.71995 130.2 55.6 8.2 80.1 97.9 63.3 55.5 120.9 51.8 15.1 7.4 34.2 76.1 68.2 59.2 18.6 22.1 56.6 72.0 72.41996 127.2 58.5 7.6 72.1 100.3 67.5 58.1 120.2 53.1 14.0 7.4 38.6 74.1 68.1 58.2 21.9 31.1 57.0 73.7 74.11997 122.5 59.8 7.0 63.6 97.5 66.2 59.5 117.5 57.4 11.1 7.4 46.7 68.2 64.1 55.5 22.4 33.7 53.9 73.2 73.61998 117.2 60.5 6.0 53.0 95.4 64.2 59.6 114.3 59.2 9.3 7.1 51.8 65.7 64.4 51.8 23.1 34.5 48.4 72.8 73.31999 113.6 61.3 6.5 47.0 94.9 62.4 59.0 113.1 59.3 12.4 6.4 55.2 61.1 66.8 51.4 24.1 47.8 45.7 71.6 72.02000 107.8 60.2 5.1 37.0 104.4 59.4 57.5 108.6 59.6 12.4 6.2 53.9 53.8 66.2 50.7 26.3 50.3 43.8 69.2 69.6
2001 106.5 59.1 4.8 34.5 104.7 55.6 57.1 108.3 61.2 14.1 6.3 58.9 50.7 66.8 53.8 26.5 48.9 42.5 68.2 68.52002 103.4 60.7 5.7 31.8 102.6 52.6 59.1 105.4 65.1 13.6 6.3 57.9 50.5 66.2 56.8 27.8 43.4 41.5 68.0 68.42003 98.4 64.4 5.6 31.0 98.3 48.8 63.3 104.1 69.7 14.7 6.2 66.0 52.0 65.3 59.4 27.2 42.4 44.5 69.2 69.62004 94.0 66.2 5.0 29.4 99.8 46.3 65.2 103.7 70.9 15.0 6.4 69.8 52.4 64.7 61.9 27.3 41.5 44.4 69.6 70.12005 92.0 68.6 4.6 27.2 110.0 43.2 66.8 105.7 69.4 12.5 6.1 68.0 51.8 64.2 67.7 26.7 34.2 41.7 70.5 71.02006 87.9 68.0 4.4 24.6 107.8 39.7 64.1 106.3 64.7 10.7 6.7 62.5 47.4 62.3 69.4 26.4 30.5 39.6 68.6 69.22007 84.0 65.2 3.7 24.9 107.3 36.3 64.2 103.3 58.8 9.0 6.7 60.7 45.3 60.2 68.4 23.1 29.6 35.2 66.2 66.92008 89.2 66.8 4.5 44.2 112.9 40.2 68.2 106.1 48.9 19.8 14.4 60.9 58.5 63.8 71.7 22.0 27.9 33.9 70.1 70.92009 95.7 74.5 7.1 64.4 129.7 54.0 79.2 116.4 58.5 36.9 15.5 66.5 60.8 69.2 83.7 35.2 35.6 43.5 79.9 80.72010 96.6 82.5 6.7 91.2 148.3 61.7 82.7 119.3 61.3 44.5 19.5 66.0 63.4 72.5 94.0 38.7 41.0 48.8 85.7 86.5
2011 99.2 80.0 6.1 104.1 170.3 70.5 86.2 120.7 71.5 42.0 18.7 68.8 65.7 73.1 108.2 47.1 43.6 49.3 88.1 88.92012 101.1 81.0 9.8 117.4 157.2 86.0 90.6 127.0 86.6 40.8 21.7 70.8 71.3 74.4 124.1 54.4 52.7 53.6 92.7 93.52013 101.5 78.4 10.0 123.7 175.1 93.9 93.5 132.6 111.7 38.1 23.1 73.0 73.5 74.5 129.0 71.7 55.4 57.0 95.0 95.72014 101.7 76.0 9.8 121.0 177.2 100.2 95.6 135.2 122.2 39.5 23.4 72.5 73.8 80.3 126.7 80.4 56.3 59.9 96.0 96.62015 101.5 73.6 9.6 120.4 172.4 103.8 96.6 133.9 126.4 33.4 25.5 71.1 73.4 79.2 124.8 81.3 57.8 61.2 95.4 96.1
1) 1970-91 D_W 2) Euro area; 1970-91 including D_W 3) Non consolidated for intergovernmental loans amounting to 0.9 bn EUR in 2009, 21.2 bn EUR in 2010, 69.4 bn EUR in 2011, 193.5 bn EUR in 2012 and 231.0 bn EUR in 2013 3) Non consolidated for intergovernmental loans amounting to 0.9 bn EUR in 2009, 21.2 bn EUR in 2010, 69.4 bn EUR in 2011 and 193.5 bn EUR in 20124) Former Euro area 12; 1970-91 including D_W5) Non consolidated for intergovernmental loans amounting to 0.9 bn EUR in 2009, 21.0 bn EUR in 2010, 68.7 bn EUR in 2011 and 190.1 bn EUR in 2012

185
78. General government consolidated gross debtExcessive deficit procedure (based on ESA 1995) and former definition (linked series) (Percentage of GDP at market prices (excessive deficit procedure))
BG CZ DK HR LT HU PL RO SE UK EU-28 EU-27 EU-15 MK IS TR ME RS US JP 1) 2) 3) 4) 5) JP
1970 : : : : : : : : 26.8 78.1 : : : : : : : : 44.3 11.1
1971 : : 13.0 : : : : : 27.2 74.3 : : : : : : : : 44.9 12.31972 : : 11.5 : : : : : 27.1 69.1 : : : : : : : : 43.5 16.21973 : : 9.0 : : : : : 26.4 64.2 : : : : : : : : 41.1 15.91974 : : 6.2 : : : : : 26.7 64.1 : : : : : : : : 40.2 16.71975 : : 7.0 : : : : : 26.0 60.4 : : : : : : : : 43.3 21.21976 : : 11.3 : : : : : 24.2 59.8 : : : : : : : : 43.5 27.01977 : : 15.1 : : : : : 26.3 58.7 : : : : : : : : 42.6 32.21978 : : 25.3 : : : : : 30.4 56.3 : : : : : : : : 41.6 40.71979 : : 31.6 : : : : : 34.8 53.0 : : : : : : : : 40.5 45.51980 : : 39.1 : : : : : 38.5 52.5 : : : : : : : : 41.2 50.7
1981 : : 51.7 : : : : : 46.3 52.6 : : : : : : : : 40.3 55.31982 : : 64.5 : : : : : 55.3 51.5 : : : : : : : : 45.0 59.31983 : : 74.2 : : : : : 59.0 51.7 : : : : : : : : 47.8 64.81984 : : 77.7 : : : : : 60.3 53.4 : : : : : : : : 49.5 66.31985 : : 74.7 : : : : : 59.8 51.5 : : : : : : : : 54.1 66.71986 : : 66.5 : : : : : 59.5 49.9 : : : : : : : : 57.5 69.91987 : : 62.2 : : : : : 52.7 47.5 : : : : : : : : 59.3 72.51988 : : 64.5 : : : : : 47.1 41.1 : : : : : : : : 60.1 70.41989 : : 62.0 : : : : : 42.3 35.6 : : : : : : : : 60.3 67.31990 : : 62.0 : : : : : 40.6 33.0 : : : : : : : : 62.0 67.0
1991 : : 62.8 : : : : : 48.8 33.3 : : 53.5 : : : : : 66.4 66.51992 : : 68.0 : : : : : 61.6 37.8 : : 55.8 : : : : : 68.6 71.21993 : : 80.1 : : : : : 70.0 43.6 : : 62.6 : : : : : 70.2 77.31994 : : 76.5 : : : : : 72.4 46.6 : : 65.0 : : : : : 69.4 83.31995 : 14.0 72.6 : 11.5 85.6 49.0 6.6 72.8 49.6 : : 69.4 : : : : : 68.8 91.21996 : 11.9 69.4 : 13.8 72.4 43.4 10.6 73.3 49.9 : : 71.3 : : : : : 68.0 99.01997 108.3 12.6 65.4 : 15.4 62.9 42.9 15.0 71.2 48.7 : 68.1 69.6 : : : : : 65.6 105.61998 77.6 14.5 61.4 : 16.5 60.9 38.9 16.8 69.9 45.8 : 66.3 67.9 : : : : : 62.5 118.31999 77.6 15.8 58.1 : 22.7 60.8 39.6 21.7 64.3 43.0 : 65.6 67.0 : : : : : 58.9 131.92000 72.5 17.8 52.4 : 23.6 56.1 36.8 22.5 53.9 40.5 : 61.8 63.1 : : 43.1 : : 53.0 140.1
2001 66.0 23.9 49.6 : 23.0 52.7 37.6 25.7 54.7 37.3 : 61.0 62.2 : : 77.9 : : 53.0 153.62002 52.4 27.1 49.5 : 22.2 55.9 42.2 24.9 52.5 37.1 : 60.4 61.7 43.0 : 74.0 75.7 : 55.4 164.02003 44.4 28.6 47.2 : 21.0 58.6 47.1 21.5 51.7 38.7 : 61.9 63.2 37.9 : 67.7 40.3 : 58.5 169.62004 37.0 28.9 45.1 : 19.3 59.5 45.7 18.7 50.3 40.3 : 62.3 63.5 35.6 : 59.6 45.3 : 65.4 180.72005 27.5 28.4 37.8 : 18.3 61.7 47.1 15.8 50.4 41.7 : 62.9 64.5 38.4 26.1 51.1 38.6 : 64.9 186.42006 21.6 28.3 32.1 : 17.9 65.9 47.7 12.4 45.2 42.7 : 61.5 63.1 30.5 27.9 45.5 32.6 : 63.8 186.02007 17.2 27.9 27.1 : 16.8 67.0 45.0 12.8 40.2 43.7 : 58.9 60.6 22.7 28.5 39.6 27.5 : 64.4 183.02008 13.7 28.7 33.4 : 15.5 73.0 47.1 13.4 38.8 51.9 : 62.2 64.7 20.7 70.4 40.0 29.0 : 73.3 191.82009 14.6 34.6 40.7 36.6 29.3 79.8 50.9 23.6 42.6 67.1 74.3 74.5 76.9 23.8 87.9 46.3 38.2 34.7 86.3 210.22010 16.2 38.4 42.8 45.0 37.8 82.2 54.9 30.5 39.4 78.4 80.1 80.2 83.0 25.8 93.0 43.1 40.9 44.5 95.2 216.0
2011 16.3 41.4 46.4 52.0 38.3 82.1 56.2 34.7 38.6 84.3 83.0 83.1 86.2 28.4 99.3 39.9 46.0 48.2 99.5 230.32012 18.4 46.2 45.4 55.9 40.5 79.8 55.6 38.0 38.3 89.1 86.8 86.9 89.8 34.0 96.9 36.2 54.0 60.0 102.9 238.02013 18.9 46.0 44.5 67.1 39.4 79.2 57.0 38.4 40.6 90.6 88.9 89.0 92.1 36.0 94.2 36.3 58.0 63.7 104.5 243.42014 23.1 44.4 43.5 69.0 41.8 80.3 49.2 39.9 41.6 91.8 89.5 89.6 92.9 38.7 91.7 36.4 58.5 70.7 105.9 242.02015 22.7 45.8 44.9 69.2 41.4 79.5 50.0 40.1 40.4 92.7 89.2 89.2 92.5 40.8 87.7 35.7 59.4 74.4 105.4 242.6
_________________________________________________________________________________________________________________________________________________________________________ 1) Non consolidated for intergovernmental loans amounting to 0.9 bn EUR in 2009, 21.2 bn EUR in 2010, 69.9 bn EUR in 2011, 196.5 bn EUR in 2012 and 236.3 bn EUR in 2013 2) Former EU-27 3) Non consolidated for intergovernmental loans amounting to 0.9 bn EUR in 2009, 21.2 bn EUR in 2010, 69.9 bn EUR in 2011, 196.5 bn EUR in 2012 and 236.3 bn EUR in 2013 4) Former EU-15 5) Non consolidated for intergovernmental loans amounting to 0.9 bn EUR in 2009, 21.0 bn EUR in 2010, 69.2 bn EUR in 2011, 193.1 bn EUR in 2012 and 232.2 bn EUR in 2013
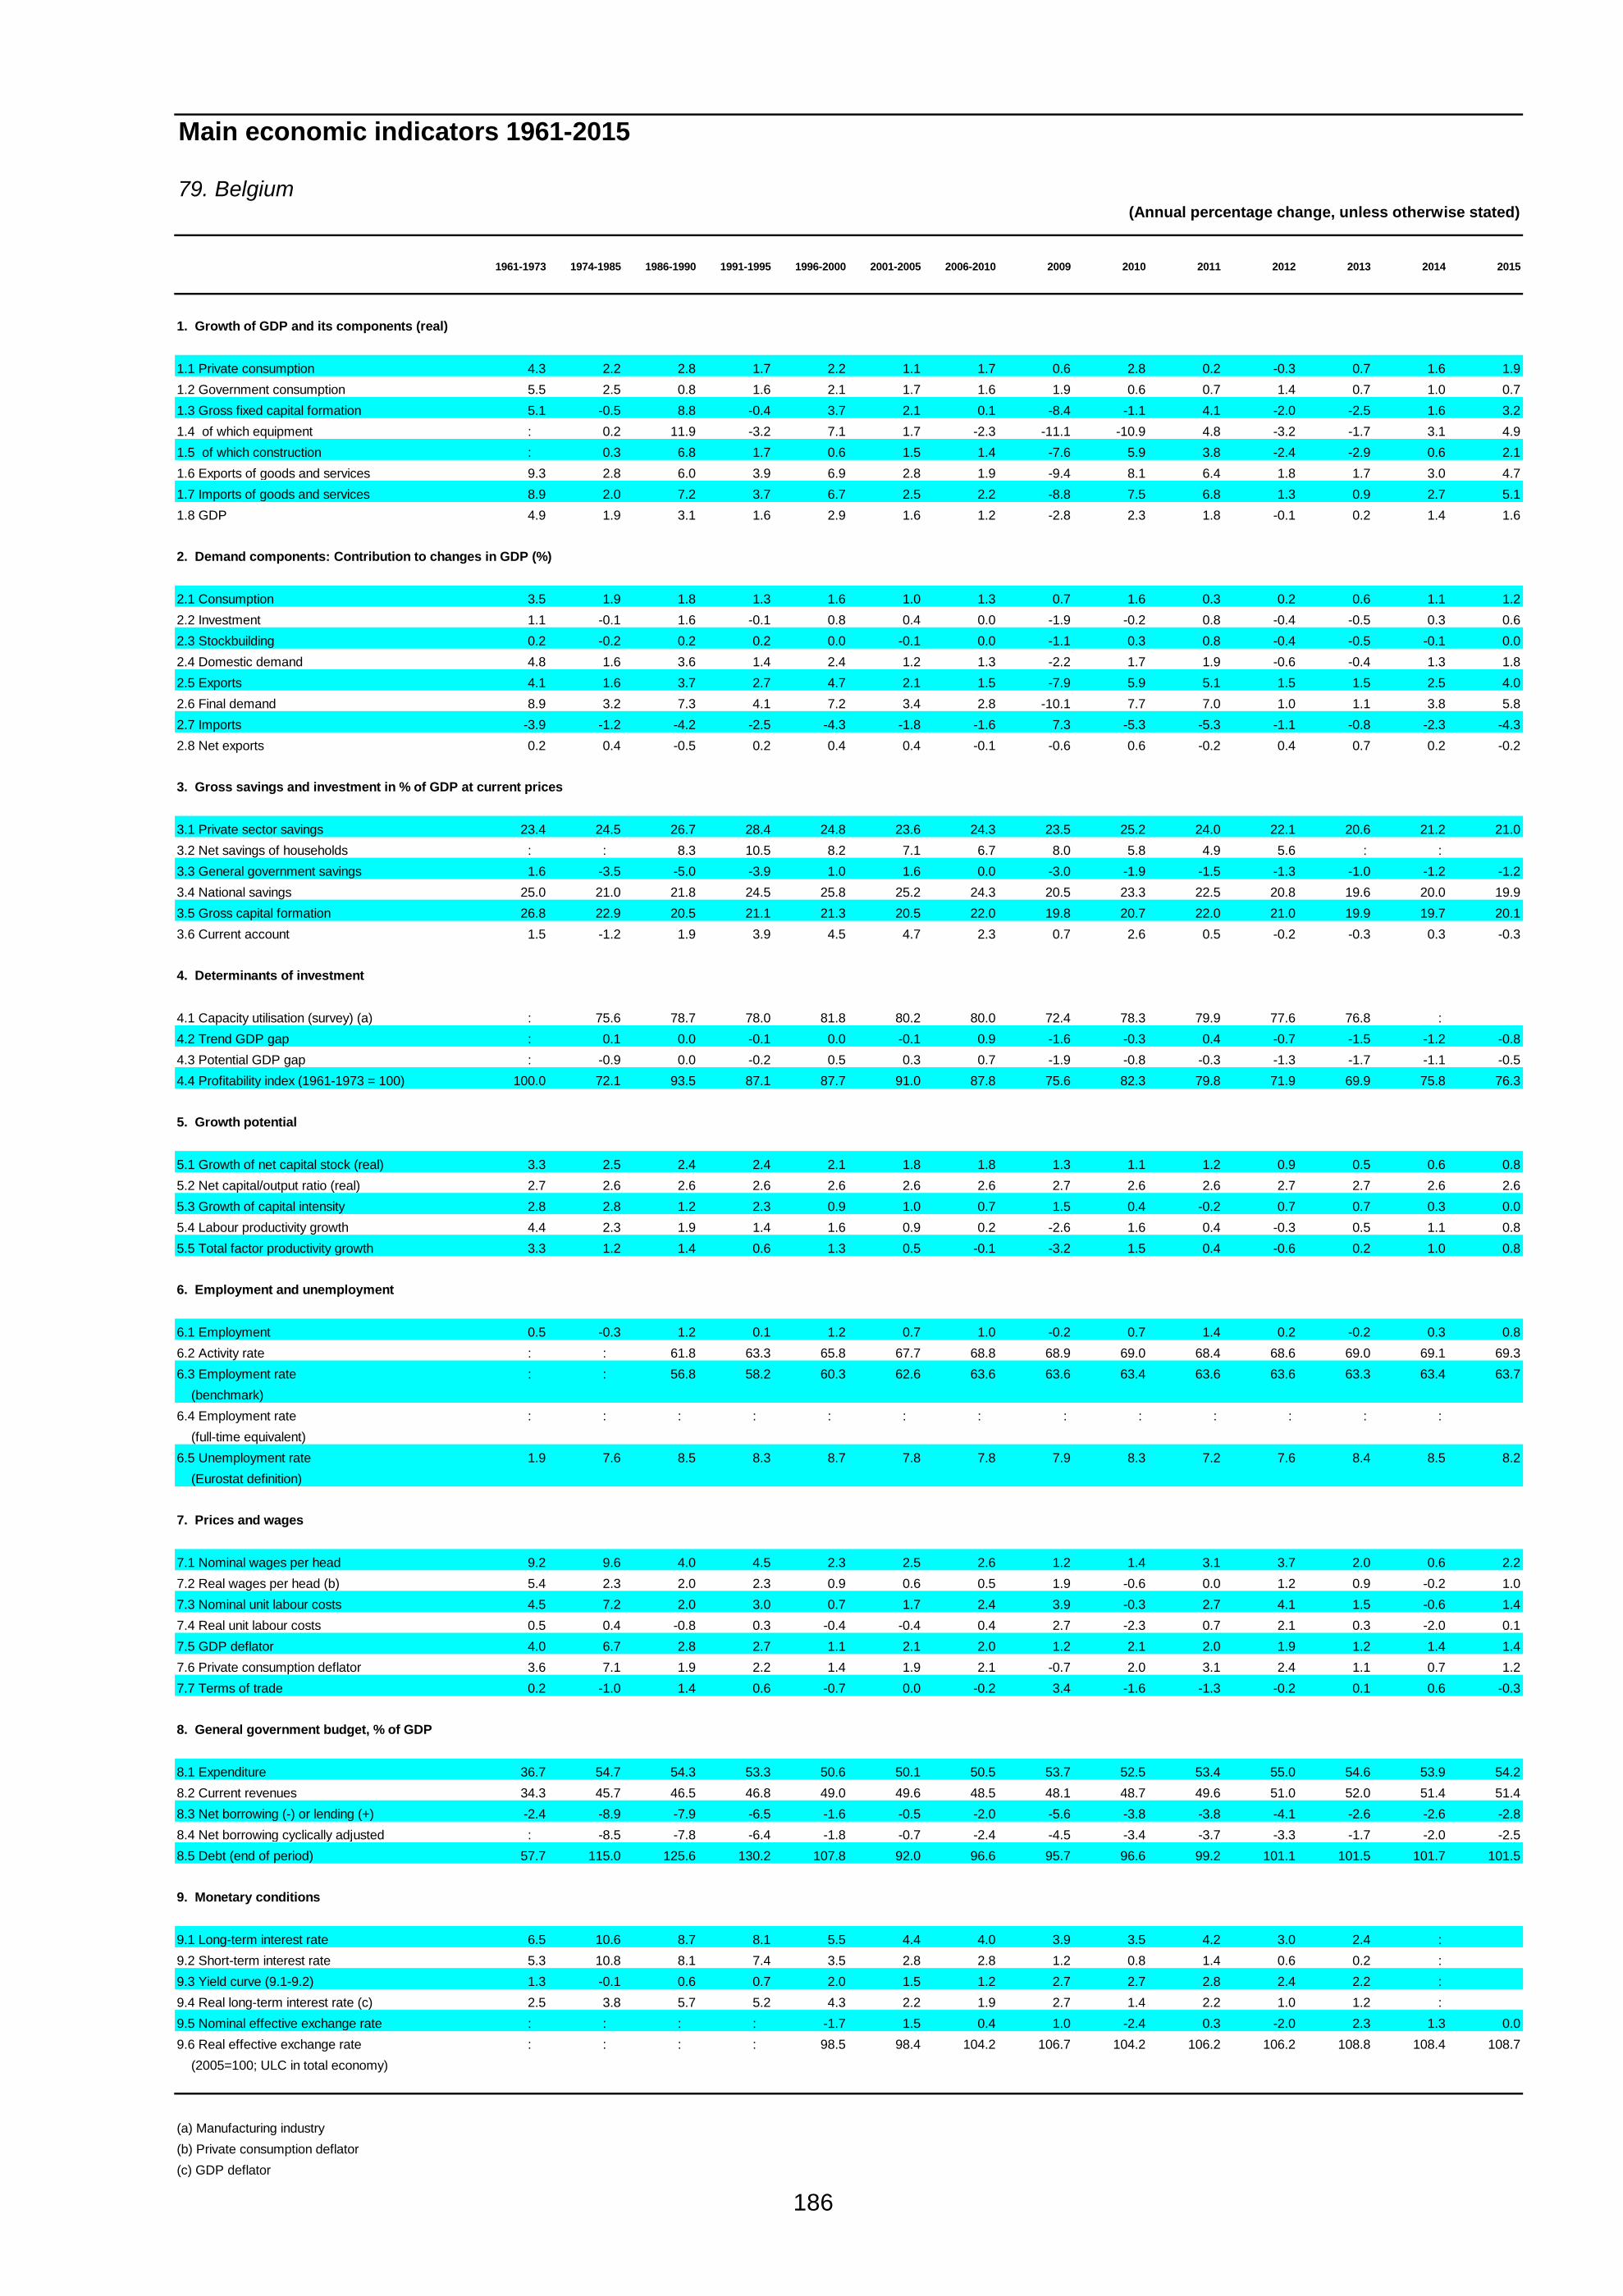
186
Main economic indicators 1961-2015
79. Belgium(Annual percentage change, unless otherwise stated)
1961-1973 1974-1985 1986-1990 1991-1995 1996-2000 2001-2005 2006-2010 2009 2010 2011 2012 2013 2014 2015
1. Growth of GDP and its components (real)
1.1 Private consumption 4.3 2.2 2.8 1.7 2.2 1.1 1.7 0.6 2.8 0.2 -0.3 0.7 1.6 1.91.2 Government consumption 5.5 2.5 0.8 1.6 2.1 1.7 1.6 1.9 0.6 0.7 1.4 0.7 1.0 0.71.3 Gross fixed capital formation 5.1 -0.5 8.8 -0.4 3.7 2.1 0.1 -8.4 -1.1 4.1 -2.0 -2.5 1.6 3.21.4 of which equipment : 0.2 11.9 -3.2 7.1 1.7 -2.3 -11.1 -10.9 4.8 -3.2 -1.7 3.1 4.91.5 of which construction : 0.3 6.8 1.7 0.6 1.5 1.4 -7.6 5.9 3.8 -2.4 -2.9 0.6 2.11.6 Exports of goods and services 9.3 2.8 6.0 3.9 6.9 2.8 1.9 -9.4 8.1 6.4 1.8 1.7 3.0 4.71.7 Imports of goods and services 8.9 2.0 7.2 3.7 6.7 2.5 2.2 -8.8 7.5 6.8 1.3 0.9 2.7 5.11.8 GDP 4.9 1.9 3.1 1.6 2.9 1.6 1.2 -2.8 2.3 1.8 -0.1 0.2 1.4 1.6
2. Demand components: Contribution to changes in GDP (%)
2.1 Consumption 3.5 1.9 1.8 1.3 1.6 1.0 1.3 0.7 1.6 0.3 0.2 0.6 1.1 1.22.2 Investment 1.1 -0.1 1.6 -0.1 0.8 0.4 0.0 -1.9 -0.2 0.8 -0.4 -0.5 0.3 0.62.3 Stockbuilding 0.2 -0.2 0.2 0.2 0.0 -0.1 0.0 -1.1 0.3 0.8 -0.4 -0.5 -0.1 0.02.4 Domestic demand 4.8 1.6 3.6 1.4 2.4 1.2 1.3 -2.2 1.7 1.9 -0.6 -0.4 1.3 1.82.5 Exports 4.1 1.6 3.7 2.7 4.7 2.1 1.5 -7.9 5.9 5.1 1.5 1.5 2.5 4.02.6 Final demand 8.9 3.2 7.3 4.1 7.2 3.4 2.8 -10.1 7.7 7.0 1.0 1.1 3.8 5.82.7 Imports -3.9 -1.2 -4.2 -2.5 -4.3 -1.8 -1.6 7.3 -5.3 -5.3 -1.1 -0.8 -2.3 -4.32.8 Net exports 0.2 0.4 -0.5 0.2 0.4 0.4 -0.1 -0.6 0.6 -0.2 0.4 0.7 0.2 -0.2
3. Gross savings and investment in % of GDP at current prices
3.1 Private sector savings 23.4 24.5 26.7 28.4 24.8 23.6 24.3 23.5 25.2 24.0 22.1 20.6 21.2 21.03.2 Net savings of households : : 8.3 10.5 8.2 7.1 6.7 8.0 5.8 4.9 5.6 : : 3.3 General government savings 1.6 -3.5 -5.0 -3.9 1.0 1.6 0.0 -3.0 -1.9 -1.5 -1.3 -1.0 -1.2 -1.23.4 National savings 25.0 21.0 21.8 24.5 25.8 25.2 24.3 20.5 23.3 22.5 20.8 19.6 20.0 19.93.5 Gross capital formation 26.8 22.9 20.5 21.1 21.3 20.5 22.0 19.8 20.7 22.0 21.0 19.9 19.7 20.13.6 Current account 1.5 -1.2 1.9 3.9 4.5 4.7 2.3 0.7 2.6 0.5 -0.2 -0.3 0.3 -0.3
4. Determinants of investment
4.1 Capacity utilisation (survey) (a) : 75.6 78.7 78.0 81.8 80.2 80.0 72.4 78.3 79.9 77.6 76.8 : 4.2 Trend GDP gap : 0.1 0.0 -0.1 0.0 -0.1 0.9 -1.6 -0.3 0.4 -0.7 -1.5 -1.2 -0.84.3 Potential GDP gap : -0.9 0.0 -0.2 0.5 0.3 0.7 -1.9 -0.8 -0.3 -1.3 -1.7 -1.1 -0.54.4 Profitability index (1961-1973 = 100) 100.0 72.1 93.5 87.1 87.7 91.0 87.8 75.6 82.3 79.8 71.9 69.9 75.8 76.3
5. Growth potential
5.1 Growth of net capital stock (real) 3.3 2.5 2.4 2.4 2.1 1.8 1.8 1.3 1.1 1.2 0.9 0.5 0.6 0.85.2 Net capital/output ratio (real) 2.7 2.6 2.6 2.6 2.6 2.6 2.6 2.7 2.6 2.6 2.7 2.7 2.6 2.65.3 Growth of capital intensity 2.8 2.8 1.2 2.3 0.9 1.0 0.7 1.5 0.4 -0.2 0.7 0.7 0.3 0.05.4 Labour productivity growth 4.4 2.3 1.9 1.4 1.6 0.9 0.2 -2.6 1.6 0.4 -0.3 0.5 1.1 0.85.5 Total factor productivity growth 3.3 1.2 1.4 0.6 1.3 0.5 -0.1 -3.2 1.5 0.4 -0.6 0.2 1.0 0.8
6. Employment and unemployment
6.1 Employment 0.5 -0.3 1.2 0.1 1.2 0.7 1.0 -0.2 0.7 1.4 0.2 -0.2 0.3 0.86.2 Activity rate : : 61.8 63.3 65.8 67.7 68.8 68.9 69.0 68.4 68.6 69.0 69.1 69.36.3 Employment rate : : 56.8 58.2 60.3 62.6 63.6 63.6 63.4 63.6 63.6 63.3 63.4 63.7 (benchmark) 6.4 Employment rate : : : : : : : : : : : : : (full-time equivalent) 6.5 Unemployment rate 1.9 7.6 8.5 8.3 8.7 7.8 7.8 7.9 8.3 7.2 7.6 8.4 8.5 8.2 (Eurostat definition)
7. Prices and wages
7.1 Nominal wages per head 9.2 9.6 4.0 4.5 2.3 2.5 2.6 1.2 1.4 3.1 3.7 2.0 0.6 2.27.2 Real wages per head (b) 5.4 2.3 2.0 2.3 0.9 0.6 0.5 1.9 -0.6 0.0 1.2 0.9 -0.2 1.07.3 Nominal unit labour costs 4.5 7.2 2.0 3.0 0.7 1.7 2.4 3.9 -0.3 2.7 4.1 1.5 -0.6 1.47.4 Real unit labour costs 0.5 0.4 -0.8 0.3 -0.4 -0.4 0.4 2.7 -2.3 0.7 2.1 0.3 -2.0 0.17.5 GDP deflator 4.0 6.7 2.8 2.7 1.1 2.1 2.0 1.2 2.1 2.0 1.9 1.2 1.4 1.47.6 Private consumption deflator 3.6 7.1 1.9 2.2 1.4 1.9 2.1 -0.7 2.0 3.1 2.4 1.1 0.7 1.27.7 Terms of trade 0.2 -1.0 1.4 0.6 -0.7 0.0 -0.2 3.4 -1.6 -1.3 -0.2 0.1 0.6 -0.3
8. General government budget, % of GDP
8.1 Expenditure 36.7 54.7 54.3 53.3 50.6 50.1 50.5 53.7 52.5 53.4 55.0 54.6 53.9 54.28.2 Current revenues 34.3 45.7 46.5 46.8 49.0 49.6 48.5 48.1 48.7 49.6 51.0 52.0 51.4 51.48.3 Net borrowing (-) or lending (+) -2.4 -8.9 -7.9 -6.5 -1.6 -0.5 -2.0 -5.6 -3.8 -3.8 -4.1 -2.6 -2.6 -2.88.4 Net borrowing cyclically adjusted : -8.5 -7.8 -6.4 -1.8 -0.7 -2.4 -4.5 -3.4 -3.7 -3.3 -1.7 -2.0 -2.58.5 Debt (end of period) 57.7 115.0 125.6 130.2 107.8 92.0 96.6 95.7 96.6 99.2 101.1 101.5 101.7 101.5
9. Monetary conditions
9.1 Long-term interest rate 6.5 10.6 8.7 8.1 5.5 4.4 4.0 3.9 3.5 4.2 3.0 2.4 : 9.2 Short-term interest rate 5.3 10.8 8.1 7.4 3.5 2.8 2.8 1.2 0.8 1.4 0.6 0.2 : 9.3 Yield curve (9.1-9.2) 1.3 -0.1 0.6 0.7 2.0 1.5 1.2 2.7 2.7 2.8 2.4 2.2 : 9.4 Real long-term interest rate (c) 2.5 3.8 5.7 5.2 4.3 2.2 1.9 2.7 1.4 2.2 1.0 1.2 : 9.5 Nominal effective exchange rate : : : : -1.7 1.5 0.4 1.0 -2.4 0.3 -2.0 2.3 1.3 0.09.6 Real effective exchange rate : : : : 98.5 98.4 104.2 106.7 104.2 106.2 106.2 108.8 108.4 108.7 (2005=100; ULC in total economy)
(a) Manufacturing industry (b) Private consumption deflator (c) GDP deflator

187
Main economic indicators 1961-2015
80. Germany(Annual percentage change, unless otherwise stated)
1961-1973 1974-1985 1986-1990 1991-1995 1996-2000 2001-2005 2006-2010 2009 2010 2011 2012 2013 2014 2015
1. Growth of GDP and its components (real)
1.1 Private consumption 5.0 2.0 3.5 2.3 1.5 0.3 0.7 0.2 1.0 2.3 0.8 0.9 1.5 1.81.2 Government consumption 4.7 2.6 0.7 2.7 1.5 0.3 2.0 3.0 1.3 1.0 1.0 0.7 1.6 1.21.3 Gross fixed capital formation 3.9 0.1 5.1 1.9 2.3 -2.0 1.4 -11.7 5.7 6.9 -2.1 -0.7 4.5 4.51.4 of which equipment 5.0 1.6 6.7 -1.8 7.7 -0.2 1.5 -22.7 10.0 5.8 -4.0 -2.4 4.2 6.61.5 of which construction 3.5 -1.2 3.5 4.0 -1.4 -4.0 0.8 -3.2 3.2 7.8 -1.4 0.1 4.7 3.21.6 Exports of goods and services 7.4 4.9 5.2 3.6 8.9 6.3 4.7 -13.0 15.2 8.0 3.2 0.8 5.0 5.61.7 Imports of goods and services 9.0 3.6 6.5 4.4 8.3 3.9 4.8 -7.8 12.5 7.4 1.4 0.9 5.4 6.51.8 GDP 4.3 2.0 3.3 2.0 1.9 0.6 1.3 -5.1 4.0 3.3 0.7 0.4 1.8 2.0
2. Demand components: Contribution to changes in GDP (%)
2.1 Consumption 3.4 1.6 2.0 : 1.2 0.2 0.7 0.7 0.9 1.5 0.6 0.6 1.2 1.32.2 Investment 1.1 0.0 1.1 : 0.5 -0.4 0.3 -2.2 1.0 1.2 -0.4 -0.1 0.8 0.82.3 Stockbuilding -0.1 -0.1 0.3 : 0.0 -0.2 0.1 -0.7 0.4 -0.1 -0.5 -0.1 -0.2 0.02.4 Domestic demand 4.4 1.5 3.3 : 1.6 -0.4 1.1 -2.2 2.3 2.6 -0.3 0.4 1.7 2.02.5 Exports 1.2 1.1 1.5 : 2.4 2.3 2.1 -6.3 6.4 3.8 1.6 0.4 2.5 2.92.6 Final demand 5.6 2.7 4.8 : 4.0 1.9 3.2 -8.4 8.7 6.4 1.3 0.9 4.2 4.92.7 Imports -1.2 -0.7 -1.4 : -2.2 -1.3 -1.8 3.3 -4.7 -3.1 -0.7 -0.4 -2.4 -2.92.8 Net exports 0.0 0.4 0.1 : 0.2 1.0 0.3 -3.0 1.7 0.7 1.0 0.0 0.1 0.0
3. Gross savings and investment in % of GDP at current prices
3.1 Private sector savings : 20.8 22.7 20.8 20.2 21.8 23.7 22.9 24.4 22.9 22.1 22.1 22.3 22.53.2 Net savings of households : : 8.1 8.0 6.5 6.7 7.1 7.2 7.0 6.7 6.6 6.4 : : 3.3 General government savings : 2.7 2.0 0.9 0.5 -0.9 0.9 -0.4 -0.7 1.6 2.2 2.0 1.9 1.83.4 National savings 27.3 22.6 24.7 21.7 20.7 20.9 24.6 22.5 23.7 24.5 24.3 24.1 24.2 24.43.5 Gross capital formation 27.2 21.8 20.5 22.9 21.7 18.2 18.1 16.4 17.3 18.3 17.3 16.7 16.9 17.33.6 Current account 0.8 0.8 4.2 -1.2 -1.0 2.7 6.5 6.1 6.4 6.3 7.0 7.4 7.3 7.0
4. Determinants of investment
4.1 Capacity utilisation (survey) (b) (c) : 80.4 86.5 84.0 85.1 83.7 82.8 72.3 80.2 85.4 83.1 82.7 : : 4.2 Trend GDP gap (b) : -0.3 -1.1 1.7 -0.2 -0.5 0.1 -3.9 -1.3 0.7 0.1 -0.8 -0.4 0.24.3 Potential GDP gap (b) : 0.1 -0.1 1.5 0.0 -0.8 -0.4 -4.2 -1.4 0.6 -0.1 -1.1 -0.7 -0.34.4 Profitability index (1961-1973 = 100) (a) 100.0 81.7 91.4 97.5 104.1 112.7 127.1 111.0 122.8 126.5 121.7 123.7 125.8 128.0
5. Growth potential
5.1 Growth of net capital stock (real) (a) 4.2 2.2 1.8 2.6 2.1 1.1 1.0 0.5 0.7 1.1 0.9 0.8 1.0 1.25.2 Net capital/output ratio (real) (b) 3.0 3.0 3.0 2.9 3.0 3.0 3.0 3.1 3.0 2.9 2.9 2.9 2.9 2.95.3 Growth of capital intensity (a) 3.9 2.1 -0.1 2.5 1.3 1.3 0.2 0.4 0.2 -0.3 -0.2 0.2 0.4 0.95.4 Labour productivity growth (a) 4.0 1.8 1.3 1.9 1.0 0.8 0.5 -5.2 3.5 1.9 -0.4 -0.1 1.3 1.65.5 Total factor productivity growth (a) 2.5 1.0 1.4 0.9 0.5 0.3 0.4 -5.4 3.4 2.0 -0.3 -0.2 1.1 1.3
6. Employment and unemployment
6.1 Employment (a) 0.2 -0.2 1.4 : 0.9 -0.2 0.9 0.1 0.6 1.4 1.1 0.6 0.6 0.36.2 Activity rate (b) 68.6 66.3 66.6 72.9 74.1 76.9 79.7 80.3 80.3 80.3 80.6 80.7 80.7 80.96.3 Employment rate (b) 68.1 63.5 62.6 67.7 67.8 69.9 73.3 74.3 74.8 75.7 76.3 76.5 76.7 76.9 (benchmark) 6.4 Employment rate (b) 69.1 65.8 67.4 68.5 68.6 70.5 73.8 74.8 75.3 76.1 76.8 76.9 77.1 77.3 (full-time equivalent) 6.5 Unemployment rate (b) 0.7 4.2 5.9 7.4 8.9 9.6 8.3 7.8 7.1 5.9 5.5 5.3 5.1 5.1 (Eurostat definition)
7. Prices and wages
7.1 Nominal wages per head 9.1 5.5 3.1 5.3 1.1 0.9 1.3 0.1 2.4 3.0 2.6 2.0 2.9 3.37.2 Real wages per head (d) 5.5 1.1 1.6 2.3 0.3 -0.6 0.1 0.1 0.4 0.9 1.0 0.3 1.7 1.87.3 Nominal unit labour costs 4.9 3.6 1.8 3.3 0.0 0.1 0.8 5.6 -1.1 1.0 3.1 2.1 1.6 1.67.4 Real unit labour costs 0.6 -0.4 -0.6 -0.1 -0.2 -0.9 -0.2 4.4 -2.1 -0.2 1.6 -0.1 0.0 0.07.5 GDP deflator 4.3 4.0 2.4 3.4 0.2 1.1 1.0 1.2 1.0 1.2 1.5 2.2 1.6 1.67.6 Private consumption deflator 3.4 4.4 1.5 3.0 0.8 1.5 1.2 0.0 2.0 2.1 1.6 1.6 1.2 1.47.7 Terms of trade 1.4 -1.4 2.7 1.3 -0.8 0.3 -0.1 4.2 -2.1 -2.3 -0.4 1.4 0.5 -0.1
8. General government budget, % of GDP
8.1 Expenditure : 45.7 44.2 48.9 47.7 47.6 45.8 48.3 47.9 45.2 44.7 44.7 44.6 44.58.2 Current revenues : 43.4 42.8 44.9 45.9 44.0 44.1 45.2 43.7 44.3 44.8 44.7 44.6 44.38.3 Net borrowing (-) or lending (+) : -2.3 -1.4 -4.0 -1.8 -3.6 -1.8 -3.1 -4.2 -0.8 0.1 0.0 0.0 -0.18.4 Net borrowing cyclically adjusted : -2.4 -1.3 -4.7 -1.8 -3.2 -1.5 -0.7 -3.4 -1.2 0.1 0.6 0.4 0.08.5 Debt (end of period) 17.7 39.5 41.3 55.6 60.2 68.6 82.5 74.5 82.5 80.0 81.0 78.4 76.0 73.6
9. Monetary conditions
9.1 Long-term interest rate (b) 7.2 8.2 6.9 7.3 5.2 4.2 3.6 3.2 2.7 2.6 1.5 1.6 : : 9.2 Short-term interest rate (b) 5.8 6.8 5.7 7.1 3.5 2.8 2.8 1.2 0.8 1.4 0.6 0.2 : : 9.3 Yield curve (9.1-9.2) (b) 1.4 1.4 1.2 0.2 1.7 1.4 0.8 2.0 1.9 1.2 0.9 1.4 : : 9.4 Real long-term interest rate (b) (e) 2.7 4.0 4.4 : 5.0 3.1 2.6 2.0 1.7 1.4 0.0 -0.6 : : 9.5 Nominal effective exchange rate (a) : : : : -1.5 2.0 0.3 1.3 -3.6 0.1 -2.3 3.1 1.9 0.09.6 Real effective exchange rate (a) : : : : 109.3 100.4 96.0 98.5 94.2 94.3 93.2 96.9 99.4 99.9 (2000=100; ULC in total economy)
(a) 1961-91: West-Germany (b) 1961-90: West-Germany (c) Manufacturing industry
(e) GDP deflator

188
Main economic indicators 1961-2015
81. Estonia(Annual percentage change, unless otherwise stated)
2002 2003 2004 2005 2006 2007 2008 2009 2010 2011 2012 2013 2014 2015
1. Growth of GDP and its components (real)
1.1 Private consumption 9.5 9.2 8.1 9.5 13.5 8.8 -5.2 -14.8 -2.6 3.8 4.9 4.2 4.5 3.81.2 Government consumption 3.4 6.3 1.1 3.2 5.0 6.6 4.6 -2.6 -0.8 1.3 3.8 1.3 1.2 1.21.3 Gross fixed capital formation 24.2 16.7 6.0 15.2 23.0 9.3 -13.3 -39.0 -7.3 37.6 10.9 1.1 0.9 3.71.4 of which equipment 25.6 27.0 -3.3 2.1 32.9 12.2 -20.4 -47.3 -16.2 123.5 11.6 0.8 4.0 6.01.5 of which construction 23.3 7.8 15.4 26.3 16.1 7.1 -10.4 -35.9 -3.0 3.9 10.5 1.3 -1.6 1.91.6 Exports of goods and services -2.7 7.7 14.5 18.6 6.1 3.7 1.0 -21.3 23.7 23.4 5.6 1.8 3.1 5.01.7 Imports of goods and services 7.2 11.2 14.7 18.9 13.9 6.3 -7.0 -31.1 21.1 28.4 8.8 2.6 3.9 5.31.8 GDP 6.6 7.8 6.3 8.9 10.1 7.5 -4.2 -14.1 2.6 9.6 3.9 0.8 1.9 3.0
2. Demand components: Contribution to changes in GDP (%)
2.1 Consumption 6.0 6.3 4.8 5.9 8.3 5.9 -2.0 -8.6 -1.6 2.3 3.2 2.4 2.6 2.32.2 Investment 6.4 5.0 1.9 4.7 7.4 3.4 -4.7 -11.8 -1.5 7.1 2.6 0.3 0.2 0.92.3 Stockbuilding 2.3 -0.3 0.9 -0.2 1.4 0.8 -3.5 -1.9 3.2 2.7 -0.5 -1.2 -0.1 0.02.4 Domestic demand 14.6 11.0 7.6 10.4 17.1 10.1 -10.3 -22.3 0.1 12.1 5.3 1.4 2.7 3.22.5 Exports -2.1 5.5 10.0 13.6 4.7 2.7 0.7 -15.1 15.1 18.5 5.1 1.6 2.7 4.42.6 Final demand 12.5 16.5 17.6 24.0 21.8 12.8 -9.6 -37.4 15.2 30.7 10.4 3.1 5.4 7.62.7 Imports -5.9 -8.7 -11.3 -15.1 -11.7 -5.3 5.3 23.3 -12.3 -20.5 -7.7 -2.3 -3.4 -4.62.8 Net exports -8.0 -3.3 -1.2 -1.5 -7.0 -2.6 6.0 8.2 2.8 -2.0 -2.6 -0.7 -0.7 -0.2
3. Gross savings and investment in % of GDP at current prices
3.1 Private sector savings 16.2 15.8 16.6 18.4 16.2 15.3 18.2 20.7 21.2 23.5 22.4 22.5 21.9 22.03.2 Net savings of households -3.4 -3.7 -6.4 -5.4 -6.4 -4.1 -2.2 2.7 2.4 3.2 -0.6 : : 3.3 General government savings 5.7 6.0 5.1 5.3 6.8 7.6 3.2 2.0 2.2 3.3 4.2 3.3 2.8 2.73.4 National savings 21.9 21.8 21.7 23.6 23.0 22.9 21.4 22.7 23.4 26.8 26.6 25.8 24.7 24.63.5 Gross capital formation 32.3 33.1 33.1 33.8 38.7 38.6 30.0 18.7 19.7 26.8 28.2 26.9 26.7 26.73.6 Current account -10.4 -11.4 -11.4 -10.1 -15.7 -15.7 -8.5 4.0 3.5 0.3 -2.8 -1.8 -2.7 -2.8
4. Determinants of investment
4.1 Capacity utilisation (survey) (a) 74.5 73.9 74.7 77.3 78.6 77.0 70.6 58.5 67.3 72.5 70.7 71.6 : 4.2 Trend GDP gap -1.9 -0.1 0.7 4.5 10.5 14.8 7.1 -9.9 -9.4 -2.4 -0.2 -1.0 -0.5 1.04.3 Potential GDP gap 2.0 3.4 3.4 5.8 9.8 12.4 4.8 -9.6 -7.0 0.3 2.6 1.3 0.7 0.84.4 Profitability index (1961-1973 = 100) : : : : : : : : : : : : :
5. Growth potential
5.1 Growth of net capital stock (real) 8.0 9.1 8.6 9.3 11.3 11.1 7.4 1.9 1.2 3.5 4.1 3.9 3.6 3.65.2 Net capital/output ratio (real) 2.2 2.3 2.3 2.3 2.3 2.4 2.7 3.2 3.2 3.0 3.0 3.1 3.1 3.25.3 Growth of capital intensity 6.6 7.6 8.6 7.2 5.6 10.2 7.2 13.3 6.2 -3.2 1.8 2.7 3.4 3.35.4 Labour productivity growth 5.1 6.3 6.4 6.7 4.5 6.6 -4.3 -4.5 7.7 2.4 1.7 -0.3 1.7 2.75.5 Total factor productivity growth 1.9 2.6 2.2 3.2 1.8 1.7 -7.5 -10.1 4.6 4.1 0.8 -1.6 0.1 1.0
6. Employment and unemployment
6.1 Employment 1.4 1.4 0.0 2.0 5.4 0.8 0.2 -10.0 -4.8 7.0 2.2 1.1 0.2 0.36.2 Activity rate 70.8 71.8 71.7 71.9 75.2 75.7 76.9 76.4 76.3 77.8 78.7 79.7 80.2 80.86.3 Employment rate 63.5 64.6 64.9 66.3 70.8 72.1 72.6 66.1 63.7 68.3 71.0 73.0 73.8 74.8 (benchmark) 6.4 Employment rate : : : : : : : : : : : : : (full-time equivalent) 6.5 Unemployment rate 10.3 10.1 9.7 7.9 5.9 4.6 5.5 13.5 16.7 12.3 10.0 8.6 8.1 7.5 (Eurostat definition)
7. Prices and wages
7.1 Nominal wages per head 9.1 11.6 12.3 10.8 14.0 25.0 9.7 -3.1 2.3 0.5 6.0 7.4 6.0 6.77.2 Real wages per head (b) 5.5 9.9 8.7 6.6 8.4 15.8 1.7 -2.7 -0.1 -4.2 2.2 3.9 4.4 3.67.3 Nominal unit labour costs 3.8 5.0 5.5 3.8 9.1 17.2 14.6 1.5 -5.0 -1.8 4.2 7.7 4.2 3.97.4 Real unit labour costs -0.8 0.9 1.0 -2.1 0.3 5.0 8.7 1.3 -5.3 -4.7 0.9 2.6 1.4 0.47.5 GDP deflator 4.7 4.0 4.5 6.1 8.8 11.6 5.4 0.2 0.3 3.0 3.3 5.0 2.8 3.57.6 Private consumption deflator 3.5 1.6 3.3 3.9 5.2 7.9 7.8 -0.4 2.4 4.9 3.6 3.4 1.5 3.07.7 Terms of trade 2.9 2.8 1.2 1.4 2.0 2.9 -0.8 1.3 -1.9 -1.0 -0.9 1.4 0.2 0.1
8. General government budget, % of GDP
8.1 Expenditure 35.8 34.8 34.0 33.6 33.6 34.0 39.7 44.8 40.5 37.6 39.5 38.3 38.5 38.28.2 Current revenues 36.0 36.5 35.6 35.2 36.1 36.4 36.7 42.8 40.7 38.7 39.2 38.1 38.0 37.58.3 Net borrowing (-) or lending (+) 0.3 1.7 1.6 1.6 2.5 2.4 -3.0 -2.0 0.2 1.1 -0.2 -0.2 -0.5 -0.68.4 Net borrowing cyclically adjusted -0.3 0.7 0.6 -0.1 -0.4 -1.3 -4.4 0.9 2.3 1.0 -1.0 -0.6 -0.7 -0.98.5 Debt (end of period) 5.7 5.6 5.0 4.6 4.4 3.7 4.5 7.1 6.7 6.1 9.8 10.0 9.8 9.6
9. Monetary conditions
9.1 Long-term interest rate 8.4 5.3 4.4 4.2 5.0 6.1 8.2 7.8 5.9 : : : : 9.2 Short-term interest rate 3.9 2.9 2.5 2.4 3.2 4.9 6.7 5.9 1.6 1.4 0.6 0.2 : 9.3 Yield curve (9.1-9.2) 4.5 2.3 1.9 1.8 1.9 1.2 1.5 1.9 4.3 : : : : 9.4 Real long-term interest rate (c) 3.6 1.2 -0.1 -1.8 -3.5 -5.0 2.6 7.6 5.6 : : : : 9.5 Nominal effective exchange rate 0.7 3.3 0.9 -0.1 0.2 1.1 1.4 2.4 -3.0 -0.4 -1.5 1.4 1.6 0.09.6 Real effective exchange rate 87.0 92.9 98.3 100.0 107.3 122.9 135.2 135.5 126.8 122.6 122.3 131.2 137.2 140.6 (2005=100; ULC in total economy)
(a) Manufacturing industry (b) Private consumption deflator (c) GDP deflator

189
Main economic indicators 1961-2015
82. Ireland(Annual percentage change, unless otherwise stated)
1961-1973 1974-1985 1986-1990 1991-1995 1996-2000 2001-2005 2006-2010 2009 2010 2011 2012 2013 2014 2015
1. Growth of GDP and its components (real)
1.1 Private consumption 3.8 2.2 3.4 3.1 8.3 4.4 1.6 -5.4 0.4 -1.4 -0.3 -1.1 0.4 0.81.2 Government consumption 5.2 3.7 -0.7 2.7 5.8 5.1 1.1 -2.9 -4.9 -2.9 -3.2 -0.6 -0.7 -0.11.3 Gross fixed capital formation 9.9 0.7 4.5 2.6 13.0 6.6 -11.3 -27.0 -22.7 -9.1 -0.6 3.6 12.0 6.51.4 of which equipment : 1.6 6.0 2.9 13.8 4.7 -5.4 -17.3 -11.2 -1.6 2.3 -8.5 12.0 5.11.5 of which construction : 0.6 3.3 3.7 12.7 7.8 -14.5 -31.4 -29.6 -15.6 -4.1 12.4 12.0 7.11.6 Exports of goods and services 8.7 8.0 8.9 12.8 17.9 5.2 2.9 -3.8 6.4 5.4 1.6 0.2 2.8 3.71.7 Imports of goods and services 9.7 4.4 7.1 9.9 18.0 5.0 0.9 -9.8 3.6 -0.4 0.0 1.0 3.1 2.61.8 GDP 4.4 3.8 4.6 4.7 10.3 4.9 0.1 -6.4 -1.1 2.2 0.2 -0.3 1.7 3.0
2. Demand components: Contribution to changes in GDP (%)
2.1 Consumption 3.7 2.3 2.0 2.3 5.1 2.8 0.8 -3.2 -0.8 -1.3 -0.7 -0.7 0.1 0.42.2 Investment 1.9 0.2 0.8 0.4 2.6 1.6 -2.0 -5.9 -3.7 -1.1 -0.1 0.4 1.3 0.82.3 Stockbuilding 0.1 0.0 0.4 -0.2 0.2 0.0 -0.1 -0.6 0.6 0.9 -0.4 0.2 -0.1 0.02.4 Domestic demand 5.7 2.5 3.2 2.4 7.8 4.4 -1.3 -9.8 -3.8 -1.4 -1.2 -0.1 1.3 1.22.5 Exports 2.5 3.0 5.0 8.3 14.7 4.8 2.5 -3.2 5.8 5.4 1.6 0.2 3.1 4.02.6 Final demand 8.3 5.5 8.1 10.6 15.5 8.7 -2.8 -19.7 -8.0 -2.4 -3.2 1.2 4.4 5.22.7 Imports -3.8 -1.9 -3.7 -5.6 -12.6 -3.8 -0.7 7.2 -2.7 0.3 0.0 -0.8 -2.6 -2.22.8 Net exports -1.3 1.1 1.3 2.6 2.1 1.0 1.8 4.1 3.1 5.7 1.6 -0.7 0.4 1.8
3. Gross savings and investment in % of GDP at current prices
3.1 Private sector savings 19.1 22.7 18.5 18.5 18.4 18.0 18.9 19.8 21.4 19.9 20.5 22.9 22.9 23.93.2 Net savings of households : : : : : : 2.8 6.4 4.6 3.3 2.6 : : 3.3 General government savings 0.9 -4.4 -3.3 -0.7 4.7 4.3 -1.2 -7.5 -7.5 -6.7 -6.0 -5.2 -3.8 -2.73.4 National savings 19.9 18.2 15.2 17.8 23.0 22.3 17.7 12.3 13.9 13.2 14.5 17.7 19.1 21.13.5 Gross capital formation 21.0 24.8 17.4 16.6 22.4 24.1 20.6 15.2 11.8 11.2 10.9 11.5 12.6 13.13.6 Current account -2.5 -7.9 -1.2 1.8 1.2 -0.6 -3.2 -2.3 1.1 1.2 4.4 6.6 7.4 8.8
4. Determinants of investment
4.1 Capacity utilisation (survey) (a) : : : : : : : : : : : : : 4.2 Trend GDP gap : 1.1 -0.8 -4.2 1.1 2.7 2.3 -3.0 -4.6 -3.1 -3.4 -4.3 -3.4 -1.44.3 Potential GDP gap : -0.6 -1.5 -1.1 2.0 0.8 0.1 -4.1 -4.1 -1.2 -0.6 -1.4 -1.0 0.04.4 Profitability index (1961-1973 = 100) 100.0 76.3 98.9 108.1 154.7 165.0 134.7 121.0 134.0 149.4 148.5 144.7 145.3 149.3
5. Growth potential
5.1 Growth of net capital stock (real) 5.6 5.1 2.5 2.2 4.9 5.7 4.0 2.1 0.7 0.2 0.3 0.4 0.9 1.25.2 Net capital/output ratio (real) 3.2 3.8 3.9 3.5 2.8 2.6 2.9 3.1 3.2 3.1 3.1 3.2 3.1 3.15.3 Growth of capital intensity 5.5 5.0 1.4 0.4 -0.7 2.6 4.9 10.8 5.0 2.1 0.9 -1.9 -1.4 -1.15.4 Labour productivity growth 4.3 3.7 3.5 2.9 4.3 1.9 0.9 1.6 3.1 4.0 0.8 -2.6 -0.6 0.75.5 Total factor productivity growth 2.1 1.7 2.9 2.7 4.6 0.8 -1.0 -2.5 1.1 3.2 0.4 -1.9 0.0 1.1
6. Employment and unemployment
6.1 Employment 0.1 0.1 1.1 1.7 5.7 3.0 -0.8 -7.8 -4.1 -1.8 -0.6 2.4 2.4 2.36.2 Activity rate : : : : 66.7 70.4 72.9 72.2 71.0 70.8 71.0 71.8 72.0 72.26.3 Employment rate : : : : 61.6 67.4 66.9 63.5 61.1 60.4 60.5 62.5 63.8 64.9 (benchmark) 6.4 Employment rate : : : : : : : : : : : : : (full-time equivalent) 6.5 Unemployment rate 5.6 10.6 15.5 14.5 7.8 4.4 8.3 12.0 13.9 14.7 14.7 13.1 11.4 10.2 (Eurostat definition)
7. Prices and wages
7.1 Nominal wages per head 11.3 16.7 5.6 4.6 5.1 6.1 2.0 -1.1 -3.8 -0.1 0.8 -1.7 0.4 0.57.2 Real wages per head (b) 4.7 2.6 2.3 1.9 1.6 2.6 2.5 6.4 -1.7 -1.8 0.3 -3.4 -0.9 -0.47.3 Nominal unit labour costs 6.8 12.5 2.1 1.6 0.8 4.1 1.1 -2.6 -6.7 -4.0 0.0 1.0 1.1 -0.27.4 Real unit labour costs -0.4 -0.2 -1.1 -1.2 -2.9 0.2 1.8 1.3 -5.3 -4.6 -0.6 0.6 -0.1 -1.17.5 GDP deflator 7.2 12.8 3.2 2.9 3.8 4.0 -0.7 -3.8 -1.5 0.7 0.7 0.4 1.1 0.97.6 Private consumption deflator 6.3 13.8 3.2 2.7 3.5 3.4 -0.5 -7.0 -2.1 1.7 0.5 1.8 1.3 0.97.7 Terms of trade 0.8 -1.7 -0.2 -1.0 -0.2 0.0 -0.9 1.7 -1.5 -2.7 0.3 -0.2 0.4 -0.1
8. General government budget, % of GDP
8.1 Expenditure 29.8 44.1 47.0 43.3 35.2 33.6 45.5 48.2 65.5 47.2 42.7 43.1 40.5 39.48.2 Current revenues 25.9 34.3 41.3 40.8 37.3 34.3 35.8 34.5 34.9 34.0 34.5 35.9 35.7 35.28.3 Net borrowing (-) or lending (+) -3.4 -9.7 -5.7 -2.5 2.1 0.8 -9.7 -13.7 -30.6 -13.1 -8.2 -7.2 -4.8 -4.28.4 Net borrowing cyclically adjusted : -10.1 -5.0 -2.0 1.4 0.4 -9.8 -11.6 -28.6 -12.5 -7.9 -6.5 -4.3 -4.28.5 Debt (end of period) 40.8 99.3 92.0 80.1 37.0 27.2 91.2 64.4 91.2 104.1 117.4 123.7 121.0 120.4
9. Monetary conditions
9.1 Long-term interest rate : 14.6 10.0 8.4 5.7 4.3 4.7 5.2 5.7 9.6 6.2 3.8 : 9.2 Short-term interest rate : 13.4 10.5 8.8 4.9 2.8 2.8 1.2 0.8 1.4 0.6 0.2 : 9.3 Yield curve (9.1-9.2) : 1.1 -0.5 -0.4 0.9 1.5 1.9 4.0 4.9 8.2 5.6 3.6 : 9.4 Real long-term interest rate (c) : 1.6 6.6 5.4 1.9 0.3 5.5 9.4 7.4 8.9 5.5 3.4 : 9.5 Nominal effective exchange rate : : : : -1.5 2.5 0.8 0.7 -3.5 0.8 -3.6 3.1 1.5 0.09.6 Real effective exchange rate : : : : 85.0 90.6 107.4 110.4 99.6 95.1 90.0 92.7 94.2 93.0 (2005=100; ULC in total economy)
(a) Manufacturing industry (b) Private consumption deflator (c) GDP deflator

190
Main economic indicators 1961-2015
83. Greece(Annual percentage change, unless otherwise stated)
1961-1973 1974-1985 1986-1990 1991-1995 1996-2000 2001-2005 2006-2010 2009 2010 2011 2012 2013 2014 2015
1. Growth of GDP and its components (real)
1.1 Private consumption 6.8 3.3 3.2 1.9 2.6 4.3 0.8 -1.6 -6.2 -7.7 -9.3 -6.0 -1.8 1.61.2 Government consumption 6.2 5.0 -0.1 0.5 4.4 2.3 0.6 4.9 -8.7 -5.2 -6.9 -4.1 -1.7 -2.01.3 Gross fixed capital formation 9.7 -3.2 0.8 -0.4 9.0 3.8 -2.4 -13.7 -15.0 -19.6 -19.2 -12.8 5.3 11.71.4 of which equipment 12.8 0.7 5.4 4.6 15.9 6.7 2.0 -18.4 -7.9 -18.1 -17.6 -7.2 8.8 13.01.5 of which construction 8.9 -3.3 0.8 -2.8 5.4 1.7 -5.6 -12.8 -19.2 -21.0 -22.7 -17.9 2.4 10.51.6 Exports of goods and services 11.5 5.5 3.6 4.3 12.0 2.5 -0.8 -19.4 5.2 0.3 -1.7 1.8 4.1 5.21.7 Imports of goods and services 12.8 3.0 8.4 3.5 12.1 1.4 -0.8 -20.2 -6.2 -7.3 -13.8 -5.3 -1.2 2.21.8 GDP 8.5 1.7 1.2 1.2 3.4 4.0 0.1 -3.1 -4.9 -7.1 -7.0 -3.9 0.6 2.9
2. Demand components: Contribution to changes in GDP (%)
2.1 Consumption 4.8 2.2 2.2 1.4 2.3 3.5 0.7 -0.2 -6.3 -6.6 -8.1 -5.1 -1.6 0.72.2 Investment 3.1 -0.9 0.2 -0.1 1.6 0.9 -0.3 -3.1 -3.0 -3.5 -2.9 -1.7 0.7 1.52.3 Stockbuilding 1.3 -0.2 0.0 0.1 0.0 -0.4 -0.2 -2.9 1.4 0.6 0.0 0.8 0.0 -0.42.4 Domestic demand 9.4 1.6 2.3 1.4 3.9 4.0 0.1 -6.3 -7.8 -9.5 -11.0 -6.1 -0.9 1.92.5 Exports 0.8 0.6 0.5 0.7 2.1 0.5 -0.1 -4.7 1.0 0.1 -0.4 0.5 1.1 1.42.6 Final demand 10.2 2.2 2.8 2.1 6.1 4.5 0.0 -10.9 -6.8 -9.4 -11.4 -5.6 0.2 3.32.7 Imports -1.6 -0.4 -1.5 -0.8 -3.0 -0.5 0.1 7.8 1.9 2.3 4.6 1.7 0.3 -0.62.8 Net exports -0.8 0.2 -1.0 -0.1 -0.9 0.1 0.0 3.1 2.9 2.4 4.1 2.2 1.4 0.8
3. Gross savings and investment in % of GDP at current prices
3.1 Private sector savings 22.9 29.3 28.5 25.8 16.1 13.0 14.2 16.1 13.9 13.2 14.0 11.6 11.8 11.83.2 Net savings of households : : : : 3.9 -3.8 -1.9 -2.0 -6.0 -8.3 -9.4 : : 3.3 General government savings 3.3 -1.5 -7.0 -6.1 -1.4 -1.7 -7.2 -11.9 -9.1 -8.9 -4.9 -0.9 -0.2 0.73.4 National savings 26.2 27.8 21.5 19.7 14.8 11.2 7.0 4.2 4.8 4.4 9.1 10.6 11.6 12.43.5 Gross capital formation 29.7 28.7 23.9 21.9 22.8 24.3 22.3 18.6 17.5 16.1 13.7 13.0 13.9 14.63.6 Current account -1.8 0.3 -1.4 -0.5 -4.9 -11.5 -15.3 -14.4 -12.8 -11.7 -4.6 -2.4 -2.3 -2.2
4. Determinants of investment
4.1 Capacity utilisation (survey) (a) : : 76.3 76.5 75.9 75.8 73.5 70.8 68.2 67.7 64.7 65.1 : 4.2 Trend GDP gap : 0.0 -0.5 -0.6 -2.4 0.8 7.4 7.2 3.4 -2.2 -7.4 -9.4 -7.6 -4.04.3 Potential GDP gap : -0.6 1.4 1.8 1.3 0.0 0.1 -1.5 -4.7 -8.7 -12.2 -12.6 -9.3 -4.04.4 Profitability index (1961-1973 = 100) 100.0 75.2 56.8 71.7 77.8 85.1 87.6 80.2 73.4 66.9 61.9 58.4 64.7 72.4
5. Growth potential
5.1 Growth of net capital stock (real) 7.8 4.1 2.2 1.9 2.3 3.0 2.5 1.6 0.4 -0.9 -2.0 -2.9 -2.7 -2.25.2 Net capital/output ratio (real) 2.8 3.3 3.8 3.9 3.8 3.6 3.6 3.7 4.0 4.2 4.4 4.5 4.3 4.15.3 Growth of capital intensity 8.3 3.1 1.5 1.2 1.7 1.2 2.2 2.2 3.1 5.1 6.9 1.2 -3.3 -4.75.4 Labour productivity growth 9.0 0.7 0.5 0.6 2.9 2.2 -0.2 -2.5 -2.4 -1.6 1.5 0.2 0.0 0.35.5 Total factor productivity growth 5.7 -0.5 -0.1 0.1 2.2 1.7 -1.0 -3.4 -3.6 -3.5 -1.1 -0.2 1.3 2.2
6. Employment and unemployment
6.1 Employment -0.5 1.0 0.7 0.5 1.4 1.3 0.2 -1.1 -2.3 -6.1 -8.7 -4.1 0.6 2.66.2 Activity rate 60.0 57.3 58.7 57.8 60.7 63.5 66.2 66.3 67.9 68.7 68.8 69.4 68.8 68.86.3 Employment rate 57.4 55.1 54.8 53.0 54.1 57.0 60.0 60.1 59.5 56.7 52.3 50.6 51.0 52.4 (benchmark) 6.4 Employment rate : : : : : : : : : : : : : (full-time equivalent) 6.5 Unemployment rate 4.4 3.8 6.6 8.3 10.7 10.2 9.4 9.5 12.6 17.7 24.3 27.3 26.0 24.0 (Eurostat definition)
7. Prices and wages
7.1 Nominal wages per head 10.1 21.5 16.8 12.1 8.0 5.6 2.3 3.5 -2.6 -3.4 -3.7 -6.6 -2.7 0.07.2 Real wages per head (b) 6.4 2.7 -0.7 -1.5 2.3 2.5 -0.8 2.8 -6.3 -6.5 -4.6 -5.2 -1.9 -0.37.3 Nominal unit labour costs 1.0 20.6 16.2 11.4 5.0 3.3 2.5 6.2 -0.1 -1.8 -5.1 -6.8 -2.7 -0.37.4 Real unit labour costs -3.2 1.3 -0.8 -2.2 -0.1 0.1 -0.3 3.8 -1.3 -2.9 -4.8 -4.9 -2.0 -0.77.5 GDP deflator 4.4 19.1 17.2 13.9 5.1 3.2 2.8 2.3 1.1 1.0 -0.3 -2.1 -0.7 0.47.6 Private consumption deflator 3.6 18.2 17.6 13.8 5.6 3.0 3.1 0.7 4.0 3.4 0.9 -1.5 -0.8 0.37.7 Terms of trade 0.0 -1.3 1.9 1.0 -0.2 0.8 -0.3 -0.7 0.4 -1.1 -1.4 0.3 -0.3 0.2
8. General government budget, % of GDP
8.1 Expenditure 20.9 28.9 39.1 44.9 45.3 45.4 49.6 54.0 51.3 51.8 53.3 58.5 47.4 45.58.2 Current revenues 21.3 24.4 28.3 34.8 40.6 39.7 39.9 38.3 40.4 42.2 44.4 45.8 45.8 44.58.3 Net borrowing (-) or lending (+) (d) 0.5 -4.5 -10.8 -10.1 -4.7 -5.6 -9.8 -15.7 -10.9 -9.6 -8.9 -12.7 -1.6 -1.08.4 Net borrowing cyclically adjusted (d) : -4.4 -10.6 -10.6 -5.1 -5.6 -9.8 -14.9 -8.6 -5.4 -3.1 -6.7 2.8 0.98.5 Debt (end of period) (d) 15.7 48.3 71.7 97.9 104.4 110.0 148.3 129.7 148.3 170.3 157.2 175.1 177.2 172.4
9. Monetary conditions
9.1 Long-term interest rate : 13.6 : : 9.0 4.5 5.5 5.2 9.1 15.8 22.5 10.1 : 9.2 Short-term interest rate : : 17.8 22.1 11.7 2.8 2.8 1.2 0.8 1.4 0.6 0.2 : 9.3 Yield curve (9.1-9.2) : : : : -2.6 1.7 2.7 4.0 8.3 14.4 21.9 9.8 : 9.4 Real long-term interest rate (c) : -4.6 : : 3.7 1.2 2.7 2.8 7.9 14.5 22.9 12.4 : 9.5 Nominal effective exchange rate : : : : 0.3 2.2 0.6 1.9 -2.4 1.0 -1.4 2.1 1.8 -0.19.6 Real effective exchange rate : : : : 92.3 95.0 100.8 104.6 101.9 100.4 91.7 85.9 84.0 82.5 (2000=100; ULC in total economy)
(a) Manufacturing industry (b) Private consumption deflator (c) GDP deflator

191
Main economic indicators 1961-2015
84. Spain(Annual percentage change, unless otherwise stated)
1961-1973 1974-1985 1986-1990 1991-1995 1996-2000 2001-2005 2006-2010 2009 2010 2011 2012 2013 2014 2015
1. Growth of GDP and its components (real)
1.1 Private consumption 7.2 1.5 4.6 1.2 4.1 3.5 0.6 -3.7 0.2 -1.2 -2.8 -2.1 1.3 1.61.2 Government consumption 4.5 4.8 6.4 3.0 3.3 5.0 4.2 3.7 1.5 -0.5 -4.8 -2.3 -0.8 -0.71.3 Gross fixed capital formation 10.5 -0.6 10.9 -0.5 7.2 5.3 -3.7 -18.0 -5.5 -5.4 -7.0 -5.1 -1.4 4.21.4 of which equipment : -0.2 11.9 -2.5 11.2 2.2 -1.7 -24.5 5.0 5.5 -3.9 2.2 6.5 8.21.5 of which construction : -1.0 11.0 0.1 4.6 6.4 -5.0 -16.6 -9.9 -10.8 -9.7 -9.6 -6.9 1.21.6 Exports of goods and services 11.9 6.0 3.1 9.9 10.2 3.3 2.5 -10.0 11.7 7.6 2.1 4.9 5.5 6.71.7 Imports of goods and services 17.3 2.5 17.0 6.7 12.3 6.3 0.4 -17.2 9.3 -0.1 -5.7 0.4 3.4 5.81.8 GDP 7.2 1.8 4.5 1.5 4.1 3.3 0.8 -3.8 -0.2 0.1 -1.6 -1.2 1.1 2.1
2. Demand components: Contribution to changes in GDP (%)
2.1 Consumption 5.4 1.6 3.8 1.2 3.0 2.9 1.2 -1.4 0.4 -0.8 -2.7 -1.7 0.6 0.82.2 Investment 2.2 -0.1 2.2 -0.1 1.6 1.4 -0.9 -5.2 -1.3 -1.2 -1.5 -1.0 -0.2 0.72.3 Stockbuilding 0.2 -0.1 0.2 -0.1 0.0 -0.1 0.1 -0.2 0.3 -0.1 0.0 0.0 0.0 0.02.4 Domestic demand 7.8 1.4 6.2 1.1 4.7 4.3 0.4 -6.7 -0.6 -2.1 -4.1 -2.7 0.4 1.52.5 Exports 1.2 0.8 0.5 1.8 2.5 0.9 0.7 -2.7 2.8 2.1 0.6 1.6 1.9 2.42.6 Final demand 9.0 2.2 6.7 2.8 7.2 5.2 1.1 -9.4 2.2 0.0 -3.5 -1.1 2.2 3.92.7 Imports -1.8 -0.4 -2.2 -1.3 -3.1 -1.9 -0.2 5.6 -2.4 0.0 1.8 -0.1 -1.1 -1.92.8 Net exports -0.6 0.5 -1.7 0.5 -0.6 -1.0 0.5 2.9 0.4 2.1 2.5 1.5 0.8 0.5
3. Gross savings and investment in % of GDP at current prices
3.1 Private sector savings : 21.3 21.8 21.5 21.0 18.4 19.2 24.4 23.0 22.6 23.0 23.9 22.7 23.73.2 Net savings of households : : : : 4.9 3.5 4.5 7.9 4.9 4.3 2.7 : : 3.3 General government savings : 1.2 1.3 -0.7 1.2 4.2 0.8 -5.3 -4.6 -5.4 -4.5 -4.9 -3.7 -4.23.4 National savings 25.4 22.5 23.1 20.8 22.2 22.6 20.0 19.1 18.4 17.3 18.5 19.0 19.0 19.53.5 Gross capital formation 27.0 24.0 24.1 22.5 23.7 27.6 27.6 23.9 22.8 21.2 19.8 18.2 17.7 18.03.6 Current account -0.7 -1.5 -1.5 -2.1 -1.6 -5.1 -7.5 -4.8 -4.4 -4.0 -1.2 0.8 1.4 1.5
4. Determinants of investment
4.1 Capacity utilisation (survey) (a) : : 80.1 76.7 79.8 79.4 76.6 70.2 71.4 72.8 72.1 73.5 : 4.2 Trend GDP gap : -0.1 1.2 -0.1 -1.6 0.8 3.1 0.6 -0.1 -0.5 -2.5 -4.2 -3.8 -2.74.3 Potential GDP gap : -0.1 0.5 -1.8 -0.2 2.1 -0.5 -4.0 -5.3 -5.9 -7.3 -8.1 -6.7 -4.74.4 Profitability index (1961-1973 = 100) 100.0 81.7 105.8 98.4 105.2 103.7 89.8 81.1 82.1 83.6 87.2 93.1 96.8 101.2
5. Growth potential
5.1 Growth of net capital stock (real) 5.2 3.9 4.0 3.6 3.8 4.5 3.6 2.3 1.7 1.3 0.8 0.4 0.3 0.55.2 Net capital/output ratio (real) 2.4 2.8 2.9 3.1 3.2 3.3 3.6 3.8 3.9 3.9 4.0 4.1 4.0 4.05.3 Growth of capital intensity 4.5 5.3 0.4 4.0 0.0 1.6 4.1 9.0 4.2 3.6 5.8 3.9 -0.1 -0.75.4 Labour productivity growth 6.5 3.2 0.9 1.9 0.3 0.3 1.4 2.5 2.2 2.3 3.3 2.3 0.7 0.85.5 Total factor productivity growth 4.7 1.2 0.7 0.4 0.3 -0.3 -0.2 -0.8 0.6 0.9 1.1 0.8 0.8 1.1
6. Employment and unemployment
6.1 Employment 0.7 -1.3 3.6 -0.3 3.9 3.3 -0.4 -6.5 -2.2 -1.9 -4.2 -3.0 0.6 1.46.2 Activity rate : : : : 65.0 69.3 73.1 74.0 74.2 74.4 74.8 74.4 74.6 74.86.3 Employment rate 62.5 53.9 50.4 51.4 55.2 62.2 63.7 60.9 59.7 58.7 56.5 55.3 56.0 57.3 (benchmark) 6.4 Employment rate : : 48.5 49.4 52.7 58.9 59.3 56.9 55.6 54.5 52.1 50.8 51.4 52.4 (full-time equivalent) 6.5 Unemployment rate 2.6 10.4 16.7 18.4 15.5 10.7 13.2 18.0 20.1 21.7 25.0 26.4 25.5 24.0 (Eurostat definition)
7. Prices and wages
7.1 Nominal wages per head 14.6 18.0 8.3 7.2 2.6 3.3 4.0 4.2 0.4 1.3 0.2 0.7 0.2 0.37.2 Real wages per head (b) 7.6 2.4 1.6 1.5 -0.1 0.0 1.7 5.3 -1.5 -1.1 -2.2 -0.7 0.0 -0.57.3 Nominal unit labour costs 7.6 14.3 7.3 5.2 2.3 3.0 2.6 1.6 -1.7 -1.0 -3.0 -1.6 -0.5 -0.57.4 Real unit labour costs 0.5 -0.6 0.0 -0.2 -0.6 -1.2 0.6 1.5 -1.8 -1.0 -3.0 -2.2 -0.8 -1.37.5 GDP deflator 7.2 15.0 7.4 5.4 2.9 4.2 2.0 0.1 0.1 0.0 0.0 0.6 0.3 0.77.6 Private consumption deflator 6.5 15.3 6.6 5.6 2.8 3.3 2.2 -1.1 1.9 2.5 2.5 1.3 0.2 0.87.7 Terms of trade 3.0 -2.2 7.4 0.8 -0.2 1.2 0.1 4.1 -2.2 -3.1 -2.3 0.7 0.6 -0.1
8. General government budget, % of GDP
8.1 Expenditure : 30.4 40.1 44.4 41.0 38.6 42.3 46.2 46.3 45.7 47.8 44.9 43.8 43.08.2 Current revenues : 28.0 36.1 38.9 38.1 38.7 38.1 35.1 36.7 36.2 37.2 37.8 38.1 36.98.3 Net borrowing (-) or lending (+) : -2.6 -4.0 -5.5 -3.0 0.0 -4.2 -11.1 -9.6 -9.6 -10.6 -7.1 -5.6 -6.18.4 Net borrowing cyclically adjusted : -2.4 -4.4 -5.5 -2.9 -1.0 -3.9 -9.2 -7.1 -6.8 -7.1 -3.3 -2.4 -3.98.5 Debt (end of period) 12.3 41.4 42.7 63.3 59.4 43.2 61.7 54.0 61.7 70.5 86.0 93.9 100.2 103.8
9. Monetary conditions
9.1 Long-term interest rate : : 12.9 10.9 6.0 4.3 4.1 4.0 4.3 5.4 5.9 4.6 : 9.2 Short-term interest rate : : 13.9 11.1 4.9 2.8 2.8 1.2 0.8 1.4 0.6 0.2 : 9.3 Yield curve (9.1-9.2) : : -1.0 -0.2 1.1 1.5 1.3 2.8 3.4 4.1 5.3 4.3 : 9.4 Real long-term interest rate (c) : : 5.1 5.2 3.1 0.1 2.1 3.9 4.2 5.4 5.8 3.9 : 9.5 Nominal effective exchange rate : : : : -1.1 1.6 0.5 1.3 -2.4 0.4 -1.8 2.1 1.3 0.09.6 Real effective exchange rate : : : : 91.3 95.0 106.5 109.1 104.8 103.3 96.5 95.5 95.4 93.7 (2005=100; ULC in total economy)
(a) Manufacturing industry (b) Private consumption deflator (c) GDP deflator
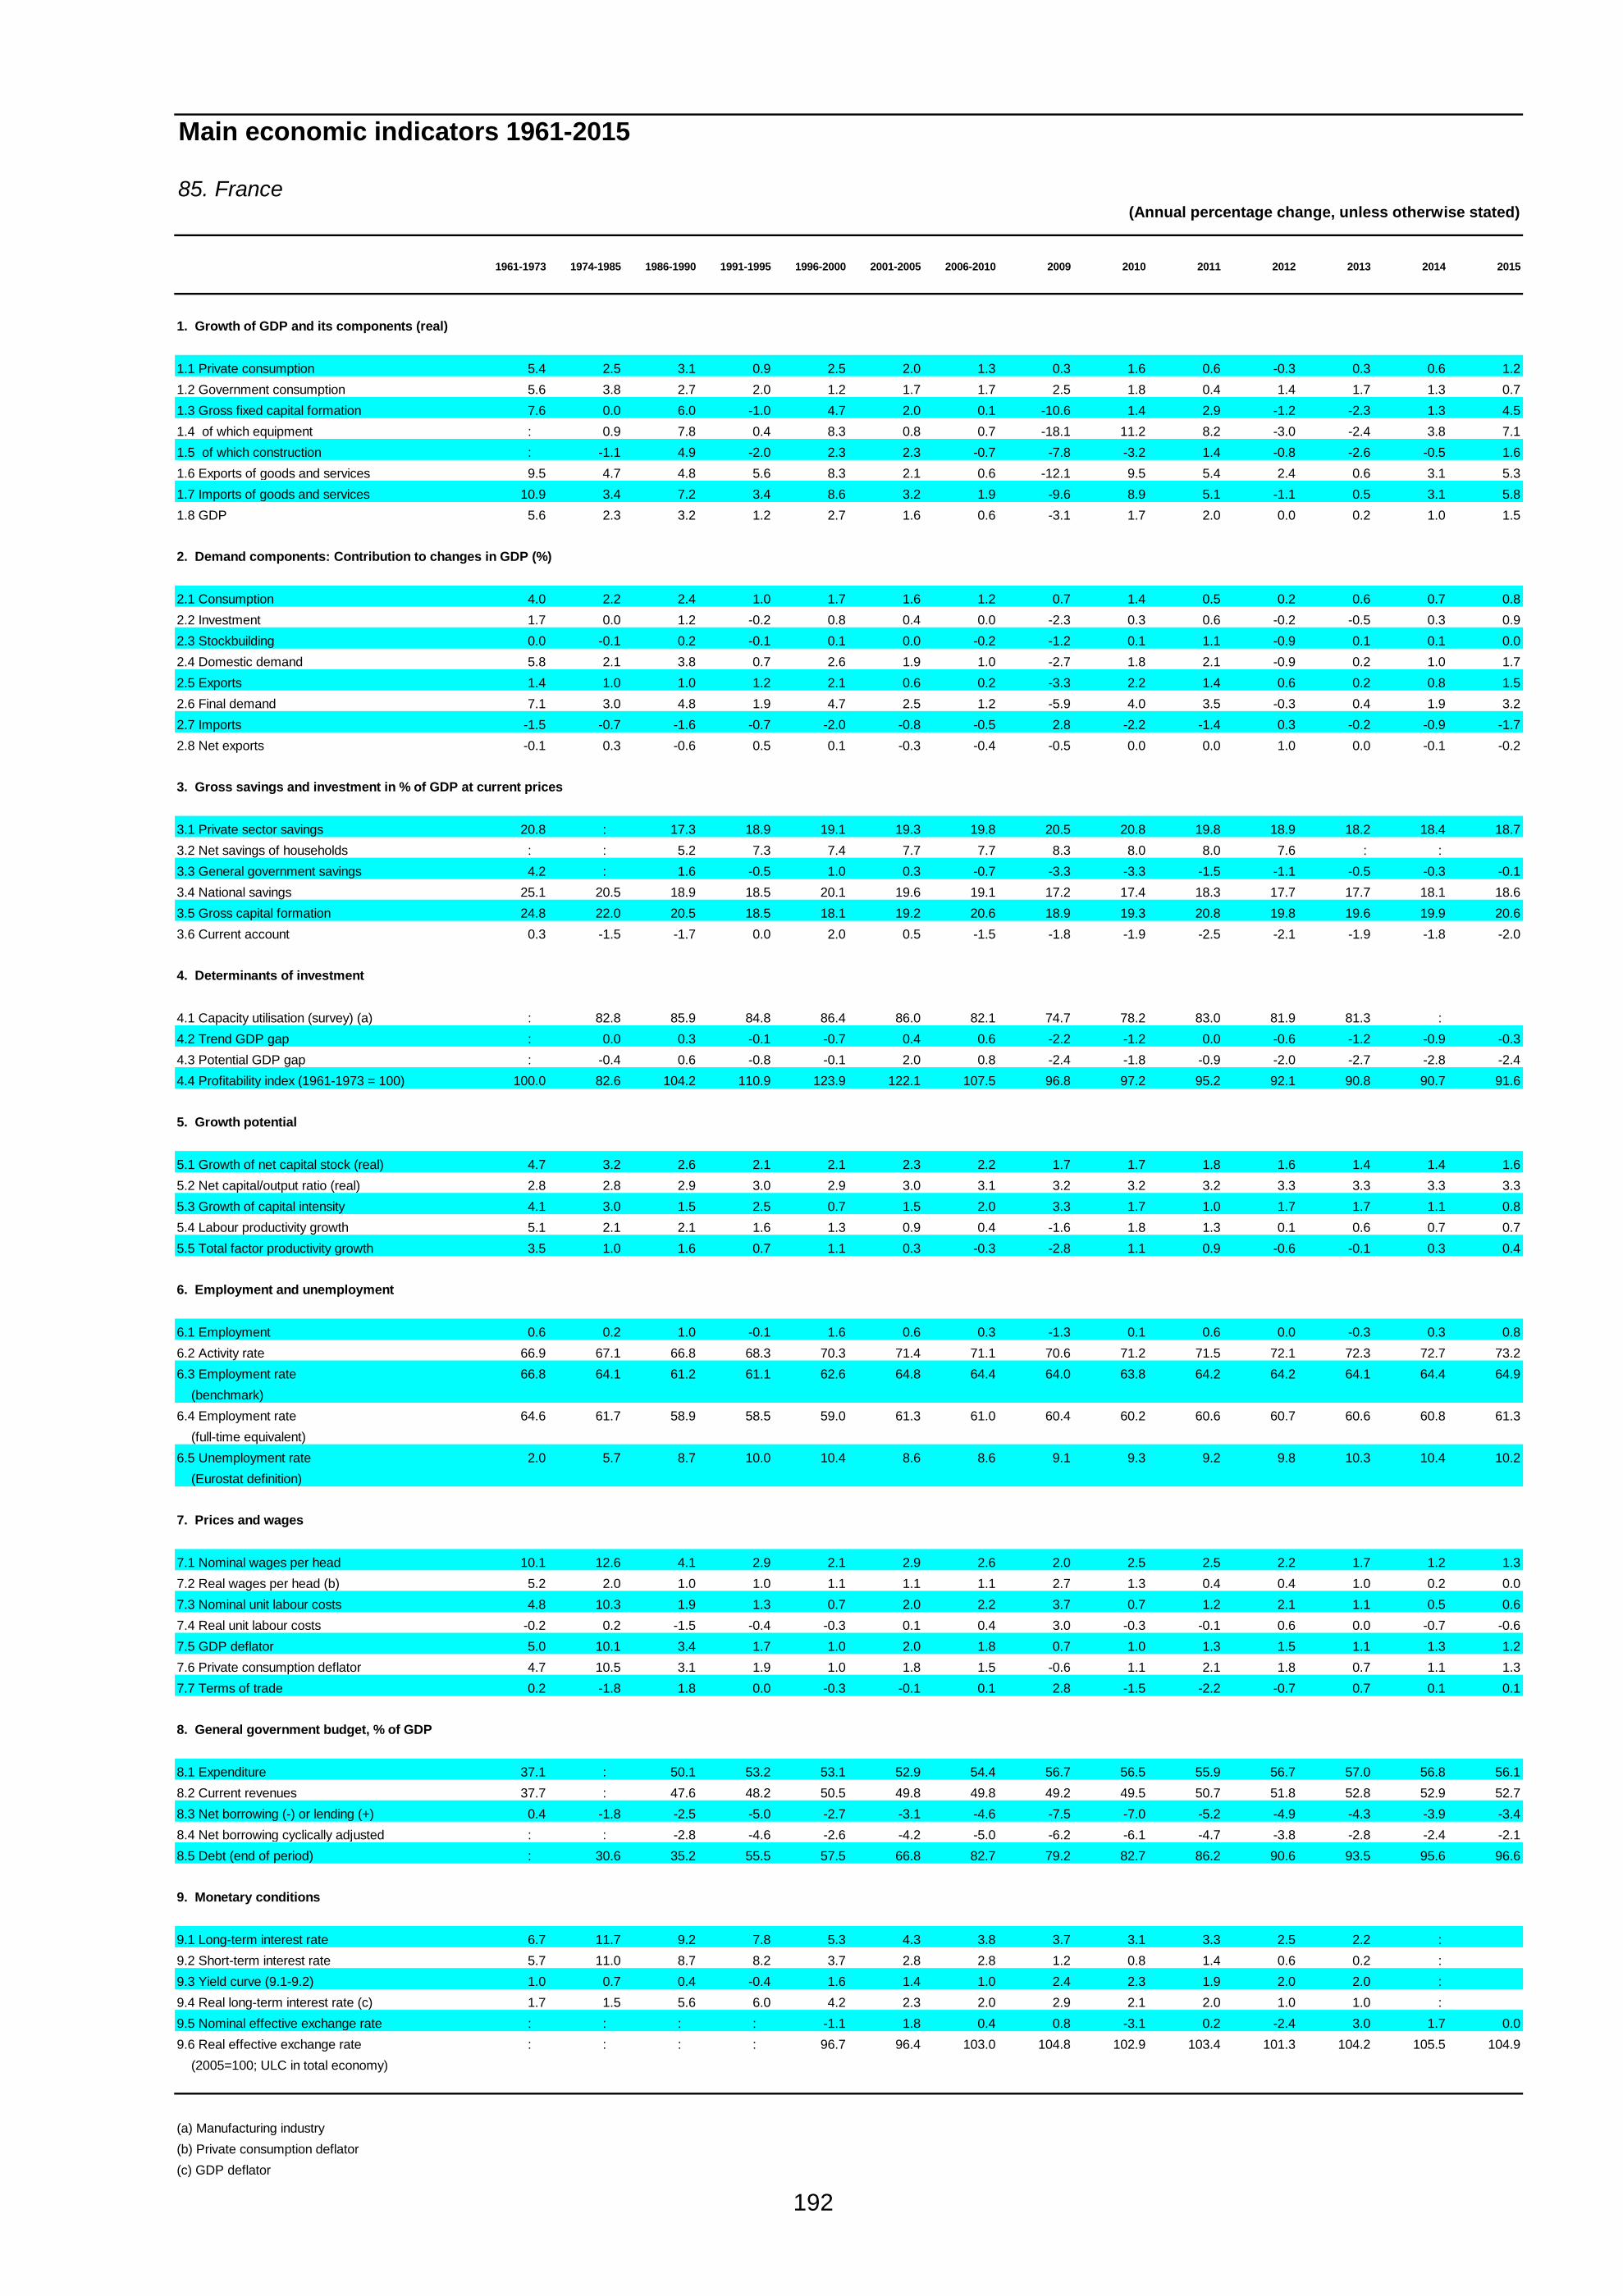
192
Main economic indicators 1961-2015
85. France(Annual percentage change, unless otherwise stated)
1961-1973 1974-1985 1986-1990 1991-1995 1996-2000 2001-2005 2006-2010 2009 2010 2011 2012 2013 2014 2015
1. Growth of GDP and its components (real)
1.1 Private consumption 5.4 2.5 3.1 0.9 2.5 2.0 1.3 0.3 1.6 0.6 -0.3 0.3 0.6 1.21.2 Government consumption 5.6 3.8 2.7 2.0 1.2 1.7 1.7 2.5 1.8 0.4 1.4 1.7 1.3 0.71.3 Gross fixed capital formation 7.6 0.0 6.0 -1.0 4.7 2.0 0.1 -10.6 1.4 2.9 -1.2 -2.3 1.3 4.51.4 of which equipment : 0.9 7.8 0.4 8.3 0.8 0.7 -18.1 11.2 8.2 -3.0 -2.4 3.8 7.11.5 of which construction : -1.1 4.9 -2.0 2.3 2.3 -0.7 -7.8 -3.2 1.4 -0.8 -2.6 -0.5 1.61.6 Exports of goods and services 9.5 4.7 4.8 5.6 8.3 2.1 0.6 -12.1 9.5 5.4 2.4 0.6 3.1 5.31.7 Imports of goods and services 10.9 3.4 7.2 3.4 8.6 3.2 1.9 -9.6 8.9 5.1 -1.1 0.5 3.1 5.81.8 GDP 5.6 2.3 3.2 1.2 2.7 1.6 0.6 -3.1 1.7 2.0 0.0 0.2 1.0 1.5
2. Demand components: Contribution to changes in GDP (%)
2.1 Consumption 4.0 2.2 2.4 1.0 1.7 1.6 1.2 0.7 1.4 0.5 0.2 0.6 0.7 0.82.2 Investment 1.7 0.0 1.2 -0.2 0.8 0.4 0.0 -2.3 0.3 0.6 -0.2 -0.5 0.3 0.92.3 Stockbuilding 0.0 -0.1 0.2 -0.1 0.1 0.0 -0.2 -1.2 0.1 1.1 -0.9 0.1 0.1 0.02.4 Domestic demand 5.8 2.1 3.8 0.7 2.6 1.9 1.0 -2.7 1.8 2.1 -0.9 0.2 1.0 1.72.5 Exports 1.4 1.0 1.0 1.2 2.1 0.6 0.2 -3.3 2.2 1.4 0.6 0.2 0.8 1.52.6 Final demand 7.1 3.0 4.8 1.9 4.7 2.5 1.2 -5.9 4.0 3.5 -0.3 0.4 1.9 3.22.7 Imports -1.5 -0.7 -1.6 -0.7 -2.0 -0.8 -0.5 2.8 -2.2 -1.4 0.3 -0.2 -0.9 -1.72.8 Net exports -0.1 0.3 -0.6 0.5 0.1 -0.3 -0.4 -0.5 0.0 0.0 1.0 0.0 -0.1 -0.2
3. Gross savings and investment in % of GDP at current prices
3.1 Private sector savings 20.8 : 17.3 18.9 19.1 19.3 19.8 20.5 20.8 19.8 18.9 18.2 18.4 18.73.2 Net savings of households : : 5.2 7.3 7.4 7.7 7.7 8.3 8.0 8.0 7.6 : : 3.3 General government savings 4.2 : 1.6 -0.5 1.0 0.3 -0.7 -3.3 -3.3 -1.5 -1.1 -0.5 -0.3 -0.13.4 National savings 25.1 20.5 18.9 18.5 20.1 19.6 19.1 17.2 17.4 18.3 17.7 17.7 18.1 18.63.5 Gross capital formation 24.8 22.0 20.5 18.5 18.1 19.2 20.6 18.9 19.3 20.8 19.8 19.6 19.9 20.63.6 Current account 0.3 -1.5 -1.7 0.0 2.0 0.5 -1.5 -1.8 -1.9 -2.5 -2.1 -1.9 -1.8 -2.0
4. Determinants of investment
4.1 Capacity utilisation (survey) (a) : 82.8 85.9 84.8 86.4 86.0 82.1 74.7 78.2 83.0 81.9 81.3 : 4.2 Trend GDP gap : 0.0 0.3 -0.1 -0.7 0.4 0.6 -2.2 -1.2 0.0 -0.6 -1.2 -0.9 -0.34.3 Potential GDP gap : -0.4 0.6 -0.8 -0.1 2.0 0.8 -2.4 -1.8 -0.9 -2.0 -2.7 -2.8 -2.44.4 Profitability index (1961-1973 = 100) 100.0 82.6 104.2 110.9 123.9 122.1 107.5 96.8 97.2 95.2 92.1 90.8 90.7 91.6
5. Growth potential
5.1 Growth of net capital stock (real) 4.7 3.2 2.6 2.1 2.1 2.3 2.2 1.7 1.7 1.8 1.6 1.4 1.4 1.65.2 Net capital/output ratio (real) 2.8 2.8 2.9 3.0 2.9 3.0 3.1 3.2 3.2 3.2 3.3 3.3 3.3 3.35.3 Growth of capital intensity 4.1 3.0 1.5 2.5 0.7 1.5 2.0 3.3 1.7 1.0 1.7 1.7 1.1 0.85.4 Labour productivity growth 5.1 2.1 2.1 1.6 1.3 0.9 0.4 -1.6 1.8 1.3 0.1 0.6 0.7 0.75.5 Total factor productivity growth 3.5 1.0 1.6 0.7 1.1 0.3 -0.3 -2.8 1.1 0.9 -0.6 -0.1 0.3 0.4
6. Employment and unemployment
6.1 Employment 0.6 0.2 1.0 -0.1 1.6 0.6 0.3 -1.3 0.1 0.6 0.0 -0.3 0.3 0.86.2 Activity rate 66.9 67.1 66.8 68.3 70.3 71.4 71.1 70.6 71.2 71.5 72.1 72.3 72.7 73.26.3 Employment rate 66.8 64.1 61.2 61.1 62.6 64.8 64.4 64.0 63.8 64.2 64.2 64.1 64.4 64.9 (benchmark) 6.4 Employment rate 64.6 61.7 58.9 58.5 59.0 61.3 61.0 60.4 60.2 60.6 60.7 60.6 60.8 61.3 (full-time equivalent) 6.5 Unemployment rate 2.0 5.7 8.7 10.0 10.4 8.6 8.6 9.1 9.3 9.2 9.8 10.3 10.4 10.2 (Eurostat definition)
7. Prices and wages
7.1 Nominal wages per head 10.1 12.6 4.1 2.9 2.1 2.9 2.6 2.0 2.5 2.5 2.2 1.7 1.2 1.37.2 Real wages per head (b) 5.2 2.0 1.0 1.0 1.1 1.1 1.1 2.7 1.3 0.4 0.4 1.0 0.2 0.07.3 Nominal unit labour costs 4.8 10.3 1.9 1.3 0.7 2.0 2.2 3.7 0.7 1.2 2.1 1.1 0.5 0.67.4 Real unit labour costs -0.2 0.2 -1.5 -0.4 -0.3 0.1 0.4 3.0 -0.3 -0.1 0.6 0.0 -0.7 -0.67.5 GDP deflator 5.0 10.1 3.4 1.7 1.0 2.0 1.8 0.7 1.0 1.3 1.5 1.1 1.3 1.27.6 Private consumption deflator 4.7 10.5 3.1 1.9 1.0 1.8 1.5 -0.6 1.1 2.1 1.8 0.7 1.1 1.37.7 Terms of trade 0.2 -1.8 1.8 0.0 -0.3 -0.1 0.1 2.8 -1.5 -2.2 -0.7 0.7 0.1 0.1
8. General government budget, % of GDP
8.1 Expenditure 37.1 : 50.1 53.2 53.1 52.9 54.4 56.7 56.5 55.9 56.7 57.0 56.8 56.18.2 Current revenues 37.7 : 47.6 48.2 50.5 49.8 49.8 49.2 49.5 50.7 51.8 52.8 52.9 52.78.3 Net borrowing (-) or lending (+) 0.4 -1.8 -2.5 -5.0 -2.7 -3.1 -4.6 -7.5 -7.0 -5.2 -4.9 -4.3 -3.9 -3.48.4 Net borrowing cyclically adjusted : : -2.8 -4.6 -2.6 -4.2 -5.0 -6.2 -6.1 -4.7 -3.8 -2.8 -2.4 -2.18.5 Debt (end of period) : 30.6 35.2 55.5 57.5 66.8 82.7 79.2 82.7 86.2 90.6 93.5 95.6 96.6
9. Monetary conditions
9.1 Long-term interest rate 6.7 11.7 9.2 7.8 5.3 4.3 3.8 3.7 3.1 3.3 2.5 2.2 : 9.2 Short-term interest rate 5.7 11.0 8.7 8.2 3.7 2.8 2.8 1.2 0.8 1.4 0.6 0.2 : 9.3 Yield curve (9.1-9.2) 1.0 0.7 0.4 -0.4 1.6 1.4 1.0 2.4 2.3 1.9 2.0 2.0 : 9.4 Real long-term interest rate (c) 1.7 1.5 5.6 6.0 4.2 2.3 2.0 2.9 2.1 2.0 1.0 1.0 : 9.5 Nominal effective exchange rate : : : : -1.1 1.8 0.4 0.8 -3.1 0.2 -2.4 3.0 1.7 0.09.6 Real effective exchange rate : : : : 96.7 96.4 103.0 104.8 102.9 103.4 101.3 104.2 105.5 104.9 (2005=100; ULC in total economy)
(a) Manufacturing industry (b) Private consumption deflator (c) GDP deflator
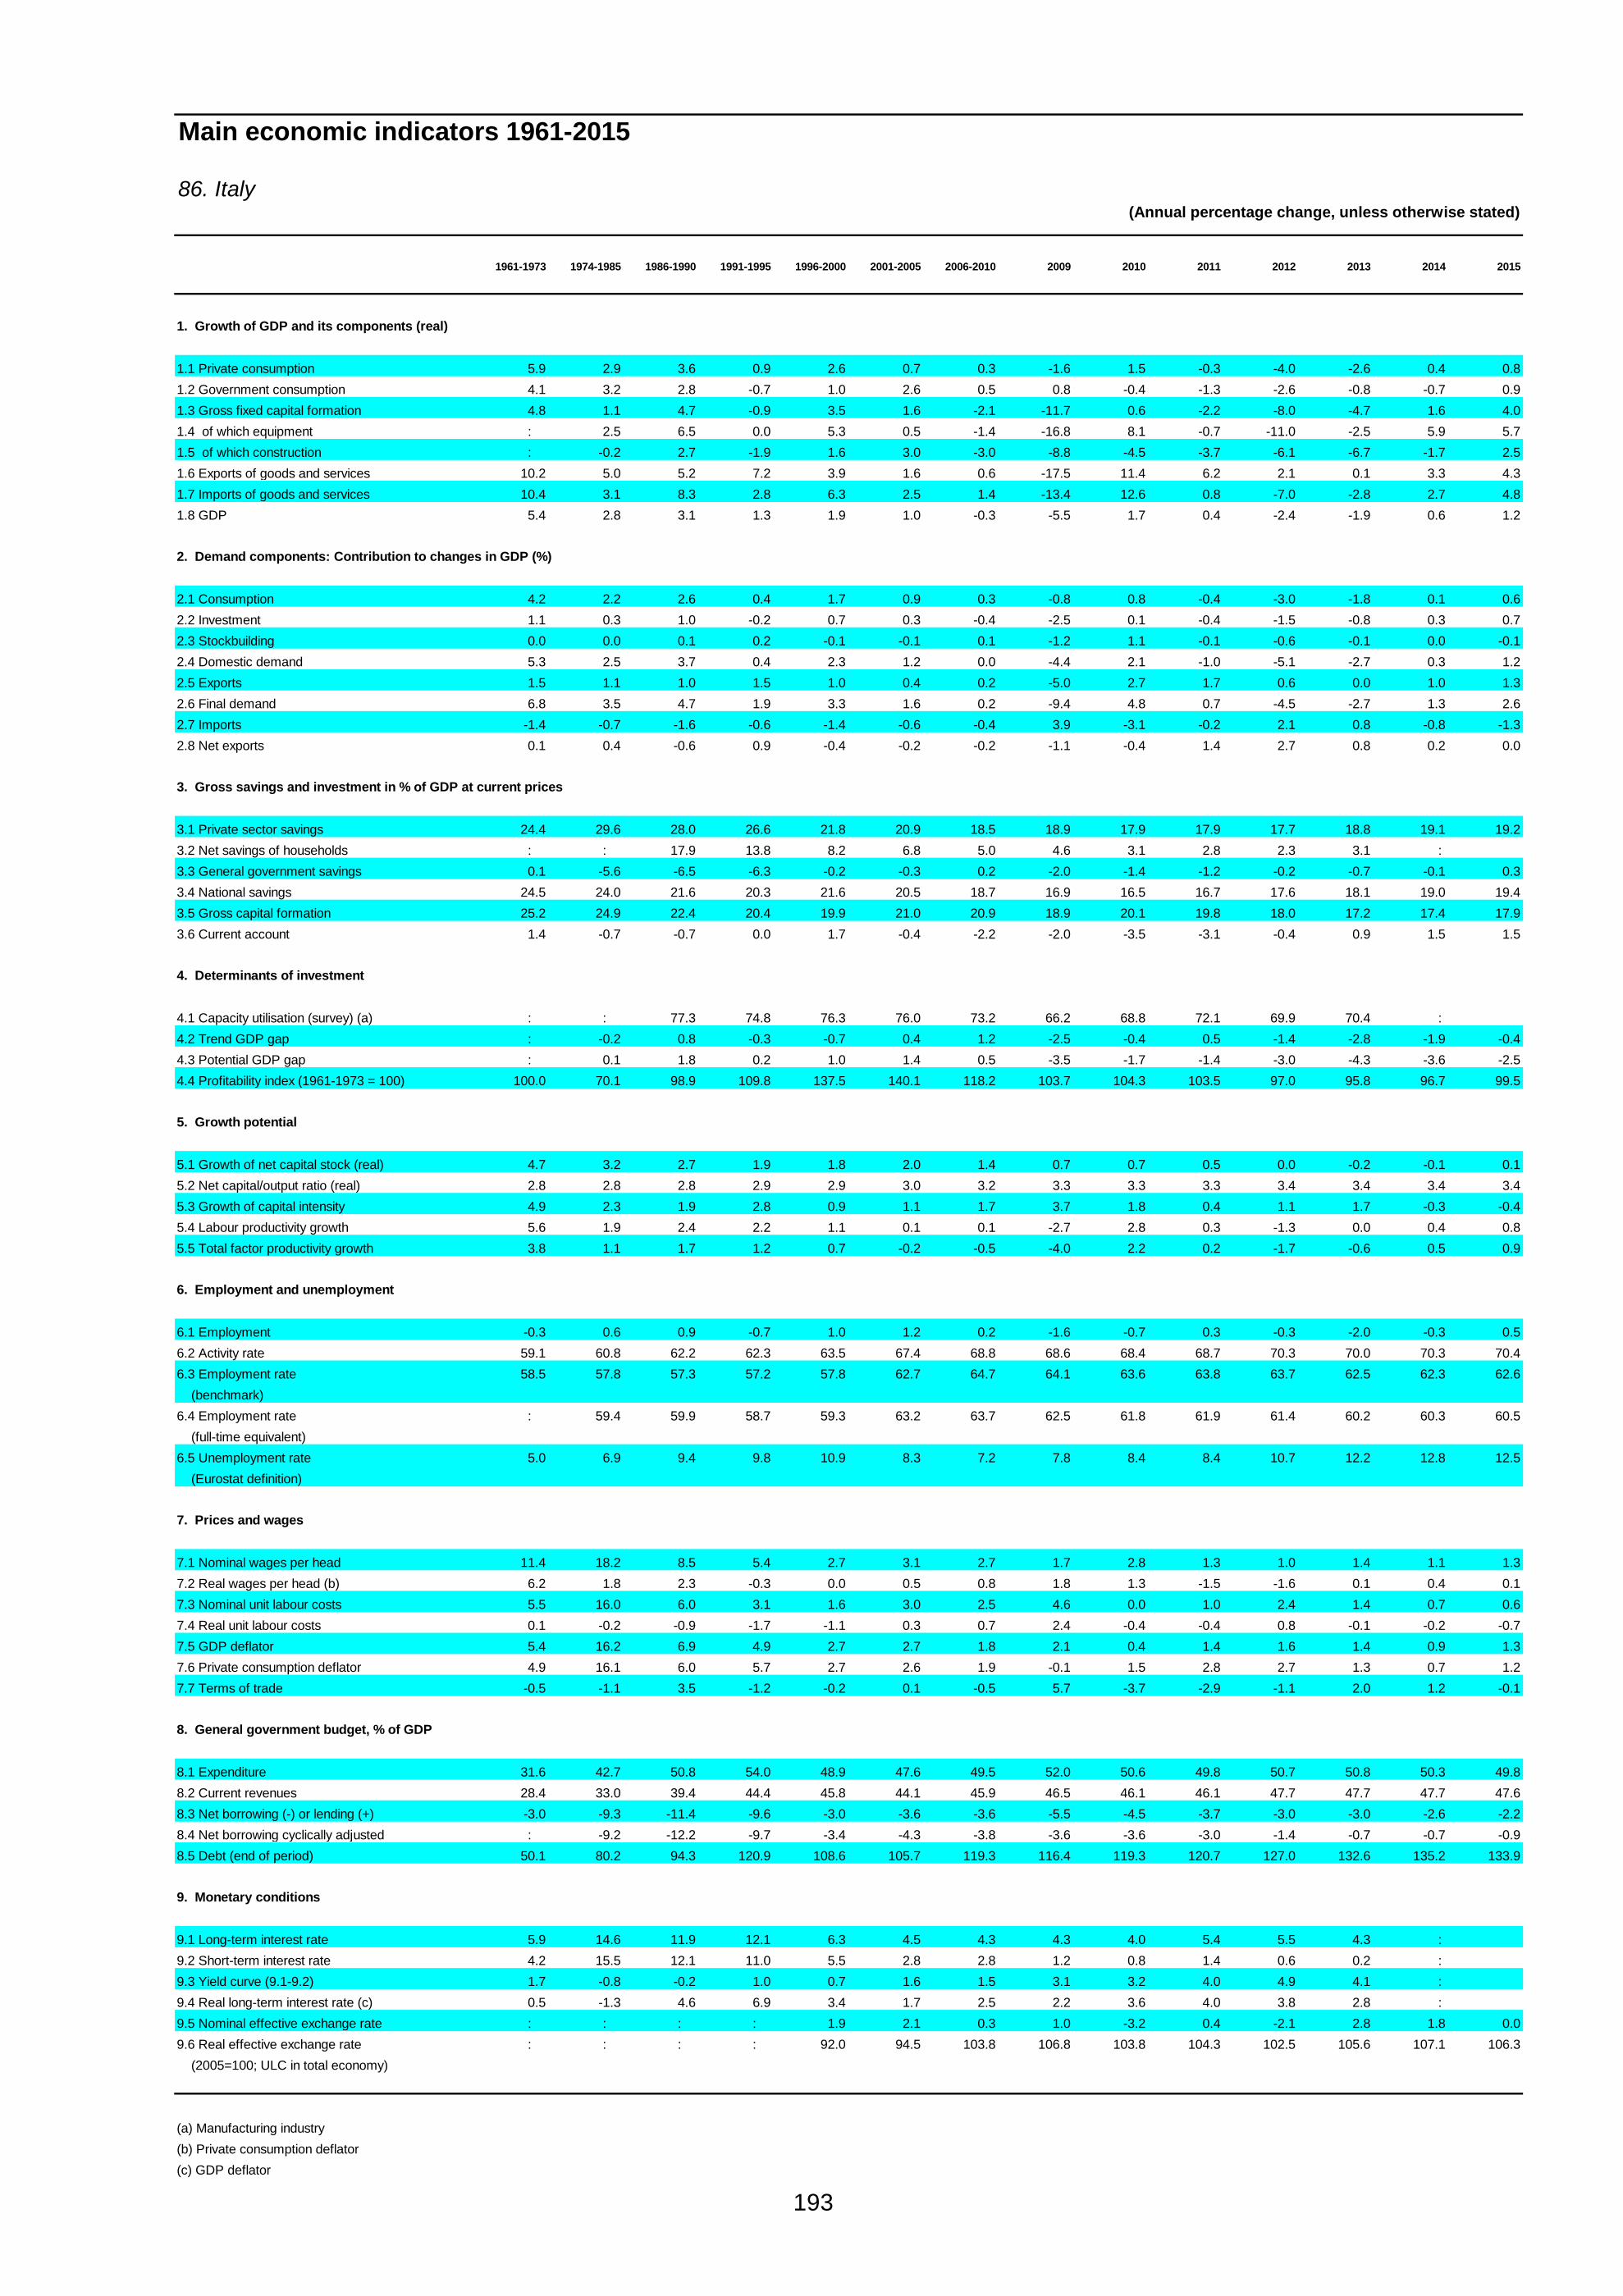
193
Main economic indicators 1961-2015
86. Italy(Annual percentage change, unless otherwise stated)
1961-1973 1974-1985 1986-1990 1991-1995 1996-2000 2001-2005 2006-2010 2009 2010 2011 2012 2013 2014 2015
1. Growth of GDP and its components (real)
1.1 Private consumption 5.9 2.9 3.6 0.9 2.6 0.7 0.3 -1.6 1.5 -0.3 -4.0 -2.6 0.4 0.81.2 Government consumption 4.1 3.2 2.8 -0.7 1.0 2.6 0.5 0.8 -0.4 -1.3 -2.6 -0.8 -0.7 0.91.3 Gross fixed capital formation 4.8 1.1 4.7 -0.9 3.5 1.6 -2.1 -11.7 0.6 -2.2 -8.0 -4.7 1.6 4.01.4 of which equipment : 2.5 6.5 0.0 5.3 0.5 -1.4 -16.8 8.1 -0.7 -11.0 -2.5 5.9 5.71.5 of which construction : -0.2 2.7 -1.9 1.6 3.0 -3.0 -8.8 -4.5 -3.7 -6.1 -6.7 -1.7 2.51.6 Exports of goods and services 10.2 5.0 5.2 7.2 3.9 1.6 0.6 -17.5 11.4 6.2 2.1 0.1 3.3 4.31.7 Imports of goods and services 10.4 3.1 8.3 2.8 6.3 2.5 1.4 -13.4 12.6 0.8 -7.0 -2.8 2.7 4.81.8 GDP 5.4 2.8 3.1 1.3 1.9 1.0 -0.3 -5.5 1.7 0.4 -2.4 -1.9 0.6 1.2
2. Demand components: Contribution to changes in GDP (%)
2.1 Consumption 4.2 2.2 2.6 0.4 1.7 0.9 0.3 -0.8 0.8 -0.4 -3.0 -1.8 0.1 0.62.2 Investment 1.1 0.3 1.0 -0.2 0.7 0.3 -0.4 -2.5 0.1 -0.4 -1.5 -0.8 0.3 0.72.3 Stockbuilding 0.0 0.0 0.1 0.2 -0.1 -0.1 0.1 -1.2 1.1 -0.1 -0.6 -0.1 0.0 -0.12.4 Domestic demand 5.3 2.5 3.7 0.4 2.3 1.2 0.0 -4.4 2.1 -1.0 -5.1 -2.7 0.3 1.22.5 Exports 1.5 1.1 1.0 1.5 1.0 0.4 0.2 -5.0 2.7 1.7 0.6 0.0 1.0 1.32.6 Final demand 6.8 3.5 4.7 1.9 3.3 1.6 0.2 -9.4 4.8 0.7 -4.5 -2.7 1.3 2.62.7 Imports -1.4 -0.7 -1.6 -0.6 -1.4 -0.6 -0.4 3.9 -3.1 -0.2 2.1 0.8 -0.8 -1.32.8 Net exports 0.1 0.4 -0.6 0.9 -0.4 -0.2 -0.2 -1.1 -0.4 1.4 2.7 0.8 0.2 0.0
3. Gross savings and investment in % of GDP at current prices
3.1 Private sector savings 24.4 29.6 28.0 26.6 21.8 20.9 18.5 18.9 17.9 17.9 17.7 18.8 19.1 19.23.2 Net savings of households : : 17.9 13.8 8.2 6.8 5.0 4.6 3.1 2.8 2.3 3.1 : 3.3 General government savings 0.1 -5.6 -6.5 -6.3 -0.2 -0.3 0.2 -2.0 -1.4 -1.2 -0.2 -0.7 -0.1 0.33.4 National savings 24.5 24.0 21.6 20.3 21.6 20.5 18.7 16.9 16.5 16.7 17.6 18.1 19.0 19.43.5 Gross capital formation 25.2 24.9 22.4 20.4 19.9 21.0 20.9 18.9 20.1 19.8 18.0 17.2 17.4 17.93.6 Current account 1.4 -0.7 -0.7 0.0 1.7 -0.4 -2.2 -2.0 -3.5 -3.1 -0.4 0.9 1.5 1.5
4. Determinants of investment
4.1 Capacity utilisation (survey) (a) : : 77.3 74.8 76.3 76.0 73.2 66.2 68.8 72.1 69.9 70.4 : 4.2 Trend GDP gap : -0.2 0.8 -0.3 -0.7 0.4 1.2 -2.5 -0.4 0.5 -1.4 -2.8 -1.9 -0.44.3 Potential GDP gap : 0.1 1.8 0.2 1.0 1.4 0.5 -3.5 -1.7 -1.4 -3.0 -4.3 -3.6 -2.54.4 Profitability index (1961-1973 = 100) 100.0 70.1 98.9 109.8 137.5 140.1 118.2 103.7 104.3 103.5 97.0 95.8 96.7 99.5
5. Growth potential
5.1 Growth of net capital stock (real) 4.7 3.2 2.7 1.9 1.8 2.0 1.4 0.7 0.7 0.5 0.0 -0.2 -0.1 0.15.2 Net capital/output ratio (real) 2.8 2.8 2.8 2.9 2.9 3.0 3.2 3.3 3.3 3.3 3.4 3.4 3.4 3.45.3 Growth of capital intensity 4.9 2.3 1.9 2.8 0.9 1.1 1.7 3.7 1.8 0.4 1.1 1.7 -0.3 -0.45.4 Labour productivity growth 5.6 1.9 2.4 2.2 1.1 0.1 0.1 -2.7 2.8 0.3 -1.3 0.0 0.4 0.85.5 Total factor productivity growth 3.8 1.1 1.7 1.2 0.7 -0.2 -0.5 -4.0 2.2 0.2 -1.7 -0.6 0.5 0.9
6. Employment and unemployment
6.1 Employment -0.3 0.6 0.9 -0.7 1.0 1.2 0.2 -1.6 -0.7 0.3 -0.3 -2.0 -0.3 0.56.2 Activity rate 59.1 60.8 62.2 62.3 63.5 67.4 68.8 68.6 68.4 68.7 70.3 70.0 70.3 70.46.3 Employment rate 58.5 57.8 57.3 57.2 57.8 62.7 64.7 64.1 63.6 63.8 63.7 62.5 62.3 62.6 (benchmark) 6.4 Employment rate : 59.4 59.9 58.7 59.3 63.2 63.7 62.5 61.8 61.9 61.4 60.2 60.3 60.5 (full-time equivalent) 6.5 Unemployment rate 5.0 6.9 9.4 9.8 10.9 8.3 7.2 7.8 8.4 8.4 10.7 12.2 12.8 12.5 (Eurostat definition)
7. Prices and wages
7.1 Nominal wages per head 11.4 18.2 8.5 5.4 2.7 3.1 2.7 1.7 2.8 1.3 1.0 1.4 1.1 1.37.2 Real wages per head (b) 6.2 1.8 2.3 -0.3 0.0 0.5 0.8 1.8 1.3 -1.5 -1.6 0.1 0.4 0.17.3 Nominal unit labour costs 5.5 16.0 6.0 3.1 1.6 3.0 2.5 4.6 0.0 1.0 2.4 1.4 0.7 0.67.4 Real unit labour costs 0.1 -0.2 -0.9 -1.7 -1.1 0.3 0.7 2.4 -0.4 -0.4 0.8 -0.1 -0.2 -0.77.5 GDP deflator 5.4 16.2 6.9 4.9 2.7 2.7 1.8 2.1 0.4 1.4 1.6 1.4 0.9 1.37.6 Private consumption deflator 4.9 16.1 6.0 5.7 2.7 2.6 1.9 -0.1 1.5 2.8 2.7 1.3 0.7 1.27.7 Terms of trade -0.5 -1.1 3.5 -1.2 -0.2 0.1 -0.5 5.7 -3.7 -2.9 -1.1 2.0 1.2 -0.1
8. General government budget, % of GDP
8.1 Expenditure 31.6 42.7 50.8 54.0 48.9 47.6 49.5 52.0 50.6 49.8 50.7 50.8 50.3 49.88.2 Current revenues 28.4 33.0 39.4 44.4 45.8 44.1 45.9 46.5 46.1 46.1 47.7 47.7 47.7 47.68.3 Net borrowing (-) or lending (+) -3.0 -9.3 -11.4 -9.6 -3.0 -3.6 -3.6 -5.5 -4.5 -3.7 -3.0 -3.0 -2.6 -2.28.4 Net borrowing cyclically adjusted : -9.2 -12.2 -9.7 -3.4 -4.3 -3.8 -3.6 -3.6 -3.0 -1.4 -0.7 -0.7 -0.98.5 Debt (end of period) 50.1 80.2 94.3 120.9 108.6 105.7 119.3 116.4 119.3 120.7 127.0 132.6 135.2 133.9
9. Monetary conditions
9.1 Long-term interest rate 5.9 14.6 11.9 12.1 6.3 4.5 4.3 4.3 4.0 5.4 5.5 4.3 : 9.2 Short-term interest rate 4.2 15.5 12.1 11.0 5.5 2.8 2.8 1.2 0.8 1.4 0.6 0.2 : 9.3 Yield curve (9.1-9.2) 1.7 -0.8 -0.2 1.0 0.7 1.6 1.5 3.1 3.2 4.0 4.9 4.1 : 9.4 Real long-term interest rate (c) 0.5 -1.3 4.6 6.9 3.4 1.7 2.5 2.2 3.6 4.0 3.8 2.8 : 9.5 Nominal effective exchange rate : : : : 1.9 2.1 0.3 1.0 -3.2 0.4 -2.1 2.8 1.8 0.09.6 Real effective exchange rate : : : : 92.0 94.5 103.8 106.8 103.8 104.3 102.5 105.6 107.1 106.3 (2005=100; ULC in total economy)
(a) Manufacturing industry (b) Private consumption deflator (c) GDP deflator

194
Main economic indicators 1961-2015
87. Cyprus(Annual percentage change, unless otherwise stated)
2002 2003 2004 2005 2006 2007 2008 2009 2010 2011 2012 2013 2014 2015
1. Growth of GDP and its components (real)
1.1 Private consumption 1.7 2.4 6.5 3.5 4.7 10.2 7.8 -7.5 1.5 1.3 -2.0 -5.7 -6.3 0.71.2 Government consumption 6.6 6.0 -5.5 3.4 7.0 1.3 6.1 6.8 1.0 -0.2 -3.8 -5.0 -1.5 -2.71.3 Gross fixed capital formation 8.6 2.4 11.6 4.1 10.2 13.4 6.0 -9.7 -4.9 -8.7 -18.3 -21.6 -18.1 1.31.4 of which equipment 14.3 -11.1 11.6 -4.7 15.7 11.3 13.4 -2.1 -6.9 -10.5 -16.2 -5.7 -14.0 3.01.5 of which construction 6.1 9.6 9.9 8.1 8.0 14.1 3.1 -14.1 -4.8 -7.9 -20.3 -31.0 -13.8 1.51.6 Exports of goods and services -4.9 -0.4 5.5 4.9 3.6 6.2 -0.5 -10.7 3.8 4.4 -2.5 -4.2 -2.7 1.81.7 Imports of goods and services -0.2 -0.3 10.3 3.7 6.8 13.4 8.5 -18.6 4.8 -0.2 -5.4 -14.1 -7.2 0.21.8 GDP 2.1 1.9 4.2 3.9 4.1 5.1 3.6 -1.9 1.3 0.4 -2.4 -5.4 -4.8 0.9
2. Demand components: Contribution to changes in GDP (%)
2.1 Consumption 2.2 2.7 3.1 2.8 4.3 6.9 6.3 -4.0 1.2 0.8 -2.1 -4.9 -4.7 0.02.2 Investment 1.5 0.4 2.1 0.8 2.0 2.8 1.3 -2.2 -1.0 -1.7 -3.0 -3.0 -2.1 0.12.3 Stockbuilding 0.8 -1.2 1.4 -0.2 -0.4 -0.5 0.9 -1.6 1.8 -0.7 1.2 -2.2 0.0 0.02.4 Domestic demand 4.5 1.9 6.6 3.4 5.9 9.1 8.6 -7.8 2.0 -1.5 -3.9 -10.1 -6.7 0.12.5 Exports -2.8 -0.2 2.6 2.4 1.7 3.0 -0.2 -4.9 1.6 1.8 -1.1 -1.8 -1.2 0.92.6 Final demand 1.8 1.7 9.2 5.8 7.6 12.1 8.3 -12.7 3.6 0.3 -5.0 -12.0 -8.0 1.02.7 Imports 0.1 0.1 -5.0 -1.9 -3.5 -6.9 -4.6 10.6 -2.2 0.1 2.6 6.6 3.1 -0.12.8 Net exports -2.7 -0.1 -2.4 0.5 -1.7 -4.0 -4.9 5.7 -0.7 1.9 1.5 4.8 1.9 0.8
3. Gross savings and investment in % of GDP at current prices
3.1 Private sector savings 15.7 17.3 14.8 13.4 10.8 2.5 6.3 9.3 10.7 14.9 10.8 10.9 12.0 12.83.2 Net savings of households 12.8 7.4 4.9 5.7 6.1 2.6 4.2 13.2 11.2 7.4 5.1 : : 3.3 General government savings -0.9 -2.6 -0.7 0.2 2.5 7.4 4.9 -0.7 -0.1 -1.9 -2.7 -1.8 -3.0 -3.33.4 National savings 14.8 14.8 14.1 13.6 13.4 10.0 11.1 8.6 10.6 13.1 8.2 9.1 8.9 9.53.5 Gross capital formation 18.5 17.0 19.8 19.8 20.6 21.6 23.3 19.4 19.8 16.6 15.2 10.5 9.0 9.23.6 Current account -3.7 -2.3 -5.7 -6.1 -7.2 -11.6 -12.2 -10.7 -9.2 -3.5 -7.0 -1.4 0.0 0.4
4. Determinants of investment
4.1 Capacity utilisation (survey) (a) : : : : : : 71.1 65.2 62.7 61.3 56.8 49.6 : 4.2 Trend GDP gap -0.9 -2.5 -1.5 -0.7 0.8 3.7 5.8 2.8 3.8 4.4 2.6 -2.0 -5.6 -3.54.3 Potential GDP gap 0.4 -1.0 -0.4 0.2 1.1 3.0 3.8 0.4 0.6 0.6 -0.6 -4.1 -6.6 -4.14.4 Profitability index (1961-1973 = 100) : : : : : : : : : : : : :
5. Growth potential
5.1 Growth of net capital stock (real) 3.8 3.6 4.3 4.3 4.8 5.7 5.8 4.3 3.6 2.5 1.1 -0.3 -1.1 -1.05.2 Net capital/output ratio (real) 2.2 2.2 2.2 2.2 2.3 2.3 2.3 2.5 2.5 2.6 2.7 2.8 2.9 2.95.3 Growth of capital intensity 1.6 0.0 0.3 0.7 2.9 2.2 3.7 4.7 3.8 2.0 5.5 5.2 3.5 -1.85.4 Labour productivity growth 0.0 -1.7 0.3 0.3 2.3 1.6 1.5 -1.4 1.5 0.0 1.8 -0.2 -0.4 0.15.5 Total factor productivity growth -0.7 -1.7 0.1 0.0 1.0 0.7 -0.1 -3.4 -0.2 -0.9 -0.6 -2.4 -1.9 0.9
6. Employment and unemployment
6.1 Employment 2.1 3.6 4.0 3.5 1.8 3.4 2.0 -0.4 -0.2 0.5 -4.2 -5.2 -4.4 0.86.2 Activity rate 72.1 73.7 75.4 77.0 76.2 76.1 75.0 73.5 71.9 71.5 70.6 69.8 68.8 68.56.3 Employment rate 69.6 70.8 72.1 73.2 72.9 73.3 72.3 69.7 67.4 65.8 62.1 58.2 55.1 55.4 (benchmark) 6.4 Employment rate : : : : : : : : : : : : : (full-time equivalent) 6.5 Unemployment rate 3.5 4.1 4.6 5.3 4.6 3.9 3.7 5.4 6.3 7.9 11.9 15.9 19.2 18.4 (Eurostat definition)
7. Prices and wages
7.1 Nominal wages per head 4.8 7.9 2.2 2.0 3.2 2.8 3.4 2.6 2.6 2.5 -0.9 -6.0 -3.0 0.97.2 Real wages per head (b) 2.5 4.2 0.4 -1.4 0.4 -0.5 -1.0 1.8 0.4 -0.8 -3.5 -5.6 -3.6 -0.67.3 Nominal unit labour costs 4.8 9.7 1.9 1.7 0.9 1.2 1.8 4.1 1.1 2.5 -2.7 -5.8 -2.6 0.87.4 Real unit labour costs 3.6 4.7 -1.4 -1.3 -2.4 -3.1 -2.7 4.0 -0.9 0.2 -4.2 -4.3 -3.1 -0.87.5 GDP deflator 1.1 4.8 3.3 3.0 3.4 4.4 4.6 0.1 1.9 2.3 1.6 -1.5 0.6 1.57.6 Private consumption deflator 2.2 3.6 1.8 3.4 2.8 3.3 4.4 0.7 2.1 3.3 2.6 -0.3 0.6 1.57.7 Terms of trade -1.9 0.6 2.0 -1.3 0.7 1.8 -0.8 -0.5 0.1 -0.2 -0.6 -0.5 0.0 -0.1
8. General government budget, % of GDP
8.1 Expenditure 40.0 44.6 42.4 43.1 42.6 41.3 42.1 46.2 46.2 46.3 45.8 45.8 47.1 46.18.2 Current revenues 35.6 38.0 38.3 40.7 41.4 44.8 43.1 40.1 40.9 39.9 39.4 40.3 41.3 40.08.3 Net borrowing (-) or lending (+) -4.4 -6.6 -4.1 -2.4 -1.2 3.5 0.9 -6.1 -5.3 -6.3 -6.4 -5.4 -5.8 -6.08.4 Net borrowing cyclically adjusted -4.6 -6.1 -3.9 -2.5 -1.7 2.2 -0.7 -6.3 -5.6 -6.6 -6.1 -3.7 -2.9 -4.38.5 Debt (end of period) 65.1 69.7 70.9 69.4 64.7 58.8 48.9 58.5 61.3 71.5 86.6 111.7 122.2 126.4
9. Monetary conditions
9.1 Long-term interest rate 5.7 4.7 5.8 5.2 4.1 4.5 4.6 4.6 4.6 5.8 7.0 11.1 : 9.2 Short-term interest rate 4.4 3.9 4.7 4.3 3.4 4.2 4.6 1.2 0.8 1.4 0.6 0.2 : 9.3 Yield curve (9.1-9.2) 1.3 0.8 1.1 0.9 0.8 0.3 0.0 3.4 3.8 4.4 6.4 10.8 : 9.4 Real long-term interest rate (c) 4.5 -0.1 2.4 2.0 0.7 0.1 0.0 4.5 2.6 3.5 5.3 12.8 : 9.5 Nominal effective exchange rate 2.0 4.1 0.8 0.7 0.6 -0.3 2.8 1.8 -2.5 0.2 -2.0 2.5 1.2 0.09.6 Real effective exchange rate 87.4 97.8 99.2 100.0 100.0 98.7 99.0 100.4 99.1 101.4 96.1 93.1 91.4 91.3 (2005=100; ULC in total economy)
(a) Manufacturing industry (b) Private consumption deflator (c) GDP deflator

195
Main economic indicators 1961-2015
88. Latvia(Annual percentage change, unless otherwise stated)
2002 2003 2004 2005 2006 2007 2008 2009 2010 2011 2012 2013 2014 2015
1. Growth of GDP and its components (real)
1.1 Private consumption 8.0 6.8 9.5 11.7 21.3 14.0 -5.8 -22.6 2.3 4.8 5.8 5.4 4.8 5.11.2 Government consumption 3.3 2.0 2.2 2.7 4.4 4.9 1.6 -9.4 -7.9 1.1 -0.2 3.6 2.0 2.01.3 Gross fixed capital formation 12.9 12.3 23.7 23.5 16.3 7.9 -13.8 -37.4 -18.1 27.9 8.7 -4.3 3.2 6.81.4 of which equipment : : : : : : : : : : : : : 1.5 of which construction : : : : : : : : : : : : : 1.6 Exports of goods and services 5.4 5.2 9.4 20.3 6.4 11.6 2.4 -13.1 12.5 12.4 9.4 1.0 3.6 5.61.7 Imports of goods and services 4.7 12.9 16.9 14.4 19.6 16.4 -10.2 -31.7 11.8 22.3 4.5 -1.7 3.9 6.81.8 GDP 7.1 7.7 8.8 10.1 11.0 10.0 -2.8 -17.7 -1.3 5.3 5.2 4.1 3.8 4.1
2. Demand components: Contribution to changes in GDP (%)
2.1 Consumption 5.7 4.7 6.4 7.9 14.2 10.0 -3.3 -16.0 -0.1 3.3 3.5 3.9 3.3 3.52.2 Investment 3.3 3.0 5.8 6.5 5.1 2.6 -4.7 -11.1 -3.9 5.1 1.9 -1.0 0.7 1.42.3 Stockbuilding -1.7 4.4 1.8 -4.6 0.9 3.1 -2.2 -3.0 2.6 2.6 -2.8 -0.6 0.0 0.02.4 Domestic demand 7.2 12.1 14.1 9.8 20.2 15.7 -10.2 -30.1 -1.4 10.9 2.6 2.4 4.0 5.02.5 Exports 2.3 2.2 4.0 8.9 3.1 5.2 1.0 -5.7 5.5 6.6 5.5 0.6 2.2 3.32.6 Final demand 9.5 14.2 18.1 18.7 23.3 20.9 -9.2 -35.7 4.1 17.6 8.1 3.0 6.2 8.32.7 Imports -2.4 -6.6 -9.2 -8.6 -12.3 -11.0 6.4 18.0 -5.4 -12.3 -2.9 1.1 -2.4 -4.12.8 Net exports -0.1 -4.4 -5.3 0.3 -9.2 -5.7 7.4 12.4 0.1 -5.6 2.6 1.7 -0.2 -0.8
3. Gross savings and investment in % of GDP at current prices
3.1 Private sector savings 18.0 19.1 17.3 17.5 11.1 12.1 17.7 33.5 26.5 22.6 20.5 20.3 19.9 19.53.2 Net savings of households -3.4 -1.8 -0.6 -2.5 -5.2 -5.8 0.9 4.1 0.4 -3.4 -3.4 : : 3.3 General government savings 1.0 1.1 2.7 3.5 5.4 5.5 0.4 -4.4 -3.7 0.2 2.0 1.7 1.4 1.23.4 National savings 19.0 20.2 19.9 21.0 16.5 17.6 18.1 29.1 22.8 22.7 22.5 22.0 21.3 20.73.5 Gross capital formation 25.7 28.4 32.8 33.6 39.1 40.0 31.2 20.5 19.8 24.9 25.0 22.9 22.5 22.73.6 Current account -6.7 -8.2 -12.9 -12.6 -22.6 -22.4 -13.1 8.6 2.9 -2.2 -2.5 -0.8 -1.3 -2.0
4. Determinants of investment
4.1 Capacity utilisation (survey) (a) 69.7 68.8 71.7 72.3 72.7 71.9 66.3 54.0 62.8 67.3 70.9 72.1 : 4.2 Trend GDP gap -3.3 -1.9 0.9 5.7 12.4 19.5 13.2 -8.6 -11.2 -7.8 -4.3 -1.8 0.6 3.44.3 Potential GDP gap -0.2 0.7 2.4 5.0 8.6 11.8 5.3 -12.0 -11.4 -6.3 -2.1 0.0 1.4 2.64.4 Profitability index (1961-1973 = 100) : : : : : : : : : : : : :
5. Growth potential
5.1 Growth of net capital stock (real) 3.6 4.8 7.9 11.6 14.5 16.2 9.9 1.3 0.0 3.0 4.4 3.7 3.8 4.25.2 Net capital/output ratio (real) 1.3 1.3 1.3 1.3 1.3 1.4 1.6 1.9 2.0 1.9 1.9 1.9 1.9 1.95.3 Growth of capital intensity 0.7 2.8 6.7 9.8 9.1 17.8 10.9 18.3 7.2 1.5 2.9 1.4 2.1 2.55.4 Labour productivity growth 4.1 5.6 7.5 8.4 5.8 11.5 -1.9 -3.9 5.7 3.7 3.7 1.8 2.1 2.45.5 Total factor productivity growth 3.7 4.2 4.1 3.4 1.2 2.6 -6.9 -11.7 2.1 3.0 2.2 1.1 1.0 1.2
6. Employment and unemployment
6.1 Employment 2.9 1.9 1.2 1.6 4.9 -1.4 -0.8 -14.3 -6.7 1.5 1.4 2.3 1.6 1.76.2 Activity rate 71.7 73.0 74.4 74.8 77.1 75.4 77.1 75.9 74.7 74.4 75.9 75.4 76.3 77.26.3 Employment rate 63.1 64.8 66.1 67.8 71.9 70.9 71.2 62.6 60.2 62.3 64.5 66.5 68.2 69.8 (benchmark) 6.4 Employment rate : : : : : : : : : : : : : (full-time equivalent) 6.5 Unemployment rate 12.5 11.6 11.7 10.0 7.0 6.1 7.7 17.5 19.5 16.2 15.0 11.9 10.7 9.6 (Eurostat definition)
7. Prices and wages
7.1 Nominal wages per head 2.8 11.0 14.5 25.1 23.2 42.2 17.7 -11.5 -4.9 5.0 7.3 5.4 4.1 4.67.2 Real wages per head (b) 1.2 6.7 6.6 15.1 16.2 29.1 1.3 -14.2 -3.3 0.1 4.1 4.9 2.8 2.17.3 Nominal unit labour costs -1.2 5.2 6.5 15.4 16.5 27.5 20.0 -7.9 -10.1 1.2 3.5 3.5 1.9 2.17.4 Real unit labour costs -4.2 1.3 -0.5 4.7 4.6 6.0 6.8 -6.7 -9.3 -4.6 0.1 2.1 0.2 -0.67.5 GDP deflator 3.1 3.8 7.0 10.2 11.4 20.3 12.4 -1.3 -0.9 6.0 3.3 1.4 1.7 2.77.6 Private consumption deflator 1.6 4.1 7.4 8.7 6.0 10.2 16.2 3.1 -1.7 4.9 3.1 0.5 1.2 2.57.7 Terms of trade -1.5 2.3 2.4 -0.9 -1.1 4.7 -2.0 0.3 0.2 3.2 -2.9 0.4 0.0 0.1
8. General government budget, % of GDP
8.1 Expenditure 36.0 34.9 35.9 35.8 38.3 36.0 39.1 43.7 43.5 38.4 36.4 36.1 35.3 34.38.2 Current revenues 33.7 33.3 34.8 35.4 37.7 35.3 34.7 34.5 35.3 34.9 35.1 35.1 34.3 33.28.3 Net borrowing (-) or lending (+) -2.3 -1.6 -1.1 -0.4 -0.6 -0.7 -4.4 -9.2 -8.2 -3.5 -1.3 -1.0 -1.0 -1.18.4 Net borrowing cyclically adjusted -2.2 -1.8 -1.8 -2.0 -3.3 -4.3 -6.0 -5.4 -4.6 -1.6 -0.7 -1.0 -1.4 -1.98.5 Debt (end of period) 13.6 14.7 15.0 12.5 10.7 9.0 19.8 36.9 44.5 42.0 40.8 38.1 39.5 33.4
9. Monetary conditions
9.1 Long-term interest rate 5.4 4.9 4.9 3.9 4.1 5.3 6.4 12.4 10.3 5.9 4.6 3.3 : 9.2 Short-term interest rate 4.4 3.8 4.2 3.1 4.4 8.7 8.0 13.1 2.0 1.0 0.9 0.4 : 9.3 Yield curve (9.1-9.2) 1.1 1.1 0.6 0.8 -0.3 -3.4 -1.6 -0.7 8.4 5.0 3.7 3.0 : 9.4 Real long-term interest rate (c) 2.2 1.1 -2.0 -5.7 -6.5 -12.5 -5.3 13.8 11.3 -0.1 1.2 1.9 : 9.5 Nominal effective exchange rate -3.0 -5.9 -3.2 -5.0 0.0 -0.1 0.9 2.0 -2.9 0.4 0.1 1.0 1.1 0.09.6 Real effective exchange rate 92.8 90.4 92.5 100.0 114.4 141.6 162.9 147.5 130.7 131.8 133.1 136.5 138.8 139.6 (2005=100; ULC in total economy)
(a) Manufacturing industry (b) Private consumption deflator (c) GDP deflator

196
Main economic indicators 1961-2015
89. Luxembourg(Annual percentage change, unless otherwise stated)
2002 2003 2004 2005 2006 2007 2008 2009 2010 2011 2012 2013 2014 2015
1. Growth of GDP and its components (real)
1.1 Private consumption 4.6 2.6 4.5 2.5 4.2 1.6 1.4 -1.4 2.6 1.3 2.2 1.7 2.4 2.51.2 Government consumption 3.4 2.4 7.0 3.6 4.8 4.6 2.7 4.9 2.5 1.3 4.8 4.5 2.7 2.91.3 Gross fixed capital formation 4.9 -2.7 14.7 3.2 7.4 5.1 0.9 -16.2 -0.7 12.1 3.5 -4.4 0.3 2.71.6 Exports of goods and services 6.3 2.9 7.0 5.8 10.3 5.7 3.7 -12.9 7.2 5.4 -1.9 2.6 3.3 4.71.7 Imports of goods and services 6.4 2.7 6.7 4.4 11.0 5.9 4.3 -15.4 11.4 7.4 -1.0 1.2 3.2 5.11.8 GDP 4.0 1.8 7.5 4.0 6.1 3.6 1.6 -5.6 3.1 1.9 -0.2 2.1 2.6 2.7
2. Demand components: Contribution to changes in GDP (%)
2.1 Consumption 2.9 1.9 3.8 1.9 2.6 1.4 0.9 0.3 1.3 0.7 1.5 1.3 1.2 1.32.2 Investment 1.5 -0.7 2.9 0.8 1.6 1.1 0.2 -3.5 -0.1 2.1 0.6 -0.9 0.1 0.52.3 Stockbuilding -0.4 0.3 0.2 -0.5 0.6 0.0 0.2 -2.2 5.1 0.2 -0.4 -1.1 0.0 0.02.4 Domestic demand 4.0 1.5 7.0 2.2 4.8 2.5 1.4 -5.4 6.3 2.9 1.7 -0.6 1.3 1.72.5 Exports 5.2 2.9 7.4 6.0 12.7 8.2 6.3 -23.5 11.7 9.3 -3.4 4.6 5.8 8.22.6 Final demand 9.2 4.4 14.4 8.3 17.5 10.7 7.7 -28.9 18.0 12.2 -1.7 4.0 7.1 9.92.7 Imports -5.1 -2.6 -6.9 -4.3 -11.4 -7.2 -6.0 23.3 -14.9 -10.3 1.5 -1.9 -4.5 -7.22.8 Net exports 0.1 0.3 0.5 1.8 1.4 1.1 0.3 -0.2 -3.2 -1.0 -1.9 2.7 1.3 1.0
3. Gross savings and investment in % of GDP at current prices
3.1 Private sector savings 30.1 32.1 : 29.9 24.5 25.8 21.8 19.5 22.9 22.8 22.4 19.5 20.4 20.43.2 Net savings of households : : : : : : 3.2 4.7 4.9 5.0 5.1 : : : 3.3 General government savings 4.4 7.2 : 6.7 8.5 6.9 6.2 4.6 4.6 5.0 4.6 4.2 3.9 2.73.4 National savings 34.5 39.3 40.3 36.7 33.0 32.7 28.0 24.1 27.5 27.8 27.1 23.7 24.3 23.13.5 Gross capital formation 22.1 18.9 22.5 22.0 22.5 22.5 19.9 16.8 19.8 21.1 21.3 18.5 17.9 18.13.6 Current account 7.9 16.1 15.7 13.0 10.5 10.2 8.2 7.3 7.7 6.6 5.8 5.2 6.4 5.0
4. Determinants of investment
4.1 Capacity utilisation (survey) (a) : : 81.5 79.6 83.2 83.3 79.9 66.2 78.9 82.3 75.8 65.5 : : 4.2 Trend GDP gap : -1.0 1.1 2.2 -1.9 0.5 2.0 -3.2 -1.8 -1.4 -2.9 -2.3 -1.2 0.04.3 Potential GDP gap : : 0.8 0.6 0.5 1.1 0.0 -5.0 -2.4 -1.8 -3.6 -2.8 -1.6 -0.34.4 Profitability index (1961-1973 = 100) 100.0 85.7 124.8 140.1 150.7 160.1 174.5 131.2 157.7 167.4 156.4 161.6 166.3 161.2
5. Growth potential
5.1 Growth of net capital stock (real) 1.6 1.7 3.2 3.8 4.4 5.6 4.3 2.5 2.0 3.5 3.7 2.8 2.5 2.65.2 Net capital/output ratio (real) 2.7 2.3 1.9 1.8 1.7 1.8 1.9 2.1 2.1 2.1 2.2 2.2 2.2 2.25.3 Growth of capital intensity 0.5 1.3 0.1 1.0 0.3 2.4 1.1 1.6 0.2 0.5 1.2 1.0 0.6 0.45.4 Labour productivity growth 3.0 1.3 4.2 1.2 1.9 0.4 -1.5 -6.4 1.3 -1.0 -2.6 0.4 0.6 0.65.5 Total factor productivity growth 2.7 0.7 4.2 0.7 1.8 -0.7 -2.0 -7.1 1.2 -1.3 -3.1 -0.1 0.3 0.4
6. Employment and unemployment
6.1 Employment 1.1 0.5 3.1 2.8 4.1 3.1 3.1 0.9 1.8 3.0 2.5 1.7 2.0 2.16.2 Activity rate 61.7 62.6 62.0 62.7 63.4 66.1 66.4 66.7 66.0 66.0 66.3 66.3 66.2 66.46.3 Employment rate 63.6 64.3 67.4 75.6 84.2 96.3 103.0 103.9 103.6 103.8 103.5 102.8 102.7 103.2 (benchmark) 6.4 Employment rate : : : : : : : : : : : : : : (full-time equivalent) 6.5 Unemployment rate 0.0 1.7 2.1 2.5 2.6 3.6 4.7 5.1 4.6 4.8 5.1 5.8 5.7 5.5 (Eurostat definition)
7. Prices and wages
7.1 Nominal wages per head 7.4 9.2 5.1 4.6 2.9 3.1 2.8 1.8 2.6 2.4 2.0 3.1 2.0 2.77.2 Real wages per head (b) 4.2 1.7 3.0 1.3 0.7 1.1 0.7 0.7 1.3 -0.2 0.4 1.6 0.3 0.77.3 Nominal unit labour costs 4.3 7.8 0.9 3.4 1.0 2.7 4.4 8.7 1.4 3.4 4.7 2.7 1.4 2.17.4 Real unit labour costs -0.2 1.1 -0.9 -0.1 -0.6 -0.2 0.6 7.9 -5.4 -0.7 1.6 -1.0 -1.3 1.37.5 GDP deflator 4.4 6.7 1.8 3.5 1.6 2.9 3.7 0.8 7.2 4.2 3.0 3.7 2.8 0.87.6 Private consumption deflator 3.0 7.4 2.1 3.2 2.2 2.0 2.1 1.1 1.4 2.6 1.6 1.6 1.7 1.97.7 Terms of trade 0.1 -1.1 -0.3 0.3 -0.8 0.7 1.0 0.4 2.5 0.6 0.2 1.3 0.7 -0.7
8. General government budget, % of GDP
8.1 Expenditure 25.9 39.5 : 39.4 39.9 41.1 40.5 45.2 43.5 42.6 43.9 43.5 43.1 44.08.2 Current revenues 27.6 41.1 : 40.7 43.4 42.6 41.9 44.5 42.8 42.7 44.0 43.6 42.9 42.68.3 Net borrowing (-) or lending (+) 1.6 1.6 : 1.4 3.5 1.5 1.4 -0.7 -0.8 0.2 0.0 0.1 -0.2 -1.48.4 Net borrowing cyclically adjusted : 2.1 : 1.1 3.4 1.0 1.4 1.7 0.4 1.0 1.7 1.4 0.6 -1.38.5 Debt (end of period) 14.7 10.3 4.7 7.4 6.2 6.1 19.5 15.5 19.5 18.7 21.7 23.1 23.4 25.5
9. Monetary conditions
9.1 Long-term interest rate : 8.1 8.0 7.4 5.4 3.6 4.0 4.2 3.2 2.9 1.8 1.7 : : 9.4 Real long-term interest rate (c) : 1.5 6.1 3.8 3.8 0.7 0.3 3.4 -3.7 -1.2 -1.2 -1.9 : : 9.5 Nominal effective exchange rate : : : : -1.4 0.9 0.4 1.6 -2.0 0.0 -1.5 1.6 0.7 0.09.6 Real effective exchange rate : : : : 94.8 97.6 107.4 114.3 113.9 116.7 117.6 121.0 122.4 123.5
(a) Manufacturing industry (b) Private consumption deflator (c) GDP deflator
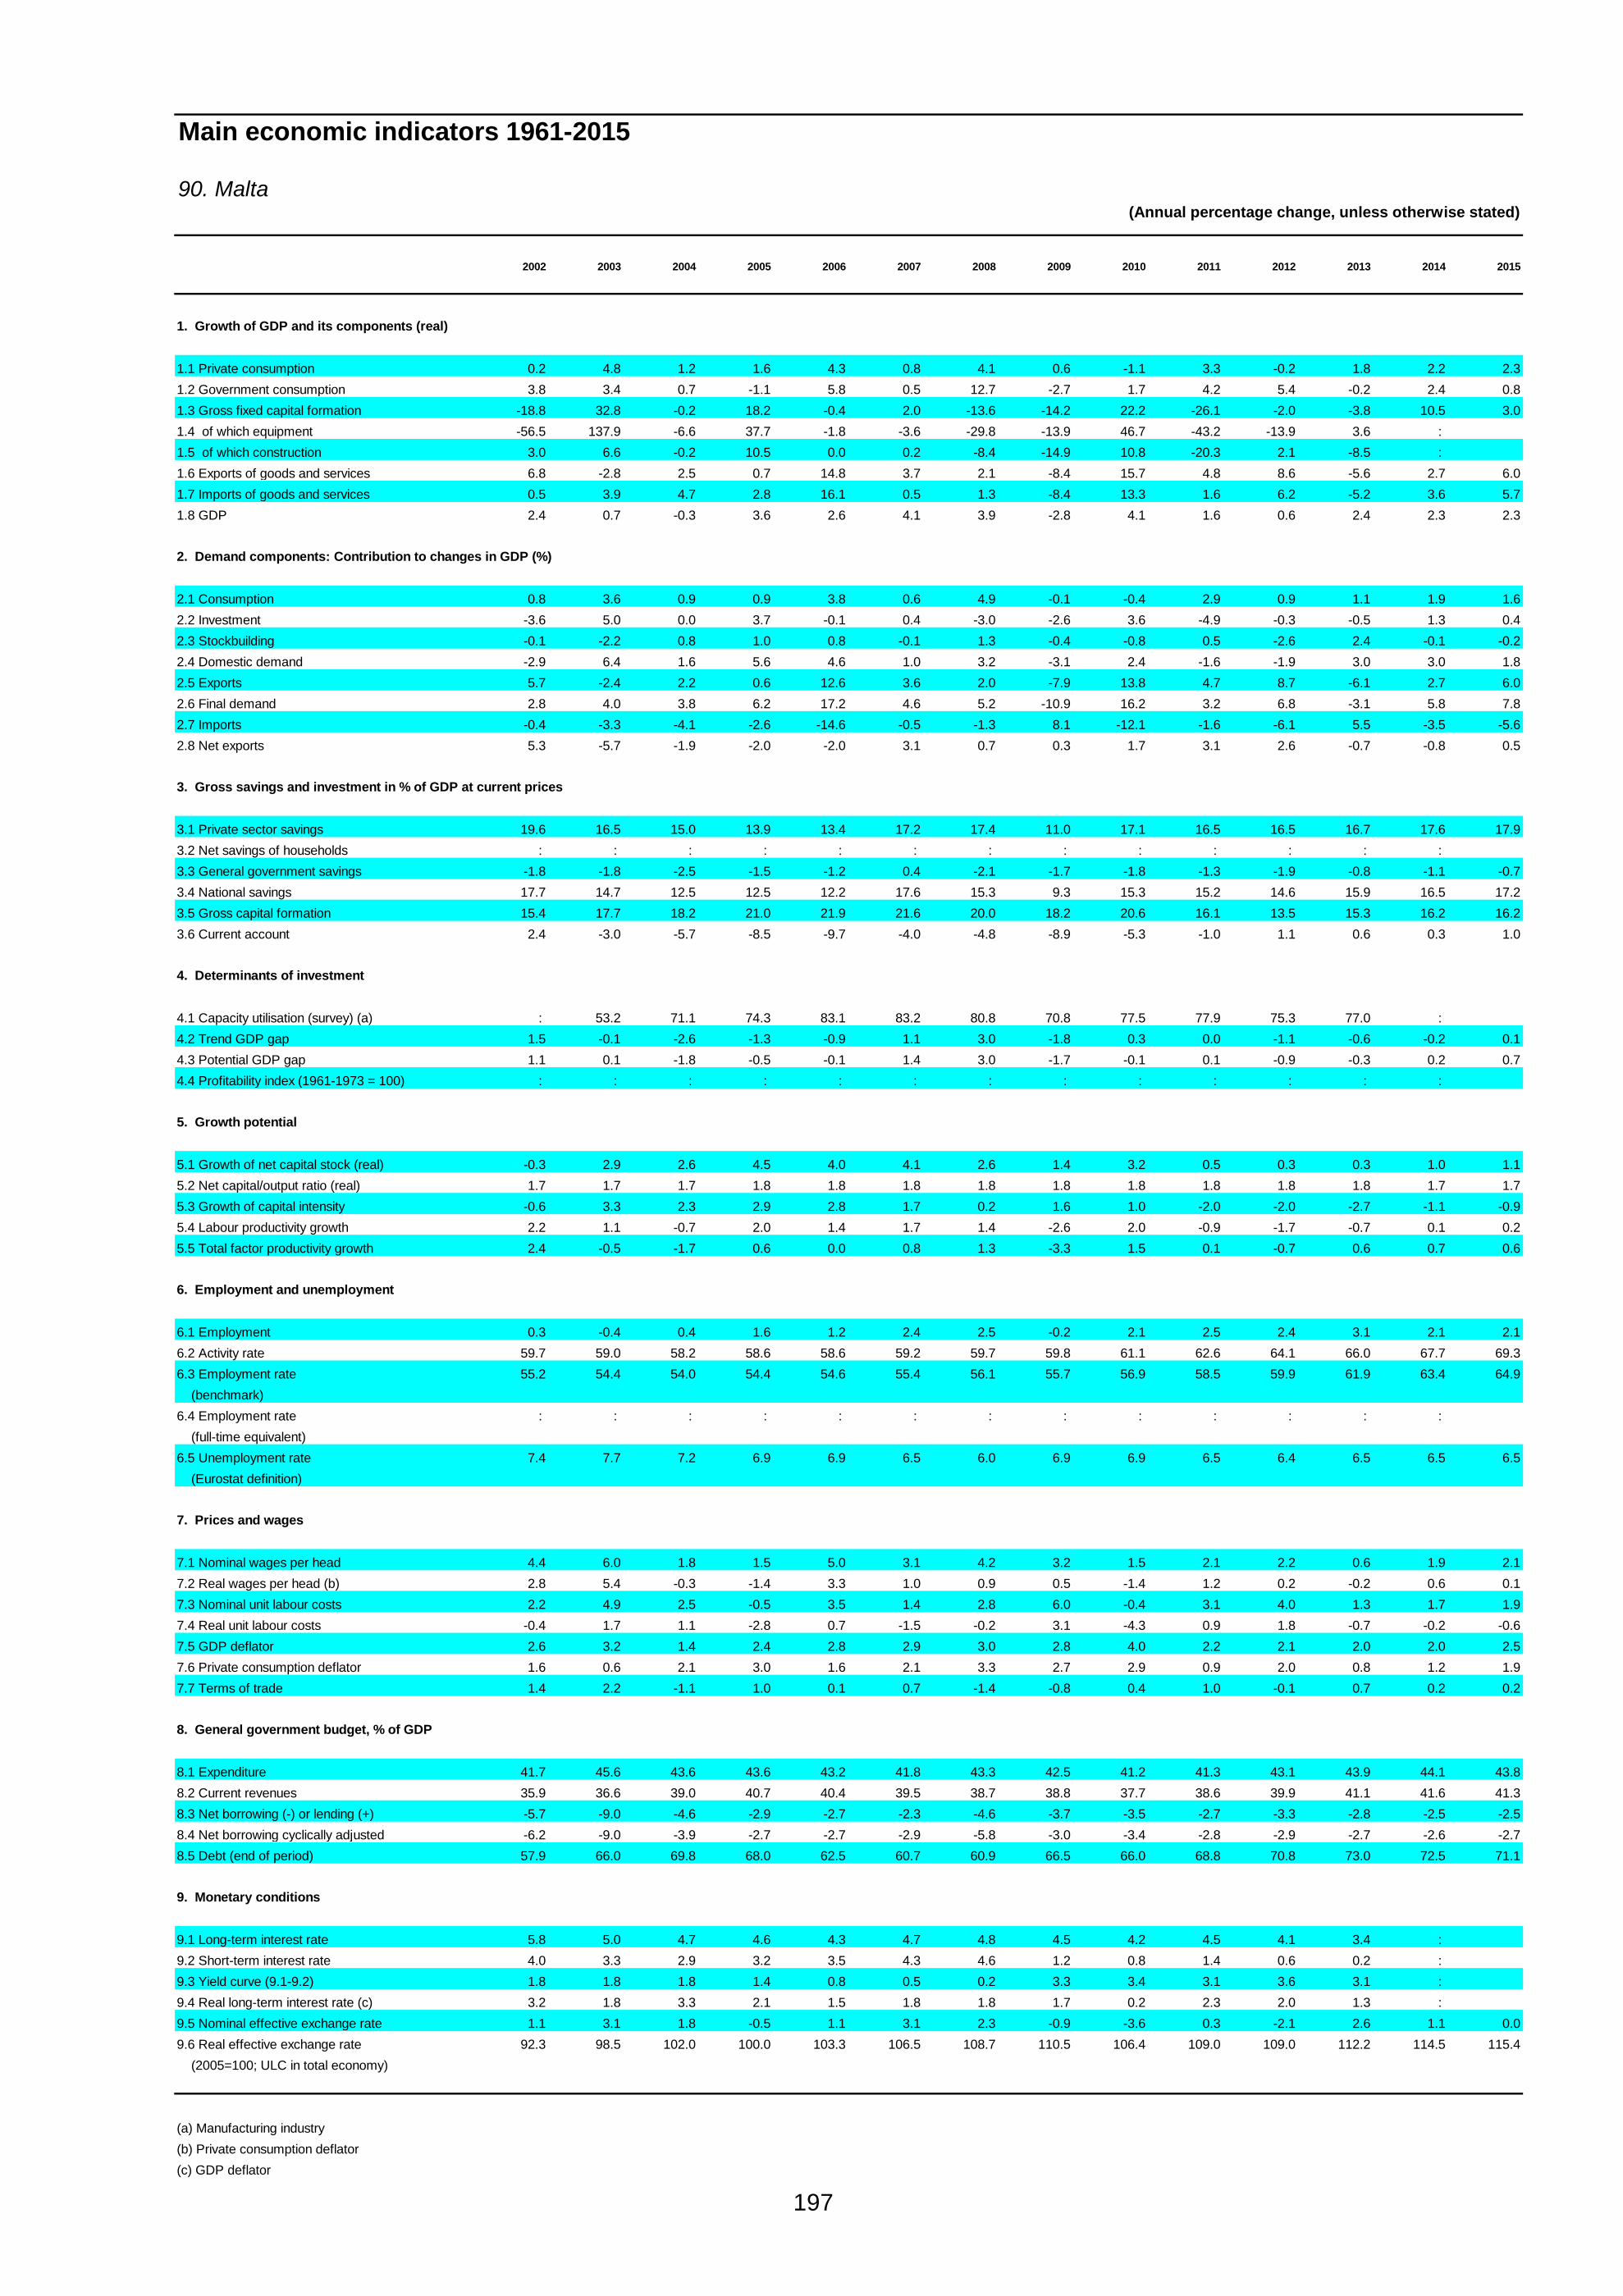
197
Main economic indicators 1961-2015
90. Malta(Annual percentage change, unless otherwise stated)
2002 2003 2004 2005 2006 2007 2008 2009 2010 2011 2012 2013 2014 2015
1. Growth of GDP and its components (real)
1.1 Private consumption 0.2 4.8 1.2 1.6 4.3 0.8 4.1 0.6 -1.1 3.3 -0.2 1.8 2.2 2.31.2 Government consumption 3.8 3.4 0.7 -1.1 5.8 0.5 12.7 -2.7 1.7 4.2 5.4 -0.2 2.4 0.81.3 Gross fixed capital formation -18.8 32.8 -0.2 18.2 -0.4 2.0 -13.6 -14.2 22.2 -26.1 -2.0 -3.8 10.5 3.01.4 of which equipment -56.5 137.9 -6.6 37.7 -1.8 -3.6 -29.8 -13.9 46.7 -43.2 -13.9 3.6 : 1.5 of which construction 3.0 6.6 -0.2 10.5 0.0 0.2 -8.4 -14.9 10.8 -20.3 2.1 -8.5 : 1.6 Exports of goods and services 6.8 -2.8 2.5 0.7 14.8 3.7 2.1 -8.4 15.7 4.8 8.6 -5.6 2.7 6.01.7 Imports of goods and services 0.5 3.9 4.7 2.8 16.1 0.5 1.3 -8.4 13.3 1.6 6.2 -5.2 3.6 5.71.8 GDP 2.4 0.7 -0.3 3.6 2.6 4.1 3.9 -2.8 4.1 1.6 0.6 2.4 2.3 2.3
2. Demand components: Contribution to changes in GDP (%)
2.1 Consumption 0.8 3.6 0.9 0.9 3.8 0.6 4.9 -0.1 -0.4 2.9 0.9 1.1 1.9 1.62.2 Investment -3.6 5.0 0.0 3.7 -0.1 0.4 -3.0 -2.6 3.6 -4.9 -0.3 -0.5 1.3 0.42.3 Stockbuilding -0.1 -2.2 0.8 1.0 0.8 -0.1 1.3 -0.4 -0.8 0.5 -2.6 2.4 -0.1 -0.22.4 Domestic demand -2.9 6.4 1.6 5.6 4.6 1.0 3.2 -3.1 2.4 -1.6 -1.9 3.0 3.0 1.82.5 Exports 5.7 -2.4 2.2 0.6 12.6 3.6 2.0 -7.9 13.8 4.7 8.7 -6.1 2.7 6.02.6 Final demand 2.8 4.0 3.8 6.2 17.2 4.6 5.2 -10.9 16.2 3.2 6.8 -3.1 5.8 7.82.7 Imports -0.4 -3.3 -4.1 -2.6 -14.6 -0.5 -1.3 8.1 -12.1 -1.6 -6.1 5.5 -3.5 -5.62.8 Net exports 5.3 -5.7 -1.9 -2.0 -2.0 3.1 0.7 0.3 1.7 3.1 2.6 -0.7 -0.8 0.5
3. Gross savings and investment in % of GDP at current prices
3.1 Private sector savings 19.6 16.5 15.0 13.9 13.4 17.2 17.4 11.0 17.1 16.5 16.5 16.7 17.6 17.93.2 Net savings of households : : : : : : : : : : : : : 3.3 General government savings -1.8 -1.8 -2.5 -1.5 -1.2 0.4 -2.1 -1.7 -1.8 -1.3 -1.9 -0.8 -1.1 -0.73.4 National savings 17.7 14.7 12.5 12.5 12.2 17.6 15.3 9.3 15.3 15.2 14.6 15.9 16.5 17.23.5 Gross capital formation 15.4 17.7 18.2 21.0 21.9 21.6 20.0 18.2 20.6 16.1 13.5 15.3 16.2 16.23.6 Current account 2.4 -3.0 -5.7 -8.5 -9.7 -4.0 -4.8 -8.9 -5.3 -1.0 1.1 0.6 0.3 1.0
4. Determinants of investment
4.1 Capacity utilisation (survey) (a) : 53.2 71.1 74.3 83.1 83.2 80.8 70.8 77.5 77.9 75.3 77.0 : 4.2 Trend GDP gap 1.5 -0.1 -2.6 -1.3 -0.9 1.1 3.0 -1.8 0.3 0.0 -1.1 -0.6 -0.2 0.14.3 Potential GDP gap 1.1 0.1 -1.8 -0.5 -0.1 1.4 3.0 -1.7 -0.1 0.1 -0.9 -0.3 0.2 0.74.4 Profitability index (1961-1973 = 100) : : : : : : : : : : : : :
5. Growth potential
5.1 Growth of net capital stock (real) -0.3 2.9 2.6 4.5 4.0 4.1 2.6 1.4 3.2 0.5 0.3 0.3 1.0 1.15.2 Net capital/output ratio (real) 1.7 1.7 1.7 1.8 1.8 1.8 1.8 1.8 1.8 1.8 1.8 1.8 1.7 1.75.3 Growth of capital intensity -0.6 3.3 2.3 2.9 2.8 1.7 0.2 1.6 1.0 -2.0 -2.0 -2.7 -1.1 -0.95.4 Labour productivity growth 2.2 1.1 -0.7 2.0 1.4 1.7 1.4 -2.6 2.0 -0.9 -1.7 -0.7 0.1 0.25.5 Total factor productivity growth 2.4 -0.5 -1.7 0.6 0.0 0.8 1.3 -3.3 1.5 0.1 -0.7 0.6 0.7 0.6
6. Employment and unemployment
6.1 Employment 0.3 -0.4 0.4 1.6 1.2 2.4 2.5 -0.2 2.1 2.5 2.4 3.1 2.1 2.16.2 Activity rate 59.7 59.0 58.2 58.6 58.6 59.2 59.7 59.8 61.1 62.6 64.1 66.0 67.7 69.36.3 Employment rate 55.2 54.4 54.0 54.4 54.6 55.4 56.1 55.7 56.9 58.5 59.9 61.9 63.4 64.9 (benchmark) 6.4 Employment rate : : : : : : : : : : : : : (full-time equivalent) 6.5 Unemployment rate 7.4 7.7 7.2 6.9 6.9 6.5 6.0 6.9 6.9 6.5 6.4 6.5 6.5 6.5 (Eurostat definition)
7. Prices and wages
7.1 Nominal wages per head 4.4 6.0 1.8 1.5 5.0 3.1 4.2 3.2 1.5 2.1 2.2 0.6 1.9 2.17.2 Real wages per head (b) 2.8 5.4 -0.3 -1.4 3.3 1.0 0.9 0.5 -1.4 1.2 0.2 -0.2 0.6 0.17.3 Nominal unit labour costs 2.2 4.9 2.5 -0.5 3.5 1.4 2.8 6.0 -0.4 3.1 4.0 1.3 1.7 1.97.4 Real unit labour costs -0.4 1.7 1.1 -2.8 0.7 -1.5 -0.2 3.1 -4.3 0.9 1.8 -0.7 -0.2 -0.67.5 GDP deflator 2.6 3.2 1.4 2.4 2.8 2.9 3.0 2.8 4.0 2.2 2.1 2.0 2.0 2.57.6 Private consumption deflator 1.6 0.6 2.1 3.0 1.6 2.1 3.3 2.7 2.9 0.9 2.0 0.8 1.2 1.97.7 Terms of trade 1.4 2.2 -1.1 1.0 0.1 0.7 -1.4 -0.8 0.4 1.0 -0.1 0.7 0.2 0.2
8. General government budget, % of GDP
8.1 Expenditure 41.7 45.6 43.6 43.6 43.2 41.8 43.3 42.5 41.2 41.3 43.1 43.9 44.1 43.88.2 Current revenues 35.9 36.6 39.0 40.7 40.4 39.5 38.7 38.8 37.7 38.6 39.9 41.1 41.6 41.38.3 Net borrowing (-) or lending (+) -5.7 -9.0 -4.6 -2.9 -2.7 -2.3 -4.6 -3.7 -3.5 -2.7 -3.3 -2.8 -2.5 -2.58.4 Net borrowing cyclically adjusted -6.2 -9.0 -3.9 -2.7 -2.7 -2.9 -5.8 -3.0 -3.4 -2.8 -2.9 -2.7 -2.6 -2.78.5 Debt (end of period) 57.9 66.0 69.8 68.0 62.5 60.7 60.9 66.5 66.0 68.8 70.8 73.0 72.5 71.1
9. Monetary conditions
9.1 Long-term interest rate 5.8 5.0 4.7 4.6 4.3 4.7 4.8 4.5 4.2 4.5 4.1 3.4 : 9.2 Short-term interest rate 4.0 3.3 2.9 3.2 3.5 4.3 4.6 1.2 0.8 1.4 0.6 0.2 : 9.3 Yield curve (9.1-9.2) 1.8 1.8 1.8 1.4 0.8 0.5 0.2 3.3 3.4 3.1 3.6 3.1 : 9.4 Real long-term interest rate (c) 3.2 1.8 3.3 2.1 1.5 1.8 1.8 1.7 0.2 2.3 2.0 1.3 : 9.5 Nominal effective exchange rate 1.1 3.1 1.8 -0.5 1.1 3.1 2.3 -0.9 -3.6 0.3 -2.1 2.6 1.1 0.09.6 Real effective exchange rate 92.3 98.5 102.0 100.0 103.3 106.5 108.7 110.5 106.4 109.0 109.0 112.2 114.5 115.4 (2005=100; ULC in total economy)
(a) Manufacturing industry (b) Private consumption deflator (c) GDP deflator

198
Main economic indicators 1961-2015
91. Netherlands(Annual percentage change, unless otherwise stated)
1961-1973 1974-1985 1986-1990 1991-1995 1996-2000 2001-2005 2006-2010 2009 2010 2011 2012 2013 2014 2015
1. Growth of GDP and its components (real)
1.1 Private consumption 5.6 1.8 2.6 1.8 4.4 0.9 0.2 -2.1 0.3 -1.1 -1.6 -2.1 -0.2 0.91.2 Government consumption 3.2 3.5 2.0 2.4 1.8 2.2 4.2 5.0 0.5 0.2 -0.7 -0.2 0.6 -0.61.3 Gross fixed capital formation 5.6 0.1 4.8 1.8 6.6 -0.8 -0.7 -12.0 -7.4 6.1 -4.0 -4.8 4.9 2.91.4 of which equipment : 6.9 4.4 3.3 8.7 -0.5 1.0 -16.5 -3.0 9.5 1.5 -4.7 8.2 4.11.5 of which construction : -2.6 4.1 0.8 3.9 -1.1 -2.0 -9.7 -11.9 4.9 -7.6 -5.7 2.3 2.21.6 Exports of goods and services 8.9 3.2 5.8 6.3 8.8 3.6 3.7 -7.7 11.6 4.1 3.2 1.4 3.3 5.01.7 Imports of goods and services 9.2 2.7 5.3 5.7 9.5 3.1 3.8 -7.1 10.3 4.2 3.3 -0.2 3.4 4.81.8 GDP 4.9 1.8 3.3 2.3 4.0 1.3 1.4 -3.7 1.5 0.9 -1.2 -0.8 1.2 1.4
2. Demand components: Contribution to changes in GDP (%)
2.1 Consumption 3.7 1.8 1.8 1.4 2.6 1.0 1.1 0.3 0.3 -0.4 -0.9 -1.0 0.1 0.22.2 Investment 1.4 0.0 1.1 0.4 1.4 -0.2 -0.1 -2.5 -1.4 1.1 -0.7 -0.8 0.8 0.52.3 Stockbuilding 0.0 0.0 0.1 -0.1 0.0 0.0 0.1 -0.4 1.1 0.1 0.2 -0.4 0.0 0.02.4 Domestic demand 5.0 1.8 3.0 1.7 4.0 0.8 1.2 -2.6 -0.1 0.7 -1.4 -2.2 0.9 0.72.5 Exports 3.5 1.6 3.1 3.5 5.5 2.4 2.7 -5.9 7.9 3.2 2.7 1.2 2.9 4.52.6 Final demand 8.5 3.4 6.1 5.2 9.5 3.2 3.8 -8.5 7.9 3.9 1.3 -1.0 3.8 5.22.7 Imports -3.6 -1.4 -2.7 -2.9 -5.4 -1.8 -2.4 4.8 -6.3 -3.0 -2.5 0.2 -2.6 -3.82.8 Net exports -0.1 0.3 0.4 0.6 0.0 0.5 0.2 -1.1 1.6 0.2 0.2 1.4 0.3 0.7
3. Gross savings and investment in % of GDP at current prices
3.1 Private sector savings 24.0 22.7 25.8 25.8 24.6 24.4 23.6 22.3 23.4 26.0 25.4 23.6 23.9 24.13.2 Net savings of households : 7.9 9.2 8.6 6.1 4.3 2.7 2.8 1.6 2.3 1.9 2.5 : 3.3 General government savings 4.0 1.9 -0.2 -0.1 2.5 2.0 1.9 -0.7 -0.6 -0.5 -0.2 0.5 1.2 1.63.4 National savings 28.0 24.5 25.6 25.7 27.1 26.4 25.5 21.6 22.8 25.5 25.2 24.1 25.0 25.73.5 Gross capital formation 27.2 21.6 22.9 21.5 22.3 19.7 19.4 18.4 17.8 18.1 17.5 16.2 16.8 17.13.6 Current account 1.4 3.1 2.7 4.2 4.8 6.7 6.1 3.2 5.0 7.4 7.7 7.8 8.2 8.6
4. Determinants of investment
4.1 Capacity utilisation (survey) (a) : 80.1 85.0 83.3 84.5 82.8 80.9 76.2 79.2 80.1 78.4 77.0 : 4.2 Trend GDP gap : -0.1 -0.1 -0.6 0.7 -0.2 1.6 -0.5 0.3 0.6 -1.3 -2.8 -2.4 -2.04.3 Potential GDP gap : 0.9 1.2 0.1 0.8 -1.2 0.1 -2.5 -1.4 -1.0 -2.4 -3.3 -2.6 -1.84.4 Profitability index (1961-1973 = 100) 100.0 84.4 92.4 99.2 124.1 132.1 136.9 119.1 123.8 128.5 123.9 122.3 125.1 125.8
5. Growth potential
5.1 Growth of net capital stock (real) 4.5 2.5 2.3 1.9 2.6 1.8 1.7 1.3 0.7 1.1 0.8 0.4 0.7 0.85.2 Net capital/output ratio (real) 2.9 3.0 3.0 2.9 2.7 2.7 2.7 2.8 2.8 2.8 2.8 2.9 2.9 2.85.3 Growth of capital intensity 3.6 2.4 0.2 1.0 0.1 1.9 1.0 2.4 1.3 0.6 1.1 1.7 1.3 0.25.4 Labour productivity growth 4.0 1.7 1.3 1.4 1.5 1.5 0.6 -2.6 2.1 0.4 -1.0 0.4 1.8 0.85.5 Total factor productivity growth 2.6 0.8 1.2 1.0 1.4 0.7 0.2 -3.5 1.6 0.2 -1.4 -0.3 1.3 0.7
6. Employment and unemployment
6.1 Employment 1.6 0.6 2.4 1.3 2.6 0.3 0.9 -0.7 -0.4 0.7 -0.2 -1.0 -0.8 0.66.2 Activity rate : : 66.3 70.4 75.5 78.0 79.6 79.8 79.9 80.4 81.2 81.2 80.9 81.16.3 Employment rate 65.8 62.4 62.5 66.5 72.3 75.5 77.7 78.0 77.5 78.1 78.2 77.0 76.2 76.5 (benchmark) 6.4 Employment rate 61.0 54.2 52.1 54.2 58.4 59.8 60.7 60.9 60.3 60.6 60.7 59.7 59.1 59.4 (full-time equivalent) 6.5 Unemployment rate 1.1 6.2 6.0 5.7 4.6 4.0 3.9 3.7 4.5 4.4 5.3 6.7 7.4 7.3 (Eurostat definition)
7. Prices and wages
7.1 Nominal wages per head 11.4 6.6 1.8 3.6 3.4 4.0 2.6 2.5 1.5 1.6 1.9 2.3 2.3 1.77.2 Real wages per head (b) 6.1 1.0 1.1 0.8 1.0 1.4 1.4 3.0 0.0 -0.8 -0.4 0.1 1.0 0.27.3 Nominal unit labour costs 7.1 4.8 0.4 2.1 1.9 2.5 2.0 5.3 -0.6 1.2 2.9 2.0 0.5 1.07.4 Real unit labour costs 1.1 -0.7 -0.1 -0.2 -0.5 -0.4 0.7 5.2 -1.4 0.0 1.5 0.6 -0.6 -0.17.5 GDP deflator 5.9 5.6 0.6 2.3 2.3 2.8 1.3 0.1 0.8 1.1 1.3 1.4 1.2 1.17.6 Private consumption deflator 5.0 5.6 0.7 2.7 2.4 2.6 1.2 -0.5 1.5 2.4 2.2 2.2 1.4 1.57.7 Terms of trade 0.5 -0.5 -0.4 0.1 0.3 0.5 -0.3 -0.1 -1.1 0.1 -0.6 0.6 0.3 -0.1
8. General government budget, % of GDP
8.1 Expenditure 37.1 54.2 56.3 55.3 46.8 45.9 48.0 51.4 51.4 49.9 50.5 49.9 49.8 49.58.2 Current revenues 36.7 50.9 51.3 50.8 46.4 44.4 46.1 45.8 46.3 45.6 46.4 47.3 47.0 47.78.3 Net borrowing (-) or lending (+) -0.7 -3.3 -4.9 -4.5 -0.3 -1.5 -1.9 -5.6 -5.1 -4.3 -4.1 -2.5 -2.8 -1.88.4 Net borrowing cyclically adjusted : -3.8 -5.6 -4.5 -0.7 -0.8 -1.9 -4.2 -4.3 -3.8 -2.7 -0.6 -1.3 -0.88.5 Debt (end of period) : 69.7 76.8 76.1 53.8 51.8 63.4 60.8 63.4 65.7 71.3 73.5 73.8 73.4
9. Monetary conditions
9.1 Long-term interest rate 5.9 9.4 7.0 7.4 5.3 4.3 3.8 3.7 3.0 3.0 1.9 2.0 : 9.2 Short-term interest rate 4.1 7.7 6.4 7.0 3.4 2.8 2.8 1.2 0.8 1.4 0.6 0.2 : 9.3 Yield curve (9.1-9.2) 1.8 1.7 0.6 0.4 1.9 1.4 1.0 2.5 2.2 1.6 1.4 1.7 : 9.4 Real long-term interest rate (c) 0.0 3.7 6.4 5.0 2.9 1.4 2.4 3.6 2.1 1.8 0.6 0.6 : 9.5 Nominal effective exchange rate : : : : -1.5 1.3 0.5 1.5 -2.4 0.2 -1.7 2.0 1.1 0.09.6 Real effective exchange rate : : : : 91.7 98.5 102.2 105.1 102.4 102.8 101.6 104.3 104.9 104.6 (2005=100; ULC in total economy)
(a) Manufacturing industry (b) Private consumption deflator (c) GDP deflator

199
Main economic indicators 1961-2015
92. Austria(Annual percentage change, unless otherwise stated)
1961-1973 1974-1985 1986-1990 1991-1995 1996-2000 2001-2005 2006-2010 2009 2010 2011 2012 2013 2014 2015
1. Growth of GDP and its components (real)
1.1 Private consumption 4.6 2.6 3.0 1.9 2.0 1.6 1.3 0.9 2.0 0.8 0.5 -0.2 0.7 1.01.2 Government consumption 3.2 2.8 1.5 3.1 2.3 0.8 1.9 0.7 0.2 0.3 0.2 0.1 0.9 0.81.3 Gross fixed capital formation 6.5 0.8 4.6 2.5 2.9 0.1 -0.9 -7.8 -1.4 8.5 1.6 -0.9 2.2 3.41.4 of which equipment 5.5 2.1 5.5 0.4 4.6 0.2 -0.3 -10.8 2.1 14.3 2.1 -3.1 2.4 5.31.5 of which construction 7.2 -0.2 3.7 3.7 0.8 -0.5 -2.0 -7.1 -3.9 2.5 2.5 0.7 2.1 2.31.6 Exports of goods and services 8.6 5.7 5.2 2.9 8.8 5.8 1.9 -15.6 9.4 6.6 1.2 2.8 4.4 5.91.7 Imports of goods and services 8.6 4.4 5.4 3.5 6.5 5.1 1.2 -13.6 9.1 7.6 -0.3 0.6 3.7 5.71.8 GDP 4.9 2.3 3.0 2.2 3.2 1.7 1.3 -3.8 1.8 2.8 0.9 0.4 1.6 1.8
2. Demand components: Contribution to changes in GDP (%)
2.1 Consumption 3.1 2.0 2.0 1.7 1.6 1.0 1.0 0.6 1.1 0.5 0.3 -0.1 0.6 0.72.2 Investment 1.7 0.2 1.1 0.6 0.7 0.0 -0.2 -1.7 -0.3 1.7 0.3 -0.2 0.5 0.72.3 Stockbuilding 0.0 0.0 0.2 0.1 -0.2 0.1 0.0 -0.9 0.5 0.8 -0.6 -0.7 0.1 0.02.4 Domestic demand 4.9 2.1 3.2 2.3 2.1 1.2 0.9 -1.9 1.3 3.1 0.1 -1.0 1.1 1.42.5 Exports 2.3 1.8 1.8 1.0 3.5 2.8 1.1 -9.2 4.7 3.6 0.7 1.6 2.5 3.42.6 Final demand 7.2 3.9 5.0 3.3 5.5 4.0 1.9 -11.2 6.0 6.7 0.8 0.6 3.6 4.82.7 Imports -2.3 -1.5 -1.9 -1.2 -2.5 -2.3 -0.6 7.3 -4.1 -3.8 0.2 -0.3 -1.9 -3.02.8 Net exports 0.0 0.3 -0.1 -0.2 0.9 0.5 0.5 -2.0 0.5 -0.2 0.9 1.2 0.6 0.4
3. Gross savings and investment in % of GDP at current prices
3.1 Private sector savings 21.3 19.6 21.3 21.8 21.9 22.7 24.8 24.3 25.1 23.8 23.1 22.9 23.3 23.73.2 Net savings of households : : : : 5.5 5.2 6.5 6.9 5.4 3.9 4.4 : : 3.3 General government savings 7.2 3.8 1.5 0.8 1.2 1.9 1.0 -0.6 -0.4 1.0 1.4 1.3 1.5 1.83.4 National savings 28.5 23.4 22.8 22.6 23.1 24.6 25.8 23.7 24.7 24.8 24.5 24.2 24.8 25.63.5 Gross capital formation 28.1 25.7 24.0 24.9 24.8 22.9 22.1 21.0 21.1 23.0 22.7 21.5 21.6 21.93.6 Current account 0.1 -2.5 -1.2 -2.4 -1.8 1.6 3.7 2.7 3.6 1.5 1.8 2.7 3.4 3.8
4. Determinants of investment
4.1 Capacity utilisation (survey) (a) : : : : 86.1 85.8 84.5 77.7 82.1 85.1 84.4 83.8 : 4.2 Trend GDP gap : 0.2 -0.9 0.4 0.1 -0.4 0.9 -2.0 -1.5 0.0 -0.4 -1.2 -0.8 -0.24.3 Potential GDP gap : 0.0 -0.3 -0.2 0.2 -0.6 -0.1 -2.9 -2.0 -0.1 -0.4 -1.1 -0.8 -0.44.4 Profitability index (1961-1973 = 100) 100.0 95.7 105.0 102.9 108.2 115.5 120.9 107.4 111.2 116.4 111.0 107.2 109.9 112.1
5. Growth potential
5.1 Growth of net capital stock (real) 4.2 3.5 2.8 3.1 2.8 2.1 1.7 1.3 1.2 1.6 1.6 1.4 1.4 1.65.2 Net capital/output ratio (real) 2.9 3.0 3.2 3.2 3.3 3.3 3.3 3.4 3.4 3.3 3.4 3.4 3.4 3.45.3 Growth of capital intensity 4.2 3.4 1.9 3.0 2.0 1.8 1.0 2.9 0.6 0.2 0.2 0.7 0.7 0.75.4 Labour productivity growth 4.9 2.2 2.2 2.1 2.3 1.4 0.6 -2.4 1.1 1.4 -0.4 -0.3 0.9 1.05.5 Total factor productivity growth 3.3 0.9 1.4 1.0 1.5 0.7 0.3 -3.4 0.9 1.3 -0.5 -0.5 0.6 0.7
6. Employment and unemployment
6.1 Employment 0.0 0.1 0.9 0.2 0.9 0.6 1.1 -0.7 1.0 1.7 1.3 0.7 0.8 0.96.2 Activity rate 72.6 71.4 69.3 70.3 71.0 71.8 74.7 75.1 75.2 76.0 77.0 77.9 78.4 78.86.3 Employment rate 71.5 70.0 67.0 67.6 68.1 68.7 71.4 71.5 71.9 72.9 73.7 74.2 74.7 75.2 (benchmark) 6.4 Employment rate : : 59.9 60.4 60.6 60.3 61.6 61.4 61.5 62.2 62.9 63.3 63.7 64.2 (full-time equivalent) 6.5 Unemployment rate 1.8 2.3 3.4 3.7 4.1 4.4 4.4 4.8 4.4 4.2 4.3 4.9 4.8 4.7 (Eurostat definition)
7. Prices and wages
7.1 Nominal wages per head 9.4 7.8 4.4 5.0 2.1 1.9 2.7 2.5 1.2 2.4 2.6 2.1 2.0 2.07.2 Real wages per head (b) 5.1 1.9 2.4 2.1 0.7 0.2 0.9 2.1 -0.6 -1.2 0.0 0.0 0.4 0.37.3 Nominal unit labour costs 4.3 5.5 2.2 2.9 -0.2 0.6 2.0 5.0 0.0 1.0 3.0 2.4 1.1 1.17.4 Real unit labour costs -0.3 0.0 -0.3 0.0 -0.6 -1.0 0.3 3.3 -1.4 -1.0 1.3 0.8 -0.7 -0.67.5 GDP deflator 4.6 5.5 2.6 2.8 0.4 1.6 1.7 1.6 1.4 2.0 1.7 1.6 1.9 1.77.6 Private consumption deflator 4.1 5.7 2.0 2.8 1.4 1.7 1.8 0.4 1.8 3.6 2.6 2.2 1.6 1.77.7 Terms of trade 0.3 -1.0 0.3 -0.1 -0.9 0.2 -0.5 1.5 -1.2 -2.1 -1.1 0.5 0.6 0.0
8. General government budget, % of GDP
8.1 Expenditure 36.8 45.9 52.9 54.9 53.5 51.3 50.4 52.6 52.8 50.8 51.6 51.2 52.4 50.98.2 Current revenues 37.6 43.7 49.3 50.9 51.1 49.6 48.0 48.5 48.3 48.3 49.1 49.7 49.6 49.48.3 Net borrowing (-) or lending (+) 0.8 -2.2 -3.6 -4.1 -2.4 -1.7 -2.4 -4.1 -4.5 -2.5 -2.6 -1.5 -2.8 -1.58.4 Net borrowing cyclically adjusted : -2.3 -3.5 -3.9 -2.5 -1.4 -2.4 -2.7 -3.5 -2.4 -2.4 -1.0 -2.4 -1.38.5 Debt (end of period) 16.7 48.0 56.2 68.2 66.2 64.2 72.5 69.2 72.5 73.1 74.4 74.5 80.3 79.2
9. Monetary conditions
9.1 Long-term interest rate : 8.9 7.4 7.4 5.4 4.3 3.9 3.9 3.2 3.3 2.4 2.0 : 9.2 Short-term interest rate : 7.1 6.1 7.0 3.6 2.8 2.8 1.2 0.8 1.4 0.6 0.2 : 9.3 Yield curve (9.1-9.2) : 1.8 1.4 0.3 1.8 1.5 1.1 2.7 2.4 1.9 1.8 1.8 : 9.4 Real long-term interest rate (c) : 3.2 4.7 4.4 4.9 2.7 2.2 2.3 1.8 1.3 0.6 0.4 : 9.5 Nominal effective exchange rate : : : : -0.4 1.1 0.2 1.3 -2.5 -0.1 -1.3 2.0 1.3 0.09.6 Real effective exchange rate : : : : 106.6 99.8 101.2 103.0 101.0 101.0 100.5 103.5 104.8 104.5 (2005=100; ULC in total economy)
(a) Manufacturing industry (b) Private consumption deflator (c) GDP deflator
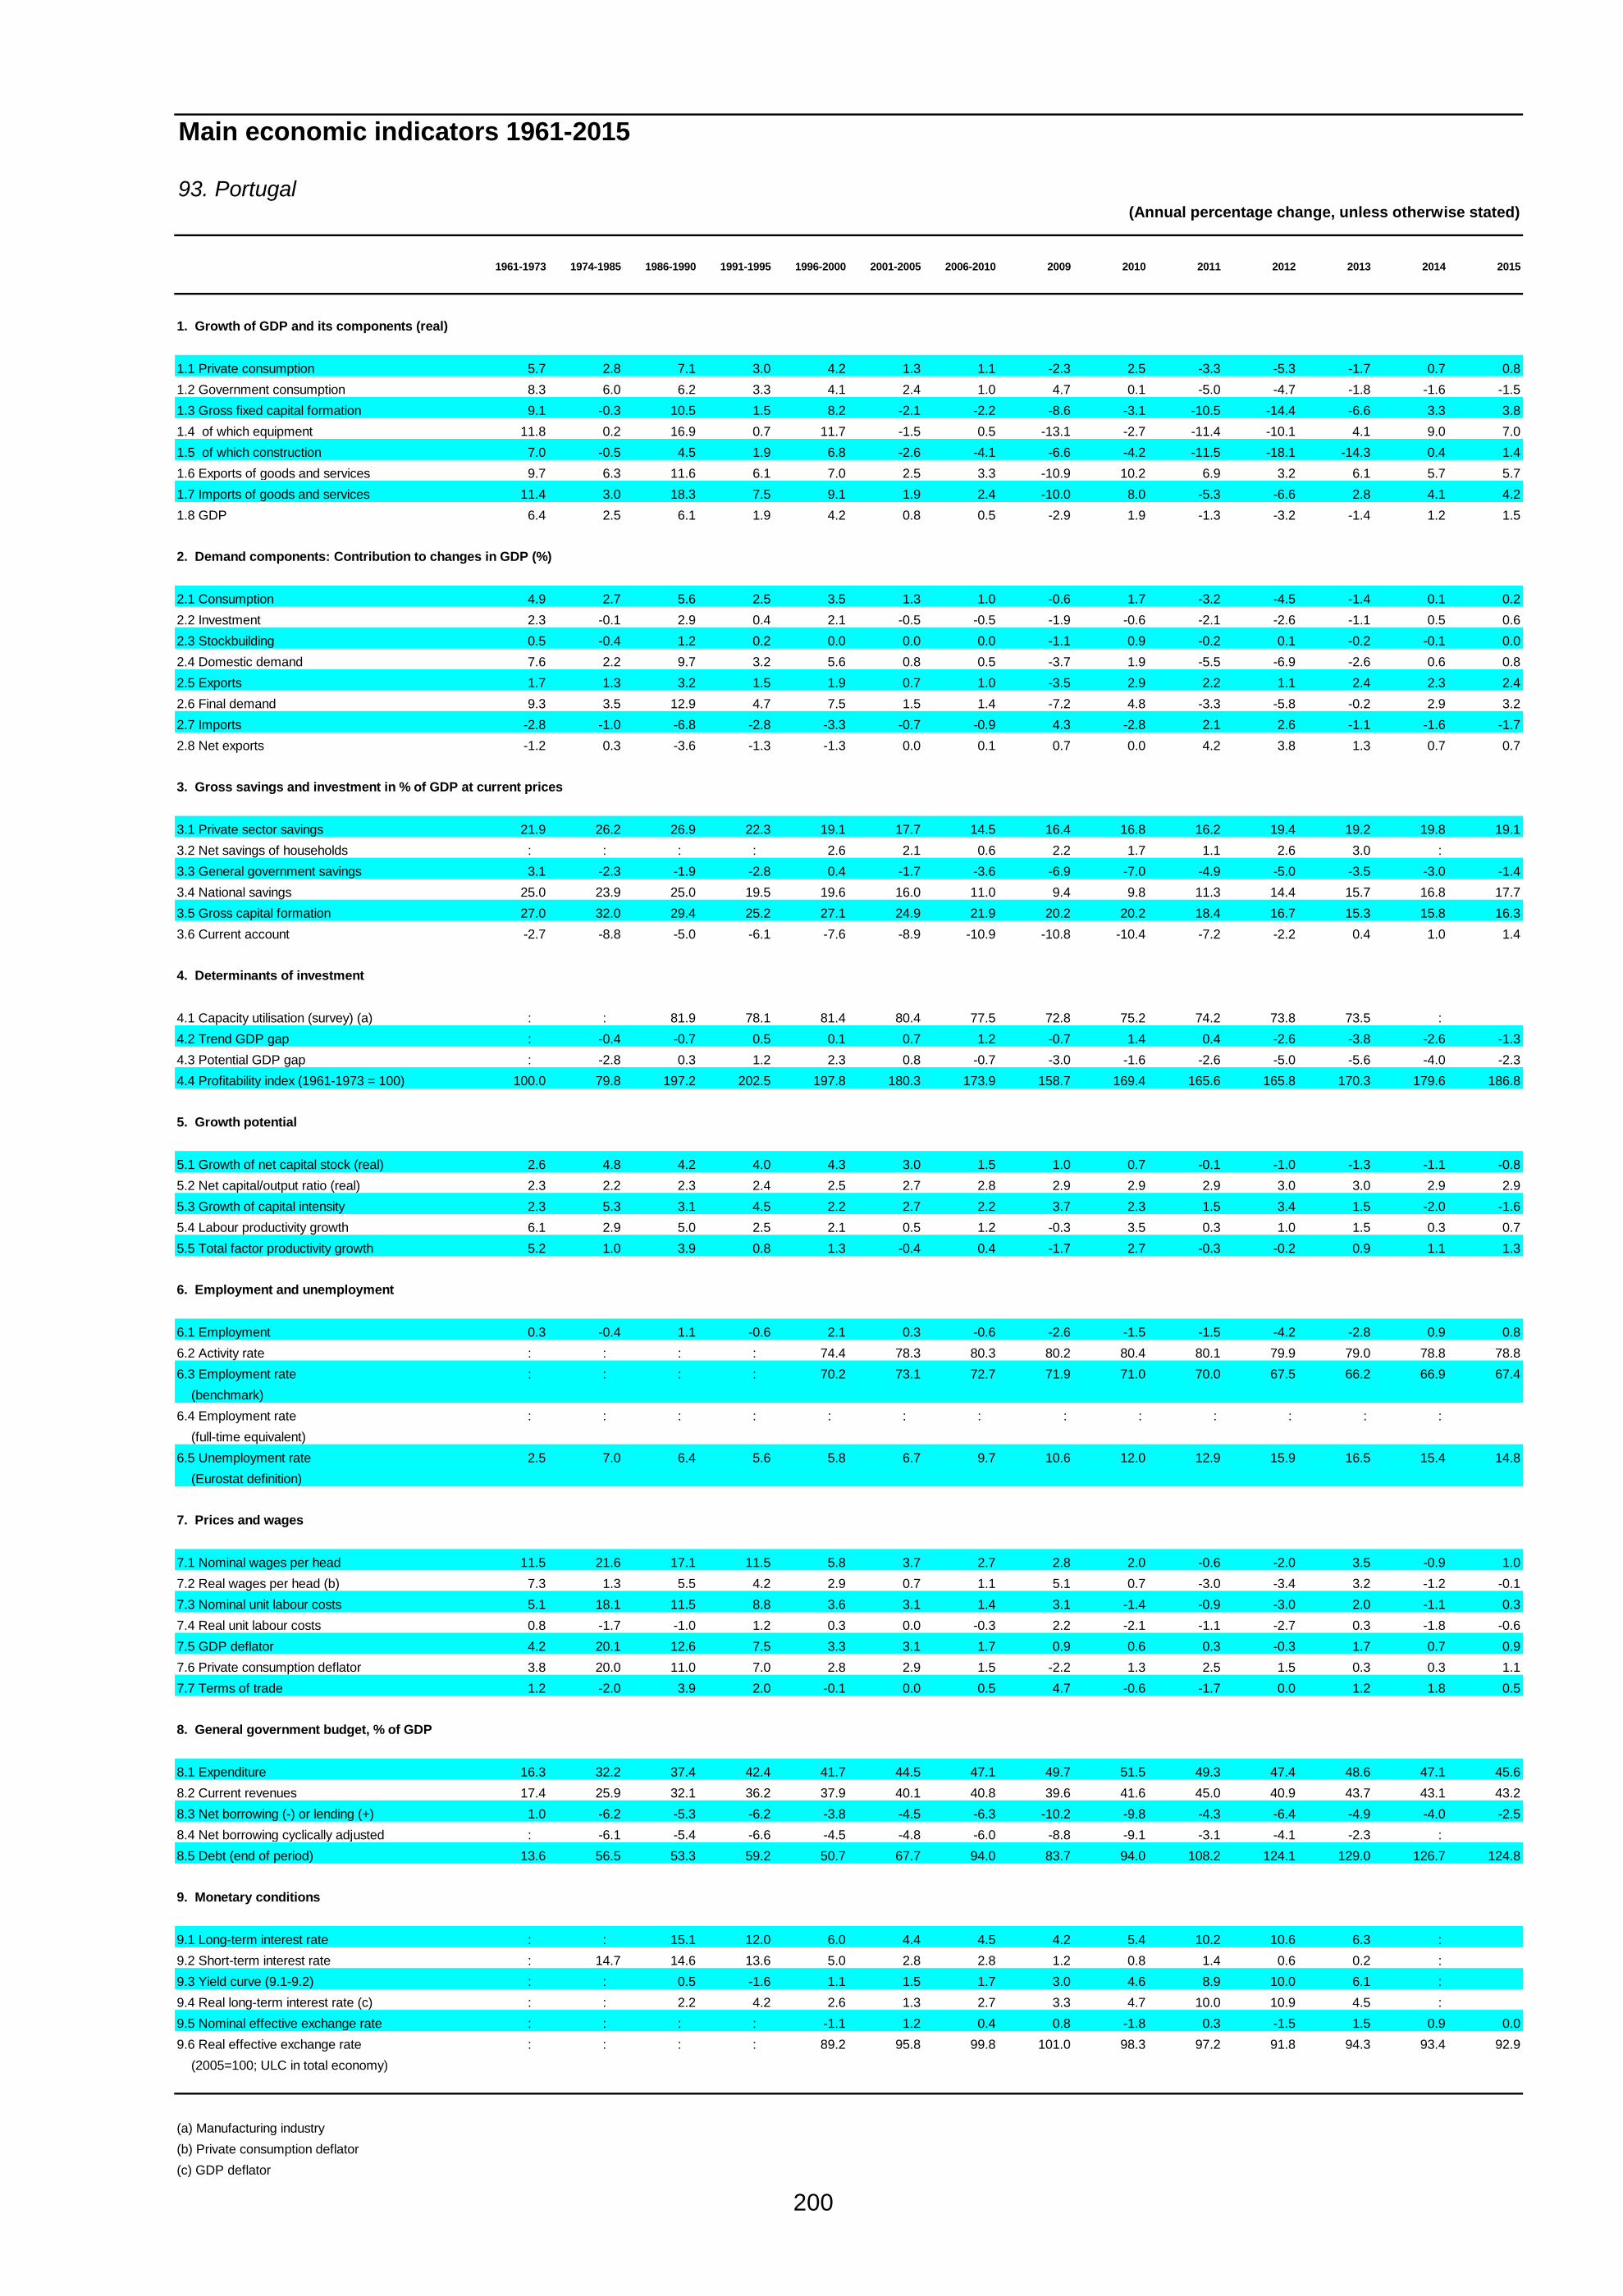
200
Main economic indicators 1961-2015
93. Portugal(Annual percentage change, unless otherwise stated)
1961-1973 1974-1985 1986-1990 1991-1995 1996-2000 2001-2005 2006-2010 2009 2010 2011 2012 2013 2014 2015
1. Growth of GDP and its components (real)
1.1 Private consumption 5.7 2.8 7.1 3.0 4.2 1.3 1.1 -2.3 2.5 -3.3 -5.3 -1.7 0.7 0.81.2 Government consumption 8.3 6.0 6.2 3.3 4.1 2.4 1.0 4.7 0.1 -5.0 -4.7 -1.8 -1.6 -1.51.3 Gross fixed capital formation 9.1 -0.3 10.5 1.5 8.2 -2.1 -2.2 -8.6 -3.1 -10.5 -14.4 -6.6 3.3 3.81.4 of which equipment 11.8 0.2 16.9 0.7 11.7 -1.5 0.5 -13.1 -2.7 -11.4 -10.1 4.1 9.0 7.01.5 of which construction 7.0 -0.5 4.5 1.9 6.8 -2.6 -4.1 -6.6 -4.2 -11.5 -18.1 -14.3 0.4 1.41.6 Exports of goods and services 9.7 6.3 11.6 6.1 7.0 2.5 3.3 -10.9 10.2 6.9 3.2 6.1 5.7 5.71.7 Imports of goods and services 11.4 3.0 18.3 7.5 9.1 1.9 2.4 -10.0 8.0 -5.3 -6.6 2.8 4.1 4.21.8 GDP 6.4 2.5 6.1 1.9 4.2 0.8 0.5 -2.9 1.9 -1.3 -3.2 -1.4 1.2 1.5
2. Demand components: Contribution to changes in GDP (%)
2.1 Consumption 4.9 2.7 5.6 2.5 3.5 1.3 1.0 -0.6 1.7 -3.2 -4.5 -1.4 0.1 0.22.2 Investment 2.3 -0.1 2.9 0.4 2.1 -0.5 -0.5 -1.9 -0.6 -2.1 -2.6 -1.1 0.5 0.62.3 Stockbuilding 0.5 -0.4 1.2 0.2 0.0 0.0 0.0 -1.1 0.9 -0.2 0.1 -0.2 -0.1 0.02.4 Domestic demand 7.6 2.2 9.7 3.2 5.6 0.8 0.5 -3.7 1.9 -5.5 -6.9 -2.6 0.6 0.82.5 Exports 1.7 1.3 3.2 1.5 1.9 0.7 1.0 -3.5 2.9 2.2 1.1 2.4 2.3 2.42.6 Final demand 9.3 3.5 12.9 4.7 7.5 1.5 1.4 -7.2 4.8 -3.3 -5.8 -0.2 2.9 3.22.7 Imports -2.8 -1.0 -6.8 -2.8 -3.3 -0.7 -0.9 4.3 -2.8 2.1 2.6 -1.1 -1.6 -1.72.8 Net exports -1.2 0.3 -3.6 -1.3 -1.3 0.0 0.1 0.7 0.0 4.2 3.8 1.3 0.7 0.7
3. Gross savings and investment in % of GDP at current prices
3.1 Private sector savings 21.9 26.2 26.9 22.3 19.1 17.7 14.5 16.4 16.8 16.2 19.4 19.2 19.8 19.13.2 Net savings of households : : : : 2.6 2.1 0.6 2.2 1.7 1.1 2.6 3.0 : 3.3 General government savings 3.1 -2.3 -1.9 -2.8 0.4 -1.7 -3.6 -6.9 -7.0 -4.9 -5.0 -3.5 -3.0 -1.43.4 National savings 25.0 23.9 25.0 19.5 19.6 16.0 11.0 9.4 9.8 11.3 14.4 15.7 16.8 17.73.5 Gross capital formation 27.0 32.0 29.4 25.2 27.1 24.9 21.9 20.2 20.2 18.4 16.7 15.3 15.8 16.33.6 Current account -2.7 -8.8 -5.0 -6.1 -7.6 -8.9 -10.9 -10.8 -10.4 -7.2 -2.2 0.4 1.0 1.4
4. Determinants of investment
4.1 Capacity utilisation (survey) (a) : : 81.9 78.1 81.4 80.4 77.5 72.8 75.2 74.2 73.8 73.5 : 4.2 Trend GDP gap : -0.4 -0.7 0.5 0.1 0.7 1.2 -0.7 1.4 0.4 -2.6 -3.8 -2.6 -1.34.3 Potential GDP gap : -2.8 0.3 1.2 2.3 0.8 -0.7 -3.0 -1.6 -2.6 -5.0 -5.6 -4.0 -2.34.4 Profitability index (1961-1973 = 100) 100.0 79.8 197.2 202.5 197.8 180.3 173.9 158.7 169.4 165.6 165.8 170.3 179.6 186.8
5. Growth potential
5.1 Growth of net capital stock (real) 2.6 4.8 4.2 4.0 4.3 3.0 1.5 1.0 0.7 -0.1 -1.0 -1.3 -1.1 -0.85.2 Net capital/output ratio (real) 2.3 2.2 2.3 2.4 2.5 2.7 2.8 2.9 2.9 2.9 3.0 3.0 2.9 2.95.3 Growth of capital intensity 2.3 5.3 3.1 4.5 2.2 2.7 2.2 3.7 2.3 1.5 3.4 1.5 -2.0 -1.65.4 Labour productivity growth 6.1 2.9 5.0 2.5 2.1 0.5 1.2 -0.3 3.5 0.3 1.0 1.5 0.3 0.75.5 Total factor productivity growth 5.2 1.0 3.9 0.8 1.3 -0.4 0.4 -1.7 2.7 -0.3 -0.2 0.9 1.1 1.3
6. Employment and unemployment
6.1 Employment 0.3 -0.4 1.1 -0.6 2.1 0.3 -0.6 -2.6 -1.5 -1.5 -4.2 -2.8 0.9 0.86.2 Activity rate : : : : 74.4 78.3 80.3 80.2 80.4 80.1 79.9 79.0 78.8 78.86.3 Employment rate : : : : 70.2 73.1 72.7 71.9 71.0 70.0 67.5 66.2 66.9 67.4 (benchmark) 6.4 Employment rate : : : : : : : : : : : : : (full-time equivalent) 6.5 Unemployment rate 2.5 7.0 6.4 5.6 5.8 6.7 9.7 10.6 12.0 12.9 15.9 16.5 15.4 14.8 (Eurostat definition)
7. Prices and wages
7.1 Nominal wages per head 11.5 21.6 17.1 11.5 5.8 3.7 2.7 2.8 2.0 -0.6 -2.0 3.5 -0.9 1.07.2 Real wages per head (b) 7.3 1.3 5.5 4.2 2.9 0.7 1.1 5.1 0.7 -3.0 -3.4 3.2 -1.2 -0.17.3 Nominal unit labour costs 5.1 18.1 11.5 8.8 3.6 3.1 1.4 3.1 -1.4 -0.9 -3.0 2.0 -1.1 0.37.4 Real unit labour costs 0.8 -1.7 -1.0 1.2 0.3 0.0 -0.3 2.2 -2.1 -1.1 -2.7 0.3 -1.8 -0.67.5 GDP deflator 4.2 20.1 12.6 7.5 3.3 3.1 1.7 0.9 0.6 0.3 -0.3 1.7 0.7 0.97.6 Private consumption deflator 3.8 20.0 11.0 7.0 2.8 2.9 1.5 -2.2 1.3 2.5 1.5 0.3 0.3 1.17.7 Terms of trade 1.2 -2.0 3.9 2.0 -0.1 0.0 0.5 4.7 -0.6 -1.7 0.0 1.2 1.8 0.5
8. General government budget, % of GDP
8.1 Expenditure 16.3 32.2 37.4 42.4 41.7 44.5 47.1 49.7 51.5 49.3 47.4 48.6 47.1 45.68.2 Current revenues 17.4 25.9 32.1 36.2 37.9 40.1 40.8 39.6 41.6 45.0 40.9 43.7 43.1 43.28.3 Net borrowing (-) or lending (+) 1.0 -6.2 -5.3 -6.2 -3.8 -4.5 -6.3 -10.2 -9.8 -4.3 -6.4 -4.9 -4.0 -2.58.4 Net borrowing cyclically adjusted : -6.1 -5.4 -6.6 -4.5 -4.8 -6.0 -8.8 -9.1 -3.1 -4.1 -2.3 : 8.5 Debt (end of period) 13.6 56.5 53.3 59.2 50.7 67.7 94.0 83.7 94.0 108.2 124.1 129.0 126.7 124.8
9. Monetary conditions
9.1 Long-term interest rate : : 15.1 12.0 6.0 4.4 4.5 4.2 5.4 10.2 10.6 6.3 : 9.2 Short-term interest rate : 14.7 14.6 13.6 5.0 2.8 2.8 1.2 0.8 1.4 0.6 0.2 : 9.3 Yield curve (9.1-9.2) : : 0.5 -1.6 1.1 1.5 1.7 3.0 4.6 8.9 10.0 6.1 : 9.4 Real long-term interest rate (c) : : 2.2 4.2 2.6 1.3 2.7 3.3 4.7 10.0 10.9 4.5 : 9.5 Nominal effective exchange rate : : : : -1.1 1.2 0.4 0.8 -1.8 0.3 -1.5 1.5 0.9 0.09.6 Real effective exchange rate : : : : 89.2 95.8 99.8 101.0 98.3 97.2 91.8 94.3 93.4 92.9 (2005=100; ULC in total economy)
(a) Manufacturing industry (b) Private consumption deflator (c) GDP deflator

201
Main economic indicators 1961-2015
94. Slovenia(Annual percentage change, unless otherwise stated)
2002 2003 2004 2005 2006 2007 2008 2009 2010 2011 2012 2013 2014 2015
1. Growth of GDP and its components (real)
1.1 Private consumption 2.6 3.4 3.0 2.1 2.8 6.3 2.3 -0.1 1.5 0.8 -4.8 -2.7 0.2 1.11.2 Government consumption 3.3 2.3 3.3 3.5 4.0 0.6 5.9 2.5 1.3 -1.6 -1.3 -2.0 0.1 0.31.3 Gross fixed capital formation 0.3 7.6 5.0 3.0 10.4 13.3 7.1 -23.8 -15.3 -5.5 -8.2 0.2 2.7 1.41.4 of which equipment -1.6 12.3 9.8 3.0 21.7 9.4 2.6 -30.8 -9.5 14.7 -8.5 9.5 2.6 1.61.5 of which construction 0.9 6.3 0.8 3.2 2.6 15.7 11.3 -20.8 -20.5 -18.5 -6.5 -5.8 2.7 1.21.6 Exports of goods and services 6.8 3.1 12.4 10.6 12.5 13.7 4.0 -16.1 10.2 7.0 0.6 2.9 3.9 5.41.7 Imports of goods and services 4.9 6.7 13.3 6.7 12.2 16.7 3.7 -19.2 7.4 5.6 -4.7 1.3 3.9 5.31.8 GDP 3.8 2.9 4.4 4.0 5.8 7.0 3.4 -7.9 1.3 0.7 -2.5 -1.1 0.8 1.4
2. Demand components: Contribution to changes in GDP (%)
2.1 Consumption 2.1 2.3 2.3 1.8 2.3 3.4 2.2 0.4 1.1 0.2 -3.0 -1.9 0.2 0.72.2 Investment 0.1 1.8 1.2 0.7 2.6 3.5 2.0 -6.8 -3.5 -1.1 -1.5 0.0 0.5 0.32.3 Stockbuilding 0.7 0.7 1.4 -0.7 0.7 2.1 -1.0 -4.1 1.9 0.6 -1.8 -0.5 -0.2 0.02.4 Domestic demand 2.8 4.8 4.9 1.8 5.7 9.0 3.2 -10.5 -0.5 -0.3 -6.3 -2.4 0.5 0.92.5 Exports 3.7 1.7 6.7 6.1 7.8 9.1 2.8 -10.9 6.0 4.7 0.4 2.2 3.1 4.32.6 Final demand 6.6 6.5 11.6 7.9 13.5 18.1 6.0 -21.4 5.5 4.3 -5.9 -0.2 3.5 5.22.7 Imports -2.7 -3.6 -7.2 -3.9 -7.6 -11.2 -2.6 13.5 -4.3 -3.6 3.4 -0.9 -2.8 -3.82.8 Net exports 1.0 -1.9 -0.5 2.2 0.2 -2.0 0.1 2.6 1.8 1.0 3.8 1.3 0.3 0.5
3. Gross savings and investment in % of GDP at current prices
3.1 Private sector savings 23.5 22.7 22.8 23.1 23.8 22.7 22.1 22.7 21.4 21.7 21.1 23.2 23.4 23.43.2 Net savings of households 6.4 4.7 5.2 6.4 6.4 5.2 4.9 4.9 3.7 3.2 2.8 4.3 : 3.3 General government savings 1.4 1.8 2.2 2.4 2.7 4.7 3.6 -1.0 -1.0 -1.3 -0.4 -0.8 -0.1 0.23.4 National savings 24.9 24.5 24.9 25.5 26.6 27.4 25.7 21.7 20.4 20.4 20.6 22.4 23.3 23.53.5 Gross capital formation 24.0 25.4 27.5 27.2 28.9 31.9 31.8 22.1 20.6 20.1 17.5 17.1 17.3 17.33.6 Current account 0.9 -0.9 -2.6 -1.7 -2.3 -4.6 -6.1 -0.4 -0.2 0.2 3.1 5.3 6.0 6.2
4. Determinants of investment
4.1 Capacity utilisation (survey) (a) 80.9 81.3 81.6 82.3 83.9 85.7 83.8 71.3 76.3 79.8 78.8 78.3 : 4.2 Trend GDP gap -1.2 -1.9 -1.0 -0.2 2.8 7.6 9.4 -0.4 0.1 0.4 -2.3 -3.4 -2.7 -1.34.3 Potential GDP gap 0.8 0.1 0.6 0.8 2.5 5.6 5.9 -3.5 -2.0 -0.8 -2.7 -3.1 -2.4 -1.54.4 Profitability index (1961-1973 = 100) : : : : : : : : : : : : :
5. Growth potential
5.1 Growth of net capital stock (real) 3.6 4.4 4.8 4.8 5.6 6.5 6.7 2.8 1.4 0.9 0.4 0.5 0.6 0.75.2 Net capital/output ratio (real) 2.1 2.2 2.2 2.2 2.2 2.2 2.2 2.5 2.5 2.5 2.6 2.6 2.6 2.65.3 Growth of capital intensity 2.0 4.8 4.4 5.3 4.0 3.1 4.0 4.7 3.6 2.6 1.2 2.5 0.7 0.45.4 Labour productivity growth 2.2 3.2 4.0 4.5 4.2 3.5 0.8 -6.2 3.5 2.4 -1.7 0.9 0.8 1.15.5 Total factor productivity growth 1.5 1.5 2.4 2.5 2.7 2.4 -0.7 -7.8 2.1 1.4 -2.2 0.0 0.5 0.9
6. Employment and unemployment
6.1 Employment 1.6 -0.3 0.4 -0.5 1.6 3.3 2.6 -1.8 -2.2 -1.6 -0.8 -2.0 0.0 0.36.2 Activity rate 71.1 71.0 71.3 71.0 71.3 72.8 74.0 73.7 73.2 72.9 73.4 72.9 73.3 73.76.3 Employment rate 66.7 66.4 66.8 66.3 67.0 69.3 70.8 69.4 67.9 67.1 67.0 65.7 66.0 66.6 (benchmark) 6.4 Employment rate : : : : : : : : : : : : : (full-time equivalent) 6.5 Unemployment rate 6.3 6.7 6.3 6.5 6.0 4.9 4.4 5.9 7.3 8.2 8.9 10.1 10.1 9.8 (Eurostat definition)
7. Prices and wages
7.1 Nominal wages per head 8.3 7.8 7.7 6.0 5.4 6.2 7.2 1.8 3.9 1.6 -1.0 0.1 1.0 1.67.2 Real wages per head (b) 0.7 2.5 4.6 3.7 2.9 2.0 1.7 1.2 2.4 0.0 -2.5 -0.9 0.7 0.47.3 Nominal unit labour costs 6.0 4.4 3.6 1.5 1.1 2.6 6.4 8.6 0.4 -0.7 0.8 -0.8 0.2 0.57.4 Real unit labour costs -1.5 -1.0 0.3 -0.2 -1.0 -1.6 2.1 5.1 1.5 -1.9 0.5 -1.8 -0.7 -0.87.5 GDP deflator 7.6 5.5 3.3 1.7 2.1 4.2 4.1 3.3 -1.1 1.2 0.2 1.0 0.9 1.37.6 Private consumption deflator 7.5 5.2 3.0 2.3 2.4 4.1 5.5 0.6 1.5 1.7 1.6 0.9 0.3 1.27.7 Terms of trade 1.9 0.8 -1.0 -2.0 -0.5 0.9 -1.5 3.7 -3.9 -1.4 -1.0 0.8 1.0 0.0
8. General government budget, % of GDP
8.1 Expenditure 46.2 46.2 45.6 45.1 44.3 42.3 44.1 48.7 49.5 49.9 48.4 59.4 49.5 47.48.2 Current revenues 43.8 43.6 43.4 43.6 43.0 42.2 42.2 42.3 43.6 43.5 44.4 44.7 45.2 44.48.3 Net borrowing (-) or lending (+) -2.4 -2.7 -2.3 -1.5 -1.4 0.0 -1.9 -6.3 -5.9 -6.4 -4.0 -14.7 -4.3 -3.18.4 Net borrowing cyclically adjusted -2.8 -2.7 -2.5 -1.9 -2.5 -2.6 -4.6 -4.7 -4.9 -6.0 -2.8 -13.3 -3.2 -2.48.5 Debt (end of period) 27.8 27.2 27.3 26.7 26.4 23.1 22.0 35.2 38.7 47.1 54.4 71.7 80.4 81.3
9. Monetary conditions
9.1 Long-term interest rate 8.7 6.4 4.7 3.8 3.9 4.5 4.6 4.4 3.8 5.0 5.8 5.8 : 9.2 Short-term interest rate 8.0 6.8 4.7 4.0 3.6 4.3 4.6 1.2 0.8 1.4 0.6 0.2 : 9.3 Yield curve (9.1-9.2) 0.7 -0.4 0.0 -0.2 0.3 0.3 0.0 3.2 3.0 3.6 5.2 5.6 : 9.4 Real long-term interest rate (c) 1.1 0.8 1.4 2.1 1.7 0.3 0.5 1.0 4.9 3.8 5.5 4.8 : 9.5 Nominal effective exchange rate -2.9 -0.7 -1.5 -1.1 0.1 0.3 0.4 2.0 -1.7 0.4 -0.6 1.3 1.1 0.09.6 Real effective exchange rate 98.1 99.5 100.8 100.0 100.2 101.1 103.5 109.8 108.8 107.6 105.2 104.0 104.1 103.4 (2005=100; ULC in total economy)
(a) Manufacturing industry (b) Private consumption deflator (c) GDP deflator

202
Main economic indicators 1961-2015
95. Slovakia(Annual percentage change, unless otherwise stated)
2002 2003 2004 2005 2006 2007 2008 2009 2010 2011 2012 2013 2014 2015
1. Growth of GDP and its components (real)
1.1 Private consumption 5.7 1.7 4.6 6.5 5.9 6.8 6.1 0.2 -0.7 -0.5 -0.2 -0.1 1.3 2.31.2 Government consumption 3.0 4.3 -2.9 3.9 8.8 -0.2 6.1 6.1 1.0 -4.3 -1.1 1.4 2.4 1.51.3 Gross fixed capital formation 0.2 -2.7 4.8 17.5 9.3 9.1 1.0 -19.7 6.5 14.2 -10.5 -4.3 2.3 3.51.4 of which equipment 4.4 -0.4 2.6 21.7 -5.5 4.5 10.9 -24.3 10.5 39.8 -11.9 -3.4 1.5 4.41.5 of which construction -6.3 -6.2 6.9 13.0 30.3 4.9 -4.0 -12.9 -7.7 7.4 -8.5 -6.1 4.1 3.41.6 Exports of goods and services 5.2 15.9 7.4 10.0 21.0 14.3 3.1 -16.3 16.0 12.2 9.9 4.5 5.6 6.41.7 Imports of goods and services 4.4 7.4 8.3 12.3 17.8 9.2 3.1 -18.9 14.9 9.7 3.3 2.9 5.4 6.11.8 GDP 4.6 4.8 5.1 6.7 8.3 10.5 5.8 -4.9 4.4 3.0 1.8 0.9 2.2 3.1
2. Demand components: Contribution to changes in GDP (%)
2.1 Consumption 3.9 1.9 2.1 4.5 5.0 3.8 4.4 1.2 -0.2 -1.1 -0.3 0.2 1.2 1.62.2 Investment 0.1 -0.7 1.2 4.2 2.5 2.4 0.3 -4.9 1.3 3.0 -2.4 -0.9 0.4 0.72.3 Stockbuilding 0.3 -1.9 2.7 0.1 -0.7 0.3 1.1 -3.8 2.6 -0.8 -1.4 -0.1 0.0 0.02.4 Domestic demand 4.3 -0.7 5.9 8.8 6.8 6.6 5.7 -7.5 3.7 1.0 -4.1 -0.8 1.6 2.32.5 Exports 3.8 11.3 5.6 7.4 16.0 12.1 2.7 -13.6 11.3 9.8 8.8 4.3 5.5 6.42.6 Final demand 8.1 10.6 11.5 16.2 22.8 18.6 8.5 -21.1 15.0 10.8 4.7 3.5 7.1 8.72.7 Imports -3.5 -5.8 -6.5 -9.5 -14.4 -8.2 -2.7 16.2 -10.6 -7.8 -2.9 -2.6 -5.0 -5.72.8 Net exports 0.3 5.5 -0.9 -2.1 1.6 3.9 0.0 2.6 0.7 2.0 5.9 1.7 0.6 0.7
3. Gross savings and investment in % of GDP at current prices
3.1 Private sector savings 23.5 18.0 19.3 19.3 20.0 21.5 20.6 21.0 23.5 23.1 23.3 21.6 21.8 21.83.2 Net savings of households 2.0 0.6 0.2 0.6 0.1 1.2 0.6 1.1 3.4 2.6 1.9 : : 3.3 General government savings -1.9 0.2 0.3 1.0 -0.2 0.7 0.8 -4.0 -4.6 -1.8 -2.2 -0.8 -1.0 -0.73.4 National savings 21.6 18.2 19.7 20.3 19.7 22.2 21.4 17.1 18.8 21.3 21.1 20.8 20.7 21.13.5 Gross capital formation 29.1 24.6 26.3 28.9 28.0 27.8 27.7 19.5 22.6 23.8 19.4 18.3 18.4 18.73.6 Current account -7.5 -6.4 -6.7 -8.6 -8.3 -5.6 -6.3 -2.5 -3.7 -2.6 1.6 2.5 2.4 2.4
4. Determinants of investment
4.1 Capacity utilisation (survey) (a) 73.3 66.7 68.8 77.5 74.1 74.2 73.0 54.7 58.2 61.3 69.1 60.2 : 4.2 Trend GDP gap -3.8 -3.6 -3.3 -1.6 1.9 7.7 9.4 0.2 1.2 1.1 0.0 -1.7 -2.2 -1.84.3 Potential GDP gap -2.5 -1.6 -0.8 0.6 3.1 7.6 7.9 -1.1 -0.4 -1.1 -2.1 -3.4 -3.6 -3.14.4 Profitability index (1961-1973 = 100) : : : : : : : : : : : : :
5. Growth potential
5.1 Growth of net capital stock (real) 2.9 1.9 2.1 3.6 4.4 5.1 4.4 1.0 1.3 2.3 0.6 -0.3 -0.1 0.35.2 Net capital/output ratio (real) 2.3 2.2 2.1 2.1 2.0 1.9 1.9 2.0 1.9 1.9 1.9 1.9 1.8 1.85.3 Growth of capital intensity 2.8 0.8 2.3 2.0 2.2 3.0 1.1 3.0 2.8 0.5 0.5 0.4 -0.5 -0.35.4 Labour productivity growth 4.5 3.7 5.3 5.0 6.1 8.2 2.4 -3.0 6.0 1.2 1.7 1.7 1.7 2.55.5 Total factor productivity growth 2.9 3.2 4.0 3.8 4.8 6.5 1.8 -4.6 4.4 0.9 1.4 1.5 2.0 2.6
6. Employment and unemployment
6.1 Employment 0.1 1.1 -0.2 1.6 2.1 2.1 3.2 -2.0 -1.5 1.8 0.1 -0.8 0.5 0.66.2 Activity rate 69.2 69.1 69.5 68.9 68.9 68.6 69.3 69.2 69.6 69.0 69.8 70.1 70.2 70.26.3 Employment rate 56.4 57.0 56.9 57.8 59.8 61.0 62.8 60.9 59.7 59.6 60.1 60.1 60.6 61.2 (benchmark) 6.4 Employment rate : : : : : : : : : : : : : (full-time equivalent) 6.5 Unemployment rate 18.8 17.7 18.4 16.4 13.5 11.2 9.6 12.1 14.5 13.7 14.0 14.2 13.6 12.9 (Eurostat definition)
7. Prices and wages
7.1 Nominal wages per head 8.9 7.8 8.1 9.1 7.9 8.7 7.0 2.5 5.1 2.0 2.8 0.8 2.4 2.77.2 Real wages per head (b) 5.8 1.2 0.7 6.3 2.9 5.9 2.4 2.4 4.1 -1.8 -0.6 -0.5 2.0 1.27.3 Nominal unit labour costs 4.2 4.0 2.6 3.9 1.7 0.5 4.4 5.7 -0.9 0.8 1.0 -0.9 0.7 0.27.4 Real unit labour costs 0.3 -1.2 -3.0 1.5 -1.2 -0.6 1.5 7.0 -1.4 -0.8 -0.2 -1.4 0.2 -0.77.5 GDP deflator 3.9 5.3 5.8 2.4 2.9 1.1 2.9 -1.2 0.5 1.6 1.3 0.5 0.5 0.97.6 Private consumption deflator 2.9 6.5 7.3 2.6 4.9 2.6 4.5 0.1 1.0 3.8 3.4 1.3 0.4 1.57.7 Terms of trade 0.0 -0.4 -0.3 -0.1 -1.4 -1.1 -1.6 -1.0 -0.6 -1.3 -1.2 -0.4 0.1 -0.5
8. General government budget, % of GDP
8.1 Expenditure 45.1 40.1 37.7 38.0 36.5 34.2 34.9 41.6 39.8 38.9 38.2 38.7 38.0 37.58.2 Current revenues 36.8 37.4 35.3 35.2 33.3 32.4 32.8 33.5 32.3 34.1 33.7 35.9 35.0 34.78.3 Net borrowing (-) or lending (+) -8.2 -2.8 -2.4 -2.8 -3.2 -1.8 -2.1 -8.0 -7.5 -4.8 -4.5 -2.8 -2.9 -2.88.4 Net borrowing cyclically adjusted -7.4 -2.2 -2.1 -3.0 -4.2 -4.3 -4.7 -7.6 -7.4 -4.4 -3.8 -1.6 -1.7 -1.88.5 Debt (end of period) 43.4 42.4 41.5 34.2 30.5 29.6 27.9 35.6 41.0 43.6 52.7 55.4 56.3 57.8
9. Monetary conditions
9.1 Long-term interest rate 6.9 5.0 5.0 3.5 4.4 4.5 4.7 4.7 3.9 4.5 4.6 3.2 : 9.2 Short-term interest rate 7.8 6.2 4.7 2.9 4.3 4.3 4.2 1.2 0.8 1.4 0.6 0.2 : 9.3 Yield curve (9.1-9.2) -0.8 -1.2 0.4 0.6 0.1 0.2 0.6 3.5 3.1 3.1 4.0 3.0 : 9.4 Real long-term interest rate (c) 3.0 -0.3 -0.8 1.1 1.4 3.3 1.8 6.0 3.4 2.8 3.3 2.7 : 9.5 Nominal effective exchange rate 1.5 5.8 4.6 2.4 3.6 10.4 8.5 6.8 -2.2 0.2 -0.4 1.3 1.1 0.09.6 Real effective exchange rate 82.1 88.5 94.6 100.0 104.8 114.1 124.2 134.5 130.7 131.0 128.5 127.0 127.9 126.6 (2005=100; ULC in total economy)
(a) Manufacturing industry (b) Private consumption deflator (c) GDP deflator

203
Main economic indicators 1961-2015
96. Finland(Annual percentage change, unless otherwise stated)
1961-1973 1974-1985 1986-1990 1991-1995 1996-2000 2001-2005 2006-2010 2009 2010 2011 2012 2013 2014 2015
1. Growth of GDP and its components (real)
1.1 Private consumption 5.2 2.8 3.8 -0.9 3.3 3.3 2.0 -2.9 3.3 2.5 0.3 -0.8 -0.1 0.31.2 Government consumption 5.4 4.0 3.7 -0.6 2.0 1.9 0.8 1.1 -0.4 0.5 0.5 0.8 0.4 0.51.3 Gross fixed capital formation 4.8 1.8 5.2 -7.4 8.1 2.1 -0.2 -13.2 1.7 5.8 -0.8 -4.6 -3.3 2.61.4 of which equipment 4.6 3.1 6.5 -7.4 6.0 0.9 -1.8 -11.4 -12.2 10.5 14.0 -5.3 -6.3 3.01.5 of which construction 5.1 0.8 3.6 -8.9 9.2 2.0 0.2 -15.0 7.2 4.9 -5.2 -5.4 -2.0 2.51.6 Exports of goods and services 7.2 4.5 2.5 7.8 11.4 3.6 1.7 -21.3 7.9 2.8 -0.2 0.3 2.7 4.51.7 Imports of goods and services 7.3 2.8 6.2 1.5 9.7 5.3 1.9 -17.2 6.8 6.2 -0.7 -1.8 1.6 4.01.8 GDP 5.0 3.0 3.4 -0.6 4.8 2.6 0.8 -8.5 3.4 2.8 -1.0 -1.4 0.2 1.0
2. Demand components: Contribution to changes in GDP (%)
2.1 Consumption 3.7 2.2 2.8 -0.6 2.2 2.1 1.2 -1.3 1.7 1.5 0.3 -0.3 0.1 0.32.2 Investment 1.4 0.5 1.3 -1.9 1.5 0.4 0.0 -2.8 0.3 1.1 -0.2 -0.9 -0.6 0.52.3 Stockbuilding 0.1 -0.1 0.1 0.3 0.0 0.2 -0.3 -1.9 0.8 1.5 -0.9 -0.3 0.0 0.02.4 Domestic demand 5.4 2.7 4.3 -2.2 3.7 2.7 0.9 -6.0 2.8 4.1 -0.8 -1.5 -0.6 0.82.5 Exports 1.3 1.3 0.6 2.4 4.4 1.5 0.9 -10.0 3.0 1.1 -0.1 0.1 1.1 1.82.6 Final demand 6.6 4.2 4.9 0.2 8.1 4.2 1.7 -16.0 5.8 5.2 -0.9 -1.3 0.5 2.62.7 Imports -1.4 -0.8 -1.6 -0.6 -2.9 -1.7 -0.8 7.4 -2.4 -2.4 0.3 0.7 -0.6 -1.62.8 Net exports 0.0 0.6 -1.0 1.8 1.4 -0.3 0.1 -2.6 0.5 -1.3 0.2 0.9 0.5 0.2
3. Gross savings and investment in % of GDP at current prices
3.1 Private sector savings 18.9 18.4 16.1 18.0 20.6 20.6 19.7 20.3 20.5 17.6 17.7 16.8 17.0 16.83.2 Net savings of households : : 0.1 3.4 0.7 0.6 0.7 2.4 2.0 0.7 0.5 0.6 : 3.3 General government savings 7.4 7.7 8.5 -1.1 4.2 6.0 4.1 0.2 -0.3 1.5 0.4 0.2 0.1 1.03.4 National savings 26.3 26.1 24.6 16.9 24.8 26.5 23.8 20.5 20.2 19.1 18.1 17.0 17.1 17.83.5 Gross capital formation 27.8 28.3 27.2 18.6 19.5 20.2 20.7 18.6 18.5 20.6 19.9 18.8 18.2 18.63.6 Current account -1.5 -2.2 -3.1 -1.3 5.6 6.4 3.1 2.0 1.7 -1.5 -1.4 -0.8 -0.4 -0.2
4. Determinants of investment
4.1 Capacity utilisation (survey) (a) : : : 85.3 85.6 83.3 80.2 67.4 76.2 79.7 78.7 78.5 : 4.2 Trend GDP gap : -0.2 4.4 -4.8 -0.1 0.5 2.1 -4.0 -1.4 0.9 -0.5 -2.2 -2.3 -1.64.3 Potential GDP gap : -1.5 2.9 -4.2 0.4 -0.3 0.6 -5.4 -2.5 -0.1 -1.4 -2.7 -2.6 -1.94.4 Profitability index (1961-1973 = 100) 100.0 83.2 92.1 89.0 158.0 178.3 158.9 125.8 143.4 149.5 137.1 132.8 132.4 133.5
5. Growth potential
5.1 Growth of net capital stock (real) 4.8 3.4 3.1 0.1 1.3 1.6 1.7 1.0 1.0 1.4 1.3 0.9 0.6 0.75.2 Net capital/output ratio (real) 3.0 3.1 3.0 3.3 2.8 2.6 2.5 2.7 2.6 2.6 2.6 2.7 2.7 2.75.3 Growth of capital intensity 4.3 3.0 2.8 4.0 -0.9 0.8 0.9 3.7 1.1 -0.1 1.2 2.2 0.9 0.45.4 Labour productivity growth 4.5 2.6 3.0 3.2 2.5 1.8 0.1 -6.1 3.4 1.3 -1.1 -0.1 0.4 0.75.5 Total factor productivity growth 2.9 1.5 2.0 1.7 2.9 1.5 -0.3 -7.4 3.0 1.3 -1.5 -0.9 0.1 0.6
6. Employment and unemployment
6.1 Employment 0.4 0.4 0.3 -3.7 2.2 0.8 0.8 -2.6 -0.1 1.5 0.1 -1.3 -0.2 0.36.2 Activity rate 77.2 76.4 76.9 72.6 72.5 74.3 76.1 76.3 76.3 77.0 77.3 77.2 77.6 78.16.3 Employment rate 75.4 72.6 73.8 62.8 63.9 67.7 70.5 70.1 69.9 71.1 71.4 70.9 71.1 71.6 (benchmark) 6.4 Employment rate : : : : : : : : : : : : : (full-time equivalent) 6.5 Unemployment rate 2.3 4.9 4.1 13.3 11.7 8.9 7.5 8.2 8.4 7.8 7.7 8.2 8.5 8.4 (Eurostat definition)
7. Prices and wages
7.1 Nominal wages per head 11.1 13.1 8.7 3.2 2.9 3.3 3.0 2.3 1.8 3.2 3.5 2.1 1.5 1.67.2 Real wages per head (b) 5.1 2.5 4.0 0.5 0.8 2.2 0.9 0.9 -0.1 -0.3 0.5 0.5 0.1 0.37.3 Nominal unit labour costs 6.3 10.3 5.5 0.0 0.4 1.5 2.9 9.0 -1.6 1.9 4.6 2.2 1.1 0.97.4 Real unit labour costs -0.4 0.0 -0.2 -2.0 -1.3 0.6 1.2 7.4 -2.0 -0.8 1.6 0.2 -0.5 -0.57.5 GDP deflator 6.7 10.3 5.7 2.1 1.7 0.9 1.7 1.5 0.3 2.7 2.9 2.0 1.6 1.47.6 Private consumption deflator 5.7 10.4 4.6 2.8 2.1 1.0 2.1 1.4 1.9 3.5 2.9 1.7 1.4 1.37.7 Terms of trade 0.1 -1.1 1.8 0.0 -1.5 -1.1 -1.3 1.2 -2.1 -1.8 -1.2 0.1 0.2 -0.1
8. General government budget, % of GDP
8.1 Expenditure 29.6 39.2 46.9 61.9 53.9 49.5 51.4 55.9 55.5 54.8 56.3 58.1 58.6 58.38.2 Current revenues 32.4 42.8 51.5 56.4 55.1 52.9 53.2 53.4 53.0 54.1 54.5 56.0 56.3 57.08.3 Net borrowing (-) or lending (+) 2.9 3.6 4.6 -5.5 1.1 3.5 1.8 -2.5 -2.5 -0.7 -1.8 -2.1 -2.3 -1.38.4 Net borrowing cyclically adjusted : 3.7 3.4 -3.0 1.0 3.6 1.5 0.4 -1.2 -0.7 -1.1 -0.7 -0.9 -0.38.5 Debt (end of period) : 11.1 16.0 46.4 49.7 42.9 40.2 43.5 48.8 49.3 53.6 57.0 59.9 61.2
9. Monetary conditions
9.1 Long-term interest rate 8.0 11.2 11.6 10.0 5.6 4.3 3.8 3.7 3.0 3.0 1.9 1.9 : 9.2 Short-term interest rate : 12.2 11.6 9.0 3.6 2.8 2.8 1.2 0.8 1.4 0.6 0.2 : 9.3 Yield curve (9.1-9.2) : -1.0 0.0 0.9 2.1 1.5 1.0 2.5 2.2 1.6 1.3 1.6 : 9.4 Real long-term interest rate (c) 1.2 1.0 5.6 7.7 3.8 3.4 2.1 2.2 2.7 0.3 -1.0 -0.1 : 9.5 Nominal effective exchange rate : : : : -1.8 2.0 0.3 1.6 -3.9 -0.1 -2.7 3.1 2.3 0.09.6 Real effective exchange rate : : : : 108.6 106.4 113.6 121.4 115.4 116.3 115.9 120.5 123.1 122.5 (2005=100; ULC in total economy)
(a) Manufacturing industry (b) Private consumption deflator (c) GDP deflator

204
Main economic indicators 1961-2015
97. EA-18(Annual percentage change, unless otherwise stated)
2002 2003 2004 2005 2006 2007 2008 2009 2010 2011 2012 2013 2014 2015
1. Growth of GDP and its components (real)
1.1 Private consumption 0.9 1.2 1.5 1.8 2.1 1.7 0.4 -1.0 1.0 0.3 -1.3 -0.7 0.8 1.31.2 Government consumption 2.4 1.7 1.6 1.6 2.1 2.2 2.3 2.6 0.6 -0.1 -0.6 0.2 0.7 0.51.3 Gross fixed capital formation -1.5 1.1 2.3 3.2 5.6 5.2 -1.4 -12.8 -0.4 1.6 -4.0 -2.9 2.3 4.21.4 of which equipment : : : : : : : : : : : : : 1.5 of which construction : : : : : : : : : : : : : 1.6 Exports of goods and services 2.0 1.2 7.8 5.2 8.9 6.6 1.1 -12.4 11.6 6.5 2.5 1.4 4.0 5.31.7 Imports of goods and services 0.6 3.1 7.2 5.7 8.8 6.3 0.8 -11.0 10.0 4.5 -0.9 0.2 3.8 5.51.8 GDP 0.9 0.7 2.2 1.7 3.3 3.0 0.4 -4.5 1.9 1.6 -0.7 -0.4 1.2 1.7
2. Demand components: Contribution to changes in GDP (%)
2.1 Consumption 1.0 1.0 1.2 1.3 1.7 1.4 0.7 -0.1 0.7 0.1 -0.9 -0.4 0.6 0.92.2 Investment -0.3 0.2 0.5 0.7 1.2 1.1 -0.3 -2.8 -0.1 0.3 -0.8 -0.5 0.4 0.82.3 Stockbuilding -0.3 0.1 0.2 -0.2 0.2 0.3 -0.1 -1.0 0.6 0.3 -0.5 -0.1 -0.1 0.02.4 Domestic demand 0.4 1.4 1.9 1.8 3.1 2.8 0.3 -3.8 1.2 0.7 -2.1 -1.0 1.0 1.62.5 Exports 0.7 0.4 2.8 1.9 3.4 2.7 0.4 -5.2 4.3 2.7 1.1 0.6 1.9 2.52.6 Final demand 1.1 1.9 4.5 3.8 6.5 5.4 0.7 -9.1 5.3 3.3 -1.1 -0.3 2.8 4.12.7 Imports -0.2 -1.1 -2.4 -2.0 -3.2 -2.5 -0.3 4.5 -3.6 -1.8 0.4 -0.1 -1.6 -2.32.8 Net exports 0.5 -0.6 0.3 -0.1 0.2 0.2 0.1 -0.7 0.7 0.9 1.5 0.6 0.3 0.1
3. Gross savings and investment in % of GDP at current prices
3.1 Private sector savings 20.4 20.8 21.4 20.7 20.4 20.4 20.2 21.5 21.8 21.2 20.7 20.6 20.7 21.03.2 Net savings of households 5.9 5.8 5.8 5.4 5.1 5.2 5.4 6.1 5.0 4.6 4.4 : : 3.3 General government savings 0.6 -0.1 0.3 0.7 1.9 2.6 1.3 -2.6 -2.3 -1.1 -0.4 -0.3 0.0 0.23.4 National savings 21.0 20.7 21.7 21.4 22.4 23.1 21.5 18.9 19.5 20.0 20.2 20.3 20.8 21.23.5 Gross capital formation 20.3 20.3 20.7 21.0 21.9 22.7 22.2 18.8 19.2 19.6 18.5 17.7 17.9 18.43.6 Current account 0.8 0.4 1.1 0.4 0.5 0.4 -0.7 0.1 0.3 0.4 1.8 2.6 2.9 2.9
4. Determinants of investment
4.1 Capacity utilisation (survey) (a) 81.6 81.3 81.6 81.5 83.3 84.6 83.1 71.5 76.4 80.2 78.6 78.3 : 4.2 Trend GDP gap 0.3 -0.7 -0.2 0.0 1.9 3.8 3.3 -2.1 -0.8 0.2 -1.1 -2.1 -1.6 -0.74.3 Potential GDP gap 0.9 -0.2 0.2 0.1 1.6 2.8 1.8 -3.4 -2.1 -1.3 -2.4 -3.3 -2.7 -1.84.4 Profitability index (1961-1973 = 100) : : : : : : : : : : : : :
5. Growth potential
5.1 Growth of net capital stock (real) 2.2 2.1 2.1 2.2 2.4 2.6 2.3 1.2 1.1 1.1 0.8 0.5 0.6 0.95.2 Net capital/output ratio (real) 3.0 3.0 3.0 3.0 3.0 3.0 3.0 3.2 3.2 3.2 3.2 3.2 3.2 3.25.3 Growth of capital intensity 1.5 1.8 1.4 1.3 0.9 0.9 1.6 3.4 1.7 0.9 1.6 1.4 0.3 0.15.4 Labour productivity growth 0.3 0.5 1.5 0.9 1.7 1.3 -0.3 -2.4 2.6 1.4 0.2 0.5 0.9 1.05.5 Total factor productivity growth -0.3 -0.2 0.9 0.3 1.4 0.9 -0.9 -3.7 1.9 1.0 -0.5 -0.1 0.7 1.0
6. Employment and unemployment
6.1 Employment 0.8 0.7 0.8 1.0 1.7 1.8 0.7 -2.0 -0.3 0.2 -0.6 -0.9 0.3 0.76.2 Activity rate 71.7 72.2 72.7 73.1 73.6 73.9 74.2 74.2 74.3 74.5 75.1 75.1 75.3 75.56.3 Employment rate 65.9 66.0 66.3 66.7 67.6 68.5 68.7 67.3 67.1 67.2 66.9 66.4 66.7 67.2 (benchmark) 6.4 Employment rate : : : : : : : : : : : : : (full-time equivalent) 6.5 Unemployment rate 8.5 9.0 9.2 9.1 8.4 7.5 7.6 9.6 10.1 10.1 11.3 12.0 11.8 11.4 (Eurostat definition)
7. Prices and wages
7.1 Nominal wages per head 2.7 2.6 2.2 2.0 2.5 2.6 3.5 1.8 2.0 2.2 2.0 1.7 1.6 1.97.2 Real wages per head (b) 0.8 0.4 0.2 -0.1 0.3 0.4 0.8 2.3 0.3 -0.3 0.0 0.4 0.7 0.67.3 Nominal unit labour costs 2.5 2.3 0.8 1.3 0.8 1.4 3.8 4.3 -0.6 0.7 1.8 1.1 0.7 0.87.4 Real unit labour costs -0.2 -0.1 -1.2 -0.7 -1.1 -1.0 1.8 3.3 -1.4 -0.4 0.6 -0.2 -0.4 -0.47.5 GDP deflator 2.6 2.2 1.9 1.9 1.8 2.4 1.9 1.0 0.8 1.2 1.3 1.4 1.2 1.37.6 Private consumption deflator 1.9 2.2 2.1 2.2 2.2 2.2 2.7 -0.4 1.6 2.4 2.1 1.3 0.9 1.37.7 Terms of trade : : : : : : : : : : : : :
8. General government budget, % of GDP
8.1 Expenditure 47.5 48.0 47.4 47.3 46.6 46.0 47.1 51.2 51.0 49.5 49.9 49.8 49.2 48.78.2 Current revenues 44.8 44.8 44.5 44.8 45.3 45.3 45.0 44.9 44.8 45.3 46.2 46.8 46.7 46.58.3 Net borrowing (-) or lending (+) -2.7 -3.1 -2.9 -2.5 -1.4 -0.7 -2.1 -6.3 -6.2 -4.1 -3.7 -3.0 -2.5 -2.38.4 Net borrowing cyclically adjusted -3.2 -3.0 -3.0 -2.6 -2.2 -2.2 -3.1 -4.6 -5.1 -3.5 -2.5 -1.4 -1.1 -1.38.5 Debt (end of period) 68.0 69.2 69.6 70.5 68.6 66.2 70.1 79.9 85.7 88.1 92.7 95.0 96.0 95.4
9. Monetary conditions
9.1 Long-term interest rate 5.0 4.2 4.1 3.4 3.8 4.3 4.3 3.9 3.6 4.3 3.8 3.0 : 9.2 Short-term interest rate 3.4 2.4 2.2 2.2 3.1 4.3 4.6 1.3 0.8 1.4 0.6 0.2 : 9.3 Yield curve (9.1-9.2) 1.6 1.8 2.0 1.2 0.7 0.0 -0.3 2.6 2.8 2.9 3.3 2.8 : 9.4 Real long-term interest rate (c) 2.2 1.8 2.1 1.4 1.9 1.9 2.3 2.9 2.8 3.1 2.5 1.5 : 9.5 Nominal effective exchange rate 3.5 11.4 3.1 -1.0 1.2 3.4 4.1 2.8 -6.7 0.5 -4.4 6.1 3.6 0.09.6 Real effective exchange rate 88.2 98.8 101.7 100.0 99.5 100.9 104.7 109.3 101.3 101.6 97.4 103.3 106.4 105.8 (2005=100; ULC in total economy) ________________________________________________________________________________________________________________________________________________________________

205
Main economic indicators 1961-2015
98. EA-12 1)(Annual percentage change, unless otherwise stated)
1961-1973 1974-1985 1986-1990 1991-1995 1996-2000 2001-2005 2006-2010 2009 2010 2011 2012 2013 2014 2015
1. Growth of GDP and its components (real)
1.1 Private consumption 5.4 2.3 3.5 1.5 2.5 1.4 0.8 -0.9 1.0 0.3 -1.4 -0.7 0.8 1.31.2 Government consumption 4.8 3.3 2.2 1.8 1.7 1.9 1.9 2.6 0.6 -0.1 -0.6 0.2 0.6 0.51.3 Gross fixed capital formation 5.8 0.1 5.8 0.1 4.2 1.0 -1.0 -12.6 -0.4 1.4 -4.0 -2.9 2.3 4.21.4 of which equipment : 1.9 7.4 -0.9 7.7 0.6 0.0 -19.0 5.6 4.2 -4.7 -2.2 4.9 6.41.5 of which construction : -1.1 4.5 0.5 1.5 1.1 -2.0 -9.7 -4.0 -0.3 -4.1 -3.7 0.6 2.41.6 Exports of goods and services 8.8 4.6 5.2 5.6 8.3 3.9 2.7 -12.3 11.6 6.4 2.5 1.3 4.0 5.31.7 Imports of goods and services 9.9 3.2 7.6 4.3 8.7 3.7 2.7 -10.6 9.9 4.3 -1.0 0.1 3.8 5.51.8 GDP 5.2 2.2 3.3 1.6 2.7 1.5 0.8 -4.4 1.9 1.6 -0.7 -0.4 1.2 1.7
2. Demand components: Contribution to changes in GDP (%)
2.1 Consumption 3.9 1.9 2.4 : 1.8 1.2 0.9 0.0 0.7 0.1 -0.9 -0.4 0.6 0.92.2 Investment 1.4 0.0 1.2 : 0.9 0.2 -0.2 -2.7 -0.1 0.3 -0.7 -0.5 0.4 0.82.3 Stockbuilding 0.0 -0.1 0.2 : 0.0 -0.1 0.0 -0.9 0.6 0.3 -0.5 -0.1 -0.1 0.02.4 Domestic demand 5.3 1.9 3.8 : 2.6 1.3 0.7 -3.6 1.2 0.7 -2.1 -1.0 1.0 1.62.5 Exports 1.6 1.1 1.4 : 2.6 1.4 1.1 -5.1 4.2 2.6 1.1 0.6 1.8 2.42.6 Final demand 6.9 3.0 5.2 : 5.2 2.7 1.7 -8.8 5.2 3.2 -1.1 -0.4 2.8 4.02.7 Imports -1.7 -0.8 -1.8 : -2.6 -1.3 -1.0 4.3 -3.5 -1.7 0.4 -0.1 -1.6 -2.32.8 Net exports -0.1 0.4 -0.4 : 0.0 0.2 0.1 -0.8 0.7 0.9 1.5 0.5 0.3 0.1
3. Gross savings and investment in % of GDP at current prices
3.1 Private sector savings : 22.1 22.5 22.1 22.0 20.6 20.9 21.5 21.8 21.1 20.7 20.6 20.7 21.03.2 Net savings of households : : : : 6.7 6.2 5.9 6.6 5.6 5.3 5.0 : : : 3.3 General government savings : 0.4 -0.2 -1.3 -1.5 0.6 0.2 -2.6 -2.3 -1.1 -0.4 -0.3 0.0 0.23.4 National savings 26.0 22.5 22.3 20.8 21.5 21.2 21.1 18.9 19.5 20.0 20.2 20.3 20.8 21.23.5 Gross capital formation 26.2 23.1 21.8 21.3 21.0 20.7 20.9 18.8 19.1 19.6 18.4 17.7 17.9 18.43.6 Current account 0.5 -0.5 0.6 -0.4 0.5 0.6 0.2 0.1 0.3 0.4 1.8 2.6 2.9 2.9
4. Determinants of investment
4.1 Capacity utilisation (survey) (b) (c) : : : : : : : : : : : : : : 4.2 Trend GDP gap (b) : -0.1 0.0 0.2 -0.5 0.2 1.2 -2.1 -0.8 0.2 -1.1 -2.1 -1.6 -0.74.3 Potential GDP gap (b) : -0.1 0.7 0.1 0.3 0.6 0.1 -3.4 -2.1 -1.3 -2.4 -3.3 -2.7 -1.84.4 Profitability index (1961-1973 = 100) (a) 100.0 79.0 97.7 102.0 116.9 122.5 117.3 103.7 108.0 108.8 104.9 105.2 107.1 109.5
5. Growth potential
5.1 Growth of net capital stock (real) (a) 4.5 3.0 2.5 2.4 2.3 2.2 1.9 1.2 1.1 1.1 0.8 0.5 0.6 0.85.2 Net capital/output ratio (real) (b) 2.8 2.9 2.9 2.9 3.0 3.0 3.1 3.2 3.2 3.2 3.2 3.2 3.2 3.25.3 Growth of capital intensity (a) 4.2 2.9 1.0 2.7 0.9 1.4 1.6 3.3 1.6 0.9 1.7 1.5 0.3 0.15.4 Labour productivity growth (a) 5.0 2.1 1.8 1.9 1.2 0.7 0.5 -2.4 2.5 1.4 0.2 0.5 0.9 1.05.5 Total factor productivity growth (a) 3.5 1.1 1.5 0.8 0.9 0.2 -0.1 -3.7 1.8 1.1 -0.5 -0.1 0.7 0.9
6. Employment and unemployment
6.1 Employment (a) 0.3 0.1 1.5 -0.3 1.7 1.0 0.4 -1.8 -0.5 0.1 -0.6 -0.9 0.3 0.76.2 Activity rate (b) 63.8 62.6 63.1 65.5 67.4 70.3 72.4 72.7 72.7 72.8 73.4 73.5 73.6 73.86.3 Employment rate (b) 62.2 58.7 57.5 59.2 60.7 64.4 66.3 65.9 65.5 65.6 65.2 64.8 65.0 65.5 (benchmark) 6.4 Employment rate (b) : : : : : : : : : : : : : : (full-time equivalent) 6.5 Unemployment rate (b) : : : 9.6 10.0 8.6 8.6 9.5 10.0 10.0 11.3 11.9 11.7 11.3 (Eurostat definition)
7. Prices and wages
7.1 Nominal wages per head 10.4 11.2 5.1 4.9 2.0 2.4 2.4 1.7 1.9 2.2 2.1 1.7 1.6 1.97.2 Real wages per head (d) 5.7 1.3 1.3 1.1 0.3 0.3 0.8 2.2 0.3 -0.2 0.0 0.4 0.6 0.67.3 Nominal unit labour costs 5.2 9.0 3.5 3.1 0.9 1.8 1.9 4.3 -0.6 0.7 1.8 1.1 0.7 0.87.4 Real unit labour costs 0.1 -0.4 -1.1 -0.6 -0.6 -0.5 0.3 3.3 -1.3 -0.4 0.6 -0.2 -0.4 -0.47.5 GDP deflator 5.0 9.3 4.4 3.6 1.4 2.2 1.5 1.0 0.8 1.2 1.3 1.4 1.2 1.37.6 Private consumption deflator 4.4 9.7 3.8 3.8 1.7 2.1 1.6 -0.4 1.6 2.4 2.0 1.3 0.9 1.3 0.0 0.0 0.0 0.0 0.0 0.0 0.0 0.0 0.0 0.0 0.0 0.0 0.0 0.0
8. General government budget, % of GDP
8.2 Current revenues : 40.2 43.0 44.5 44.9 44.9 45.2 45.0 45.0 45.5 46.4 46.9 46.9 46.68.3 Net borrowing (-) or lending (+) : -3.8 -4.1 -4.9 -5.0 -2.6 -3.3 -6.3 -6.2 -4.1 -3.7 -3.0 -2.5 -2.38.4 Net borrowing cyclically adjusted : -3.7 -4.1 -5.0 -4.6 -2.9 -3.4 -4.5 -5.1 -3.5 -2.5 -1.3 -1.1 -1.38.5 Debt (end of period) : : 54.9 64.4 72.7 69.7 75.1 80.9 86.8 89.2 93.8 96.0 97.0 96.4 0.0 0.0 0.0 0.0 0.0 0.0 0.0 0.0 0.0 0.0 0.0 0.0 0.0 0.0
9. Monetary conditions
9.2 Short-term interest rate (b) 5.2 11.0 9.3 9.1 4.3 2.8 2.8 1.2 0.8 1.4 0.6 0.2 : : 9.3 Yield curve (9.1-9.2) (b) 1.7 0.6 0.3 0.1 1.4 1.5 1.2 2.6 2.8 2.9 3.2 2.7 : : 9.4 Real long-term interest rate (b) (e) 1.6 1.5 4.7 : 4.0 2.0 2.4 2.8 2.8 3.1 2.5 1.5 : : 9.5 Nominal effective exchange rate (a) : : 7.2 2.0 -2.9 5.3 2.0 5.0 -6.6 0.6 -5.7 6.1 2.8 -0.19.6 Real effective exchange rate (a) : : : : 97.3 95.8 104.5 113.1 103.9 104.2 98.2 104.0 106.1 105.3 (2005=100; ULC in total economy) 0.0 0.0 0.0 0.0 0.0 0.0 0.0 0.0 0.0 0.0 0.0 0.0 0.0 0.0
(a) 1961-91: including West-Germany (b) 1961-90: including West-Germany (c) Manufacturing industry (d) Private consumption deflator (e) GDP deflator

206
Main economic indicators 1961-2015
99. Bulgaria(Annual percentage change, unless otherwise stated)
2002 2003 2004 2005 2006 2007 2008 2009 2010 2011 2012 2013 2014 2015
1. Growth of GDP and its components (real)
1.1 Private consumption 3.6 6.8 7.7 6.7 8.6 9.0 3.4 -7.6 0.1 1.5 3.7 -2.3 1.3 1.71.2 Government consumption 1.2 8.8 3.5 0.4 3.5 0.3 -1.0 -6.5 1.9 1.6 -0.5 2.5 1.5 2.31.3 Gross fixed capital formation 7.6 13.0 13.7 30.7 13.1 11.8 21.9 -17.6 -18.3 -6.5 4.0 -0.3 5.5 2.51.4 of which equipment 16.8 13.6 -4.7 43.1 0.8 28.8 3.1 -45.0 -11.2 24.5 1.0 3.0 6.0 3.01.5 of which construction 0.3 9.4 37.6 21.8 29.0 -2.4 46.1 1.0 -21.6 -22.2 -5.8 -1.8 4.2 2.11.6 Exports of goods and services 9.8 10.6 11.9 -17.5 50.7 6.1 3.0 -11.2 14.7 12.3 -0.4 8.9 4.9 6.51.7 Imports of goods and services 6.8 16.7 13.9 -7.6 47.7 9.6 4.2 -21.0 2.4 8.8 3.3 5.7 5.5 6.41.8 GDP 4.7 5.5 6.7 6.4 6.5 6.4 6.2 -5.5 0.4 1.8 0.6 0.9 1.7 2.0
2. Demand components: Contribution to changes in GDP (%)
2.1 Consumption 2.8 6.4 6.0 4.7 6.6 6.1 2.2 -6.1 0.4 1.2 2.3 -1.1 1.1 1.42.2 Investment 1.4 2.4 2.6 6.3 3.4 3.3 6.3 -5.9 -5.3 -1.5 0.9 -0.1 1.1 0.52.3 Stockbuilding -0.3 1.0 0.5 -0.4 2.5 0.9 -0.7 -3.4 -0.4 0.3 0.0 0.0 0.0 0.02.4 Domestic demand 3.9 9.7 9.2 10.6 12.5 10.3 7.7 -15.5 -5.2 0.0 3.1 -1.1 2.2 2.02.5 Exports 4.8 5.0 5.8 -9.1 20.5 3.7 1.8 -6.5 7.0 7.1 -0.3 6.0 3.4 4.62.6 Final demand 8.6 14.8 14.9 1.6 33.0 14.0 9.5 -22.0 1.7 7.1 2.8 4.8 5.6 6.52.7 Imports -4.0 -9.2 -8.2 4.8 -26.5 -7.6 -3.3 16.5 -1.4 -5.2 -2.2 -3.9 -3.9 -4.62.8 Net exports 0.8 -4.2 -2.4 -4.3 -6.0 -3.8 -1.5 10.0 5.6 1.8 -2.5 2.0 -0.5 0.0
3. Gross savings and investment in % of GDP at current prices
3.1 Private sector savings 14.6 12.9 11.0 11.3 9.2 0.9 8.1 20.8 22.2 21.6 19.4 22.1 22.2 21.53.2 Net savings of households -4.0 -6.5 -8.1 -9.7 -9.6 -12.4 -5.8 -2.7 -3.3 -2.6 -4.2 : : 3.3 General government savings 2.7 2.9 5.3 4.6 5.3 7.9 6.3 -0.4 0.3 0.4 1.5 0.7 0.6 0.83.4 National savings 17.3 15.8 16.3 15.9 14.5 8.8 14.4 20.4 22.5 22.0 20.9 22.8 22.8 22.23.5 Gross capital formation 19.7 21.2 22.7 27.6 32.1 34.1 37.5 29.4 22.9 21.9 21.7 20.9 21.8 22.03.6 Current account -2.4 -5.3 -6.5 -11.7 -17.6 -25.2 -23.2 -9.0 -0.4 0.1 -0.9 1.9 1.0 0.2
4. Determinants of investment
4.1 Capacity utilisation (survey) (a) 56.5 59.3 61.6 63.5 68.2 73.2 71.7 64.2 65.0 68.0 67.2 67.2 : 4.2 Trend GDP gap -3.0 -2.1 0.0 1.9 4.2 7.0 10.1 1.4 -0.4 -0.5 -1.5 -2.2 -1.9 -1.34.3 Potential GDP gap 2.5 1.9 2.8 2.6 3.3 4.6 5.6 -2.3 -2.2 -0.7 -0.6 -1.2 -1.4 -1.74.4 Profitability index (1961-1973 = 100) : : : : : : : : : : : : :
5. Growth potential
5.1 Growth of net capital stock (real) 2.7 2.6 3.5 6.1 7.3 7.7 10.9 6.6 3.4 3.1 3.3 3.5 3.7 3.65.2 Net capital/output ratio (real) 2.2 2.1 2.0 2.0 2.0 2.1 2.2 2.4 2.5 2.5 2.6 2.7 2.7 2.85.3 Growth of capital intensity 2.4 -0.3 0.9 3.3 3.9 4.4 8.3 8.4 7.6 5.4 6.0 3.8 3.4 3.25.4 Labour productivity growth 4.4 2.5 4.1 3.6 3.1 3.2 3.7 -3.8 4.4 4.1 3.2 1.1 1.4 1.65.5 Total factor productivity growth 3.2 2.6 3.6 1.9 1.2 1.0 -0.2 -7.5 0.8 1.5 0.3 -0.7 -0.2 0.0
6. Employment and unemployment
6.1 Employment 0.2 3.0 2.6 2.7 3.3 3.2 2.4 -1.7 -3.9 -2.2 -2.5 -0.3 0.3 0.46.2 Activity rate 71.4 70.3 71.0 71.6 74.1 76.1 77.7 77.9 78.1 78.0 78.0 78.8 79.9 80.96.3 Employment rate 60.0 61.8 63.5 65.3 68.3 71.5 73.8 73.2 71.1 70.5 69.7 69.9 71.0 72.1 (benchmark) 6.4 Employment rate : : : : : : : : : : : : : (full-time equivalent) 6.5 Unemployment rate 18.2 13.7 12.1 10.1 9.0 6.9 5.6 6.8 10.3 11.3 12.3 13.0 12.8 12.5 (Eurostat definition)
7. Prices and wages
7.1 Nominal wages per head 6.0 4.2 6.2 9.3 6.3 12.7 16.8 8.1 9.9 6.8 7.8 6.0 3.6 3.37.2 Real wages per head (b) 1.4 3.4 2.7 2.3 4.0 3.4 9.0 6.5 7.3 2.1 2.2 8.1 3.6 1.77.3 Nominal unit labour costs 1.5 1.6 2.0 5.6 3.1 9.3 12.6 12.4 5.2 2.5 4.4 4.8 2.2 1.67.4 Real unit labour costs -3.0 -0.6 -2.1 -1.7 -3.5 0.1 3.8 7.7 2.4 -2.2 1.3 5.7 1.2 0.17.5 GDP deflator 4.7 2.3 4.2 7.4 6.9 9.2 8.4 4.3 2.8 4.9 3.1 -0.8 0.9 1.67.6 Private consumption deflator 4.5 0.7 3.4 6.8 2.2 9.0 7.2 1.5 2.4 4.6 5.4 -1.9 0.0 1.57.7 Terms of trade -0.8 1.8 1.1 -0.3 4.5 -0.1 -0.4 1.5 2.5 0.1 -0.8 0.1 0.3 -0.1
8. General government budget, % of GDP
8.1 Expenditure 39.6 39.1 38.6 37.3 34.4 39.2 38.4 41.4 37.4 35.6 35.8 38.7 39.4 39.58.2 Current revenues 38.4 38.7 40.4 38.3 36.2 40.4 40.1 37.1 34.3 33.6 35.0 37.2 37.5 37.78.3 Net borrowing (-) or lending (+) -1.2 -0.4 1.9 1.0 1.9 1.2 1.7 -4.3 -3.1 -2.0 -0.8 -1.5 -1.9 -1.88.4 Net borrowing cyclically adjusted -2.0 -1.0 1.0 0.2 0.8 -0.3 -0.1 -3.6 -2.4 -1.8 -0.6 -1.1 -1.5 -1.28.5 Debt (end of period) 52.4 44.4 37.0 27.5 21.6 17.2 13.7 14.6 16.2 16.3 18.4 18.9 23.1 22.7
9. Monetary conditions
9.1 Long-term interest rate 8.3 6.5 5.4 3.9 4.2 4.5 5.4 7.2 6.0 5.4 4.5 3.5 : 9.2 Short-term interest rate 4.9 3.7 3.7 3.6 3.7 4.9 7.1 5.7 4.1 3.8 2.3 1.1 : 9.3 Yield curve (9.1-9.2) 3.4 2.8 1.6 0.3 0.5 -0.4 -1.8 1.5 1.9 1.6 2.3 2.3 : 9.4 Real long-term interest rate (c) 3.4 4.1 1.1 -3.3 -2.5 -4.3 -2.8 2.8 3.1 0.5 1.4 4.3 : 9.5 Nominal effective exchange rate 3.3 4.8 1.2 -1.3 0.8 0.6 1.7 2.6 -2.2 1.3 -0.7 2.1 2.1 -0.19.6 Real effective exchange rate 93.1 95.5 97.8 100.0 102.5 109.7 119.6 131.8 136.0 141.5 143.2 151.1 155.6 155.6 (2005=100; ULC in total economy)
(a) Manufacturing industry (b) Private consumption deflator (c) GDP deflator

207
Main economic indicators 1961-2015
100. Czech Republic(Annual percentage change, unless otherwise stated)
2002 2003 2004 2005 2006 2007 2008 2009 2010 2011 2012 2013 2014 2015
1. Growth of GDP and its components (real)
1.1 Private consumption 3.1 5.3 3.2 3.1 4.4 4.2 2.8 0.2 0.9 0.5 -2.1 0.1 0.7 1.91.2 Government consumption 7.9 6.0 -3.3 1.6 -0.6 0.4 1.2 4.0 0.2 -2.7 -1.9 1.6 1.5 1.31.3 Gross fixed capital formation 3.8 0.6 3.0 6.0 5.8 13.2 4.1 -11.0 1.0 0.4 -4.5 -3.5 2.3 2.61.4 of which equipment 4.5 -4.6 3.6 8.7 6.4 23.0 10.4 -18.7 3.9 6.8 -5.6 -1.3 2.9 3.41.5 of which construction 3.5 6.8 1.4 4.3 5.3 6.0 -1.9 -4.1 -0.1 -5.0 -5.3 -7.1 1.6 1.71.6 Exports of goods and services 2.4 7.6 13.6 11.6 13.8 11.2 4.0 -10.9 15.4 9.5 4.5 0.2 5.0 6.21.7 Imports of goods and services 4.7 7.4 10.0 5.9 10.8 12.8 2.7 -12.1 15.4 7.0 2.3 0.6 4.0 6.01.8 GDP 2.1 3.8 4.7 6.8 7.0 5.7 3.1 -4.5 2.5 1.8 -1.0 -0.9 2.0 2.4
2. Demand components: Contribution to changes in GDP (%)
2.1 Consumption 3.2 4.0 0.9 1.9 2.0 2.1 1.6 0.9 0.5 -0.3 -1.5 0.4 0.7 1.22.2 Investment 1.1 0.2 0.8 1.6 1.5 3.4 1.1 -3.0 0.3 0.1 -1.1 -0.8 0.5 0.62.3 Stockbuilding -0.7 -0.4 1.0 -0.4 1.2 0.9 -0.5 -2.9 1.0 0.1 -0.1 -0.2 -0.2 0.02.4 Domestic demand 3.6 3.8 2.8 3.1 4.7 6.4 2.2 -5.0 1.8 -0.1 -2.7 -0.6 1.0 1.82.5 Exports 1.5 4.4 8.0 7.3 8.9 7.5 2.7 -7.0 9.1 6.4 3.3 0.1 3.9 5.12.6 Final demand 5.2 8.1 10.8 10.4 13.7 13.9 4.9 -12.0 10.9 6.2 0.5 -0.5 4.9 6.92.7 Imports -3.0 -4.4 -6.0 -3.7 -6.6 -8.2 -1.8 7.5 -8.4 -4.4 -1.6 -0.4 -2.9 -4.52.8 Net exports -1.5 0.0 2.0 3.7 2.3 -0.7 0.9 0.5 0.6 1.9 1.7 -0.3 1.0 0.6
3. Gross savings and investment in % of GDP at current prices
3.1 Private sector savings 21.3 20.6 19.1 21.0 21.5 20.2 22.8 21.4 20.3 20.5 19.6 19.6 20.7 21.33.2 Net savings of households 2.8 2.2 1.5 2.5 3.1 2.9 2.5 3.7 3.3 2.7 3.2 2.0 : 3.3 General government savings 1.9 1.3 3.9 3.5 3.5 4.5 3.2 -0.8 -0.5 0.5 1.1 1.5 1.0 0.73.4 National savings 23.2 21.9 23.0 24.5 25.1 24.7 26.0 20.6 19.8 21.0 20.7 21.1 21.7 21.93.5 Gross capital formation 28.2 27.0 27.1 26.5 27.7 29.8 28.9 23.8 24.8 24.5 23.3 22.3 22.1 22.13.6 Current account -5.0 -5.1 -4.1 -2.0 -2.6 -5.1 -2.9 -3.3 -5.0 -3.5 -2.6 -1.2 -0.4 -0.2
4. Determinants of investment
4.1 Capacity utilisation (survey) (a) 85.5 83.8 85.3 86.6 87.2 89.2 88.8 76.8 79.8 83.7 82.3 81.7 : 4.2 Trend GDP gap -3.5 -3.3 -2.2 0.9 4.5 7.2 7.7 0.6 1.2 1.3 -1.2 -3.5 -2.9 -2.04.3 Potential GDP gap -0.1 0.2 0.6 2.5 5.0 5.9 4.7 -1.5 -0.8 -0.5 -1.9 -3.3 -2.4 -1.34.4 Profitability index (1961-1973 = 100) : : : : : : : : : : : : :
5. Growth potential
5.1 Growth of net capital stock (real) 2.3 2.2 2.2 2.4 2.6 3.4 3.3 2.0 1.9 1.7 1.2 0.8 0.9 1.15.2 Net capital/output ratio (real) 3.4 3.3 3.2 3.1 3.0 2.9 2.9 3.1 3.1 3.1 3.2 3.2 3.2 3.25.3 Growth of capital intensity 1.7 3.0 2.5 0.3 1.3 1.2 1.0 3.8 2.9 1.7 0.8 -0.1 0.8 0.65.4 Labour productivity growth 1.5 4.6 5.1 4.6 5.6 3.5 0.8 -2.8 3.5 1.9 -1.4 -1.8 1.8 2.05.5 Total factor productivity growth 0.7 3.1 3.8 4.4 4.9 2.9 0.3 -4.6 2.0 1.0 -1.8 -1.8 1.4 1.7
6. Employment and unemployment
6.1 Employment 0.6 -0.8 -0.3 2.1 1.3 2.1 2.3 -1.8 -1.0 0.0 0.4 0.9 0.2 0.46.2 Activity rate 72.8 72.4 72.2 72.7 72.8 72.2 72.0 72.5 73.1 73.5 74.7 76.7 77.3 78.26.3 Employment rate 67.6 66.9 66.3 67.1 67.7 68.5 68.9 67.8 67.9 68.6 69.6 71.5 72.3 73.2 (benchmark) 6.4 Employment rate : : : : : : : : : : : : : (full-time equivalent) 6.5 Unemployment rate 7.3 7.8 8.3 7.9 7.1 5.3 4.4 6.7 7.3 6.7 7.0 7.0 6.7 6.6 (Eurostat definition)
7. Prices and wages
7.1 Nominal wages per head 7.8 7.9 8.2 3.8 6.0 6.3 4.2 -0.6 3.1 2.3 1.9 -1.9 2.1 2.47.2 Real wages per head (b) 6.4 8.1 4.4 2.9 4.5 3.2 -0.6 -1.4 3.3 1.9 -0.8 -3.0 1.1 0.67.3 Nominal unit labour costs 6.2 3.1 2.9 -0.7 0.4 2.6 3.4 2.2 -0.4 0.5 3.3 -0.1 0.3 0.47.4 Real unit labour costs 3.5 2.2 -1.0 -0.4 -0.1 -0.7 1.5 -0.1 1.2 1.4 1.7 -2.0 -1.1 -1.37.5 GDP deflator 2.7 0.9 4.0 -0.3 0.5 3.3 1.9 2.3 -1.6 -0.9 1.6 1.9 1.3 1.77.6 Private consumption deflator 1.3 -0.2 3.6 0.8 1.5 2.9 4.8 0.8 -0.2 0.5 2.7 1.1 1.0 1.87.7 Terms of trade 2.6 -0.2 0.2 -2.3 -2.4 0.8 -1.4 2.0 -1.9 -1.6 -0.5 1.4 0.1 0.1
8. General government budget, % of GDP
8.1 Expenditure 45.6 50.0 43.3 43.0 42.0 41.0 41.2 44.7 43.8 43.2 44.5 42.4 42.5 42.68.2 Current revenues 39.1 43.3 40.4 39.8 39.6 40.3 38.9 38.9 39.1 40.0 40.3 40.9 40.6 40.28.3 Net borrowing (-) or lending (+) -6.5 -6.7 -2.8 -3.2 -2.4 -0.7 -2.2 -5.8 -4.7 -3.2 -4.2 -1.5 -1.9 -2.48.4 Net borrowing cyclically adjusted -6.5 -6.8 -3.1 -4.2 -4.3 -3.0 -4.1 -5.2 -4.4 -3.0 -3.5 -0.2 -0.9 -1.98.5 Debt (end of period) 27.1 28.6 28.9 28.4 28.3 27.9 28.7 34.6 38.4 41.4 46.2 46.0 44.4 45.8
9. Monetary conditions
9.1 Long-term interest rate 4.9 4.1 4.8 3.5 3.8 4.3 4.6 4.8 3.9 3.7 2.8 2.1 : 9.2 Short-term interest rate 3.5 2.3 2.4 2.0 2.3 3.1 4.0 2.2 1.3 1.2 1.0 0.5 : 9.3 Yield curve (9.1-9.2) 1.3 1.9 2.5 1.5 1.5 1.2 0.6 2.7 2.6 2.5 1.8 1.7 : 9.4 Real long-term interest rate (c) 2.2 3.2 0.8 3.9 3.2 0.9 2.7 2.5 5.5 4.7 1.1 0.2 : 9.5 Nominal effective exchange rate 11.5 -0.3 0.4 6.2 5.2 2.3 12.2 -3.6 2.6 3.1 -3.2 -1.9 -4.6 0.09.6 Real effective exchange rate 92.0 92.9 95.7 100.0 105.1 108.6 121.2 114.3 117.3 120.4 117.7 113.6 107.4 106.5 (2005=100; ULC in total economy)
(a) Manufacturing industry (b) Private consumption deflator (c) GDP deflator

208
Main economic indicators 1961-2015
101. Denmark(Annual percentage change, unless otherwise stated)
1961-1973 1974-1985 1986-1990 1991-1995 1996-2000 2001-2005 2006-2010 2009 2010 2011 2012 2013 2014 2015
1. Growth of GDP and its components (real)
1.1 Private consumption 4.3 1.6 0.9 2.3 1.5 2.2 0.8 -3.6 1.3 -0.7 -0.1 0.0 1.2 1.71.2 Government consumption 5.8 2.8 0.3 2.1 2.5 1.6 1.7 2.1 0.2 -1.4 0.4 0.8 1.2 0.81.3 Gross fixed capital formation 7.1 1.0 2.7 2.5 6.3 1.4 -1.9 -15.9 -2.1 3.3 0.8 0.6 2.4 3.01.4 of which equipment : 7.1 3.6 5.3 5.9 0.2 0.8 -16.0 1.9 -3.8 8.4 6.7 -0.1 5.51.5 of which construction : -2.6 0.6 -1.2 4.9 1.6 -5.4 -18.4 -7.1 9.5 -5.3 -3.8 5.0 0.51.6 Exports of goods and services 6.1 5.6 5.3 3.9 7.4 3.4 1.5 -9.5 3.0 7.0 0.4 1.2 3.1 4.01.7 Imports of goods and services 7.7 4.0 4.1 4.4 7.5 5.2 2.1 -12.3 3.5 5.9 0.9 1.7 2.8 3.81.8 GDP 4.6 2.1 1.4 2.3 2.9 1.3 -0.1 -5.7 1.4 1.1 -0.4 0.4 1.5 1.9
2. Demand components: Contribution to changes in GDP (%)
2.1 Consumption 3.7 1.6 0.6 1.7 1.4 1.5 0.8 -1.2 0.7 -0.8 0.1 0.3 0.9 1.02.2 Investment 1.6 0.2 0.6 0.4 1.2 0.3 -0.3 -3.3 -0.4 0.6 0.1 0.1 0.4 0.52.3 Stockbuilding -0.1 -0.1 -0.1 0.2 0.0 0.1 -0.3 -2.3 1.1 0.4 -0.3 0.2 -0.1 0.02.4 Domestic demand 5.3 1.7 1.1 2.3 2.6 1.8 0.2 -6.8 1.5 0.2 -0.1 0.6 1.2 1.62.5 Exports 1.5 1.8 1.8 1.5 2.9 1.6 0.8 -5.2 1.4 3.5 0.2 0.7 1.7 2.22.6 Final demand 6.8 3.5 2.9 3.8 5.5 3.4 1.0 -12.0 2.9 3.7 0.1 1.3 2.9 3.82.7 Imports -2.2 -1.4 -1.4 -1.4 -2.6 -2.1 -1.0 6.3 -1.5 -2.6 -0.4 -0.9 -1.4 -1.92.8 Net exports -0.7 0.4 0.4 0.0 0.3 -0.6 -0.2 1.1 -0.1 0.9 -0.2 -0.2 0.3 0.3
3. Gross savings and investment in % of GDP at current prices
3.1 Private sector savings 17.2 16.8 16.0 20.7 19.3 20.4 20.2 21.0 23.0 23.2 23.0 23.2 23.2 25.13.2 Net savings of households : : -1.1 -0.1 -1.3 0.1 -0.9 0.0 0.0 0.3 -0.4 -0.1 : 3.3 General government savings 6.1 1.0 2.8 -1.1 2.1 3.2 3.5 -0.6 -0.3 0.5 0.3 1.5 1.1 -0.73.4 National savings 23.3 17.8 18.8 19.7 21.4 23.6 23.7 20.3 22.7 23.7 23.4 24.7 24.2 24.33.5 Gross capital formation 25.7 21.3 21.1 18.0 20.5 20.3 20.5 16.9 16.9 17.7 17.4 17.4 17.4 17.63.6 Current account -2.2 -3.6 -2.3 1.7 0.9 3.3 3.3 3.4 5.8 5.9 6.0 7.3 6.9 6.8
4. Determinants of investment
4.1 Capacity utilisation (survey) (a) : : 81.0 80.6 83.0 81.9 81.6 74.7 76.0 78.0 79.0 78.1 : 4.2 Trend GDP gap : -0.8 1.3 -1.7 0.9 0.0 1.1 -3.1 -2.0 -1.3 -2.0 -2.0 -1.1 0.24.3 Potential GDP gap : -0.2 -0.5 -2.1 1.4 0.9 0.1 -4.7 -4.0 -3.6 -4.6 -4.8 -4.3 -3.64.4 Profitability index (1961-1973 = 100) 100.0 104.2 128.1 140.2 167.0 169.0 154.1 121.8 152.0 157.8 161.4 167.9 174.2 180.5
5. Growth potential
5.1 Growth of net capital stock (real) 2.9 2.0 2.2 0.8 1.7 1.5 1.4 0.1 0.0 0.3 0.4 0.5 0.6 0.85.2 Net capital/output ratio (real) 2.6 2.5 2.5 2.4 2.2 2.2 2.3 2.4 2.4 2.4 2.4 2.4 2.4 2.35.3 Growth of capital intensity 1.7 1.7 1.9 0.9 0.6 1.4 1.3 3.6 2.5 0.6 0.7 0.1 0.2 0.35.4 Labour productivity growth 3.3 1.8 1.2 2.5 1.8 1.2 -0.2 -2.4 3.9 1.3 0.0 0.0 1.1 1.35.5 Total factor productivity growth 2.6 1.1 0.4 2.1 1.6 0.6 -0.7 -3.7 2.9 1.1 -0.3 0.0 1.0 1.2
6. Employment and unemployment
6.1 Employment 1.2 0.3 0.3 -0.2 1.0 0.1 0.1 -3.4 -2.5 -0.2 -0.3 0.4 0.5 0.56.2 Activity rate : 81.5 82.9 81.4 80.7 81.2 82.0 82.2 81.7 81.5 81.3 82.2 82.4 82.66.3 Employment rate : 76.7 78.0 74.9 76.5 77.2 78.0 77.3 75.6 75.4 75.3 76.6 76.9 77.3 (benchmark) 6.4 Employment rate : : : : : : : : : : : : : (full-time equivalent) 6.5 Unemployment rate 1.0 6.1 5.9 8.1 5.2 5.0 4.9 6.0 7.5 7.6 7.5 7.0 6.8 6.6 (Eurostat definition)
7. Prices and wages
7.1 Nominal wages per head 10.8 10.7 5.5 3.1 3.8 3.7 3.5 3.3 3.5 1.3 1.4 1.2 1.8 2.07.2 Real wages per head (b) 4.5 1.3 2.2 1.2 1.8 2.1 1.4 1.7 0.8 -1.4 -1.3 0.2 0.1 0.37.3 Nominal unit labour costs 7.2 8.8 4.2 0.6 1.9 2.5 3.6 5.8 -0.5 0.0 1.5 1.2 0.7 0.77.4 Real unit labour costs 0.3 -0.1 0.4 -1.0 0.0 0.2 0.9 5.1 -4.5 -0.7 -0.8 -0.2 -0.7 -0.87.5 GDP deflator 6.9 8.9 3.8 1.6 2.0 2.3 2.7 0.7 4.3 0.7 2.3 1.4 1.4 1.57.6 Private consumption deflator 6.0 9.3 3.2 1.9 1.9 1.6 2.0 1.5 2.7 2.7 2.8 1.0 1.7 1.77.7 Terms of trade 1.3 -0.8 1.7 0.2 0.5 1.1 0.8 -0.5 3.7 -2.4 0.0 1.6 0.0 -0.4
8. General government budget, % of GDP
8.1 Expenditure 34.1 51.1 54.8 58.6 56.2 54.1 53.9 58.0 57.5 57.5 59.2 57.0 56.8 55.88.2 Current revenues 37.8 49.0 56.0 55.4 56.4 55.9 55.5 55.3 55.0 55.7 55.5 56.2 55.6 53.28.3 Net borrowing (-) or lending (+) 2.1 -2.1 1.2 -3.1 0.2 1.9 1.6 -2.7 -2.5 -1.9 -3.8 -0.8 -1.2 -2.78.4 Net borrowing cyclically adjusted : -1.9 1.5 -1.9 -0.6 1.3 1.5 0.2 -0.1 0.3 -1.0 2.1 1.4 -0.58.5 Debt (end of period) 9.0 74.7 62.0 72.6 52.4 37.8 42.8 40.7 42.8 46.4 45.4 44.5 43.5 44.9
9. Monetary conditions
9.1 Long-term interest rate 9.0 16.0 10.3 8.3 5.8 4.4 3.8 3.6 2.9 2.7 1.4 1.8 : 9.2 Short-term interest rate 7.0 12.6 9.6 9.0 4.1 3.0 3.3 2.5 1.3 1.4 0.6 0.3 : 9.3 Yield curve (9.1-9.2) 2.0 3.4 0.7 -0.7 1.7 1.4 0.5 1.1 1.7 1.4 0.8 1.5 : 9.4 Real long-term interest rate (c) 2.0 6.5 6.2 6.7 3.7 2.1 1.1 2.9 -1.3 2.0 -0.8 0.4 : 9.5 Nominal effective exchange rate : : : : -1.3 1.7 0.4 2.3 -4.0 -0.4 -2.5 2.5 1.9 0.09.6 Real effective exchange rate : : : : 91.6 96.2 108.2 114.4 109.8 108.1 104.6 106.9 108.4 107.7 (2005=100; ULC in total economy)
(a) Manufacturing industry (b) Private consumption deflator (c) GDP deflator

209
Main economic indicators 1961-2015
102. Croatia(Annual percentage change, unless otherwise stated)
2002 2003 2004 2005 2006 2007 2008 2009 2010 2011 2012 2013 2014 2015
1. Growth of GDP and its components (real)
1.1 Private consumption 8.1 3.9 4.0 3.9 3.2 6.5 1.4 -7.5 -1.3 0.4 -3.0 -1.0 -1.2 0.01.2 Government consumption 4.9 1.9 3.8 2.5 4.5 5.0 -0.2 0.4 -2.1 -1.4 -0.8 0.5 -2.9 -2.71.3 Gross fixed capital formation 14.1 24.6 5.1 4.9 11.1 7.1 8.7 -14.2 -15.0 -3.4 -4.7 -1.0 0.0 3.01.4 of which equipment : : : : : : : : : : : : : 1.5 of which construction : : : : : : : : : : : : : 1.6 Exports of goods and services 1.1 11.6 5.4 3.8 6.0 3.7 1.7 -16.2 4.8 1.7 0.9 -1.8 2.6 3.71.7 Imports of goods and services 13.6 12.2 4.9 4.2 8.3 6.1 4.0 -21.4 -2.8 2.1 -2.5 -1.7 1.3 2.31.8 GDP 4.9 5.4 4.1 4.3 4.9 5.1 2.1 -6.9 -2.3 -0.2 -1.9 -1.0 -0.6 0.7
2. Demand components: Contribution to changes in GDP (%)
2.1 Consumption 6.0 2.8 3.2 2.8 2.8 4.8 0.8 -4.3 -1.2 0.0 -2.0 -0.5 -1.3 -0.52.2 Investment 2.7 5.3 1.3 1.2 2.7 1.9 2.3 -3.9 -3.7 -0.7 -0.9 -0.2 0.0 0.62.3 Stockbuilding 2.1 -1.5 -0.2 0.6 0.9 -0.1 0.3 -2.6 -0.3 0.7 -0.4 -0.3 0.0 0.02.4 Domestic demand 10.8 6.6 4.3 4.7 6.4 6.5 3.4 -10.8 -5.2 -0.1 -3.3 -1.0 -1.3 0.02.5 Exports 0.5 4.7 2.3 1.6 2.5 1.6 0.7 -6.8 1.8 0.7 0.4 -0.8 1.1 1.72.6 Final demand 11.3 11.3 6.6 6.3 9.0 8.1 4.1 -17.6 -3.4 0.6 -2.9 -1.7 -0.2 1.72.7 Imports -6.4 -6.0 -2.4 -2.1 -4.0 -3.0 -2.0 10.7 1.1 -0.8 1.1 0.7 -0.6 -1.02.8 Net exports -6.0 -1.2 -0.1 -0.4 -1.5 -1.5 -1.3 3.9 2.9 -0.1 1.4 -0.1 0.5 0.7
3. Gross savings and investment in % of GDP at current prices
3.1 Private sector savings : : : : : : : 20.9 21.0 22.0 20.7 20.4 20.9 20.33.2 Net savings of households 1.7 1.9 1.8 1.4 0.5 -0.8 0.5 3.7 4.3 3.0 3.8 : : 3.3 General government savings : : : : : : : -0.4 -0.9 -2.1 -2.1 -1.2 -0.7 0.43.4 National savings 19.4 20.2 22.3 22.0 22.8 22.2 22.2 20.5 20.1 19.8 18.7 19.1 20.2 20.73.5 Gross capital formation 25.1 27.1 26.5 27.0 29.1 29.1 30.4 24.9 20.9 20.5 19.1 18.6 18.7 19.03.6 Current account -5.7 -6.9 -4.2 -5.1 -6.3 -6.9 -8.3 -4.5 -0.9 -0.7 -0.4 0.5 1.5 1.6
4. Determinants of investment
4.1 Capacity utilisation (survey) (a) : : : : : : : : : : : : : 4.2 Trend GDP gap -2.3 -0.4 0.5 2.0 4.6 8.1 9.2 1.1 -1.3 -1.2 -2.6 -3.1 -3.2 -2.14.3 Potential GDP gap -1.2 0.0 0.8 1.6 3.6 6.4 6.6 -0.9 -2.4 -1.7 -2.2 -2.9 -3.8 -3.74.4 Profitability index (1961-1973 = 100) : : : : : : : : : : : : :
5. Growth potential
5.1 Growth of net capital stock (real) 2.9 4.9 4.4 5.8 6.5 6.6 7.1 4.2 2.1 1.8 1.1 1.0 0.9 1.15.2 Net capital/output ratio (real) 1.8 1.8 1.8 1.8 1.8 1.9 1.9 2.2 2.3 2.3 2.4 2.4 2.5 2.55.3 Growth of capital intensity 2.1 0.9 2.9 5.0 2.5 5.1 3.8 6.1 7.6 4.2 5.2 2.0 3.5 2.25.4 Labour productivity growth 4.0 1.4 2.6 3.5 1.0 3.6 -1.0 -5.2 3.0 2.2 2.1 0.0 1.9 1.75.5 Total factor productivity growth 3.1 1.0 1.4 1.4 0.0 1.4 -2.6 -7.6 -0.2 0.4 -0.1 -0.9 0.4 0.8
6. Employment and unemployment
6.1 Employment 0.8 3.9 1.5 0.7 3.9 1.4 3.1 -1.8 -5.1 -2.3 -3.9 -1.0 -2.5 -1.06.2 Activity rate 56.7 58.0 58.6 58.2 59.2 59.1 60.0 59.4 58.2 58.9 59.5 60.2 59.4 58.96.3 Employment rate 47.7 49.6 50.3 50.5 52.4 53.3 55.0 54.0 51.2 50.9 50.0 50.0 48.8 48.5 (benchmark) 6.4 Employment rate : : : : : : : : : : : : : (full-time equivalent) 6.5 Unemployment rate 15.1 14.1 13.8 12.8 11.4 9.6 8.4 9.1 11.8 13.5 15.9 17.2 18.0 18.0 (Eurostat definition)
7. Prices and wages
7.1 Nominal wages per head 9.7 6.8 4.2 5.5 3.3 8.2 4.4 1.0 1.9 1.9 3.2 1.9 2.5 2.07.2 Real wages per head (b) 7.3 4.4 2.1 2.1 -0.1 5.1 -1.1 -2.2 0.3 -0.5 -0.2 0.0 1.5 0.67.3 Nominal unit labour costs 5.4 5.3 1.6 1.9 2.2 4.4 5.5 6.6 -1.1 -0.3 1.1 1.9 0.6 0.37.4 Real unit labour costs 1.8 1.2 -2.1 -1.4 -1.7 0.3 -0.2 3.6 -1.9 -2.0 -0.7 1.0 -0.2 -0.87.5 GDP deflator 3.5 4.1 3.8 3.3 4.0 4.1 5.7 2.9 0.8 1.8 1.9 0.9 0.8 1.27.6 Private consumption deflator 2.3 2.3 2.1 3.3 3.4 2.9 5.6 3.2 1.5 2.4 3.5 1.9 1.0 1.47.7 Terms of trade 1.7 2.2 2.6 0.2 1.3 1.1 1.1 1.3 0.6 0.3 -0.8 0.0 0.6 -0.1
8. General government budget, % of GDP
8.1 Expenditure : : : : : : : 46.1 46.9 48.1 45.7 45.9 46.8 46.68.2 Current revenues : : : : : : : 40.8 40.5 40.3 40.8 41.0 43.0 43.58.3 Net borrowing (-) or lending (+) : : : : : : : -5.3 -6.4 -7.8 -5.0 -4.9 -3.8 -3.18.4 Net borrowing cyclically adjusted : : : : : : : -4.9 -5.4 -7.2 -4.1 -3.7 -2.2 -1.68.5 Debt (end of period) : : : : : : : 36.6 45.0 52.0 55.9 67.1 69.0 69.2
9. Monetary conditions
9.1 Long-term interest rate : : : : : : : : : 6.5 6.1 4.7 : 9.2 Short-term interest rate : : : : : : : : : 2.9 2.7 1.3 : 9.3 Yield curve (9.1-9.2) : : : : : : : : : 3.7 3.4 3.4 : 9.4 Real long-term interest rate (c) : : : : : : : : : 4.7 4.2 3.7 : 9.5 Nominal effective exchange rate 2.0 0.5 1.8 0.8 1.4 0.5 2.4 -0.4 -1.2 -1.6 -2.2 0.9 0.6 0.09.6 Real effective exchange rate 93.3 96.3 98.7 100.0 102.5 105.7 109.7 111.4 109.1 106.3 102.6 104.1 104.2 103.3 (2005=100; ULC in total economy)
(a) Manufacturing industry (b) Private consumption deflator (c) GDP deflator

210
Main economic indicators 1961-2015
103. Lithuania(Annual percentage change, unless otherwise stated)
2002 2003 2004 2005 2006 2007 2008 2009 2010 2011 2012 2013 2014 2015
1. Growth of GDP and its components (real)
1.1 Private consumption 6.2 11.2 11.7 11.2 10.0 11.3 3.7 -17.8 -3.6 4.8 3.9 4.8 3.8 4.31.2 Government consumption 2.5 2.9 4.1 3.3 2.0 1.6 0.4 -1.4 -3.4 0.3 0.6 1.8 1.6 1.71.3 Gross fixed capital formation 10.7 13.5 15.7 11.2 19.3 21.8 -5.2 -39.5 1.9 20.7 -3.6 12.8 6.5 6.91.4 of which equipment 10.2 6.8 32.4 11.3 16.9 23.5 -17.4 -50.6 22.2 38.1 -4.5 21.8 9.0 9.81.5 of which construction 11.3 19.7 5.8 11.3 22.0 21.4 0.5 -36.9 -7.2 14.3 -4.1 8.6 5.0 5.01.6 Exports of goods and services 18.6 8.4 4.1 17.0 12.2 3.1 11.4 -12.6 17.4 14.1 11.8 9.5 6.3 6.61.7 Imports of goods and services 18.6 8.9 15.2 16.8 13.7 10.6 10.3 -28.1 17.9 13.7 6.1 9.8 7.1 7.41.8 GDP 6.8 10.3 7.4 7.8 7.8 9.8 2.9 -14.8 1.6 6.0 3.7 3.3 3.3 3.7
2. Demand components: Contribution to changes in GDP (%)
2.1 Consumption 4.6 7.9 8.4 8.0 6.9 7.7 2.5 -12.0 -3.2 3.2 2.6 3.4 2.7 3.02.2 Investment 2.2 2.7 3.3 2.5 4.4 5.5 -1.5 -10.0 0.3 3.4 -0.7 2.1 1.2 1.32.3 Stockbuilding 1.1 0.4 2.2 -1.6 -1.7 2.1 2.6 -5.4 5.1 -0.5 -2.5 -2.0 0.0 0.02.4 Domestic demand 7.9 11.0 13.9 8.9 9.6 15.3 3.6 -27.4 2.2 6.0 -0.5 3.4 3.9 4.32.5 Exports 9.2 4.4 2.1 8.8 7.0 1.8 6.2 -7.5 9.4 9.6 9.1 8.0 5.5 5.72.6 Final demand 17.1 15.4 16.0 17.7 16.6 17.1 9.8 -35.0 11.6 15.6 8.6 11.4 9.4 10.02.7 Imports -10.2 -5.2 -8.6 -9.9 -8.8 -7.3 -6.9 20.1 -10.0 -9.5 -4.9 -8.2 -6.0 -6.32.8 Net exports -1.0 -0.7 -6.6 -1.1 -1.8 -5.5 -0.7 12.6 -0.6 0.0 4.2 -0.2 -0.6 -0.6
3. Gross savings and investment in % of GDP at current prices
3.1 Private sector savings 13.5 12.8 12.8 14.1 12.7 12.6 13.0 20.1 21.8 20.3 18.8 20.1 18.6 18.33.2 Net savings of households -0.7 -1.8 -2.9 -2.6 -2.6 -5.5 -3.6 0.7 2.8 0.2 -1.9 : : 3.3 General government savings 1.7 1.8 2.0 2.5 3.1 3.6 1.0 -6.6 -4.8 -2.9 -1.6 -0.4 0.0 0.63.4 National savings 15.2 14.6 14.8 16.6 15.8 16.2 14.0 13.5 16.9 17.4 17.2 19.7 18.6 18.93.5 Gross capital formation 20.3 21.4 22.3 23.6 26.0 31.2 27.1 11.4 17.3 21.3 18.3 18.5 19.4 20.43.6 Current account -5.1 -6.8 -7.5 -7.1 -10.2 -15.0 -13.0 2.1 -0.4 -3.9 -1.1 1.3 -0.8 -1.5
4. Determinants of investment
4.1 Capacity utilisation (survey) (a) 63.6 67.1 68.6 70.7 73.0 73.4 71.0 61.5 64.6 70.3 71.9 73.3 : 4.2 Trend GDP gap -4.2 -0.2 1.5 4.0 7.1 13.1 12.6 -6.7 -7.5 -4.1 -2.7 -1.6 -0.3 1.54.3 Potential GDP gap -2.1 1.3 2.5 4.4 6.2 9.1 6.8 -9.7 -8.2 -3.5 -1.3 -0.7 -0.5 -0.44.4 Profitability index (1961-1973 = 100) : : : : : : : : : : : : :
5. Growth potential
5.1 Growth of net capital stock (real) 3.4 4.7 6.1 7.1 9.2 11.8 8.9 1.2 1.1 3.3 2.8 3.7 4.2 4.65.2 Net capital/output ratio (real) 1.6 1.5 1.5 1.5 1.5 1.5 1.6 1.9 1.9 1.9 1.9 1.9 1.9 1.95.3 Growth of capital intensity -0.3 2.4 6.2 4.5 7.2 8.7 9.6 8.6 14.8 2.8 1.0 2.4 2.8 3.35.4 Labour productivity growth 3.1 7.9 7.4 5.2 5.9 6.8 3.6 -8.6 15.3 5.5 1.9 1.9 1.9 2.55.5 Total factor productivity growth 3.2 6.5 4.1 2.8 2.1 2.3 -1.2 -12.4 7.4 4.0 1.3 0.7 0.5 0.7
6. Employment and unemployment
6.1 Employment 3.6 2.2 0.0 2.5 1.8 2.8 -0.7 -6.8 -11.9 0.5 1.8 1.3 1.4 1.36.2 Activity rate 71.2 72.1 71.8 72.3 72.5 73.6 74.5 76.0 72.6 72.8 73.5 73.5 73.9 74.36.3 Employment rate 61.4 63.2 63.7 66.3 68.4 70.7 70.4 66.2 59.7 61.6 63.7 64.8 66.1 67.2 (benchmark) 6.4 Employment rate : : : : : : : : : : : : : (full-time equivalent) 6.5 Unemployment rate 13.9 12.6 11.6 8.5 5.8 4.3 5.8 13.8 17.8 15.4 13.4 11.8 10.6 9.7 (Eurostat definition)
7. Prices and wages
7.1 Nominal wages per head 5.0 8.9 10.9 11.5 16.7 13.9 14.3 -9.9 7.2 6.3 3.8 4.8 3.3 4.67.2 Real wages per head (b) 5.4 10.6 11.1 9.0 11.4 7.5 3.1 -13.8 5.9 2.1 0.6 3.7 2.3 2.77.3 Nominal unit labour costs 1.8 1.0 3.3 6.0 10.2 6.6 10.4 -1.5 -7.0 0.7 1.9 2.8 1.4 2.07.4 Real unit labour costs 1.5 1.8 0.8 -0.6 3.3 -1.9 0.7 2.0 -9.1 -4.4 -0.7 1.1 -0.2 -0.27.5 GDP deflator 0.2 -0.9 2.5 6.6 6.6 8.6 9.6 -3.4 2.3 5.4 2.6 1.7 1.6 2.37.6 Private consumption deflator -0.4 -1.6 -0.2 2.3 4.7 5.9 10.9 4.5 1.3 4.1 3.1 1.1 1.0 1.87.7 Terms of trade 0.2 -0.1 8.6 1.0 -2.9 0.9 2.9 -4.5 0.8 -1.0 -0.7 0.1 0.1 0.0
8. General government budget, % of GDP
8.1 Expenditure 35.4 33.8 34.0 34.0 34.2 35.3 37.9 44.9 42.2 38.7 36.0 34.4 34.2 33.38.2 Current revenues 33.5 32.5 32.5 33.5 33.7 34.3 34.6 35.5 35.0 33.2 32.7 32.3 32.0 31.78.3 Net borrowing (-) or lending (+) -1.9 -1.3 -1.5 -0.5 -0.4 -1.0 -3.3 -9.4 -7.2 -5.5 -3.2 -2.2 -2.1 -1.68.4 Net borrowing cyclically adjusted -1.2 -1.7 -2.3 -1.9 -2.3 -3.8 -5.4 -6.5 -4.7 -4.4 -2.9 -1.9 -2.0 -1.58.5 Debt (end of period) 22.2 21.0 19.3 18.3 17.9 16.8 15.5 29.3 37.8 38.3 40.5 39.4 41.8 41.4
9. Monetary conditions
9.1 Long-term interest rate 6.1 5.3 4.5 3.7 4.1 4.6 5.6 14.0 5.6 5.2 4.8 3.8 : 9.2 Short-term interest rate 3.7 2.8 2.7 2.4 3.1 5.1 6.0 7.1 1.8 1.7 1.1 0.5 : 9.3 Yield curve (9.1-9.2) 2.3 2.5 1.8 1.3 1.0 -0.6 -0.4 6.9 3.8 3.5 3.8 3.3 : 9.4 Real long-term interest rate (c) 5.8 6.2 1.9 -2.7 -2.4 -3.7 -3.6 18.1 3.2 -0.2 2.1 2.1 : 9.5 Nominal effective exchange rate 5.2 5.0 1.1 -0.6 0.1 0.8 0.9 2.5 -2.6 0.4 -1.4 1.7 1.3 0.09.6 Real effective exchange rate 89.9 93.2 96.7 100.0 107.9 111.4 117.4 114.9 105.4 105.6 103.4 106.1 107.6 108.2 (2005=100; ULC in total economy)
(a) Manufacturing industry (b) Private consumption deflator (c) GDP deflator

211
Main economic indicators 1961-2015
104. Hungary(Annual percentage change, unless otherwise stated)
2002 2003 2004 2005 2006 2007 2008 2009 2010 2011 2012 2013 2014 2015
1. Growth of GDP and its components (real)
1.1 Private consumption 8.2 8.4 1.7 2.3 1.7 1.1 -0.7 -6.6 -3.0 0.4 -1.6 0.2 1.4 1.61.2 Government consumption 5.6 5.0 1.6 2.4 3.4 -7.2 1.1 0.7 -1.2 0.0 -1.2 1.3 1.1 2.01.3 Gross fixed capital formation 7.4 1.5 7.2 4.5 -2.7 3.8 2.9 -11.1 -8.5 -5.9 -3.7 5.9 7.0 4.31.4 of which equipment 0.5 8.7 6.9 1.5 2.7 11.6 1.6 -17.3 -3.1 6.0 3.8 5.0 7.0 4.71.5 of which construction 12.2 -4.4 10.7 4.0 -5.0 -3.2 2.2 -5.9 -13.7 -13.3 -9.1 4.3 7.9 4.21.6 Exports of goods and services 3.8 6.2 15.0 11.3 19.1 15.0 5.7 -10.2 11.3 8.4 1.7 5.3 5.7 6.11.7 Imports of goods and services 6.7 9.3 14.3 6.9 15.1 12.8 5.5 -14.8 10.9 6.4 -0.1 5.3 6.2 6.51.8 GDP 4.5 3.9 4.8 4.0 3.9 0.1 0.9 -6.8 1.1 1.6 -1.7 1.1 2.3 2.1
2. Demand components: Contribution to changes in GDP (%)
2.1 Consumption 5.7 5.7 1.3 1.8 1.7 -1.1 -0.1 -3.4 -1.9 0.2 -1.1 0.4 1.0 1.32.2 Investment 1.8 0.4 1.6 1.0 -0.6 0.8 0.6 -2.4 -1.8 -1.1 -0.7 1.0 1.3 0.82.3 Stockbuilding -0.8 -0.1 1.9 -1.4 0.5 -1.2 0.2 -4.6 3.8 0.4 -1.5 -0.7 0.0 0.02.4 Domestic demand 6.6 6.0 4.9 1.4 1.6 -1.5 0.7 -10.4 0.2 -0.5 -3.3 0.7 2.3 2.12.5 Exports 2.7 3.9 9.2 7.2 12.6 11.6 4.6 -8.4 8.8 7.2 1.5 5.0 5.5 6.02.6 Final demand 9.4 9.9 14.1 8.6 14.2 10.2 5.3 -18.8 8.9 6.7 -1.7 5.7 7.8 8.12.7 Imports -4.9 -6.0 -9.3 -4.6 -10.3 -10.1 -4.4 12.0 -7.9 -5.1 0.1 -4.6 -5.5 -5.92.8 Net exports -2.1 -2.1 -0.1 2.5 2.3 1.6 0.2 3.6 0.9 2.1 1.6 0.4 0.1 0.1
3. Gross savings and investment in % of GDP at current prices
3.1 Private sector savings 18.4 17.4 18.4 19.6 20.7 15.4 16.8 19.5 22.0 22.2 18.6 21.2 21.8 22.03.2 Net savings of households 3.1 1.7 3.1 3.9 4.2 1.9 1.5 2.7 3.0 3.1 1.0 : : 3.3 General government savings -0.5 -2.1 -2.1 -3.2 -4.1 -0.4 -0.2 -1.6 -2.4 -2.4 -0.1 -0.5 -0.6 -0.63.4 National savings 17.9 15.3 16.4 16.4 16.6 15.0 16.6 17.9 19.6 19.8 18.6 20.7 21.1 21.43.5 Gross capital formation 24.7 23.6 25.9 24.5 24.1 22.4 23.5 18.0 19.3 19.2 17.5 17.6 18.1 18.73.6 Current account -6.8 -8.3 -9.5 -8.2 -7.5 -7.4 -6.9 -0.1 0.4 0.6 1.1 3.1 3.0 2.7
4. Determinants of investment
4.1 Capacity utilisation (survey) (a) 80.7 80.2 81.2 82.5 85.0 85.2 84.8 72.6 77.5 78.3 76.4 77.4 : 4.2 Trend GDP gap -0.1 0.6 2.6 4.3 6.3 4.9 4.8 -3.0 -2.6 -1.6 -3.8 -3.4 -2.0 -1.04.3 Potential GDP gap 1.6 2.0 3.1 3.9 5.2 3.2 2.5 -4.9 -3.9 -2.5 -4.2 -3.4 -2.1 -1.04.4 Profitability index (1961-1973 = 100) : : : : : : : : : : : : :
5. Growth potential
5.1 Growth of net capital stock (real) 3.9 3.8 4.4 4.5 3.7 3.7 3.6 2.0 1.0 0.7 0.3 0.7 1.2 1.55.2 Net capital/output ratio (real) 1.9 1.9 1.9 1.9 1.9 2.0 2.0 2.2 2.2 2.2 2.2 2.2 2.2 2.25.3 Growth of capital intensity 4.0 3.8 5.4 4.8 3.3 3.0 5.5 4.6 0.1 0.4 0.3 0.2 0.5 0.95.4 Labour productivity growth 4.6 3.9 5.8 4.3 3.4 -0.6 2.7 -4.4 0.2 1.3 -1.7 0.7 1.6 1.55.5 Total factor productivity growth 2.6 2.0 3.2 2.0 1.9 -2.0 0.2 -6.4 0.1 1.1 -1.8 0.6 1.4 1.1
6. Employment and unemployment
6.1 Employment -0.1 0.0 -1.0 -0.3 0.4 0.7 -1.8 -2.5 0.8 0.3 0.0 0.4 0.7 0.66.2 Activity rate 58.9 59.9 59.8 60.6 61.3 61.2 60.9 61.0 62.0 62.6 64.1 64.8 65.2 65.86.3 Employment rate 55.6 56.5 56.2 56.2 56.7 56.7 56.2 54.9 55.1 55.8 57.1 58.1 59.4 60.0 (benchmark) 6.4 Employment rate : : : : : : : : : : : : : (full-time equivalent) 6.5 Unemployment rate 5.6 5.8 6.1 7.2 7.5 7.4 7.8 10.0 11.2 10.9 10.9 10.2 9.0 8.9 (Eurostat definition)
7. Prices and wages
7.1 Nominal wages per head 13.6 9.9 10.3 7.1 5.6 5.5 7.2 -1.7 -0.5 3.6 0.8 4.7 3.6 3.47.2 Real wages per head (b) 7.4 5.4 4.4 3.4 2.0 -1.3 1.9 -5.4 -4.2 -0.6 -4.9 2.9 2.5 0.67.3 Nominal unit labour costs 8.6 5.8 4.2 2.7 2.0 6.2 4.4 2.8 -0.7 2.3 2.5 4.0 1.9 1.97.4 Real unit labour costs 0.1 0.4 -0.9 0.2 -1.4 0.7 -0.9 -0.7 -3.0 -0.3 -0.6 1.3 -0.3 -0.77.5 GDP deflator 8.5 5.4 5.2 2.5 3.5 5.4 5.3 3.6 2.4 2.6 3.2 2.7 2.2 2.67.6 Private consumption deflator 5.8 4.2 5.6 3.6 3.5 6.9 5.3 3.9 3.9 4.2 6.1 1.7 1.0 2.87.7 Terms of trade 1.3 -0.3 -0.1 -1.6 -1.4 0.4 -0.7 0.7 0.0 -1.4 -1.0 0.6 0.3 0.3
8. General government budget, % of GDP
8.1 Expenditure 51.5 49.7 49.1 50.1 52.1 50.7 49.3 51.5 49.9 50.0 48.6 49.8 50.2 49.38.2 Current revenues 42.5 42.4 42.6 42.2 42.7 45.6 45.5 46.9 45.6 54.3 46.6 47.6 47.3 46.58.3 Net borrowing (-) or lending (+) -9.0 -7.3 -6.5 -7.9 -9.4 -5.1 -3.7 -4.6 -4.3 4.3 -2.1 -2.2 -2.9 -2.88.4 Net borrowing cyclically adjusted -9.7 -8.2 -7.9 -9.7 -11.8 -6.6 -4.9 -2.4 -2.5 5.5 -0.1 -0.6 -1.9 -2.38.5 Debt (end of period) 55.9 58.6 59.5 61.7 65.9 67.0 73.0 79.8 82.2 82.1 79.8 79.2 80.3 79.5
9. Monetary conditions
9.1 Long-term interest rate 7.1 6.8 8.2 6.6 7.1 6.7 8.2 9.1 7.3 7.6 7.9 5.9 : 9.2 Short-term interest rate 9.2 8.5 11.4 7.2 7.0 7.9 8.7 9.3 6.2 6.6 8.1 4.2 : 9.3 Yield curve (9.1-9.2) -2.1 -1.7 -3.2 -0.6 0.2 -1.2 -0.5 -0.1 1.1 1.1 -0.2 1.7 : 9.4 Real long-term interest rate (c) -1.3 1.3 2.8 4.0 3.5 1.2 2.8 5.4 4.8 4.9 4.5 3.2 : 9.5 Nominal effective exchange rate 6.9 -1.2 1.5 0.6 -6.1 5.4 0.8 -8.4 -0.2 -1.0 -4.5 -0.9 -2.1 0.19.6 Real effective exchange rate 90.6 92.9 97.9 100.0 95.1 104.5 105.4 95.1 94.7 95.4 91.2 92.6 91.3 91.9 (2005=100; ULC in total economy)
(a) Manufacturing industry (b) Private consumption deflator (c) GDP deflator

212
Main economic indicators 1961-2015
105. Poland(Annual percentage change, unless otherwise stated)
2002 2003 2004 2005 2006 2007 2008 2009 2010 2011 2012 2013 2014 2015
1. Growth of GDP and its components (real)
1.1 Private consumption 3.4 2.1 4.7 2.1 5.0 4.9 5.7 2.0 3.1 2.6 1.3 0.8 2.3 2.81.2 Government consumption 1.4 4.9 3.1 5.2 6.1 3.7 7.4 2.1 4.1 -1.7 0.2 2.8 3.1 2.61.3 Gross fixed capital formation -6.3 -0.1 6.4 6.5 14.9 17.6 9.6 -1.2 -0.4 8.5 -1.6 -0.2 4.8 7.31.4 of which equipment -8.5 -1.4 9.1 9.9 17.1 22.3 13.0 -10.8 -3.3 11.6 -3.9 5.0 7.2 9.11.5 of which construction -3.8 -0.3 5.3 5.0 13.0 13.4 8.2 4.9 2.2 7.8 -1.0 -3.6 4.2 6.11.6 Exports of goods and services 4.8 14.2 14.0 8.0 14.6 9.1 7.1 -6.8 12.1 7.7 3.9 4.6 4.4 6.01.7 Imports of goods and services 2.8 9.6 15.8 4.7 17.3 13.7 8.0 -12.4 13.9 5.5 -0.7 1.2 4.5 6.51.8 GDP 1.4 3.9 5.3 3.6 6.2 6.8 5.1 1.6 3.9 4.5 2.0 1.6 3.2 3.4
2. Demand components: Contribution to changes in GDP (%)
2.1 Consumption 2.5 2.3 3.6 2.2 4.3 3.8 4.8 1.6 2.7 1.3 0.8 1.0 2.0 2.22.2 Investment -1.3 0.0 1.2 1.2 2.7 3.4 2.1 -0.3 -0.1 1.7 -0.3 0.0 0.9 1.42.3 Stockbuilding -0.2 0.6 1.6 -0.9 0.4 1.7 -1.1 -2.5 2.0 0.7 -0.6 -0.9 0.3 0.02.4 Domestic demand 1.0 2.9 6.4 2.5 7.4 8.9 5.8 -1.1 4.6 3.6 -0.1 0.0 3.2 3.52.5 Exports 1.3 4.1 4.7 3.0 5.4 3.7 2.9 -2.7 4.8 3.3 1.8 2.1 2.1 2.82.6 Final demand 2.3 7.0 11.0 5.5 12.8 12.5 8.6 -3.8 9.3 6.9 1.7 2.1 5.3 6.42.7 Imports -0.9 -3.1 -5.7 -1.9 -6.6 -5.8 -3.5 5.5 -5.5 -2.4 0.3 -0.6 -2.0 -2.92.8 Net exports 0.5 1.0 -1.0 1.1 -1.1 -2.1 -0.6 2.7 -0.7 0.9 2.1 1.6 0.1 -0.1
3. Gross savings and investment in % of GDP at current prices
3.1 Private sector savings 17.4 18.8 16.4 17.3 16.4 15.9 16.9 19.0 19.4 18.2 17.3 18.4 18.2 18.03.2 Net savings of households 6.0 5.5 3.8 4.0 4.3 2.9 -0.2 4.5 4.0 -0.1 1.6 : : 3.3 General government savings -1.0 -1.8 -1.5 -0.2 0.7 2.5 1.3 -1.8 -2.7 -0.6 -0.2 -1.2 -0.6 -0.23.4 National savings 16.5 17.0 14.8 17.0 17.0 18.4 18.3 17.3 16.7 17.6 17.1 17.1 17.6 17.83.5 Gross capital formation 18.6 18.7 20.1 19.3 21.1 24.4 23.9 20.3 21.0 22.1 20.5 18.7 19.3 20.13.6 Current account -2.1 -1.7 -5.2 -2.2 -4.0 -6.1 -5.6 -3.1 -4.3 -4.5 -3.4 -1.6 -1.7 -2.3
4. Determinants of investment
4.1 Capacity utilisation (survey) (a) 68.8 71.8 75.4 75.6 77.4 78.1 79.9 71.1 73.8 73.6 74.7 74.1 : 4.2 Trend GDP gap -2.8 -3.0 -1.9 -2.4 -0.5 2.0 3.1 0.9 1.1 2.0 0.7 -0.9 -0.8 -0.54.3 Potential GDP gap -4.7 -4.5 -2.7 -2.3 0.3 3.1 4.1 1.7 1.5 1.9 0.4 -1.2 -1.2 -1.24.4 Profitability index (1961-1973 = 100) : : : : : : : : : : : : :
5. Growth potential
5.1 Growth of net capital stock (real) 2.5 2.2 2.6 2.8 3.8 5.4 6.2 5.7 5.2 5.7 4.8 4.4 4.5 4.85.2 Net capital/output ratio (real) 2.0 2.0 1.9 1.9 1.9 1.9 1.9 1.9 2.0 2.0 2.1 2.1 2.1 2.25.3 Growth of capital intensity 5.7 3.4 1.4 0.7 0.6 0.9 2.4 5.3 8.1 5.1 4.7 4.5 3.9 4.15.4 Labour productivity growth 4.6 5.1 4.2 1.4 3.0 2.2 1.3 1.3 6.7 3.9 1.9 1.7 2.7 2.85.5 Total factor productivity growth 1.8 3.4 3.4 1.1 2.6 1.8 0.1 -1.3 2.7 1.4 -0.4 -0.5 0.8 0.8
6. Employment and unemployment
6.1 Employment -3.0 -1.2 1.1 2.2 3.2 4.5 3.8 0.4 -2.7 0.6 0.1 -0.1 0.5 0.66.2 Activity rate 65.0 63.6 63.6 63.8 62.8 62.2 62.6 63.4 62.6 62.8 63.5 63.6 63.7 63.96.3 Employment rate 52.1 51.2 51.6 52.6 54.2 56.4 58.3 58.4 56.6 56.7 57.1 57.0 57.4 57.8 (benchmark) 6.4 Employment rate : : : : : : : : : : : : : (full-time equivalent) 6.5 Unemployment rate 20.0 19.8 19.1 17.9 13.9 9.6 7.1 8.1 9.7 9.7 10.1 10.3 9.9 9.5 (Eurostat definition)
7. Prices and wages
7.1 Nominal wages per head 2.3 1.6 1.9 1.7 1.9 4.9 8.6 3.6 8.2 5.1 3.5 2.7 3.5 4.47.2 Real wages per head (b) -1.0 1.2 -1.0 -0.4 0.7 2.4 4.1 1.1 5.6 0.2 -0.2 2.1 2.4 2.57.3 Nominal unit labour costs -2.2 -3.3 -2.1 0.3 -1.0 2.6 7.2 2.3 1.4 1.1 1.5 1.1 0.8 1.67.4 Real unit labour costs -4.4 -3.7 -6.0 -2.3 -2.5 -1.3 4.0 -1.4 0.0 -2.0 -0.9 0.2 -0.2 0.17.5 GDP deflator 2.2 0.4 4.1 2.6 1.5 4.0 3.1 3.7 1.4 3.2 2.4 0.9 1.0 1.57.6 Private consumption deflator 3.3 0.4 3.0 2.1 1.2 2.4 4.3 2.5 2.5 4.9 3.7 0.7 1.1 1.97.7 Terms of trade -0.7 -0.4 3.4 1.1 -0.1 1.7 -1.7 3.5 -1.4 -1.8 -1.3 1.3 0.0 -0.7
8. General government budget, % of GDP
8.1 Expenditure 44.3 44.7 42.6 43.4 43.9 42.2 43.2 44.6 45.4 43.4 42.2 41.9 41.3 41.28.2 Current revenues 39.3 38.5 37.2 39.4 40.2 40.3 39.5 37.2 37.5 38.4 38.3 37.5 47.0 38.38.3 Net borrowing (-) or lending (+) -5.0 -6.2 -5.4 -4.1 -3.6 -1.9 -3.7 -7.5 -7.8 -5.1 -3.9 -4.3 5.7 -2.98.4 Net borrowing cyclically adjusted -3.1 -4.4 -4.3 -3.1 -3.8 -3.1 -5.3 -8.2 -8.4 -5.8 -4.0 -3.8 6.2 -2.48.5 Debt (end of period) 42.2 47.1 45.7 47.1 47.7 45.0 47.1 50.9 54.9 56.2 55.6 57.0 49.2 50.0
9. Monetary conditions
9.1 Long-term interest rate 7.4 5.8 6.9 5.2 5.2 5.5 6.1 6.1 5.8 6.0 5.0 4.0 : 9.2 Short-term interest rate 9.0 5.7 6.2 5.3 4.2 4.7 6.4 4.4 3.9 4.5 4.9 3.0 : 9.3 Yield curve (9.1-9.2) -1.6 0.1 0.7 -0.1 1.0 0.7 -0.3 1.7 1.9 1.4 0.1 1.0 : 9.4 Real long-term interest rate (c) 5.0 5.4 2.7 2.5 3.7 1.5 2.9 2.3 4.3 2.7 2.5 3.1 : 9.5 Nominal effective exchange rate -4.3 -10.1 -2.3 12.1 3.5 3.4 9.1 -17.7 6.2 -2.8 -2.7 1.3 1.6 0.09.6 Real effective exchange rate 111.1 94.7 90.0 100.0 101.4 105.5 118.6 95.7 103.6 101.0 97.3 98.0 99.2 99.5 (2005=100; ULC in total economy)
(a) Manufacturing industry (b) Private consumption deflator (c) GDP deflator

213
Main economic indicators 1961-2015
106. Romania(Annual percentage change, unless otherwise stated)
2002 2003 2004 2005 2006 2007 2008 2009 2010 2011 2012 2013 2014 2015
1. Growth of GDP and its components (real)
1.1 Private consumption 6.2 8.3 15.9 10.1 12.7 11.9 9.0 -10.1 -0.3 1.4 1.5 1.3 2.0 3.01.2 Government consumption -4.2 9.8 -8.6 3.8 -4.1 -0.1 7.2 3.1 -4.7 -0.2 1.2 -1.8 1.8 1.61.3 Gross fixed capital formation 8.9 8.8 11.0 15.3 19.9 30.3 15.6 -28.1 -1.8 7.7 3.8 -3.3 2.7 4.31.4 of which equipment 7.4 16.6 8.9 18.9 23.5 28.3 10.9 -27.7 -19.1 23.6 4.1 -3.8 2.5 4.51.5 of which construction 9.9 4.1 11.4 17.0 15.3 37.3 20.3 -28.7 11.3 -4.3 3.5 -3.1 2.9 4.21.6 Exports of goods and services 17.1 9.3 14.1 7.6 10.4 7.8 8.3 -6.4 13.2 11.6 -1.5 13.5 6.5 5.61.7 Imports of goods and services 12.3 16.5 22.1 16.0 22.6 27.3 7.9 -20.5 11.1 10.5 -0.2 2.4 5.9 6.81.8 GDP 5.1 5.2 8.5 4.2 7.9 6.3 7.3 -6.6 -1.1 2.3 0.6 3.5 2.5 2.6
2. Demand components: Contribution to changes in GDP (%)
2.1 Consumption 3.6 7.2 8.8 7.6 8.1 8.2 7.2 -6.0 -1.1 0.8 1.1 0.6 1.5 2.12.2 Investment 1.8 1.9 2.4 3.3 4.7 7.8 4.7 -9.0 -0.4 1.9 1.0 -0.9 0.6 1.02.3 Stockbuilding -1.0 -0.3 1.7 -2.3 1.4 0.0 -3.5 1.4 0.4 -0.2 -1.1 -0.6 0.0 0.02.4 Domestic demand 4.4 8.7 12.9 8.6 14.2 15.9 8.3 -13.5 -1.1 2.6 1.0 -0.9 2.2 3.22.5 Exports 5.7 3.3 4.9 2.7 3.5 2.5 2.4 -2.0 4.0 4.1 -0.6 5.5 2.8 2.42.6 Final demand 10.1 12.0 17.8 11.3 17.7 18.4 10.8 -15.5 2.9 6.7 0.5 4.6 5.0 5.52.7 Imports -5.0 -6.8 -9.3 -7.2 -9.8 -12.1 -3.4 8.9 -4.1 -4.3 0.1 -1.1 -2.5 -2.92.8 Net exports 0.7 -3.5 -4.4 -4.5 -6.3 -9.6 -1.0 7.0 0.0 -0.2 -0.5 4.4 0.3 -0.5
3. Gross savings and investment in % of GDP at current prices
3.1 Private sector savings 18.5 13.8 14.5 11.0 11.6 13.8 18.6 24.2 22.1 20.6 19.6 19.4 19.5 19.13.2 Net savings of households -8.5 -12.4 -10.6 -13.7 -14.2 -12.1 -5.7 -6.1 -7.7 : : : : 3.3 General government savings 2.4 3.3 3.4 3.4 4.3 3.6 1.2 -3.0 -0.9 1.8 2.0 2.5 2.5 2.83.4 National savings 20.9 17.1 17.9 14.4 15.9 17.4 19.8 21.2 21.2 22.4 21.5 21.9 22.0 21.93.5 Gross capital formation 22.0 22.0 23.7 23.3 26.5 31.0 31.3 25.4 25.6 26.8 26.0 22.9 23.2 23.43.6 Current account -1.1 -4.9 -5.8 -8.9 -10.6 -13.6 -11.4 -4.2 -4.4 -4.5 -4.4 -1.1 -1.2 -1.6
4. Determinants of investment
4.1 Capacity utilisation (survey) (a) 78.0 82.4 80.0 79.9 82.8 83.8 82.4 72.2 74.8 79.9 78.8 78.0 : 4.2 Trend GDP gap -3.8 -2.7 1.3 1.3 5.1 7.8 12.1 1.8 -1.8 -1.7 -3.3 -2.0 -1.7 -1.34.3 Potential GDP gap -1.0 0.3 4.1 3.4 5.7 6.3 8.6 0.2 -2.3 -1.8 -3.2 -1.6 -1.2 -0.84.4 Profitability index (1961-1973 = 100) : : : : : : : : : : : : :
5. Growth potential
5.1 Growth of net capital stock (real) -0.6 0.3 1.6 3.6 6.2 10.9 12.3 4.2 4.1 4.2 4.3 2.8 2.9 3.25.2 Net capital/output ratio (real) 1.7 1.6 1.5 1.5 1.5 1.5 1.6 1.8 1.9 1.9 2.0 2.0 2.0 2.05.3 Growth of capital intensity 10.6 0.3 3.3 5.2 5.5 10.5 12.3 6.3 4.4 5.0 2.9 3.1 2.5 2.45.4 Labour productivity growth 17.0 5.3 10.3 5.8 7.1 5.9 7.3 -4.7 -0.9 3.2 -0.8 3.9 2.1 1.95.5 Total factor productivity growth 12.1 5.1 8.8 3.5 4.8 1.6 2.2 -7.1 -2.7 1.1 -1.9 2.5 1.0 0.9
6. Employment and unemployment
6.1 Employment -10.2 0.0 -1.7 -1.5 0.7 0.4 0.0 -2.0 -0.3 -0.8 1.3 -0.3 0.4 0.76.2 Activity rate 69.8 69.1 69.3 68.7 70.1 71.6 72.3 72.8 73.5 73.1 74.0 74.3 74.7 75.36.3 Employment rate 64.6 64.5 63.9 63.9 65.2 67.2 68.3 68.0 68.3 67.8 68.9 68.9 69.4 70.0 (benchmark) 6.4 Employment rate : : : : : : : : : : : : : (full-time equivalent) 6.5 Unemployment rate 7.5 6.8 8.0 7.2 7.3 6.4 5.8 6.9 7.3 7.4 7.0 7.3 7.2 7.1 (Eurostat definition)
7. Prices and wages
7.1 Nominal wages per head 16.7 27.4 13.8 29.1 12.4 22.0 31.9 -1.9 -3.3 -4.1 4.2 5.9 5.4 4.57.2 Real wages per head (b) -3.0 10.0 0.9 20.8 7.2 16.5 19.9 -5.4 -10.2 -8.0 0.2 1.5 2.4 1.27.3 Nominal unit labour costs -0.2 21.0 3.1 22.0 4.9 15.2 22.9 2.9 -2.4 -7.0 5.0 2.0 3.3 2.57.4 Real unit labour costs -18.7 -2.0 -10.7 8.8 -5.1 1.5 6.6 -1.2 -7.7 -10.6 0.3 -1.4 0.5 -0.37.5 GDP deflator 22.7 23.4 15.5 12.2 10.6 13.5 15.3 4.2 5.7 4.0 4.7 3.5 2.8 2.87.6 Private consumption deflator 20.3 15.8 12.7 6.9 4.9 4.8 10.0 3.7 7.7 4.3 3.9 4.4 2.9 3.27.7 Terms of trade 1.8 1.7 3.9 3.2 5.8 9.9 2.8 1.3 1.1 1.6 2.8 -0.6 -0.7 0.1
8. General government budget, % of GDP
8.1 Expenditure 35.0 33.5 33.6 33.6 35.5 38.2 39.3 41.1 40.1 39.4 36.7 35.0 34.8 34.78.2 Current revenues 33.0 32.0 32.3 32.4 33.3 35.3 33.6 32.1 33.3 33.9 33.7 32.7 32.6 32.88.3 Net borrowing (-) or lending (+) -2.0 -1.5 -1.2 -1.2 -2.2 -2.9 -5.7 -9.0 -6.8 -5.5 -3.0 -2.3 -2.2 -1.98.4 Net borrowing cyclically adjusted -1.7 -1.6 -2.6 -2.3 -4.1 -5.0 -8.5 -9.1 -6.0 -5.0 -1.9 -1.7 -1.8 -1.78.5 Debt (end of period) 24.9 21.5 18.7 15.8 12.4 12.8 13.4 23.6 30.5 34.7 38.0 38.4 39.9 40.1
9. Monetary conditions
9.1 Long-term interest rate : : : : 7.2 7.1 7.7 9.7 7.3 7.3 6.7 5.4 : 9.2 Short-term interest rate 27.3 17.7 19.1 8.4 8.1 7.2 12.3 11.3 6.5 5.6 5.1 4.0 : 9.3 Yield curve (9.1-9.2) : : : : -0.9 -0.1 -4.6 -1.7 0.8 1.7 1.6 1.4 : 9.4 Real long-term interest rate (c) : : : : -3.0 -5.6 -6.6 5.2 1.5 3.2 1.9 1.9 : 9.5 Nominal effective exchange rate -15.3 -13.8 -6.6 11.2 3.6 6.2 -8.4 -11.5 -1.3 0.4 -5.9 2.8 0.5 0.19.6 Real effective exchange rate 77.0 78.1 74.6 100.0 107.1 128.4 138.7 120.6 116.2 107.7 103.6 106.7 109.3 110.6 (2005=100; ULC in total economy)
(a) Manufacturing industry (b) Private consumption deflator (c) GDP deflator

214
Main economic indicators 1961-2015
107. Sweden(Annual percentage change, unless otherwise stated)
1961-1973 1974-1985 1986-1990 1991-1995 1996-2000 2001-2005 2006-2010 2009 2010 2011 2012 2013 2014 2015
1. Growth of GDP and its components (real)
1.1 Private consumption 3.3 1.2 2.6 -0.2 3.4 2.2 2.0 -0.3 4.0 1.7 1.6 2.0 2.9 2.81.2 Government consumption 4.9 2.6 1.8 1.1 0.8 0.7 1.5 2.2 2.1 0.8 0.3 2.0 1.2 1.11.3 Gross fixed capital formation 4.4 1.3 4.9 -4.4 5.7 2.9 1.8 -15.5 7.2 8.2 3.3 -1.3 5.5 6.51.4 of which equipment : : 8.4 -1.4 8.3 3.0 2.4 -22.7 11.9 13.2 5.2 -2.5 3.9 8.11.5 of which construction : -0.5 1.4 -6.9 0.9 3.4 1.3 -11.8 4.5 3.5 0.7 -0.5 7.2 4.71.6 Exports of goods and services 7.7 3.5 3.3 6.4 9.2 4.7 2.4 -13.8 11.4 6.1 0.7 -0.9 3.7 5.41.7 Imports of goods and services 6.1 2.6 4.9 2.6 8.7 2.8 3.4 -14.3 12.0 7.1 -0.6 -1.2 4.7 5.91.8 GDP 4.1 1.9 2.4 0.7 3.5 2.7 1.6 -5.0 6.6 2.9 0.9 1.5 2.8 3.0
2. Demand components: Contribution to changes in GDP (%)
2.1 Consumption 2.8 1.3 1.8 0.2 1.9 1.3 1.4 0.4 2.5 1.0 0.9 1.5 1.8 1.72.2 Investment 1.1 0.3 1.0 -1.0 0.9 0.5 0.4 -3.1 1.3 1.5 0.6 -0.2 1.0 1.22.3 Stockbuilding -0.1 0.0 0.0 0.2 -0.1 -0.1 0.2 -1.6 2.2 0.5 -1.2 0.2 0.2 0.02.4 Domestic demand 3.8 1.6 2.8 -0.6 2.8 1.6 1.9 -4.3 6.1 3.0 0.3 1.4 2.9 2.92.5 Exports 1.7 1.1 1.1 2.1 3.8 2.1 1.2 -7.4 5.5 3.0 0.4 -0.4 1.7 2.52.6 Final demand 5.4 2.7 3.9 1.6 6.6 3.8 3.2 -11.7 11.5 6.0 0.7 1.0 4.7 5.42.7 Imports -1.3 -0.8 -1.5 -0.9 -3.0 -1.1 -1.5 6.7 -5.0 -3.1 0.3 0.5 -1.9 -2.42.8 Net exports 0.4 0.3 -0.4 1.3 0.8 1.0 -0.2 -0.7 0.5 -0.1 0.6 0.1 -0.2 0.1
3. Gross savings and investment in % of GDP at current prices
3.1 Private sector savings : 17.3 17.4 21.6 18.8 20.4 22.0 20.8 22.2 22.6 22.8 23.1 23.2 22.93.2 Net savings of households : : -0.1 4.1 1.5 3.0 4.2 6.1 4.4 5.5 6.7 6.7 : 3.3 General government savings : 2.8 5.2 -3.8 3.0 3.2 4.7 2.5 3.4 3.5 2.6 1.9 1.9 2.63.4 National savings 25.1 20.1 22.6 17.8 21.8 23.7 26.7 23.4 25.6 26.1 25.3 25.0 25.1 25.53.5 Gross capital formation 26.7 21.7 22.3 17.6 17.3 17.5 18.9 16.5 18.7 19.9 18.9 18.4 19.0 19.53.6 Current account 1.0 -0.4 0.3 0.3 4.5 6.1 7.8 6.9 6.9 6.2 6.5 6.6 6.1 6.0
4. Determinants of investment
4.1 Capacity utilisation (survey) (a) : : : : 85.4 84.3 83.0 73.7 80.2 85.1 82.2 80.1 : 4.2 Trend GDP gap : -0.4 2.8 -2.2 -0.4 0.5 0.7 -5.3 -0.9 0.0 -0.9 -1.3 -0.6 0.44.3 Potential GDP gap : 0.4 1.0 -2.1 -0.3 -0.3 -0.3 -5.8 -1.5 -0.4 -1.4 -2.0 -1.4 -0.74.4 Profitability index (1961-1973 = 100) 100.0 90.4 108.9 111.4 130.6 130.8 142.9 123.3 141.5 149.1 143.1 143.9 146.6 151.3
5. Growth potential
5.1 Growth of net capital stock (real) 4.2 2.6 2.8 1.5 1.5 1.5 2.0 1.2 1.6 1.9 2.0 1.7 1.9 2.25.2 Net capital/output ratio (real) 2.9 3.2 3.3 3.6 3.3 3.1 3.0 3.2 3.0 3.0 3.0 3.0 3.0 3.05.3 Growth of capital intensity 3.6 1.8 1.8 3.5 0.7 1.3 1.3 3.7 0.6 -0.2 1.2 0.7 0.8 1.15.4 Labour productivity growth 3.5 1.1 1.4 2.8 2.7 2.5 0.9 -2.7 5.5 0.8 0.2 0.5 1.6 1.95.5 Total factor productivity growth 2.1 0.4 0.7 1.4 2.4 2.0 0.4 -4.1 5.3 0.9 -0.3 0.3 1.3 1.5
6. Employment and unemployment
6.1 Employment 0.6 0.9 0.8 -2.2 0.9 0.5 1.3 -2.0 1.0 2.1 0.7 1.0 1.2 1.16.2 Activity rate 73.9 80.2 82.3 79.2 77.2 78.2 80.4 80.7 81.4 82.3 83.1 83.6 83.7 83.76.3 Employment rate 72.5 78.2 80.6 73.5 70.9 72.9 74.6 73.9 74.4 75.9 76.5 77.0 77.3 77.7 (benchmark) 6.4 Employment rate : : : : : : : : : : : : : (full-time equivalent) 6.5 Unemployment rate 1.9 2.4 2.0 7.2 8.0 6.7 7.3 8.3 8.6 7.8 8.0 8.0 7.6 7.2 (Eurostat definition)
7. Prices and wages
7.1 Nominal wages per head 8.4 10.7 9.2 4.5 4.6 3.5 2.7 1.6 3.1 0.9 3.1 1.2 2.7 3.07.2 Real wages per head (b) 3.5 0.6 2.4 -0.3 3.5 2.0 0.8 -0.5 1.6 -0.7 1.9 0.5 2.1 1.47.3 Nominal unit labour costs 4.7 9.5 7.7 1.7 1.9 1.0 1.7 4.4 -2.3 0.1 2.9 0.7 1.2 1.17.4 Real unit labour costs -0.1 -0.3 0.7 -1.8 0.8 -0.4 -0.4 2.3 -3.1 -1.2 1.9 -0.2 -0.1 -0.67.5 GDP deflator 4.9 9.9 7.0 3.5 1.0 1.4 2.1 2.1 0.8 1.3 1.0 0.8 1.2 1.87.6 Private consumption deflator 4.8 10.0 6.6 4.7 1.0 1.4 1.8 2.1 1.5 1.7 1.2 0.6 0.6 1.67.7 Terms of trade -0.5 -1.4 0.8 -0.5 -1.2 -1.2 0.1 0.5 -0.6 -0.5 -0.4 0.0 0.1 0.2
8. General government budget, % of GDP
8.1 Expenditure : 55.9 56.1 62.4 59.1 54.6 52.4 54.7 52.0 51.3 51.8 52.6 52.2 51.38.2 Current revenues : 54.2 59.1 55.2 59.2 55.0 53.9 54.0 52.3 51.5 51.2 51.5 50.5 50.58.3 Net borrowing (-) or lending (+) : -1.6 3.0 -7.2 0.1 0.4 1.5 -0.7 0.3 0.2 -0.6 -1.1 -1.8 -0.88.4 Net borrowing cyclically adjusted : -1.3 1.5 -5.8 0.3 0.6 1.7 2.7 1.2 0.4 0.3 0.1 -0.9 -0.48.5 Debt (end of period) 26.4 59.8 40.6 72.8 53.9 50.4 39.4 42.6 39.4 38.6 38.3 40.6 41.6 40.4
9. Monetary conditions
9.1 Long-term interest rate 6.3 11.0 11.5 9.8 6.0 4.6 3.6 3.3 2.9 2.6 1.6 2.1 : 9.2 Short-term interest rate : : 11.0 10.1 4.4 3.2 2.6 0.9 0.9 2.5 2.0 1.2 : 9.3 Yield curve (9.1-9.2) : : 0.5 -0.3 1.6 1.4 1.0 2.3 2.0 0.2 -0.4 0.9 : 9.4 Real long-term interest rate (c) 1.4 1.1 4.2 6.1 4.9 3.2 1.4 1.2 2.0 1.3 0.5 1.3 : 9.5 Nominal effective exchange rate : : : : 1.1 0.0 -0.2 -8.4 7.4 5.9 1.1 3.6 -1.9 -0.59.6 Real effective exchange rate : : : : 106.7 100.6 97.1 90.8 95.5 99.9 101.7 104.3 102.3 101.5 (2005=100; ULC in total economy)
(a) Manufacturing industry (b) Private consumption deflator (c) GDP deflator

215
Main economic indicators 1961-2015
108. United Kingdom(Annual percentage change, unless otherwise stated)
1961-1973 1974-1985 1986-1990 1991-1995 1996-2000 2001-2005 2006-2010 2009 2010 2011 2012 2013 2014 2015
1. Growth of GDP and its components (real)
1.1 Private consumption 3.0 1.6 4.8 2.0 4.9 3.4 0.2 -3.6 1.0 -0.4 1.4 2.2 2.1 2.21.2 Government consumption 2.6 1.4 0.9 1.1 2.0 3.6 1.2 0.7 0.5 0.0 1.6 0.7 0.5 0.21.3 Gross fixed capital formation 4.6 0.9 5.9 1.0 6.5 2.6 -2.0 -16.7 2.8 -2.4 0.8 -0.6 6.6 7.11.4 of which equipment : 1.4 4.6 -0.8 6.6 -0.3 -0.7 -20.3 10.0 -21.8 12.9 1.0 7.9 8.21.5 of which construction : 1.0 6.2 2.4 4.4 3.9 -2.3 -16.2 1.9 3.6 -3.9 0.8 7.3 7.41.6 Exports of goods and services 5.5 3.4 4.1 5.5 6.1 4.2 1.6 -8.7 6.7 4.5 1.7 1.0 2.6 3.21.7 Imports of goods and services 5.2 2.6 7.0 3.4 9.2 5.3 0.5 -10.7 7.9 0.3 3.4 0.5 2.0 2.81.8 GDP 3.2 1.5 3.3 2.4 3.7 3.0 0.3 -5.2 1.7 1.1 0.3 1.7 2.7 2.5
2. Demand components: Contribution to changes in GDP (%)
2.1 Consumption 2.3 1.2 3.1 1.5 3.5 2.9 0.4 -2.1 0.8 -0.3 1.3 1.6 1.5 1.52.2 Investment 0.9 0.2 1.1 0.1 1.1 0.4 -0.3 -2.8 0.4 -0.4 0.1 -0.1 0.9 1.02.3 Stockbuilding 0.1 -0.2 -0.1 0.4 0.0 0.0 0.0 -1.5 1.3 0.5 -0.2 0.3 0.1 0.02.4 Domestic demand 3.2 1.3 4.2 1.8 4.6 3.4 0.1 -6.0 2.1 -0.1 1.2 1.8 2.6 2.52.5 Exports 1.1 0.9 1.0 1.4 1.7 1.1 0.4 -2.5 1.9 1.3 0.6 0.3 0.8 1.02.6 Final demand 4.3 2.2 5.2 3.2 6.3 4.5 0.6 -8.6 4.0 1.2 1.7 2.1 3.4 3.52.7 Imports -1.1 -0.7 -1.9 -0.9 -2.5 -1.5 -0.2 3.4 -2.4 -0.1 -1.1 -0.2 -0.7 -0.92.8 Net exports 0.0 0.2 -0.8 0.5 -0.8 -0.4 0.3 0.8 -0.5 1.2 -0.6 0.2 0.1 0.1
3. Gross savings and investment in % of GDP at current prices
3.1 Private sector savings 16.2 17.7 15.5 18.5 15.7 15.6 17.5 19.3 18.9 18.4 15.9 13.1 13.5 13.53.2 Net savings of households : : : 3.9 1.6 -0.4 -0.4 1.5 1.9 1.4 2.0 : : 3.3 General government savings 4.1 0.5 1.7 -2.9 0.9 -0.3 -3.1 -6.6 -6.6 -4.8 -5.2 -3.5 -2.9 -1.93.4 National savings 20.3 18.2 17.2 15.5 16.5 15.4 14.4 12.7 12.3 13.5 10.7 9.5 10.6 11.73.5 Gross capital formation 19.9 19.1 20.1 16.6 17.8 17.3 16.4 14.1 15.0 15.0 14.9 14.6 15.1 15.63.6 Current account 0.2 -0.3 -2.9 -1.1 -1.3 -2.0 -2.0 -1.4 -2.7 -1.5 -3.8 -4.4 -3.8 -3.3
4. Determinants of investment
4.1 Capacity utilisation (survey) (a) : 79.1 83.9 80.4 81.5 78.9 78.5 72.7 77.1 80.7 80.9 80.1 : 4.2 Trend GDP gap : -0.7 2.6 -2.2 0.1 0.8 1.3 -3.1 -2.4 -2.2 -2.9 -2.4 -1.0 0.14.3 Potential GDP gap : 0.2 2.1 -1.5 0.9 0.2 -0.8 -5.0 -3.9 -3.3 -3.5 -2.6 -1.0 0.04.4 Profitability index (1961-1973 = 100) 100.0 81.7 104.1 125.3 173.3 171.9 170.6 148.1 156.7 159.4 151.5 154.8 163.4 169.6
5. Growth potential
5.1 Growth of net capital stock (real) 2.6 1.5 2.1 1.4 2.5 2.5 2.3 1.4 1.5 1.3 1.2 1.1 1.4 1.75.2 Net capital/output ratio (real) 2.9 2.9 2.6 2.6 2.4 2.3 2.4 2.6 2.5 2.6 2.6 2.6 2.5 2.55.3 Growth of capital intensity 2.3 1.6 0.2 2.2 1.2 1.6 2.2 3.1 1.3 0.8 0.0 -0.1 -0.2 0.75.4 Labour productivity growth 2.9 1.6 1.4 3.1 2.5 2.0 0.2 -3.6 1.5 0.6 -0.9 0.5 1.1 1.55.5 Total factor productivity growth 2.0 1.0 1.3 2.3 2.0 1.4 -0.6 -4.7 1.0 0.3 -0.9 0.5 1.2 1.2
6. Employment and unemployment
6.1 Employment 0.3 -0.1 1.9 -0.8 1.3 0.9 0.2 -1.6 0.2 0.5 1.2 1.2 1.6 1.06.2 Activity rate : : : : 75.4 75.7 76.0 76.0 75.9 76.1 76.9 77.3 77.3 77.56.3 Employment rate : : : : 70.6 71.9 71.2 70.3 70.0 70.1 70.9 71.5 72.3 72.6 (benchmark) 6.4 Employment rate : : : : : : : : : : : : : (full-time equivalent) 6.5 Unemployment rate 1.9 6.8 8.8 9.3 6.4 4.9 6.3 7.6 7.8 8.0 7.9 7.5 6.6 6.3 (Eurostat definition)
7. Prices and wages
7.1 Nominal wages per head 8.2 13.8 8.3 4.4 4.9 4.1 3.4 2.4 3.1 2.0 1.6 2.1 2.1 2.87.2 Real wages per head (b) 3.1 1.6 2.6 0.7 3.3 2.6 0.6 0.5 -0.8 -1.9 -0.2 -0.1 0.2 0.87.3 Nominal unit labour costs 5.2 12.1 6.8 1.3 2.4 2.0 3.3 6.2 1.7 1.4 2.5 1.6 1.0 1.37.4 Real unit labour costs 0.1 -0.3 0.7 -1.7 0.5 -0.2 0.5 3.9 -1.4 -0.9 1.4 -0.2 -0.8 -0.97.5 GDP deflator 5.1 12.4 6.1 3.0 1.9 2.2 2.7 2.2 3.1 2.3 1.1 1.8 1.8 2.27.6 Private consumption deflator 4.9 12.0 5.5 3.7 1.6 1.5 2.9 1.9 4.0 3.9 1.8 2.2 1.9 2.07.7 Terms of trade -0.4 0.5 0.3 -0.3 1.1 0.4 -0.5 -0.6 -0.3 -1.6 -0.3 0.9 1.1 1.2
8. General government budget, % of GDP
8.1 Expenditure 35.4 48.4 41.4 43.5 39.0 41.7 46.9 50.9 49.9 48.0 48.1 47.1 45.6 44.38.2 Current revenues 35.1 42.7 40.4 37.6 38.6 39.3 40.5 39.6 39.8 40.3 42.0 41.3 40.5 40.28.3 Net borrowing (-) or lending (+) -0.3 -3.6 -1.0 -6.0 -0.4 -2.4 -6.4 -11.4 -10.0 -7.6 -6.1 -5.8 -5.1 -4.18.4 Net borrowing cyclically adjusted : : -1.7 -5.4 -0.8 -2.5 -6.0 -9.0 -8.2 -6.0 -4.5 -4.6 -4.6 -4.18.5 Debt (end of period) 64.2 51.5 33.0 49.6 40.5 41.7 78.4 67.1 78.4 84.3 89.1 90.6 91.8 92.7
9. Monetary conditions
9.1 Long-term interest rate 7.6 13.0 10.3 8.6 6.2 4.8 4.1 3.4 3.4 3.1 1.7 2.0 : 9.2 Short-term interest rate 6.8 11.9 12.0 7.9 6.4 4.4 3.7 1.2 0.7 0.9 0.8 0.5 : 9.3 Yield curve (9.1-9.2) 0.8 1.2 -1.7 0.7 -0.2 0.3 0.5 2.2 2.7 2.2 0.9 1.5 : 9.4 Real long-term interest rate (c) 2.3 0.7 3.9 5.5 4.2 2.5 1.4 1.1 0.2 0.7 0.6 0.2 : 9.5 Nominal effective exchange rate : : : : 5.5 -0.2 -4.5 -11.4 0.3 -0.9 4.4 -1.8 5.0 0.09.6 Real effective exchange rate : : : : 91.0 99.2 93.3 82.9 85.2 84.7 89.1 87.9 92.2 92.4 (2005=100; ULC in total economy)
(a) Manufacturing industry (b) Private consumption deflator (c) GDP deflator

216
Main economic indicators 1961-2015
109. EU-28(Annual percentage change, unless otherwise stated)
2002 2003 2004 2005 2006 2007 2008 2009 2010 2011 2012 2013 2014 2015
1. Growth of GDP and its components (real)
1.1 Private consumption 1.7 1.9 2.1 2.1 2.3 2.2 0.4 -1.6 1.1 0.3 -0.7 0.0 1.2 1.61.2 Government consumption 2.6 2.2 1.8 1.7 2.2 1.8 2.3 2.2 0.6 -0.2 -0.2 0.4 0.7 0.61.3 Gross fixed capital formation -0.7 1.4 3.2 3.7 6.2 6.2 -1.4 -13.4 -0.2 1.6 -2.9 -2.3 3.1 4.71.4 of which equipment : : : : : : : : : : : : : 1.5 of which construction : : : : : : : : : : : : : 1.6 Exports of goods and services 2.2 1.9 7.8 6.0 9.8 5.7 1.5 -11.7 11.0 6.5 2.4 1.6 4.0 5.11.7 Imports of goods and services 1.7 3.4 7.6 6.1 9.6 5.9 1.1 -11.5 9.8 4.4 -0.2 0.4 3.7 5.21.8 GDP 1.3 1.5 2.6 2.2 3.4 3.2 0.4 -4.5 2.0 1.6 -0.4 0.1 1.6 2.0
2. Demand components: Contribution to changes in GDP (%)
2.1 Consumption 1.5 1.5 1.6 1.6 1.8 1.6 0.7 -0.5 0.8 0.1 -0.4 0.1 0.9 1.12.2 Investment -0.2 0.3 0.6 0.7 1.2 1.3 -0.3 -2.8 0.0 0.3 -0.5 -0.4 0.5 0.82.3 Stockbuilding -0.4 0.2 0.2 -0.2 0.2 0.3 -0.2 -1.2 0.8 0.3 -0.5 -0.1 0.0 0.02.4 Domestic demand 1.1 2.0 2.4 2.1 3.2 3.3 0.2 -4.4 1.5 0.8 -1.5 -0.4 1.4 1.92.5 Exports 0.8 0.7 2.7 2.1 3.6 2.3 0.6 -4.8 4.1 2.7 1.0 0.7 1.8 2.32.6 Final demand 1.8 2.7 5.1 4.3 6.9 5.5 0.8 -9.3 5.4 3.3 -0.5 0.3 3.1 4.22.7 Imports -0.6 -1.2 -2.5 -2.1 -3.5 -2.3 -0.4 4.7 -3.5 -1.7 0.1 -0.2 -1.5 -2.22.8 Net exports 0.2 -0.5 0.1 0.0 0.1 0.0 0.2 -0.1 0.5 0.9 1.1 0.5 0.2 0.1
3. Gross savings and investment in % of GDP at current prices
3.1 Private sector savings : : : : : : : 21.1 21.3 20.8 19.9 19.6 19.7 19.93.2 Net savings of households 4.5 4.4 4.0 3.6 3.4 3.2 3.5 5.0 4.0 3.6 3.6 : : 3.3 General government savings : : : : : : : -2.9 -2.7 -1.4 -1.0 -0.6 -0.3 0.03.4 National savings 20.0 19.8 20.5 20.3 21.0 21.8 20.9 18.2 18.7 19.3 19.0 18.9 19.4 19.83.5 Gross capital formation 19.8 19.8 20.1 20.3 21.3 22.1 21.8 18.3 18.7 19.2 18.1 17.4 17.7 18.13.6 Current account 0.2 0.1 0.4 0.0 -0.2 -0.4 -0.9 -0.1 -0.1 0.2 0.9 1.6 1.8 1.8
4. Determinants of investment
4.1 Capacity utilisation (survey) (a) 80.7 80.5 81.3 81.2 82.8 84.2 82.9 71.9 76.5 80.1 78.8 78.4 : 4.2 Trend GDP gap 0.0 -0.6 0.1 0.5 2.3 4.2 3.4 -2.2 -1.1 -0.2 -1.4 -2.1 -1.5 -0.54.3 Potential GDP gap 0.5 -0.2 0.2 0.4 1.7 2.9 1.7 -3.6 -2.4 -1.6 -2.5 -3.1 -2.4 -1.54.4 Profitability index (1961-1973 = 100) : : : : : : : : : : : : :
5. Growth potential
5.1 Growth of net capital stock (real) 2.2 2.1 2.2 2.3 2.5 2.8 2.5 1.3 1.3 1.3 1.0 0.8 0.9 1.15.2 Net capital/output ratio (real) 2.8 2.8 2.8 2.8 2.8 2.8 2.8 3.0 3.0 3.0 3.0 3.0 3.0 3.05.3 Growth of capital intensity 2.3 1.9 1.6 1.4 1.0 1.0 1.6 3.3 2.0 1.0 1.3 1.1 0.3 0.45.4 Labour productivity growth 1.5 1.2 2.0 1.3 1.8 1.4 -0.5 -2.7 2.8 1.4 0.0 0.5 1.0 1.25.5 Total factor productivity growth 0.5 0.5 1.4 0.7 1.4 1.0 -1.2 -3.9 2.0 1.0 -0.6 0.0 0.9 1.1
6. Employment and unemployment
6.1 Employment -0.1 0.5 0.7 1.1 1.7 1.8 0.9 -1.8 -0.6 0.2 -0.2 -0.3 0.5 0.76.2 Activity rate 71.5 71.6 71.9 72.3 72.7 72.9 73.2 73.3 73.4 73.5 74.2 74.4 74.6 74.86.3 Employment rate 65.3 65.3 65.5 66.0 66.9 67.8 68.2 66.9 66.5 66.7 66.7 66.5 66.9 67.4 (benchmark) 6.4 Employment rate : : : : : : : : : : : : : (full-time equivalent) 6.5 Unemployment rate 9.0 9.1 9.2 9.0 8.2 7.2 7.0 9.0 9.6 9.6 10.4 10.8 10.5 10.1 (Eurostat definition)
7. Prices and wages
7.1 Nominal wages per head 2.9 3.3 2.5 2.5 2.8 3.2 3.3 1.8 2.6 2.1 1.9 1.7 1.8 2.27.2 Real wages per head (b) 1.0 1.3 0.4 0.3 0.6 0.8 0.3 1.6 0.5 -0.6 -0.2 0.3 0.7 0.77.3 Nominal unit labour costs 2.2 2.1 1.0 1.4 1.3 1.9 4.1 4.5 -0.3 0.7 2.0 1.2 0.8 1.07.4 Real unit labour costs -1.2 -0.2 -1.6 -0.7 -1.1 -0.8 1.3 3.2 -1.4 -0.8 0.6 -0.2 -0.5 -0.57.5 GDP deflator 2.6 2.3 2.1 2.0 2.1 2.6 2.5 1.3 1.2 1.4 1.4 1.5 1.3 1.57.6 Private consumption deflator 1.8 2.0 2.1 2.2 2.2 2.4 3.0 0.3 2.1 2.8 2.1 1.4 1.1 1.57.7 Terms of trade : : : : : : : : : : : : :
8. General government budget, % of GDP
8.1 Expenditure : : : : : : : 51.0 50.6 49.0 49.4 49.1 48.4 47.78.2 Current revenues : : : : : : : 44.1 44.1 44.6 45.4 45.7 45.8 45.28.3 Net borrowing (-) or lending (+) : : : : : : : -6.8 -6.5 -4.4 -3.9 -3.3 -2.6 -2.58.4 Net borrowing cyclically adjusted : : : : : : : -5.0 -5.3 -3.7 -2.7 -1.8 -1.4 -1.88.5 Debt (end of period) : : : : : : : 74.3 80.1 83.0 86.8 88.9 89.5 89.2
9. Monetary conditions
9.1 Long-term interest rate : : : : : : : : : 4.3 3.6 3.0 : 9.2 Short-term interest rate : : : : : : : : : 1.7 1.1 0.6 : 9.3 Yield curve (9.1-9.2) : : : : : : : : : 2.6 2.6 2.4 : 9.4 Real long-term interest rate (c) : : : : : : : : : 2.7 2.2 1.5 : 9.5 Nominal effective exchange rate 5.7 12.3 6.0 -0.8 2.7 6.4 1.2 -5.4 -7.3 1.0 -5.2 8.2 6.4 -0.19.6 Real effective exchange rate 84.1 94.9 100.9 100.0 101.4 106.8 108.9 105.5 97.5 98.2 93.4 101.0 106.5 105.5 (2005=100; ULC in total economy)
(a) Manufacturing industry (b) Private consumption deflator (c) GDP deflator

217
Main economic indicators 1961-2015
110. EU-15 1)(Annual percentage change, unless otherwise stated)
1961-1973 1974-1985 1986-1990 1991-1995 1996-2000 2001-2005 2006-2010 2009 2010 2011 2012 2013 2014 2015
1. Growth of GDP and its components (real)
1.1 Private consumption 4.8 2.2 3.6 1.5 2.9 1.9 0.7 -1.4 1.1 0.2 -0.8 -0.1 1.1 1.51.2 Government consumption 4.4 3.0 2.0 1.7 1.7 2.1 1.8 2.2 0.6 -0.1 -0.2 0.4 0.7 0.51.3 Gross fixed capital formation 5.6 0.3 5.7 0.1 4.6 1.3 -1.1 -13.3 0.2 1.2 -3.1 -2.5 3.0 4.71.4 of which equipment : : 6.9 -0.9 7.5 0.6 0.0 -19.2 6.1 2.0 -2.8 -1.7 4.9 6.61.5 of which construction : -0.9 4.5 0.5 1.8 1.5 -2.1 -10.8 -3.2 0.4 -4.0 -3.0 1.8 3.21.6 Exports of goods and services 8.0 4.4 5.0 5.5 8.0 4.0 2.5 -11.8 10.8 6.2 2.3 1.2 3.8 5.01.7 Imports of goods and services 8.7 3.1 7.3 4.1 8.7 3.9 2.4 -10.8 9.5 3.9 -0.4 0.2 3.5 5.11.8 GDP 4.8 2.1 3.3 1.7 2.9 1.8 0.7 -4.6 2.0 1.5 -0.5 0.0 1.5 1.9
2. Demand components: Contribution to changes in GDP (%)
2.1 Consumption 3.5 1.8 2.4 : 2.0 1.5 0.8 -0.3 0.8 0.1 -0.5 0.0 0.8 1.02.2 Investment 1.3 0.1 1.2 : 0.9 0.3 -0.2 -2.7 0.0 0.2 -0.6 -0.4 0.5 0.82.3 Stockbuilding 0.0 -0.1 0.1 : 0.0 -0.1 0.0 -1.1 0.7 0.3 -0.5 0.0 0.0 0.02.4 Domestic demand 4.9 1.8 3.8 : 2.9 1.7 0.6 -4.1 1.5 0.6 -1.5 -0.4 1.3 1.82.5 Exports 1.5 1.1 1.3 : 2.5 1.4 1.0 -4.8 3.8 2.4 0.9 0.5 1.7 2.22.6 Final demand 6.4 2.9 5.1 : 5.4 3.1 1.5 -8.9 5.2 3.0 -0.6 0.1 3.0 4.02.7 Imports -1.6 -0.8 -1.8 : -2.6 -1.3 -0.9 4.3 -3.3 -1.5 0.2 -0.1 -1.4 -2.12.8 Net exports -0.1 0.3 -0.5 : -0.1 0.1 0.1 -0.5 0.5 0.9 1.1 0.4 0.2 0.1
3. Gross savings and investment in % of GDP at current prices
3.1 Private sector savings : 21.3 21.2 21.5 19.8 19.7 20.3 21.1 21.4 20.8 20.0 19.6 19.7 19.93.2 Net savings of households : : : : 5.6 4.8 4.8 5.8 5.0 4.7 4.6 : : : 3.3 General government savings : 0.4 0.3 -1.6 0.9 0.6 -0.1 -3.0 -2.7 -1.5 -1.1 -0.7 -0.3 -0.13.4 National savings 24.9 21.7 21.5 20.0 20.7 20.3 20.2 18.1 18.7 19.3 18.9 18.9 19.3 19.83.5 Gross capital formation 25.1 22.4 21.5 20.5 20.4 20.0 20.1 18.0 18.4 18.9 17.9 17.2 17.4 17.93.6 Current account 0.5 -0.5 0.0 -0.5 0.4 0.3 0.1 0.1 0.2 0.4 1.1 1.7 2.0 2.0
4. Determinants of investment
4.1 Capacity utilisation (survey) (b) (c) : : : : : : : : : : : : : : 4.2 Trend GDP gap (b) : -0.2 0.6 -0.2 -0.3 0.3 1.2 -2.4 -1.1 -0.3 -1.4 -2.1 -1.4 -0.54.3 Potential GDP gap (b) : 0.0 0.9 -0.3 0.4 0.5 -0.1 -3.8 -2.5 -1.7 -2.6 -3.2 -2.4 -1.54.4 Profitability index (1961-1973 = 100) (a) 100.0 81.9 100.6 106.8 126.5 130.9 126.1 110.6 116.3 117.5 113.5 114.2 117.2 120.2
5. Growth potential
5.1 Growth of net capital stock (real) (a) 4.1 2.7 2.5 2.2 2.3 2.2 1.9 1.2 1.2 1.1 0.9 0.7 0.8 1.05.2 Net capital/output ratio (real) (b) 2.8 2.9 2.9 2.9 2.9 2.9 2.9 3.1 3.1 3.0 3.1 3.1 3.1 3.15.3 Growth of capital intensity (a) 3.8 2.6 0.9 2.6 0.9 1.4 1.7 3.3 1.6 0.9 1.4 1.1 0.2 0.35.4 Labour productivity growth (a) 4.5 2.0 1.7 2.1 1.5 1.0 0.5 -2.7 2.5 1.3 0.0 0.5 0.9 1.15.5 Total factor productivity growth (a) 3.1 1.1 1.4 1.1 1.1 0.4 -0.2 -3.9 1.8 0.9 -0.5 0.0 0.9 1.0
6. Employment and unemployment
6.1 Employment (a) 0.3 0.1 1.6 -0.4 1.6 1.0 0.4 -1.9 -0.4 0.3 -0.3 -0.4 0.5 0.86.2 Activity rate (b) 65.3 64.8 65.7 67.4 68.8 71.3 73.2 73.4 73.4 73.6 74.2 74.3 74.4 74.66.3 Employment rate (b) 63.8 60.7 60.0 61.0 62.5 65.7 67.3 66.8 66.4 66.6 66.4 66.1 66.4 66.9 (benchmark) 6.4 Employment rate (b) : : : : : : : : : : : : : : (full-time equivalent) 6.5 Unemployment rate (b) : : : 9.4 9.3 7.9 8.2 9.1 9.6 9.6 10.6 11.0 10.7 10.3 (Eurostat definition)
7. Prices and wages
7.1 Nominal wages per head 9.8 11.6 5.8 4.8 2.6 2.8 2.6 1.9 2.2 2.1 2.0 1.8 1.7 2.17.2 Real wages per head (d) 5.0 1.4 1.6 1.0 0.9 0.8 0.7 1.8 0.1 -0.5 0.0 0.3 0.6 0.77.3 Nominal unit labour costs 5.2 9.4 4.2 2.7 1.2 1.8 2.2 4.7 -0.3 0.8 1.9 1.2 0.7 0.97.4 Real unit labour costs 0.0 -0.3 -0.7 -0.8 -0.4 -0.4 0.3 3.4 -1.4 -0.5 0.7 -0.2 -0.5 -0.57.5 GDP deflator 5.1 9.7 4.7 3.5 1.5 2.2 1.8 1.2 1.2 1.3 1.3 1.5 1.3 1.57.6 Private consumption deflator 4.6 10.0 4.1 3.7 1.6 2.0 1.8 0.1 2.0 2.7 2.0 1.4 1.1 1.4 0.0 0.0 0.0 0.0 0.0 0.0 0.0 0.0 0.0 0.0 0.0 0.0 0.0 0.0
8. General government budget, % of GDP
8.2 Current revenues : 40.8 43.1 43.7 45.6 44.4 44.9 44.7 44.6 45.1 46.0 46.4 46.1 45.88.3 Net borrowing (-) or lending (+) : -3.6 -3.2 -5.0 -1.8 -2.4 -3.6 -6.8 -6.5 -4.5 -4.0 -3.3 -2.9 -2.58.4 Net borrowing cyclically adjusted : -3.5 -3.4 -4.9 -1.9 -2.7 -3.6 -4.9 -5.3 -3.7 -2.7 -1.7 -1.6 -1.78.5 Debt (end of period) : : 52.6 61.3 67.8 63.0 69.7 76.9 83.0 86.2 89.8 92.1 92.9 92.5 0.0 0.0 0.0 0.0 0.0 0.0 0.0 0.0 0.0 0.0 0.0 0.0 0.0 0.0
9. Monetary conditions
9.2 Short-term interest rate (b) 5.6 11.2 9.7 8.9 4.7 3.1 2.9 1.2 0.8 1.3 0.6 0.3 : : 9.3 Yield curve (9.1-9.2) (b) 1.3 0.7 0.0 0.2 1.1 1.3 1.0 2.5 2.7 2.7 2.7 2.5 : : 9.4 Real long-term interest rate (b) (e) 1.8 1.2 4.6 : 4.1 2.1 2.2 2.5 2.3 2.7 2.1 1.3 : : 9.5 Nominal effective exchange rate (a) : : 8.1 1.1 2.1 6.3 -0.1 -0.6 -8.7 1.1 -4.9 8.5 7.5 -0.29.6 Real effective exchange rate (a) : : : : 93.0 95.4 100.9 104.3 93.9 94.7 90.0 97.0 102.9 101.4 (2005=100; ULC in total economy) 0.0 0.0 0.0 0.0 0.0 0.0 0.0 0.0 0.0 0.0 0.0 0.0 0.0 0.0_________________________________________________________________________________________________________________________________________________________________________________________________________
(a) 1961-91: including West-Germany (b) 1961-90: including West-Germany (c) Manufacturing industry
(e) GDP deflator

218
Main economic indicators 1961-2015
111. Macedonia, the former Yugoslav Republic of(Annual percentage change, unless otherwise stated)
2002 2003 2004 2005 2006 2007 2008 2009 2010 2011 2012 2013 2014 2015
1. Growth of GDP and its components (real)
1.1 Private consumption 12.5 -1.5 9.1 5.9 7.5 8.1 7.4 -4.7 2.1 2.9 -3.0 4.2 3.0 2.71.2 Government consumption -11.1 -9.9 1.3 0.7 0.5 -0.3 10.6 0.5 -2.0 0.6 -1.4 -3.6 3.1 2.31.3 Gross fixed capital formation 17.6 1.1 9.8 -6.1 7.7 17.1 5.4 -4.3 -2.7 12.3 20.0 -11.5 10.6 9.01.4 of which equipment 19.0 -13.5 5.9 -3.0 9.6 16.7 -1.1 -17.1 -15.7 : : : : 1.5 of which construction 24.7 11.9 12.5 -8.3 4.6 13.2 9.8 6.7 8.5 : : : : 1.6 Exports of goods and services -5.1 -5.7 11.7 13.4 8.2 11.8 -6.3 -15.8 23.6 10.5 0.0 4.5 6.8 7.61.7 Imports of goods and services 9.8 -15.2 16.7 8.2 10.1 16.1 0.8 -14.3 9.5 10.4 4.2 -2.1 7.4 6.81.8 GDP 0.9 2.8 4.6 4.4 5.0 6.1 5.0 -0.9 2.9 2.8 -0.4 3.1 3.0 3.2
2. Demand components: Contribution to changes in GDP (%)
2.1 Consumption 6.0 -3.3 7.3 4.8 5.9 6.3 7.5 -3.7 1.2 2.3 -2.5 2.5 2.9 2.52.2 Investment 2.6 0.2 1.6 -1.1 1.3 3.0 1.1 -0.9 -0.5 2.4 4.1 -2.6 1.9 1.62.3 Stockbuilding 0.0 -0.7 0.4 0.3 0.4 1.8 0.3 0.8 -1.2 0.0 1.1 -0.7 0.0 0.02.4 Domestic demand 8.6 -3.8 9.3 4.0 7.6 11.0 8.8 -3.8 -0.6 4.7 2.7 -0.9 4.8 4.12.5 Exports -2.2 -2.2 4.5 5.3 3.6 5.5 -3.3 -8.1 9.2 4.9 0.0 2.4 3.6 4.22.6 Final demand 6.4 -6.0 13.8 9.3 11.2 16.5 5.5 -11.8 8.7 9.6 2.8 1.5 8.4 8.32.7 Imports -5.5 8.8 -9.1 -4.9 -6.2 -10.4 -0.6 10.9 -5.8 -6.8 -3.1 1.6 -5.4 -5.12.8 Net exports -7.7 6.7 -4.7 0.4 -2.6 -4.9 -3.9 2.9 3.4 -1.9 -3.1 4.0 -1.7 -0.9
3. Gross savings and investment in % of GDP at current prices
3.1 Private sector savings : : : : : : : : 22.5 23.0 26.2 23.1 20.8 19.83.2 Net savings of households : : : : : : : : : : : : : 3.3 General government savings : : : : : : : : 0.4 0.7 0.2 -0.6 -0.7 -0.43.4 National savings 10.6 15.1 13.8 18.8 21.1 17.6 13.9 19.4 22.9 23.7 26.4 22.5 20.1 19.43.5 Gross capital formation 20.6 19.1 22.0 21.3 21.5 24.6 26.8 26.2 24.9 26.2 29.4 24.4 23.8 23.23.6 Current account -10.0 -4.0 -8.1 -2.5 -0.4 -7.1 -12.9 -6.8 -2.0 -2.5 -3.0 -1.9 -3.7 -3.8
4. Determinants of investment
4.1 Capacity utilisation (survey) (a) : : : : : : : : : : : : : 4.2 Trend GDP gap : : : : : : : : : : : : : 4.3 Potential GDP gap : : : : : : : : : : : : : 4.4 Profitability index (1961-1973 = 100) : : : : : : : : : : : : :
5. Growth potential
5.1 Growth of net capital stock (real) : : : : : : : : : : : : : 5.2 Net capital/output ratio (real) : : : : : : : : : : : : : 5.3 Growth of capital intensity : : : : : : : : : : : : : 5.4 Labour productivity growth 1.4 4.8 6.9 2.2 1.8 1.8 -1.2 -3.4 1.4 -0.3 -1.2 -1.2 1.1 1.35.5 Total factor productivity growth : : : : : : : : : : : : :
6. Employment and unemployment
6.1 Employment -0.6 -1.9 -2.2 2.1 3.2 4.3 6.2 2.5 1.5 3.1 0.8 4.3 1.9 1.96.2 Activity rate 53.7 56.6 54.9 56.3 56.8 57.5 59.0 58.6 59.0 60.0 60.0 61.0 61.7 62.16.3 Employment rate 34.7 33.9 32.9 33.3 34.1 35.4 37.4 38.1 38.5 39.5 39.8 41.7 42.5 43.4 (benchmark) 6.4 Employment rate : : : : : : : : : : : : : (full-time equivalent) 6.5 Unemployment rate 31.9 36.7 37.1 37.3 36.0 34.9 33.8 32.2 32.0 31.4 31.0 29.0 28.5 27.5 (Eurostat definition)
7. Prices and wages
7.1 Nominal wages per head 4.5 8.0 -2.9 -3.3 11.7 -4.8 9.0 6.9 6.0 -3.9 2.8 2.4 4.3 3.27.2 Real wages per head (b) 2.3 0.6 -1.4 -3.9 9.3 -8.0 -0.8 7.1 5.0 -7.2 0.4 0.3 2.0 1.17.3 Nominal unit labour costs 3.1 3.0 -9.2 -5.4 9.7 -6.5 10.3 10.6 4.6 -3.6 4.1 3.6 3.2 1.97.4 Real unit labour costs -0.4 0.0 -9.9 -8.8 6.2 -12.9 2.6 9.9 1.8 -6.5 3.9 3.3 2.9 1.67.5 GDP deflator 3.4 3.0 0.8 3.8 3.3 7.4 7.5 0.7 2.7 3.1 0.1 0.3 0.3 0.37.6 Private consumption deflator 2.1 7.3 -1.5 0.7 2.2 3.5 9.9 -0.2 1.0 3.5 2.4 2.1 2.3 2.17.7 Terms of trade 0.4 -3.9 -0.5 3.7 2.0 6.2 -2.8 -2.2 -1.5 3.1 -0.6 -1.3 0.2 0.2
8. General government budget, % of GDP
8.1 Expenditure : : : : : : 36.1 34.6 32.9 31.7 33.3 33.4 33.6 33.78.2 Current revenues : : : : : : 35.1 32.0 30.4 29.2 29.4 29.3 29.4 29.88.3 Net borrowing (-) or lending (+) : -1.1 0.0 0.2 -0.5 0.6 -0.9 -2.7 -2.5 -2.5 -3.9 -4.1 -4.2 -3.98.4 Net borrowing cyclically adjusted : : : : : : : : : : : : : 8.5 Debt (end of period) 43.0 37.9 35.6 38.4 30.5 22.7 20.7 23.8 25.8 28.4 34.0 36.0 38.7 40.8
9. Monetary conditions
9.1 Long-term interest rate : : : : : : : : : : : : : 9.2 Short-term interest rate : : : : : : : : : : : : : 9.3 Yield curve (9.1-9.2) : : : : : : : : : : : : : 9.4 Real long-term interest rate (c) : : : : : : : : : : : : : 9.5 Nominal effective exchange rate : : : : : : : : : : : : : 9.6 Real effective exchange rate : : : : : : : : : : : : : (2005=100; ULC in total economy)
(a) Manufacturing industry (b) Private consumption deflator (c) GDP deflator

219
Main economic indicators 1961-2015
112. Iceland(Annual percentage change, unless otherwise stated)
2002 2003 2004 2005 2006 2007 2008 2009 2010 2011 2012 2013 2014 2015
1. Growth of GDP and its components (real)
1.1 Private consumption -1.5 6.2 7.0 12.7 3.6 5.7 -7.8 -15.0 0.1 2.6 2.4 1.2 4.3 4.01.2 Government consumption 5.3 1.8 2.2 3.5 4.0 4.1 4.6 -1.7 -3.4 -0.3 -1.4 1.3 0.8 0.51.3 Gross fixed capital formation -14.0 11.1 28.7 34.4 24.4 -12.2 -20.4 -51.4 -9.4 14.1 5.5 -3.4 5.0 10.01.4 of which equipment -21.7 0.3 36.8 102.9 -3.2 -31.7 -34.1 -58.0 33.8 68.3 20.3 -1.4 6.6 10.61.5 of which construction -7.6 14.2 27.8 10.3 39.5 -3.7 -16.2 -51.4 -20.3 -9.6 -4.7 9.0 : 1.6 Exports of goods and services 3.8 1.6 8.4 7.5 -4.6 17.7 7.0 7.0 0.5 3.8 3.8 5.3 5.0 5.51.7 Imports of goods and services -2.6 10.7 14.5 29.3 11.3 -1.5 -18.4 -24.0 4.5 6.7 4.7 -0.1 6.6 7.21.8 GDP 0.1 2.4 7.8 7.2 4.7 6.0 1.2 -6.6 -4.1 2.7 1.5 3.3 2.8 3.2
2. Demand components: Contribution to changes in GDP (%)
2.1 Consumption 0.4 3.8 4.6 8.1 3.1 4.3 -3.4 -8.4 -0.9 1.3 0.9 1.0 2.5 2.32.2 Investment -3.0 2.0 5.7 8.1 6.9 -4.2 -5.8 -12.5 -1.3 1.8 0.8 -0.5 0.7 1.42.3 Stockbuilding 0.7 -0.2 0.1 0.0 1.1 -0.6 -0.3 -0.1 -0.7 1.6 -0.3 -1.1 0.0 0.02.4 Domestic demand -1.9 5.7 10.4 16.3 11.1 -0.5 -9.5 -21.0 -2.8 4.7 1.4 -0.6 3.2 3.72.5 Exports 1.5 0.6 2.9 2.6 -1.5 5.7 2.4 3.1 0.3 2.1 2.3 3.2 2.9 3.02.6 Final demand -0.5 6.3 13.3 18.9 9.7 5.3 -7.1 -17.9 -2.6 6.8 3.7 2.6 6.1 6.72.7 Imports 1.0 -3.9 -5.4 -11.6 -5.0 0.8 8.3 11.3 -2.0 -3.1 -2.4 0.0 -3.3 -3.52.8 Net exports 2.5 -3.2 -2.5 -9.0 -6.4 6.5 10.8 14.4 -1.7 -1.0 -0.1 3.2 -0.4 -0.5
3. Gross savings and investment in % of GDP at current prices
3.1 Private sector savings 17.7 13.3 9.0 3.4 0.5 3.0 -4.6 7.7 7.1 10.0 9.9 16.5 11.8 11.63.2 Net savings of households : : : : : : : : : : : : : 3.3 General government savings 2.1 1.7 4.7 8.7 10.8 10.1 4.6 -5.3 -2.6 -2.0 -0.4 0.9 2.3 1.83.4 National savings 19.7 15.0 13.7 12.2 11.4 13.1 0.0 2.4 4.5 8.0 9.5 17.4 14.1 13.43.5 Gross capital formation 18.2 19.8 23.5 28.2 35.6 29.0 24.6 13.9 12.5 14.4 14.8 13.5 13.9 14.63.6 Current account 1.5 -4.8 -9.8 -16.0 -24.3 -15.9 -24.6 -11.5 -8.0 -6.3 -5.3 3.9 0.2 -1.3
4. Determinants of investment
4.1 Capacity utilisation (survey) (a) : : : : : : : : : : : : : 4.2 Trend GDP gap : : : : : : : : : : : : : 4.3 Potential GDP gap : : : : : : : : : : : : : 4.4 Profitability index (1961-1973 = 100) : : : : : : : : : : : : :
5. Growth potential
5.1 Growth of net capital stock (real) 3.1 4.0 6.3 9.2 11.4 7.7 4.1 -1.1 -1.3 -0.5 -0.3 -0.5 -0.2 0.45.2 Net capital/output ratio (real) 1.9 2.0 1.9 2.0 2.1 2.1 2.2 2.3 2.4 2.3 2.3 2.2 2.1 2.15.3 Growth of capital intensity 4.7 3.8 6.9 5.7 6.0 3.0 3.2 5.4 -0.9 -0.5 -1.4 -3.7 -2.3 -1.65.4 Labour productivity growth 1.6 2.3 8.4 3.8 -0.4 1.4 0.4 -0.4 -3.8 2.7 0.3 -0.1 0.6 1.25.5 Total factor productivity growth 0.0 0.9 5.8 1.7 -2.5 0.4 -0.8 -2.3 -3.4 2.8 0.8 1.3 1.5 1.8
6. Employment and unemployment
6.1 Employment -1.4 0.1 -0.5 3.3 5.1 4.5 0.8 -6.2 -0.4 0.0 1.1 3.3 2.1 2.06.2 Activity rate 86.6 85.8 84.1 84.5 86.2 86.7 86.1 84.5 85.1 84.6 84.5 85.8 87.0 87.96.3 Employment rate 83.7 83.0 81.5 82.3 83.8 84.7 83.6 78.4 78.6 78.7 79.4 81.2 82.6 84.0 (benchmark) 6.4 Employment rate : : : : : : : : : : : : : (full-time equivalent) 6.5 Unemployment rate 3.3 3.3 3.1 2.6 2.9 2.3 3.0 7.2 7.6 7.1 6.0 5.4 5.0 4.5 (Eurostat definition)
7. Prices and wages
7.1 Nominal wages per head 8.8 2.0 10.3 8.9 12.4 9.8 2.8 -4.5 7.2 8.2 5.6 3.2 2.5 3.57.2 Real wages per head (b) 3.8 0.7 7.1 6.9 4.4 5.0 -9.9 -16.0 3.6 4.0 0.1 -0.4 0.0 0.57.3 Nominal unit labour costs 7.1 -0.3 1.8 4.9 12.9 8.3 2.4 -4.1 11.4 5.4 5.3 3.3 1.9 2.37.4 Real unit labour costs 1.4 -0.9 -0.7 2.0 3.7 2.5 -8.4 -11.5 4.2 2.1 2.4 1.5 1.6 0.37.5 GDP deflator 5.6 0.6 2.5 2.8 8.8 5.7 11.8 8.3 6.9 3.3 2.9 1.8 0.3 2.07.6 Private consumption deflator 4.8 1.3 3.0 1.9 7.6 4.6 14.1 13.7 3.4 4.1 5.6 3.6 2.5 3.07.7 Terms of trade 0.6 -4.1 -1.3 1.0 3.4 0.1 -6.1 -9.8 5.9 -1.6 -3.5 -2.4 -1.3 -1.3
8. General government budget, % of GDP
8.1 Expenditure 44.3 45.6 44.0 42.2 41.6 42.3 57.7 51.0 51.6 47.4 47.4 46.3 44.1 43.68.2 Current revenues 41.7 42.8 44.0 47.1 48.0 47.7 44.1 41.0 41.5 41.8 43.6 44.2 43.9 42.98.3 Net borrowing (-) or lending (+) -2.6 -2.8 0.0 4.9 6.3 5.4 -13.5 -9.9 -10.1 -5.6 -3.8 -2.1 -0.3 -0.78.4 Net borrowing cyclically adjusted : : : : : : : : : : : : : 8.5 Debt (end of period) : : : 26.1 27.9 28.5 70.4 87.9 93.0 99.3 96.9 94.2 91.7 87.7
9. Monetary conditions
9.1 Long-term interest rate : 7.6 7.6 7.6 8.4 9.7 10.0 8.4 6.5 : 7.0 6.4 : 9.2 Short-term interest rate 8.8 5.3 6.4 9.4 12.4 14.3 15.8 11.3 6.8 4.3 5.5 : : 9.3 Yield curve (9.1-9.2) : 2.2 1.2 -1.8 -3.9 -4.6 -5.8 -2.9 -0.3 : 1.5 : : 9.4 Real long-term interest rate (c) : 6.9 5.0 4.6 -0.4 3.8 -1.6 0.1 -0.4 : 4.0 4.5 : 9.5 Nominal effective exchange rate : : : : : : : : : : : : : 9.6 Real effective exchange rate : : : : : : : : : : : : : (2005=100; ULC in total economy)
(a) Manufacturing industry (b) Private consumption deflator (c) GDP deflator

220
Main economic indicators 1961-2015
113. Turkey(Annual percentage change, unless otherwise stated)
2002 2003 2004 2005 2006 2007 2008 2009 2010 2011 2012 2013 2014 2015
1. Growth of GDP and its components (real)
1.1 Private consumption 4.7 10.2 11.0 7.9 4.6 5.5 -0.3 -2.3 6.7 7.7 -0.5 4.6 0.2 1.21.2 Government consumption 5.8 -2.6 6.0 2.5 8.4 6.5 1.7 7.8 2.0 4.7 6.1 5.9 3.2 2.71.3 Gross fixed capital formation 14.7 14.2 28.4 17.4 13.3 3.1 -6.2 -19.0 30.5 18.0 -2.7 4.3 1.3 3.01.4 of which equipment 17.6 23.3 43.3 22.2 10.2 1.2 -5.6 -22.2 40.5 23.1 -4.8 : : 1.5 of which construction 12.1 5.9 12.4 10.9 17.8 5.8 -6.9 -14.7 18.2 10.6 0.7 : : 1.6 Exports of goods and services 6.9 6.9 11.2 7.9 6.6 7.3 2.7 -5.0 3.4 7.9 16.3 0.1 7.4 9.01.7 Imports of goods and services 20.9 23.5 20.8 12.2 6.9 10.7 -4.1 -14.3 20.7 10.7 -0.4 8.5 0.7 3.31.8 GDP 6.2 5.3 9.4 8.4 6.9 4.7 0.7 -4.8 9.2 8.8 2.1 4.0 2.6 3.3
2. Demand components: Contribution to changes in GDP (%)
2.1 Consumption 4.1 6.5 8.6 6.0 4.3 4.6 0.0 -0.6 5.1 6.0 0.4 3.9 0.6 1.22.2 Investment 2.1 2.2 4.7 3.4 2.8 0.7 -1.4 -3.9 5.3 3.8 -0.6 0.9 0.3 0.62.3 Stockbuilding 2.9 -0.6 -2.7 0.1 -0.1 0.9 0.5 -3.2 3.5 -0.3 -2.1 2.2 -0.1 0.12.4 Domestic demand 9.1 8.1 10.6 9.4 7.0 6.2 -0.9 -7.7 13.8 9.4 -2.2 7.1 0.7 1.92.5 Exports 1.5 1.5 2.4 1.7 1.5 1.6 0.6 -1.1 0.8 1.7 3.5 0.0 1.7 2.22.6 Final demand 10.5 9.6 13.0 11.2 8.4 7.8 -0.3 -8.9 14.6 11.1 1.3 7.1 2.4 4.12.7 Imports -3.5 -4.4 -4.6 -3.0 -1.7 -2.7 1.1 3.6 -4.8 -2.7 0.1 -2.2 -0.2 -0.92.8 Net exports -2.0 -3.0 -2.2 -1.2 -0.3 -1.1 1.7 2.5 -4.0 -1.0 3.6 -2.1 1.5 1.4
3. Gross savings and investment in % of GDP at current prices
3.1 Private sector savings : : : : 11.5 12.6 14.6 15.3 12.3 11.0 : : : 3.2 Net savings of households : : : : : : : : : : : : : 3.3 General government savings : : : : 4.5 2.6 1.7 -2.3 1.0 2.8 : : : 3.4 National savings 17.3 15.1 15.7 15.5 16.0 15.2 16.3 13.0 13.3 13.9 14.0 12.7 13.9 16.03.5 Gross capital formation 17.6 17.6 19.4 20.0 22.1 21.1 21.8 14.9 19.5 23.6 20.1 20.6 20.0 19.93.6 Current account -0.3 -2.5 -3.7 -4.5 -6.0 -5.8 -5.5 -2.0 -6.2 -9.7 -6.2 -7.9 -6.0 -3.9
4. Determinants of investment
4.1 Capacity utilisation (survey) (a) : : : : : : : : : : : : : 4.2 Trend GDP gap : : : : : : : : : : : : : 4.3 Potential GDP gap : : : : : : : : : : : : : 4.4 Profitability index (1961-1973 = 100) : : : : : : : : : : : : :
5. Growth potential
5.1 Growth of net capital stock (real) 2.8 3.4 4.7 5.6 6.1 : : : : : : : : 5.2 Net capital/output ratio (real) 3.3 3.3 3.1 3.1 3.0 : : : : : : : : 5.3 Growth of capital intensity 3.6 4.4 12.8 3.3 4.3 : : : : : : : : 5.4 Labour productivity growth 7.0 6.3 17.8 6.1 5.0 3.1 -1.5 -5.2 2.8 1.9 -0.9 1.0 0.6 0.65.5 Total factor productivity growth 5.0 3.8 10.3 4.2 2.7 : : : : : : : :
6. Employment and unemployment
6.1 Employment -0.8 -1.0 -7.2 2.2 1.8 1.5 2.2 0.4 6.2 6.7 3.0 3.0 2.0 2.76.2 Activity rate 54.8 53.5 49.0 48.9 48.7 48.8 49.5 50.4 51.5 52.9 53.3 54.4 55.0 55.56.3 Employment rate 49.9 48.5 44.2 44.4 44.5 44.5 44.7 44.1 46.0 48.3 49.0 49.6 49.8 50.4 (benchmark) 6.4 Employment rate : : : : : : : : : : : : : (full-time equivalent) 6.5 Unemployment rate 10.3 10.5 10.8 9.2 8.7 8.8 9.7 12.5 10.7 8.8 8.1 8.7 9.4 9.3 (Eurostat definition)
7. Prices and wages
7.1 Nominal wages per head 37.9 27.9 16.5 7.1 10.8 9.4 7.5 4.7 7.0 -2.1 11.8 10.7 7.8 8.17.2 Real wages per head (b) -0.5 3.7 5.1 -1.1 0.9 2.7 -2.9 -0.3 -1.3 -10.1 3.4 4.0 -0.7 0.87.3 Nominal unit labour costs 28.8 20.3 -1.1 1.0 5.5 6.1 9.2 10.4 4.1 -3.9 12.7 9.6 7.2 7.57.4 Real unit labour costs -6.3 -2.4 -12.0 -5.7 -3.5 -0.1 -2.5 4.8 -1.5 -11.5 5.5 3.4 -0.3 -0.47.5 GDP deflator 37.4 23.3 12.4 7.1 9.3 6.2 12.0 5.3 5.7 8.6 6.9 5.9 7.5 7.97.6 Private consumption deflator 38.5 23.4 10.8 8.3 9.8 6.6 10.8 4.9 8.5 8.9 8.1 6.4 8.6 7.27.7 Terms of trade 2.7 3.4 2.2 -0.3 -4.4 1.9 -3.1 2.1 -3.1 -4.9 -2.5 3.3 0.3 1.8
8. General government budget, % of GDP
8.1 Expenditure : : : : 33.0 34.7 36.3 43.1 40.2 37.4 38.9 40.7 41.0 40.08.2 Current revenues : : : : 33.7 33.2 34.0 36.6 37.3 36.6 37.8 39.1 38.1 37.58.3 Net borrowing (-) or lending (+) -10.2 -9.0 -4.4 -1.2 0.8 -1.5 -2.3 -6.5 -2.9 -0.8 -1.1 -1.6 -2.9 -2.58.4 Net borrowing cyclically adjusted : : : : : : : : : : : : : 8.5 Debt (end of period) 74.0 67.7 59.6 51.1 45.5 39.6 40.0 46.3 43.1 39.9 36.2 36.3 36.4 35.7
9. Monetary conditions
9.1 Long-term interest rate : : : 11.7 16.2 16.8 18.9 12.9 9.6 9.3 8.5 : : 9.2 Short-term interest rate 60.5 37.8 23.8 15.7 18.7 17.8 17.0 10.2 7.6 : : : : 9.3 Yield curve (9.1-9.2) : : : -3.9 -2.5 -1.0 1.9 2.7 2.0 : : : : 9.4 Real long-term interest rate (c) : : : 4.3 6.3 10.0 6.2 7.3 3.7 0.6 1.5 : : 9.5 Nominal effective exchange rate -23.7 -12.0 -3.2 5.4 -6.7 2.1 -4.2 -11.2 5.4 -14.4 -1.4 -6.1 -13.5 0.99.6 Real effective exchange rate 96.8 100.6 95.4 100.0 97.1 103.0 103.5 97.7 107.7 87.8 95.8 97.5 89.6 96.2 (2005=100; ULC in total economy)
(a) Manufacturing industry (b) Private consumption deflator (c) GDP deflator

221
Main economic indicators 1961-2015
114. Montenegro(Annual percentage change, unless otherwise stated)
2002 2003 2004 2005 2006 2007 2008 2009 2010 2011 2012 2013 2014 2015
1. Growth of GDP and its components (real)
1.1 Private consumption : : : : : : 12.1 -12.9 2.0 4.2 -3.2 -0.7 1.0 1.51.2 Government consumption : : : : : : 0.3 0.7 -0.3 -1.6 3.1 1.1 0.4 1.41.3 Gross fixed capital formation : : : : : : 27.3 -30.1 -18.5 -10.3 -3.3 6.7 9.5 11.51.4 of which equipment : : : : : : : : : : : : : 1.5 of which construction : : : : : : : : : : : : : 1.6 Exports of goods and services : : : : : : -2.0 -22.4 7.5 14.1 -1.2 6.6 3.0 5.41.7 Imports of goods and services : : : : : : 15.3 -30.2 -3.1 3.1 0.9 -0.4 2.7 4.51.8 GDP 1.9 2.5 4.4 4.2 8.6 10.7 6.9 -5.7 2.5 3.2 -2.5 3.5 2.9 3.6
2. Demand components: Contribution to changes in GDP (%)
2.1 Consumption : : : : : : 10.8 -11.6 1.6 3.1 -2.0 -0.4 0.9 1.42.2 Investment : : : : : : 8.8 -11.5 -5.0 -2.2 -0.6 1.2 1.8 2.42.3 Stockbuilding : : : : : : 1.5 -2.1 1.4 -0.6 1.2 -0.5 0.6 0.32.4 Domestic demand : : : : : : 21.1 -25.2 -2.0 0.3 -1.4 0.4 3.3 4.12.5 Exports : : : : : : -0.9 -8.9 2.4 4.9 -0.5 2.9 1.3 2.32.6 Final demand : : : : : : 20.2 -34.1 0.4 5.2 -1.9 3.3 4.6 6.42.7 Imports : : : : : : -13.2 28.4 2.1 -2.0 -0.6 0.3 -1.7 -2.82.8 Net exports : : : : : : -14.1 19.6 4.5 2.9 -1.1 3.2 -0.4 -0.5
3. Gross savings and investment in % of GDP at current prices
3.1 Private sector savings : : : : : : : : : : : : : 3.2 Net savings of households : : : : : : : : : : : : : 3.3 General government savings : : : : : : : : : : : : : 3.4 National savings : : : : : : : : : : : 5.0 7.3 9.33.5 Gross capital formation 18.8 15.4 16.6 17.7 25.4 33.8 40.6 27.1 22.8 18.2 19.5 19.6 21.7 23.83.6 Current account : : : -16.6 -31.3 -39.5 -49.8 -27.9 -22.9 -17.7 -18.7 -14.6 -14.4 -14.5
4. Determinants of investment
4.1 Capacity utilisation (survey) (a) : : : : : : : : : : : : : 4.2 Trend GDP gap : : : : : : : : : : : : : 4.3 Potential GDP gap : : : : : : : : : : : : : 4.4 Profitability index (1961-1973 = 100) : : : : : : : : : : : : :
5. Growth potential
5.1 Growth of net capital stock (real) : : : : : : : : : : : : : 5.2 Net capital/output ratio (real) : : : : : : : : : : : : : 5.3 Growth of capital intensity : : : : : : : : : : : : : 5.4 Labour productivity growth : : : : 9.1 -7.2 2.3 -1.9 4.6 10.1 -5.2 3.3 0.9 1.05.5 Total factor productivity growth : : : : : : : : : : : : :
6. Employment and unemployment
6.1 Employment : : : : -0.5 19.3 4.5 -3.8 -2.0 -6.2 2.8 0.2 1.9 2.66.2 Activity rate : : : 61.3 60.2 62.4 62.7 62.6 62.1 57.9 : : : 6.3 Employment rate : : : 42.8 42.4 50.3 52.2 50.6 49.9 46.5 : : : (benchmark) 6.4 Employment rate : : : : : : : : : : : : : (full-time equivalent) 6.5 Unemployment rate : : : 30.3 29.6 19.4 16.8 19.1 19.7 19.7 19.6 19.5 19.1 18.2 (Eurostat definition)
7. Prices and wages
7.1 Nominal wages per head : : : : : : : : : : : : : 7.2 Real wages per head (b) : : : : : : : : : : : : : 7.3 Nominal unit labour costs : : : : : : : : : : : : : 7.4 Real unit labour costs : : : : : : : : : : : : : 7.5 GDP deflator 3.1 8.3 5.9 4.3 9.1 12.7 7.7 2.4 1.6 0.9 -0.1 2.4 1.2 2.07.6 Private consumption deflator : : : : : : 6.0 2.2 -0.1 0.4 2.0 3.2 1.8 2.77.7 Terms of trade : : : : : : -3.2 4.7 0.9 8.2 -0.5 -0.8 -0.9 -0.5
8. General government budget, % of GDP
8.1 Expenditure : : : : 42.4 43.2 50.4 51.1 47.2 45.2 46.9 45.2 45.4 44.58.2 Current revenues : : : : 45.5 49.5 50.1 45.4 42.3 39.7 41.3 42.6 44.9 45.48.3 Net borrowing (-) or lending (+) : : : : 3.1 6.3 -0.4 -5.7 -4.9 -5.4 -5.6 -2.6 -0.6 1.08.4 Net borrowing cyclically adjusted : : : : : : : : : : : : : 8.5 Debt (end of period) 75.7 40.3 45.3 38.6 32.6 27.5 29.0 38.2 40.9 46.0 54.0 58.0 58.5 59.4
9. Monetary conditions
9.1 Long-term interest rate : : : : : : : : : : : : : 9.2 Short-term interest rate : : : : : : : : : : : : : 9.3 Yield curve (9.1-9.2) : : : : : : : : : : : : : 9.4 Real long-term interest rate (c) : : : : : : : : : : : : : 9.5 Nominal effective exchange rate : : : : : : : : : : : : : 9.6 Real effective exchange rate : : : : : : : : : : : : : (2005=100; ULC in total economy)
(a) Manufacturing industry (b) Private consumption deflator (c) GDP deflator

222
Main economic indicators 1961-2015
115. Serbia(Annual percentage change, unless otherwise stated)
2002 2003 2004 2005 2006 2007 2008 2009 2010 2011 2012 2013 2014 2015
1. Growth of GDP and its components (real)
1.1 Private consumption : : 7.5 6.0 5.8 7.9 6.7 -2.8 -0.9 -1.1 -1.8 -1.4 -1.1 -0.51.2 Government consumption : : -0.5 3.4 2.5 13.3 4.1 -1.9 0.4 1.0 1.7 -1.7 -1.2 -0.81.3 Gross fixed capital formation : : 23.8 4.8 17.2 29.7 8.5 -22.1 -5.5 8.4 14.4 -7.7 5.5 9.81.4 of which equipment : : : : : : : : : : : : : 1.5 of which construction : : : : : : : : : : : : : 1.6 Exports of goods and services : : 2.0 15.1 16.9 11.7 9.8 -8.0 15.3 3.4 1.8 16.6 5.3 4.91.7 Imports of goods and services : : 23.2 -4.1 20.0 31.0 9.6 -19.1 3.1 7.0 1.9 2.0 2.4 3.61.8 GDP 4.3 2.5 9.3 5.4 3.6 5.4 3.8 -3.5 1.0 1.6 -1.5 2.5 1.1 1.9
2. Demand components: Contribution to changes in GDP (%)
2.1 Consumption : : 5.9 5.3 4.9 8.6 5.9 -2.6 -0.7 -0.7 -1.1 -1.4 -1.1 -0.52.2 Investment : : 4.0 0.9 3.3 6.2 2.1 -5.2 -1.0 1.5 2.7 -1.6 1.3 2.42.3 Stockbuilding : : 12.4 -3.9 -1.5 2.0 1.4 -6.6 0.2 2.2 -1.9 0.1 0.1 0.12.4 Domestic demand : : 22.3 2.3 6.7 16.9 9.4 -14.5 -1.5 2.9 -0.3 -3.0 0.3 2.02.5 Exports : : 0.5 3.8 4.8 3.7 3.0 -2.5 4.5 1.2 0.7 6.7 2.5 2.42.6 Final demand : : 22.8 6.2 11.4 20.5 12.4 -17.0 3.0 4.2 0.3 3.7 2.7 4.42.7 Imports : : -10.1 2.1 -9.6 -16.0 -5.4 11.2 -1.5 -3.7 -1.0 -1.2 -1.6 -2.52.8 Net exports : : -9.5 5.9 -4.8 -12.3 -2.4 8.7 3.0 -2.5 -0.3 5.5 0.8 -0.1
3. Gross savings and investment in % of GDP at current prices
3.1 Private sector savings : : : : : : : : : : : : : 3.2 Net savings of households : : : : : : : : : : : : : 3.3 General government savings : : : : : : : : : : : : : 3.4 National savings 5.3 9.3 17.4 16.5 13.7 11.1 7.8 10.8 9.6 11.3 10.4 13.2 15.5 18.53.5 Gross capital formation 11.0 14.5 28.3 23.7 24.1 29.0 29.7 18.0 17.2 20.1 21.1 18.5 20.1 22.83.6 Current account -5.8 -5.2 -10.9 -7.3 -10.4 -17.8 -21.9 -7.2 -7.6 -8.8 -10.6 -5.3 -4.6 -4.3
4. Determinants of investment
4.1 Capacity utilisation (survey) (a) : : : : : : : : : : : : : 4.2 Trend GDP gap : : : : : : : : : : : : : 4.3 Potential GDP gap : : : : : : : : : : : : : 4.4 Profitability index (1961-1973 = 100) : : : : : : : : : : : : :
5. Growth potential
5.1 Growth of net capital stock (real) : : : : : : : : : : : : : 5.2 Net capital/output ratio (real) : : : : : : : : : : : : : 5.3 Growth of capital intensity : : : : : : : : : : : : : 5.4 Labour productivity growth 8.0 5.4 8.9 13.0 7.6 4.4 -2.3 4.1 10.3 8.0 -0.4 -1.1 1.7 2.25.5 Total factor productivity growth : : : : : : : : : : : : :
6. Employment and unemployment
6.1 Employment -3.4 -2.7 0.4 -6.7 -3.8 1.0 6.3 -7.3 -8.4 -6.0 -1.1 3.7 -0.6 -0.36.2 Activity rate 68.6 68.0 71.8 69.2 66.8 65.2 65.9 63.0 59.8 59.1 : : : 6.3 Employment rate 59.5 58.1 58.5 54.8 52.9 53.5 56.9 52.8 48.4 45.5 : : : (benchmark) 6.4 Employment rate : : : : : : : : : : : : : (full-time equivalent) 6.5 Unemployment rate 13.3 14.6 18.5 20.8 20.9 18.1 13.6 16.1 19.2 23.0 23.9 22.1 22.6 22.5 (Eurostat definition)
7. Prices and wages
7.1 Nominal wages per head : : : : : : : : : : : : : 7.2 Real wages per head (b) : : : : : : : : : : : : : 7.3 Nominal unit labour costs : : : : : : : : : : : : : 7.4 Real unit labour costs : : : : : : : : : : : : : 7.5 GDP deflator 22.3 12.9 12.2 15.7 12.5 10.1 12.6 5.9 4.9 9.6 6.0 5.4 4.1 4.57.6 Private consumption deflator : : 9.7 14.8 10.2 6.5 10.6 8.9 7.5 8.1 6.4 5.4 3.5 3.67.7 Terms of trade : : 1.4 -1.8 5.9 4.3 -0.8 2.0 -3.0 5.4 0.3 0.4 -0.2 0.0
8. General government budget, % of GDP
8.1 Expenditure : : : : : : : : : : : : : 8.2 Current revenues : : : : : : : : 42.5 40.6 42.0 40.6 40.2 39.58.3 Net borrowing (-) or lending (+) : : : : : : : -4.5 -4.7 -4.9 -6.5 -5.0 -6.3 -5.98.4 Net borrowing cyclically adjusted : : : : : : : : : : : : : 8.5 Debt (end of period) : : : : : : : 34.7 44.5 48.2 60.0 63.7 70.7 74.4
9. Monetary conditions
9.1 Long-term interest rate : : : : : : : : : : : : : 9.2 Short-term interest rate : : : : : : : : : : : : : 9.3 Yield curve (9.1-9.2) : : : : : : : : : : : : : 9.4 Real long-term interest rate (c) : : : : : : : : : : : : : 9.5 Nominal effective exchange rate : : : : : : : : : : : : : 9.6 Real effective exchange rate : : : : : : : : : : : : : (2005=100; ULC in total economy)
(a) Manufacturing industry (b) Private consumption deflator (c) GDP deflator

223
Main economic indicators 1961-2015
116. United States(Annual percentage change, unless otherwise stated)
1961-1973 1974-1985 1986-1990 1991-1995 1996-2000 2001-2005 2006-2010 2009 2010 2011 2012 2013 2014 2015
1. Growth of GDP and its components (real)
1.1 Private consumption 4.5 3.0 3.4 2.9 4.6 3.1 1.0 -1.6 2.0 2.5 2.2 2.0 2.6 2.91.2 Government consumption 2.7 2.0 2.9 0.6 1.7 2.3 1.8 3.7 0.1 -2.7 -0.2 -2.0 -0.2 1.11.3 Gross fixed capital formation 4.9 3.5 2.0 3.2 7.7 2.6 -3.3 -13.1 1.1 3.5 5.5 2.9 4.9 7.51.4 of which equipment 8.2 4.8 2.2 5.5 10.0 2.4 -0.3 -19.0 12.8 9.6 6.3 1.9 6.1 7.31.5 of which construction 3.8 1.5 -0.2 1.0 4.9 2.2 -8.6 -15.7 -7.4 -1.6 7.7 3.7 4.1 7.61.6 Exports of goods and services 6.7 3.8 11.0 7.2 7.0 1.8 4.9 -9.1 11.5 7.1 3.5 2.7 5.0 5.61.7 Imports of goods and services 7.4 5.0 5.3 7.0 11.6 4.3 0.6 -13.7 12.8 4.9 2.2 1.4 3.5 6.01.8 GDP 4.3 2.8 3.4 2.6 4.3 2.5 0.8 -2.8 2.5 1.8 2.8 1.9 2.8 3.2
2. Demand components: Contribution to changes in GDP (%)
2.1 Consumption 3.6 2.2 2.6 2.0 3.2 2.4 1.0 -0.5 1.4 1.3 1.5 1.1 1.7 2.12.2 Investment 0.8 0.8 0.5 0.6 1.7 0.6 -0.7 -2.8 0.2 0.6 1.0 0.5 0.9 1.52.3 Stockbuilding 0.1 0.0 0.0 0.1 0.1 0.0 0.0 -0.7 1.4 -0.2 0.2 0.2 0.0 0.02.4 Domestic demand 4.4 3.0 3.0 2.7 5.0 3.0 0.3 -3.9 3.0 1.7 2.7 1.8 2.7 3.62.5 Exports 0.3 0.3 0.9 0.7 0.7 0.2 0.5 -1.1 1.3 0.9 0.5 0.4 0.6 0.72.6 Final demand 4.7 3.3 3.9 3.3 5.7 3.1 0.8 -5.1 4.3 2.6 3.1 2.1 3.3 4.32.7 Imports -0.4 -0.5 -0.5 -0.7 -1.4 -0.6 -0.1 2.4 -1.7 -0.8 -0.4 -0.2 -0.5 -0.92.8 Net exports -0.1 -0.2 0.3 -0.1 -0.7 -0.4 0.5 1.2 -0.5 0.1 0.1 0.1 0.1 -0.2
3. Gross savings and investment in % of GDP at current prices
3.1 Private sector savings 19.0 22.2 19.5 19.4 18.0 18.7 19.7 22.0 22.6 22.3 21.9 20.6 19.5 19.33.2 Net savings of households : 7.6 5.6 5.4 3.7 3.1 3.5 4.7 4.2 4.3 4.2 : : 3.3 General government savings 1.5 -0.4 0.0 -1.4 2.5 -0.6 -3.4 -7.6 -7.5 -6.4 -5.4 -2.6 -1.9 -1.33.4 National savings 20.5 21.8 19.5 18.0 20.5 18.0 16.3 14.4 15.1 15.8 16.5 18.0 17.6 18.03.5 Gross capital formation 22.6 23.3 22.8 20.6 22.7 22.2 20.5 17.5 18.4 18.4 19.0 19.5 20.0 20.93.6 Current account 0.5 -0.4 -2.3 -0.9 -2.4 -4.6 -4.2 -2.6 -3.0 -2.9 -2.7 -2.3 -2.2 -2.4
4. Determinants of investment
4.1 Capacity utilisation (survey) (a) : : : : : : : : : : : : : 4.2 Trend GDP gap : : : : : : : : : : : : : 4.3 Potential GDP gap : 0.5 1.2 -1.1 0.4 0.3 -0.4 -3.6 -2.3 -1.9 -0.9 -0.9 -0.4 0.24.4 Profitability index (1961-1973 = 100) 100.0 93.5 105.5 116.4 131.7 134.8 132.9 127.1 138.3 141.2 146.2 148.2 150.9 154.9
5. Growth potential
5.1 Growth of net capital stock (real) 3.1 2.7 2.7 2.1 3.3 3.1 2.0 0.9 0.9 1.0 1.3 1.4 1.6 2.15.2 Net capital/output ratio (real) 2.7 2.6 2.5 2.4 2.3 2.3 2.4 2.5 2.5 2.5 2.4 2.4 2.4 2.45.3 Growth of capital intensity 1.1 0.9 0.5 1.0 1.3 2.8 2.8 6.1 1.7 0.4 -0.5 0.3 -0.2 0.65.4 Labour productivity growth 2.4 1.0 1.1 1.4 2.3 2.2 1.6 2.3 3.4 1.3 0.9 0.8 1.0 1.65.5 Total factor productivity growth 1.9 0.7 0.9 1.0 1.8 1.1 0.5 -0.1 2.7 1.1 1.1 0.7 1.1 1.4
6. Employment and unemployment
6.1 Employment 1.9 1.8 2.4 0.9 1.8 0.7 -0.4 -3.7 -0.6 0.6 1.8 1.0 1.8 1.66.2 Activity rate 67.4 71.6 76.9 77.7 77.2 76.7 76.2 75.9 75.2 74.6 75.0 74.6 74.2 74.76.3 Employment rate 64.2 66.3 72.5 72.8 73.7 72.6 71.1 69.0 68.1 68.0 69.1 69.2 69.5 70.4 (benchmark) 6.4 Employment rate 60.4 62.2 67.7 68.2 70.7 69.0 66.5 63.9 62.9 62.8 63.8 63.9 64.2 65.1 (full-time equivalent) 6.5 Unemployment rate 4.9 7.5 5.9 6.5 4.6 5.4 6.8 9.3 9.6 8.9 8.1 7.4 6.4 5.9 (Eurostat definition)
7. Prices and wages
7.1 Nominal wages per head 5.6 7.5 4.6 3.4 4.5 3.6 3.1 1.6 3.1 3.1 2.1 1.7 2.3 2.97.2 Real wages per head (b) 2.6 0.5 1.0 0.9 2.8 1.4 1.1 1.7 1.4 0.7 0.2 0.5 0.7 1.07.3 Nominal unit labour costs 3.1 6.4 3.4 2.0 2.2 1.3 1.5 -0.6 -0.3 1.8 1.1 0.8 1.3 1.27.4 Real unit labour costs -0.1 -0.3 0.3 -0.4 0.5 -1.0 -0.4 -1.4 -1.4 -0.2 -0.6 -0.7 -0.3 -0.67.5 GDP deflator 3.3 6.7 3.1 2.4 1.7 2.4 1.9 0.8 1.2 2.0 1.7 1.5 1.6 1.87.6 Private consumption deflator 2.9 6.9 3.6 2.5 1.7 2.1 2.0 -0.1 1.7 2.4 1.8 1.1 1.6 1.97.7 Terms of trade -0.3 -1.9 -1.5 0.4 0.3 -0.3 -0.5 5.6 -1.5 -1.2 0.4 1.1 0.1 -0.1
8. General government budget, % of GDP
8.1 Expenditure : 35.3 36.6 37.8 34.8 36.0 39.5 42.9 42.6 41.5 40.0 38.8 38.3 38.38.2 Current revenues : 30.9 32.1 32.5 33.9 31.7 31.9 30.2 30.6 30.9 30.8 32.6 33.0 33.68.3 Net borrowing (-) or lending (+) -2.0 -4.4 -4.5 -5.3 -0.8 -4.3 -7.7 -12.7 -12.0 -10.6 -9.2 -6.2 -5.4 -4.78.4 Net borrowing cyclically adjusted : : : : : : : : : : : : : 8.5 Debt (end of period) 41.1 54.1 62.0 68.8 53.0 64.9 95.2 86.3 95.2 99.5 102.9 104.5 105.9 105.4
9. Monetary conditions
9.1 Long-term interest rate 5.0 9.5 8.6 7.0 6.0 4.4 3.9 3.3 3.2 2.8 1.8 2.3 : 9.2 Short-term interest rate 4.5 8.7 7.9 4.8 5.8 2.4 2.9 0.7 0.3 0.3 0.4 0.3 : 9.3 Yield curve (9.1-9.2) 0.5 0.8 0.7 2.2 0.2 2.0 1.0 2.6 2.9 2.4 1.4 2.1 : 9.4 Real long-term interest rate (c) 1.7 2.7 5.3 4.5 4.3 2.0 1.9 2.5 2.0 0.8 0.0 0.8 : 9.5 Nominal effective exchange rate : : : : 5.2 -2.7 -1.4 6.4 -3.1 -5.3 4.0 3.2 1.3 -0.29.6 Real effective exchange rate : : : : 108.4 110.2 94.9 93.6 90.7 86.1 88.9 91.2 92.3 91.8 (2005=100; ULC in total economy)
(a) Manufacturing industry (b) Private consumption deflator (c) GDP deflator

224
Main economic indicators 1961-2015
117. Japan(Annual percentage change, unless otherwise stated)
1961-1973 1974-1985 1986-1990 1991-1995 1996-2000 2001-2005 2006-2010 2009 2010 2011 2012 2013 2014 2015
1. Growth of GDP and its components (real)
1.1 Private consumption 8.7 3.4 4.6 1.8 0.8 1.2 0.6 -0.7 2.8 0.3 2.0 1.9 0.6 0.71.2 Government consumption 4.9 4.4 3.5 3.6 2.6 2.2 1.0 2.3 1.9 1.2 1.7 2.2 1.6 0.91.3 Gross fixed capital formation 14.0 1.9 8.7 -0.6 -0.6 -1.1 -2.7 -10.6 -0.2 1.4 3.4 2.6 3.8 1.61.4 of which equipment : 4.2 10.1 0.1 1.3 2.0 -2.2 -16.5 2.6 3.4 : : : 1.5 of which construction : 0.2 7.2 -1.2 -3.0 -4.1 -3.9 -6.2 -3.1 -0.1 : : : 1.6 Exports of goods and services 14.1 9.1 3.5 3.6 5.6 5.9 2.7 -24.2 24.4 -0.4 -0.1 1.6 4.0 4.91.7 Imports of goods and services 14.3 1.7 11.4 3.1 4.3 3.4 0.1 -15.7 11.1 5.9 5.3 3.4 4.3 2.81.8 GDP 9.4 3.8 5.0 1.4 0.8 1.2 0.3 -5.5 4.7 -0.5 1.4 1.5 1.5 1.3
2. Demand components: Contribution to changes in GDP (%)
2.1 Consumption 6.0 2.5 3.0 1.5 0.9 1.1 0.6 0.0 2.0 0.4 1.6 1.6 0.6 0.62.2 Investment 3.6 0.5 2.6 -0.2 -0.1 -0.3 -0.6 -2.4 -0.1 0.3 0.7 0.5 0.8 0.32.3 Stockbuilding 0.1 0.0 0.1 0.0 -0.1 0.0 0.0 -1.6 0.9 -0.2 0.1 -0.3 0.0 0.02.4 Domestic demand 9.7 3.0 5.6 1.4 0.7 0.8 -0.1 -4.0 2.9 0.4 2.3 1.9 1.4 0.92.5 Exports 0.7 0.9 0.3 0.3 0.6 0.7 0.4 -4.3 3.1 -0.1 0.0 0.2 0.6 0.82.6 Final demand 10.3 3.8 6.0 1.7 1.2 1.6 0.3 -8.3 6.0 0.4 2.3 2.1 2.0 1.72.7 Imports -0.9 -0.2 -0.9 -0.2 -0.4 -0.4 0.1 2.8 -1.4 -0.8 -0.9 -0.6 -0.6 -0.42.8 Net exports -0.3 0.7 -0.6 0.1 0.2 0.4 0.5 -1.5 1.7 -0.9 -0.9 -0.3 0.0 0.4
3. Gross savings and investment in % of GDP at current prices
3.1 Private sector savings : : 27.2 27.0 27.4 27.4 27.4 28.4 28.9 27.5 26.7 26.4 25.2 24.83.2 Net savings of households : : 8.9 8.5 5.3 1.6 0.9 1.4 1.3 1.6 0.9 : : 3.3 General government savings : : 6.0 5.3 1.5 -1.4 -2.0 -5.8 -5.4 -5.3 -4.9 -4.7 -3.0 -2.13.4 National savings 36.1 32.0 33.2 32.3 28.9 25.9 25.4 22.6 23.5 22.2 21.8 21.7 22.2 22.73.5 Gross capital formation 35.4 31.0 30.3 29.6 26.5 22.8 21.6 19.7 19.8 20.2 20.8 21.0 21.5 21.53.6 Current account 0.6 0.9 2.8 2.5 2.4 3.1 3.7 2.9 3.7 2.0 1.0 0.7 0.7 1.2
4. Determinants of investment
4.1 Capacity utilisation (survey) (a) : : : : : : : : : : : : : 4.2 Trend GDP gap : : : : : : : : : : : : : 4.3 Potential GDP gap : : : : : : : : : : : : : 4.4 Profitability index (1961-1973 = 100) 100.0 67.7 106.3 90.9 86.8 108.9 111.4 95.0 114.4 103.2 108.5 110.2 118.5 125.7
5. Growth potential
5.1 Growth of net capital stock (real) 6.4 5.6 4.8 3.6 2.2 0.9 0.1 -0.6 -0.5 -0.3 0.0 0.1 0.4 0.55.2 Net capital/output ratio (real) 2.3 2.5 2.6 2.7 3.0 3.1 3.0 3.1 3.0 3.0 2.9 2.9 2.9 2.85.3 Growth of capital intensity 5.0 4.9 3.8 2.8 2.7 1.0 0.4 1.0 -0.1 -0.1 -0.1 -0.3 -0.1 0.25.4 Labour productivity growth 7.9 3.1 3.9 0.6 1.3 1.3 0.6 -4.1 5.1 -0.3 1.4 1.1 1.0 1.05.5 Total factor productivity growth 6.2 1.5 2.6 -0.3 0.4 1.0 0.5 -4.4 5.1 -0.2 1.4 1.2 1.1 0.9
6. Employment and unemployment
6.1 Employment 1.3 0.7 1.0 0.8 -0.5 -0.1 -0.3 -1.5 -0.4 -0.2 0.0 0.4 0.5 0.36.2 Activity rate 78.0 76.6 76.2 79.0 80.3 80.1 82.9 83.6 83.0 82.7 83.8 84.9 85.6 86.26.3 Employment rate 77.1 75.0 74.4 77.1 77.1 76.2 79.3 79.5 78.9 79.1 80.3 81.5 82.3 83.0 (benchmark) 6.4 Employment rate : : : : : : : : : : : : : (full-time equivalent) 6.5 Unemployment rate 1.2 2.2 2.5 2.6 4.1 5.0 4.4 5.1 5.1 4.6 4.3 4.0 3.9 3.8 (Eurostat definition)
7. Prices and wages
7.1 Nominal wages per head 14.2 8.3 4.1 2.0 0.1 -1.4 -1.1 -3.3 0.4 0.6 -0.1 0.0 1.1 0.87.2 Real wages per head (b) 7.6 1.8 2.9 0.8 0.1 -0.4 -0.1 -0.9 2.1 1.4 0.7 0.2 -1.4 -0.77.3 Nominal unit labour costs 5.8 5.1 0.2 1.3 -1.3 -2.6 -1.7 0.7 -4.5 0.8 -1.6 -1.1 0.1 -0.17.4 Real unit labour costs -0.4 -0.1 -1.1 0.5 -0.8 -1.3 -0.5 1.2 -2.4 2.7 -0.6 -0.6 -1.6 -1.37.5 GDP deflator 6.2 5.2 1.3 0.8 -0.5 -1.4 -1.2 -0.5 -2.2 -1.9 -0.9 -0.6 1.7 1.27.6 Private consumption deflator 6.1 6.4 1.1 1.1 -0.1 -1.0 -1.0 -2.5 -1.7 -0.8 -0.8 -0.2 2.5 1.57.7 Terms of trade -0.1 -4.7 3.8 0.9 -1.6 -3.1 -3.0 13.2 -5.9 -7.6 -1.4 -1.8 -1.7 0.0
8. General government budget, % of GDP
8.1 Expenditure : : 31.8 33.5 38.0 37.4 38.3 41.9 40.7 41.9 42.0 42.5 42.3 41.78.2 Current revenues : : 32.2 31.9 31.3 31.0 33.8 33.1 32.4 33.1 33.3 33.5 34.9 35.58.3 Net borrowing (-) or lending (+) : : 0.4 -1.7 -6.7 -6.4 -4.5 -8.8 -8.3 -8.8 -8.7 -9.0 -7.4 -6.28.4 Net borrowing cyclically adjusted : : : : : : : : : : : : : 8.5 Debt (end of period) 15.9 66.7 67.0 91.2 140.1 186.4 216.0 210.2 216.0 229.9 237.3 244.0 243.7 244.1
9. Monetary conditions
9.1 Long-term interest rate : 7.8 5.5 4.7 2.0 1.3 1.5 1.4 1.2 1.1 0.9 0.7 : 9.2 Short-term interest rate : 7.8 5.4 3.7 0.4 0.1 0.5 0.5 0.2 0.2 0.2 0.2 : 9.3 Yield curve (9.1-9.2) : 0.0 0.0 1.0 1.6 1.2 0.9 0.9 1.0 0.9 0.7 0.6 : 9.4 Real long-term interest rate (c) : 2.6 4.1 3.8 2.5 2.8 2.7 1.9 3.4 3.0 1.8 1.3 : 9.5 Nominal effective exchange rate : : : : 0.7 -3.1 4.0 16.1 6.1 5.9 3.2 -18.5 -5.6 -0.19.6 Real effective exchange rate : : : : 136.3 110.7 91.2 98.9 99.9 105.0 104.8 83.4 77.8 76.5 (2005=100; ULC in total economy)
(a) Manufacturing industry (b) Private consumption deflator (c) GDP deflator