statistical assessment of crosstalk enrichment between...
TRANSCRIPT

Statistical Assessment of Crosstalk Enrichment betweenGene Groups in Biological NetworksTheodore McCormack1,2., Oliver Frings1,2., Andrey Alexeyenko1,3, Erik L. L. Sonnhammer1,2,4*
1 Stockholm Bioinformatics Centre, Science for Life Laboratory, Solna, Sweden, 2 Department of Biochemistry and Biophysics, Stockholm University, Stockholm, Sweden,
3 School of Biotechnology, Royal Institute of Technology, Stockholm, Sweden, 4 Swedish eScience Research Center, Stockholm, Sweden
Abstract
Motivation: Analyzing groups of functionally coupled genes or proteins in the context of global interaction networks hasbecome an important aspect of bioinformatic investigations. Assessing the statistical significance of crosstalk enrichmentbetween or within groups of genes can be a valuable tool for functional annotation of experimental gene sets.
Results: Here we present CrossTalkZ, a statistical method and software to assess the significance of crosstalk enrichmentbetween pairs of gene or protein groups in large biological networks. We demonstrate that the standard z-score is generallyan appropriate and unbiased statistic. We further evaluate the ability of four different methods to reliably recover crosstalkwithin known biological pathways. We conclude that the methods preserving the second-order topological networkproperties perform best. Finally, we show how CrossTalkZ can be used to annotate experimental gene sets using knownpathway annotations and that its performance at this task is superior to gene enrichment analysis (GEA).
Availability and Implementation: CrossTalkZ (available at http://sonnhammer.sbc.su.se/download/software/CrossTalkZ/) isimplemented in C++, easy to use, fast, accepts various input file formats, and produces a number of statistics. These includez-score, p-value, false discovery rate, and a test of normality for the null distributions.
Citation: McCormack T, Frings O, Alexeyenko A, Sonnhammer ELL (2013) Statistical Assessment of Crosstalk Enrichment between Gene Groups in BiologicalNetworks. PLoS ONE 8(1): e54945. doi:10.1371/journal.pone.0054945
Editor: Christos A. Ouzounis, The Centre for Research and Technology, Greece
Received October 14, 2011; Accepted December 21, 2012; Published January 23, 2013
Copyright: � 2013 McCormack et al. This is an open-access article distributed under the terms of the Creative Commons Attribution License, which permitsunrestricted use, distribution, and reproduction in any medium, provided the original author and source are credited.
Funding: This work was supported by a grant from the Swedish Research Council. The funders had no role in study design, data collection and analysis, decisionto publish, or preparation of the manuscript.
Competing Interests: The authors have declared that no competing interests exist.
* E-mail: [email protected]
. These authors contributed equally to this work.
Introduction
Gene interaction networks are widely used in biological
research. Some popular applications include: inference of
function for previously unannotated genes [1], extension of
GO terms and pathways [2], finding novel disease genes [3],
and prioritization of disease gene candidates [4]. However, as
always in computational and high-throughput biology, the
problems of statistical significance and false discovery need to
be properly addressed [5,6].
When studying statistical properties in biological networks by
randomization techniques, a good null model is indispensable. The
model should accurately reflect the structure of the original
network as well as the conditions that led to its emergence [7].
Various models have been proposed in recent years to model
biological networks, in particular PPI networks. Network types
include random [8], random geometric [9], and scale free [10]. In
all cases, a good null model is a prerequisite for producing reliable
predictions that can help to guide experimental studies, while an
incorrect model might lead to erroneous conclusions.
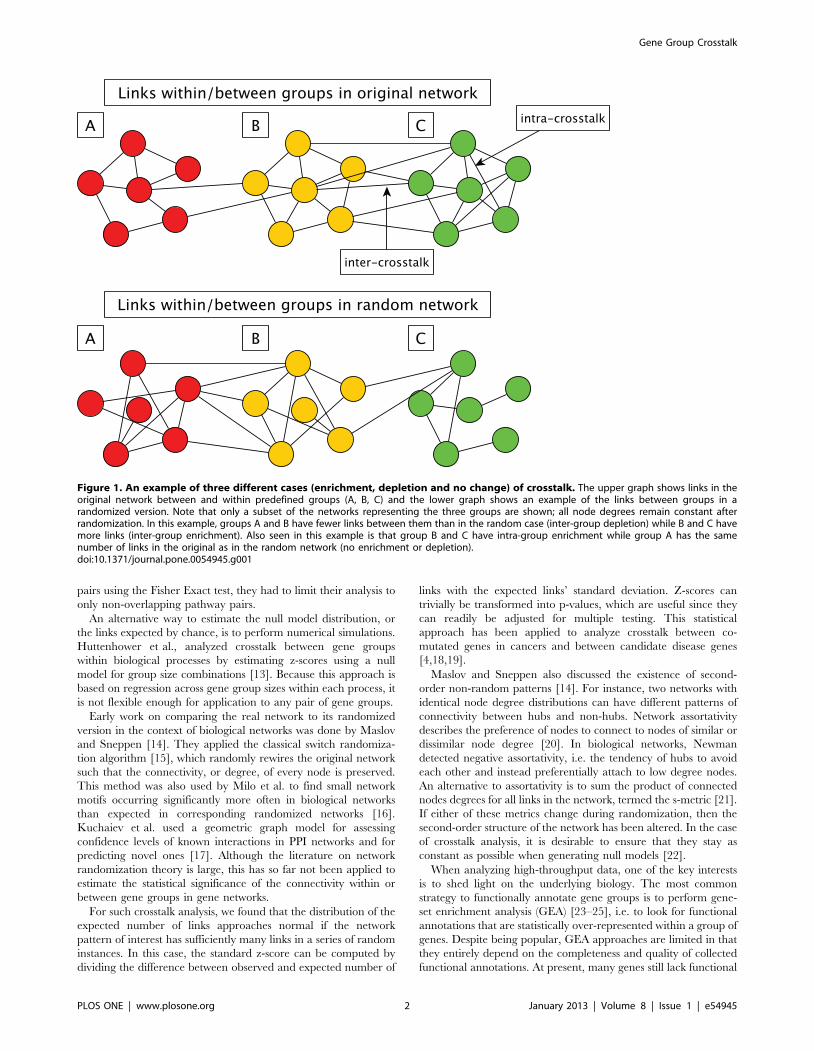
We define crosstalk enrichment in biological networks as the
extent of connectivity between (inter) or within (intra) biological
groups (see Figure 1). An experimental gene set, a known
functional module, or a pathway are all examples of biological
groupings. To draw statistically sound conclusions about crosstalk
enrichment or depletion, a probabilistic estimate is crucial.
A probabilistic estimate is produced by comparing an observa-
tion to a reference. The reference is determined by the null model
hypothesis, which must express a distribution of the number of
observations expected by chance. In network analysis, an
observation is typically the number of links found within a certain
network structure, e.g. inside of a network module or between two
modules. Given the scale-free property of most biological
networks, it does not make sense to compare the properties of
network hubs to those of sparsely connected genes without such a
reference. For instance, a hub gene may have a few links to genes
of a certain module simply by chance, whereas for a gene with a
modest number of connections, the same number of links would
indicate an important biological pattern. If a null distribution is
available, then both the expected number of links and the
respective variance can be estimated.
In simple cases, the number of links expected by chance can be
estimated analytically for scale-free networks, for instance, from
the hyper-geometric distribution [11]. However, analytical meth-
ods are not feasible for more complex cases, such as when gene
groups share members, which is likely to exaggerate the number of
links between them. For example, when Li, Y. et al. [12] built a
network of pathways by computing the crosstalk between pathway
PLOS ONE | www.plosone.org 1 January 2013 | Volume 8 | Issue 1 | e54945
pairs using the Fisher Exact test, they had to limit their analysis to
only non-overlapping pathway pairs.
An alternative way to estimate the null model distribution, or
the links expected by chance, is to perform numerical simulations.
Huttenhower et al., analyzed crosstalk between gene groups
within biological processes by estimating z-scores using a null
model for group size combinations [13]. Because this approach is
based on regression across gene group sizes within each process, it
is not flexible enough for application to any pair of gene groups.
Early work on comparing the real network to its randomized
version in the context of biological networks was done by Maslov
and Sneppen [14]. They applied the classical switch randomiza-
tion algorithm [15], which randomly rewires the original network
such that the connectivity, or degree, of every node is preserved.
This method was also used by Milo et al. to find small network
motifs occurring significantly more often in biological networks
than expected in corresponding randomized networks [16].
Kuchaiev et al. used a geometric graph model for assessing
confidence levels of known interactions in PPI networks and for
predicting novel ones [17]. Although the literature on network
randomization theory is large, this has so far not been applied to
estimate the statistical significance of the connectivity within or
between gene groups in gene networks.
For such crosstalk analysis, we found that the distribution of the
expected number of links approaches normal if the network
pattern of interest has sufficiently many links in a series of random
instances. In this case, the standard z-score can be computed by
dividing the difference between observed and expected number of
links with the expected links’ standard deviation. Z-scores can
trivially be transformed into p-values, which are useful since they
can readily be adjusted for multiple testing. This statistical
approach has been applied to analyze crosstalk between co-
mutated genes in cancers and between candidate disease genes
[4,18,19].
Maslov and Sneppen also discussed the existence of second-
order non-random patterns [14]. For instance, two networks with
identical node degree distributions can have different patterns of
connectivity between hubs and non-hubs. Network assortativity
describes the preference of nodes to connect to nodes of similar or
dissimilar node degree [20]. In biological networks, Newman
detected negative assortativity, i.e. the tendency of hubs to avoid
each other and instead preferentially attach to low degree nodes.
An alternative to assortativity is to sum the product of connected
nodes degrees for all links in the network, termed the s-metric [21].
If either of these metrics change during randomization, then the
second-order structure of the network has been altered. In the case
of crosstalk analysis, it is desirable to ensure that they stay as
constant as possible when generating null models [22].
When analyzing high-throughput data, one of the key interests
is to shed light on the underlying biology. The most common
strategy to functionally annotate gene groups is to perform gene-
set enrichment analysis (GEA) [23–25], i.e. to look for functional
annotations that are statistically over-represented within a group of
genes. Despite being popular, GEA approaches are limited in that
they entirely depend on the completeness and quality of collected
functional annotations. At present, many genes still lack functional
Figure 1. An example of three different cases (enrichment, depletion and no change) of crosstalk. The upper graph shows links in theoriginal network between and within predefined groups (A, B, C) and the lower graph shows an example of the links between groups in arandomized version. Note that only a subset of the networks representing the three groups are shown; all node degrees remain constant afterrandomization. In this example, groups A and B have fewer links between them than in the random case (inter-group depletion) while B and C havemore links (inter-group enrichment). Also seen in this example is that group B and C have intra-group enrichment while group A has the samenumber of links in the original as in the random network (no enrichment or depletion).doi:10.1371/journal.pone.0054945.g001
Gene Group Crosstalk
PLOS ONE | www.plosone.org 2 January 2013 | Volume 8 | Issue 1 | e54945

annotations, for example in form of Gene Ontology (GO) terms
[26] or KEGG pathways [27]. GEA methods further fail to
identify pathway annotations that are strongly linked to a gene
group, but only have a few shared genes.
Here we compare the suitability of four different network
randomization algorithms for statistical crosstalk enrichment
analysis [15,28]. The methods are evaluated with respect to their
true and false positive rates, conservation of topological properties,
the null model distribution quality, and the computational speed
under different conditions. Furthermore, we show that crosstalk
enrichment analysis can be a valuable tool for functional
annotation of gene groups. We compare crosstalk enrichment
analysis GEA and demonstrate that its performance is superior to
GEA when annotating experimental gene groups from MsigDB
[24] using know pathway annotations from KEGG [27].
We also present CrossTalkZ, a software package that imple-
ments the four randomization techniques and quantifies the
connectivity between gene groups of interest. The package is freely
available and includes several statistical tests to allow the user to
draw solid statistically supported conclusions.
Results
In undirected networks, crosstalk between (inter) or within
(intra) gene groups is defined as the extent of connectivity between
the genes in the groups (see Figure 1). To assess the significance of
crosstalk enrichment, we compare the observed connectivity with
the connectivity expected from a null model distribution. The
expected connectivity between groups is obtained by tallying the
links between genes of the two groups after randomizing the
network multiple times. We first show that if the distribution of
expected links is normal, the standard z-score is an appropriate
and unbiased statistic to estimate the significance of crosstalk
enrichment and that other statistics such as a p-value and false
discovery rate (FDR) [29] can readily be calculated. We then
compare four different network randomization algorithms with
respect to their suitability for crosstalk analysis. Finally, we
exemplify how crosstalk enrichment analysis can be used to
annotate experimentally derived gene groups and that it performs
favorably compared to gene set enrichment analysis (GEA).
Network Randomization MethodsThere are many different ways to randomize networks. We pose
a minimum requirement that the degree distribution is preserved.
In many cases it is also important to preserve second-order
topological patterns of the original network to best represent the
system under study. We tested four different randomization
methods, each with varying degrees of topological conservation,
for their ability to discover crosstalk. The methods are referred to
as link permutation (LP), node permutation (NP), link assignment
(LA), and link assignment+second-order conservation (LA+S). The
LP method, randomly swaps links in a network. NP permutes node
labels between nodes that have similar degree. LA implements a
variant of the matching algorithm [15] or configuration model
[28] by adding an extra step to resolve the problem of self-links or
multiple links between nodes. It starts with an unconnected
network and randomly adds links between nodes until the original
node degrees are recovered. LA+S is a variant of LA that also
preserves the second-order topology. All of the methods preserve
the network degree sequence (distribution) of the original network.
Estimating the Significance of Crosstalk EnrichmentThe estimation of the significance of crosstalk enrichment, i.e.
the extent to which the connectivity between or within functional
groups exceeds what is expected by chance, is a crucial aspect of
crosstalk analysis. The converse of enrichment is depletion, and
corresponds to observing less connectivity than expected by
chance.
There are two common alternatives for significance estimation.
The first is to use a permutation test where a p-value can be
calculated as the fraction of null cases (i.e. observations in
randomized network instances) that contained more links than
observed in the real network. An alternative is to use standard z-
scores, which for the normal distribution, is the number of
standard deviations away from the mean that an observation point
lies. The z-score can readily be transformed into a p-value. One of
the crucial differences between the two methods is that the z-score
converges after relatively few randomizations, while a high
precision indirect p-value estimation using a permutation test
requires a very large number of permutations to converge.
Because, the full permutation test is computationally expensive,
we opted for the z-score alternative. Another advantage of using
the z-score is that it is easily interpreted as crosstalk enrichment or
depletion, where positive values indicate enrichment and negative
values indicate depletion.
In order for the z-score and p-value to be meaningful, the null
model distribution needs to fulfill the normality criterion. To
assure that the assumption of normality is fulfilled, a reduced chi-
squared statistic is calculated. We generated 100 sets of
randomized KEGG pathways to test for this. Every node in each
pathway was replaced with a random node from the entire
FunCoup network of similar degree. In this way, each pathway
contains new random genes while approximately conserving its
original degree sequence. Figure 2 shows the reduced chi-squared
statistic versus the number of expected links for all four methods
for this test. We found that the normality assumption is generally
only violated if the number of expected links is small. For the set of
randomized KEGG pathways we found for example that when
averaged over all four methods, only 4.761.5% of the cases had
expected number of links below 5 and fit a normal distribution, i.e.
reduced chi-squared , = 1 [30]. On the other hand, for the cases
with expected links above 5, 97.660.8% had reduced chi-squared
, = 1. One should note, however, that reduced chi-squared = 1
can potentially be an overly stringent criterion if the expected
number of links is small, leading to false negatives.
For the analysis to be unbiased, the central limit theorem
suggests that the distribution of z-scores between random groups
should be standard normal and therefore give a uniform
distribution of p-values. For the randomized KEGG pathways
these distributions are shown in Figure 3, along with some quality
metrics. When considering only test cases that passed the expected
links normality criterion, all four methods generated approxi-
mately standard normal z-score distributions. However, LA+S was
clearly the best and LP the worst when looking at skewness, mean,
standard deviation, and p-value bias. A bias in the p-value
distribution can be seen by looking at the ratio of the number of
points with p-value in the range [0, 0.05] to the average number of
points in equally sized bins for p-value . = 0.05. The least biased
method was LA+S with a ratio of 0.996, while LP was the worst
with almost 50% more significant p-values than the mean in
insignificant bins.
Preservation of Second-order Network TopologyWe tested to which degree the different methods preserve the
topology of the original network by calculating two different
measures: assortativity [20] and the s-metric [21]. The network
assortativity is the correlation between the degrees of the two
nodes connected by a link, while the s-metric is simply the sum of
Gene Group Crosstalk
PLOS ONE | www.plosone.org 3 January 2013 | Volume 8 | Issue 1 | e54945

the product of node degrees that are connected by a link. The
human FunCoup network had an assortativity of r = 0.2,
indicating that high degree nodes are more frequently connected
to high degree nodes than to low degree nodes. We observed the
same trend for the human STRING [31] network (cutoff .0.5,
r = 0.32). This is opposite to what Newman reported for biological
networks (r = 20.15) [20]. Independently, Maslov and Sneppen
found biological networks to be disassortative (r ,0), i.e. that high
degree nodes have a preference to connect to low degree nodes
[14]. However, the networks used in their studies were relatively
small yeast networks, purely based on physical protein interac-
tions.
The average assortativity, s-metric ratio, and percent identity
for each of the four methods are shown in Table 1. By percent
Figure 2. Normality test of the null model distribution. Values of the reduced chi-squared test of normality are plotted against the expectednumber of links for all four methods using randomized KEGG pathways. The normality criterion is generally only violated for low numbers of expectedlinks. The horizontal line represents the threshold used for normality (chi-squared = 1), and the vertical line is at expected number of links = 5. Thenumber of points is indicated by the density, lighter colors are lower density.doi:10.1371/journal.pone.0054945.g002
Gene Group Crosstalk
PLOS ONE | www.plosone.org 4 January 2013 | Volume 8 | Issue 1 | e54945

identity we mean the fraction of links shared between the original
and the randomized networks. A method with higher percent
identity can be considered more conservative than one with a
lower percent identity. As expected, NP preserved the assortativity
and s-metric of the original network, simply because it did not
change the network topology. The other methods altered these
metrics to varying degrees. The effect for the LA+S method was
marginal, as it aimed to connect nodes that have same degree as in
Figure 3. Comparison of the p-value and z-score distributions for all four methods. The analysis were performed on a set of randomizedKEGG pathways. All results were filtered for reduced chi-squared , = 1.0. According to the central limit theorem the distribution of z-scores betweenrandom groups should be standard normal and therefore give a uniform distribution of p-values. For each p-value distribution we report the ratiobetween the number of p-values ,0.05 and the average number in equally sized bins with p-value . = 0.05. An unbiased distribution should give aratio of 1. For each z-score distribution we report skewness, mean and standard deviation. For each method 150 rando-mizations were performed.doi:10.1371/journal.pone.0054945.g003
Gene Group Crosstalk
PLOS ONE | www.plosone.org 5 January 2013 | Volume 8 | Issue 1 | e54945

the original network. For the less conservative methods LP and
LA, the assortativity turned negative and the s-metric was
substantially lower than for NP and LA+S. Depending on the
null hypotheses tested, conclusions based on the expected number
of links might be biased if the network randomization does not
account for second-order topological features of the original
network. Both LA+S and NP should generate a null distribution
that preserves the second-order topology of the original network
and are therefore preferable for crosstalk analysis.
Estimation of False Positive RateTo analyze the false positive rate of the four algorithms we used
the same dataset of sets of randomized KEGG pathways
previously used for analyzing distribution properties (Figure 2,
3), as a source of crosstalk statistics between pathways that should
not have crosstalk. In a first test we used a simple cutoff such that a
crosstalk enrichment measurement was considered a false positive
if its p-value ,0.05 and it had a reduced chi-squared value
, = 1.0. The least conservative method, LP, gave the highest
fraction, 4.7%. LA+S gave the lowest fraction, 3.2%, slightly lower
than NP and LA, at 3.5% and 3.6%, respectively.
In a second, more comprehensive test, we analyzed the false
positive rate for each method across a range of p-values (Figure 4).
This also shows that the LP method is clearly less conservative
than the other methods, and that the LA+S method is most
conservative.
Estimation of False Negative RateHundreds of signaling, metabolic and other functional gene
groups are known from the literature and found curated in
databases, such as GO [26] or KEGG [27]. Li et al. demonstrated
that GO terms and pathways (HumanCyc and BioCarta) are often
enriched in internal network connections [12]. Based on the
assumption that pathways are functionally coherent groups, we
analysed intra-crosstalk within KEGG pathways mapped to
FunCoup as a positive control, to estimate the false negative rate
of the methods.
At FDR ,0.05 and reduced chi-squared , = 1.0, all four
methods found 100% of the pathways to be significant for this test.
However, at higher stringency the differences between the
methods are more apparent. To show this, we plotted the fraction
of significant internal crosstalk as a function of the z-score
(Figure 5, solid curves). We used the z-score here to maximize the
range of sensitivity. Consistent with the fact that the LP method
previously showed the highest false positive rate (Figure 4), it also
showed the lowest false negative rate here (i.e. the highest recovery
rate). Although the LA+S method previously showed the lowest
false positive rate, it did not have the highest false negative rate. In
fact, around a z-score cutoff of 15 it is the best method. Overall
LA+S thus appears to be the best compromise between false and
negative rates.
A variation of this test involves splitting each pathway
approximately in half resulting in two pathways. In this test we
look at the ability of the methods to re-discover the crosstalk
between the pathway halves. Since we observed strong intra-
crosstalk enrichment in the original KEGG pathways, we expect
that splitting these pathways in random halves should result in
strong inter-crosstalk enrichment between the halves. At FDR
,0.05 and reduced chi-squared , = 1.0, all methods recovered at
least 99.1% of the pathways. The dotted lines in Figure 5 represent
the results of the split pathway test. Again, the LP method showed
the lowest false negative rate here, while the LA+S and NP
methods performed about equally, showing the highest false
negative rates.
The main outcome of both the negative and positive controls
is that LP performs strikingly less conservative than the other
methods as it estimates higher z-scores. The other three
methods perform similarly, but the two methods that preserve
second-order topology well, LA+S and NP are more conserva-
tive in most tests.
Pathway AnalysisAn important goal of analyzing high-throughput data, such as
lists of differentially expressed genes, is to study the underlying
biology. A commonly applied approach is to perform gene
enrichment analysis (GEA), i.e. to look for functional annotations
that are statistically over-represented within a group of genes [32].
While GEA approaches are popular and easy to implement, they
are limited in certain ways [23]. They entirely depend on the
completeness and quality of pathway annotations, both of which
are low at present. In contrast, crosstalk enrichment analysis by
CrossTalkZ looks for enrichment in network connections between
two groups of genes. Because it employs the network, it can detect
pathways that are strongly associated to a gene group, even when
GEA can not detect this because of few shared genes. It may also
detect associations to relevant up- or downstream pathways if the
crosstalk is sufficiently strong.
To compare these approaches, we applied both CrossTalkZ and
GEA to search for associations between 2392 experimental gene
groups from MsigDB [24] and 236 KEGG pathways. GEA found
3370 unique, i.e. only found by GEA, gene group to pathway
associations that were significant. CrossTalkZ using the FunCoup
network found 49225 unique significant associations while 9707
significant associations were found by both methods. In other
Table 1. Shown are the means and standard deviations for one primary (column two) and two secondary (column three and four)topology conservation metrics for the four different network randomization methods.
MethodPercent identity of links betweenrandomized and original Randomized assortativity (original r = 0.20) s-metric ratio (randomized/original)
LP 7.3860.04 20.0960.00 0.8060.00
NP 12.1260.11 0.2060.00 1.0060.00
LA 10.4760.21 20.1560.02 0.7660.01
LA+S 14.7960.07 0.1460.01 0.9660.00
The average percent identity is the fraction of links the randomized network had in common with the original network. The assortativity represents the correlationbetween degrees of connected nodes. A positive assortativity indicates that nodes tend to be connected to nodes of similar degree, while a negative assortativityindicates that they tend to connect to nodes with different degrees. The s-metric is another link degree correlation measure; the ratios shown are the randomizednetwork’s s-metric divided by the original network’s s-metric. All results shown were generated from 50 iterations for each method using the human FunCoup network.doi:10.1371/journal.pone.0054945.t001
Gene Group Crosstalk
PLOS ONE | www.plosone.org 6 January 2013 | Volume 8 | Issue 1 | e54945

words, CrossTalkZ provides a very substantial increase in pathway
annotations compared to GEA, yet finds most GEA annotations.
To illustrate the usefulness of CrossTalkZ, we briefly discuss two
examples from this screen.
Setlur et al. [33] presented a gene signature of 63 genes up-
regulated in prostate cancer. The GEA approach failed to identify
any significant KEGG pathway associations (see Table 2). In
contrast, CrossTalkZ identified 9 significant KEGG pathway
associations that reflect the functional dynamics of the signature.
We found significant associations to pathways ‘‘Prostate cancer’’
and ‘‘Pathways in cancer’’. We further found strong links to the
TGF-beta signaling pathway which plays a well-studied role in
tumorigenesis and cancer progression [34], as well as the Notch
signaling pathway which has been linked more recently to prostate
cancer as one of the key regulators of prostate cancer progression
[35].
A signature of 389 genes up-regulated in a sub-cluster of bladder
cancers dominated by G2 tumors was presented by Lindgren et al.
[36]. CrossTalkZ identified 81 significant pathway associations of
which 55 were not found by the GEA approach. Among the
pathways identified by both methods were various pathways
related to cellular functions as cell migration, differentiation,
proliferation, and apoptosis. Pathway associations only found by
CrossTalkZ included: the KEGG bladder cancer pathway, TGF-
beta signaling pathway, Wnt signaling pathway, ErbB signaling
pathway as well as many other cancer-related pathways (see Table
S1).
Software PerformanceWe tested the performance of each of the four methods on
random scale free networks that were obtained using the
Barabasi–Albert scale free model [10]. Figure 6 shows the
performance of the methods for 150 randomizations when either
a) keeping the number of nodes constant and varying the number
of links or b) keeping the number of links constant and varying the
number of nodes. The node permutation method is the fastest in
all test cases and its speed depends only on the number of nodes in
the network. Conversely, the link permutation method depends
only on the number of links, but is orders of magnitude slower on
the test set. The link assignment methods have a more complex
performance curves, but still randomize a network of 104 nodes
and 106 links in approximately 10 seconds. All benchmarks were
conducted on a 2 GHz processor with 4GB of memory.
Discussion
We created CrossTalkZ, a method and software to assess the
significance of crosstalk, which we define as the extent of
connectivity between or within gene groups in biological networks.
We first showed that the significance of the crosstalk enrichment
can be assessed with the standard z-score, which compares the
number of links observed between gene groups in the original
network to the number of expected links. The expected number of
links under the null model is estimated by generating a series of
randomized instances of the original network. Second, we
compared four different randomization methods with regard to
Figure 4. Comparison of the false positive rate for the four different methods. A result was considered false positive if it passed thenormality criterion (reduced chi-squared , = 1) and had a p-value below a certain cutoff. Shown is the false positive rate as a function of the p-value.The test was performed using randomized KEGG pathways mapped to the FunCoup network.doi:10.1371/journal.pone.0054945.g004
Gene Group Crosstalk
PLOS ONE | www.plosone.org 7 January 2013 | Volume 8 | Issue 1 | e54945

their suitability for crosstalk enrichment analysis. Third, we
showed that crosstalk analysis performed favorably to gene-set
enrichment analysis (GEA) when annotating experimental gene
groups from MsigDB.
CrossTalkZ implements four network randomization algo-
rithms. The algorithms conserve the scale-free topology (degree
distribution) of the original network and differ mostly by the extent
to which they conserve second-order topological properties. Link
permutation attempts to swap all links in the original network and
therefore generates random networks that have the least links in
common with the original network. As a result, it is potentially
underestimating the number of links between groups expected by
Figure 5. Comparison of the false negative rate for the four different methods. Shown is the percentage of correctly recovered pathways(i.e. 1– false negative rate) as a function of the z-score. Solid lines represent internal crosstalk enrichment detection rates while dashed lines representinter-crosstalk enrichment detection rates for KEGG pathways that were split into random halves. The test was performed using KEGG pathwaysmapped to the FunCoup network.doi:10.1371/journal.pone.0054945.g005
Table 2. KEGG pathway associations to a 63 gene signature of genes up-regulated in prostate cancer.
KEEG pathway associations with prostate cancer signature by Setlur et al.
Z-score CrossTalkZ ChiSqr CrossTalkZ FDR CrossTalkZ FDR GEA
TGF-beta signaling pathway 4.58 0.02 5.31E206 0.19
Basal transcription factors 4.55 0.05 5.95E206 1.00
Notch signaling pathway 4.01 0.32 7.20E205 0.50
Ubiquitin mediated proteolysis 3.26 0.01 1.41E203 0.85
Pathways in cancer 3.11 0.03 2.34E203 1.00
Prostate cancer 2.98 0.10 3.71E203 1.00
Proteasome 2.59 0.04 1.30E202 0.49
Cell cycle 2.44 0.02 2.06E202 0.26
Bladder cancer 2.26 0.36 3.46E202 1.00
Shown are the z-score, the reduced chi-squared, and the FDR for CrossTalkZ as well as the FDR for the GEA approach. CrossTalkZ identified 9 significant pathwayassociations while GEA failed to identify any significant pathway associations.doi:10.1371/journal.pone.0054945.t002
Gene Group Crosstalk
PLOS ONE | www.plosone.org 8 January 2013 | Volume 8 | Issue 1 | e54945

chance, giving overall higher fractions of significant crosstalk
enrichment. Link assignment provides random networks that have
links between nodes drawn uniformly from the whole network, a
result of which is disassortative mixing (high degree nodes prefer
low degree nodes). The more conservative methods LA+S and NP
have restricted sets of links or nodes, respectively, to choose from
when randomizing and therefore potentially over estimate the
number of links between groups expected by chance, resulting in
lower fractions of significant crosstalk enrichment.
We compared the algorithms with respect to their ability to
produce high-quality random networks in order to provide
unbiased null distributions for the estimation of the expected
number of links. Overall, we found that the methods LA+S and
NP maximally preserved the topological properties of the original
network and gave the lowest fraction of both true and false
positives, as expected. Interestingly, the LA+S method minimized
the fraction of false positives while preserving second-order
properties to a similar degree as NP. Furthermore, it produces
the least biased z-score and p-value distributions of all the methods
and is therefore the default method in the CrossTalkZ software
package. Conversely, the least conservative methods LP and LA
resulted in higher fractions of both true and false positives and
produced more biased p-value distributions.
Gene enrichment analysis is often applied for pathway
annotation of gene groups, for example, sets of differentially
expressed genes. However, it often fails because of the incomplete
state of current pathway databases. Methods that employ
connections in a comprehensive interaction network are more
likely to identify pathway associations. We exemplified how
CrossTalkZ using the FunCoup network can be a valuable
addition to classical gene enrichment analysis and that it can
uniquely find many relevant pathway associations.
Since our statistics rely on a normal distribution of the expected
number of links, our method gives completely unbiased p-value
estimates only on groups with a sufficient number of expected links
in the randomized networks. In general, the reliability of the
statistics can always be assessed by the reduced chi-squared
statistic, which conveys the degree of deviation from normality.
Potentially (in a future software version), this bottleneck could be
circumvented by directly estimating the false positive rate for a
given case by a permutation test.
Methods
Network Randomization AlgorithmsLink permutation (LP). This method swaps links between
nodes while conserving their node degree. In order to swap links,
two links are chosen randomly from the network. Then, if the links
do not share common nodes and if swapping the links forms two
new links in the network, the links are swapped. This process is
repeated until all the links in the original network have been
swapped or no additional swapping can occur. Since swapping
links leaves the degree of each node involved unchanged, the
randomized network conserves degree sequence.
Node permutation (NP). In this method, network topology
is completely conserved because only the nodes are permuted
randomly. In our implementation, a given node may only swap
with a node that belongs to the same connectivity bin, so as to
approximately conserve its connectivity. Bin borders were
dynamically established using a natural log scale where a node
with degree d falls into bin B(d) = round(ln(d)+1).
Link assignment (LA). This method begins by removing all
the links from the network while keeping track of each node’s
degree. Links are assigned between randomly chosen nodes until
the original degrees are restored or no more nodes satisfy the
connection constraints. These connection constraints are as
follows: no self-loops or multiple edges are allowed, and the
degree of both nodes must be less than or equal to their respective
original degree after link assignment. Once a node recovers its
original degree, it is removed from the set of available nodes. Since
Figure 6. Software performance for 150 randomizations for each of the four methods. a) Computational performance with increasingnumber of links and constant number of nodes. The node permutation method is independent of the number of links and only depends on thenumber of nodes. b) Computational performance with increasing number of nodes and constant number of links. The link permutation method isindependent of the number of nodes and only depends on the number of links.doi:10.1371/journal.pone.0054945.g006
Gene Group Crosstalk
PLOS ONE | www.plosone.org 9 January 2013 | Volume 8 | Issue 1 | e54945

it is possible that some nodes will not recover their original degree
due to connection constraints, a final test and degree fix by
swapping procedure is applied to those nodes (see Text S1).
Link assignment+second-order conservation
(LA+S). The ‘‘neighbor degree sequence’’ describes the associ-
ation between a given node’s degree to the degree of nodes
connected to it. With this in mind, we introduce a variation of our
link assignment method termed link assignment+second-order
conservation. This method uses the same basic approach as LA,
but for a given node, instead of choosing any node available in the
network to connect to, the available nodes are restricted to a set of
nodes that fall into the same log connectivity-bin as nodes it was
connected to in the original network. After randomization, the
degree sequence is conserved and each node has a similar
neighbor degree sequence as in the original network.
StatisticsAfter generating a normally distributed null model, a standard
z-score can be calculated as follows: Zij = (Nobsij2Nexpij)/SDij
where Nexpij is the mean number of links between groups i and j
found after N randomizations of the network, Nobsij is the number
of links found between groups i and j in the original network, and
SDij is the standard deviation of the number of links between the
two groups after N randomizations. The z-score is further
transformed into a p-value and adjusted for multiple testing using
the false discovery rate (FDR) with the procedure of Benjamini
and Hochberg [29]. When applying CrossTalkZ in research one
should always use FDR as a criterion for the significance of cross-
talk. However, for illustrative purposes we use p-values or z-scores
in Figures 4 and 5 as it makes differences between the methods
more apparent. P-value adjustment is conducted separately for
inter- and intra- crosstalk as they are considered as two
independent tests. As a measure of how well the distribution of
expected links for each pair of gene groups fits a normal
distribution, a reduced chi-squared statistic is calculated [30]. The
reduced chi-squared normalizes for the number of degrees of
freedom in a statistical calculation, which in this implementation is
d = N2c, with N the same as above and c = 3 the number of
constraints (mean, standard deviation, and N). Taylor suggested
that for reduced chi-squared of order one or less the observed
distribution fits the theoretical distribution well [30]. Therefore, in
our analysis we only used results with reduced chi-squared , = 1
to ensure the z-scores calculated are valid.
Interaction NetworkThe FunCoup database provides global interaction networks for
a variety of species and combines different types of evidence:
protein-protein interactions, mRNA co-expression, sub-cellular
co-localization, phylogenetic profile similarity, co-targeting by
either miRNA or transcription factors, protein co-expression, and
domain-domain interactions. It further transfers evidence from
other eukaryotic species via orthologs. For this study we used the
human FunCoup v1.1 network. All links with a confidence cutoff
of 0.5 or higher were included. We earlier demonstrated that this
network possesses the scale-free property [18], which is typically
associated with biological networks. The whole network included
10885 unique genes with 230589 links between them. The highest
and most rare node degree was 957 while the lowest and most
frequent node degree was 1. From this point, all references to the
FunCoup network will be referring to the network described here.
Pathway DataWe collected all human pathway annotations from the KEGG
database (as of February 2010) [27]. All pathways containing less
than 10 genes present in the interaction network were excluded,
since they are likely to have a low number of expected links
between them and would therefore not fulfill the normality
criterion. In total we included 66 metabolic and 33 signaling
human KEGG pathways, covering 2004 unique genes. Out of the
original 2650 unique KEGG genes, 587 were not represented in
the interaction network. From this point, all references to KEGG
pathways will be referring to the pathway set described here.
Random PathwaysTo assess the false positive rate of the different randomization
methods, we created random pathways that resemble the original
KEGG pathways in both the number of genes as well as the degree
distribution. For each original pathway we generated 100 random
pathway instances. To preserve the degree distribution of the
original pathway, each gene was replaced with a gene from the
network that had similar connectivity; i.e. the node degree had to
fall into the same log connectivity-bin. Swapping of genes was
further restricted by two conditions: the new gene could not be in
the original pathway and no duplicate genes were allowed in a
pathway. Thus, each random pathway instance contained the
same number of genes randomly drawn from the full set of
network nodes while approximately preserving its original degree
distribution.
Pathway AnalysisWe performed a large scale screen between gene signatures
from MsigDB [24] and KEGG pathways. In total we considered
2392 gene signatures from the category C2: chemical and genetic
perturbations. The KEGG pathway set was comprised of 236
metabolic, signaling, and disease pathways from KEGG. Signif-
icance of signature-pathway associations was assessed by Cross-
TalkZ using the FunCoup network as well as gene enrichment
analysis.
GEA was performed by calculating the probability of the
overlap between gene signatures from MsigDB and KEGG
pathways using the hypergeometric probability distribution:
P(X = k) = C(m, k) * C(N2m, n2k)/C(N, n). Where C(x) is the
binomial coefficient, N is the total number of unique genes found
both in MsigDB and KEGG, m is the KEGG pathway size, n is the
gene signature size, and k is the number of successes i.e. the
number signature genes that are part of a respective KEGG
pathway. All p-values were adjusted for multiple testing using the
false discovery rate (FDR) with the procedure of Benjamini and
Hochberg [29].
A pathway-signature association was considered significant if it
had an FDR ,0.05 and in the case of crosstalk analysis also had a
reduced chi-squared ,1 and a z-score .0.
ImplementationAll four methods have been implemented in a single package
called CrossTalkZ. The package was written in C++ and used the
Libxml2 (xmlsoft.org) and Boost graph libraries (boost.org).
CrossTalkZ requires two files as input: a network file and one or
two group file(s). If one group file is given, statistics for all pairwise
permutations of groups are calculated. If two group files are given,
statistics for the first set of groups versus the second set of groups
are calculated. For more details see Text S2.
When counting links between groups in either the random or
the original network, the question of how to treat links between
groups that have common genes must be addressed. Therefore,
two different link counting modes are implemented in CrossTalkZ.
For inter-crosstalk, the default link counting mode does not tally a
link that has either of its nodes in both of the groups. The alternate
Gene Group Crosstalk
PLOS ONE | www.plosone.org 10 January 2013 | Volume 8 | Issue 1 | e54945

mode is to not tally a link that has both of its nodes in both groups.
Intra-crosstalk links are always tallied.
Supporting Information
Table S1 Significant KEGG pathway associations to a389 gene signature up-regulated in bladder cancer.(PDF)
Text S1 Pseudocode for randomization algorithm.(PDF)
Text S2 Implementation Details.
(PDF)
Author Contributions
Conceived and designed the experiments: TM OF AA ES. Performed the
experiments: TM OF. Analyzed the data: TM OF AA ES. Contributed
reagents/materials/analysis tools: TM OF AA ES. Wrote the paper: TM
OF AA ES.
References
1. Deng M, Sun F, Chen T (2003) Assessment of the reliability of protein-proteininteractions and protein function prediction. Pacific Symposium on Biocomput-
ing Pacific Symposium on Biocomputing: 140–151.
2. Song J, Singh M (2009) How and when should interactome-derived clusters beused to predict functional modules and protein function? Bioinformatics
(Oxford, England) 25: 3143–3150.3. Ostlund G, Lindskog M, Sonnhammer ELL (2010) Network-based Identification
of novel cancer genes. Molecular & cellular proteomics?: MCP 9: 648–655.
4. Hong M-G, Alexeyenko A, Lambert J-C, Amouyel P, Prince JA (2010) Genome-wide pathway analysis implicates intracellular transmembrane protein transport
in Alzheimer disease. Journal of human genetics 55: 707–709.5. Storey JD, Tibshirani R (2003) Statistical significance for genomewide studies.
Proc Natl Acad Sci USA 100: 9440–9445.6. Ioannidis JPA (2005) Why most published research findings are false. PLoS
medicine 2: e124.
7. Milenkovic T, Filippis I, Lappe M, Przulj N (2009) Optimized null model forprotein structure networks. PloS One 4: e5967.
8. Erdos P, Renyi A (1959) On random graphs, I. Publicationes Mathematicae(Debrecen) 6: 290–297.
9. Penrose M (2003) Random Geometric Graphs (Oxford Studies in Probability).
{Oxford University Press, USA}.10. Barabasi A, Albert R (1999) Emergence of scaling in random networks. Science
(New York, NY) 286: 509–512.11. Alexeyenko A, Wassenberg DM, Lobenhofer EK, Yen J, Linney E, et al. (2010)
Dynamic zebrafish interactome reveals transcriptional mechanisms of dioxintoxicity. PloS One 5: e10465.
12. Li Y, Agarwal P, Rajagopalan D (2008) A global pathway crosstalk network.
Bioinformatics (Oxford, England) 24: 1442–1447.13. Huttenhower C, Haley EM, Hibbs MA, Dumeaux V, Barrett DR, et al. (2009)
Exploring the human genome with functional maps. Genome research 19:1093–1106.
14. Maslov S, Sneppen K (2002) Specificity and stability in topology of protein
networks. Science (New York, NY) 296: 910–913.15. Milo R, Kashtan N, Itzkovitz S, Newman M, Alon U (2004) On the uniform
generation of random graphs with prescribed degree sequences. arXiv:cond-mat/0312028v2.
16. Milo R, Shen-Orr S, Itzkovitz S, Kashtan N, Chklovskii D, et al. (2002) Networkmotifs: simple building blocks of complex networks. Science (New York, NY)
298: 824–827.
17. Kuchaiev O, Rasajski M, Higham DJ, Przulj N (2009) Geometric de-noising ofprotein-protein interaction networks. PLoS computational biology 5: e1000454.
18. Alexeyenko A, Sonnhammer ELL (2009) Global networks of functional couplingin eukaryotes from comprehensive data integration. Genome research 19: 1107–
1116.
19. Reynolds CA, Hong M-G, Eriksson UK, Blennow K, Wiklund F, et al. (2010)Analysis of lipid pathway genes indicates association of sequence variation near
SREBF1/TOM1L2/ATPAF2 with dementia risk. Human molecular genetics19: 2068–2078.
20. Newman MEJ (2002) Assortative mixing in networks. Physical review letters 89:
208701.21. Li L, Alderson D, Tanaka R, Doyle J, Willinger W (2005) Towards a Theory of
Scale-Free Graphs: Definition, Properties, and Implications (Extended Version).22. Annibale A, Coolen A, Fernandes L, Fraternali F, Kleinjung J (2009) Tailored
graph ensembles as proxies or null models for real networks I: tools for
quantifying structure. Journal of physics A: Mathematical and general 42.23. Khatri P, Sirota M, Butte AJ (2012) Ten Years of Pathway Analysis: Current
Approaches and Outstanding Challenges. PLoS Comput Biol 8: e1002375.24. Subramanian A, Tamayo P, Mootha VK, Mukherjee S, Ebert BL, et al. (2005)
Gene set enrichment analysis: a knowledge-based approach for interpretinggenome-wide expression profiles. Proc Natl Acad Sci USA 102: 15545–15550.
25. Abatangelo L, Maglietta R, Distaso A, D’Addabbo A, Creanza TM, et al. (2009)
Comparative study of gene set enrichment methods. BMC bioinformatics 10:275.
26. Ashburner M, Ball CA, Blake JA, Botstein D, Butler H, et al. (2000) Geneontology: tool for the unification of biology. The Gene Ontology Consortium.
Nature genetics 25: 25–29.
27. Kanehisa M, Goto S (2000) KEGG: kyoto encyclopedia of genes and genomes.Nucleic acids research 28: 27–30.
28. Newman M (2003) The structure and function of complex networks.arXiv:cond-mat/0303516v1.
29. Benjamini Y, Hochberg Y (1995) Controlling the False Discovery Rate: APractical and Powerful Approach to Multiple Testing. Journal of the Royal
Statistical Society 57: 289–300.
30. Taylor JR (1997) An introduction to error analysis: the study of uncertainties inphysical measurements. University Science Books. p.
31. Szklarczyk D, Franceschini A, Kuhn M, Simonovic M, Roth A, et al. (2011) TheSTRING database in 2011: functional interaction networks of proteins, globally
integrated and scored. Nucleic acids research 39: D561–8.
32. Huang DW, Sherman BT, Lempicki RA (2009) Bioinformatics enrichmenttools: paths toward the comprehensive functional analysis of large gene lists.
Nucleic acids research 37: 1–13.33. Setlur SR, Mertz KD, Hoshida Y, Demichelis F, Lupien M, et al. (2008)
Estrogen-dependent signaling in a molecularly distinct subclass of aggressiveprostate cancer. Journal of the National Cancer Institute 100: 815–825.
34. Moustakas A, Pardali K, Gaal A, Heldin C-H (2002) Mechanisms of TGF-bsignaling in regulation of cell growth and differentiation. Immunol Lett 82: 85–91.
35. Leong KG, Gao W-Q (2008) The Notch pathway in prostate development andcancer. Differentiation; research in biological diversity 76: 699–716.
36. Lindgren D, Liedberg F, Andersson A, Chebil G, Gudjonsson S, et al. (2006)
Molecular characterization of early-stage bladder carcinomas by expressionprofiles, FGFR3 mutation status, and loss of 9q. Oncogene 25: 2685–2696.
Gene Group Crosstalk
PLOS ONE | www.plosone.org 11 January 2013 | Volume 8 | Issue 1 | e54945