statistical estimation, confidence intervals. - u- · pdf filestatistical estimation,...
TRANSCRIPT
BiostatisticsStatistical estimation, confidence
intervals.
Krisztina Boda PhD
Department of Medical Physics and
Informatics, University of Szeged
Krisztina Boda
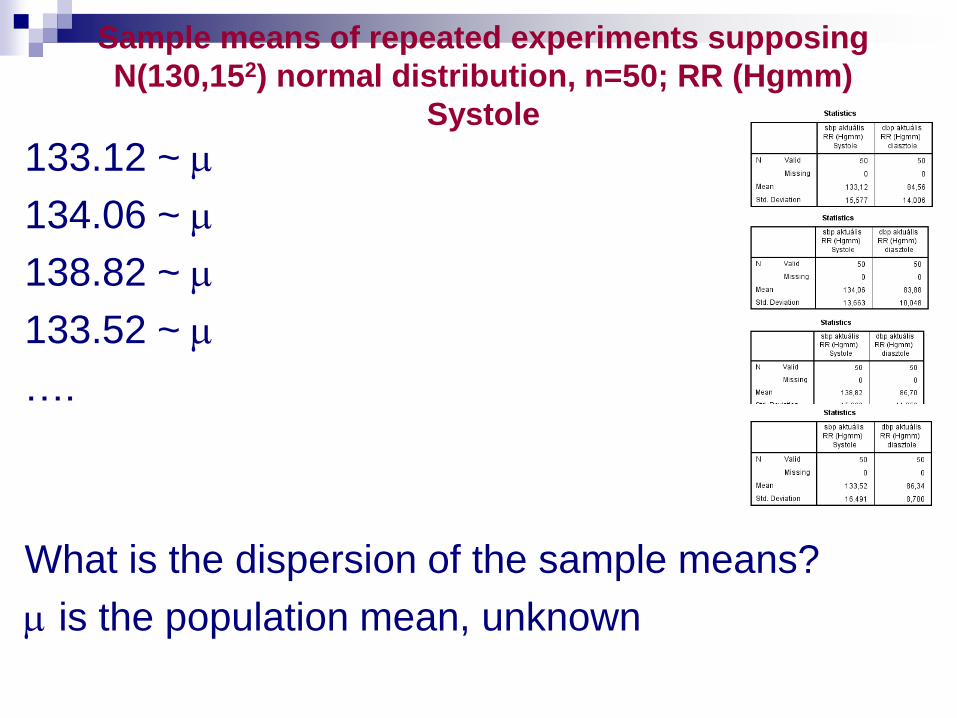
Sample means of repeated experiments supposing
N(130,152) normal distribution, n=50; RR (Hgmm)
Systole
133.12 ~
134.06 ~
138.82 ~
133.52 ~
….
What is the dispersion of the sample means?
is the population mean, unknown
Krisztina Boda 3
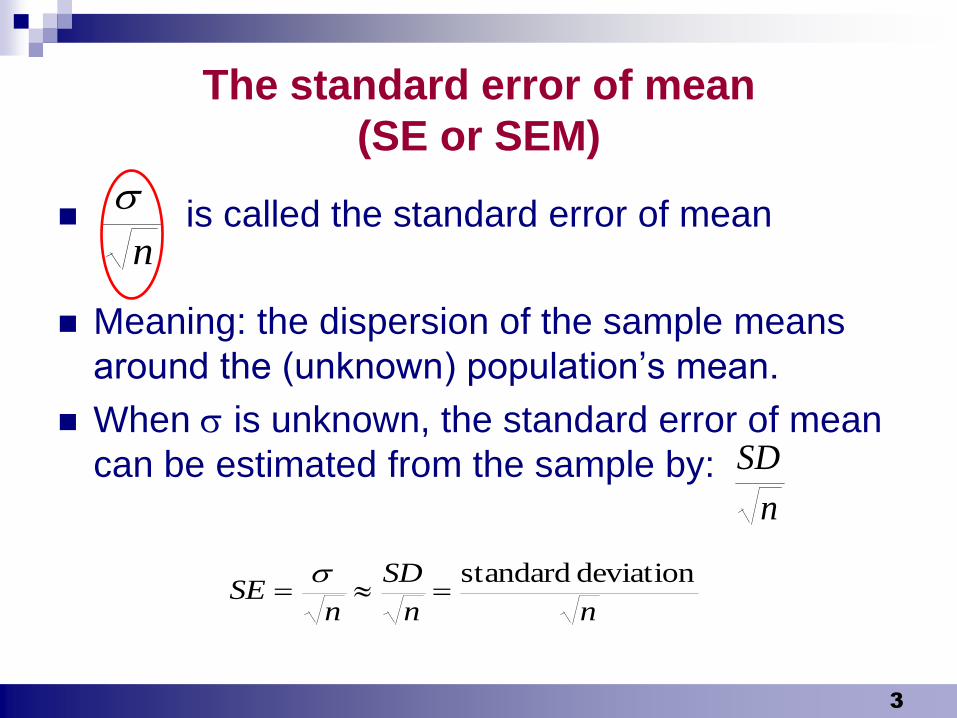
The standard error of mean
(SE or SEM)
is called the standard error of mean
Meaning: the dispersion of the sample means
around the (unknown) population’s mean.
When is unknown, the standard error of mean
can be estimated from the sample by:
n
n
SD
nn
SD
nSE
deviation standard
Krisztina Boda 4
Statistical estimation
Krisztina Boda 5
Statistical estimation
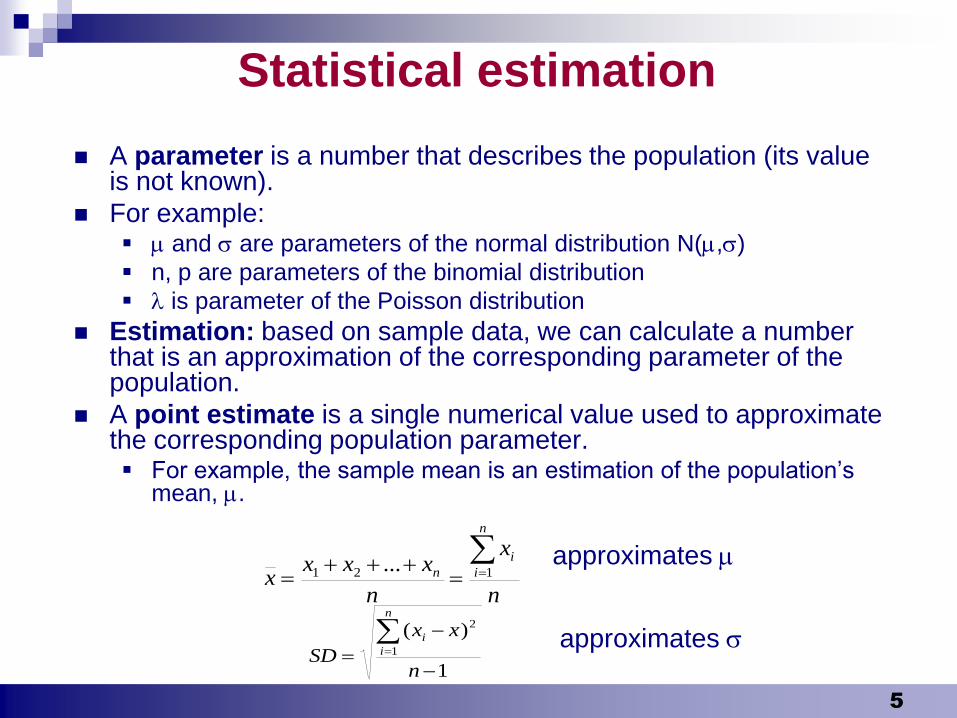
A parameter is a number that describes the population (its value is not known).
For example: and are parameters of the normal distribution N(,)
n, p are parameters of the binomial distribution
is parameter of the Poisson distribution
Estimation: based on sample data, we can calculate a number that is an approximation of the corresponding parameter of the population.
A point estimate is a single numerical value used to approximate the corresponding population parameter. For example, the sample mean is an estimation of the population’s
mean, .
approximates
approximates
n
x
n
xxxx
n
i
i
n
121 ...
1
)(1
2
n
xx
SD
n
i
i
Krisztina Boda 6
Interval estimate, confidence interval
Interval estimate: a range of values that we think includes the true value of the population parameter (with a given level of certainty) .
Confidence interval: an interval –calculated from the sample data - which contains the value of the (unknown) population parameter with „high”probability.
The higher the probability assigned, the more confident we are that the interval does, in fact, include the true value.
The „high” probability assigned is called the confidence level (generally: 0.90, 0.95, 0.99 )
Krisztina Boda 7
Interval estimate, confidence interval
(cont.) „high” probability:
the probability assigned is the confidence level(generally: 0.90, 0.95, 0.99 ).
„small” probability: the „error” of the estimation (denoted by )according to the confidence level is
1-0.90=0.1, 1-0.95=0.05, 1-0.99=0.01
The most often used confidence level is
95% (0.95),
so the most often used value for is
=0.05
Krisztina Boda 8
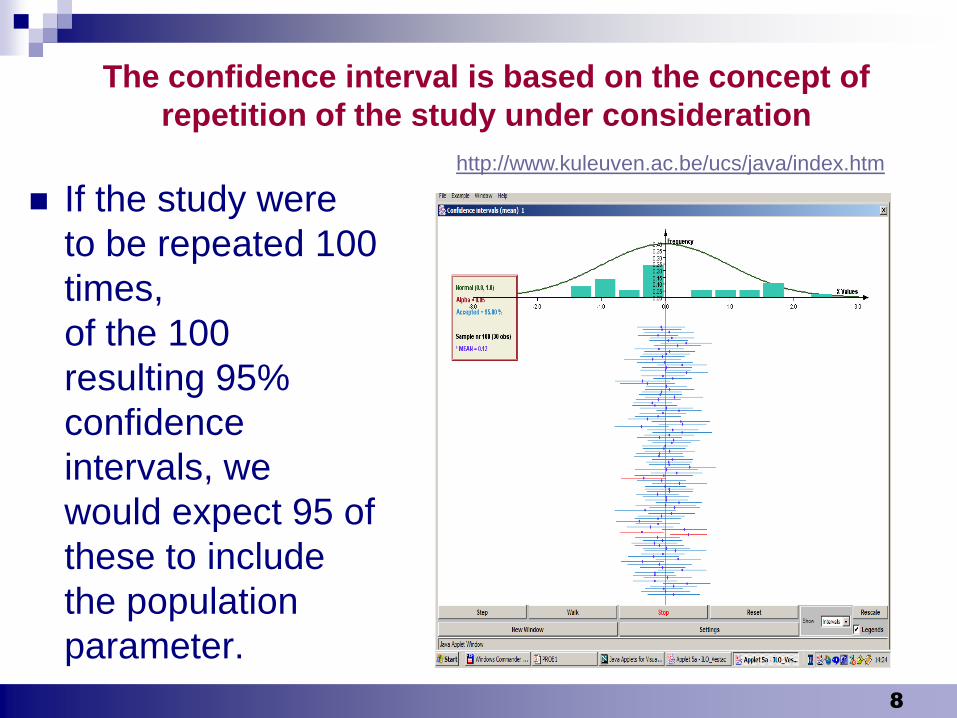
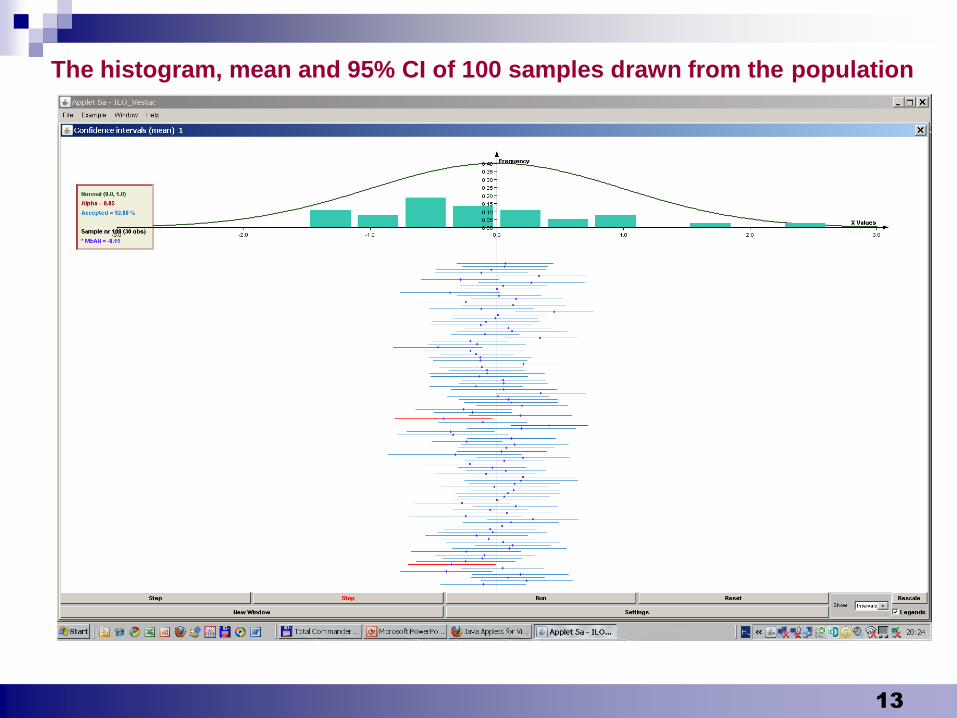
The confidence interval is based on the concept of
repetition of the study under consideration
If the study were
to be repeated 100
times,
of the 100
resulting 95%
confidence
intervals, we
would expect 95 of
these to include
the population
parameter.
http://www.kuleuven.ac.be/ucs/java/index.htm
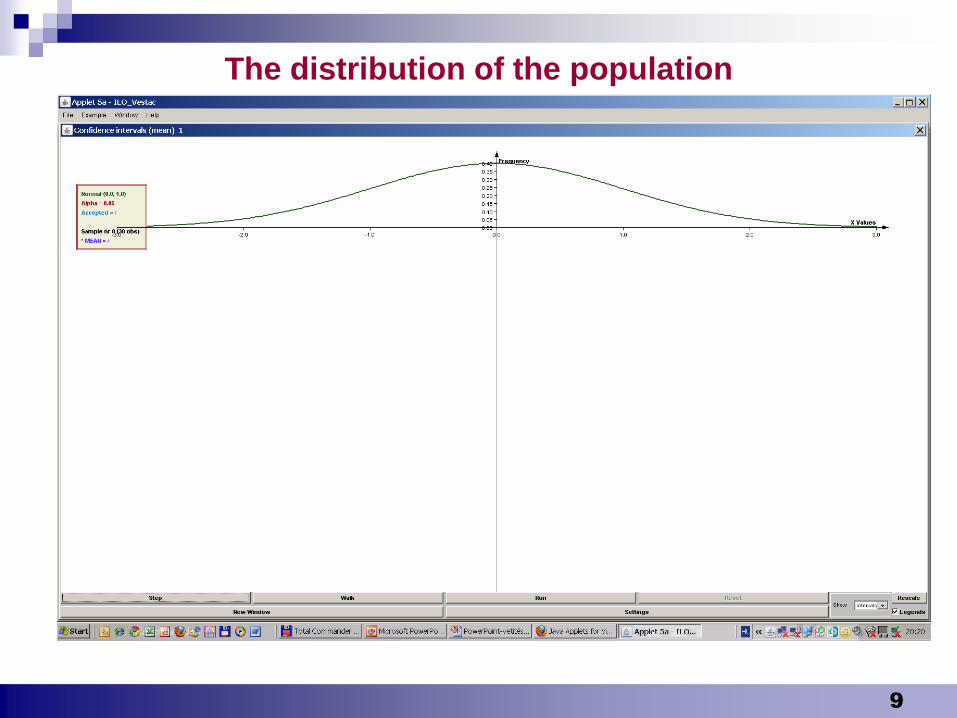
Krisztina Boda 9
The distribution of the population
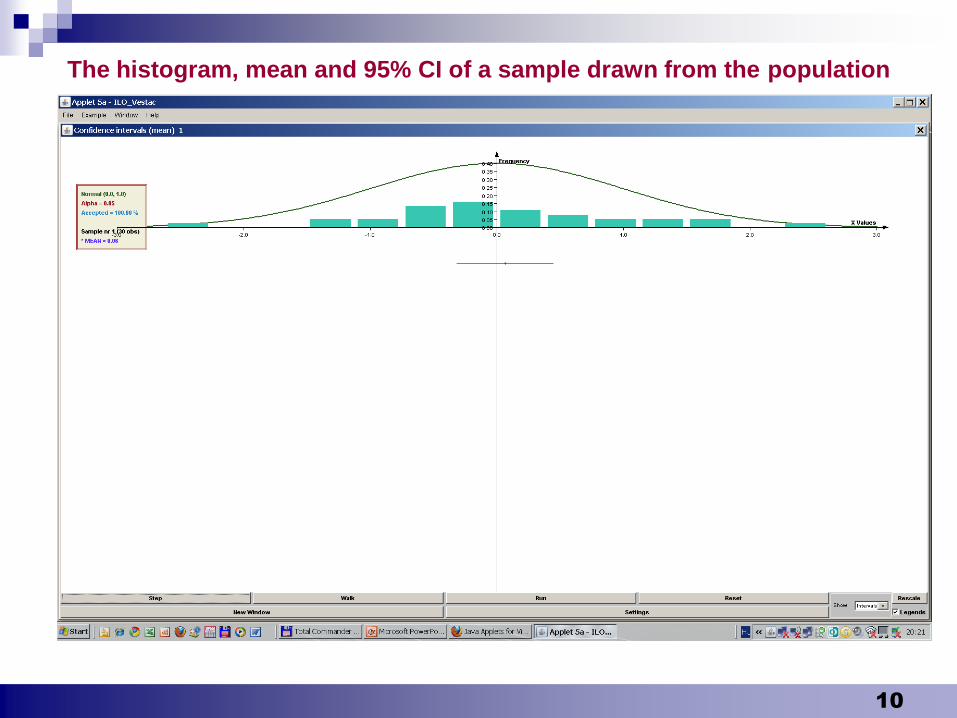
Krisztina Boda 10
The histogram, mean and 95% CI of a sample drawn from the population
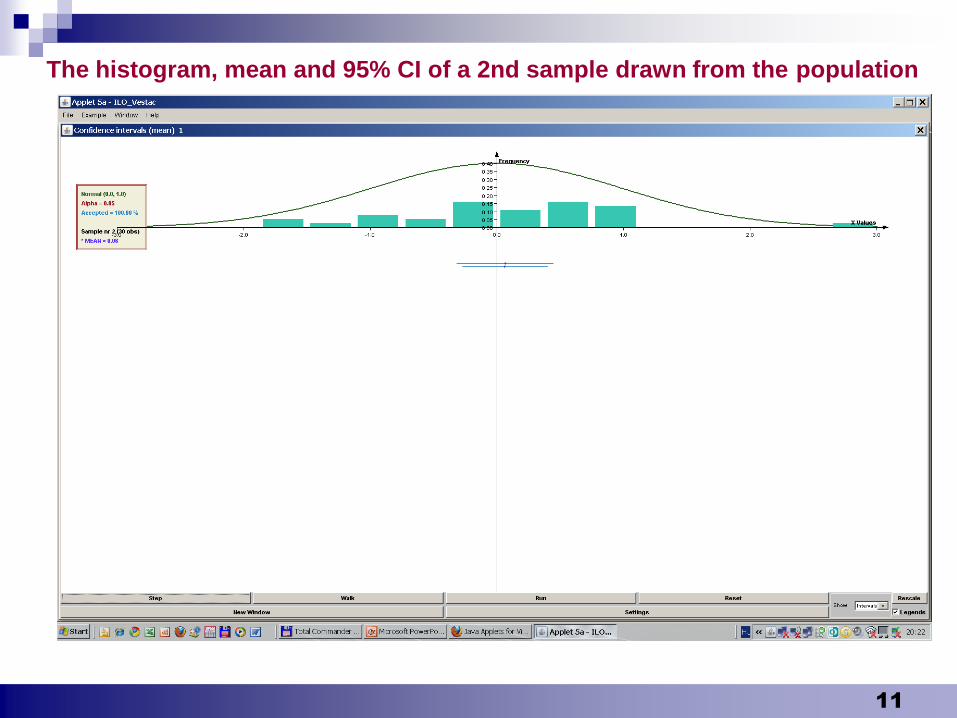
Krisztina Boda 11
The histogram, mean and 95% CI of a 2nd sample drawn from the population
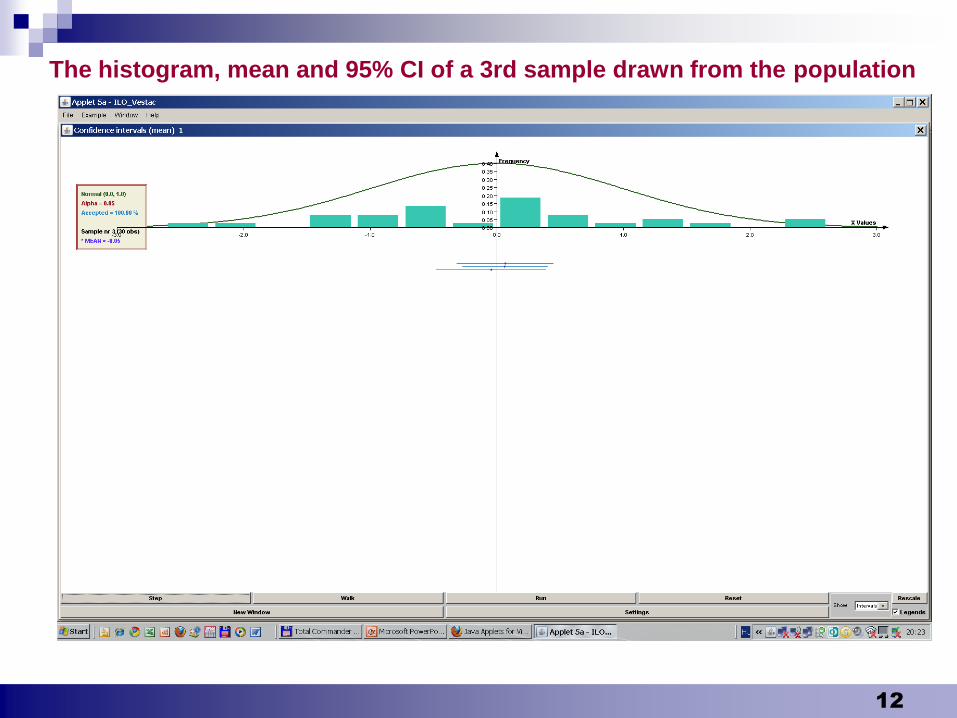
Krisztina Boda 12
The histogram, mean and 95% CI of a 3rd sample drawn from the population
Krisztina Boda 13
The histogram, mean and 95% CI of 100 samples drawn from the population
Krisztina Boda 14
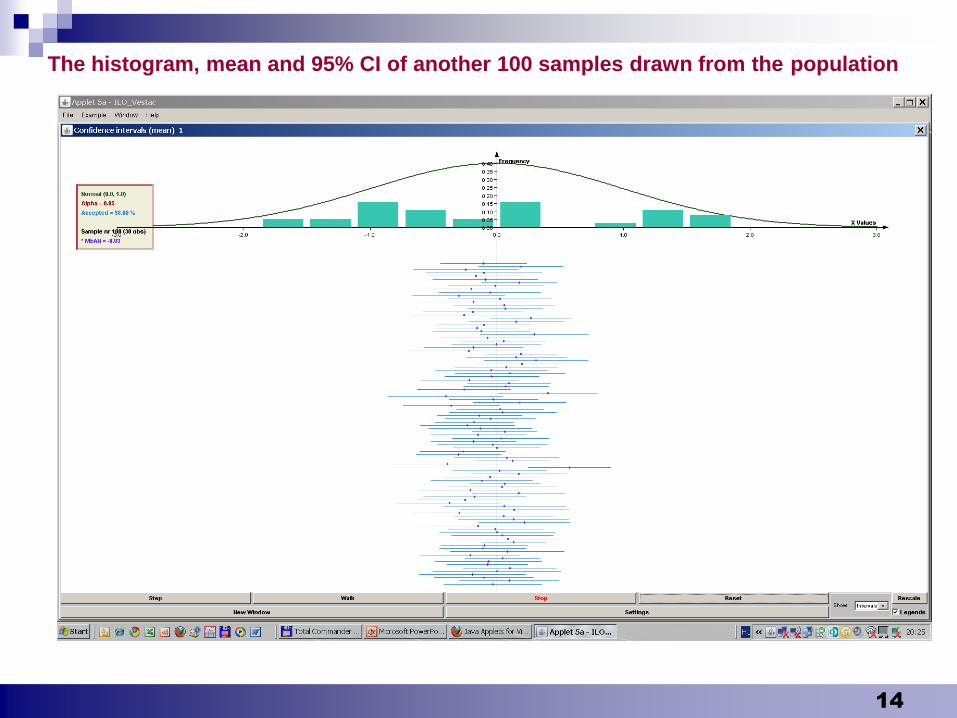
The histogram, mean and 95% CI of another 100 samples drawn from the population
Krisztina Boda 15
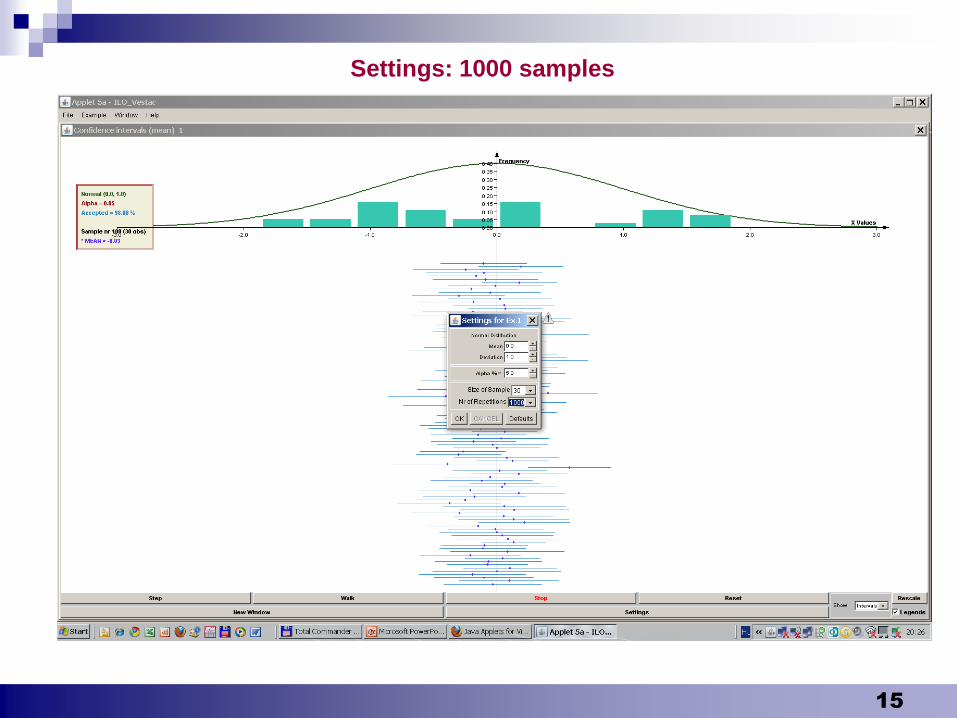
Settings: 1000 samples
Krisztina Boda 16
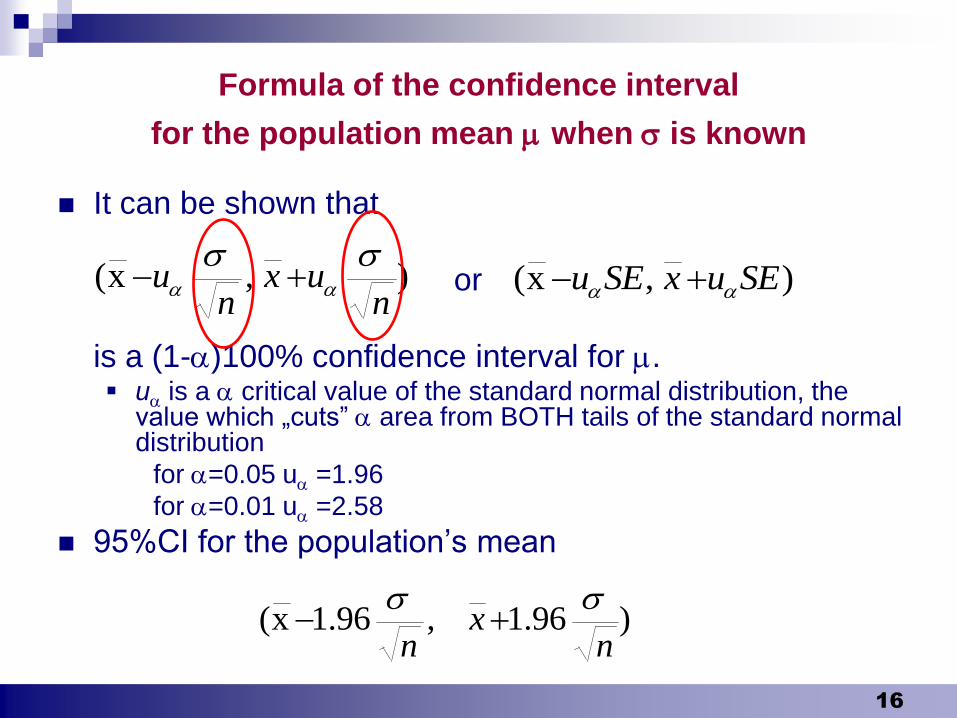
Formula of the confidence interval
for the population mean when is known
It can be shown that
or
is a (1-)100% confidence interval for . u is a critical value of the standard normal distribution, the
value which „cuts” area from BOTH tails of the standard normal distribution
for =0.05 u =1.96
for =0.01 u =2.58
95%CI for the population’s mean
),x(n
uxn
u
)96.1,96.1x(n
xn
),x( SEuxSEu
Krisztina Boda 17
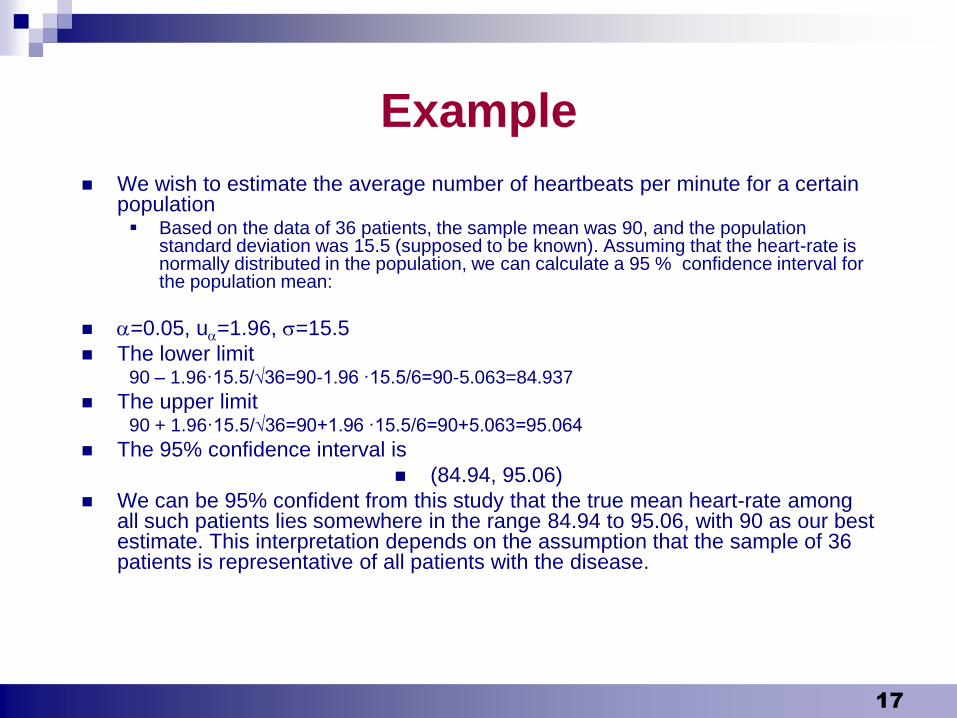
Example
We wish to estimate the average number of heartbeats per minute for a certain population Based on the data of 36 patients, the sample mean was 90, and the population
standard deviation was 15.5 (supposed to be known). Assuming that the heart-rate is normally distributed in the population, we can calculate a 95 % confidence interval for the population mean:
=0.05, u=1.96, =15.5
The lower limit90 – 1.96·15.5/√36=90-1.96 ·15.5/6=90-5.063=84.937
The upper limit90 + 1.96·15.5/√36=90+1.96 ·15.5/6=90+5.063=95.064
The 95% confidence interval is
(84.94, 95.06)
We can be 95% confident from this study that the true mean heart-rate among all such patients lies somewhere in the range 84.94 to 95.06, with 90 as our best estimate. This interpretation depends on the assumption that the sample of 36 patients is representative of all patients with the disease.
Krisztina Boda
How to know (The population
stadard deviation)?
The population standard deviation () is
generally not known. Sometimes we get its
value from studies with very high sample
size.
What to do when is not known? How to
calculate a confidence interval? (next
slide)
18
Krisztina Boda 19
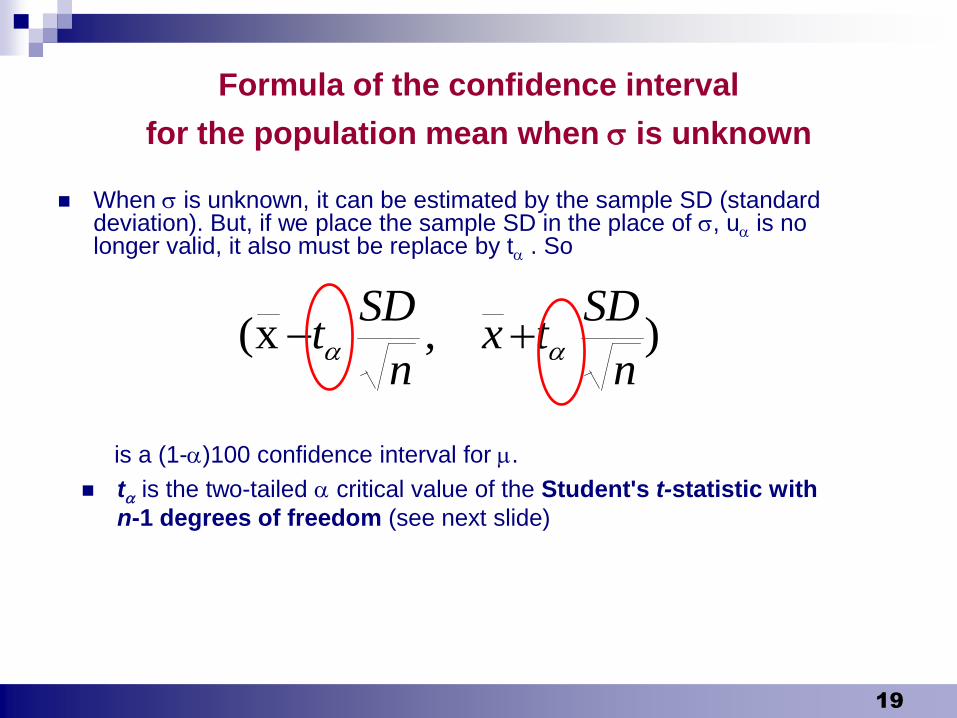
Formula of the confidence interval
for the population mean when is unknown
When is unknown, it can be estimated by the sample SD (standard deviation). But, if we place the sample SD in the place of , u is no longer valid, it also must be replace by t . So
is a (1-)100 confidence interval for .
t is the two-tailed critical value of the Student's t-statistic with
n-1 degrees of freedom (see next slide)
),x(n
SDtx
n
SDt
Krisztina Boda 20
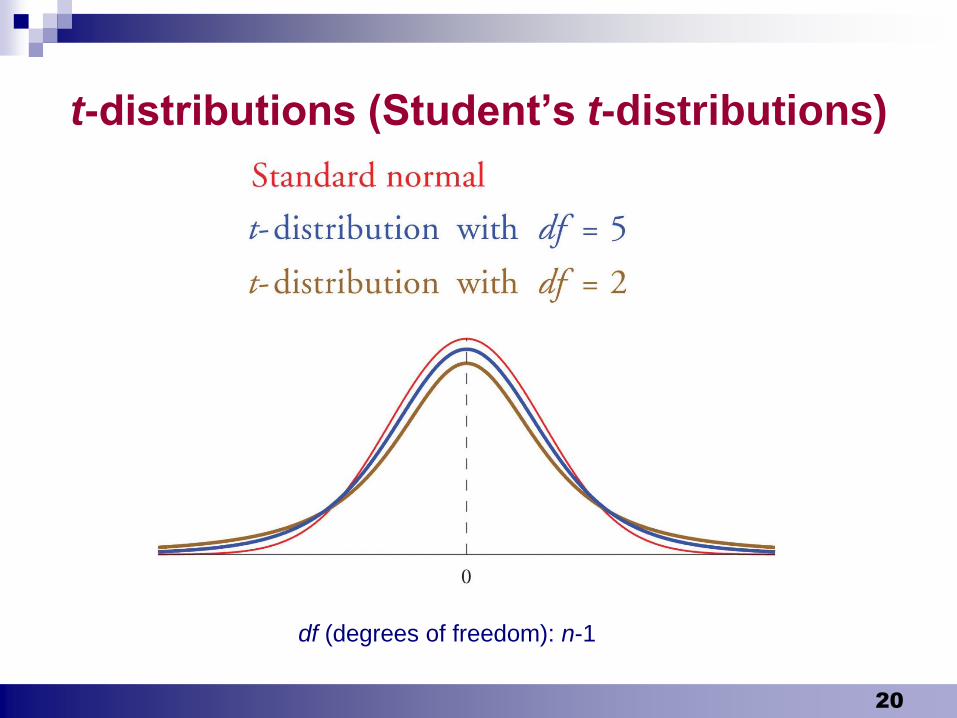
t-distributions (Student’s t-distributions)
df (degrees of freedom): n-1

Krisztina Boda 21
Memorial tablet in Dublin
William Sealy Gosset, was an English statistician. He published under the pen
name Student, and developed the Student's t-distribution.Born June 13, 1876, Died October 16, 1937 (aged 61)
Krisztina Boda 22
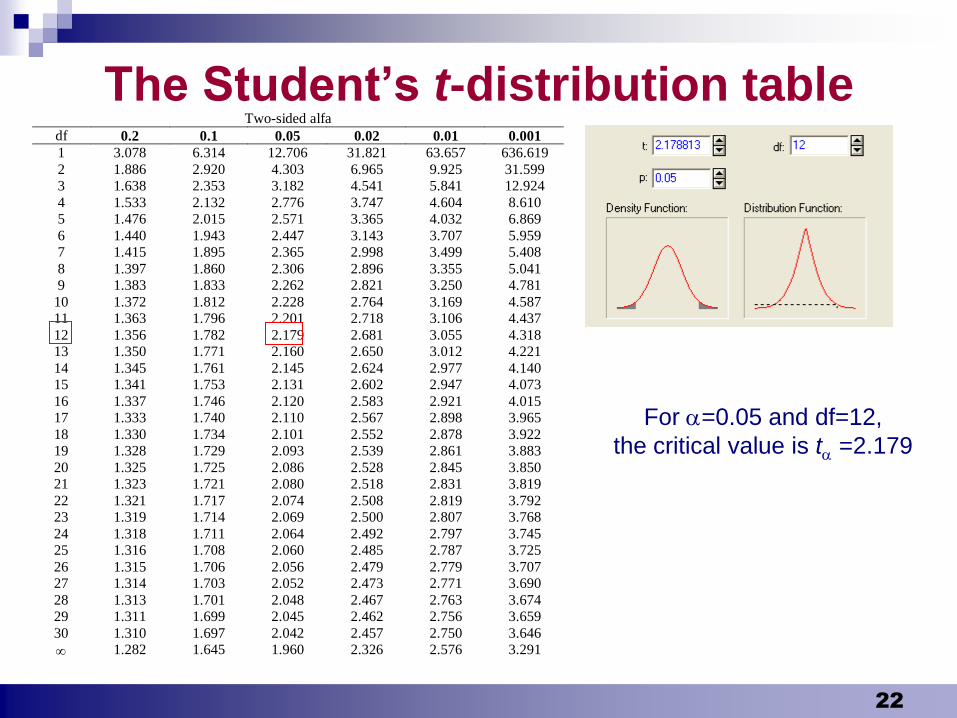
Two-sided alfa
df 0.2 0.1 0.05 0.02 0.01 0.001
1 3.078 6.314 12.706 31.821 63.657 636.619
2 1.886 2.920 4.303 6.965 9.925 31.599
3 1.638 2.353 3.182 4.541 5.841 12.924
4 1.533 2.132 2.776 3.747 4.604 8.610
5 1.476 2.015 2.571 3.365 4.032 6.869
6 1.440 1.943 2.447 3.143 3.707 5.959
7 1.415 1.895 2.365 2.998 3.499 5.408
8 1.397 1.860 2.306 2.896 3.355 5.041
9 1.383 1.833 2.262 2.821 3.250 4.781
10 1.372 1.812 2.228 2.764 3.169 4.587
11 1.363 1.796 2.201 2.718 3.106 4.437
12 1.356 1.782 2.179 2.681 3.055 4.318
13 1.350 1.771 2.160 2.650 3.012 4.221
14 1.345 1.761 2.145 2.624 2.977 4.140
15 1.341 1.753 2.131 2.602 2.947 4.073
16 1.337 1.746 2.120 2.583 2.921 4.015
17 1.333 1.740 2.110 2.567 2.898 3.965
18 1.330 1.734 2.101 2.552 2.878 3.922
19 1.328 1.729 2.093 2.539 2.861 3.883
20 1.325 1.725 2.086 2.528 2.845 3.850
21 1.323 1.721 2.080 2.518 2.831 3.819
22 1.321 1.717 2.074 2.508 2.819 3.792
23 1.319 1.714 2.069 2.500 2.807 3.768
24 1.318 1.711 2.064 2.492 2.797 3.745
25 1.316 1.708 2.060 2.485 2.787 3.725
26 1.315 1.706 2.056 2.479 2.779 3.707
27 1.314 1.703 2.052 2.473 2.771 3.690
28 1.313 1.701 2.048 2.467 2.763 3.674
29 1.311 1.699 2.045 2.462 2.756 3.659
30 1.310 1.697 2.042 2.457 2.750 3.646
1.282 1.645 1.960 2.326 2.576 3.291
The Student’s t-distribution table
For =0.05 and df=12,
the critical value is t =2.179
Krisztina Boda 23
Student’s t-distribution
table
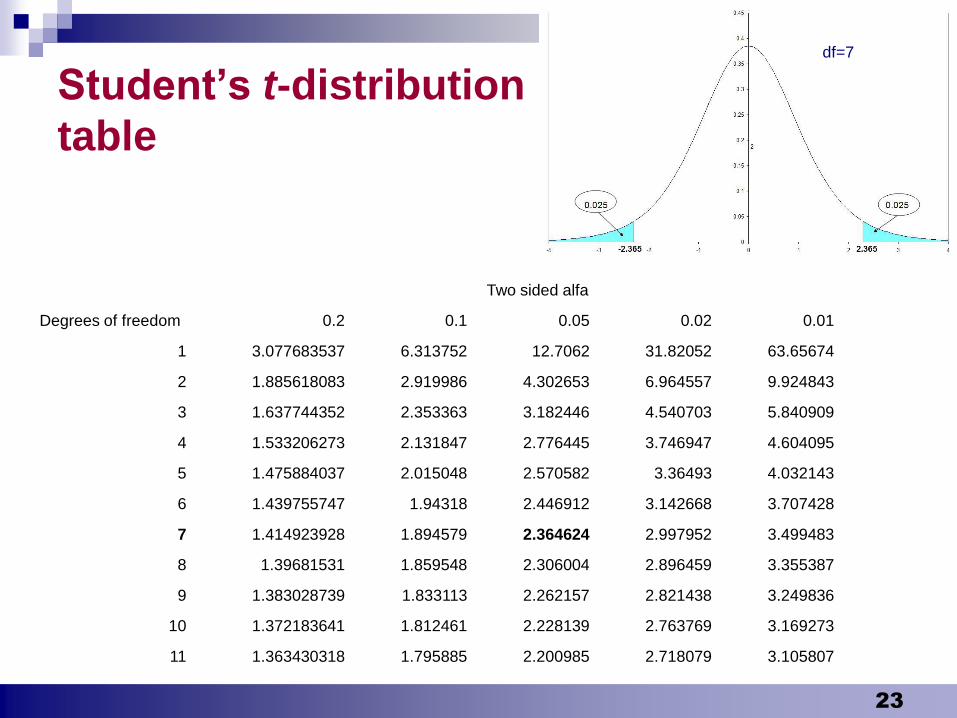
Two sided alfa
Degrees of freedom 0.2 0.1 0.05 0.02 0.01
1 3.077683537 6.313752 12.7062 31.82052 63.65674
2 1.885618083 2.919986 4.302653 6.964557 9.924843
3 1.637744352 2.353363 3.182446 4.540703 5.840909
4 1.533206273 2.131847 2.776445 3.746947 4.604095
5 1.475884037 2.015048 2.570582 3.36493 4.032143
6 1.439755747 1.94318 2.446912 3.142668 3.707428
7 1.414923928 1.894579 2.364624 2.997952 3.499483
8 1.39681531 1.859548 2.306004 2.896459 3.355387
9 1.383028739 1.833113 2.262157 2.821438 3.249836
10 1.372183641 1.812461 2.228139 2.763769 3.169273
11 1.363430318 1.795885 2.200985 2.718079 3.105807
df=7
Krisztina Boda 24
Student’s t-distribution
table
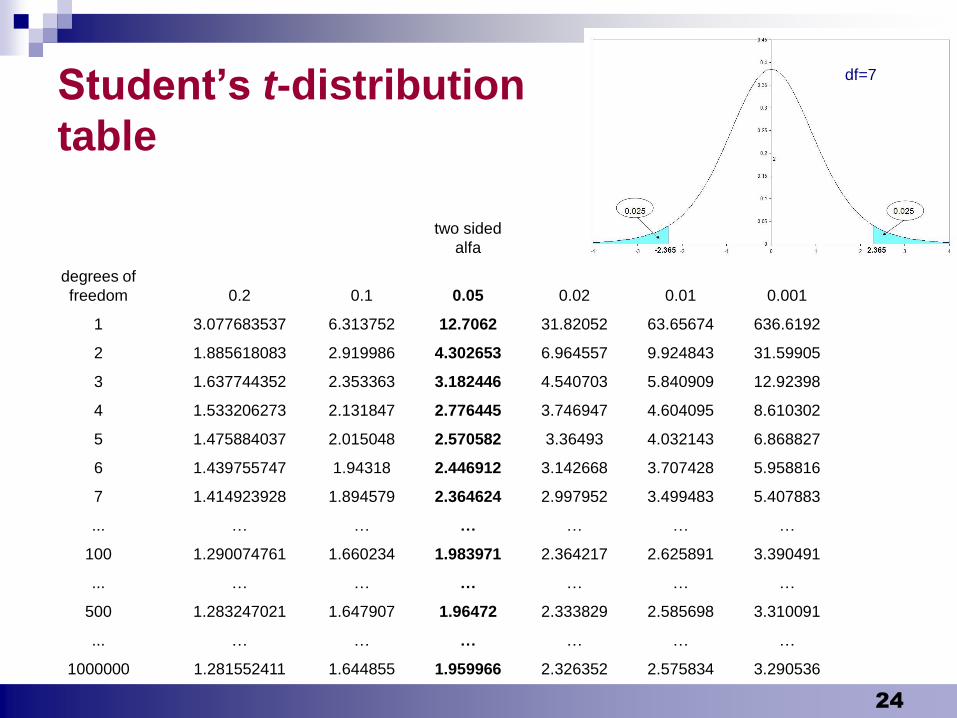
two sided
alfa
degrees of
freedom 0.2 0.1 0.05 0.02 0.01 0.001
1 3.077683537 6.313752 12.7062 31.82052 63.65674 636.6192
2 1.885618083 2.919986 4.302653 6.964557 9.924843 31.59905
3 1.637744352 2.353363 3.182446 4.540703 5.840909 12.92398
4 1.533206273 2.131847 2.776445 3.746947 4.604095 8.610302
5 1.475884037 2.015048 2.570582 3.36493 4.032143 6.868827
6 1.439755747 1.94318 2.446912 3.142668 3.707428 5.958816
7 1.414923928 1.894579 2.364624 2.997952 3.499483 5.407883
... … … … … … …
100 1.290074761 1.660234 1.983971 2.364217 2.625891 3.390491
... … … … … … …
500 1.283247021 1.647907 1.96472 2.333829 2.585698 3.310091
... … … … … … …
1000000 1.281552411 1.644855 1.959966 2.326352 2.575834 3.290536
df=7
Krisztina Boda 25
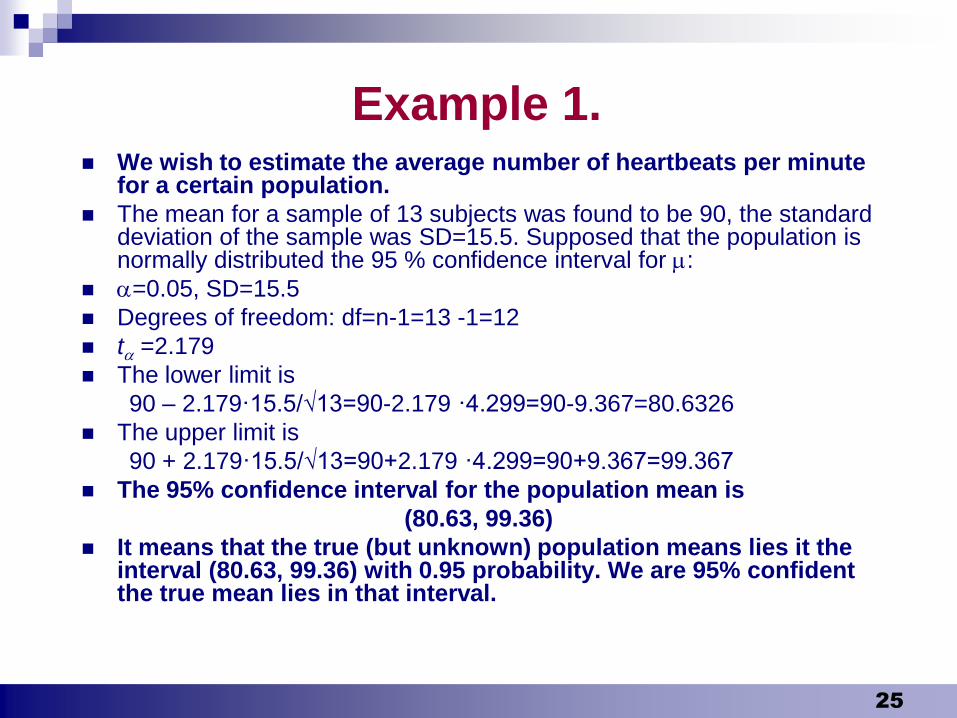
Example 1. We wish to estimate the average number of heartbeats per minute
for a certain population.
The mean for a sample of 13 subjects was found to be 90, the standard deviation of the sample was SD=15.5. Supposed that the population is normally distributed the 95 % confidence interval for :
=0.05, SD=15.5
Degrees of freedom: df=n-1=13 -1=12
t =2.179
The lower limit is
90 – 2.179·15.5/√13=90-2.179 ·4.299=90-9.367=80.6326
The upper limit is
90 + 2.179·15.5/√13=90+2.179 ·4.299=90+9.367=99.367
The 95% confidence interval for the population mean is
(80.63, 99.36)
It means that the true (but unknown) population means lies it the interval (80.63, 99.36) with 0.95 probability. We are 95% confident the true mean lies in that interval.
Krisztina Boda 26
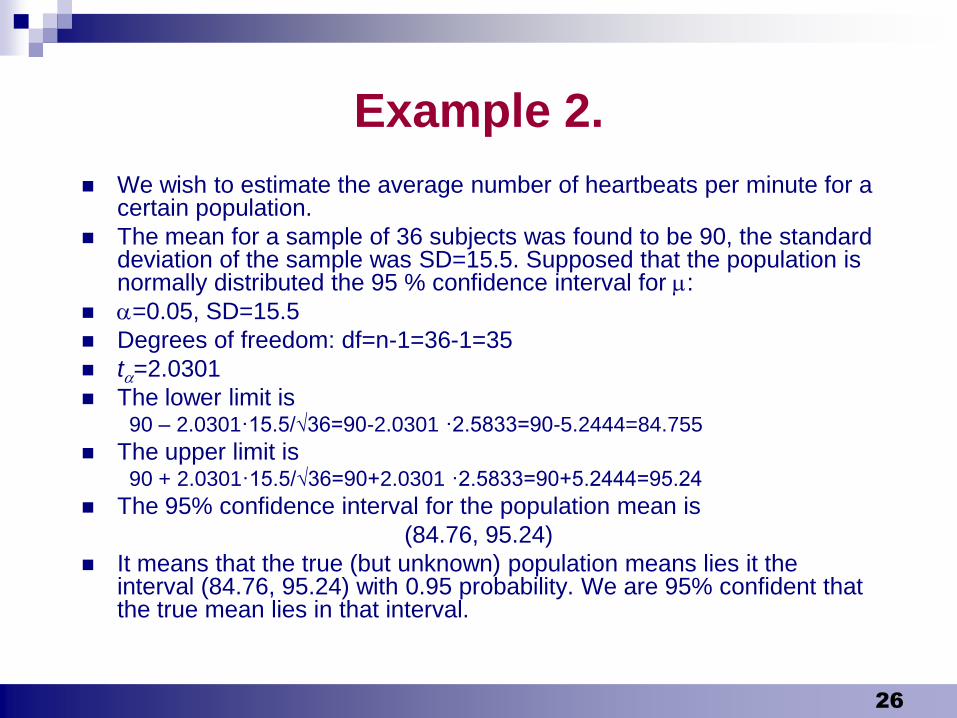
Example 2.
We wish to estimate the average number of heartbeats per minute for a certain population.
The mean for a sample of 36 subjects was found to be 90, the standard deviation of the sample was SD=15.5. Supposed that the population is normally distributed the 95 % confidence interval for :
=0.05, SD=15.5
Degrees of freedom: df=n-1=36-1=35
t=2.0301
The lower limit is 90 – 2.0301·15.5/√36=90-2.0301 ·2.5833=90-5.2444=84.755
The upper limit is 90 + 2.0301·15.5/√36=90+2.0301 ·2.5833=90+5.2444=95.24
The 95% confidence interval for the population mean is
(84.76, 95.24)
It means that the true (but unknown) population means lies it the interval (84.76, 95.24) with 0.95 probability. We are 95% confident that the true mean lies in that interval.
Krisztina Boda 27
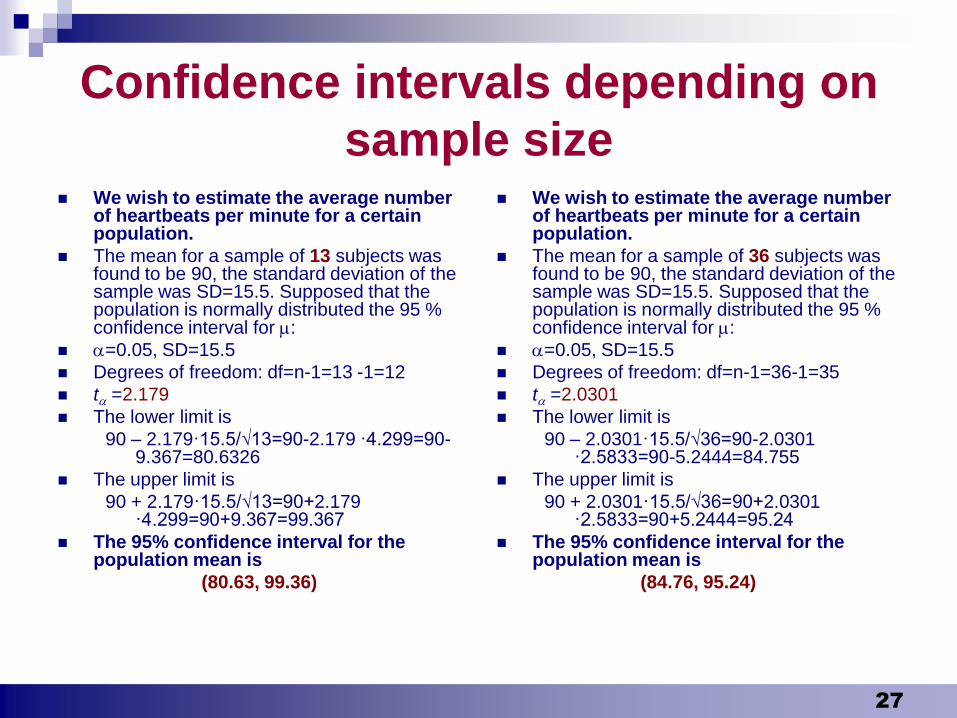
Confidence intervals depending on
sample size We wish to estimate the average number
of heartbeats per minute for a certain population.
The mean for a sample of 13 subjects was found to be 90, the standard deviation of the sample was SD=15.5. Supposed that the population is normally distributed the 95 % confidence interval for :
=0.05, SD=15.5
Degrees of freedom: df=n-1=13 -1=12
t =2.179
The lower limit is
90 – 2.179·15.5/√13=90-2.179 ·4.299=90-9.367=80.6326
The upper limit is
90 + 2.179·15.5/√13=90+2.179·4.299=90+9.367=99.367
The 95% confidence interval for the population mean is
(80.63, 99.36)
We wish to estimate the average number of heartbeats per minute for a certain population.
The mean for a sample of 36 subjects was found to be 90, the standard deviation of the sample was SD=15.5. Supposed that the population is normally distributed the 95 % confidence interval for :
=0.05, SD=15.5
Degrees of freedom: df=n-1=36-1=35
t =2.0301
The lower limit is
90 – 2.0301·15.5/√36=90-2.0301·2.5833=90-5.2444=84.755
The upper limit is
90 + 2.0301·15.5/√36=90+2.0301·2.5833=90+5.2444=95.24
The 95% confidence interval for the population mean is
(84.76, 95.24)
Krisztina Boda 28
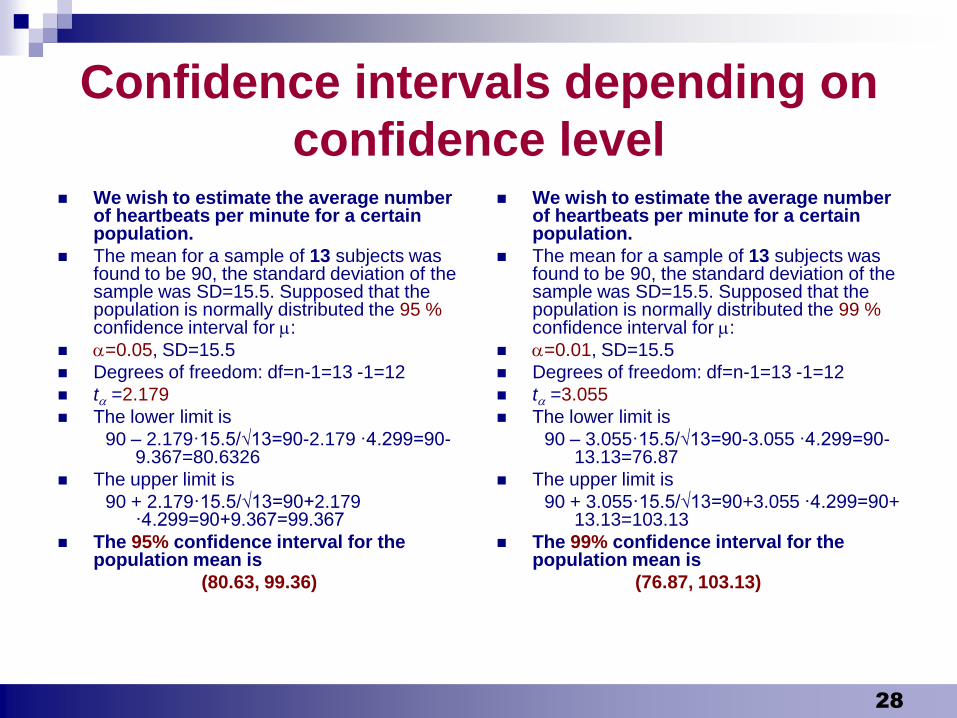
Confidence intervals depending on
confidence level We wish to estimate the average number
of heartbeats per minute for a certain population.
The mean for a sample of 13 subjects was found to be 90, the standard deviation of the sample was SD=15.5. Supposed that the population is normally distributed the 95 %confidence interval for :
=0.05, SD=15.5
Degrees of freedom: df=n-1=13 -1=12
t =2.179
The lower limit is
90 – 2.179·15.5/√13=90-2.179 ·4.299=90-9.367=80.6326
The upper limit is
90 + 2.179·15.5/√13=90+2.179·4.299=90+9.367=99.367
The 95% confidence interval for the population mean is
(80.63, 99.36)
We wish to estimate the average number of heartbeats per minute for a certain population.
The mean for a sample of 13 subjects was found to be 90, the standard deviation of the sample was SD=15.5. Supposed that the population is normally distributed the 99 % confidence interval for :
=0.01, SD=15.5
Degrees of freedom: df=n-1=13 -1=12
t =3.055
The lower limit is
90 – 3.055·15.5/√13=90-3.055 ·4.299=90-13.13=76.87
The upper limit is
90 + 3.055·15.5/√13=90+3.055 ·4.299=90+13.13=103.13
The 99% confidence interval for the population mean is
(76.87, 103.13)
Krisztina Boda 29
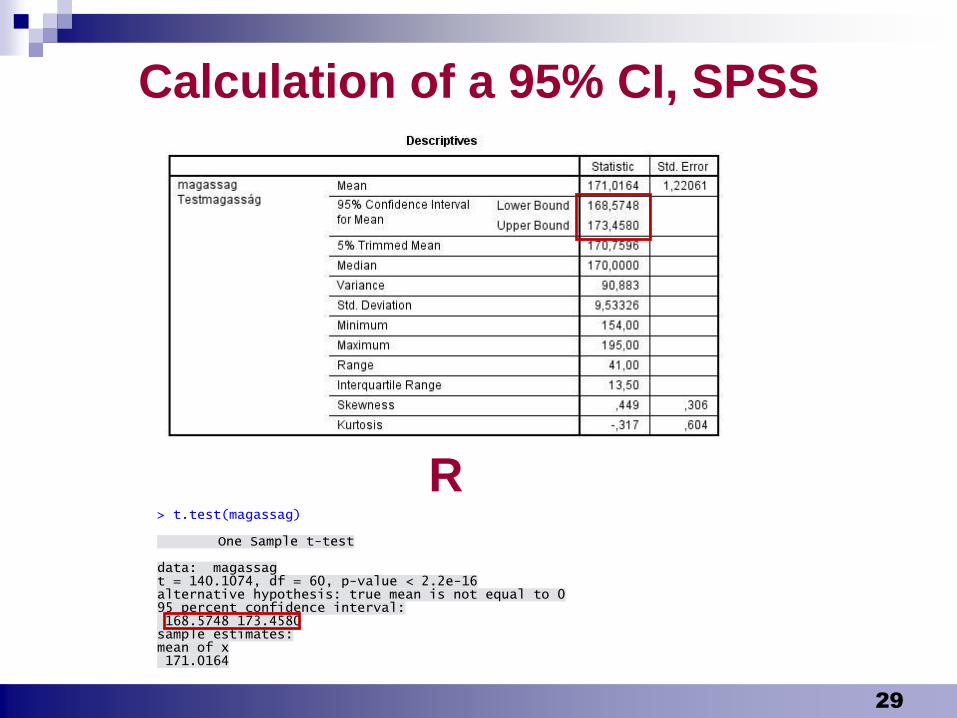
Calculation of a 95% CI, SPSS
> t.test(magassag) One Sample t-test data: magassag t = 140.1074, df = 60, p-value < 2.2e-16 alternative hypothesis: true mean is not equal to 0 95 percent confidence interval: 168.5748 173.4580 sample estimates: mean of x 171.0164
R
Krisztina Boda 30
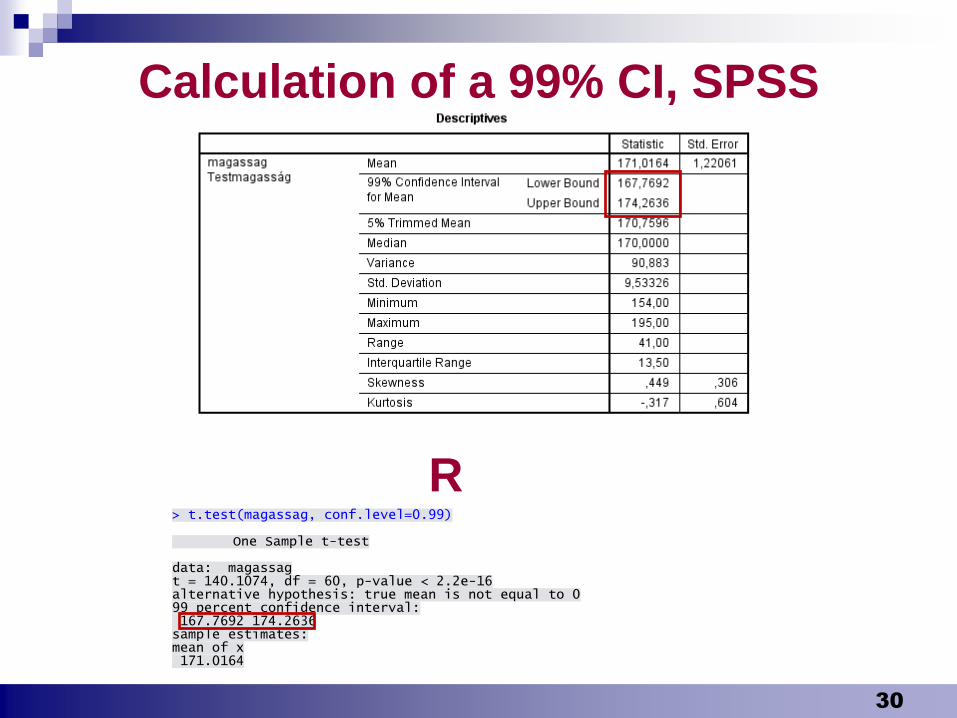
Calculation of a 99% CI, SPSS
R> t.test(magassag, conf.level=0.99) One Sample t-test data: magassag t = 140.1074, df = 60, p-value < 2.2e-16 alternative hypothesis: true mean is not equal to 0 99 percent confidence interval: 167.7692 174.2636 sample estimates: mean of x 171.0164
Krisztina Boda
Confidence intervals for other
population parameters
There are confidence intervals for other
population parameters and estimations,
(for example for proportions, for difference
of proportions, for standard deviations,
etc.). Formulas are not studied.
31
Krisztina Boda 32
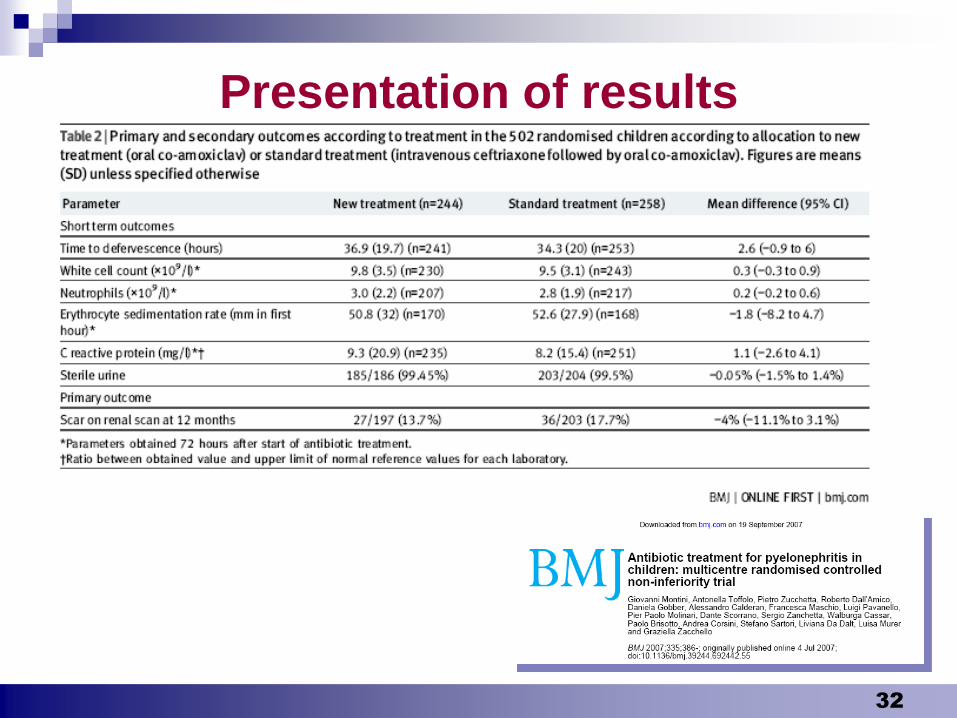
Presentation of results
Krisztina Boda 33
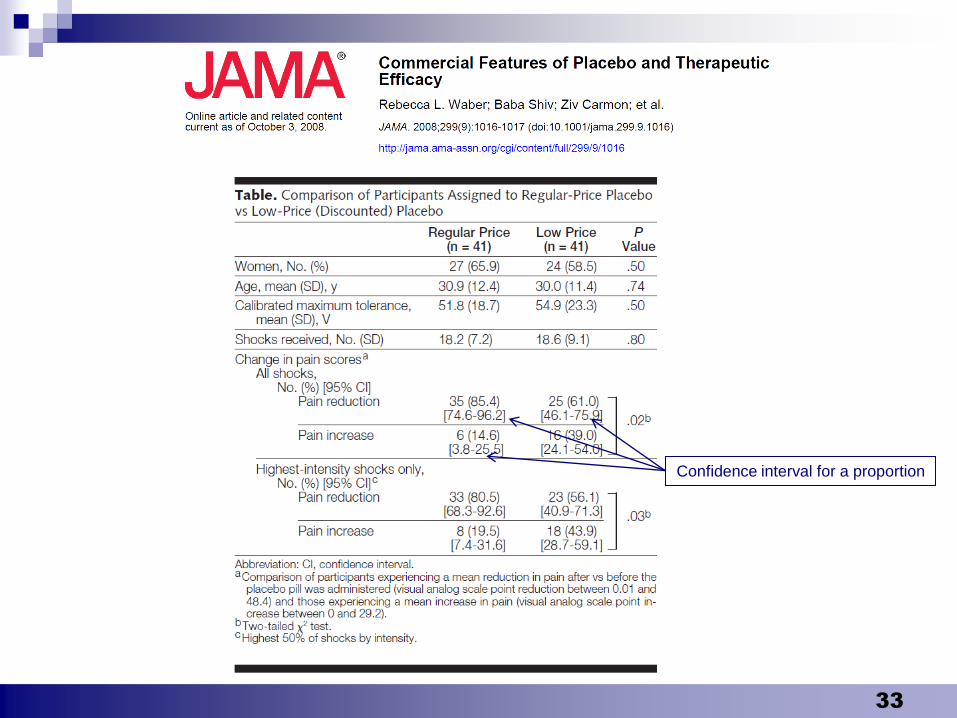
Confidence interval for a proportion
Krisztina Boda 34
Review questions and problems
The central limit theorem
The meaning and the formula of the standard error of mean (SE)
The meaning of a confidence interval
The confidence level
Which is wider, a 95% or a 99% confidence interval?
Calculation of the confidence interval for the population mean in case of unknown standard deviation
Studenst’s t-distribution
In a study, systolic blood pressure of 16 healthy women was measured. The mean was 121, the standard deviation was SD=8.2. Calculate the standard error.
In a study, systolic blood pressure of 10 healthy women was measured. The mean was 119, the standard error 0.664. Calculate the 95% confidence interval for the population mean! (=0.05, ttable=2.26).