statistical overview of armenia ’ s mining industry a presentation by
DESCRIPTION
Statistical Overview of Armenia ’ s Mining Industry A Presentation by Anastas Aghazaryan , Adivsor National Statistical Service Republic of Armenia American University of Armenia Nov. 30, 2012 Yerevan, Armenia. Structure and Dynamics of Armenia ’ s GDP. - PowerPoint PPT PresentationTRANSCRIPT

Structure and Dynamics of Armenia’s GDP
Agriculture
Trade, etc.Real Estate, etc.
Public admin
ManufacturingUtilities
Real
Gro
wth
of I
ndus
try
Valu
e Ad
ded
(ann
ual a
vera
ge, 2
002-
2011
)
Share of GDP (2011)
GD
P G
row
th (
9%)
Transport and Comm.
Financial intermediation
~100k employees in 2011Mining and quarrying
Hotels and restaurants
Construction
Education
Health & social work
Other
Source: National Statistical Services, Republic of Armenia
15.5k employees, making it 3rd smallest employer
2.9% of GDP, making it 3rd smallest industry
37.5% avg annual growth rate, 2nd fastest growing industry
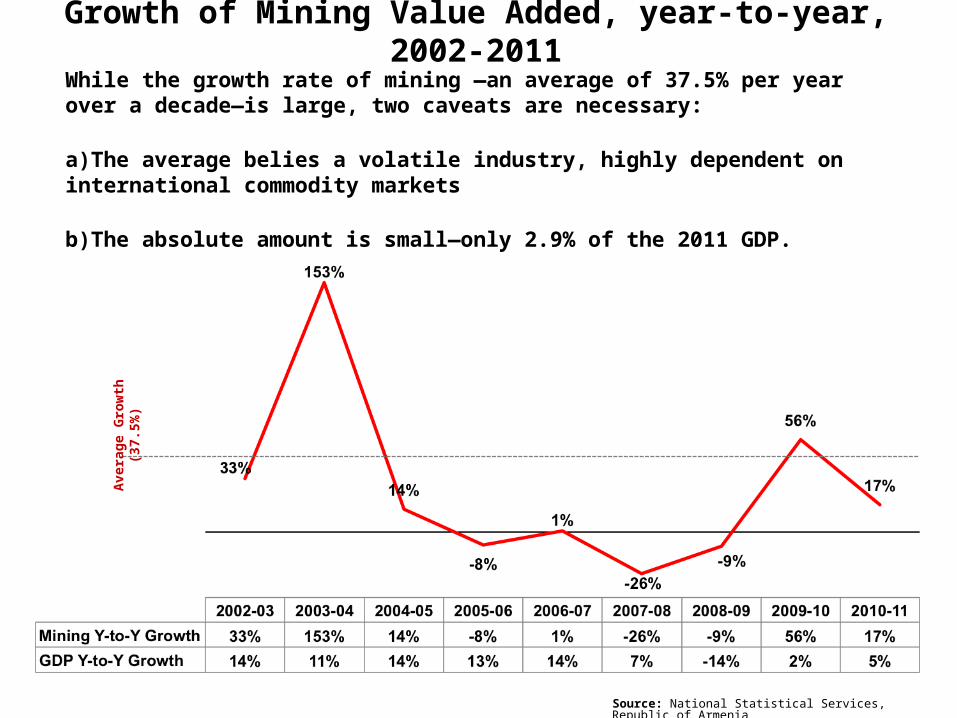
Growth of Mining Value Added, year-to-year, 2002-2011
Ave
rag
e G
row
th (
37.5
%)
Source: National Statistical Services, Republic of Armenia
While the growth rate of mining —an average of 37.5% per year over a decade—is large, two caveats are necessary:
a)The average belies a volatile industry, highly dependent on international commodity markets
b)The absolute amount is small—only 2.9% of the 2011 GDP.

Source: National Statistical Services
Number of People Employed in Mining, 2002-2011
Share of mining in total national employment (in %)
Number of mining employees (in thousands)
Comment on employment and wages
1
2
3
4
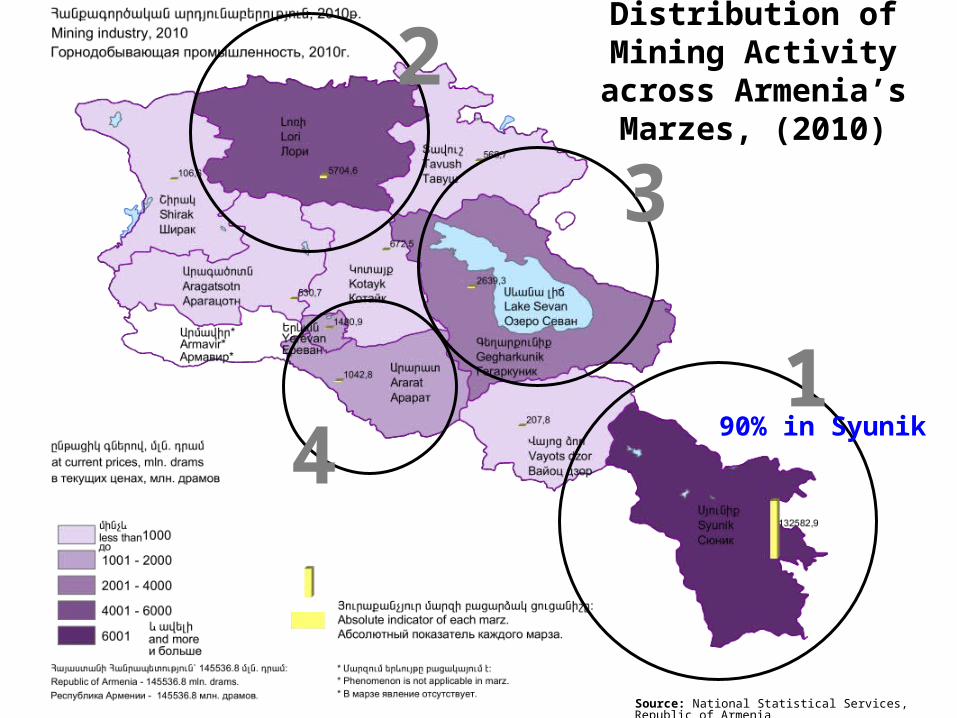
Distribution of Mining Activity across Armenia’s
Marzes, (2010)
90% in Syunik
Source: National Statistical Services, Republic of Armenia

Source: National Statistical Services
Mining’s share of all of Armenia’s exports
Share of all exports (value)
Share of all exports (tons)
256 thousand tons
$297 million
• In 2011, a fifth of export revenues was from minerals
• For good part of the mid-2000s, mining comprised 60% of export revenues. But that share has been declining starting in 2009.

$12940 per ton
$60 per ton
$230 per ton
$930 per ton
$2200 per ton
Exported by product type and reported value (2011)
King of quantity
King of value

Product QuantityUSD
AmountMain Destination
Copper ores and concentrate
118.3 k tons
$260.5mln BulgariaSpain
Zink ores and concentrate
14.8 k tons $13.9 mln Switzerland
Ore and concentrates molibdenic
860 tons $11.1mln Republic of KoreaNetherlands
METALLIC ORES, SLAG and ASH Exports: Quantities and Values (2011)

Precious stones and metals Exports: Quantities and Values (2011)
Product Product QuantityQuantityUSD USD
AmountAmount
Ferro-alloys 5566.0 tons 121.3 mln
Unrefined copper, copper anodes, electrolytic refining
8945.4 tons 114.6 mln
Aluminium foil of a thickness <0.2mm
25041.1 tons 86.9 mln
Molybdenum and articles thereof, waste or scrap
480.0 tons 15.4 mln
Gold, unwrought, semimanufactured, powder
2.3 tons 67.3 mln
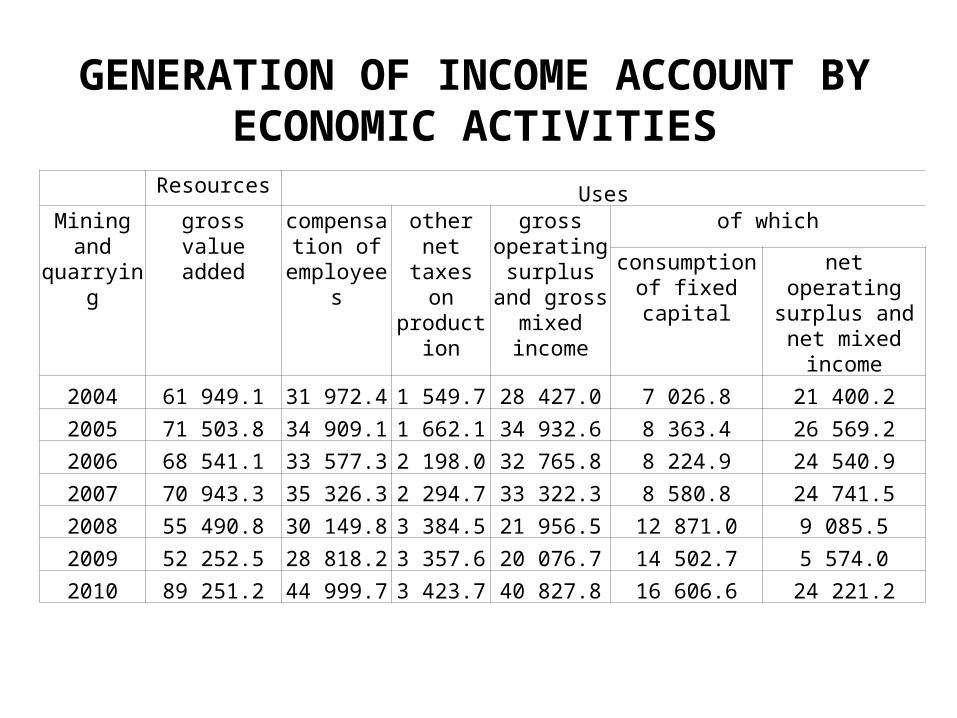
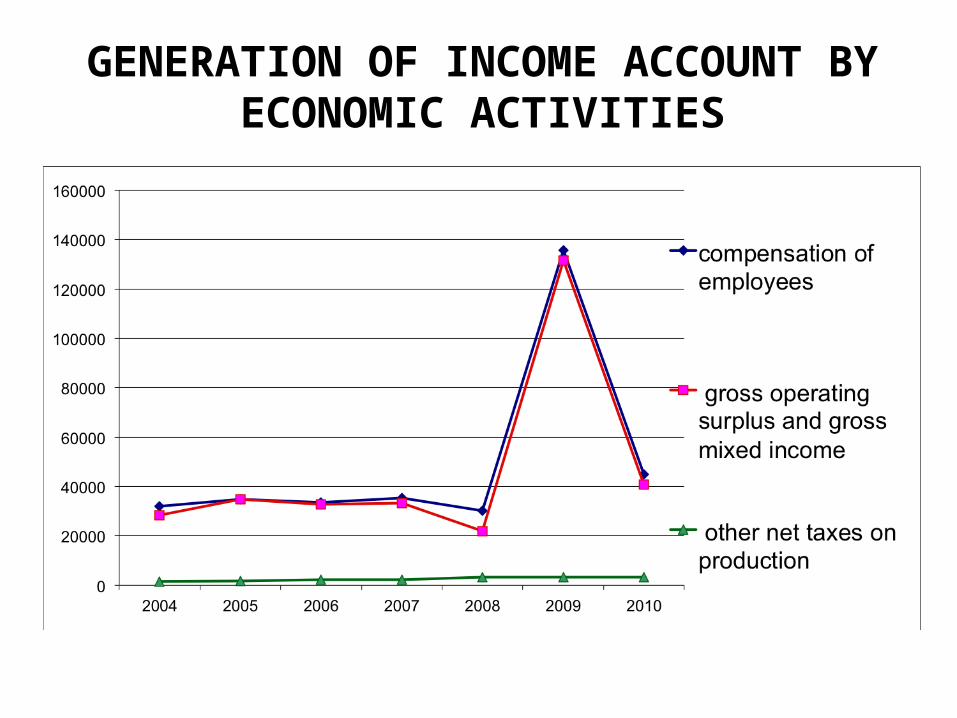
GENERATION OF INCOME ACCOUNT BY ECONOMIC ACTIVITIES
Resources UsesMining and quarrying
gross value added
compensation of
employees
other net taxes on
production
gross operating surplus and gross mixed income
of which
consumption of fixed capital
net operating surplus and net mixed income
2004 61 949.1 31 972.4 1 549.7 28 427.0 7 026.8 21 400.22005 71 503.8 34 909.1 1 662.1 34 932.6 8 363.4 26 569.22006 68 541.1 33 577.3 2 198.0 32 765.8 8 224.9 24 540.92007 70 943.3 35 326.3 2 294.7 33 322.3 8 580.8 24 741.52008 55 490.8 30 149.8 3 384.5 21 956.5 12 871.0 9 085.52009 52 252.5 28 818.2 3 357.6 20 076.7 14 502.7 5 574.02010 89 251.2 44 999.7 3 423.7 40 827.8 16 606.6 24 221.2
GENERATION OF INCOME ACCOUNT BY ECONOMIC ACTIVITIES

Income structure in mining production by Generetion of income account
48.8
48.9
2.3
49.0
47.8
3.2
49.847.0
3.2
54.3
39.6
6.1
50.248.6
1.2
50.4
45.7
3.8
0.0
10.0
20.0
30.0
40.0
50.0
60.0
2005 2006 2007 2008 2009 2010
compensation ofemployees
gross operating surplusand gross mixed income
other net taxes onproduction