statistical report of kentucky public libraries
TRANSCRIPT

STATISTICAL REPORT OF
KENTUCKY PUBLIC LIBRARIES
FISCAL YEAR 2015 - 2016
Department for Libraries and Archives
An agency of the Education and Workforce Development Cabinet
May 2017
Serving Kentucky's Need To Know
STATISTICAL REPORT OF
KENTUCKY PUBLIC LIBRARIES
FISCAL YEAR 2015 - 2016
Compiled and edited by:
Jay Bank
Department for Libraries and Archives An agency of the Education and Workforce Development Cabinet
May 2017
P.O. Box 537 Frankfort Kentucky 40602-0537

Printed with 100% Library Services and Technology Act Funds
This publication is supported by the Institute of Museum and Library Services under the provisions of the Library Services and Technology Act as administered by the Kentucky Department for Libraries and Archives.
The Kentucky Department for Libraries and Archives does not discriminate on the basis of race, color, national origin, sex, religion, age, or disability in employment or the provision of services. This publication will be made available in alternative format upon request
CONTENTS
Introduction ..................................................................................................................... i
Summary of Kentucky Public Library Statistics, 2015-2016 ..................................... 1
Top Ten List of Per Capita Statistics, by Kentucky County ...................................... 5
Kentucky Public Library Statistics, 2015-2016 ........................................................... 9
Selected Statistics, by Kentucky County Population, 2015-2016 ........................... 45
Glossary ....................................................................................................................... 65
Special Statistical Comparisons and Rankings, 2015-2016 .................................... 68
Web Links to Public Library Statistics and Resources ........................................... 80
-i-
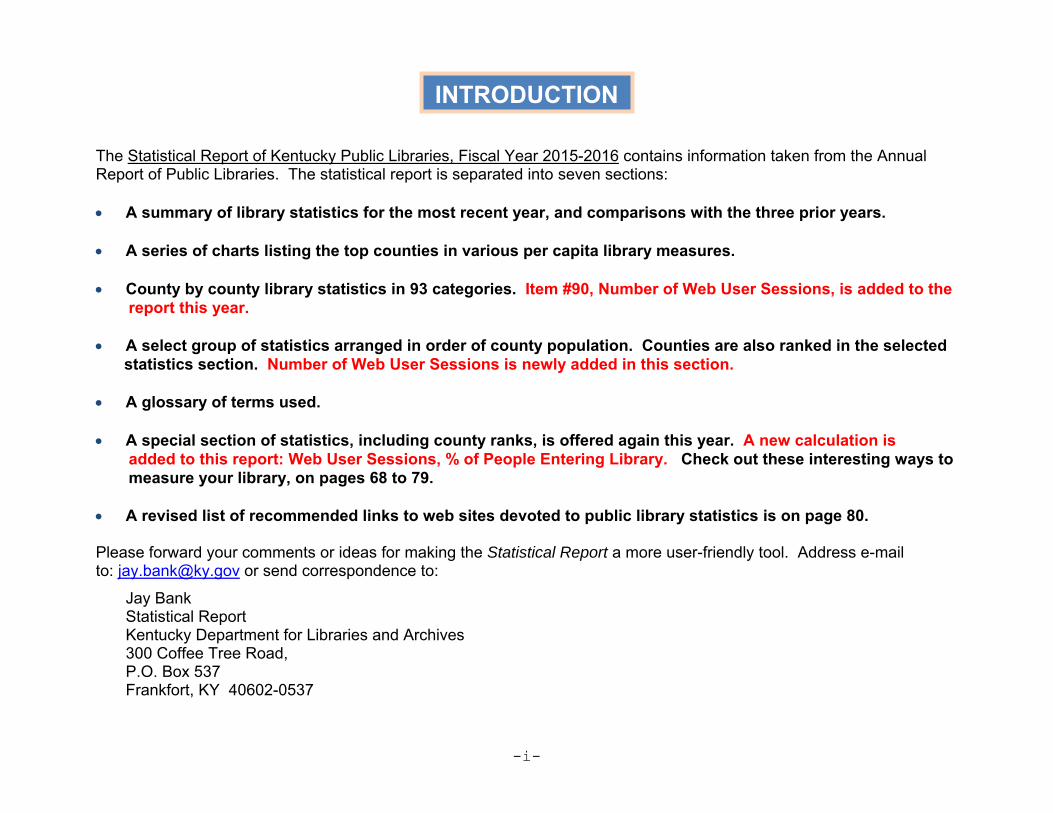
The Statistical Report of Kentucky Public Libraries, Fiscal Year 2015-2016 contains information taken from the Annual Report of Public Libraries. The statistical report is separated into seven sections: A summary of library statistics for the most recent year, and comparisons with the three prior years.
A series of charts listing the top counties in various per capita library measures.
County by county library statistics in 93 categories. Item #90, Number of Web User Sessions, is added to the report this year.
A select group of statistics arranged in order of county population. Counties are also ranked in the selected statistics section. Number of Web User Sessions is newly added in this section.
A glossary of terms used.
A special section of statistics, including county ranks, is offered again this year. A new calculation is added to this report: Web User Sessions, % of People Entering Library. Check out these interesting ways to measure your library, on pages 68 to 79.
A revised list of recommended links to web sites devoted to public library statistics is on page 80. Please forward your comments or ideas for making the Statistical Report a more user-friendly tool. Address e-mail to: [email protected] or send correspondence to:
Jay Bank Statistical Report Kentucky Department for Libraries and Archives 300 Coffee Tree Road, P.O. Box 537 Frankfort, KY 40602-0537
INTRODUCTION

% Change % Change % ChangeItem # 2014 2015 2016 2013-2014 2014-2015 2015-2016
Summary of Statistics
Sources of All Revenue1 Local Government $161,990,162 $167,707,494 $172,109,461 0.1% 3.5% 2.6%
% of Total Operating Revenue 91.7% 91.5% 92.9%
2 State Government $5,499,282 $6,101,708 $5,858,645 0.5% 11.0% -4.0% % of Total Operating Revenue 3.1% 3.3% 3.2%
3 Federal Government $631,093 $708,556 $281,379 -42.9% 12.3% -60.3% % of Total Operating Revenue 0.4% 0.4% 0.2%
4 Other Revenue $8,515,586 $8,703,449 $7,013,982 0.8% 2.2% -19.4% % of Total Operating Revenue 4.8% 4.8% 3.8%
5 Total Operating Revenue $176,636,123 $183,221,207 $185,263,467 -0.2% 3.7% 1.1%6 Library Operating Revenue, Per Capita $40.19 $41.51 $41.87
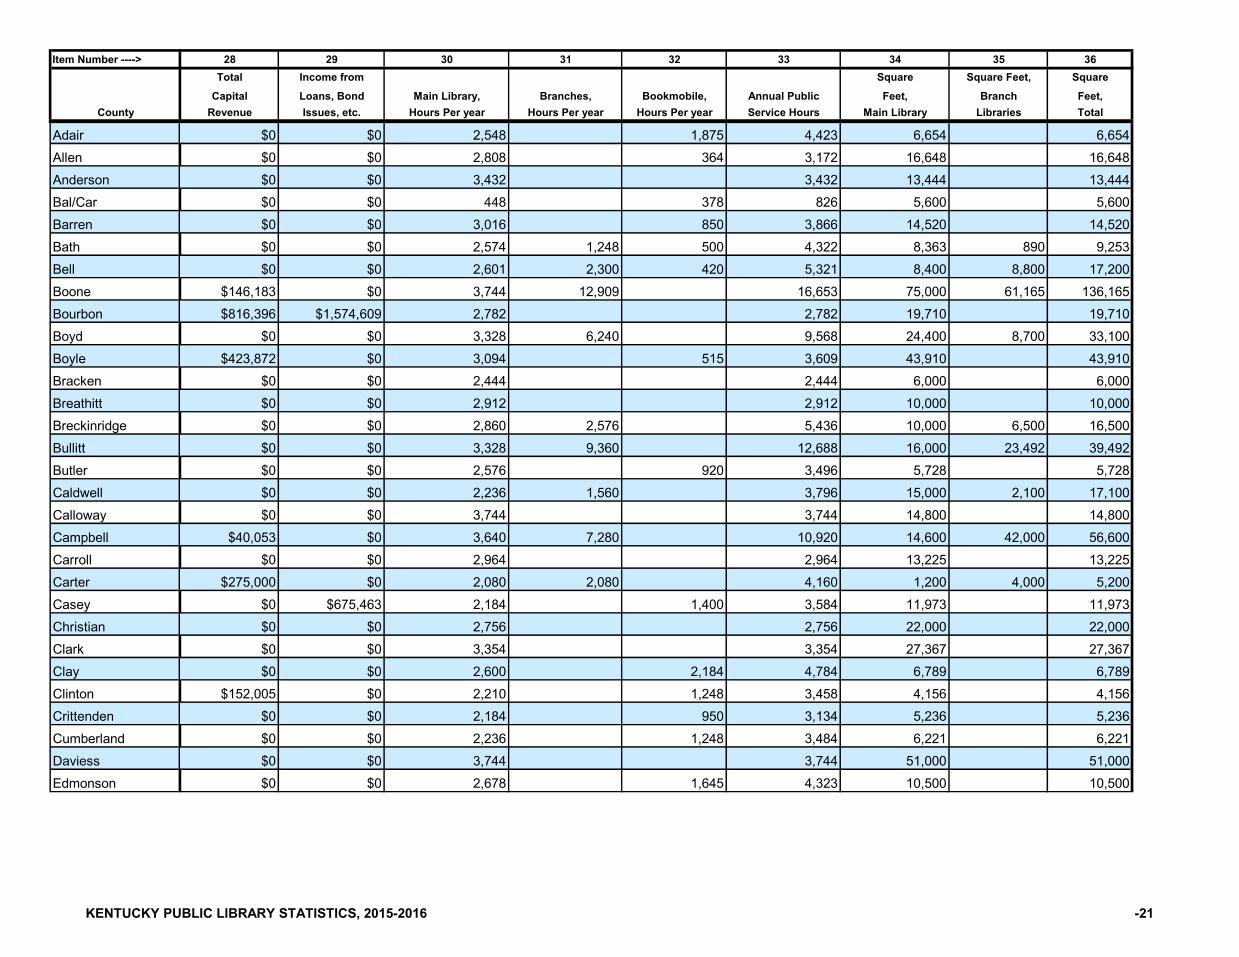
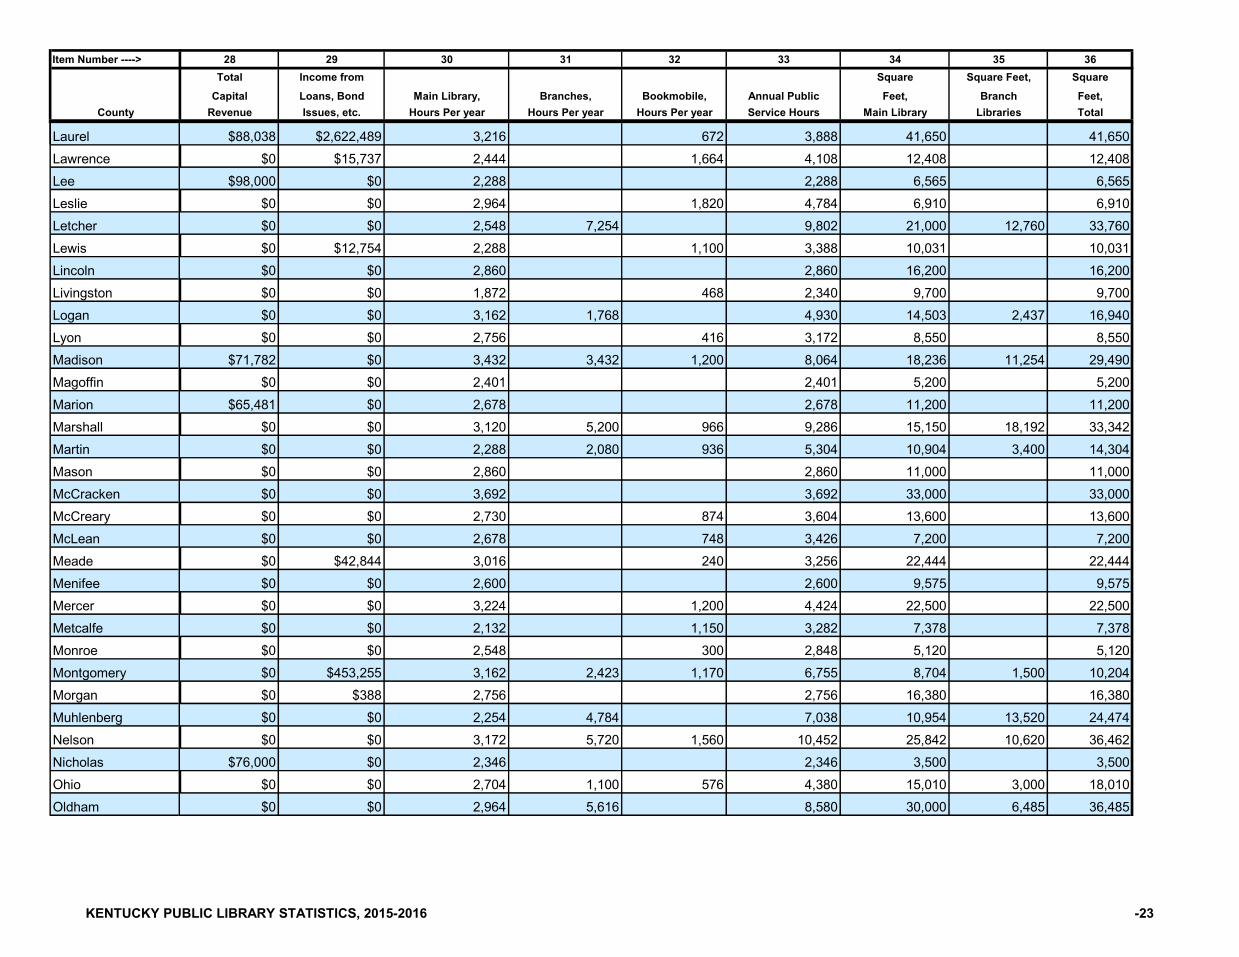
28 Capital Revenue $4,421,448 $8,042,005 $21,967,268 -9.1% 81.9% 173.2%29 Income from Loans and Bond Issues, etc. $3,457,690 $2,468,143 $10,791,627 -39.8% -28.6% 337.2%
Expenditures 7 Budget Expenditures $139,411,238 $143,187,272 $149,538,441 4.0% 2.7% 4.4%8 Per Capita Expenditures $31.72 $32.44 $33.79
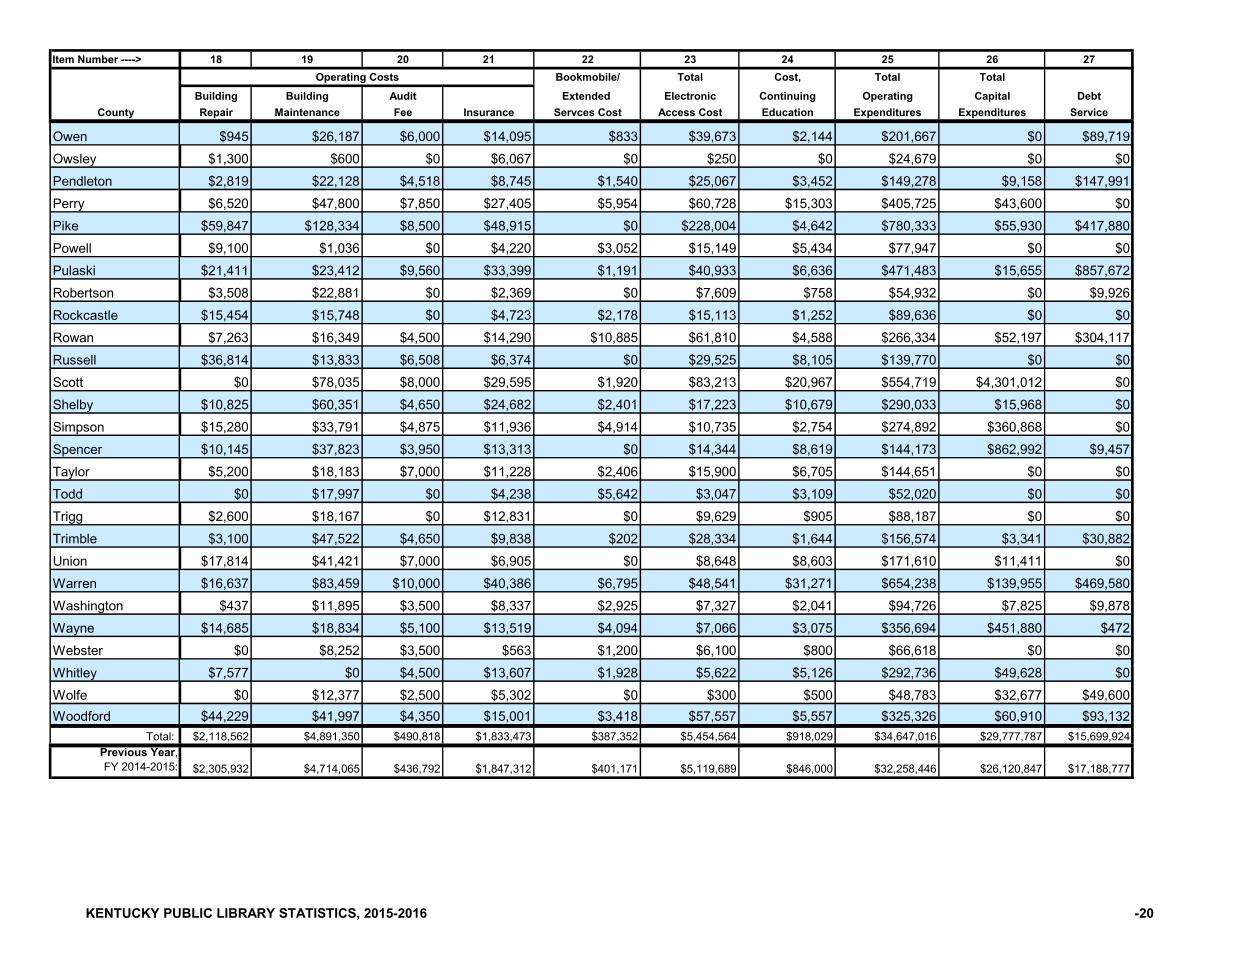
26 Capital Expenditures $31,151,779 $26,120,847 $29,777,787 0.6% -16.1% 14.0%27 Debt Service $13,962,730 $17,188,777 $15,699,924 24.6% 23.1% -8.7%
Salary Expenditures9 Director $6,254,892 $6,376,540 $6,433,072 3.7% 1.9% 0.9%
10 Total Salaries $63,983,150 $66,068,552 $68,802,092 4.3% 3.3% 4.1%11 Fringe Benefits $23,932,804 $24,481,791 $25,177,756 3.5% 2.3% 2.8%12 Total Staff Expenditures $87,915,954 $90,550,343 $93,979,848 4.1% 3.0% 3.8%
Salaries + Benefits, % of Expenditures 63.06% 63.24% 62.85%
Book and Material Expenditures13 Print Materials Expenditures $11,155,043 $11,302,055 $11,009,811 4.1% 1.3% -2.6%
Print Materials, % of Expenditures 8.00% 7.89% 7.36%
15 Audiovisual Materials Expenditures $3,780,840 $3,719,224 $3,783,302 5.7% -1.6% 1.7%14 Electronic Materials Expenditures $2,007,986 $2,339,658 $2,785,112 18.7% 16.5% 19.0%16 El;ectronic Collections (databases) $2,399,473 $2,456,328 $2,746,856 7.4% 2.4% 11.8%
Non-Print, % of Expenditures 6.2% 5.9% 6.2%
SUMMARY OF KENTUCKY PUBLIC LIBRARY STATISTICS, 2015-2016 -1
% Change % Change % ChangeItem # 2014 2015 2016 2013-2014 2014-2015 2015-2016
Summary of Statistics
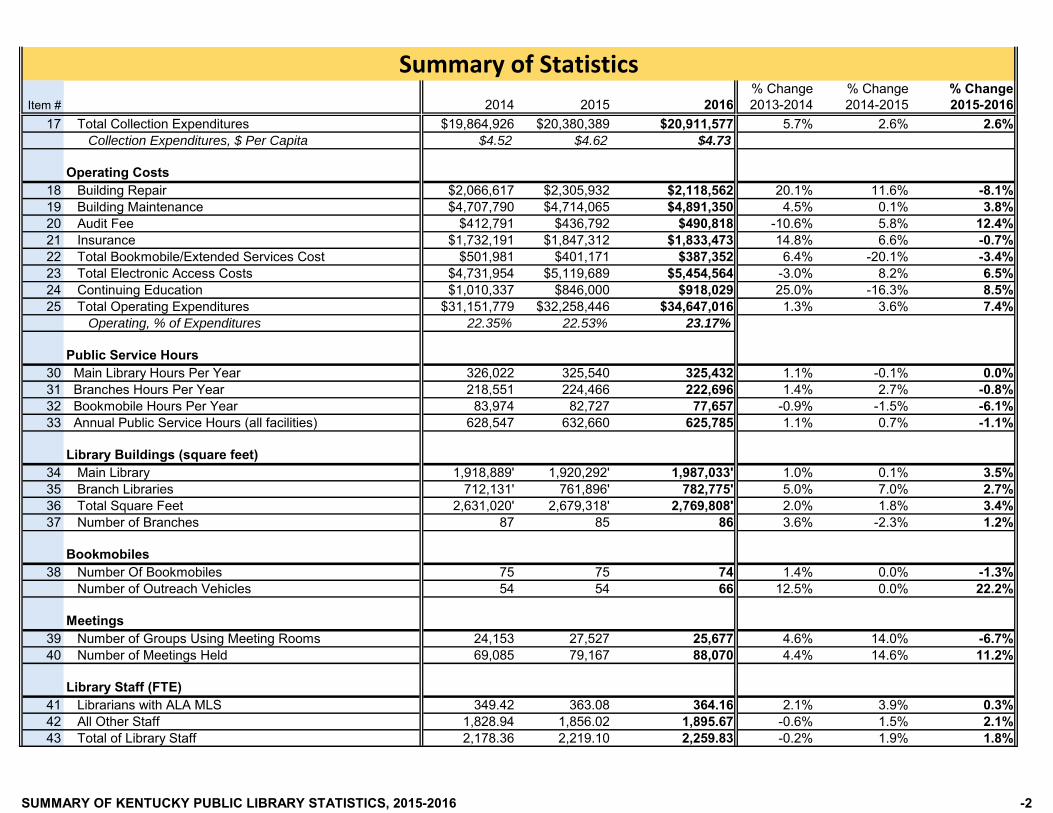
17 Total Collection Expenditures $19,864,926 $20,380,389 $20,911,577 5.7% 2.6% 2.6% Collection Expenditures, $ Per Capita $4.52 $4.62 $4.73
Operating Costs18 Building Repair $2,066,617 $2,305,932 $2,118,562 20.1% 11.6% -8.1%19 Building Maintenance $4,707,790 $4,714,065 $4,891,350 4.5% 0.1% 3.8%20 Audit Fee $412,791 $436,792 $490,818 -10.6% 5.8% 12.4%21 Insurance $1,732,191 $1,847,312 $1,833,473 14.8% 6.6% -0.7%22 Total Bookmobile/Extended Services Cost $501,981 $401,171 $387,352 6.4% -20.1% -3.4%23 Total Electronic Access Costs $4,731,954 $5,119,689 $5,454,564 -3.0% 8.2% 6.5%24 Continuing Education $1,010,337 $846,000 $918,029 25.0% -16.3% 8.5%25 Total Operating Expenditures $31,151,779 $32,258,446 $34,647,016 1.3% 3.6% 7.4%
Operating, % of Expenditures 22.35% 22.53% 23.17%
Public Service Hours30 Main Library Hours Per Year 326,022 325,540 325,432 1.1% -0.1% 0.0%31 Branches Hours Per Year 218,551 224,466 222,696 1.4% 2.7% -0.8%32 Bookmobile Hours Per Year 83,974 82,727 77,657 -0.9% -1.5% -6.1%33 Annual Public Service Hours (all facilities) 628,547 632,660 625,785 1.1% 0.7% -1.1%
Library Buildings (square feet)34 Main Library 1,918,889' 1,920,292' 1,987,033' 1.0% 0.1% 3.5%35 Branch Libraries 712,131' 761,896' 782,775' 5.0% 7.0% 2.7%36 Total Square Feet 2,631,020' 2,679,318' 2,769,808' 2.0% 1.8% 3.4%37 Number of Branches 87 85 86 3.6% -2.3% 1.2%
Bookmobiles38 Number Of Bookmobiles 75 75 74 1.4% 0.0% -1.3%
Number of Outreach Vehicles 54 54 66 12.5% 0.0% 22.2%
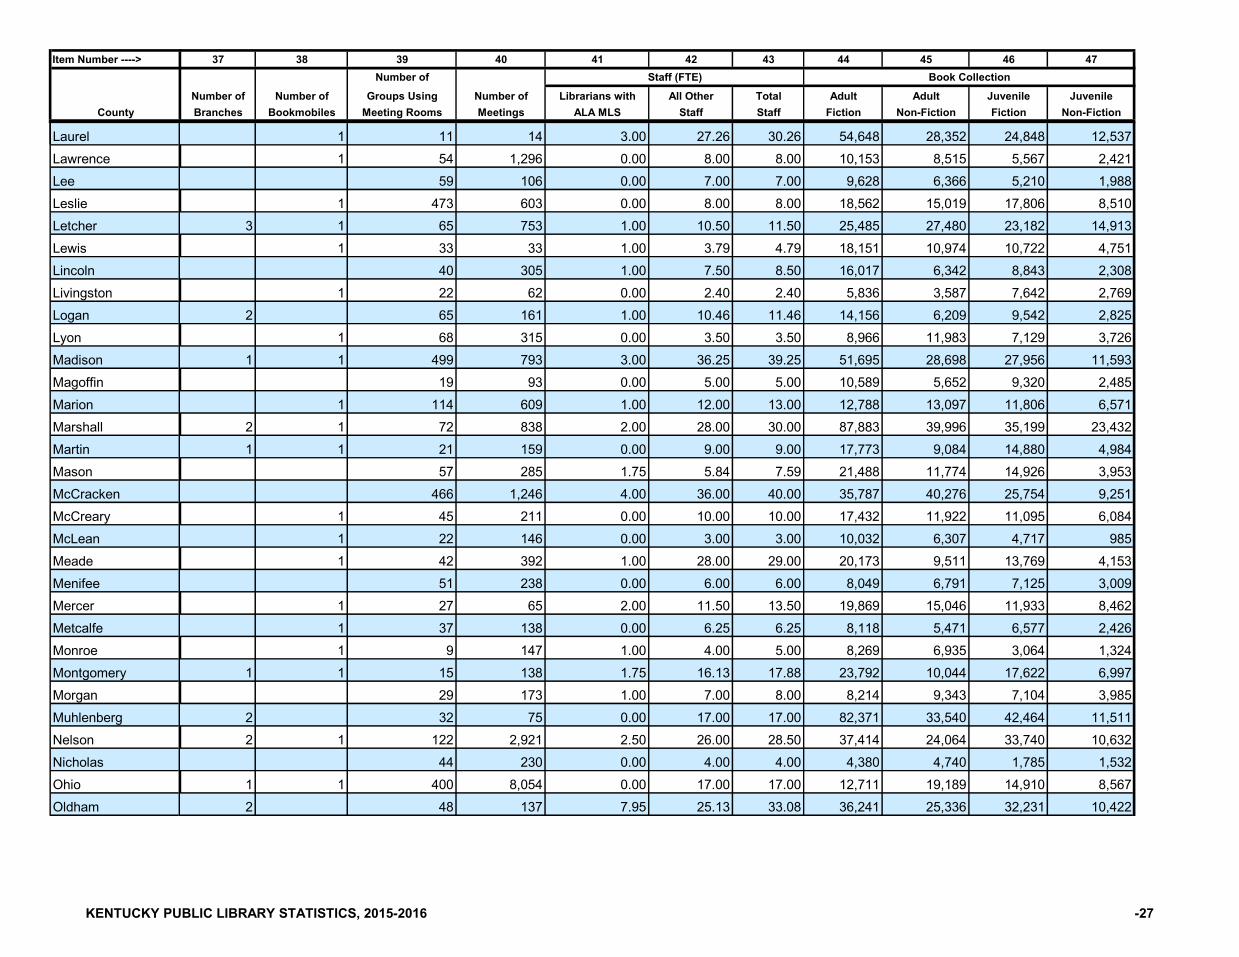
Meetings39 Number of Groups Using Meeting Rooms 24,153 27,527 25,677 4.6% 14.0% -6.7%40 Number of Meetings Held 69,085 79,167 88,070 4.4% 14.6% 11.2%
Library Staff (FTE)41 Librarians with ALA MLS 349.42 363.08 364.16 2.1% 3.9% 0.3%42 All Other Staff 1,828.94 1,856.02 1,895.67 -0.6% 1.5% 2.1%43 Total of Library Staff 2,178.36 2,219.10 2,259.83 -0.2% 1.9% 1.8%
SUMMARY OF KENTUCKY PUBLIC LIBRARY STATISTICS, 2015-2016 -2
% Change % Change % ChangeItem # 2014 2015 2016 2013-2014 2014-2015 2015-2016
Summary of Statistics
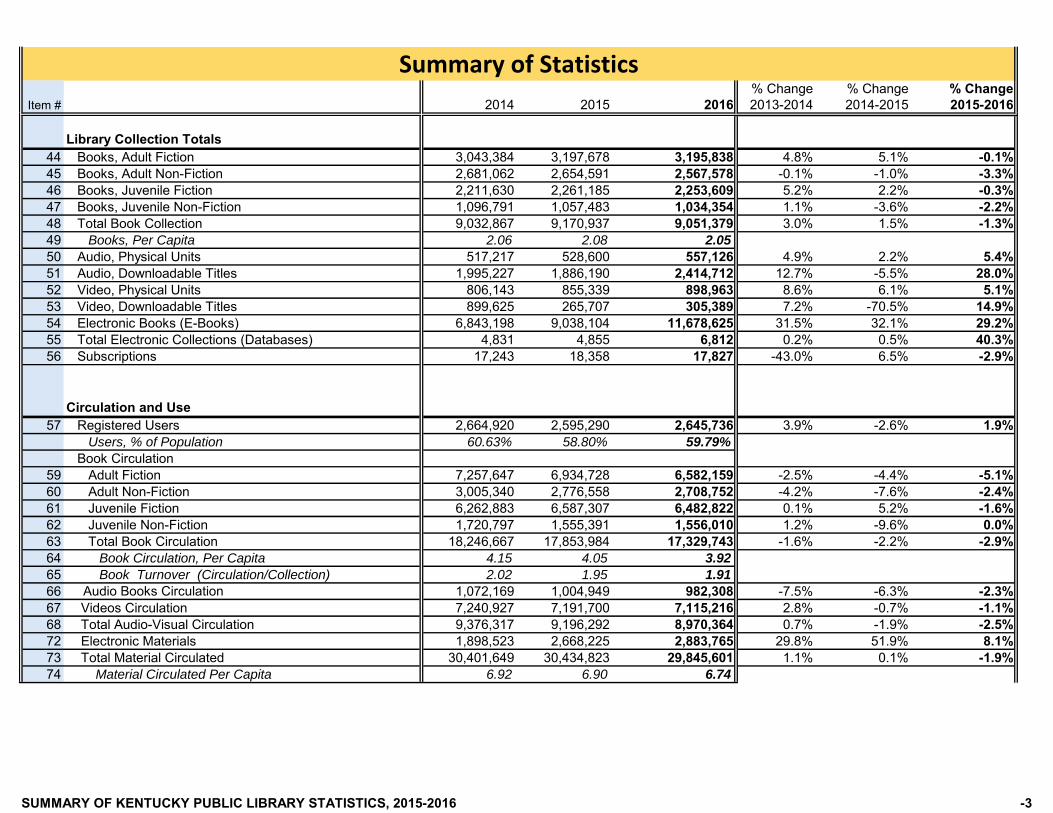
Library Collection Totals44 Books, Adult Fiction 3,043,384 3,197,678 3,195,838 4.8% 5.1% -0.1%45 Books, Adult Non-Fiction 2,681,062 2,654,591 2,567,578 -0.1% -1.0% -3.3%46 Books, Juvenile Fiction 2,211,630 2,261,185 2,253,609 5.2% 2.2% -0.3%47 Books, Juvenile Non-Fiction 1,096,791 1,057,483 1,034,354 1.1% -3.6% -2.2%48 Total Book Collection 9,032,867 9,170,937 9,051,379 3.0% 1.5% -1.3%49 Books, Per Capita 2.06 2.08 2.05
50 Audio, Physical Units 517,217 528,600 557,126 4.9% 2.2% 5.4%51 Audio, Downloadable Titles 1,995,227 1,886,190 2,414,712 12.7% -5.5% 28.0%52 Video, Physical Units 806,143 855,339 898,963 8.6% 6.1% 5.1%53 Video, Downloadable Titles 899,625 265,707 305,389 7.2% -70.5% 14.9%54 Electronic Books (E-Books) 6,843,198 9,038,104 11,678,625 31.5% 32.1% 29.2%55 Total Electronic Collections (Databases) 4,831 4,855 6,812 0.2% 0.5% 40.3%56 Subscriptions 17,243 18,358 17,827 -43.0% 6.5% -2.9%
Circulation and Use57 Registered Users 2,664,920 2,595,290 2,645,736 3.9% -2.6% 1.9%
Users, % of Population 60.63% 58.80% 59.79%
Book Circulation59 Adult Fiction 7,257,647 6,934,728 6,582,159 -2.5% -4.4% -5.1%60 Adult Non-Fiction 3,005,340 2,776,558 2,708,752 -4.2% -7.6% -2.4%61 Juvenile Fiction 6,262,883 6,587,307 6,482,822 0.1% 5.2% -1.6%62 Juvenile Non-Fiction 1,720,797 1,555,391 1,556,010 1.2% -9.6% 0.0%63 Total Book Circulation 18,246,667 17,853,984 17,329,743 -1.6% -2.2% -2.9%64 Book Circulation, Per Capita 4.15 4.05 3.92
65 Book Turnover (Circulation/Collection) 2.02 1.95 1.91
66 Audio Books Circulation 1,072,169 1,004,949 982,308 -7.5% -6.3% -2.3%67 Videos Circulation 7,240,927 7,191,700 7,115,216 2.8% -0.7% -1.1%68 Total Audio-Visual Circulation 9,376,317 9,196,292 8,970,364 0.7% -1.9% -2.5%72 Electronic Materials 1,898,523 2,668,225 2,883,765 29.8% 51.9% 8.1%73 Total Material Circulated 30,401,649 30,434,823 29,845,601 1.1% 0.1% -1.9%74 Material Circulated Per Capita 6.92 6.90 6.74
SUMMARY OF KENTUCKY PUBLIC LIBRARY STATISTICS, 2015-2016 -3

% Change % Change % ChangeItem # 2014 2015 2016 2013-2014 2014-2015 2015-2016
Summary of Statistics
69 Material Circulated (Main Library) 16,027,989 15,423,091 15,084,146 0.3% -3.8% -2.2%70 Material Circulated (Branches) 10,784,609 10,633,651 10,214,114 -0.9% -1.4% -3.9%71 Material Circulated (Bookmobile) 1,690,528 1,708,296 1,663,576 -3.4% 1.1% -2.6%
Bookmobile, % of All Circulation 5.56% 5.61% 5.57%
75 Number of Uses of Public Internet Computers/Year 4,550,684 4,404,673 4,163,635 -1.5% -3.2% -5.5%
Library Attendance58 People Entering Library 19,283,936 18,584,048 18,108,790 -0.2% -3.6% -2.6%77 Children's Program Attendance 1,426,392 1,481,367 1,219,016 3.6% 3.9% -17.7%79 Young Adult Program Attendance 113,081 126,791 145,008 21.2% 12.1% 14.4%81 Adult Program Attendance 307,761 339,100 392,307 -0.8% 10.2% 15.7%84 Total Number of Programs 89,358 94,129 97,632 4.3% 5.3% 3.7%85 Total Program Attendance 2,006,238 2,209,558 2,442,453 7.1% 10.1% 10.5%
Reference Transactions86 Reference Requests 4,466,997 4,282,701 4,371,557 16.6% -4.1% 2.1%
Interlibrary Cooperation87 Total Materials Loaned 55,680 52,914 55,192 1.2% -5.0% 4.3%88 Total Material Borrowed 78,242 72,733 77,143 4.0% -7.0% 6.1%
Automation89 Wireless Sessions, Annually 1,266,660 3,781,523 4,263,616 new 198.5% 12.7%90 Number of Web User Sessions 19,357,049 new91 Computers Intended for Public Use 4,858 4,893 4,963 2.3% 0.7% 1.4%92 Patrons Trained to Use Electronic Resources 33,695 35,382 33,175 -14.7% 5.0% -6.2%
Intellectual Freedom Incidents(P1) Number of Intellectual Freedom Incidents 21 21 13 -8.7% 0.0% -38.1%
SUMMARY OF KENTUCKY PUBLIC LIBRARY STATISTICS, 2015-2016 -4
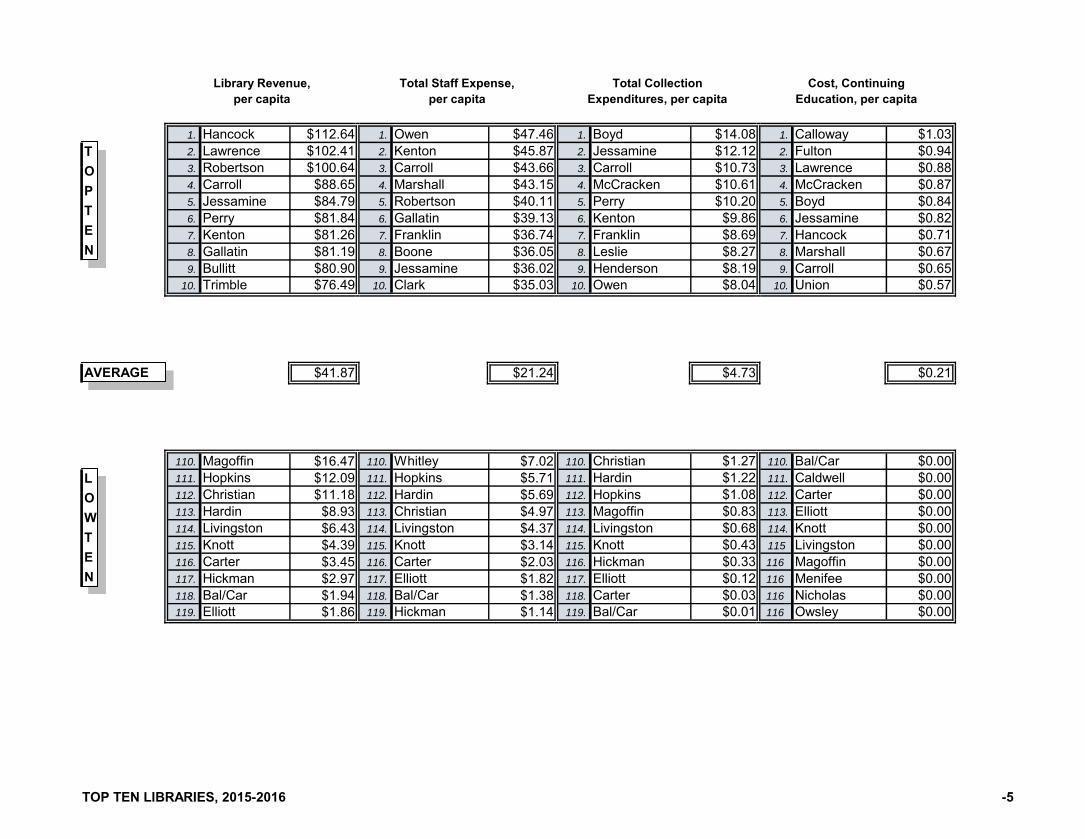
1. Hancock $112.64 1. Owen $47.46 1. Boyd $14.08 1. Calloway $1.032. Lawrence $102.41 2. Kenton $45.87 2. Jessamine $12.12 2. Fulton $0.943. Robertson $100.64 3. Carroll $43.66 3. Carroll $10.73 3. Lawrence $0.884. Carroll $88.65 4. Marshall $43.15 4. McCracken $10.61 4. McCracken $0.875. Jessamine $84.79 5. Robertson $40.11 5. Perry $10.20 5. Boyd $0.846. Perry $81.84 6. Gallatin $39.13 6. Kenton $9.86 6. Jessamine $0.827. Kenton $81.26 7. Franklin $36.74 7. Franklin $8.69 7. Hancock $0.718. Gallatin $81.19 8. Boone $36.05 8. Leslie $8.27 8. Marshall $0.679. Bullitt $80.90 9. Jessamine $36.02 9. Henderson $8.19 9. Carroll $0.65
10. Trimble $76.49 10. Clark $35.03 10. Owen $8.04 10. Union $0.57
$41.87 $21.24 $4.73 $0.21
110. Magoffin $16.47 110. Whitley $7.02 110. Christian $1.27 110. Bal/Car $0.00111. Hopkins $12.09 111. Hopkins $5.71 111. Hardin $1.22 111. Caldwell $0.00112. Christian $11.18 112. Hardin $5.69 112. Hopkins $1.08 112. Carter $0.00113. Hardin $8.93 113. Christian $4.97 113. Magoffin $0.83 113. Elliott $0.00114. Livingston $6.43 114. Livingston $4.37 114. Livingston $0.68 114. Knott $0.00115. Knott $4.39 115. Knott $3.14 115. Knott $0.43 115 Livingston $0.00116. Carter $3.45 116. Carter $2.03 116. Hickman $0.33 116 Magoffin $0.00117. Hickman $2.97 117. Elliott $1.82 117. Elliott $0.12 116 Menifee $0.00118. Bal/Car $1.94 118. Bal/Car $1.38 118. Carter $0.03 116 Nicholas $0.00119. Elliott $1.86 119. Hickman $1.14 119. Bal/Car $0.01 116 Owsley $0.00
TOP TEN
Library Revenue,per capita
Total Staff Expense,per capita
Total CollectionExpenditures, per capita
Cost, ContinuingEducation, per capita
AVERAGE
LOW TEN
TOP TEN LIBRARIES, 2015-2016 -5

1. Robertson 1.07 1. Robertson 2.39 1. Robertson 23.39 1 Fulton 8.472. Fulton 0.99 2. Fulton 1.60 2. Cumberland 11.84 2 Robertson 6.803. Hancock 0.63 3. Owsley 1.57 3. Owen 11.00 3 Marshall 6.004. Cumberland 0.52 4. Menifee 1.51 4. Union 10.76 4 Owsley 5.775. Owsley 0.50 5. Boyle 1.47 5. Meade 10.39 5 Leslie 5.596. Union 0.48 6. Letcher 1.46 6. Lee 10.37 6 Muhlenberg 5.457. Leslie 0.45 7. Hancock 1.36 7. Carroll 10.28 7 Webster 5.308. Martin 0.43 8. Caldwell 1.35 8. Jackson 9.74 8 Hancock 5.049. Webster 0.43 9. Pike 1.25 9. Marshall 9.65 9 Harlan 4.58
10. Letcher 0.42 10. Carroll 1.24 10. Wolfe 9.64 10 Boyle 4.51
0.14 0.63 5.11 2.05
110. Franklin 0.07 110. Clay 0.32 110. Hopkins 2.38 110 Warren 1.27111. Jessamine 0.07 111. Rockcastle 0.32 111. Graves 2.26 111 Logan 1.22112. Kenton 0.07 112. Christian 0.30 112. Hickman 2.17 112 Taylor 1.19113. Fayette 0.07 113. Grayson 0.29 113. Knott 1.91 113 Graves 1.18114. Laurel 0.06 114. Spencer 0.28 114. Knox 1.89 114 Whitley 1.06115. Hardin 0.06 115. Todd 0.26 115. Christian 1.50 115 Barren 1.05116. Bal/Car 0.06 116. Knox 0.22 116. Hardin 1.34 116 Hardin 0.75117. McCracken 0.06 117. Hardin 0.22 117. Elliott 1.31 117 Bal/Car 0.70118. Daviess 0.04 118. Carter 0.19 118. Carter 1.10 118 Carter 0.40119. Christian 0.04 119. Knott 0.15 119. Bal/Car 0.76 119 Christian 0.21
TOP TEN
Total Library Staff,per 10,000 population
Book Collection,per capita
Annual Public ServiceHours, per capita
Square Feet, Total,per capita
AVERAGE
LOW TEN
TOP TEN LIBRARIES, 2015-2016 -6

1. Carroll 11.08 1. Carroll 10.53 1. McLean 1.76 1. Robertson 8.892. Leslie 9.25 2. Wolfe 9.26 2. Union 1.62 2. Fulton 5.133. Owsley 9.04 3. Owsley 8.78 3. Clinton 1.51 3. Trimble 4.684. Clinton 8.43 4. Rowan 7.59 4. Pulaski 1.25 4. Gallatin 4.635. Nicholas 8.11 5. Woodford 7.58 5. Leslie 1.24 5. Menifee 4.096. Marshall 7.93 6. Mason 7.43 6. Lawrence 1.05 6. Owsley 4.037. Fulton 7.00 7. Daviess 7.38 7. Martin 0.85 7. Union 3.998. Hart 6.90 8. Leslie 7.13 8. Hart 0.78 8. Leslie 3.649. Boone 6.37 9. Boone 6.79 9. Woodford 0.77 9. Pike 3.20
10. Wayne 6.31 10. Robertson 6.78 10. Hancock 0.76 10. Hancock 2.99
3.92 4.09 0.34 1.12
110. Clay 1.16 110. Caldwell 1.44 110. Edmonson 0.07 110. Hardin 0.41111. Hopkins 1.15 111. Magoffin 1.43 111. Morgan 0.06 111. Hopkins 0.41112. Floyd 1.13 112. Christian 1.41 112. Grant 0.05 112. Todd 0.40113. Hickman 1.11 113. Livingston 1.39 113. Livingston 0.05 113. Clay 0.38114. Magoffin 0.98 114. Adair 1.38 114. Floyd 0.05 114. Knox 0.38115. Knott 0.60 115. Knott 1.27 115. Hickman 0.03 115. Carter 0.37116. Elliott 0.49 116. Muhlenberg 0.75 116. Christian 0.03 116. Grayson 0.34117. Christian 0.30 117. Hickman 0.48 117. Owsley 0.01 117. Calloway 0.34118. Carter 0.26 118. Carter 0.29 118. Carter 0.00 118. Christian 0.26119. Bal/Car 0.23 119. Bal/Car 0.08 119. Bal/Car 0.00 119. Bal/Car 0.15
TOP TEN
Book Circulation,per capita
Library Attendance,per capita
Children's ProgramAttendance, per capita
Number of Internet Computers Used by Public, per 1,000 pop.
AVERAGE
LOW TEN
TOP TEN LIBRARIES, 2015-2016 -7

1. Lyon 1.28 1. Leslie 14.37 1. Leslie 14.01 1. Leslie 60.052. Owsley 1.28 2. Lyon 13.98 2. Kenton 2.56 2. Carroll 7.073. Fulton 1.24 3. Bracken 13.96 3. Fleming 2.45 3. Marshall 5.594. Lawrence 1.23 4. Gallatin 13.45 4. Jessamine 1.49 4. Nelson 5.375. Leslie 1.12 5. Hancock 13.38 5. Boyd 1.38 5. Morgan 3.396. Webster 1.09 6. Trimble 13.24 6. Hancock 1.17 6. Fayette 2.917. Kenton 0.99 7. Wolfe 12.61 7. Daviess 1.12 7. Casey 2.898. Laurel 0.97 8. Metcalfe 11.74 8. Franklin 1.09 8. Robertson 2.799. Johnson 0.95 9. Clinton 11.41 9. Boone 0.99 9. Webster 2.64
10. Menifee 0.95 10. Carroll 10.89 10. Pike 0.92 10. Butler 2.41
0.60 2.64 0.65 0.96
110. Bullitt 0.33 110. 110. 110. Hardin 0.06111. Russell 0.33 111. 111. 111. Johnson 0.05112. Muhlenberg 0.32 112. 112. 112. Hart 0.05113. Carter 0.31 113. 113. 113. McLean 0.04114. Magoffin 0.30 114. 114. 114. Rockcastle 0.03115. Livingston 0.29 115. 115. 115. Muhlenberg 0.03116. Barren 0.27 116. 116. 116. Bal/Car 0.00117. Estill 0.26 117. 117. 117. Christian 0.00118. Adair 0.22 118. 118. 118. Hickman 0.00119. Bal/Car 0.05 119. 16 libraries 0.00 119. 16 libraries 0.00 119. Wolfe 0.00
Collection, Electronic Books,(E-books) per capita
Circulation, Electronic Material,per capita
Annual Wireless Sessions,per capita
TOP TEN
LOW TEN
AVERAGE
Registered Users,per capita
TOP TEN LIBRARIES, 2015-2016 -8

Item Number ----> 1 2 3 4 5 6 7 8 9Local State Federal Other Total Library Budget
Government Government Government Operating Operating Income, Budget Expenditures, Salary,County Population Revenue Revenue Revenue Revenue Revenue Per Capita Expenditures Per Capita Director
Adair 19,027 $367,701 $16,578 $0 $3,590 $387,869 $20.39 $305,472 $16.05 $42,303Allen 20,640 $763,111 $16,822 $289 $21,232 $801,454 $38.83 $649,390 $31.46 $56,301Anderson 21,979 $1,294,341 $17,398 $0 $19,104 $1,330,843 $60.55 $848,035 $38.58 $74,000Bal/Car 13,086 $1,411 $23,992 $0 $0 $25,403 $1.94 $20,389 $1.56 $8,301Barren 43,570 $765,584 $34,858 $0 $29,626 $830,068 $19.05 $672,724 $15.44 $59,884Bath 12,228 $435,759 $13,871 $0 $9,768 $459,398 $37.57 $421,577 $34.48 $43,562Bell 27,337 $821,679 $161,217 $0 $22,723 $1,005,619 $36.79 $726,279 $26.57 $40,312Boone 127,712 $7,288,504 $44,788 $14,214 $182,596 $7,530,102 $58.96 $6,910,268 $54.11 $92,177Bourbon 20,116 $1,160,425 $17,508 $0 $187,721 $1,365,654 $67.89 $864,769 $42.99 $67,217Boyd 48,325 $2,861,495 $108,897 $0 $155,905 $3,126,297 $64.69 $2,959,173 $61.23 $73,019Boyle 29,809 $1,100,000 $128,671 $7,010 $176,041 $1,411,722 $47.36 $1,262,677 $42.36 $63,000Bracken 8,321 $423,919 $12,638 $0 $0 $436,557 $52.46 $317,458 $38.15 $38,295Breathitt 13,484 $506,751 $16,075 $0 $9,767 $532,593 $39.50 $502,315 $37.25 $33,718Breckinridge 20,018 $910,563 $17,195 $39,092 $19,433 $986,283 $49.27 $702,317 $35.08 $41,207Bullitt 78,702 $6,086,728 $53,910 $0 $226,694 $6,367,332 $80.90 $3,434,730 $43.64 $86,625Butler 12,938 $314,556 $14,717 $0 $8,478 $337,751 $26.11 $286,803 $22.17 $35,518Caldwell 12,681 $320,981 $14,739 $0 $7,160 $342,880 $27.04 $333,997 $26.34 $42,890Calloway 38,343 $1,592,087 $23,019 $0 $54,031 $1,669,137 $43.53 $1,116,955 $29.13 $61,816Campbell 92,066 $4,541,091 $159,984 $48,698 $92,441 $4,842,214 $52.60 $4,386,758 $47.65 $90,262Carroll 10,699 $646,614 $111,145 $0 $190,701 $948,460 $88.65 $869,846 $81.30 $51,000Carter 27,158 $54,000 $19,816 $0 $20,000 $93,816 $3.45 $94,155 $3.47 $28,000Casey 15,808 $548,408 $98,022 $0 $9,431 $655,861 $41.49 $500,530 $31.66 $48,000Christian 73,309 $639,636 $38,756 $0 $140,949 $819,341 $11.18 $612,493 $8.35 $31,489Clark 35,757 $2,013,708 $82,565 $0 $78,622 $2,174,895 $60.82 $1,759,921 $49.22 $69,238Clay 21,013 $430,981 $18,791 $0 $31,915 $481,687 $22.92 $435,908 $20.74 $12,632Clinton 10,174 $175,592 $13,234 $0 $4,587 $193,413 $19.01 $184,795 $18.16 $29,572Crittenden 9,183 $212,836 $13,124 $0 $8,134 $234,094 $25.49 $216,791 $23.61 $42,869Cumberland 6,759 $261,395 $12,141 $0 $2,000 $275,536 $40.77 $236,355 $34.97 $37,367Daviess 99,259 $4,063,485 $111,229 $6,086 $383,113 $4,563,913 $45.98 $3,273,226 $32.98 $45,472Edmonson 12,007 $438,035 $14,117 $0 $16,458 $468,610 $39.03 $405,101 $33.74 $53,408
KENTUCKY PUBLIC LIBRARY STATISTICS, 2015-2016 -9

Item Number ----> 1 2 3 4 5 6 7 8 9Local State Federal Other Total Library Budget
Government Government Government Operating Operating Income, Budget Expenditures, Salary,County Population Revenue Revenue Revenue Revenue Revenue Per Capita Expenditures Per Capita Director
Elliott 7,648 $0 $11,965 $0 $2,225 $14,190 $1.86 $25,359 $3.32 $13,920Estill 14,375 $604,142 $15,727 $0 $25,149 $645,018 $44.87 $438,902 $30.53 $44,506Fayette 314,488 $14,634,159 $226,479 $7,007 $957,599 $15,825,244 $50.32 $13,295,905 $42.28 $145,294Fleming 14,637 $541,326 $95,061 $0 $161,490 $797,877 $54.51 $458,553 $31.33 $42,400Floyd 37,756 $1,347,024 $26,650 $0 $0 $1,373,674 $36.38 $1,026,139 $27.18 $66,831Franklin 50,375 $2,926,864 $34,434 $0 $138,650 $3,099,948 $61.54 $2,959,711 $58.75 $107,081Fulton 6,238 $252,482 $12,407 $0 $14,495 $279,384 $44.79 $275,008 $44.09 $29,547Gallatin 8,636 $655,216 $12,458 $18,841 $14,666 $701,181 $81.19 $605,005 $70.06 $57,548Garrard 17,237 $572,455 $23,265 $0 $15,671 $611,391 $35.47 $564,816 $32.77 $55,160Grant 24,757 $1,152,542 $87,836 $0 $40,248 $1,280,626 $51.73 $1,057,889 $42.73 $74,813Graves 37,421 $1,092,845 $24,272 $0 $27,399 $1,144,516 $30.58 $654,697 $17.50 $47,250Grayson 26,221 $1,128,836 $38,570 $0 $19,063 $1,186,469 $45.25 $754,238 $28.76 $55,909Green 11,010 $364,571 $16,315 $0 $14,073 $394,959 $35.87 $385,298 $35.00 $32,836Greenup 36,068 $1,839,266 $89,711 $0 $36,023 $1,965,000 $54.48 $1,249,479 $34.64 $72,644Hancock 8,692 $951,543 $13,089 $0 $14,433 $979,065 $112.64 $518,897 $59.70 $43,052Hardin 106,439 $840,000 $48,384 $0 $62,600 $950,984 $8.93 $918,479 $8.63 $78,687Harlan 27,703 $1,000,929 $22,590 $0 $0 $1,023,519 $36.95 $849,820 $30.68 $50,149Harrison 18,763 $712,671 $16,902 $0 $70,223 $799,796 $42.63 $675,930 $36.02 $57,707Hart 18,454 $629,492 $65,848 $0 $7,573 $702,913 $38.09 $326,198 $17.68 $47,600Henderson 46,407 $2,532,740 $27,700 $0 $164,346 $2,724,786 $58.71 $2,110,163 $45.47 $84,165Henry 15,620 $771,731 $15,618 $0 $25,569 $812,918 $52.04 $612,015 $39.18 $61,333Hickman 4,612 $2,400 $11,312 $0 $0 $13,712 $2.97 $19,602 $4.25 $4,320Hopkins 46,222 $463,000 $27,442 $4,623 $63,723 $558,788 $12.09 $481,779 $10.42 $42,494Jackson 13,352 $394,563 $14,930 $0 $17,106 $426,599 $31.95 $518,428 $38.83 $45,968Jefferson 763,623 $17,260,520 $311,797 $0 $379,154 $17,951,471 $23.51 $18,293,942 $23.96 $135,002Jessamine 51,961 $4,296,669 $25,156 $0 $83,705 $4,405,530 $84.79 $3,513,707 $67.62 $90,000Johnson 23,175 $937,332 $18,303 $0 $8,669 $964,304 $41.61 $641,502 $27.68 $52,471Kenton 165,012 $13,044,285 $150,285 $0 $213,609 $13,408,179 $81.26 $11,124,902 $67.42 $123,508Knott 15,693 $49,351 $16,756 $500 $2,304 $68,911 $4.39 $63,242 $4.03 $27,118Knox 31,730 $569,180 $21,972 $0 $12,547 $603,699 $19.03 $415,922 $13.11 $62,709LaRue 14,241 $448,216 $14,877 $0 $7,518 $470,611 $33.05 $343,082 $24.09 $35,000
KENTUCKY PUBLIC LIBRARY STATISTICS, 2015-2016 -10
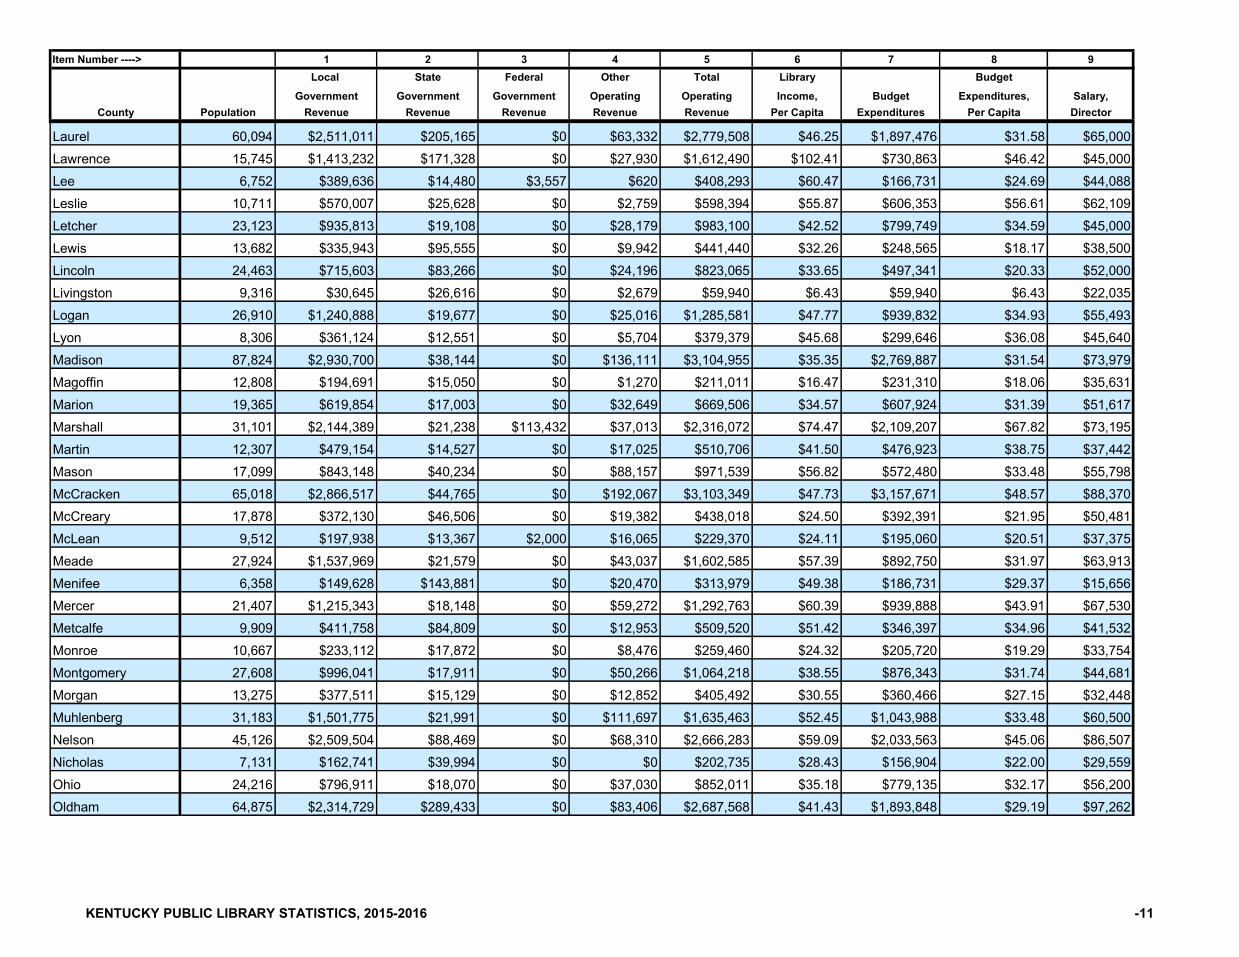
Item Number ----> 1 2 3 4 5 6 7 8 9Local State Federal Other Total Library Budget
Government Government Government Operating Operating Income, Budget Expenditures, Salary,County Population Revenue Revenue Revenue Revenue Revenue Per Capita Expenditures Per Capita Director
Laurel 60,094 $2,511,011 $205,165 $0 $63,332 $2,779,508 $46.25 $1,897,476 $31.58 $65,000Lawrence 15,745 $1,413,232 $171,328 $0 $27,930 $1,612,490 $102.41 $730,863 $46.42 $45,000Lee 6,752 $389,636 $14,480 $3,557 $620 $408,293 $60.47 $166,731 $24.69 $44,088Leslie 10,711 $570,007 $25,628 $0 $2,759 $598,394 $55.87 $606,353 $56.61 $62,109Letcher 23,123 $935,813 $19,108 $0 $28,179 $983,100 $42.52 $799,749 $34.59 $45,000Lewis 13,682 $335,943 $95,555 $0 $9,942 $441,440 $32.26 $248,565 $18.17 $38,500Lincoln 24,463 $715,603 $83,266 $0 $24,196 $823,065 $33.65 $497,341 $20.33 $52,000Livingston 9,316 $30,645 $26,616 $0 $2,679 $59,940 $6.43 $59,940 $6.43 $22,035Logan 26,910 $1,240,888 $19,677 $0 $25,016 $1,285,581 $47.77 $939,832 $34.93 $55,493Lyon 8,306 $361,124 $12,551 $0 $5,704 $379,379 $45.68 $299,646 $36.08 $45,640Madison 87,824 $2,930,700 $38,144 $0 $136,111 $3,104,955 $35.35 $2,769,887 $31.54 $73,979Magoffin 12,808 $194,691 $15,050 $0 $1,270 $211,011 $16.47 $231,310 $18.06 $35,631Marion 19,365 $619,854 $17,003 $0 $32,649 $669,506 $34.57 $607,924 $31.39 $51,617Marshall 31,101 $2,144,389 $21,238 $113,432 $37,013 $2,316,072 $74.47 $2,109,207 $67.82 $73,195Martin 12,307 $479,154 $14,527 $0 $17,025 $510,706 $41.50 $476,923 $38.75 $37,442Mason 17,099 $843,148 $40,234 $0 $88,157 $971,539 $56.82 $572,480 $33.48 $55,798McCracken 65,018 $2,866,517 $44,765 $0 $192,067 $3,103,349 $47.73 $3,157,671 $48.57 $88,370McCreary 17,878 $372,130 $46,506 $0 $19,382 $438,018 $24.50 $392,391 $21.95 $50,481McLean 9,512 $197,938 $13,367 $2,000 $16,065 $229,370 $24.11 $195,060 $20.51 $37,375Meade 27,924 $1,537,969 $21,579 $0 $43,037 $1,602,585 $57.39 $892,750 $31.97 $63,913Menifee 6,358 $149,628 $143,881 $0 $20,470 $313,979 $49.38 $186,731 $29.37 $15,656Mercer 21,407 $1,215,343 $18,148 $0 $59,272 $1,292,763 $60.39 $939,888 $43.91 $67,530Metcalfe 9,909 $411,758 $84,809 $0 $12,953 $509,520 $51.42 $346,397 $34.96 $41,532Monroe 10,667 $233,112 $17,872 $0 $8,476 $259,460 $24.32 $205,720 $19.29 $33,754Montgomery 27,608 $996,041 $17,911 $0 $50,266 $1,064,218 $38.55 $876,343 $31.74 $44,681Morgan 13,275 $377,511 $15,129 $0 $12,852 $405,492 $30.55 $360,466 $27.15 $32,448Muhlenberg 31,183 $1,501,775 $21,991 $0 $111,697 $1,635,463 $52.45 $1,043,988 $33.48 $60,500Nelson 45,126 $2,509,504 $88,469 $0 $68,310 $2,666,283 $59.09 $2,033,563 $45.06 $86,507Nicholas 7,131 $162,741 $39,994 $0 $0 $202,735 $28.43 $156,904 $22.00 $29,559Ohio 24,216 $796,911 $18,070 $0 $37,030 $852,011 $35.18 $779,135 $32.17 $56,200Oldham 64,875 $2,314,729 $289,433 $0 $83,406 $2,687,568 $41.43 $1,893,848 $29.19 $97,262
KENTUCKY PUBLIC LIBRARY STATISTICS, 2015-2016 -11

Item Number ----> 1 2 3 4 5 6 7 8 9Local State Federal Other Total Library Budget
Government Government Government Operating Operating Income, Budget Expenditures, Salary,County Population Revenue Revenue Revenue Revenue Revenue Per Capita Expenditures Per Capita Director
Owen 10,730 $674,121 $13,635 $10,800 $14,926 $713,482 $66.49 $797,222 $74.30 $64,585Owsley 4,461 $144,114 $18,766 $0 $17,715 $180,595 $40.48 $146,917 $32.93 $30,600Pendleton 14,408 $719,190 $15,324 $0 $29,910 $764,424 $53.06 $526,456 $36.54 $46,149Perry 27,565 $2,178,990 $20,915 $0 $56,097 $2,256,002 $81.84 $1,644,436 $59.66 $74,893Pike 61,792 $2,718,558 $37,205 $0 $151,281 $2,907,044 $47.05 $1,979,710 $32.04 $91,296Powell 12,269 $272,942 $15,172 $0 $14,934 $303,048 $24.70 $276,783 $22.56 $37,046Pulaski 63,782 $2,492,329 $74,704 $0 $74,064 $2,641,097 $41.41 $1,591,947 $24.96 $56,042Robertson 2,138 $124,539 $65,419 $0 $25,215 $215,173 $100.64 $153,702 $71.89 $35,923Rockcastle 16,942 $376,273 $16,287 $0 $7,405 $399,965 $23.61 $288,530 $17.03 $32,396Rowan 23,892 $1,253,935 $232,709 $0 $66,026 $1,552,670 $64.99 $1,021,916 $42.77 $64,385Russell 17,662 $642,203 $16,169 $0 $28,178 $686,550 $38.87 $533,801 $30.22 $40,000Scott 52,420 $2,537,297 $22,528 $0 $44,665 $2,604,490 $49.69 $2,165,484 $41.31 $79,433Shelby 45,632 $1,214,041 $22,650 $0 $54,394 $1,291,085 $28.29 $881,329 $19.31 $73,493Simpson 18,006 $809,713 $16,209 $2,000 $49,917 $877,839 $48.75 $648,525 $36.02 $43,709Spencer 17,894 $540,918 $154,170 $0 $21,432 $716,520 $40.04 $459,630 $25.69 $52,008Taylor 25,420 $1,015,334 $23,304 $0 $26,403 $1,065,041 $41.90 $727,098 $28.60 $21,425Todd 12,531 $289,390 $16,599 $0 $9,664 $315,653 $25.19 $210,835 $16.83 $38,681Trigg 14,233 $382,460 $14,536 $3,230 $53,761 $453,987 $31.90 $403,178 $28.33 $38,500Trimble 8,769 $639,701 $12,570 $0 $18,442 $670,713 $76.49 $498,271 $56.82 $41,500Union 15,050 $775,376 $15,872 $0 $16,239 $807,487 $53.65 $716,167 $47.59 $60,702Warren 122,851 $3,734,103 $47,658 $0 $140,048 $3,921,809 $31.92 $3,128,155 $25.46 $99,828Washington 12,063 $482,610 $103,797 $0 $13,616 $600,023 $49.74 $397,487 $32.95 $60,530Wayne 20,464 $738,526 $86,755 $0 $20,029 $845,310 $41.31 $764,705 $37.37 $52,527Webster 13,170 $385,889 $15,205 $0 $5,641 $406,735 $30.88 $399,123 $30.31 $30,050Whitley 36,129 $701,908 $23,761 $0 $25,860 $751,529 $20.80 $634,850 $17.57 $55,211Wolfe 7,259 $291,590 $69,105 $0 $6,127 $366,822 $50.53 $206,274 $28.42 $30,000Woodford 25,793 $1,556,240 $18,199 $0 $72,078 $1,646,517 $63.84 $1,371,012 $53.15 $87,389
Total: 4,425,092 $172,109,461 $5,858,645 $281,379 $7,013,982 $185,263,467 $41.87 $149,538,441 $33.79 $6,433,072Previous Year,FY 2014-2015: 4,413,457 $167,707,494 $6,101,708 $708,556 $8,703,449 $183,221,207 $41.51 $143,187,272 $32.44 $6,376,540
KENTUCKY PUBLIC LIBRARY STATISTICS, 2015-2016 -12

Item Number ---->
County
AdairAllenAndersonBal/CarBarrenBathBellBooneBourbonBoydBoyleBrackenBreathittBreckinridgeBullittButlerCaldwellCallowayCampbellCarrollCarterCaseyChristianClarkClayClintonCrittendenCumberlandDaviessEdmonson
10 11 12 13 14 15 16 17Total Print Electronic Audiovisual Electronic Collection
Total Fringe Staff Materials Materials Materials Collections ExpendituresSalaries Benefits Expense Expense Expense Expenditures Expenditures Total
$151,945 $40,483 $192,428 $20,951 $3,000 $928 $6,232 $31,111$251,528 $98,889 $350,417 $58,884 $45,276 $14,389 $18,491 $137,040$300,779 $140,075 $440,854 $61,222 $26,845 $22,410 $21,320 $131,797
$8,301 $9,789 $18,090 $159 $0 $0 $0 $159$288,776 $99,516 $388,292 $43,242 $16,610 $8,820 $37,826 $108,611$214,552 $58,563 $273,115 $22,935 $5,772 $4,118 $1,756 $34,581$331,834 $147,243 $479,077 $46,120 $2,000 $5,945 $10,505 $64,570
$3,434,291 $1,169,511 $4,603,802 $370,807 $154,551 $183,966 $134,275 $905,632$362,239 $137,606 $499,845 $93,142 $8,579 $20,193 $6,535 $128,449
$1,001,858 $497,206 $1,499,064 $309,985 $78,784 $174,950 $115,965 $680,425$698,176 $181,246 $879,422 $67,776 $10,768 $24,757 $19,567 $128,896$105,756 $23,631 $129,387 $26,466 $15,480 $8,571 $11,083 $64,028$117,599 $137,658 $255,257 $24,499 $345 $5,234 $0 $33,862$215,561 $114,313 $329,874 $80,895 $19,733 $30,035 $10,502 $145,478
$1,651,022 $598,723 $2,249,745 $291,721 $50,480 $112,668 $62,461 $530,130$145,714 $19,523 $165,237 $36,094 $2,100 $6,120 $8,563 $55,937$157,556 $49,432 $206,988 $24,704 $0 $215 $1,205 $26,236$389,147 $147,554 $536,701 $124,061 $27,514 $29,140 $33,506 $282,928
$2,128,476 $710,181 $2,838,657 $280,121 $47,102 $151,566 $165,634 $644,423$351,215 $115,947 $467,162 $66,960 $5,765 $28,113 $13,990 $114,828$50,620 $4,496 $55,116 $919 $0 $0 $0 $919
$265,566 $90,982 $356,548 $39,482 $53 $6,333 $11,197 $57,384$278,981 $85,402 $364,383 $46,696 $6,378 $14,881 $25,396 $93,351$875,607 $376,823 $1,252,430 $105,615 $22,727 $72,958 $0 $236,469$148,126 $41,390 $189,516 $75,008 $2,163 $6,703 $4,468 $90,073$82,743 $41,371 $124,114 $14,593 $4,200 $3,125 $1,014 $24,057$84,018 $23,987 $108,005 $31,995 $769 $1,737 $3,815 $38,316
$108,248 $48,856 $157,104 $25,099 $1,295 $46 $5,650 $32,137$1,627,455 $513,488 $2,140,943 $226,722 $113,536 $64,812 $89,283 $495,751
$196,273 $32,050 $228,323 $28,191 $3,152 $5,688 $3,701 $43,304
KENTUCKY PUBLIC LIBRARY STATISTICS, 2015-2016 -13

Item Number ---->
County
AdairElliottEstillFayetteFlemingFloydFranklinFultonGallatinGarrardGrantGravesGraysonGreenGreenupHancockHardinHarlanHarrisonHartHendersonHenryHickmanHopkinsJacksonJeffersonJessamineJohnsonKentonKnottKnoxLaRue
10 11 12 13 14 15 16 17Total Print Electronic Audiovisual Electronic Collection
Total Fringe Staff Materials Materials Materials Collections ExpendituresSalaries Benefits Expense Expense Expense Expenditures Expenditures Total
$13,920 $0 $13,920 $642 $211 $30 $0 $955$199,381 $81,035 $280,416 $31,446 $5,723 $7,967 $6,250 $54,572
$6,603,976 $2,162,637 $8,766,613 $969,550 $266,762 $365,246 $258,187 $1,998,121$186,911 $68,397 $255,308 $27,039 $8,200 $2,718 $7,483 $47,274$448,286 $129,578 $577,864 $82,425 $47,930 $42,198 $42,198 $214,751
$1,356,753 $494,161 $1,850,914 $207,179 $106,981 $106,783 $17,050 $437,993$130,116 $30,778 $160,894 $23,813 $0 $3,599 $0 $35,006$223,822 $114,085 $337,907 $41,714 $3,000 $13,151 $3,355 $61,220$183,724 $65,174 $248,898 $36,637 $9,227 $4,208 $3,493 $53,565$478,638 $247,397 $726,035 $76,914 $22,034 $10,813 $8,590 $118,351$232,441 $137,515 $369,956 $69,016 $19,239 $5,677 $2,489 $103,847$241,355 $118,259 $359,614 $66,193 $5,934 $11,768 $21,628 $109,969$148,761 $53,846 $202,607 $45,526 $2,175 $10,154 $11,592 $72,361$566,219 $49,899 $616,118 $116,332 $30,430 $71,052 $14,946 $232,760$207,946 $62,622 $270,568 $29,697 $7,268 $13,565 $15,695 $66,225$436,564 $168,885 $605,449 $80,029 $12,912 $13,593 $22,790 $129,324$384,398 $156,185 $540,583 $73,018 $5,250 $8,285 $22,760 $115,463$333,641 $102,824 $436,465 $45,490 $7,028 $19,589 $13,523 $93,549$171,616 $30,124 $201,740 $21,284 $0 $1,280 $1,663 $29,382$940,760 $410,327 $1,351,087 $207,023 $81,114 $37,450 $54,676 $380,263$282,815 $115,999 $398,814 $40,950 $2,037 $12,033 $6,636 $65,133
$4,320 $928 $5,248 $1,421 $80 $0 $0 $1,501$227,557 $36,294 $263,851 $33,169 $4,291 $7,797 $3,482 $49,751$292,392 $81,139 $373,531 $31,434 $2,580 $2,101 $3,859 $42,483
$9,474,172 $3,324,957 $12,799,129 $1,543,258 $286,050 $244,773 $287,767 $2,385,179$1,356,174 $515,616 $1,871,790 $268,834 $71,712 $155,518 $89,012 $629,570
$246,261 $104,194 $350,455 $39,467 $8,048 $6,495 $19,044 $78,514$5,717,351 $1,851,186 $7,568,537 $664,366 $333,878 $406,899 $220,252 $1,627,714
$39,088 $10,262 $49,350 $4,832 $0 $757 $1,014 $6,735$205,129 $60,734 $265,863 $36,260 $8,437 $2,694 $2,456 $49,847$152,665 $72,161 $224,826 $30,918 $5,959 $7,517 $6,255 $52,003
KENTUCKY PUBLIC LIBRARY STATISTICS, 2015-2016 -14

Item Number ---->
County
AdairLaurelLawrenceLeeLeslieLetcherLewisLincolnLivingstonLoganLyonMadisonMagoffinMarionMarshallMartinMasonMcCrackenMcCrearyMcLeanMeadeMenifeeMercerMetcalfeMonroeMontgomeryMorganMuhlenbergNelsonNicholasOhioOldham
10 11 12 13 14 15 16 17Total Print Electronic Audiovisual Electronic Collection
Total Fringe Staff Materials Materials Materials Collections ExpendituresSalaries Benefits Expense Expense Expense Expenditures Expenditures Total
$826,599 $394,137 $1,220,736 $120,351 $64,762 $43,129 $23,897 $252,139$223,168 $65,938 $289,106 $28,966 $3,633 $2,058 $9,213 $47,510$109,517 $24,556 $134,073 $6,865 $0 $4,817 $990 $12,672$272,662 $94,655 $367,317 $40,014 $11,120 $34,621 $2,797 $88,552$297,774 $131,177 $428,951 $82,059 $3,000 $11,792 $17,582 $114,433$102,505 $49,562 $152,067 $32,185 $4,198 $487 $6,555 $43,425$199,846 $89,019 $288,865 $35,509 $3,480 $12,346 $11,147 $62,482$37,695 $3,054 $40,749 $5,121 $0 $0 $0 $6,321
$523,848 $192,155 $716,003 $44,646 $2,254 $28,832 $7,466 $83,486$128,109 $63,539 $191,648 $11,064 $3,000 $2,157 $2,687 $18,908
$1,151,987 $525,252 $1,677,239 $209,243 $25,208 $81,814 $43,640 $360,563$65,563 $34,721 $100,284 $9,286 $1,245 $126 $0 $10,657
$288,539 $73,169 $361,708 $48,790 $3,546 $11,799 $4,211 $68,346$922,920 $418,970 $1,341,890 $103,683 $17,931 $48,178 $64,066 $240,163$194,165 $97,189 $291,354 $46,487 $12,255 $15,355 $6,090 $80,876$229,830 $90,237 $320,067 $50,040 $4,200 $11,950 $3,251 $69,441
$1,284,060 $497,000 $1,781,060 $332,297 $80,492 $224,486 $52,625 $689,900$196,476 $46,255 $242,731 $31,894 $9,336 $12,656 $3,000 $56,886$64,029 $35,295 $99,324 $8,560 $4,500 $2,197 $4,284 $21,056
$374,113 $96,845 $470,958 $88,549 $4,200 $35,036 $13,343 $141,250$53,637 $48,950 $102,587 $10,249 $0 $2,718 $168 $13,135
$456,970 $210,505 $667,475 $52,187 $4,200 $20,059 $6,210 $82,698$162,623 $38,625 $201,248 $21,089 $8,629 $12,786 $1,239 $46,302$109,084 $28,684 $137,768 $21,843 $750 $2,213 $2,512 $27,530$381,362 $134,562 $515,924 $68,698 $3,607 $9,569 $15,463 $97,337$155,952 $91,612 $247,564 $21,058 $4,500 $1,814 $3,050 $30,422$448,502 $231,339 $679,841 $86,343 $4,667 $9,862 $10,222 $111,094
$1,010,428 $409,629 $1,420,057 $149,713 $10,045 $33,152 $29,475 $228,787$80,343 $18,675 $99,018 $26,009 $4,465 $410 $3,200 $35,156
$384,423 $162,884 $547,307 $52,742 $11,206 $14,488 $14,636 $93,072$1,033,983 $311,457 $1,345,440 $90,129 $22,255 $27,505 $3,056 $152,179
KENTUCKY PUBLIC LIBRARY STATISTICS, 2015-2016 -15

Item Number ---->
County
AdairOwenOwsleyPendletonPerryPikePowellPulaskiRobertsonRockcastleRowanRussellScottShelbySimpsonSpencerTaylorToddTriggTrimbleUnionWarrenWashingtonWayneWebsterWhitleyWolfeWoodford
Total: Previous Year,FY 2014-2015:
10 11 12 13 14 15 16 17Total Print Electronic Audiovisual Electronic Collection
Total Fringe Staff Materials Materials Materials Collections ExpendituresSalaries Benefits Expense Expense Expense Expenditures Expenditures Total
$339,530 $169,764 $509,294 $52,550 $5,367 $4,319 $24,025 $86,261$79,244 $26,527 $105,771 $9,600 $0 $5,800 $1,067 $16,467
$233,274 $81,819 $315,093 $36,574 $4,200 $11,833 $6,381 $62,085$609,150 $348,443 $957,593 $109,133 $71,168 $68,902 $31,915 $281,118$754,742 $268,167 $1,022,909 $104,501 $17,928 $18,136 $34,438 $176,468$141,538 $39,160 $180,698 $11,907 $3,000 $1,044 $2,187 $18,138$656,525 $312,712 $969,237 $116,532 $11,185 $5,255 $13,998 $151,227$75,375 $10,386 $85,761 $8,522 $2,289 $2,009 $189 $13,009
$131,182 $44,614 $175,796 $14,907 $3,000 $1,514 $2,801 $23,098$450,117 $142,475 $592,592 $66,549 $6,870 $46,952 $29,771 $162,990$248,348 $109,816 $358,164 $24,505 $3,000 $667 $7,695 $35,867$966,231 $385,058 $1,351,289 $104,375 $23,332 $48,741 $60,133 $259,476$360,644 $125,422 $486,066 $60,636 $8,232 $6,362 $30,000 $105,230$207,989 $85,732 $293,721 $39,770 $20,285 $17,006 $2,851 $79,912$189,857 $81,305 $271,162 $25,162 $5,777 $6,570 $6,786 $44,295$322,927 $143,102 $466,029 $79,800 $6,450 $9,068 $4,200 $116,418$124,939 $10,753 $135,692 $19,344 $1,750 $659 $1,370 $23,123$131,726 $107,590 $239,316 $48,390 $8,020 $11,201 $6,803 $75,675$195,796 $101,133 $296,929 $28,050 $5,127 $8,368 $3,223 $44,768$364,648 $102,313 $466,961 $53,440 $6,169 $10,259 $7,728 $77,596
$1,369,231 $580,711 $1,949,942 $203,648 $156,026 $107,646 $56,655 $523,975$188,759 $67,151 $255,910 $28,491 $6,000 $7,844 $4,516 $46,851$230,955 $129,805 $360,760 $24,303 $6,700 $7,091 $9,157 $47,251$170,209 $92,601 $262,810 $44,652 $0 $19,543 $5,500 $69,695$204,802 $48,873 $253,675 $44,434 $7,702 $12,239 $15,595 $88,439$103,855 $18,902 $122,757 $21,776 $4,529 $2,579 $3,000 $34,734$668,673 $220,643 $889,316 $101,651 $18,855 $19,152 $16,712 $156,370
$68,802,092 $25,177,756 $93,979,848 $11,009,811 $2,785,112 $3,783,302 $2,746,856 $20,911,577
$66,068,552 $24,481,791 $90,550,343 $11,302,055 $2,339,658 $3,719,224 $2,456,328 $20,380,389
KENTUCKY PUBLIC LIBRARY STATISTICS, 2015-2016 -16
Item Number ---->
County
AdairAllenAndersonBal/CarBarrenBathBellBooneBourbonBoydBoyleBrackenBreathittBreckinridgeBullittButlerCaldwellCallowayCampbellCarrollCarterCaseyChristianClarkClayClintonCrittendenCumberlandDaviessEdmonson
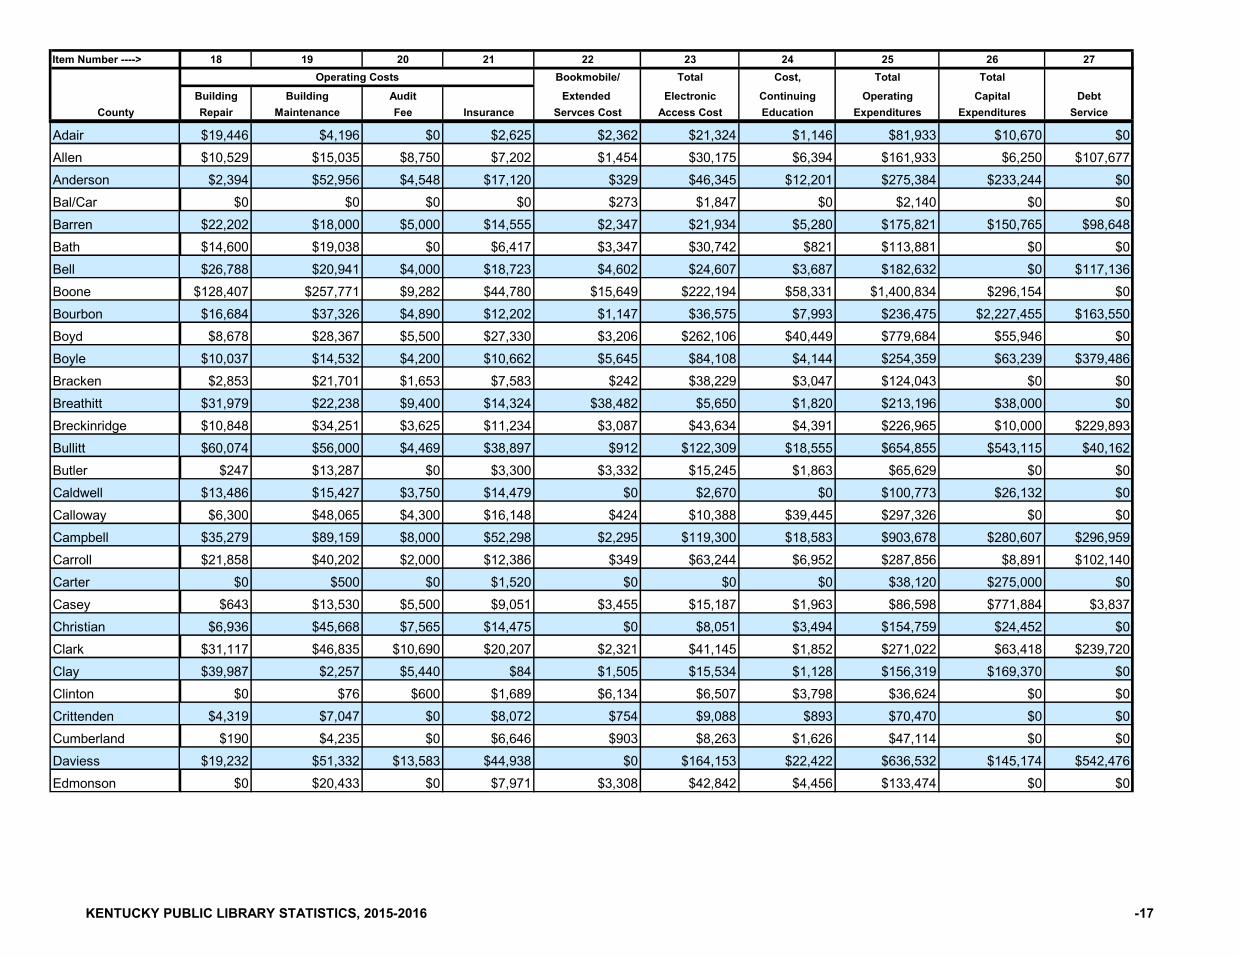
18 19 20 21 22 23 24 25 26 27Bookmobile/ Total Cost, Total Total
Building Building Audit Extended Electronic Continuing Operating Capital DebtRepair Maintenance Fee Insurance Servces Cost Access Cost Education Expenditures Expenditures Service
$19,446 $4,196 $0 $2,625 $2,362 $21,324 $1,146 $81,933 $10,670 $0$10,529 $15,035 $8,750 $7,202 $1,454 $30,175 $6,394 $161,933 $6,250 $107,677$2,394 $52,956 $4,548 $17,120 $329 $46,345 $12,201 $275,384 $233,244 $0
$0 $0 $0 $0 $273 $1,847 $0 $2,140 $0 $0$22,202 $18,000 $5,000 $14,555 $2,347 $21,934 $5,280 $175,821 $150,765 $98,648$14,600 $19,038 $0 $6,417 $3,347 $30,742 $821 $113,881 $0 $0$26,788 $20,941 $4,000 $18,723 $4,602 $24,607 $3,687 $182,632 $0 $117,136
$128,407 $257,771 $9,282 $44,780 $15,649 $222,194 $58,331 $1,400,834 $296,154 $0$16,684 $37,326 $4,890 $12,202 $1,147 $36,575 $7,993 $236,475 $2,227,455 $163,550$8,678 $28,367 $5,500 $27,330 $3,206 $262,106 $40,449 $779,684 $55,946 $0
$10,037 $14,532 $4,200 $10,662 $5,645 $84,108 $4,144 $254,359 $63,239 $379,486$2,853 $21,701 $1,653 $7,583 $242 $38,229 $3,047 $124,043 $0 $0
$31,979 $22,238 $9,400 $14,324 $38,482 $5,650 $1,820 $213,196 $38,000 $0$10,848 $34,251 $3,625 $11,234 $3,087 $43,634 $4,391 $226,965 $10,000 $229,893$60,074 $56,000 $4,469 $38,897 $912 $122,309 $18,555 $654,855 $543,115 $40,162
$247 $13,287 $0 $3,300 $3,332 $15,245 $1,863 $65,629 $0 $0$13,486 $15,427 $3,750 $14,479 $0 $2,670 $0 $100,773 $26,132 $0$6,300 $48,065 $4,300 $16,148 $424 $10,388 $39,445 $297,326 $0 $0
$35,279 $89,159 $8,000 $52,298 $2,295 $119,300 $18,583 $903,678 $280,607 $296,959$21,858 $40,202 $2,000 $12,386 $349 $63,244 $6,952 $287,856 $8,891 $102,140
$0 $500 $0 $1,520 $0 $0 $0 $38,120 $275,000 $0$643 $13,530 $5,500 $9,051 $3,455 $15,187 $1,963 $86,598 $771,884 $3,837
$6,936 $45,668 $7,565 $14,475 $0 $8,051 $3,494 $154,759 $24,452 $0$31,117 $46,835 $10,690 $20,207 $2,321 $41,145 $1,852 $271,022 $63,418 $239,720$39,987 $2,257 $5,440 $84 $1,505 $15,534 $1,128 $156,319 $169,370 $0
$0 $76 $600 $1,689 $6,134 $6,507 $3,798 $36,624 $0 $0$4,319 $7,047 $0 $8,072 $754 $9,088 $893 $70,470 $0 $0
$190 $4,235 $0 $6,646 $903 $8,263 $1,626 $47,114 $0 $0$19,232 $51,332 $13,583 $44,938 $0 $164,153 $22,422 $636,532 $145,174 $542,476
$0 $20,433 $0 $7,971 $3,308 $42,842 $4,456 $133,474 $0 $0
Operating Costs
KENTUCKY PUBLIC LIBRARY STATISTICS, 2015-2016 -17

Item Number ---->
County
AdairElliottEstillFayetteFlemingFloydFranklinFultonGallatinGarrardGrantGravesGraysonGreenGreenupHancockHardinHarlanHarrisonHartHendersonHenryHickmanHopkinsJacksonJeffersonJessamineJohnsonKentonKnottKnoxLaRue
18 19 20 21 22 23 24 25 26 27Bookmobile/ Total Cost, Total Total
Building Building Audit Extended Electronic Continuing Operating Capital DebtRepair Maintenance Fee Insurance Servces Cost Access Cost Education Expenditures Expenditures Service
Operating Costs
$400 $629 $0 $0 $0 $0 $0 $10,484 $0 $0$3,078 $22,130 $3,975 $7,268 $8,923 $9,183 $3,708 $103,914 $0 $0
$240,587 $375,970 $21,000 $141,597 $14,372 $371,206 $51,994 $2,531,171 $4,646,283 $3,371,262$8,897 $24,692 $4,300 $15,016 $961 $35,298 $5,632 $155,971 $0 $143,870
$13,421 $49,093 $4,000 $19,442 $3,989 $22,322 $8,247 $233,524 $0 $0$785 $67,952 $5,000 $31,724 $2,007 $200,467 $13,831 $670,804 $22,805 $0
$1,526 $3,442 $0 $8,209 $366 $13,169 $5,856 $79,108 $0 $0$8,962 $27,366 $4,200 $10,925 $3,171 $36,836 $2,076 $205,878 $0 $57,520
$16,080 $17,799 $4,000 $8,170 $2,553 $25,586 $1,312 $262,353 $840,006 $0$211 $49,337 $5,000 $14,700 $0 $48,905 $11,242 $213,503 $47,949 $69,490
$2,732 $22,353 $0 $10,936 $5,364 $58,217 $1,126 $180,894 $130,927 $0$14,952 $34,152 $3,500 $17,093 $512 $29,312 $4,960 $284,655 $240,149 $0
$405 $15,462 $3,900 $1,518 $0 $6,642 $4,970 $110,330 $3,871 $0$92,065 $17,872 $6,450 $24,834 $3,131 $86,897 $1,257 $400,601 $53,331 $44,955$15,220 $27,421 $0 $9,976 $984 $35,755 $6,194 $182,104 $0 $128,000$1,407 $53,767 $0 $14,453 $3,464 $37,938 $1,420 $183,706 $0 $0
$0 $27,258 $15,900 $27,239 $2,175 $28,119 $5,622 $193,774 $1,282,460 $0$11,815 $3,741 $4,050 $1,333 $4,181 $40,352 $2,477 $145,916 $0 $0
$0 $3,465 $3,500 $11,749 $14,001 $10,084 $5,152 $95,076 $203,449 $35,374$48,117 $30,729 $5,600 $22,615 $8,468 $105,686 $7,162 $378,813 $76,570 $0$5,009 $24,837 $3,826 $11,364 $1,516 $30,004 $4,016 $148,068 $0 $0
$0 $1,507 $0 $1,680 $5,000 $0 $500 $12,853 $0 $0$10,192 $700 $2,500 $7,499 $4,447 $6,693 $2,296 $168,177 $315,538 $41,591$1,576 $1,575 $3,500 $7,471 $765 $2,510 $959 $102,414 $0 $0
$245,331 $1,022,911 $0 $8,470 $3,666 $554,081 $2,938 $3,109,634 $4,307,353 $460,000$47,597 $32,553 $4,212 $31,373 $4,305 $83,531 $42,405 $1,012,347 $99,401 $204,019$13,474 $5,630 $5,500 $15,393 $4,441 $441 $2,678 $212,533 $49,586 $0
$129,488 $289,877 $9,025 $68,966 $5,753 $201,658 $75,219 $1,928,651 $237,880 $1,245,923$0 $199 $0 $2,468 $0 $0 $0 $7,157 $0 $0
$2,983 $1,942 $5,000 $21,049 $1,341 $25,395 $2,301 $100,212 $15,319 $0$3,259 $9,517 $0 $11,930 $3,280 $1,232 $3,336 $66,253 $1,330 $0
KENTUCKY PUBLIC LIBRARY STATISTICS, 2015-2016 -18

Item Number ---->
County
AdairLaurelLawrenceLeeLeslieLetcherLewisLincolnLivingstonLoganLyonMadisonMagoffinMarionMarshallMartinMasonMcCrackenMcCrearyMcLeanMeadeMenifeeMercerMetcalfeMonroeMontgomeryMorganMuhlenbergNelsonNicholasOhioOldham
18 19 20 21 22 23 24 25 26 27Bookmobile/ Total Cost, Total Total
Building Building Audit Extended Electronic Continuing Operating Capital DebtRepair Maintenance Fee Insurance Servces Cost Access Cost Education Expenditures Expenditures Service
Operating Costs
$25,868 $20,486 $4,500 $23,190 $2,799 $142,332 $11,350 $424,601 $2,753,052 $392,359$5,137 $35,176 $4,500 $11,487 $6,667 $26,470 $13,898 $394,247 $35,472 $0
$0 $71 $0 $4,367 $0 $5,640 $658 $19,986 $4,767 $0$1,034 $14,764 $7,075 $12,253 $7,688 $20,462 $2,370 $150,484 $0 $0
$43,318 $18,505 $6,300 $14,136 $0 $20,830 $5,432 $256,365 $48,686 $0$0 $7,640 $2,100 $9,568 $2,727 $1,508 $1,272 $53,073 $0 $78,022
$6,492 $33,465 $5,243 $11,145 $2,918 $10,034 $6,185 $145,994 $7,532 $251,618$0 $0 $0 $0 $0 $0 $0 $12,870 $0 $0
$587 $17,003 $9,394 $13,820 $1,580 $19,761 $5,435 $140,343 $0 $151,183$5,204 $11,694 $0 $3,793 $2,693 $25,057 $2,286 $89,090 $3,420 $0
$23,446 $99,780 $5,355 $44,671 $15,660 $68,733 $10,248 $732,085 $27,145 $379,705$0 $2,431 $5,000 $213 $0 $0 $0 $120,369 $1,065,578 $0
$10,947 $21,961 $3,900 $7,981 $22,448 $25,528 $5,250 $177,870 $0 $0$4,897 $66,274 $3,900 $36,257 $2,715 $53,863 $20,716 $527,154 $544,309 $0
$939 $5,388 $4,000 $10,003 $3,589 $12,255 $2,749 $104,693 $53,611 $0$12,052 $24,153 $5,400 $8,976 $933 $20,317 $1,405 $182,972 $257 $0$64,066 $44,320 $6,825 $26,666 $0 $146,916 $56,360 $686,711 $0 $0$4,090 $16,268 $4,500 $8,295 $2,555 $8,364 $3,382 $92,774 $0 $34,147$3,142 $4,219 $0 $4,056 $3,636 $15,218 $2,471 $74,680 $500 $0$3,425 $58,632 $4,527 $21,374 $896 $41,646 $5,628 $280,542 $14,088 $2,729,111$9,218 $5,621 $5,000 $5,485 $0 $12,088 $0 $71,009 $0 $131,906$3,610 $24,636 $4,300 $14,690 $5,340 $20,611 $2,502 $189,715 $10,143 $167,393
$0 $19,039 $6,000 $5,917 $3,701 $9,438 $1,525 $98,847 $0 $71,654$1,725 $1,715 $0 $7,640 $546 $2,326 $510 $40,422 $0 $0
$22,658 $3,075 $3,000 $11,015 $2,285 $26,145 $3,489 $263,082 $645,563 $1,241$0 $14,501 $2,500 $8,922 $761 $16,945 $1,153 $82,480 $29,541 $0
$14,259 $39,810 $0 $17,815 $0 $72,365 $5,413 $253,053 $1,435 $0$31,311 $96,060 $5,350 $17,157 $4,287 $44,706 $13,411 $384,719 $0 $345,293
$0 $2,099 $1,500 $5,126 $142 $1,500 $0 $22,730 $0 $0$0 $20,831 $500 $7,963 $4,290 $13,108 $2,984 $138,756 $83,708 $0
$22,945 $47,038 $4,455 $34,231 $2,018 $102,036 $7,658 $396,229 $0 $352,298
KENTUCKY PUBLIC LIBRARY STATISTICS, 2015-2016 -19
Item Number ---->
County
AdairOwenOwsleyPendletonPerryPikePowellPulaskiRobertsonRockcastleRowanRussellScottShelbySimpsonSpencerTaylorToddTriggTrimbleUnionWarrenWashingtonWayneWebsterWhitleyWolfeWoodford
Total: Previous Year,FY 2014-2015:
18 19 20 21 22 23 24 25 26 27Bookmobile/ Total Cost, Total Total
Building Building Audit Extended Electronic Continuing Operating Capital DebtRepair Maintenance Fee Insurance Servces Cost Access Cost Education Expenditures Expenditures Service
Operating Costs
$945 $26,187 $6,000 $14,095 $833 $39,673 $2,144 $201,667 $0 $89,719$1,300 $600 $0 $6,067 $0 $250 $0 $24,679 $0 $0$2,819 $22,128 $4,518 $8,745 $1,540 $25,067 $3,452 $149,278 $9,158 $147,991$6,520 $47,800 $7,850 $27,405 $5,954 $60,728 $15,303 $405,725 $43,600 $0
$59,847 $128,334 $8,500 $48,915 $0 $228,004 $4,642 $780,333 $55,930 $417,880$9,100 $1,036 $0 $4,220 $3,052 $15,149 $5,434 $77,947 $0 $0
$21,411 $23,412 $9,560 $33,399 $1,191 $40,933 $6,636 $471,483 $15,655 $857,672$3,508 $22,881 $0 $2,369 $0 $7,609 $758 $54,932 $0 $9,926
$15,454 $15,748 $0 $4,723 $2,178 $15,113 $1,252 $89,636 $0 $0$7,263 $16,349 $4,500 $14,290 $10,885 $61,810 $4,588 $266,334 $52,197 $304,117
$36,814 $13,833 $6,508 $6,374 $0 $29,525 $8,105 $139,770 $0 $0$0 $78,035 $8,000 $29,595 $1,920 $83,213 $20,967 $554,719 $4,301,012 $0
$10,825 $60,351 $4,650 $24,682 $2,401 $17,223 $10,679 $290,033 $15,968 $0$15,280 $33,791 $4,875 $11,936 $4,914 $10,735 $2,754 $274,892 $360,868 $0$10,145 $37,823 $3,950 $13,313 $0 $14,344 $8,619 $144,173 $862,992 $9,457$5,200 $18,183 $7,000 $11,228 $2,406 $15,900 $6,705 $144,651 $0 $0
$0 $17,997 $0 $4,238 $5,642 $3,047 $3,109 $52,020 $0 $0$2,600 $18,167 $0 $12,831 $0 $9,629 $905 $88,187 $0 $0$3,100 $47,522 $4,650 $9,838 $202 $28,334 $1,644 $156,574 $3,341 $30,882
$17,814 $41,421 $7,000 $6,905 $0 $8,648 $8,603 $171,610 $11,411 $0$16,637 $83,459 $10,000 $40,386 $6,795 $48,541 $31,271 $654,238 $139,955 $469,580
$437 $11,895 $3,500 $8,337 $2,925 $7,327 $2,041 $94,726 $7,825 $9,878$14,685 $18,834 $5,100 $13,519 $4,094 $7,066 $3,075 $356,694 $451,880 $472
$0 $8,252 $3,500 $563 $1,200 $6,100 $800 $66,618 $0 $0$7,577 $0 $4,500 $13,607 $1,928 $5,622 $5,126 $292,736 $49,628 $0
$0 $12,377 $2,500 $5,302 $0 $300 $500 $48,783 $32,677 $49,600$44,229 $41,997 $4,350 $15,001 $3,418 $57,557 $5,557 $325,326 $60,910 $93,132
$2,118,562 $4,891,350 $490,818 $1,833,473 $387,352 $5,454,564 $918,029 $34,647,016 $29,777,787 $15,699,924
$2,305,932 $4,714,065 $436,792 $1,847,312 $401,171 $5,119,689 $846,000 $32,258,446 $26,120,847 $17,188,777
KENTUCKY PUBLIC LIBRARY STATISTICS, 2015-2016 -20
Item Number ---->
County
AdairAllenAndersonBal/CarBarrenBathBellBooneBourbonBoydBoyleBrackenBreathittBreckinridgeBullittButlerCaldwellCallowayCampbellCarrollCarterCaseyChristianClarkClayClintonCrittendenCumberlandDaviessEdmonson
28 29 30 31 32 33 34 35 36Total Income from Square Square Feet, Square
Capital Loans, Bond Main Library, Branches, Bookmobile, Annual Public Feet, Branch Feet,Revenue Issues, etc. Hours Per year Hours Per year Hours Per year Service Hours Main Library Libraries Total
$0 $0 2,548 1,875 4,423 6,654 6,654$0 $0 2,808 364 3,172 16,648 16,648$0 $0 3,432 3,432 13,444 13,444$0 $0 448 378 826 5,600 5,600$0 $0 3,016 850 3,866 14,520 14,520$0 $0 2,574 1,248 500 4,322 8,363 890 9,253$0 $0 2,601 2,300 420 5,321 8,400 8,800 17,200
$146,183 $0 3,744 12,909 16,653 75,000 61,165 136,165$816,396 $1,574,609 2,782 2,782 19,710 19,710
$0 $0 3,328 6,240 9,568 24,400 8,700 33,100$423,872 $0 3,094 515 3,609 43,910 43,910
$0 $0 2,444 2,444 6,000 6,000$0 $0 2,912 2,912 10,000 10,000$0 $0 2,860 2,576 5,436 10,000 6,500 16,500$0 $0 3,328 9,360 12,688 16,000 23,492 39,492$0 $0 2,576 920 3,496 5,728 5,728$0 $0 2,236 1,560 3,796 15,000 2,100 17,100$0 $0 3,744 3,744 14,800 14,800
$40,053 $0 3,640 7,280 10,920 14,600 42,000 56,600$0 $0 2,964 2,964 13,225 13,225
$275,000 $0 2,080 2,080 4,160 1,200 4,000 5,200$0 $675,463 2,184 1,400 3,584 11,973 11,973$0 $0 2,756 2,756 22,000 22,000$0 $0 3,354 3,354 27,367 27,367$0 $0 2,600 2,184 4,784 6,789 6,789
$152,005 $0 2,210 1,248 3,458 4,156 4,156$0 $0 2,184 950 3,134 5,236 5,236$0 $0 2,236 1,248 3,484 6,221 6,221$0 $0 3,744 3,744 51,000 51,000$0 $0 2,678 1,645 4,323 10,500 10,500
KENTUCKY PUBLIC LIBRARY STATISTICS, 2015-2016 -21

Item Number ---->
County
AdairElliottEstillFayetteFlemingFloydFranklinFultonGallatinGarrardGrantGravesGraysonGreenGreenupHancockHardinHarlanHarrisonHartHendersonHenryHickmanHopkinsJacksonJeffersonJessamineJohnsonKentonKnottKnoxLaRue
28 29 30 31 32 33 34 35 36Total Income from Square Square Feet, Square
Capital Loans, Bond Main Library, Branches, Bookmobile, Annual Public Feet, Branch Feet,Revenue Issues, etc. Hours Per year Hours Per year Hours Per year Service Hours Main Library Libraries Total
$0 $0 2,210 2,210 8,000 8,000$0 $0 2,808 1,222 4,030 5,700 5,700
$3,280,525 $2,297,470 3,588 17,160 20,748 110,400 112,930 223,330$0 $0 3,120 1,260 4,380 12,000 12,000$0 $0 2,600 2,444 1,560 6,604 15,000 3,000 18,000$0 $0 3,380 3,380 39,290 39,290$0 $0 2,080 2,262 1,820 6,162 6,000 3,970 9,970$0 $0 2,548 2,548 9,188 9,188$0 $0 2,548 980 3,528 12,713 12,713$0 $0 3,432 3,432 12,500 12,500
$110,000 $0 3,120 1,725 4,845 17,635 17,635$218,570 $0 2,704 1,400 4,104 7,500 7,500
$0 $0 2,080 2,080 7,885 7,885$65,500 $20,545 2,652 5,148 1,820 9,620 14,860 16,410 31,270
$0 $4,091 2,350 2,150 975 5,475 10,000 1,800 11,800$0 $0 2,964 2,964 897 6,825 18,100 5,100 23,200$0 $0 2,808 4,732 1,225 8,765 10,276 8,225 18,501$0 $0 2,964 1,375 4,339 13,203 13,203
$238,823 $0 2,418 2,230 4,648 8,350 8,350$0 $0 3,302 1,200 4,502 21,635 21,635$0 $0 3,120 400 3,520 8,000 8,000$0 $0 750 270 1,020 2,100 2,100
$21,635 $0 2,288 1,716 4,004 14,678 3,328 18,006$0 $70,807 2,522 2,314 4,836 8,200 8,200
$14,797,422 $0 3,536 49,932 2,158 55,626 167,031 185,099 352,130$0 $0 3,458 3,458 41,000 41,000
$24,862 $7,416 2,652 1,400 4,052 12,180 12,180$0 $0 3,536 7,436 10,972 61,900 73,349 135,249$0 $0 2,210 2,210 2,400 2,400$0 $0 2,193 1,428 3,621 7,123 7,123$0 $0 2,548 1,600 4,148 6,000 6,000
KENTUCKY PUBLIC LIBRARY STATISTICS, 2015-2016 -22
Item Number ---->
County
AdairLaurelLawrenceLeeLeslieLetcherLewisLincolnLivingstonLoganLyonMadisonMagoffinMarionMarshallMartinMasonMcCrackenMcCrearyMcLeanMeadeMenifeeMercerMetcalfeMonroeMontgomeryMorganMuhlenbergNelsonNicholasOhioOldham
28 29 30 31 32 33 34 35 36Total Income from Square Square Feet, Square
Capital Loans, Bond Main Library, Branches, Bookmobile, Annual Public Feet, Branch Feet,Revenue Issues, etc. Hours Per year Hours Per year Hours Per year Service Hours Main Library Libraries Total
$88,038 $2,622,489 3,216 672 3,888 41,650 41,650$0 $15,737 2,444 1,664 4,108 12,408 12,408
$98,000 $0 2,288 2,288 6,565 6,565$0 $0 2,964 1,820 4,784 6,910 6,910$0 $0 2,548 7,254 9,802 21,000 12,760 33,760$0 $12,754 2,288 1,100 3,388 10,031 10,031$0 $0 2,860 2,860 16,200 16,200$0 $0 1,872 468 2,340 9,700 9,700$0 $0 3,162 1,768 4,930 14,503 2,437 16,940$0 $0 2,756 416 3,172 8,550 8,550
$71,782 $0 3,432 3,432 1,200 8,064 18,236 11,254 29,490$0 $0 2,401 2,401 5,200 5,200
$65,481 $0 2,678 2,678 11,200 11,200$0 $0 3,120 5,200 966 9,286 15,150 18,192 33,342$0 $0 2,288 2,080 936 5,304 10,904 3,400 14,304$0 $0 2,860 2,860 11,000 11,000$0 $0 3,692 3,692 33,000 33,000$0 $0 2,730 874 3,604 13,600 13,600$0 $0 2,678 748 3,426 7,200 7,200$0 $42,844 3,016 240 3,256 22,444 22,444$0 $0 2,600 2,600 9,575 9,575$0 $0 3,224 1,200 4,424 22,500 22,500$0 $0 2,132 1,150 3,282 7,378 7,378$0 $0 2,548 300 2,848 5,120 5,120$0 $453,255 3,162 2,423 1,170 6,755 8,704 1,500 10,204$0 $388 2,756 2,756 16,380 16,380$0 $0 2,254 4,784 7,038 10,954 13,520 24,474$0 $0 3,172 5,720 1,560 10,452 25,842 10,620 36,462
$76,000 $0 2,346 2,346 3,500 3,500$0 $0 2,704 1,100 576 4,380 15,010 3,000 18,010$0 $0 2,964 5,616 8,580 30,000 6,485 36,485
KENTUCKY PUBLIC LIBRARY STATISTICS, 2015-2016 -23

Item Number ---->
County
AdairOwenOwsleyPendletonPerryPikePowellPulaskiRobertsonRockcastleRowanRussellScottShelbySimpsonSpencerTaylorToddTriggTrimbleUnionWarrenWashingtonWayneWebsterWhitleyWolfeWoodford
Total: Previous Year,FY 2014-2015:
28 29 30 31 32 33 34 35 36Total Income from Square Square Feet, Square
Capital Loans, Bond Main Library, Branches, Bookmobile, Annual Public Feet, Branch Feet,Revenue Issues, etc. Hours Per year Hours Per year Hours Per year Service Hours Main Library Libraries Total
$0 $0 2,964 2,964 12,000 12,000$0 $0 2,236 2,236 7,000 7,000$0 $0 3,264 611 3,875 13,700 13,700$0 $0 2,958 990 3,948 30,000 30,000$0 $0 2,340 9,828 12,168 10,692 66,840 77,532$0 $0 2,548 600 3,148 6,000 6,000
$43,000 $0 2,958 8,568 11,526 45,750 12,652 58,402$0 $0 2,288 2,288 5,109 5,109$0 $0 2,444 1,450 3,894 5,456 5,456
$356,314 $0 3,328 1,716 5,044 17,000 17,000$0 $0 2,418 2,210 4,628 6,376 2,000 8,376$0 $0 2,940 1,170 4,110 41,351 41,351$0 $0 2,756 1,248 4,004 22,000 22,000
$360,868 $0 2,800 920 3,720 6,024 6,024$0 $937,992 2,418 2,418 5,000 5,000$0 $0 2,808 650 3,458 10,000 10,000$0 $0 2,150 736 2,886 3,276 3,276$0 $0 2,496 2,496 5,998 5,998$0 $0 2,756 2,756 10,500 10,500$0 $0 2,548 4,680 7,228 11,528 4,478 16,006
$139,955 $0 3,536 8,684 1,404 13,624 19,100 26,727 45,827$0 $1,605,721 2,340 585 2,925 4,384 4,384$0 $450,046 2,704 968 3,672 8,710 8,710$0 $0 2,184 2,184 1,248 5,616 4,800 1,107 5,907$0 $0 2,808 2,288 1,428 6,524 15,564 11,745 27,309
$56,984 $0 2,314 2,314 7,010 7,010$0 $0 3,380 3,380 1,118 7,878 23,000 3,200 26,200
$21,967,268 $10,791,627 325,432 222,696 77,657 625,785 1,987,033 782,775 2,769,808
$8,042,005 $2,468,143 325,540 224,466 82,727 632,660 1,920,292 761,896 2,679,318
KENTUCKY PUBLIC LIBRARY STATISTICS, 2015-2016 -24

Item Number ---->
County
AdairAllenAndersonBal/CarBarrenBathBellBooneBourbonBoydBoyleBrackenBreathittBreckinridgeBullittButlerCaldwellCallowayCampbellCarrollCarterCaseyChristianClarkClayClintonCrittendenCumberlandDaviessEdmonson
37 38 39 40 41 42 43 44 45 46 47Number of
Number of Number of Groups Using Number of Librarians with All Other Total Adult Adult Juvenile JuvenileBranches Bookmobiles Meeting Rooms Meetings ALA MLS Staff Staff Fiction Non-Fiction Fiction Non-Fiction
1 5 50 0.00 5.00 5.00 9,841 10,867 6,835 3,1781 41 329 0.00 11.00 11.00 11,232 5,201 7,955 3,123
45 228 1.75 8.48 10.23 23,554 11,577 12,908 4,5311 6 6 0.00 1.00 1.00 4,584 1,525 1,841 1,2271 40 127 2.00 11.00 13.00 19,434 11,399 9,496 5,532
1 1 81 597 0.94 8.26 9.20 11,106 6,183 7,385 3,2621 1 230 381 0.00 11.31 11.31 26,112 24,290 11,771 8,0455 1,745 8,094 27.00 75.00 102.00 59,563 57,936 100,064 36,283
27 119 2.80 8.28 11.08 22,192 16,431 7,117 3,7572 344 557 2.75 30.55 33.30 55,006 56,464 24,112 9,199
1 267 288 5.80 17.09 22.89 48,590 44,241 25,357 16,219166 364 1.00 5.05 6.05 8,408 4,029 5,458 2,29447 102 1.00 8.00 9.00 9,208 6,613 8,222 4,996
2 39 335 2.00 8.00 10.00 27,680 15,678 19,087 11,3673 385 806 2.00 44.75 46.75 62,676 33,602 51,172 25,334
1 41 184 0.00 6.00 6.00 11,034 9,430 6,856 6,7621 55 262 0.00 6.70 6.70 11,519 5,536 6,663 5,512
37 61 1.00 16.25 17.25 24,448 18,922 24,719 9,4542 1,507 3,059 17.50 46.50 64.00 40,135 34,897 65,435 22,566
97 174 1.00 10.00 11.00 13,435 8,587 6,155 3,8072 17 35 0.00 3.00 3.00 4,584 1,635 3,943 710
1 267 742 1.60 8.64 10.24 19,109 12,133 11,603 7,58537 205 2.00 9.00 11.00 13,477 2,103 8 33
513 987 7.00 15.65 22.65 22,991 31,650 22,834 9,6571 138 148 1.00 6.00 7.00 13,368 8,911 10,870 2,5921 0 0 0.00 5.00 5.00 9,608 6,151 6,844 2,4591 25 254 0.00 3.86 3.86 9,703 5,194 6,553 1,7521 9 146 0.00 8.00 8.00 12,584 5,883 6,266 1,999
0 0 9.00 37.25 46.25 56,457 65,385 42,609 18,6301 78 363 0.00 6.76 6.76 12,404 4,907 8,765 2,625
Staff (FTE) Book Collection
KENTUCKY PUBLIC LIBRARY STATISTICS, 2015-2016 -25

Item Number ---->
County
AdairElliottEstillFayetteFlemingFloydFranklinFultonGallatinGarrardGrantGravesGraysonGreenGreenupHancockHardinHarlanHarrisonHartHendersonHenryHickmanHopkinsJacksonJeffersonJessamineJohnsonKentonKnottKnoxLaRue
37 38 39 40 41 42 43 44 45 46 47Number of
Number of Number of Groups Using Number of Librarians with All Other Total Adult Adult Juvenile JuvenileBranches Bookmobiles Meeting Rooms Meetings ALA MLS Staff Staff Fiction Non-Fiction Fiction Non-Fiction
Staff (FTE) Book Collection
30 228 0.00 1.00 1.00 9,796 4,895 4,430 2,2101 24 119 3.00 4.20 7.20 12,789 7,917 8,971 4,456
5 2,735 13,133 45.00 141.00 186.00 129,451 118,640 129,820 62,0351 290 518 0.00 7.07 7.07 12,261 9,877 8,570 4,725
1 1 57 344 2.00 11.00 13.00 30,955 15,385 15,327 9,859605 1,327 7.60 23.17 30.77 49,911 52,847 22,320 12,665
1 1 47 271 0.00 5.72 5.72 26,777 12,917 9,698 3,44532 179 0.00 7.50 7.50 9,481 6,079 10,820 3,245
1 19 54 2.00 5.00 7.00 10,830 7,238 7,459 3,86058 167 2.82 18.22 21.04 14,473 14,124 11,945 5,588
1 61 196 0.00 8.44 8.44 24,425 5,878 11,099 2,5981 6 9 1.00 7.43 8.43 15,617 12,338 6,379 4,361
9 54 0.00 8.00 8.00 8,476 7,253 5,050 2,2642 1 162 1,196 2.00 15.00 17.00 59,396 34,426 27,996 12,4761 1 12 38 0.00 8.32 8.32 15,886 8,923 12,435 6,5511 1 30 110 2.50 11.75 14.25 36,690 17,299 17,485 8,3082 1 173 533 1.00 19.00 20.00 37,098 36,756 35,980 17,107
1 25 35 1.38 9.00 10.38 19,046 9,419 9,276 3,0582 35 51 0.00 6.70 6.70 12,276 11,868 10,863 7,1491 241 851 2.00 22.10 24.10 48,812 25,761 13,170 7,3241 48 252 2.00 7.60 9.60 10,834 6,673 8,320 3,0551 5 83 0.00 1.00 1.00 3,311 2,799 3,837 2,214
1 96 412 2.00 9.00 11.00 22,998 19,173 18,617 8,3741 175 255 0.00 13.00 13.00 6,872 6,425 7,822 6,435
17 1 1,146 5,256 67.00 194.00 261.00 377,393 525,829 258,174 105,75739 39 17.00 30.00 47.00 29,582 20,814 38,430 17,253
1 101 586 1.00 11.00 12.00 22,926 20,209 9,784 4,1052 5,885 5,885 39.00 103.83 142.83 125,124 132,633 133,709 61,133
1 10 68 1.00 2.00 3.00 7,478 4,168 6,730 2,9811 150 567 0.00 6.00 6.00 24,982 17,293 12,219 11,9341 31 31 0.00 9.00 9.00 10,381 10,017 8,608 6,049
KENTUCKY PUBLIC LIBRARY STATISTICS, 2015-2016 -26
Item Number ---->
County
AdairLaurelLawrenceLeeLeslieLetcherLewisLincolnLivingstonLoganLyonMadisonMagoffinMarionMarshallMartinMasonMcCrackenMcCrearyMcLeanMeadeMenifeeMercerMetcalfeMonroeMontgomeryMorganMuhlenbergNelsonNicholasOhioOldham
37 38 39 40 41 42 43 44 45 46 47Number of
Number of Number of Groups Using Number of Librarians with All Other Total Adult Adult Juvenile JuvenileBranches Bookmobiles Meeting Rooms Meetings ALA MLS Staff Staff Fiction Non-Fiction Fiction Non-Fiction
Staff (FTE) Book Collection
1 11 14 3.00 27.26 30.26 54,648 28,352 24,848 12,5371 54 1,296 0.00 8.00 8.00 10,153 8,515 5,567 2,421
59 106 0.00 7.00 7.00 9,628 6,366 5,210 1,9881 473 603 0.00 8.00 8.00 18,562 15,019 17,806 8,510
3 1 65 753 1.00 10.50 11.50 25,485 27,480 23,182 14,9131 33 33 1.00 3.79 4.79 18,151 10,974 10,722 4,751
40 305 1.00 7.50 8.50 16,017 6,342 8,843 2,3081 22 62 0.00 2.40 2.40 5,836 3,587 7,642 2,769
2 65 161 1.00 10.46 11.46 14,156 6,209 9,542 2,8251 68 315 0.00 3.50 3.50 8,966 11,983 7,129 3,726
1 1 499 793 3.00 36.25 39.25 51,695 28,698 27,956 11,59319 93 0.00 5.00 5.00 10,589 5,652 9,320 2,485
1 114 609 1.00 12.00 13.00 12,788 13,097 11,806 6,5712 1 72 838 2.00 28.00 30.00 87,883 39,996 35,199 23,4321 1 21 159 0.00 9.00 9.00 17,773 9,084 14,880 4,984
57 285 1.75 5.84 7.59 21,488 11,774 14,926 3,953466 1,246 4.00 36.00 40.00 35,787 40,276 25,754 9,251
1 45 211 0.00 10.00 10.00 17,432 11,922 11,095 6,0841 22 146 0.00 3.00 3.00 10,032 6,307 4,717 9851 42 392 1.00 28.00 29.00 20,173 9,511 13,769 4,153
51 238 0.00 6.00 6.00 8,049 6,791 7,125 3,0091 27 65 2.00 11.50 13.50 19,869 15,046 11,933 8,4621 37 138 0.00 6.25 6.25 8,118 5,471 6,577 2,4261 9 147 1.00 4.00 5.00 8,269 6,935 3,064 1,324
1 1 15 138 1.75 16.13 17.88 23,792 10,044 17,622 6,99729 173 1.00 7.00 8.00 8,214 9,343 7,104 3,985
2 32 75 0.00 17.00 17.00 82,371 33,540 42,464 11,5112 1 122 2,921 2.50 26.00 28.50 37,414 24,064 33,740 10,632
44 230 0.00 4.00 4.00 4,380 4,740 1,785 1,5321 1 400 8,054 0.00 17.00 17.00 12,711 19,189 14,910 8,5672 48 137 7.95 25.13 33.08 36,241 25,336 32,231 10,422
KENTUCKY PUBLIC LIBRARY STATISTICS, 2015-2016 -27

Item Number ---->
County
AdairOwenOwsleyPendletonPerryPikePowellPulaskiRobertsonRockcastleRowanRussellScottShelbySimpsonSpencerTaylorToddTriggTrimbleUnionWarrenWashingtonWayneWebsterWhitleyWolfeWoodford
Total: Previous Year,FY 2014-2015:
37 38 39 40 41 42 43 44 45 46 47Number of
Number of Number of Groups Using Number of Librarians with All Other Total Adult Adult Juvenile JuvenileBranches Bookmobiles Meeting Rooms Meetings ALA MLS Staff Staff Fiction Non-Fiction Fiction Non-Fiction
Staff (FTE) Book Collection
78 377 0.80 11.00 11.80 6,517 8,693 6,931 7,53945 322 0.00 3.00 3.00 16,234 3,228 5,712 549
1 33 130 0.00 8.00 8.00 17,805 10,460 12,048 3,4541 307 334 0.00 19.58 19.58 13,619 14,606 12,082 11,406
5 70 254 4.00 19.40 23.40 101,686 80,908 42,469 27,3351 29 207 1.00 5.50 6.50 7,884 5,888 3,823 2,783
4 1 155 797 0.53 32.04 32.57 47,471 25,937 28,415 11,41579 189 0.00 5.00 5.00 4,547 3,730 4,765 1,486
1 0 0 0.00 7.00 7.00 12,274 7,877 9,700 4,7121 1,080 1,207 3.31 16.06 19.37 25,647 16,590 12,096 7,130
1 27 483 0.00 14.00 14.00 16,333 11,463 10,086 4,6761 51 102 8.00 19.26 27.26 26,643 26,836 25,872 13,1631 751 4,502 0.00 15.54 15.54 21,058 22,661 17,934 11,8931 33 464 0.00 7.50 7.50 14,742 7,271 12,624 3,877
12 41 2.50 3.50 6.00 12,180 6,505 7,780 3,1621 45 950 1.00 17.00 18.00 14,591 6,415 7,006 2,2261 1 7 0.00 5.00 5.00 7,076 1,812 9,022 2,192
42 308 0.00 6.25 6.25 11,919 12,223 8,567 5,32337 129 1.00 5.95 6.95 7,204 5,571 10,463 3,228
2 129 1,216 0.00 16.20 16.20 27,540 9,615 12,659 10,4053 1 652 898 6.38 34.32 40.70 54,724 36,935 43,002 21,436
1 12 53 1.00 10.00 11.00 6,792 3,987 5,757 1,8901 20 78 0.00 7.00 7.00 22,449 15,061 10,108 3,946
1 1 23 137 0.00 10.01 10.01 31,104 19,068 11,456 8,2221 117 411 2.00 6.61 8.61 14,361 8,924 11,066 4,047
72 890 0.00 7.00 7.00 12,750 6,190 10,350 2,5061 1 90 998 6.25 15.01 21.26 23,649 14,248 19,102 8,183
86 74 25,677 88,070 364.16 1,895.67 2,259.83 3,195,838 2,567,578 2,253,609 1,034,354
85 76 27,527 79,167 363.08 1,856.02 2,219.10 3,197,678 2,654,591 2,261,185 1,057,483
KENTUCKY PUBLIC LIBRARY STATISTICS, 2015-2016 -28

Item Number ---->
County
AdairAllenAndersonBal/CarBarrenBathBellBooneBourbonBoydBoyleBrackenBreathittBreckinridgeBullittButlerCaldwellCallowayCampbellCarrollCarterCaseyChristianClarkClayClintonCrittendenCumberlandDaviessEdmonson
48 49 50 51 52 53 54 55 56 57 58Electronic Books Total People
Total Book Books, Physical Downloadable Physical Downloadable Collection Electronic Registered EnteringCollection Per Capita Units Titles Units Titles (E-Books) Collections Subscriptions Users Library
30,721 1.61 1,143 22,014 596 1,758 116,125 53 30 4,252 26,29027,511 1.33 1,738 29,361 3,295 1,298 118,157 65 95 15,926 131,73352,570 2.39 4,515 22,014 4,132 1,758 116,125 62 77 16,051 85,6129,177 0.70 419 0 734 0 0 0 0 640 1,107
45,861 1.05 2,474 22,309 2,988 1,758 117,348 44 53 11,634 77,26027,936 2.28 1,063 22,014 3,233 1,758 116,125 52 113 6,266 42,42570,218 2.57 1,955 22,014 4,839 1,758 116,125 52 92 14,852 92,180
253,846 1.99 35,634 23,598 44,197 20,448 152,186 74 794 84,816 866,55149,497 2.46 1,863 22,014 3,584 1,758 116,335 55 97 6,940 95,210
144,781 3.00 6,247 30,056 27,989 1,847 122,515 114 424 33,976 272,602134,407 4.51 8,701 22,014 8,027 1,758 116,225 59 105 22,594 156,90920,189 2.43 1,316 22,014 3,773 1,758 116,125 59 49 4,797 32,60829,039 2.15 909 22,014 1,739 1,758 116,125 34 40 8,917 86,42773,812 3.69 3,394 22,160 6,884 1,758 117,590 54 132 16,712 88,667
172,784 2.20 8,742 27,000 15,403 1,758 116,567 64 128 26,124 289,05434,082 2.63 383 22,018 1,537 1,758 116,192 56 41 8,429 31,14429,230 2.31 293 0 266 0 0 53 31 5,199 18,29777,543 2.02 703 22,014 2,613 1,758 118,927 59 126 35,785 252,524
163,033 1.77 26,294 23,543 26,771 2,115 121,305 55 377 54,939 590,26531,984 2.99 3,168 22,014 6,145 1,758 116,555 63 130 9,738 112,62510,872 0.40 175 0 1,691 0 0 0 12 8,344 7,75950,430 3.19 755 22,014 1,920 1,758 116,125 58 26 10,919 43,54415,621 0.21 26,458 22,014 21,633 1,758 116,125 55 58 25,093 103,68387,132 2.44 3,523 22,014 10,576 1,758 116,125 50 114 18,967 128,75535,741 1.70 728 22,014 1,277 1,758 116,125 35 55 13,006 38,36125,062 2.46 1,196 22,014 1,537 1,758 116,125 54 16 6,271 46,41223,202 2.53 1,385 0 2,047 0 0 51 25 3,747 30,71626,732 3.96 330 11,624 1,242 1,642 50,691 50 34 4,906 17,310
183,081 1.84 14,043 29,982 15,230 1,862 184,860 75 235 76,681 732,38128,701 2.39 1,119 22,014 4,767 1,758 116,125 52 59 5,704 63,561
Audio Collection Video Collection
KENTUCKY PUBLIC LIBRARY STATISTICS, 2015-2016 -29

Item Number ---->
County
AdairElliottEstillFayetteFlemingFloydFranklinFultonGallatinGarrardGrantGravesGraysonGreenGreenupHancockHardinHarlanHarrisonHartHendersonHenryHickmanHopkinsJacksonJeffersonJessamineJohnsonKentonKnottKnoxLaRue
48 49 50 51 52 53 54 55 56 57 58Electronic Books Total People
Total Book Books, Physical Downloadable Physical Downloadable Collection Electronic Registered EnteringCollection Per Capita Units Titles Units Titles (E-Books) Collections Subscriptions Users Library
Audio Collection Video Collection
21,331 2.79 0 922 1,008 0 0 50 2 2,686 13,52134,133 2.37 1,507 22,014 2,496 1,758 116,144 56 68 3,738 61,740
439,946 1.40 44,983 5,444 50,447 0 21,160 59 763 235,737 1,880,52435,433 2.42 1,434 22,014 2,198 1,758 116,125 55 116 11,554 67,55871,526 1.89 4,977 22,000 12,522 1,400 93,855 68 46 22,895 68,670
137,743 2.73 13,044 25,125 15,411 1,758 118,335 69 164 40,756 183,66252,837 8.47 6,623 0 4,984 0 0 51 95 7,761 40,40629,625 3.43 1,642 22,014 4,010 1,758 116,125 65 122 7,783 49,91329,387 1.70 716 22,014 2,126 1,758 116,125 52 24 9,313 36,25446,130 1.86 3,775 22,014 2,786 1,758 116,125 55 105 18,118 106,44344,000 1.18 1,168 22,041 2,876 1,758 116,710 56 71 22,588 146,74238,695 1.48 1,560 22,014 1,522 1,758 169,720 61 66 15,212 52,46823,043 2.09 529 22,014 2,877 1,758 116,500 55 68 4,461 31,260
134,294 3.72 8,706 25,068 23,239 3,556 133,828 71 262 16,452 140,73143,795 5.04 1,601 33,634 5,246 11,663 116,314 56 55 6,008 33,72579,782 0.75 3,067 22,146 2,936 1,758 116,700 54 127 47,694 214,267
126,941 4.58 2,304 22,059 7,103 1,748 116,574 62 128 14,346 82,86940,799 2.17 1,921 22,014 3,574 1,758 116,125 72 99 9,875 48,23842,156 2.28 820 0 1,521 0 0 51 98 12,911 41,17295,067 2.05 8,007 23,322 11,787 1,758 119,203 65 111 34,155 189,18028,882 1.85 823 22,014 4,039 1,758 116,125 55 98 7,082 73,78912,161 2.64 210 0 600 0 0 0 0 1,851 2,19569,162 1.50 2,874 22,016 4,394 1,758 116,257 54 61 21,535 69,21427,554 2.06 629 19,420 1,520 132 92,201 51 52 5,938 66,242
1,267,153 1.66 69,749 8,850 36,192 350 25,980 88 2,455 363,084 3,054,629106,079 2.04 10,058 168,178 7,346 39,382 221,937 59 92 45,023 165,97857,024 2.46 1,520 13,331 3,479 16,243 99,776 32 57 22,091 53,090
452,599 2.74 39,884 10,702 79,598 0 87,883 106 469 162,830 863,27021,357 1.36 279 0 1,620 0 0 50 15 5,691 20,00066,428 2.09 1,597 36,421 4,521 12,679 75,986 60 164 10,728 77,11135,055 2.46 671 22,014 3,019 1,758 116,125 55 63 8,178 47,952
KENTUCKY PUBLIC LIBRARY STATISTICS, 2015-2016 -30

Item Number ---->
County
AdairLaurelLawrenceLeeLeslieLetcherLewisLincolnLivingstonLoganLyonMadisonMagoffinMarionMarshallMartinMasonMcCrackenMcCrearyMcLeanMeadeMenifeeMercerMetcalfeMonroeMontgomeryMorganMuhlenbergNelsonNicholasOhioOldham
48 49 50 51 52 53 54 55 56 57 58Electronic Books Total People
Total Book Books, Physical Downloadable Physical Downloadable Collection Electronic Registered EnteringCollection Per Capita Units Titles Units Titles (E-Books) Collections Subscriptions Users Library
Audio Collection Video Collection
120,385 2.00 10,930 29,566 10,247 1,788 121,478 60 137 58,013 152,85726,656 1.69 561 22,014 952 1,758 116,125 55 123 19,357 76,45923,192 3.43 628 0 2,402 0 0 50 37 4,038 35,81259,897 5.59 2,157 24,652 16,217 3,657 153,875 56 128 12,009 76,41791,060 3.94 2,132 31,289 7,916 2,257 117,855 57 133 12,684 64,30044,598 3.26 743 22,014 4,974 1,758 116,125 61 77 5,467 76,37933,510 1.37 1,479 15,462 6,286 1,686 96,290 54 90 14,468 91,87719,834 2.13 231 0 2,103 0 0 50 25 2,666 12,99532,732 1.22 2,239 22,026 7,680 1,758 116,250 54 40 13,936 141,08731,804 3.83 1,097 22,014 2,785 1,758 116,125 51 21 10,635 22,951
119,942 1.37 9,984 28,807 20,773 1,758 116,515 64 277 57,638 336,56028,046 2.19 865 0 628 0 0 52 58 3,895 18,32044,262 2.29 2,975 22,014 2,075 1,758 116,175 52 30 10,481 98,637
186,510 6.00 6,377 22,737 21,456 1,810 120,618 71 238 28,852 209,54846,721 3.80 1,445 27,988 3,161 12,600 74,492 55 61 5,365 43,27552,141 3.05 3,660 22,014 4,061 1,758 116,125 54 73 12,160 127,000
111,068 1.71 9,089 22,246 37,796 1,766 117,039 72 211 44,107 370,86746,533 2.60 2,003 22,014 2,875 1,758 116,125 62 49 13,510 54,48422,041 2.32 395 22,059 1,887 1,748 94,281 53 58 3,483 33,05847,606 1.70 2,483 22,015 7,309 1,758 116,135 55 31 19,754 91,89224,974 3.93 1,970 0 3,579 0 0 51 48 6,035 39,98955,310 2.58 4,737 22,014 6,078 1,158 116,125 52 110 13,329 123,04722,592 2.28 361 22,024 2,591 1,758 116,357 55 30 4,724 32,13119,592 1.84 216 22,014 1,751 1,758 116,125 50 27 4,353 25,18458,455 2.12 960 22,014 8,148 1,758 116,125 67 97 11,026 103,28028,646 2.16 720 12,011 1,242 4,451 67,102 50 61 8,466 46,212
169,886 5.45 5,059 22,014 7,579 1,758 116,125 53 40 10,020 23,343105,850 2.35 5,163 22,014 8,002 1,758 116,125 63 1,840 20,373 132,51012,437 1.74 183 11,288 952 10,362 59,634 52 32 3,701 33,57255,377 2.29 3,233 28,581 2,523 1,758 117,059 59 99 11,759 53,560
104,230 1.61 4,841 22,103 9,891 1,758 116,528 60 238 34,296 237,457
KENTUCKY PUBLIC LIBRARY STATISTICS, 2015-2016 -31

Item Number ---->
County
AdairOwenOwsleyPendletonPerryPikePowellPulaskiRobertsonRockcastleRowanRussellScottShelbySimpsonSpencerTaylorToddTriggTrimbleUnionWarrenWashingtonWayneWebsterWhitleyWolfeWoodford
Total: Previous Year,FY 2014-2015:
48 49 50 51 52 53 54 55 56 57 58Electronic Books Total People
Total Book Books, Physical Downloadable Physical Downloadable Collection Electronic Registered EnteringCollection Per Capita Units Titles Units Titles (E-Books) Collections Subscriptions Users Library
Audio Collection Video Collection
29,680 2.77 1,931 22,035 2,164 1,759 116,184 61 60 8,815 72,23625,723 5.77 623 0 3,829 0 0 50 80 5,698 39,15243,767 3.04 2,595 22,014 5,362 1,758 117,664 55 63 9,404 47,61951,713 1.88 5,070 23,078 7,971 1,809 123,157 82 144 11,413 85,500
252,398 4.08 6,994 22,014 15,490 1,758 116,446 91 1,309 40,345 171,98320,378 1.66 225 22,014 1,005 1,758 116,125 51 32 6,576 46,719
113,238 1.78 3,974 22,014 9,957 1,758 113,125 56 147 26,260 228,06614,528 6.80 617 0 2,028 0 0 50 21 1,026 14,50034,563 2.04 429 22,014 849 1,758 139,897 55 23 6,577 30,98661,463 2.57 5,833 22,014 8,976 1,758 116,125 83 247 20,482 181,38642,558 2.41 385 22,014 1,956 1,758 116,125 54 55 5,769 47,05292,514 1.76 8,093 22,620 7,852 1,758 118,348 64 176 40,550 156,27573,546 1.61 2,252 27,786 2,375 11,758 116,125 72 52 24,752 76,77738,514 2.14 2,290 28,303 5,906 1,758 116,822 51 45 14,991 91,82529,627 1.66 1,622 22,014 3,489 1,758 116,295 56 46 7,880 54,28130,238 1.19 724 3,037 1,579 74 139,897 56 48 10,139 88,97820,102 1.60 353 22,014 1,058 1,758 116,125 50 23 8,492 19,37838,032 2.67 2,497 22,059 1,931 1,748 116,574 66 114 12,923 87,42426,466 3.02 965 22,014 2,873 1,758 116,125 56 42 5,546 46,52360,219 4.00 974 22,014 3,053 9,525 116,125 57 132 7,642 36,529
156,097 1.27 13,364 8,632 28,951 0 8,300 63 261 47,536 356,18618,426 1.53 642 22,014 1,046 1,758 116,125 66 21 8,974 32,15451,564 2.52 1,998 26,833 3,316 1,758 116,320 93 115 10,538 74,65969,850 5.30 1,688 0 7,977 0 0 52 74 14,415 63,24338,398 1.06 1,204 22,071 8,822 1,765 116,298 62 103 30,175 166,80831,796 4.38 825 20,150 292 1,275 91,500 54 55 4,692 67,21165,182 2.53 2,699 22,238 5,275 1,758 116,974 56 136 13,227 195,495
9,051,379 2.05 557,126 2,414,712 898,963 305,389 11,678,625 6,812 17,827 2,645,736 18,108,790
9,170,937 2.08 528,600 1,886,190 855,339 265,707 9,038,104 4,855 18,358 2,595,290 18,584,048
KENTUCKY PUBLIC LIBRARY STATISTICS, 2015-2016 -32

Item Number ---->
County
AdairAllenAndersonBal/CarBarrenBathBellBooneBourbonBoydBoyleBrackenBreathittBreckinridgeBullittButlerCaldwellCallowayCampbellCarrollCarterCaseyChristianClarkClayClintonCrittendenCumberlandDaviessEdmonson
59 60 61 62 63 64 65 66 67 68 69 70Book Book Total Material Material
Adult Adult Juvenile Juvenile Total Book Circulation, Turnover Circulation, Circulation, Audio-Video Circulated, Circulated,Fiction Non-fiction Fiction Non-Fiction Circulation Per Capita (Circ/Coll) Audio Books Videos Circulation Main Library All Branches
12,499 3,277 13,055 3,450 32,281 1.70 1.05 1,684 441 7,555 38,938 035,844 10,533 26,342 6,134 78,853 3.82 2.87 2,906 44,956 50,055 125,735 039,693 10,202 20,087 4,496 74,478 3.39 1.42 5,308 31,627 36,972 107,897 01,144 507 935 369 2,955 0.23 0.32 27 234 261 1,435 0
42,286 8,726 31,519 11,853 94,384 2.17 2.06 5,663 16,684 22,347 101,803 028,323 13,514 17,770 10,748 70,355 5.75 2.52 600 9,448 10,175 41,534 2,45021,439 5,975 5,509 1,561 34,484 1.26 0.49 844 14,448 15,793 30,496 19,211
189,801 98,912 432,708 91,776 813,197 6.37 3.20 57,022 286,032 414,492 601,319 601,10534,943 8,583 18,367 5,233 67,126 3.34 1.36 3,988 38,715 42,703 99,629 090,838 26,488 47,503 10,180 175,009 3.62 1.21 11,159 277,279 319,053 365,978 115,02264,925 22,674 54,340 11,777 153,716 5.16 1.14 8,216 35,103 45,934 176,894 07,766 1,284 5,480 821 15,351 1.84 0.76 969 18,302 19,861 33,117 0
33,142 6,742 16,872 9,084 65,840 4.88 2.27 3,047 22,410 25,458 99,202 038,607 6,158 22,398 3,832 70,995 3.55 0.96 2,995 25,648 28,643 78,272 21,62274,283 19,801 72,897 14,892 181,873 2.31 1.05 11,098 82,103 96,380 100,701 179,89614,312 2,692 8,878 4,674 30,556 2.36 0.90 289 9,151 9,460 29,437 021,043 1,465 6,190 792 29,490 2.33 1.01 499 179 678 29,527 061,410 17,550 80,516 16,791 176,267 4.60 2.27 2,312 33,842 36,154 202,802 0
148,766 85,480 226,224 42,469 502,939 5.46 3.08 31,052 490,150 589,153 444,670 718,01330,995 34,809 34,684 18,067 118,555 11.08 3.71 3,855 85,566 96,739 186,179 03,147 565 3,154 272 7,138 0.26 0.66 131 4,219 4,350 7,104 4,384
36,359 7,354 22,606 5,769 72,088 4.56 1.43 832 33,273 34,219 93,616 015,904 6,078 49 37 22,068 0.30 1.41 3,610 21,633 26,458 48,526 054,257 33,677 113,158 14,488 215,580 6.03 2.47 11,276 115,733 128,110 304,717 015,790 2,301 5,773 519 24,383 1.16 0.68 500 7,366 7,903 31,485 036,501 16,723 30,777 1,777 85,778 8.43 3.42 2,906 17,528 21,231 94,221 019,240 2,733 10,531 1,457 33,961 3.70 1.46 1,415 4,091 5,506 34,180 011,590 1,570 4,545 298 18,003 2.66 0.67 235 10,810 11,045 24,364 0
156,322 55,580 149,891 34,574 396,367 3.99 2.16 23,228 272,021 341,603 751,154 024,823 4,160 18,179 3,768 50,930 4.24 1.77 924 15,524 17,012 45,856 0
Book Circulation
KENTUCKY PUBLIC LIBRARY STATISTICS, 2015-2016 -33

Item Number ---->
County
AdairElliottEstillFayetteFlemingFloydFranklinFultonGallatinGarrardGrantGravesGraysonGreenGreenupHancockHardinHarlanHarrisonHartHendersonHenryHickmanHopkinsJacksonJeffersonJessamineJohnsonKentonKnottKnoxLaRue
59 60 61 62 63 64 65 66 67 68 69 70Book Book Total Material Material
Adult Adult Juvenile Juvenile Total Book Circulation, Turnover Circulation, Circulation, Audio-Video Circulated, Circulated,Fiction Non-fiction Fiction Non-Fiction Circulation Per Capita (Circ/Coll) Audio Books Videos Circulation Main Library All Branches
Book Circulation
1,116 764 819 1,048 3,747 0.49 0.18 77 2,766 2,843 13,690 032,479 11,088 30,663 5,779 80,009 5.57 2.34 909 18,734 20,627 57,111 0
522,504 323,998 689,834 230,101 1,766,437 5.62 4.02 128,514 664,083 896,707 403,724 2,258,30231,929 11,986 29,636 11,872 85,423 5.84 2.41 1,543 10,878 12,701 93,371 020,116 5,112 14,911 2,666 42,805 1.13 0.60 517 53,174 58,902 66,412 32,551
113,485 52,328 70,866 18,833 255,512 5.07 1.85 22,769 138,083 174,419 418,301 031,705 3,251 7,209 1,513 43,678 7.00 0.83 3,488 12,659 16,147 30,656 21,0708,217 1,779 12,720 932 23,648 2.74 0.80 783 19,128 21,319 46,170 0
19,370 2,853 18,267 2,934 43,424 2.52 1.48 323 10,481 10,804 41,709 028,091 14,207 21,142 4,337 67,777 2.74 1.47 2,954 35,494 45,595 108,254 045,928 8,184 25,495 6,938 86,545 2.31 1.97 3,415 19,730 23,506 90,224 028,000 5,276 12,682 3,317 49,275 1.88 1.27 1,472 10,238 12,091 51,971 016,309 3,942 13,372 2,340 35,963 3.27 1.56 995 15,252 16,247 54,777 077,451 12,266 49,974 7,090 146,781 4.07 1.09 6,759 102,672 111,775 51,069 182,00314,483 2,853 8,811 2,989 29,136 3.35 0.67 415 20,754 21,956 32,154 18,78973,529 16,960 70,623 11,645 172,757 1.62 2.17 8,162 12,629 23,586 153,970 33,03821,939 7,420 24,781 3,896 58,036 2.09 0.46 571 18,976 20,151 35,244 27,44531,094 5,110 18,641 2,839 57,684 3.07 1.41 1,750 42,836 45,910 93,383 050,481 16,766 50,754 9,354 127,355 6.90 3.02 1,745 25 8,525 85,720 092,868 24,376 38,572 9,996 165,812 3.57 1.74 12,926 114,605 134,615 273,961 018,275 6,031 18,841 4,424 47,571 3.05 1.65 1,280 26,401 27,681 71,329 03,051 145 1,168 758 5,122 1.11 0.42 0 265 265 3,799 0
28,364 6,047 16,391 2,209 53,011 1.15 0.77 2,251 19,023 21,792 49,832 21,75531,426 3,244 8,340 8,547 51,557 3.86 1.87 3,598 46,488 55,900 104,588 0
816,992 601,546 1,154,572 234,364 2,807,474 3.68 2.22 198,262 250,668 546,218 311,898 3,027,56182,506 44,101 143,237 40,811 310,655 5.98 2.93 16,926 111,795 141,553 450,627 029,833 6,584 19,216 2,583 58,216 2.51 1.02 1,350 5,832 7,747 49,800 0
333,644 208,888 365,753 102,171 1,010,456 6.12 2.23 50,152 688,563 879,852 484,410 1,311,3084,947 664 3,455 381 9,447 0.60 0.44 77 3,052 3,129 12,596 0
44,216 20,557 28,478 11,984 105,235 3.32 1.58 7,624 23,294 33,485 127,185 021,708 6,936 18,620 5,008 52,272 3.67 1.49 1,105 16,190 17,295 62,596 0
KENTUCKY PUBLIC LIBRARY STATISTICS, 2015-2016 -34
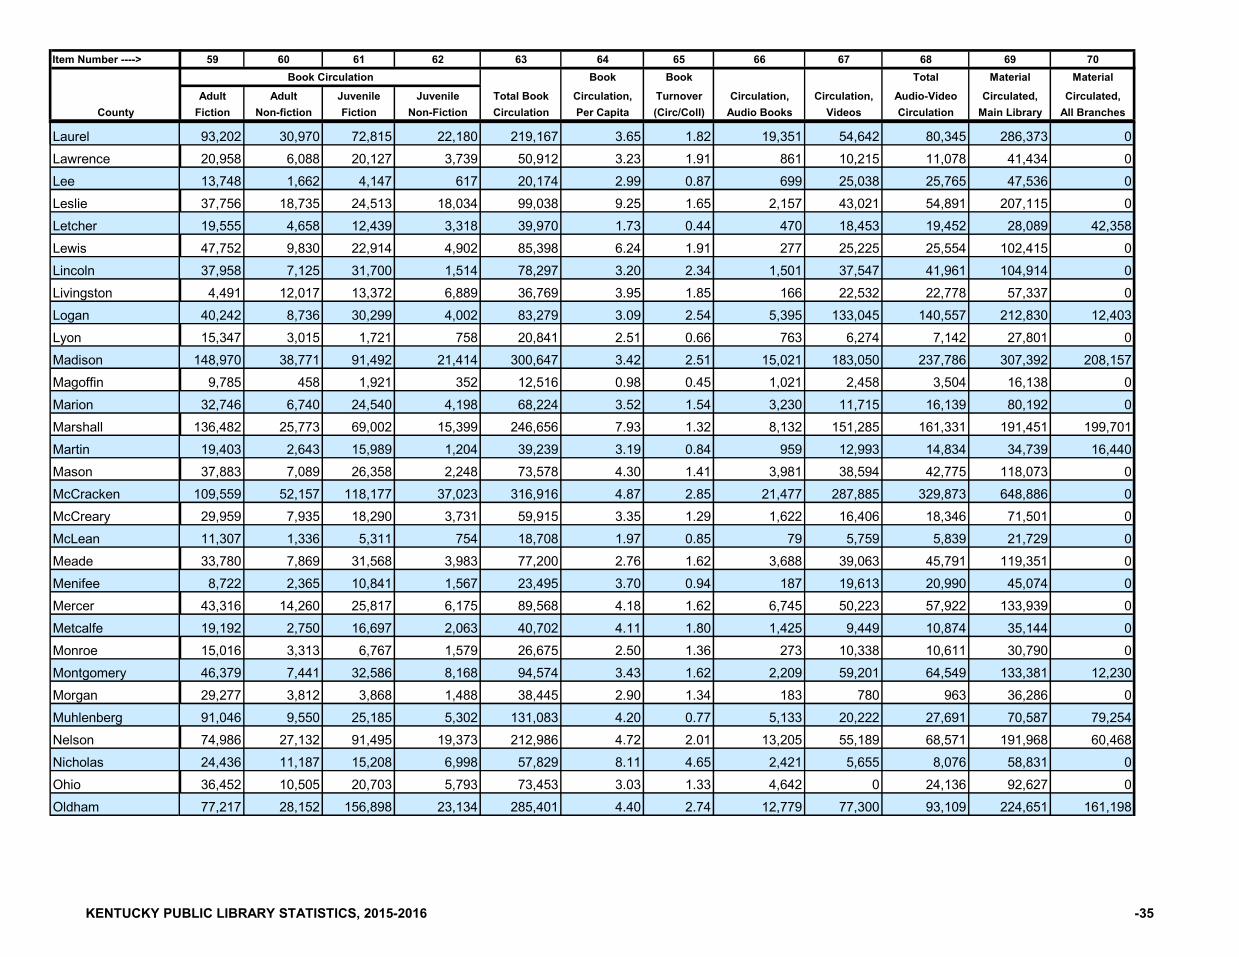
Item Number ---->
County
AdairLaurelLawrenceLeeLeslieLetcherLewisLincolnLivingstonLoganLyonMadisonMagoffinMarionMarshallMartinMasonMcCrackenMcCrearyMcLeanMeadeMenifeeMercerMetcalfeMonroeMontgomeryMorganMuhlenbergNelsonNicholasOhioOldham
59 60 61 62 63 64 65 66 67 68 69 70Book Book Total Material Material
Adult Adult Juvenile Juvenile Total Book Circulation, Turnover Circulation, Circulation, Audio-Video Circulated, Circulated,Fiction Non-fiction Fiction Non-Fiction Circulation Per Capita (Circ/Coll) Audio Books Videos Circulation Main Library All Branches
Book Circulation
93,202 30,970 72,815 22,180 219,167 3.65 1.82 19,351 54,642 80,345 286,373 020,958 6,088 20,127 3,739 50,912 3.23 1.91 861 10,215 11,078 41,434 013,748 1,662 4,147 617 20,174 2.99 0.87 699 25,038 25,765 47,536 037,756 18,735 24,513 18,034 99,038 9.25 1.65 2,157 43,021 54,891 207,115 019,555 4,658 12,439 3,318 39,970 1.73 0.44 470 18,453 19,452 28,089 42,35847,752 9,830 22,914 4,902 85,398 6.24 1.91 277 25,225 25,554 102,415 037,958 7,125 31,700 1,514 78,297 3.20 2.34 1,501 37,547 41,961 104,914 04,491 12,017 13,372 6,889 36,769 3.95 1.85 166 22,532 22,778 57,337 0
40,242 8,736 30,299 4,002 83,279 3.09 2.54 5,395 133,045 140,557 212,830 12,40315,347 3,015 1,721 758 20,841 2.51 0.66 763 6,274 7,142 27,801 0
148,970 38,771 91,492 21,414 300,647 3.42 2.51 15,021 183,050 237,786 307,392 208,1579,785 458 1,921 352 12,516 0.98 0.45 1,021 2,458 3,504 16,138 0
32,746 6,740 24,540 4,198 68,224 3.52 1.54 3,230 11,715 16,139 80,192 0136,482 25,773 69,002 15,399 246,656 7.93 1.32 8,132 151,285 161,331 191,451 199,70119,403 2,643 15,989 1,204 39,239 3.19 0.84 959 12,993 14,834 34,739 16,44037,883 7,089 26,358 2,248 73,578 4.30 1.41 3,981 38,594 42,775 118,073 0
109,559 52,157 118,177 37,023 316,916 4.87 2.85 21,477 287,885 329,873 648,886 029,959 7,935 18,290 3,731 59,915 3.35 1.29 1,622 16,406 18,346 71,501 011,307 1,336 5,311 754 18,708 1.97 0.85 79 5,759 5,839 21,729 033,780 7,869 31,568 3,983 77,200 2.76 1.62 3,688 39,063 45,791 119,351 08,722 2,365 10,841 1,567 23,495 3.70 0.94 187 19,613 20,990 45,074 0
43,316 14,260 25,817 6,175 89,568 4.18 1.62 6,745 50,223 57,922 133,939 019,192 2,750 16,697 2,063 40,702 4.11 1.80 1,425 9,449 10,874 35,144 015,016 3,313 6,767 1,579 26,675 2.50 1.36 273 10,338 10,611 30,790 046,379 7,441 32,586 8,168 94,574 3.43 1.62 2,209 59,201 64,549 133,381 12,23029,277 3,812 3,868 1,488 38,445 2.90 1.34 183 780 963 36,286 091,046 9,550 25,185 5,302 131,083 4.20 0.77 5,133 20,222 27,691 70,587 79,25474,986 27,132 91,495 19,373 212,986 4.72 2.01 13,205 55,189 68,571 191,968 60,46824,436 11,187 15,208 6,998 57,829 8.11 4.65 2,421 5,655 8,076 58,831 036,452 10,505 20,703 5,793 73,453 3.03 1.33 4,642 0 24,136 92,627 077,217 28,152 156,898 23,134 285,401 4.40 2.74 12,779 77,300 93,109 224,651 161,198
KENTUCKY PUBLIC LIBRARY STATISTICS, 2015-2016 -35
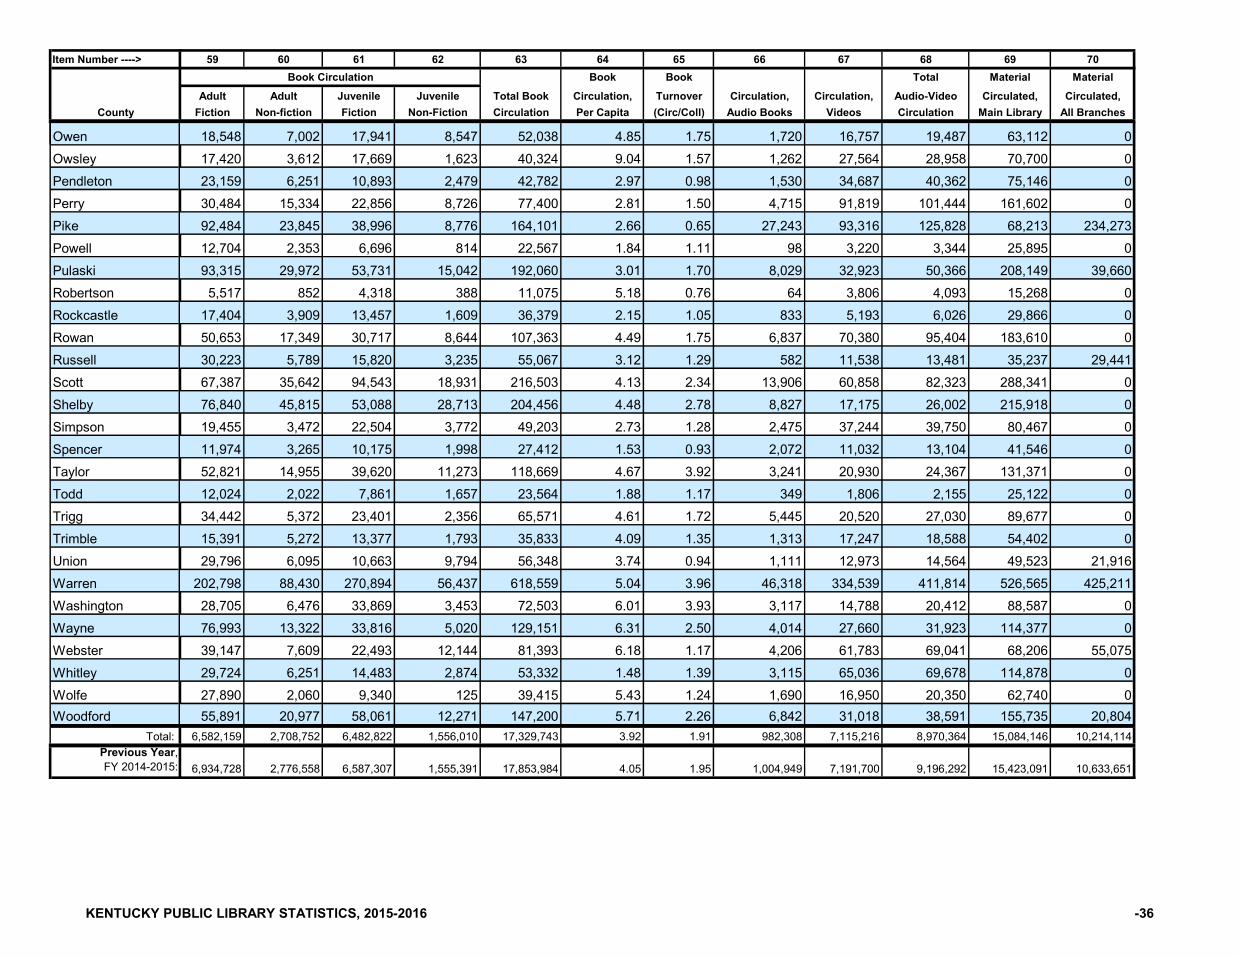
Item Number ---->
County
AdairOwenOwsleyPendletonPerryPikePowellPulaskiRobertsonRockcastleRowanRussellScottShelbySimpsonSpencerTaylorToddTriggTrimbleUnionWarrenWashingtonWayneWebsterWhitleyWolfeWoodford
Total: Previous Year,FY 2014-2015:
59 60 61 62 63 64 65 66 67 68 69 70Book Book Total Material Material
Adult Adult Juvenile Juvenile Total Book Circulation, Turnover Circulation, Circulation, Audio-Video Circulated, Circulated,Fiction Non-fiction Fiction Non-Fiction Circulation Per Capita (Circ/Coll) Audio Books Videos Circulation Main Library All Branches
Book Circulation
18,548 7,002 17,941 8,547 52,038 4.85 1.75 1,720 16,757 19,487 63,112 017,420 3,612 17,669 1,623 40,324 9.04 1.57 1,262 27,564 28,958 70,700 023,159 6,251 10,893 2,479 42,782 2.97 0.98 1,530 34,687 40,362 75,146 030,484 15,334 22,856 8,726 77,400 2.81 1.50 4,715 91,819 101,444 161,602 092,484 23,845 38,996 8,776 164,101 2.66 0.65 27,243 93,316 125,828 68,213 234,27312,704 2,353 6,696 814 22,567 1.84 1.11 98 3,220 3,344 25,895 093,315 29,972 53,731 15,042 192,060 3.01 1.70 8,029 32,923 50,366 208,149 39,6605,517 852 4,318 388 11,075 5.18 0.76 64 3,806 4,093 15,268 0
17,404 3,909 13,457 1,609 36,379 2.15 1.05 833 5,193 6,026 29,866 050,653 17,349 30,717 8,644 107,363 4.49 1.75 6,837 70,380 95,404 183,610 030,223 5,789 15,820 3,235 55,067 3.12 1.29 582 11,538 13,481 35,237 29,44167,387 35,642 94,543 18,931 216,503 4.13 2.34 13,906 60,858 82,323 288,341 076,840 45,815 53,088 28,713 204,456 4.48 2.78 8,827 17,175 26,002 215,918 019,455 3,472 22,504 3,772 49,203 2.73 1.28 2,475 37,244 39,750 80,467 011,974 3,265 10,175 1,998 27,412 1.53 0.93 2,072 11,032 13,104 41,546 052,821 14,955 39,620 11,273 118,669 4.67 3.92 3,241 20,930 24,367 131,371 012,024 2,022 7,861 1,657 23,564 1.88 1.17 349 1,806 2,155 25,122 034,442 5,372 23,401 2,356 65,571 4.61 1.72 5,445 20,520 27,030 89,677 015,391 5,272 13,377 1,793 35,833 4.09 1.35 1,313 17,247 18,588 54,402 029,796 6,095 10,663 9,794 56,348 3.74 0.94 1,111 12,973 14,564 49,523 21,916
202,798 88,430 270,894 56,437 618,559 5.04 3.96 46,318 334,539 411,814 526,565 425,21128,705 6,476 33,869 3,453 72,503 6.01 3.93 3,117 14,788 20,412 88,587 076,993 13,322 33,816 5,020 129,151 6.31 2.50 4,014 27,660 31,923 114,377 039,147 7,609 22,493 12,144 81,393 6.18 1.17 4,206 61,783 69,041 68,206 55,07529,724 6,251 14,483 2,874 53,332 1.48 1.39 3,115 65,036 69,678 114,878 027,890 2,060 9,340 125 39,415 5.43 1.24 1,690 16,950 20,350 62,740 055,891 20,977 58,061 12,271 147,200 5.71 2.26 6,842 31,018 38,591 155,735 20,804
6,582,159 2,708,752 6,482,822 1,556,010 17,329,743 3.92 1.91 982,308 7,115,216 8,970,364 15,084,146 10,214,114
6,934,728 2,776,558 6,587,307 1,555,391 17,853,984 4.05 1.95 1,004,949 7,191,700 9,196,292 15,423,091 10,633,651
KENTUCKY PUBLIC LIBRARY STATISTICS, 2015-2016 -36
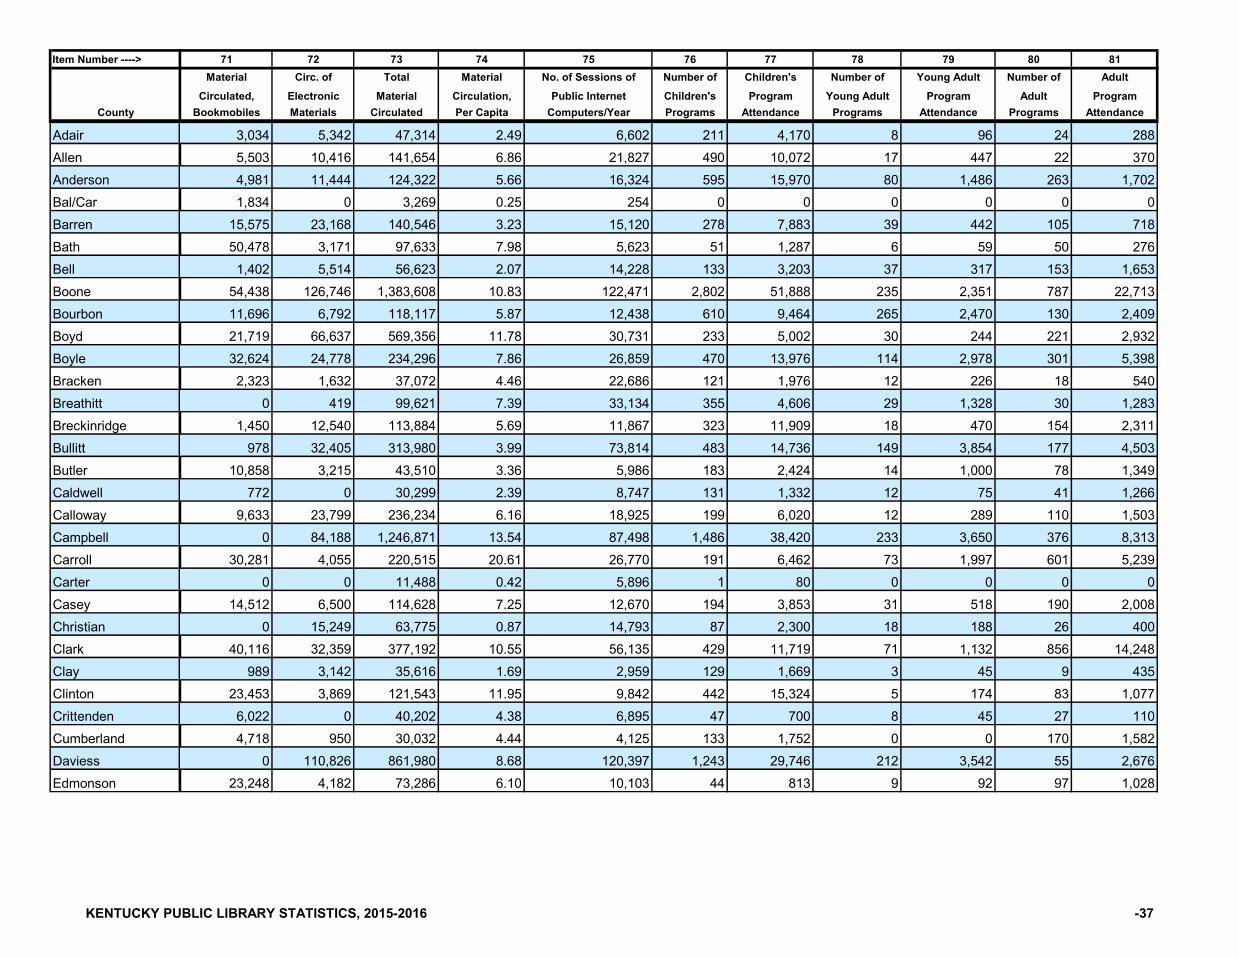
Item Number ---->
County
AdairAllenAndersonBal/CarBarrenBathBellBooneBourbonBoydBoyleBrackenBreathittBreckinridgeBullittButlerCaldwellCallowayCampbellCarrollCarterCaseyChristianClarkClayClintonCrittendenCumberlandDaviessEdmonson
71 72 73 74 75 76 77 78 79 80 81Material Circ. of Total Material No. of Sessions of Number of Children's Number of Young Adult Number of Adult
Circulated, Electronic Material Circulation, Public Internet Children's Program Young Adult Program Adult ProgramBookmobiles Materials Circulated Per Capita Computers/Year Programs Attendance Programs Attendance Programs Attendance
3,034 5,342 47,314 2.49 6,602 211 4,170 8 96 24 2885,503 10,416 141,654 6.86 21,827 490 10,072 17 447 22 3704,981 11,444 124,322 5.66 16,324 595 15,970 80 1,486 263 1,7021,834 0 3,269 0.25 254 0 0 0 0 0 0
15,575 23,168 140,546 3.23 15,120 278 7,883 39 442 105 71850,478 3,171 97,633 7.98 5,623 51 1,287 6 59 50 2761,402 5,514 56,623 2.07 14,228 133 3,203 37 317 153 1,653
54,438 126,746 1,383,608 10.83 122,471 2,802 51,888 235 2,351 787 22,71311,696 6,792 118,117 5.87 12,438 610 9,464 265 2,470 130 2,40921,719 66,637 569,356 11.78 30,731 233 5,002 30 244 221 2,93232,624 24,778 234,296 7.86 26,859 470 13,976 114 2,978 301 5,3982,323 1,632 37,072 4.46 22,686 121 1,976 12 226 18 540
0 419 99,621 7.39 33,134 355 4,606 29 1,328 30 1,2831,450 12,540 113,884 5.69 11,867 323 11,909 18 470 154 2,311
978 32,405 313,980 3.99 73,814 483 14,736 149 3,854 177 4,50310,858 3,215 43,510 3.36 5,986 183 2,424 14 1,000 78 1,349
772 0 30,299 2.39 8,747 131 1,332 12 75 41 1,2669,633 23,799 236,234 6.16 18,925 199 6,020 12 289 110 1,503
0 84,188 1,246,871 13.54 87,498 1,486 38,420 233 3,650 376 8,31330,281 4,055 220,515 20.61 26,770 191 6,462 73 1,997 601 5,239
0 0 11,488 0.42 5,896 1 80 0 0 0 014,512 6,500 114,628 7.25 12,670 194 3,853 31 518 190 2,008
0 15,249 63,775 0.87 14,793 87 2,300 18 188 26 40040,116 32,359 377,192 10.55 56,135 429 11,719 71 1,132 856 14,248
989 3,142 35,616 1.69 2,959 129 1,669 3 45 9 43523,453 3,869 121,543 11.95 9,842 442 15,324 5 174 83 1,0776,022 0 40,202 4.38 6,895 47 700 8 45 27 1104,718 950 30,032 4.44 4,125 133 1,752 0 0 170 1,582
0 110,826 861,980 8.68 120,397 1,243 29,746 212 3,542 55 2,67623,248 4,182 73,286 6.10 10,103 44 813 9 92 97 1,028
KENTUCKY PUBLIC LIBRARY STATISTICS, 2015-2016 -37
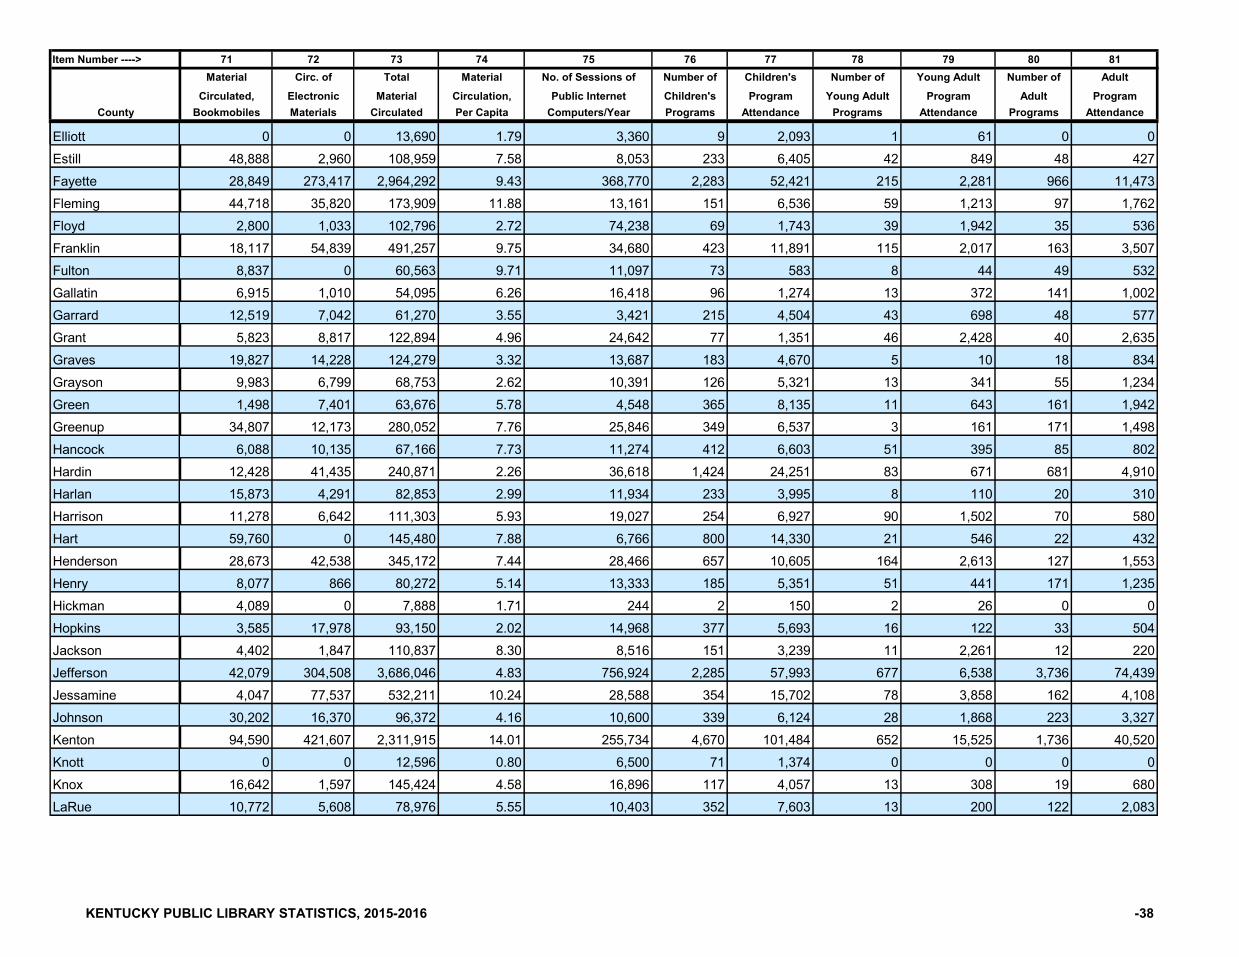
Item Number ---->
County
AdairElliottEstillFayetteFlemingFloydFranklinFultonGallatinGarrardGrantGravesGraysonGreenGreenupHancockHardinHarlanHarrisonHartHendersonHenryHickmanHopkinsJacksonJeffersonJessamineJohnsonKentonKnottKnoxLaRue
71 72 73 74 75 76 77 78 79 80 81Material Circ. of Total Material No. of Sessions of Number of Children's Number of Young Adult Number of Adult
Circulated, Electronic Material Circulation, Public Internet Children's Program Young Adult Program Adult ProgramBookmobiles Materials Circulated Per Capita Computers/Year Programs Attendance Programs Attendance Programs Attendance
0 0 13,690 1.79 3,360 9 2,093 1 61 0 048,888 2,960 108,959 7.58 8,053 233 6,405 42 849 48 42728,849 273,417 2,964,292 9.43 368,770 2,283 52,421 215 2,281 966 11,47344,718 35,820 173,909 11.88 13,161 151 6,536 59 1,213 97 1,7622,800 1,033 102,796 2.72 74,238 69 1,743 39 1,942 35 536
18,117 54,839 491,257 9.75 34,680 423 11,891 115 2,017 163 3,5078,837 0 60,563 9.71 11,097 73 583 8 44 49 5326,915 1,010 54,095 6.26 16,418 96 1,274 13 372 141 1,002
12,519 7,042 61,270 3.55 3,421 215 4,504 43 698 48 5775,823 8,817 122,894 4.96 24,642 77 1,351 46 2,428 40 2,635
19,827 14,228 124,279 3.32 13,687 183 4,670 5 10 18 8349,983 6,799 68,753 2.62 10,391 126 5,321 13 341 55 1,2341,498 7,401 63,676 5.78 4,548 365 8,135 11 643 161 1,942
34,807 12,173 280,052 7.76 25,846 349 6,537 3 161 171 1,4986,088 10,135 67,166 7.73 11,274 412 6,603 51 395 85 802
12,428 41,435 240,871 2.26 36,618 1,424 24,251 83 671 681 4,91015,873 4,291 82,853 2.99 11,934 233 3,995 8 110 20 31011,278 6,642 111,303 5.93 19,027 254 6,927 90 1,502 70 58059,760 0 145,480 7.88 6,766 800 14,330 21 546 22 43228,673 42,538 345,172 7.44 28,466 657 10,605 164 2,613 127 1,5538,077 866 80,272 5.14 13,333 185 5,351 51 441 171 1,2354,089 0 7,888 1.71 244 2 150 2 26 0 03,585 17,978 93,150 2.02 14,968 377 5,693 16 122 33 5044,402 1,847 110,837 8.30 8,516 151 3,239 11 2,261 12 220
42,079 304,508 3,686,046 4.83 756,924 2,285 57,993 677 6,538 3,736 74,4394,047 77,537 532,211 10.24 28,588 354 15,702 78 3,858 162 4,108
30,202 16,370 96,372 4.16 10,600 339 6,124 28 1,868 223 3,32794,590 421,607 2,311,915 14.01 255,734 4,670 101,484 652 15,525 1,736 40,520
0 0 12,596 0.80 6,500 71 1,374 0 0 0 016,642 1,597 145,424 4.58 16,896 117 4,057 13 308 19 68010,772 5,608 78,976 5.55 10,403 352 7,603 13 200 122 2,083
KENTUCKY PUBLIC LIBRARY STATISTICS, 2015-2016 -38
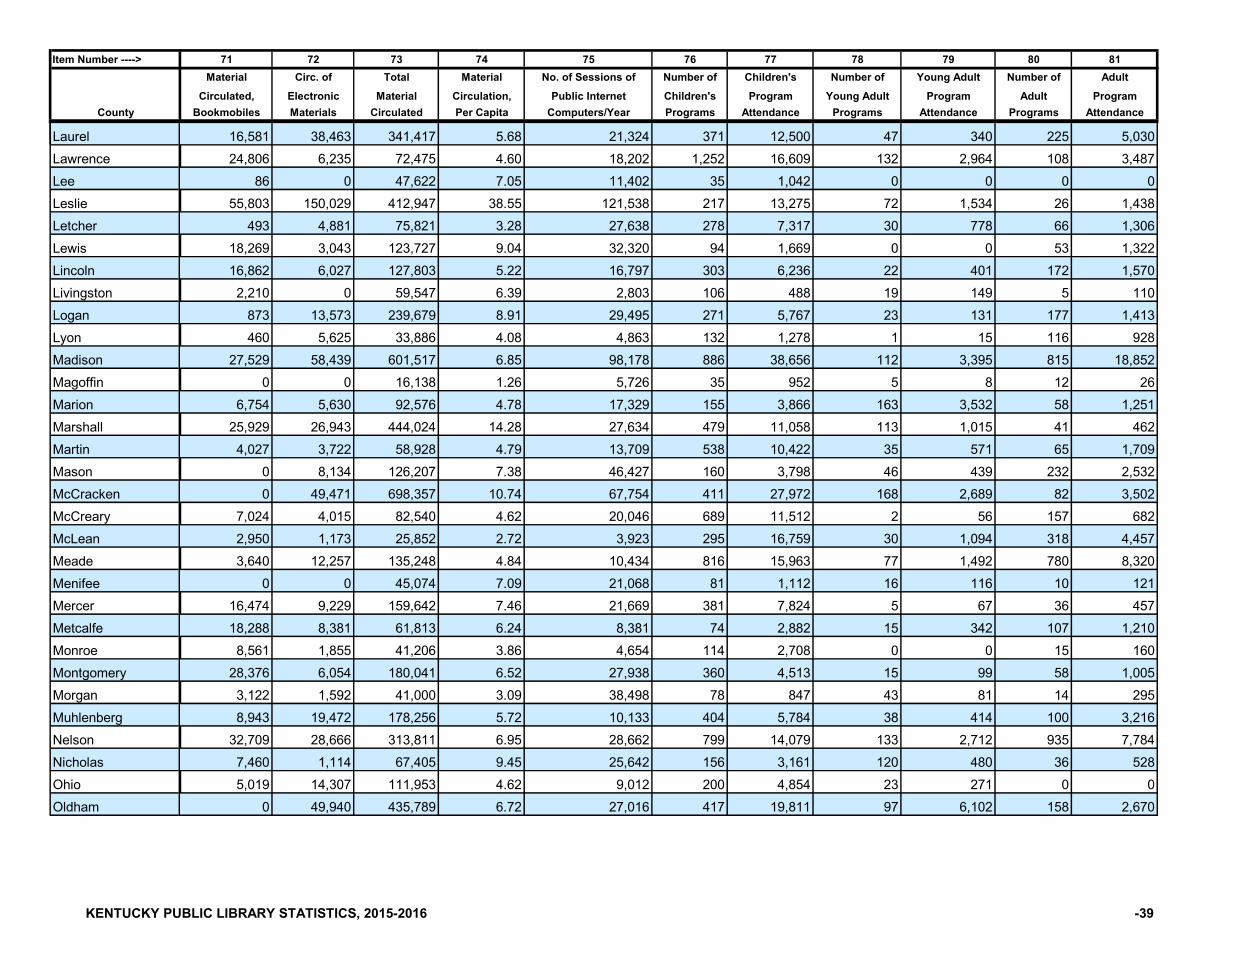
Item Number ---->
County
AdairLaurelLawrenceLeeLeslieLetcherLewisLincolnLivingstonLoganLyonMadisonMagoffinMarionMarshallMartinMasonMcCrackenMcCrearyMcLeanMeadeMenifeeMercerMetcalfeMonroeMontgomeryMorganMuhlenbergNelsonNicholasOhioOldham
71 72 73 74 75 76 77 78 79 80 81Material Circ. of Total Material No. of Sessions of Number of Children's Number of Young Adult Number of Adult
Circulated, Electronic Material Circulation, Public Internet Children's Program Young Adult Program Adult ProgramBookmobiles Materials Circulated Per Capita Computers/Year Programs Attendance Programs Attendance Programs Attendance
16,581 38,463 341,417 5.68 21,324 371 12,500 47 340 225 5,03024,806 6,235 72,475 4.60 18,202 1,252 16,609 132 2,964 108 3,487
86 0 47,622 7.05 11,402 35 1,042 0 0 0 055,803 150,029 412,947 38.55 121,538 217 13,275 72 1,534 26 1,438
493 4,881 75,821 3.28 27,638 278 7,317 30 778 66 1,30618,269 3,043 123,727 9.04 32,320 94 1,669 0 0 53 1,32216,862 6,027 127,803 5.22 16,797 303 6,236 22 401 172 1,5702,210 0 59,547 6.39 2,803 106 488 19 149 5 110
873 13,573 239,679 8.91 29,495 271 5,767 23 131 177 1,413460 5,625 33,886 4.08 4,863 132 1,278 1 15 116 928
27,529 58,439 601,517 6.85 98,178 886 38,656 112 3,395 815 18,8520 0 16,138 1.26 5,726 35 952 5 8 12 26
6,754 5,630 92,576 4.78 17,329 155 3,866 163 3,532 58 1,25125,929 26,943 444,024 14.28 27,634 479 11,058 113 1,015 41 4624,027 3,722 58,928 4.79 13,709 538 10,422 35 571 65 1,709
0 8,134 126,207 7.38 46,427 160 3,798 46 439 232 2,5320 49,471 698,357 10.74 67,754 411 27,972 168 2,689 82 3,502
7,024 4,015 82,540 4.62 20,046 689 11,512 2 56 157 6822,950 1,173 25,852 2.72 3,923 295 16,759 30 1,094 318 4,4573,640 12,257 135,248 4.84 10,434 816 15,963 77 1,492 780 8,320
0 0 45,074 7.09 21,068 81 1,112 16 116 10 12116,474 9,229 159,642 7.46 21,669 381 7,824 5 67 36 45718,288 8,381 61,813 6.24 8,381 74 2,882 15 342 107 1,2108,561 1,855 41,206 3.86 4,654 114 2,708 0 0 15 160
28,376 6,054 180,041 6.52 27,938 360 4,513 15 99 58 1,0053,122 1,592 41,000 3.09 38,498 78 847 43 81 14 2958,943 19,472 178,256 5.72 10,133 404 5,784 38 414 100 3,216
32,709 28,666 313,811 6.95 28,662 799 14,079 133 2,712 935 7,7847,460 1,114 67,405 9.45 25,642 156 3,161 120 480 36 5285,019 14,307 111,953 4.62 9,012 200 4,854 23 271 0 0
0 49,940 435,789 6.72 27,016 417 19,811 97 6,102 158 2,670
KENTUCKY PUBLIC LIBRARY STATISTICS, 2015-2016 -39

Item Number ---->
County
AdairOwenOwsleyPendletonPerryPikePowellPulaskiRobertsonRockcastleRowanRussellScottShelbySimpsonSpencerTaylorToddTriggTrimbleUnionWarrenWashingtonWayneWebsterWhitleyWolfeWoodford
Total: Previous Year,FY 2014-2015:
71 72 73 74 75 76 77 78 79 80 81Material Circ. of Total Material No. of Sessions of Number of Children's Number of Young Adult Number of Adult
Circulated, Electronic Material Circulation, Public Internet Children's Program Young Adult Program Adult ProgramBookmobiles Materials Circulated Per Capita Computers/Year Programs Attendance Programs Attendance Programs Attendance
8,664 3,263 75,039 6.99 17,718 163 5,486 88 1,469 86 4,055274 0 70,974 15.91 26,959 39 33 15 10 3 8
8,524 5,434 89,104 6.18 15,565 125 5,374 50 950 93 1,23719,791 17,740 199,133 7.22 20,077 111 3,169 53 383 123 2,786
0 56,961 359,447 5.82 93,764 491 6,746 66 483 566 6,3331,963 4,493 32,351 2.64 10,123 219 4,970 60 1,243 41 2557,670 24,185 279,664 4.38 108,593 2,934 79,510 956 12,692 644 7,373
80 0 15,348 7.18 6,580 55 1,332 16 320 39 26213,680 4,771 48,317 2.85 6,919 111 1,526 5 22 24 15321,936 11,775 217,321 9.10 21,384 202 4,795 76 1,256 164 1,8863,870 4,608 73,156 4.14 8,500 338 11,736 1 400 11 698
13,669 42,828 344,838 6.58 26,200 561 13,676 73 1,119 124 2,44719,655 20,193 255,766 5.60 22,744 410 11,182 43 285 485 5,9838,979 6,336 95,782 5.32 14,217 95 1,863 19 641 69 834
50 6,869 48,465 2.71 7,734 126 3,743 52 1,179 204 1,89114,402 14,076 159,849 6.29 20,572 485 9,600 172 1,262 283 4,9766,887 1,263 33,272 2.66 5,297 93 1,405 12 105 5 264,026 8,081 101,784 7.15 24,671 250 3,432 154 1,948 63 9301,561 365 56,328 6.42 11,786 113 3,397 21 399 44 515
0 4,485 75,924 5.04 11,513 1,270 24,447 35 850 15 1,12578,597 61,439 1,091,812 8.89 105,797 1,678 37,325 201 4,340 290 15,3054,545 1,291 94,423 7.83 9,795 692 8,538 10 119 55 451
58,118 13,554 186,049 9.09 12,218 111 2,823 9 397 38 25030,161 0 153,442 11.65 20,575 258 1,933 10 759 36 45512,933 8,657 136,468 3.78 23,021 294 6,375 53 647 28 461
0 560 63,300 8.72 12,790 47 2,265 4 50 4 1511,490 20,432 208,461 8.08 23,486 1,020 19,920 69 834 349 3,762
1,663,576 2,883,765 29,845,601 6.74 4,163,635 52,307 1,219,016 8,236 145,008 23,228 392,307
1,708,296 2,668,225 30,434,823 6.90 4,404,673 59,612 1,481,367 7,205 126,791 21,548 339,100
KENTUCKY PUBLIC LIBRARY STATISTICS, 2015-2016 -40

Item Number ---->
County
AdairAllenAndersonBal/CarBarrenBathBellBooneBourbonBoydBoyleBrackenBreathittBreckinridgeBullittButlerCaldwellCallowayCampbellCarrollCarterCaseyChristianClarkClayClintonCrittendenCumberlandDaviessEdmonson
82 83 84 85 86 87 88 89 90 91 92 93Number of Other Total Total Total Total Annual Number of Internet Terminals Patrons Formally Weeks
Other Program Number of Program Reference Material Material Wireless Web User Used by Trained to Use Main LibraryPrograms Attendance Programs Attendance Transactions Loaned Borrowed Sessions Sessions General Public Electronic Resources Is Open
85 3,513 328 8,067 1,775 11 523 4,650 2,275 15 54 5259 2,692 588 13,581 4,876 583 695 7,800 12,958 20 7 520 0 938 19,158 8,007 479 575 6,300 15,324 19 83 520 0 0 0 84 0 6 2 1 32
52 975 474 10,018 15,655 0 410 7,678 55,747 34 200 5248 985 155 2,607 22,930 0 44 3,300 19 8 5242 1,233 365 6,406 12,107 611 380 19,406 29,553 17 2,192 51
359 104,507 4,183 181,459 282,943 3,384 2,682 120,000 782,590 148 350 526 653 1,011 14,996 8,130 0 320 24,263 31,300 24 67 52
30 4,244 514 12,422 40,706 1,557 1,798 73,000 45,645 64 40 52189 5,020 1,074 27,372 4,712 368 885 62,909 26,859 59 584 5238 1,686 189 4,428 498 0 84 17,846 4,822 16 5 526 1,108 420 8,325 7,425 5 0 10,247 374,900 22 5 52
106 4,326 601 19,016 20,002 0 243 16,805 144,142 20 5 52248 7,584 1,057 30,677 19,644 271 1,105 53,859 168,090 80 222 5219 461 294 5,234 3,996 0 296 31,200 11 0 512 30 186 2,703 10,069 0 151 1,722 7,449 12 10 52
25 1,730 346 9,542 2,237 2 326 33,120 29,920 13 52 52480 6,276 2,575 56,659 111,865 3,636 4,585 38,845 338,212 93 278 52156 5,557 1,021 19,255 8,854 0 166 75,659 34,298 30 2,208 52
0 0 1 80 527 0 0 2,356 10 8 52133 1,760 548 8,139 3,686 817 0 45,666 337,951 18 690 5227 2,806 158 5,694 3,360 47 73 14,793 19 0 52
135 9,698 1,491 36,797 23,254 1,696 1,143 28,911 56,135 15 168 5211 733 152 2,882 4,337 0 125 2,949 5,688 8 0 5226 1,074 556 17,649 7,561 0 138 600 12 4 528 184 90 1,039 12,646 0 121 9,100 8,008 11 12 521 80 304 3,414 11,760 0 274 5,000 2,643 8 10 52
201 14,529 1,711 50,493 330,765 5,826 1,420 72,571 262,170 77 20 528 1,941 158 3,874 3,498 0 97 18,250 9,945 33 8 52
KENTUCKY PUBLIC LIBRARY STATISTICS, 2015-2016 -41

Item Number ---->
County
AdairElliottEstillFayetteFlemingFloydFranklinFultonGallatinGarrardGrantGravesGraysonGreenGreenupHancockHardinHarlanHarrisonHartHendersonHenryHickmanHopkinsJacksonJeffersonJessamineJohnsonKentonKnottKnoxLaRue
82 83 84 85 86 87 88 89 90 91 92 93Number of Other Total Total Total Total Annual Number of Internet Terminals Patrons Formally Weeks
Other Program Number of Program Reference Material Material Wireless Web User Used by Trained to Use Main LibraryPrograms Attendance Programs Attendance Transactions Loaned Borrowed Sessions Sessions General Public Electronic Resources Is Open
0 0 10 2,154 2,120 0 0 2,600 2,040 11 262 5212 661 335 8,342 1,277 0 321 7,969 8,053 15 0 52
553 22,636 4,017 88,811 626,692 1,990 3,767 914,931 8,211,926 272 2,772 524 768 311 10,279 668 6 305 10,980 13,266 39 51 52
124 2,603 267 6,824 17,000 12 59 33,252 38 55 52168 7,953 869 25,368 28,550 2,043 568 71,198 84,755 51 82 52
6 162 136 1,321 1,331 148 212 5,860 2,427 32 55 5251 2,557 301 5,205 6,919 0 788 10,587 3,502 40 77 5249 2,015 355 7,794 2,146 0 1,574 2,907 20 165 498 216 171 6,630 1,794 174 417 8,677 15,965 28 42 52
32 859 238 6,373 3,137 125 207 11,687 13,687 34 260 5222 2,560 216 9,456 4,575 182 1,020 4,105 9 24 5259 1,348 596 12,068 3,880 0 219 1,007 5,555 15 11 52
198 6,337 721 14,533 49,503 0 105 32,500 2,423 45 391 5232 1,100 580 8,900 7,053 1 745 1,821 387,995 26 34 504 242 2,192 30,074 8,239 60 1,976 6,006 36,618 44 214 524 276 265 4,691 7,411 165 122 2,136 57,314 23 5 52
53 4,012 467 13,021 666 0 279 9,692 19,027 29 30 5218 4,580 861 19,888 7,502 269 242 920 1,280 11 24 5259 1,498 1,007 16,269 58,509 2,995 1,206 5,215 133,387 40 557 520 0 407 7,027 18,940 20 163 14,232 67,258 16 104 524 86 8 262 154 0 0 3 0 50
20 1,754 446 8,073 4,940 0 146 11,169 19 12 4452 898 226 6,618 8,450 0 50 1,700 1,673 16 275 52
5,081 181,578 11,779 320,548 1,115,610 2,303 1,108 210,906 2,433,249 727 2,862 52216 23,312 810 46,980 44,672 1,650 688 19,432 16,543 69 763 52187 3,934 777 15,253 76,392 0 1,734 1,259 19,553 18 12 52374 32,806 7,432 190,335 240,279 1,256 4,060 108,855 255,734 266 3,193 5215 50 86 1,424 5,526 0 57 4,000 1,000 10 0 5233 954 182 5,999 10,746 510 417 19,643 24,932 12 36 5123 1,333 510 11,219 9,163 39 187 2,209 21,108 19 98 52
KENTUCKY PUBLIC LIBRARY STATISTICS, 2015-2016 -42
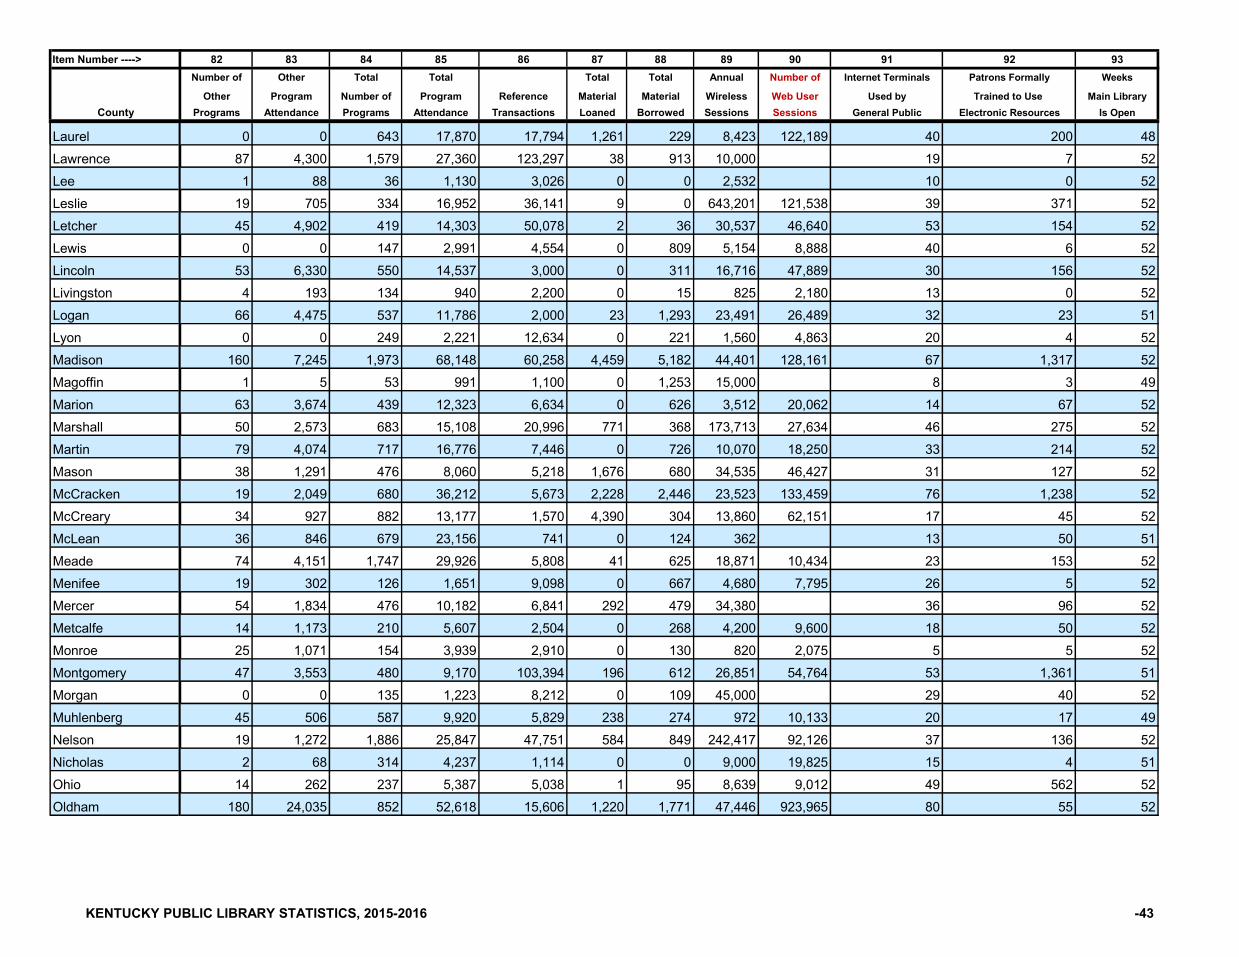
Item Number ---->
County
AdairLaurelLawrenceLeeLeslieLetcherLewisLincolnLivingstonLoganLyonMadisonMagoffinMarionMarshallMartinMasonMcCrackenMcCrearyMcLeanMeadeMenifeeMercerMetcalfeMonroeMontgomeryMorganMuhlenbergNelsonNicholasOhioOldham
82 83 84 85 86 87 88 89 90 91 92 93Number of Other Total Total Total Total Annual Number of Internet Terminals Patrons Formally Weeks
Other Program Number of Program Reference Material Material Wireless Web User Used by Trained to Use Main LibraryPrograms Attendance Programs Attendance Transactions Loaned Borrowed Sessions Sessions General Public Electronic Resources Is Open
0 0 643 17,870 17,794 1,261 229 8,423 122,189 40 200 4887 4,300 1,579 27,360 123,297 38 913 10,000 19 7 521 88 36 1,130 3,026 0 0 2,532 10 0 52
19 705 334 16,952 36,141 9 0 643,201 121,538 39 371 5245 4,902 419 14,303 50,078 2 36 30,537 46,640 53 154 520 0 147 2,991 4,554 0 809 5,154 8,888 40 6 52
53 6,330 550 14,537 3,000 0 311 16,716 47,889 30 156 524 193 134 940 2,200 0 15 825 2,180 13 0 52
66 4,475 537 11,786 2,000 23 1,293 23,491 26,489 32 23 510 0 249 2,221 12,634 0 221 1,560 4,863 20 4 52
160 7,245 1,973 68,148 60,258 4,459 5,182 44,401 128,161 67 1,317 521 5 53 991 1,100 0 1,253 15,000 8 3 49
63 3,674 439 12,323 6,634 0 626 3,512 20,062 14 67 5250 2,573 683 15,108 20,996 771 368 173,713 27,634 46 275 5279 4,074 717 16,776 7,446 0 726 10,070 18,250 33 214 5238 1,291 476 8,060 5,218 1,676 680 34,535 46,427 31 127 5219 2,049 680 36,212 5,673 2,228 2,446 23,523 133,459 76 1,238 5234 927 882 13,177 1,570 4,390 304 13,860 62,151 17 45 5236 846 679 23,156 741 0 124 362 13 50 5174 4,151 1,747 29,926 5,808 41 625 18,871 10,434 23 153 5219 302 126 1,651 9,098 0 667 4,680 7,795 26 5 5254 1,834 476 10,182 6,841 292 479 34,380 36 96 5214 1,173 210 5,607 2,504 0 268 4,200 9,600 18 50 5225 1,071 154 3,939 2,910 0 130 820 2,075 5 5 5247 3,553 480 9,170 103,394 196 612 26,851 54,764 53 1,361 510 0 135 1,223 8,212 0 109 45,000 29 40 52
45 506 587 9,920 5,829 238 274 972 10,133 20 17 4919 1,272 1,886 25,847 47,751 584 849 242,417 92,126 37 136 522 68 314 4,237 1,114 0 0 9,000 19,825 15 4 51
14 262 237 5,387 5,038 1 95 8,639 9,012 49 562 52180 24,035 852 52,618 15,606 1,220 1,771 47,446 923,965 80 55 52
KENTUCKY PUBLIC LIBRARY STATISTICS, 2015-2016 -43

Item Number ---->
County
AdairOwenOwsleyPendletonPerryPikePowellPulaskiRobertsonRockcastleRowanRussellScottShelbySimpsonSpencerTaylorToddTriggTrimbleUnionWarrenWashingtonWayneWebsterWhitleyWolfeWoodford
Total: Previous Year,FY 2014-2015:
82 83 84 85 86 87 88 89 90 91 92 93Number of Other Total Total Total Total Annual Number of Internet Terminals Patrons Formally Weeks
Other Program Number of Program Reference Material Material Wireless Web User Used by Trained to Use Main LibraryPrograms Attendance Programs Attendance Transactions Loaned Borrowed Sessions Sessions General Public Electronic Resources Is Open
0 0 337 11,010 3,640 193 397 3,558 17,718 30 135 529 41 66 92 26,232 0 182 7,902 18 4 52
77 2,597 345 10,158 1,679 0 470 5,595 118,906 28 82 51117 5,716 404 12,054 1,636 0 286 16,260 46,140 41 6 51365 6,299 1,488 19,861 136,728 0 725 58,684 1,238,076 198 1,984 52
3 580 323 7,048 2,011 0 121 1,784 8,010 10 4 52772 43,954 5,306 143,529 20,242 198 1,530 31,380 51,493 76 350 5145 856 155 2,770 3,996 0 885 5,972 4,680 19 0 5219 931 159 2,632 1,038 0 456 551 6,919 17 882 5271 2,948 513 10,885 17,904 883 464 48,180 69,564 61 768 520 0 350 12,834 3,188 0 495 11,440 14,538 14 0 52
87 6,258 845 23,500 13,321 234 330 51,693 150,012 49 469 42198 3,538 1,136 20,988 23,942 338 374 15,000 20,224 44 588 5226 2,998 209 6,336 12,174 0 485 3,391 11,233 13 1 503 80 385 6,893 2,045 0 429 6,029 21,579 22 38 52
38 1,245 978 17,083 15,027 0 805 5,389 20,570 25 5 520 0 110 1,536 4,396 59 302 7,965 5 3 50
58 820 525 7,130 196 0 262 24,671 98,254 24 398 5245 2,082 223 6,393 3,370 238 316 4,387 5,689 41 210 52
145 5,550 1,465 31,972 3,460 0 217 1,432 60 120 520 0 2,169 56,970 68,653 1,683 1,744 45,659 438,317 92 281 52
48 1,658 805 10,766 13,903 0 254 4,940 9,760 12 29 5238 4,452 196 7,922 10,885 0 119 7,583 12,218 12 89 520 0 304 3,147 8,993 0 67 34,778 14 8 52
273 10,216 648 17,699 16,663 212 712 7,162 137,953 54 59 52137 2,110 192 4,440 8,910 4 380 6,570 18 4 5278 4,816 1,516 29,332 7,107 480 1,514 16,073 250,390 48 160 52
13,861 686,122 97,632 2,442,453 4,371,557 55,192 77,143 4,263,616 19,357,049 4,963 33,175 6,119
5,761 262,303 95,029 2,209,558 4,282,701 52,914 72,733 3,781,523 new 4,893 35,382 6,145
KENTUCKY PUBLIC LIBRARY STATISTICS, 2015-2016 -44

1 2+3+4 5 9 10 11 17Local Total Collection
Government Other Operating Salary, Total Fringe ExpendituresCounty Population Revenue Revenue Revenue Director Salaries Benefits Total
Jefferson 763,623 1 $17,260,520 1 $690,951 2 $17,951,471 1 $135,002 2 $9,474,172 1 $3,324,957 1 $2,385,179 1Fayette 314,488 2 $14,634,159 2 $1,191,085 1 $15,825,244 2 $145,294 1 $6,603,976 2 $2,162,637 2 $1,998,121 2Kenton 165,012 3 $13,044,285 3 $363,894 5 $13,408,179 3 $123,508 3 $5,717,351 3 $1,851,186 3 $1,627,714 3Boone 127,712 4 $7,288,504 4 $241,598 14 $7,530,102 4 $92,177 7 $3,434,291 4 $1,169,511 4 $905,632 4Warren 122,851 5 $3,734,103 9 $187,706 20 $3,921,809 9 $99,828 5 $1,369,231 8 $580,711 7 $523,975 10Hardin 106,439 6 $840,000 49 $110,984 36 $950,984 50 $78,687 17 $436,564 33 $168,885 31 $129,324 33Daviess 99,259 7 $4,063,485 8 $500,428 3 $4,563,913 7 $45,472 68 $1,627,455 7 $513,488 10 $495,751 11Campbell 92,066 8 $4,541,091 6 $301,123 8 $4,842,214 6 $90,262 9 $2,128,476 5 $710,181 5 $644,423 7Madison 87,824 9 $2,930,700 10 $174,255 24 $3,104,955 11 $73,979 21 $1,151,987 12 $525,252 8 $360,563 14Bullitt 78,702 10 $6,086,728 5 $280,604 10 $6,367,332 5 $86,625 13 $1,651,022 6 $598,723 6 $530,130 9Christian 73,309 11 $639,636 67 $179,705 22 $819,341 57 $31,489 104 $278,981 53 $85,402 69 $93,351 48McCracken 65,018 12 $2,866,517 12 $236,832 15 $3,103,349 12 $88,370 11 $1,284,060 11 $497,000 12 $689,900 5Oldham 64,875 13 $2,314,729 20 $372,839 4 $2,687,568 17 $97,262 6 $1,033,983 13 $311,457 22 $152,179 27Pulaski 63,782 14 $2,492,329 19 $148,768 30 $2,641,097 19 $56,042 47 $656,525 24 $312,712 21 $151,227 28Pike 61,792 15 $2,718,558 14 $188,486 19 $2,907,044 14 $91,296 8 $754,742 21 $268,167 23 $176,468 24Laurel 60,094 16 $2,511,011 17 $268,497 11 $2,779,508 15 $65,000 30 $826,599 20 $394,137 17 $252,139 18Scott 52,420 17 $2,537,297 15 $67,193 57 $2,604,490 20 $79,433 16 $966,231 16 $385,058 18 $259,476 17Jessamine 51,961 18 $4,296,669 7 $108,861 37 $4,405,530 8 $90,000 10 $1,356,174 10 $515,616 9 $629,570 8Franklin 50,375 19 $2,926,864 11 $173,084 25 $3,099,948 13 $107,081 4 $1,356,753 9 $494,161 13 $437,993 12Boyd 48,325 20 $2,861,495 13 $264,802 12 $3,126,297 10 $73,019 24 $1,001,858 15 $497,206 11 $680,425 6Henderson 46,407 21 $2,532,740 16 $192,046 18 $2,724,786 16 $84,165 15 $940,760 17 $410,327 15 $380,263 13Hopkins 46,222 22 $463,000 80 $95,788 43 $558,788 78 $42,494 79 $227,557 64 $36,294 98 $49,751 79Shelby 45,632 23 $1,214,041 35 $77,044 49 $1,291,085 36 $73,493 22 $360,644 41 $125,422 46 $105,230 44Nelson 45,126 24 $2,509,504 18 $156,779 29 $2,666,283 18 $86,507 14 $1,010,428 14 $409,629 16 $228,787 22Barren 43,570 25 $765,584 55 $64,484 60 $830,068 55 $59,884 42 $288,776 50 $99,516 58 $108,611 43Calloway 38,343 26 $1,592,087 25 $77,050 48 $1,669,137 25 $61,816 37 $389,147 34 $147,554 34 $282,928 15Floyd 37,756 27 $1,347,024 30 $26,650 97 $1,373,674 32 $66,831 29 $448,286 32 $129,578 45 $214,751 23Graves 37,421 28 $1,092,845 40 $51,671 63 $1,144,516 40 $47,250 64 $232,441 61 $137,515 41 $103,847 45Whitley 36,129 29 $701,908 61 $49,621 67 $751,529 64 $55,211 51 $204,802 72 $48,873 89 $88,439 52Greenup 36,068 30 $1,839,266 24 $125,734 34 $1,965,000 24 $72,644 25 $566,219 26 $49,899 85 $232,760 21Clark 35,757 31 $2,013,708 23 $161,187 28 $2,174,895 23 $69,238 26 $875,607 19 $376,823 19 $236,469 20
RANK
Item Number ----> RANK
RANK
RANK
RANK
RANK
RANK
RANK
SELECT STATISTICS, BY KENTUCKY POPULATION, 2015-2016 -45
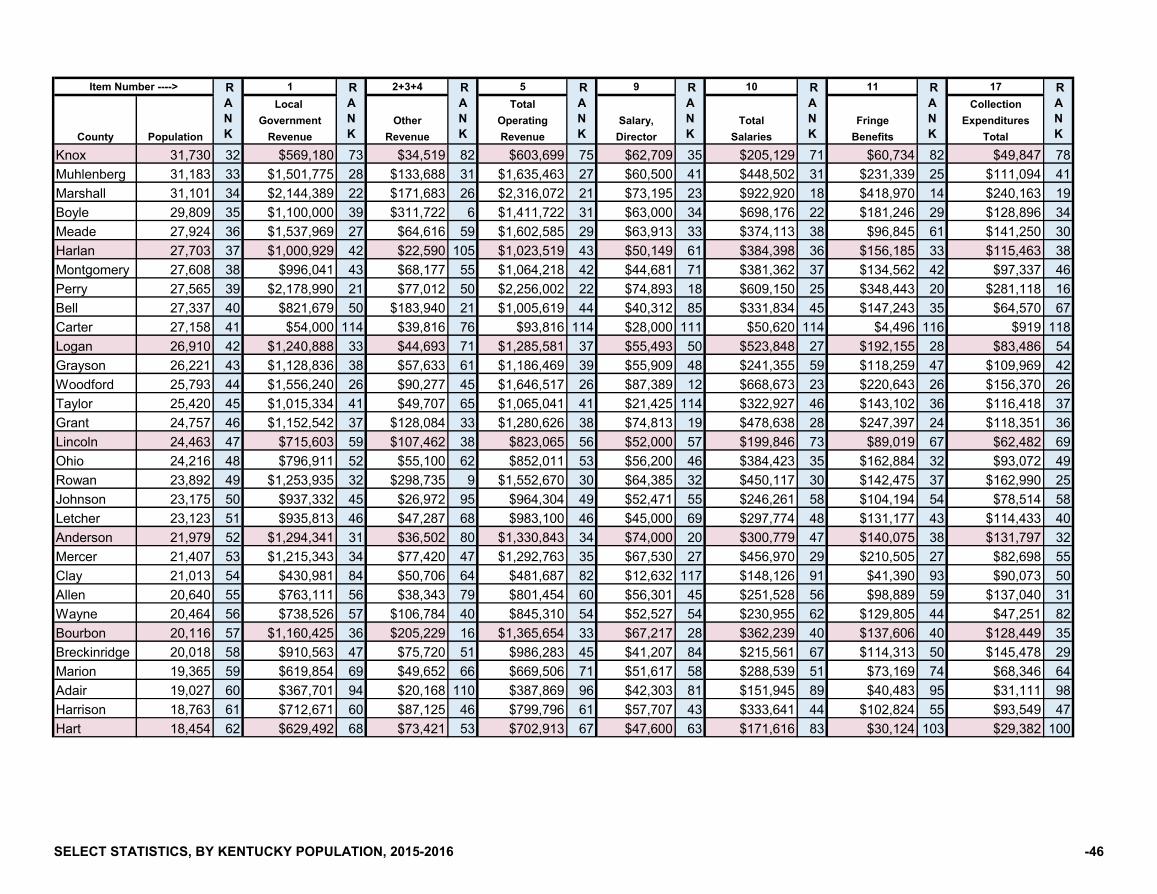
1 2+3+4 5 9 10 11 17Local Total Collection
Government Other Operating Salary, Total Fringe ExpendituresCounty Population Revenue Revenue Revenue Director Salaries Benefits Total
RANK
Item Number ----> RANK
RANK
RANK
RANK
RANK
RANK
RANK
Knox 31,730 32 $569,180 73 $34,519 82 $603,699 75 $62,709 35 $205,129 71 $60,734 82 $49,847 78Muhlenberg 31,183 33 $1,501,775 28 $133,688 31 $1,635,463 27 $60,500 41 $448,502 31 $231,339 25 $111,094 41Marshall 31,101 34 $2,144,389 22 $171,683 26 $2,316,072 21 $73,195 23 $922,920 18 $418,970 14 $240,163 19Boyle 29,809 35 $1,100,000 39 $311,722 6 $1,411,722 31 $63,000 34 $698,176 22 $181,246 29 $128,896 34Meade 27,924 36 $1,537,969 27 $64,616 59 $1,602,585 29 $63,913 33 $374,113 38 $96,845 61 $141,250 30Harlan 27,703 37 $1,000,929 42 $22,590 105 $1,023,519 43 $50,149 61 $384,398 36 $156,185 33 $115,463 38Montgomery 27,608 38 $996,041 43 $68,177 55 $1,064,218 42 $44,681 71 $381,362 37 $134,562 42 $97,337 46Perry 27,565 39 $2,178,990 21 $77,012 50 $2,256,002 22 $74,893 18 $609,150 25 $348,443 20 $281,118 16Bell 27,337 40 $821,679 50 $183,940 21 $1,005,619 44 $40,312 85 $331,834 45 $147,243 35 $64,570 67Carter 27,158 41 $54,000 114 $39,816 76 $93,816 114 $28,000 111 $50,620 114 $4,496 116 $919 118Logan 26,910 42 $1,240,888 33 $44,693 71 $1,285,581 37 $55,493 50 $523,848 27 $192,155 28 $83,486 54Grayson 26,221 43 $1,128,836 38 $57,633 61 $1,186,469 39 $55,909 48 $241,355 59 $118,259 47 $109,969 42Woodford 25,793 44 $1,556,240 26 $90,277 45 $1,646,517 26 $87,389 12 $668,673 23 $220,643 26 $156,370 26Taylor 25,420 45 $1,015,334 41 $49,707 65 $1,065,041 41 $21,425 114 $322,927 46 $143,102 36 $116,418 37Grant 24,757 46 $1,152,542 37 $128,084 33 $1,280,626 38 $74,813 19 $478,638 28 $247,397 24 $118,351 36Lincoln 24,463 47 $715,603 59 $107,462 38 $823,065 56 $52,000 57 $199,846 73 $89,019 67 $62,482 69Ohio 24,216 48 $796,911 52 $55,100 62 $852,011 53 $56,200 46 $384,423 35 $162,884 32 $93,072 49Rowan 23,892 49 $1,253,935 32 $298,735 9 $1,552,670 30 $64,385 32 $450,117 30 $142,475 37 $162,990 25Johnson 23,175 50 $937,332 45 $26,972 95 $964,304 49 $52,471 55 $246,261 58 $104,194 54 $78,514 58Letcher 23,123 51 $935,813 46 $47,287 68 $983,100 46 $45,000 69 $297,774 48 $131,177 43 $114,433 40Anderson 21,979 52 $1,294,341 31 $36,502 80 $1,330,843 34 $74,000 20 $300,779 47 $140,075 38 $131,797 32Mercer 21,407 53 $1,215,343 34 $77,420 47 $1,292,763 35 $67,530 27 $456,970 29 $210,505 27 $82,698 55Clay 21,013 54 $430,981 84 $50,706 64 $481,687 82 $12,632 117 $148,126 91 $41,390 93 $90,073 50Allen 20,640 55 $763,111 56 $38,343 79 $801,454 60 $56,301 45 $251,528 56 $98,889 59 $137,040 31Wayne 20,464 56 $738,526 57 $106,784 40 $845,310 54 $52,527 54 $230,955 62 $129,805 44 $47,251 82Bourbon 20,116 57 $1,160,425 36 $205,229 16 $1,365,654 33 $67,217 28 $362,239 40 $137,606 40 $128,449 35Breckinridge 20,018 58 $910,563 47 $75,720 51 $986,283 45 $41,207 84 $215,561 67 $114,313 50 $145,478 29Marion 19,365 59 $619,854 69 $49,652 66 $669,506 71 $51,617 58 $288,539 51 $73,169 74 $68,346 64Adair 19,027 60 $367,701 94 $20,168 110 $387,869 96 $42,303 81 $151,945 89 $40,483 95 $31,111 98Harrison 18,763 61 $712,671 60 $87,125 46 $799,796 61 $57,707 43 $333,641 44 $102,824 55 $93,549 47Hart 18,454 62 $629,492 68 $73,421 53 $702,913 67 $47,600 63 $171,616 83 $30,124 103 $29,382 100
SELECT STATISTICS, BY KENTUCKY POPULATION, 2015-2016 -46

1 2+3+4 5 9 10 11 17Local Total Collection
Government Other Operating Salary, Total Fringe ExpendituresCounty Population Revenue Revenue Revenue Director Salaries Benefits Total
RANK
Item Number ----> RANK
RANK
RANK
RANK
RANK
RANK
RANK
Simpson 18,006 63 $809,713 51 $68,126 56 $877,839 52 $43,709 74 $207,989 69 $85,732 68 $79,912 57Spencer 17,894 64 $540,918 76 $175,602 23 $716,520 65 $52,008 56 $189,857 79 $81,305 71 $44,295 86McCreary 17,878 65 $372,130 93 $65,888 58 $438,018 88 $50,481 60 $196,476 75 $46,255 91 $56,886 73Russell 17,662 66 $642,203 65 $44,347 72 $686,550 69 $40,000 86 $248,348 57 $109,816 52 $35,867 91Garrard 17,237 67 $572,455 71 $38,936 78 $611,391 74 $55,160 52 $183,724 82 $65,174 79 $53,565 76Mason 17,099 68 $843,148 48 $128,391 32 $971,539 48 $55,798 49 $229,830 63 $90,237 66 $69,441 63Rockcastle 16,942 69 $376,273 92 $23,692 102 $399,965 94 $32,396 103 $131,182 95 $44,614 92 $23,098 105Casey 15,808 70 $548,408 74 $107,453 39 $655,861 72 $48,000 62 $265,566 55 $90,982 65 $57,384 72Lawrence 15,745 71 $1,413,232 29 $199,258 17 $1,612,490 28 $45,000 69 $223,168 66 $65,938 78 $47,510 80Knott 15,693 72 $49,351 115 $19,560 111 $68,911 115 $27,118 112 $39,088 115 $10,262 114 $6,735 114Henry 15,620 73 $771,731 54 $41,187 73 $812,918 58 $61,333 38 $282,815 52 $115,999 48 $65,133 66Union 15,050 74 $775,376 53 $32,111 83 $807,487 59 $60,702 39 $364,648 39 $102,313 56 $77,596 59Fleming 14,637 75 $541,326 75 $256,551 13 $797,877 62 $42,400 80 $186,911 81 $68,397 76 $47,274 81Pendleton 14,408 76 $719,190 58 $45,234 70 $764,424 63 $46,149 65 $233,274 60 $81,819 70 $62,085 70Estill 14,375 77 $604,142 70 $40,876 74 $645,018 73 $44,506 72 $199,381 74 $81,035 73 $54,572 75LaRue 14,241 78 $448,216 81 $22,395 106 $470,611 83 $35,000 98 $152,665 88 $72,161 75 $52,003 77Trigg 14,233 79 $382,460 90 $71,527 54 $453,987 86 $38,500 88 $131,726 94 $107,590 53 $75,675 60Lewis 13,682 80 $335,943 97 $105,497 41 $441,440 87 $38,500 88 $102,505 105 $49,562 86 $43,425 87Breathitt 13,484 81 $506,751 77 $25,842 100 $532,593 79 $33,718 100 $117,599 99 $137,658 39 $33,862 96Jackson 13,352 82 $394,563 87 $32,036 84 $426,599 90 $45,968 66 $292,392 49 $81,139 72 $42,483 89Morgan 13,275 83 $377,511 91 $27,981 93 $405,492 93 $32,448 102 $155,952 87 $91,612 64 $30,422 99Webster 13,170 84 $385,889 89 $20,846 109 $406,735 92 $30,050 106 $170,209 84 $92,601 63 $69,695 62Bal/Car 13,086 85 $1,411 118 $23,992 101 $25,403 117 $8,301 118 $8,301 118 $9,789 115 $159 119Butler 12,938 86 $314,556 99 $23,195 104 $337,751 100 $35,518 97 $145,714 92 $19,523 109 $55,937 74Magoffin 12,808 87 $194,691 108 $16,320 115 $211,011 110 $35,631 96 $65,563 111 $34,721 100 $10,657 113Caldwell 12,681 88 $320,981 98 $21,899 107 $342,880 99 $42,890 77 $157,556 86 $49,432 87 $26,236 102Todd 12,531 89 $289,390 101 $26,263 99 $315,653 101 $38,681 87 $124,939 98 $10,753 112 $23,123 104Martin 12,307 90 $479,154 79 $31,552 85 $510,706 80 $37,442 91 $194,165 78 $97,189 60 $80,876 56Powell 12,269 91 $272,942 102 $30,106 90 $303,048 103 $37,046 94 $141,538 93 $39,160 96 $18,138 108Bath 12,228 92 $435,759 83 $23,639 103 $459,398 85 $43,562 75 $214,552 68 $58,563 83 $34,581 95Washington 12,063 93 $482,610 78 $117,413 35 $600,023 76 $60,530 40 $188,759 80 $67,151 77 $46,851 83
SELECT STATISTICS, BY KENTUCKY POPULATION, 2015-2016 -47
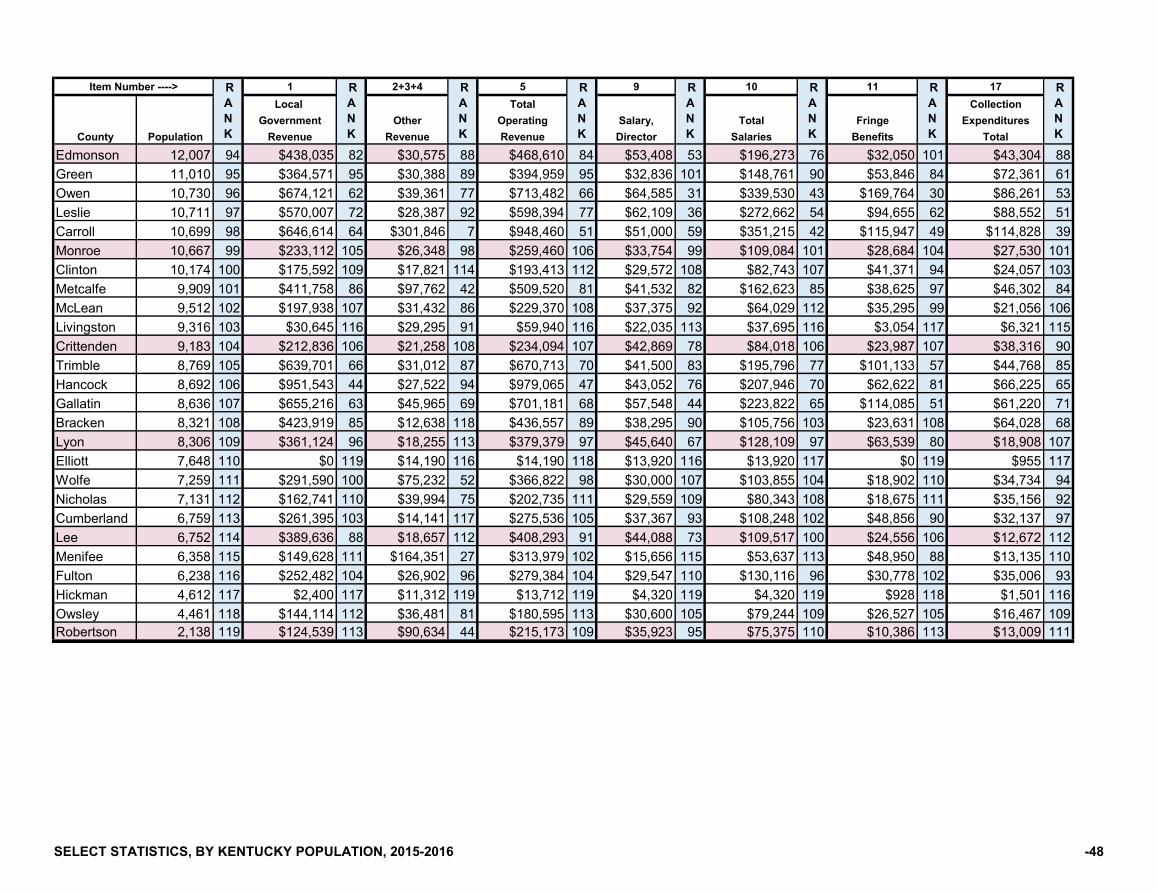
1 2+3+4 5 9 10 11 17Local Total Collection
Government Other Operating Salary, Total Fringe ExpendituresCounty Population Revenue Revenue Revenue Director Salaries Benefits Total
RANK
Item Number ----> RANK
RANK
RANK
RANK
RANK
RANK
RANK
Edmonson 12,007 94 $438,035 82 $30,575 88 $468,610 84 $53,408 53 $196,273 76 $32,050 101 $43,304 88Green 11,010 95 $364,571 95 $30,388 89 $394,959 95 $32,836 101 $148,761 90 $53,846 84 $72,361 61Owen 10,730 96 $674,121 62 $39,361 77 $713,482 66 $64,585 31 $339,530 43 $169,764 30 $86,261 53Leslie 10,711 97 $570,007 72 $28,387 92 $598,394 77 $62,109 36 $272,662 54 $94,655 62 $88,552 51Carroll 10,699 98 $646,614 64 $301,846 7 $948,460 51 $51,000 59 $351,215 42 $115,947 49 $114,828 39Monroe 10,667 99 $233,112 105 $26,348 98 $259,460 106 $33,754 99 $109,084 101 $28,684 104 $27,530 101Clinton 10,174 100 $175,592 109 $17,821 114 $193,413 112 $29,572 108 $82,743 107 $41,371 94 $24,057 103Metcalfe 9,909 101 $411,758 86 $97,762 42 $509,520 81 $41,532 82 $162,623 85 $38,625 97 $46,302 84McLean 9,512 102 $197,938 107 $31,432 86 $229,370 108 $37,375 92 $64,029 112 $35,295 99 $21,056 106Livingston 9,316 103 $30,645 116 $29,295 91 $59,940 116 $22,035 113 $37,695 116 $3,054 117 $6,321 115Crittenden 9,183 104 $212,836 106 $21,258 108 $234,094 107 $42,869 78 $84,018 106 $23,987 107 $38,316 90Trimble 8,769 105 $639,701 66 $31,012 87 $670,713 70 $41,500 83 $195,796 77 $101,133 57 $44,768 85Hancock 8,692 106 $951,543 44 $27,522 94 $979,065 47 $43,052 76 $207,946 70 $62,622 81 $66,225 65Gallatin 8,636 107 $655,216 63 $45,965 69 $701,181 68 $57,548 44 $223,822 65 $114,085 51 $61,220 71Bracken 8,321 108 $423,919 85 $12,638 118 $436,557 89 $38,295 90 $105,756 103 $23,631 108 $64,028 68Lyon 8,306 109 $361,124 96 $18,255 113 $379,379 97 $45,640 67 $128,109 97 $63,539 80 $18,908 107Elliott 7,648 110 $0 119 $14,190 116 $14,190 118 $13,920 116 $13,920 117 $0 119 $955 117Wolfe 7,259 111 $291,590 100 $75,232 52 $366,822 98 $30,000 107 $103,855 104 $18,902 110 $34,734 94Nicholas 7,131 112 $162,741 110 $39,994 75 $202,735 111 $29,559 109 $80,343 108 $18,675 111 $35,156 92Cumberland 6,759 113 $261,395 103 $14,141 117 $275,536 105 $37,367 93 $108,248 102 $48,856 90 $32,137 97Lee 6,752 114 $389,636 88 $18,657 112 $408,293 91 $44,088 73 $109,517 100 $24,556 106 $12,672 112Menifee 6,358 115 $149,628 111 $164,351 27 $313,979 102 $15,656 115 $53,637 113 $48,950 88 $13,135 110Fulton 6,238 116 $252,482 104 $26,902 96 $279,384 104 $29,547 110 $130,116 96 $30,778 102 $35,006 93Hickman 4,612 117 $2,400 117 $11,312 119 $13,712 119 $4,320 119 $4,320 119 $928 118 $1,501 116Owsley 4,461 118 $144,114 112 $36,481 81 $180,595 113 $30,600 105 $79,244 109 $26,527 105 $16,467 109Robertson 2,138 119 $124,539 113 $90,634 44 $215,173 109 $35,923 95 $75,375 110 $10,386 113 $13,009 111
SELECT STATISTICS, BY KENTUCKY POPULATION, 2015-2016 -48

County PopulationJefferson 763,623 1Fayette 314,488 2Kenton 165,012 3Boone 127,712 4Warren 122,851 5Hardin 106,439 6Daviess 99,259 7Campbell 92,066 8Madison 87,824 9Bullitt 78,702 10Christian 73,309 11McCracken 65,018 12Oldham 64,875 13Pulaski 63,782 14Pike 61,792 15Laurel 60,094 16Scott 52,420 17Jessamine 51,961 18Franklin 50,375 19Boyd 48,325 20Henderson 46,407 21Hopkins 46,222 22Shelby 45,632 23Nelson 45,126 24Barren 43,570 25Calloway 38,343 26Floyd 37,756 27Graves 37,421 28Whitley 36,129 29Greenup 36,068 30Clark 35,757 31
Item Number ----> RANK
23 24 33 36 41 43 48Total Cost, Square Staff (FTE) -
Electronic Continuing Annual Public Feet, Librarians with Total Total BookAccess Cost Education Service Hours Total ALA MLS Staff Collection
$554,081 1 $2,938 69 55,626 1 352,130 1 67.00 1 261.00 1 1,267,153 1$371,206 2 $51,994 4 20,748 2 223,330 2 45.00 2 186.00 2 439,946 3$201,658 6 $75,219 1 10,972 8 135,249 4 39.00 3 142.83 3 452,599 2$222,194 5 $58,331 2 16,653 3 136,165 3 27.00 4 102.00 4 253,846 4$48,541 28 $31,271 8 13,624 4 45,827 9 6.38 12 40.70 9 156,097 11$37,938 39 $1,420 90 6,825 21 23,200 29 2.50 24 14.25 38 79,782 28
$164,153 8 $22,422 9 3,744 62 51,000 8 9.00 7 46.25 8 183,081 7$119,300 12 $18,583 12 10,920 9 56,600 7 17.50 5 64.00 5 163,033 10$68,733 20 $10,248 22 8,064 17 29,490 24 3.00 18 39.25 11 119,942 18
$122,309 11 $18,555 13 12,688 5 39,492 14 2.00 27 46.75 7 172,784 8$8,051 92 $3,494 60 2,756 99 22,000 32 2.00 27 11.00 51 15,621 114
$146,916 9 $56,360 3 3,692 65 33,000 21 4.00 15 40.00 10 111,068 20$102,036 14 $7,658 28 8,580 16 36,485 16 7.95 9 33.08 13 104,230 23$40,933 35 $6,636 32 11,526 7 58,402 6 0.53 68 32.57 14 113,238 19
$228,004 4 $4,642 51 12,168 6 77,532 5 4.00 15 23.40 22 252,398 5$142,332 10 $11,350 19 3,888 58 41,650 11 3.00 18 30.26 16 120,385 17$83,213 18 $20,967 10 4,110 49 41,351 12 8.00 8 27.26 20 92,514 25$83,531 17 $42,405 5 3,458 75 41,000 13 17.00 6 47.00 6 106,079 21
$200,467 7 $13,831 16 3,380 82 39,290 15 7.60 10 30.77 15 137,743 13$262,106 3 $40,449 6 9,568 13 33,100 20 2.75 23 33.30 12 144,781 12$105,686 13 $7,162 29 4,502 39 21,635 34 2.00 27 24.10 21 95,067 24
$6,693 96 $2,296 78 4,004 54 18,006 38 2.00 27 11.00 51 69,162 35$17,223 67 $10,679 21 4,004 54 22,000 32 0.00 -- 15.54 37 73,546 31$44,706 30 $13,411 17 10,452 10 36,462 17 2.50 24 28.50 19 105,850 22$21,934 60 $5,280 45 3,866 60 14,520 51 2.00 27 13.00 41 45,861 56$10,388 82 $39,445 7 3,744 62 14,800 50 1.00 45 17.25 32 77,543 29$22,322 59 $8,247 25 6,604 23 18,000 39 2.00 27 13.00 41 71,526 32$58,217 24 $1,126 99 4,845 33 17,635 40 0.00 -- 8.44 69 44,000 59$5,622 102 $5,126 48 6,524 24 27,309 26 2.00 27 8.61 67 38,398 67
$86,897 15 $1,257 94 9,620 12 31,270 22 2.00 27 17.00 33 134,294 15$41,145 34 $1,852 85 3,354 83 27,367 25 7.00 11 22.65 24 87,132 27
RANK
RANK
RANK
RANK
RANK
RANK
RANK
SELECT STATISTICS, BY KENTUCKY POPULATION, 2015-2016 -49
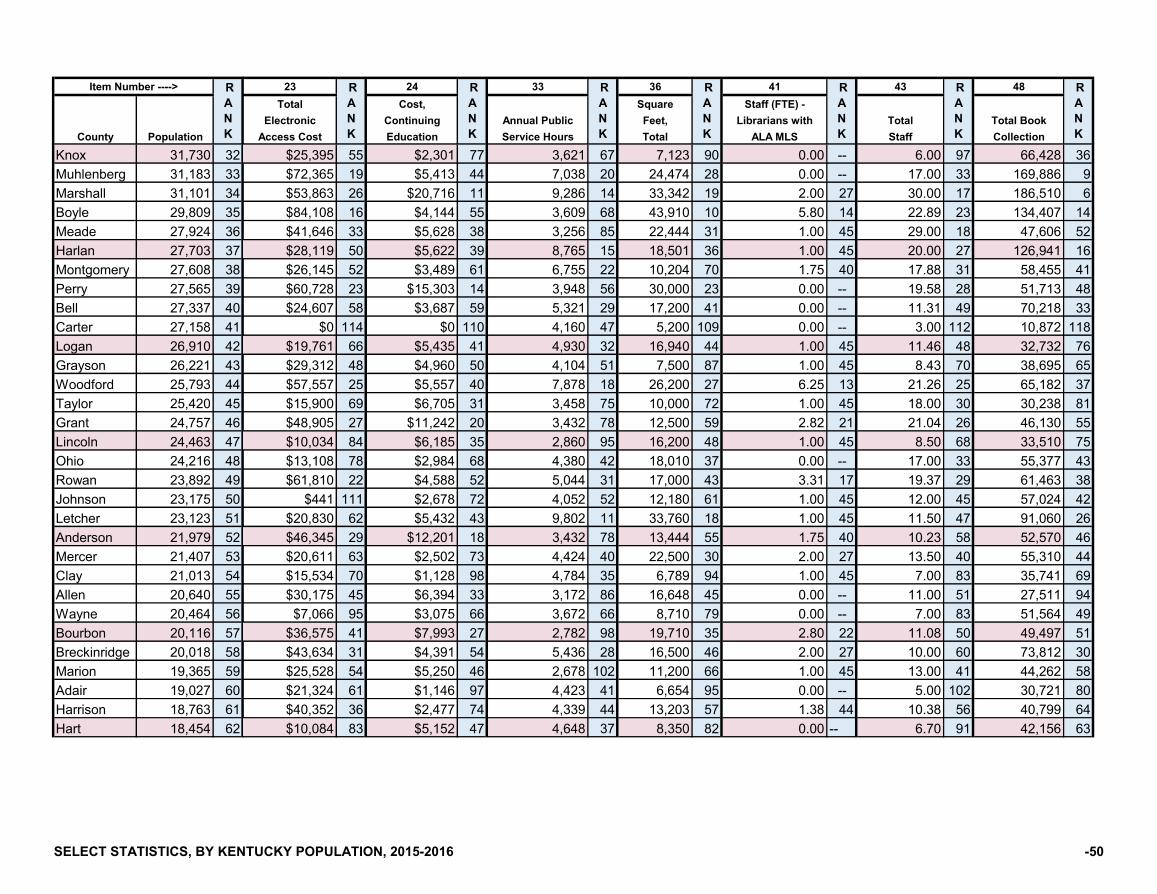
County Population
Item Number ----> RANK
Knox 31,730 32Muhlenberg 31,183 33Marshall 31,101 34Boyle 29,809 35Meade 27,924 36Harlan 27,703 37Montgomery 27,608 38Perry 27,565 39Bell 27,337 40Carter 27,158 41Logan 26,910 42Grayson 26,221 43Woodford 25,793 44Taylor 25,420 45Grant 24,757 46Lincoln 24,463 47Ohio 24,216 48Rowan 23,892 49Johnson 23,175 50Letcher 23,123 51Anderson 21,979 52Mercer 21,407 53Clay 21,013 54Allen 20,640 55Wayne 20,464 56Bourbon 20,116 57Breckinridge 20,018 58Marion 19,365 59Adair 19,027 60Harrison 18,763 61Hart 18,454 62
23 24 33 36 41 43 48Total Cost, Square Staff (FTE) -
Electronic Continuing Annual Public Feet, Librarians with Total Total BookAccess Cost Education Service Hours Total ALA MLS Staff Collection
RANK
RANK
RANK
RANK
RANK
RANK
RANK
$25,395 55 $2,301 77 3,621 67 7,123 90 0.00 -- 6.00 97 66,428 36$72,365 19 $5,413 44 7,038 20 24,474 28 0.00 -- 17.00 33 169,886 9$53,863 26 $20,716 11 9,286 14 33,342 19 2.00 27 30.00 17 186,510 6$84,108 16 $4,144 55 3,609 68 43,910 10 5.80 14 22.89 23 134,407 14$41,646 33 $5,628 38 3,256 85 22,444 31 1.00 45 29.00 18 47,606 52$28,119 50 $5,622 39 8,765 15 18,501 36 1.00 45 20.00 27 126,941 16$26,145 52 $3,489 61 6,755 22 10,204 70 1.75 40 17.88 31 58,455 41$60,728 23 $15,303 14 3,948 56 30,000 23 0.00 -- 19.58 28 51,713 48$24,607 58 $3,687 59 5,321 29 17,200 41 0.00 -- 11.31 49 70,218 33
$0 114 $0 110 4,160 47 5,200 109 0.00 -- 3.00 112 10,872 118$19,761 66 $5,435 41 4,930 32 16,940 44 1.00 45 11.46 48 32,732 76$29,312 48 $4,960 50 4,104 51 7,500 87 1.00 45 8.43 70 38,695 65$57,557 25 $5,557 40 7,878 18 26,200 27 6.25 13 21.26 25 65,182 37$15,900 69 $6,705 31 3,458 75 10,000 72 1.00 45 18.00 30 30,238 81$48,905 27 $11,242 20 3,432 78 12,500 59 2.82 21 21.04 26 46,130 55$10,034 84 $6,185 35 2,860 95 16,200 48 1.00 45 8.50 68 33,510 75$13,108 78 $2,984 68 4,380 42 18,010 37 0.00 -- 17.00 33 55,377 43$61,810 22 $4,588 52 5,044 31 17,000 43 3.31 17 19.37 29 61,463 38
$441 111 $2,678 72 4,052 52 12,180 61 1.00 45 12.00 45 57,024 42$20,830 62 $5,432 43 9,802 11 33,760 18 1.00 45 11.50 47 91,060 26$46,345 29 $12,201 18 3,432 78 13,444 55 1.75 40 10.23 58 52,570 46$20,611 63 $2,502 73 4,424 40 22,500 30 2.00 27 13.50 40 55,310 44$15,534 70 $1,128 98 4,784 35 6,789 94 1.00 45 7.00 83 35,741 69$30,175 45 $6,394 33 3,172 86 16,648 45 0.00 -- 11.00 51 27,511 94$7,066 95 $3,075 66 3,672 66 8,710 79 0.00 -- 7.00 83 51,564 49
$36,575 41 $7,993 27 2,782 98 19,710 35 2.80 22 11.08 50 49,497 51$43,634 31 $4,391 54 5,436 28 16,500 46 2.00 27 10.00 60 73,812 30$25,528 54 $5,250 46 2,678 102 11,200 66 1.00 45 13.00 41 44,262 58$21,324 61 $1,146 97 4,423 41 6,654 95 0.00 -- 5.00 102 30,721 80$40,352 36 $2,477 74 4,339 44 13,203 57 1.38 44 10.38 56 40,799 64$10,084 83 $5,152 47 4,648 37 8,350 82 0.00 -- 6.70 91 42,156 63
SELECT STATISTICS, BY KENTUCKY POPULATION, 2015-2016 -50
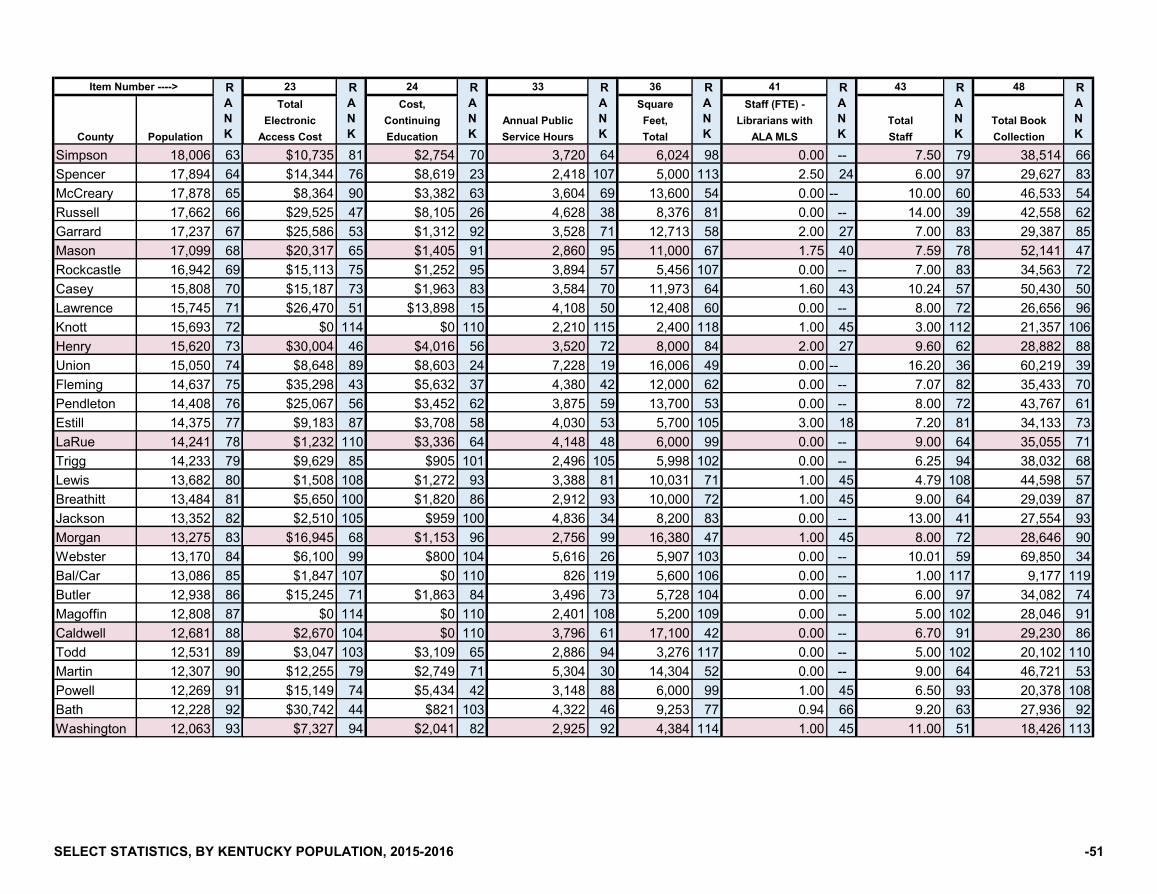
County Population
Item Number ----> RANK
Simpson 18,006 63Spencer 17,894 64McCreary 17,878 65Russell 17,662 66Garrard 17,237 67Mason 17,099 68Rockcastle 16,942 69Casey 15,808 70Lawrence 15,745 71Knott 15,693 72Henry 15,620 73Union 15,050 74Fleming 14,637 75Pendleton 14,408 76Estill 14,375 77LaRue 14,241 78Trigg 14,233 79Lewis 13,682 80Breathitt 13,484 81Jackson 13,352 82Morgan 13,275 83Webster 13,170 84Bal/Car 13,086 85Butler 12,938 86Magoffin 12,808 87Caldwell 12,681 88Todd 12,531 89Martin 12,307 90Powell 12,269 91Bath 12,228 92Washington 12,063 93
23 24 33 36 41 43 48Total Cost, Square Staff (FTE) -
Electronic Continuing Annual Public Feet, Librarians with Total Total BookAccess Cost Education Service Hours Total ALA MLS Staff Collection
RANK
RANK
RANK
RANK
RANK
RANK
RANK
$10,735 81 $2,754 70 3,720 64 6,024 98 0.00 -- 7.50 79 38,514 66$14,344 76 $8,619 23 2,418 107 5,000 113 2.50 24 6.00 97 29,627 83$8,364 90 $3,382 63 3,604 69 13,600 54 0.00 -- 10.00 60 46,533 54
$29,525 47 $8,105 26 4,628 38 8,376 81 0.00 -- 14.00 39 42,558 62$25,586 53 $1,312 92 3,528 71 12,713 58 2.00 27 7.00 83 29,387 85$20,317 65 $1,405 91 2,860 95 11,000 67 1.75 40 7.59 78 52,141 47$15,113 75 $1,252 95 3,894 57 5,456 107 0.00 -- 7.00 83 34,563 72$15,187 73 $1,963 83 3,584 70 11,973 64 1.60 43 10.24 57 50,430 50$26,470 51 $13,898 15 4,108 50 12,408 60 0.00 -- 8.00 72 26,656 96
$0 114 $0 110 2,210 115 2,400 118 1.00 45 3.00 112 21,357 106$30,004 46 $4,016 56 3,520 72 8,000 84 2.00 27 9.60 62 28,882 88$8,648 89 $8,603 24 7,228 19 16,006 49 0.00 -- 16.20 36 60,219 39
$35,298 43 $5,632 37 4,380 42 12,000 62 0.00 -- 7.07 82 35,433 70$25,067 56 $3,452 62 3,875 59 13,700 53 0.00 -- 8.00 72 43,767 61$9,183 87 $3,708 58 4,030 53 5,700 105 3.00 18 7.20 81 34,133 73$1,232 110 $3,336 64 4,148 48 6,000 99 0.00 -- 9.00 64 35,055 71$9,629 85 $905 101 2,496 105 5,998 102 0.00 -- 6.25 94 38,032 68$1,508 108 $1,272 93 3,388 81 10,031 71 1.00 45 4.79 108 44,598 57$5,650 100 $1,820 86 2,912 93 10,000 72 1.00 45 9.00 64 29,039 87$2,510 105 $959 100 4,836 34 8,200 83 0.00 -- 13.00 41 27,554 93
$16,945 68 $1,153 96 2,756 99 16,380 47 1.00 45 8.00 72 28,646 90$6,100 99 $800 104 5,616 26 5,907 103 0.00 -- 10.01 59 69,850 34$1,847 107 $0 110 826 119 5,600 106 0.00 -- 1.00 117 9,177 119
$15,245 71 $1,863 84 3,496 73 5,728 104 0.00 -- 6.00 97 34,082 74$0 114 $0 110 2,401 108 5,200 109 0.00 -- 5.00 102 28,046 91
$2,670 104 $0 110 3,796 61 17,100 42 0.00 -- 6.70 91 29,230 86$3,047 103 $3,109 65 2,886 94 3,276 117 0.00 -- 5.00 102 20,102 110
$12,255 79 $2,749 71 5,304 30 14,304 52 0.00 -- 9.00 64 46,721 53$15,149 74 $5,434 42 3,148 88 6,000 99 1.00 45 6.50 93 20,378 108$30,742 44 $821 103 4,322 46 9,253 77 0.94 66 9.20 63 27,936 92$7,327 94 $2,041 82 2,925 92 4,384 114 1.00 45 11.00 51 18,426 113
SELECT STATISTICS, BY KENTUCKY POPULATION, 2015-2016 -51
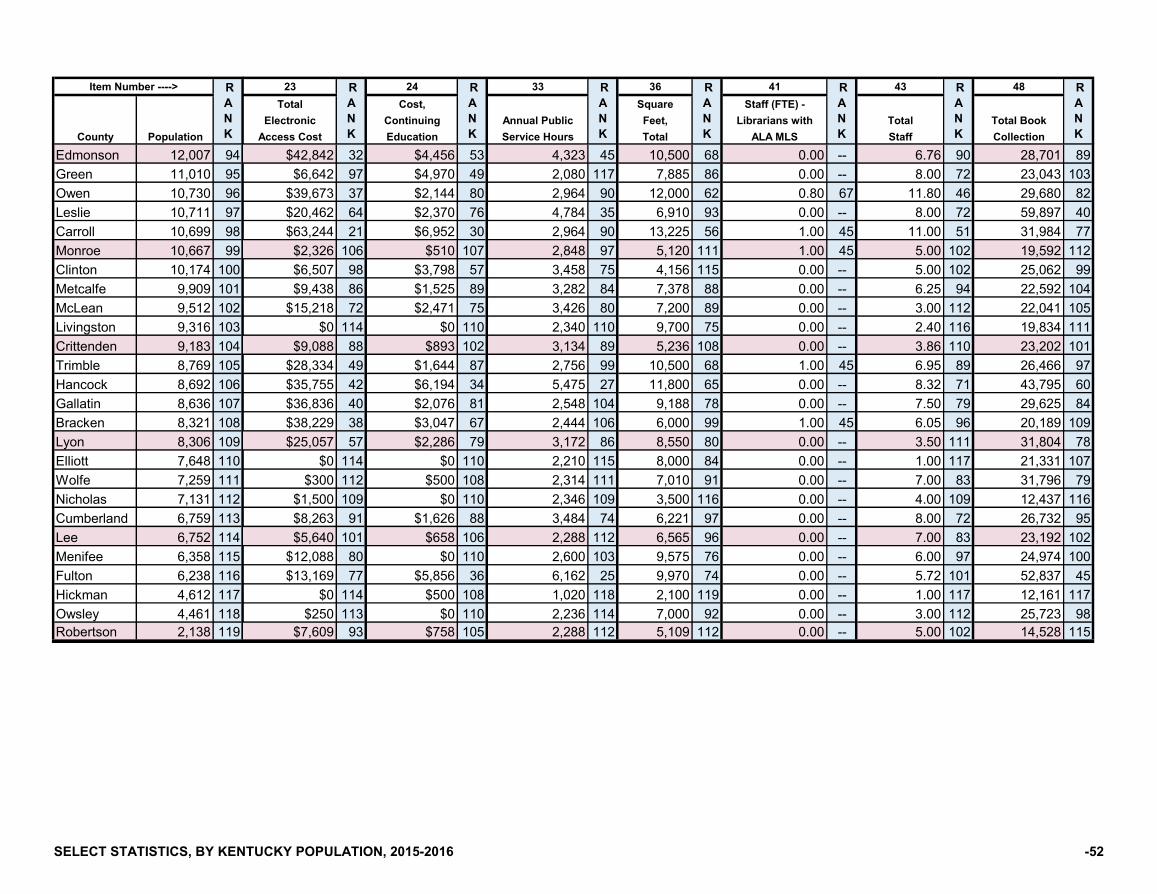
County Population
Item Number ----> RANK
Edmonson 12,007 94Green 11,010 95Owen 10,730 96Leslie 10,711 97Carroll 10,699 98Monroe 10,667 99Clinton 10,174 100Metcalfe 9,909 101McLean 9,512 102Livingston 9,316 103Crittenden 9,183 104Trimble 8,769 105Hancock 8,692 106Gallatin 8,636 107Bracken 8,321 108Lyon 8,306 109Elliott 7,648 110Wolfe 7,259 111Nicholas 7,131 112Cumberland 6,759 113Lee 6,752 114Menifee 6,358 115Fulton 6,238 116Hickman 4,612 117Owsley 4,461 118Robertson 2,138 119
23 24 33 36 41 43 48Total Cost, Square Staff (FTE) -
Electronic Continuing Annual Public Feet, Librarians with Total Total BookAccess Cost Education Service Hours Total ALA MLS Staff Collection
RANK
RANK
RANK
RANK
RANK
RANK
RANK
$42,842 32 $4,456 53 4,323 45 10,500 68 0.00 -- 6.76 90 28,701 89$6,642 97 $4,970 49 2,080 117 7,885 86 0.00 -- 8.00 72 23,043 103
$39,673 37 $2,144 80 2,964 90 12,000 62 0.80 67 11.80 46 29,680 82$20,462 64 $2,370 76 4,784 35 6,910 93 0.00 -- 8.00 72 59,897 40$63,244 21 $6,952 30 2,964 90 13,225 56 1.00 45 11.00 51 31,984 77$2,326 106 $510 107 2,848 97 5,120 111 1.00 45 5.00 102 19,592 112$6,507 98 $3,798 57 3,458 75 4,156 115 0.00 -- 5.00 102 25,062 99$9,438 86 $1,525 89 3,282 84 7,378 88 0.00 -- 6.25 94 22,592 104
$15,218 72 $2,471 75 3,426 80 7,200 89 0.00 -- 3.00 112 22,041 105$0 114 $0 110 2,340 110 9,700 75 0.00 -- 2.40 116 19,834 111
$9,088 88 $893 102 3,134 89 5,236 108 0.00 -- 3.86 110 23,202 101$28,334 49 $1,644 87 2,756 99 10,500 68 1.00 45 6.95 89 26,466 97$35,755 42 $6,194 34 5,475 27 11,800 65 0.00 -- 8.32 71 43,795 60$36,836 40 $2,076 81 2,548 104 9,188 78 0.00 -- 7.50 79 29,625 84$38,229 38 $3,047 67 2,444 106 6,000 99 1.00 45 6.05 96 20,189 109$25,057 57 $2,286 79 3,172 86 8,550 80 0.00 -- 3.50 111 31,804 78
$0 114 $0 110 2,210 115 8,000 84 0.00 -- 1.00 117 21,331 107$300 112 $500 108 2,314 111 7,010 91 0.00 -- 7.00 83 31,796 79
$1,500 109 $0 110 2,346 109 3,500 116 0.00 -- 4.00 109 12,437 116$8,263 91 $1,626 88 3,484 74 6,221 97 0.00 -- 8.00 72 26,732 95$5,640 101 $658 106 2,288 112 6,565 96 0.00 -- 7.00 83 23,192 102
$12,088 80 $0 110 2,600 103 9,575 76 0.00 -- 6.00 97 24,974 100$13,169 77 $5,856 36 6,162 25 9,970 74 0.00 -- 5.72 101 52,837 45
$0 114 $500 108 1,020 118 2,100 119 0.00 -- 1.00 117 12,161 117$250 113 $0 110 2,236 114 7,000 92 0.00 -- 3.00 112 25,723 98
$7,609 93 $758 105 2,288 112 5,109 112 0.00 -- 5.00 102 14,528 115
SELECT STATISTICS, BY KENTUCKY POPULATION, 2015-2016 -52

County PopulationJefferson 763,623 1Fayette 314,488 2Kenton 165,012 3Boone 127,712 4Warren 122,851 5Hardin 106,439 6Daviess 99,259 7Campbell 92,066 8Madison 87,824 9Bullitt 78,702 10Christian 73,309 11McCracken 65,018 12Oldham 64,875 13Pulaski 63,782 14Pike 61,792 15Laurel 60,094 16Scott 52,420 17Jessamine 51,961 18Franklin 50,375 19Boyd 48,325 20Henderson 46,407 21Hopkins 46,222 22Shelby 45,632 23Nelson 45,126 24Barren 43,570 25Calloway 38,343 26Floyd 37,756 27Graves 37,421 28Whitley 36,129 29Greenup 36,068 30Clark 35,757 31
Item Number ----> RANK
54 57 58 63 68 72 73People Total Circulation of Total
E-Books Registered Entering Total Book Audio-Video Electronic Materialin Collection Users Library Circulation Circulation Materials Circulated
25,980 101 363,084 1 3,054,629 1 2,807,474 1 546,218 4 304,508 2 3,686,046 121,160 102 235,737 2 1,880,524 2 1,766,437 2 896,707 1 273,417 3 2,964,292 287,883 95 162,830 3 863,270 4 1,010,456 3 879,852 2 421,607 1 2,311,915 3
152,186 5 84,816 4 866,551 3 813,197 4 414,492 5 126,746 5 1,383,608 48,300 103 47,536 10 356,186 8 618,559 5 411,814 6 61,439 10 1,091,812 6
116,700 28 47,694 9 214,267 15 172,757 23 23,586 63 41,435 18 240,871 26184,860 2 76,681 5 732,381 5 396,367 7 341,603 7 110,826 6 861,980 7121,305 12 54,939 8 590,265 6 502,939 6 589,153 3 84,188 7 1,246,871 5116,515 34 57,638 7 336,560 9 300,647 10 237,786 10 58,439 11 601,517 9116,567 31 26,124 23 289,054 10 181,873 20 96,380 21 32,405 21 313,980 21116,125 51 25,093 24 103,683 37 22,068 107 26,458 56 15,249 35 63,775 85117,039 24 44,107 12 370,867 7 316,916 8 329,873 8 49,471 15 698,357 8116,528 33 34,296 17 237,457 13 285,401 11 93,109 23 49,940 14 435,789 14113,125 88 26,260 22 228,066 14 192,060 19 50,366 34 24,185 26 279,664 24116,446 36 40,345 15 171,983 21 164,101 25 125,828 17 56,961 12 359,447 17121,478 11 58,013 6 152,857 26 219,167 14 80,345 25 38,463 19 341,417 20118,348 16 40,550 14 156,275 25 216,503 15 82,323 24 42,828 16 344,838 19221,937 1 45,023 11 165,978 23 310,655 9 141,553 13 77,537 8 532,211 11118,335 17 40,756 13 183,662 19 255,512 12 174,419 11 54,839 13 491,257 12122,515 10 33,976 19 272,602 11 175,009 22 319,053 9 66,637 9 569,356 10119,203 14 34,155 18 189,180 18 165,812 24 134,615 15 42,538 17 345,172 18116,257 43 21,535 30 69,214 61 53,011 71 21,792 68 17,978 32 93,150 68116,125 51 24,752 25 76,777 54 204,456 18 26,002 57 20,193 30 255,766 25116,125 51 20,373 32 132,510 30 212,986 17 68,571 28 28,666 23 313,811 22117,348 22 11,634 58 77,260 52 94,384 38 22,347 66 23,168 28 140,546 44118,927 15 35,785 16 252,524 12 176,267 21 36,154 47 23,799 27 236,234 2893,855 92 22,895 26 68,670 62 42,805 82 58,902 30 1,033 97 102,796 61
116,710 27 22,588 28 146,742 27 86,545 40 23,506 64 14,228 37 124,279 50116,298 41 30,175 20 166,808 22 53,332 70 69,678 26 8,657 50 136,468 45133,828 8 16,452 38 140,731 29 146,781 28 111,775 18 12,173 43 280,052 23116,125 51 18,967 35 128,755 32 215,580 16 128,110 16 32,359 22 377,192 16
RANK
RANK
RANK
RANK
RANK
RANK
RANK
SELECT STATISTICS, BY KENTUCKY POPULATION, 2015-2016 -53
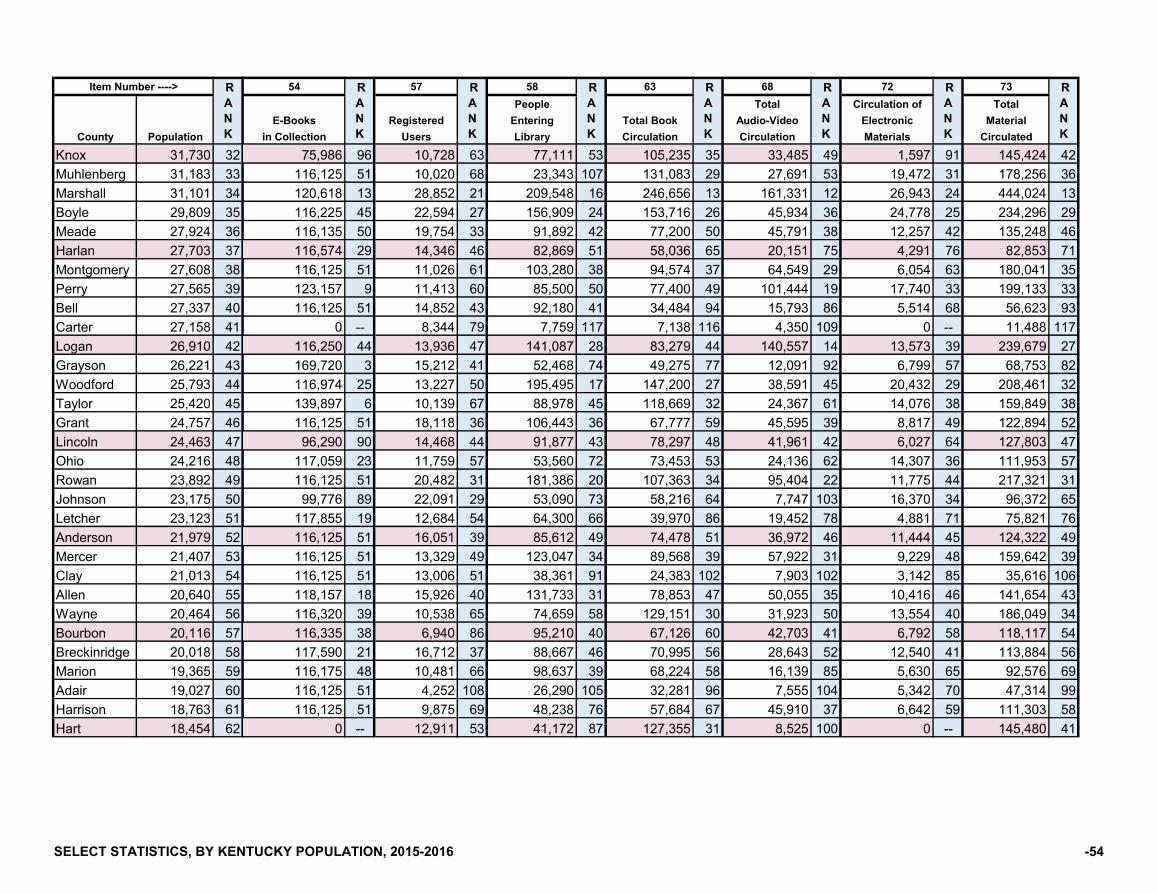
County Population
Item Number ----> RANK
Knox 31,730 32Muhlenberg 31,183 33Marshall 31,101 34Boyle 29,809 35Meade 27,924 36Harlan 27,703 37Montgomery 27,608 38Perry 27,565 39Bell 27,337 40Carter 27,158 41Logan 26,910 42Grayson 26,221 43Woodford 25,793 44Taylor 25,420 45Grant 24,757 46Lincoln 24,463 47Ohio 24,216 48Rowan 23,892 49Johnson 23,175 50Letcher 23,123 51Anderson 21,979 52Mercer 21,407 53Clay 21,013 54Allen 20,640 55Wayne 20,464 56Bourbon 20,116 57Breckinridge 20,018 58Marion 19,365 59Adair 19,027 60Harrison 18,763 61Hart 18,454 62
54 57 58 63 68 72 73People Total Circulation of Total
E-Books Registered Entering Total Book Audio-Video Electronic Materialin Collection Users Library Circulation Circulation Materials Circulated
RANK
RANK
RANK
RANK
RANK
RANK
RANK
75,986 96 10,728 63 77,111 53 105,235 35 33,485 49 1,597 91 145,424 42116,125 51 10,020 68 23,343 107 131,083 29 27,691 53 19,472 31 178,256 36120,618 13 28,852 21 209,548 16 246,656 13 161,331 12 26,943 24 444,024 13116,225 45 22,594 27 156,909 24 153,716 26 45,934 36 24,778 25 234,296 29116,135 50 19,754 33 91,892 42 77,200 50 45,791 38 12,257 42 135,248 46116,574 29 14,346 46 82,869 51 58,036 65 20,151 75 4,291 76 82,853 71116,125 51 11,026 61 103,280 38 94,574 37 64,549 29 6,054 63 180,041 35123,157 9 11,413 60 85,500 50 77,400 49 101,444 19 17,740 33 199,133 33116,125 51 14,852 43 92,180 41 34,484 94 15,793 86 5,514 68 56,623 93
0 -- 8,344 79 7,759 117 7,138 116 4,350 109 0 -- 11,488 117116,250 44 13,936 47 141,087 28 83,279 44 140,557 14 13,573 39 239,679 27169,720 3 15,212 41 52,468 74 49,275 77 12,091 92 6,799 57 68,753 82116,974 25 13,227 50 195,495 17 147,200 27 38,591 45 20,432 29 208,461 32139,897 6 10,139 67 88,978 45 118,669 32 24,367 61 14,076 38 159,849 38116,125 51 18,118 36 106,443 36 67,777 59 45,595 39 8,817 49 122,894 5296,290 90 14,468 44 91,877 43 78,297 48 41,961 42 6,027 64 127,803 47
117,059 23 11,759 57 53,560 72 73,453 53 24,136 62 14,307 36 111,953 57116,125 51 20,482 31 181,386 20 107,363 34 95,404 22 11,775 44 217,321 3199,776 89 22,091 29 53,090 73 58,216 64 7,747 103 16,370 34 96,372 65
117,855 19 12,684 54 64,300 66 39,970 86 19,452 78 4,881 71 75,821 76116,125 51 16,051 39 85,612 49 74,478 51 36,972 46 11,444 45 124,322 49116,125 51 13,329 49 123,047 34 89,568 39 57,922 31 9,229 48 159,642 39116,125 51 13,006 51 38,361 91 24,383 102 7,903 102 3,142 85 35,616 106118,157 18 15,926 40 131,733 31 78,853 47 50,055 35 10,416 46 141,654 43116,320 39 10,538 65 74,659 58 129,151 30 31,923 50 13,554 40 186,049 34116,335 38 6,940 86 95,210 40 67,126 60 42,703 41 6,792 58 118,117 54117,590 21 16,712 37 88,667 46 70,995 56 28,643 52 12,540 41 113,884 56116,175 48 10,481 66 98,637 39 68,224 58 16,139 85 5,630 65 92,576 69116,125 51 4,252 108 26,290 105 32,281 96 7,555 104 5,342 70 47,314 99116,125 51 9,875 69 48,238 76 57,684 67 45,910 37 6,642 59 111,303 58
0 -- 12,911 53 41,172 87 127,355 31 8,525 100 0 -- 145,480 41
SELECT STATISTICS, BY KENTUCKY POPULATION, 2015-2016 -54

County Population
Item Number ----> RANK
Simpson 18,006 63Spencer 17,894 64McCreary 17,878 65Russell 17,662 66Garrard 17,237 67Mason 17,099 68Rockcastle 16,942 69Casey 15,808 70Lawrence 15,745 71Knott 15,693 72Henry 15,620 73Union 15,050 74Fleming 14,637 75Pendleton 14,408 76Estill 14,375 77LaRue 14,241 78Trigg 14,233 79Lewis 13,682 80Breathitt 13,484 81Jackson 13,352 82Morgan 13,275 83Webster 13,170 84Bal/Car 13,086 85Butler 12,938 86Magoffin 12,808 87Caldwell 12,681 88Todd 12,531 89Martin 12,307 90Powell 12,269 91Bath 12,228 92Washington 12,063 93
54 57 58 63 68 72 73People Total Circulation of Total
E-Books Registered Entering Total Book Audio-Video Electronic Materialin Collection Users Library Circulation Circulation Materials Circulated
RANK
RANK
RANK
RANK
RANK
RANK
RANK
116,822 26 14,991 42 91,825 44 49,203 78 39,750 44 6,336 61 95,782 66116,295 42 7,880 81 54,281 71 27,412 100 13,104 90 6,869 56 48,465 96116,125 51 13,510 48 54,484 70 59,915 63 18,346 80 4,015 79 82,540 72116,125 51 5,769 94 47,052 79 55,067 69 13,481 89 4,608 73 73,156 79116,125 51 9,313 72 36,254 93 43,424 81 10,804 96 7,042 55 61,270 89116,125 51 12,160 55 127,000 33 73,578 52 42,775 40 8,134 52 126,207 48139,897 6 6,577 87 30,986 103 36,379 91 6,026 106 4,771 72 48,317 97116,125 51 10,919 62 43,544 84 72,088 55 34,219 48 6,500 60 114,628 55116,125 51 19,357 34 76,459 55 50,912 76 11,078 93 6,235 62 72,475 80
0 -- 5,691 97 20,000 109 9,447 115 3,129 113 0 -- 12,596 116116,125 51 7,082 85 73,789 59 47,571 79 27,681 54 866 100 80,272 73116,125 51 7,642 84 36,529 92 56,348 68 14,564 88 4,485 75 75,924 75116,125 51 11,554 59 67,558 63 85,423 42 12,701 91 35,820 20 173,909 37117,664 20 9,404 71 47,619 78 42,782 83 40,362 43 5,434 69 89,104 70116,144 49 3,738 112 61,740 69 80,009 46 20,627 72 2,960 87 108,959 60116,125 51 8,178 80 47,952 77 52,272 72 17,295 81 5,608 67 78,976 74116,574 29 12,923 52 87,424 47 65,571 62 27,030 55 8,081 53 101,784 62116,125 51 5,467 99 76,379 57 85,398 43 25,554 59 3,043 86 123,727 51116,125 51 8,917 74 86,427 48 65,840 61 25,458 60 419 102 99,621 6392,201 93 5,938 93 66,242 65 51,557 74 55,900 32 1,847 89 110,837 5967,102 98 8,466 77 46,212 83 38,445 89 963 116 1,592 92 41,000 103
0 -- 14,415 45 63,243 68 81,393 45 69,041 27 0 -- 153,442 400 104 640 119 1,107 119 2,955 119 261 119 0 104 3,269 119
116,192 46 8,429 78 31,144 102 30,556 97 9,460 99 3,215 83 43,510 1010 -- 3,895 110 18,320 111 12,516 113 3,504 111 0 -- 16,138 1130 -- 5,199 101 18,297 112 29,490 98 678 117 0 -- 30,299 110
116,125 51 8,492 76 19,378 110 23,564 104 2,155 115 1,263 94 33,272 10874,492 97 5,365 100 43,275 85 39,239 88 14,834 87 3,722 81 58,928 92
116,125 51 6,576 88 46,719 80 22,567 106 3,344 112 4,493 74 32,351 109116,125 51 6,266 90 42,425 86 70,355 57 10,175 98 3,171 84 97,633 64116,125 51 8,974 73 32,154 99 72,503 54 20,412 73 1,291 93 94,423 67
SELECT STATISTICS, BY KENTUCKY POPULATION, 2015-2016 -55
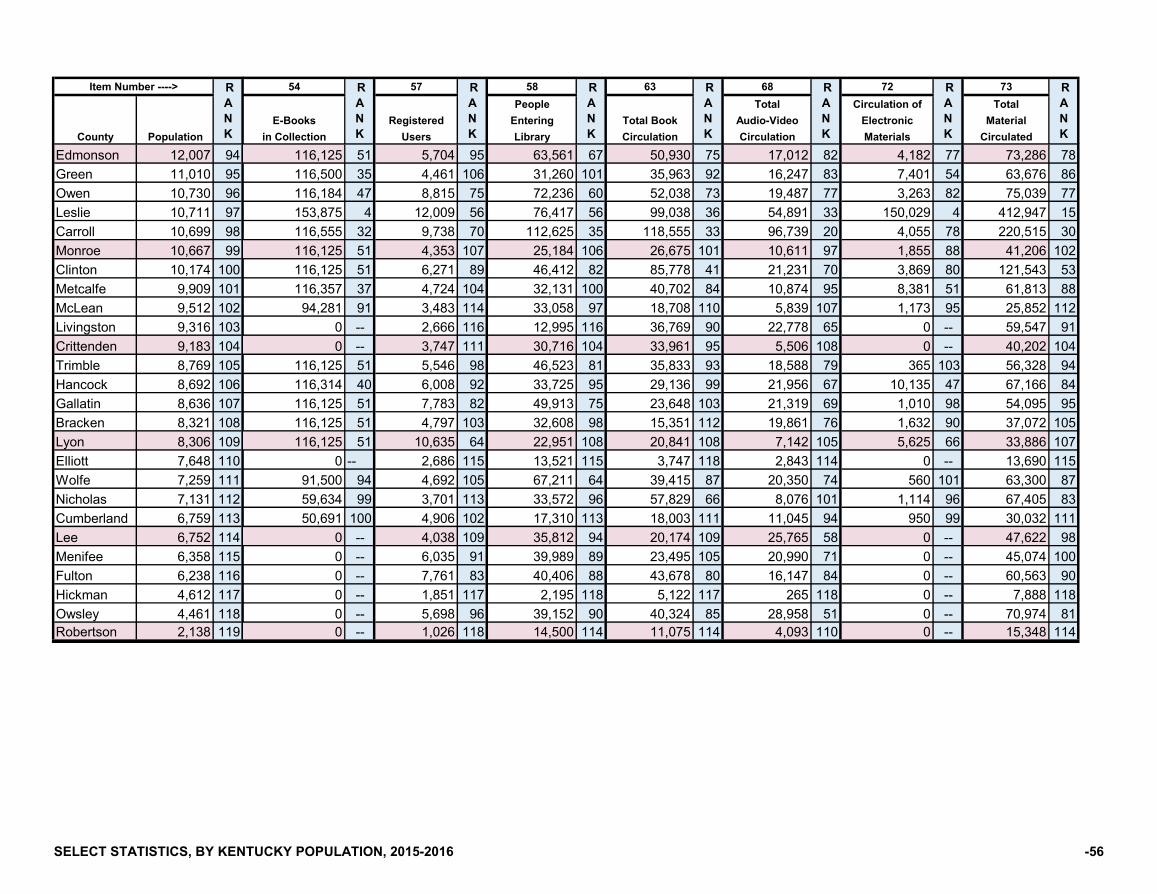
County Population
Item Number ----> RANK
Edmonson 12,007 94Green 11,010 95Owen 10,730 96Leslie 10,711 97Carroll 10,699 98Monroe 10,667 99Clinton 10,174 100Metcalfe 9,909 101McLean 9,512 102Livingston 9,316 103Crittenden 9,183 104Trimble 8,769 105Hancock 8,692 106Gallatin 8,636 107Bracken 8,321 108Lyon 8,306 109Elliott 7,648 110Wolfe 7,259 111Nicholas 7,131 112Cumberland 6,759 113Lee 6,752 114Menifee 6,358 115Fulton 6,238 116Hickman 4,612 117Owsley 4,461 118Robertson 2,138 119
54 57 58 63 68 72 73People Total Circulation of Total
E-Books Registered Entering Total Book Audio-Video Electronic Materialin Collection Users Library Circulation Circulation Materials Circulated
RANK
RANK
RANK
RANK
RANK
RANK
RANK
116,125 51 5,704 95 63,561 67 50,930 75 17,012 82 4,182 77 73,286 78116,500 35 4,461 106 31,260 101 35,963 92 16,247 83 7,401 54 63,676 86116,184 47 8,815 75 72,236 60 52,038 73 19,487 77 3,263 82 75,039 77153,875 4 12,009 56 76,417 56 99,038 36 54,891 33 150,029 4 412,947 15116,555 32 9,738 70 112,625 35 118,555 33 96,739 20 4,055 78 220,515 30116,125 51 4,353 107 25,184 106 26,675 101 10,611 97 1,855 88 41,206 102116,125 51 6,271 89 46,412 82 85,778 41 21,231 70 3,869 80 121,543 53116,357 37 4,724 104 32,131 100 40,702 84 10,874 95 8,381 51 61,813 8894,281 91 3,483 114 33,058 97 18,708 110 5,839 107 1,173 95 25,852 112
0 -- 2,666 116 12,995 116 36,769 90 22,778 65 0 -- 59,547 910 -- 3,747 111 30,716 104 33,961 95 5,506 108 0 -- 40,202 104
116,125 51 5,546 98 46,523 81 35,833 93 18,588 79 365 103 56,328 94116,314 40 6,008 92 33,725 95 29,136 99 21,956 67 10,135 47 67,166 84116,125 51 7,783 82 49,913 75 23,648 103 21,319 69 1,010 98 54,095 95116,125 51 4,797 103 32,608 98 15,351 112 19,861 76 1,632 90 37,072 105116,125 51 10,635 64 22,951 108 20,841 108 7,142 105 5,625 66 33,886 107
0 -- 2,686 115 13,521 115 3,747 118 2,843 114 0 -- 13,690 11591,500 94 4,692 105 67,211 64 39,415 87 20,350 74 560 101 63,300 8759,634 99 3,701 113 33,572 96 57,829 66 8,076 101 1,114 96 67,405 8350,691 100 4,906 102 17,310 113 18,003 111 11,045 94 950 99 30,032 111
0 -- 4,038 109 35,812 94 20,174 109 25,765 58 0 -- 47,622 980 -- 6,035 91 39,989 89 23,495 105 20,990 71 0 -- 45,074 1000 -- 7,761 83 40,406 88 43,678 80 16,147 84 0 -- 60,563 900 -- 1,851 117 2,195 118 5,122 117 265 118 0 -- 7,888 1180 -- 5,698 96 39,152 90 40,324 85 28,958 51 0 -- 70,974 810 -- 1,026 118 14,500 114 11,075 114 4,093 110 0 -- 15,348 114
SELECT STATISTICS, BY KENTUCKY POPULATION, 2015-2016 -56

County PopulationJefferson 763,623 1Fayette 314,488 2Kenton 165,012 3Boone 127,712 4Warren 122,851 5Hardin 106,439 6Daviess 99,259 7Campbell 92,066 8Madison 87,824 9Bullitt 78,702 10Christian 73,309 11McCracken 65,018 12Oldham 64,875 13Pulaski 63,782 14Pike 61,792 15Laurel 60,094 16Scott 52,420 17Jessamine 51,961 18Franklin 50,375 19Boyd 48,325 20Henderson 46,407 21Hopkins 46,222 22Shelby 45,632 23Nelson 45,126 24Barren 43,570 25Calloway 38,343 26Floyd 37,756 27Graves 37,421 28Whitley 36,129 29Greenup 36,068 30Clark 35,757 31
Item Number ----> RANK
75 76 77 78 79 80 81 84No. of Users of Number of Children's Number of Young Adult Number of Adult TotalPublic Internet Children's Program Young Adult Program Adult Program Number of
Computers/Year Programs Attendance Programs Attendance Programs Attendance Programs756,924 1 2,285 4 57,993 3 677 2 6,538 3 3,736 1 74,439 1 11,779 1368,770 2 2,283 5 52,421 4 215 7 2,281 20 966 3 11,473 7 4,017 5255,734 3 4,670 1 101,484 1 652 3 15,525 1 1,736 2 40,520 2 7,432 2122,471 4 2,802 3 51,888 5 235 5 2,351 19 787 7 22,713 3 4,183 4105,797 8 1,678 6 37,325 8 201 9 4,340 5 290 18 15,305 5 2,169 836,618 18 1,424 8 24,251 12 83 26 671 50 681 9 4,910 18 2,192 7
120,397 6 1,243 11 29,746 9 212 8 3,542 9 55 68 2,676 31 1,711 1287,498 11 1,486 7 38,420 7 233 6 3,650 8 376 14 8,313 9 2,575 698,178 9 886 13 38,656 6 112 22 3,395 11 815 6 18,852 4 1,973 973,814 13 483 27 14,736 21 149 15 3,854 7 177 27 4,503 19 1,057 2014,793 64 87 100 2,300 89 18 71 188 84 26 91 400 94 158 9967,754 14 411 35 27,972 10 168 11 2,689 15 82 59 3,502 25 680 3727,016 30 417 33 19,811 14 97 23 6,102 4 158 37 2,670 32 852 29
108,593 7 2,934 2 79,510 2 956 1 12,692 2 644 10 7,373 11 5,306 393,764 10 491 24 6,746 47 66 36 483 57 566 12 6,333 12 1,488 1621,324 46 371 40 12,500 27 47 45 340 74 225 22 5,030 16 643 4026,200 34 561 22 13,676 25 73 31 1,119 39 124 44 2,447 35 845 3028,588 25 354 44 15,702 19 78 28 3,858 6 162 35 4,108 21 810 3134,680 19 423 32 11,891 29 115 19 2,017 22 163 34 3,507 24 869 2730,731 22 233 59 5,002 64 30 59 244 81 221 24 2,932 29 514 5128,466 26 657 19 10,605 35 164 12 2,613 16 127 43 1,553 49 1,007 2314,968 63 377 39 5,693 59 16 74 122 89 33 87 504 85 446 5922,744 41 410 36 11,182 33 43 48 285 79 485 13 5,983 13 1,136 1828,662 24 799 16 14,079 23 133 16 2,712 14 935 4 7,784 10 1,886 1015,120 62 278 53 7,883 42 39 52 442 61 105 51 718 74 474 5718,925 53 199 68 6,020 56 12 85 289 78 110 48 1,503 50 346 6974,238 12 69 107 1,743 96 39 52 1,942 25 35 86 536 81 267 8213,687 68 183 72 4,670 68 5 100 10 110 18 99 834 71 238 8523,021 40 294 52 6,375 53 53 39 647 51 28 89 461 87 648 3925,846 35 349 46 6,537 49 3 106 161 86 171 30 1,498 51 721 3456,135 15 429 31 11,719 31 71 34 1,132 38 856 5 14,248 6 1,491 15
RANK
RANK
RANK
RANK
RANK
RANK
RANK
RANK
SELECT STATISTICS, BY KENTUCKY POPULATION, 2015-2016 -57

County Population
Item Number ----> RANK
Knox 31,730 32Muhlenberg 31,183 33Marshall 31,101 34Boyle 29,809 35Meade 27,924 36Harlan 27,703 37Montgomery 27,608 38Perry 27,565 39Bell 27,337 40Carter 27,158 41Logan 26,910 42Grayson 26,221 43Woodford 25,793 44Taylor 25,420 45Grant 24,757 46Lincoln 24,463 47Ohio 24,216 48Rowan 23,892 49Johnson 23,175 50Letcher 23,123 51Anderson 21,979 52Mercer 21,407 53Clay 21,013 54Allen 20,640 55Wayne 20,464 56Bourbon 20,116 57Breckinridge 20,018 58Marion 19,365 59Adair 19,027 60Harrison 18,763 61Hart 18,454 62
75 76 77 78 79 80 81 84No. of Users of Number of Children's Number of Young Adult Number of Adult TotalPublic Internet Children's Program Young Adult Program Adult Program Number of
Computers/Year Programs Attendance Programs Attendance Programs Attendance Programs
RANK
RANK
RANK
RANK
RANK
RANK
RANK
RANK
16,896 57 117 89 4,057 73 13 81 308 77 19 98 680 77 182 9610,133 86 404 37 5,784 57 38 54 414 64 100 52 3,216 28 587 4427,634 29 479 28 11,058 34 113 21 1,015 41 41 77 462 86 683 3626,859 32 470 29 13,976 24 114 20 2,978 12 301 17 5,398 14 1,074 1910,434 83 816 14 15,963 18 77 29 1,492 29 780 8 8,320 8 1,747 1111,934 75 233 59 3,995 74 8 95 110 92 20 97 310 96 265 8327,938 27 360 42 4,513 70 15 77 99 94 58 66 1,005 67 480 5420,077 50 111 92 3,169 83 53 39 383 70 123 45 2,786 30 404 6414,228 65 133 80 3,203 82 37 55 317 76 153 40 1,653 46 365 665,896 105 1 118 80 117 0 -- 0 -- 0 -- 0 -- 1 118
29,495 23 271 55 5,767 58 23 64 131 88 177 27 1,413 53 537 4910,391 85 126 85 5,321 63 13 81 341 73 55 68 1,234 62 216 8923,486 39 1,020 12 19,920 13 69 35 834 46 349 15 3,762 23 1,516 1420,572 49 485 26 9,600 38 172 10 1,262 33 283 19 4,976 17 978 2424,642 38 77 103 1,351 102 46 46 2,428 18 40 80 2,635 33 171 9716,797 58 303 50 6,236 54 22 66 401 65 172 29 1,570 48 550 479,012 91 200 67 4,854 66 23 64 271 80 0 -- 0 -- 237 86
21,384 45 202 66 4,795 67 76 30 1,256 34 164 33 1,886 42 513 5210,600 82 339 47 6,124 55 28 63 1,868 26 223 23 3,327 27 777 3327,638 28 278 53 7,317 45 30 59 778 47 66 63 1,306 56 419 6216,324 60 595 21 15,970 17 80 27 1,486 30 263 20 1,702 45 938 2521,669 44 381 38 7,824 43 5 100 67 99 36 83 457 88 476 552,959 116 129 84 1,669 97 3 106 45 104 9 108 435 91 152 104
21,827 43 490 25 10,072 37 17 73 447 60 22 95 370 95 588 4312,218 74 111 92 2,823 86 9 93 397 68 38 82 250 102 196 9212,438 73 610 20 9,464 39 265 4 2,470 17 130 42 2,409 36 1,011 2211,867 76 323 49 11,909 28 18 71 470 59 154 39 2,311 37 601 4117,329 56 155 77 3,866 75 163 13 3,532 10 58 66 1,251 59 439 606,602 101 211 65 4,170 72 8 95 96 95 24 93 288 98 328 74
19,027 52 254 57 6,927 46 90 24 1,502 28 70 61 580 78 467 586,766 100 800 15 14,330 22 21 67 546 55 22 95 432 92 861 28
SELECT STATISTICS, BY KENTUCKY POPULATION, 2015-2016 -58

County Population
Item Number ----> RANK
Simpson 18,006 63Spencer 17,894 64McCreary 17,878 65Russell 17,662 66Garrard 17,237 67Mason 17,099 68Rockcastle 16,942 69Casey 15,808 70Lawrence 15,745 71Knott 15,693 72Henry 15,620 73Union 15,050 74Fleming 14,637 75Pendleton 14,408 76Estill 14,375 77LaRue 14,241 78Trigg 14,233 79Lewis 13,682 80Breathitt 13,484 81Jackson 13,352 82Morgan 13,275 83Webster 13,170 84Bal/Car 13,086 85Butler 12,938 86Magoffin 12,808 87Caldwell 12,681 88Todd 12,531 89Martin 12,307 90Powell 12,269 91Bath 12,228 92Washington 12,063 93
75 76 77 78 79 80 81 84No. of Users of Number of Children's Number of Young Adult Number of Adult TotalPublic Internet Children's Program Young Adult Program Adult Program Number of
Computers/Year Programs Attendance Programs Attendance Programs Attendance Programs
RANK
RANK
RANK
RANK
RANK
RANK
RANK
RANK
14,217 66 95 97 1,863 94 19 69 641 53 69 62 834 71 209 917,734 97 126 85 3,743 78 52 41 1,179 37 204 25 1,891 41 385 65
20,046 51 689 18 11,512 32 2 108 56 102 157 38 682 76 882 268,500 94 338 48 11,736 30 1 110 400 66 11 106 698 75 350 683,421 114 215 64 4,504 71 43 48 698 49 48 74 577 79 355 67
46,427 16 160 75 3,798 77 46 46 439 63 232 21 2,532 34 476 556,919 98 111 92 1,526 99 5 100 22 108 24 93 153 105 159 98
12,670 72 194 69 3,853 76 31 58 518 56 190 26 2,008 39 548 4818,202 54 1,252 10 16,609 16 132 17 2,964 13 108 49 3,487 26 1,579 136,500 103 71 106 1,374 101 0 -- 0 -- 0 -- 0 -- 86 112
13,333 69 185 71 5,351 62 51 42 441 62 171 30 1,235 61 407 6311,513 78 1,270 9 24,447 11 35 56 850 44 15 101 1,125 64 1,465 1713,161 70 151 78 6,536 50 59 38 1,213 36 97 53 1,762 43 311 7715,565 61 125 87 5,374 61 50 44 950 43 93 55 1,237 60 345 708,053 96 233 59 6,405 52 42 51 849 45 48 74 427 93 335 72
10,403 84 352 45 7,603 44 13 81 200 83 122 46 2,083 38 510 5324,671 37 250 58 3,432 79 154 14 1,948 24 63 65 930 69 525 5032,320 21 94 98 1,669 97 0 -- 0 -- 53 71 1,322 55 147 10533,134 20 355 43 4,606 69 29 62 1,328 32 30 88 1,283 57 420 618,516 93 151 78 3,239 81 11 89 2,261 21 12 104 220 103 226 87
38,498 17 78 102 847 111 43 48 81 97 14 103 295 97 135 10720,575 48 258 56 1,933 93 10 91 759 48 36 83 455 89 304 78
254 118 0 -- 0 119 0 -- 0 -- 0 -- 0 -- 0 --5,986 104 183 72 2,424 88 14 80 1,000 42 78 60 1,349 54 294 815,726 106 35 114 952 110 5 100 8 112 12 104 26 109 53 1148,747 92 131 83 1,332 103 12 85 75 98 41 77 1,266 58 186 955,297 108 93 99 1,405 100 12 85 105 93 5 109 26 109 110 110
13,709 67 538 23 10,422 36 35 56 571 54 65 64 1,709 44 717 3510,123 87 219 62 4,970 65 60 37 1,243 35 41 77 255 101 323 755,623 107 51 109 1,287 105 6 99 59 101 50 72 276 99 155 1019,795 90 692 17 8,538 40 10 91 119 90 55 68 451 90 805 32
SELECT STATISTICS, BY KENTUCKY POPULATION, 2015-2016 -59
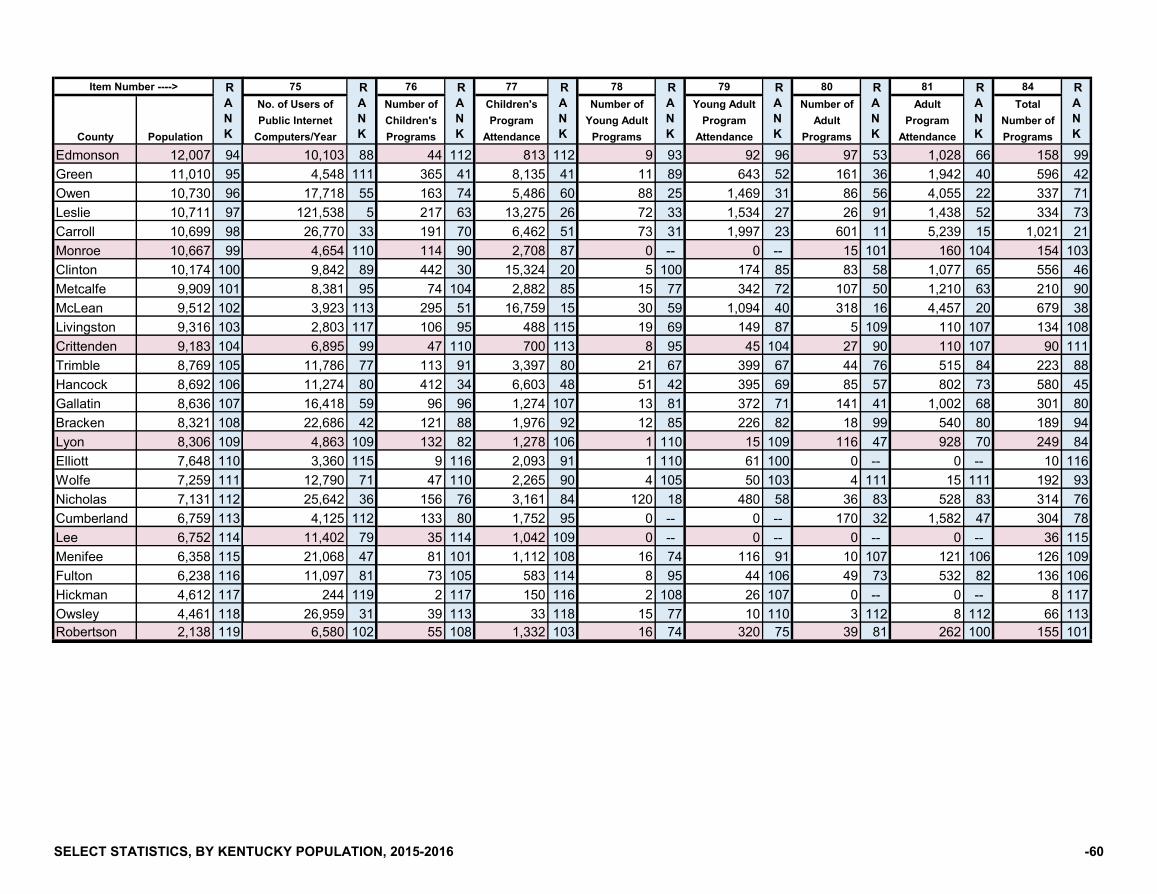
County Population
Item Number ----> RANK
Edmonson 12,007 94Green 11,010 95Owen 10,730 96Leslie 10,711 97Carroll 10,699 98Monroe 10,667 99Clinton 10,174 100Metcalfe 9,909 101McLean 9,512 102Livingston 9,316 103Crittenden 9,183 104Trimble 8,769 105Hancock 8,692 106Gallatin 8,636 107Bracken 8,321 108Lyon 8,306 109Elliott 7,648 110Wolfe 7,259 111Nicholas 7,131 112Cumberland 6,759 113Lee 6,752 114Menifee 6,358 115Fulton 6,238 116Hickman 4,612 117Owsley 4,461 118Robertson 2,138 119
75 76 77 78 79 80 81 84No. of Users of Number of Children's Number of Young Adult Number of Adult TotalPublic Internet Children's Program Young Adult Program Adult Program Number of
Computers/Year Programs Attendance Programs Attendance Programs Attendance Programs
RANK
RANK
RANK
RANK
RANK
RANK
RANK
RANK
10,103 88 44 112 813 112 9 93 92 96 97 53 1,028 66 158 994,548 111 365 41 8,135 41 11 89 643 52 161 36 1,942 40 596 42
17,718 55 163 74 5,486 60 88 25 1,469 31 86 56 4,055 22 337 71121,538 5 217 63 13,275 26 72 33 1,534 27 26 91 1,438 52 334 7326,770 33 191 70 6,462 51 73 31 1,997 23 601 11 5,239 15 1,021 214,654 110 114 90 2,708 87 0 -- 0 -- 15 101 160 104 154 1039,842 89 442 30 15,324 20 5 100 174 85 83 58 1,077 65 556 468,381 95 74 104 2,882 85 15 77 342 72 107 50 1,210 63 210 903,923 113 295 51 16,759 15 30 59 1,094 40 318 16 4,457 20 679 382,803 117 106 95 488 115 19 69 149 87 5 109 110 107 134 1086,895 99 47 110 700 113 8 95 45 104 27 90 110 107 90 111
11,786 77 113 91 3,397 80 21 67 399 67 44 76 515 84 223 8811,274 80 412 34 6,603 48 51 42 395 69 85 57 802 73 580 4516,418 59 96 96 1,274 107 13 81 372 71 141 41 1,002 68 301 8022,686 42 121 88 1,976 92 12 85 226 82 18 99 540 80 189 944,863 109 132 82 1,278 106 1 110 15 109 116 47 928 70 249 843,360 115 9 116 2,093 91 1 110 61 100 0 -- 0 -- 10 116
12,790 71 47 110 2,265 90 4 105 50 103 4 111 15 111 192 9325,642 36 156 76 3,161 84 120 18 480 58 36 83 528 83 314 764,125 112 133 80 1,752 95 0 -- 0 -- 170 32 1,582 47 304 78
11,402 79 35 114 1,042 109 0 -- 0 -- 0 -- 0 -- 36 11521,068 47 81 101 1,112 108 16 74 116 91 10 107 121 106 126 10911,097 81 73 105 583 114 8 95 44 106 49 73 532 82 136 106
244 119 2 117 150 116 2 108 26 107 0 -- 0 -- 8 11726,959 31 39 113 33 118 15 77 10 110 3 112 8 112 66 1136,580 102 55 108 1,332 103 16 74 320 75 39 81 262 100 155 101
SELECT STATISTICS, BY KENTUCKY POPULATION, 2015-2016 -60
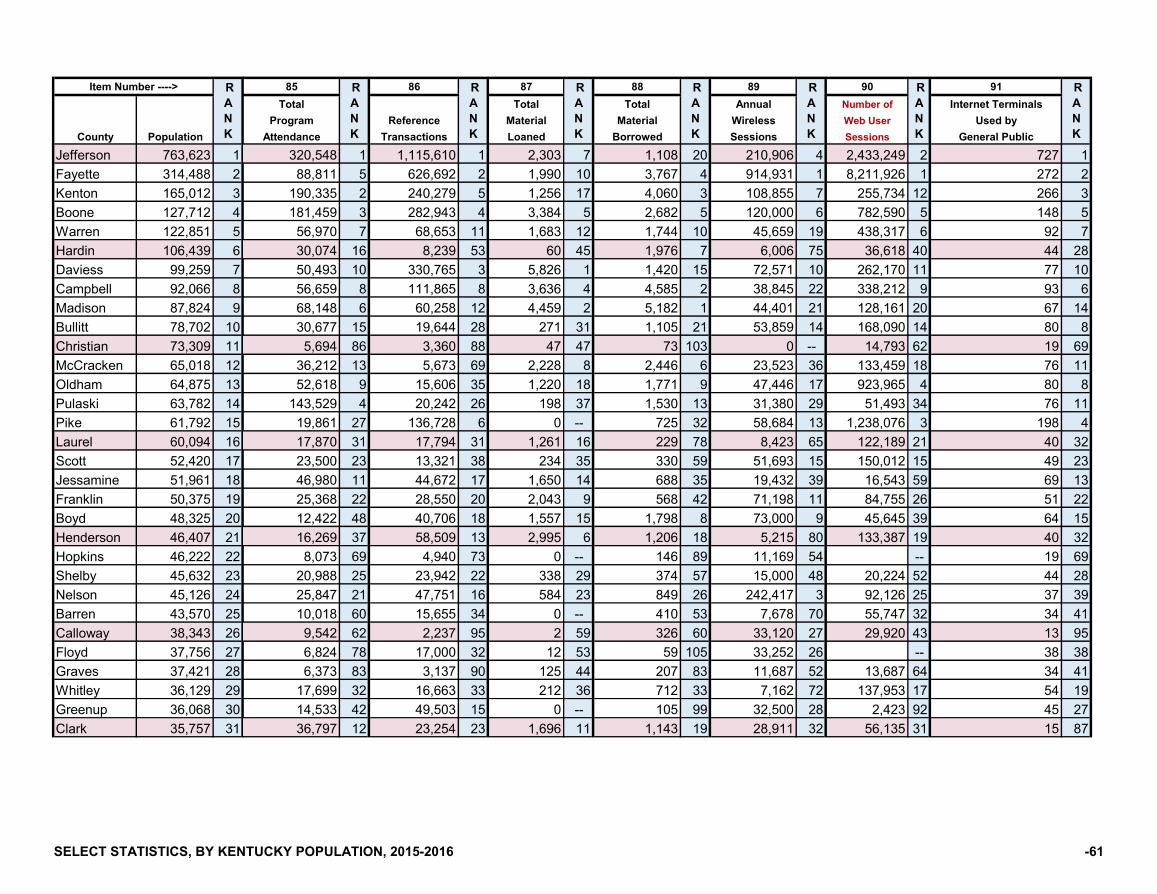
County PopulationJefferson 763,623 1Fayette 314,488 2Kenton 165,012 3Boone 127,712 4Warren 122,851 5Hardin 106,439 6Daviess 99,259 7Campbell 92,066 8Madison 87,824 9Bullitt 78,702 10Christian 73,309 11McCracken 65,018 12Oldham 64,875 13Pulaski 63,782 14Pike 61,792 15Laurel 60,094 16Scott 52,420 17Jessamine 51,961 18Franklin 50,375 19Boyd 48,325 20Henderson 46,407 21Hopkins 46,222 22Shelby 45,632 23Nelson 45,126 24Barren 43,570 25Calloway 38,343 26Floyd 37,756 27Graves 37,421 28Whitley 36,129 29Greenup 36,068 30Clark 35,757 31
Item Number ----> RANK
85 86 87 88 89 90 91Total Total Total Annual Number of Internet Terminals
Program Reference Material Material Wireless Web User Used byAttendance Transactions Loaned Borrowed Sessions Sessions General Public
320,548 1 1,115,610 1 2,303 7 1,108 20 210,906 4 2,433,249 2 727 188,811 5 626,692 2 1,990 10 3,767 4 914,931 1 8,211,926 1 272 2
190,335 2 240,279 5 1,256 17 4,060 3 108,855 7 255,734 12 266 3181,459 3 282,943 4 3,384 5 2,682 5 120,000 6 782,590 5 148 556,970 7 68,653 11 1,683 12 1,744 10 45,659 19 438,317 6 92 730,074 16 8,239 53 60 45 1,976 7 6,006 75 36,618 40 44 2850,493 10 330,765 3 5,826 1 1,420 15 72,571 10 262,170 11 77 1056,659 8 111,865 8 3,636 4 4,585 2 38,845 22 338,212 9 93 668,148 6 60,258 12 4,459 2 5,182 1 44,401 21 128,161 20 67 1430,677 15 19,644 28 271 31 1,105 21 53,859 14 168,090 14 80 85,694 86 3,360 88 47 47 73 103 0 -- 14,793 62 19 69
36,212 13 5,673 69 2,228 8 2,446 6 23,523 36 133,459 18 76 1152,618 9 15,606 35 1,220 18 1,771 9 47,446 17 923,965 4 80 8
143,529 4 20,242 26 198 37 1,530 13 31,380 29 51,493 34 76 1119,861 27 136,728 6 0 -- 725 32 58,684 13 1,238,076 3 198 417,870 31 17,794 31 1,261 16 229 78 8,423 65 122,189 21 40 3223,500 23 13,321 38 234 35 330 59 51,693 15 150,012 15 49 2346,980 11 44,672 17 1,650 14 688 35 19,432 39 16,543 59 69 1325,368 22 28,550 20 2,043 9 568 42 71,198 11 84,755 26 51 2212,422 48 40,706 18 1,557 15 1,798 8 73,000 9 45,645 39 64 1516,269 37 58,509 13 2,995 6 1,206 18 5,215 80 133,387 19 40 328,073 69 4,940 73 0 -- 146 89 11,169 54 -- 19 69
20,988 25 23,942 22 338 29 374 57 15,000 48 20,224 52 44 2825,847 21 47,751 16 584 23 849 26 242,417 3 92,126 25 37 3910,018 60 15,655 34 0 -- 410 53 7,678 70 55,747 32 34 419,542 62 2,237 95 2 59 326 60 33,120 27 29,920 43 13 956,824 78 17,000 32 12 53 59 105 33,252 26 -- 38 386,373 83 3,137 90 125 44 207 83 11,687 52 13,687 64 34 41
17,699 32 16,663 33 212 36 712 33 7,162 72 137,953 17 54 1914,533 42 49,503 15 0 -- 105 99 32,500 28 2,423 92 45 2736,797 12 23,254 23 1,696 11 1,143 19 28,911 32 56,135 31 15 87
RANK
RANK
RANK
RANK
RANK
RANK
RANK
SELECT STATISTICS, BY KENTUCKY POPULATION, 2015-2016 -61
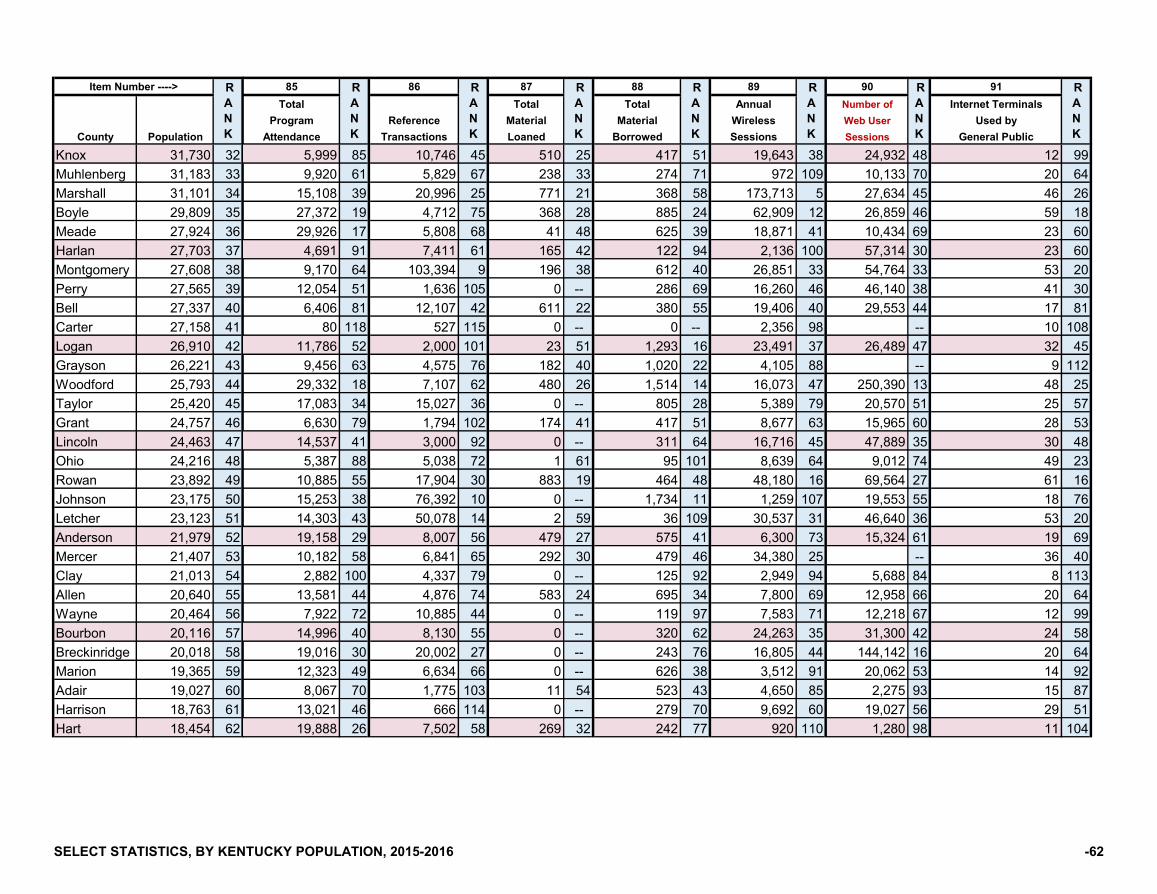
County Population
Item Number ----> RANK
Knox 31,730 32Muhlenberg 31,183 33Marshall 31,101 34Boyle 29,809 35Meade 27,924 36Harlan 27,703 37Montgomery 27,608 38Perry 27,565 39Bell 27,337 40Carter 27,158 41Logan 26,910 42Grayson 26,221 43Woodford 25,793 44Taylor 25,420 45Grant 24,757 46Lincoln 24,463 47Ohio 24,216 48Rowan 23,892 49Johnson 23,175 50Letcher 23,123 51Anderson 21,979 52Mercer 21,407 53Clay 21,013 54Allen 20,640 55Wayne 20,464 56Bourbon 20,116 57Breckinridge 20,018 58Marion 19,365 59Adair 19,027 60Harrison 18,763 61Hart 18,454 62
85 86 87 88 89 90 91Total Total Total Annual Number of Internet Terminals
Program Reference Material Material Wireless Web User Used byAttendance Transactions Loaned Borrowed Sessions Sessions General Public
RANK
RANK
RANK
RANK
RANK
RANK
RANK
5,999 85 10,746 45 510 25 417 51 19,643 38 24,932 48 12 999,920 61 5,829 67 238 33 274 71 972 109 10,133 70 20 64
15,108 39 20,996 25 771 21 368 58 173,713 5 27,634 45 46 2627,372 19 4,712 75 368 28 885 24 62,909 12 26,859 46 59 1829,926 17 5,808 68 41 48 625 39 18,871 41 10,434 69 23 604,691 91 7,411 61 165 42 122 94 2,136 100 57,314 30 23 609,170 64 103,394 9 196 38 612 40 26,851 33 54,764 33 53 20
12,054 51 1,636 105 0 -- 286 69 16,260 46 46,140 38 41 306,406 81 12,107 42 611 22 380 55 19,406 40 29,553 44 17 81
80 118 527 115 0 -- 0 -- 2,356 98 -- 10 10811,786 52 2,000 101 23 51 1,293 16 23,491 37 26,489 47 32 459,456 63 4,575 76 182 40 1,020 22 4,105 88 -- 9 112
29,332 18 7,107 62 480 26 1,514 14 16,073 47 250,390 13 48 2517,083 34 15,027 36 0 -- 805 28 5,389 79 20,570 51 25 576,630 79 1,794 102 174 41 417 51 8,677 63 15,965 60 28 53
14,537 41 3,000 92 0 -- 311 64 16,716 45 47,889 35 30 485,387 88 5,038 72 1 61 95 101 8,639 64 9,012 74 49 23
10,885 55 17,904 30 883 19 464 48 48,180 16 69,564 27 61 1615,253 38 76,392 10 0 -- 1,734 11 1,259 107 19,553 55 18 7614,303 43 50,078 14 2 59 36 109 30,537 31 46,640 36 53 2019,158 29 8,007 56 479 27 575 41 6,300 73 15,324 61 19 6910,182 58 6,841 65 292 30 479 46 34,380 25 -- 36 402,882 100 4,337 79 0 -- 125 92 2,949 94 5,688 84 8 113
13,581 44 4,876 74 583 24 695 34 7,800 69 12,958 66 20 647,922 72 10,885 44 0 -- 119 97 7,583 71 12,218 67 12 99
14,996 40 8,130 55 0 -- 320 62 24,263 35 31,300 42 24 5819,016 30 20,002 27 0 -- 243 76 16,805 44 144,142 16 20 6412,323 49 6,634 66 0 -- 626 38 3,512 91 20,062 53 14 928,067 70 1,775 103 11 54 523 43 4,650 85 2,275 93 15 87
13,021 46 666 114 0 -- 279 70 9,692 60 19,027 56 29 5119,888 26 7,502 58 269 32 242 77 920 110 1,280 98 11 104
SELECT STATISTICS, BY KENTUCKY POPULATION, 2015-2016 -62

County Population
Item Number ----> RANK
Simpson 18,006 63Spencer 17,894 64McCreary 17,878 65Russell 17,662 66Garrard 17,237 67Mason 17,099 68Rockcastle 16,942 69Casey 15,808 70Lawrence 15,745 71Knott 15,693 72Henry 15,620 73Union 15,050 74Fleming 14,637 75Pendleton 14,408 76Estill 14,375 77LaRue 14,241 78Trigg 14,233 79Lewis 13,682 80Breathitt 13,484 81Jackson 13,352 82Morgan 13,275 83Webster 13,170 84Bal/Car 13,086 85Butler 12,938 86Magoffin 12,808 87Caldwell 12,681 88Todd 12,531 89Martin 12,307 90Powell 12,269 91Bath 12,228 92Washington 12,063 93
85 86 87 88 89 90 91Total Total Total Annual Number of Internet Terminals
Program Reference Material Material Wireless Web User Used byAttendance Transactions Loaned Borrowed Sessions Sessions General Public
RANK
RANK
RANK
RANK
RANK
RANK
RANK
6,336 84 12,174 41 0 -- 485 45 3,391 92 11,233 68 13 956,893 77 2,045 99 0 -- 429 50 6,029 74 21,579 49 22 62
13,177 45 1,570 106 4,390 3 304 66 13,860 51 62,151 29 17 8112,834 47 3,188 89 0 -- 495 44 11,440 53 14,538 63 14 927,794 73 2,146 97 0 -- 1,574 12 2,907 95 -- 20 648,060 71 5,218 71 1,676 13 680 36 34,535 24 46,427 37 31 472,632 103 1,038 111 0 -- 456 49 551 114 6,919 81 17 818,139 68 3,686 83 817 20 0 -- 45,666 18 337,951 10 18 76
27,360 20 123,297 7 38 50 913 23 10,000 59 -- 19 691,424 109 5,526 70 0 -- 57 106 4,000 89 1,000 99 10 1087,027 76 18,940 29 20 52 163 87 14,232 50 67,258 28 16 84
31,972 14 3,460 86 0 -- 217 81 1,432 106 -- 60 1710,279 57 668 113 6 56 305 65 10,980 55 13,266 65 39 3610,158 59 1,679 104 0 -- 470 47 5,595 78 118,906 23 28 538,342 66 1,277 108 0 -- 321 61 7,969 66 8,053 76 15 87
11,219 53 9,163 47 39 49 187 84 2,209 99 21,108 50 19 697,130 74 196 117 0 -- 262 74 24,671 34 98,254 24 24 582,991 99 4,554 77 0 -- 809 27 5,154 81 8,888 75 40 328,325 67 7,425 60 5 57 0 -- 10,247 57 374,900 8 22 626,618 80 8,450 52 0 -- 50 107 1,700 104 1,673 97 16 841,223 111 8,212 54 0 -- 109 98 45,000 20 -- 29 513,147 98 8,993 49 0 -- 67 104 34,778 23 -- 14 92
0 -- 84 119 0 -- 6 111 0 -- -- 2 1195,234 89 3,996 80 0 -- 296 68 31,200 30 -- 11 104
991 114 1,100 110 0 -- 1,253 17 15,000 48 -- 8 1132,703 102 10,069 46 0 -- 151 88 1,722 103 7,449 80 12 991,536 108 4,396 78 59 46 302 67 7,965 67 -- 5 116
16,776 36 7,446 59 0 -- 726 31 10,070 58 18,250 57 33 437,048 75 2,011 100 0 -- 121 95 1,784 102 8,010 77 10 1082,607 104 22,930 24 0 -- 44 108 3,300 93 -- 19 69
10,766 56 13,903 37 0 -- 254 75 4,940 83 9,760 72 12 99
SELECT STATISTICS, BY KENTUCKY POPULATION, 2015-2016 -63
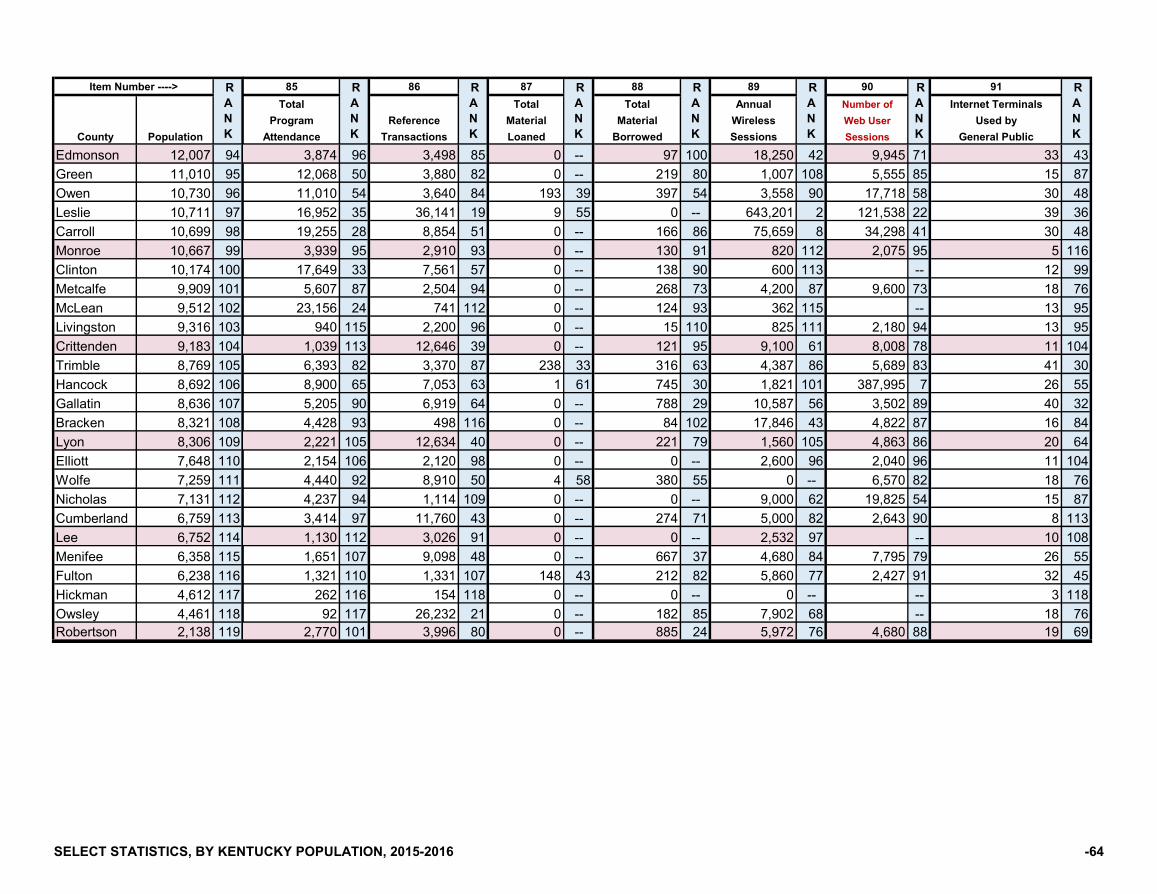
County Population
Item Number ----> RANK
Edmonson 12,007 94Green 11,010 95Owen 10,730 96Leslie 10,711 97Carroll 10,699 98Monroe 10,667 99Clinton 10,174 100Metcalfe 9,909 101McLean 9,512 102Livingston 9,316 103Crittenden 9,183 104Trimble 8,769 105Hancock 8,692 106Gallatin 8,636 107Bracken 8,321 108Lyon 8,306 109Elliott 7,648 110Wolfe 7,259 111Nicholas 7,131 112Cumberland 6,759 113Lee 6,752 114Menifee 6,358 115Fulton 6,238 116Hickman 4,612 117Owsley 4,461 118Robertson 2,138 119
85 86 87 88 89 90 91Total Total Total Annual Number of Internet Terminals
Program Reference Material Material Wireless Web User Used byAttendance Transactions Loaned Borrowed Sessions Sessions General Public
RANK
RANK
RANK
RANK
RANK
RANK
RANK
3,874 96 3,498 85 0 -- 97 100 18,250 42 9,945 71 33 4312,068 50 3,880 82 0 -- 219 80 1,007 108 5,555 85 15 8711,010 54 3,640 84 193 39 397 54 3,558 90 17,718 58 30 4816,952 35 36,141 19 9 55 0 -- 643,201 2 121,538 22 39 3619,255 28 8,854 51 0 -- 166 86 75,659 8 34,298 41 30 483,939 95 2,910 93 0 -- 130 91 820 112 2,075 95 5 116
17,649 33 7,561 57 0 -- 138 90 600 113 -- 12 995,607 87 2,504 94 0 -- 268 73 4,200 87 9,600 73 18 76
23,156 24 741 112 0 -- 124 93 362 115 -- 13 95940 115 2,200 96 0 -- 15 110 825 111 2,180 94 13 95
1,039 113 12,646 39 0 -- 121 95 9,100 61 8,008 78 11 1046,393 82 3,370 87 238 33 316 63 4,387 86 5,689 83 41 308,900 65 7,053 63 1 61 745 30 1,821 101 387,995 7 26 555,205 90 6,919 64 0 -- 788 29 10,587 56 3,502 89 40 324,428 93 498 116 0 -- 84 102 17,846 43 4,822 87 16 842,221 105 12,634 40 0 -- 221 79 1,560 105 4,863 86 20 642,154 106 2,120 98 0 -- 0 -- 2,600 96 2,040 96 11 1044,440 92 8,910 50 4 58 380 55 0 -- 6,570 82 18 764,237 94 1,114 109 0 -- 0 -- 9,000 62 19,825 54 15 873,414 97 11,760 43 0 -- 274 71 5,000 82 2,643 90 8 1131,130 112 3,026 91 0 -- 0 -- 2,532 97 -- 10 1081,651 107 9,098 48 0 -- 667 37 4,680 84 7,795 79 26 551,321 110 1,331 107 148 43 212 82 5,860 77 2,427 91 32 45
262 116 154 118 0 -- 0 -- 0 -- -- 3 11892 117 26,232 21 0 -- 182 85 7,902 68 -- 18 76
2,770 101 3,996 80 0 -- 885 24 5,972 76 4,680 88 19 69
SELECT STATISTICS, BY KENTUCKY POPULATION, 2015-2016 -64
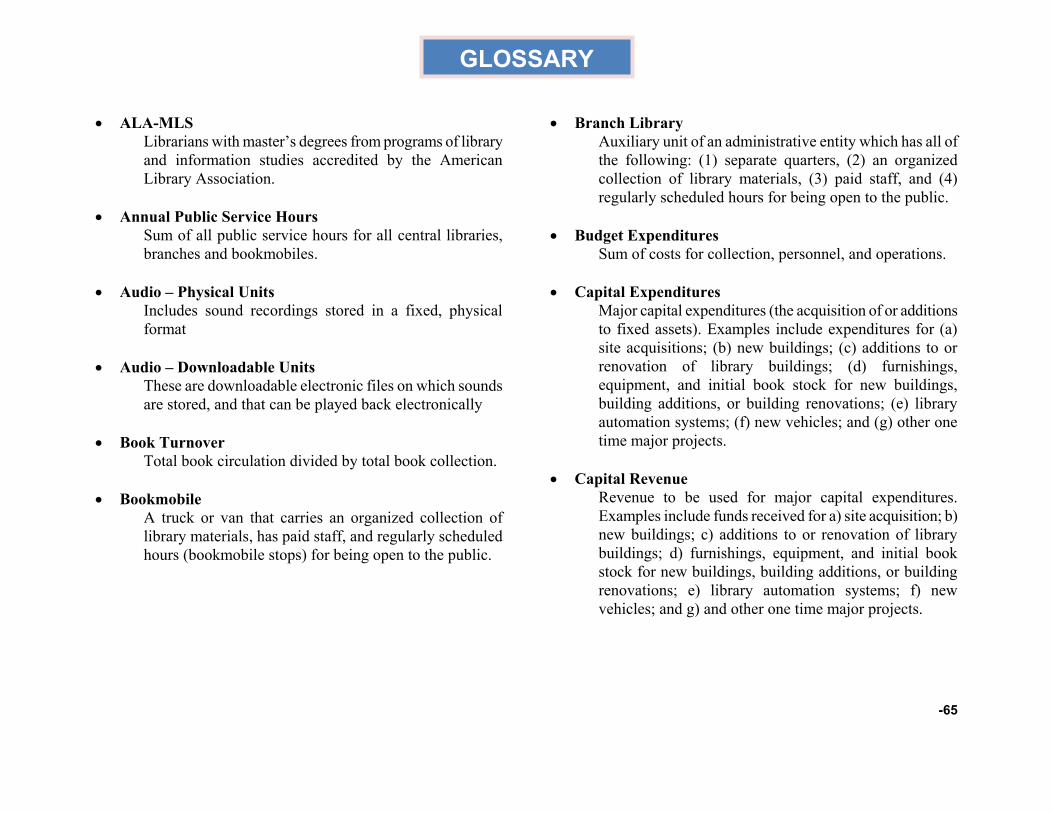
-65
GLOSSARY
ALA-MLS Librarians with master’s degrees from programs of library and information studies accredited by the American Library Association.
Annual Public Service Hours Sum of all public service hours for all central libraries, branches and bookmobiles.
Audio – Physical Units Includes sound recordings stored in a fixed, physical format Audio – Downloadable Units
These are downloadable electronic files on which sounds are stored, and that can be played back electronically
Book Turnover
Total book circulation divided by total book collection. Bookmobile
A truck or van that carries an organized collection of library materials, has paid staff, and regularly scheduled hours (bookmobile stops) for being open to the public.
Branch Library Auxiliary unit of an administrative entity which has all of the following: (1) separate quarters, (2) an organized collection of library materials, (3) paid staff, and (4) regularly scheduled hours for being open to the public.
Budget Expenditures
Sum of costs for collection, personnel, and operations.
Capital Expenditures Major capital expenditures (the acquisition of or additions to fixed assets). Examples include expenditures for (a) site acquisitions; (b) new buildings; (c) additions to or renovation of library buildings; (d) furnishings, equipment, and initial book stock for new buildings, building additions, or building renovations; (e) library automation systems; (f) new vehicles; and (g) other one time major projects.
Capital Revenue
Revenue to be used for major capital expenditures. Examples include funds received for a) site acquisition; b) new buildings; c) additions to or renovation of library buildings; d) furnishings, equipment, and initial book stock for new buildings, building additions, or building renovations; e) library automation systems; f) new vehicles; and g) and other one time major projects.

-66
GLOSSARY
Children's Program Attendance The count of the audience at all programs for which the primary audience is children 11 years and under. Includes adults who attend programs intended primarily for children.
Circulation
Materials in all formats that are charged out for use outside the library, including renewals.
Circulation of Electronic Materials Electronic Materials are materials that are distributed digitally and can be accessed via a computer, the Internet, or a portable device such as an e-book reader. Types of electronic materials include e-books and downloadable electronic video and audio files.
Electronic Books (E-Books) These are digital documents (including those digitized by the library), licensed or not, where searchable text is prevalent, and which can be seen in analogy to a printed book (monograph). Includes non-serial government documents. E-books are loaned to users on portable devices (e-book readers) or by transmitting the contents to the user’s personal computer for a limited time
. FTE (Full Time Equivalent)
To ensure comparable national data use the following calculation for budgeted positions: Hours worked by employees in a position / 40
General Operating Expenditures Library costs including supplies, rent, fees, building maintenance, postage, etc.
Intellectual Freedom Incidents The number of challenged works. Local Government Revenue
All local government funds designated by the community, district, or region and available for expenditure by the public library. Does not include the value of any contributed or in-kind services, or the value of any gifts and donations, library fines, fees or grants.
Material Circulated, Central Library Total material circulated in central library only. Material Circulation Per Capita
Sum of all material circulated for the central library, branches, and bookmobiles, divided by population.
Other Operating Revenue This is all operating revenue other than that reported under local, state, and federal.
People Entering Library Attendance. The total number of persons entering the li-brary for whatever purpose during the year.
Population The latest county population estimates as released by the
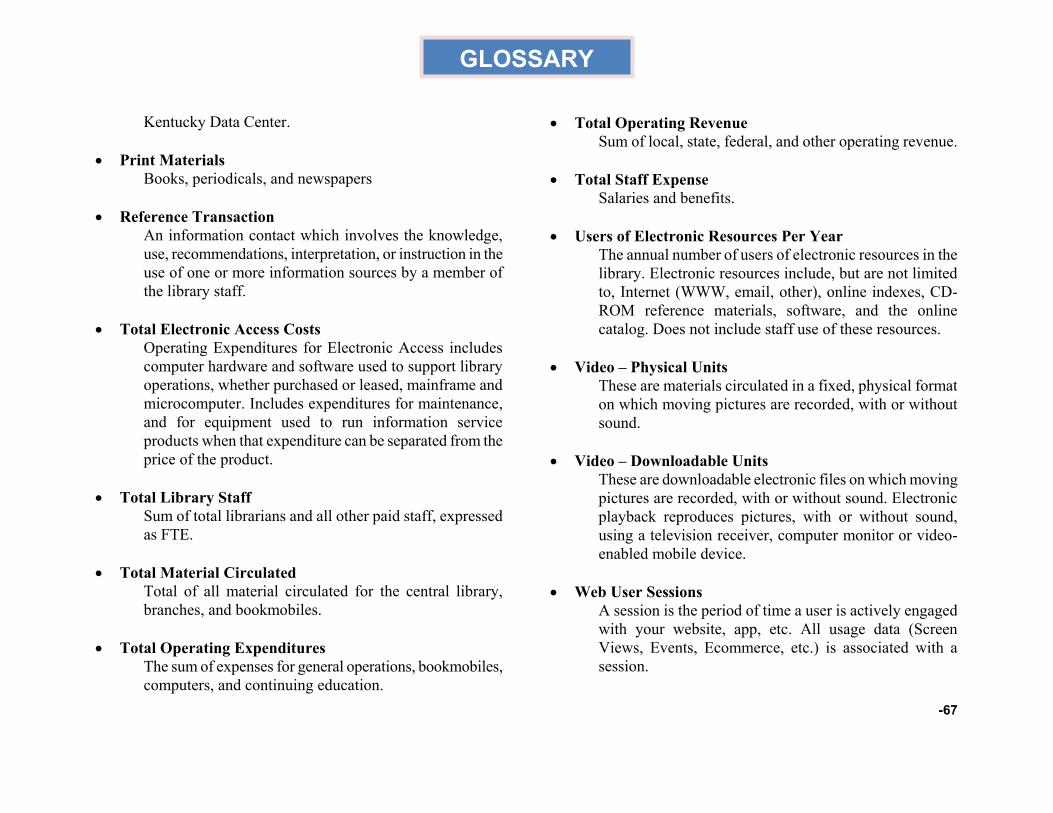
-67
GLOSSARY
Kentucky Data Center. Print Materials
Books, periodicals, and newspapers Reference Transaction
An information contact which involves the knowledge, use, recommendations, interpretation, or instruction in the use of one or more information sources by a member of the library staff.
Total Electronic Access Costs
Operating Expenditures for Electronic Access includes computer hardware and software used to support library operations, whether purchased or leased, mainframe and microcomputer. Includes expenditures for maintenance, and for equipment used to run information service products when that expenditure can be separated from the price of the product.
Total Library Staff Sum of total librarians and all other paid staff, expressed as FTE.
Total Material Circulated
Total of all material circulated for the central library, branches, and bookmobiles.
Total Operating Expenditures
The sum of expenses for general operations, bookmobiles, computers, and continuing education.
Total Operating Revenue Sum of local, state, federal, and other operating revenue.
Total Staff Expense Salaries and benefits.
Users of Electronic Resources Per Year
The annual number of users of electronic resources in the library. Electronic resources include, but are not limited to, Internet (WWW, email, other), online indexes, CD-ROM reference materials, software, and the online catalog. Does not include staff use of these resources.
Video – Physical Units These are materials circulated in a fixed, physical format on which moving pictures are recorded, with or without sound.
Video – Downloadable Units These are downloadable electronic files on which moving pictures are recorded, with or without sound. Electronic playback reproduces pictures, with or without sound, using a television receiver, computer monitor or video-enabled mobile device.
Web User Sessions A session is the period of time a user is actively engaged with your website, app, etc. All usage data (Screen Views, Events, Ecommerce, etc.) is associated with a session.

SPECIAL STATISTICAL COMPARISONS AND RANKINGS, 2015-2016 --68
R R R R R % of Total Income A % of Total Income A % of Total Income A Salary, A Fringe Benefits, A
from N from N from N Per N % of N Local Government K State Government K Federal Government K Staff (FTE) K Staff Expenditures K
Adair 94.8% 34 4.3% 46 0.0% -- $30,389 34 21.0% 95Allen 95.2% 24 2.1% 82 0.0% 16 $22,866 71 28.2% 49Anderson 97.3% 6 1.3% 105 0.0% -- $29,402 39 31.8% 27Bal/Car 5.6% 118 94.4% 1 0.0% -- $8,301 118 54.1% 1Barren 92.2% 72 4.2% 47 0.0% -- $22,214 78 25.6% 69Bath 94.9% 33 3.0% 67 0.0% -- $23,321 68 21.4% 94Bell 81.7% 99 16.0% 15 0.0% -- $29,340 41 30.7% 33Boone 96.8% 10 0.6% 118 0.2% 13 $33,670 17 25.4% 71Bourbon 85.0% 94 1.3% 106 0.0% -- $32,693 22 27.5% 54Boyd 91.5% 75 3.5% 59 0.0% -- $30,086 36 33.2% 20Boyle 77.9% 107 9.1% 27 0.5% 11 $30,501 33 20.6% 98Bracken 97.1% 9 2.9% 70 0.0% -- $17,480 101 18.3% 107Breathitt 95.1% 28 3.0% 68 0.0% -- $13,067 114 53.9% 2Breckinridge 92.3% 68 1.7% 94 4.0% 2 $21,556 84 34.7% 11Bullitt 95.6% 16 0.8% 117 0.0% -- $35,316 11 26.6% 59Butler 93.1% 59 4.4% 43 0.0% -- $24,286 64 11.8% 114Caldwell 93.6% 50 4.3% 44 0.0% -- $23,516 66 23.9% 81Calloway 95.4% 19 1.4% 101 0.0% -- $22,559 75 27.5% 55Campbell 93.8% 47 3.3% 62 1.0% 5 $33,257 20 25.0% 74Carroll 68.2% 111 11.7% 19 0.0% -- $31,929 26 24.8% 75Carter 57.6% 114 21.1% 10 0.0% -- $16,873 105 8.2% 115Casey 83.6% 97 14.9% 17 0.0% -- $25,934 58 25.5% 70Christian 78.1% 106 4.7% 39 0.0% -- $25,362 61 23.4% 83Clark 92.6% 62 3.8% 53 0.0% -- $38,658 5 30.1% 38Clay 89.5% 84 3.9% 51 0.0% -- $21,161 88 21.8% 91Clinton 90.8% 77 6.8% 32 0.0% -- $16,549 106 33.3% 19Crittenden 90.9% 76 5.6% 34 0.0% -- $21,766 82 22.2% 89Cumberland 94.9% 32 4.4% 42 0.0% -- $13,531 112 31.1% 31Daviess 89.0% 86 2.4% 75 0.1% 14 $35,188 12 24.0% 80Edmonson 93.5% 56 3.0% 69 0.0% -- $29,034 43 14.0% 111

SPECIAL STATISTICAL COMPARISONS AND RANKINGS, 2015-2016 --69
R R R R R % of Total Income A % of Total Income A % of Total Income A Salary, A Fringe Benefits, A
from N from N from N Per N % of N Local Government K State Government K Federal Government K Staff (FTE) K Staff Expenditures K
Elliott 0.0% 119 84.3% 2 0.0% -- $13,920 111 0.0% 119Estill 93.7% 48 2.4% 74 0.0% -- $27,692 50 28.9% 45Fayette 92.5% 66 1.4% 99 0.0% 15 $35,505 8 24.7% 77Fleming 67.8% 112 11.9% 18 0.0% -- $26,437 53 26.8% 57Floyd 98.1% 1 1.9% 86 0.0% -- $34,484 13 22.4% 88Franklin 94.4% 37 1.1% 111 0.0% -- $44,093 2 26.7% 58Fulton 90.4% 78 4.4% 41 0.0% -- $22,748 73 19.1% 103Gallatin 93.4% 57 1.8% 92 2.7% 3 $29,843 37 33.8% 16Garrard 93.6% 49 3.8% 52 0.0% -- $26,246 56 26.2% 63Grant 90.0% 81 6.9% 31 0.0% -- $22,749 72 34.1% 13Graves 95.5% 17 2.1% 80 0.0% -- $27,540 51 37.2% 5Grayson 95.1% 29 3.3% 63 0.0% -- $28,630 46 32.9% 22Green 92.3% 69 4.1% 49 0.0% -- $18,595 98 26.6% 60Greenup 93.6% 51 4.6% 40 0.0% -- $33,307 19 8.1% 116Hancock 97.2% 8 1.3% 104 0.0% -- $24,994 62 23.1% 85Hardin 88.3% 87 5.1% 36 0.0% -- $30,636 32 27.9% 52Harlan 97.8% 2 2.2% 77 0.0% -- $19,220 96 28.9% 46Harrison 89.1% 85 2.1% 81 0.0% -- $32,143 24 23.6% 82Hart 89.6% 83 9.4% 26 0.0% -- $25,614 60 14.9% 110Henderson 93.0% 61 1.0% 113 0.0% -- $39,036 4 30.4% 37Henry 94.9% 30 1.9% 87 0.0% -- $29,460 38 29.1% 44Hickman 17.5% 117 82.5% 3 0.0% -- $4,320 119 17.7% 108Hopkins 82.9% 98 4.9% 38 0.8% 8 $20,687 90 13.8% 112Jackson 92.5% 65 3.5% 58 0.0% -- $22,492 77 21.7% 92Jefferson 96.2% 13 1.7% 95 0.0% -- $36,300 7 26.0% 65Jessamine 97.5% 3 0.6% 119 0.0% -- $28,855 44 27.5% 53Johnson 97.2% 7 1.9% 89 0.0% -- $20,522 91 29.7% 42Kenton 97.3% 5 1.1% 110 0.0% -- $40,029 3 24.5% 78Knott 71.6% 110 24.3% 7 0.7% 9 $13,029 115 20.8% 97Knox 94.3% 40 3.6% 56 0.0% -- $34,188 14 22.8% 86

SPECIAL STATISTICAL COMPARISONS AND RANKINGS, 2015-2016 --70
R R R R R % of Total Income A % of Total Income A % of Total Income A Salary, A Fringe Benefits, A
from N from N from N Per N % of N Local Government K State Government K Federal Government K Staff (FTE) K Staff Expenditures K
LaRue 95.2% 23 3.2% 66 0.0% -- $16,963 104 32.1% 26Laurel 90.3% 79 7.4% 28 0.0% -- $27,317 52 32.3% 24Lawrence 87.6% 88 10.6% 21 0.0% -- $27,896 48 22.8% 87Lee 95.4% 18 3.5% 57 0.9% 7 $15,645 108 18.3% 106Leslie 95.3% 22 4.3% 45 0.0% -- $34,083 15 25.8% 68Letcher 95.2% 26 1.9% 85 0.0% -- $25,893 59 30.6% 36Lewis 76.1% 108 21.6% 8 0.0% -- $21,400 85 32.6% 23Lincoln 86.9% 90 10.1% 25 0.0% -- $23,511 67 30.8% 32Livingston 51.1% 115 44.4% 5 0.0% -- $15,706 107 7.5% 118Logan 96.5% 12 1.5% 97 0.0% -- $45,711 1 26.8% 56Lyon 95.2% 27 3.3% 61 0.0% -- $36,603 6 33.2% 21Madison 94.4% 38 1.2% 108 0.0% -- $29,350 40 31.3% 29Magoffin 92.3% 70 7.1% 29 0.0% -- $13,113 113 34.6% 12Marion 92.6% 64 2.5% 73 0.0% -- $22,195 79 20.2% 100Marshall 92.6% 63 0.9% 115 4.9% 1 $30,764 31 31.2% 30Martin 93.8% 46 2.8% 71 0.0% -- $21,574 83 33.4% 17Mason 86.8% 91 4.1% 48 0.0% -- $30,281 35 28.2% 50McCracken 92.4% 67 1.4% 98 0.0% -- $32,102 25 27.9% 51McCreary 85.0% 95 10.6% 22 0.0% -- $19,648 94 19.1% 104McLean 86.3% 92 5.8% 33 0.9% 6 $21,343 86 35.5% 9Meade 96.0% 15 1.3% 102 0.0% -- $12,900 116 20.6% 99Menifee 47.7% 116 45.8% 4 0.0% -- $8,940 117 47.7% 3Mercer 94.0% 45 1.4% 100 0.0% -- $33,850 16 31.5% 28Metcalfe 80.8% 100 16.6% 14 0.0% -- $26,020 57 19.2% 102Monroe 89.8% 82 6.9% 30 0.0% -- $21,817 80 20.8% 96Montgomery 93.6% 52 1.7% 96 0.0% -- $21,329 87 26.1% 64Morgan 93.1% 60 3.7% 55 0.0% -- $19,494 95 37.0% 6Muhlenberg 91.8% 73 1.3% 103 0.0% -- $26,382 55 34.0% 15Nelson 94.1% 41 3.3% 60 0.0% -- $35,454 9 28.8% 47Nicholas 80.3% 103 19.7% 11 0.0% -- $20,086 93 18.9% 105
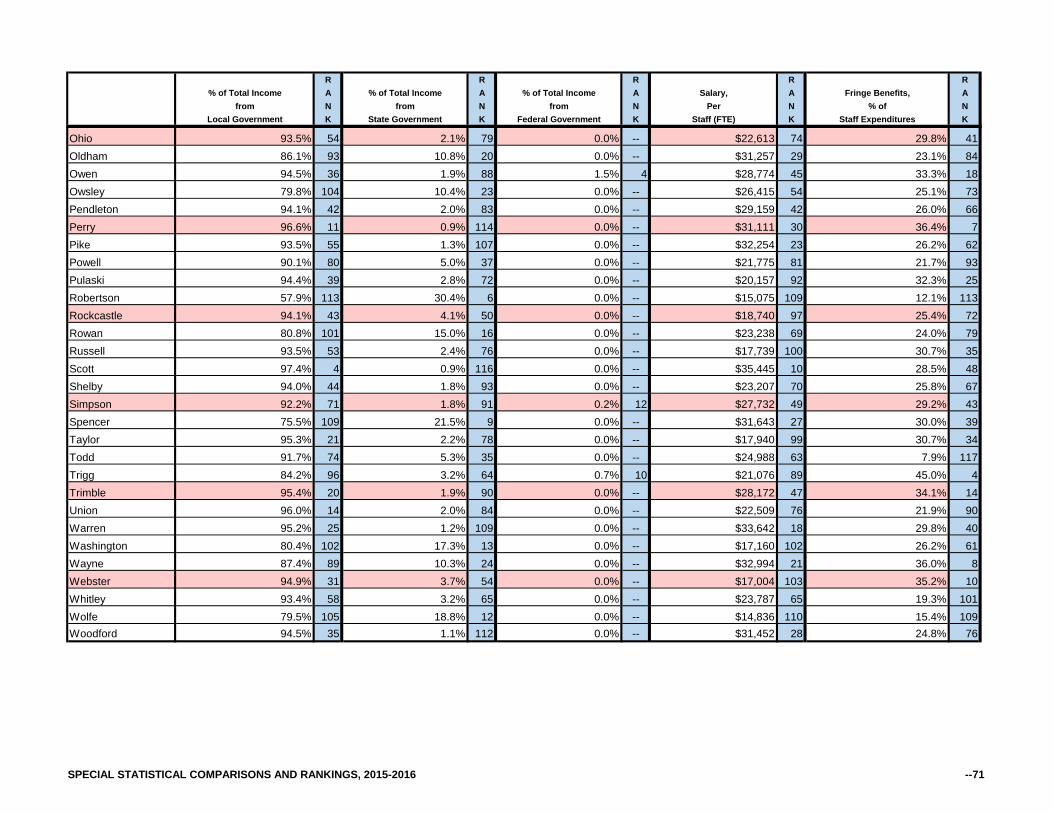
SPECIAL STATISTICAL COMPARISONS AND RANKINGS, 2015-2016 --71
R R R R R % of Total Income A % of Total Income A % of Total Income A Salary, A Fringe Benefits, A
from N from N from N Per N % of N Local Government K State Government K Federal Government K Staff (FTE) K Staff Expenditures K
Ohio 93.5% 54 2.1% 79 0.0% -- $22,613 74 29.8% 41Oldham 86.1% 93 10.8% 20 0.0% -- $31,257 29 23.1% 84Owen 94.5% 36 1.9% 88 1.5% 4 $28,774 45 33.3% 18Owsley 79.8% 104 10.4% 23 0.0% -- $26,415 54 25.1% 73Pendleton 94.1% 42 2.0% 83 0.0% -- $29,159 42 26.0% 66Perry 96.6% 11 0.9% 114 0.0% -- $31,111 30 36.4% 7Pike 93.5% 55 1.3% 107 0.0% -- $32,254 23 26.2% 62Powell 90.1% 80 5.0% 37 0.0% -- $21,775 81 21.7% 93Pulaski 94.4% 39 2.8% 72 0.0% -- $20,157 92 32.3% 25Robertson 57.9% 113 30.4% 6 0.0% -- $15,075 109 12.1% 113Rockcastle 94.1% 43 4.1% 50 0.0% -- $18,740 97 25.4% 72Rowan 80.8% 101 15.0% 16 0.0% -- $23,238 69 24.0% 79Russell 93.5% 53 2.4% 76 0.0% -- $17,739 100 30.7% 35Scott 97.4% 4 0.9% 116 0.0% -- $35,445 10 28.5% 48Shelby 94.0% 44 1.8% 93 0.0% -- $23,207 70 25.8% 67Simpson 92.2% 71 1.8% 91 0.2% 12 $27,732 49 29.2% 43Spencer 75.5% 109 21.5% 9 0.0% -- $31,643 27 30.0% 39Taylor 95.3% 21 2.2% 78 0.0% -- $17,940 99 30.7% 34Todd 91.7% 74 5.3% 35 0.0% -- $24,988 63 7.9% 117Trigg 84.2% 96 3.2% 64 0.7% 10 $21,076 89 45.0% 4Trimble 95.4% 20 1.9% 90 0.0% -- $28,172 47 34.1% 14Union 96.0% 14 2.0% 84 0.0% -- $22,509 76 21.9% 90Warren 95.2% 25 1.2% 109 0.0% -- $33,642 18 29.8% 40Washington 80.4% 102 17.3% 13 0.0% -- $17,160 102 26.2% 61Wayne 87.4% 89 10.3% 24 0.0% -- $32,994 21 36.0% 8Webster 94.9% 31 3.7% 54 0.0% -- $17,004 103 35.2% 10Whitley 93.4% 58 3.2% 65 0.0% -- $23,787 65 19.3% 101Wolfe 79.5% 105 18.8% 12 0.0% -- $14,836 110 15.4% 109Woodford 94.5% 35 1.1% 112 0.0% -- $31,452 28 24.8% 76

SPECIAL STATISTICAL COMPARISONS AND RANKINGS, 2015-2016 --72
AdairAllenAndersonBal/CarBarrenBathBellBooneBourbonBoydBoyleBrackenBreathittBreckinridgeBullittButlerCaldwellCallowayCampbellCarrollCarterCaseyChristianClarkClayClintonCrittendenCumberlandDaviessEdmonson
R R R R Audiovisual R Electronic Materials R Staff Expenditures, A Collection Expenditures, A Registered A A Circulation, A Circulation, A
% of N % of N Users, N Library Visits, N % of N % of N Total Expenditures K Total Expenditures K Per Capita K Per Capita K Total Circulation K Total Circulation K
63.0% 51 10.2% 89 0.22 118 1.4 114 16.0% 97 11.3% 2554.0% 94 21.1% 5 0.77 26 6.4 17 35.3% 36 7.4% 5352.0% 101 15.5% 28 0.73 33 3.9 51 29.7% 50 9.2% 3988.7% 1 0.8% 119 0.05 119 0.1 119 8.0% 113 0.0% --57.7% 79 16.1% 23 0.27 116 1.8 105 15.9% 98 16.5% 964.8% 36 8.2% 102 0.51 77 3.5 67 10.4% 108 3.2% 8866.0% 24 8.9% 97 0.54 64 3.4 68 27.9% 51 9.7% 3666.6% 22 13.1% 52 0.66 43 6.8 9 30.0% 48 9.2% 4057.8% 78 14.9% 34 0.34 107 4.7 37 36.2% 33 5.8% 7150.7% 105 23.0% 2 0.70 37 5.6 24 56.0% 3 11.7% 2069.6% 14 10.2% 88 0.76 27 5.3 29 19.6% 84 10.6% 3040.8% 116 20.2% 9 0.58 61 3.9 49 53.6% 5 4.4% 8250.8% 104 6.7% 110 0.66 44 6.4 16 25.6% 60 0.4% 10347.0% 111 20.7% 7 0.83 19 4.4 43 25.2% 63 11.0% 2865.5% 29 15.4% 29 0.33 110 3.7 57 30.7% 46 10.3% 3157.6% 80 19.5% 10 0.65 48 2.4 94 21.7% 76 7.4% 5262.0% 55 7.9% 106 0.41 94 1.4 110 2.2% 119 0.0% --48.1% 108 25.3% 1 0.93 11 6.6 13 15.3% 100 10.1% 3264.7% 37 14.7% 36 0.60 58 6.4 15 47.3% 9 6.8% 5853.7% 95 13.2% 51 0.91 13 10.5 1 43.9% 15 1.8% 9458.5% 72 1.0% 118 0.31 113 0.3 118 37.9% 27 0.0% --71.2% 7 11.5% 69 0.69 40 2.8 86 29.9% 49 5.7% 7359.5% 68 15.2% 30 0.34 108 1.4 112 41.5% 17 23.9% 271.2% 8 13.4% 47 0.53 69 3.6 61 34.0% 39 8.6% 4843.5% 114 20.7% 8 0.62 53 1.8 103 22.2% 73 8.8% 4467.2% 19 13.0% 54 0.62 54 4.6 42 17.5% 94 3.2% 8949.8% 106 17.7% 16 0.41 96 3.3 70 13.7% 104 0.0% --66.5% 23 13.6% 45 0.73 34 2.6 90 36.8% 30 3.2% 9065.4% 30 15.1% 32 0.77 25 7.4 7 39.6% 21 12.9% 1656.4% 83 10.7% 81 0.48 83 5.3 28 23.2% 69 5.7% 72
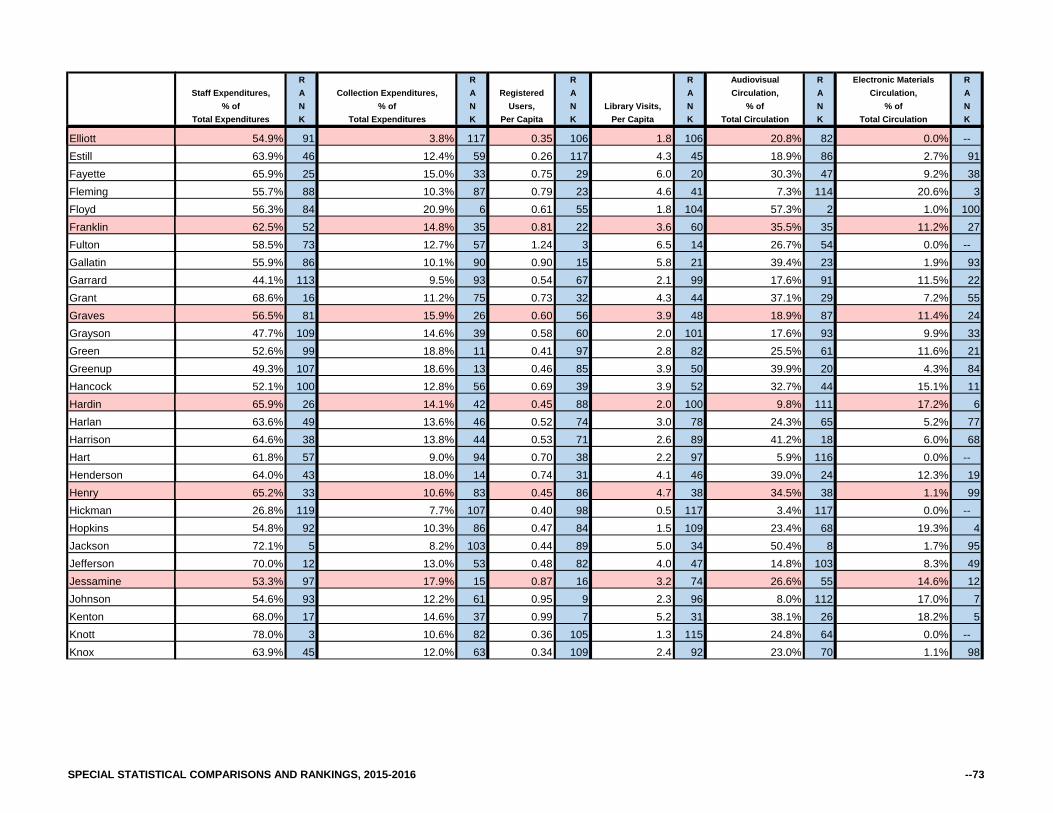
SPECIAL STATISTICAL COMPARISONS AND RANKINGS, 2015-2016 --73
ElliottEstillFayetteFlemingFloydFranklinFultonGallatinGarrardGrantGravesGraysonGreenGreenupHancockHardinHarlanHarrisonHartHendersonHenryHickmanHopkinsJacksonJeffersonJessamineJohnsonKentonKnottKnox
R R R R Audiovisual R Electronic Materials R Staff Expenditures, A Collection Expenditures, A Registered A A Circulation, A Circulation, A
% of N % of N Users, N Library Visits, N % of N % of N Total Expenditures K Total Expenditures K Per Capita K Per Capita K Total Circulation K Total Circulation K
54.9% 91 3.8% 117 0.35 106 1.8 106 20.8% 82 0.0% --63.9% 46 12.4% 59 0.26 117 4.3 45 18.9% 86 2.7% 9165.9% 25 15.0% 33 0.75 29 6.0 20 30.3% 47 9.2% 3855.7% 88 10.3% 87 0.79 23 4.6 41 7.3% 114 20.6% 356.3% 84 20.9% 6 0.61 55 1.8 104 57.3% 2 1.0% 10062.5% 52 14.8% 35 0.81 22 3.6 60 35.5% 35 11.2% 2758.5% 73 12.7% 57 1.24 3 6.5 14 26.7% 54 0.0% --55.9% 86 10.1% 90 0.90 15 5.8 21 39.4% 23 1.9% 9344.1% 113 9.5% 93 0.54 67 2.1 99 17.6% 91 11.5% 2268.6% 16 11.2% 75 0.73 32 4.3 44 37.1% 29 7.2% 5556.5% 81 15.9% 26 0.60 56 3.9 48 18.9% 87 11.4% 2447.7% 109 14.6% 39 0.58 60 2.0 101 17.6% 93 9.9% 3352.6% 99 18.8% 11 0.41 97 2.8 82 25.5% 61 11.6% 2149.3% 107 18.6% 13 0.46 85 3.9 50 39.9% 20 4.3% 8452.1% 100 12.8% 56 0.69 39 3.9 52 32.7% 44 15.1% 1165.9% 26 14.1% 42 0.45 88 2.0 100 9.8% 111 17.2% 663.6% 49 13.6% 46 0.52 74 3.0 78 24.3% 65 5.2% 7764.6% 38 13.8% 44 0.53 71 2.6 89 41.2% 18 6.0% 6861.8% 57 9.0% 94 0.70 38 2.2 97 5.9% 116 0.0% --64.0% 43 18.0% 14 0.74 31 4.1 46 39.0% 24 12.3% 1965.2% 33 10.6% 83 0.45 86 4.7 38 34.5% 38 1.1% 9926.8% 119 7.7% 107 0.40 98 0.5 117 3.4% 117 0.0% --54.8% 92 10.3% 86 0.47 84 1.5 109 23.4% 68 19.3% 472.1% 5 8.2% 103 0.44 89 5.0 34 50.4% 8 1.7% 9570.0% 12 13.0% 53 0.48 82 4.0 47 14.8% 103 8.3% 4953.3% 97 17.9% 15 0.87 16 3.2 74 26.6% 55 14.6% 1254.6% 93 12.2% 61 0.95 9 2.3 96 8.0% 112 17.0% 768.0% 17 14.6% 37 0.99 7 5.2 31 38.1% 26 18.2% 578.0% 3 10.6% 82 0.36 105 1.3 115 24.8% 64 0.0% --63.9% 45 12.0% 63 0.34 109 2.4 92 23.0% 70 1.1% 98
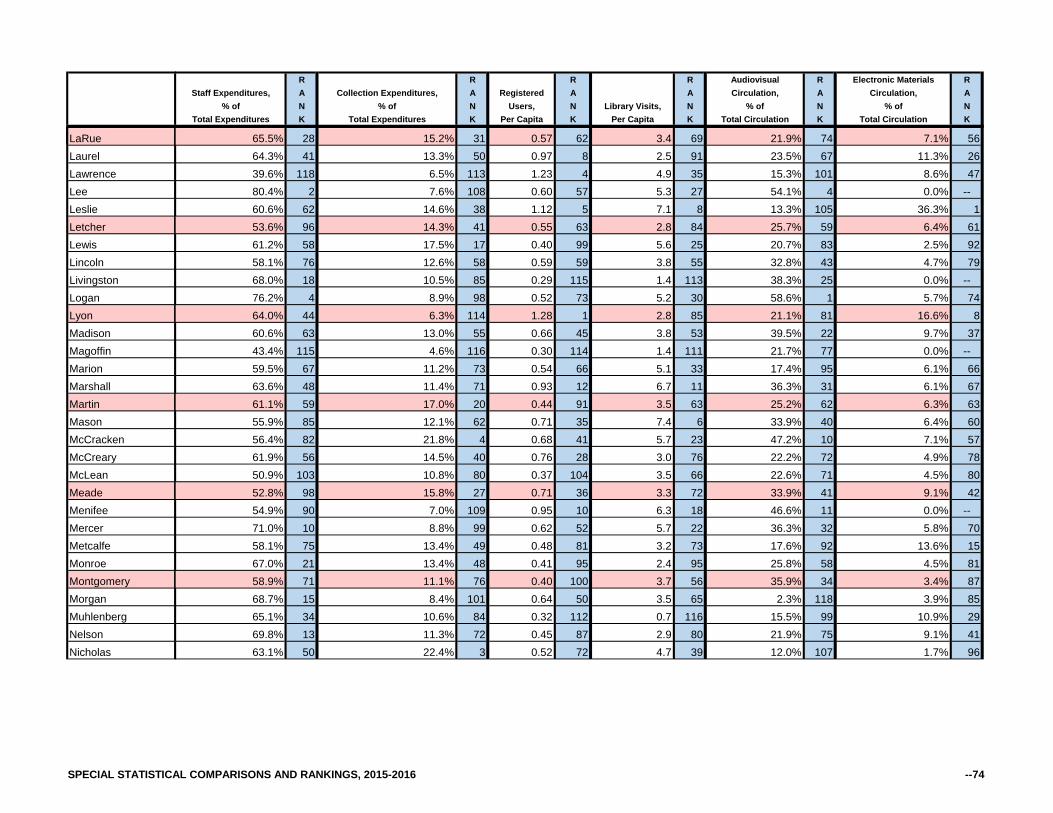
SPECIAL STATISTICAL COMPARISONS AND RANKINGS, 2015-2016 --74
LaRueLaurelLawrenceLeeLeslieLetcherLewisLincolnLivingstonLoganLyonMadisonMagoffinMarionMarshallMartinMasonMcCrackenMcCrearyMcLeanMeadeMenifeeMercerMetcalfeMonroeMontgomeryMorganMuhlenbergNelsonNicholas
R R R R Audiovisual R Electronic Materials R Staff Expenditures, A Collection Expenditures, A Registered A A Circulation, A Circulation, A
% of N % of N Users, N Library Visits, N % of N % of N Total Expenditures K Total Expenditures K Per Capita K Per Capita K Total Circulation K Total Circulation K
65.5% 28 15.2% 31 0.57 62 3.4 69 21.9% 74 7.1% 5664.3% 41 13.3% 50 0.97 8 2.5 91 23.5% 67 11.3% 2639.6% 118 6.5% 113 1.23 4 4.9 35 15.3% 101 8.6% 4780.4% 2 7.6% 108 0.60 57 5.3 27 54.1% 4 0.0% --60.6% 62 14.6% 38 1.12 5 7.1 8 13.3% 105 36.3% 153.6% 96 14.3% 41 0.55 63 2.8 84 25.7% 59 6.4% 6161.2% 58 17.5% 17 0.40 99 5.6 25 20.7% 83 2.5% 9258.1% 76 12.6% 58 0.59 59 3.8 55 32.8% 43 4.7% 7968.0% 18 10.5% 85 0.29 115 1.4 113 38.3% 25 0.0% --76.2% 4 8.9% 98 0.52 73 5.2 30 58.6% 1 5.7% 7464.0% 44 6.3% 114 1.28 1 2.8 85 21.1% 81 16.6% 860.6% 63 13.0% 55 0.66 45 3.8 53 39.5% 22 9.7% 3743.4% 115 4.6% 116 0.30 114 1.4 111 21.7% 77 0.0% --59.5% 67 11.2% 73 0.54 66 5.1 33 17.4% 95 6.1% 6663.6% 48 11.4% 71 0.93 12 6.7 11 36.3% 31 6.1% 6761.1% 59 17.0% 20 0.44 91 3.5 63 25.2% 62 6.3% 6355.9% 85 12.1% 62 0.71 35 7.4 6 33.9% 40 6.4% 6056.4% 82 21.8% 4 0.68 41 5.7 23 47.2% 10 7.1% 5761.9% 56 14.5% 40 0.76 28 3.0 76 22.2% 72 4.9% 7850.9% 103 10.8% 80 0.37 104 3.5 66 22.6% 71 4.5% 8052.8% 98 15.8% 27 0.71 36 3.3 72 33.9% 41 9.1% 4254.9% 90 7.0% 109 0.95 10 6.3 18 46.6% 11 0.0% --71.0% 10 8.8% 99 0.62 52 5.7 22 36.3% 32 5.8% 7058.1% 75 13.4% 49 0.48 81 3.2 73 17.6% 92 13.6% 1567.0% 21 13.4% 48 0.41 95 2.4 95 25.8% 58 4.5% 8158.9% 71 11.1% 76 0.40 100 3.7 56 35.9% 34 3.4% 8768.7% 15 8.4% 101 0.64 50 3.5 65 2.3% 118 3.9% 8565.1% 34 10.6% 84 0.32 112 0.7 116 15.5% 99 10.9% 2969.8% 13 11.3% 72 0.45 87 2.9 80 21.9% 75 9.1% 4163.1% 50 22.4% 3 0.52 72 4.7 39 12.0% 107 1.7% 96

SPECIAL STATISTICAL COMPARISONS AND RANKINGS, 2015-2016 --75
OhioOldhamOwenOwsleyPendletonPerryPikePowellPulaskiRobertsonRockcastleRowanRussellScottShelbySimpsonSpencerTaylorToddTriggTrimbleUnionWarrenWashingtonWayneWebsterWhitleyWolfeWoodford
R R R R Audiovisual R Electronic Materials R Staff Expenditures, A Collection Expenditures, A Registered A A Circulation, A Circulation, A
% of N % of N Users, N Library Visits, N % of N % of N Total Expenditures K Total Expenditures K Per Capita K Per Capita K Total Circulation K Total Circulation K
70.2% 11 11.9% 65 0.49 79 2.2 98 21.6% 79 12.8% 1771.0% 9 8.0% 104 0.53 70 3.7 58 21.4% 80 11.5% 2363.9% 47 10.8% 79 0.82 21 6.7 12 26.0% 57 4.3% 8372.0% 6 11.2% 74 1.28 2 8.8 3 40.8% 19 0.0% --59.9% 64 11.8% 67 0.65 47 3.3 71 45.3% 12 6.1% 6558.2% 74 17.1% 19 0.41 92 3.1 75 50.9% 7 8.9% 4351.7% 102 8.9% 96 0.65 46 2.8 83 35.0% 37 15.8% 1065.3% 31 6.6% 112 0.54 68 3.8 54 10.3% 109 13.9% 1460.9% 61 9.5% 92 0.41 93 3.6 62 18.0% 90 8.6% 4655.8% 87 8.5% 100 0.48 80 6.8 10 26.7% 53 0.0% --60.9% 60 8.0% 105 0.39 102 1.8 102 12.5% 106 9.9% 3458.0% 77 15.9% 25 0.86 17 7.6 4 43.9% 14 5.4% 7667.1% 20 6.7% 111 0.33 111 2.7 88 18.4% 89 6.3% 6462.4% 53 12.0% 64 0.77 24 3.0 79 23.9% 66 12.4% 1855.2% 89 11.9% 66 0.54 65 1.7 107 10.2% 110 7.9% 5145.3% 112 12.3% 60 0.83 20 5.1 32 41.5% 16 6.6% 5959.0% 70 9.6% 91 0.44 90 3.0 77 27.0% 52 14.2% 1364.1% 42 16.0% 24 0.40 101 3.5 64 15.2% 102 8.8% 4564.4% 40 11.0% 77 0.68 42 1.5 108 6.5% 115 3.8% 8659.4% 69 18.8% 12 0.91 14 6.1 19 26.6% 56 7.9% 5059.6% 65 9.0% 95 0.63 51 5.3 26 33.0% 42 0.6% 10265.2% 32 10.8% 78 0.51 78 2.4 93 19.2% 85 5.9% 6962.3% 54 16.8% 22 0.39 103 2.9 81 37.7% 28 5.6% 7564.4% 39 11.8% 68 0.74 30 2.7 87 21.6% 78 1.4% 9747.2% 110 6.2% 115 0.51 75 3.6 59 17.2% 96 7.3% 5465.8% 27 17.5% 18 1.09 6 4.8 36 45.0% 13 0.0% --40.0% 117 13.9% 43 0.84 18 4.6 40 51.1% 6 6.3% 6259.5% 66 16.8% 21 0.65 49 9.3 2 32.1% 45 0.9% 10164.9% 35 11.4% 70 0.51 76 7.6 5 18.5% 88 9.8% 35

SPECIAL STATISTICAL COMPARISONS AND RANKINGS, 2015-2016 --76
AdairAllenAndersonBal/CarBarrenBathBellBooneBourbonBoydBoyleBrackenBreathittBreckinridgeBullittButlerCaldwellCallowayCampbellCarrollCarterCaseyChristianClarkClayClintonCrittendenCumberlandDaviessEdmonson
Total R Total R R R R Circulation, A Circulation, A Total Circulation, A Web User Sessions, A County A
Per N Per N % Increase Over N % of N Population, per N Registered User K Visit K Previous Year K People Entering Library K Internet Terminal K
11.1 51 1.8 45 -46.9% 115 8.7% 92 1,268.5 928.9 72 1.1 97 -4.5% 73 9.8% 89 1,032.0 767.7 79 1.5 70 -2.6% 67 17.9% 65 1,156.8 845.1 100 3.0 9 -70.9% 118 -- 6,543.0 119
12.1 39 1.8 42 -6.4% 84 72.2% 21 1,281.5 9315.6 24 2.3 22 129.0% 3 -- 643.6 35
3.8 113 0.6 119 -20.9% 108 32.1% 48 1,608.1 10516.3 20 1.6 59 -12.7% 101 90.3% 16 862.9 6217.0 17 1.2 80 11.8% 14 32.9% 45 838.2 5516.8 18 2.1 29 2.9% 36 16.7% 72 755.1 4710.4 61 1.5 66 -2.1% 61 17.1% 68 505.2 24
7.7 80 1.1 91 -41.4% 114 14.8% 79 520.1 2611.2 50 1.2 90 7.0% 23 433.8% 5 612.9 33
6.8 86 1.3 79 -12.6% 100 162.6% 8 1,000.9 7312.0 41 1.1 95 5.7% 27 58.2% 26 983.8 68
5.2 99 1.4 71 -15.7% 105 -- 1,176.2 865.8 96 1.7 55 -11.1% 94 40.7% 36 1,056.8 806.6 88 0.9 108 10.4% 16 11.8% 85 2,949.5 117
22.7 4 2.1 26 6.3% 26 57.3% 27 990.0 7022.6 5 2.0 35 12.3% 13 30.5% 50 356.6 12
1.4 119 1.5 67 -34.0% 112 -- 2,715.8 11510.5 58 2.6 14 4.1% 33 776.1% 2 878.2 63
2.5 117 0.6 118 -57.5% 116 14.3% 80 3,858.4 11819.9 8 2.9 11 5.5% 28 43.6% 33 2,383.8 109
2.7 116 0.9 109 6.3% 25 14.8% 78 2,626.6 11319.4 9 2.6 15 7.1% 22 -- 847.8 5910.7 53 1.3 77 -2.6% 65 26.1% 55 834.8 54
6.1 92 1.7 50 -3.4% 70 15.3% 75 844.9 5811.2 48 1.2 86 1.5% 47 35.8% 44 1,289.1 9512.8 34 1.2 89 -6.3% 83 15.6% 74 363.8 14
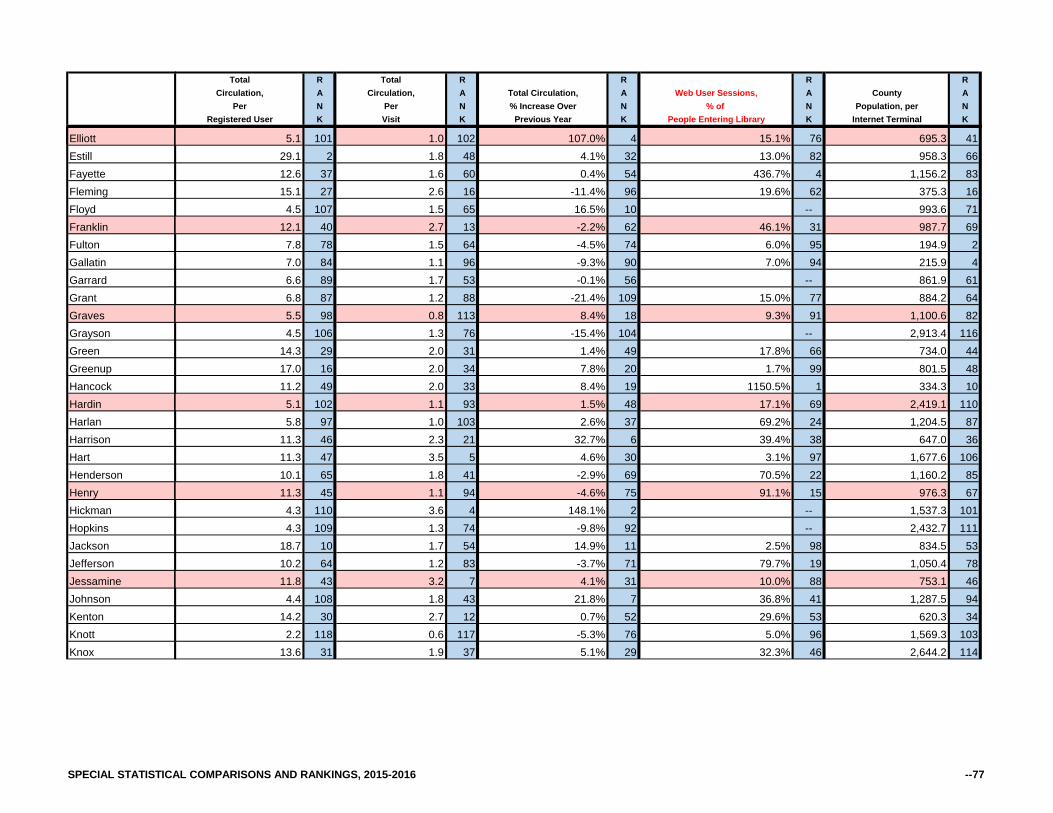
SPECIAL STATISTICAL COMPARISONS AND RANKINGS, 2015-2016 --77
ElliottEstillFayetteFlemingFloydFranklinFultonGallatinGarrardGrantGravesGraysonGreenGreenupHancockHardinHarlanHarrisonHartHendersonHenryHickmanHopkinsJacksonJeffersonJessamineJohnsonKentonKnottKnox
Total R Total R R R R Circulation, A Circulation, A Total Circulation, A Web User Sessions, A County A
Per N Per N % Increase Over N % of N Population, per N Registered User K Visit K Previous Year K People Entering Library K Internet Terminal K
5.1 101 1.0 102 107.0% 4 15.1% 76 695.3 4129.1 2 1.8 48 4.1% 32 13.0% 82 958.3 6612.6 37 1.6 60 0.4% 54 436.7% 4 1,156.2 8315.1 27 2.6 16 -11.4% 96 19.6% 62 375.3 16
4.5 107 1.5 65 16.5% 10 -- 993.6 7112.1 40 2.7 13 -2.2% 62 46.1% 31 987.7 69
7.8 78 1.5 64 -4.5% 74 6.0% 95 194.9 27.0 84 1.1 96 -9.3% 90 7.0% 94 215.9 46.6 89 1.7 53 -0.1% 56 -- 861.9 616.8 87 1.2 88 -21.4% 109 15.0% 77 884.2 645.5 98 0.8 113 8.4% 18 9.3% 91 1,100.6 824.5 106 1.3 76 -15.4% 104 -- 2,913.4 116
14.3 29 2.0 31 1.4% 49 17.8% 66 734.0 4417.0 16 2.0 34 7.8% 20 1.7% 99 801.5 4811.2 49 2.0 33 8.4% 19 1150.5% 1 334.3 10
5.1 102 1.1 93 1.5% 48 17.1% 69 2,419.1 1105.8 97 1.0 103 2.6% 37 69.2% 24 1,204.5 87
11.3 46 2.3 21 32.7% 6 39.4% 38 647.0 3611.3 47 3.5 5 4.6% 30 3.1% 97 1,677.6 10610.1 65 1.8 41 -2.9% 69 70.5% 22 1,160.2 8511.3 45 1.1 94 -4.6% 75 91.1% 15 976.3 67
4.3 110 3.6 4 148.1% 2 -- 1,537.3 1014.3 109 1.3 74 -9.8% 92 -- 2,432.7 111
18.7 10 1.7 54 14.9% 11 2.5% 98 834.5 5310.2 64 1.2 83 -3.7% 71 79.7% 19 1,050.4 7811.8 43 3.2 7 4.1% 31 10.0% 88 753.1 46
4.4 108 1.8 43 21.8% 7 36.8% 41 1,287.5 9414.2 30 2.7 12 0.7% 52 29.6% 53 620.3 34
2.2 118 0.6 117 -5.3% 76 5.0% 96 1,569.3 10313.6 31 1.9 37 5.1% 29 32.3% 46 2,644.2 114

SPECIAL STATISTICAL COMPARISONS AND RANKINGS, 2015-2016 --78
LaRueLaurelLawrenceLeeLeslieLetcherLewisLincolnLivingstonLoganLyonMadisonMagoffinMarionMarshallMartinMasonMcCrackenMcCrearyMcLeanMeadeMenifeeMercerMetcalfeMonroeMontgomeryMorganMuhlenbergNelsonNicholas
Total R Total R R R R Circulation, A Circulation, A Total Circulation, A Web User Sessions, A County A
Per N Per N % Increase Over N % of N Population, per N Registered User K Visit K Previous Year K People Entering Library K Internet Terminal K
9.7 67 1.6 56 2.9% 35 44.0% 32 749.5 455.9 95 2.2 23 -5.9% 79 79.9% 18 1,502.4 1003.7 114 0.9 105 1.7% 45 -- 828.7 52
11.8 44 1.3 75 6.7% 24 -- 675.2 3934.4 1 5.4 2 2.4% 40 159.0% 9 274.6 8
6.0 94 1.2 85 -25.9% 110 72.5% 20 436.3 2022.6 6 1.6 58 -1.8% 59 11.6% 86 342.1 11
8.8 73 1.4 72 -5.3% 77 52.1% 30 815.4 5122.3 7 4.6 3 265.3% 1 16.8% 71 716.6 4217.2 15 1.7 52 -9.3% 91 18.8% 64 840.9 57
3.2 115 1.5 68 -6.4% 85 21.2% 60 415.3 1910.4 59 1.8 47 2.5% 38 38.1% 40 1,310.8 96
4.1 111 0.9 112 -0.2% 57 -- 1,601.0 1048.8 74 0.9 107 -0.3% 58 20.3% 61 1,383.2 98
15.4 26 2.1 25 -7.0% 86 13.2% 81 676.1 4011.0 52 1.4 73 -6.0% 81 42.2% 35 372.9 1510.4 60 1.0 104 -7.3% 87 36.6% 42 551.6 3015.8 21 1.9 38 -2.1% 60 36.0% 43 855.5 60
6.1 93 1.5 63 -11.6% 97 114.1% 12 1,051.6 797.4 82 0.8 115 -5.6% 78 -- 731.7 436.8 85 1.5 69 2.0% 43 11.4% 87 1,214.1 887.5 81 1.1 92 49.0% 5 19.5% 63 244.5 5
12.0 42 1.3 78 -12.2% 99 -- 594.6 3213.1 33 1.9 36 -4.3% 72 29.9% 52 550.5 29
9.5 70 1.6 57 -60.2% 117 8.2% 93 2,133.4 10816.3 19 1.7 49 -2.6% 66 53.0% 29 520.9 27
4.8 104 0.9 111 1.6% 46 -- 457.8 2117.8 12 7.6 1 -39.5% 113 43.4% 34 1,559.2 10215.4 25 2.4 19 0.0% 55 69.5% 23 1,219.6 8918.2 11 2.0 32 -13.4% 102 59.1% 25 475.4 22

SPECIAL STATISTICAL COMPARISONS AND RANKINGS, 2015-2016 --79
OhioOldhamOwenOwsleyPendletonPerryPikePowellPulaskiRobertsonRockcastleRowanRussellScottShelbySimpsonSpencerTaylorToddTriggTrimbleUnionWarrenWashingtonWayneWebsterWhitleyWolfeWoodford
Total R Total R R R R Circulation, A Circulation, A Total Circulation, A Web User Sessions, A County A
Per N Per N % Increase Over N % of N Population, per N Registered User K Visit K Previous Year K People Entering Library K Internet Terminal K
9.5 68 2.1 27 0.5% 53 16.8% 70 494.2 2312.7 35 1.8 40 1.9% 44 389.1% 6 810.9 49
8.5 75 1.0 101 -2.8% 68 24.5% 56 357.7 1312.5 38 1.8 44 -5.9% 80 -- 247.8 6
9.5 69 1.9 39 -8.9% 89 249.7% 7 514.6 2517.4 14 2.3 20 10.4% 17 54.0% 28 672.3 38
8.9 71 2.1 28 19.9% 8 719.9% 3 312.1 94.9 103 0.7 116 -2.5% 64 17.1% 67 1,226.9 90
10.6 54 1.2 81 -7.5% 88 22.6% 58 839.2 5615.0 28 1.1 99 2.1% 42 32.3% 47 112.5 1
7.3 83 1.6 61 -2.5% 63 22.3% 59 996.6 7210.6 56 1.2 84 2.4% 39 38.4% 39 391.7 1712.7 36 1.6 62 1.3% 50 30.9% 49 1,261.6 91
8.5 76 2.2 24 -11.4% 95 96.0% 14 1,069.8 8110.3 62 3.3 6 0.8% 51 26.3% 54 1,037.1 77
6.4 90 1.0 100 -20.0% 107 12.2% 83 1,385.1 996.2 91 0.9 110 -10.5% 93 39.8% 37 813.4 50
15.8 22 1.8 46 7.6% 21 23.1% 57 1,016.8 753.9 112 1.7 51 -77.0% 119 -- 2,506.2 1127.9 77 1.2 87 -6.2% 82 112.4% 13 593.0 31
10.2 63 1.2 82 -16.2% 106 12.2% 84 213.9 39.9 66 2.1 30 -11.7% 98 -- 250.8 7
23.0 3 3.1 8 13.2% 12 123.1% 11 1,335.3 9710.5 57 2.9 10 19.6% 9 30.4% 51 1,005.3 7417.7 13 2.5 17 -13.6% 103 16.4% 73 1,705.3 10710.6 55 2.4 18 11.7% 15 -- 940.7 65
4.5 105 0.8 114 -30.8% 111 82.7% 17 669.1 3713.5 32 0.9 106 3.0% 34 9.8% 90 403.3 1815.8 23 1.1 98 2.1% 41 128.1% 10 537.4 28
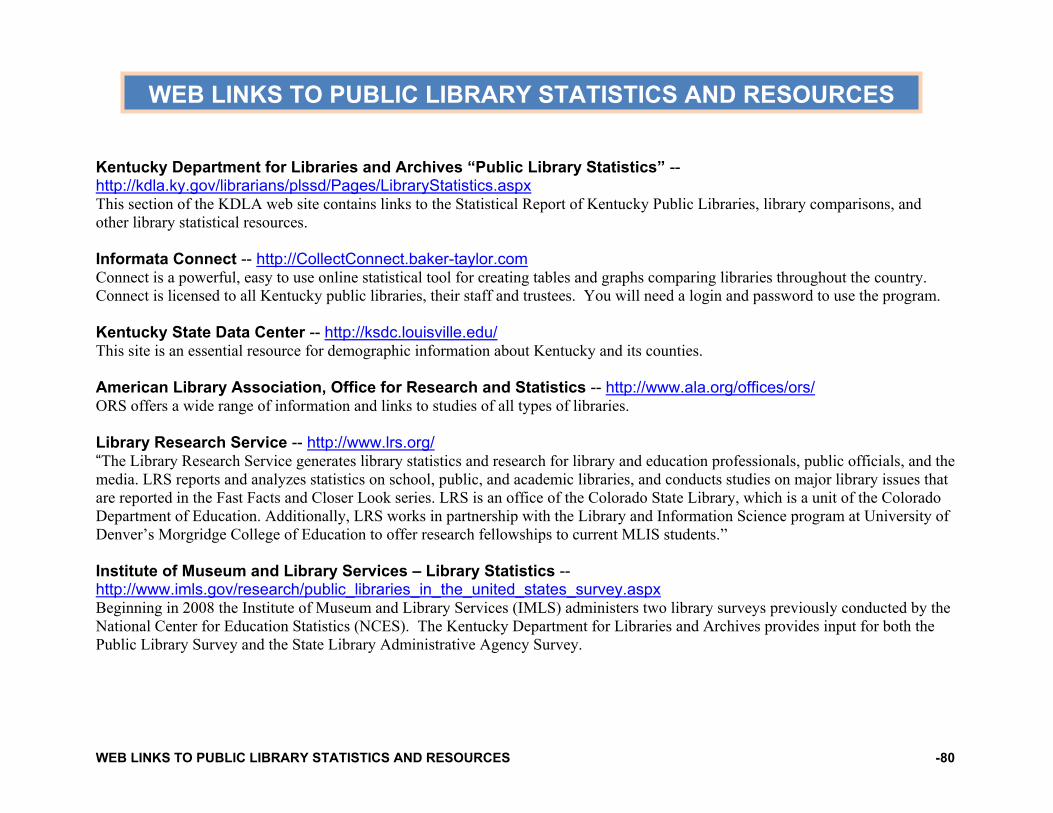
WEB LINKS TO PUBLIC LIBRARY STATISTICS AND RESOURCES -80
Kentucky Department for Libraries and Archives “Public Library Statistics” -- http://kdla.ky.gov/librarians/plssd/Pages/LibraryStatistics.aspx This section of the KDLA web site contains links to the Statistical Report of Kentucky Public Libraries, library comparisons, and other library statistical resources.
Informata Connect -- http://CollectConnect.baker-taylor.com Connect is a powerful, easy to use online statistical tool for creating tables and graphs comparing libraries throughout the country. Connect is licensed to all Kentucky public libraries, their staff and trustees. You will need a login and password to use the program. Kentucky State Data Center -- http://ksdc.louisville.edu/ This site is an essential resource for demographic information about Kentucky and its counties. American Library Association, Office for Research and Statistics -- http://www.ala.org/offices/ors/ ORS offers a wide range of information and links to studies of all types of libraries. Library Research Service -- http://www.lrs.org/ “The Library Research Service generates library statistics and research for library and education professionals, public officials, and the media. LRS reports and analyzes statistics on school, public, and academic libraries, and conducts studies on major library issues that are reported in the Fast Facts and Closer Look series. LRS is an office of the Colorado State Library, which is a unit of the Colorado Department of Education. Additionally, LRS works in partnership with the Library and Information Science program at University of Denver’s Morgridge College of Education to offer research fellowships to current MLIS students.” Institute of Museum and Library Services – Library Statistics -- http://www.imls.gov/research/public_libraries_in_the_united_states_survey.aspx Beginning in 2008 the Institute of Museum and Library Services (IMLS) administers two library surveys previously conducted by the National Center for Education Statistics (NCES). The Kentucky Department for Libraries and Archives provides input for both the Public Library Survey and the State Library Administrative Agency Survey.
WEB LINKS TO PUBLIC LIBRARY STATISTICS AND RESOURCES