statistics for journalists description of quantitative variables for quantitative data as with...
Post on 21-Dec-2015
220 views
TRANSCRIPT
Statistics for Journalists
Description of quantitative variables
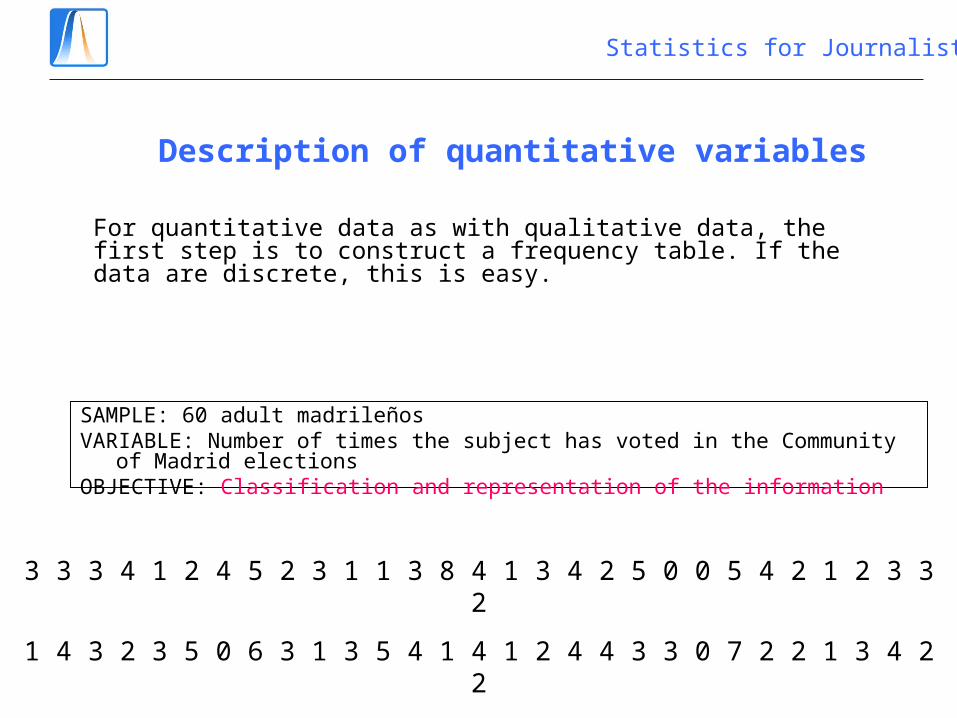
For quantitative data as with qualitative data, the first step is to construct a frequency table. If the data are discrete, this is easy.
3 3 3 4 1 2 4 5 2 3 1 1 3 8 4 1 3 4 2 5 0 0 5 4 2 1 2 3 3 2
1 4 3 2 3 5 0 6 3 1 3 5 4 1 4 1 2 4 4 3 3 0 7 2 2 1 3 4 2 2
SAMPLE: 60 adult madrileñosVARIABLE: Number of times the subject has voted in the Community of Madrid electionsOBJECTIVE: Classification and representation of the information
Statistics for Journalists
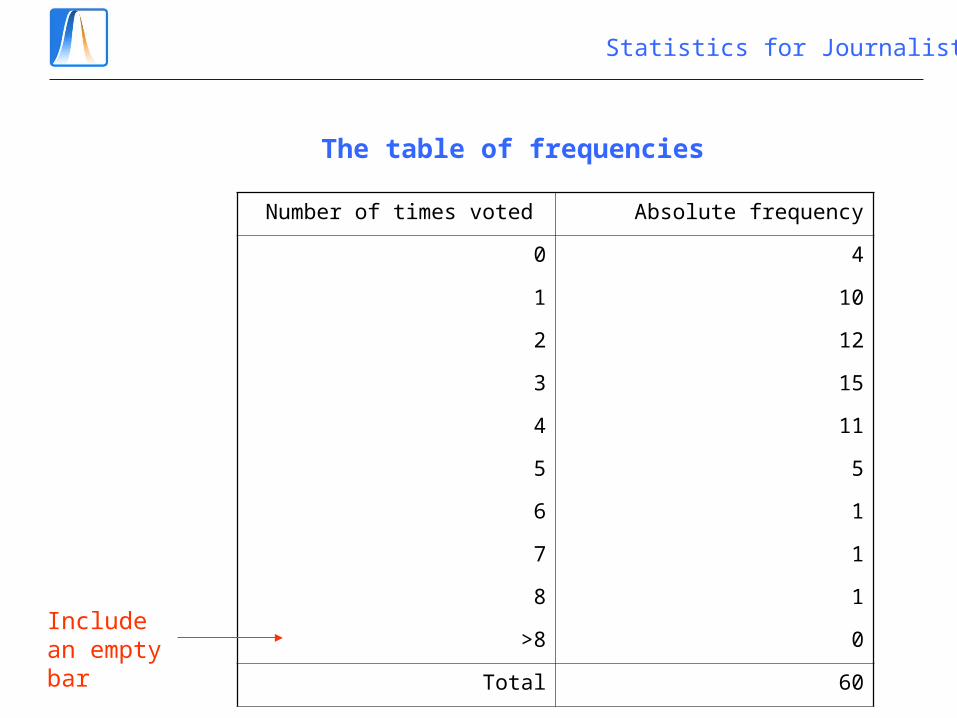
The table of frequencies
Number of times voted Absolute frequency
0 4
1 10
2 12
3 15
4 11
5 5
6 1
7 1
8 1
>8 0
Total 60
Include an empty bar
Statistics for Journalists
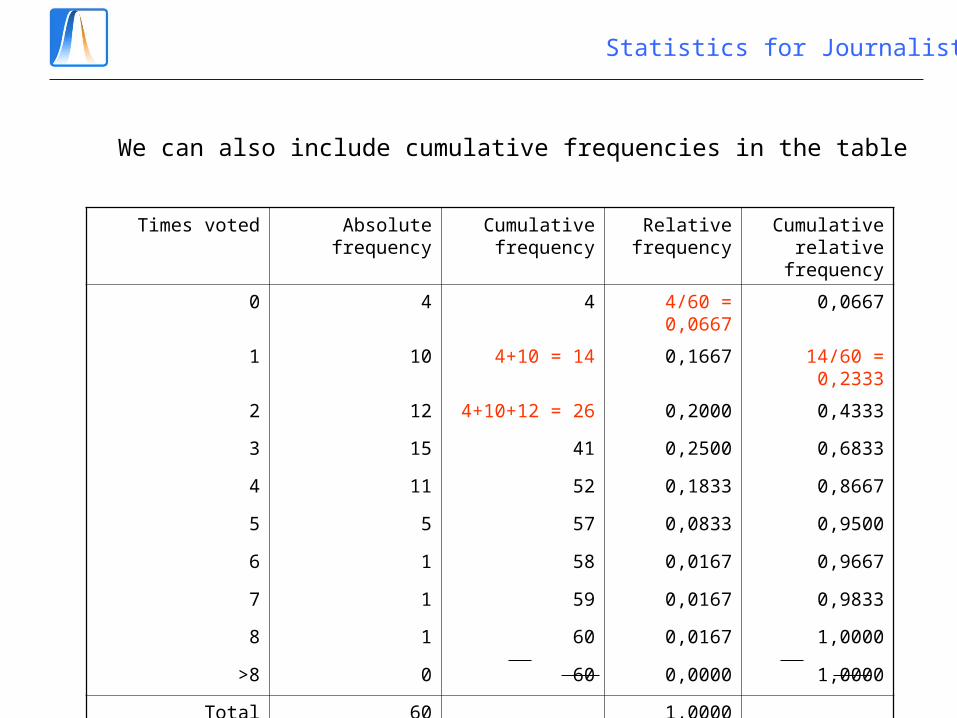
We can also include cumulative frequencies in the table
Times voted Absolute frequency
Cumulative frequency
Relative frequency
Cumulative relative
frequency
0 4 4 4/60 = 0,0667 0,0667
1 10 4+10 = 14 0,1667 14/60 = 0,2333
2 12 4+10+12 = 26 0,2000 0,4333
3 15 41 0,2500 0,6833
4 11 52 0,1833 0,8667
5 5 57 0,0833 0,9500
6 1 58 0,0167 0,9667
7 1 59 0,0167 0,9833
8 1 60 0,0167 1,0000
>8 0 60 0,0000 1,0000
Total 60 1,0000

Statistics for Journalists
The general format of the table
Value (xi) ni Ni fi Fi
x1 n1 N1 = n1 f1 =n1/N F1 = f1
x2 n2 N2 = N1+n2 f2 = n2/N F2 = F1+f2
x3 n3 N3 = N2+n3 f3 F3 = F2+f3
xk nk Nk = N fk = n2/N Fk = 1
Total N 1

Statistics for Journalists
The bar chart
Las veces que votan los madrileños
0
0,05
0,1
0,15
0,2
0,25
0,3
0 1 2 3 4 5 6 7 8 >8
Número de veces votado
Fre
cuen
cia
rela
tiva

Statistics for Journalists
A bar chart with cumulative frequencies
Frecuencias acumuladas del número de veces que votan los madrileños
0
0,2
0,4
0,6
0,8
1
1,2
0 1 2 3 4 5 6 7 8 >8
Número de veces votado
Fre
cuen
cia
acu
mu
lad
a
Statistics for Journalists
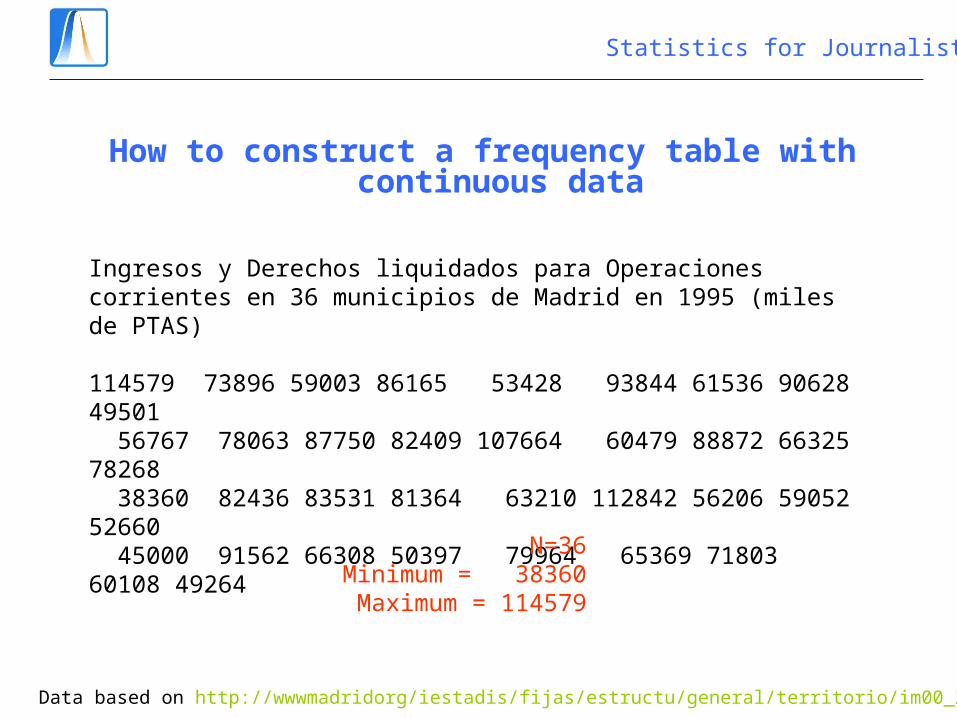
How to construct a frequency table with continuous data
Ingresos y Derechos liquidados para Operaciones corrientes en 36 municipios de Madrid en 1995 (miles de PTAS)
114579 73896 59003 86165 53428 93844 61536 90628 49501 56767 78063 87750 82409 107664 60479 88872 66325 78268 38360 82436 83531 81364 63210 112842 56206 59052 52660 45000 91562 66308 50397 79964 65369 71803 60108 49264
N=36Minimum = 38360Maximum = 114579
Data based on http://wwwmadridorg/iestadis/fijas/estructu/general/territorio/im00_23htm

Statistics for Journalists
A bar chart with bars for every possible value doesn’t make sense
We have to group the data
How many intervals should we use?
Approximately √ N
Where should we start and what bar widths should we use?
Use more or less ‘round’ numbers

Statistics for Journalists
The frequency table
Ingresos y Derechos liquidados
(millones de PTAS)
Absolute frequency
≤ 30 0
(30,45] 2
(45,60] 9
(60,75] 9
(75,90] 10
(90,105] 3
(105,120] 3
> 120 0
Total 60
Include an empty barData less than or equal to 45
Data bigger than 45

Statistics for Journalists
General format of the table
Interval Centre (xi) ni Ni fi Fi
(a0,a1] x1 = ½ (a0+a1) n1 N1 f1 F1
(a1,a2] x2 = ½ (a1+a2) n2 N2 f2 F2
(a2,a3] x3 n3 N3 f3 F3
(ak,ak+1] xk nk Nk = N fk Fk = 1
Total N 1

Statistics for Journalists
The histogram
0
2
4
6
8
10
12
15 37,5 52,5 67,5 82,5 97,5 112,5 >120
Frec
uenc
ia a
bsol
uta
Ingresos
Ingresos de ayuntamientos de Madrid (millones de PTAS)
Statistics for Journalists
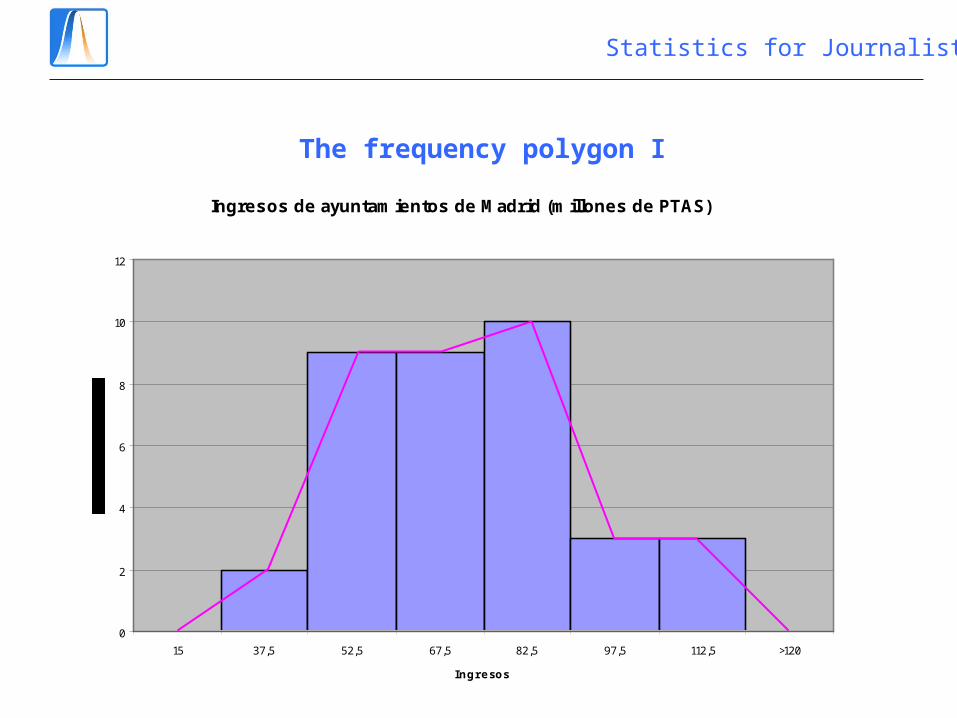
The frequency polygon I
Ingresos de ayuntamientos de Madrid (millones de PTAS)
0
2
4
6
8
10
12
15 37,5 52,5 67,5 82,5 97,5 112,5 >120
Ingresos
Statistics for Journalists
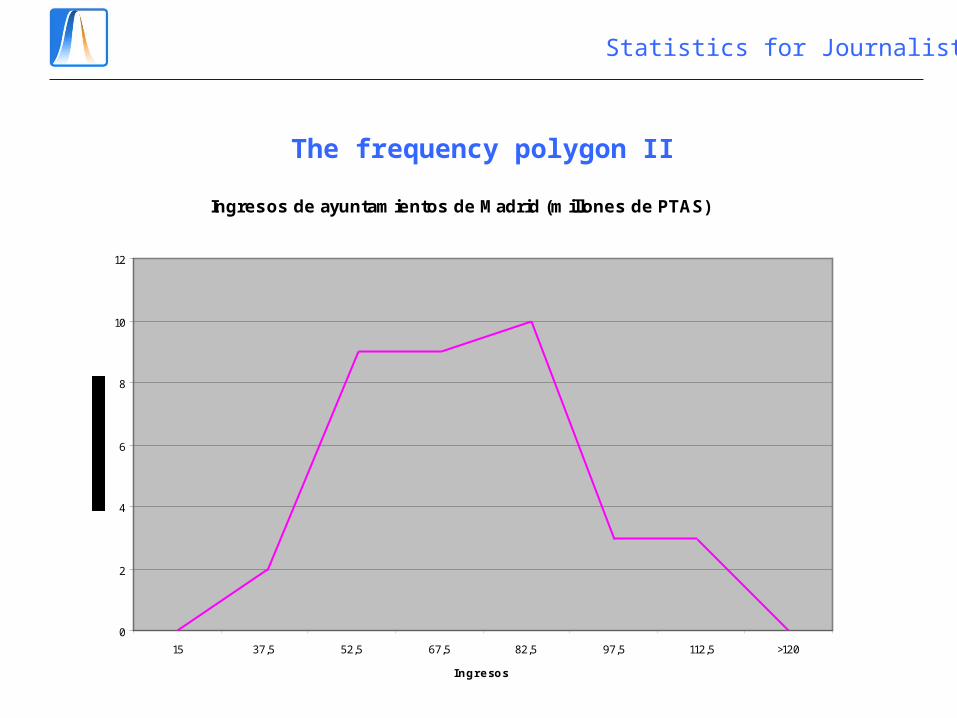
The frequency polygon II
Ingresos de ayuntamientos de Madrid (millones de PTAS)
0
2
4
6
8
10
12
15 37,5 52,5 67,5 82,5 97,5 112,5 >120
Ingresos
Statistics for Journalists
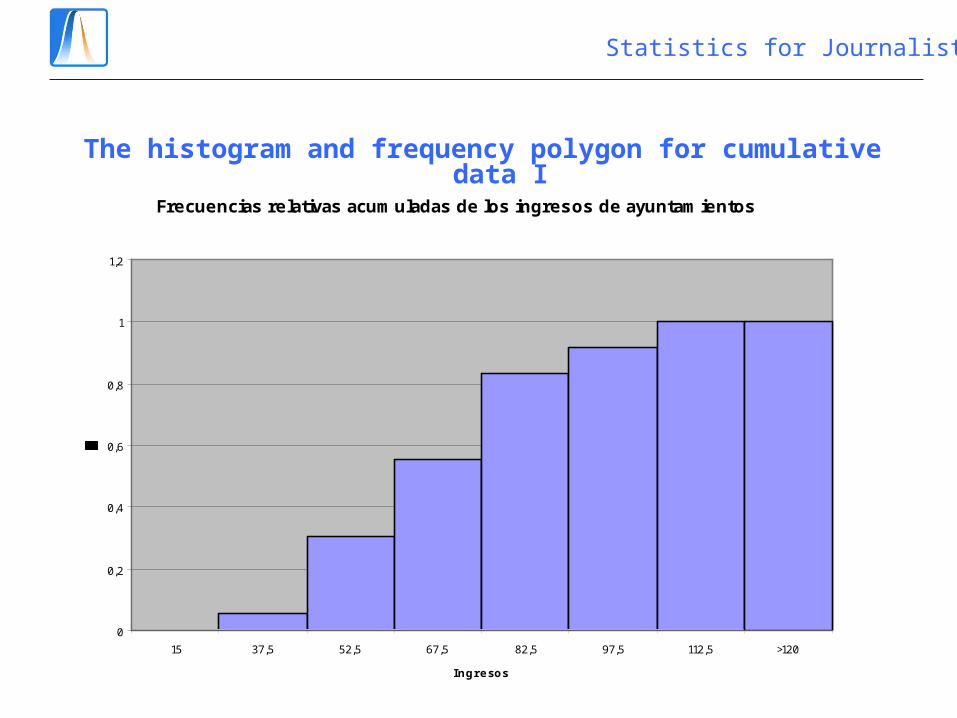
The histogram and frequency polygon for cumulative data I
Frecuencias relativas acumuladas de los ingresos de ayuntamientos
0
0,2
0,4
0,6
0,8
1
1,2
15 37,5 52,5 67,5 82,5 97,5 112,5 >120
Ingresos

Statistics for Journalists
The histogram and frequency polygon for cumulative data II
Frecuencias relativas acumuladas de los ingresos de ayuntamientos
0
0,2
0,4
0,6
0,8
1
1,2
15 37,5 52,5 67,5 82,5 97,5 112,5 >120
Ingresos

Statistics for Journalists
The histogram and frequency polygon for cumulative data III
Frecuencias relativas acumuladas de los ingresos de ayuntamientos
0
0,2
0,4
0,6
0,8
1
1,2
15 37,5 52,5 67,5 82,5 97,5 112,5 >120
Ingresos

Statistics for Journalists
Lying with histograms
What happens when we change the number of bars?
What happens if we use intervals of different widths?

Statistics for Journalists

Statistics for Journalists
Statistics for Journalists
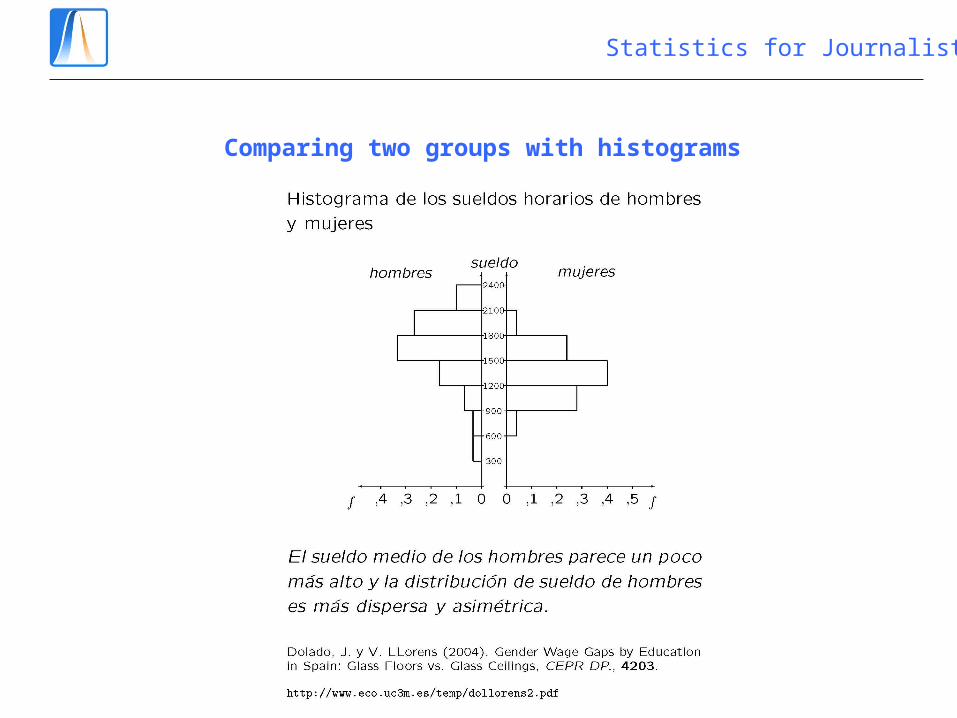
Comparing two groups with histograms
Statistics for Journalists
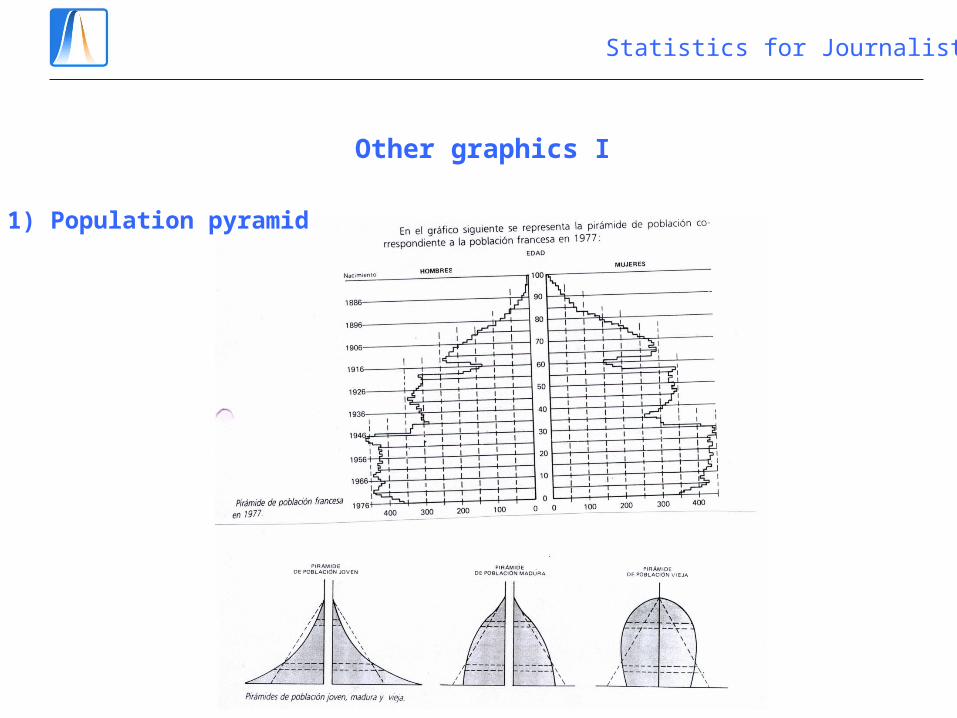
Other graphics I
1) Population pyramid

Statistics for Journalists
Other graphics II
2) Cartogram

Statistics for Journalists
Exercise
La estatura media de los integrantes de un club juvenil se ha tomado una muestra y se han obtenido los siguientes resultados:
Estatura Frecuencia
Intervalo fi
152-160 5
160-168 18
168-176 41
176-184 28
184-192 8

Statistics for Journalists
Exercise
Impact factor Frequency
Interval fi
[0,0.3) 22
[0.3,0.6) 25
[0.6,0.8) 17
[0.8,1.0) 10
[1.0,1.5) 11
[1.5,2.0) 9
[2.0,3.0) 4
[3.0,5.0) 1
>5 0
The table shows the impact factors of POLITICAL SCIENCE journals in 2008.
Construct a histogram of these data and comment.
ISI Web of Knowledge
Statistics for Journalists
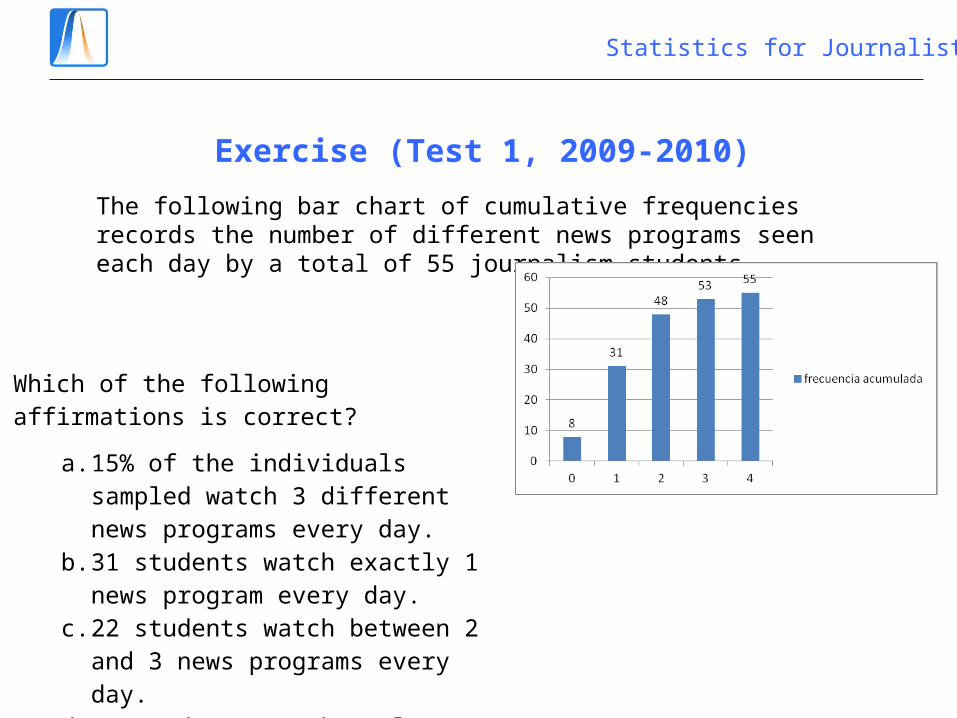
Exercise (Test 1, 2009-2010)
The following bar chart of cumulative frequencies records the number of different news programs seen each day by a total of 55 journalism students
Which of the following affirmations is correct?
a. 15% of the individuals sampled watch 3 different news programs every day.
b. 31 students watch exactly 1 news program every day.
c. 22 students watch between 2 and 3 news programs every day.
d. 48 students watch at least 2 news programs every day.

Statistics for Journalists
Exercise (Test 1, 2010-2011)
The following table records the number of newspapers read each day by a sample of 50 Madrileños.
Signal which of the following bar charts of cumulative, relative frequencies is correct for the above data.
Number of papers Absolute Frequency0 151 202 83 54 2
Total 50

Statistics for Journalists