statistics of income - internal revenue service and distribution of individual retirement...
TRANSCRIPT

“Accumulation and Distribution of Individual Retirement Arrangements, 2010,” will be published in the fall 2013 issue of the SOI Bulletin, along with articles on individual income tax returns and partnership returns. The fall Bulletin will be available on Tax Stats in November 2013.
When using information from this report, cite the publication as—
Internal Revenue ServiceStatistics of Income Bulletin, Fall 2013Washington, D.C.
Accumulation and Distribution of Individual Retirement Arrangements, 2010by Victoria L. Bryant and Jon Gober
By the end of 2010, the fair market values for Individual Retirement Arrangements (IRAs) had recovered from their precipitous decline
in 2008 to reach levels higher than their previous peak in 2007. Prior to 2008, the value of invest-ments in IRAs exhibited steady growth, reaching $4.7 trillion for 2007. In 2008, year-end values dropped nearly 23 percent, to $3.7 trillion.1 Since then, year-end values have recovered, reaching $4.5 trillion in 2009 and $5.0 trillion in 2010 (Figure A).
The 1-year decline from 2007 to 2008 was mainly attributable to substantial losses in fi nancial asset values. Coupled with these losses, in 2008, IRA contribution amounts fell while IRA withdrawals increased. Rollovers, primarily the switch from a qualifi ed retirement plan into an IRA also declined. However, such activity only accounted for marginal declines in year-end values. The nearly 37-percent rebound from 2008 to 2010 was entirely the result of improvements in the value of investments. In
Victoria L. Bryant and Jon Gober are economists with the Individual Special Projects Section. This article was prepared under the direction of Lisa Rosenmerkel, Acting Chief.
1 For more information see Bryant, Victoria (2012), “Accumulation and Distribution of Individual Retirement Arrangements, 2008,” SOI Bulletin, Spring 2012, Volume 31, Number 4, pp. 89-104.
Figure A
0
1
2
3
4
5
6
2004 2005 2006 2007 2008 2009 2010
Trillions of dollars
Tax year
Traditional IRA plans SEP plans [1] Roth IRA plans SIMPLE IRA plans [2]
$4.2 trillion
$4.7 trillion
$3.7 trillion
$4.5 trillion
$5.0 trillion
$3.4 trillion$3.3 trillion
[1] SEP—Simplified Employee Pension[2] SIMPLE—Savings Incentive Match Plans for Employees[3] Exact amounts can be found in Table 1: IRA Plans by Type.
[3]
Individual Retirement Arrangements End-of-Year Fair Market Value, by Type of Plan, Tax Years2004–2010
Sta
tist
ics
of I
ncom
ew
ww
.irs
.gov
/ta
xsta
ts
| w
ww
.irs
.gov
/uac
/SO
I-T
ax-
Sta
ts-I
ndi
vid
ual
-Ta
x-S
tati
stic
s

Accumulation and Distribution of Individual Retirement Arrangements, 2010
2 Statistics of Income
2010, total contributions were lower and total withdraw-als were higher than 2008 levels (Figure B). The amount of rollovers increased between 2008 and 2010, but these were still well below 2007 levels.
Roth IRA conversions increased signifi cantly in 2010, although these were not responsible for changes in year-end fair market values. The amount converted to Roth IRAs rose over 800 percent, to $64.8 billion in 2010, sur-passing contributions for the fi rst time. This explosive growth was primarily due to new tax provisions expand-ing the availability of conversions to all income levels.
Types of Plans
Traditional IRAsThe Employee Retirement Income Security Act (ERISA) of 1974 created IRAs. These fi rst retirement accounts, termed traditional IRAs, remained the primary type of Individual Retirement Arrangements held by taxpay-ers in 2010. In general, individuals receiving taxable compensation, such as wages, salaries, commissions, and self-employment income, can contribute to IRAs. For 2010, the maximum contribution amount to a tra-ditional IRA was the smaller of the individual’s taxable compensation or $5,000, which was unchanged from
the 2009 limit. For taxpayers age 50 and older, an ad-ditional $1,000 “catch-up” contribution was allowed for both years. The amount that could be contributed in any particular tax year was restricted based on the taxpay-er’s coverage under an employer retirement plan, age, income, and fi ling status.
In general, a taxpayer who was under age 70½ and not covered by a retirement plan at work, could make a traditional IRA contribution that was deductible from his or her taxable income. However, this deduction was limited or eliminated based on income level, fi ling status, and whether the taxpayer’s spouse was covered by an employer-sponsored retirement plan. For example, in 2010, a single taxpayer with employer coverage had his or her deduction limited when modifi ed adjusted gross income (AGI) level reached $56,000 or more, and eliminated when modifi ed AGI levels reached $66,000 or more.2 Married taxpayers fi ling jointly, with each spouse having employer coverage, had their deduction limited when modifi ed AGI levels exceeded $89,000 and eliminated when modifi ed AGI reached $109,000 or more. Married taxpayers fi ling jointly having coverage only through their spouses had their deduction limited when modifi ed AGI levels reached $167,000 or more, and eliminated when modifi ed AGI reached $177,000 or
282.0
322.3
272 1 264 3
299.7300
350
Billions of dollars
Individual Retirement Account Activity, Tax Years 2004–2010
214.9228.5
282.0
322.3
272.1 264.3
299.7
139.6124.5
143.8167.1
227.5
174.1
257.6
150
200
250
300
350
139.6124.5
143.8
48.7 54.3 56.9 58.8 55.6 50.7
51.22.8 2.6 2.8 2.2 3.7 6.8
64.8
0
50
100
150
2004 2005 2006 2007 2008 2009 2010
Tax year
R ll Withd l C t ib ti R th i
Tax year
Rollovers Withdrawals Contributions Roth conversions
Figure B
2 See Explanation of Selected Terms for the defi nition of modifi ed adjusted gross income.
Accumulation and Distribution of Individual Retirement Arrangements, 2010
3Statistics of Income
more. Married taxpayers fi ling separately did not get a deduction if their modifi ed AGI exceeded $10,000. Most withdrawals from traditional IRAs made before age 59½ were subject to a 10-percent additional tax.
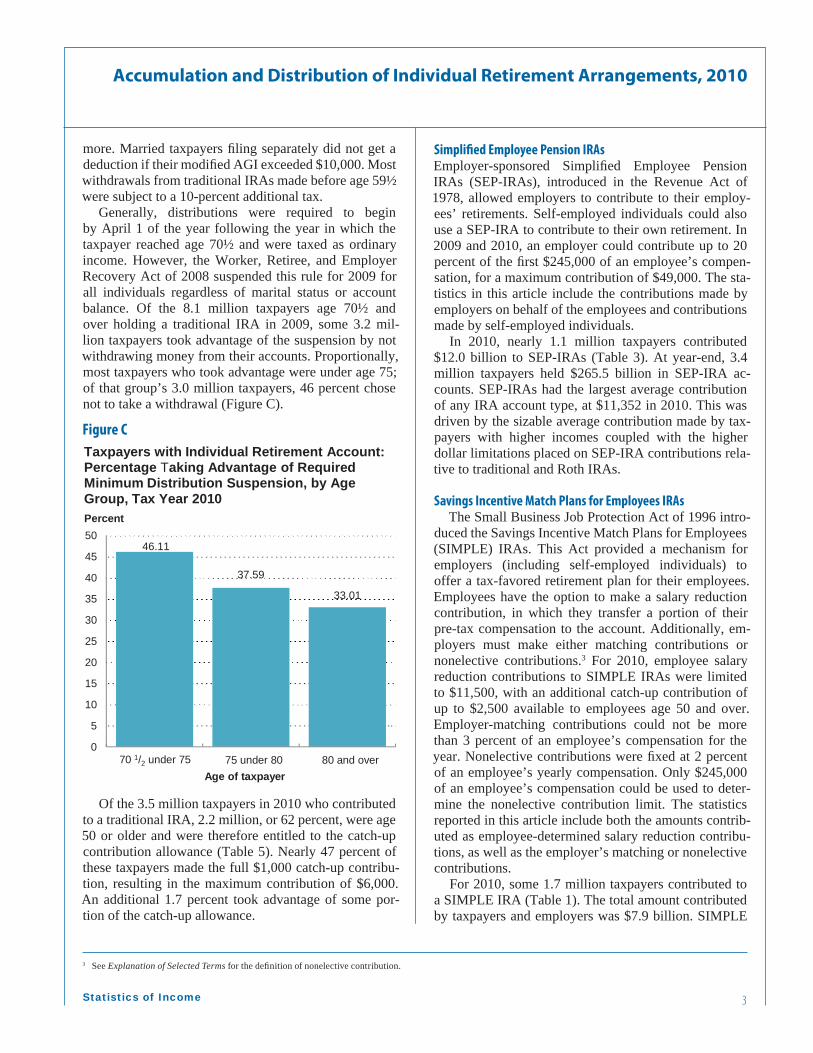
Generally, distributions were required to begin by April 1 of the year following the year in which the taxpayer reached age 70½ and were taxed as ordinary income. However, the Worker, Retiree, and Employer Recovery Act of 2008 suspended this rule for 2009 for all individuals regardless of marital status or account balance. Of the 8.1 million taxpayers age 70½ and over holding a traditional IRA in 2009, some 3.2 mil-lion taxpayers took advantage of the suspension by not withdrawing money from their accounts. Proportionally, most taxpayers who took advantage were under age 75; of that group’s 3.0 million taxpayers, 46 percent chose not to take a withdrawal (Figure C).
Simplifi ed Employee Pension IRAsEmployer-sponsored Simplifi ed Employee Pension IRAs (SEP-IRAs), introduced in the Revenue Act of 1978, allowed employers to contribute to their employ-ees’ retirements. Self-employed individuals could also use a SEP-IRA to contribute to their own retirement. In 2009 and 2010, an employer could contribute up to 20 percent of the fi rst $245,000 of an employee’s compen-sation, for a maximum contribution of $49,000. The sta-tistics in this article include the contributions made by employers on behalf of the employees and contributions made by self-employed individuals.
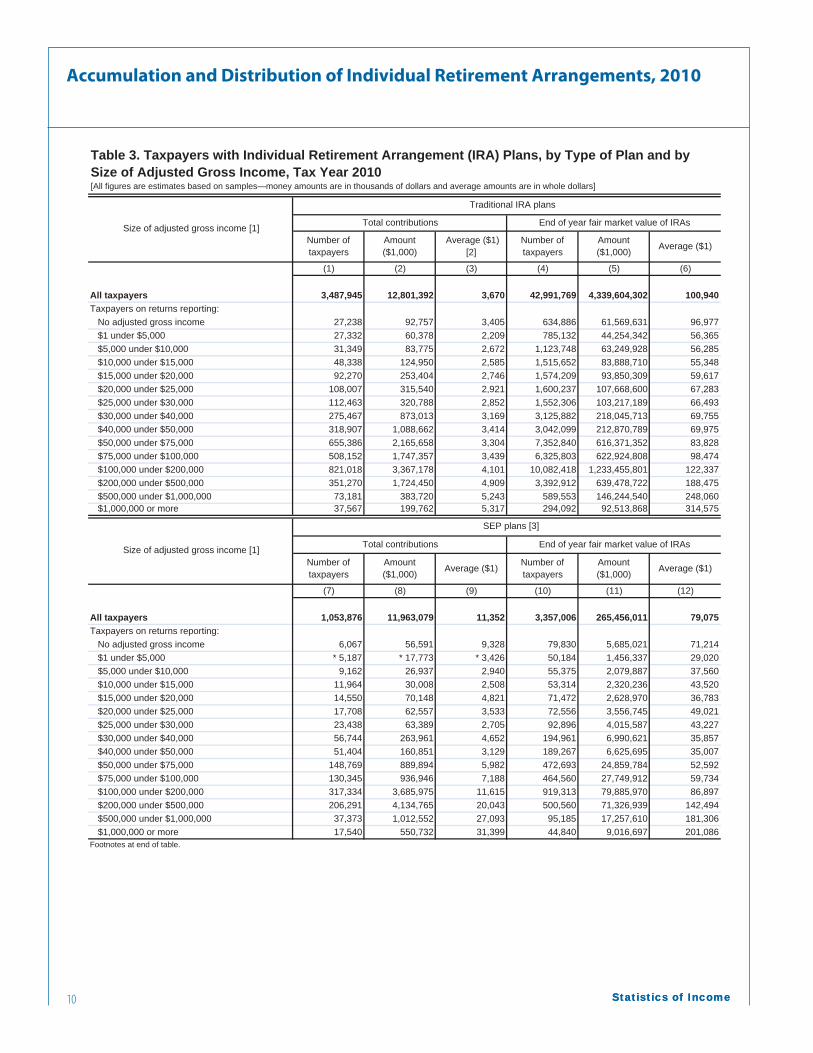
In 2010, nearly 1.1 million taxpayers contributed $12.0 billion to SEP-IRAs (Table 3). At year-end, 3.4 million taxpayers held $265.5 billion in SEP-IRA ac-counts. SEP-IRAs had the largest average contribution of any IRA account type, at $11,352 in 2010. This was driven by the sizable average contribution made by tax-payers with higher incomes coupled with the higher dollar limitations placed on SEP-IRA contributions rela-tive to traditional and Roth IRAs.
Savings Incentive Match Plans for Employees IRAsThe Small Business Job Protection Act of 1996 intro-
duced the Savings Incentive Match Plans for Employees (SIMPLE) IRAs. This Act provided a mechanism for employers (including self-employed individuals) to offer a tax-favored retirement plan for their employees. Employees have the option to make a salary reduction contribution, in which they transfer a portion of their pre-tax compensation to the account. Additionally, em-ployers must make either matching contributions or nonelective contributions.3 For 2010, employee salary reduction contributions to SIMPLE IRAs were limited to $11,500, with an additional catch-up contribution of up to $2,500 available to employees age 50 and over. Employer-matching contributions could not be more than 3 percent of an employee’s compensation for the year. Nonelective contributions were fi xed at 2 percent of an employee’s yearly compensation. Only $245,000 of an employee’s compensation could be used to deter-mine the nonelective contribution limit. The statistics reported in this article include both the amounts contrib-uted as employee-determined salary reduction contribu-tions, as well as the employer’s matching or nonelective contributions.
For 2010, some 1.7 million taxpayers contributed to a SIMPLE IRA (Table 1). The total amount contributed by taxpayers and employers was $7.9 billion. SIMPLE
Figure C
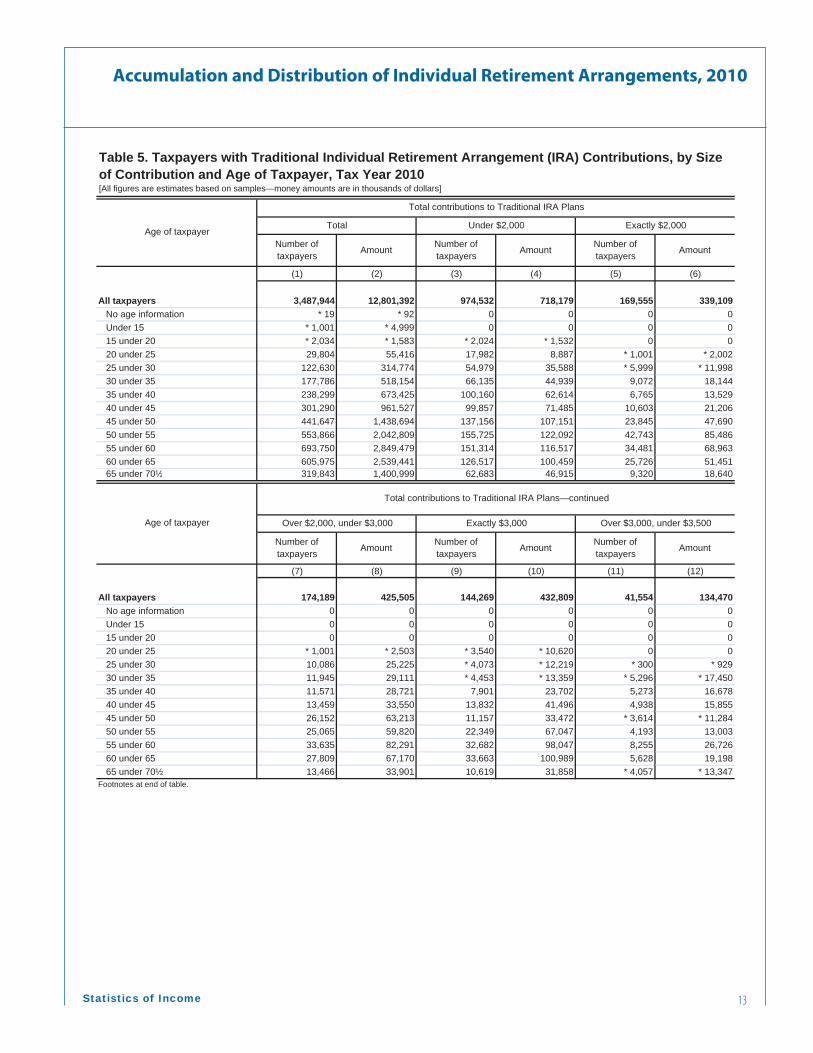
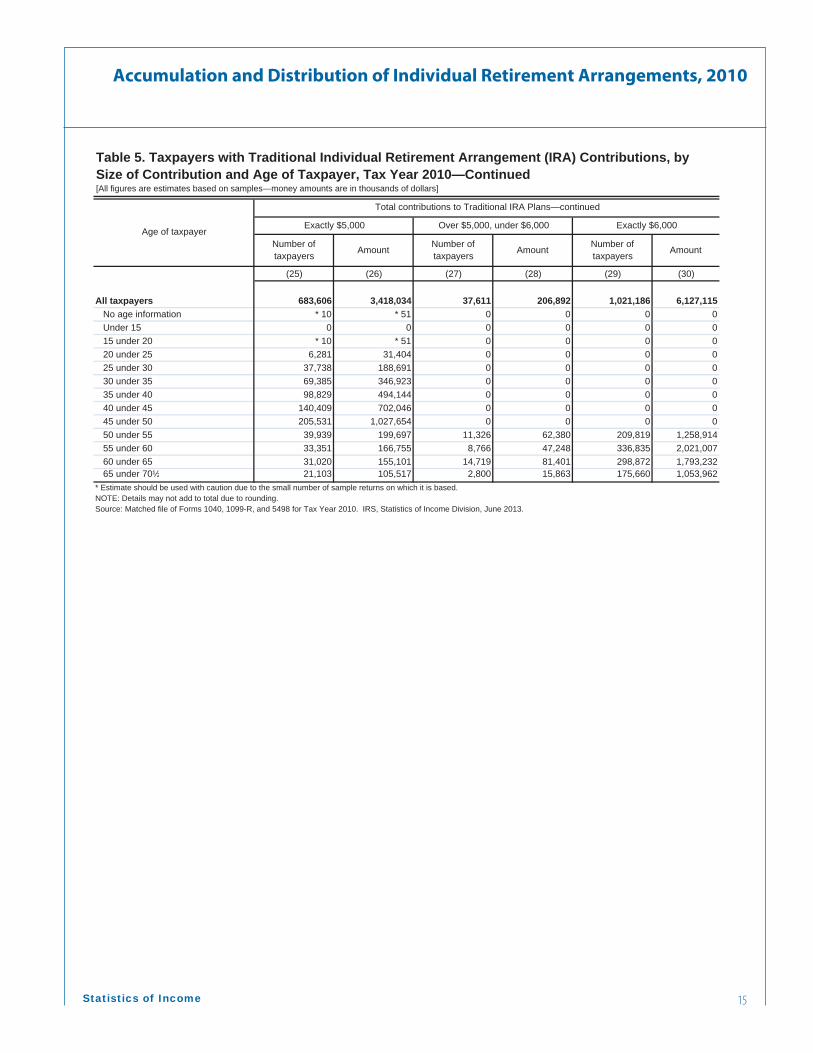
Of the 3.5 million taxpayers in 2010 who contributed to a traditional IRA, 2.2 million, or 62 percent, were age 50 or older and were therefore entitled to the catch-up contribution allowance (Table 5). Nearly 47 percent of these taxpayers made the full $1,000 catch-up contribu-tion, resulting in the maximum contribution of $6,000. An additional 1.7 percent took advantage of some por-tion of the catch-up allowance.
3 See Explanation of Selected Terms for the defi nition of nonelective contribution.
46.11
37.59
33.01
0
5
10
15
20
25
30
35
40
45
50Percent
Taxpayers with Individual Retirement Account: Percentage Taking Advantage of Required Minimum Distribution Suspension, by Age Group, Tax Year 2010
070.5 under 75 75 under 80 80 and over
Age of taxpayer 70 1/2 under 75

Accumulation and Distribution of Individual Retirement Arrangements, 2010
4 Statistics of Income
IRA contributions represented the lowest share of all IRA contributions, accounting for 15.4 percent of all contributions.
Roth IRAsRoth IRAs, introduced in the Taxpayer Relief Act of 1997, differ from traditional IRAs in several substan-tive ways. First, contributions to Roth IRAs are not tax-deductible. Subsequently, unlike traditional IRAs, qualifi ed distributions from these plans are tax-free and taxpayers are not required to take qualifi ed distributions from these plans based on age. And fi nally, contributions can be made regardless of age.
Similar to other IRA plans investment returns in the plan are not taxed each year. However, contributions are limited based on income. For 2010, married taxpay-ers fi ling jointly were not permitted to make Roth IRA contributions if their modifi ed AGI exceeded $177,000. Married taxpayers fi ling separately were not permitted
to contribute to a Roth if their modifi ed AGI were over $10,000. For unmarried taxpayers, the corresponding limit was $120,000.
While contributions remained limited, starting in 2010, the income restrictions on converting to a Roth IRA were lifted. Prior to 2010, only individuals with a modifi ed AGI of less than $100,000 could convert to a Roth IRA. The total amount converted signifi cantly in-creased for nearly all income classes between 2009 and 2010, with the largest increases occurring at income levels of $200,000 or more. The number of taxpayers who converted from a traditional IRA to a Roth IRA also increased signifi cantly (Figure D).
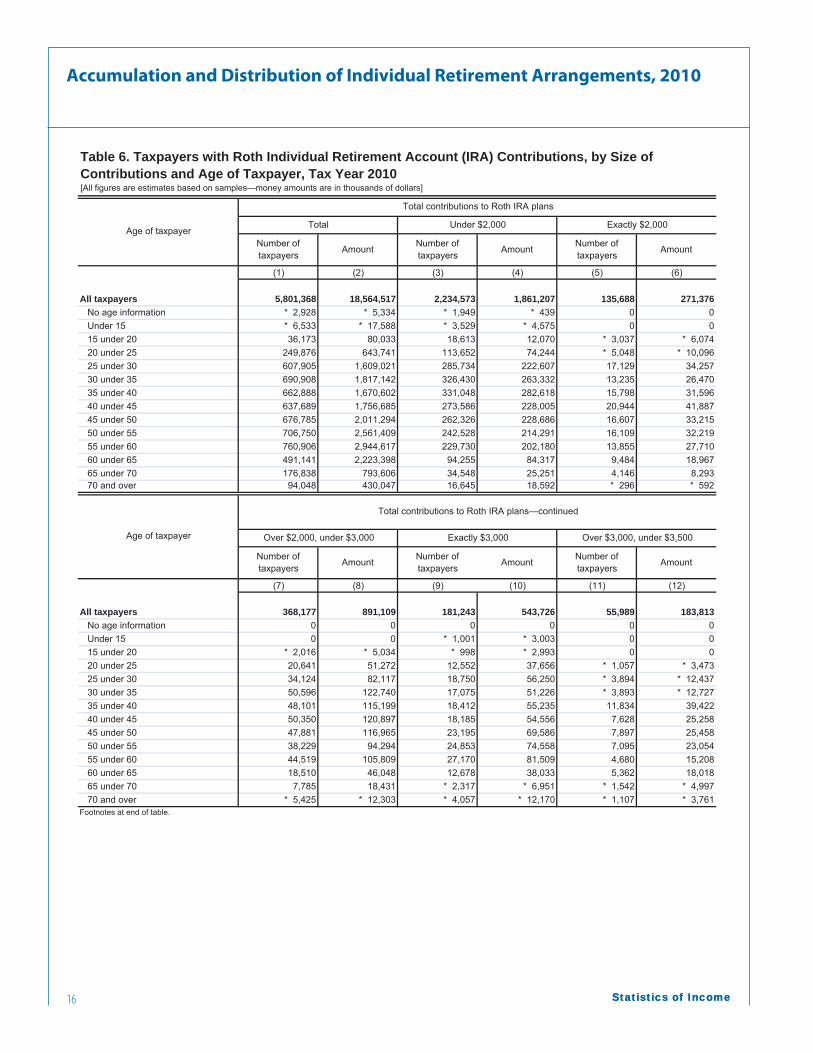
The contribution limits for Roth IRAs are the same as those for traditional IRAs. In 2010, of the 5.8 million taxpayers who contributed to a Roth IRA, 2.2 million, or 38.4 percent, were age 50 or older, entitling them to an additional $1,000 in catch-up contributions (Table 6). However, only 49.9 percent of these taxpayers took
Figure D
10.08
12.0
Percent
Percentage of Taxpayers with a Traditional Individual Retirement Account Choosing To Convert to a Roth IRA, by Size of Adjusted Gross Income, Tax Years 2009–2010
7.41
10.08
8.0
10.0
2009 2010
2.301 82
2.46
4.81
7.41
4.0
6.0
8.0
0.650.28
0.57
0.70
0.390.86
0.44
0.600.79 0.61
1.17 0.57
0.12 0.11 0.10
2.30
0.260.71
0.62
0.95 0.980.71
1.101.49 1.35
1.82
2.46
0.0
2.0
$40,000under
$50,000
$50,000under
$75,000
$75,000under
$100,000
$100,000under
$200,000
$200,000under
$500,000
$500,000under
$1,000,000
$1,000,000or
more
Noadjustedgross
income
$5,000under
$10,000
$10,000under
$15,000
$15,000under
$20,000
$20,000under
$25,000
$25,000under
$30,000
$30,000under
$40,000
$1under$5,000
0.0
Size of adjusted gross income (AGI)
$40,000under
$50,000
$50,000under
$75,000
$75,000under
$100,000
$100,000under
$200,000
$200,000under
$500,000
$500,000under
$1,000,000
$1,000,000or
more
Noadjustedgross
income
$5,000under
$10,000
$10,000under
$15,000
$15,000under
$20,000
$20,000under
$25,000
$25,000under
$30,000
$30,000under
$40,000
$1under$5,000

Accumulation and Distribution of Individual Retirement Arrangements, 2010
5Statistics of Income
advantage of some or all of the catch-up contribution allowance. Of the 1.1 million taxpayers who made a catch-up contribution, 93.2 percent contributed the max-imum amount.
Trends and HighlightsFor 2010, some 145.6 million taxpayers, or 74.1 per-cent of all taxpayers, were eligible to contribute to an IRA. This percentage has progressively declined from the 78.4 percent eligible in 2007.4 Additionally, the per-centage of eligible taxpayers contributing to an IRA has declined every year since 2005, falling from 9.6 percent to 7.9 in 2010.5
While the absolute number of eligible taxpayers con-tributing has decreased since 2007, the average contri-bution has increased 3.8 percent from 2009 to 2010. In other words, fewer eligible taxpayers contributed to an IRA, but those who did, contributed more to their ac-counts, on average. Only those taxpayers with an AGI of less than $10,000 did not follow this pattern. This in-crease in average contributions from 2009 to 2010 also held for all age groups, with the exception of taxpayers under age 25 and those ages 65 and over.
For 2010 and consistent with earlier years, the per-centage of taxpayers making contributions increased as income level rose for taxpayers reporting a non-zero AGI (Figure E). In fact, those making between $100,000 and
$200,000 per year were more than twice as likely to con-tribute to an IRA as those making $30,000 to $40,000 annually. Taxpayers reporting no AGI had high partici-pation rates and average contributions, which were most likely due to the inclusion of many wealthy individuals who experienced temporary losses. Along with the per-centage of taxpayers contributing, average contributions also rose with higher income levels for those with an AGI greater than zero.
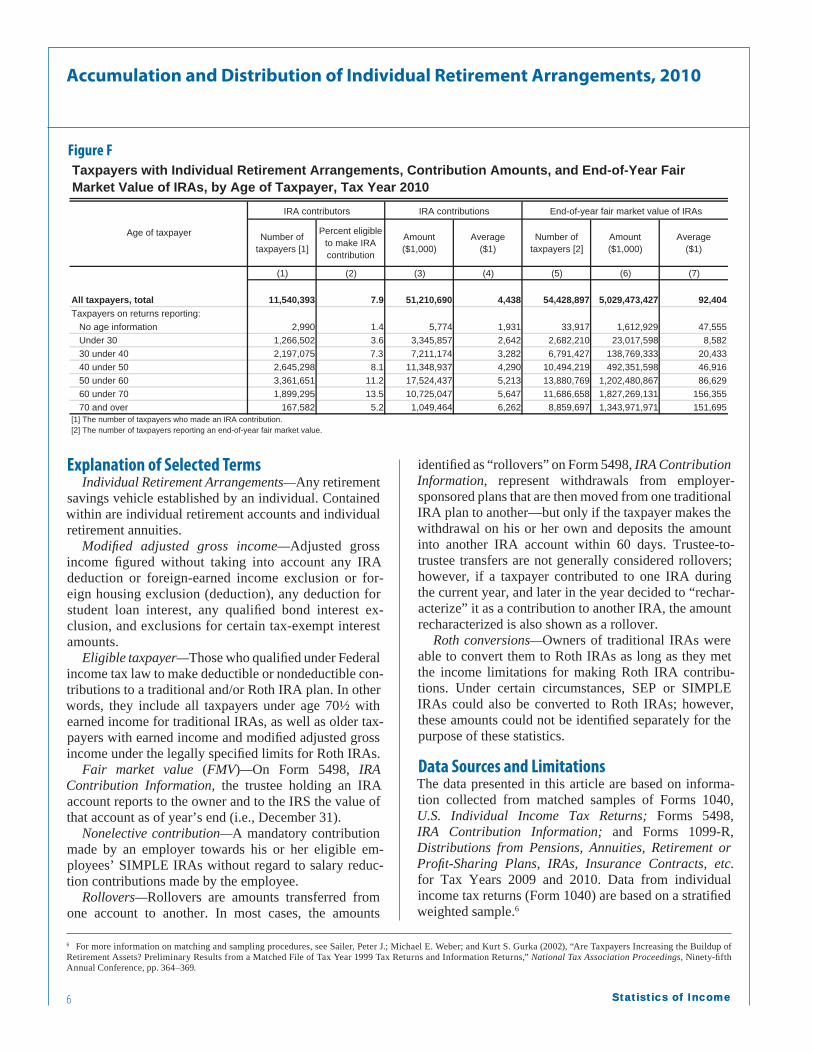
Consistent with prior years, for 2010, both the number of taxpayers making contributions and the total amount contributed peaked for taxpayers in the age 50-under-60 group (Figure F). However, average IRA contributions increased with the age of the tax-payer through taxpayers in the age 70 and over group. This suggests that even though fewer taxpayers chose to contribute to an IRA, those who did contributed more on an individual basis than their counterparts in younger age groups.
The number of taxpayers who withdrew funds from their IRAs increased 13.9 percent from 2009 to 13.5 mil-lion for 2010 (Table 1). The amount of withdrawals also increased 48 percent from the 2009 level to $257.6 bil-lion for 2010. Driving this result were taxpayers at higher income levels, primarily those with an AGI of $100,000 or more, whose withdrawal amounts more than doubled from 2009 to 2010 (Figure G).
4 The decline between 2007 and 2010 is statistically signifi cant.5 The decline between 2005 and 2010 is also statistically signifi cant.
Figure E
Number of taxpayers [1]
Percent eligible to make IRA contribution
Amount($1,000)
Average($1)
Number of taxpayers [2]
Amount($1,000)
Average($1)
(1) (2) (3) (4) (5) (6) (7)
All taxpayers, total 11,540,392 7.9 51,210,692 4,438 54,428,898 5,029,473,427 92,404 Taxpayers on returns reporting: No adjusted gross income 96,041 10.2 406,395 4,231 829,255 77,135,522 93,018 $1 under $10,000 288,913 1.7 717,096 2,482 2,456,376 120,111,340 48,898 $10,000 under $20,000 465,630 2.3 1,226,129 2,633 3,723,744 195,150,132 52,407 $20,000 under $30,000 685,942 4.1 1,859,318 2,711 3,955,463 233,487,179 59,029 $30,000 under $40,000 825,027 5.9 2,461,419 2,983 4,021,014 245,152,843 60,968 $40,000 under $50,000 922,110 8.1 2,777,308 3,012 3,924,013 238,660,236 60,820 $50,000 under $75,000 2,252,168 10.1 7,684,515 3,412 9,490,661 704,097,506 74,188 $75,000 under $100,000 1,947,622 12.1 7,583,757 3,894 8,191,997 716,447,836 87,457 $100,000 under $200,000 3,095,444 14.7 15,912,920 5,141 12,753,063 1,436,580,026 112,646 $200,000 or more 961,495 16.1 10,581,835 11,006 5,083,312 1,062,650,807 209,047
Taxpayers with Individual Retirement Arrangements, Contribution Amounts, and End-of-Year Fair Market Value of IRAs, by Size of Adjusted Gross Income, Tax Year 2010
[1] The number of taxpayers who made an IRA contribution. [2] The number of taxpayers reporting an end-of-year fair market value.
Size of adjusted gross income
IRA contributors IRA contributions End-of-year fair market value of IRAs
Accumulation and Distribution of Individual Retirement Arrangements, 2010
6 Statistics of IncomeStatistics of Income
Explanation of Selected TermsIndividual Retirement Arrangements—Any retirement
savings vehicle established by an individual. Contained within are individual retirement accounts and individual retirement annuities.
Modifi ed adjusted gross income—Adjusted gross income fi gured without taking into account any IRA deduction or foreign-earned income exclusion or for-eign housing exclusion (deduction), any deduction for student loan interest, any qualifi ed bond interest ex-clusion, and exclusions for certain tax-exempt interest amounts.
Eligible taxpayer—Those who qualifi ed under Federal income tax law to make deductible or nondeductible con-tributions to a traditional and/or Roth IRA plan. In other words, they include all taxpayers under age 70½ with earned income for traditional IRAs, as well as older tax-payers with earned income and modifi ed adjusted gross income under the legally specifi ed limits for Roth IRAs.
Fair market value (FMV)—On Form 5498, IRA Contribution Information, the trustee holding an IRA account reports to the owner and to the IRS the value of that account as of year’s end (i.e., December 31).
Nonelective contribution—A mandatory contribution made by an employer towards his or her eligible em-ployees’ SIMPLE IRAs without regard to salary reduc-tion contributions made by the employee.
Rollovers—Rollovers are amounts transferred from one account to another. In most cases, the amounts
Figure F
identifi ed as “rollovers” on Form 5498, IRA Contribution Information, represent withdrawals from employer-sponsored plans that are then moved from one traditional IRA plan to another—but only if the taxpayer makes the withdrawal on his or her own and deposits the amount into another IRA account within 60 days. Trustee-to-trustee transfers are not generally considered rollovers; however, if a taxpayer contributed to one IRA during the current year, and later in the year decided to “rechar-acterize” it as a contribution to another IRA, the amount recharacterized is also shown as a rollover.
Roth conversions—Owners of traditional IRAs were able to convert them to Roth IRAs as long as they met the income limitations for making Roth IRA contribu-tions. Under certain circumstances, SEP or SIMPLE IRAs could also be converted to Roth IRAs; however, these amounts could not be identifi ed separately for the purpose of these statistics.
Data Sources and LimitationsThe data presented in this article are based on informa-tion collected from matched samples of Forms 1040, U.S. Individual Income Tax Returns; Forms 5498, IRA Contribution Information; and Forms 1099-R, Distributions from Pensions, Annuities, Retirement or Profi t-Sharing Plans, IRAs, Insurance Contracts, etc. for Tax Years 2009 and 2010. Data from individual income tax returns (Form 1040) are based on a stratifi ed weighted sample.6
Number of taxpayers [1]
Percent eligible to make IRA contribution
Amount($1,000)
Average($1)
Number of taxpayers [2]
Amount($1,000)
Average($1)
(1) (2) (3) (4) (5) (6) (7)
All taxpayers, total 11,540,393 7.9 51,210,690 4,438 54,428,897 5,029,473,427 92,404 Taxpayers on returns reporting: No age information 2,990 1.4 5,774 1,931 33,917 1,612,929 47,555 Under 30 1,266,502 3.6 3,345,857 2,642 2,682,210 23,017,598 8,582 30 under 40 2,197,075 7.3 7,211,174 3,282 6,791,427 138,769,333 20,433 40 under 50 2,645,298 8.1 11,348,937 4,290 10,494,219 492,351,598 46,916 50 under 60 3,361,651 11.2 17,524,437 5,213 13,880,769 1,202,480,867 86,629 60 under 70 1,899,295 13.5 10,725,047 5,647 11,686,658 1,827,269,131 156,355 70 and over 167,582 5.2 1,049,464 6,262 8,859,697 1,343,971,971 151,695
Taxpayers with Individual Retirement Arrangements, Contribution Amounts, and End-of-Year Fair Market Value of IRAs, by Age of Taxpayer, Tax Year 2010
[1] The number of taxpayers who made an IRA contribution. [2] The number of taxpayers reporting an end-of-year fair market value.
Age of taxpayer
IRA contributors IRA contributions End-of-year fair market value of IRAs
6 For more information on matching and sampling procedures, see Sailer, Peter J.; Michael E. Weber; and Kurt S. Gurka (2002), “Are Taxpayers Increasing the Buildup of Retirement Assets? Preliminary Results from a Matched File of Tax Year 1999 Tax Returns and Information Returns,” National Tax Association Proceedings, Ninety-fi fth Annual Conference, pp. 364–369.

Accumulation and Distribution of Individual Retirement Arrangements, 2010
Statistics of Income 7
70.0
Amount of IRA withdrawal
(in millions of dollars)
Taxpayers with Individual Retirement Arrangements by Total Amount of Withdrawals and Size of Adjusted Gross Income, Tax Years 2009–2010
44.09
62.04
45.33
50.0
60.0
70.0(in millions of dollars)
2009 2010
28.53
24.13
44.09
30.7133.36
45.33
18.7120 0
30.0
40.0
50.0
4.281.66
3.55 4.86 5.73 5.675.60
11.01 11.20
24.13
17.76
3.77 2.254.99
1.36 2.78 4.15 5.55 5.20
5.95
11.7911.77
13.93
18.71
0.0
10.0
20.0
4.281.66
3.55 5.603.77 2.25
1.36 2.78 4.15 5.55 5.200.0
Size of adjusted gross income
$40,000under
$50,000
$50,000under
$75,000
$75,000under
$100,000
$100,000under
$200,000
$200,000under
$500,000
$500,000under
$1,000,000
$1,000,000or
more
Noadjustedgross
income
$5,000under
$10,000
$10,000under
$15,000
$15,000under
$20,000
$20,000under
$25,000
$25,000under
$30,000
$30,000under
$40,000
$1under$5,000
In addition to the limitations of the Form 1040 sample described in the above-referenced report, special limita-tions apply to the Form 5498 data. As with the Form 1040, these data are before audit. In the case of contribu-tions to IRA plans, this means that some Forms 5498 show amounts in excess of the maximum allowable contribution. If these excess amounts are identifi ed by the taxpayer or trustee during the tax year, the excess amounts would be refunded and the amount of the refund documented on Form 1099-R. In these cases, the refund would be included in the “withdrawals” columns of these tables. On the other hand, the excess amounts may also include cases where rollovers or conversions were improperly reported as contributions, and the sub-sequent corrected Form 5498 was not available at the time the sample used in these statistics was created.
References
Bryant, Victoria (2012), “Accumulation and Distribution of Individual Retirement Arrangements, 2008,” SOI Bulletin, Spring 2012, Volume 31, Number 4, pp. 89–104.
Bryant, Victoria (2008), “Accumulation and Distribution of Individual Retirement Arrangements, 2004,” SOI Bulletin, Spring 2008, Volume 27, Number 4, pp. 90–101.
Department of Treasury, Internal Revenue Service, Individual Retirement Arrangements (IRAs), Publication 590, for more information on eligibility requirements and limitations.
Figure G

Accumulation and Distribution of Individual Retirement Arrangements, 2010
8 Statistics of IncomeStatistics of Income
Number of taxpayers Amount Number of
taxpayers Amount Number of taxpayers Amount
(1) (2) (3) (4) (5) (6)
Total [4] 11,540,393 51,210,690 4,166,699 20,737,719 4,323,498 299,715,386 Traditional IRA plans 3,487,945 12,801,391 3,019,530 11,443,203 4,053,966 288,422,617 SEP plans 1,053,876 11,963,079 614,383 7,101,137 59,173 3,519,745 SIMPLE plans 1,709,465 7,881,701 591,901 2,193,379 N/A N/A Roth IRA plans 5,801,369 18,564,519 n.a. n.a. 294,844 7,773,023
Number of taxpayers Amount Number of
taxpayers Amount Number of taxpayers Amount
(7) (8) (9) (10) (11) (12)
Total [4] 869,400 64,767,827 13,459,026 257,611,338 54,428,897 5,029,473,427 Traditional IRA plans 869,400 -64,767,827 13,345,209 243,310,067 42,991,769 4,339,604,304 SEP plans N/A N/A 500,395 13,669,685 3,357,006 265,456,010 SIMPLE plans N/A N/A 29,322 58,000 2,703,260 69,479,389 Roth IRA plans 869,400 64,767,827 118,577 573,585 16,688,937 354,933,723
Table 1. Taxpayers with Individual Retirement Arrangement (IRA) Plans, by Type of Plan, Tax Year 2010[All figures are estimates based on samples—money amounts are in thousands of dollars]
SEP—Simplified Employee PensionSIMPLE—Savings Incentive Match Plans for Employeesn.a.—Not availableN/A—Not applicable[1] For SEP and SIMPLE plans, total contributions include contributions made by the taxpayer directly as well as those made by an employer.[2] For Tax Year 2010 owners of traditional IRAs were able to convert traditional IRAs to Roth IRAs as long as they met the income limitations for making Roth IRA contributions. Under certain circumstances, SEP or SIMPLE IRAs could also be converted to Roth IRAs; however, these amounts could not be identified separately for the purpose of these statistics. [3] Withdrawals are reported on Form 1099-R; does not include withdrawals made for the purpose of rollovers to other IRA accounts if the transfer was made by the trustee; Roth IRA conversions are shown separately. [4] The total represents the number of taxpayers who have at least one IRA account. Taxpayers may have multiple types of IRA plans. Consequently, the sum of the number of taxpayers with the various types of IRA plans will exceed the total shown in the table.NOTE: Details may not add to total due to rounding. Source: Matched file of Forms 1040, 1099-R, and 5498 for Tax Year 2010. IRS, Statistics of Income Division, June 2013.
End-of-year fair market value of IRAs
Total contributions [1] Contributions deducted on Form 1040 Rollovers
Roth conversions [2] Withdrawals [3]
Type of plan
Type of plan
Accumulation and Distribution of Individual Retirement Arrangements, 2010
Statistics of Income 9
Number of taxpayers Amount Number of
taxpayers Amount
(1) (2) (3) (4) (5) (6) (7)
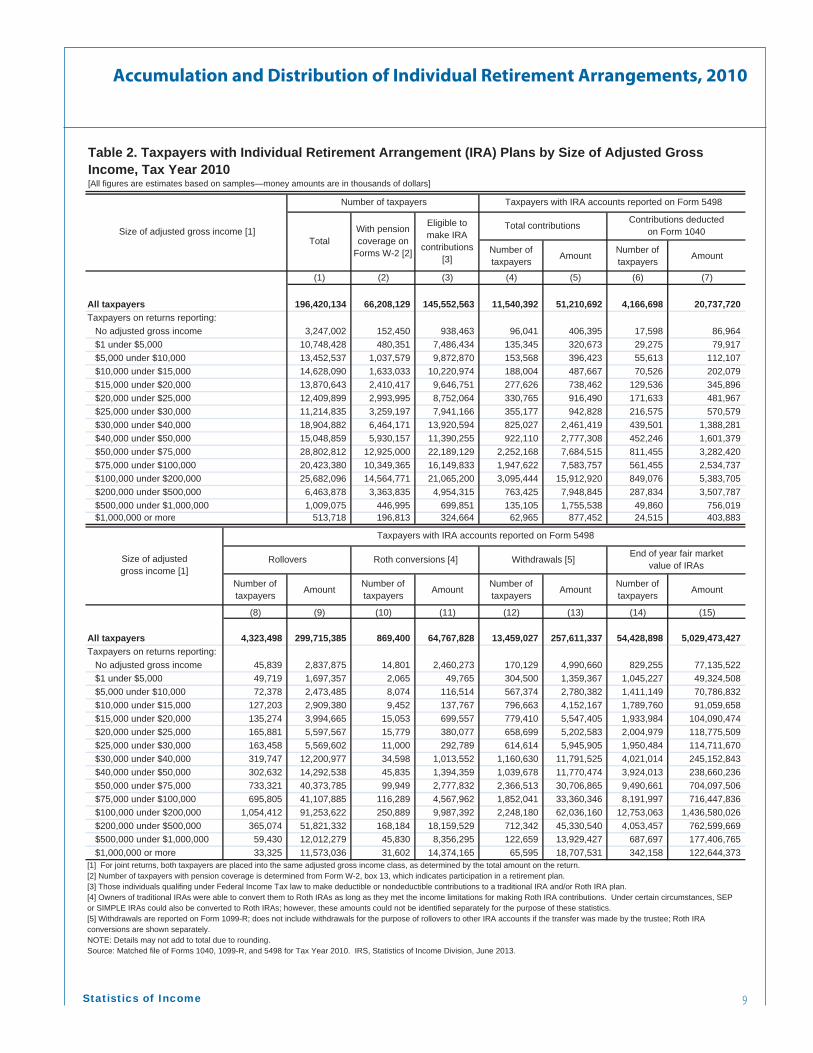
All taxpayers 196,420,134 66,208,129 145,552,563 11,540,392 51,210,692 4,166,698 20,737,720 Taxpayers on returns reporting: No adjusted gross income 3,247,002 152,450 938,463 96,041 406,395 17,598 86,964 $1 under $5,000 10,748,428 480,351 7,486,434 135,345 320,673 29,275 79,917 $5,000 under $10,000 13,452,537 1,037,579 9,872,870 153,568 396,423 55,613 112,107 $10,000 under $15,000 14,628,090 1,633,033 10,220,974 188,004 487,667 70,526 202,079 $15,000 under $20,000 13,870,643 2,410,417 9,646,751 277,626 738,462 129,536 345,896 $20,000 under $25,000 12,409,899 2,993,995 8,752,064 330,765 916,490 171,633 481,967 $25,000 under $30,000 11,214,835 3,259,197 7,941,166 355,177 942,828 216,575 570,579 $30,000 under $40,000 18,904,882 6,464,171 13,920,594 825,027 2,461,419 439,501 1,388,281 $40,000 under $50,000 15,048,859 5,930,157 11,390,255 922,110 2,777,308 452,246 1,601,379 $50,000 under $75,000 28,802,812 12,925,000 22,189,129 2,252,168 7,684,515 811,455 3,282,420 $75,000 under $100,000 20,423,380 10,349,365 16,149,833 1,947,622 7,583,757 561,455 2,534,737 $100,000 under $200,000 25,682,096 14,564,771 21,065,200 3,095,444 15,912,920 849,076 5,383,705 $200,000 under $500,000 6,463,878 3,363,835 4,954,315 763,425 7,948,845 287,834 3,507,787 $500,000 under $1,000,000 1,009,075 446,995 699,851 135,105 1,755,538 49,860 756,019 $1,000,000 or more 513,718 196,813 324,664 62,965 877,452 24,515 403,883
Number of taxpayers Amount Number of
taxpayers Amount Number of taxpayers Amount Number of
taxpayers Amount
(8) (9) (10) (11) (12) (13) (14) (15)
All taxpayers 4,323,498 299,715,385 869,400 64,767,828 13,459,027 257,611,337 54,428,898 5,029,473,427 Taxpayers on returns reporting: No adjusted gross income 45,839 2,837,875 14,801 2,460,273 170,129 4,990,660 829,255 77,135,522 $1 under $5,000 49,719 1,697,357 2,065 49,765 304,500 1,359,367 1,045,227 49,324,508 $5,000 under $10,000 72,378 2,473,485 8,074 116,514 567,374 2,780,382 1,411,149 70,786,832 $10,000 under $15,000 127,203 2,909,380 9,452 137,767 796,663 4,152,167 1,789,760 91,059,658 $15,000 under $20,000 135,274 3,994,665 15,053 699,557 779,410 5,547,405 1,933,984 104,090,474 $20,000 under $25,000 165,881 5,597,567 15,779 380,077 658,699 5,202,583 2,004,979 118,775,509 $25,000 under $30,000 163,458 5,569,602 11,000 292,789 614,614 5,945,905 1,950,484 114,711,670 $30,000 under $40,000 319,747 12,200,977 34,598 1,013,552 1,160,630 11,791,525 4,021,014 245,152,843 $40,000 under $50,000 302,632 14,292,538 45,835 1,394,359 1,039,678 11,770,474 3,924,013 238,660,236 $50,000 under $75,000 733,321 40,373,785 99,949 2,777,832 2,366,513 30,706,865 9,490,661 704,097,506 $75,000 under $100,000 695,805 41,107,885 116,289 4,567,962 1,852,041 33,360,346 8,191,997 716,447,836 $100,000 under $200,000 1,054,412 91,253,622 250,889 9,987,392 2,248,180 62,036,160 12,753,063 1,436,580,026 $200,000 under $500,000 365,074 51,821,332 168,184 18,159,529 712,342 45,330,540 4,053,457 762,599,669 $500,000 under $1,000,000 59,430 12,012,279 45,830 8,356,295 122,659 13,929,427 687,697 177,406,765 $1,000,000 or more 33,325 11,573,036 31,602 14,374,165 65,595 18,707,531 342,158 122,644,373
Eligible tomake IRA
contributions[3]
Total contributions Contributions deductedon Form 1040
Rollovers Roth conversions [4] Withdrawals [5]
[1] For joint returns, both taxpayers are placed into the same adjusted gross income class, as determined by the total amount on the return.[2] Number of taxpayers with pension coverage is determined from Form W-2, box 13, which indicates participation in a retirement plan.[3] Those individuals qualifing under Federal Income Tax law to make deductible or nondeductible contributions to a traditional IRA and/or Roth IRA plan.[4] Owners of traditional IRAs were able to convert them to Roth IRAs as long as they met the income limitations for making Roth IRA contributions. Under certain circumstances, SEP or SIMPLE IRAs could also be converted to Roth IRAs; however, these amounts could not be identified separately for the purpose of these statistics.[5] Withdrawals are reported on Form 1099-R; does not include withdrawals for the purpose of rollovers to other IRA accounts if the transfer was made by the trustee; Roth IRA conversions are shown separately.NOTE: Details may not add to total due to rounding.Source: Matched file of Forms 1040, 1099-R, and 5498 for Tax Year 2010. IRS, Statistics of Income Division, June 2013.
Size of adjustedgross income [1]
Table 2. Taxpayers with Individual Retirement Arrangement (IRA) Plans by Size of Adjusted Gross Income, Tax Year 2010[All figures are estimates based on samples—money amounts are in thousands of dollars]
Size of adjusted gross income [1]
Taxpayers with IRA accounts reported on Form 5498
Taxpayers with IRA accounts reported on Form 5498
End of year fair marketvalue of IRAs
TotalWith pension coverage on
Forms W-2 [2]
Number of taxpayers
Accumulation and Distribution of Individual Retirement Arrangements, 2010
10 Statistics of IncomeStatistics of Income
(1) (2) (3) (4) (5) (6)
All taxpayers 3,487,945 12,801,392 3,670 42,991,769 4,339,604,302 100,940Taxpayers on returns reporting: No adjusted gross income 27,238 92,757 3,405 634,886 61,569,631 96,977 $1 under $5,000 27,332 60,378 2,209 785,132 44,254,342 56,365 $5,000 under $10,000 31,349 83,775 2,672 1,123,748 63,249,928 56,285 $10,000 under $15,000 48,338 124,950 2,585 1,515,652 83,888,710 55,348 $15,000 under $20,000 92,270 253,404 2,746 1,574,209 93,850,309 59,617 $20,000 under $25,000 108,007 315,540 2,921 1,600,237 107,668,600 67,283 $25,000 under $30,000 112,463 320,788 2,852 1,552,306 103,217,189 66,493 $30,000 under $40,000 275,467 873,013 3,169 3,125,882 218,045,713 69,755 $40,000 under $50,000 318,907 1,088,662 3,414 3,042,099 212,870,789 69,975 $50,000 under $75,000 655,386 2,165,658 3,304 7,352,840 616,371,352 83,828 $75,000 under $100,000 508,152 1,747,357 3,439 6,325,803 622,924,808 98,474 $100,000 under $200,000 821,018 3,367,178 4,101 10,082,418 1,233,455,801 122,337 $200,000 under $500,000 351,270 1,724,450 4,909 3,392,912 639,478,722 188,475 $500,000 under $1,000,000 73,181 383,720 5,243 589,553 146,244,540 248,060 $1,000,000 or more 37,567 199,762 5,317 294,092 92,513,868 314,575
(7) (8) (9) (10) (11) (12)
All taxpayers 1,053,876 11,963,079 11,352 3,357,006 265,456,011 79,075Taxpayers on returns reporting: No adjusted gross income 6,067 56,591 9,328 79,830 5,685,021 71,214 $1 under $5,000 * 5,187 * 17,773 * 3,426 50,184 1,456,337 29,020 $5,000 under $10,000 9,162 26,937 2,940 55,375 2,079,887 37,560 $10,000 under $15,000 11,964 30,008 2,508 53,314 2,320,236 43,520 $15,000 under $20,000 14,550 70,148 4,821 71,472 2,628,970 36,783 $20,000 under $25,000 17,708 62,557 3,533 72,556 3,556,745 49,021 $25,000 under $30,000 23,438 63,389 2,705 92,896 4,015,587 43,227 $30,000 under $40,000 56,744 263,961 4,652 194,961 6,990,621 35,857 $40,000 under $50,000 51,404 160,851 3,129 189,267 6,625,695 35,007 $50,000 under $75,000 148,769 889,894 5,982 472,693 24,859,784 52,592 $75,000 under $100,000 130,345 936,946 7,188 464,560 27,749,912 59,734 $100,000 under $200,000 317,334 3,685,975 11,615 919,313 79,885,970 86,897 $200,000 under $500,000 206,291 4,134,765 20,043 500,560 71,326,939 142,494 $500,000 under $1,000,000 37,373 1,012,552 27,093 95,185 17,257,610 181,306 $1,000,000 or more 17,540 550,732 31,399 44,840 9,016,697 201,086Footnotes at end of table.
Table 3. Taxpayers with Individual Retirement Arrangement (IRA) Plans, by Type of Plan and by Size of Adjusted Gross Income, Tax Year 2010[All figures are estimates based on samples—money amounts are in thousands of dollars and average amounts are in whole dollars]
Size of adjusted gross income [1]Amount($1,000)
Average ($1)
Traditional IRA plans
Size of adjusted gross income [1]
Amount($1,000)
Average ($1) [2]
Number of taxpayers Average ($1)
SEP plans [3]
Number of taxpayers
End of year fair market value of IRAsTotal contributions
Number of taxpayers
Amount($1,000) Average ($1)Amount
($1,000)
Total contributions End of year fair market value of IRAs
Number of taxpayers

Accumulation and Distribution of Individual Retirement Arrangements, 2010
Statistics of Income 11
(13) (14) (15) (16) (17) (18)
All taxpayers 1,709,466 7,881,700 4,611 2,703,262 69,479,389 25,702Taxpayers on returns reporting: No adjusted gross income 10,095 66,903 6,627 37,305 1,191,032 31,927 $1 under $5,000 * 2,974 * 4,582 * 1,541 16,727 174,327 10,422 $5,000 under $10,000 18,665 19,030 1,020 42,145 581,451 13,796 $10,000 under $15,000 15,944 27,226 1,708 46,714 422,915 9,053 $15,000 under $20,000 38,155 39,842 1,044 82,663 842,836 10,196 $20,000 under $25,000 58,914 66,514 1,129 116,282 852,651 7,333 $25,000 under $30,000 81,710 181,310 2,219 129,968 1,427,903 10,987 $30,000 under $40,000 176,508 343,991 1,949 256,618 3,280,637 12,784 $40,000 under $50,000 144,863 399,468 2,758 221,546 3,040,449 13,724 $50,000 under $75,000 334,811 977,203 2,919 523,132 9,668,604 18,482 $75,000 under $100,000 290,517 1,138,726 3,920 429,209 9,603,368 22,375 $100,000 under $200,000 361,404 2,451,514 6,783 545,704 20,530,191 37,621 $200,000 under $500,000 142,826 1,720,044 12,043 209,064 14,111,181 67,497 $500,000 under $1,000,000 24,305 331,331 13,632 34,573 2,707,302 78,307 $1,000,000 or more 7,775 114,016 14,664 11,612 1,044,542 89,954
(19) (20) (21) (22) (23) (24)
All taxpayers 5,801,369 18,564,517 3,200 16,688,936 354,933,723 21,268Taxpayers on returns reporting: No adjusted gross income 57,130 190,143 3,328 234,054 8,689,838 37,127 $1 under $5,000 100,854 237,940 2,359 298,716 3,439,502 11,514 $5,000 under $10,000 96,923 266,681 2,751 340,089 4,875,566 14,336 $10,000 under $15,000 118,125 305,483 2,586 367,409 4,427,797 12,051 $15,000 under $20,000 140,520 375,067 2,669 434,986 6,768,358 15,560 $20,000 under $25,000 159,788 471,879 2,953 480,755 6,697,513 13,931 $25,000 under $30,000 151,517 377,341 2,490 434,439 6,050,991 13,928 $30,000 under $40,000 341,921 980,454 2,867 1,041,747 16,835,871 16,161 $40,000 under $50,000 445,796 1,128,326 2,531 1,134,317 16,123,303 14,214 $50,000 under $75,000 1,215,827 3,651,760 3,004 2,996,313 53,197,766 17,754 $75,000 under $100,000 1,124,217 3,760,728 3,345 2,889,518 56,169,748 19,439 $100,000 under $200,000 1,745,087 6,408,253 3,672 4,772,496 102,708,064 21,521 $200,000 under $500,000 94,818 369,585 3,898 1,073,986 37,682,827 35,087 $500,000 under $1,000,000 6,106 27,936 4,575 127,862 11,197,313 87,573 $1,000,000 or more 2,740 12,941 4,723 62,249 20,069,266 322,403* Estimate should be used with caution due to the small number of sample returns on which it is based.[1] For joint returns, both taxpayers are placed into the same adjusted gross income class, as determined by the total amount on the return.[2] The statistics are based on unaudited data and contain some amounts in excess of the legal maximum. For additional explanation, see Data Sources and Limitations found in Bryant, Victoria, "Accumulation and Distribution of Individual Retirement Arrangements, 2004" SOI Bulletin, Spring 2008, Volume 27, Number 4, pp. 90–101.[3] For SEP plans, total contributions include contributions made by the taxpayer directly as well as those made by an employer.[4] For SIMPLE plans, total contributions include contributions made by the taxpayer directly as well as those made by an employer.NOTE: Details may not add to total due to rounding.Source: Matched file of Forms 1040, 1099-R, and 5498 for Tax Year 2010. IRS, Statistics of Income Division, June 2013.
Table 3. Taxpayers with Individual Retirement Arrangement (IRA) Plans, by Type of Plan and by Size of Adjusted Gross Income, Tax Year 2010—Continued[All figures are estimates based on samples—money amounts are in thousands of dollars and average amounts are in whole dollars]
End of year fair market value of IRAs
Amount($1,000) Average ($1)
Size of adjusted gross income [1]
Size of adjusted gross income [1]
SIMPLE plans [4]
Number of taxpayers
Average ($1)
Average ($1)
Number of taxpayers
Roth IRA plans
Amount($1,000) Average ($1) Number of
taxpayers
Total contributions End of year fair market value of IRAs
Total contributions
Amount($1,000)
Number of taxpayers
Amount($1,000)

Accumulation and Distribution of Individual Retirement Arrangements, 2010
12 Statistics of IncomeStatistics of Income
Number of taxpayers Amount Number of
taxpayers Amount
(1) (2) (3) (4) (5) (6) (7)
All taxpayers 196,420,136 66,208,127 145,552,561 11,540,393 51,210,690 4,166,696 20,737,721 No age information 570,290 36,088 212,992 2,990 5,774 * 4,047 * 19,526 Under 15 266,858 * 8,093 52,611 * 8,535 * 26,434 * 2,002 * 7,651 15 under 20 5,214,054 312,140 4,570,388 43,210 83,960 9,037 9,697 20 under 25 16,305,519 3,494,957 14,698,685 331,598 788,100 88,581 155,391 25 under 30 18,436,965 6,547,598 15,919,494 883,159 2,447,363 253,655 732,180 30 under 35 18,203,139 7,297,582 15,250,367 1,064,433 3,303,182 251,101 888,053 35 under 40 17,992,003 7,605,274 15,010,823 1,132,642 3,907,992 282,911 1,186,321 40 under 45 18,789,856 8,329,080 15,826,674 1,220,967 4,975,593 341,046 1,666,709 45 under 50 19,770,639 8,894,509 16,753,367 1,424,331 6,373,344 495,985 2,320,343 50 under 55 19,553,706 9,028,008 16,149,338 1,616,601 8,208,863 632,620 3,385,862 55 under 60 17,494,344 7,561,744 13,800,863 1,745,050 9,315,574 759,543 4,264,715 60 under 65 14,588,464 4,789,871 9,651,095 1,305,078 7,328,053 648,191 3,720,579 65 under 70 10,097,243 1,564,397 4,410,253 594,217 3,396,994 330,408 1,933,858 70 under 75 7,158,551 518,607 1,915,869 119,341 754,798 47,435 304,203 75 under 80 5,074,985 162,798 829,533 31,228 202,264 15,975 104,686 80 and over 6,903,520 57,381 500,209 17,013 92,402 4,159 37,947
Number of taxpayers Amount Number of
taxpayers Amount Number of taxpayers Amount Number of
taxpayers Amount
(8) (9) (10) (11) (12) (13) (14) (15)
All taxpayers 4,323,498 299,715,386 869,399 64,767,827 13,459,025 257,611,337 54,428,897 5,029,473,427 No age information 3,085 116,096 * 1,027 * 8,174 6,808 163,765 33,917 1,612,929 Under 15 * 999 * 248 0 0 * 2,847 * 18,765 17,204 252,107 15 under 20 0 0 0 0 * 7,603 * 26,240 81,925 1,020,961 20 under 25 47,352 199,694 9,141 52,650 33,050 166,087 658,032 4,271,227 25 under 30 202,529 1,321,044 37,441 332,877 119,126 792,404 1,925,049 17,473,303 30 under 35 286,381 4,678,547 54,813 1,039,397 192,747 2,215,303 3,006,027 45,393,159 35 under 40 295,877 9,583,106 78,745 2,495,288 300,579 5,204,728 3,785,400 93,376,174 40 under 45 367,424 13,296,221 78,426 2,843,586 430,490 7,951,289 4,697,248 176,972,598 45 under 50 468,464 22,149,836 96,986 4,254,894 552,923 12,142,947 5,796,971 315,379,000 50 under 55 494,322 32,847,413 97,662 7,015,421 734,126 18,769,743 6,745,970 496,102,528 55 under 60 613,104 55,192,434 111,744 7,082,497 847,323 22,109,707 7,134,799 706,378,339 60 under 65 702,617 76,813,889 123,120 11,929,298 1,429,492 43,292,551 6,664,113 949,927,965 65 under 70 432,028 46,867,330 114,100 13,204,280 1,347,126 41,021,477 5,022,545 877,341,166 70 under 75 243,423 22,483,037 33,595 8,296,679 2,705,865 43,716,677 3,563,566 627,955,155 75 under 80 81,107 6,424,724 23,372 3,793,114 2,209,310 29,937,344 2,530,225 408,213,641 80 and over 84,786 7,741,767 9,227 2,419,672 2,539,610 30,082,310 2,765,906 307,803,175
Age of taxpayer
* Estimate should be used with caution due to the small number of sample returns on which it is based.[1] Number of taxpayers with pension coverage is determined from Form W-2 box 13, which indicates participation in a retirement plan.[2] Those individuals qualifing under Federal Income Tax law to make deductible or nondeductible contributions to a traditional IRA and/or Roth IRA plan.[3] Owners of traditional IRAs were able to convert them to Roth IRAs as long as they met the income limitations for making Roth IRA contributions. Under certain circumstances, SEP or SIMPLE IRAs could also be converted to Roth IRAs; however, these amounts could not be identified separately for the purpose of these statistics. [4] Withdrawals are reported on Form 1099-R; does not include withdrawals for the purpose of rollovers to other IRA accounts if the transfer was made by the trustee; Roth IRA conversions are shown separately. NOTE: Details may not add to total due to rounding.Source: Matched file of Forms 1040, 1099-R, and 5498 for Tax Year 2010. IRS, Statistics of Income Division, June 2013.
Total contributions Contributions deducted on Form 1040
Rollovers
Taxpayers with IRA accounts reported on Form 5498
Table 4. Taxpayers with Individual Retirement Arrangement (IRA) Plans, by Age of Taxpayer, Tax Year 2010[All figures are estimates based on samples—money amounts are in thousands of dollars]
Number of taxpayers
Age of taxpayer
Taxpayers with IRA accounts reported on Form 5498—continued
Roth conversions [3] Withdrawals [4] End of year fair marketvalue of IRAs
TotalWith pension coverage on
Forms W-2 [1]
Eligible to make IRA
contributions[2]
Accumulation and Distribution of Individual Retirement Arrangements, 2010
Statistics of Income 13
(1) (2) (3) (4) (5) (6)
All taxpayers 3,487,944 12,801,392 974,532 718,179 169,555 339,109 No age information * 19 * 92 0 0 0 0 Under 15 * 1,001 * 4,999 0 0 0 0 15 under 20 * 2,034 * 1,583 * 2,024 * 1,532 0 0 20 under 25 29,804 55,416 17,982 8,887 * 1,001 * 2,002 25 under 30 122,630 314,774 54,979 35,588 * 5,999 * 11,998 30 under 35 177,786 518,154 66,135 44,939 9,072 18,144 35 under 40 238,299 673,425 100,160 62,614 6,765 13,529 40 under 45 301,290 961,527 99,857 71,485 10,603 21,206 45 under 50 441,647 1,438,694 137,156 107,151 23,845 47,690 50 under 55 553,866 2,042,809 155,725 122,092 42,743 85,486 55 under 60 693,750 2,849,479 151,314 116,517 34,481 68,963 60 under 65 605,975 2,539,441 126,517 100,459 25,726 51,451 65 under 70½ 319,843 1,400,999 62,683 46,915 9,320 18,640
(7) (8) (9) (10) (11) (12)
All taxpayers 174,189 425,505 144,269 432,809 41,554 134,470 No age information 0 0 0 0 0 0 Under 15 0 0 0 0 0 0 15 under 20 0 0 0 0 0 0 20 under 25 * 1,001 * 2,503 * 3,540 * 10,620 0 0 25 under 30 10,086 25,225 * 4,073 * 12,219 * 300 * 929 30 under 35 11,945 29,111 * 4,453 * 13,359 * 5,296 * 17,450 35 under 40 11,571 28,721 7,901 23,702 5,273 16,678 40 under 45 13,459 33,550 13,832 41,496 4,938 15,855 45 under 50 26,152 63,213 11,157 33,472 * 3,614 * 11,284 50 under 55 25,065 59,820 22,349 67,047 4,193 13,003 55 under 60 33,635 82,291 32,682 98,047 8,255 26,726 60 under 65 27,809 67,170 33,663 100,989 5,628 19,198 65 under 70½ 13,466 33,901 10,619 31,858 * 4,057 * 13,347Footnotes at end of table.
Age of taxpayer
AmountNumber of taxpayers Amount
Number of taxpayers
Number of taxpayers
Number of taxpayers
Amount Number of taxpayers
Amount Amount Amount
Over $3,000, under $3,500
Table 5. Taxpayers with Traditional Individual Retirement Arrangement (IRA) Contributions, by Size of Contribution and Age of Taxpayer, Tax Year 2010[All figures are estimates based on samples—money amounts are in thousands of dollars]
Age of taxpayer
Total contributions to Traditional IRA Plans
Total contributions to Traditional IRA Plans—continued
Total Under $2,000 Exactly $2,000
Over $2,000, under $3,000 Exactly $3,000
Number of taxpayers

Accumulation and Distribution of Individual Retirement Arrangements, 2010
14 Statistics of IncomeStatistics of Income
(13) (14) (15) (16) (17) (18)
All taxpayers 23,108 80,880 42,308 160,161 92,373 369,495 No age information 0 0 0 0 0 0 Under 15 0 0 0 0 0 0 15 under 20 0 0 0 0 0 0 20 under 25 0 0 0 0 0 0 25 under 30 0 0 * 2,023 * 7,797 * 4,024 * 16,098 30 under 35 * 1,038 * 3,632 * 2,628 * 9,970 * 3,144 * 12,578 35 under 40 * 1,001 * 3,504 * 1,950 * 7,744 686 2,745 40 under 45 * 2,009 * 7,032 2,598 9,835 7,757 31,030 45 under 50 * 944 * 3,305 9,032 34,422 4,831 19,323 50 under 55 * 4,264 * 14,923 5,147 19,147 22,300 89,200 55 under 60 7,255 25,393 6,708 25,456 23,729 94,916 60 under 65 * 5,621 * 19,674 6,718 25,242 17,770 71,079 65 under 70½ * 976 * 3,417 5,504 20,548 8,132 32,526
(19) (20) (21) (22) (23) (24)
All taxpayers 19,291 82,441 13,103 58,967 51,259 247,333 No age information 0 0 0 0 * 8 * 41 Under 15 0 0 0 0 * 1,001 * 4,999 15 under 20 0 0 0 0 0 0 20 under 25 0 0 0 0 0 0 25 under 30 0 0 0 0 * 3,407 * 16,229 30 under 35 * 1,034 * 4,545 * 209 * 943 3,448 16,562 35 under 40 * 458 * 1,914 * 300 * 1,350 3,406 16,779 40 under 45 * 11 * 46 * 1,001 * 4,505 4,815 23,441 45 under 50 4,664 19,744 * 2,016 * 9,071 12,704 62,365 50 under 55 * 1,385 * 5,996 * 3,026 * 13,618 6,585 31,484 55 under 60 4,989 21,139 * 4,319 * 19,435 7,431 35,587 60 under 65 3,046 13,159 * 1,897 * 8,538 6,970 32,746 65 under 70½ * 3,704 * 15,898 * 335 * 1,507 * 1,484 * 7,100Footnotes at end of table.
Number of taxpayers Amount Number of
taxpayers
Over $4,500, under $5,000
Number of taxpayers
Over $3,500, under $4,000
Amount
Exactly $4,000
Number of taxpayers Amount Number of
taxpayers Amount Number of taxpayers
Amount
Over $4,000, under $4,500 Exactly $4,500
Amount
Table 5. Taxpayers with Traditional Individual Retirement Arrangement (IRA) Contributions, by Size of Contribution and Age of Taxpayer, Tax Year 2010—Continued[All figures are estimates based on samples—money amounts are in thousands of dollars]
Total contributions to Traditional IRA Plans—continued
Total contributions to Traditional IRA Plans—continued
Age of taxpayer
Age of taxpayerExactly $3,500
Accumulation and Distribution of Individual Retirement Arrangements, 2010
Statistics of Income 15
(25) (26) (27) (28) (29) (30)
All taxpayers 683,606 3,418,034 37,611 206,892 1,021,186 6,127,115 No age information * 10 * 51 0 0 0 0 Under 15 0 0 0 0 0 0 15 under 20 * 10 * 51 0 0 0 0 20 under 25 6,281 31,404 0 0 0 0 25 under 30 37,738 188,691 0 0 0 0 30 under 35 69,385 346,923 0 0 0 0 35 under 40 98,829 494,144 0 0 0 0 40 under 45 140,409 702,046 0 0 0 0 45 under 50 205,531 1,027,654 0 0 0 0 50 under 55 39,939 199,697 11,326 62,380 209,819 1,258,914 55 under 60 33,351 166,755 8,766 47,248 336,835 2,021,007 60 under 65 31,020 155,101 14,719 81,401 298,872 1,793,232 65 under 70½ 21,103 105,517 2,800 15,863 175,660 1,053,962
Number of taxpayers Amount
Over $5,000, under $6,000 Exactly $6,000
Number of taxpayers Amount
Exactly $5,000
Number of taxpayers Amount
Age of taxpayer
Total contributions to Traditional IRA Plans—continued
Table 5. Taxpayers with Traditional Individual Retirement Arrangement (IRA) Contributions, by Size of Contribution and Age of Taxpayer, Tax Year 2010—Continued[All figures are estimates based on samples—money amounts are in thousands of dollars]
* Estimate should be used with caution due to the small number of sample returns on which it is based.NOTE: Details may not add to total due to rounding.Source: Matched file of Forms 1040, 1099-R, and 5498 for Tax Year 2010. IRS, Statistics of Income Division, June 2013.
Accumulation and Distribution of Individual Retirement Arrangements, 2010
16 Statistics of IncomeStatistics of Income
(1) (2) (3) (4) (5) (6)
All taxpayers 5,801,368 18,564,517 2,234,573 1,861,207 135,688 271,376 No age information * 2,928 * 5,334 * 1,949 * 439 0 0 Under 15 * 6,533 * 17,588 * 3,529 * 4,575 0 0 15 under 20 36,173 80,033 18,613 12,070 * 3,037 * 6,074 20 under 25 249,876 643,741 113,652 74,244 * 5,048 * 10,096 25 under 30 607,905 1,609,021 285,734 222,607 17,129 34,257 30 under 35 690,908 1,817,142 326,430 263,332 13,235 26,470 35 under 40 662,888 1,670,602 331,048 282,618 15,798 31,596 40 under 45 637,689 1,756,685 273,586 228,005 20,944 41,887 45 under 50 676,785 2,011,294 262,326 228,686 16,607 33,215 50 under 55 706,750 2,561,409 242,528 214,291 16,109 32,219 55 under 60 760,906 2,944,617 229,730 202,180 13,855 27,710 60 under 65 491,141 2,223,398 94,255 84,317 9,484 18,967 65 under 70 176,838 793,606 34,548 25,251 4,146 8,293 70 and over 94,048 430,047 16,645 18,592 * 296 * 592
(7) (8) (9) (10) (11) (12)
All taxpayers 368,177 891,109 181,243 543,726 55,989 183,813 No age information 0 0 0 0 0 0 Under 15 0 0 * 1,001 * 3,003 0 0 15 under 20 * 2,016 * 5,034 * 998 * 2,993 0 0 20 under 25 20,641 51,272 12,552 37,656 * 1,057 * 3,473 25 under 30 34,124 82,117 18,750 56,250 * 3,894 * 12,437 30 under 35 50,596 122,740 17,075 51,226 * 3,893 * 12,727 35 under 40 48,101 115,199 18,412 55,235 11,834 39,422 40 under 45 50,350 120,897 18,185 54,556 7,628 25,258 45 under 50 47,881 116,965 23,195 69,586 7,897 25,458 50 under 55 38,229 94,294 24,853 74,558 7,095 23,054 55 under 60 44,519 105,809 27,170 81,509 4,680 15,208 60 under 65 18,510 46,048 12,678 38,033 5,362 18,018 65 under 70 7,785 18,431 * 2,317 * 6,951 * 1,542 * 4,997 70 and over * 5,425 * 12,303 * 4,057 * 12,170 * 1,107 * 3,761Footnotes at end of table.
Table 6. Taxpayers with Roth Individual Retirement Account (IRA) Contributions, by Size of Contributions and Age of Taxpayer, Tax Year 2010[All figures are estimates based on samples—money amounts are in thousands of dollars]
Total contributions to Roth IRA plans
Total contributions to Roth IRA plans—continued
Age of taxpayer
Amount
Number of taxpayers
Number of taxpayers Amount
Number of taxpayers
Number of taxpayers Amount
Over $3,000, under $3,500
Number of taxpayers
Age of taxpayerTotal Under $2,000 Exactly $2,000
Over $2,000, under $3,000 Exactly $3,000
Number of taxpayers Amount Amount Amount

Accumulation and Distribution of Individual Retirement Arrangements, 2010
Statistics of Income 17
(13) (14) (15) (16) (17) (18)
All taxpayers 21,701 75,948 164,854 620,102 87,452 349,807 No age information 0 0 0 0 0 0 Under 15 0 0 0 0 0 0 15 under 20 0 0 * 1,929 * 7,370 * 1,018 * 4,072 20 under 25 * 2,016 * 7,055 * 4,316 * 16,153 * 7,069 * 28,275 25 under 30 * 5,328 * 18,646 11,084 41,883 12,090 48,359 30 under 35 * 2,319 * 8,116 28,018 107,266 9,956 39,824 35 under 40 * 2,146 * 7,510 18,212 68,362 8,090 32,362 40 under 45 * 148 * 520 28,347 108,253 11,213 44,850 45 under 50 * 40 * 139 26,616 100,164 14,562 58,248 50 under 55 * 1,196 * 4,186 22,032 81,695 9,321 37,284 55 under 60 * 5,033 * 17,614 13,740 50,536 7,385 29,540 60 under 65 * 2,177 * 7,618 8,006 29,150 * 2,448 * 9,790 65 under 70 * 1,001 * 3,504 * 1,053 * 3,802 * 1,685 * 6,741 70 and over * 297 * 1,040 * 1,501 * 5,468 * 2,615 * 10,462
(19) (20) (21) (22) (23) (24)
All taxpayers 48,622 204,475 19,654 88,446 211,268 1,034,447 No age information 0 0 0 0 0 0 Under 15 0 0 0 0 0 0 15 under 20 0 0 0 0 * 972 * 4,470 20 under 25 * 1,001 * 4,204 * 1,001 * 4,505 * 5,871 * 28,547 25 under 30 * 4,978 * 20,493 0 0 25,492 125,456 30 under 35 9,969 42,290 * 1,306 * 5,879 37,865 186,050 35 under 40 6,088 25,820 * 1,292 * 5,814 39,142 193,036 40 under 45 * 1,922 * 7,871 * 1,984 * 8,926 19,730 97,395 45 under 50 7,039 29,766 * 1,028 * 4,627 37,773 185,334 50 under 55 * 3,624 * 15,065 * 2,576 * 11,594 17,022 81,669 55 under 60 8,766 37,265 * 5,671 * 25,518 10,958 53,173 60 under 65 2,812 11,816 * 3,675 * 16,539 12,859 62,171 65 under 70 * 2,317 * 9,423 * 1,121 * 5,044 * 592 * 2,889 70 and over * 106 * 462 0 0 * 2,992 * 14,257Footnotes at end of table.
Table 6. Taxpayers with Roth Individual Retirement Account (IRA) Contributions, by Size of Contributions and Age of Taxpayer, Tax Year 2010—Continued[All figures are estimates based on samples—money amounts are in thousands of dollars]
Total contributions to Roth IRA plans—continued
Age of taxpayer
Total contributions to Roth IRA plans—continued
Age of taxpayer
Amount Number of taxpayers
Over $4,500, under $5,000
Number of taxpayers AmountNumber of
taxpayers
Over $4,000, under $4,500 Exactly $4,500
Number of taxpayers Amount Number of
taxpayers Amount
Exactly $3,500 Over $3,500, under $4,000
Amount
Exactly $4,000
Amount Number of taxpayers

Accumulation and Distribution of Individual Retirement Arrangements, 2010
18 Statistics of IncomeStatistics of Income
(25) (26) (27) (28) (29) (30)
All taxpayers 1,159,810 5,799,051 75,210 418,218 1,037,133 6,222,794 No age information * 979 * 4,896 0 0 0 0 Under 15 * 2,002 * 10,010 0 0 0 0 15 under 20 * 7,590 * 37,951 0 0 0 0 20 under 25 75,652 378,260 0 0 0 0 25 under 30 189,303 946,515 0 0 0 0 30 under 35 190,244 951,221 0 0 0 0 35 under 40 162,726 813,629 0 0 0 0 40 under 45 203,654 1,018,268 0 0 0 0 45 under 50 231,821 1,159,106 0 0 0 0 50 under 55 35,252 176,261 15,613 87,446 271,299 1,627,793 55 under 60 25,690 128,450 27,254 151,351 336,459 2,018,753 60 under 65 22,717 113,587 21,623 120,130 274,536 1,647,214 65 under 70 9,382 46,909 8,918 48,785 100,431 602,587 70 and over 2,798 13,988 1,802 10,506 54,408 326,447
Age of taxpayer
Table 6. Taxpayers with Roth Individual Retirement Account (IRA) Contributions, by Size of Contributions and Age of Taxpayer, Tax Year 2010—Continued[All figures are estimates based on samples—money amounts are in thousands of dollars]
Total contributions to Roth IRA plans—continued
* Estimate should be used with caution due to the small number of sample returns on which it is basedNOTE: Roth IRA refers to an individual retirement plan that is subject to the rules that apply to a traditional IRA with exceptions, as defined by Publication 590, p. 36.Source: Matched file of Forms 1040, 1099-R, and 5498 for Tax Year 2010. IRS, Statistics of Income Division, June 2013.
Over $5,000, under $6,000 Exactly $6,000
Number of taxpayers Amount Number of
taxpayers Amount
Exactly $5,000
Number of taxpayers Amount