stats sa · all its forms everywhere”. the ilo report entitled “world employment social...
TRANSCRIPT

Labour market dynamicsin South Africa, 2015
Labourstatistics
The South Africa I know, the home I understandSTATISTICS SOUTH AFRICASTATS SA

Labour market dynamics in South Africa, 2015 / Statistics South Africa
Published by Statistics South Africa, Private Bag X44, Pretoria 0001
© Statistics South Africa, Users may apply or process this data, provided Statistics South Africa (Stats
SA) is acknowledged as the original source of the data; that it is specified that the application and/or
analysis is the result of the user's independent processing of the data; and that neither the basic data
nor any reprocessed version or application thereof may be sold or offered for sale in any form
whatsoever without prior permission from Stats SA.
Stats SA Library Cataloguing-in-Publication (CIP) Data Labour market dynamics in South Africa, 2015 / Statistics South Africa. Pretoria: Statistics South Africa, 2016
Report 02-11-02 (2015)
208 pp
ISBN 978-0-621-44956-3
A complete set of Stats SA publications is available at Stats SA Library and the following libraries:
National Library of South Africa, Pretoria Division
National Library of South Africa, Cape Town Division
Library of Parliament, Cape Town
Bloemfontein Public Library
Natal Society Library, Pietermaritzburg
Johannesburg Public Library
Eastern Cape Library Services, King William’s Town
Central Regional Library, Polokwane
Central Reference Library, Nelspruit
Central Reference Collection, Kimberley
Central Reference Library, Mmabatho
This publication is available on the Stats SA website: www.statssa.gov.za
For technical enquiries please contact:
Peter Buwembo
Email: [email protected]

Foreword
One of the first goals of the Agenda for Sustainable Development is to end poverty by 2030 “in
all its forms everywhere”. The ILO report entitled “World Employment Social Outlook” finds that
decent jobs is a critical pre-condition for ending poverty. However, high unemployment continues
to undermine the progress towards the eradication of poverty. In 2015, the number of
unemployed globally was 197,1 million and this is expected to increase to 199,4 million in 2016.
Unemployment is most acute amongst the poor, youth and women. In South Africa, the number
of unemployed people increased from 4,4 million 2009 to 5,3 million in 2015. This translated into
an unemployment rate of 25,3% in 2015. Data further shows that from a multidimensional
poverty perspective the main drivers of poverty are unemployment and educational attainment;
accounting for 52% and 11% in 2016 respectively (South African Multidimensional poverty index
(SAMPI), Community Survey 2016)
Analysis by the IMF in the working paper entitled “South Africa: labour market dynamics and
inequality” confirms research undertaken by Stats SA using the QLFS panel regarding the
importance of experience in improving the transition rates into employment from unemployment.
However the paper finds that education plays a minor role in the job-finding rate, possibly due to
perceptions around the quality of education presently experienced in the country. In addition to
that, long-term unemployment decreases the job-finding rate, and also the fact that females
have lower rates of entry into employment compared to men.
The year 2015 marks the eighth Labour Market Dynamics Report in South Africa since the
inception of the Quarterly Labour Force Survey (QLFS) in 2008. In 2015, Stats SA introduced a
new Master Sample which was based on the Census 2011 population estimates. A number of
improvements took place with regard to this sample, including efforts to improve Mining
estimates, through the inclusion of a Mining strata in provinces where employment in this
industry accounted for more than 30% of total employment. In addition, estimates of labour
market indicators at metro levels were also published for the first time, on a quarterly basis in
Q1: 2015.
This report provides information on labour market trends over the period 2009–2015, with
particular focus on labour market dynamics as provided for by QLFS panel data. The panel
allows the tracking of individuals on a quarterly basis, identifying the factors that facilitate the
movement into employment, as well as distinguishing in which sectors, industries, occupations,
and provinces employment outcomes are better. In addition, data on transition and retention
rates were analysed over the period 2010–2015. Between 2010 and 2015, panel data
constructed from the Quarterly Labour Force Survey (QLFS) confirms that the employed are
likely to remain in employment, with 93,3% remaining in this labour market state between Q3
and Q4: 2015. The transition rate into employment amongst the unemployed increased from
10,3% in 2010 to 12,7% in 2015. In line with the IMF results, the QLFS panel highlights that
those without jobs but who had previous work experience were nearly 4 times more likely to find
employment, while being male and an adult also increases the chances of transitioning into
employment.
The analysis presented in this report complements the insights gained from a number of reports
over the last two years, focusing on national and provincial labour market trends on the following
topics:
National and provincial labour market trends over the last decade, 2003-2013

Youth
Panel data
Long-term unemployment
The informal sector
Job tenure
Over the period 2009 to 2015, the number of the employed increased from 14,2 million to 15,7
million, while the number of unemployed increased by 941 000 to 5,3 million in 2015. The rise in
employment levels have however not kept pace with the increase in the working age population,
and as such the absorption rate, at 43,7% in 2015 was still 2,2 percentage points below the
2008 pre-recessionary high.
The trends highlighted in the “Labour market dynamics in South Africa, 2015” should be seen in
the context of the National Development Plan (NDP), which targets an unemployment rate of
6%, an absorption rate of 61%, and a labour force participation rate of 65% by 2030.
I sincerely hope that this report will form the basis for robust policy discourse on how reducing
unemployment levels can assist in the reduction of poverty in South Africa.
Pali Lehohla Statistician-General

Statistics South Africa 02-11-02
Labour market dynamics in South Africa, 2015
Highlights
While employment levels increased over the period 2009–2015 from 14,2 million to 15,7 million, this
rise however did not keep pace with the increase in the working age population and as such the
absorption rate, at 43,7% in 2015 was still 2,2 percentage points below the 2008 pre-recessionary
high. Since 2012, economic growth has slowed, declining from a high of 3,3% in 2011 to 1,3% in
2015.
Labour market dynamics
Between 2010 and 2015, panel data constructed from the Quarterly Labour Force Survey (QLFS)
over the two quarters (Q3 to Q4) indicate that the employed are more likely to remain in
employment. In 2010, 93,9% remained in employment while in 2015, the retention rate was 93,3%.
On the other hand, the unemployment retention rates increased over the period from 66,9% in
2010 to 67,5% in 2015.
Provincial variations in employment retention rates are evident. In 2015, the best performing
province in terms of employment retention rates continues to be the Western Cape at 96,2% (up
by 2,2 percentage points since 2010); while the lowest retention rates was recorded in the
Northern Cape (88,9%). Generally employment retention rates increased in four of the nine
provinces, namely, Limpopo (2,7 percentage points), Western Cape (2,2 percentage points)
Mpumalanga (1,6 percentage points) and KwaZulu-Natal (0,1 of a percentage point).
In 2010, only 10,3% of the unemployed found employment between Q3 and Q4; however by 2015,
this increased to 12,7%.
The informal sector serves as a point of entry to the formal sector; however, provincial disparities
are evident. Between Q3 and Q4: 2015 nationally, 17,1% of informal sector workers found a formal
sector job, while provincially this ranged from a high of 26,3% in the Western Cape, to a low of
11,5% in Limpopo.
The panel data analysis also finds that the informal sector does not provide for stable employment;
in the North West and Northern Cape, more than one in five of those employed in the informal
sector moved out of employment in the subsequent quarter.
The analysis identifies that jobless women, youth and those who have no previous work
experience are less likely to transition into employment.
While the unemployed have a low transition rate into employment, the short-term unemployed are
three times more likely to enter employment on a quarterly basis relative to the long-term
unemployed.
The type of contract a person is employed on can also point to vulnerabilities in the labour market;
in particular, those employed on a contract of a limited and unspecified duration are less likely to
retain employment on these contract types and are therefore more likely to move out of
employment on a quarterly basis.
Being employed in a skilled occupation and industries in the tertiary sector increases a person's
chances of remaining in employment, as these occupations and industries are associated with
higher retention rates. Between Q3 and Q4: 2015 the employment retention rate in skilled
occupations was 87,0% compared to 82,7% in low-skilled occupations.
Jobless adults were more likely to transition into employment compared to jobless youth. However
in certain provinces, such as Northern Cape, Gauteng and Free State, while still disadvantaged,
youth are better off than their counterparts in other provinces.

Statistics South Africa 02-11-02
Labour market dynamics in South Africa, 2015
Experience and education levels play an important role in improving the chances of finding a job.
At provincial level, the transition rates into employment amongst the jobless with previous
experience was highest in Limpopo (15,3%), Mpumalanga (13,0%) and the Free State (12,5%). In
2015 the transition rate into employment amongst the jobless who have a tertiary qualification was
8,0% compared to 5,5% of those without a job and whose education levels were below matric.
The South African labour market
Between 2009 and 2015, the South African working age population increased from 32,4 million to
36,0 million. The number of young persons and children (0–14) years declined by 31 000 while
there was a large increase over the period among older persons (65 years and above) (566 000).
The share of the working age population in the total population increased from 64,4% in 2009 to
66,2% in 2015.
The employed accounted for the largest share of the working age population in both 2009 and
2015 in all provinces, however in the following provinces the share of other NEA was higher than
the share of employed, Limpopo (36,2% versus 43,7% in 2015), Eastern Cape (33,5% versus
42,9% in 2015) and KwaZulu-Natal (38,1% versus 43,0% in 2015).
The employed also accounted for the largest share amongst the white population group; in 2015
their share of the working age who were employed was 63,7% amongst whites compared to 40,6%
amongst black Africans.
Among those aged 35–44 years, the employed accounted 63,8% while for persons in the working
age population with a tertiary qualification, 76,5% were employed.
The overall dependency ratio declined between 2009–2015 from 55,2% to 51,1%; reflecting the
decline in the youth dependency ratio from 47,8% in 2009 to 42,9% in 2015.
Between 2009 and 2015 the number of the employed increased from 14,2 million to 15,7 million;
which when combined with an increase in the number of unemployed (941 000) resulted in an
increase in the unemployment rate from 23,7% in 2009 to 25,3% in 2015. In 2015, the absorption
rate of 43,7% and the labour force participation rate of 58,5% was the highest rates recorded since
2009.
Provincial variations in labour market rates were observed over the period 2009 to 2015. In terms
of the unemployment rate, the rate was lowest in Limpopo and this was also the province where
the rate declined the most over the period (6,5 percentage points). The only other province where
the rate also declined was the North West. Amongst the seven provinces where the rate
increased, the largest increase was in Northern Cape (5,4 percentage points) and the Free State
(4,8 percentage points).
Over the period 2009 to 2015, absorption rates declined in six of the nine provinces, most notably
in Gauteng (2,2 percentage points) and KwaZulu-Natal (1,7 percentage points). While a province
such as Limpopo has a low official unemployment rate, the absorption rate in this province is the
second lowest, however the rate increased between 2009 to 2015 (5,8 percentage points).
Reflecting the changes in employment and unemployment over the period 2009–2015, the labour
force participation increased in six of the nine provinces, the largest of which was in Limpopo (3,9
percentage points) although the province still ranked lowest.
Regardless of race, unemployment rates are higher amongst black African women. However over
the period the rise in unemployment rates amongst women of the other three population groups
was of a higher magnitude.
Young people continue to face higher unemployment rates and lower absorption and participation
rates relative to adults. In particular, the unemployment rate is highest amongst youth aged 15–24
years (50,1% in 2015) while their absorption rate was only 13,3% in 2015.

Statistics South Africa 02-11-02
Labour market dynamics in South Africa, 2015
The unemployment rate increased amongst all age groups, most notably those aged 45–54 and
35–44 years (2,9 percentage points each). This increase was accompanied by a decline in the
absorption rate across all age groups, the largest of which was for the age groups 15–24 and 25–
34 years (1,2 and 1,4 percentage points respectively).
Employment patterns and trends
Over the period 2009 to 2015 total employment increased by 1,5 million to 15,7 million in 2015.
The rise in employment levels was supported by increases in eight of the ten industries, the largest
of which was Community and Social Services (737 000), Finance (336 000) and Construction
(216 000).
In terms of the contribution to employment, in 2009, Trade accounted for the largest share in
employment at 22,0%, but by 2015 Community and Social Services was ranked highest
accounting for 22,6%. Between 2009 and 2015, seven out of ten industries reflected an increase in
their share in total employment; the largest increase was in Community and Social Services (2,7
percentage points). Manufacturing reflected the largest decline in its share of employment over the
period (2,6 percentage points).
In 2015, at a provincial level, Community and Social Services accounted for the largest share of
employment in all provinces, ranging between 20,1% in the Western Cape to 29,9% in the
Northern Cape. Trade accounted for the second largest share with the contribution ranging from a
low of 17,3% in the Northern Cape to a high of 21,7% in Limpopo. Utilities contributed the lowest
proportion to employment across all provinces.
Strong employment growth in occupations such as Elementary occupations (663 000), Sales
(540 000) and Manager (178 000) supported the robust employment growth over the period 2009
to 2015.
Between 2009 and 2015, employment levels in the formal sector increased by 968 000 to 10,9
million, while informal sector employment increased from 2,2 million in 2009 to 2,6 million in 2015.
Over the period 2009 to 2015, the average weekly hours worked declined from 44 hours in 2009 to
43 hours in 2015. While men worked longer hours relative to women, for both groups monthly
average hours declined; from 46 to 45 hours amongst men and from 42 to 41 hours amongst
women.
Hours worked are highest in Transport and Trade and lowest amongst people employed in Private
households. By occupation, Sales workers and Operators work the longest hours, and Domestic
workers the lowest.
The number of underemployed increased from 669 000 in 2009 to 705 000 in 2015, accounting for
4,5% of the unemployed in 2015. Underemployment is more prevalent amongst women, black
Africans and persons residing in Limpopo.
While the share of employees working excessive hours declined, men were more likely to work
excessive hours than women.
The proportion of employees belonging to a trade union declined between 2011 and 2015, to
reach 27,4% in 2015. While men were marginally more likely to be a member of a trade union, the
decline in membership over the period was more pronounced amongst this sex. Over the period
2011 to 2015, membership of trade unions increased only amongst employees in Mining and
Utilities.
While gender disparities still remain in terms of access to benefits, access to paid sick leave is the
most broadly accessed form of benefit amongst all employees (68,3% in 2015). The proportion of
employees who were entitled to paid sick leave increased between 2011 and 2015, for both men

Statistics South Africa 02-11-02
Labour market dynamics in South Africa, 2015
and women. Access to paid maternity leave and medical aid (the lowest coverage amongst
employees) also declined among both genders.
Pension/retirement fund contributions declined marginally between 2009 and 2015 from 46,4% to
46,1% and while declining amongst male employees, the access was still higher relative to female
employees. In 2015, 55,4% of employees indicated that their salary increment was negotiated by
their employer only; and this was a 7,4 percentage point increase since 2011 and the only salary
negotiating category to show an increase over the period.
Median monthly earnings of employees increased from R2 900 in 2010 to R3 100 in 2015.
Gender, race and age continue to be drivers of the earnings inequalities.
Between 2010 and 2015, employees in Mining and Utilities continued to be the top performing
earners, with the largest increases in earnings also recorded for these two industries (R2 500 and
R1 500 respectively) followed by Agriculture (R936). Over the period, monthly median earnings
declined only in Community and Social Services (R1 000). Robust earnings growth was recorded
for Managers (R6 000) and Professionals (R7 400) and declined only amongst Technicians
(R1 900). Median monthly earnings remained unchanged in the Clerk and Skilled Agriculture
occupational categories.
At provincial level, across all years, median monthly earnings was highest in Gauteng (R4 500 in
2015) and the Western Cape (R3 250 in 2015), while the largest increase over the period 2010–
2015 was in Gauteng (R1 000) and the Free State and Limpopo (R500 each).
Median monthly job tenure increased from 39 months in 2009 to 44 months in 2015. In 2009, male
median monthly job tenure was higher relative to women, but by 2015 this situation reversed. Job
tenure is higher in the formal sector, amongst the white population group, highly skilled
occupations and industries such as Utilities, Mining and Community and Social Services, in the
provinces of Gauteng and the Western Cape and the older age categories.
Between 2011 and 2015, fetching of water or collecting wood/dung was the main own-use activity
undertaken by South Africans aged 15–64 years. This type of activity is not counted as
employment in South Africa and is predominately undertaken by women, black Africans, those
who have never married, young people between the ages of 15 and 34 years, the less educated,
and persons residing in KwaZulu-Natal, Eastern Cape and Limpopo.
Between 2011 and 2015, the number of persons engaged in own-use activities as a percentage of
the working-age population declined from 16,1% to 15,9%, as the number of persons engaged in
subsistence Agriculture declined.
Government job creation programmes
The proportion of the working age population who have heard of the EPWP increased from 42,8%
in 2011 to 52,4% in 2015. The proportion of women who participated in these types of
programmes also increased from 59,3% in 2011 to 64,4% in 2015.
Youth participation was higher in 2011 at 51,1% but in 2012 this trend reversed and in 2015,
55,1% of participants were between the ages of 35–64 years.
In 2015, persons with below matric qualifications accounted for 70,7% of the participants in
government job creation programmes.
In 2015, participation rates were highest in the Eastern Cape (18,9%), KwaZulu-Natal (18,7%) and
Gauteng (17,8%). KwaZulu-Natal and Gauteng also recorded the largest decline in participation
rates since 2011 (8,1 and 7,4 percentage points respectively).
In 2015, among those who participated in government job creation programmes; 69,2% were
employed, up from 56,9% in 2011. In addition seven out of ten of those who participated in

Statistics South Africa 02-11-02
Labour market dynamics in South Africa, 2015
government job creation programmes were employed in Tertiary industries and close to one in ten
in skilled-occupations.
Unemployment patterns and trends
Unemployment in South Africa is most acute amongst black Africans, and amongst those with less
than a matric, the youth and women.
Between 2009 and 2015 more than 50,0% of the unemployed indicated that they were working
prior to becoming unemployed. While multiple job search methods can be used for looking for
work, in 2015, the majority of job seekers (52,6%) amongst the unemployed preferred to enquire at
a workplace. Over the period, the largest increase for a job search method was amongst those
unemployed who searched the internet and job adverts (11,3 percentage points each).
Over the period 2009 to 2015, the number of long-term unemployed persons increased by
828 000, accounting for 88,0% of the increase in the total number of the unemployed. Those who
have been unemployed for more than 5 years increased from just over 1 million to 1,5 million over
the period.
Persons with less than a matric qualification accounted for 59,1% of the long-term unemployed in
2015, down from 62,4% in 2009. The share of persons with a Tertiary qualification amongst the
long-term unemployed increased from 4,7% in 2009 to 7,0% in 2015.
The incidence of long-term unemployment was highest in 2015 amongst those aged 55–64 years
at 69,6%, this age group also reflected the largest increase over the period (13,3 percentage
points). While the incidence is higher amongst women, the gender gap narrowed over the period.
Similarly, the incidence of long-term unemployment is higher amongst black Africans, but the
disparity relative to the white population group declined over the period.
Provincial variations in the incidence of long-term unemployment is once again evident with the
highest incidence in the Gauteng in 2015 (71,6%) and the lowest in the Northern Cape (53,6%).
The incidence of long-term unemployment for those without prior work experience was higher
compared to unemployed persons who had worked before. In addition, between 2009 and 2015,
the incidence of long-term unemployment increased from 77,9% to 80,3% for those with no prior
work experience.
Youth in the labour market
The number of young people in the working age population increased from 18,5 million in 2009 to
19,8 million in 2015, as the number of unemployed and discouraged youth increased (371 000 and
470 000 respectively). The share of youth employed in the formal sector declined from 72,0% in
2009 to 70,3% in 2015, while the share of those employed in private households decreased (from
6,4% to 5,3%) and the share of those in the informal sector increased (from 16,4% to 17,9%).
Youth unemployment rates remain elevated and were more than double the rates of adults. In
2015 the youth unemployment rate was 35,8% while amongst adults it was 16,3%.
In 2015, close to a quarter of youth were employed in Trade (24,0%) followed by Community and
Social Services (18,5%) and Finance (15,3%). In addition, 25,6% of youth were employed in
Elementary occupations, 18,6% in Sales and 13,3% in Craft.
The education profile of the employed youth improved over the period, as the share of youth with a
tertiary qualification amongst the employed increased by 1,1 percentage points. Similarly among
unemployed youth, however in 2015 youth with less than a matric qualification still accounted for
54,8% of all unemployed youth.

Statistics South Africa 02-11-02
Labour market dynamics in South Africa, 2015
Young women (aged 15–34 years) in the labour force are better educated than young men.
Amongst employed young women, 22,8% had a tertiary qualification and 39,8% a matric,
compared to 14,1% and 36,0% respectively among young employed men. The unemployment rate
for youth with a tertiary qualification is more than half that of young persons with a qualification
lower than matric. However the youth unemployment rate for those with a tertiary qualification
increased by 5,0 percentage points to 20,3% in 2015, the largest increase amongst all the
educational groupings.
Nationally 50,9% of unemployed youth had no previous work experience and this ranged from a
high of 56,5% in Gauteng to a low of 35,4% in the Northern Cape.
In 2015, 66,8% of discouraged young work seekers possessed less than a matric qualification,
however discouragement has increased amongst those with a tertiary and matric qualification over
the period. A provincial analysis in 2015, shows that the share of discouragement, within
provinces, was highest amongst youth in Limpopo and Easter Cape (12,0% each) and lowest for
youth in the Western Cape (1,4%).
Between 2013 and 2015, the NEET rate declined for those aged 19–24 years, but was highest in
2015 amongst the 24-year olds (51,2%).
Between 2013 and 2015, the NEET rate for youth aged 15–24 years increased amongst only
Indian/Asian youth (5,9 percentage points), but remained highest amongst black African youth at
31,7%. In 2015 the NEET rate was highest in the Northern Cape (36,5%) and lowest in Limpopo
(27,3%), with the NEET rate increasing in the Northern Cape and Free State. The largest decline
over the period was in the North West (5,1 percentage points).

Chapter 1Introduction


Statistics South Africa 02-11-02
Labour market dynamics in South Africa, 2015
1-2
Table of contents
Chapter 1: Introduction ................................................................................................................................ 3 Background .................................................................................................................................................. 3 Objective ...................................................................................................................................................... 3 Data sources ................................................................................................................................................ 3 Cautionary note............................................................................................................................................ 3 Layout of the remainder of the report .......................................................................................................... 3 Chapter 2: Labour market dynamics ........................................................................................................... 3 Chapter 3: The South African labour market ............................................................................................... 4 Chapter 4: Employment and other forms of work ........................................................................................ 4 Chapter 5: A profile of the unemployed ....................................................................................................... 4 Chapter 6: Youth in the South African labour market .................................................................................. 4 Appendices .................................................................................................................................................. 4

Statistics South Africa 02-11-02
Labour market dynamics in South Africa, 2015
1-3
Chapter 1: Introduction
Background
The Quarterly Labour Force Survey (QLFS) is a household-based sample survey conducted by
Statistics South Africa (Stats SA) which collects information about the labour market activities of
individuals aged 15 years or older who live in South Africa. Prior to the introduction of the QLFS in
2008, the Labour Force Survey (LFS) was the major source of labour market information. The LFS
was conducted in March and September each year over the period 2000–2007 and replaced the
annual October Household Survey (OHS) as the principal vehicle for collecting labour market
information.
This report is the eighth annual report produced by Stats SA on the labour market in South Africa. The
report includes, for the fourth time, an analysis of labour market dynamics (discussed in Chapter 2).
As in previous reports, annual historical data are included in a statistical appendix.
Objective
The objective of this report is to analyse the patterns and trends of annual labour market results over
the period 2009 to 2015.
Data sources
Quarterly Labour Force Survey – 2009 to 2015 (average of the results for Quarters 1 to 4 of each
year).
Cautionary note
Mining: Caution is required when making conclusions based on the industrial profile of employed
persons since the clustered nature of the Mining industry means that it might not have been
adequately captured by the QLFS sample. Alternative mining estimates are also included in the
Quarterly Employment Statistics (QES).
2013 Master Sample: In 2015, Stats SA introduced a new master sample based on the Census 2011
data (2013 Master Sample). A number of improvements were introduced, including efforts to improve
Mining estimates through the inclusion of Mining strata in provinces where employment in this
industry was more than 30% of total employment. In addition, estimates of labour market indicators at
a metro level was also published for the first time.
Layout of the remainder of the report
Chapter 2: Labour market dynamics
The Quarterly Labour Force Survey (QLFS) conducted every quarter since 2008, which through its
design tracks individuals from one quarter to the next, makes it possible to create and analyse panel
data. The analysis in this chapter focuses on the national and provincial retention and transition rates
as well as the distribution of those who found employment between two consecutive quarters. The
trends in transition and retention rates are also analysed for the period 2010 to 2015, focusing on the
Q3–Q4 QLFS panel for each of these years.
Statistics South Africa 02-11-02
Labour market dynamics in South Africa, 2015
1-4
Chapter 3: The South African labour market
This chapter first analyses the working-age population in the context of the overall population and
then focuses on dependency ratios over the period 2009 to 2015. The composition of the working-age
population by socio-demographic characteristics such as age, population group, gender and level of
education is then analysed. Summary labour market measures, including the unemployment, labour
absorption and labour force participation rates shed light on the impact that the recent global financial
crisis has had on various groups. When disaggregated by gender, population group, age, level of
education and province, these measures underscore the vulnerability of several groups in the South
African labour market.
Chapter 4: Employment and other forms of work
The objective of this chapter is to analyse employment outcomes in the South African labour market.
The analysis focuses on trends in employment over the period 2009 to 2015 with respect to the socio-
demographic characteristics of individuals (age, sex, population group and education), as well as the
distribution by province, industry and occupation. Employment patterns and trends in the formal and
informal sectors are analysed for various groups. This is followed by a comparison of the formal
sector employment results based on the Quarterly Labour Force Survey with those based on the
Quarterly Employment Statistics. Subsequent sections of the chapter focus on other aspects of
employment, such as: hours worked; earnings; decent work; job-tenure; government job creation
programmes and other forms of work.
Chapter 5: A profile of the unemployed
The analysis in this chapter first focuses on the demographic characteristics of the unemployed as
well as their types of job-search activities. This is followed by a discussion of unemployment duration
for the period 2009 to 2015. The incidence of long-term unemployment is then analysed in the context
of sex, population group, age, educational attainment and province. The chapter concludes with an
analysis of the job-search methods used by the unemployed.
Chapter 6: Youth in the South African labour market
This chapter focuses on the labour market situation of youth aged 15–34 years. The patterns and
trends of key labour market indicators over the period 2009 to 2015 are analysed. The chapter then
discusses the characteristics of employed, unemployed and discouraged youth as well as those that
are Not in Employment, Education or Training (NEET) (2013–2015).
Appendices
Appendix 1: Technical notes
Appendix 2: Statistical tables
Appendix 3: Panel data results

Chapter 2Labour market dynamics


Statistics South Africa 02-11-02
Labour market dynamics in South Africa, 2015
2-2
Table of contents
Chapter 2: Labour market dynamics ............................................................................................................ 3 Background .................................................................................................................................................. 3 Introduction .................................................................................................................................................. 3 Selected retention and transition rates ........................................................................................................ 4 Factors impacting on the speed of transition ............................................................................................... 6 Rates by occupation and industry, sector and type of employment contract .............................................. 8 Contract types ............................................................................................................................................ 10 Provincial transition rates ........................................................................................................................... 12 Summary and conclusion ........................................................................................................................... 16

Statistics South Africa 02-11-02
Labour market dynamics in South Africa, 2015
2-3
Chapter 2: Labour market dynamics
What are panel data? Panel data are collected at different times for the same individuals or households. For
example, collecting information about whether a person is employed or not for the same person on a quarterly
basis over a number of years constitutes a panel.
The design of the QLFS enables the tracking of individuals across quarters. This means that, in principle, as many
as three out of every four (75%) individuals in the sample can be tracked between two consecutive quarters. The
results analysed in this chapter use data on matched individuals that were present in the sample between two
consecutive quarters using the following variables: name, surname, gender, age, and population group.
The value of a panel: Tracking individuals over time provides a better understanding of how their movements into
and out of employment, unemployment and inactivity change over time. One is also able to identify factors that can
increase the chances of finding employment. “More importantly, panel data allow a researcher to analyse a
number of important economic questions that cannot be addressed using cross-sectional or time series datasets.”1
Transition matrices: Transition matrices are tables that help us to understand the labour market movements of
matched individuals in a panel. In addition to looking at changes in the labour market status, movements between
different sectors and industries can also be analysed. These movements are expressed in percentages. If 2,0% of
employed persons in Q3: 2014 moved into unemployment in Q4: 2014, this percentage is referred to as the rate
of transition.
Retention rate: Refers to individuals who did not change their labour market state between two consecutive
quarters.
Background
Panel data have become widely available in both developed and developing countries. Such data are an important
source of information for policymakers as it allows for the analyses of a number of important socio-demographic
and economic variables across time. The Quarterly Labour Force Survey is a rotational panel dataset that allows
for the tracking of individuals in the sample across quarters, making it possible to analyse labour market outcomes
(employed, unemployed and inactive) of respondents on a quarterly basis.
The results from the “Labour market dynamics in South Africa, 2014” report indicated that the employed were more
likely to remain employed. In 2014, 93,0% remained in employment. The analysis in the report identified that
certain factors hinder the transition into employment for those without jobs; in particular lack of experience, being
female as well as for young persons. For the purpose of this report, further analysis on these variables will be done
to show trends over the period 2010 to 2015.
Introduction
This chapter examines changes in three labour market states (employed, unemployed and inactive) of the same
individuals from one quarter to another over the period 2010 to 2015. The movement into and out of the three
labour market states is regarded as transition, while a person can also remain in the same labour market state
(retention). The focus is predominantly on national and provincial retention and transition rates between the third
and fourth quarters of 2015, while the trends in transition and retention rates are analysed over the period 2010 to
2015.
1 Analysis of Panel Data, second edition, Cheng Hsiao, 2003

Statistics South Africa 02-11-02
Labour market dynamics in South Africa, 2015
2-4
Selected retention and transition rates
The analysis of labour market retention and transition rates between various labour market states (employment,
unemployment and inactivity) over the third and fourth quarters of 2010 and 2015 is undertaken in this section. The
analysis tries to identify whether the transition rates into employment have improved after the economic crisis.
Table 2.1: Retention and transition rates by labour market status, 2010 and 2015
Employed Unemployed Not economically
active (NEA)
Total
Labour market status in Q4: 2010
Labour market status in Q3: 2010 Thousand
Employed 12 819 358 471 13 648
Unemployed 478 3 116 1 061 4 655
Not economically active 454 826 13 451 14 731
Working‐age population 13 752 4 300 14 982 33 033
Retention and transition rates by labour market status between Q3 and Q4:
2010
Employed 93,9 2,6 3,5 100,0
Unemployed 10,3 66,9 22,8 100,0
Not economically active 3,1 5,6 91,3 100,0
Employed Unemployed Not economically
active (NEA)
Total
Labour market status in Q4: 2015
Labour market status in Q3: 2015 Thousand
Employed 14 763 504 561 15 828
Unemployed 688 3 656 1 074 5 418
Not economically active 538 871 13 459 14 867
Working‐age population 15 990 5 030 15 094 36 114
Retention and transition rates by labour market status between Q3 and Q4:
2015
Employed 93,3 3,2 3,5 100,0
Unemployed 12,7 67,5 19,8 100,0
Not economically active 3,6 5,9 90,5 100,0
Table 2.1 shows that 93,3% of persons who were employed in Q3: 2015 retained their jobs in Q4: 2015 while 3,2%
of those who were employed moved into unemployment. Among the employed, 3,5% moved into the not
economically active population in both 2010 and 2015. In 2015, 67,5% of those who were unemployed remained
without jobs, an increase from 66,9% in 2010, while 19,8% moved out of unemployment into inactivity, and 12,7%
found jobs, which is an increase from the 10,3% recorded in 2010. In terms of the not economically active, 90,5%
remained in the same labour market state, while 3,6% moved into employment, which is an increase from 3,1% in
2010, while 5,9% moved into unemployment.

Statistics South Africa 02-11-02
Labour market dynamics in South Africa, 2015
2-5
Figure 2.1: Transition rates into employment for the unemployed, discouraged and other not economically
active, 2010–2015
Note: Only Q3–Q4 for each year is analysed.
Over the period 2010–2015, among persons who did not have jobs, the unemployed had a better chance of finding
employment when compared to those who were discouraged and inactive. The transition rate into employment
among the unemployed was higher relative to other groups, ranging between 10,3% and 13,1%, and this finding
was consistent throughout the years. While the transition rate into employment increased between 2010 and 2015
across all labour market statuses, the inactive were the less likely to find a job, as their transition rate was the
lowest at 2,5% in 2015.
Figure 2.2: Retention rates by labour market status,
2010 and 2015
Figure 2.3: Provincial employment retention rates,
2010 and 2015
Note: Q3–Q4 for each year is analysed.
While the unemployment retention rate was lower compared to the employed and not economically active in both
2010 and 2015 (66,9% and 67,5% respectively), it was the only labour market state where the retention rate
increased over the period (0,5 of a percentage point) (Figure 2.2).

Statistics South Africa 02-11-02
Labour market dynamics in South Africa, 2015
2-6
Between 2010 and 2015, provincial employment retention rates increased in four of the nine provinces in the
country, of which the largest increase was in the Limpopo (2,7 percentage points), while Free State recorded the
largest decline of 3,2 percentage points. Although Limpopo recorded the largest increase in the retention rate
between 2010 and 2015, the rate was below the national rate of 93,3% and the fourth lowest amongst all
provinces. The Western Cape (96,2%), KwaZulu-Natal (94,7%) and Mpumalanga (94,0%) were the provinces
where the employment retention rates increased over the period and the rates in 2015 were also higher than the
national average.
Figure 2.4: Provincial retention and transition rates in the informal sector, Q3: 2015–Q4: 2015
Note: “Other employment” refers to Agriculture and Private households.
Figure 2.4 highlights the provincial variation in the retention and transition rates in the informal sector in 2015.
Between Q3: 2015 and Q4: 2015, the informal sector retention rate was highest in KwaZulu-Natal at 73,8%
followed by Free State (71,2%), while Northern Cape recorded the lowest retention rate (51,4%). In all provinces,
with the exception of North West, those in the informal sector found jobs in the Agriculture or Private household
sectors (other employment) in Q4: 2015.
In South Africa, 68,2% of people who worked in the informal sector in Q3: 2015 retained their jobs in Q4: 2015
while 17,1% found a formal-sector job and 1,4% found jobs in other employment (Agriculture or Private
households). Thus, the informal sector serves as a stepping stone into the formal sector. In most provinces, the
share of the informally employed who found a formal-sector job was higher than the share of those who moved out
of employment or found employment in the Agriculture or Private household sectors. The highest transition rate to
the formal sector was in Western Cape (26,3%) and the lowest in Limpopo (11,5%). The largest share of persons
who moved out of employment was in North West; 24,3% of those employed in the informal sector in Q3: 2015 in
North West became either unemployed or economically inactive in Q4: 2015.
Factors impacting on the speed of transition
Policymakers have increasingly placed emphasis on assisting the unemployed or those who are out of the labour
force to find employment. However, there are a number of factors that can impede the process of finding a job.
Unemployment is disproportionally higher amongst young people relative to the average working population. In

Statistics South Africa 02-11-02
Labour market dynamics in South Africa, 2015
2-7
addition, prior work experience and higher levels of education or training have consistently been associated with
the successful transition into employment as they improve the chances of finding a job.
Figure 2.5: Transition into employment by various
labour market groups, 2010 and 2015
Figure 2.6: Transition into employment by level of
education, 2010 and 2015
Note: Q3–Q4 for each year is analysed.
Between 2010 and 2015, the transition rate into employment amongst those without a job increased by 1,2
percentage points, as 6,0% of those who did not have job in Q3: 2015 found a job in Q4: 2015. For both men and
women, the transition rate for those without jobs increased over the period. In 2015, a higher percentage of men
(7,2%) found employment relative to women (5,2%), constituting an increase of 1,3 percentage points and 1,1
percentage points respectively. In addition, the analysis shows that in 2015, youth without a job (4,9%) had a lower
transition rate into employment when compared with adults (8,2%), while for both groups the transition rate into
employment increased between 2010 and 2015. Those without work experience are less likely to find a job
compared to those with previous work experience; however, between 2010 and 2015, the transition rates increased
for both groups. In 2015, those with work experience were more than three times more likely to find a job compared
to those without work experience; 10,7% of those with experience found jobs compared to only 2,9% of those
without work experience.
Figure 2.6 shows that those with a higher level of education have a better chance of finding employment when
compared to those with a lower level of education. Between 2010 and 2015, the transition rate into employment for
those without jobs increased across all education categories. The largest increase was recorded among those who
completed their secondary education (2,0 percentage points), followed by persons with incomplete secondary and
primary and below levels of education (0,9 and 1,0 percentage points, respectively). In 2015, 8,0% of people
without a job who had a tertiary qualification found employment compared to 5,2% of those with an incomplete
secondary education.

Statistics South Africa 02-11-02
Labour market dynamics in South Africa, 2015
2-8
Retention and transition rates by occupation and industry, sector and type of
employment contract
This section analyses the retention and transition rates by occupation, industry and type of employment contract
over the period 2010 and 2015. Prior to 2015, caution is required when making conclusions based on the industrial
profile of employed persons, as the clustered nature of the Mining industry means that it might not have been
adequately captured by the QLFS sample. However, in the new master sample introduced in 2015, Mining was
included as a stratification variable in six of the nine provinces.
Figure 2.7: Retention and transition rates by broad
occupation groups, 2010 and 2015
Figure 2.8: Retention and transition rates by broad
industry, 2010 and 2015
Note: Q3–Q4 for each year is analysed.
In both 2010 and 2015, the occupation retention rate were highest among persons employed in skilled occupations
(88,5% and 87,0% respectively) when compared to those who were employed in semi-skilled and low-skilled
occupations . Figure 2.7 shows that those who are employed in skilled occupations were less likely to move out of
employment compared to those in semi-skilled and low-skilled occupations; only 2,9% of people employed in
skilled occupations moved out of employment in 2015 compared to 9,6% of those employed in low-skilled
occupations. Although the highest occupational retention rate was recorded among those employed in skilled
occupations in 2015, the group also had the highest transition rate into other occupations (10,1%).
The industry retention rates in 2010 and 2015 were highest among those employed in tertiary industries (91,2%
and 91,3%, respectively) when compared to secondary and primary industries. Although secondary industries had
the lowest retention rates, these industries also accounted for the highest transition rates to other industries as well
as the highest transition rates out of employment. Between the two quarters in 2015, 10,1% of persons who worked
in the secondary industries moved to other industries, while 8,9% moved out of employment.
Unemployment duration
The analysis in this section focuses on the transition into various labour market states in relation to the
unemployment duration over the period 2010 and 2015, particularly with respect to those in short-term
unemployment (unemployed for less than a year) and those in long-term unemployment (unemployed for a year or
longer).

Statistics South Africa 02-11-02
Labour market dynamics in South Africa, 2015
2-9
Figure 2.9: Transition rates from long-term and short-term unemployment, 2010 and 2015
Between 2010 and 2015, the retention rate amongst short-term and long-term unemployment increased; 59,7% of
those in the short-term unemployment in 2015 remained unemployed (up from 57,6% in 2010), while amongst the
long term-unemployed, 71,3% were still unemployed in 2015 (down from 71,6% in 2010). The results further show
that those in short-term unemployment had a better chance of finding employment when compared to those in the
long-term unemployment; 20,6% of the short-term unemployed in Q3: 2015 found employment in Q4: 2015,
compared to only 8,9% amongst the long-term unemployed. The difference in the transition rates into employment
highlights the scarring effects associated with long-term unemployment, which negatively affect future employment
probabilities. The differences in terms of the transition rate into inactivity were less pronounced between the two
groups. In 2015, 19,7% of the short-term unemployed became inactive compared to 19,9% of the long-term
unemployed.

Statistics South Africa 02-11-02
Labour market dynamics in South Africa, 2015
2-10
Contract types
This section focuses on the retention and transition rates of employees by contract type over the period 2010 to
2015. Employees holding permanent contract types are more likely to remain on these contracts compared to those
having limited or unspecified contracts of employment.
Figure 2.10: Retention and transition into
employment of employees by contract duration,
Q3: 2015 – Q4: 2015
Figure 2.11: Retention and transition rates of
employees with limited duration contracts,
2010–2015
Note: “Other” refers to those who were employees in Q3: 2015 and became employers or own account workers in Q4: 2015.
Figure 2.10 shows that people employed on a permanent basis were more likely to remain in this same type of
employment in the subsequent quarter. Amongst employees who were employed on a permanent contract in the
third quarter of 2015, almost 90% retained the same contract in the next quarter. Only 6,7% of those who were
employed on a permanent basis moved to a different contract type. The results show that, among those employed
on a contract of limited or unspecified duration, more than 10,0% of employees for each contract type lost their
jobs, whereas only 2,6% of those who were employed on a permanent basis moved out of employment between
the two quarters. The retention rates among those with limited duration contracts were more than 50% throughout
the period 2010–2015. The percentage of those who moved from limited duration contracts to permanent contracts
declined from a high of 20,8% in 2010 to 14,5% in 2015. On the other hand, those who were employed on a limited
duration contract and moved out of employment in the subsequent quarter ranged between 11,0% and 15,0% over
the period 2010 and 2015.
Statistics South Africa 02-11-02
Labour market dynamics in South Africa, 2015
2-11
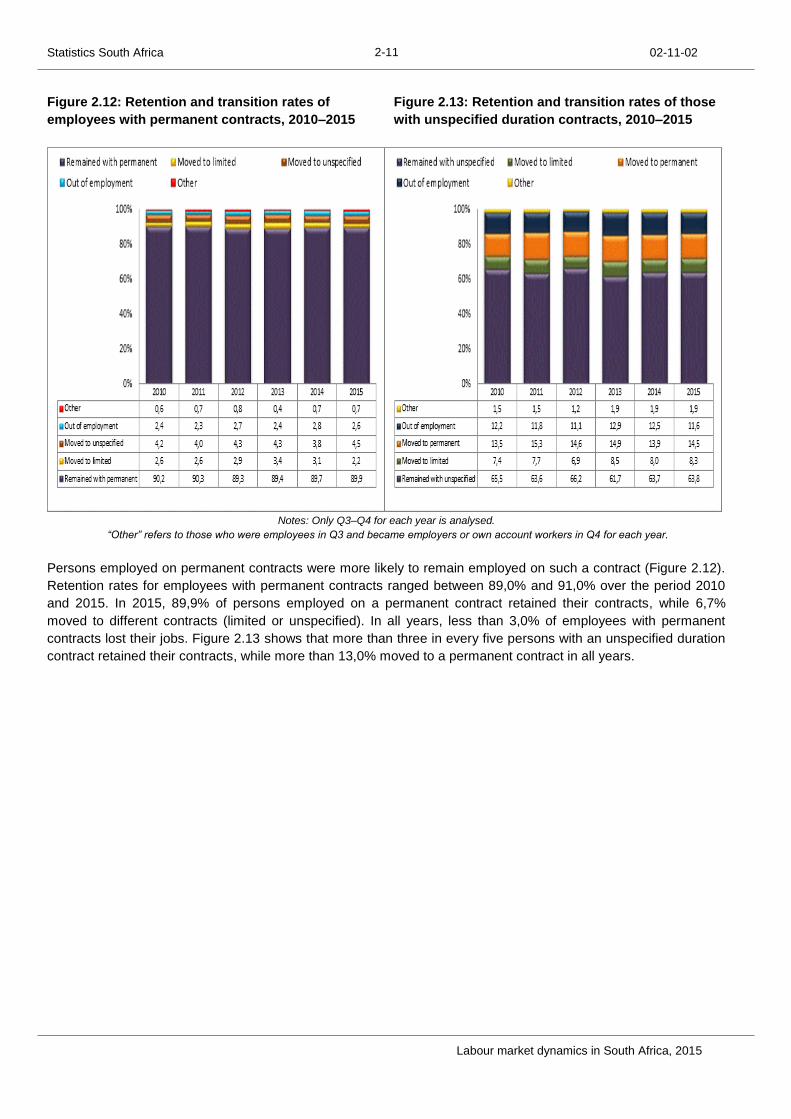
Figure 2.12: Retention and transition rates of
employees with permanent contracts, 2010–2015
Figure 2.13: Retention and transition rates of those
with unspecified duration contracts, 2010–2015
Notes: Only Q3–Q4 for each year is analysed.
“Other” refers to those who were employees in Q3 and became employers or own account workers in Q4 for each year.
Persons employed on permanent contracts were more likely to remain employed on such a contract (Figure 2.12).
Retention rates for employees with permanent contracts ranged between 89,0% and 91,0% over the period 2010
and 2015. In 2015, 89,9% of persons employed on a permanent contract retained their contracts, while 6,7%
moved to different contracts (limited or unspecified). In all years, less than 3,0% of employees with permanent
contracts lost their jobs. Figure 2.13 shows that more than three in every five persons with an unspecified duration
contract retained their contracts, while more than 13,0% moved to a permanent contract in all years.
Statistics South Africa 02-11-02
Labour market dynamics in South Africa, 2015
2-12
Provincial retention and transition rates
The analysis in this section highlights the provincial variations in transition and retention rates over the period 2010
and 2015. The first part looks at the retention and transition rates within each labour market category, while the
second part focuses on all persons who were without jobs, irrespective of whether or not they looked for
employment. The analyses of the transition rates into employment for those without jobs (unemployed and inactive)
were presented by age, work experience and level of education.
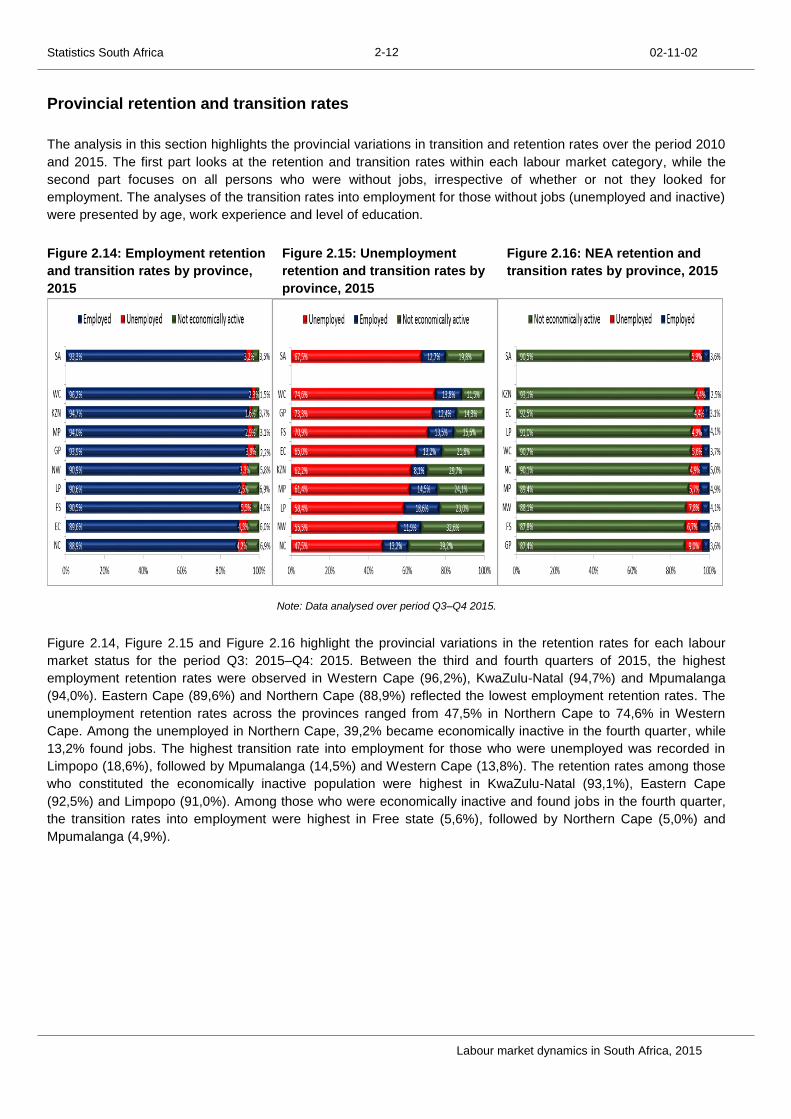
Figure 2.14: Employment retention
and transition rates by province,
2015
Figure 2.15: Unemployment
retention and transition rates by
province, 2015
Figure 2.16: NEA retention and
transition rates by province, 2015
Note: Data analysed over period Q3–Q4 2015.
Figure 2.14, Figure 2.15 and Figure 2.16 highlight the provincial variations in the retention rates for each labour
market status for the period Q3: 2015–Q4: 2015. Between the third and fourth quarters of 2015, the highest
employment retention rates were observed in Western Cape (96,2%), KwaZulu-Natal (94,7%) and Mpumalanga
(94,0%). Eastern Cape (89,6%) and Northern Cape (88,9%) reflected the lowest employment retention rates. The
unemployment retention rates across the provinces ranged from 47,5% in Northern Cape to 74,6% in Western
Cape. Among the unemployed in Northern Cape, 39,2% became economically inactive in the fourth quarter, while
13,2% found jobs. The highest transition rate into employment for those who were unemployed was recorded in
Limpopo (18,6%), followed by Mpumalanga (14,5%) and Western Cape (13,8%). The retention rates among those
who constituted the economically inactive population were highest in KwaZulu-Natal (93,1%), Eastern Cape
(92,5%) and Limpopo (91,0%). Among those who were economically inactive and found jobs in the fourth quarter,
the transition rates into employment were highest in Free state (5,6%), followed by Northern Cape (5,0%) and
Mpumalanga (4,9%).

Statistics South Africa 02-11-02
Labour market dynamics in South Africa, 2015
2-13
Figure 2.17: Provincial transition rates into
employment among youth (15–34 years), 2010 and
2015
Figure 2.18: Provincial transition rates into
employment among adults (35–64 years), 2010 and
2015
Note: Only Q3–Q4 for each year is analysed.
Figures 2.17 and 2.18 indicate that the national transition rate into employment for adults who were without jobs
(unemployed and inactive) was higher than that of youth in both 2010 and 2015. The youth transition rate into
employment increased by 0,9 of a percentage point (from 4,0% in 2010 to 4,9% in 2015), while the rate for adults
increased by 1,8 percentage points to reach 8,2% in 2015. The transition rates into employment for adults
increased in all provinces with the exception of KwaZulu-Natal, Eastern Cape and Northern Cape. The largest
increase in the adult transition rate into employment was observed in Free State (5,8 percentage points), followed
by Mpumalanga (4,5 percentage points) and North West (3,3 percentage points). The rate remained unchanged at
7,6% in Northern Cape, while KwaZulu-Natal and Eastern Cape declined by 0,1 of a percentage point each. Four
out of nine provinces experienced a decline in the youth transition rate into employment (Figure 2.17). The largest
decline was observed in Western Cape (1,7 percentage points), while in Northern Cape, KwaZulu-Natal and
Limpopo the decline was less than a percentage point each. The largest increase in the youth transition rate into
employment was in Gauteng, which ranked the province second highest in 2015.
Statistics South Africa 02-11-02
Labour market dynamics in South Africa, 2015
2-14
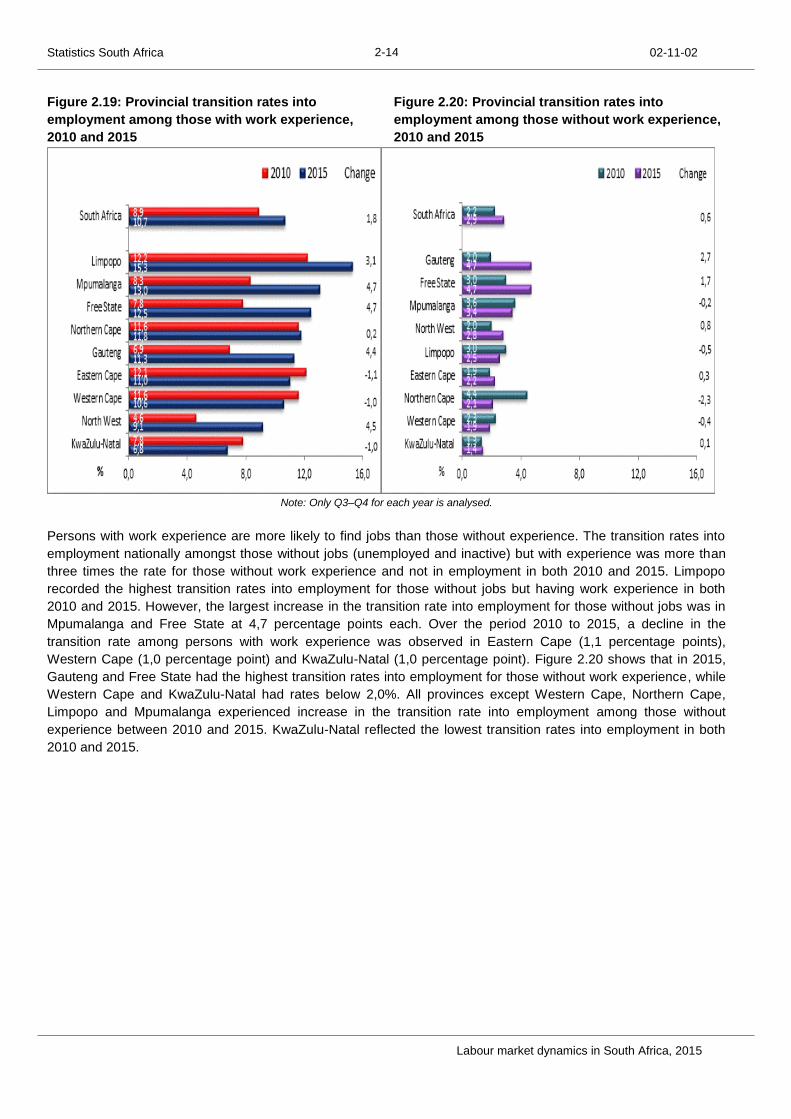
Figure 2.19: Provincial transition rates into
employment among those with work experience,
2010 and 2015
Figure 2.20: Provincial transition rates into
employment among those without work experience,
2010 and 2015
Note: Only Q3–Q4 for each year is analysed.
Persons with work experience are more likely to find jobs than those without experience. The transition rates into
employment nationally amongst those without jobs (unemployed and inactive) but with experience was more than
three times the rate for those without work experience and not in employment in both 2010 and 2015. Limpopo
recorded the highest transition rates into employment for those without jobs but having work experience in both
2010 and 2015. However, the largest increase in the transition rate into employment for those without jobs was in
Mpumalanga and Free State at 4,7 percentage points each. Over the period 2010 to 2015, a decline in the
transition rate among persons with work experience was observed in Eastern Cape (1,1 percentage points),
Western Cape (1,0 percentage point) and KwaZulu-Natal (1,0 percentage point). Figure 2.20 shows that in 2015,
Gauteng and Free State had the highest transition rates into employment for those without work experience, while
Western Cape and KwaZulu-Natal had rates below 2,0%. All provinces except Western Cape, Northern Cape,
Limpopo and Mpumalanga experienced increase in the transition rate into employment among those without
experience between 2010 and 2015. KwaZulu-Natal reflected the lowest transition rates into employment in both
2010 and 2015.

Statistics South Africa 02-11-02
Labour market dynamics in South Africa, 2015
2-15
Figure 2.21: Provincial transition rates into
employment among those with education levels
below matric, 2010 and 2015
Figure 2.22: Provincial transition rates into
employment among those with matric, 2010 and
2015
Note: Only Q3–Q4 for each year is analysed.
Education plays an important role in improving the chances of finding a job. Figures 2.21 and 2.22 indicate that
among those without jobs (unemployed and inactive), the better educated have a higher chance of moving from
unemployment and inactivity into employment. The transition rate into employment for those without jobs with
levels of education below matric nationally increased from 4,6% in 2010 to 5,5% in 2015. In all provinces except
Northern Cape and KwaZulu-Natal, the transition rates into employment increased among those with less than a
matric education over the period 2010 and 2015. Among those with matric, the rate increased by 2,0 percentage
points from 5,3% in 2010 to 7,3% in 2015. Free State, Northern Cape and North West reflected the highest
transition rates into employment in 2015. The transition rates into employment for those without a job and who have
a matric education declined only in Western Cape (4,0 percentage points), Northern Cape (1,2 percentage points)
and Eastern Cape (0,5 of a percentage point). The largest increase in the rate was observed in Free State (8,0
percentage points), followed by North West (6,6 percentage points) and Gauteng (4,5 percentage points).

Statistics South Africa 02-11-02
Labour market dynamics in South Africa, 2015
2-16
Figure 2.23: Provincial transition rates into employment among those with tertiary education levels, 2010
and 2015
Note: Only Q3–Q4 for each year is analysed. North West was dropped due to a small sample size for 2010.
In 2015, the transition rate into employment for those with a tertiary education was highest in Mpumalanga,
followed by Limpopo and Northern Cape. Northern Cape (5,2 percentage points) and Mpumalanga (4,9 percentage
points) reflected the largest increase in the transition rates over the period 2010 and 2015. The transition rate for
those in Gauteng increased by 2,4 percentage points from 7,4% in 2010 to 9,8% in 2015. A decline in the transition
rates was observed in Eastern Cape (5,6 percentage points), Western Cape (2,7 percentage points) and KwaZulu-
Natal (1,3 percentage points).
Summary and conclusion
Those who are unemployed are more likely to find employment when compared to those who were
discouraged and economically inactive. A provincial comparison finds that the highest employment
retention rates were in Western Cape followed by KwaZulu-Natal.
Transition rates into employment are higher for men compared to women.
Employees employed in skilled occupations were more likely to remain in the same occupation compared
to those employed in semi-skilled and low-skilled occupation. Retention rates amongst those employed in
tertiary industries were also higher relative to those employed in primary and secondary industries.
The short-term unemployed are three times more likely to find employment on a quarterly basis compared
to persons in long-term unemployment.
Persons employed on permanent contracts were more likely to remain employed on such a contract
compared to those with limited or an unspecified type of contract.
The unemployed are less likely to remain in the same status relative to those who are employed and those
who are economically inactive.
The transition rates into employment for adults without jobs (unemployed or inactive) were higher than the
rates for youth in all provinces except in Northern Cape. In both 2010 and 2015, Northern Cape recorded
the highest transition rates into employment for youth who were without jobs relative to the rates for adults.
Persons without jobs but having previous work experience are more likely to find employment than those
without work experience.
Education improves the chances of finding employment. Nationally, the transition rates into employment for
those without jobs having tertiary education were higher, followed by those with a matric education.
Chapter 3The South African labour market


Statistics South Africa 02-11-02
Labour market dynamics in South Africa, 2015
3-2
Table of contents
Chapter 3: The South African labour market ............................................................................................... 3 Background .................................................................................................................................................. 4 Introduction .................................................................................................................................................. 4 The components of the working-age population.......................................................................................... 5 Labour market rates ..................................................................................................................................... 9 Summary and conclusion .......................................................................................................................... 13

Statistics South Africa 02-11-02
Labour market dynamics in South Africa, 2015
3-3
Chapter 3: The South African labour market
Key labour market concepts The working-age population comprises everyone aged 15–64 years who fall into each of the three
labour market components (employed, unemployed, not economically active). Employed persons are those who were engaged in market production activities in the week prior to the
survey interview (even if only for one hour) as well as those who were temporarily absent from their activities. Market production employment refers to those who:
a) Worked for a wage, salary, commission or payment in kind. b) Ran any kind of business, big or small, on their own, or with one or more partners. c) Helped without being paid in a business run by another household member. In order to be considered unemployed based on the official definition, three criteria must be met
simultaneously: a person must be completely without work, currently available to work, and taking active steps to find work. The expanded definition relaxes the requirement to have taken active steps to find
work. If a person is working or trying to find work, he/she is in the labour force. Thus the number of people that
are employed plus those who are unemployed constitute the labour force or economically active population. A person who reaches working age may not necessarily enter the labour force. He/she may remain outside the labour force and would then be regarded as inactive (not economically active). This
inactivity can be voluntary – if the person prefers to stay at home or to begin or continue education – or involuntary, where the person would prefer to work but is discouraged and has given up hope of finding
work. Not economically active persons are those who did not work in the reference week because they either
did not look for work or start a business in the four weeks preceding the survey or were not available to start work or a business in the reference week. The not economically active is composed of two groups: discouraged work-seekers and other (not economically active, as described above). Discouraged work-seekers are persons who wanted to work but did not try to find work or start a
business because they believed that there were no jobs available in their area, or were unable to find jobs requiring their skills, or they had lost hope of finding any kind of work. Discouraged work-seekers and other (not economically active) are counted as out of the labour force under international guidelines as they were not looking for work and were not available for work. The unemployment rate measures the proportion of the labour force that is trying to find work.
The labour force participation rate is a measure of the proportion of a country's working-age population
that engages actively in the labour market, either by working or looking for work; it provides an indication of the relative size of the supply of labour available to engage in the production of goods and services (ILO, KILM 2013). The absorption rate (employment-to-population ratio) measures the proportion of the working-age
population that is employed.
Statistics South Africa 02-11-02
Labour market dynamics in South Africa, 2015
3-4
Background
This chapter analyses the patterns and trends in the working-age population over the period 2009–2015 in
the context of South Africa’s youthful population and the benefits of a growing working age population which
is educated and can repeat the benefits of a demographic dividend. Key labour market rates are analysed
with respect to socio-demographic variables such as age, gender, population group and level of educational
attainment.
Introduction
The ILO publication entitled “World Employment Social Outlook, 2016” highlights the fact that the projected
slowdown in economic growth will complicate the task of meeting demographic challenges. Slowing growth
particularly in sub-Saharan Africa and, in South Africa, places workers at risk. Globally, lower growth rates
have resulted in the number of unemployed reaching 197,1 million in 2015, 27 million higher than the pre-
crisis level. Working poverty is set to rise and a slowdown in the growth of the middle class may add to
possible social unrest. The ILO recommends that policy focus be directed towards strengthening labour
market institutions, to “ensure that social protection systems are well designed in order to prevent further
increases in long-term unemployment, underemployment and working poverty”.
Benefiting from a growing working age population without the necessary investments in quality education
may prevent South Africa from achieving a “demographic dividend”, a situation characterised by accelerated
economic growth as fertility rates decline. The South African working age population is characterised by a
youthful population, however labour market outcomes for the youth remain poor.
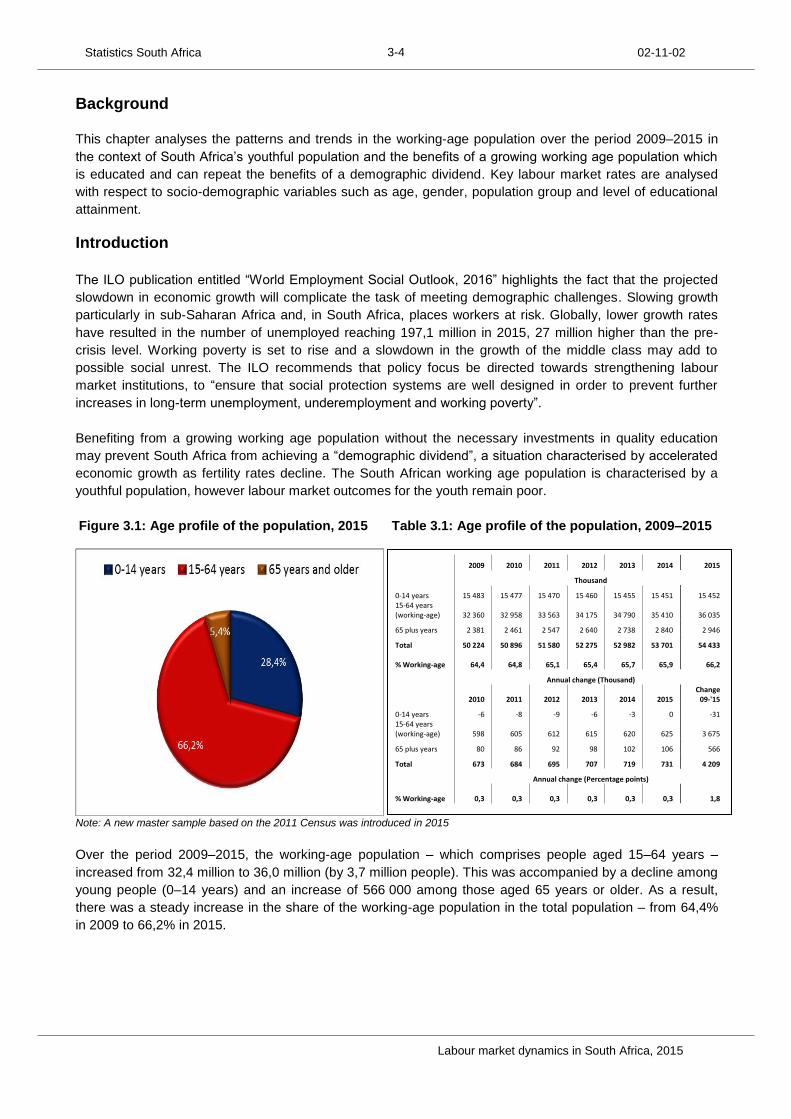
Figure 3.1: Age profile of the population, 2015 Table 3.1: Age profile of the population, 2009–2015
Note: A new master sample based on the 2011 Census was introduced in 2015
Over the period 2009–2015, the working-age population – which comprises people aged 15–64 years –
increased from 32,4 million to 36,0 million (by 3,7 million people). This was accompanied by a decline among
young people (0–14 years) and an increase of 566 000 among those aged 65 years or older. As a result,
there was a steady increase in the share of the working-age population in the total population – from 64,4%
in 2009 to 66,2% in 2015.
2009 2010 2011 2012 2013 2014 2015
Thousand
0-14 years 15 483 15 477 15 470 15 460 15 455 15 451 15 452 15-64 years (working-age) 32 360 32 958 33 563 34 175 34 790 35 410 36 035
65 plus years 2 381 2 461 2 547 2 640 2 738 2 840 2 946
Total 50 224 50 896 51 580 52 275 52 982 53 701 54 433 % Working-age 64,4 64,8 65,1 65,4 65,7 65,9 66,2
Annual change (Thousand)
2010 2011 2012 2013 2014 2015
Change 09-'15
0-14 years -6 -8 -9 -6 -3 0 -31 15-64 years (working-age) 598 605 612 615 620 625 3 675
65 plus years 80 86 92 98 102 106 566
Total 673 684 695 707 719 731 4 209
Annual change (Percentage points) % Working-age 0,3 0,3 0,3 0,3 0,3 0,3 1,8

Statistics South Africa 02-11-02
Labour market dynamics in South Africa, 2015
3-5
Figure 3.2: Working-age population as a percentage of the total population, 2009 and 2015
Table 3.2: Age dependency ratio, 2009–2015
Note: A new master sample based on the 2011 Census was introduced in 2015
Trends in the working age population varies by population group. In both 2009 and 2015, the working age
population as a share of the total population was lowest amongst black Africans, however this share
increased by 2,3 percentage points over the period 2009 to 2015 (Figure 3.2). The decline in the overall
dependency rate has been supported by a decline in the child dependency rate from 47,8% in 2009 to 42,9%
in 2015.
The components of the working-age population
An analysis of the components of the working age population (i.e. the employed, unemployed and not
economically active) provides insights into the factors which drive the supply and demand of labour and the
policies which can be developed to assist in increasing participation in the labour market.
The shares of the three groups in the working-age population reported in this section should be interpreted
with caution. With regard to unemployment, caution should be exercised in interpreting the percentages, as
the numbers relate to the percentage of the working-age population and not to the labour force (the latter
comprises the employed plus the unemployed) which is the basis for calculating the unemployment rate
(presented in the section that follows). And it should also be noted that the share of the working-age
population that is employed is referred to as either the employment-to-population ratio or the absorption rate
(also presented in the section that follows).
Table 3.3: Working-age population by sex, 2009–2015 2009 2010 2011 2012 2013 2014 2015
Thousand
Men 15 758 16 087 16 419 16 753 17 088 17 424 17 762
Women 16 602 16 871 17 145 17 422 17 702 17 986 18273
Working-age population 32 360 32 958 33 563 34 175 34 790 35 410 36 035
Per cent
Share of women in the working-age population 51,3 51,2 51,1 51,0 50,9 50,8 50,7
Note: A new master sample based on the 2011 Census was introduced in 2015
Over the period 2009 to 2015 the share of women in the working age population declined from 51,3% to
50,7%. The number of men in the working age population increased from 15,8 million in 2009 to reach 17,8
million in 2015.
Child dependency
ratio
Old age dependency
ratio
Overall dependency
ratio
Per cent
2009 47,8 7,4 55,2
2010 47,0 7,5 54,4
2011 46,1 7,6 53,7
2012 45,2 7,7 53,0
2013 44,4 7,9 52,3
2014 43,6 8,0 51,7
2015 42,9 8,2 51,1
Child refers to those aged 0 to 14 years and old age refers to those 65 years and older

Statistics South Africa 02-11-02
Labour market dynamics in South Africa, 2015
3-6
Table 3.4: Labour market status of the working-age population, 2009–2015
2009 2010 2011 2012 2013 2014 2015
Thousand Employed 14 194 13 788 14 070 14 425 14 866 15 146 15 741 Unemployed 4 403 4 564 4 636 4 775 4 886 5 070 5 344 Discouraged 1 535 2 026 2 252 2 314 2 331 2 422 2 334 Other not economically active 12 228 12 579 12 605 12 661 12 708 12 771 12 616 Working-age population 32 360 32 958 33 563 34 175 34 790 35 410 36 035 Annual change (Thousand)
2010 2011 2012 2013 2014 2015
Change 2009- 2015
Employed -406 282 355 441 281 594 1 547 Unemployed 161 72 139 111 184 274 941 Discouraged 491 226 62 17 92 - 88 799 Other not economically active 352 26 56 46 64 - 155 388 Working-age population 598 605 612 615 620 625 3 675
Note: A new master sample based on the 2011 Census was introduced 2015
Since 2011, the number of employed persons increased on an annual basis. Over the period 2009 to 2015,
the number of the employed increased by 1,5 million, outpacing the rise in the number of the unemployed
(941 000), while the number of discouraged work seekers and the economically inactive increased by
799 000 and 388 000, respectively over the period) (Table 3.4)
Figure 3.3: Components of the working-age by province, 2009 and 2015
NEA refers to the Not Economically Active population.
Provincial variations can be observed in the share of the components of the working age over the period
2009 to 2015. Figure 3.3 highlights that the employed as a share of the working age population ranges
from a high of 53,8% in 2015 in the Western Cape to a low of 33,5% in the Eastern Cape. Between 2009
and 2015, the share of the working age population who were inactive declined across all provinces, most
notably in Limpopo and Mpumalanga (8,2 and 6,3 percentage points respectively). In 2015, the share of

Statistics South Africa 02-11-02
Labour market dynamics in South Africa, 2015
3-7
the working age who were economically inactive was highest in Limpopo (43,7%) and lowest in Gauteng
(24,7%). The share of discouragement in the working age population also increased across all provinces,
the largest increase was observed in Limpopo and the North West (4,3 and 4,4 percentage points,
respectively).
Figure 3.4: Components of the working-age population by population group, 2009 and 2015
Figure 3.5: Components of the working-age population by age group, 2009 and 2015
NEA refers to the Not Economically Active population.
Figure 3.4 highlights that between 2009 and 2015 the share of the employed in the working age population
increased only amongst the black African population group (from 39,7% to 40,6%), while declining amongst
all other population groups. Over the period the share of the unemployment increased amongst all population
groups, most notably amongst the coloured population group (1,6 percentage points). The share of
discouragement amongst all population groups increased, particularly amongst black Africans (1,9
percentage points). The share of employment amongst the youth aged 15–24 years is low, while inactivity is
high: in 2015; 13,3% of the working age youth (aged 15–24 years) were employed while 67,1% were
inactive. The share of discouragement is the highest amongst those aged 25–34 years; reaching 9,1% in
2015, and in addition this age group also accounted for the largest increase of discouraged work seekers
over the period (2,6 percentage points) (Figure 3.5).

Statistics South Africa 02-11-02
Labour market dynamics in South Africa, 2015
3-8
Figure 3.6: Components of the working-age population by education level, 2009 and 2015
NEA refers to the Not Economically Active population.
The share of unemployment in the working age amongst those with a matric is close to double that of a
person with a tertiary qualification. Between 2009 and 2015 the share of discouragement amongst all
educational categories increased, most notably amongst those with attainment below a matric qualification
(2,0 percentage points).
The share of employment in the working age declined amongst all the educational categories, the largest of
which was amongst persons with a tertiary qualification (5,0 percentage points). This educational grouping
also accounted for the largest increase in the share of unemployment over the period from 7,4% in 2009 to
10,2% in 2015.

Statistics South Africa 02-11-02
Labour market dynamics in South Africa, 2015
3-9
Figure 3.7: Working-age population by province and geo-type, 2015
Non-urban refers to Traditional and Farming settlement characteristics.
Mining in provinces where employment in Mining accounts for more than 30% of employment
Figure 3.7 highlights the variation in the distribution of the working age population in 2015 by province and
geo-type. In Limpopo only 18,0% of the working age population reside in urban areas, while in the more
urbanised provinces of Gauteng and the Western Cape, more than 90,0% of this group reside in these
areas.
Labour market rates
This section focuses on key labour market rates over the period 2009–2015 by province, sex, age,
population group and level of educational attainment. The analysis of the unemployment rate, the labour
absorption rate and the labour force participation rate provides a comprehensive picture of labour market
outcomes – particularly for vulnerable groups such as women, youth and the black African population.
Figure 3.8: Labour market rates and annual change in GDP at constant prices, 2008–2015
GDP refers to Gross Domestic Product (Right Hand Scale), URate off refers to the Official unemployment rate, URate exp refers to the Expanded unemployment rate. Absorption refers to the labour absorption rate, LFPR refers to the Labour Force Participation Rate. Note: A new master sample based on the 2011 Census was introduced in 2015

Statistics South Africa 02-11-02
Labour market dynamics in South Africa, 2015
3-10
The impact of the financial crisis was most pronounced in 2009 as economic growth contracted by 1,5% but
gradually increased till 2013, however since 2014 growth started slowing down till it reached 1,3% in 2015
(Figure 3.8). This slowdown in GDP has been accompanied by a rise in the unemployment rate which
increased from 24,8% in 2011 to 25,3% in 2015. In 2015, the expanded unemployment rate was 34,8%,
which was 5,1 percentage points higher than the 2008 rate. While the absorption rate increased above its
lowest of 41,8% in 2010, this rate at 43,7% in 2015 is still below the rate for 2008 of 45,9%; this was also a
similar case for the labour force participation rate which was 58,5% in 2015; but still below its highest
recorded for 2008 (which stood at 59,3%).
Figure 3.9: Unemployment rate by province, 2009 and 2015
Figure 3.10: Absorption rate by province, 2009 and 2015
Figure 3.11: Participation rate by province, 2009 and 2015
Note: Participation rate refers to the Labour Force Participation Rate.
Figures 3.9 to 3.11 examine the unemployment rates, absorption rates and labour participation rates by
province between 2009 and 2015.
Unemployment rates: Between 2009 and 2015, the official unemployment rates increased across all
provinces with the exception of Limpopo (6,5 percentage points) and the North West (1,5 percentage points)
(Figure 3.9). The largest increase in the unemployment rate over the period was in the Northern Cape (5,4
percentage points), and also in 2015 the unemployment rate was also the highest in this province.
Absorption rates: The provincial disparities in terms of employment can been seen by the range in the
absorption rate; from a high in 2015 of 53,8% in the Western Cape to a low of 33,5% in the Eastern Cape.
Limpopo, Mpumalanga and the Eastern Cape were the only three provinces where the absorption rates
increased over the period (with Limpopo recording the highest increase in the rate at 5,8 percentage points,
followed by Mpumalanga at 1,2 percentage points; and 0,2 percentage points in Eastern Cape). The largest
decline in the absorption rate over the period was in Gauteng (2,2 percentage points) (Figure 3.10).
Participation rates: Participation rates declined in three of the nine provinces, North West, KwaZulu-Natal
and the Western Cape. Between 2009 and 2015, the largest increases in the labour force participation rate
was in Limpopo (3,9 percentage points), and the Northern Cape and Free State (3,6 percentage points
respectively).

Statistics South Africa 02-11-02
Labour market dynamics in South Africa, 2015
3-11
Figure 3.12: Male labour market rates by population group, 2009 and 2015
Figure 3.13: Female labour market rates by population group, 2009 and 2015
Note: LFPR refers to the Labour Force Participation Rate.
Figure 3.12 and Figure 3.13 highlight the fact that women, regardless of race, still face higher unemployment
rates and lower absorption and participation rates relative to their male counter parts. In addition, both men
and women from the white population group have the lowest unemployment rates and highest absorption
and participation rates in both 2009 and 2015. Male participation rates increased amongst both black
Africans and the white population group, while amongst females, the rate declined amongst the white
population group (2,7 percentage points).
Male absorption rates declined amongst all population groups with the exception of black African population
(0,2 percentage points), while amongst females, the absorption rates declined for both the white and
coloured population groups (3,6 and 1,6 respectively). Between 2009 and 2015, male and female
unemployment rates increased across all population groups, the largest increase was however observed
amongst females, in particular among coloured and Indian females (3,4 and 3,2 percentage points
respectively).

Statistics South Africa 02-11-02
Labour market dynamics in South Africa, 2015
3-12
Figure 3.14: Unemployment rate by age, 2009 and 2015
Figure 3.15: Absorption rate by age, 2009 and 2015
Figure 3.16: Participation rate by age, 2009 and 2015
Figures 314 to 3.16 highlight that young people face higher unemployment rates and lower absorption and
participation rates relative to adults. In 2015, the unemployment rate of a young person aged 15–24 years
was more than five times that of a person aged 55–64 years. However between 2009 and 2015 the
unemployment rates increased amongst all age groups. The increase in unemployment rates was
accompanied by a decline in the absorption rates across all age groups, particularly amongst the youth below
the age of 34 years. Over the period 2009–2015, participation rates increased amongst all age groups with
the exception of those aged 15–24 years (where it declined by 1,4 percentage points).
Figure 3.17: Labour market rates by education level, 2009 and 2015
Note: LFPR refers to the Labour Force Participation Rate.
Figure 3.17 highlights that higher levels of education are associated with lower unemployment and higher
absorption and participation rates. Between 2009 and 2015, participation rates increased only amongst
persons with a below matric educational attainment (0,9 of a percentage point). Absorption rates declined

Statistics South Africa 02-11-02
Labour market dynamics in South Africa, 2015
3-13
across all three educational groups, the largest of which was amongst those with a tertiary qualification (5,0
percentage points), the increase in the unemployment rate was also the largest amongst this educational
grouping over the period (3,5 percentage points).
Summary and conclusion
Over the period 2009–2015, the working age population increased by 3,7 million to reach 36,0
million in 2015, with the share of the working age population (15–64 years) in the total population
increasing from 64,4% to 66,2% over the period.
While the share of the working age population who were employed increased over the period (1,5
million), the number of unemployed and discouraged work seekers also increased (941 000 and
799 000 respectively). In line with the recommendation from the ILO, improving job prospects for
the unemployed and encouraging re-entry into labour market for the discouraged work seekers
should receive attention.
The share of the working age who were discouraged increased from 4,7% in 2009 to 6,5% in 2015.
In addition, there is some provincial variation in the share of discouragement with provinces such
as Limpopo and the North West reflecting the largest increases amongst all provinces (4,3 and 4,4
percentage points respectively).
Economic growth has slowed since 2012, reaching a 6-year low of 1,3% in 2015. This slowdown in
economic activity has been accompanied by a rise in unemployment rates to 25,3% in 2015. While
absorption and labour force participation rates have increased since 2010, rates have remained
below pre-recessionary highs.
Women, regardless of race, face higher unemployment and lower absorption and participation rates
relative to males, while the gender gap remained prevalent over the period 2009 to 2016.
Young people remain disadvantaged in the labour market; the unemployment rate for a young
person aged 25–34 years in 2015 was 30,2%, more than twice the rate of someone aged 45–54
years.
Education continues to be an important factor for improving labour market outcomes;
unemployment rates fall and absorption and participation rates rise with higher levels of education.

Chapter 4Employment and other forms of work

Statistics South Africa 02-11-02
Labour market dynamics in South Africa, 2015
4-2
Table of contents
Chapter 4: Employment and other forms of work ........................................................................................ 3
4.1 A profile of the employed ....................................................................................................................... 3 Background .................................................................................................................................................. 4 Introduction .................................................................................................................................................. 4 Employment by industry and occupation ..................................................................................................... 4 Hours of work ............................................................................................................................................. 12 Time-related underemployment ................................................................................................................. 14 Summary and conclusion ........................................................................................................................... 16
4.2 The formal and informal sector in South Africa .................................................................................... 17 Background ................................................................................................................................................ 17 Introduction ................................................................................................................................................ 17 Summary and conclusion ........................................................................................................................... 21
4.3 Monthly earnings in South Africa ......................................................................................................... 22 Background ................................................................................................................................................ 22 Introduction ................................................................................................................................................ 23 Summary and conclusion ........................................................................................................................... 28
4.4 Decent work ......................................................................................................................................... 29 Introduction ................................................................................................................................................ 29 Standards and rights at work ..................................................................................................................... 29 Social protection ......................................................................................................................................... 31 Social dialogue ........................................................................................................................................... 32 Summary and conclusion ........................................................................................................................... 33
4.5 Job tenure ............................................................................................................................................ 34 Background ................................................................................................................................................ 34 Introduction ................................................................................................................................................ 34 Summary and conclusion ........................................................................................................................... 38
4.6 Government job creation programmes ................................................................................................ 39 Background ................................................................................................................................................ 39 Introduction ................................................................................................................................................ 39 Characteristics of those who participated in government job creation programmes ................................. 40 Employment by industry and occupation ................................................................................................... 42 Summary and conclusion ........................................................................................................................... 43
4.7 Other forms of work ............................................................................................................................. 44 Background ................................................................................................................................................ 44 Introduction ................................................................................................................................................ 44 Own-use activities as a proportion of the working-age population ............................................................ 48 References ................................................................................................................................................. 49

Statistics South Africa 02-11-02
Labour market dynamics in South Africa, 2015
4-3
Chapter 4: Employment and other forms of work
4.1 A profile of the employed
Key labour market concepts
Persons are considered to be employed if they have engaged in any kind of economic activity for at least one hour in the reference period. Also included are persons who, during the reference period, were temporarily absent from work/business but definitely had a job/business to return to.
Economic activities are activities that contribute to the production of goods and services.
Market production activities refer to work that is done usually for pay or profit, whereas production for own final use refers to work that is done for the benefit of the household, e.g. subsistence farming (production of fruit/vegetables for own consumption). The QLFS collects information on both these activities.
Occupations1 in this chapter have been grouped by hierarchy from the way they appear in QLFS statistical release publications. A classification of skills categories is drawn from Bhorat, H & Oosthuizen, M in 'Employment shifts and the "jobless growth" debate' Chapter in 'Human Resource Development Review 2008, Education, Employment and Skills in South Africa', editors A. Kraak& K. Press, HSRC Press:
Skilled occupations classification: comprises managers, professionals and technicians.
Semi-skilled occupations classification: comprises clerks, sales and services, skilled agriculture, crafts and related trade, plant and machine operators
Low-skilled occupations classification: comprises elementary work
Domestic workers are classified separately
Industry classification is as follows:
Primary sector: Agriculture and Mining
Secondary sector: Manufacturing, Utilities and Construction
Tertiary sector: Trade, Transport, Finance, Social and personal services, and Private households
Employed persons may be described as fully employed if they do not want to work more hours than they currently do; or underemployed if they would like to work more hours than they currently do. In essence, time-related underemployment measures situations of partial lack of work and thus complements the statistics on unemployment.
The measurement of hours worked: The labour force framework gives priority to employment over unemployment and economically inactive. Thus, employment takes precedence over other activities, regardless of the amount of time devoted to it during the reference period, which in some cases may be only one hour (ILO). The QLFS would thus classify a person as employed when they have worked for only one hour during the reference week.
Caution is required when making conclusions based on the industrial profile of employed persons, since the clustered nature of the Mining industry means that it might not have been adequately captured by the QLFS sample. Alternative mining estimates are included in the Quarterly Employment Statistics (QES) release.
1Stats-SA classifies occupations as prescribed by the South African Standard Classification of Occupations (SASCO).

Statistics South Africa 02-11-02
Labour market dynamics in South Africa, 2015
4-4
Background The ILO publication entitled "World Employment Outlook, 2015" finds that employment levels in sub-
Saharan Africa remain low with unemployment most acute amongst women and youth. High unemployment
levels have also resulted in educated workers who used to work in medium skilled jobs having to compete
for lower-skilled jobs2. The publication further finds that countries facing high youth unemployment levels
are vulnerable to social unrest.
Introduction
This chapter includes five sections. The first section provides a profile of the employed in South Africa; the
analysis focuses on employment by industry and occupation, hours worked and time-related
underemployment. The second section provides an analysis of the monthly median earnings by certain
demographic variables. The third section analyses the provision of decent work in terms of the standards
and workers’ rights at work, social protection and social dialogue. Section four analyses job tenure, and the
last section presents trends in participation in government job creation programmes over the period 2011 to
2015. The analysis also focuses on the awareness about EPWP and the characteristics of the people who
participated in these programmes.
Employment by industry and occupation
This section analyses the distribution of employment by industry and occupation over the period 2009 to
2015, by sex, population group and province.
Table 4.1: Employment by industry, 2009–2015
Industry 2009 2010 2011 2012 2013 2014 2015
Thousand
Agriculture 715 665 644 696 740 702 880
Mining 340 327 334 375 411 428 455
Manufacturing 1 954 1 839 1 871 1 817 1 810 1 760 1 762
Utilities 105 95 91 102 128 117 132
Construction 1 189 1 109 1 109 1 091 1 145 1 249 1 405
Trade 3 120 3 073 3 148 3 145 3 132 3 202 3 161
Transport 800 816 811 860 914 932 905
Finance 1 862 1 748 1 818 1 902 1 995 2 030 2 198
Services 2 814 2 875 3 027 3 202 3 351 3 493 3 551
Private households 1 291 1 237 1 214 1 232 1 236 1 230 1 288
Total 14 194 13 788 14 070 14 425 14 866 15 146 15 741 Note: Total includes 'Other forms of industry'
2 World Employment Outlook, 2015

Statistics South Africa 02-11-02
Labour market dynamics in South Africa, 2015
4-5
Table 4.2: Changes in employment by industry, 2010–2015
Industry 2010 2011 2012 2013 2014 2015
Change 2009-2015
Thousand
Agriculture -49 -21 52 44 -38 178 165
Mining -13 7 41 36 17 27 115
Manufacturing -115 32 -54 -7 -50 2 -192
Utilities -10 -4 11 27 -11 15 28
Construction -80 -0 -18 55 103 156 216
Trade -47 74 -3 -13 70 -41 41
Transport 16 -5 49 54 18 -27 105
Finance -114 70 84 93 35 168 336
Services 61 152 175 149 142 58 737
Private households -54 -24 18 4 -6 58 -3
Total -406 282 355 441 281 594 1 547 Note: Total includes 'Other forms of industry'
Over the period 2009 to 2015, total employment increased by 1,5 million jobs as highlighted in Tables
4.1 and 4.2. All industries, except Manufacturing and Private Households, gained jobs over the same
period. The largest increases in employment were observed in Community and social services
(737 000), Finance (336 000) and Construction (216 000). Total employment increased in all the years
except between 2009 and 2010 where a decline of 406 000 jobs was observed. Between 2014 and
2015, only Trade and Transport industries shed jobs (41 000 jobs and 27 000 jobs respectively).
Figure 4.1 Employment by industry, index 2009–2015
Note: Dotted line indicates introduction of new Master sample
Over the period 2009 to 2015, employment in secondary industries was marginally lower when
compared to both primary and tertiary industries. In 2015, employment in all industries, with the
exception of secondary industries was above their 2009 levels. After the introduction of the new Master
Sample in 2015, employment in all industries increased but most notably in primary industries.

Statistics South Africa 02-11-02
Labour market dynamics in South Africa, 2015
4-6
Figure 4.2: Employment shares by industry, 2009–2015
Figure 4.3: Employment shares by industry and sex, 2015
The industry employment shares declined in three of the ten industries between 2009 and 2015.
Employment in Manufacturing, Trade and Private households declined by 2,6 percentage points, 1,9
percentage points and 0,9 of a percentage point respectively. Community and social services and Trade
industries accounted for the largest shares of employment in both 2009 and 2015 while the lowest share
of less than one per cent in both years was observed in Utilities. In 2015, men accounted for 56,3% of
the total employment and they were more likely to work in all industries except Community and social
services and Private households when compared to women. In 2015, women accounted 61,0% of the
employment in Community and social services and 78,1% in the Private households. The employment
shares for women in Construction, Mining, Utilities and Transport ranged between 10,0% and 20,0%.
Table 4.3: Employment shares by industry and province, 2015
WC EC NC FS KZN NW GP MP LP RSA
Industry Percent
Agriculture 10,1 6,1 11,7 8,8 5,7 5,9 0,7 7,5 10,5 5,6
Mining 0,1 0,1 8,2 4,2 0,3 16,6 1,9 5,0 6,0 2,9
Manufacturing 12,9 9,5 3,6 8,4 13,6 7,7 13,1 9,0 5,6 11,2
Utilities 0,7 0,4 1,2 1,3 0,6 0,5 0,6 2,6 1,0 0,8
Construction 8,7 12,0 9,7 6,9 10,4 6,8 7,5 8,8 11,2 8,9
Trade 19,8 21,2 17,3 21,3 19,7 17,8 20,1 20,4 21,7 20,1
Transport 5,2 4,7 3,1 4,4 6,4 3,7 7,2 5,3 4,3 5,7
Finance 15,8 9,4 6,8 8,0 10,5 10,7 20,4 11,2 7,6 14,0
Services 20,1 28,1 29,9 25,9 24,5 21,6 20,5 21,5 23,2 22,6
Private households 6,7 8,6 8,6 10,6 8,3 8,7 7,9 8,6 9,0 8,2
Total 100,0 100,0 100,0 100,0 100,0 100,0 100,0 100,0 100,0 100,0 Note: Total includes 'Other'
Community and social services and Trade industries were the main contributors to employment in all
provinces. In 2015, the shares of employment in the Community and social services ranged from 20,1%
in Western Cape to 29,9% in Northern Cape, while for Trade, the shares ranged from 17,3% in Northern
Cape to 21,7% in Limpopo. Finance was the second biggest industry contributor to employment in
Gauteng after Community and social services, while Trade was ranked third.

Statistics South Africa 02-11-02
Labour market dynamics in South Africa, 2015
4-7
Figure 4.4: Provincial employment in primary, secondary and tertiary industries, 2009 and 2015
The figure above reveals that in both 2009 and 2015, seven in every ten employed persons worked in
tertiary industries. In addition, this industry grouping is the main contributor to total employment across
all the provinces. In both 2009 and 2015, tertiary industries accounted for more than 70,0% of
employment in Gauteng and the Eastern Cape. The shares of employment in the primary industries in
Gauteng was lowest at 1,8% in 2009 which increased to 2,6% in 2015. The largest shares of
employment in primary industries were observed in the North West and Northern Cape. In both 2009
and 2015, amongst all provinces, secondary industries accounted for the largest share of employment
in KwaZulu-Natal, followed by Western Cape and Gauteng.

Statistics South Africa 02-11-02
Labour market dynamics in South Africa, 2015
4-8
Table 4.4: Employment by occupation, 2009–2015
Occupation 2009 2010 2011 2012 2013 2014 2015
Thousand
Manager 1 097 1 099 1 194 1 161 1 224 1 331 1 274 Professional 755 764 800 842 925 842 776 Technician 1 626 1 534 1 561 1 639 1 645 1 552 1 456 Clerk 1 530 1 517 1 484 1 506 1 606 1 653 1 671 Sales 1 924 1 974 2 054 2 113 2 163 2 326 2 463 Skilled agriculture 94 92 73 68 70 76 96 Craft 1 826 1 682 1 722 1 734 1 730 1 813 1 946 Operator 1 255 1 195 1 200 1 200 1 274 1 277 1 312 Elementary 3 067 2 971 3 021 3 187 3 227 3 295 3 729 Domestic worker 1 022 959 961 975 1 002 981 1 017 Total 14 194 13 788 14 070 14 425 14 866 15 146 15 741
Table 4.5: Changes in employment by occupation, 2010-2015
Occupation 2010 2011 2012 2013 2014 2015
Change 2009-2015
Thousand
Manager 2 95 -33 63 108 -57 178 Professional 9 36 42 83 -83 -67 21 Technician -92 27 79 5 -93 -96 -169 Clerk -13 -33 21 101 47 18 142 Sales 50 80 59 50 164 137 540 Skilled agriculture -1 -20 -5 2 6 20 2 Craft -144 40 12 -4 83 133 120 Operator -59 4 0 74 3 35 57 Elementary -96 51 165 40 68 435 663 Domestic worker -62 2 14 27 -22 37 -4 Total -406 282 355 441 281 594 1 547
Table 4.4 and Table 4.5 show that between 2009 and 2010, employment declined in all occupational
categories except for people employed as Managers, Professionals and Sales workers which saw
increases of 2 000 jobs, 9 000 jobs and 50 000 jobs respectively. Only skilled occupations (Manager,
Professional and Technician) experienced a decline in employment between 2014 and 2015. Over the
same period, employment gains were driven by increases in the Elementary workers’ occupations which
gained 435 000 jobs, followed by those in Sales (137 000) and Craft and related trade industries
(133 000). Over the period 2009 to 2015, jobs were lost among Technicians (169 000) and Domestic
workers (4 000) with large job gains in the following occupations; Elementary (663 000), Sales
(540 000) and Managers (178 000).

Statistics South Africa 02-11-02
Labour market dynamics in South Africa, 2015
4-9
Figure 4.5: Employment shares by occupation, 2009 and 2015
Figure 4.6: Employment shares by occupational categories, 2009 and 2015
The results in Figure 4.5 show that Elementary occupations contributed the largest share to
employment in both 2009 and 2015. While Sales, and Craft and related trade occupations were among
the top three contributors to total employment. Between 2009 and 2015, employment shares increased
in three of the ten occupations; Elementary and Sales occupations gained 2,1 percentage points each
while Managers’ contribution increased by 0,4 of a percentage point. All other occupations, with the
exception of Technicians, declined by less than a percentage point each. The lowest share of
employment was among the Skilled agriculture occupations which reflected a contribution to
employment of less than one per cent over the period 2009 to 2015. In both 2009 and 2015, semi-
skilled occupations accounted for the largest share of employment (Figure 4.6), this skill category and
low-skilled occupations share of total employment increased over the period, while high-skilled
occupation’s share declined by 2,2 percentage points.

Statistics South Africa 02-11-02
Labour market dynamics in South Africa, 2015
4-10
Figure 4.7: Provincial employment in skilled, semi- and low-skilled occupations, 2009 and 2015
In both 2009 and 2015, semi-skilled occupations accounted for the largest share of employment across
all the provinces. In 2015 the shares ranged from a low of 45,1% in Eastern Cape to a high of 50,2% in
Mpumalanga. The low-skilled occupations were the second largest contributors to the total employment
in all provinces, except in Gauteng where the skilled occupations accounted for the second largest
contributor. The highest contribution to employment amongst skilled occupational categories was found
in Gauteng (29,1%) and Western Cape (24,6%) which in 2015 were the only two provinces which
recorded shares above the national average (22,3%). The contribution of skilled occupations to total
employment declined across all the provinces over the period 2009 to 2015. The largest decline was
observed in Northern Cape (5,7 percentage points), North West (4,5 percentage points) and Limpopo
(3,9 percentage points). The share of employment accounted for by low-skilled occupations in 2015 was
highest in the North West (38,5%) followed by Limpopo and Northern Cape with 37,5% each.

Statistics South Africa 02-11-02
Labour market dynamics in South Africa, 2015
4-11
Table 4.6: Number and percentage of persons employed as managers, professionals and
technicians by sex, 2009–2015
2009 2010 2011 2012 2013 2014 2015
Thousand Women Manager 330 327 373 364 370 418 395 Professional 347 345 370 367 403 374 394 Technician 865 840 871 905 912 872 809
Men Manager 766 772 821 797 854 914 879 Professional 408 419 430 475 522 469 382 Technician 760 694 690 735 733 680 647 Both sexes Manager 1 097 1 099 1 194 1 161 1 224 1 331 1 274 Professional 755 764 800 842 925 842 776 Technician 1 626 1 534 1 561 1 639 1 645 1 552 1 456
% share of women
Manager 30,1 29,8 31,2 31,4 30,2 31,4 31,0 Professional 45,9 45,1 46,2 43,6 43,6 44,4 50,7 Technician 53,2 54,7 55,8 55,2 55,4 56,2 55,5
Men accounted for larger shares of employment as Managers and Professionals over the period 2009
to 2015, with the exception of 2015 amongst Professionals. Women employed in skilled occupations
were more likely to work as Technicians compared to Managers and Professionals. The share of
women employed as Technicians increased from 53,2% in 2009 to a high of 56,2% in 2014 and
declined to 55,5% in 2015. However, in 2015, women accounted for 50,7% of those employed in
Professional occupations. The largest gender gap in favour of men were observed amongst those who
were employed as Managers throughout the period.
Figure 4.8: Employment by occupational
categories and population group, 2009 and
2015
Figure 4.9: Employment by occupational
categories and sex, 2009 and 2015
Figure 4.8 shows that the majority of workers were employed in semi-skilled occupations. In both 2009
and 2015, the white and Indian/Asian population groups were less likely to work in low-skilled
occupations while black African and coloured population groups reflected the second largest share of
workers in the same occupational category. In 2015, almost 60,0% of the employed among the white
population group were employed in skilled occupations while the Indian/Asian population group
accounted for 48,3%. Black Africans and coloured people employed in the skilled occupations were
15,5% and 18,0% respectively. Figure 4.9 reveals that in 2009 and 2015, a higher percentage of women
were employed in skilled and low-skilled occupations relative to men. In contrast, more than 50% of
employed men were working in semi-skilled occupations in both 2009 and 2015.

Statistics South Africa 02-11-02
Labour market dynamics in South Africa, 2015
4-12
Hours of work This section analyses the volume of hours and also the average weekly hours worked. The average
weekly hours worked were analysed by sex, population group, industry, occupation, sector and
province.
Table 4.7: Volume of hours and average weekly hours worked by sex, 2009–2015
2009 2010 2011 2012 2013 2014 2015
Volume of hours worked (Thousand hours)
Women 251 530 240 134 249 715 251 385 261 483 265 748 274 839
Men 362 437 352 681 360 326 365 587 370 874 377 705 396 888
Both sexes 613 967 592 815 610 041 616 971 632 357 643 453 671 727
The volume of hours worked between 2009 and 2015 increased by 57,8 million hours. The largest
increase in the volume of hours worked was among men (34,5 million hours) while for women it went up
by 23,3 million hours between 2009 and 2015.
Figure 4.10: Average weekly hours worked
by sex, 2009–2015
Figure 4.11: Average weekly hours worked
by population group, 2009 and 2015
Figure 4.10 shows that over the period 2009–2015, men worked longer hours than women. Every year
between 2009 and 2012, the weekly hours worked by men remained unchanged at 46 hours which
declined to 45 hours in 2013 and did not change until 2015. On the other hand, weekly hours worked by
women remained constant at 41 hours for four consecutive years since 2012. The highest number of
hours worked by women on a weekly basis was 42 hours in 2009 and 2011. The hours of work recorded
by the coloured population was the least hours of work compared to other population groups as
reflected in Figure 4.11. Indians and black Africans worked longer hours compared to white and
coloured workers.

Statistics South Africa 02-11-02
Labour market dynamics in South Africa, 2015
4-13
Figure 4.12: Average weekly hours worked by
industry, 2009 and 2015
Figure 4.13: Average weekly hours worked by
occupation, 2009 and 2015
Those employed in the Transport industry worked longer hours; in 2015 the average hours worked in
this industry was 50 hours. In all other industries, except in Private households, the average hours
worked in 2015 ranged from 40 hours for those employed in Community and social services to 48 hours
for those employed in Trade industries. Those in Private households worked 34 hours on average in
both 2009 and 2015. Between 2009 and 2015, the average hours per week worked remained
unchanged in five of the ten occupations while for the remainder of the occupations the average weekly
hours declined (Figure 4.13). The largest decline of three hours was observed among those who
worked in Skilled Agricultural occupations. Persons employed in Sales and Operators occupations
worked longer hours in a week compared to those in other occupations.
Figure 4.14: Average weekly hours worked by
sector, 2009–2015
Figure 4.15: Average weekly hours worked by
province, 2009 and 2015
Figure 4.14 indicates that persons in the informal sector worked longer hours than those in the formal
sector in all the years since 2009. Weekly hours worked by those in the formal sector remained constant
at 44 hours over the period 2009 to 2015 while for those in the informal sector, the hours ranged from

Statistics South Africa 02-11-02
Labour market dynamics in South Africa, 2015
4-14
46 hours to 48 hours. All provinces, except KwaZulu-Natal and Western Cape recorded a decline in
average worked hours per week. Three out of nine provinces reflected a decline of 2 hours between
2009 and 2015 (Figure 4.15).
Time-related underemployment Time-related underemployment is one of the many labour market indicators used to measure the
economic well-being of a country. According to Statistics South Africa (2008), time-related
underemployment refers to those persons who worked less than 35 hours in the reference week and
were available to work additional hours.
Persons employed in market production activities are those aged 15–64 years who, during the
reference week, even if it was for only one hour, did any of the following:
a) Worked for a wage, salary, commission or payment in kind (including paid domestic work);
b) Ran any kind of business, big or small, on their own or with one or more partners; and/or
c) Helped without being paid in a business run by another household member.
Persons helping unpaid in such businesses who were temporarily absent in the reference week are not
considered as employed; so in the questionnaire they are routed eventually to questions on job search
activities; their desire to work; and their availability to work – to determine whether they are unemployed
or inactive (Statistics South Africa, 2008).
Table 4.8: Trends in underemployment
Underemployed Other employed
Total employed
% underemployed
Thousands
2009 669 13 525 14 194 4,7
2010 576 13 212 13 788 4,2
2011 540 13 530 14 070 3,8
2012 585 13 840 14 425 4,1
2013 615 14 251 14 866 4,1
2014 608 14 539 15 146 4,0
2015 705 15 036 15 741 4,5
The number of underemployed persons increased from 669 000 in 2009 to 705 000 in 2015. The lowest
number of underemployed persons of 540 000 was recorded in 2011 which translated into an
underemployment rate of 3,8%. The underemployment rate declined by 0,2 of a percentage point from
4,7% in 2009 to 4,5% in 2015 while between 2014 and 2015, the rate increased by 0,5 of a percentage
point.

Statistics South Africa 02-11-02
Labour market dynamics in South Africa, 2015
4-15
Figure 4.16: Underemployment by sex, race and province, 2009 and 2015
Figure 4.16 show that the underemployment rate was higher among women compared to men in both
2009 and 2015. In 2015, the rate for women was 3,0 percentage points higher than the male rate, down
from a gender gap of 3,7 percentage points in 2009. In terms of population group, black Africans and
coloured people recorded the highest rate of underemployment in both 2009 and 2015. A decline in the
underemployment rate occurred in three of the four population groups, namely the black African,
Indian/Asian and white population groups. However, the underemployment rate among the coloured
population increased by 0,8 of a percentage point between 2009 and 2015. In 2015, the highest
underemployment rate was recorded in Limpopo (6,7%) followed by Eastern Cape (6,6%) and Free
State (6,0%) while the lowest rate was observed in North West (3,4%) and Gauteng (3,5%). Four out of
nine provinces recorded increases in the underemployment rate between 2009 and 2015 with the
largest increase in Limpopo (3,0 percentage points). The largest decline of 2,2 percentage points was
observed in KwaZulu-Natal.

Statistics South Africa 02-11-02
Labour market dynamics in South Africa, 2015
4-16
Figure 4.17: Underemployment by industry,
2009 and 2015
Figure 4.18: Underemployment by occupation,
2009 and 2015
The underemployment rate was highest for those employed in Private households (21,7% in 2009 and
18,4% in 2015); and this group also recorded the largest decline in underemployment over the period
(3,3 percentage points). The 2015 results show that the rate for other industries ranged from 1,9% in
Manufacturing to 5,3% in Construction while in 2009, the rate ranged from 1,8% in Agriculture to 4,6%
in Construction. In relation to occupation, domestic workers were also more likely to be underemployed.
Out of ten occupation categories, the underemployment rate increased among those employed as
Skilled agriculture workers (1,3 percentage points), Elementary workers (0,8 of a percentage point) and
Craft and related tradeworkers (0,3 of a percentage point). The rate for Managers remained unchanged
at 0,9%.
Summary and conclusion Community and social services and Trade industries were the main contributors to employment in all
provinces.
The shares of employment in the primary industries in Gauteng was lowest at 1,8% in 2009 which
increased to 2,6% in 2015.
Over the period 2009 to 2015, men accounted for the largest share of employment in occupations
such as Managers and Professionals. On the other hand, women employed in skilled occupations
were more likely to work as Technicians compared to Managers and Professionals.
People working in Transport industry worked longer hours of about 50 hours or more per week on
average.
The female underemployment rate was higher compared to men in both 2009 and 2015. In 2009, the
rate for women was more than double the rate for men.

Statistics South Africa 02-11-02
Labour market dynamics in South Africa, 2015
4-17
4.2 The formal and informal sector in South Africa
Background
The relative small contribution of the informal sector to employment in South Africa has often been
highlighted in the context of very high unemployment levels. However the informal sector is an important
survival mechanism for the unemployed. The Survey of Employed and the Self Employed (SESE, 2013)
finds that 70% of the people who start an informal business do so because they are unemployed and
have no alternative source of income.
While in general the informal sector in South Africa is small and survivalist in nature, it serves as an
important avenue for entry into employment for those who would otherwise be unemployed. It is
important for policy makers to determine the factors which hinder the transition from unemployment to
the informal sector as well as the movement from the informal to the formal sector. While trade
industries dominate the informal sector employment, there is a wide variety of activities conducted in the
sector, ranging from educare, traditional healers, and hair salons (Charman and Petersen).3
The Stats SA publication entitled “National and provincial labour market: The Informal sector, Q2: 2008–
Q2: 2014” finds provincial variations in the contribution to employment by the sector; in provinces such
as Limpopo, Mpumalanga, KwaZulu-Natal and Eastern Cape this sector contributed between 20% and
27% of employment, but only 9,5% in the Western Cape. Levels of education in the informal sector are
lower compared to the formal sector and as such the number of people employed in skilled occupations
in the informal sector is lower. Underemployment is also more prevalent in the informal sector, while
access to benefits such as paid leave, medical aid and pension contributions by the employer is
substantially lower relative to the formal sector.
Introduction
In this section of Chapter 4, demographic characteristics (sex, population group and education level) of
the informal and formal sector are analysed. Industry and occupational profiles of both sectors are
investigated while provincial variations are also highlighted. The analysis is based on QLFS annual data
for the period 2009–2015.
3 ‘Informal micro-enterprises in a township context, a spatial analysis of business dynamics in 5 Cape Town localities’ A.
Charman & L. Petersen, REDI 3x3 Working Paper nr 5, November 2015.
Key labour market concepts
Informal sector: The informal sector has the following two components:
Employees working in establishments that employ fewer than five employees, who do not
deduct income tax from their salaries/wages; and
Employers, own-account workers and persons helping unpaid in their household business
who are not registered for either income tax or value-added tax.

Statistics South Africa 02-11-02
Labour market dynamics in South Africa, 2015
4-18
Table 4.9: Employment by sector, 2009–2015
2009 2010 2011 2012 2013 2014 2015
Formal 9 967 9 627 9 942 10 222 10 524 10 822 10 935
Informal 2 221 2 259 2 270 2 275 2 366 2 393 2 637
Other* 2 006 1 903 1 858 1 928 1 976 1 931 2 168
Total 14 194 13 788 14 070 14 425 14 866 15 146 15 741
Percent shares
Formal 70,2 69,8 70,7 70,9 70,8 71,5 69,5
Informal 15,6 16,4 16,1 15,8 15,9 15,8 16,8
Other* 14,1 13,8 13,2 13,4 13,3 12,8 13,8
Total 100,0 100,0 100,0 100,0 100,0 100,0 100,0
Annual changes (Thousand)
Formal -340 316 280 302 298 113
Informal 38 11 5 91 27 245
Other* -103 -45 70 48 -44 237
Total -406 282 355 441 281 594
Note: 'Other' comprises Agriculture and Private households.
Over the period 2009 to 2015, the share of informal sector employment increased from 15,6% to 16,8%,
while the formal sector’s share of total employment declined (from 70,2% to 69,5%). Between 2014 and
2015 employment in the informal sector increased by 245 000 jobs, while formal sector employment
expanded by 113 000 jobs, this resulted in the share of formal sector employment declining to 69,5% in
2015 from 71,5% in 2014, while the informal sector’s share of employment increased from 15,8% to
16,8%.
Figure 4.19: Formal sector share of employment by sex, 2009–2015
Figure 4.20: Informal sector share of employment by sex, 2009–2015
Over the period 2009–2015, the formal sector accounted for a larger share of employment amongst
men relative to women. However, over the period, the female formal sector share increased from 64,2%
in 2009 to 66,5% in 2015 while amongst men the share declined from 74,9% to 71,8%. A higher
proportion of men were employed in the informal sector compared to women across all years with the
exception of 2009. Between 2009 and 2015, the male informal sector share increased (from 15,5% to
18,4%) while that of women declined (from 15,8% to 14,6%).

Statistics South Africa 02-11-02
Labour market dynamics in South Africa, 2015
4-19
Figure 4.21: Employment by sector and population group, 2009 and 2015
Figure 4.22: Employment by sector and education group, 2009 and 2015
Due to small contributions in certain population groups and education levels, Agriculture and Private hh contributions to
employment may not reflect in the above graphs.
In both 2009 and 2015, employment amongst all population groups was dominated by the formal sector
(Figure 4.21). However while the sector accounts for more than 90,0% of employment amongst the
white population group, in 2015 the sector accounted for only 64,9% of employment amongst black
Africans. Amongst black Africans, the share of the informal sector in total employment increased from
19,3% in 2009 to 19,6% in 2015, accounting for the highest share of this sector amongst all population
groups; followed by employment in private households, which accounted for around 10% of total
employment. The highest proportion of individuals employed in the agriculture sector was from the
coloured population, and this proportion was higher relative to other population groups – accounting for
12,0% in 2015 – and less than 5,5% amongst other population groups.
Figure 4.22 highlights that amongst all educational categories attained by the employed, the proportion
of those employed in the formal sector was highest, although even within educational attainment there
were significant variations. This is evident from the fact that in 2015, amongst the employed, individuals
with tertiary qualifications accounted for 93,2% of total employment in the formal sector, while amongst
those with a primary or below primary education attainment were significantly low, accounting for only
37,6% of formal sector employment. The situation seemed to improve as the level of educational
attainment increased; those with some secondary education accounted for the second highest
proportion of persons employed in the formal sector (81,2%). Amongst the employed those with an
incomplete secondary education and primary and below primary levels of education, were found to be
employed in the informal sector, accounting for more than 20,0% of total employment

Statistics South Africa 02-11-02
Labour market dynamics in South Africa, 2015
4-20
Figure 4.23: Formal sector employment share by province, 2009 and 2015
Figure 4.24: Informal sector employment share by province, 2009 and 2015
Between 2009 and 2015, the formal sector share of total employment nationally declined marginally by
0,7 of a percentage point to 69,5% (Figure 4.23). This was mainly due to the decline in four of the nine
provinces, most notably in Limpopo (4,4 percentage points) and Western Cape (2,8 percentage points).
The largest increases in the formal sector share in employment over the period was in the Northern
Cape (5,2 percentage points) and Free State (3,1 percentage points). Figure 4.24 highlights that
Limpopo accounted for the highest provincial employment share in the informal sector at 27,8%; while
the lowest informal sector share was in Western Cape at 10,5%. Over the period 2009 to 2015 the
informal sector’s share in employment declined slightly in two provinces, namely Mpumalanga (0,7 of a
percentage point) and Free State (0,2 of a percentage point).
Figure 4.25: Formal sector employment share by industry, 2009 and 2015
Figure 4.26: Informal sector employment share by industry, 2009 and 2015
Figure 4.25 depicts that the formal sector dominates employment across all industries, however there
are variations in the contribution by industry. In 2015 the share of the formal sector in total employment
ranged from a low of 66,1% in Trade industries to a high of 99,3% in Mining. Notwithstanding this,
however there was generally a decline in total formal sector employment across all industries between
2009 and 2015, the largest of which was in Construction (5,6 percentage points).

Statistics South Africa 02-11-02
Labour market dynamics in South Africa, 2015
4-21
The declines experienced in the formal sector industry employment were offset by increases in
employment in the informal sector industries. The results in Figure 4.26 highlight that over the period,
and across all industries, the informal sector’s share of total employment increased, with Construction
reflecting the largest increase. Informal sector shares in excess of 20,0% were observed in Trade,
Construction and Transport.
Figure 4.27: Formal sector employment by occupation, 2009 and 2015
Figure 4.28: Informal sector employment by occupation, 2009 and 2015
Skilled and Semi-skilled occupations dominate employment in the formal sector (Figure 4.27). Between
2009 and 2015, the share of skilled occupations in the formal sector declined from 32,1% to 29,0%,
while the share of unskilled occupations increased by 2,8 percentage points to 18,3% in 2015. Figure
4.28 shows that in 2015 semi-skilled occupations accounted for 57,7% of informal sector employment,
up from 54,5% in 2009. In addition the share of unskilled occupation employed in the sector declined
from 34,3% in 2009 to 31,0% in 2015.
Summary and conclusion
The formal sector accounted for 69,5% of total employment in 2015, down from 70,2% in 2009,
while the informal sector’s share in employment increased from 15,6% to 16,8% over the same
period.
Men’s employment share has been higher than that of women in both the formal and informal
sector since 2010.
Amongst black Africans the informal sector accounted for close to 20,0% of total employment.
Amongst the employed with incomplete secondary education and primary and below primary
levels of education, the informal sector accounted for more than 20,0% of employment.
Informal sector employment is high in provinces such as Limpopo and the Eastern Cape while
in the Western Cape and Gauteng the share of formal sector employment was the highest.

Statistics South Africa 02-11-02
Labour market dynamics in South Africa, 2015
4-22
4.3 Monthly earnings in South Africa
Background
Stats SA added earnings questions to the QLFS questionnaire from the third quarter of 2009. This was
done with the aim of producing relative earnings data and earnings distributions. Earnings are assessed
using the median monthly income of employed people in both the formal and the informal sectors.
Medians are used for two main reasons – they are widely used measures that best describe the
distribution of earnings, as they are more stable over time. The ILO “Global Wage Report” highlighted
that some emerging and developing economies concentrate more on wages as a key component of
overall strategies to reduce poverty and inequality. The analysis of earnings highlights that a gender gap
exists in earnings, and notes that the white population group continues to earn more than three times
the earnings of black Africans.
Key labour market concepts
Distributions:
Top 5 percentage (or 10% or 25%): The earnings level at which 5% (or 10% or 25%) of all of the records have higher earnings. Bottom 5 percentage (or 10% or 25%): The earnings level at which 5% (or 10% or 25%) of all the records have lower earnings. Median: when the QLFS records are arranged from the one with the lowest earnings to the one with the highest, the median is the record where half the records have lower earnings than the median and half the records have higher earnings.
Distinguishing between earnings and incomes:
What the QLFS measures are the gross earnings of employees and the net earnings of employers and own-account workers. It is essential to distinguish this concept of earnings from the concept of income.
Income is inclusive; it covers all sources of household revenue and includes not only earnings but also grants, other sources of revenue from government such as UIF, as well as investment income.
Income is generally measured at household level (household income) while earnings are usually measured for individual employed persons, as is the case here.
The degree of inequality observed in earnings distributions is almost certain to be less than the degree of inequality observed in income distributions. There are two reasons for this:
The entire population aged 15 years and over is included in the income statistics, not just the employed population. The not employed portion of the population (about 60% of the population) will generally have much lower incomes because they have no earnings.
People at the high end of the earnings distribution are more likely to also have investment income.
It is appropriate to compare the degree of inequality between income and earnings distributions if
the objective is to measure that difference. However, it is inappropriate to judge the validity of
income data or earnings data by comparing the two.

Statistics South Africa 02-11-02
Labour market dynamics in South Africa, 2015
4-23
Introduction
This section of the chapter focuses on the median monthly earnings of employees. The first part
analyses the median monthly earnings by employment status while the remainder of the section
presents the earnings by demographic variables such as sex, population group, age, as well as
industry, occupation and province.
Table 4.10: Median monthly earnings by status in employment, 2010–2015
2010 2011 2012 2013 2014 2015
Change 2010-2015 2010-2015
Rand
Employees 2 900 3 000 3 115 3 033 3 033 3 100 200
Employer 7 916 9 100 7 583 6 066 6 500 7 000 -916
Own-account worker 2 000 2 166 2 166 2 166 2 500 2 816 816
Total 3 000 3 033 3 100 3 033 3 120 3 200 200
Between 2010 and 2015, total median monthly earnings increased by R200. Over the same period, an
increase in the median monthly earnings was observed among own-account workers (R816) and
employees (R200) while for employers earnings declined (R916). The highest monthly median earnings
for own-account workers was observed in 2015 at R2 816 while for the employees, it was in 2012 at
R3 115. Employers recorded the highest earnings of R9 100 in 2011 which declined by R2 100 between
2011 and 2015.
Table 4.11 Median monthly earnings of employees by sex, 2010 and 2015
Number of employees
Bottom 5%
Bottom 10%
Bottom 25% Median Top25% Top10% Top5%
Rand
Men 6 545 780 1 083 1 733 3 200 7 000 14 000 20 000 Women 5 094 500 700 1 200 2 400 6 500 12 000 15 000 Both sexes 2010 11 638 600 866 1 500 2 900 6 900 12 885 17 106 Men 6 473 500 900 2 000 3 500 8 210 20 000 30 000 Women 5 386 500 700 1 500 2 700 7 000 16 100 22 000 Both sexes 2015 11 860 500 800 1 700 3 100 8 000 18 000 26 000
The median monthly earnings for women increased by R300 between 2010 and 2015, and this
contributed to the increase of R200 for all employees. However, men earned more than women in both
2010 and 2015. Male median monthly earnings increased by R300 from R3 200 in 2010 to R3 500 in
2015. In 2010, the top 5% earned almost 30 times the earnings of the bottom 5% employees, and by
2015, this had increased to 52 times. The gender gap of R5 000 amongst the top 5% earners was
observed in 2010 while the gap increased to R8 000 in 2015. Both men and women falling in the bottom
5% earned the same amount of R500 in 2015. However, between 2010 and 2015, the female median
monthly earnings of the bottom 5% remained unchanged at R500, while among men earnings declined
by R280.

Statistics South Africa 02-11-02
Labour market dynamics in South Africa, 2015
4-24
Figure 4.29: Median monthly earnings by population group, 2010–2015
Figure 4.30: Median monthly earnings by age, 2010–2015
Figure 4.29 shows that the median monthly earnings for all population groups increased over the period
2010 to 2015, except for the Indian/Asian population group for whom earnings decreased by R200.
However, the median monthly earnings for the Indian/Asian population group was the second highest
after the white population in all the years under consideration. The earnings for whites ranged from
R9 850 in 2010 to R12 000 in 2015 while for black Africans, median monthly earnings ranged from a low
of R2 200 in 2010 to R2 900 in 2015. In 2015, the median monthly earnings for the white population
was four times that of the coloured population and more than four times those of black Africans. The
median monthly earnings were higher for the employees aged 55–64 in all years and lowest amongst
young people aged 15–24 years as highlighted in Figure 4.30. However, the median monthly earnings
for those aged 55-64 years remained unchanged at R3 500 between 2010 and 2015.

Statistics South Africa 02-11-02
Labour market dynamics in South Africa, 2015
4-25
Table 4.12: Median monthly earnings of employees by age and gender, 2010–2015
2010 2011 2012 2013 2014 2015
Change 2010-2015
Rand
Both sexes 2 900 3 000 3 115 3 033 3 033 3 100 200 15-24yrs 2 166 2 300 2 500 2 340 2 500 2 600 434 25-34yrs 2 600 3 000 3 000 3 000 3 000 3 006 406 35-44yrs 3 000 3 250 3 500 3 466 3 466 3 466 466 45-54yrs 3 250 3 500 3 500 3 204 3 271 3 400 150 55-64yrs 3 500 3 700 4 000 3 500 3 900 3 500 0 Women 2 400 2 500 2 600 2 500 2 600 2 700 300 15-24yrs 2 100 2 400 2 500 2 400 2 500 2 500 400 25-34yrs 2 383 2 500 2 600 2 760 2 800 2 863 480 35-44yrs 2 400 2 500 2 800 2 500 2 700 2 800 400 45-54yrs 2 500 2 500 2 500 2 400 2 500 2 500 0 55-64yrs 2 600 2 900 3 100 2 500 2 850 2 600 0 Men 3 200 3 466 3 500 3 500 3 500 3 500 300 15-24yrs 2 166 2 200 2 470 2 300 2 500 2 600 434 25-34yrs 2 950 3 033 3 250 3 250 3 250 3 250 300 35-44yrs 3 500 3 640 4 000 4 000 4 000 4 000 500 45-54yrs 4 000 4 333 4 500 4 342 4 333 4 300 300 55-64yrs 4 000 4 333 5 000 4 700 4 800 4 500 500
Table 4.12 shows the median monthly earnings of employees by age and gender for the period 2010 to
2015. Male median monthly earnings have generally been higher than those of their female
counterparts, except among the youngest age cohort (15–24 years) in 2011, 2012 and 2013. In 2015,
the highest median monthly earnings were amongst women aged 25–34 years at R2 863 while men in
the oldest age group (55–64 years) earned more than others (R4 500). Between 2010 and 2015,
amongst all age categories for both men and women median monthly earnings increased except for
women aged 45–54 years and 55–64 years where for these age groups their earnings remained
unchanged.

Statistics South Africa 02-11-02
Labour market dynamics in South Africa, 2015
4-26
Figure 4.31:Median monthly earnings of
employees by industry, 2010–2015
Table 4.13: Median monthly earnings of employees by industry, 2010–2015
The monthly median earnings of employees in Utilities remained unchanged at R6 000 over three
consecutive years since 2010 and increased to the highest level of R8 666 in 2013 (Table 4.13).
Employees in Utilities and Mining earned equal amounts of R7 000 in 2014 which increased by R500 to
R7 500 in 2015; in 2014 and 2015, median monthly earnings in these two industries were the highest
compared to that of other industries. The lowest median monthly earnings were observed in Private
households and Agriculture. Over the period 2011 to 2015, employees in Agriculture earned more than
R2 000 only in 2014 and 2015 while the highest median monthly earnings for those in Private
households was R1 500 in 2015. Between 2010 and 2015 employee earnings increased across all
industries, with the exception of Community and Social services, with the largest increase of R2 500 for
employees in Mining followed by Utilities (R1 500). The lowest increase of R499 was observed among
those who were employed in Finance.
2010 2011 2012 2013 2014 2015
Rand
Agriculture 1 295 1 300 1 495 1 733 2 153 2 231
Mining 5 000 5 800 6 000 6 000 7 000 7 500
Manufacturing 3 250 3 500 3 500 3 672 3 900 3 800
Utilities 6 000 6 000 6 000 8 666 7 000 7 500
Construction 2 437 2 600 2 600 2 800 2 816 3 000
Trade 2 505 2 800 3 000 3 000 3 033 3 100
Transport 3 500 3 600 3 800 3 900 4 000 4 000
Finance 3 501 4 333 4 000 4 000 4 000 4 000
Services 6 000 6 000 6 500 6 000 5 000 5 000 Private households 1 000 1 200 1 200 1 300 1 400 1 500
Total 2 900 3 000 3 115 3 033 3 033 3 100

Statistics South Africa 02-11-02
Labour market dynamics in South Africa, 2015
4-27
Figure 4.32: Median monthly earnings of
employees by occupation, 2010 and 2015
Table 4.14: Median monthly earnings of employees by occupation, 2010–2015
Figure 4.32 highlights that in both 2010 and 2015 the highest earnings were amongst skilled
occupations. In 2015, the median monthly earnings of the skilled employees was R12 400 compared to
R3 500 and R2 000 earned by the semi-skilled and the low-skilled employees respectively. Between
2010 and 2015, the median monthly earnings for skilled employees increased by R3 400 while for the
semi-skilled and low-skilled it increased by R500 and R600 respectively. Table 4.14 highlights that over
the period 2010 to 2015, within the skilled occupational category, median monthly earnings increased
for Managers and Professionals but declined amongst Technicians. Both Managers and Professionals
earned above R10 000 over the period 2010 to 2015 while for Technicians, the median monthly
earnings ranged from R6 000 to R8 400. All the occupations within semi-skilled occupational category
reflected an increase over the same period with the exception of Clerks and Skilled Agricultural
employees.
Table 4.15 Median monthly earnings of employees by province, 2010–2015
2010 2011 2012 2013 2014 2015
Change 2010-2015 2010-2015
Rand
South Africa 2 900 3 000 3 115 3 033 3 033 3 100 200
Western Cape 3 000 3 300 3 466 3 250 3 423 3 250 250
Eastern Cape 2 200 2 500 2 500 2 200 2 500 2 418 218
Northern Cape 2 058 2 166 2 000 2 058 2 200 2 383 325
Free State 2 000 2 100 2 166 2 400 2 500 2 500 500
KwaZulu-Natal 2 500 2 600 2 800 2 600 2 500 2 500 0
North West 3 000 3 250 3 500 3 380 3 000 3 000 0
Gauteng 3 500 3 960 4 000 4 300 4 333 4 500 1 000
Mpumalanga 2 800 2 400 2 505 2 700 3 000 3 000 200
Limpopo 1 800 1 800 2 000 2 000 2 166 2 300 500
Table 4.15 shows that median monthly earnings increased in all provinces except in KwaZulu-Natal and
North West which remained unchanged over the period 2010 to 2015. The largest increase of R1 000
was observed in Gauteng, followed by Limpopo and Free State which recorded a rise of R500 each.
2010 2011 2012 2013 2014 2015
Rand
Manager 11 000 13 000 12 800 14 083 16 000 17 000
Professional 10 600 13 000 13 000 15 000 15 000 18 000
Technician 7 900 8 000 8 000 8 400 6 000 6 000
Total skilled 9 000 10 000 10 200 11 478 11 000 12 400
Clerk 4 500 4 800 5 000 4 700 4 800 4 500
Sales 2 500 2 600 2 800 2 860 3 000 3 080
Skilled Agric. 1 950 1 200 1 500 1 920 2 200 1 950
Craft 3 000 3 033 3 466 3 300 3 466 3 500
Operator 3 000 3 000 3 100 3 466 3 500 3 500
Total semi-skilled
3 000 3 200 3 466 3 466 3 500 3 500
Elementary 1 516 1 600 1 750 1 900 2 100 2 200
Domestic worker
1 000 1 200 1 200 1 300 1 400 1 500
Total low-skilled
1 400 1 500 1 516 1 700 1 841 2 000
All occupations
2 900 3 000 3 115 3 033 3 033 3 100

Statistics South Africa 02-11-02
Labour market dynamics in South Africa, 2015
4-28
Employees in Gauteng earned more than those in other provinces. In 2015, the median monthly
earnings were highest in Gauteng (R4 500) followed by Western Cape (R3 250), followed by North
West and Mpumalanga with R3 000 each. Gauteng was the only province which recorded median
monthly earnings of R4 000 or more between 2012 and 2015.
Summary and conclusion The median monthly earnings for both men and women increased by R300 between 2010 and 2015.
The gender gap of R5 000 amongst the top 5% earners was observed in 2010 while the gap
increased to R8 000 in 2015.
The highest monthly median earnings for the own-account workers were observed in 2015 at R2 816
while for the employees, it was in 2012 at R3 115.
Median monthly earnings of the white population group have been consistently higher than those of
other population groups. The earnings for whites ranged from R9 850 in 2010 to R12 000 in 2015.
In 2015, amongst women those aged 25–34 years recorded the highest median monthly earnings of
R2 863 while men in the oldest age group (55–64 years) earned more than in other age categories.

Statistics South Africa 02-11-02
Labour market dynamics in South Africa, 2015
4-29
4.4 Decent work
Key labour market concepts
According to the International Labour Organization (ILO), decent work involves opportunities for work
that is productive and delivers a fair income, security in the workplace and social protection for families,
better prospects for personal development and social integration, freedom for people to express their
concerns, organise and participate in the decisions that affect their lives and equality of opportunity and
treatment for all women and men.
A 40–45 hour week is considered as the normal hours worked in a full-time job. Excessive hours are
considered as a week in which more than 48 hours are worked, which equates to a 6-day working
week of 8 hours per week.
Introduction
This section analyses the components of decent work which aims to measure whether different groups
in the labour market have equal opportunities in employment and income, safety and security in the
workplace, social protection, rights of association (union membership) and social dialogue.
Standards and rights at work This section analyses the basic standards and rights of employees at the workplace. Key indicators that
were used to measure these are paid sick leave, maternity/paternity leave, hours of work and trade
union membership. These indicators were reported by sex of the employees.
Figure 4.33: Entitlement of employees to paid sick leave, 2011 and 2015
Figure 4.34: Entitlement of employees to maternity/paternity leave, 2011 and 2015
Between 2011 and 2015, the proportion of employees who were entitled to paid sick leave increased by
0,6 of a percentage point to 68,3%. A higher proportion of employees who were entitled to paid sick
leave was observed among men as compared to women. The gender gap for this kind of leave was 1,9
percentage points in 2011 and 2,2 percentage points in 2015. On the other hand, Figure 4.34 shows
that more women than men were entitled to maternity/paternity leave in both 2011 and 2015. Both men
and women experienced a decline of 1,0 percentage point in terms of employees entitled to
maternity/paternity leave.

Statistics South Africa 02-11-02
Labour market dynamics in South Africa, 2015
4-30
Figure 4.35: Excessive hours worked (workers working more than 48 hours per week), 2011 and 2015
Figure 4.36: Proportion of employees who are members of a trade union, 2011 and 2015
The results in Figure 4.35 indicate that the proportion of employees who worked excessive hours (more
than 48 hours per week) declined by 1,5 percentage points between 2011 and 2015. Higher proportions
of male employees worked excessive hours compared to female employees. However, both men and
women experienced a decline in the proportions of employees who worked excessive hours between
2011 and 2015. Male employees were more likely to be members of a trade union relative to their
female counterparts. However, the proportion of employees who were members of a trade union
declined for both men and women by 2,1 percentage points and 1,6 percentage points respectively.
Figure 4.37: Proportion of employees who are members of a trade union within each industry, 2011 and 2015
The proportion of employees who were members of a trade union decreased from 29,3% in 2011 to
27,4% in 2015 by 1,9 percentage points. The proportions of employees who were members of a trade
union increased in three out of ten industries while the proportion unionised employees employed in
Private households remained unchanged at 0,5%. The largest increase in the proportion of employees
who were members of a trade union was observed in the Utilities industry (11,3 percentage points) and
the Mining industry (5,4 percentage points), while the largest declines were observed in the Community
and social services industry at 6,0 percentage points. Mining, Utilities and Community and social

Statistics South Africa 02-11-02
Labour market dynamics in South Africa, 2015
4-31
services accounted for the largest proportion of employees who were members of a trade union in both
2011 and 2015.
Social protection Access to social protection is recognised by both the ILO and United Nations as a basic human right. It
is one of the four strategic objectives of the ILO's Decent Work Agenda. The focus in terms of the ILO
objectives relating to social protection includes:
Extending the coverage and effectiveness of social security schemes;
Promoting labour protection, which comprises decent conditions of work, including wages, working
time and occupational safety and health as essential components of decent work; and
Working through dedicated programmes and activities to protect such vulnerable groups as migrant
workers and their families, and workers in the informal economy.
This section analysis changes in access to pension/retirement funds and medical aid benefits for
employees between 2009 and 2015. The results also compare the access of these benefits between
men and women.
Figure 4.38: Pension/retirement fund contribution by employer, 2009 and 2015
Figure 4.39: Entitlement to medical aid benefit from the employer, 2009 and 2015
Figure 4.38 shows that there was a marginal change in terms of the proportion of employees who had
access to pension/retirement fund contributions by their employers between 2009 and 2015. The
proportions for men declined by 0,9 of a percentage point while for women, an increase of 0,4 of a
percentage point was observed. The proportion of employees having access to medical aid benefits
decreased by 1,0 percentage point from 30,5% in 2009 to 29,5% in 2015. The gender gap was lower in
relation to those who were entitled to medical aid benefits. In 2015, the proportion of men entitled to
medical aid benefit was 30,2% while for women it was 28,6%.

Statistics South Africa 02-11-02
Labour market dynamics in South Africa, 2015
4-32
Figure 4.40: Entitlement to medical aid by population group, 2009 and 2015
Between 2009 and 2015, the proportion of employees who were entitled to medical aid benefits from
their employer declined by 1,0 percentage point nationally. In terms of population groups, the proportion
of employees who were entitled to medical aid benefits only decreased among whites while for the
coloured and black African population groups the proportions increased by less than a percentage point.
The largest increase of 3,4 percentage points was among the Indian/Asian population group which
increased from 43,9% in 2009 to 47,3% in 2015.
Social dialogue Social dialogue plays an important role in advancing opportunities for decent work amongst men and
women. It includes all forms of negotiation, consultation and exchanges of information amongst various
role players in the labour market, including representatives of business, government, and trade unions.
Figure 4.41: Annual salary increment by type of negotiation, 2011 and 2015

Statistics South Africa 02-11-02
Labour market dynamics in South Africa, 2015
4-33
In 2015, the proportion of employees indicating that their annual salary increment was negotiated by the
employer only increased by 7,4 percentage points to 55,4%. This was the only category that reflected
an increase between 2011 and 2015. All other types of negotiation for salary increments declined over
the period 2011 to 2015 with the largest decline amongst those who indicated that the negotiation was
between an individual and the employer (4,4 percentage points).
Summary and conclusion
More men than women were entitled to paid sick leave with a gender gap of 2,2 percentage
points in 2015.
In both 2011 and 2015, the working of excessive hours was higher amongst men compared to women, in addition they were more likely to be members of trade unions.
The largest increase in the proportion of employees who were members of a trade union was
observed in the Utilities industry (11,3 percentage points) and the Mining industry (5,4 percentage
points), while the largest declines were observed in the Community and social services industry
at 6,0 percentage points.
In 2015, the proportion of male employees entitled to medical aid benefits was 30,2% while for
women it was 28,6%.
Over the period 2011 to 2015, the proportion of employees indicating that their annual salary
increment was negotiated by the employer only increased by 7,4 percentage points to 55,4%.

Statistics South Africa 02-11-02
Labour market dynamics in South Africa, 2015
4-34
4.5 Job tenure Key concepts
Job tenure is the length of time that employed persons have been with their current employer. It is
measured as the length of time between two dates – the year and the month from the survey date and
the year and month the employed person started with their current employer.
Interpretation of tenure data
Job tenure, like hours worked and earnings, is a continuous measure. Summary statistics are
therefore used in this section to calculate job tenure.
Background In order to measure job tenure in the labour market, a question on both the month and year in which the
respondents started working for their current employer or started running their businesses were included
since the inception of the Quarterly Labour Force Survey (QLFS: 2008). Job tenure is a continuous
measure and is normally measured by successive monthly receipt of earnings from the same employer,
and as such this section will only report on medians. There are a number of factors which can affect
median tenure of workers, including changes in the age profile among workers, as well as changes in the
number of hires and separations.
Introduction This section analyses the length of time an employee has worked for his or her current employer.
Employee tenure is analysed with respect to socio-demographic variables such as age, gender,
population group. Trends in job tenure will further be assessed with regards to industry, occupation and
sector over the period 2009 to 2015.
Table 4.16: Median monthly employee tenure by sex, 2009–2015
2009 2010 2011 2012 2013 2014 2015
Job tenure Months
Men 40 42 46 47 47 48 43
Women 39 41 45 47 46 47 44
Both sexes 39 41 45 47 47 47 44
Thousand
Number of employees
12 030 11 652 11 901 12 240 12 712 13 065 13 499

Statistics South Africa 02-11-02
Labour market dynamics in South Africa, 2015
4-35
Figure 4.42: Median monthly tenure of employees, 2009–2015
Figure 4.43: Median monthly tenure of employee by sex, 2009–2015
Note: LHS refers to left-hand scale.
Figure 4.42 shows that the median job tenure of employees increased over the period 2009 to 2011
before it remained constant at 47 months for three consecutive years and then declined to 44 months in
2015. Thus, between 2014 and 2015, the increase in the number of employees was accompanied by a
decline in job tenure as potentially new labour market entrants found employment. After declining in 2010,
the number of employees increased gradually until 2015, reaching 13,5 million. Although median monthly
job tenure amongst men was higher relative women, job tenure increased amongst both groups over the
same period. On an annual basis in 2015, job tenure declined amongst both men and women; from 48
months to 43 months for men and from 47 to 44 months among women.
Figure 4.44: Median monthly employee tenure by population group, 2009 and 2015
Figure 4.45: Median monthly tenure employee tenure by sector, 2009 and 2015
The median job tenure varies among population groups. Over the period 2009 to 2015, median job tenure
was the highest amongst the white population group followed by Indian and coloured population groups,
while job tenure was lowest among black Africans across the years. There was a decline in monthly job
tenure for all population groups between 2014 and 2015, with the largest decline observed among the
coloured population group at 6 months and the smallest among the white population group at one month.
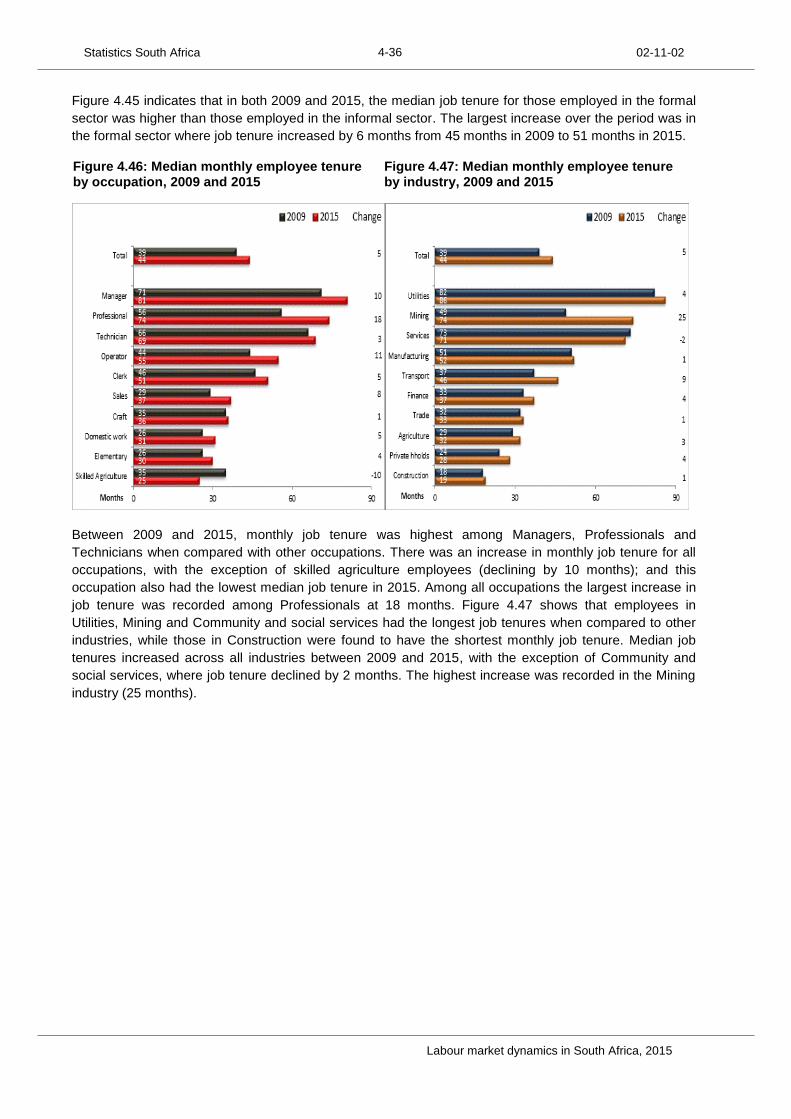
Statistics South Africa 02-11-02
Labour market dynamics in South Africa, 2015
4-36
Figure 4.45 indicates that in both 2009 and 2015, the median job tenure for those employed in the formal
sector was higher than those employed in the informal sector. The largest increase over the period was in
the formal sector where job tenure increased by 6 months from 45 months in 2009 to 51 months in 2015.
Figure 4.46: Median monthly employee tenure by occupation, 2009 and 2015
Figure 4.47: Median monthly employee tenure by industry, 2009 and 2015
Between 2009 and 2015, monthly job tenure was highest among Managers, Professionals and
Technicians when compared with other occupations. There was an increase in monthly job tenure for all
occupations, with the exception of skilled agriculture employees (declining by 10 months); and this
occupation also had the lowest median job tenure in 2015. Among all occupations the largest increase in
job tenure was recorded among Professionals at 18 months. Figure 4.47 shows that employees in
Utilities, Mining and Community and social services had the longest job tenures when compared to other
industries, while those in Construction were found to have the shortest monthly job tenure. Median job
tenures increased across all industries between 2009 and 2015, with the exception of Community and
social services, where job tenure declined by 2 months. The highest increase was recorded in the Mining
industry (25 months).

Statistics South Africa 02-11-02
Labour market dynamics in South Africa, 2015
4-37
Figure 4.48: Median monthly employee tenure by province, 2009 and 2015
Figure 4.49: Median monthly employee tenure by age, 2009 and 2015
In both 2009 and 2015, job tenure was highest in Gauteng, Western Cape and KwaZulu-Natal and lowest
in Northern Cape. The median job tenure increased in all provinces with the exception of the Northern
Cape where monthly job tenure declined by 6 months. The largest increase over the period occurred in
KwaZulu-Natal and Limpopo (with an increase of 7 months each respectively).
Figure 4.49 shows that monthly job tenure was higher among older employees than younger employees.
Those aged 55–64 had the highest monthly job tenure and this age group reflected the largest increase
over the period (17 months). The decrease in job tenure was observed among those aged 45–54 (7
months) and those aged 15–24 (2 months).
Figure 4.50: Median monthly employee tenure by level of education, 2009 and 2015
Figure 4.50 shows the disparities in median job tenure by level of education. Monthly job tenure was
highest among the better educated employees. Job tenure was highest amongst employees with tertiary
qualifications (as high as 71 months in 2015), followed by those with no education (58 months) while
those employees with incomplete secondary education (31 months) had the lowest monthly job tenure.
The median monthly job tenure increased among all education levels with the largest increase observed
among employees with tertiary qualifications (10 months).

Statistics South Africa 02-11-02
Labour market dynamics in South Africa, 2015
4-38
Summary and conclusion Although the median job tenure continued to increase from 39 months in 2009 to 47 months in 2014, the
median months worked at the current employer was constant for three successive years (from 2012 to
2014) and declined to 44 months in 2015.
Median job tenure was higher among men compared to women; however median job tenure increased
for both sexes over the period 2009 to 2015. Over the period 2009 to 2015, the white population group
had the highest median job tenure, followed by Indian and coloured employees while job tenure was the
lowest among black African employees.
Utilities, Mining and Community and social services had the longest job tenure when compared to other
industries while Construction was found to be the industry with the lowest monthly job tenure.
Monthly job tenure was higher among older employees relative to younger employees. Those aged 55–
64 had the highest monthly job tenure and this age group reflected the largest increase over the period
(17 months).
Employees with higher levels of education had higher monthly job tenure than those with lower levels of
education.

Statistics South Africa 02-11-02
Labour market dynamics in South Africa, 2015
4-39
4.6 Government job creation programmes Background Unemployment and poverty are the two biggest challenges facing the country. To address these
challenges, the South African government introduced several job creation programmes, including the
Expanded Public Works Programme (EPWP) aimed at equipping unemployed youth with the necessary
skills and experience needed in the labour market and creating jobs for those who cannot find work. The
EPWP creates work opportunities in four sectors, namely, Infrastructure, Non-State sectors, Environment
& Culture and Social. These programmes also aim to address service delivery challenges.
Introduction This section focuses on the analyses of people aged 15–64 years (the working age population)
participating in the EPWP and other government job creation programmes over the period 2011 to 2015.
The section first identifies the proportion of people who were aware of the EPWP and government job
creation programmes over the period and then presents the distribution of those who participated by
various attributes. Among those who participated in such programmes and were employed, a profile by
industry, occupation and sectors is also shown. The reference period for EPWP and other government job
creation programmes was 12 months prior to the survey interview.
Figure 4.51: Awareness about EPWP, proportion of the working age population (WAP) who have heard of the EPWP, 2011-2015
Figure 4.51 shows that the proportion of the working age population (15-64 years) who heard about the
EPWP increased steadily over the period 2011 to 2015. In 2011, 42,8% of the working-age population had
heard about EPWP and this increased to 52,4% in 2015.

Statistics South Africa 02-11-02
Labour market dynamics in South Africa, 2015
4-40
Characteristics of those who participated in government job creation programmes Figure 4.52: Proportion of those who participated in government job creation programmes by sex, 2011–2015
Over the period 2011 to 2015 more women participated in EPWP and other job creation programmes
compared to men. The proportion of women who participated in EPWP increased over the years while
men’s participation decreased slightly over the same period. In 2015, 35,6% of men participated in EPWP
and other government job creation programmes (down from 40,7% in 2011) while 64,4% of women
participated in such programmes.
Figure 4.53: Share of those who participated in government job creation programmes by age, 2011–2015
Figure 4.54: Share of those who participated in government job creation programmes by level of education, 2011 and 2015
Larger proportions of adults participated in EPWP and other such programmes compared to youth over
the period 2011 to 2015, with the exception of 2011 where youth accounted for the largest proportion
(51,1% youth compared to 48,9% adults). With regards to the level of education, the highest proportion of
people who participated in EPWP had qualifications which were below matric in both 2011 and 2015. An

Statistics South Africa 02-11-02
Labour market dynamics in South Africa, 2015
4-41
increase in the proportion of those who participated in EPWP was only reflected among those with below
matric qualifications (5,1 percentage points) while it decreased for both those participants with matric and
tertiary qualifications (3,6 and 2,4 percentage points respectively).
Figure 4.55: Proportion of those who participated in government job creation programmes by population group and sex, 2011 and 2015
Note: Other includes Coloured, Indian and White population groups
Figure 4.55 shows that black Africans were more likely to participate in government job creation
programmes, irrespective of sex. The proportion of both black African men and women who participated in
EPWP between 2011 and 2015 increased while amongst other population groups there was a decline
among both sexes. In terms of gender disparities among the black African population group, women
accounted for a higher share of those participating in the EPWP relative to men in both 2011 and 2015.
The share of black African women participation was 84,6% in 2011 and this increased to 89,2% in 2015
while the share of men was 83,3% in 2011 and further increased to 87,4% in 2015.
Figure 4.56: Proportion of those who participated in government job creation programmes by province, 2011 and 2015

Statistics South Africa 02-11-02
Labour market dynamics in South Africa, 2015
4-42
In 2015, the Eastern Cape accounted for the highest share of those who participated in EPWP and other
government job creation programmes at 18,9%, followed by KwaZulu-Natal (18,7%) while Northern Cape
had the lowest participation rate (4,4%). Between 2011 and 2015, participation declined in only three
provinces, namely KwaZulu-Natal, Gauteng and Limpopo of which the largest decline occurred in
KwaZulu-Natal (8,1 percentage points). The largest increase in the share of those who participated in
these programmes was in the North West where the participation rate increased by 6,9 percentage points.
Figure 4.57: Proportion of those who participated in government job creation programmes by labour market status, 2011 and 2015
Figure 4.57 shows that in both 2011 and 2015, the majority of those who participated in EPWP and other
government programmes were currently employed while those who were discouraged from looking for
work accounted for the lowest share. Between 2011 and 2015, the share only increased among those
who participated and were subsequently employed. The proportion increased from 56,9% in 2011 to
69,2% in 2015; an increase of 12,3 percentage points while the share amongst those who participated
and were classified in the category “Other not economically active” declined by 8,9 percentage points; the
largest decline over the period.
Employment by industry and occupation Figure 4.58: Employment by industry, 2011 and 2015
Figure 4.59: Employment by occupation, 2011 and 2015

Statistics South Africa 02-11-02
Labour market dynamics in South Africa, 2015
4-43
In both 2011 and 2015, the highest proportion of those who were employed and participated in the EPWP
and other government job creation programmes found a job in tertiary industries. In 2011, 58,1% of
people employed in the tertiary industries participated in the EPWP and this increased to 70,3% in 2015;
an increase of 12,2 percentage points over the period. The proportion of those employed in the primary
and secondary industries declined over the same period. Figure 4.56 shows that the majority of those who
participated in the EPWP were among those who were employed in low-skilled occupations. The
proportion increased from 51,1% in 2011 to 73,2% in 2015. A smaller proportion of persons who
participated in EPWP became employed in high-skilled occupations.
Figure 4.60: Employment by sector, 2011 and 2015
The proportion of those who participated in the EPWP or other government job creation programmes were
higher among those who were employed in the formal sector. The share of those employed in the formal
sector increased by 3,6 percentage points from 81,1% in 2011 to 84,6% in 2015 while there was a decline
in the participation in all other sectors over the same period. The largest decline was among those who
were employed in the informal sector (2,5 percentage points).
Summary and conclusion
Women were more likley to participate in EPWP or other government job creation programmes.
Over the period 2011 to 2015, a larger proportion of adults relative to youth participated in
EPWP and other such programmes except in 2011 where youth accounted for the largest
proportion at 51,1% compared to 48,9% of adults.
With regards to the level of education, persons with lower levels of edcuation were more likely
to particpate in these types of programmes.
A higher proportion of the black African population participated in government job creation
programmes, irrespective of sex.
When comparing provinces, Eastern Cape had the highest number of people who participated
in EPWP and other government job creation programmes at 18,9%, followed by KwaZulu-Natal
(18,7%).
The proportion of those who were employed in the formal sector, the participation in the EPWP
was higher compared to other sectors.

Statistics South Africa 02-11-02
Labour market dynamics in South Africa, 2015
4-44
4.7 Other forms of work Background
The production of goods and services for own final use by household members is a significant part of total
production in many countries and it plays an important role in improving and sustaining livelihoods. As
measured by the QLFS in the South African context, this production of goods and services by household
members for own final use includes activities such as subsistence farming, fetching water or collecting
wood or dung, production of other goods for household use, construction or major repairs to own or
household dwelling or structure and hunting or fishing for household use. In defining the production
boundary, the 1993 SNA recommends that the production of a good for own final use should be measured
when the amount produced is believed to be quantitatively important in relation to the total supply of the
good in the country. This section will provide insight into other forms of work done by household
members.
Introduction
It is on this basis that Statistics South Africa (Stats SA) collected information regarding own-use activities
since the inception of the QLFS in 2008 and is asked of all persons aged 15 years and above. The
analysis in this section is based on the QLFS results from 2011, to ensure that the information was
collected from persons who engaged in both market and own-use activities. The question relating to own-
use activities allows for multiple responses, as a result the distribution of such activities cannot be
summed to measure the total number of persons involved in such activities.
Table 4.17: Types of own-use activities, 2011–2015
2011 2012 2013 2014 2015 2011 2012 2013 2014 2015
Thousand % of working age
Subsistence farming 1 908 1 718 1 611 1 428 1 588 5,7 5,0 4,6 4,0 4,4 Fetching water or collecting wood/dung 4 148 4 085 4 233 4 152 4 664 12,4 12,0 12,2 11,7 12,9 Produce other goods for household use 254 121 93 106 157 0,8 0,4 0,3 0,3 0,4 Construction or major repairs to own or household dwelling/structure 367 267 280 275 310 1,1 0,8 0,8 0,8 0,9 Hunting or fishing for household use 112 37 31 34 34 0,3 0,1 0,1 0,1 0,1 Involvement in at least one activity 5 413 5 120 5 226 5 053 5 734 16,1 15,0 15,0 14,3 15,9
Note: The activities do not sum to the total since an individual could have undertaken more than one type of activity.
Over the period 2011 to 2015, fetching water or collecting wood was found to be the main type of activity
undertaken by household members aged 15–64 years for own-use, followed by subsistence farming,
while hunting or fishing for household use was the least prevalent activity undertaken by households for
own-use. Between 2011 and 2015, the number of persons engaged in each type of activity declined
except among those fetching water or collecting wood or dung. The proportion of the working age
population engaged in this activity increased slightly to 12,9% in 2015 from 12,4% in 2011.
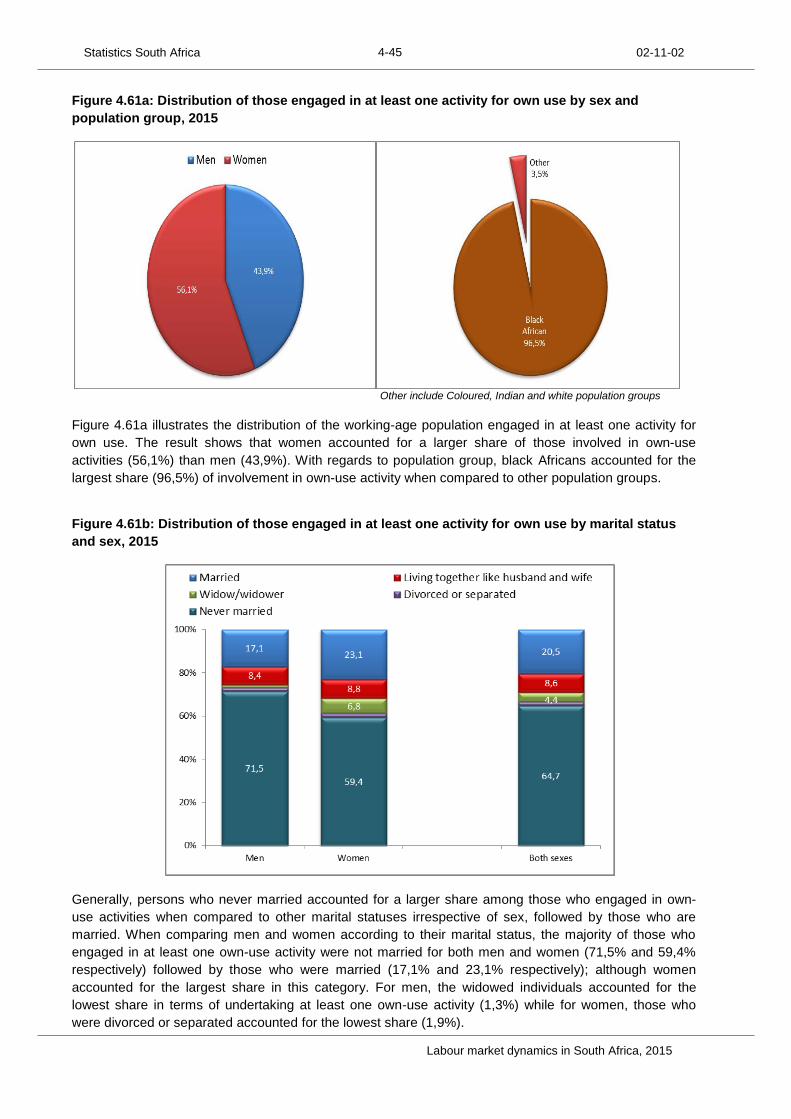
Statistics South Africa 02-11-02
Labour market dynamics in South Africa, 2015
4-45
Figure 4.61a: Distribution of those engaged in at least one activity for own use by sex and
population group, 2015
Other include Coloured, Indian and white population groups
Figure 4.61a illustrates the distribution of the working-age population engaged in at least one activity for
own use. The result shows that women accounted for a larger share of those involved in own-use
activities (56,1%) than men (43,9%). With regards to population group, black Africans accounted for the
largest share (96,5%) of involvement in own-use activity when compared to other population groups.
Figure 4.61b: Distribution of those engaged in at least one activity for own use by marital status
and sex, 2015
Generally, persons who never married accounted for a larger share among those who engaged in own-
use activities when compared to other marital statuses irrespective of sex, followed by those who are
married. When comparing men and women according to their marital status, the majority of those who
engaged in at least one own-use activity were not married for both men and women (71,5% and 59,4%
respectively) followed by those who were married (17,1% and 23,1% respectively); although women
accounted for the largest share in this category. For men, the widowed individuals accounted for the
lowest share in terms of undertaking at least one own-use activity (1,3%) while for women, those who
were divorced or separated accounted for the lowest share (1,9%).

Statistics South Africa 02-11-02
Labour market dynamics in South Africa, 2015
4-46
Figure 4.61c: Distribution of those engaged in at least one activity for own use, by age and level of
education, 2011 and 2015
Generally young people are more likely than adults to participate in at least one activity for own-use.
Figure 4.61c shows that in 2011, young people aged 15–24 years accounted for the largest share of those
who were engaged in at least one activity for own-use (36,9%) followed by those aged 25–34 years, while
adults aged 55–64 years accounted for the lowest share of those who were engaged in such activities.
Although participation was highest among those aged 15–24 years, the decline in their participation rate
over the period was the largest. The proportion decreased by 1,3 percentage points to 35,6% in 2015.
In terms of participation by level of education, those who had an incomplete secondary level of education
accounted for the largest share of those engaged in own-use activities in 2011 (49,0%). The proportion
increased to 51,0% in 2015; an increase of 2,0 percentage points. Those with a tertiary qualification
accounted for the lowest share of 4,1% in 2011 which increased to 5,0% in 2015. Only among persons
with a primary education and below primary level of education did the share decline (5,1 percentage
points).

Statistics South Africa 02-11-02
Labour market dynamics in South Africa, 2015
4-47
Table 4.18: Engagement in at least one own-use activity, 2011–2015
2011 2012 2013 2014 2015 Change
2011–2015 Thousand
South Africa 5 413 5 120 5 226 5 053 5 734 321 Sex
Men 2 248 2 116 2 186 2 162 2 514 266 Women 3 164 3 004 3 040 2 890 3 219 55 Age group
15–24 yrs 1 997 1 920 1 938 1 791 2 041 43 25–34 yrs 1 285 1 224 1 246 1 249 1 454 169 35–44 yrs 944 887 906 867 1 027 83 45–54 yrs 710 648 656 652 725 15 55–64 yrs 477 440 480 494 487 10 Population group
Black African 5 157 4 971 5 074 4 922 5 530 373 Coloured 109 64 78 58 89 -21 Indian/Asian 37 22 7 8 34 -3 White 109 62 66 65 81 -28 Province
Western Cape 93 64 44 45 59 -35 Eastern Cape 1 224 1 275 1 359 1 350 1 414 190 Northern Cape 83 96 100 60 94 11 Free State 154 128 133 129 115 -39 KwaZulu-Natal 1 591 1 530 1 482 1 387 1 649 58 North West 375 310 391 389 450 75 Gauteng 224 103 76 80 305 81 Mpumalanga 440 443 468 462 516 76 Limpopo 1 228 1 171 1 172 1 149 1 131 -97
For both men and women, the number of persons who were engaged in at least one own-use activity
increased between 2011 and 2015 (266 000 and 55 000 respectively). In terms of age group, there was
an increase over the period across all age groups. The largest increase was observed among persons
aged 25–34 years (169 000) followed by those aged 35–44 years (83 000). There was a decline amongst
all population groups except among black Africans where the number of persons increased by 373 000.
The number of persons who were engaged in at least one own-use activity declined in three of the nine
provinces. The largest decline was observed in Limpopo (97 000), followed by Free State (39 000) while
among those provinces where the number of persons engaged in own-use activity increased over this
period, the largest increase being recorded in Eastern Cape (190 000), followed by Gauteng (81 000).

Statistics South Africa 02-11-02
Labour market dynamics in South Africa, 2015
4-48
Own-use activities as a proportion of the working-age population
Figure 4.62: Involvement in at least one own-use activity as a proportion of the working-age
population, by sex, age group and population group, 2011 and 2015
Although the female proportion of the working-age who were engaged in activities for own-use was higher
than that of men, their share declined by 0,8 of a percentage point from 18,5% in 2011 to 17,6% in 2015
while the proportion of men increased by 0,5 of a percentage point. Over the period, there was a decline
across all age groups except for those aged 25–34 years, where an increase of 0,8 of a percentage point
was recorded. The proportion of the working-age population engaged in activities for own use declined
across all population groups, with the largest decline observed among coloured and white population
groups (0,8 of a percentage point each).
Figure 4.63: Engagement in at least one own-use activity by province, 2011 and 2015
Figure 4.64: Engagement in at least one own-use activity by level of education, 2011 and 2015

Statistics South Africa 02-11-02
Labour market dynamics in South Africa, 2015
4-49
The proportion of the working-age population engaged in at least one own-use activity was highest in the
Eastern Cape and Limpopo and lowest in the Western Cape. Between 2011 and 2015, the proportion of
persons engaged in at least one own-use activity decreased in four of the nine provinces. The largest
decline was observed in Limpopo from 37,1% in 2011 to 31,7% in 2015 (5,4 percentage points). Figure
4.64 highlights that those with lower levels of education were more likely to be engaged in at least one
own-use activity. In 2011, 30,4% of people with no education were engaged in these activities compared
to 6,3% of those with a tertiary education level. The proportion declined by 3,0 percentage points in 2015
for those with no education while it increased by 0,7 of a percentage point for those with tertiary
qualifications.
Summary and conclusion
The analysis in this section finds that between 2011 and 2015, women accounted for a larger share of
persons engaged in at least one activity for own-use. Generally, those who are not married accounted for
a larger share of those engaged in own-use activities when compared to other marital statuses,
irrespective of sex of the household member. In terms of the age group, young people are more likely to
participate in at least one activity for own-use relative to adults. With regards to population group, black
Africans accounted for a larger share of engagement in own-use activities when compared to other
population groups. The proportion of the working-age people engaged in at least one own-use activity was
higher in Eastern Cape and Limpopo and lowest in the Western Cape. Persons with lower levels of
edcuation were also more likley to engage in at least one activity for own-use.
References “Measuring the non-observed economy: A handbook”, OECD publications, 2002.

Chapter 5A profile of the unemployed


Statistics South Africa 02-11-02
Labour market dynamics in South Africa, 2015
5-2
Table of contents
Chapter 5: A profile of the unemployed ....................................................................................................... 3 Background .................................................................................................................................................. 3 Introduction .................................................................................................................................................. 3 The duration of unemployment .................................................................................................................... 6 Summary and conclusion ............................................................................................................................ 9

Statistics South Africa 02-11-02
Labour market dynamics in South Africa, 2015
5-3
Chapter 5: A profile of the unemployed
Background
Elevated levels of unemployment remain a problem, both globally and in South Africa. The ILO in the
publication “World Employment Social Outlook, 2016” finds that globally the number of unemployed in 2015
was 197,1 million and this is expected to rise to 199,4 million in 2016. The problem of unemployment is
most acute amongst the youth; in 2016, 71,0 million youth are expected to be unemployed across the
world, accounting for 35,0% of the global unemployed while accounting for only 21,0% of the global WAP.
Factors such as experience, gender, unemployment duration and education are important indicators for
labour market success. Unemployment is also an important driver for the reduction of poverty levels; the
International Monetary Fund (IMF1) estimates that a 10 percentage points reduction in the unemployment
rate will lower South African’s Gini coefficient by 3%.
Introduction
This chapter explores the levels of unemployment in the country over the period 2009 to 2015. The analysis
focuses on the levels and rates of unemployment by population group, level of education and activities of
the unemployed before they lost their jobs. The types of job search methods used by those without jobs
and the duration of unemployment are also analysed.
Table 5.1: Unemployment levels by population group, 2009–2015
2009 2010 2011 2012 2013 2014 2015
Thousand
Black African 3 836 3 948 3 998 4 101 4 171 4 335 4 634
Coloured 400 438 453 491 499 512 492
Indian/Asian 61 48 58 59 71 68 76
White 106 130 128 125 146 156 142
Total 4 403 4 564 4 636 4 775 4 886 5 070 5 344
Table 5.1 shows that between 2009 and 2015 the number of unemployed increased by 941 000, rising from
4,4 million in 2009 to a high of 5,3 million in 2015. Black Africans accounted for more than 85,0% of the
unemployed population in all years. Over the period, unemployment levels were lowest among
1 IMF Working paper, African Department, July 2016 “South Africa: Labour Market Dynamics and Inequality”, Anand R,
Kothari, S & Kumar, N.
Key labour market concepts
In order to be considered unemployed, three criteria must be met simultaneously: the person must be
completely without work, currently available to work, and taking active steps to find work.
Persons in short-term unemployment have been unemployed, available for work, and looking for a job for
less than one year.
Persons in long-term unemployment have been unemployed, available for work, and looking for a job for
one year or longer.
The long-term unemployment rate measures the proportion of the labour force that has been trying to find
work for a period of one year or longer.
The incidence of long-term unemployment is the proportion of the unemployed that has been unemployed
for one year or longer.

Statistics South Africa 02-11-02
Labour market dynamics in South Africa, 2015
5-4
Indians/Asians and whites. Between 2014 and 2015 the levels of unemployment declined among the
coloured and the white population by 20 000 and 14 000 persons respectively.
Table 5.2: Unemployment as a percentage of the working-age population by population group,
2009–2015
2009 2010 2011 2012 2013 2014 2015
Per cent
Black African 15,2 15,3 15,2 15,3 15,2 15,5 16,2
Coloured 13,2 14,2 14,4 15,4 15,4 15,6 14,8
Indian/Asian 6,8 5,3 6,2 6,3 7,5 7,0 7,8
White 3,3 4,0 4,0 3,9 4,6 5,0 4,6
Total 13,6 13,8 13,8 14,0 14,0 14,3 14,8
Over the period 2009–2015, the proportions of the unemployed amongst the working-age population were
highest among the black Africans and the coloureds, ranging from 13,2 % to 16,2% as highlighted in Table
5.2. In 2015, the proportion of the working-age population that was unemployed was lowest among the
Indians/Asians and whites at 7,8% and 4,6% respectively.
Table 5.3: Distribution of the unemployed by level of education, 2009–2015
Figure 5.1: Distribution of the unemployed by level of education, 2009 and 2015
The number of unemployed persons was higher among those who did not complete secondary education
and those who completed matric over the period 2009 and 2015 (Table 5.3). In 2015, the unemployed who
did not complete secondary education amounted to 2,5 million while those who completed matric were 1,8
million. The number of persons with tertiary education who were unemployed increased from 239 000 in
2009 to 418 000 in 2015. Between 2009 and 2015, the share of unemployment accounted for by the better
educated increased (Figure 5.1); the proportion of unemployed persons with tertiary education increased by
2,4 percentage points from 5,4% in 2009 to 7,8% in 2015. Those with a below matric education saw a
decline of 3,2 percentage points in their share of unemployment over the period.
2009 2010 2011 2012 2013 2014 2015
Thousands
No schooling 103 83 78 75 76 76 80
Primary incomplete 385 374 325 334 301 321 349
Primary completed 223 214 216 214 195 221 234
Secondary incomplete 2 011 2 077 2 161 2 258 2 329 2 382 2 473
Secondary completed 1 408 1 513 1 555 1 572 1 625 1 668 1 762
Tertiary 239 264 272 295 333 373 418
Other 33 39 30 27 27 29 27
Total unemployed 4 403 4 564 4 636 4 775 4 886 5 070 5 344

Statistics South Africa 02-11-02
Labour market dynamics in South Africa, 2015
5-5
Table 5.4: Unemployment by main activity before becoming unemployed, 2009–2015
Figure 5.2: Proportion of the unemployed by main activity before becoming unemployed, 2009 and 2015
Over the period 2009 to 2015, the majority of people currently unemployed were working prior to becoming
unemployed, followed by those who were attending school. The number of those who worked before
becoming unemployed increased from 2,3 million in 2009 to 2,8 million in 2015 while among those who
were attending school, the number increased from 1,4 million in 2009 to reach a high of 1,6 million in 2012,
declining to 1,5 million in 2015. Between 2009 and 2015, the proportion of the unemployed increased only
among those who were managing a home previously (5,2 percentage points). The largest decline in the
proportion of the unemployed was observed among those who were attending school previously (3,7
percentage points) followed by those who worked before (1,1 percentage points).
Figure 5.3: Types of job search activities, 2009 and 2015
Figure 5.3 shows that enquiring at workplaces or sought assistance from relatives or friends were the most
preferred methods for job search. The use of all job search methods increased over the period 2009 to
2015, with the exception of those who enquired at workplaces and among those who waited at the street
side for casual jobs (4,6 percentage points and 1,5 percentage points respectively). The largest increase
was observed among those who searched through job adverts or the internet (11,3 percentage points),
Working Managing
a home Attending
school Other Total
unemployed
Thousand
2009 2 320 617 1 393 72 4 403
2010 2 291 707 1 489 77 4 564
2011 2 245 789 1 546 56 4 636
2012 2 386 767 1 569 54 4 775
2013 2 430 830 1 533 93 4 886
2014 2 618 874 1 511 68 5 070
2015 2 759 1 029 1 492
64 5 344

Statistics South Africa 02-11-02
Labour market dynamics in South Africa, 2015
5-6
followed by those who answered advertisements (7,8 percentage points) and those who sought assistance
from relatives or friends (5,4 percentage points).
The duration of unemployment
This section analyses the trends in the duration of unemployment over the period 2009 to 2015. The
duration of unemployment is presented by the level of education, while the section concludes by analysing
the incidence of long-term unemployment by age, sex, population group, province and work experience.
Table 5.5: Trends in duration of unemployment and annual changes, 2009–2015
2009 2010 2011 2012 2013 2014 2015
Thousand
Short-term 1 750 1 566 1 456 1 533 1 660 1 729 1 863 Long-term 2 653 2 998 3 180 3 242 3 226 3 341 3 481 Total 4 403 4 564 4 636 4 775 4 886 5 070 5 344
2010 2011 2012 2013 2014 2015
Change: 2009-2015
Annual changes (Thousand)
Short-term -184 -110 76 127 70 133 113 Long-term 345 182 63 -16 114 141 828 Total 161 72 139 111 184 274 941
The results in Table 5.5 show that unemployment has been increasing over the period 2009 to 2015. The
long-term unemployed (unemployed for more than a year) accounted for the largest share of the
unemployed. Persons in long-term unemployment increased by 828 000 from 2,7 million in 2009 to 3,5
million in 2015 while those in short-term unemployment increased by 113 000. Short-term unemployment
declined only on an annual basis in 2010 and 2011 by 184 000 and 110 000 respectively while amongst
those in long-term unemployment, increases were observed in all years except in 2013 (decline of 16 000).
The largest increase among the long-term unemployment was observed between 2009 and 2010 (345 000)
followed by an increase of 182 000 people between 2010 and 2011. Amongst those in short-term
unemployment, the largest increase of 133 000 people was observed in 2014, followed by 127 000 people
in 2012.
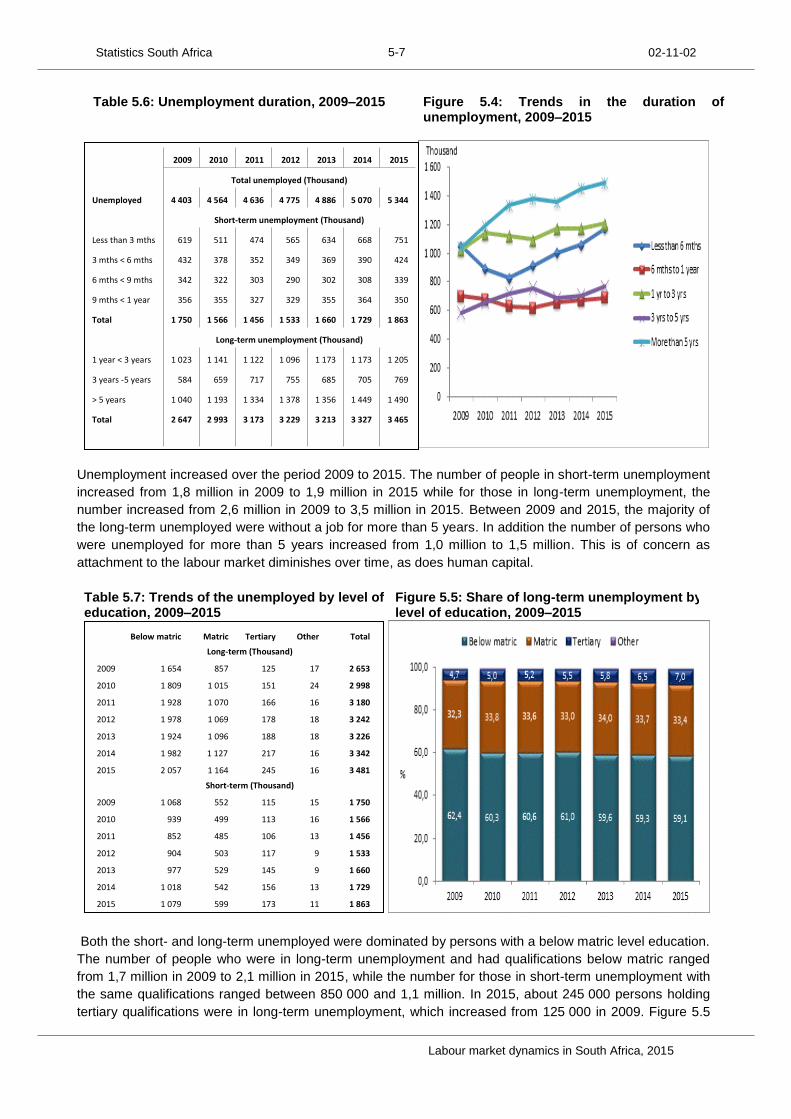
Statistics South Africa 02-11-02
Labour market dynamics in South Africa, 2015
5-7
Table 5.6: Unemployment duration, 2009–2015 Figure 5.4: Trends in the duration of unemployment, 2009–2015
Unemployment increased over the period 2009 to 2015. The number of people in short-term unemployment
increased from 1,8 million in 2009 to 1,9 million in 2015 while for those in long-term unemployment, the
number increased from 2,6 million in 2009 to 3,5 million in 2015. Between 2009 and 2015, the majority of
the long-term unemployed were without a job for more than 5 years. In addition the number of persons who
were unemployed for more than 5 years increased from 1,0 million to 1,5 million. This is of concern as
attachment to the labour market diminishes over time, as does human capital.
Table 5.7: Trends of the unemployed by level of education, 2009–2015
Figure 5.5: Share of long-term unemployment by level of education, 2009–2015
Both the short- and long-term unemployed were dominated by persons with a below matric level education.
The number of people who were in long-term unemployment and had qualifications below matric ranged
from 1,7 million in 2009 to 2,1 million in 2015, while the number for those in short-term unemployment with
the same qualifications ranged between 850 000 and 1,1 million. In 2015, about 245 000 persons holding
tertiary qualifications were in long-term unemployment, which increased from 125 000 in 2009. Figure 5.5
2009 2010 2011 2012 2013 2014 2015
Total unemployed (Thousand)
Unemployed 4 403 4 564 4 636 4 775 4 886 5 070 5 344
Short-term unemployment (Thousand)
Less than 3 mths 619 511 474 565 634 668 751
3 mths < 6 mths 432 378 352 349 369 390 424
6 mths < 9 mths 342 322 303 290 302 308 339
9 mths < 1 year 356 355 327 329 355 364 350
Total 1 750 1 566 1 456 1 533 1 660 1 729 1 863
Long-term unemployment (Thousand)
1 year < 3 years 1 023 1 141 1 122 1 096 1 173 1 173 1 205
3 years -5 years 584 659 717 755 685 705 769
> 5 years 1 040 1 193 1 334 1 378 1 356 1 449 1 490
Total 2 647 2 993 3 173 3 229 3 213 3 327 3 465
Below matric Matric Tertiary Other Total
Long-term (Thousand)
2009 1 654 857 125 17 2 653
2010 1 809 1 015 151 24 2 998
2011 1 928 1 070 166 16 3 180
2012 1 978 1 069 178 18 3 242
2013 1 924 1 096 188 18 3 226
2014 1 982 1 127 217 16 3 342
2015 2 057 1 164 245 16 3 481
Short-term (Thousand)
2009 1 068 552 115 15 1 750
2010 939 499 113 16 1 566
2011 852 485 106 13 1 456
2012 904 503 117 9 1 533
2013 977 529 145 9 1 660
2014 1 018 542 156 13 1 729
2015 1 079 599 173 11 1 863

Statistics South Africa 02-11-02
Labour market dynamics in South Africa, 2015
5-8
shows that persons with less than a matric education accounted for six out of every ten persons in long-
term unemployment. The shares of those in long-term unemployment holding matric qualifications ranged
from 32,3% in 2009 to 34,0% in 2013, declining to 33,4% in 2015. The long-term unemployed with a
completed tertiary education accounted for the lowest share but increased from 4,7% in 2009 to 7,0% in
2015.
Table 5.8: Incidence of long-term unemployment by age group, 2009–2015
Figure 5.6: Incidence of long-term unemployment by age group, 2009 and 2015
The incidence of long-term unemployment reached a peak in 2011 across all age groups except for those
aged 35–44 years (70,5% in 2012) (Table 5.8). On the other hand, the incidence of long-term
unemployment for those aged 45–54 years increased from 64,8% in 2009 to reach a high of 71,4% in 2011
and this incidence remained unchanged in 2012. Figure 5.6 highlights that there were increases in the
incidence of long-term unemployment among all age groups between 2009 and 2015. The largest increase
was observed among those aged 55–64 years (13,3 percentage points) followed by those aged 15–24
years (6,8 percentage points). The lowest increase of 2,6 percentage points was among those aged 35–44
years old.
Figure 5.7: Incidence of long-term unemployment by sex, 2009–2015
Figure 5.8: Incidence of long-term unemployment by population group, 2009–2015
15-24 25-34 35-44 45-54 55-64
Per cent
2009 53,9 62,4 64,2 64,8 56,3
2010 59,3 68,6 69,4 66,0 62,1
2011 62,9 71,1 69,8 71,4 71,4
2012 62,8 69,5 70,5 71,4 63,8
2013 61,1 67,9 68,7 67,5 62,8
2014 61,3 68,1 66,9 66,7 66,6
2015 60,7 66,0 66,7 68,5 69,6

Statistics South Africa 02-11-02
Labour market dynamics in South Africa, 2015
5-9
Figure 5.7 highlights that women are more likely to be in long-term unemployment than their male
counterparts. The incidence of long-term unemployment reached a peak in 2011 for both men (65,2%) and
women (72,0%). The results indicate that the incidence of long-term unemployment for men was lower than
the national average over the period 2009 to 2015. In terms of population group, black Africans reflected
higher incidences of long-term unemployment compared to other population groups while the lowest
incidence was observed among the white population group. The incidence of long-term unemployment
increased across all population groups between 2009 and 2015 with the largest increase observed
amongst whites (16,7 percentage points) and Indians/Asians (12,2 percentage points).
Figure 5.9: Incidence of long-term unemployment by province, 2009 and 2015
Figure 5.10: Incidence of long-term unemployment by work experience, 2009–2015
Nationally, the incidence of long-term unemployment increased by 4,9 percentage points over the period
2009 to 2015 (Figure 5.9). The incidence of unemployment increased in all provinces except in Limpopo
and the Northern Cape (declined by 1,5 percentage points and 0,3 of a percentage point respectively). The
largest provincial increase was in Free State (11,1 percentage points), Mpumalanga (11,0 percentage
points) and KwaZulu-Natal (7,7 percentage points). Figure 5.10 shows that unemployed people without
work experience have a higher incidence of long-term unemployment compared to those who have worked
before. The incidence of long-term unemployment among those who had worked before ranged from 48,6%
in 2009 to 55,9% in 2014 while for those without work experience the incidence, with the exception of 2009,
was above 80,0%. The highest incidence of long-term unemployment amongst those without work
experience was in 2011 at 82,8%.
Summary and conclusion
Over the period 2009 to 2015, the highest proportions of the working-age population who were
unemployed were amongst black Africans and coloureds.
Persons with less than a matric education and those with matric qualifications recorded higher
unemployment levels compared to those holding tertiary qualifications.
The most popular methods of searching for jobs were to enquire at workplaces and to seek
assistance from relatives or friends.
The incidence of long-term unemployment is higher amongst older age cohorts.
Women are more likely to be in long-term unemployment than men.
The incidence of long-term unemployment was higher among persons without previous work
experience compared to those who had worked before.

Chapter 6Youth in the South African labour market


Statistics South Africa 02-11-02
Labour market dynamics in South Africa, 2015
6-2
Table of contents
Chapter 6: Youth in the South African labour market .................................................................................. 3 Background .................................................................................................................................................. 3 Introduction .................................................................................................................................................. 3 Access to benefits among youth and adults ................................................................................................ 6 Discouragement among young people ...................................................................................................... 10 Youth who are Not in Employment, Education or Training (NEET) ........................................................... 12 Summary and conclusion .......................................................................................................................... 13
Statistics South Africa 02-11-02
Labour market dynamics in South Africa, 2015
6-3
Chapter 6: Youth in the South African labour market
Key labour market concepts Labour force: The labour force is the sum of employed and unemployed persons within the working-age population (WAP), i.e. persons between the ages of 15 and 64 years. Definitions of the employed, unemployed, discouraged and other non-economically active (NEA) are included in Chapter 4. Definitions of youth vary considerably amongst countries. The United Nations defines the youth as those aged between 15 and 24 years1. The South African definition of the youth refers to persons aged 15–34 years. NEET refers to Not in Employment, Education or Training. The NEET rate is the proportion of youth aged 15–24 years who are not in education, employment or training.
Background Unemployment is a global problem and is most acute amongst the youth; young people aged 15–24 are
three times more likely to be unemployed than are adults (ILO, 2006). The ILO publication entitled “World
Employment Social Outlook, Trends for Youth, 2016” highlights that the global youth unemployment rate
is expected to increase from 12,9% in 2015 to 13,1% in 2016 in line with the historic peak reached in
2013 (13,2%). The number of unemployed youth will reach 71 million in 2016. The vulnerability of the
youth extends beyond unemployment to higher incidences of working poverty; the report finds that
“37,7% of working youth are living in extreme or moderate poverty in 2016”.
In South Africa, the National Development Plan (NDP) was developed by government in order to create
an economy that is more inclusive and dynamic in meeting the needs of all citizens. One of the 2030
vision mentioned in the plan is to achieve full employment, decent work and sustainable livelihoods to
improve living standards and to ensure a dignified existence for all South Africans2. In addition, the
National Youth Policy (NYP) for 2015–2020 (NYP 2020) is focused on the development of young people
in the country, with the aim of redressing the wrongs of the past and addressing the specific challenges
and immediate needs of the country’s youth3.
High youth unemployment means young people are not acquiring the skills nor experience needed to
drive the economy forward. This hinders the country’s economic development and imposes a larger
burden on the state to provide social assistance. The previous report entitled “Labour market dynamics in
South Africa, 2014” highlighted that young people aged 15–34 years are vulnerable in the market as they
are faced with unemployment rates double that of adults while they are more likely to have limited or no
previous work experience, which reduces their future chances of finding employment.
Introduction
This chapter focuses on the labour market situation of youth aged 15–34 years. The analyses are based
on the patterns and trends of key labour market indicators over the period 2009 to 2015. In addition the
analyses are done with respect to socio-demographic variables such as age, gender, population group
and level of education. Furthermore, the number of young people, aged 15–24 years, who are ‘Not in
Employment, Education or Training (NEET)’ is analysed.
1 http://social.un.org/youthyear/docs/UNPY-presentation.pdf 2 National Development Plan, 11 November 2011 3 National Youth Policy,(2015-2020)

Statistics South Africa 02-11-02
Labour market dynamics in South Africa, 2015
6-4
Distribution of the working-age among youth and adults
Table 6.1: Trends in key labour market indicators among youth, 2009–2015
2009 2010 2011 2012 2013 2014 2015
Thousand Employed 6 052 5 739 5 771 5 868 6 008 6 021 6 312 Unemployed 3 141 3 180 3 205 3 271 3 295 3 377 3 512 Discouraged 1 042 1 360 1 523 1 537 1 549 1 584 1 511 Other not economically active 8 245 8 408 8 409 8 464 8 515 8 601 8 441 Working-age population 18 480 18 687 18 909 19 140 19 367 19 583 19 777 Annual changes
2010 2011 2012 2013 2014 2015
Change 2009-2015
Employed -313 32 96 140 13 291 260 Unemployed 39 25 66 24 82 136 371 Discouraged 318 164 14 12 35 -73 470 Other not economically active 163 1 55 51 85 -159 196 Working-age population 207 222 231 228 216 194 1 297
Over the period 2009 to 2015, the number of young people aged 15 to 34 years in the working age
population increased for six successive years from 18,5 million in 2009 to 19,8 million in 2015; an
increase of 1,3 million over the period. Between 2009 and 2015, the number of youth increased in all
labour market statuses; the number of employed, unemployed and discouraged youth increased by
260 000, 371 000 and 470 000 respectively. In 2015, the discouraged and inactive youth decreased
annually by 73 000 and 159 000 respectively, while the number of employed and unemployed youth
increased (291 000 and 136 000 respectively).
Table 6.2: Employment among the youth and adults by sector, 2009 and 2015
2009 2015
Youth Adults Total Youth Adults Total
Thousand
Formal sector 4 355 5 612 9 967 4 440 6 495 10 935
Informal sector 993 1 228 2 221 1 127 1 510 2 637
Agriculture 317 398 715 411 469 880
Private households 387 904 1 291 334 954 1 288
Total 6 052 8 142 14 194 6 312 9 428 15 741
Per cent
Formal sector 72,0 68,9 70,2 70,3 68,9 69,5
Informal sector 16,4 15,1 15,6 17,9 16,0 16,8
Agriculture 5,2 4,9 5,0 6,5 5,0 5,6
Private households 6,4 11,1 9,1 5,3 10,1 8,2
Total 100,0 100,0 100,0 100,0 100,0 100,0
Table 6.2 shows that employment in the formal sector is more stable and secure in nature; a higher
proportion of both youth and adults were employed in this sector when compared to other sectors. In both
2009 and 2015, the number of adults employed in the formal sector was higher compared to youth. Over
the period 2009 and 2015, formal sector jobs increased among both youth and adults (85 000 and
883 000 respectively); this was also the case for all other sectors among youth and adults except for the
number of youth employed in private households which decreased by 53 000. Between 2009 and 2015,
the share of adults who were employed in the formal sector remained constant at 68,9% while the share
of young people decreased by 1,7 percentage points from 72,0% in 2009 to 70,3% in 2015. The share of
young people and adults who were employed in the informal sector and Agriculture increased while
declining among both groups employed in private households.

Statistics South Africa 02-11-02
Labour market dynamics in South Africa, 2015
6-5
Figure 6.1: Labour market rates among the youth, 2009–2015
Figure 6.2: Labour market rates among adults, 2009–2015
Figures 6.1 and 6.2 show that between 2009 and 2015 the unemployment rate among youth was
consistently higher than that of adults, while the absorption and labour force participation rates were also
higher among adults. The unemployment rate for both youth and adults remained unchanged between
2010 and 2011 (35,7% and 14,7% respectively). Between 2009 and 2015 the unemployment rate for both
groups increased; the youth unemployment rate increased from 34,2% in 2009 to 35,8% in 2015 while the
adult unemployment rate increased from 13,4% in 2009 to 16,3% in 2015 (an increase by 1,6 percentage
points and 2,9 percentage points respectively). Over the same period the absorption rate declined
amongst both groups. The youth rate decreased from 32,7% in 2009 to 31,9% in 2015 while the adult rate
decreased from 58,7% in 2009 to 58,0% in 2015.
Employment by industry and occupation among youth
The analysis in this section will focus on the employment of youth in different industries over the period
2009 and 2015 and also the employment share of the youth by occupational categories.
Figure 6.3: Employed youth by industry, 2009 and 2015
Figure 6.4: Employed youth by occupation, 2009 and 2015

Statistics South Africa 02-11-02
Labour market dynamics in South Africa, 2015
6-6
Youth are predominately employed in Trade, Community and social services and Finance industries while
the share of youth employed was lowest in Utilities and Mining. Between 2009 and 2015, there was a
decline in the share of youth employed in five of the ten industries; namely Manufacturing, Trade, Private
households, Transport and Finance. The largest decline was in Manufacturing (2,3 percentage points).
For those industries where the share of youth employed increased over the period, the largest increase
was in the Community and social services (3,3 percentage points). With regards to occupation,
Elementary, Sales and Craft accounted for the largest share of youth employment while Skilled
Agriculture and Domestic workers contributed the lowest share to youth employment. Over the period
2009 to 2015, the largest increase in the share of youth employment was in Elementary occupations
which increased by 2,5 percentage points.
Access to benefits among youth and adults In the labour market, employers often look for skills and experience as they regard unskilled,
inexperienced job-seekers as a risky investment. Thus, accounting for the fact that young people are
mostly unemployed while those young people who have a job are often employed on contracts of limited
duration, which increases their vulnerability in the labour market. In addition, young people who are
employed on these types of contracts are often excluded from the employment benefits offered by the
employer, including paid sick leave or maternity/paternity leave.
Figure 6.5: Provincial access to medical aid among youth, 2009 and 2015
Figure 6.6: Provincial access to medical aid among adults, 2009 and 2015
Nationally access to medical aid benefits is higher among adults when compared to young people and this
is also the finding across all provinces. Between 2009 and 2015, access to medical aid benefits declined
among youth and adults. In 2009, 22,6% of youth had access to medical aid benefits and by 2015 this
decreased to 21,6% while among adults, over the same period access decreased from 36,8% in 2009 to
35,1% in 2015. North West, Gauteng and Western Cape were found to be the provinces where access to
medical aid benefits were higher for both youth and adults while medical aid benefits was less accessible
for youth in the Eastern Cape and amongst adults in KwaZulu-Natal.

Statistics South Africa 02-11-02
Labour market dynamics in South Africa, 2015
6-7
Figure 6.7: Provincial limited contract duration among youth, 2009 and 2015
Figure 6.8: Provincial limited contract duration among adults, 2009 and 2015
A permanent employment contract generally provides for a more stable working environment and better
access to benefits when compared to a limited employment contract. In South Africa, youth are more likely
to be employed on contractual basis of limited duration when compared to adults; this was also the case
across all the provinces. Between 2009 and 2015, the proportion of those employed on limited contracts
duration increased among both youth and adults (3,2 percentage points each). The share of youth
employed on a limited contract increased from 16,5% in 2009 to 19,7% in 2015 while amongst adults the
share increased from 8,0% in 2009 to 11,2% in 2015. The largest share of people who were employed on a
limited-duration contract was in the Eastern Cape and the Northern Cape which may be an indication that
permanent jobs are less common in these two provinces. Gauteng had the lowest share of people who
were employed on limited-duration contract; and this was the case for both youth and adults.
Unemployment duration among youth and adults
The analysis in this section focuses on the labour market status of youth and adults over the period 2009
and 2015 in relation to unemployment duration, particularly with respect to those in short-term
unemployment (i.e. unemployed for less than a year) and the long-term unemployed (unemployed for a
year or longer).

Statistics South Africa 02-11-02
Labour market dynamics in South Africa, 2015
6-8
Figure 6.9: Unemployment duration among youth and adults, 2009 and 2015
Young people aged 15–34 years accounted for the largest share of the long-term unemployment in both
2009 and 2015; a similar case was observed among those on short-term unemployment. Over the period,
the share of youth in both long and short-term unemployment declined while the share of adults in both
long and short-term unemployment increased. The share of youth in long-term unemployment decreased
from 69,6% in 2009 to 64,5% in 2015 while the share of adults in long-term unemployment increased over
the period from 30,4% to 35,5%.

Statistics South Africa 02-11-02
Labour market dynamics in South Africa, 2015
6-9
Education profile of youth
Education is recognised in South Africa and globally as central for development and the improvement of
the lives of young people. However, many education and training systems do not provide young people
with the basic skills which are deemed necessary and required by employers. Education is also
associated with more job opportunities, provides greater protection against job loss and improves the
chances of finding employment during an economic slowdown.
Figure 6.10: Education level of youth in the labour force, 2009 and 2015
Figure 6.11: Education level of youth in the labour force by sex, 2015
Generally education is associated with improved employment prospects. Between 2009 and 2015, the
level of education improved among both employed and unemployed youth. The share of employed and
unemployed youth with a tertiary qualification increased from 16,6% to 17,7%; and from 5,8% to 8,1%;
respectively in 2015. In contrast, the share of both the employed and unemployed youth with a below
matric level of education declined over the period (by 1,0 percentage point and 2,2 percentage points
respectively).
When comparing the education level of young women and men in the labour force, Figure 6.11 shows
that the share of both employed and unemployed women across all educational levels was higher than
that of men, with the exception amongst those with below matric level of education. Among employed
young women, 22,8% had a tertiary qualification compared to 14,1% of young men while among the
unemployed, 9,5% of young women had a tertiary qualification when compared to 6,7% of men.

Statistics South Africa 02-11-02
Labour market dynamics in South Africa, 2015
6-10
Figure 6.12: Youth unemployment rate by level of education, 2009 and 2015
Figure 6.13: Unemployed youth by work experience and province, 2015
Figure 6.12 shows that higher levels of education are associated with lower youth unemployment rates.
Between 2009 and 2015, youth unemployment rates increased across all education levels. The highest
youth unemployment rate was among those with below matric and also increased from 39,7% in 2009 to
41,0% in 2015, the smallest increase over the period amongst all educational grouping (1,3 percentage
points). Although the unemployment rate was lowest among youth with a tertiary education, the increase
over the period was the largest (5,0 percentage points). Previous work experience increases the chances
of getting a job. In South Africa, young people without prior work experience accounted for 50,9% of
unemployed youth. This was the case for most of the provinces, where the youth with no previous work
experience accounted for the largest share of the unemployed, except in the Northern Cape, Western
Cape, North West and Limpopo where youth with prior work experience accounted for the largest share
of the unemployed. In the Northern Cape, young people who had no previous work experience accounted
for 35,4% of the unemployed compared to 56,5% in Gauteng.
Discouragement among young people The economy demands highly-skilled labour therefore lower levels of education, no previous work
experience or skills is associated with lower employment levels. Many young people are poorly educated;
do not have prior work experience or skills which makes it difficult for them to find a job and as a result
they end up losing hope in finding a job and enter the ranks of the discouraged.

Statistics South Africa 02-11-02
Labour market dynamics in South Africa, 2015
6-11
Figure 6.14: Distribution of the discouraged youth by level of education, 2009 and 2015
Figure 6.15: Distribution of the discouraged youth by sex, 2015
Figure 6.14 shows that the majority of young people who are discouraged are those with lower education
levels, however this education category was the only group to reflect a decline in its share in
discouragement over the period. Between 2009 and 2015, the share of young people with a below matric
education qualification who were discouraged decreased from 72,5% to 66,8%; a decline of 5,7
percentage points. In terms of sex, women were more likely to be discouraged than men irrespective of
level of education, except among those with a below matric level of education where a higher proportion
of young men (70,3%) were discouraged relative to young women (63,8%).
Figure 6.16: Share of discouraged youth by province, 2009 and 2015
Between 2009 and 2015, the proportion of youth who were discouraged increased from 5,6% to 7,6%. An
increase was observed across all provinces over the period with the exception of the Free State where the
proportion declined by 1,4 percentage points. In 2015, discouragement among youth was highest in
Limpopo and Eastern Cape (12,0% each). Between 2009 and 2015, the increase in the share of
discouraged youth was highest in the North West (4,4 percentage points).

Statistics South Africa 02-11-02
Labour market dynamics in South Africa, 2015
6-12
Youth who are Not in Employment, Education or Training (NEET)
The NEET indicator refers to young men and women between the ages 15 and 24 who are not in
education, employment or training. The purpose of this indicator is to monitor labour market and social
dynamics of young people touching on issues of unemployment, early school leaving and labour market
discouragement. This indicator is used to address a broad array of vulnerabilities among youth. The ILO
publication “World Employment Social Outlook, Trends for Youth, 2016” finds that “survey evidence for
some 28 countries around the globe shows that roughly 25 per cent of the youth population aged between
15 and 29 years old are categorised as NEET”.
Figure 6.17: NEET rate for youth aged 15–24 years in single years, 2013 and 2015
Figure 6.17 shows that the NEET rate increases with age. The pace at which the rate increases is rapid
between the ages 19 and 24. Between 2013 and 2015, close to 50% or more of youth aged 22–24 years
were classified as NEET. In 2015, young people aged 24 years were more than ten times more likely to be
NEET compared to who were 15 years old.
Figure 6.18: NEET rate for youth aged 15–24 by
population group, 2013 and 2015
Figure 6.19: NEET rate for youth aged 15–24
by province, 2013 and 2015

Statistics South Africa 02-11-02
Labour market dynamics in South Africa, 2015
6-13
Between 2013 and 2015, the NEET rate of young people in South Africa decreased by 1,5 percentage
points from 32,0% to 30,5%. The NEET rate for young black Africans and coloured youth was higher than
that of other population groups. In 2015, the rate for both Black Africans (31,7%) and coloured youth
(32,0%) was more than double the rate of white youth (13,9%). Over the same period, the rate decreased
across all provinces except in the Northern Cape and Free State. In 2015, the NEET rate was highest in
the Northern Cape (36,5%) and the North West (32,7%) while the NEET rate was below the national
average in KwaZulu-Natal, Gauteng, Western Cape and Limpopo.
Figure 6.20: NEET rate for youth aged 15–24 by sex, 2013 and 2015
Figure 6.21: NEET rate for youth aged 15–24 by level of education, 2013 and 2015
Figure 6.20 shows that in both 2013 and 2015 female NEET rates were higher than male rates. Between
2013 and 2015 the rate for both sexes declined; the rate among young women decreased from 34,7% to
33,1% while the rate for men decreased from 29,3% to 27,9%. In terms of education level, a higher NEET
rate is often associated with lower education levels. This was not the case in South Africa as the NEET rate
among youth with higher levels of education was higher than that of those with lower level of education. In
2015, the NEET rate for youth with a matric (42,9%) and tertiary (35,7%) qualification was higher than that
of youth with below matric (25,8%). Although the rate was highest among those with tertiary education, the
NEET rate declined the most over the period for this educational category (3,0 percentage points).
Summary and conclusion
The number of young people aged 15 to 34 years in the working age population rose steadily over the period 2009 to 2015. Between 2009 and 2015, the number of youth increased for all labour market statuses.
The results show that adults are more employable than youth across all sectors. Employment in the formal sector is considered to be more stable and secure relative to other sectors, hence a higher proportion of both youth and adults were employed in the formal sector.
Youth are mostly employed in Trade, Community and social services and Finance industries while employment opportunities for youth was lowest in Utilities and Mining. Between 2009 and 2015, the largest decline in the share of youth employed by industry was in Manufacturing (2,3 percentage points).

Statistics South Africa 02-11-02
Labour market dynamics in South Africa, 2015
6-14
In terms of access to benefits, a higher proportion of adults have access to medical aid benefits when compared to young people nationally and across all provinces. A similar pattern was observed in terms of employment contracts; youth were more likely to be employed on a contract of limited duration.
Between 2009 and 2015, the level of education improved among both the employed and unemployed youth. The share of both the employed and unemployed youth with a below matric level of education declined over the period (1,0 percentage point and 2,2 percentage points respectively).
In South Africa the youth NEET rate is higher amongst the better educated youth; in 2015, the NEET rate for youth with matric (42,9%) and Tertiary (35,7%) qualification was higher than that of youth with below matric (25,8%).

Appendices

Statistics South Africa A-2 02-11-02
Labour market dynamics in South Africa, 2015

Statistics South Africa A-3 02-11-02
Labour market dynamics in South Africa, 2015
Appendix 1: Technical notes
Missing values
These were imputed in the QLFS.
The annual data presented in this report have been derived as follows:
QLFS data covering the period 2009–2015 are averages of the results obtained for
the four quarters each year over the period 2009 to 2015.
Rounding
Totals may sometimes differ from the sum of the constituent parts by small amounts due to
rounding.
Master Sample design
The Quarterly Labour Force Survey (QLFS) is based on the 2013 Master Sample
Current master sample
The QLFS frame has been developed as a general-purpose household survey frame that
can be used by all other household surveys irrespective of the sample size requirement of
the survey. The sample size for the QLFS is roughly 33 000 dwellings per quarter.
The sample is based on information collected during the 2011 Population Census conducted
by Stats SA. The sample is designed to be representative at provincial level and within
provinces at metro/non-metro level. Within the metros, the sample is further distributed by
geography type. The three geography types are: urban, traditional and farms. This implies,
for example, that within a metropolitan area the sample is representative at the different
geography types that may exist within that metro.
The current sample size is 3 324 PSUs. It is divided equally into four subgroups or panels
called rotation groups. The rotation groups are designed in such a way that each of these
groups has the same distribution pattern as that which is observed in the whole sample.
They are numbered from one to four and these numbers also correspond to the quarters of
the year in which the sample will be rotated for the particular group.
The sample for the redesigned labour force survey (i.e. the QLFS) is based on a stratified
two-stage design with probability proportional to size (PPS) sampling of primary sampling
units (PSUs) in the first stage, and sampling of dwelling units (DUs) with systematic
sampling in the second stage.
Each quarter, a ¼ of the sampled dwellings rotate out of the sample and are replaced by
new dwellings from the same PSU or the next PSU on the list. Thus, sampled dwellings will
remain in the sample for four consecutive quarters. It should be noted that the sampling unit
is the dwelling, and the unit of observation is the household. Therefore, if a household
moves out of a dwelling after being in the sample for, say two quarters, and a new
household moves in, then the new household will be enumerated for the next two quarters. If
no household moves into the sampled dwelling, the dwelling will be classified as vacant
(unoccupied).

Statistics South Africa A-4 02-11-02
Labour market dynamics in South Africa, 2015
Gross flows
All social and economic statistics can be expressed as either stock or flows. Stocks
measure the quantities of a variable at a specific point in time while flows are the movements
occurring between 2 points in time or an interval of time. Flows and stocks are linked as
flows change the level of stocks.
When referring to gross and net flows, the relationship is as follows:
Gross flows in – Gross flows out = Net flows.
Surveys such as the QLFS produces net flow data, while panel data attempts to investigate gross
flows underlying the net flows in the QLFS.
Gross flows matrix and interpretation
Transition matrix between period t and t+1
Status in period t + 1
Status in Period t Employed Unemployed Not Economically Active
Employed
Unemployed
Not Economically Active
Interpretation of flows Definition
Inflows to
Employment UE+NEAE
Unemployment EU+NEAU
Not Economically Active ENEA+UNEA
Outflows from
Employment EU+ENEA
Unemployment UE+UNEA
Not Economically Active NEAE+NEAU

Statistics South Africa A-5 02-11-02
Labour market dynamics in South Africa, 2015
Constructing the QLFS panel for Gross flow analysis
Gross flow analysis requires the linking of individuals who appear in two consecutive
quarters in the QLFS sample. Seven variables are used as matching criteria for the records
namely:
Name
Surname
Gender
Age
Year of birth
Verified age
Population group
The scoring model for gender and population groups requires an exact match between 2
quarters to assign a score of 0 otherwise a score of 1 is allocated. Name and surname are
scored, using the SAS function Complev. Complev returns the Levenshtein edit distance
between two strings. If the score is less or equal to 3 (ie the 2 names are more or less the
same) the score becomes 0 If the score is higher than 3, the score becomes 1. For the
variables regarding age, month, year of birth and verified age, the scoring model allows for a
difference of 2 between the 2 strings. A perfect score of zero is assigned if the score for all 7
variables is 0.
Weighting methodology for the QLFS panel1
Adjustments
The Gross Flow Estimation was based on data of persons aged 15-64 years from only three
overlapping panels from two consecutive quarters. The QLFS adjusted base weights from
time T were therefore adjusted by a factor of 4 3⁄ to account for the non-overlapping panel.
A ‘Person non-match’ (also referred to as the panel non-response) adjustment factor was
calculated based on whether the person records at time T were matched or not with a
person record at time T+1 and the persons in labour force age at time T but were reported
as younger than 15 years at time T+1.
The person records in the panel data were classified into the following response categories:
Respondent: Persons that were matched in the panel data and were reported to be
aged 15-64 years at both time T and T+1
Non-Respondent: (a) Persons that were non-matched in the panel data and from the
overlapping panels with age 15-64 years
1 Please see appendix for details on matched records on a quarterly basis.
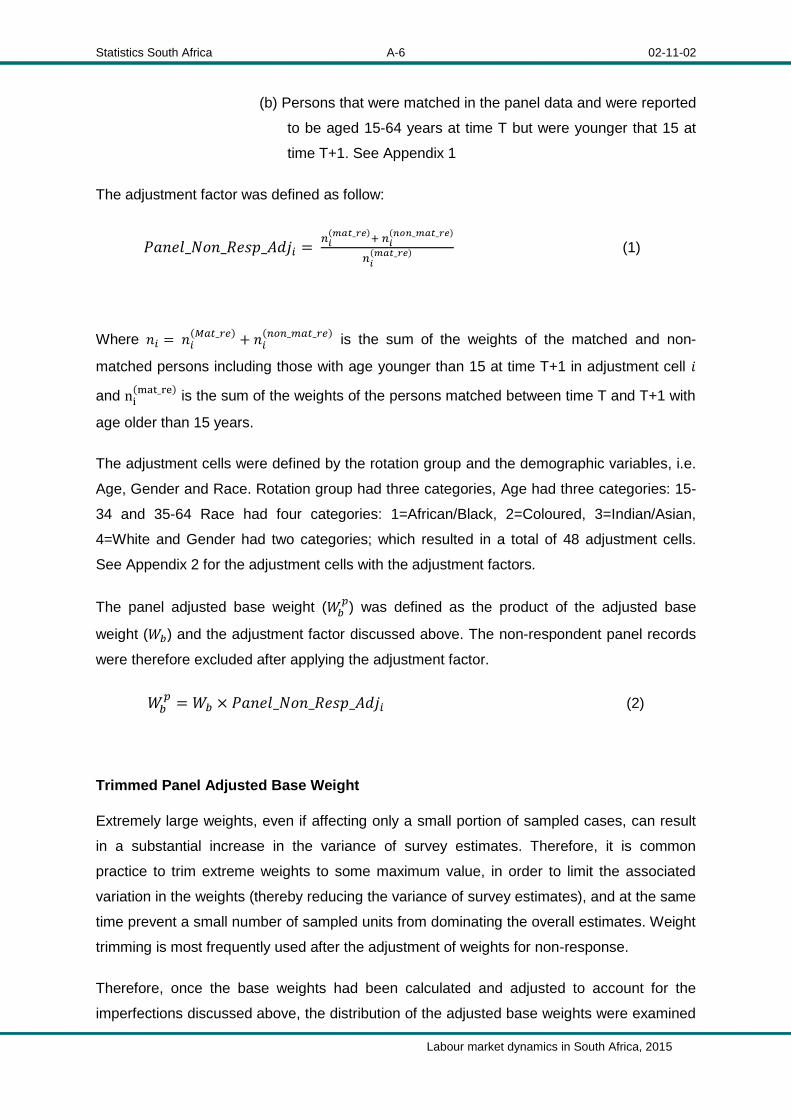
Statistics South Africa A-6 02-11-02
Labour market dynamics in South Africa, 2015
(b) Persons that were matched in the panel data and were reported
to be aged 15-64 years at time T but were younger that 15 at
time T+1. See Appendix 1
The adjustment factor was defined as follow:
𝑃𝑎𝑛𝑒𝑙_𝑁𝑜𝑛_𝑅𝑒𝑠𝑝_𝐴𝑑𝑗𝑖 = 𝑛𝑖
(𝑚𝑎𝑡_𝑟𝑒)+ 𝑛𝑖
(𝑛𝑜𝑛_𝑚𝑎𝑡_𝑟𝑒)
𝑛𝑖(𝑚𝑎𝑡_𝑟𝑒) (1)
Where 𝑛𝑖 = 𝑛𝑖(𝑀𝑎𝑡_𝑟𝑒)
+ 𝑛𝑖(𝑛𝑜𝑛_𝑚𝑎𝑡_𝑟𝑒)
is the sum of the weights of the matched and non-
matched persons including those with age younger than 15 at time T+1 in adjustment cell 𝑖
and ni(mat_re)
is the sum of the weights of the persons matched between time T and T+1 with
age older than 15 years.
The adjustment cells were defined by the rotation group and the demographic variables, i.e.
Age, Gender and Race. Rotation group had three categories, Age had three categories: 15-
34 and 35-64 Race had four categories: 1=African/Black, 2=Coloured, 3=Indian/Asian,
4=White and Gender had two categories; which resulted in a total of 48 adjustment cells.
See Appendix 2 for the adjustment cells with the adjustment factors.
The panel adjusted base weight (𝑊𝑏𝑝) was defined as the product of the adjusted base
weight (𝑊𝑏) and the adjustment factor discussed above. The non-respondent panel records
were therefore excluded after applying the adjustment factor.
𝑊𝑏𝑝 = 𝑊𝑏 × 𝑃𝑎𝑛𝑒𝑙_𝑁𝑜𝑛_𝑅𝑒𝑠𝑝_𝐴𝑑𝑗𝑖 (2)
Trimmed Panel Adjusted Base Weight
Extremely large weights, even if affecting only a small portion of sampled cases, can result
in a substantial increase in the variance of survey estimates. Therefore, it is common
practice to trim extreme weights to some maximum value, in order to limit the associated
variation in the weights (thereby reducing the variance of survey estimates), and at the same
time prevent a small number of sampled units from dominating the overall estimates. Weight
trimming is most frequently used after the adjustment of weights for non-response.
Therefore, once the base weights had been calculated and adjusted to account for the
imperfections discussed above, the distribution of the adjusted base weights were examined

Statistics South Africa A-7 02-11-02
Labour market dynamics in South Africa, 2015
for possible extreme weights and were trimmed at the 99th percentile as the maximum cut-off
value. Meaning that if the adjusted base weight for the sampled units were greater than the
99th percentile, the adjusted base weight for these cases was set equal to the 99th percentile.
The trimmed adjusted base weight (𝑊𝑡𝑝) is defined as:
𝑊𝑡𝑝 = {
99𝑡ℎ𝑝𝑒𝑟𝑐𝑒𝑛𝑡𝑖𝑙𝑒 , 𝑤ℎ𝑒𝑟𝑒 𝑊𝑏𝑝 > 99𝑡ℎ𝑝𝑒𝑟𝑐𝑒𝑛𝑡𝑖𝑙𝑒
𝑊𝑏𝑝 , 𝑜𝑡ℎ𝑒𝑟 𝑤𝑖𝑠𝑒
(3)
The adjustment factor was defined as follow:
𝑃𝑎𝑛𝑒𝑙_𝑁𝑜𝑛_𝑅𝑒𝑠𝑝_𝐴𝑑𝑗𝑖 = 𝑛𝑖
(𝑚𝑎𝑡_𝑟𝑒)+ 𝑛𝑖
(𝑛𝑜𝑛_𝑚𝑎𝑡_𝑟𝑒)
𝑛𝑖(𝑚𝑎𝑡_𝑟𝑒) (1)
Where 𝑛𝑖 = 𝑛𝑖(𝑀𝑎𝑡_𝑟𝑒)
+ 𝑛𝑖(𝑛𝑜𝑛_𝑚𝑎𝑡_𝑟𝑒)
is the sum of the weights of the matched and non-
matched persons including those with age younger than 15 at time T+1 in adjustment cell 𝑖
and ni(mat_re)
is the sum of the weights of the persons matched between time T and T+1 with
age older than 15 years.
The adjustment cells were defined by the rotation group and the demographic variables, i.e.
Age, Gender and Race. Rotation group had three categories, Age had three categories: 15-
34 and 35-64 Race had four categories: 1=African/Black, 2=Coloured, 3=Indian/Asian,
4=White and Gender had two categories; which resulted in a total of 48 adjustment cells.
See Appendix 2 for the adjustment cells with the adjustment factors.
The panel adjusted base weight (𝑊𝑏𝑝) was defined as the product of the adjusted base
weight (𝑊𝑏) and the adjustment factor discussed above. The non-respondent panel records
were therefore excluded after applying the adjustment factor.
𝑊𝑏𝑝 = 𝑊𝑏 × 𝑃𝑎𝑛𝑒𝑙_𝑁𝑜𝑛_𝑅𝑒𝑠𝑝_𝐴𝑑𝑗𝑖 (2)
Statistics South Africa A-8 02-11-02
Labour market dynamics in South Africa, 2015
Limitations
The calibrated weights provided should be used with caution to the following limitations:
1. The reference period for the Panel data analysis is time T.
2. The demographic variables at time T are assumed to be correct and should be used
for the analysis.
3. For analysis purposes, the Calibrated weight is named ‘GF_CALWGT’.
4. Estimates at aggregate levels, such as the broad age groups, gender and labour
force status only, will be comparable to the initial published estimates.
5. Estimation can only be done for ages 15-64.

Statistics South Africa P02-11-01 P0120
Labour market dynamics in South Africa, 2015
A2-1
Appendix 2: Statistical tables
Page
Table 2.1: Population of working age (15-64 years) ..........................................................................................................3
Table 2.2: Labour force characteristics by sex - All population groups .............................................................................4
Table 2.3: Labour force characteristics by population group .............................................................................................5
Table 2.4: Labour force characteristics by age group .......................................................................................................6
Table 2.4: Labour force characteristics by age group (concluded) ...................................................................................7
Table 2.5: Labour force characteristics by province ..........................................................................................................8
Table 2.5: Labour force characteristics by province (continued) .......................................................................................9
Table 2.5: Labour force characteristics by province (concluded) ................................................................................... 10
Table 2.6: Labour force characteristics by sex - Expanded definition of unemployment ............................................... 11
Table 2.7: Labour force characteristics by population group - Expanded definition of unemployment .......................... 12
Table 2.8: Labour force characteristics by age group .................................................................................................... 13
Table 2.8: Labour force characteristics by age group (concluded) ................................................................................ 14
Table 2.9: Labour force characteristics by province - Expanded definition of unemployment ....................................... 15
Table 2.9: Labour force characteristics by province - Expanded definition of unemployment (continued) .................... 16
Table 2.9: Labour force characteristics by province - Expanded definition of unemployment (concluded) ................... 17
Table 3.1: Employed by industry and sex - South Africa ................................................................................................ 18
Table 3.2: Employed by industry and province ............................................................................................................... 19
Table 3.2: Employed by industry and province (concluded) ........................................................................................... 20
Table 3.3: Employed by sector and industry - South Africa ........................................................................................... 21
Table 3.4: Employed by province and sector ................................................................................................................. 22
Table 3.4: Employed by province and sector (concluded) ............................................................................................. 23
Table 3.5: Employed by sex and occupation - South Africa ........................................................................................... 24
Table 3.6: Employed by sex and status in employment - South Africa .......................................................................... 25
Table 3.7: Employed by sex and usual hours of work - South Africa ............................................................................. 26
Table 3.8a: Conditions of employment - South Africa .................................................................................................... 27
Table 3.8b: Conditions of employment - South Africa .................................................................................................... 28
Table 3.8c: Conditions of employment - South Africa .................................................................................................... 29
Table 3.9: Time-related underemployment - South Africa .............................................................................................. 30
Table 3.10: Employed by industry and volume of hours worked - South Africa ............................................................. 31
Table 3.11: Employed by industry and average hours of work ...................................................................................... 32
Table 3.12: Employed by occupation and volume of hours worked ............................................................................... 33
Table 3.13: Employed by occupation and average hours of work .................................................................................. 34
Table 3.14: Employed by sector and volume of hours worked ....................................................................................... 35
Table 3.15: Employed by sector and average hours of work ......................................................................................... 36
Table 3.16: Employment by sex and province ................................................................................................................ 37
Table 3.17: Distribution of monthly earnings for employees by selected population group and sex ............................. 38
Table 3.18: Distribution of monthly earnings for employees by age group and sex ....................................................... 39
Table 3.19: Distribution of monthly earnings of employees by province and sex .......................................................... 40
Table 3.20: Distribution of monthly earnings for employees by occupation and sex ..................................................... 41
Table 3.21: Distribution of monthly earnings for employees by industry and sex .......................................................... 42
Table 3.22: Unemployment rate by level of education - South Africa ............................................................................ 43

Statistics South Africa P02-11-01 P0120
Labour market dynamics in South Africa, 2015
A2-2
Table 3.23: Adequate earnings and productive work - Low pay rate (below 2/3 of median monthly earning)............... 43
Table 3.24: Proportion of employees who are entitled to paid sick leave ...................................................................... 43
Table 3.25: Proportion of employees who are entitled to maternity/paternity leave ....................................................... 43
Table 3.26: Decent hours ............................................................................................................................................... 44
Table 3.27: Rights at work and social dialogue .............................................................................................................. 44
Table 3.28: Proportion of employees whose employer contribute to a pension/retirement fund for them ..................... 44
Table 3.29: Proportion of employees who are entitled to medical aid benefit from the employer by sex ...................... 44
Table 3.30: Proportions of employees by how annual salary increment is negotiated .................................................. 45
Table 4.1: Characteristics of the unemployed - South Africa ......................................................................................... 45
Table 4.2: Characteristics of the unemployed by province ............................................................................................. 46
Table 4.3: The duration of unemployment ...................................................................................................................... 47
Table 5: Characteristics of the not economically active - South Africa........................................................................... 48
Table 6.1a: Socio-demographic characteristics - South Africa ....................................................................................... 49
Table 6.1b: Socio-demographic characteristics - South Africa ....................................................................................... 50
Table 6.1c: Socio-demographic characteristics - South Africa ....................................................................................... 51
Table 7: Profile of those not in education and not in employment - South Africa ........................................................... 52
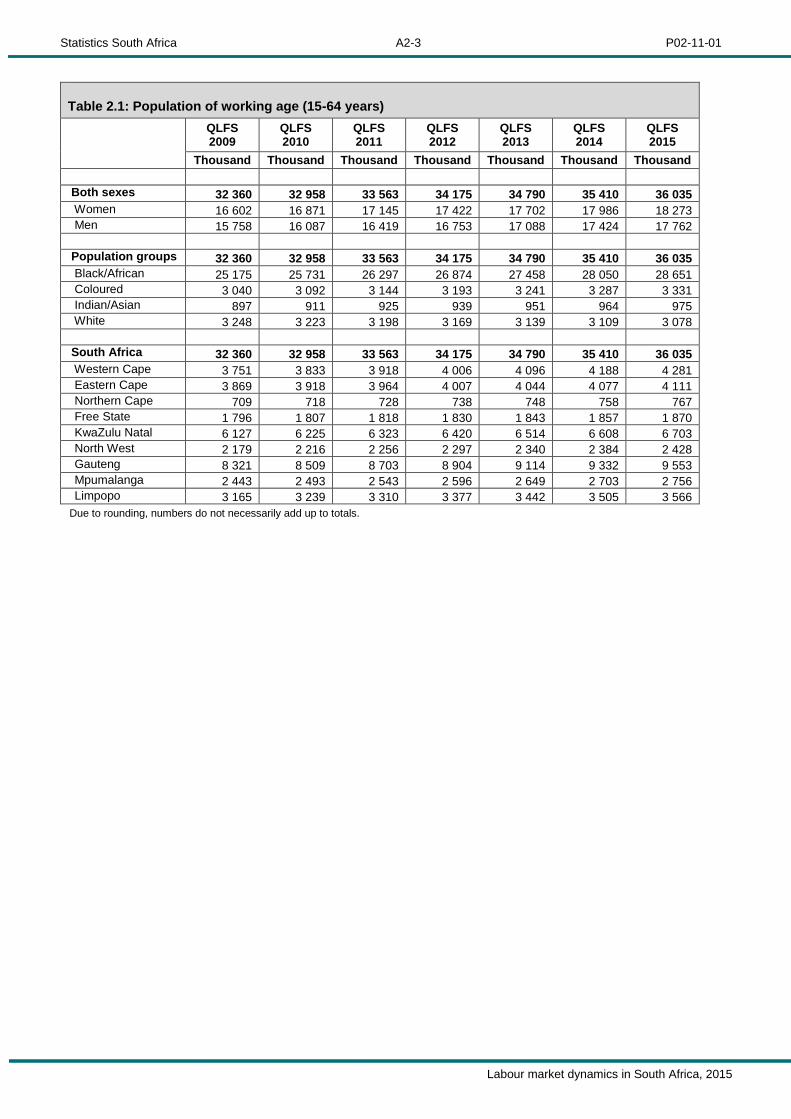
Statistics South Africa P02-11-01 P0120
Labour market dynamics in South Africa, 2015
A2-3
Table 2.1: Population of working age (15-64 years)
QLFS 2009
QLFS 2010
QLFS 2011
QLFS 2012
QLFS 2013
QLFS 2014
QLFS 2015
Thousand Thousand Thousand Thousand Thousand Thousand Thousand
Both sexes 32 360 32 958 33 563 34 175 34 790 35 410 36 035
Women 16 602 16 871 17 145 17 422 17 702 17 986 18 273
Men 15 758 16 087 16 419 16 753 17 088 17 424 17 762
Population groups 32 360 32 958 33 563 34 175 34 790 35 410 36 035
Black/African 25 175 25 731 26 297 26 874 27 458 28 050 28 651
Coloured 3 040 3 092 3 144 3 193 3 241 3 287 3 331
Indian/Asian 897 911 925 939 951 964 975
White 3 248 3 223 3 198 3 169 3 139 3 109 3 078
South Africa 32 360 32 958 33 563 34 175 34 790 35 410 36 035
Western Cape 3 751 3 833 3 918 4 006 4 096 4 188 4 281
Eastern Cape 3 869 3 918 3 964 4 007 4 044 4 077 4 111
Northern Cape 709 718 728 738 748 758 767
Free State 1 796 1 807 1 818 1 830 1 843 1 857 1 870
KwaZulu Natal 6 127 6 225 6 323 6 420 6 514 6 608 6 703
North West 2 179 2 216 2 256 2 297 2 340 2 384 2 428
Gauteng 8 321 8 509 8 703 8 904 9 114 9 332 9 553
Mpumalanga 2 443 2 493 2 543 2 596 2 649 2 703 2 756
Limpopo 3 165 3 239 3 310 3 377 3 442 3 505 3 566
Due to rounding, numbers do not necessarily add up to totals.

Statistics South Africa P02-11-01 P0120
Labour market dynamics in South Africa, 2015
A2-4
Table 2.2: Labour force characteristics by sex - All population groups
QLFS 2009
QLFS 2010
QLFS 2011
QLFS 2012
QLFS 2013
QLFS 2014
QLFS 2015
Thousand Thousand Thousand Thousand Thousand Thousand Thousand
Both sexes
Population 15-64 yrs 32 360 32 958 33 563 34 175 34 790 35 410 36 035
Labour Force 18 597 18 352 18 706 19 200 19 752 20 216 21 085
Employed 14 194 13 788 14 070 14 425 14 866 15 146 15 741
Formal sector (Non-agricultural) 9 967 9 627 9 942 10 222 10 524 10 822 10 935
Informal sector (Non-agricultural) 2 221 2 259 2 270 2 275 2 366 2 393 2 637
Agriculture 715 665 644 696 740 702 880
Private households 1 291 1 237 1 214 1 232 1 236 1 230 1 288
Unemployed 4 403 4 564 4 636 4 775 4 886 5 070 5 344
Not economically active 13 763 14 606 14 857 14 975 15 038 15 194 14 950
Discouraged work-seekers 1 535 2 026 2 252 2 314 2 331 2 422 2 334
Other(not economically active) 12 228 12 579 12 605 12 661 12 708 12 771 12 616
Rates (%)
Unemployment rate 23,7 24,9 24,8 24,9 24,7 25,1 25,3
Employed / population ratio (Absorption) 43,9 41,8 41,9 42,2 42,7 42,8 43,7
Labour force participation rate 57,5 55,7 55,7 56,2 56,8 57,1 58,5
Women
Population 15-64 yrs 16 602 16 871 17 145 17 422 17 702 17 986 18 273
Labour Force 8 327 8 171 8 404 8 601 8 920 9 115 9 522
Employed 6 188 5 950 6 106 6 264 6 539 6 634 6 882
Formal sector (Non-agricultural) 3 971 3 827 4 021 4 173 4 369 4 514 4 577
Informal sector (Non-agricultural) 978 940 927 908 954 937 1 007
Agriculture 225 225 211 227 230 213 293
Private households 1 013 957 946 957 987 969 1 006
Unemployed 2 139 2 221 2 298 2 337 2 381 2 482 2 640
Not economically active 8 275 8 700 8 741 8 821 8 782 8 871 8 751
Discouraged work-seekers 881 1 131 1 242 1 294 1 270 1 285 1 309
Other(not economically active) 7 394 7 569 7 499 7 527 7 512 7 586 7 443
Rates (%)
Unemployment rate 25,7 27,2 27,3 27,2 26,7 27,2 27,7
Employed / population ratio (Absorption) 37,3 35,3 35,6 36,0 36,9 36,9 37,7
Labour force participation rate 50,2 48,4 49,0 49,4 50,4 50,7 52,1
Men
Population 15-64 yrs 15 758 16 087 16 419 16 753 17 088 17 424 17 762
Labour Force 10 270 10 181 10 303 10 599 10 832 11 101 11 563
Employed 8 006 7 838 7 964 8 161 8 327 8 513 8 859
Formal sector (Non-agricultural) 5 996 5 799 5 921 6 049 6 155 6 308 6 359
Informal sector (Non-agricultural) 1 243 1 319 1 343 1 367 1 412 1 455 1 630
Agriculture 489 440 433 470 510 488 587
Private households 278 280 268 275 249 261 283
Unemployed 2 264 2 343 2 338 2 438 2 505 2 589 2 704
Not economically active 5 488 5 906 6 116 6 154 6 256 6 323 6 199
Discouraged work-seekers 654 895 1 010 1 020 1 061 1 137 1 025
Other(not economically active) 4 833 5 011 5 106 5 135 5 195 5 186 5 174
Rates (%) . . . . . . .
Unemployment rate 22,0 23,0 22,7 23,0 23,1 23,3 23,4
Employed / population ratio (Absorption) 50,8 48,7 48,5 48,7 48,7 48,9 49,9
Labour force participation rate 65,2 63,3 62,8 63,3 63,4 63,7 65,1
Due to rounding, numbers do not necessarily add up to totals.

Statistics South Africa P02-11-01 P0120
Labour market dynamics in South Africa, 2015
A2-5
Table 2.3: Labour force characteristics by population group
QLFS 2009
QLFS 2010
QLFS 2011
QLFS 2012
QLFS 2013
QLFS 2014
QLFS 2015
Thousand Thousand Thousand Thousand Thousand Thousand Thousand
South Africa
Population 15-64 yrs 32 360 32 958 33 563 34 175 34 790 35 410 36 035
Labour Force 18 597 18 352 18 706 19 200 19 752 20 216 21 085
Employed 14 194 13 788 14 070 14 425 14 866 15 146 15 741
Unemployed 4 403 4 564 4 636 4 775 4 886 5 070 5 344
Not economically active 13 763 14 606 14 857 14 975 15 038 15 194 14 950
Rates (%)
Unemployment rate 23,7 24,9 24,8 24,9 24,7 25,1 25,3
Employed / population ratio (Absorption) 43,9 41,8 41,9 42,2 42,7 42,8 43,7
Labour force participation rate 57,5 55,7 55,7 56,2 56,8 57,1 58,5
Black/African
Population 15-64 yrs 25 175 25 731 26 297 26 874 27 458 28 050 28 651
Labour Force 13 825 13 614 13 990 14 466 14 960 15 413 16 267
Employed 9 990 9 666 9 992 10 365 10 790 11 078 11 633
Unemployed 3 836 3 948 3 998 4 101 4 171 4 335 4 634
Not economically active 11 349 12 117 12 307 12 408 12 498 12 638 12 383
Rates (%)
Unemployment rate 27,7 29,0 28,6 28,3 27,9 28,1 28,5
Employed / population ratio (Absorption) 39,7 37,6 38,0 38,6 39,3 39,5 40,6
Labour force participation rate 54,9 52,9 53,2 53,8 54,5 54,9 56,8
Coloured
Population 15-64 yrs 3 040 3 092 3 144 3 193 3 241 3 287 3 331
Labour Force 1 980 1 977 1 981 2 035 2 071 2 135 2 134
Employed 1 579 1 539 1 528 1 544 1 572 1 623 1 643
Unemployed 400 438 453 491 499 512 492
Not economically active 1 060 1 115 1 163 1 159 1 170 1 152 1 196
Rates (%)
Unemployment rate 20,2 22,2 22,9 24,1 24,1 24,0 23,0
Employed / population ratio (Absorption) 52,0 49,8 48,6 48,3 48,5 49,4 49,3
Labour force participation rate 65,1 63,9 63,0 63,7 63,9 65,0 64,1
Indian/Asian
Population 15-64 yrs 897 911 925 939 951 964 975
Labour Force 531 558 549 553 579 566 580
Employed 469 510 491 494 508 498 504
Unemployed 61 48 58 59 71 68 76
Not economically active 367 353 376 386 373 398 395
Rates (%)
Unemployment rate 11,6 8,7 10,5 10,6 12,3 12,0 13,1
Employed / population ratio (Absorption) 52,3 56,0 53,1 52,7 53,4 51,7 51,7
Labour force participation rate 59,1 61,3 59,3 58,9 60,8 58,7 59,5
White
Population 15-64 yrs 3 248 3 223 3 198 3 169 3 139 3 109 3 078
Labour Force 2 261 2 203 2 187 2 147 2 142 2 103 2 103
Employed 2 156 2 073 2 060 2 022 1 996 1 947 1 961
Unemployed 106 130 128 125 146 156 142
Not economically active 987 1 020 1 010 1 022 998 1 006 975
Rates (%)
Unemployment rate 4,7 5,9 5,8 5,8 6,8 7,4 6,8
Employed / population ratio (Absorption) 66,4 64,3 64,4 63,8 63,6 62,6 63,7
Labour force participation rate 69,6 68,4 68,4 67,7 68,2 67,6 68,3
Due to rounding, numbers do not necessarily add up to totals.

Statistics South Africa P02-11-01 P0120
Labour market dynamics in South Africa, 2015
A2-6
Table 2.4: Labour force characteristics by age group
QLFS 2009
QLFS 2010
QLFS 2011
QLFS 2012
QLFS 2013
QLFS 2014
QLFS 2015
Thousand Thousand Thousand Thousand Thousand Thousand Thousand
15-64 years
Population 15-64 yrs 32 360 32 958 33 563 34 175 34 790 35 410 36 035
Labour Force 18 597 18 352 18 706 19 200 19 752 20 216 21 085
Employed 14 194 13 788 14 070 14 425 14 866 15 146 15 741
Unemployed 4 403 4 564 4 636 4 775 4 886 5 070 5 344
Not economically active 13 763 14 606 14 857 14 975 15 038 15 194 14 950
Rates (%)
Unemployment rate 23,7 24,9 24,8 24,9 24,7 25,1 25,3
Employed / population ratio (Absorption) 43,9 41,8 41,9 42,2 42,7 42,8 43,7
Labour force participation rate 57,5 55,7 55,7 56,2 56,8 57,1 58,5
15-24 years
Population 15-24 yrs 9 837 9 938 10 038 10 128 10 201 10 257 10 291
Labour Force 2 762 2 597 2 558 2 571 2 629 2 593 2 741
Employed 1 427 1 267 1 272 1 242 1 277 1 263 1 367
Unemployed 1 335 1 330 1 286 1 329 1 352 1 330 1 374
Not economically active 7 076 7 341 7 480 7 557 7 572 7 664 7 550
Rates (%)
Unemployment rate 48,3 51,2 50,3 51,7 51,4 51,3 50,1
Employed / population ratio (Absorption) 14,5 12,8 12,7 12,3 12,5 12,3 13,3
Labour force participation rate 28,1 26,1 25,5 25,4 25,8 25,3 26,6
25-34 years
Population 25-34 yrs 8 642 8 749 8 871 9 011 9 166 9 326 9 486
Labour Force 6 431 6 322 6 419 6 568 6 674 6 805 7 083
Employed 4 625 4 472 4 500 4 626 4 731 4 758 4 945
Unemployed 1 806 1 850 1 919 1 942 1 943 2 047 2 138
Not economically active 2 211 2 427 2 452 2 444 2 492 2 521 2 402
Rates (%)
Unemployment rate 28,1 29,3 29,9 29,6 29,1 30,1 30,2
Employed / population ratio (Absorption) 53,5 51,1 50,7 51,3 51,6 51,0 52,1
Labour force participation rate 74,4 72,3 72,4 72,9 72,8 73,0 74,7
35-44 years
Population 35-44 yrs 6 445 6 645 6 843 7 040 7 236 7 430 7 618
Labour Force 4 995 5 035 5 202 5 413 5 622 5 790 6 041
Employed 4 167 4 144 4 261 4 428 4 577 4 685 4 862
Unemployed 828 891 941 984 1 045 1 106 1 179
Not economically active 1 450 1 610 1 641 1 628 1 614 1 639 1 577
Rates (%)
Unemployment rate 16,6 17,7 18,1 18,2 18,6 19,1 19,5
Employed / population ratio (Absorption) 64,7 62,4 62,3 62,9 63,2 63,1 63,8
Labour force participation rate 77,5 75,8 76,0 76,9 77,7 77,9 79,3
45-54 years
Population 45-54 yrs 4 568 4 670 4 759 4 841 4 925 5 025 5 152
Labour Force 3 181 3 184 3 268 3 338 3 442 3 545 3 691
Employed 2 824 2 783 2 856 2 911 3 003 3 071 3 171
Unemployed 357 401 412 428 440 474 520
Not economically active 1 387 1 486 1 492 1 502 1 482 1 480 1 461
Rates (%)
Unemployment rate 11,2 12,6 12,6 12,8 12,8 13,4 14,1
Employed / population ratio (Absorption) 61,8 59,6 60,0 60,1 61,0 61,1 61,6
Labour force participation rate 69,6 68,2 68,7 69,0 69,9 70,6 71,6

Statistics South Africa P02-11-01 P0120
Labour market dynamics in South Africa, 2015
A2-7
Table 2.4: Labour force characteristics by age group (concluded)
QLFS 2009
QLFS 2010
QLFS 2011
QLFS 2012
QLFS 2013
QLFS 2014
QLFS 2015
Thousand Thousand Thousand Thousand Thousand Thousand Thousand
55-64 years
Population 55-64 yrs 2 867 2 956 3 052 3 154 3 262 3 373 3 487
Labour Force 1 227 1 214 1 260 1 310 1 385 1 483 1 528
Employed 1 151 1 122 1 182 1 218 1 278 1 369 1 395
Unemployed 77 92 78 92 107 113 133
Not economically active 1 639 1 743 1 792 1 844 1 877 1 890 1 959
Rates (%)
Unemployment rate 6,2 7,6 6,2 7,0 7,7 7,7 8,7
Employed / population ratio (Absorption) 40,1 37,9 38,7 38,6 39,2 40,6 40,0
Labour force participation rate 42,8 41,1 41,3 41,5 42,5 44,0 43,8
Due to rounding, numbers do not necessarily add up to totals.

Statistics South Africa P02-11-01 P0120
Labour market dynamics in South Africa, 2015
A2-8
Table 2.5: Labour force characteristics by province
QLFS 2009
QLFS 2010
QLFS 2011
QLFS 2012
QLFS 2013
QLFS 2014
QLFS 2015
Thousand Thousand Thousand Thousand Thousand Thousand Thousand
South Africa
Population 15-64 yrs 32 360 32 958 33 563 34 175 34 790 35 410 36 035
Labour Force 18 597 18 352 18 706 19 200 19 752 20 216 21 085
Employed 14 194 13 788 14 070 14 425 14 866 15 146 15 741
Unemployed 4 403 4 564 4 636 4 775 4 886 5 070 5 344
Not economically active 13 763 14 606 14 857 14 975 15 038 15 194 14 950
Discouraged work-seekers 1 535 2 026 2 252 2 314 2 331 2 422 2 334
Other 12 228 12 579 12 605 12 661 12 708 12 771 12 616
Rates (%)
Unemployment rate 23,7 24,9 24,8 24,9 24,7 25,1 25,3
Employed / population ratio (Absorption)
43,9 41,8 41,9 42,2 42,7 42,8 43,7
Labour force participation rate 57,5 55,7 55,7 56,2 56,8 57,1 58,5
Western Cape
Population 15-64 yrs 3 751 3 833 3 918 4 006 4 096 4 188 4 281
Labour Force 2 577 2 575 2 636 2 730 2 768 2 842 2 904
Employed 2 053 2 025 2 061 2 091 2 141 2 195 2 304
Unemployed 525 550 575 639 627 646 600
Not economically active 1 174 1 258 1 282 1 277 1 328 1 346 1 377
Discouraged work-seekers 35 47 37 34 40 32 51
Other 1 138 1 211 1 246 1 243 1 288 1 315 1 326
Rates (%)
Unemployment rate 20,4 21,4 21,8 23,4 22,7 22,7 20,7
Employed / population ratio (Absorption)
54,7 52,8 52,6 52,2 52,3 52,4 53,8
Labour force participation rate 68,7 67,2 67,3 68,1 67,6 67,8 67,8
Eastern Cape
Population 15-64 yrs 3 869 3 918 3 964 4 007 4 044 4 077 4 111
Labour Force 1 772 1 729 1 755 1 759 1 838 1 918 1 935
Employed 1 287 1 262 1 278 1 254 1 295 1 350 1 377
Unemployed 485 467 477 505 543 568 558
Not economically active 2 097 2 189 2 209 2 248 2 205 2 159 2 176
Discouraged work-seekers 302 353 360 403 414 420 411
Other 1 795 1 836 1 848 1 845 1 792 1 739 1 764
Rates (%)
Unemployment rate 27,4 27,0 27,2 28,7 29,6 29,6 28,8
Employed / population ratio (Absorption)
33,3 32,2 32,2 31,3 32,0 33,1 33,5
Labour force participation rate 45,8 44,1 44,3 43,9 45,5 47,0 47,1
Northern Cape
Population 15-64 yrs 709 718 728 738 748 758 767
Labour Force 389 381 393 413 430 438 448
Employed 285 281 281 296 310 307 305
Unemployed 103 101 112 117 120 131 143
Not economically active 321 337 335 324 317 319 319
Discouraged work-seekers 29 39 35 31 30 42 46
Other 292 298 300 294 287 278 274
Rates (%)
Unemployment rate 26,6 26,4 28,4 28,3 27,9 29,9 32,0
Employed / population ratio (Absorption)
40,2 39,1 38,6 40,2 41,5 40,5 39,7
Labour force participation rate 54,8 53,1 54,0 56,0 57,6 57,8 58,4 Due to rounding, numbers do not necessarily add up to totals

Statistics South Africa P02-11-01 P0120
Labour market dynamics in South Africa, 2015
A2-9
Table 2.5: Labour force characteristics by province (continued)
QLFS 2009
QLFS 2010
QLFS 2011
QLFS 2012
QLFS 2013
QLFS 2014
QLFS 2015
Thousand Thousand Thousand Thousand Thousand Thousand Thousand
Free State
Population 15-64 yrs 1 796 1 807 1 818 1 830 1 843 1 857 1 870
Labour Force 1 053 1 063 1 069 1 075 1 111 1 136 1 163
Employed 779 768 775 728 748 749 805
Unemployed 274 296 294 346 363 388 358
Not economically active 743 743 749 756 732 720 707
Discouraged work-seekers 89 87 90 78 79 77 81
Other 654 657 659 677 653 643 626
Rates (%)
Unemployment rate 26,0 27,8 27,5 32,2 32,7 34,1 30,8
Employed / population ratio (Absorption)
43,4 42,5 42,6 39,8 40,6 40,3 43,0
Labour force participation rate 58,6 58,9 58,8 58,7 60,3 61,2 62,2
KwaZulu Natal
Population 15-64 yrs 6 127 6 225 6 323 6 420 6 514 6 608 6 703
Labour Force 3 028 2 913 2 984 3 046 3 144 3 201 3 239
Employed 2 435 2 340 2 406 2 423 2 490 2 487 2 551
Unemployed 593 573 577 622 654 715 688
Not economically active 3 099 3 312 3 340 3 375 3 371 3 406 3 463
Discouraged work-seekers 398 494 529 548 558 622 584
Other 2 700 2 819 2 811 2 827 2 813 2 784 2 880
Rates (%)
Unemployment rate 19,6 19,7 19,3 20,4 20,8 22,3 21,3
Employed / population ratio (Absorption)
39,7 37,6 38,1 37,7 38,2 37,6 38,1
Labour force participation rate 49,4 46,8 47,2 47,4 48,3 48,4 48,3
North West
Population 15-64 yrs 2 179 2 216 2 256 2 297 2 340 2 384 2 428
Labour Force 1 163 1 101 1 063 1 091 1 157 1 229 1 260
Employed 846 810 784 817 848 904 936
Unemployed 317 291 279 274 309 325 324
Not economically active 1 015 1 115 1 192 1 206 1 183 1 155 1 168
Discouraged work-seekers 125 168 256 252 234 238 245
Other 890 947 937 954 949 917 924
Rates (%)
Unemployment rate 27,2 26,5 26,2 25,1 26,7 26,4 25,7
Employed / population ratio (Absorption)
38,9 36,5 34,8 35,6 36,3 37,9 38,5
Labour force participation rate 53,4 49,7 47,1 47,5 49,4 51,6 51,9
Gauteng
Population 15-64 yrs 8 321 8 509 8 703 8 904 9 114 9 332 9 553
Labour Force 5 954 6 004 6 163 6 245 6 369 6 423 6 923
Employed 4 531 4 377 4 494 4 687 4 782 4 824 4 995
Unemployed 1 423 1 627 1 669 1 557 1 587 1 599 1 928
Not economically active 2 367 2 504 2 540 2 659 2 745 2 908 2 629
Discouraged work-seekers 207 320 303 323 337 357 271
Other 2 160 2 184 2 237 2 336 2 408 2 551 2 359
Rates (%)
Unemployment rate 23,9 27,1 27,1 24,9 24,9 24,9 27,8
Employed / population ratio (Absorption)
54,5 51,4 51,6 52,6 52,5 51,7 52,3
Labour force participation rate 71,6 70,6 70,8 70,1 69,9 68,8 72,5 Due to rounding, numbers do not necessarily add up to totals

Statistics South Africa P02-11-01 P0120
Labour market dynamics in South Africa, 2015
A2-10
Table 2.5: Labour force characteristics by province (concluded)
QLFS 2009
QLFS 2010
QLFS 2011
QLFS 2012
QLFS 2013
QLFS 2014
QLFS 2015
Thousand Thousand Thousand Thousand Thousand Thousand Thousand
Mpumalanga
Population 15-64 yrs 2 443 2 493 2 543 2 596 2 649 2 703 2 756
Labour Force 1 361 1 355 1 402 1 477 1 559 1 593 1 611
Employed 1 015 973 992 1 042 1 123 1 132 1 177
Unemployed 347 382 410 435 436 461 433
Not economically active 1 081 1 138 1 142 1 118 1 090 1 110 1 146
Discouraged work-seekers 127 205 230 266 242 239 242
Other 954 933 912 853 848 871 904
Rates (%)
Unemployment rate 25,5 28,2 29,2 29,5 28,0 29,0 26,9
Employed / population ratio (Absorption) 41,5 39,0 39,0 40,1 42,4 41,9 42,7
Labour force participation rate 55,7 54,4 55,1 56,9 58,9 58,9 58,4
Limpopo
Population 15-64 yrs 3 165 3 239 3 310 3 377 3 442 3 505 3 566
Labour Force 1 300 1 230 1 242 1 365 1 375 1 435 1 602
Employed 963 953 999 1 085 1 128 1 198 1 291
Unemployed 337 277 244 279 247 237 311
Not economically active 1 865 2 009 2 067 2 013 2 067 2 070 1 964
Discouraged work-seekers 222 314 413 380 397 396 404
Other 1 643 1 695 1 655 1 633 1 670 1 674 1 560
Rates (%)
Unemployment rate 25,9 22,5 19,6 20,5 18,0 16,5 19,4
Employed / population ratio (Absorption) 30,4 29,4 30,2 32,1 32,8 34,2 36,2
Labour force participation rate 41,1 38,0 37,5 40,4 39,9 40,9 44,9 Due to rounding, numbers do not necessarily add up to totals

Statistics South Africa P02-11-01 P0120
Labour market dynamics in South Africa, 2015
A2-11
Table 2.6: Labour force characteristics by sex - Expanded definition of unemployment
QLFS 2009
QLFS 2010
QLFS 2011
QLFS 2012
QLFS 2013
QLFS 2014
QLFS 2015
Thousand Thousand Thousand Thousand Thousand Thousand Thousand
Both sexes
Population 15-64 yrs 32 360 32 958 33 563 34 175 34 790 35 410 36 035
Labour Force 20 988 21 332 21 845 22 388 22 966 23 402 24 142
Employed 14 194 13 788 14 070 14 425 14 866 15 146 15 741
Formal sector (Non-agricultural) 9 967 9 627 9 942 10 222 10 524 10 822 10 935
Informal sector (Non-agricultural) 2 221 2 259 2 270 2 275 2 366 2 393 2 637
Agriculture 715 665 644 696 740 702 880
Private households 1 291 1 237 1 214 1 232 1 236 1 230 1 288
Unemployed 6 795 7 544 7 775 7 964 8 101 8 255 8 401
Not economically active 11 372 11 626 11 718 11 787 11 824 12 009 11 893
Rates (%)
Unemployment rate 32,4 35,4 35,6 35,6 35,3 35,3 34,8
Employed / population ratio (Absorption) 43,9 41,8 41,9 42,2 42,7 42,8 43,7
Labour force participation rate 64,9 64,7 65,1 65,5 66,0 66,1 67,0
Women
Population 15-64 yrs 16 602 16 871 17 145 17 422 17 702 17 986 18 273
Labour Force 9 762 9 918 10 209 10 438 10 733 10 867 11 278
Employed 6 188 5 950 6 106 6 264 6 539 6 634 6 882
Formal sector (Non-agricultural) 3 971 3 827 4 021 4 173 4 369 4 514 4 577
Informal sector (Non-agricultural) 978 940 927 908 954 937 1 007
Agriculture 225 225 211 227 230 213 293
Private households 1 013 957 946 957 987 969 1 006
Unemployed 3 574 3 968 4 104 4 175 4 194 4 233 4 396
Not economically active 6 840 6 953 6 936 6 984 6 969 7 119 6 995
Rates (%)
Unemployment rate 36,6 40,0 40,2 40,0 39,1 39,0 39,0
Employed / population ratio (Absorption) 37,3 35,3 35,6 36,0 36,9 36,9 37,7
Labour force participation rate 58,8 58,8 59,5 59,9 60,6 60,4 61,7
Men
Population 15-64 yrs 15 758 16 087 16 419 16 753 17 088 17 424 17 762
Labour Force 11 226 11 414 11 636 11 950 12 233 12 534 12 864
Employed 8 006 7 838 7 964 8 161 8 327 8 513 8 859
Formal sector (Non-agricultural) 5 996 5 799 5 921 6 049 6 155 6 308 6 359
Informal sector (Non-agricultural) 1 243 1 319 1 343 1 367 1 412 1 455 1 630
Agriculture 489 440 433 470 510 488 587
Private households 278 280 268 275 249 261 283
Unemployed 3 220 3 576 3 671 3 789 3 907 4 022 4 005
Not economically active 4 532 4 672 4 783 4 803 4 855 4 890 4 898
Rates (%)
Unemployment rate 28,7 31,3 31,6 31,7 31,9 32,1 31,1
Employed / population ratio (Absorption) 50,8 48,7 48,5 48,7 48,7 48,9 49,9
Labour force participation rate 71,2 71,0 70,9 71,3 71,6 71,9 72,4
Due to rounding, numbers do not necessarily add up to totals

Statistics South Africa P02-11-01 P0120
Labour market dynamics in South Africa, 2015
A2-12
Table 2.7: Labour force characteristics by population group - Expanded definition of unemployment
QLFS 2009
QLFS 2010
QLFS 2011
QLFS 2012
QLFS 2013
QLFS 2014
QLFS 2015
Thousand Thousand Thousand Thousand Thousand Thousand Thousand
South Africa
Population 15-64 yrs 32 360 32 958 33 563 34 175 34 790 35 410 36 035
Labour Force 20 988 21 332 21 845 22 388 22 966 23 402 24 142
Employed 14 194 13 788 14 070 14 425 14 866 15 146 15 741
Unemployed 6 795 7 544 7 775 7 964 8 101 8 255 8 401
Not economically active 11 372 11 626 11 718 11 787 11 824 12 009 11 893
Rates (%)
Unemployment rate 32,4 35,4 35,6 35,6 35,3 35,3 34,8
Employed / population ratio (Absorption) 43,9 41,8 41,9 42,2 42,7 42,8 43,7
Labour force participation rate 64,9 64,7 65,1 65,5 66,0 66,1 67,0
Black/African
Population 15-64 yrs 25 175 25 731 26 297 26 874 27 458 28 050 28 651
Labour Force 16 074 16 414 16 933 17 470 17 990 18 402 19 115
Employed 9 989 9 666 9 992 10 365 10 790 11 078 11 633
Unemployed 6 085 6 748 6 941 7 105 7 200 7 324 7 482
Not economically active 9 100 9 317 9 364 9 404 9 468 9 648 9 536
Rates (%)
Unemployment rate 37,9 41,1 41,0 40,7 40,0 39,8 39,1
Employed / population ratio (Absorption) 39,7 37,6 38,0 38,6 39,3 39,5 40,6
Labour force participation rate 63,9 63,8 64,4 65,0 65,5 65,6 66,7
Coloured
Population 15-64 yrs 3 040 3 092 3 144 3 193 3 241 3 287 3 331
Labour Force 2 060 2 089 2 103 2 148 2 187 2 254 2 271
Employed 1 579 1 539 1 528 1 544 1 572 1 623 1 643
Unemployed 481 550 575 605 615 630 628
Not economically active 980 1 004 1 041 1 045 1 054 1 034 1 060
Rates (%)
Unemployment rate 23,3 26,3 27,4 28,1 28,1 28,0 27,7
Employed / population ratio (Absorption) 52,0 49,8 48,6 48,3 48,5 49,4 49,3
Labour force participation rate 67,8 67,5 66,9 67,3 67,5 68,6 68,2
Indian/Asian
Population 15-64 yrs 897 911 925 939 951 964 975
Labour Force 560 579 573 578 610 599 614
Employed 469 510 491 494 508 498 504
Unemployed 90 69 81 84 102 101 110
Not economically active 338 332 353 360 341 365 361
Rates (%)
Unemployment rate 16,1 12,0 14,2 14,5 16,7 16,9 17,9
Employed / population ratio (Absorption) 52,3 56,0 53,1 52,7 53,4 51,7 51,7
Labour force participation rate 62,4 63,6 61,9 61,6 64,1 62,2 62,9
White
Population 15-64 yrs 3 248 3 223 3 198 3 169 3 139 3 109 3 078
Labour Force 2 294 2 250 2 237 2 192 2 179 2 147 2 142
Employed 2 156 2 073 2 060 2 022 1 996 1 947 1 961
Unemployed 139 177 177 170 183 200 181
Not economically active 954 973 961 977 960 962 936
Rates (%)
Unemployment rate 6,0 7,9 7,9 7,8 8,4 9,3 8,5
Employed / population ratio (Absorption) 66,4 64,3 64,4 63,8 63,6 62,6 63,7
Labour force participation rate 70,6 69,8 69,9 69,2 69,4 69,1 69,6 Due to rounding, numbers do not necessarily add up to totals

Statistics South Africa P02-11-01 P0120
Labour market dynamics in South Africa, 2015
A2-13
Table 2.8: Labour force characteristics by age group
QLFS 2009
QLFS 2010
QLFS 2011
QLFS 2012
QLFS 2013
QLFS 2014
QLFS 2015
Thousand Thousand Thousand Thousand Thousand Thousand Thousand
15-64 years
Population 15-64 yrs 32 360 32 958 33 563 34 175 34 790 35 410 36 035
Labour Force 20 988 21 332 21 845 22 388 22 966 23 402 24 142
Employed 14 194 13 788 14 070 14 425 14 866 15 146 15 741
Unemployed 6 795 7 544 7 775 7 964 8 101 8 255 8 401
Not economically active 11 372 11 626 11 718 11 787 11 824 12 009 11 893
Rates (%)
Unemployment rate 32,4 35,4 35,6 35,6 35,3 35,3 34,8
Employed / population ratio (Absorption) 43,9 41,8 41,9 42,2 42,7 42,8 43,7
Labour force participation rate 64,9 64,7 65,1 65,5 66,0 66,1 67,0
15-24 years
Population 15-24 yrs 9 837 9 938 10 038 10 128 10 201 10 257 10 291
Labour Force 3 578 3 618 3 634 3 645 3 697 3 610 3 677
Employed 1 427 1 267 1 272 1 242 1 277 1 263 1 367
Unemployed 2 151 2 350 2 362 2 403 2 420 2 347 2 310
Not economically active 6 260 6 321 6 404 6 483 6 504 6 647 6 614
Rates (%)
Unemployment rate 60,1 65,0 65,0 65,9 65,5 65,0 62,8
Employed / population ratio (Absorption) 14,5 12,8 12,7 12,3 12,5 12,3 13,3
Labour force participation rate 36,4 36,4 36,2 36,0 36,2 35,2 35,7
25-34 years
Population 25-34 yrs 8 642 8 749 8 871 9 011 9 166 9 326 9 486
Labour Force 7 261 7 334 7 501 7 648 7 780 7 897 8 157
Employed 4 625 4 472 4 500 4 626 4 731 4 758 4 945
Unemployed 2 636 2 862 3 002 3 023 3 049 3 139 3 212
Not economically active 1 381 1 415 1 370 1 363 1 386 1 429 1 329
Rates (%)
Unemployment rate 36,3 39,0 40,0 39,5 39,2 39,8 39,4
Employed / population ratio (Absorption) 53,5 51,1 50,7 51,3 51,6 51,0 52,1
Labour force participation rate 84,0 83,8 84,6 84,9 84,9 84,7 86,0
35-44 years
Population 35-44 yrs 6 445 6 645 6 843 7 040 7 236 7 430 7 618
Labour Force 5 431 5 578 5 783 6 005 6 212 6 384 6 637
Employed 4 167 4 144 4 261 4 428 4 577 4 685 4 862
Unemployed 1 264 1 434 1 522 1 576 1 636 1 700 1 775
Not economically active 1 014 1 067 1 060 1 036 1 024 1 045 982
Rates (%)
Unemployment rate 23,3 25,7 26,3 26,3 26,3 26,6 26,7
Employed / population ratio (Absorption) 64,7 62,4 62,3 62,9 63,2 63,1 63,8
Labour force participation rate 84,3 83,9 84,5 85,3 85,9 85,9 87,1
45-54 years
Population 45-54 yrs 4 568 4 670 4 759 4 841 4 925 5 025 5 152
Labour Force 3 412 3 488 3 570 3 666 3 781 3 898 4 022
Employed 2 824 2 783 2 856 2 911 3 003 3 071 3 171
Unemployed 588 705 714 755 778 827 851
Not economically active 1 156 1 182 1 189 1 175 1 144 1 127 1 130
Rates (%)
Unemployment rate 17,2 20,2 20,0 20,6 20,6 21,2 21,1
Employed / population ratio (Absorption) 61,8 59,6 60,0 60,1 61,0 61,1 61,6
Labour force participation rate 74,7 74,7 75,0 75,7 76,8 77,6 78,1 Due to rounding, numbers do not necessarily add up to totals

Statistics South Africa P02-11-01 P0120
Labour market dynamics in South Africa, 2015
A2-14
Table 2.8: Labour force characteristics by age group (concluded)
QLFS 2009
QLFS 2010
QLFS 2011
QLFS 2012
QLFS 2013
QLFS 2014
QLFS 2015
Thousand Thousand Thousand Thousand Thousand Thousand Thousand
55-64 years
Population 55-64 yrs 2 867 2 956 3 052 3 154 3 262 3 373 3 487
Labour Force 1 306 1 315 1 357 1 424 1 495 1 612 1 649
Employed 1 151 1 122 1 182 1 218 1 278 1 369 1 395
Unemployed 155 194 175 206 217 243 255
Not economically active 1 561 1 641 1 695 1 730 1 766 1 761 1 838
Rates (%)
Unemployment rate 11,9 14,7 12,9 14,5 14,5 15,0 15,4
Employed / population ratio (Absorption) 40,1 37,9 38,7 38,6 39,2 40,6 40,0
Labour force participation rate 45,6 44,5 44,5 45,2 45,8 47,8 47,3 Due to rounding, numbers do not necessarily add up to totals

Statistics South Africa P02-11-01 P0120
Labour market dynamics in South Africa, 2015
A2-15
Table 2.9: Labour force characteristics by province - Expanded definition of unemployment
QLFS 2009
QLFS 2010
QLFS 2011
QLFS 2012
QLFS 2013
QLFS 2014
QLFS 2015
Thousand Thousand Thousand Thousand Thousand Thousand Thousand
South Africa
Population 15-64 yrs 32 360 32 958 33 563 34 175 34 790 35 410 36 035
Labour Force 20 988 21 332 21 845 22 388 22 966 23 402 24 142
Employed 14 194 13 788 14 070 14 425 14 866 15 146 15 741
Unemployed 6 795 7 544 7 775 7 964 8 101 8 255 8 401
Not economically active 11 372 11 626 11 718 11 787 11 824 12 009 11 893
Rates (%)
Unemployment rate 32,4 35,4 35,6 35,6 35,3 35,3 34,8
Employed / population ratio (Absorption) 43,9 41,8 41,9 42,2 42,7 42,8 43,7
Labour force participation rate 64,9 64,7 65,1 65,5 66,0 66,1 67,0
Western Cape
Population 15-64 yrs 3 751 3 833 3 918 4 006 4 096 4 188 4 281
Labour Force 2 651 2 662 2 701 2 792 2 844 2 908 2 997
Employed 2 053 2 025 2 061 2 091 2 141 2 195 2 304
Unemployed 598 638 640 701 704 713 693
Not economically active 1 100 1 171 1 217 1 215 1 252 1 280 1 284
Rates (%)
Unemployment rate 22,6 23,9 23,7 25,1 24,7 24,5 23,1
Employed / population ratio (Absorption) 54,7 52,8 52,6 52,2 52,3 52,4 53,8
Labour force participation rate 70,7 69,5 68,9 69,7 69,4 69,4 70,0
Eastern Cape
Population 15-64 yrs 3 869 3 918 3 964 4 007 4 044 4 077 4 111
Labour Force 2 121 2 143 2 177 2 220 2 330 2 384 2 380
Employed 1 287 1 262 1 278 1 254 1 295 1 350 1 377
Unemployed 834 881 899 966 1 036 1 034 1 003
Not economically active 1 748 1 774 1 787 1 787 1 713 1 694 1 730
Rates (%)
Unemployment rate 39,3 41,1 41,3 43,5 44,4 43,4 42,2
Employed / population ratio (Absorption) 33,3 32,2 32,2 31,3 32,0 33,1 33,5
Labour force participation rate 54,8 54,7 54,9 55,4 57,6 58,5 57,9
Northern Cape
Population 15-64 yrs 709 718 728 738 748 758 767
Labour Force 441 439 445 460 482 510 519
Employed 285 281 281 296 310 307 305
Unemployed 156 158 164 163 172 203 214
Not economically active 268 279 283 278 266 247 249
Rates (%)
Unemployment rate 35,3 36,1 36,8 35,5 35,6 39,9 41,3
Employed / population ratio (Absorption) 40,2 39,1 38,6 40,2 41,5 40,5 39,7
Labour force participation rate 62,2 61,1 61,1 62,3 64,5 67,4 67,6 Due to rounding, numbers do not necessarily add up to totals

Statistics South Africa P02-11-01 P0120
Labour market dynamics in South Africa, 2015
A2-16
Table 2.9: Labour force characteristics by province - Expanded definition of unemployment (continued)
QLFS 2009
QLFS 2010
QLFS 2011
QLFS 2012
QLFS 2013
QLFS 2014
QLFS 2015
Thousand Thousand Thousand Thousand Thousand Thousand Thousand
Free State
Population 15-64 yrs 1 796 1 807 1 818 1 830 1 843 1 857 1 870
Labour Force 1 196 1 202 1 206 1 198 1 245 1 265 1 295
Employed 779 768 775 728 748 749 805
Unemployed 417 434 431 470 496 516 490
Not economically active 600 605 612 632 599 592 575
Rates (%)
Unemployment rate 34,9 36,1 35,7 39,2 39,9 40,8 37,8
Employed / population ratio (Absorption) 43,4 42,5 42,6 39,8 40,6 40,3 43,0
Labour force participation rate 66,6 66,5 66,3 65,5 67,5 68,1 69,3
KwaZulu Natal
Population 15-64 yrs 6 127 6 225 6 323 6 420 6 514 6 608 6 703
Labour Force 3 679 3 732 3 836 3 931 3 997 4 074 4 033
Employed 2 434 2 340 2 406 2 423 2 490 2 487 2 551
Unemployed 1 245 1 392 1 429 1 508 1 507 1 588 1 482
Not economically active 2 447 2 493 2 488 2 489 2 518 2 533 2 670
Rates (%)
Unemployment rate 33,8 37,3 37,3 38,4 37,7 39,0 36,8
Employed / population ratio (Absorption) 39,7 37,6 38,1 37,7 38,2 37,6 38,1
Labour force participation rate 60,1 59,9 60,7 61,2 61,4 61,7 60,2
North West
Population 15-64 yrs 2 179 2 216 2 256 2 297 2 340 2 384 2 428
Labour Force 1 363 1 373 1 419 1 438 1 477 1 550 1 579
Employed 846 810 784 817 848 904 936
Unemployed 516 563 634 621 628 646 643
Not economically active 816 843 837 859 863 833 849
Rates (%)
Unemployment rate 37,9 41,0 44,7 43,2 42,6 41,7 40,7
Employed / population ratio (Absorption) 38,9 36,5 34,8 35,6 36,3 37,9 38,5
Labour force participation rate 62,6 61,9 62,9 62,6 63,1 65,0 65,0
Gauteng
Population 15-64 yrs 8 321 8 509 8 703 8 904 9 114 9 332 9 553
Labour Force 6 244 6 411 6 542 6 651 6 800 6 842 7 285
Employed 4 531 4 377 4 494 4 687 4 782 4 824 4 995
Unemployed 1 713 2 034 2 048 1 963 2 018 2 018 2 289
Not economically active 2 076 2 097 2 161 2 253 2 314 2 490 2 268
Rates (%)
Unemployment rate 27,4 31,7 31,3 29,5 29,7 29,5 31,4
Employed / population ratio (Absorption) 54,5 51,4 51,6 52,6 52,5 51,7 52,3
Labour force participation rate 75,0 75,4 75,2 74,7 74,6 73,3 76,3 Due to rounding, numbers do not necessarily add up to totals

Statistics South Africa P02-11-01 P0120
Labour market dynamics in South Africa, 2015
A2-17
Table 2.9: Labour force characteristics by province - Expanded definition of unemployment (concluded)
QLFS 2009
QLFS 2010
QLFS 2011
QLFS 2012
QLFS 2013
QLFS 2014
QLFS 2015
Thousand Thousand Thousand Thousand Thousand Thousand Thousand
Mpumalanga
Population 15-64 yrs 2 443 2 493 2 543 2 596 2 649 2 703 2 756
Labour Force 1 631 1 703 1 751 1 860 1 915 1 940 1 947
Employed 1 015 973 992 1 042 1 123 1 132 1 177
Unemployed 616 730 759 818 792 808 770
Not economically active 812 790 792 736 734 763 809
Rates (%)
Unemployment rate 37,8 42,9 43,4 44,0 41,3 41,6 39,5
Employed / population ratio (Absorption) 41,5 39,0 39,0 40,1 42,4 41,9 42,7
Labour force participation rate 66,8 68,3 68,9 71,7 72,3 71,8 70,7
Limpopo
Population 15-64 yrs 3 165 3 239 3 310 3 377 3 442 3 505 3 566
Labour Force 1 662 1 667 1 768 1 840 1 876 1 929 2 107
Employed 963 953 999 1 085 1 128 1 198 1 291
Unemployed 699 714 770 755 748 731 816
Not economically active 1 504 1 572 1 541 1 538 1 566 1 576 1 459
Rates (%)
Unemployment rate 42,0 42,8 43,5 41,0 39,9 37,9 38,7
Employed / population ratio (Absorption) 30,4 29,4 30,2 32,1 32,8 34,2 36,2
Labour force participation rate 52,5 51,5 53,4 54,5 54,5 55,0 59,1
Due to rounding, numbers do not necessarily add up to totals

Statistics South Africa P02-11-01 P0120
Labour market dynamics in South Africa, 2015
A2-18
Table 3.1: Employed by industry and sex - South Africa
QLFS 2008
QLFS 2009
QLFS 2010
QLFS 2011
QLFS 2012
QLFS 2013
QLFS 2014
Thousand Thousand Thousand Thousand Thousand Thousand Thousand
Both sexes 14 585 14 194 13 788 14 070 14 425 14 866 15 146
Agriculture 819 715 665 644 696 740 702
Mining 354 340 327 334 375 411 428
Manufacturing 2 091 1 954 1 839 1 871 1 817 1 810 1 760
Utilities 103 105 95 91 102 128 117
Construction 1 215 1 189 1 109 1 109 1 091 1 145 1 249
Trade 3 316 3 120 3 073 3 148 3 145 3 132 3 202
Transport 823 800 816 811 860 914 932
Finance 1 782 1 862 1 748 1 818 1 902 1 995 2 030
Community and social services 2 776 2 814 2 875 3 027 3 202 3 351 3 493
Private households 1 303 1 291 1 237 1 214 1 232 1 236 1 230
Other 3 5 4 5 4 3 4
Women 6 277 6 188 5 950 6 106 6 264 6 539 6 634
Agriculture 265 225 225 211 227 230 213
Mining 37 42 38 37 51 54 73
Manufacturing 649 619 603 623 575 586 556
Utilities 27 23 21 21 21 35 28
Construction 114 131 116 115 126 135 140
Trade 1 627 1 510 1 460 1 466 1 475 1 528 1 514
Transport 160 168 161 155 167 177 180
Finance 780 810 703 767 790 820 849
Community and social services 1 598 1 644 1 661 1 762 1 875 1 986 2 109
Private households 1 018 1 013 957 946 957 987 969
Other 2 3 3 2 2 2 2
Men 8 308 8 006 7 838 7 964 8 161 8 327 8 513
Agriculture 554 489 440 433 470 510 488
Mining 316 297 288 297 324 357 355
Manufacturing 1 441 1 334 1 236 1 248 1 242 1 224 1 203
Utilities 76 82 73 70 81 93 89
Construction 1 101 1 058 993 994 965 1 010 1 109
Trade 1 689 1 610 1 613 1 681 1 670 1 604 1 688
Transport 663 631 655 656 692 737 752
Finance 1 002 1 053 1 045 1 050 1 112 1 175 1 181
Community and social services 1 178 1 171 1 214 1 265 1 328 1 366 1 384
Private households 285 278 280 268 275 249 261
Other 1 2 1 3 2 1 2 Due to rounding, numbers do not necessarily add up to totals

Statistics South Africa P02-11-01 P0120
Labour market dynamics in South Africa, 2015
A2-19
Table 3.2: Employed by industry and province
QLFS 2009 QLFS 2010 QLFS 2011 QLFS 2012 QLFS 2013 QLFS 2014 QLFS 2015
Thousand Thousand Thousand Thousand Thousand Thousand Thousand
Agriculture 715 665 644 696 740 702 880
Western Cape 149 161 120 135 149 142 232
Eastern Cape 77 65 63 55 78 78 83
Northern Cape 51 44 52 46 44 44 36
Free State 84 69 66 63 72 57 71
KwaZulu Natal 115 114 97 93 98 90 145
North West 44 40 36 36 39 42 55
Gauteng 47 35 50 64 47 59 34
Mpumalanga 83 79 82 98 98 84 89
Limpopo 65 58 79 106 114 106 135
Mining 340 327 334 375 411 428 455
Western Cape 3 3 4 3 3 4 3
Eastern Cape 2 1 1 1 1 2 1
Northern Cape 11 11 11 17 20 19 25
Free State 33 31 22 27 24 28 33
KwaZulu Natal 9 9 11 21 19 6 8
North West 132 130 129 132 156 152 155
Gauteng 34 29 30 31 33 56 94
Mpumalanga 64 61 66 68 84 91 58
Limpopo 52 53 60 75 71 70 77
Manufacturing 1 954 1 839 1 871 1 817 1 810 1 760 1 762
Western Cape 323 306 331 326 306 308 297
Eastern Cape 174 142 169 155 158 139 131
Northern Cape 13 12 13 12 10 10 11
Free State 77 67 63 60 62 69 68
KwaZulu Natal 392 369 390 365 349 349 348
North West 86 80 71 63 72 69 72
Gauteng 725 716 684 674 681 630 657
Mpumalanga 87 83 84 90 94 100 106
Limpopo 75 64 66 72 76 85 72
Utilities 105 95 91 102 128 117 132
Western Cape 8 10 11 10 16 13 16
Eastern Cape 3 4 6 5 8 9 6
Northern Cape 4 1 2 3 2 2 4
Free State 4 4 3 5 5 4 11
KwaZulu Natal 8 9 12 11 10 19 16
North West 4 3 3 6 5 2 4
Gauteng 49 38 26 29 41 37 32
Mpumalanga 18 18 21 24 25 21 31
Limpopo 8 8 7 10 14 10 13
Construction 1 189 1 109 1 109 1 091 1 145 1 249 1 405
Western Cape 196 162 146 161 158 168 200
Eastern Cape 105 115 115 119 140 139 165
Northern Cape 18 18 17 18 23 25 29
Free State 58 50 68 50 51 52 56
KwaZulu Natal 229 223 229 208 222 252 266
North West 56 48 51 49 52 54 64
Gauteng 334 313 310 310 303 349 376
Mpumalanga 96 76 79 77 88 98 104
Limpopo 96 103 96 100 110 113 144
For all values of 10 000 or lower the sample size is too small for reliable estimates Due to rounding, numbers do not necessarily add up to totals

Statistics South Africa P02-11-01 P0120
Labour market dynamics in South Africa, 2015
A2-20
Table 3.2: Employed by industry and province (concluded)
QLFS 2009
QLFS 2010
QLFS 2011
QLFS 2012
QLFS 2013
QLFS 2014
QLFS 2015
Thousand Thousand Thousand Thousand Thousand Thousand Thousand
Trade 3 120 3 073 3 148 3 145 3 132 3 202 3 161
Western Cape 447 424 447 432 456 469 455
Eastern Cape 294 305 286 298 268 284 291
Northern Cape 44 44 39 46 49 46 53
Free State 165 168 171 151 139 156 172
KwaZulu Natal 506 494 552 506 520 540 502
North West 178 173 156 163 154 172 166
Gauteng 992 979 1 012 1 029 1 036 994 1 002
Mpumalanga 243 235 241 256 249 242 240
Limpopo 250 252 243 264 261 299 280
Transport 800 816 811 860 914 932 905
Western Cape 94 119 122 111 135 142 119
Eastern Cape 74 70 68 67 70 79 64
Northern Cape 12 10 12 10 15 8 10
Free State 40 39 33 29 35 33 36
KwaZulu Natal 171 167 163 185 191 176 162
North West 23 24 26 35 30 32 35
Gauteng 298 303 309 313 350 361 361
Mpumalanga 47 44 43 58 48 54 62
Limpopo 41 40 36 53 40 47 56
Finance 1 862 1 748 1 818 1 902 1 995 2 030 2 198
Western Cape 293 290 316 333 352 361 364
Eastern Cape 121 106 130 110 109 112 129
Northern Cape 21 23 22 26 26 24 21
Free State 61 68 71 69 64 63 64
KwaZulu Natal 283 270 260 276 287 252 268
North West 74 67 64 68 69 70 100
Gauteng 853 773 797 864 916 967 1 021
Mpumalanga 96 92 89 94 111 120 132
Limpopo 60 59 68 62 61 61 98
Community and social services 2 814 2 875 3 027 3 202 3 351 3 493 3 551
Western Cape 400 422 432 447 442 450 463
Eastern Cape 310 330 326 335 341 391 387
Northern Cape 82 87 84 91 94 99 91
Free State 166 182 195 180 207 210 209
KwaZulu Natal 472 471 486 537 567 582 624
North West 167 171 174 193 201 228 202
Gauteng 809 805 889 990 996 1 009 1 022
Mpumalanga 180 193 186 176 223 224 254
Limpopo 227 215 254 253 279 300 299
Private households 1 291 1 237 1 214 1 232 1 236 1 230 1 288
Western Cape 141 128 131 132 124 139 154
Eastern Cape 126 124 114 108 121 117 118
Northern Cape 29 31 28 27 28 30 26
Free State 90 90 85 96 89 78 86
KwaZulu Natal 248 213 207 222 225 220 211
North West 81 74 74 73 68 83 82
Gauteng 386 383 384 381 377 358 393
Mpumalanga 101 92 101 102 102 98 102
Limpopo 89 102 90 91 101 107 116
For all values of 10 000 or lower the sample size is too small for reliable estimates Due to rounding, numbers do not necessarily add up to totals
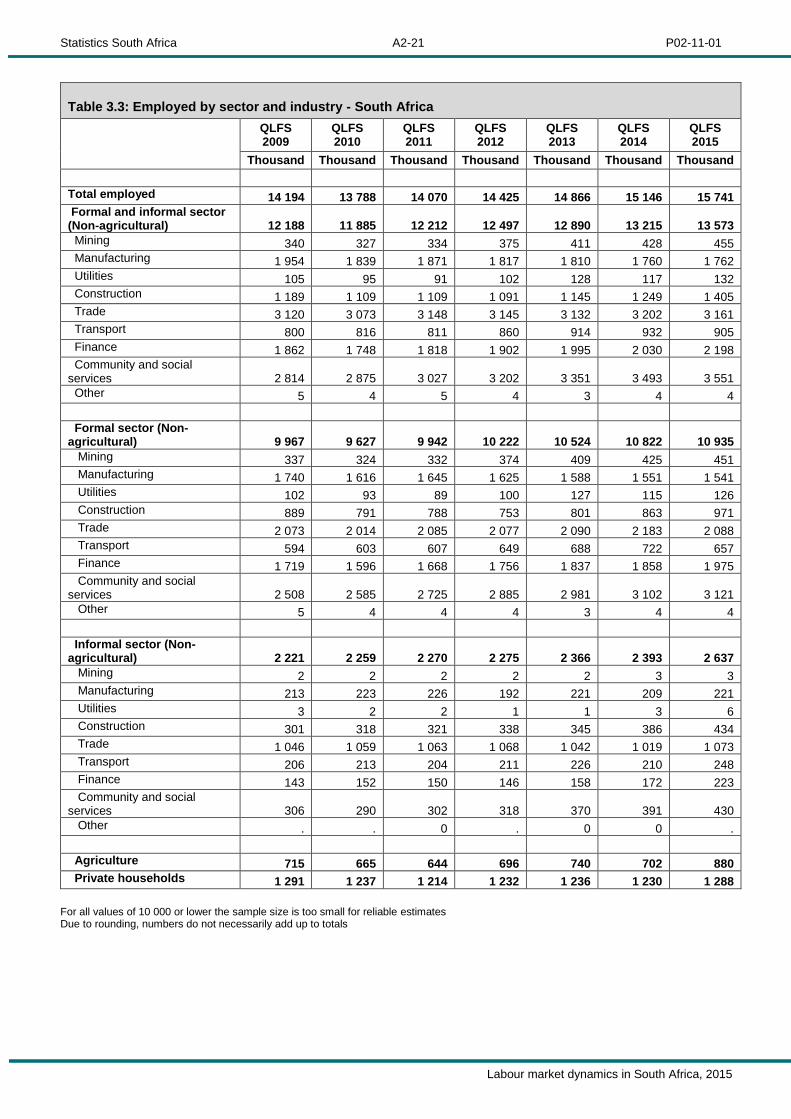
Statistics South Africa P02-11-01 P0120
Labour market dynamics in South Africa, 2015
A2-21
Table 3.3: Employed by sector and industry - South Africa
QLFS 2009
QLFS 2010
QLFS 2011
QLFS 2012
QLFS 2013
QLFS 2014
QLFS 2015
Thousand Thousand Thousand Thousand Thousand Thousand Thousand
Total employed 14 194 13 788 14 070 14 425 14 866 15 146 15 741
Formal and informal sector (Non-agricultural) 12 188 11 885 12 212 12 497 12 890 13 215 13 573
Mining 340 327 334 375 411 428 455
Manufacturing 1 954 1 839 1 871 1 817 1 810 1 760 1 762
Utilities 105 95 91 102 128 117 132
Construction 1 189 1 109 1 109 1 091 1 145 1 249 1 405
Trade 3 120 3 073 3 148 3 145 3 132 3 202 3 161
Transport 800 816 811 860 914 932 905
Finance 1 862 1 748 1 818 1 902 1 995 2 030 2 198
Community and social services 2 814 2 875 3 027 3 202 3 351 3 493 3 551
Other 5 4 5 4 3 4 4
Formal sector (Non-agricultural) 9 967 9 627 9 942 10 222 10 524 10 822 10 935
Mining 337 324 332 374 409 425 451
Manufacturing 1 740 1 616 1 645 1 625 1 588 1 551 1 541
Utilities 102 93 89 100 127 115 126
Construction 889 791 788 753 801 863 971
Trade 2 073 2 014 2 085 2 077 2 090 2 183 2 088
Transport 594 603 607 649 688 722 657
Finance 1 719 1 596 1 668 1 756 1 837 1 858 1 975
Community and social services 2 508 2 585 2 725 2 885 2 981 3 102 3 121
Other 5 4 4 4 3 4 4
Informal sector (Non-agricultural) 2 221 2 259 2 270 2 275 2 366 2 393 2 637
Mining 2 2 2 2 2 3 3
Manufacturing 213 223 226 192 221 209 221
Utilities 3 2 2 1 1 3 6
Construction 301 318 321 338 345 386 434
Trade 1 046 1 059 1 063 1 068 1 042 1 019 1 073
Transport 206 213 204 211 226 210 248
Finance 143 152 150 146 158 172 223
Community and social services 306 290 302 318 370 391 430
Other . . 0 . 0 0 .
Agriculture 715 665 644 696 740 702 880
Private households 1 291 1 237 1 214 1 232 1 236 1 230 1 288
For all values of 10 000 or lower the sample size is too small for reliable estimates Due to rounding, numbers do not necessarily add up to totals

Statistics South Africa P02-11-01 P0120
Labour market dynamics in South Africa, 2015
A2-22
Table 3.4: Employed by province and sector
QLFS 2009
QLFS 2010
QLFS 2011
QLFS 2012
QLFS 2013
QLFS 2014
QLFS 2015
Thousand Thousand Thousand Thousand Thousand Thousand Thousand
South Africa 14 194 13 788 14 070 14 425 14 866 15 146 15 741
Formal sector (Non-agricultural) 9 967 9 627 9 942 10 222 10 524 10 822 10 935
Informal sector (Non-agricultural) 2 221 2 259 2 270 2 275 2 366 2 393 2 637
Agriculture 715 665 644 696 740 702 880
Private households 1 291 1 237 1 214 1 232 1 236 1 230 1 288
Western Cape 2 053 2 025 2 061 2 091 2 141 2 195 2 304
Formal sector (Non-agricultural) 1 550 1 518 1 606 1 629 1 659 1 699 1 676
Informal sector (Non-agricultural) 213 217 204 195 210 216 241
Agriculture 149 161 120 135 149 142 232
Private households 141 128 131 132 124 139 154
Eastern Cape 1 287 1 262 1 278 1 254 1 295 1 350 1 377
Formal sector (Non-agricultural) 802 790 845 822 811 859 869
Informal sector (Non-agricultural) 282 283 256 269 285 296 305
Agriculture 77 65 63 55 78 78 83
Private households 126 124 114 108 121 117 118
Northern Cape 285 281 281 296 310 307 305
Formal sector (Non-agricultural) 177 176 169 193 210 201 205
Informal sector (Non-agricultural) 28 30 31 31 28 32 38
Agriculture 51 44 52 46 44 44 36
Private households 29 31 28 27 28 30 26
Due to rounding, numbers do not necessarily add up to totals

Statistics South Africa P02-11-01 P0120
Labour market dynamics in South Africa, 2015
A2-23
Table 3.4: Employed by province and sector (concluded)
QLFS 2009
QLFS 2010
QLFS 2011
QLFS 2012
QLFS 2013
QLFS 2014
QLFS 2015
Thousand Thousand Thousand Thousand Thousand Thousand Thousand
Free State 779 768 775 728 748 749 805
Formal sector (Non-agricultural) 474 486 495 464 480 496 514
Informal sector (Non-agricultural) 131 123 130 105 107 118 134
Agriculture 84 69 66 63 72 57 71
Private households 90 90 85 96 89 78 86
KwaZulu Natal 2 435 2 340 2 406 2 423 2 490 2 487 2 551
Formal sector (Non-agricultural) 1 624 1 602 1 627 1 695 1 750 1 712 1 708
Informal sector (Non-agricultural) 447 411 476 413 417 464 487
Agriculture 115 114 97 93 98 90 145
Private households 248 213 207 222 225 220 211
North West 846 810 784 817 848 904 936
Formal sector (Non-agricultural) 610 590 576 593 623 668 672
Informal sector (Non-agricultural) 111 106 98 116 118 111 127
Agriculture 44 40 36 36 39 42 55
Private households 81 74 74 73 68 83 82
Gauteng 4 531 4 377 4 494 4 687 4 782 4 824 4 995
Formal sector (Non-agricultural) 3 567 3 373 3 479 3 650 3 726 3 829 3 869
Informal sector (Non-agricultural) 531 586 581 591 632 579 700
Agriculture 47 35 50 64 47 59 34
Private households 386 383 384 381 377 358 393
Mpumalanga 1 015 973 992 1 042 1 123 1 132 1 177
Formal sector (Non-agricultural) 611 595 596 611 674 701 740
Informal sector (Non-agricultural) 220 207 213 232 249 250 247
Agriculture 83 79 82 98 98 84 89
Private households 101 92 101 102 102 98 102
Limpopo 963 953 999 1 085 1 128 1 198 1 291
Formal sector (Non-agricultural) 551 498 550 566 592 658 681
Informal sector (Non-agricultural) 258 295 280 323 320 327 359
Agriculture 65 58 79 106 114 106 135
Private households 89 102 90 91 101 107 116
For all values of 10 000 or lower the sample size is too small for reliable estimates Due to rounding, numbers do not necessarily add up to totals

Statistics South Africa P02-11-01 P0120
Labour market dynamics in South Africa, 2015
A2-24
Table 3.5: Employed by sex and occupation - South Africa
QLFS 2009
QLFS 2010
QLFS 2011
QLFS 2012
QLFS 2013
QLFS 2014
QLFS 2015
Thousand Thousand Thousand Thousand Thousand Thousand Thousand
Both sexes 14 194 13 788 14 070 14 425 14 866 15 146 15 741
Manager 1 097 1 099 1 194 1 161 1 224 1 331 1 274
Professional 755 764 800 842 925 842 776
Technician 1 626 1 534 1 561 1 639 1 645 1 552 1 456
Clerk 1 530 1 517 1 484 1 506 1 606 1 653 1 671
Sales and services 1 924 1 974 2 054 2 113 2 163 2 326 2 463
Skilled agriculture 94 92 73 68 70 76 96
Craft and related trade 1 826 1 682 1 722 1 734 1 730 1 813 1 946
Plant and machine operator 1 255 1 195 1 200 1 200 1 274 1 277 1 312
Elementary 3 067 2 971 3 021 3 187 3 227 3 295 3 729
Domestic worker 1 022 959 961 975 1 002 981 1 017
Other 0 1
Women 6 188 5 950 6 106 6 264 6 539 6 634 6 882
Manager 330 327 373 364 370 418 395
Professional 347 345 370 367 403 374 394
Technician 865 840 871 905 912 872 809
Clerk 1 063 1 034 1 020 1 043 1 134 1 148 1 216
Sales and services 909 873 886 957 1 032 1 122 1 176
Skilled agriculture 21 25 22 22 21 22 26
Craft and related trade 230 194 205 181 196 207 198
Plant and machine operator 178 163 177 154 166 171 173
Elementary 1 257 1 225 1 259 1 332 1 340 1 354 1 515
Domestic worker 987 923 924 939 965 945 979
Other 1
Men 8 006 7 838 7 964 8 161 8 327 8 513 8 859
Manager 766 772 821 797 854 914 879
Professional 408 419 430 475 522 469 382
Technician 760 694 690 735 733 680 647
Clerk 467 483 464 463 472 505 455
Sales and services 1 014 1 100 1 167 1 156 1 131 1 204 1 287
Skilled agriculture 73 67 51 46 49 54 69
Craft and related trade 1 596 1 488 1 517 1 553 1 533 1 606 1 748
Plant and machine operator 1 077 1 032 1 023 1 047 1 109 1 106 1 139
Elementary 1 810 1 746 1 762 1 855 1 886 1 940 2 214
Domestic worker 35 36 38 36 37 36 38
Other 0
For all values of 10 000 or lower the sample size is too small for reliable estimates Due to rounding, numbers do not necessarily add up to totals

Statistics South Africa P02-11-01 P0120
Labour market dynamics in South Africa, 2015
A2-25
Table 3.6: Employed by sex and status in employment - South Africa
QLFS 2009
QLFS 2010
QLFS 2011
QLFS 2012
QLFS 2013
QLFS 2014
QLFS 2015
Thousand Thousand Thousand Thousand Thousand Thousand Thousand
Both sexes 14 194 13 788 14 070 14 425 14 866 15 146 15 741
Employee 12 030 11 652 11 901 12 240 12 712 13 065 13 499
Employer 750 738 759 751 770 773 784
Own-account worker 1 293 1 282 1 303 1 339 1 290 1 227 1 372
Unpaid household member 121 117 107 95 94 82 87
Women 6 188 5 950 6 106 6 264 6 539 6 634 6 882
Employee 5 301 5 098 5 253 5 456 5 714 5 874 6 071
Employer 156 162 171 150 166 161 152
Own-account worker 641 618 612 593 596 546 604
Unpaid household member 90 73 69 64 63 53 54
Men 8 006 7 838 7 964 8 161 8 327 8 513 8 859
Employee 6 729 6 554 6 648 6 784 6 998 7 191 7 427
Employer 594 576 587 601 604 612 631
Own-account worker 652 664 691 745 694 681 768
Unpaid household member 32 44 38 31 30 28 33
For all values of 10 000 or lower the sample size is too small for reliable estimates Due to rounding, numbers do not necessarily add up to totals

Statistics South Africa P02-11-01 P0120
Labour market dynamics in South Africa, 2015
A2-26
Table 3.7: Employed by sex and usual hours of work - South Africa
QLFS 2009
QLFS 2010
QLFS 2011
QLFS 2012
QLFS 2013
QLFS 2014
QLFS 2015
Thousand Thousand Thousand Thousand Thousand Thousand Thousand
Both sexes 14 194 13 788 14 070 14 425 14 866 15 146 15 741
Working less than 15 hours per week 280 251 240 253 298 322 345
Working 15-29 hours per week 864 816 798 847 914 900 1 015
Working 30-39 hours per week 1 043 1 018 1 004 1 032 1 080 1 070 1 077
Working 40-45 hours per week 7 575 7 526 7 759 7 958 8 205 8 527 8 662
Working more than 45 hours per week 4 431 4 177 4 269 4 336 4 369 4 327 4 641
Women 6 188 5 950 6 106 6 264 6 539 6 634 6 882
Working less than 15 hours per week 177 149 142 166 195 207 217
Working 15-29 hours per week 577 537 514 559 593 586 663
Working 30-39 hours per week 656 636 619 645 689 642 661
Working 40-45 hours per week 3 222 3 200 3 371 3 416 3 550 3 713 3 773
Working more than 45 hours per week 1 556 1 428 1 459 1 479 1 513 1 486 1 568
Men 8 006 7 838 7 964 8 161 8 327 8 513 8 859
Working less than 15 hours per week 103 102 98 87 103 115 128
Working 15-29 hours per week 287 279 284 288 321 314 352
Working 30-39 hours per week 386 382 385 387 392 428 416
Working 40-45 hours per week 4 354 4 327 4 388 4 543 4 655 4 814 4 890
Working more than 45 hours per week 2 875 2 748 2 810 2 856 2 856 2 841 3 073
For all values of 10 000 or lower the sample size is too small for reliable estimates Due to rounding, numbers do not necessarily add up to totals

Statistics South Africa P02-11-01 P0120
Labour market dynamics in South Africa, 2015
A2-27
Table 3.8a: Conditions of employment - South Africa
QLFS 2009
QLFS 2010
QLFS 2011
QLFS 2012
QLFS 2013
QLFS 2014
QLFS 2015
Thousand Thousand Thousand Thousand Thousand Thousand Thousand
Pension/retirement fund contribution
Both sexes 12 030 11 652 11 901 12 240 12 712 13 065 13 499
Yes 5 584 5 365 5 696 6 001 6 103 6 386 6 216
No 6 309 6 118 6 040 6 031 6 377 6 443 7 021
Don't know 137 169 165 207 231 235 262
Women 5 301 5 098 5 253 5 456 5 714 5 874 6 071
Yes 2 279 2 203 2 346 2 481 2 539 2 661 2 635
No 2 966 2 831 2 838 2 887 3 071 3 119 3 333
Don't know 56 63 69 87 105 94 104
Men 6 729 6 554 6 648 6 784 6 998 7 191 7 427
Yes 3 305 3 161 3 349 3 520 3 565 3 725 3 581
No 3 342 3 287 3 202 3 144 3 306 3 324 3 688
Don't know 81 106 96 120 127 142 158
Entitled to any paid leave
Both sexes 12 030 11 652 11 901 12 240 12 712 13 065 13 499
Yes 7 296 7 290 7 860 7 848 8 047 8 441 8 522
No 4 624 4 241 3 921 4 240 4 508 4 465 4 814
Don't know 110 121 120 152 156 159 163
Women 5 301 5 098 5 253 5 456 5 714 5 874 6 071
Yes 3 106 3 104 3 380 3 395 3 508 3 671 3 747
No 2 154 1 950 1 830 1 999 2 140 2 138 2 263
Don't know 42 44 44 62 66 65 61
Men 6 729 6 554 6 648 6 784 6 998 7 191 7 427
Yes 4 191 4 186 4 480 4 454 4 539 4 770 4 775
No 2 470 2 291 2 091 2 240 2 368 2 327 2 551
Don't know 68 77 77 90 90 94 102
Entitled to paid sick leave
Both sexes 5 799 11 901 12 240 12 712 13 065 13 499
Yes 3 755 8 055 8 433 8 687 9 001 9 223
No 2 044 3 846 3 807 4 025 4 063 4 276
Women 2 529 5 253 5 456 5 714 5 874 6 071
Yes 1 625 3 500 3 668 3 811 3 931 4 074
No 903 1 753 1 788 1 903 1 943 1 997
Men 3 270 6 648 6 784 6 998 7 191 7 427
Yes 2 129 4 555 4 765 4 876 5 071 5 148
No 1 141 2 093 2 019 2 122 2 120 2 279
Entitled to maternity/paternity leave
Both sexes 5 799 11 901 12 240 12 712 13 065 13 499
Yes 3 091 6 472 6 585 6 689 6 988 7 207
No 2 708 5 429 5 655 6 023 6 077 6 292
Women 2 529 5 253 5 456 5 714 5 874 6 071
Yes 1 438 2 946 3 038 3 100 3 226 3 343
No 1 090 2 307 2 418 2 614 2 648 2 729
Men 3 270 6 648 6 784 6 998 7 191 7 427
Yes 1 652 3 526 3 547 3 589 3 762 3 864
No 1 618 3 122 3 237 3 409 3 429 3 563 Due to rounding, numbers do not necessarily add up to totals

Statistics South Africa P02-11-01 P0120
Labour market dynamics in South Africa, 2015
A2-28
Table 3.8b: Conditions of employment - South Africa
QLFS 2009
QLFS 2010
QLFS 2011
QLFS 2012
QLFS 2013
QLFS 2014
QLFS 2015
Thousand Thousand Thousand Thousand Thousand Thousand Thousand
UIF contribution
Both sexes 12 030 11 652 11 901 12 240 12 712 13 065 13 499
Yes 6 875 6 593 6 814 7 279 7 815 7 976 8 080
No 5 050 4 938 4 958 4 787 4 677 4 862 5 154
Don't know 105 121 129 174 220 227 264
Women 5 301 5 098 5 253 5 456 5 714 5 874 6 071
Yes 2 743 2 632 2 766 2 986 3 227 3 269 3 356
No 2 512 2 415 2 428 2 396 2 376 2 501 2 602
Don't know 46 51 59 74 111 104 113
Men 6 729 6 554 6 648 6 784 6 998 7 191 7 427
Yes 4 132 3 961 4 048 4 292 4 588 4 706 4 724
No 2 538 2 523 2 530 2 392 2 300 2 361 2 552
Don't know 58 69 70 100 109 123 152
Medical aid benefits
Both sexes 12 030 11 652 11 901 12 240 12 712 13 065 13 499
Yes 3 667 3 715 3 799 4 013 4 020 4 105 3 980
No 8 285 7 856 8 013 8 110 8 559 8 820 9 366
Don't know 77 80 89 117 133 139 153
Women 5 301 5 098 5 253 5 456 5 714 5 874 6 071
Yes 1 574 1 593 1 645 1 731 1 722 1 769 1 737
No 3 694 3 472 3 569 3 672 3 929 4 053 4 269
Don't know 34 33 39 53 62 52 65
Men 6 729 6 554 6 648 6 784 6 998 7 191 7 427
Yes 2 094 2 122 2 153 2 281 2 297 2 336 2 242
No 4 591 4 384 4 444 4 438 4 629 4 768 5 096
Don't know 44 47 50 64 71 87 89
Income tax (PAYE/ SITE) deduction
Both sexes 12 030 11 652 11 901 12 240 12 712 13 065 13 499
Yes 6 614 6 205 6 644 6 865 7 099 7 283 7 180
No 5 286 5 295 5 106 5 170 5 386 5 538 6 054
Don't know 130 151 151 205 227 244 265
Women 5 301 5 098 5 253 5 456 5 714 5 874 6 071
Yes 2 707 2 560 2 734 2 844 2 973 3 019 3 031
No 2 549 2 485 2 465 2 538 2 650 2 756 2 933
Don't know 45 53 55 74 91 99 108
Men 6 729 6 554 6 648 6 784 6 998 7 191 7 427
Yes 3 907 3 646 3 910 4 020 4 126 4 264 4 149
No 2 737 2 810 2 641 2 632 2 736 2 781 3 122
Don't know 85 98 96 131 136 145 156
Condition of employment
Both sexes 12 030 11 652 11 901 12 240 12 712 13 065 13 499
Written contract 9 376 9 159 9 458 9 851 10 223 10 643 10 698
Verbal agreement 2 653 2 492 2 443 2 388 2 489 2 422 2 801
Women 5 301 5 098 5 253 5 456 5 714 5 874 6 071
Written contract 4 014 3 906 4 093 4 299 4 510 4 723 4 787
Verbal agreement 1 287 1 192 1 160 1 156 1 205 1 151 1 284
Men 6 729 6 554 6 648 6 784 6 998 7 191 7 427
Written contract 5 362 5 253 5 365 5 552 5 713 5 920 5 910
Verbal agreement 1 366 1 301 1 283 1 232 1 284 1 271 1 517 Due to rounding, numbers do not necessarily add up to totals

Statistics South Africa P02-11-01 P0120
Labour market dynamics in South Africa, 2015
A2-29
Table 3.8c: Conditions of employment - South Africa
QLFS 2009
QLFS 2010
QLFS 2011
QLFS 2012
QLFS 2013
QLFS 2014
QLFS 2015
Thousand Thousand Thousand Thousand Thousand Thousand Thousand
Nature of contract/agreement (Both sexes)
Both sexes 12 030 11 652 11 901 12 240 12 712 13 065 13 499
Limited duration 1 418 1 391 1 448 1 615 1 795 1 993 1 989
Permanent nature 7 719 7 586 7 747 7 917 8 010 8 185 8 233
Unspecified duration 2 893 2 674 2 707 2 708 2 908 2 886 3 276
Women 5 301 5 098 5 253 5 456 5 714 5 874 6 071
Limited duration 624 608 639 740 823 961 965
Permanent nature 3 286 3 220 3 333 3 415 3 498 3 549 3 615
Unspecified duration 1 391 1 271 1 282 1 300 1 394 1 365 1 491
Men 6 729 6 554 6 648 6 784 6 998 7 191 7 427
Limited duration 793 784 809 875 972 1 033 1 024
Permanent nature 4 432 4 367 4 414 4 502 4 512 4 636 4 618
Unspecified duration 1 503 1 403 1 424 1 407 1 514 1 522 1 785
Trade union membership (Both sexes)
Both sexes 5 799 11 901 12 240 12 712 13 065 13 499
Yes 1 746 3 488 3 640 3 650 3 788 3 697
No 3 888 8 171 8 310 8 726 8 908 9 414
Don't know 164 242 290 336 369 387
Women 2 529 5 253 5 456 5 714 5 874 6 071
Yes 699 1 405 1 468 1 498 1 544 1 526
No 1 767 3 754 3 874 4 087 4 187 4 388
Don't know 62 94 114 129 143 158
Men 3 270 6 648 6 784 6 998 7 191 7 427
Yes 1 047 2 082 2 172 2 152 2 243 2 172
No 2 121 4 417 4 436 4 639 4 721 5 026
Don't know 102 148 176 207 227 229
How annual salary increment is negotiated
Both sexes 5 799 11 901 12 240 12 712 13 065 13 499
Individual and employer 839 1 675 1 454 1 276 1 235 1 307
Union and employer 1 350 2 691 2 864 2 794 2 877 2 833
Bargaining council 557 1 091 1 136 1 108 1 152 1 096
Employer only 2 602 5 718 6 102 6 799 7 018 7 481
No regular increment 402 660 616 669 727 724
Other 48 66 67 65 56 58
Women 2 529 5 253 5 456 5 714 5 874 6 071
Individual and employer 354 730 627 548 551 571
Union and employer 521 1 041 1 094 1 064 1 090 1 098
Bargaining council 254 513 544 560 583 560
Employer only 1 202 2 630 2 870 3 208 3 292 3 490
No regular increment 178 313 295 311 336 331
Other 20 26 25 23 22 23
Men 3 270 6 648 6 784 6 998 7 191 7 427
Individual and employer 486 945 826 728 684 736
Union and employer 829 1 650 1 770 1 730 1 787 1 735
Bargaining council 303 578 593 549 570 536
Employer only 1 400 3 088 3 232 3 591 3 726 3 992
No regular increment 224 347 321 358 391 393
Other 28 40 42 41 34 35 Due to rounding, numbers do not necessarily add up to totals

Statistics South Africa P02-11-01 P0120
Labour market dynamics in South Africa, 2015
A2-30
Table 3.9: Time-related underemployment - South Africa
QLFS 2009
QLFS 2010
QLFS 2011
QLFS 2012
QLFS 2013
QLFS 2014
QLFS 2015
Thousand Thousand Thousand Thousand Thousand Thousand Thousand
Both sexes 669 576 540 585 615 608 705
Women 421 352 323 351 377 359 424
Men 248 224 217 233 237 249 281
As percentage of the labour force (Both sexes) 3,6 3,1 2,9 3,0 3,1 3,0 3,3
Women 5,1 4,3 3,8 4,1 4,2 3,9 4,5
Men 2,4 2,2 2,1 2,2 2,2 2,2 2,4
As percentage of total employment (Both sexes) 4,7 4,2 3,8 4,1 4,1 4,0 4,5
Women 6,8 5,9 5,3 5,6 5,8 5,4 6,2
Men 3,1 2,9 2,7 2,9 2,8 2,9 3,2
Industry 669 576 540 585 615 608 705
Agriculture 13 10 10 12 13 11 18
Mining . 0 0 0 0 0 0
Manufacturing 41 31 40 31 30 22 33
Utilities 0 0 . 0 0 0 1
Construction 54 57 52 69 64 70 75
Trade 126 116 103 109 104 102 114
Transport 20 16 13 16 25 15 20
Finance 37 29 38 40 38 39 46
Community and social services 98 86 75 91 127 137 161
Private households 280 230 209 216 213 211 237
Other 0
Occupation 669 576 540 585 615 608 705
Manager 10 8 14 10 14 14 11
Professional 15 9 5 7 11 9 6
Technician 44 33 30 34 32 30 36
Clerk 22 23 19 16 24 20 19
Sales and services 61 64 48 60 62 59 76
Skilled agriculture 4 3 3 4 4 2 6
Craft and related trade 62 64 66 71 63 68 73
Plant and machine operator 18 10 14 15 20 10 17
Elementary 217 194 188 203 228 245 293
Domestic worker 215 169 153 165 158 151 168
For all values of 10 000 or lower the sample size is too small for reliable estimates Due to rounding, numbers do not necessarily add up to totals

Statistics South Africa P02-11-01 P0120
Labour market dynamics in South Africa, 2015
A2-31
Table 3.10: Employed by industry and volume of hours worked - South Africa
Market production activities
QLFS 2009
QLFS 2010
QLFS 2011
QLFS 2012
QLFS 2013
QLFS 2014
QLFS 2015
Hours Hours Hours Hours Hours Hours Hours
Both sexes 613 967 592 815 610 041 616 971 632 357 643 453 592 815
Agriculture 33 496 30 329 29 801 31 913 33 511 31 594 30 329
Mining 15 204 14 715 14 900 16 656 18 213 17 869 14 715
Manufacturing 83 197 78 130 80 687 76 737 76 365 74 900 78 130
Utilities 4 414 4 051 3 882 4 327 5 368 4 946 4 051
Construction 49 667 45 137 45 679 44 162 46 147 50 609 45 137
Trade 148 569 146 018 150 108 147 790 147 205 149 496 146 018
Transport 40 665 40 987 40 770 42 256 45 245 45 567 40 987
Finance 83 489 77 901 80 595 83 960 87 283 89 177 77 901
Community and social services 111 284 113 485 121 805 127 288 131 014 137 009 113 485
Private households 43 803 41 898 41 618 41 725 41 884 42 138 41 898
Other 179 162 196 157 122 149 162
Women 251 530 240 134 249 715 251 385 261 483 265 748 240 134
Agriculture 9 958 9 771 9 294 9 771 9 745 8 912 9 771
Mining 1 773 1 636 1 567 2 188 2 211 2 949 1 636
Manufacturing 25 278 24 666 26 142 23 596 23 584 22 913 24 666
Utilities 931 823 846 861 1 406 1 048 823
Construction 4 699 4 034 3 940 4 107 4 640 4 820 4 034
Trade 69 923 67 556 67 617 66 568 69 993 68 251 67 556
Transport 7 267 6 628 6 631 6 979 7 374 7 594 6 628
Finance 33 712 28 830 31 446 32 410 33 237 34 803 28 830
Community and social services 63 190 63 344 69 039 72 117 75 195 80 300 63 344
Private households 34 696 32 724 33 117 32 724 34 040 34 086 32 724
Other 102 122 75 64 58 71 122
Men 362 437 352 681 360 326 365 587 370 874 377 705 352 681
Agriculture 23 539 20 558 20 507 22 142 23 766 22 682 20 558
Mining 13 431 13 079 13 333 14 468 16 002 14 920 13 079
Manufacturing 57 919 53 464 54 545 53 142 52 781 51 987 53 464
Utilities 3 482 3 228 3 036 3 466 3 962 3 898 3 228
Construction 44 969 41 104 41 739 40 054 41 507 45 789 41 104
Trade 78 645 78 462 82 491 81 221 77 212 81 246 78 462
Transport 33 398 34 359 34 140 35 277 37 872 37 973 34 359
Finance 49 777 49 071 49 149 51 551 54 046 54 374 49 071
Community and social services 48 094 50 141 52 766 55 172 55 819 56 709 50 141
Private households 9 107 9 174 8 501 9 001 7 845 8 051 9 174
Other 77 41 120 92 64 78 41
For all values of 10 000 or lower the sample size is too small for reliable estimates Due to rounding, numbers do not necessarily add up to totals

Statistics South Africa P02-11-01 P0120
Labour market dynamics in South Africa, 2015
A2-32
Table 3.11: Employed by industry and average hours of work
Market production activities
QLFS 2009
QLFS 2010
QLFS 2011
QLFS 2012
QLFS 2013
QLFS 2014
QLFS 2015
Hours Hours Hours Hours Hours Hours Hours
Both sexes 44 44 44 44 43 43 44
Agriculture 47 46 47 46 46 46 46
Mining 46 46 45 46 46 46 46
Manufacturing 43 43 44 43 43 43 43
Utilities 43 44 43 43 42 42 44
Construction 43 42 42 42 42 42 42
Trade 48 48 48 48 48 47 48
Transport 52 51 51 50 50 50 51
Finance 45 45 45 45 44 45 45
Community and social services 41 41 42 41 41 40 41
Private households 34 34 35 34 34 34 34
Other 40 41 42 45 42 38 41
Women 42 41 42 41 41 41 41
Agriculture 45 44 44 44 43 43 44
Mining 43 45 43 44 43 44 45
Manufacturing 42 42 43 42 42 42 42
Utilities 42 40 41 42 40 38 40
Construction 37 36 35 33 35 35 36
Trade 47 47 47 46 47 46 47
Transport 44 42 43 42 43 43 42
Finance 42 42 42 42 41 42 42
Community and social services 40 40 41 40 40 39 40
Private households 35 35 35 34 35 35 35
Other 39 40 43 42 38 36 40
Men 46 46 46 46 45 45 46
Agriculture 49 47 48 47 47 47 47
Mining 46 46 46 46 46 46 46
Manufacturing 44 44 44 43 44 44 44
Utilities 43 44 44 43 43 44 44
Construction 43 43 43 43 42 42 43
Trade 49 49 50 49 49 49 49
Transport 54 53 52 52 52 51 53
Finance 48 47 47 47 46 47 47
Community and social services 42 42 43 43 42 42 42
Private households 33 33 32 33 32 31 33
Other 40 44 42 47 47 40 44
For all values of 10 000 or lower the sample size is too small for reliable estimates Due to rounding, numbers do not necessarily add up to totals

Statistics South Africa P02-11-01 P0120
Labour market dynamics in South Africa, 2015
A2-33
Table 3.12: Employed by occupation and volume of hours worked
QLFS 2009
QLFS 2010
QLFS 2011
QLFS 2012
QLFS 2013
QLFS 2014
QLFS 2015
Hours Hours Hours Hours Hours Hours Hours
Both sexes 613 967 592 815 610 041 616 971 632 357 643 453 592 815
Manager 51 425 50 318 54 718 52 714 55 306 59 669 50 318
Professional 31 038 31 383 33 656 34 967 37 662 34 608 31 383
Technician 63 476 59 600 60 965 63 248 63 701 60 688 59 600
Clerk 64 008 63 189 62 607 62 765 66 635 68 608 63 189
Sales and services 95 451 96 771 101 745 102 824 104 829 111 141 96 771
Skilled agriculture 4 227 4 003 3 316 2 952 2 956 3 304 4 003
Craft and related trade 77 565 70 627 73 501 73 153 72 341 76 023 70 627
Plant and machine operator 59 695 57 155 57 369 56 390 60 432 59 555 57 155
Elementary 132 104 127 153 128 732 134 727 133 997 135 459 127 153
Domestic worker 34 973 32 616 33 432 33 233 34 498 34 371 32 616
Other 27
Women 251 530 240 134 249 715 251 385 261 483 265 748 240 134
Manager 14 381 14 108 16 165 15 408 15 809 17 770 14 108
Professional 13 793 13 691 15 285 14 859 16 011 14 978 13 691
Technician 32 651 31 455 33 310 33 907 34 055 32 968 31 455
Clerk 43 881 42 416 42 561 43 080 46 475 47 184 42 416
Sales and services 41 959 39 601 40 505 42 946 46 429 49 991 39 601
Skilled agriculture 773 1 002 943 903 807 854 1 002
Craft and related trade 9 177 7 768 8 497 7 238 8 043 8 432 7 768
Plant and machine operator 7 561 6 708 7 501 6 438 6 903 7 220 6 708
Elementary 53 616 52 005 52 748 54 522 53 713 53 225 52 005
Domestic worker 33 738 31 380 32 199 32 083 33 238 33 100 31 380
Other 27
Men 362 437 352 681 360 326 365 587 370 874 377 705 352 681
Manager 37 044 36 209 38 553 37 305 39 497 41 899 36 209
Professional 17 245 17 692 18 371 20 108 21 651 19 630 17 692
Technician 30 826 28 145 27 655 29 341 29 646 27 720 28 145
Clerk 20 127 20 773 20 046 19 684 20 159 21 424 20 773
Sales and services 53 492 57 170 61 240 59 878 58 400 61 150 57 170
Skilled agriculture 3 453 3 001 2 373 2 049 2 149 2 450 3 001
Craft and related trade 68 388 62 860 65 004 65 915 64 299 67 591 62 860
Plant and machine operator 52 134 50 447 49 868 49 952 53 529 52 336 50 447
Elementary 78 488 75 148 75 984 80 204 80 284 82 235 75 148
Domestic worker 1 236 1 236 1 233 1 150 1 260 1 271 1 236
Other Due to rounding, numbers do not necessarily add up to totals

Statistics South Africa P02-11-01 P0120
Labour market dynamics in South Africa, 2015
A2-34
Table 3.13: Employed by occupation and average hours of work
QLFS 2009
QLFS 2010
QLFS 2011
QLFS 2012
QLFS 2013
QLFS 2014
QLFS 2015
Hours Hours Hours Hours Hours Hours Hours
Both sexes 44 44 44 44 43 43 44
Manager 48 47 46 46 46 45 47
Professional 42 42 43 42 42 42 42
Technician 41 40 41 40 41 41 40
Clerk 42 42 43 42 42 42 42
Sales and services 51 50 50 49 49 49 50
Skilled agriculture 46 44 46 45 43 44 44
Craft and related trade 43 43 43 43 43 43 43
Plant and machine operator 48 49 48 48 48 48 49
Elementary 44 44 43 43 42 42 44
Domestic worker 34 34 35 34 35 35 34
Other 45
Women 42 41 42 41 41 41 41
Manager 44 44 44 43 44 43 44
Professional 41 41 42 41 41 41 41
Technician 39 39 40 40 40 40 39
Clerk 42 42 43 42 42 42 42
Sales and services 47 46 47 46 46 45 46
Skilled agriculture 38 40 43 42 39 40 40
Craft and related trade 41 42 43 41 42 42 42
Plant and machine operator 44 43 43 43 43 43 43
Elementary 44 44 43 42 41 40 44
Domestic worker 34 34 35 34 35 35 34
Other 45
Men 46 46 46 46 45 45 46
Manager 49 47 47 47 47 46 47
Professional 43 43 43 43 42 43 43
Technician 42 42 41 41 42 42 42
Clerk 44 44 44 43 43 43 44
Sales and services 53 53 53 52 52 52 53
Skilled agriculture 48 46 47 47 45 46 46
Craft and related trade 44 43 44 43 43 43 43
Plant and machine operator 49 49 49 48 49 49 49
Elementary 44 44 44 44 43 43 44
Domestic worker 36 34 33 32 35 36 34
Other

Statistics South Africa P02-11-01 P0120
Labour market dynamics in South Africa, 2015
A2-35
Table 3.14: Employed by sector and volume of hours worked
Market production activities
QLFS 2009
QLFS 2010
QLFS 2011
QLFS 2012
QLFS 2013
QLFS 2014
QLFS 2015
Hours Hours Hours Hours Hours Hours Hours
Both Sexes 613 967 592 815 610 041 616 971 632 357 643 453 592 815
Formal sector (Non-agricultural) 434 317 416 363 432 158 440 041 449 895 462 155 416 363
Informal sector (Non-agricultural) 102 351 104 225 106 464 103 292 107 067 107 566 104 225
Agriculture 33 496 30 329 29 801 31 913 33 511 31 594 30 329
Private households 43 803 41 898 41 618 41 725 41 884 42 138 41 898
Women 251 530 240 134 249 715 251 385 261 483 265 748 240 134
Formal sector (Non-agricultural) 163 902 156 169 165 540 170 117 176 759 182 912 156 169
Informal sector (Non-agricultural) 42 974 41 469 41 764 38 773 40 940 39 837 41 469
Agriculture 9 958 9 771 9 294 9 771 9 745 8 912 9 771
Private households 34 696 32 724 33 117 32 724 34 040 34 086 32 724
Men 362 437 352 681 360 326 365 587 370 874 377 705 352 681
Formal sector (Non-agricultural) 270 415 260 193 266 618 269 924 273 136 279 243 260 193
Informal sector (Non-agricultural) 59 377 62 756 64 700 64 519 66 127 67 730 62 756
Agriculture 23 539 20 558 20 507 22 142 23 766 22 682 20 558
Private households 9 107 9 174 8 501 9 001 7 845 8 051 9 174 Due to rounding, numbers do not necessarily add up to totals

Statistics South Africa P02-11-01 P0120
Labour market dynamics in South Africa, 2015
A2-36
Table 3.15: Employed by sector and average hours of work
Market production activities
QLFS 2009
QLFS 2010
QLFS 2011
QLFS 2012
QLFS 2013
QLFS 2014
QLFS 2015
Hours Hours Hours Hours Hours Hours Hours
Both Sexes 44 44 44 44 43 43 44
Formal sector (Non-agricultural) 44 44 44 44 44 44 44
Informal sector (Non-agricultural) 48 48 48 47 47 46 48
Agriculture 47 46 47 46 46 46 46
Private households 34 34 35 34 34 34 34
Women 42 41 42 41 41 41 41
Formal sector (Non-agricultural) 42 42 42 42 42 42 42
Informal sector (Non-agricultural) 45 46 46 44 44 44 46
Agriculture 45 44 44 44 43 43 44
Private households 35 35 35 34 35 35 35
Men 46 46 46 46 45 45 46
Formal sector (Non-agricultural) 46 46 46 45 45 45 46
Informal sector (Non-agricultural) 49 49 49 48 48 48 49
Agriculture 49 47 48 47 47 47 47
Private households 33 33 32 33 32 31 33

Statistics South Africa P02-11-01 P0120
Labour market dynamics in South Africa, 2015
A2-37
Table 3.16: Employment by sex and province
QLFS 2008
QLFS 2009
QLFS 2010
QLFS 2011
QLFS 2012
QLFS 2013
QLFS 2014
Thousand Thousand Thousand Thousand Thousand Thousand Thousand
Both sexes 14 585 14 194 13 788 14 070 14 425 14 866 15 146
Western Cape 2 032 2 053 2 025 2 061 2 091 2 141 2 195
Eastern Cape 1 324 1 287 1 262 1 278 1 254 1 295 1 350
Northern Cape 314 285 281 281 296 310 307
Free State 826 779 768 775 728 748 749
KwaZulu Natal 2 553 2 435 2 340 2 406 2 423 2 490 2 487
North West 904 846 810 784 817 848 904
Gauteng 4 688 4 531 4 377 4 494 4 687 4 782 4 824
Mpumalanga 1 021 1 015 973 992 1 042 1 123 1 132
Limpopo 922 963 953 999 1 085 1 128 1 198
Women 6 277 6 188 5 950 6 106 6 264 6 539 6 634
Western Cape 877 904 917 947 970 983 992
Eastern Cape 620 608 603 606 583 612 659
Northern Cape 127 124 128 113 130 134 132
Free State 353 335 330 317 308 334 321
KwaZulu Natal 1 149 1 129 1 064 1 085 1 088 1 154 1 122
North West 347 318 308 294 323 334 373
Gauteng 1 928 1 870 1 752 1 870 1 953 2 018 2 031
Mpumalanga 441 452 427 425 445 463 478
Limpopo 436 446 420 448 464 507 525
Men 8 308 8 006 7 838 7 964 8 161 8 327 8 513
Western Cape 1 155 1 149 1 107 1 114 1 121 1 157 1 203
Eastern Cape 705 679 659 672 671 683 691
Northern Cape 187 162 152 168 166 177 175
Free State 473 444 438 458 420 415 428
KwaZulu Natal 1 404 1 305 1 276 1 321 1 335 1 336 1 365
North West 557 528 502 490 494 514 531
Gauteng 2 760 2 661 2 625 2 624 2 735 2 764 2 793
Mpumalanga 581 563 546 567 597 661 654
Limpopo 486 517 533 550 621 620 673 Due to rounding, numbers do not necessarily add up to totals

Statistics South Africa P02-11-01 P0120
Labour market dynamics in South Africa, 2015
A2-38
Table 3.17: Distribution of monthly earnings for employees by selected population group and sex
QLFS 2009
QLFS 2010
QLFS 2011
QLFS 2012
QLFS 2013
QLFS 2014
QLFS 2015
Rand Rand Rand Rand Rand Rand Rand
Both sexes - 2 900 3 000 3 115 3 033 3 033 3 100
Black African - 2 200 2 491 2 600 2 600 2 800 2 900
Coloured - 2 600 3 000 3 250 3 000 3 033 3 000
Indian/Asian - 6 700 7 000 7 000 7 000 6 000 6 500
White - 9 850 10 000 10 006 10 500 10 000 12 000
Female - 2 400 2 500 2 600 2 500 2 600 2 700
Black African - 1 800 1 950 2 000 2 100 2 300 2 500
Coloured - 2 383 2 730 3 000 2 700 3 000 2 700
Indian/Asian - 6 500 6 700 7 000 6 700 4 700 6 000
White - 8 000 8 500 9 500 10 000 10 000 10 000
Male - 3 200 3 466 3 500 3 500 3 500 3 500
Black African - 2 600 2 800 3 000 3 100 3 250 3 250
Coloured - 3 033 3 300 3 500 3 060 3 250 3 028
Indian/Asian - 7 000 7 000 7 000 7 400 6 000 7 000
White - 12 000 12 000 12 000 12 000 11 853 13 100 Due to rounding, numbers do not necessarily add up to totals

Statistics South Africa P02-11-01 P0120
Labour market dynamics in South Africa, 2015
A2-39
Table 3.18: Distribution of monthly earnings for employees by age group and sex
QLFS 2009
QLFS 2010
QLFS 2011
QLFS 2012
QLFS 2013
QLFS 2014
QLFS 2015
Rand Rand Rand Rand Rand Rand Rand
Both sexes - 2 900 3 000 3 115 3 033 3 033 3 100
15-24 years - 2 166 2 300 2 500 2 340 2 500 2 600
25-34 years - 2 600 3 000 3 000 3 000 3 000 3 006
35-44 years - 3 000 3 250 3 500 3 466 3 466 3 466
45-54 years - 3 250 3 500 3 500 3 204 3 271 3 400
55-64 years - 3 500 3 700 4 000 3 500 3 900 3 500
Female - 2 400 2 500 2 600 2 500 2 600 2 700
15-24 years - 2 100 2 400 2 500 2 400 2 500 2 500
25-34 years - 2 383 2 500 2 600 2 760 2 800 2 863
35-44 years - 2 400 2 500 2 800 2 500 2 700 2 800
45-54 years - 2 500 2 500 2 500 2 400 2 500 2 500
55-64 years - 2 600 2 900 3 100 2 500 2 850 2 600
Male - 3 200 3 466 3 500 3 500 3 500 3 500
15-24 years - 2 166 2 200 2 470 2 300 2 500 2 600
25-34 years - 2 950 3 033 3 250 3 250 3 250 3 250
35-44 years - 3 500 3 640 4 000 4 000 4 000 4 000
45-54 years - 4 000 4 333 4 500 4 342 4 333 4 300
55-64 years - 4 000 4 333 5 000 4 700 4 800 4 500 Due to rounding, numbers do not necessarily add up to totals

Statistics South Africa P02-11-01 P0120
Labour market dynamics in South Africa, 2015
A2-40
Table 3.19: Distribution of monthly earnings of employees by province and sex
QLFS 2009
QLFS 2010
QLFS 2011
QLFS 2012
QLFS 2013
QLFS 2014
QLFS 2015
Rand Rand Rand Rand Rand Rand Rand
Both sexes - 2 900 3 000 3 115 3 033 3 033 3 100
Western Cape - 3 000 3300 3 466 3 250 3 423 3 250
Eastern Cape - 2 200 2500 2 500 2 200 2 500 2 418
Northern Cape - 2 058 2166 2 000 2 058 2 200 2 383
Free State - 2 000 2100 2 166 2 400 2 500 2 500
KwaZulu-Natal - 2 500 2600 2 800 2 600 2 500 2 500
North West - 3 000 3250 3 500 3 380 3 000 3 000
Gauteng - 3 500 3960 4 000 4 300 4 333 4 500
Mpumalanga - 2 800 2400 2 505 2 700 3 000 3 000
Limpopo - 1 800 1800 2 000 2 000 2 166 2 300
Women - 2 400 2 500 2 600 2 500 2 600 2 700
Western Cape - 2 500 3 000 3 033 3 033 3 200 3 000
Eastern Cape - 2 000 2 166 2 340 2 000 2 200 2 100
Northern Cape - 1 733 1 900 1 625 1 800 2 000 2 000
Free State - 1 650 1 800 1 800 1 850 2 100 2 166
KwaZulu-Natal - 1 950 2 000 2 160 2 000 2 000 2 000
North West - 2 100 2 200 2 500 2 383 2 246 2 400
Gauteng - 3 200 3 500 3 500 3 500 3 800 4 000
Mpumalanga - 2 000 1 950 2 000 2 000 2 300 2 500
Limpopo - 1 200 1 300 1 500 1 500 1 800 1 800
Men - 3 200 3 466 3 500 3 500 3 500 3 500
Western Cape - 3 206 3 500 3 600 3 500 3 500 3 500
Eastern Cape - 2 400 2 600 2 600 2 500 2 600 2 600
Northern Cape - 2 500 2 250 2 273 2 200 2 383 2 500
Free State - 2 400 2 200 2 600 2 600 3 000 2 700
KwaZulu-Natal - 2 816 3 000 3 100 3 200 3 000 2 816
North West - 3 488 3 900 4 200 4 333 4 000 3 500
Gauteng - 3 900 4 285 4 500 4 800 4 500 5 000
Mpumalanga - 3 400 3 000 3 200 3 293 4 000 3 600
Limpopo - 2 200 2 200 2 500 2 500 2 400 2 600 Due to rounding, numbers do not necessarily add up to totals

Statistics South Africa P02-11-01 P0120
Labour market dynamics in South Africa, 2015
A2-41
Table 3.20: Distribution of monthly earnings for employees by occupation and sex
QLFS 2009 QLFS 2010 QLFS 2011 QLFS 2012 QLFS 2013 QLFS 2014 QLFS 2015
Rand Rand Rand Rand Rand Rand Rand
Both sexes - 2 900 3 000 3 115 3 033 3 033 3 100
Manager - 11 000 13 000 12 800 14 083 16 000 17 000
Professional - 10 600 13 000 13 000 15 000 15 000 18 000
Technician - 7 900 8 000 8 000 8 400 6 000 6 000
Clerk - 4 500 4 800 5 000 4 700 4 800 4 500
Sales - 2 500 2 600 2 800 2 860 3 000 3 080
Skilled agriculture - 1 950 1 200 1 500 1 920 2 200 1 950
Craft - 3 000 3 033 3 466 3 300 3 466 3 500
Operator - 3 000 3 000 3 100 3 466 3 500 3 500
Elementary - 1 516 1 600 1 750 1 900 2 100 2 200
Domestic worker - 1 000 1 200 1 200 1 300 1 400 1 500
Women - 2 400 2 500 2 600 2 500 2 600 2 700
Manager - 9 000 11 400 12 000 12 800 15 000 15 000
Professional - 10 000 11 500 12 000 14 000 14 500 17 000
Technician - 7 500 8 000 8 000 8 000 6 000 7 000
Clerk - 4 000 4 550 4 506 4 500 4 500 4 333
Sales - 2 000 2 166 2 300 2 300 2 500 2 686
Skilled agriculture - 1 560 996 1 300 1 360 2 000 1 213
Craft - 2 080 2 296 2 470 2 500 2 925 2 800
Operator - 1 950 2 000 2 500 2 816 2 600 2 790
Elementary - 1 500 1 500 1 600 1 733 1 900 2 000
Domestic worker - 1 000 1 200 1 200 1 300 1 400 1 500
Men - 3 200 3 466 3 500 3 500 3 500 3 500
Manager - 12 000 15 000 14 000 15 000 16 700 20 000
Professional - 12 000 15 700 15 000 16 000 16 000 21 000
Technician - 8 000 8 000 8 000 8 500 5 850 5 500
Clerk - 5 000 5 000 5 200 5 000 5 000 4 900
Sales - 2 800 3 000 3 200 3 250 3 500 3 500
Skilled agriculture - 2 200 1 300 1 733 2 050 2 383 2 500
Craft - 3 000 3 120 3 500 3 500 3 500 3 780
Operator - 3 033 3 250 3 250 3 466 3 683 3 600
Elementary - 1 700 1 733 1 921 2 000 2 200 2 400
Domestic worker - 1 000 1 100 1 040 1 200 1 200 1 500 Due to rounding, numbers do not necessarily add up to totals

Statistics South Africa P02-11-01 P0120
Labour market dynamics in South Africa, 2015
A2-42
Table 3.21: Distribution of monthly earnings for employees by industry and sex
QLFS 2009
QLFS 2010
QLFS 2011
QLFS 2012
QLFS 2013
QLFS 2014
QLFS 2015
Rand Rand Rand Rand Rand Rand Rand
Both sexes - 2 900 3 000 3 115 3 033 3 033 3 100
Agriculture - 1 295 1 300 1 495 1 733 2 153 2 231
Mining - 5 000 5 800 6 000 6 000 7 000 7 500
Manufacturing - 3 250 3 500 3 500 3 672 3 900 3 800
Utilities - 6 000 6 000 6 000 8 666 7 000 7 500
Construction - 2 437 2 600 2 600 2 800 2 816 3 000
Trade - 2 505 2 800 3 000 3 000 3 033 3 100
Transport - 3 500 3 600 3 800 3 900 4 000 4 000
Finance - 3 501 4 333 4 000 4 000 4 000 4 000
Services - 6 000 6 000 6 500 6 000 5 000 5 000
Private hholds - 1 000 1 200 1 200 1 300 1 400 1 500
Women - 2 400 2 500 2 600 2 500 2 600 2 700
Agriculture - 1 200 1 250 1 369 1 505 2 000 2 127
Mining - 5 700 5 000 6 000 6 500 7 000 7 000
Manufacturing - 2 500 2 652 2 946 3 000 3 033 3 033
Utilities - 9 000 7 900 7 000 9 650 12 000 10 500
Construction - 1 733 1 841 1 300 1 560 1 900 1 125
Trade - 2 383 2 500 2 600 2 600 3 000 3 000
Transport - 5 000 5 000 5 000 5 500 4 900 5 000
Finance - 4 333 5 000 4 500 4 000 4 000 4 500
Services - 5 500 5 400 6 000 5 500 4 000 4 000
Private hholds - 1 000 1 200 1 200 1 300 1 400 1 500
Men - 3 200 3 466 3 500 3 500 3 500 3 500
Agriculture - 1 300 1 400 1 500 1 800 2 166 2 400
Mining - 5 000 5 800 6 000 6 000 7 000 7 500
Manufacturing - 3 683 3 900 3 900 4 000 4 333 4 100
Utilities - 5 200 5 400 5 200 8 000 7 000 7 000
Construction - 2 500 2 600 2 800 3 000 3 000 3 120
Trade - 2 800 3 000 3 250 3 250 3 466 3 500
Transport - 3 466 3 500 3 500 3 600 3 900 4 000
Finance - 3 466 3 800 3 900 4 000 4 000 4 000
Services - 6 500 6 800 8 000 7 000 6 500 6 200
Private hholds - 1 040 1 100 1 200 1 300 1 300 1 430 Due to rounding, numbers do not necessarily add up to totals

Statistics South Africa P02-11-01 P0120
Labour market dynamics in South Africa, 2015
A2-43
Table 3.22: Unemployment rate by level of education - South Africa
Decent Work Indicator
QLFS 2009
QLFS 2010
QLFS 2011
QLFS 2012
QLFS 2013
QLFS 2014
QLFS 2015
Per cent
Per cent
Per cent
Per cent
Per cent
Per cent
Per cent
Unemployment rate by level of education 23,7 24,9 24,8 24,9 24,7 25,1 25,3
None 16,9 16,6 17,4 16,7 16,8 16,9 17,1
Less than primary completed 22,2 24,3 21,9 22,8 20,9 22,9 22,8
Primary completed 23,2 24,1 25,5 25,0 23,4 26,5 26,1
Secondary not completed 30,2 31,3 31,5 31,7 31,9 32,1 32,1
Secondary completed 25,4 26,7 27,0 26,3 26,3 25,8 26,3
Tertiary 8,3 9,1 8,7 9,4 9,9 10,8 11,7
Other 17,2 16,8 14,3 14,7 15,6 14,4 12,5
Table 3.23: Adequate earnings and productive work - Low pay rate (below 2/3 of median monthly earning)
Decent Work Indicator
QLFS 2009
QLFS 2010
QLFS 2011
QLFS 2012
QLFS 2013
QLFS 2014
QLFS 2015
Percent Percent Percent Percent Percent Percent Percent
Median .. 2 900 3 000 3 115 3 033 3 033 3 100
2/3 .. 1 933 2 000 2 077 2 022 2 022 2 067
Men .. 28,4 28,4 28,7 28,8 27,5 26,6
Women .. 42,6 40,7 42,1 42,1 39,5 38,8
Both sexes .. 34,6 33,9 34,7 34,8 32,9 32,1
Table 3.24: Proportion of employees who are entitled to paid sick leave
Decent Work Indicators
QLFS 2009
QLFS 2010
QLFS 2011
QLFS 2012
QLFS 2013
QLFS 2014
QLFS 2015
Percent Percent Percent Percent Percent Percent Percent
Both sexes .. .. 67,7 68,9 68,3 68,9 68,3
Male .. .. 68,5 70,2 69,7 70,5 69,3
Female .. .. 66,6 67,2 66,7 66,9 67,1
Table 3.25: Proportion of employees who are entitled to maternity/paternity leave
Decent Work Indicators
QLFS 2009
QLFS 2010
QLFS 2011
QLFS 2012
QLFS 2013
QLFS 2014
QLFS 2015
Percent Percent Percent Percent Percent Percent Percent
Both sexes .. .. 54,4 53,8 52,6 53,5 53,4
Male .. .. 53,0 52,3 51,3 52,3 52,0
Female .. .. 56,1 55,7 54,3 54,9 55,1

Statistics South Africa P02-11-01 P0120
Labour market dynamics in South Africa, 2015
A2-44
Table 3.26: Decent hours
Decent hours
QLFS 2009
QLFS 2010
QLFS 2011
QLFS 2012
QLFS 2013
QLFS 2014
QLFS 2015
Per cent
Per cent
Per cent
Per cent
Per cent
Per cent
Per cent
Excessive hours (workers with more than 48 hours per week) 25,2 24,0 23,7 22,9 22,5 21,8 22,2
Men 28,9 27,8 27,7 26,9 26,5 25,9 26,5
Women 20,3 19,0 18,5 17,7 17,4 16,7 16,7
Time-related underemployment rate 4,7 4,2 3,8 4,1 4,1 4,0 4,5
Men 3,1 2,9 2,7 2,9 2,8 2,9 3,2
Women 6,8 5,9 5,3 5,6 5,8 5,4 6,2
Rate of workers with decent hours 70,1 71,9 72,4 73,0 73,4 74,1 73,3
Men 68,0 69,4 69,6 70,2 70,6 71,2 70,4
Women 72,9 75,1 76,2 76,7 76,9 77,9 77,1
Table 3.27: Rights at work and social dialogue
Decent work Indicators
QLFS 2009
QLFS 2010
QLFS 2011
QLFS 2012
QLFS 2013
QLFS 2014
QLFS 2015
Per cent Per cent Per cent Per cent Per cent Per cent Per cent
Trade union members .. .. 3 488 3 640 3 650 3 788 3 697
Men .. .. 2 082 2 172 2 152 2 243 2 172
Women .. .. 1 405 1 468 1 498 1 544 1 526
Trade union density rate .. .. 29,3 29,7 28,7 29,0 27,4
Men .. .. 31,3 32,0 30,8 31,2 29,2
Women .. .. 26,8 26,9 26,2 26,3 25,1
Table 3.28: Proportion of employees whose employer contribute to a pension/retirement fund for them
QLFS 2009 QLFS 2010* QLFS 2011 QLFS 2012 QLFS 2013 QLFS 2014 QLFS 2015
Per cent Per cent Per cent Per cent Per cent Per cent Per cent
Both sexes 46,4 46,0 47,9 49,0 48,0 48,9 46,1
Men 49,1 48,2 50,4 51,9 50,9 51,8 48,2
Women 43,0 43,2 44,7 45,5 44,4 45,3 43,4
Table 3.29: Proportion of employees who are entitled to medical aid benefit from the employer by sex
QLFS 2009 QLFS 2010* QLFS 2011 QLFS 2012 QLFS 2013 QLFS 2014 QLFS 2015
Per cent Per cent Per cent Per cent Per cent Per cent Per cent
Both sexes 30,5 31,9 31,9 32,8 31,6 31,4 29,5
Men 31,1 32,4 32,4 33,6 32,8 32,5 30,2
Women 29,7 31,2 31,3 31,7 30,1 30,1 28,6

Statistics South Africa P02-11-01 P0120
Labour market dynamics in South Africa, 2015
A2-45
Table 3.30: Proportions of employees by how annual salary increment is negotiated
QLFS 2009
QLFS 2010*
QLFS 2011
QLFS 2012
QLFS 2013
QLFS 2014
QLFS 2015
Per cent
Per cent
Per cent
Per cent
Per cent
Per cent
Per cent
Individual and employer .. .. 14,1 11,9 10,0 9,5 9,7
Collective bargaining .. .. 31,8 32,7 30,7 30,8 29,1
Employer only .. .. 48,0 49,9 53,5 53,7 55,4
No regular increment .. .. 5,5 5,0 5,3 5,6 5,4
Other .. .. 0,6 0,5 0,5 0,4 0,4
Table 4.1: Characteristics of the unemployed - South Africa
QLFS 2009
QLFS 2010
QLFS 2011
QLFS 2012
QLFS 2013
QLFS 2014
QLFS 2015
Thousand Thousand Thousand Thousand Thousand Thousand Thousand
Unemployed 4 403 4 564 4 636 4 775 4 886 5 070 5 344
Job losers 1 506 1 474 1 406 1 498 1 532 1 641 1 785
Job leavers 359 285 275 285 309 319 361
New entrants 1 751 1 905 2 006 2 035 2 017 1 952 2 074
Re-entrants 192 199 215 182 215 256 245
Other 595 702 735 776 813 903 878
Unemployed 4 403 4 564 4 636 4 775 4 886 5 070 5 344
Long-term unemployment (1 year and more) 2 653 2 998 3 180 3 242 3 226 3 341 3 481
Short-term unemployment (less than 1 year) 1 750 1 566 1 456 1 533 1 660 1 729 1 863
Long-term unemployment (%)
Proportion of the labour force 14,3 16,3 17,0 16,9 16,3 16,5 16,5
Proportion of the unemployed 60,3 65,7 68,6 67,9 66,0 65,9 65,1
Those who have worked in the past 5 years
Previous occupation 2 057 1 958 1 896 1 964 2 057 2 216 2 391
Manager 37 44 46 45 54 51 50
Professional 28 29 41 43 40 47 49
Technician 89 104 97 102 122 147 127
Clerk 202 237 227 249 268 252 271
Sales and services 293 287 286 298 307 346 372
Skilled agriculture 8 9 9 6 5 16 15
Craft and related trade 402 369 321 336 315 356 396
Plant and machine operator 182 164 152 158 172 181 187
Elementary 642 553 557 569 612 652 738
Domestic worker 175 160 160 157 160 167 187
Other 0 0 0 1 1 0 .
Previous industry 2 057 1 958 1 896 1 964 2 057 2 216 2 391
Agriculture 115 103 93 87 94 120 135
Mining 34 34 31 32 37 35 46
Manufacturing 321 289 263 264 256 274 287
Utilities 11 9 10 8 16 17 17
Construction 374 322 293 313 312 326 380
Trade 473 487 448 460 497 517 540
Transport 100 88 96 96 109 128 107
Finance 231 237 239 258 282 299 323
Community and social services 165 185 211 234 245 271 316
Private households 231 203 211 209 208 228 240
Other 1 1 1 1 1 0 .
For all values of 10 000 or lower the sample size is too small for reliable estimates Due to rounding, numbers do not necessarily add up to totals

Statistics South Africa P02-11-01 P0120
Labour market dynamics in South Africa, 2015
A2-46
Table 4.2: Characteristics of the unemployed by province
QLFS 2009
QLFS 2010
QLFS 2011
QLFS 2012
QLFS 2013
QLFS 2014
QLFS 2015
Thousand Thousand Thousand Thousand Thousand Thousand Thousand
Long-term unemployment 2 653 2 998 3 180 3 242 3 226 3 341 3 481
Western cape 262 297 347 384 382 405 336
Eastern Cape 287 285 293 330 358 346 351
Northern Cape 56 58 65 70 65 69 77
Free State 151 173 180 240 246 268 237
KwaZulu-Natal 325 368 368 406 420 458 430
North West 194 196 198 181 183 216 209
Gauteng 996 1 199 1 279 1 151 1 131 1 115 1 381
Mpumalanga 195 261 297 318 299 326 292
Limpopo 187 161 152 163 143 139 168
Long-term unemployment (%) 60,3 65,7 68,6 67,9 66,0 65,9 65,1
Western cape 50,0 54,0 60,4 60,1 60,8 62,6 56,0
Eastern Cape 59,2 60,9 61,5 65,4 65,9 60,9 62,9
Northern Cape 53,9 57,7 58,1 59,6 53,8 52,5 53,6
Free State 55,1 58,5 61,4 69,2 67,7 69,0 66,2
KwaZulu-Natal 54,8 64,2 63,7 65,3 64,2 64,0 62,5
North West 61,1 67,4 70,9 66,0 59,2 66,4 64,7
Gauteng 70,0 73,7 76,6 73,9 71,3 69,7 71,6
Mpumalanga 56,3 68,4 72,6 73,1 68,6 70,7 67,4
Limpopo 55,5 58,1 62,5 58,2 57,9 58,6 54,0
Short-term unemployment 1 750 1 566 1 456 1 533 1 660 1 729 1 863
Western cape 262 253 228 255 246 242 264
Eastern Cape 198 183 184 175 185 222 207
Northern Cape 48 43 47 47 55 62 66
Free State 123 123 113 107 117 120 121
KwaZulu-Natal 268 205 210 216 234 257 258
North West 123 95 81 93 126 109 114
Gauteng 426 429 390 406 456 484 547
Mpumalanga 151 121 112 117 137 135 141
Limpopo 150 116 92 117 104 98 143
Short-term unemployment (%) 39,7 34,3 31,4 32,1 34,0 34,1 34,9
Western cape 50,0 46,0 39,6 39,9 39,2 37,4 44,0
Eastern Cape 40,8 39,1 38,5 34,6 34,1 39,1 37,1
Northern Cape 46,1 42,3 41,9 40,4 46,2 47,5 46,4
Free State 44,9 41,5 38,6 30,8 32,3 31,0 33,8
KwaZulu-Natal 45,2 35,8 36,3 34,7 35,8 36,0 37,5
North West 38,9 32,6 29,1 34,0 40,8 33,6 35,3
Gauteng 30,0 26,3 23,4 26,1 28,7 30,3 28,4
Mpumalanga 43,7 31,6 27,4 26,9 31,4 29,3 32,6
Limpopo 44,5 41,9 37,5 41,8 42,1 41,4 46,0 Due to rounding, numbers do not necessarily add up to totals

Statistics South Africa P02-11-01 P0120
Labour market dynamics in South Africa, 2015
A2-47
Table 4.3: The duration of unemployment
QLFS 2009
QLFS 2010
QLFS 2011
QLFS 2012
QLFS 2013
QLFS 2014
QLFS 2015
Thousand Thousand Thousand Thousand Thousand Thousand Thousand
Both Sexes 4 403 4 564 4 636 4 775 4 886 5 070 5 344
Less than 3 moths 619 511 474 565 634 668 751
3 months less than 6 months 432 378 352 349 369 390 424
6 months less than 1 year 698 677 630 619 657 672 688
1 year less than 3 years 1 023 1 141 1 122 1 096 1 173 1 173 1 205
3 years and over 1 630 1 858 2 058 2 147 2 053 2 167 2 276
Women 2 139 2 221 2 298 2 337 2 381 2 482 2 640
Less than 3 moths 241 206 192 219 259 270 306
3 months less than 6 months 182 163 151 159 162 167 183
6 months less than 1 year 310 303 300 291 300 319 328
1 year less than 3 years 518 575 572 532 586 592 601
3 years and over 889 974 1 083 1 136 1 074 1 133 1 223
Men 2 264 2 343 2 338 2 438 2 505 2 589 2 704
Less than 3 moths 378 305 283 346 375 398 445
3 months less than 6 months 250 215 201 190 207 222 241
6 months less than 1 year 389 374 330 328 357 353 361
1 year less than 3 years 505 566 550 563 587 581 605
3 years and over 742 884 975 1 010 979 1 034 1 053 Due to rounding, numbers do not necessarily add up to totals

Statistics South Africa P02-11-01 P0120
Labour market dynamics in South Africa, 2015
A2-48
Table 5: Characteristics of the not economically active - South Africa
QLFS 2009
QLFS 2010
QLFS 2011
QLFS 2012
QLFS 2013
QLFS 2014
QLFS 2015
Thousand Thousand Thousand Thousand Thousand Thousand Thousand
Not economically active 13 763 14 606 14 857 14 975 15 038 15 194 14 950
Student 5 706 5 906 6 041 6 137 6 111 6 239 6 214
Home-maker 2 747 2 909 2 892 2 821 2 852 2 849 2 618
Illness/disability 1 853 1 878 1 731 1 740 1 717 1 637 1 674
Too old/young to work 1 061 1 134 1 210 1 220 1 218 1 234 1 302
Discouraged work seekers 1 535 2 026 2 252 2 314 2 331 2 422 2 334
Other 861 753 730 743 809 812 809
Inactivity rate by age (Both sexes) 42,5 44,3 44,3 43,8 43,2 42,9 41,5
15-24 yrs 71,9 73,9 74,5 74,6 74,2 74,7 73,4
25-54 yrs 25,7 27,5 27,3 26,7 26,2 25,9 24,4
55-64 yrs 57,2 58,9 58,7 58,5 57,5 56,0 56,2
Inactivity rate by age (Women) 49,8 51,6 51,0 50,6 49,6 49,3 47,9
15-24 yrs 74,7 76,5 76,5 77,1 76,4 77,2 76,2
25-54 yrs 34,9 37,0 36,1 35,5 34,3 33,9 32,2
55-64 yrs 68,3 68,4 67,9 67,1 66,3 64,6 64,2
Inactivity rate by age (Men) 34,8 36,7 37,2 36,7 36,6 36,3 34,9
15-24 yrs 69,2 71,3 72,5 72,2 72,1 72,3 70,5
25-54 yrs 15,9 17,5 18,0 17,5 17,8 17,7 16,5
55-64 yrs 43,6 47,4 47,6 48,0 47,0 45,7 46,4 Due to rounding, numbers do not necessarily add up to totals

Statistics South Africa P02-11-01 P0120
Labour market dynamics in South Africa, 2015
A2-49
Table 6.1a: Socio-demographic characteristics - South Africa
QLFS 2009
QLFS 2010
QLFS 2011
QLFS 2012
QLFS 2013
QLFS 2014
QLFS 2015
Thousand Thousand Thousand Thousand Thousand Thousand Thousand
Age group of the employed 14 194 13 788 14 070 14 425 14 866 15 146 15 741
15-24 yrs 1 427 1 267 1 272 1 242 1 277 1 263 1 367
25-34 yrs 4 625 4 472 4 500 4 626 4 731 4 758 4 945
35-44 yrs 4 167 4 144 4 261 4 428 4 577 4 685 4 862
45-54 yrs 2 824 2 783 2 856 2 911 3 003 3 071 3 171
55-64 yrs 1 151 1 122 1 182 1 218 1 278 1 369 1 395
Age group of the unemployed 4 403 4 564 4 636 4 775 4 886 5 070 5 344
15-24 yrs 1 335 1 330 1 286 1 329 1 352 1 330 1 374
25-34 yrs 1 806 1 850 1 919 1 942 1 943 2 047 2 138
35-44 yrs 828 891 941 984 1 045 1 106 1 179
45-54 yrs 357 401 412 428 440 474 520
55-64 yrs 77 92 78 92 107 113 133
Age group of the not economically active 13 763 14 606 14 857 14 975 15 038 15 194 14 950
15-24 yrs 7 076 7 341 7 480 7 557 7 572 7 664 7 550
25-34 yrs 2 211 2 427 2 452 2 444 2 492 2 521 2 402
35-44 yrs 1 450 1 610 1 641 1 628 1 614 1 639 1 577
45-54 yrs 1 387 1 486 1 492 1 502 1 482 1 480 1 461
55-64 yrs 1 639 1 743 1 792 1 844 1 877 1 890 1 959
Highest level of education of the employed 14 194 13 788 14 070 14 425 14 866 15 146 15 741
No schooling 506 418 369 374 375 373 388
Less than primary completed 1 348 1 164 1 160 1 129 1 143 1 078 1 180
Primary completed 741 674 634 641 640 614 664
Secondary not completed 4 643 4 556 4 696 4 865 4 965 5 043 5 239
Secondary completed 4 143 4 163 4 197 4 416 4 555 4 796 4 934
Tertiary 2 654 2 617 2 835 2 842 3 041 3 072 3 146
Other 158 196 179 157 148 171 190
Highest level of education of the unemployed 4 403 4 564 4 636 4 775 4 886 5 070 5 344
No schooling 103 83 78 75 76 76 80
Less than primary completed 385 374 325 334 301 321 349
Primary completed 223 214 216 214 195 221 234
Secondary not completed 2 011 2 077 2 161 2 258 2 329 2 382 2 473
Secondary completed 1 408 1 513 1 555 1 572 1 625 1 668 1 762
Tertiary 239 264 272 295 333 373 418
Other 33 39 30 27 27 29 27
Highest level of education of the not economically active 13 763 14 606 14 857 14 975 15 038 15 194 14 950
No schooling 875 840 825 792 763 741 703
Less than primary completed 1 940 2 008 1 896 1 817 1 723 1 661 1 695
Primary completed 1 070 1 139 1 122 1 069 1 008 951 953
Secondary not completed 7 190 7 570 7 852 7 993 8 171 8 183 8 017
Secondary completed 2 224 2 509 2 595 2 739 2 779 3 028 2 905
Tertiary 361 412 441 449 485 507 548
Other 104 128 127 115 110 122 131
For all values of 10 000 or lower the sample size is too small for reliable estimates
Due to rounding, numbers do not necessarily add up to totals.

Statistics South Africa P02-11-01 P0120
Labour market dynamics in South Africa, 2015
A2-50
Table 6.1b: Socio-demographic characteristics - South Africa
QLFS 2009
QLFS 2010
QLFS 2011
QLFS 2012
QLFS 2013
QLFS 2014
QLFS 2015
Thousand Thousand Thousand Thousand Thousand Thousand Thousand
Employed - - - 7 271 14 866 15 146 15 741
Attending educational institution - - - 174 350 384 421
Not attending educational institution - - - 7 097 14 515 14 762 15 319
Unemployed - - - 2 403 4 886 5 070 5 344
Attending educational institution - - - 49 102 95 131
Not attending educational institution - - - 2 353 4 784 4 975 5 213
Not economically active - - - 7 490 15 038 15 194 14 950
Attending educational institution - - - 2 969 5 930 6 083 6 061
Not attending educational institution - - - 4 521 9 108 9 111 8 889
Employed and attending by type of educational institution - - - 174 350 384 421
Odinary school - - - 14 30 28 38
Special school - - - 0 3 1 1
Further education and training college (FET) - - - 19 31 38 34
Other college - - - 15 33 49 59
Higher education institution - - - 120 242 254 273
Adult basic education and training centre(ABET CENTRE) - - - 5 9 12 12
Literacy classes (e.g KHA RI GUDE, SANLI) - - - 1 0 0 0
Home based education or home schooling - - - 0 0 0 1
Unemployed and attending by type of educational institution - - - 49 102 95 131
Odinary school - - - 19 37 38 39
Special school - - - 1 0 1 1
Further education and training college (FET) - - - 9 21 13 27
Other college - - - 5 12 15 17
Higher education institution - - - 12 26 24 38
Adult basic education and training centre(ABET CENTRE) - - - 4 5 4 7
Literacy classes (e.g KHA RI GUDE, SANLI) - - - - - - -
Home based education or home schooling - - - - - 0 0
For all values of 10 000 or lower the sample size is too small for reliable estimates
Due to rounding, numbers do not necessarily add up to totals.

Statistics South Africa P02-11-01 P0120
Labour market dynamics in South Africa, 2015
A2-51
Table 6.1c: Socio-demographic characteristics - South Africa
QLFS 2009
QLFS 2010
QLFS 2011
QLFS 2012
QLFS 2013
QLFS 2014
QLFS 2015
Thousand Thousand Thousand Thousand Thousand Thousand Thousand
Not economically active and attending by type of educational institution - - - 2 969 5 930 6 083 6 061
Odinary school - - - 2 440 4 744 4 781 4 765
Special school - - - 21 44 34 41
Further education and training college (FET) - - - 139 372 422 435
Other college - - - 58 157 186 184
Higher education institution - - - 273 553 595 569
Adult basic education and training centre(ABET CENTRE) - - - 17 33 36 31
Literacy classes (e.g KHA RI GUDE, SANLI) - - - 2 1 1 2
Home based education or home schooling - - - 1 2 3 4
Current marital status of the employed 14 194 13 788 14 070 14 425 14 866 15 146 15 741
Married 5 930 5 841 5 923 6 116 6 086 6 064 6 258
Living together like husband and wife 1 709 1 632 1 617 1 647 1 712 1 766 1 897
Widow/widower 454 468 449 436 459 501 458
Divorced or separated 512 487 488 520 536 473 505
Never married 5 589 5 360 5 594 5 706 6 072 6 341 6 623
Current marital status of the unemployed 4 403 4 564 4 636 4 775 4 886 5 070 5 344
Married 728 767 784 799 824 840 936
Living together like husband and wife 514 496 471 515 532 519 617
Widow/widower 59 54 59 63 75 75 63
Divorced or separated 71 81 83 86 84 91 97
Never married 3 030 3 166 3 239 3 313 3 371 3 546 3 632
Current marital status of the not economically active 13 763 14 606 14 857 14 975 15 038 15 194 14 950
Married 2 865 2 965 3 009 3 020 2 940 2 930 2 819
Living together like husband and wife 756 807 738 748 750 777 806
Widow/widower 637 648 678 663 642 610 614
Divorced or separated 242 243 250 253 243 254 244
Never married 9 263 9 943 10 181 10 292 10 464 10 622 10 468
For all values of 10 000 or lower the sample size is too small for reliable estimates
Due to rounding, numbers do not necessarily add up to totals.

Statistics South Africa P02-11-01 P0120
Labour market dynamics in South Africa, 2015
A2-52
Table 7: Profile of those not in education and not in employment - South Africa
QLFS 2009 QLFS 2010 QLFS 2011 QLFS 2012 QLFS 2013 QLFS 2014 QLFS 2015
Thousand Thousand Thousand Thousand Thousand Thousand Thousand
Both sexes 13 892 14 086 14 102
Women 8 166 8 258 8 265
Men 5 726 5 827 5 837
Age group 13 892 14 086 14 102
15-24 yrs 3 261 3 212 3 139
25-34 yrs 4 133 4 235 4 203
35-44 yrs 2 608 2 697 2 705
45-54 yrs 1 910 1 945 1 969
55-64 yrs 1 981 1 998 2 086
Population groups 13 892 14 086 14 102
Black/African 11 557 11 707 11 754
Coloured 1 267 1 265 1 273
Indian/Asian 313 342 353
White 755 772 723
South Africa 13 892 14 086 14 102
Western Cape 1 433 1 462 1 423
Eastern Cape 1 893 1 884 1 854
Northern Cape 323 340 353
Free State 775 778 762
KwaZulu Natal 2 738 2 820 2 811
North West 1 102 1 072 1 092
Gauteng 3 109 3 173 3 312
Mpumalanga 1 058 1 107 1 081
Limpopo 1 461 1 450 1 415
For all values of 10 000 or lower the sample size is too small for reliable estimates
Due to rounding, numbers do not necessarily add up to totals.

Statistics South Africa A3-1 02-11-02
Labour market dynamics in South Africa, 2015
Appendix 3: Panel data results
Table of Contents
Table A.1: Quarterly transition rates between different labour market states ............................................. 2
Table A.1: Quarterly transition rates between different labour market states (concluded) ......................... 3
Table A2: Quarterly transition rates between different sectors ................................................................... 4
Table A2: Quarterly transition rates between different sectors (concluded)................................................ 5
Table A3: Quarterly transition rates between different labour market states, by education ........................ 6
Table A3: Quarterly transition rates between different labour market states, by education (Continued) .................................................................................................................................................. 7
Table A3: Quarterly transition rates between different labour market states, by education (Continued) .................................................................................................................................................. 8
Table A3: Quarterly transition rates between different labour market states, by education (Continued) .................................................................................................................................................. 9
Table A3: Quarterly transition rates between different labour market states, by education (Continued) ................................................................................................................................................ 10
Table A3: Quarterly transition rates between different labour market states, by education (Continued) ................................................................................................................................................ 11
Table A3: Quarterly transition rates between different labour market states, by education (Continued) ................................................................................................................................................ 12
Table A3: Quarterly transition rates between different labour market states, by education (Continued) ................................................................................................................................................ 13
Table A4: Quarterly transition rates between different labour market states and sectors ......................... 14
Table A4: Quarterly transition rates between different labour market states and sectors ......................... 15
Table A5: Quarterly transition rates between different labour market states, for youths (15-34 yrs) and adults (35-64 yrs) ................................................................................................................................ 16
Table A5: Quarterly transition rates between different labour market states, for youths (15-34 yrs) and adults (35-64 yrs) ................................................................................................................................ 17
Table A5: Quarterly transition rates between different labour market states, for youths (15-34 yrs) and adults (35-64 yrs) ................................................................................................................................ 18
Table A5: Quarterly transition rates between different labour market states, for youths (15-34 yrs) and adults (35-64 yrs) ................................................................................................................................ 19
Table A6: Quarterly transition rates between different labour market states, by experience .................... 20
Table A7: Quarterly transition rates between different labour market states, by length of unemployment ........................................................................................................................................... 21
Table A8: Quarterly distribution of those who found employment by sector ............................................. 22
Table A9: Quarterly distribution of those who found employment by sector and level of education ......... 23
Table A9: Quarterly distribution of those who found employment by sector and level of education ......... 24
Table A10: Quarterly distribution of those who found employment by sector and age ............................. 25
Table A11: Quarterly distribution of those who found employment by size of firm ................................... 26
Page

Statistics South Africa A3-2 02-11-02
Labour market dynamics in South Africa, 2015
Table A.1: Quarterly transition rates between different labour market states
t+1 status
t status: Employed
Employed Unemployed Discouraged Other NEA Total
Per cent
t quarter t+1 quarter
Q1 2010 Q2 2010 92,7 3,4 1,3 2,6 100,0
Q2 2010 Q3 2010 93,4 3,2 1,1 2,4 100,0
Q3 2010 Q4 2010 93,9 2,6 1,0 2,5 100,0
Q4 2010 Q1 2011 93,5 2,8 1,2 2,5 100,0
Q1 2011 Q2 2011 93,2 3,2 1,1 2,5 100,0
Q2 2011 Q3 2011 93,6 3,1 1,2 2,2 100,0
Q3 2011 Q4 2011 93,7 2,9 1,1 2,3 100,0
Q4 2011 Q1 2012 93,0 3,4 1,1 2,5 100,0
Q1 2012 Q2 2012 93,4 2,9 1,3 2,4 100,0
Q2 2012 Q3 2012 93,8 3,1 0,9 2,1 100,0
Q3 2012 Q4 2012 93,3 3,1 1,0 2,5 100,0
Q4 2012 Q1 2013 93,2 3,3 1,1 2,3 100,0
Q1 2013 Q2 2013 93,1 3,4 1,6 2,0 100,0
Q2 2013 Q3 2013 92,4 3,5 1,4 2,7 100,0
Q3 2013 Q4 2013 92,9 3,2 1,3 2,6 100,0
Q4 2013 Q1 2014 91,7 4,0 1,6 2,7 100,0
Q1 2014 Q2 2014 92,3 3,6 1,4 2,8 100,0
Q2 2014 Q3 2014 92,1 3,9 1,6 2,4 100,0
Q3 2014 Q4 2014 93,0 3,1 1,5 2,5 100,0
Q1 2015 Q2 2015 91,4 4,3 1,5 2,8 100,0
Q2 2015 Q3 2015 91,2 4,6 1,5 2,7 100,0
Q3 2015 Q4 2015 93,3 3,2 1,2 2,3 100,0
t+1 status
t status: Unemployed
Employed Unemployed Discouraged Other NEA Total
Per cent
t quarter t+1 quarter
Q1 2010 Q2 2010 11,9 66,8 7,0 14,4 100,0
Q2 2010 Q3 2010 10,7 65,7 7,9 15,7 100,0
Q3 2010 Q4 2010 10,3 66,9 8,3 14,5 100,0
Q4 2010 Q1 2011 11,1 68,9 6,6 13,3 100,0
Q1 2011 Q2 2011 10,0 70,0 6,6 13,4 100,0
Q2 2011 Q3 2011 10,3 67,4 7,5 14,9 100,0
Q3 2011 Q4 2011 10,8 67,5 7,5 14,2 100,0
Q4 2011 Q1 2012 10,5 67,5 8,1 13,9 100,0
Q1 2012 Q2 2012 10,3 68,9 7,2 13,6 100,0
Q2 2012 Q3 2012 12,7 68,9 7,0 11,5 100,0
Q3 2012 Q4 2012 10,8 66,8 7,0 15,3 100,0
Q4 2012 Q1 2013 11,4 65,7 8,2 14,6 100,0
Q1 2013 Q2 2013 11,0 68,9 7,5 12,6 100,0
Q2 2013 Q3 2013 13,3 66,5 7,6 12,6 100,0
Q3 2013 Q4 2013 13,1 68,1 5,9 13,0 100,0
Q4 2013 Q1 2014 12,0 67,9 7,0 13,1 100,0
Q1 2014 Q2 2014 12,9 65,3 7,3 14,5 100,0
Q2 2014 Q3 2014 12,9 66,0 7,7 13,5 100,0
Q3 2014 Q4 2014 13,0 65,5 7,2 14,3 100,0
Q1 2015 Q2 2015 14,9 61,9 8,3 14,9 100,0
Q2 2015 Q3 2015 14,1 65,7 8,2 12.0 100,0
Q3 2015 Q4 2015 12,7 67,5 7,0 12,8 100,0

Statistics South Africa A3-3 02-11-02
Labour market dynamics in South Africa, 2015
Table A.1: Quarterly transition rates between different labour market states (concluded)
t+1 status
t status: Discouragement
Employed Unemployed Discouraged Other NEA Total
Per cent
t quarter t+1 quarter
Q1 2010 Q2 2010 9,2 16,5 50,4 23,8 100,0
Q2 2010 Q3 2010 7,9 16,2 54,1 21,8 100,0
Q3 2010 Q4 2010 7,6 13,3 57,7 21,3 100,0
Q4 2010 Q1 2011 8,3 13,1 58,4 20,2 100,0
Q1 2011 Q2 2011 8,7 16,6 51,8 22,8 100,0
Q2 2011 Q3 2011 7,5 13,4 56,7 22,4 100,0
Q3 2011 Q4 2011 7,2 15,6 59,0 18,2 100,0
Q4 2011 Q1 2012 7,1 14,7 57,3 20,9 100,0
Q1 2012 Q2 2012 8,2 14,5 58,2 19,1 100,0
Q2 2012 Q3 2012 8,3 15,5 56,1 20,0 100,0
Q3 2012 Q4 2012 6,8 15,2 55,7 22,2 100,0
Q4 2012 Q1 2013 7,3 14,6 58,1 20,0 100,0
Q1 2013 Q2 2013 7,3 14,6 58,4 19,6 100,0
Q2 2013 Q3 2013 10,7 15,2 54,3 19,7 100,0
Q3 2013 Q4 2013 10,9 15,1 52,3 21,8 100,0
Q4 2013 Q1 2014 9,9 15,3 56,4 18,5 100,0
Q1 2014 Q2 2014 8,8 13,4 57,2 20,5 100,0
Q2 2014 Q3 2014 9,8 12,3 58,7 19,2 100,0
Q3 2014 Q4 2014 9,6 13,0 57,1 20,3 100,0
Q1 2015 Q2 2015 11,7 15,7 50,9 21,6 100,0
Q2 2015 Q3 2015 9,2 18,3 51,9 20,5 100,0
Q3 2015 Q4 2015 10,6 14,3 58,4 16,7 100,0
t+1 status
t status: Other NEA
Employed Unemployed Discouraged Other NEA Total
Per cent
Q1 2010 Q2 2010 2,7 5,6 3,6 88,1 100,0
Q2 2010 Q3 2010 2,6 5,0 3,7 88,7 100,0
Q3 2010 Q4 2010 2,4 4,5 3,7 89,4 100,0
Q4 2010 Q1 2011 2,5 5,3 4,3 87,9 100,0
Q1 2011 Q2 2011 2,5 5,2 3,9 88,4 100,0
Q2 2011 Q3 2011 2,3 5,0 3,5 89,1 100,0
Q3 2011 Q4 2011 2,2 4,7 3,9 89,2 100,0
Q4 2011 Q1 2012 2,5 5,8 4,3 87,4 100,0
Q1 2012 Q2 2012 2,3 5,1 4,0 88,7 100,0
Q2 2012 Q3 2012 2,6 5,3 3,4 88,7 100,0
Q3 2012 Q4 2012 2,0 4,4 3,4 90,2 100,0
Q4 2012 Q1 2013 2,6 5,7 4,0 87,7 100,0
Q1 2013 Q2 2013 2,4 5,5 3,8 88,2 100,0
Q2 2013 Q3 2013 3,0 4,7 3,6 88,7 100,0
Q3 2013 Q4 2013 3,0 4,5 3,6 89,0 100,0
Q4 2013 Q1 2014 2,9 5,4 4,1 87,5 100,0
Q1 2014 Q2 2014 3,1 5,8 3,5 87,6 100,0
Q2 2014 Q3 2014 2,8 4,9 3,5 88,8 100,0
Q3 2014 Q4 2014 2,9 5,4 4,1 87,5 100,0
Q1 2015 Q2 2015 3,1 5,8 4,2 86.9 100,0
Q2 2015 Q3 2015 3,2 5,7 3,5 87,6 100,0
Q3 2015 Q4 2015 2,5 4,5 2,9 90,1 100,0

Statistics South Africa A3-4 02-11-02
Labour market dynamics in South Africa, 2015
Table A2: Quarterly transition rates between different sectors
t+1 status
t status: Formal
Formal Informal Agriculture Private hh Total
Per cent
t quarter t+1 quarter
Q1 2010 Q2 2010 95,8 3,5 0,5 0,2 100,0
Q2 2010 Q3 2010 96,3 2,9 0,5 0,3 100,0
Q3 2010 Q4 2010 96,5 2,9 0,3 0,3 100,0
Q4 2010 Q1 2011 96,7 2,7 0,3 0,3 100,0
Q1 2011 Q2 2011 96,2 3,4 0,3 0,2 100,0
Q2 2011 Q3 2011 96,7 2,7 0,3 0,3 100,0
Q3 2011 Q4 2011 96,4 2,8 0,5 0,2 100,0
Q4 2011 Q1 2012 96,3 3,0 0,3 0,3 100,0
Q1 2012 Q2 2012 96,4 2,9 0,4 0,3 100,0
Q2 2012 Q3 2012 96,7 2,7 0,4 0,2 100,0
Q3 2012 Q4 2012 96,4 3,1 0,3 0,2 100,0
Q4 2012 Q1 2013 96,5 2,8 0,3 0,4 100,0
Q1 2013 Q2 2013 96,6 2,9 0,3 0,2 100,0
Q2 2013 Q3 2013 96,1 3,2 0,5 0,3 100,0
Q3 2013 Q4 2013 96,3 2,9 0,5 0,3 100,0
Q4 2013 Q1 2014 96,0 3,4 0,4 0,3 100,0
Q1 2014 Q2 2014 96,2 3,1 0,3 0,3 100,0
Q2 2014 Q3 2014 96,2 3,3 0,3 0,2 100,0
Q3 2014 Q4 2014 96,0 3,4 0,3 0,3 100,0
Q1 2015 Q2 2015 94,4 4,8 0,5 0,3 100,0
Q2 2015 Q3 2015 94,9 4,3 0,5 0,4 100,0
Q3 2015 Q4 2015 95,5 3,8 0,5 0,2 100,0
t status: Informal
Formal Informal Agriculture Private hh Total
Per cent
t quarter t+1 quarter
Q1 2010 Q2 2010 15,7 82,3 0,9 1,2 100,0
Q2 2010 Q3 2010 16,2 81,3 0,5 1,9 100,0
Q3 2010 Q4 2010 15,2 83,0 0,6 1,2 100,0
Q4 2010 Q1 2011 14,8 83,6 0,4 1,2 100,0
Q1 2011 Q2 2011 13,1 86,0 0,3 0,6 100,0
Q2 2011 Q3 2011 13,6 84,8 0,3 1,3 100,0
Q3 2011 Q4 2011 16,6 81,6 0,5 1,3 100,0
Q4 2011 Q1 2012 15,7 83,3 0,1 0,9 100,0
Q1 2012 Q2 2012 14,8 84,1 0,4 0,7 100,0
Q2 2012 Q3 2012 14,4 83,9 0,4 1,3 100,0
Q3 2012 Q4 2012 15,7 83,3 0,4 0,6 100,0
Q4 2012 Q1 2013 15,9 82,5 0,4 1,1 100,0
Q1 2013 Q2 2013 14,5 84,0 0,5 1,0 100,0
Q2 2013 Q3 2013 17,8 80,4 0,4 1,4 100,0
Q3 2013 Q4 2013 16,7 81,1 1,1 1,1 100,0
Q4 2013 Q1 2014 17,5 80,6 0,6 1,2 100,0
Q1 2014 Q2 2014 17,7 80,7 0,4 1,2 100,0
Q2 2014 Q3 2014 18,5 79,8 0,7 1,0 100,0
Q3 2014 Q4 2014 16,9 81,4 0,6 1,1 100,0
Q1 2015 Q2 2015 20,2 77,2 0,3 2,2 100,0
Q2 2015 Q3 2015 19,5 79,1 0,5 0,9 100,0
Q3 2015 Q4 2015 19,7 78,7 0,5 1,2 100,0

Statistics South Africa A3-5 02-11-02
Labour market dynamics in South Africa, 2015
Table A2: Quarterly transition rates between different sectors (concluded)
t status: Agriculture
Formal Informal Agriculture Private hh Total
Per cent
t quarter t+1 quarter
Q1 2010 Q2 2010 5,8 1,0 90,3 2,9 100,0
Q2 2010 Q3 2010 7,9 3,1 86,6 2,4 100,0
Q3 2010 Q4 2010 5,7 0,6 90,5 3,1 100,0
Q4 2010 Q1 2011 5,5 1,5 91,7 1,3 100,0
Q1 2011 Q2 2011 3,4 1,5 94,2 0,9 100,0
Q2 2011 Q3 2011 3,2 1,5 94,0 1,2 100,0
Q3 2011 Q4 2011 6,1 0,9 91,7 1,3 100,0
Q4 2011 Q1 2012 7,4 1,3 90,3 1,0 100,0
Q1 2012 Q2 2012 4,0 1,7 92,4 1,9 100,0
Q2 2012 Q3 2012 6,4 0,9 92,0 0,7 100,0
Q3 2012 Q4 2012 6,4 1,6 90,9 1,2 100,0
Q4 2012 Q1 2013 4,9 0,7 93,5 1,0 100,0
Q1 2013 Q2 2013 7,4 1,2 90,5 1,0 100,0
Q2 2013 Q3 2013 6,1 1,4 91,4 1,0 100,0
Q3 2013 Q4 2013 5,8 2,1 90,1 2,0 100,0
Q4 2013 Q1 2014 5,9 0,1 92,5 1,5 100,0
Q1 2014 Q2 2014 4,2 1,9 92,2 1,7 100,0
Q2 2014 Q3 2014 5,0 2,1 92,0 0,9 100,0
Q3 2014 Q4 2014 6,0 1,8 90,3 1,8 100,0
Q1 2011 Q2 2015 5,8 0,9 91,0 2,3 100,0
Q2 2015 Q3 2015 6,9 1,0 90,8 1,3 100,0
Q3 2015 Q4 2015 5,5 1,0 91,9 1,6 100,0
t status: Private hh
Formal Informal Agriculture Private hh Total
Per cent
t quarter t+1 quarter
Q1 2010 Q2 2010 2,5 2,5 0,9 94,1 100,0
Q2 2010 Q3 2010 2,1 2,9 2,0 93,0 100,0
Q3 2010 Q4 2010 1,9 1,8 0,7 95,6 100,0
Q4 2010 Q1 2011 2,7 1,7 0,9 94,6 100,0
Q1 2011 Q2 2011 2,8 3,1 1,0 93,1 100,0
Q2 2011 Q3 2011 2,5 2,5 1,2 93,8 100,0
Q3 2011 Q4 2011 1,8 1,0 0,8 96,4 100,0
Q4 2011 Q1 2012 2,2 1,8 0,5 95,5 100,0
Q1 2012 Q2 2012 2,3 1,9 0,7 95,1 100,0
Q2 2012 Q3 2012 1,4 2,1 1,0 95,5 100,0
Q3 2012 Q4 2012 2,4 2,6 1,0 94,1 100,0
Q4 2012 Q1 2013 2,6 1,8 0,3 95,3 100,0
Q1 2013 Q2 2013 2,5 2,5 0,8 94,3 100,0
Q2 2013 Q3 2013 3,4 2,1 0,9 93,7 100,0
Q3 2013 Q4 2013 2,9 3,1 1,0 93,0 100,0
Q4 2013 Q1 2014 2,3 2,3 1,3 94,1 100,0
Q1 2014 Q2 2014 2,6 1,7 0,5 95,2 100,0
Q2 2014 Q3 2014 2,8 2,4 1,1 93,7 100,0
Q3 2014 Q4 2014 1,8 2,6 0,9 94,7 100,0
Q1 2015 Q2 2015 3,1 2,4 1,3 93,0 100,0
Q2 2015 Q3 2015 2,5 2,7 1,4 93,4 100,0
Q3 2015 Q4 2015 2,1 1,7 0,7 95,5 100,0

Statistics South Africa A3-6 02-11-02
Labour market dynamics in South Africa, 2015
Table A3: Quarterly transition rates between different labour market states, by education
t+1 status
t status: Employed: Primary and less
Employed Unemployed Discouraged Other NEA Total
Per cent
t quarter t+1 quarter
Q1 2010 Q2 2010 87,9 3,7 2,7 5,7 100,0
Q2 2010 Q3 2010 89,3 3,6 2,0 5,0 100,0
Q3 2010 Q4 2010 90,9 3,1 1,8 4,2 100,0
Q4 2010 Q1 2011 88,4 4,1 2,4 5,0 100,0
Q1 2011 Q2 2011 87,5 4,6 2,3 5,6 100,0
Q2 2011 Q3 2011 90,3 3,2 1,9 4,6 100,0
Q3 2011 Q4 2011 91,2 3,1 1,5 4,2 100,0
Q4 2011 Q1 2012 90,2 3,8 1,7 4,3 100,0
Q1 2012 Q2 2012 90,4 3,0 2,3 4,3 100,0
Q2 2012 Q3 2012 91,6 3,1 1,7 3,7 100,0
Q3 2012 Q4 2012 90,5 3,7 1,7 4,2 100,0
Q4 2012 Q1 2013 89,4 4,1 2,1 4,4 100,0
Q1 2013 Q2 2013 90,5 3,4 3,0 3,0 100,0
Q2 2013 Q3 2013 88,7 3,1 2,9 5,3 100,0
Q3 2013 Q4 2013 89,2 3,3 2,5 5,0 100,0
Q4 2013 Q1 2014 89,1 4,0 2,1 4,8 100,0
Q1 2014 Q2 2014 88,7 3,7 2,6 5,0 100,0
Q2 2014 Q3 2014 88,1 4,9 2,5 4,5 100,0
Q3 2014 Q4 2014 88,2 3,7 3,0 5,1 100,0
Q1 2015 Q2 2015 87,4 5,2 3,0 4,5 100,0
Q2 2015 Q3 2015 87,7 4,7 2,5 5,0 100,0
Q3 2015 Q4 2015 90,0 3,6 2,2 4,2 100,0
t+1 status
t status: Unemployed: Primary and less
Employed Unemployed Discouraged Other NEA Total
Per cent
t quarter t+1 quarter
Q1 2010 Q2 2010 17,8 57,6 7,7 16,8 100,0
Q2 2010 Q3 2010 14,6 56,1 7,8 21,5 100,0
Q3 2010 Q4 2010 14,6 58,6 9,6 17,2 100,0
Q4 2010 Q1 2011 15,1 60,4 6,7 17,8 100,0
Q1 2011 Q2 2011 12,9 62,9 7,3 16,9 100,0
Q2 2011 Q3 2011 12,4 59,8 9,6 18,2 100,0
Q3 2011 Q4 2011 10,1 61,6 6,8 21,5 100,0
Q4 2011 Q1 2012 12,7 60,0 11,0 16,3 100,0
Q1 2012 Q2 2012 11,9 63,2 9,2 15,7 100,0
Q2 2012 Q3 2012 12,7 64,4 7,6 15,3 100,0
Q3 2012 Q4 2012 11,6 59,6 9,2 19,5 100,0
Q4 2012 Q1 2013 14,1 57,5 10,6 17,8 100,0
Q1 2013 Q2 2013 16,6 61,2 7,0 15,2 100,0
Q2 2013 Q3 2013 19,0 58,3 9,2 13,6 100,0
Q3 2013 Q4 2013 13,4 57,8 7,7 21,0 100,0
Q4 2013 Q1 2014 15,5 59,3 6,7 18,5 100,0
Q1 2014 Q2 2014 16,8 56,4 10,1 16,6 100,0
Q2 2014 Q3 2014 14,5 59,3 7,2 19,1 100,0
Q3 2014 Q4 2014 17,5 55,3 9,0 18,2 100,0
Q1 2015 Q2 2015 18,4 52,4 10,0 19,2 100,0
Q2 2015 Q3 2015 20,0 52,7 11,4 15,9 100,0
Q3 2015 Q4 2015 16,4 58,7 8,5 16,4 100,0

Statistics South Africa A3-7 02-11-02
Labour market dynamics in South Africa, 2015
Table A3: Quarterly transition rates between different labour market states, by education (Continued)
t+1 status
t status: Discouragement: Primary and less
Employed Unemployed Discouraged Other NEA Total
Per cent
t quarter t+1 quarter
Q1 2010 Q2 2010 9,9 10,5 51,6 28,0 100,0
Q2 2010 Q3 2010 7,9 11,6 55,9 24,7 100,0
Q3 2010 Q4 2010 8,5 7,3 59,3 24,9 100,0
Q4 2010 Q1 2011 9,5 10,3 52,5 27,7 100,0
Q1 2011 Q2 2011 9,1 9,0 55,7 26,2 100,0
Q2 2011 Q3 2011 8,1 7,5 55,2 29,1 100,0
Q3 2011 Q4 2011 8,3 10,7 59,1 21,9 100,0
Q4 2011 Q1 2012 6,4 8,1 56,3 29,2 100,0
Q1 2012 Q2 2012 8,5 9,8 57,3 24,4 100,0
Q2 2012 Q3 2012 10,2 9,1 57,4 23,3 100,0
Q3 2012 Q4 2012 8,7 9,5 53,9 27,9 100,0
Q4 2012 Q1 2013 7,0 9,2 58,9 24,8 100,0
Q1 2013 Q2 2013 8,8 9,9 60,4 20,9 100,0
Q2 2013 Q3 2013 12,5 11,5 51,8 24,2 100,0
Q3 2013 Q4 2013 12,7 5,4 53,4 28,5 100,0
Q4 2013 Q1 2014 12,3 10,4 54,1 23,1 100,0
Q1 2014 Q2 2014 12,1 9,7 54,1 24,2 100,0
Q2 2014 Q3 2014 11,0 8,8 56,3 23,9 100,0
Q3 2014 Q4 2014 11,4 10,9 51,1 26,6 100,0
Q1 2015 Q2 2015 11,6 9,4 52,2 26,3 100,0
Q2 2015 Q3 2015 11,1 13,8 50,4 24,7 100,0
Q3 2015 Q4 2015 14,7 7,9 55,7 21,7 100,0
t+1 status
t status: Other NEA: primary and less
Employed Unemployed Discouraged Other NEA Total
Per cent
t quarter t+1 quarter
Q1 2010 Q2 2010 3,2 3,2 3,7 89,9 100,0
Q2 2010 Q3 2010 3,2 3,1 3,8 89,9 100,0
Q3 2010 Q4 2010 2,9 2,9 3,7 90,5 100,0
Q4 2010 Q1 2011 3,1 2,9 4,0 90,0 100,0
Q1 2011 Q2 2011 2,8 2,8 3,9 90,5 100,0
Q2 2011 Q3 2011 2,8 3,3 3,7 90,2 100,0
Q3 2011 Q4 2011 2,0 3,2 3,7 91,1 100,0
Q4 2011 Q1 2012 2,8 3,1 4,0 90,0 100,0
Q1 2012 Q2 2012 2,5 2,7 4,4 90,3 100,0
Q2 2012 Q3 2012 3,0 3,1 4,1 89,8 100,0
Q3 2012 Q4 2012 2,1 2,8 3,6 91,6 100,0
Q4 2012 Q1 2013 2,7 2,6 4,4 90,2 100,0
Q1 2013 Q2 2013 3,1 3,1 3,7 90,1 100,0
Q2 2013 Q3 2013 3,3 3,0 3,4 90,3 100,0
Q3 2013 Q4 2013 2,9 2,2 3,4 91,5 100,0
Q4 2013 Q1 2014 3,1 3,2 4,0 89,7 100,0
Q1 2014 Q2 2014 3,9 3,9 4,1 88,1 100,0
Q2 2014 Q3 2014 3,9 3,0 3,5 89,6 100,0
Q3 2014 Q4 2014 3,1 2,7 3,1 91,2 100,0
Q1 2015 Q2 2015 4,0 3,6 4,5 87,8 100,0
Q2 2015 Q3 2015 3,6 3,0 3,3 90,1 100,0
Q3 2015 Q4 2015 2,8 2,7 3,5 90,9 100,0

Statistics South Africa A3-8 02-11-02
Labour market dynamics in South Africa, 2015
Table A3: Quarterly transition rates between different labour market states, by education (Continued)
t+1 status
t status: Employed: less than Secondary
Employed Unemployed Discouraged Other NEA Total
Per cent
t quarter t+1 quarter
Q1 2010 Q2 2010 90,4 5,2 1,7 2,7 100,0
Q2 2010 Q3 2010 91,3 4,6 1,4 2,8 100,0
Q3 2010 Q4 2010 92,2 3,3 1,4 3,1 100,0
Q4 2010 Q1 2011 91,5 3,7 1,7 3,1 100,0
Q1 2011 Q2 2011 91,0 4,2 1,6 3,2 100,0
Q2 2011 Q3 2011 91,3 4,3 1,8 2,6 100,0
Q3 2011 Q4 2011 91,5 4,2 1,6 2,7 100,0
Q4 2011 Q1 2012 90,9 4,6 1,6 3,0 100,0
Q1 2012 Q2 2012 90,1 5,0 1,9 3,0 100,0
Q2 2012 Q3 2012 91,4 4,7 1,4 2,4 100,0
Q3 2012 Q4 2012 91,0 4,4 1,4 3,3 100,0
Q4 2012 Q1 2013 91,2 4,5 1,7 2,7 100,0
Q1 2013 Q2 2013 90,4 5,1 1,8 2,7 100,0
Q2 2013 Q3 2013 90,1 4,9 2,0 3,0 100,0
Q3 2013 Q4 2013 90,3 4,5 2,0 3,2 100,0
Q4 2013 Q1 2014 88,7 5,6 2,6 3,2 100,0
Q1 2014 Q2 2014 89,6 5,0 2,1 3,3 100,0
Q2 2014 Q3 2014 89,9 5,7 2,1 2,4 100,0
Q3 2014 Q4 2014 90,2 4,8 2,0 3,1 100,0
Q1 2015 Q2 2015 88,4 6,0 2,4 3,2 100,0
Q2 2015 Q3 2015 88,9 6,1 2,1 2,9 100,0
Q3 2015 Q4 2015 91,3 4,2 1,7 2,9 100,0
t+1 status
t status: Unemployed : less than Secondary
Employed Unemployed Discouraged Other NEA Total
Per cent
t quarter t+1 quarter
Q1 2010 Q2 2010 10,7 67,3 7,4 14,6 100,0
Q2 2010 Q3 2010 10,7 65,3 8,6 15,4 100,0
Q3 2010 Q4 2010 10,7 66,8 7,3 15,1 100,0
Q4 2010 Q1 2011 10,8 69,4 6,8 13,0 100,0
Q1 2011 Q2 2011 10,1 68,4 7,5 14,1 100,0
Q2 2011 Q3 2011 10,3 67,8 7,4 14,5 100,0
Q3 2011 Q4 2011 10,9 67,7 8,1 13,3 100,0
Q4 2011 Q1 2012 11,0 68,1 7,9 13,0 100,0
Q1 2012 Q2 2012 10,4 69,3 7,1 13,3 100,0
Q2 2012 Q3 2012 12,9 70,7 6,4 10,0 100,0
Q3 2012 Q4 2012 10,4 67,6 6,6 15,5 100,0
Q4 2012 Q1 2013 11,8 64,8 8,3 15,1 100,0
Q1 2013 Q2 2013 10,8 69,0 7,7 12,5 100,0
Q2 2013 Q3 2013 12,8 67,9 7,2 12,1 100,0
Q3 2013 Q4 2013 12,5 69,2 5,6 12,7 100,0
Q4 2013 Q1 2014 12,0 68,6 7,7 11,6 100,0
Q1 2014 Q2 2014 12,3 67,2 7,0 13,4 100,0
Q2 2014 Q3 2014 12,5 67,0 7,9 12,6 100,0
Q3 2014 Q4 2014 11,7 66,7 7,3 14,3 100,0
Q1 2015 Q2 2015 15,8 63,0 8,0 13,0 100,0
Q2 2015 Q3 2015 13,4 66,2 8,9 11,5 100,0
Q3 2015 Q4 2015 12,8 66,1 7,7 13,3 100,0

Statistics South Africa A3-9 02-11-02
Labour market dynamics in South Africa, 2015
Table A3: Quarterly transition rates between different labour market states, by education (Continued)
t+1 status
t status: Discouragement: less than Secondary
Employed Unemployed Discouraged Other NEA Total
Per cent
t quarter t+1 quarter
Q1 2010 Q2 2010 8,9 15,1 49,8 26,2 100,0
Q2 2010 Q3 2010 7,6 15,4 54,6 22,4 100,0
Q3 2010 Q4 2010 7,5 14,2 55,0 23,3 100,0
Q4 2010 Q1 2011 8,4 11,4 61,2 19,0 100,0
Q1 2011 Q2 2011 10,6 15,5 52,0 22,0 100,0
Q2 2011 Q3 2011 7,9 12,7 58,1 21,3 100,0
Q3 2011 Q4 2011 7,4 14,9 58,8 18,8 100,0
Q4 2011 Q1 2012 7,6 14,5 57,4 20,4 100,0
Q1 2012 Q2 2012 8,5 13,5 59,8 18,3 100,0
Q2 2012 Q3 2012 7,7 15,2 56,4 20,6 100,0
Q3 2012 Q4 2012 6,2 15,1 55,8 22,9 100,0
Q4 2012 Q1 2013 7,0 15,1 58,2 19,8 100,0
Q1 2013 Q2 2013 7,2 13,5 58,1 21,3 100,0
Q2 2013 Q3 2013 11,5 13,1 55,3 20,1 100,0
Q3 2013 Q4 2013 10,9 14,8 52,6 21,7 100,0
Q4 2013 Q1 2014 9,3 15,7 56,6 18,4 100,0
Q1 2014 Q2 2014 7,9 12,1 58,6 21,4 100,0
Q2 2014 Q3 2014 9,6 11,0 59,5 19,8 100,0
Q3 2014 Q4 2014 8,3 13,0 59,9 18,9 100,0
Q1 2015 Q2 2015 12,0 14,4 51,3 22,4 100,0
Q2 2015 Q3 2015 7,9 16,5 55,1 20,5 100,0
Q3 2015 Q4 2015 9,7 14,2 58,1 18,0 100,0
t+1 status
t status: Other NEA: less than Secondary
Employed Unemployed Discouraged Other NEA Total
Per cent
t quarter t+1 quarter
Q1 2010 Q2 2010 2,1 4,7 3,3 89,9 100,0
Q2 2010 Q3 2010 1,9 4,8 3,6 89,7 100,0
Q3 2010 Q4 2010 1,8 4,0 3,2 90,9 100,0
Q4 2010 Q1 2011 2,1 5,0 4,5 88,4 100,0
Q1 2011 Q2 2011 2,1 4,6 3,7 89,6 100,0
Q2 2011 Q3 2011 1,8 4,6 3,2 90,4 100,0
Q3 2011 Q4 2011 1,6 4,1 3,7 90,5 100,0
Q4 2011 Q1 2012 1,7 5,6 4,5 88,1 100,0
Q1 2012 Q2 2012 1,7 4,3 3,8 90,2 100,0
Q2 2012 Q3 2012 1,9 4,5 3,2 90,5 100,0
Q3 2012 Q4 2012 1,5 3,7 3,4 91,4 100,0
Q4 2012 Q1 2013 2,2 5,5 3,9 88,4 100,0
Q1 2013 Q2 2013 1,7 4,9 3,7 89,7 100,0
Q2 2013 Q3 2013 2,3 4,3 3,4 90,1 100,0
Q3 2013 Q4 2013 2,4 3,7 3,6 90,3 100,0
Q4 2013 Q1 2014 2,2 5,2 4,6 88,0 100,0
Q1 2014 Q2 2014 2,3 5,1 3,1 89,6 100,0
Q2 2014 Q3 2014 1,8 4,1 3,2 90,9 100,0
Q3 2014 Q4 2014 1,9 3,4 3,1 91,6 100,0
Q1 2015 Q2 2015 2,2 5,0 3,7 89,0 100,0
Q2 2015 Q3 2015 2,6 4,8 3,2 89,3 100,0
Q3 2015 Q4 2015 1,9 3,7 2,6 91,8 100,0

Statistics South Africa A3-10 02-11-02
Labour market dynamics in South Africa, 2015
Table A3: Quarterly transition rates between different labour market states, by education (Continued)
t+1 status
t status: Employed: Secondary completed
Employed Unemployed Discouraged Other NEA Total
Per cent
t quarter t+1 quarter
Q1 2010 Q2 2010 94,9 2,5 0,8 1,8 100,0
Q2 2010 Q3 2010 95,2 2,5 0,8 1,5 100,0
Q3 2010 Q4 2010 94,7 2,7 0,6 1,9 100,0
Q4 2010 Q1 2011 95,0 2,5 0,7 1,9 100,0
Q1 2011 Q2 2011 94,8 3,1 0,7 1,4 100,0
Q2 2011 Q3 2011 95,0 3,0 0,8 1,1 100,0
Q3 2011 Q4 2011 94,5 2,7 1,0 1,8 100,0
Q4 2011 Q1 2012 93,9 3,3 0,8 2,0 100,0
Q1 2012 Q2 2012 94,9 2,4 0,9 1,8 100,0
Q2 2012 Q3 2012 94,9 2,7 0,6 1,8 100,0
Q3 2012 Q4 2012 94,3 2,7 0,9 2,1 100,0
Q4 2012 Q1 2013 94,0 3,2 0,7 2,1 100,0
Q1 2013 Q2 2013 93,8 3,3 1,5 1,5 100,0
Q2 2013 Q3 2013 93,4 3,6 1,0 2,0 100,0
Q3 2013 Q4 2013 94,3 3,2 0,6 1,8 100,0
Q4 2013 Q1 2014 93,0 3,8 1,1 2,2 100,0
Q1 2014 Q2 2014 94,0 3,5 0,8 1,7 100,0
Q2 2014 Q3 2014 93,0 3,5 1,3 2,2 100,0
Q3 2014 Q4 2014 94,5 2,8 1,0 1,7 100,0
Q1 2015 Q2 2015 93,4 3,6 0,7 2,3 100,0
Q2 2015 Q3 2014 92,6 4,6 0,9 1,8 100,0
Q3 2015 Q4 2105 94,6 2,9 0,8 1,7 100,0
t+1 status
t status: Unemployed : Secondary completed
Employed Unemployed Discouraged Other NEA Total
Per cent
t quarter t+1 quarter
Q1 2010 Q2 2010 10,2 69,9 6,1 13,7 100,0
Q2 2010 Q3 2010 9,4 69,2 6,9 14,5 100,0
Q3 2010 Q4 2010 7,6 71,7 8,0 12,7 100,0
Q4 2010 Q1 2011 9,8 71,7 6,1 12,4 100,0
Q1 2011 Q2 2011 7,8 75,3 5,0 11,8 100,0
Q2 2011 Q3 2011 8,9 68,9 7,1 15,1 100,0
Q3 2011 Q4 2011 10,5 68,2 7,2 14,1 100,0
Q4 2011 Q1 2012 8,2 69,7 7,2 14,9 100,0
Q1 2012 Q2 2012 9,6 70,4 6,6 13,3 100,0
Q2 2012 Q3 2012 12,4 68,9 7,2 11,6 100,0
Q3 2012 Q4 2012 10,9 68,3 6,7 14,1 100,0
Q4 2012 Q1 2013 9,9 70,3 6,6 13,1 100,0
Q1 2013 Q2 2013 9,8 71,3 6,8 12,1 100,0
Q2 2013 Q3 2013 11,4 67,1 8,1 13,4 100,0
Q3 2013 Q4 2013 12,6 70,7 5,8 10,9 100,0
Q4 2013 Q1 2014 10,6 69,3 6,1 14,0 100,0
Q1 2014 Q2 2014 11,5 66,2 6,6 15,7 100,0
Q2 2014 Q3 2014 12,7 65,6 7,7 14,0 100,0
Q3 2014 Q4 2014 12,8 67,4 5,9 13,9 100,0
Q1 2015 Q2 2015 12,0 64,4 7,7 15,9 100,0
Q2 2015 Q3 2015 12,4 69,3 6,4 11,9 100,0
Q3 2015 Q4 2015 11,1 72,2 5,7 11,0 100,0

Statistics South Africa A3-11 02-11-02
Labour market dynamics in South Africa, 2015
Table A3: Quarterly transition rates between different labour market states, by education (Continued)
t+1 status
t status: Discouragement: Secondary completed
Employed Unemployed Discouraged Other NEA Total
Per cent
t quarter t+1 quarter
Q1 2010 Q2 2010 9,9 26,3 49,4 14,4 100,0
Q2 2010 Q3 2010 8,6 22,0 52,2 17,2 100,0
Q3 2010 Q4 2010 6,5 17,1 62,0 14,4 100,0
Q4 2010 Q1 2011 6,8 19,0 59,7 14,5 100,0
Q1 2011 Q2 2011 4,6 25,0 47,9 22,4 100,0
Q2 2011 Q3 2011 6,1 19,9 57,0 16,9 100,0
Q3 2011 Q4 2011 4,8 20,9 59,5 14,8 100,0
Q4 2011 Q1 2012 6,9 20,2 56,8 16,1 100,0
Q1 2012 Q2 2012 7,3 18,4 58,1 16,3 100,0
Q2 2012 Q3 2012 7,5 21,0 55,9 15,6 100,0
Q3 2012 Q4 2012 6,5 21,1 58,0 14,3 100,0
Q4 2012 Q1 2013 8,6 17,2 57,9 16,2 100,0
Q1 2013 Q2 2013 6,0 20,8 57,0 16,2 100,0
Q2 2013 Q3 2013 8,4 19,1 56,6 16,0 100,0
Q3 2013 Q4 2013 8,8 22,5 52,9 15,8 100,0
Q4 2013 Q1 2014 8,1 16,8 60,7 14,4 100,0
Q1 2014 Q2 2014 6,9 18,7 58,2 16,2 100,0
Q2 2014 Q3 2014 8,8 17,1 59,5 14,7 100,0
Q3 2014 Q4 2014 10,6 13,2 57,9 18,3 100,0
Q1 2015 Q2 2015 11,0 21,0 50,9 17,1 100,0
Q2 2015 Q3 2015 8,4 24,2 49,5 18,0 100,0
Q3 2015 Q4 2015 9,5 17,2 61,7 11,5 100,0
t+1 status
t status: Other NEA: Secondary completed
Employed Unemployed Discouraged Other NEA Total
Per cent
t quarter t+1 quarter
Q1 2010 Q2 2010 3,1 11,7 4,8 80,4 100,0
Q2 2010 Q3 2010 3,9 8,9 4,2 83,0 100,0
Q3 2010 Q4 2010 3,1 8,8 5,2 82,9 100,0
Q4 2010 Q1 2011 2,8 11,0 4,2 82,0 100,0
Q1 2011 Q2 2011 2,9 10,9 4,7 81,5 100,0
Q2 2011 Q3 2011 3,1 9,1 4,2 83,5 100,0
Q3 2011 Q4 2011 3,3 9,0 5,1 82,6 100,0
Q4 2011 Q1 2012 4,2 10,9 4,4 80,6 100,0
Q1 2012 Q2 2012 2,9 10,6 4,3 82,2 100,0
Q2 2012 Q3 2012 3,9 11,3 3,5 81,4 100,0
Q3 2012 Q4 2012 3,0 8,9 3,4 84,8 100,0
Q4 2012 Q1 2013 3,6 10,9 3,5 82,0 100,0
Q1 2013 Q2 2013 3,6 10,9 4,5 80,9 100,0
Q2 2013 Q3 2013 4,1 8,5 5,0 82,5 100,0
Q3 2013 Q4 2013 4,4 9,4 4,0 82,2 100,0
Q4 2013 Q1 2014 4,4 9,5 3,0 83,0 100,0
Q1 2014 Q2 2014 4,0 10,6 4,1 81,3 100,0
Q2 2014 Q3 2014 3,8 9,4 4,5 82,3 100,0
Q3 2014 Q4 2014 4,2 8,3 3,8 83,6 100,0
Q1 2015 Q2 2015 4,3 10,0 5,0 80,7 100,0
Q2 2015 Q3 2015 4,3 12,2 4,4 79,1 100,0
Q3 2015 Q4 2015 3,7 8,7 3,3 84,3 100,0

Statistics South Africa A3-12 02-11-02
Labour market dynamics in South Africa, 2015
Table A3: Quarterly transition rates between different labour market states, by education (Continued)
t+1 status
t status: Employed: Tertiary
Employed Unemployed Discouraged Other NEA Total
Per cent
t quarter t+1 quarter
Q1 2010 Q2 2010 97,6 1,4 0,2 0,8 100,0
Q2 2010 Q3 2010 98,2 1,1 0,2 0,6 100,0
Q3 2010 Q4 2010 98,3 0,8 0,2 0,7 100,0
Q4 2010 Q1 2011 98,6 0,6 0,1 0,6 100,0
Q1 2011 Q2 2011 98,3 0,8 0,1 0,8 100,0
Q2 2011 Q3 2011 97,6 1,0 0,2 1,1 100,0
Q3 2011 Q4 2011 98,0 0,9 0,3 0,8 100,0
Q4 2011 Q1 2012 97,1 1,6 0,2 1,2 100,0
Q1 2012 Q2 2012 98,5 0,4 0,1 1,0 100,0
Q2 2012 Q3 2012 98,1 1,1 0,1 0,7 100,0
Q3 2012 Q4 2012 98,1 1,1 0,1 0,7 100,0
Q4 2012 Q1 2013 98,1 0,9 0,2 0,8 100,0
Q1 2013 Q2 2013 97,7 0,8 0,3 1,1 100,0
Q2 2013 Q3 2013 97,2 1,4 0,2 1,3 100,0
Q3 2013 Q4 2013 97,5 1,2 0,3 1,0 100,0
Q4 2013 Q1 2014 96,6 1,8 0,4 1,2 100,0
Q1 2014 Q2 2014 96,8 1,2 0,3 1,7 100,0
Q2 2014 Q3 2014 96,8 1,3 0,6 1,3 100,0
Q3 2014 Q4 2014 98,2 0,6 0,4 0,8 100,0
Q1 2015 Q2 2015 96,2 1,9 0,2 1,7 100,0
Q2 2015 Q3 2015 96,3 1,9 0,3 1,5 100,0
Q3 2015 Q4 2015 96,8 1,7 0,3 1,2 100,0
t+1 status
t status: Unemployed : Tertiary
Employed Unemployed Discouraged Other NEA Total
Per cent
t quarter t+1 quarter
Q1 2010 Q2 2010 13,3 69,0 6,4 11,2 100,0
Q2 2010 Q3 2010 8,5 71,8 8,3 11,4 100,0
Q3 2010 Q4 2010 9,8 64,3 13,0 12,9 100,0
Q4 2010 Q1 2011 11,7 68,8 9,0 10,5 100,0
Q1 2011 Q2 2011 12,4 69,4 8,2 10,0 100,0
Q2 2011 Q3 2011 12,9 71,2 5,5 10,5 100,0
Q3 2011 Q4 2011 13,7 73,8 5,3 7,2 100,0
Q4 2011 Q1 2012 11,3 69,7 9,0 10,0 100,0
Q1 2012 Q2 2012 9,9 70,5 6,6 13,0 100,0
Q2 2012 Q3 2012 11,9 65,7 8,4 14,1 100,0
Q3 2012 Q4 2012 12,2 68,4 7,3 12,1 100,0
Q4 2012 Q1 2013 11,5 67,3 10,0 11,2 100,0
Q1 2013 Q2 2013 8,1 69,8 10,9 11,2 100,0
Q2 2013 Q3 2013 15,9 67,7 5,8 10,7 100,0
Q3 2013 Q4 2013 17,7 64,6 5,4 12,2 100,0
Q4 2013 Q1 2014 12,7 71,9 6,0 9,5 100,0
Q1 2014 Q2 2014 17,1 63,3 6,8 12,8 100,0
Q2 2014 Q3 2014 12,6 72,4 7,3 7,7 100,0
Q3 2014 Q4 2014 14,2 67,0 9,3 9,6 100,0
Q1 2015 Q2 2015 17,1 60,6 7,9 15,1 100,0
Q2 2015 Q3 2015 14,3 69,5 6,8 9,3 100,0
Q3 2015 Q4 2015 12,7 69,7 6,3 11,3 100,0

Statistics South Africa A3-13 02-11-02
Labour market dynamics in South Africa, 2015
Table A3: Quarterly transition rates between different labour market states, by education (Continued)
t+1 status
t status: Discouragement: Tertiary
Employed Unemployed Discouraged Other NEA Total
Per cent
t quarter t+1 quarter
Q1 2010 Q2 2010 4,3 28,7 52,2 14,8 100,0
Q2 2010 Q3 2010 5,7 30,3 47,2 16,8 100,0
Q3 2010 Q4 2010 7,5 23,3 60,3 8,9 100,0
Q4 2010 Q1 2011 7,7 22,1 58,4 11,8 100,0
Q1 2011 Q2 2011 9,4 27,0 48,4 15,1 100,0
Q2 2011 Q3 2011 7,1 26,6 48,9 17,3 100,0
Q3 2011 Q4 2011 9,0 23,8 58,3 8,9 100,0
Q4 2011 Q1 2012 5,2 20,8 69,0 4,9 100,0
Q1 2012 Q2 2012 7,0 38,9 45,9 8,2 100,0
Q2 2012 Q3 2012 6,9 34,4 45,1 13,6 100,0
Q3 2012 Q4 2012 2,9 23,1 51,7 22,4 100,0
Q4 2012 Q1 2013 6,4 29,6 51,2 12,8 100,0
Q1 2013 Q2 2013 9,2 21,1 61,3 8,4 100,0
Q2 2013 Q3 2013 6,0 33,2 44,4 16,4 100,0
Q3 2013 Q4 2013 9,8 33,4 41,1 15,7 100,0
Q4 2013 Q1 2014 8,2 26,9 50,0 14,9 100,0
Q1 2014 Q2 2014 13,3 24,8 52,1 9,8 100,0
Q2 2014 Q3 2014 8,2 22,6 58,8 10,3 100,0
Q3 2014 Q4 2014 8,9 23,3 50,8 17,0 100,0
Q1 2015 Q2 2015 11,3 34,4 40,4 14,0 100,0
Q2 2015 Q3 2015 14,1 30,8 44,9 10,3 100,0
Q3 2015 Q4 2015 2,9 35,4 54,3 7,4 100,0
t+1 status
t status: Other NEA: Tertiary
Employed Unemployed Discouraged Other NEA Total
Per cent
t quarter t+1 quarter
Q1 2010 Q2 2010 5,5 8,3 3,0 83,2 100,0
Q2 2010 Q3 2010 3,8 7,5 1,4 87,3 100,0
Q3 2010 Q4 2010 5,0 9,0 4,7 81,4 100,0
Q4 2010 Q1 2011 4,9 7,4 2,9 84,8 100,0
Q1 2011 Q2 2011 4,0 6,9 2,9 86,2 100,0
Q2 2011 Q3 2011 3,9 7,3 3,0 85,9 100,0
Q3 2011 Q4 2011 7,4 8,1 2,8 81,7 100,0
Q4 2011 Q1 2012 5,1 8,5 2,6 83,8 100,0
Q1 2012 Q2 2012 6,0 7,3 2,9 83,8 100,0
Q2 2012 Q3 2012 6,6 6,3 3,1 84,0 100,0
Q3 2012 Q4 2012 6,4 7,5 2,9 83,2 100,0
Q4 2012 Q1 2013 4,9 7,9 4,4 82,8 100,0
Q1 2013 Q2 2013 4,4 7,2 1,7 86,6 100,0
Q2 2013 Q3 2013 7,1 6,8 1,6 84,5 100,0
Q3 2013 Q4 2013 6,8 8,4 2,1 82,7 100,0
Q4 2013 Q1 2014 7,4 7,7 2,9 82,0 100,0
Q1 2014 Q2 2014 6,6 5,1 2,3 86,0 100,0
Q2 2014 Q3 2014 5,0 6,7 4,0 84,3 100,0
Q3 2014 Q4 2014 5,8 7,2 0,9 86,1 100,0
Q1 2015 Q2 2015 6,1 13,5 3,2 77,2 100,0
Q2 2015 Q3 2015 14,3 11,3 2,1 82,3 100,0
Q3 2015 Q4 2015 4,9 9,3 1,0 84,8 100,0

Statistics South Africa A3-14 02-11-02
Labour market dynamics in South Africa, 2015
Table A4: Quarterly transition rates between different labour market states and sectors
t+1 status
t status: Employed
Formal Informal Agriculture Private hh Total
Per cent
t quarter t+1 quarter
Q1 2010 Q2 2010 71,5 14,7 5,0 8,7 100,0
Q2 2010 Q3 2010 71,4 15,3 4,6 8,7 100,0
Q3 2010 Q4 2010 72,0 14,9 4,7 8,4 100,0
Q4 2010 Q1 2011 72,2 14,9 4,8 8,1 100,0
Q1 2011 Q2 2011 72,1 15,2 4,7 8,0 100,0
Q2 2011 Q3 2011 72,1 15,2 4,4 8,2 100,0
Q3 2011 Q4 2011 72,9 14,2 4,8 8,1 100,0
Q4 2011 Q1 2012 72,9 14,1 4,7 8,3 100,0
Q1 2012 Q2 2012 73,1 13,7 4,8 8,5 100,0
Q2 2012 Q3 2012 72,2 14,4 4,9 8,5 100,0
Q3 2012 Q4 2012 72,8 14,7 4,6 8,0 100,0
Q4 2012 Q1 2013 72,5 14,9 4,7 8,0 100,0
Q1 2013 Q2 2013 72,6 14,5 4,8 8,1 100,0
Q2 2013 Q3 2013 73,0 13,9 5,1 8,0 100,0
Q3 2013 Q4 2013 73,0 14,2 4,7 8,0 100,0
Q4 2013 Q1 2014 73,2 14,4 4,6 7,7 100,0
Q1 2014 Q2 2014 73,4 14,1 4,3 8,2 100,0
Q2 2014 Q3 2014 73,4 14,6 4,5 7,6 100,0
Q3 2014 Q4 2014 73,6 14,8 4,2 7,4 100,0
Q1 2015 Q2 2015 71,5 15,3 5,4 7,8 100,0
Q2 2015 Q3 2015 69,8 16,0 5,7 8,5 100,0
Q3 2015 Q4 2015 71,7 15,4 5,1 7,8 100,0
t+1 status
t status: Unemployed
Formal Informal Agriculture Private hh Total
Per cent
t quarter t+1 quarter
Q1 2010 Q2 2010 47,2 28,8 7,5 16,6 100,0
Q2 2010 Q3 2010 47,0 32,9 3,8 16,3 100,0
Q3 2010 Q4 2010 48,4 32,9 4,4 14,2 100,0
Q4 2010 Q1 2011 51,2 29,2 4,8 14,7 100,0
Q1 2011 Q2 2011 55,5 26,7 3,5 14,4 100,0
Q2 2011 Q3 2011 52,5 28,4 5,6 13,5 100,0
Q3 2011 Q4 2011 54,1 29,0 4,1 12,7 100,0
Q4 2011 Q1 2012 54,5 28,4 4,4 12,7 100,0
Q1 2012 Q2 2012 58,5 23,5 4,6 13,3 100,0
Q2 2012 Q3 2012 56,7 28,5 3,2 11,6 100,0
Q3 2012 Q4 2012 55,8 28,3 5,7 10,2 100,0
Q4 2012 Q1 2013 51,9 29,2 5,6 13,3 100,0
Q1 2013 Q2 2013 56,9 29,2 3,2 10,7 100,0
Q2 2013 Q3 2013 54,7 27,7 5,6 12,0 100,0
Q3 2013 Q4 2013 56,8 25,4 5,8 12,0 100,0
Q4 2013 Q1 2014 56,2 27,4 4,6 11,8 100,0
Q1 2014 Q2 2014 52,9 30,5 4,9 11,7 100,0
Q2 2014 Q3 2014 51,7 30,8 4,1 13,5 100,0
Q3 2014 Q4 2014 51,1 31,4 5,8 11,8 100,0
Q1 2015 Q2 2015 52,3 31,7 4,0 12,0 100,0
Q2 2015 Q3 2015 47,0 34,0 6,3 12,7 100,0
Q3 2015 Q4 2015 52,0 30,1 5,9 12,0 100,0

Statistics South Africa A3-15 02-11-02
Labour market dynamics in South Africa, 2015
Table A4: Quarterly transition rates between different labour market states and sectors
t+1 status
t status: Discouragement
Formal Informal Agriculture Private hh Total
Per cent
t quarter t+1 quarter
Q1 2010 Q2 2010 34,4 41,0 7,5 17,2 100,0
Q2 2010 Q3 2010 34,3 40,7 10,9 14,2 100,0
Q3 2010 Q4 2010 32,0 47,8 6,9 13,3 100,0
Q4 2010 Q1 2011 39,4 36,7 7,3 16,6 100,0
Q1 2011 Q2 2011 34,8 43,4 10,4 11,5 100,0
Q2 2011 Q3 2011 40,3 37,8 6,5 15,4 100,0
Q3 2011 Q4 2011 41,9 37,5 8,6 12,1 100,0
Q4 2011 Q1 2012 37,5 35,1 11,1 16,4 100,0
Q1 2012 Q2 2012 38,7 37,3 9,3 14,7 100,0
Q2 2012 Q3 2012 38,9 42,1 4,3 14,7 100,0
Q3 2012 Q4 2012 38,2 39,2 9,1 13,4 100,0
Q4 2012 Q1 2013 47,8 31,2 10,2 10,8 100,0
Q1 2013 Q2 2013 36,9 42,4 7,4 13,3 100,0
Q2 2013 Q3 2013 38,8 39,4 12,7 9,1 100,0
Q3 2013 Q4 2013 41,7 38,9 10,3 9,1 100,0
Q4 2013 Q1 2014 35,1 38,8 13,5 12,6 100,0
Q1 2014 Q2 2014 35,3 39,4 10,9 14,4 100,0
Q2 2014 Q3 2014 35,9 42,2 6,8 15,0 100,0
Q3 2014 Q4 2014 44,6 35,4 9,7 10,2 100,0
Q1 2015 Q2 2015 36,1 45,5 6,8 11,6 100,0
Q2 2015 Q3 2015 32,6 44,2 7,7 15,5 100,0
Q3 2015 Q4 2015 37,4 42,8 10,5 9,2 100,0
t+1 status
t status: Other NEA
Formal Informal Agriculture Private hh Total
Per cent
t quarter t+1 quarter
Q1 2010 Q2 2010 41,7 36,6 5,1 16,7 100,0
Q2 2010 Q3 2010 42,6 32,6 8,8 16,1 100,0
Q3 2010 Q4 2010 38,3 38,2 7,3 16,2 100,0
Q4 2010 Q1 2011 37,2 32,6 5,7 24,5 100,0
Q1 2011 Q2 2011 41,2 38,3 6,6 13,9 100,0
Q2 2011 Q3 2011 45,3 34,8 4,4 15,4 100,0
Q3 2011 Q4 2011 43,9 34,5 7,5 14,1 100,0
Q4 2011 Q1 2012 44,5 35,3 4,4 15,8 100,0
Q1 2012 Q2 2012 39,1 38,1 6,6 16,2 100,0
Q2 2012 Q3 2012 41,9 37,9 5,2 15,0 100,0
Q3 2012 Q4 2012 41,4 34,9 10,5 13,1 100,0
Q4 2012 Q1 2013 46,7 31,4 5,9 16,0 100,0
Q1 2013 Q2 2013 42,1 36,6 6,3 15,0 100,0
Q2 2013 Q3 2013 38,1 40,0 8,7 13,1 100,0
Q3 2013 Q4 2013 47,1 38,1 5,2 9,7 100,0
Q4 2013 Q1 2014 49,5 29,6 8,5 12,5 100,0
Q1 2014 Q2 2014 46,5 31,4 8,2 13,9 100,0
Q2 2014 Q3 2014 43,0 33,7 8,7 14,6 100,0
Q3 2014 Q4 2014 48,3 31,2 5,9 14,6 100,0
Q1 2015 Q2 2015 40,7 37,1 6,6 15,5 100,0
Q2 2015 Q3 2015 41,0 33,2 8,1 17,6 100,0
Q3 2015 Q4 2015 45,0 35,4 5,9 13,7 100,0

Statistics South Africa A3-16 02-11-02
Labour market dynamics in South Africa, 2015
Table A5: Quarterly transition rates between different labour market states, for youths (15-34 yrs) and adults (35-64 yrs)
t+1 status
t status: Employed Youth
Employed Unemployed Discouraged Other NEA Total
Per cent
t quarter t+1 quarter
Q1 2010 Q2 2010 90,1 5,0 2,0 2,9 100,0
Q2 2010 Q3 2010 91,6 4,7 1,3 2,3 100,0
Q3 2010 Q4 2010 91,9 4,2 1,4 2,5 100,0
Q4 2010 Q1 2011 91,6 4,1 1,7 2,6 100,0
Q1 2011 Q2 2011 91,2 4,7 1,6 2,6 100,0
Q2 2011 Q3 2011 91,6 4,5 1,8 2,2 100,0
Q3 2011 Q4 2011 91,6 4,4 1,6 2,4 100,0
Q4 2011 Q1 2012 90,7 4,9 1,5 2,8 100,0
Q1 2012 Q2 2012 91,3 4,5 1,8 2,3 100,0
Q2 2012 Q3 2012 92,1 4,4 1,3 2,2 100,0
Q3 2012 Q4 2012 90,8 5,0 1,6 2,6 100,0
Q4 2012 Q1 2013 90,9 5,0 1,6 2,6 100,0
Q1 2013 Q2 2013 90,5 5,4 2,2 2,0 100,0
Q2 2013 Q3 2013 90,0 5,3 2,1 2,7 100,0
Q3 2013 Q4 2013 90,6 4,9 1,9 2,6 100,0
Q4 2013 Q1 2014 88,4 6,1 2,5 3,1 100,0
Q1 2014 Q2 2014 90,1 5,4 2,0 2,6 100,0
Q2 2014 Q3 2014 89,5 6,1 2,3 2,2 100,0
Q3 2014 Q4 2014 90,6 4,8 2,0 2,5 100,0
Q1 2015 Q2 2015 88,7 6,5 2,2 2,6 100,0
Q2 2015 Q3 2015 89,5 6,7 1,9 1,9 100,0
Q3 2015 Q4 2015 91,4 4,8 1,5 2,3 100,0
t+1 status
t status: Unemployed Youth
Employed Unemployed Discouraged Other NEA Total
Per cent
t quarter t+1 quarter
Q1 2010 Q2 2010 10,6 67,9 7,4 14,1 100,0
Q2 2010 Q3 2010 9,8 66,5 8,5 15,2 100,0
Q3 2010 Q4 2010 9,3 67,9 8,8 13,9 100,0
Q4 2010 Q1 2011 10,2 70,2 6,7 12,8 100,0
Q1 2011 Q2 2011 9,0 70,9 6,9 13,1 100,0
Q2 2011 Q3 2011 9,6 68,5 7,3 14,5 100,0
Q3 2011 Q4 2011 9,6 69,5 7,7 13,2 100,0
Q4 2011 Q1 2012 9,2 68,5 8,2 14,1 100,0
Q1 2012 Q2 2012 9,3 69,5 7,7 13,5 100,0
Q2 2012 Q3 2012 11,6 70,4 7,0 11,0 100,0
Q3 2012 Q4 2012 10,1 68,7 6,8 14,4 100,0
Q4 2012 Q1 2013 10,4 66,2 8,8 14,6 100,0
Q1 2013 Q2 2013 9,5 70,2 7,8 12,4 100,0
Q2 2013 Q3 2013 12,0 68,0 8,1 12,0 100,0
Q3 2013 Q4 2013 12,9 68,5 6,3 12,2 100,0
Q4 2013 Q1 2014 10,9 68,8 7,0 13,3 100,0
Q1 2014 Q2 2014 12,6 65,6 7,4 14,5 100,0
Q2 2014 Q3 2014 11,2 68,1 7,6 13,0 100,0
Q3 2014 Q4 2014 11,9 67,4 7,2 13,4 100,0
Q1 2015 Q2 2015 13,6 64,2 8,0 14,3 100,0
Q2 2015 Q3 2015 13,1 67,1 8,5 11,4 100,0
Q3 2015 Q4 2015 11,6 68,7 7,6 12,1 100,0

Statistics South Africa A3-17 02-11-02
Labour market dynamics in South Africa, 2015
Table A5: Quarterly transition rates between different labour market states, for youths (15-34 yrs) and adults (35-64 yrs)
t+1 status
t status: Discouragement Youth
Employed Unemployed Discouraged Other NEA Total
Per cent
t quarter t+1 quarter
Q1 2010 Q2 2010 8,2 18,9 50,7 22,2 100,0
Q2 2010 Q3 2010 7,5 18,2 53,8 20,5 100,0
Q3 2010 Q4 2010 6,9 15,1 57,9 20,2 100,0
Q4 2010 Q1 2011 7,6 14,4 59,7 18,3 100,0
Q1 2011 Q2 2011 7,6 18,1 53,1 21,3 100,0
Q2 2011 Q3 2011 6,0 15,1 58,0 20,9 100,0
Q3 2011 Q4 2011 6,3 16,5 59,1 18,1 100,0
Q4 2011 Q1 2012 6,2 15,3 58,0 20,5 100,0
Q1 2012 Q2 2012 7,0 15,1 59,1 18,8 100,0
Q2 2012 Q3 2012 7,8 17,0 56,0 19,2 100,0
Q3 2012 Q4 2012 5,9 17,4 57,0 19,8 100,0
Q4 2012 Q1 2013 6,9 15,2 59,5 18,4 100,0
Q1 2013 Q2 2013 6,3 15,3 59,5 18,9 100,0
Q2 2013 Q3 2013 9,7 15,8 56,5 18,0 100,0
Q3 2013 Q4 2013 10,1 16,4 53,2 20,3 100,0
Q4 2013 Q1 2014 8,0 16,0 59,3 16,7 100,0
Q1 2014 Q2 2014 7,9 14,4 60,3 17,4 100,0
Q2 2014 Q3 2014 9,1 12,3 61,5 17,0 100,0
Q3 2014 Q4 2014 8,4 13,4 59,9 18,3 100,0
Q1 2015 Q2 2015 9,7 18,0 51,4 20,9 100,0
Q2 2015 Q3 2015 7,5 19,3 55,4 17,7 100,0
Q3 2015 Q4 2015 8,5 16,4 59,4 15,6 100,0
t+1 status
t status: Other NEA Youth
Employed Unemployed Discouraged Other NEA Total
Per cent
t quarter t+1 quarter
Q1 2010 Q2 2010 1,9 6,4 3,7 88,1 100,0
Q2 2010 Q3 2010 2,0 5,5 3,7 88,8 100,0
Q3 2010 Q4 2010 1,6 4,7 3,8 90,0 100,0
Q4 2010 Q1 2011 2,1 5,9 4,4 87,6 100,0
Q1 2011 Q2 2011 1,7 5,8 4,1 88,4 100,0
Q2 2011 Q3 2011 1,8 5,5 3,6 89,1 100,0
Q3 2011 Q4 2011 1,6 5,3 4,0 89,2 100,0
Q4 2011 Q1 2012 1,8 6,8 4,6 86,8 100,0
Q1 2012 Q2 2012 1,6 5,7 4,0 88,6 100,0
Q2 2012 Q3 2012 1,9 5,7 3,2 89,2 100,0
Q3 2012 Q4 2012 1,5 4,6 3,4 90,5 100,0
Q4 2012 Q1 2013 1,8 6,6 4,0 87,7 100,0
Q1 2013 Q2 2013 1,9 6,2 3,7 88,2 100,0
Q2 2013 Q3 2013 2,2 4,9 3,6 89,3 100,0
Q3 2013 Q4 2013 2,4 4,6 3,5 89,5 100,0
Q4 2013 Q1 2014 2,4 5,9 4,1 87,6 100,0
Q1 2014 Q2 2014 2,1 6,1 3,3 88,4 100,0
Q2 2014 Q3 2014 1,9 5,3 3,3 89,5 100,0
Q3 2014 Q4 2014 1,9 4,3 3,1 90,7 100,0
Q1 2015 Q2 2015 2,2 6,0 4,2 87,6 100,0
Q2 2015 Q3 2015 2,1 6,1 3,2 88,6 100,0
Q3 2015 Q4 2015 1,6 4,7 2,7 91,0 100,0

Statistics South Africa A3-18 02-11-02
Labour market dynamics in South Africa, 2015
Table A5: Quarterly transition rates between different labour market states, for youths (15-34 yrs) and adults (35-64 yrs)
t+1 status
t status: Employed Adults
Employed Unemployed Discouraged Other NEA Total
Per cent
t quarter t+1 quarter
Q1 2010 Q2 2010 94,6 2,2 0,8 2,4 100,0
Q2 2010 Q3 2010 94,6 2,0 0,9 2,5 100,0
Q3 2010 Q4 2010 95,4 1,5 0,7 2,4 100,0
Q4 2010 Q1 2011 94,8 1,8 0,9 2,5 100,0
Q1 2011 Q2 2011 94,5 2,2 0,8 2,5 100,0
Q2 2011 Q3 2011 94,9 2,1 0,8 2,2 100,0
Q3 2011 Q4 2011 95,2 1,9 0,7 2,2 100,0
Q4 2011 Q1 2012 94,6 2,4 0,8 2,3 100,0
Q1 2012 Q2 2012 94,8 1,8 0,9 2,5 100,0
Q2 2012 Q3 2012 95,1 2,2 0,7 2,1 100,0
Q3 2012 Q4 2012 95,1 1,8 0,6 2,5 100,0
Q4 2012 Q1 2013 94,7 2,2 0,8 2,2 100,0
Q1 2013 Q2 2013 94,8 2,0 1,1 2,0 100,0
Q2 2013 Q3 2013 94,1 2,2 1,0 2,7 100,0
Q3 2013 Q4 2013 94,4 2,1 0,9 2,6 100,0
Q4 2013 Q1 2014 94,0 2,6 0,9 2,4 100,0
Q1 2014 Q2 2014 93,8 2,4 1,0 2,8 100,0
Q2 2014 Q3 2014 93,8 2,5 1,2 2,5 100,0
Q3 2014 Q4 2014 94,5 2,0 1,1 2,4 100,0
Q1 2015 Q2 2015 93,3 2,8 1,1 2,9 100,0
Q2 2015 Q3 2015 92,3 3,3 1,2 3,2 100,0
Q3 2015 Q4 2015 94,5 2,1 1,1 2,4 100,0
t+1 status
t status: Unemployed Adults
Employed Unemployed Discouraged Other NEA Total
Per cent
t quarter t+1 quarter
Q1 2010 Q2 2010 14,9 64,1 6,0 15,0 100,0
Q2 2010 Q3 2010 12,6 64,0 6,5 16,9 100,0
Q3 2010 Q4 2010 12,5 64,6 7,1 15,8 100,0
Q4 2010 Q1 2011 13,2 65,9 6,4 14,5 100,0
Q1 2011 Q2 2011 12,2 68,0 5,9 13,9 100,0
Q2 2011 Q3 2011 11,7 64,9 7,8 15,7 100,0
Q3 2011 Q4 2011 13,5 63,0 7,0 16,5 100,0
Q4 2011 Q1 2012 13,3 65,2 8,0 13,5 100,0
Q1 2012 Q2 2012 12,4 67,4 6,2 14,0 100,0
Q2 2012 Q3 2012 15,0 65,5 7,0 12,5 100,0
Q3 2012 Q4 2012 12,4 62,8 7,5 17,3 100,0
Q4 2012 Q1 2013 13,8 64,7 7,0 14,5 100,0
Q1 2013 Q2 2013 14,1 66,1 6,9 12,9 100,0
Q2 2013 Q3 2013 16,1 63,3 6,6 14,0 100,0
Q3 2013 Q4 2013 13,4 67,1 5,1 14,4 100,0
Q4 2013 Q1 2014 14,3 66,2 7,0 12,6 100,0
Q1 2014 Q2 2014 13,6 64,8 7,1 14,4 100,0
Q2 2014 Q3 2014 16,0 61,9 7,7 14,5 100,0
Q3 2014 Q4 2014 15,2 61,4 7,2 16,2 100,0
Q1 2015 Q2 2015 17,5 57,5 8,9 16,1 100,0
Q2 2015 Q3 2015 16,0 62,9 7,7 13,4 100,0
Q3 2015 Q4 2015 14,7 65,2 6,0 14,1 100,0
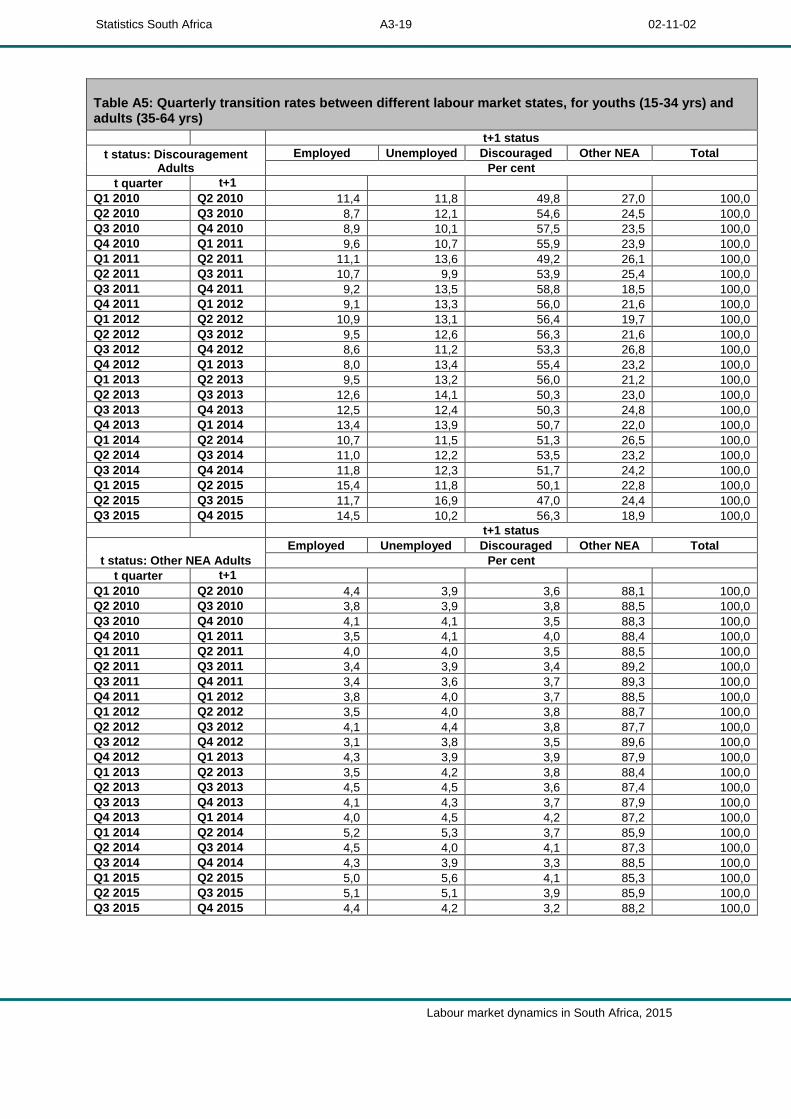
Statistics South Africa A3-19 02-11-02
Labour market dynamics in South Africa, 2015
Table A5: Quarterly transition rates between different labour market states, for youths (15-34 yrs) and adults (35-64 yrs)
t+1 status
t status: Discouragement Adults
Employed Unemployed Discouraged Other NEA Total
Per cent
t quarter t+1 quarter
Q1 2010 Q2 2010 11,4 11,8 49,8 27,0 100,0
Q2 2010 Q3 2010 8,7 12,1 54,6 24,5 100,0
Q3 2010 Q4 2010 8,9 10,1 57,5 23,5 100,0
Q4 2010 Q1 2011 9,6 10,7 55,9 23,9 100,0
Q1 2011 Q2 2011 11,1 13,6 49,2 26,1 100,0
Q2 2011 Q3 2011 10,7 9,9 53,9 25,4 100,0
Q3 2011 Q4 2011 9,2 13,5 58,8 18,5 100,0
Q4 2011 Q1 2012 9,1 13,3 56,0 21,6 100,0
Q1 2012 Q2 2012 10,9 13,1 56,4 19,7 100,0
Q2 2012 Q3 2012 9,5 12,6 56,3 21,6 100,0
Q3 2012 Q4 2012 8,6 11,2 53,3 26,8 100,0
Q4 2012 Q1 2013 8,0 13,4 55,4 23,2 100,0
Q1 2013 Q2 2013 9,5 13,2 56,0 21,2 100,0
Q2 2013 Q3 2013 12,6 14,1 50,3 23,0 100,0
Q3 2013 Q4 2013 12,5 12,4 50,3 24,8 100,0
Q4 2013 Q1 2014 13,4 13,9 50,7 22,0 100,0
Q1 2014 Q2 2014 10,7 11,5 51,3 26,5 100,0
Q2 2014 Q3 2014 11,0 12,2 53,5 23,2 100,0
Q3 2014 Q4 2014 11,8 12,3 51,7 24,2 100,0
Q1 2015 Q2 2015 15,4 11,8 50,1 22,8 100,0
Q2 2015 Q3 2015 11,7 16,9 47,0 24,4 100,0
Q3 2015 Q4 2015 14,5 10,2 56,3 18,9 100,0
t+1 status
t status: Other NEA Adults
Employed Unemployed Discouraged Other NEA Total
Per cent
t quarter t+1 quarter
Q1 2010 Q2 2010 4,4 3,9 3,6 88,1 100,0
Q2 2010 Q3 2010 3,8 3,9 3,8 88,5 100,0
Q3 2010 Q4 2010 4,1 4,1 3,5 88,3 100,0
Q4 2010 Q1 2011 3,5 4,1 4,0 88,4 100,0
Q1 2011 Q2 2011 4,0 4,0 3,5 88,5 100,0
Q2 2011 Q3 2011 3,4 3,9 3,4 89,2 100,0
Q3 2011 Q4 2011 3,4 3,6 3,7 89,3 100,0
Q4 2011 Q1 2012 3,8 4,0 3,7 88,5 100,0
Q1 2012 Q2 2012 3,5 4,0 3,8 88,7 100,0
Q2 2012 Q3 2012 4,1 4,4 3,8 87,7 100,0
Q3 2012 Q4 2012 3,1 3,8 3,5 89,6 100,0
Q4 2012 Q1 2013 4,3 3,9 3,9 87,9 100,0
Q1 2013 Q2 2013 3,5 4,2 3,8 88,4 100,0
Q2 2013 Q3 2013 4,5 4,5 3,6 87,4 100,0
Q3 2013 Q4 2013 4,1 4,3 3,7 87,9 100,0
Q4 2013 Q1 2014 4,0 4,5 4,2 87,2 100,0
Q1 2014 Q2 2014 5,2 5,3 3,7 85,9 100,0
Q2 2014 Q3 2014 4,5 4,0 4,1 87,3 100,0
Q3 2014 Q4 2014 4,3 3,9 3,3 88,5 100,0
Q1 2015 Q2 2015 5,0 5,6 4,1 85,3 100,0
Q2 2015 Q3 2015 5,1 5,1 3,9 85,9 100,0
Q3 2015 Q4 2015 4,4 4,2 3,2 88,2 100,0

Statistics South Africa A3-20 02-11-02
Labour market dynamics in South Africa, 2015
Table A6: Quarterly transition rates between different labour market states, by experience
t+1 status
t status: Unemployed: With experience
Employed Unemployed Discouraged Other NEA Total
Per cent
t quarter t+1 quarter
Q1 2010 Q2 2010 15,5 65,3 6,5 12,6 100,0
Q2 2010 Q3 2010 14,7 63,9 7,3 14,0 100,0
Q3 2010 Q4 2010 13,9 64,7 7,9 13,5 100,0
Q4 2010 Q1 2011 14,2 67,5 6,2 12,1 100,0
Q1 2011 Q2 2011 14,0 68,6 6,5 11,0 100,0
Q2 2011 Q3 2011 14,0 65,3 7,7 13,0 100,0
Q3 2011 Q4 2011 14,1 64,8 7,9 13,1 100,0
Q4 2011 Q1 2012 14,3 66,2 7,8 11,8 100,0
Q1 2012 Q2 2012 13,3 68,2 6,9 11,6 100,0
Q2 2012 Q3 2012 16,1 66,4 7,1 10,5 100,0
Q3 2012 Q4 2012 14,2 66,9 6,4 12,5 100,0
Q4 2012 Q1 2013 15,0 63,5 8,0 13,4 100,0
Q1 2013 Q2 2013 14,6 67,5 6,9 11,0 100,0
Q2 2013 Q3 2013 16,3 65,7 7,4 10,7 100,0
Q3 2013 Q4 2013 15,6 66,5 6,0 11,9 100,0
Q4 2013 Q1 2014 15,4 66,0 7,3 11,4 100,0
Q1 2014 Q2 2014 15,8 64,2 7,9 12,1 100,0
Q2 2014 Q3 2014 15,9 64,8 7,5 11,8 100,0
Q3 2014 Q4 2014 16,1 63,6 7,5 12,9 100,0
Q1 2015 Q2 2015 18,2 61,3 7,7 12,8 100,0
Q2 2015 Q3 2015 17,0 63,9 8,2 11,0 100,0
Q3 2015 Q4 2015 15,6 65,2 7,1 12,1 100,0
t+1 status
t status: Unemployed: Without experience
Employed Unemployed Discouraged Other NEA Total
Per cent
t quarter t+1 quarter
Q1 2010 Q2 2010 6,8 68,8 7,6 16,8 100,0
Q2 2010 Q3 2010 5,1 68,2 8,8 17,9 100,0
Q3 2010 Q4 2010 5,7 69,8 8,8 15,8 100,0
Q4 2010 Q1 2011 6,9 70,9 7,2 15,0 100,0
Q1 2011 Q2 2011 4,6 72,0 6,8 16,6 100,0
Q2 2011 Q3 2011 5,5 70,0 7,2 17,2 100,0
Q3 2011 Q4 2011 6,6 70,9 6,9 15,6 100,0
Q4 2011 Q1 2012 5,6 69,1 8,6 16,6 100,0
Q1 2012 Q2 2012 6,3 69,8 7,6 16,3 100,0
Q2 2012 Q3 2012 7,9 72,4 6,8 12,9 100,0
Q3 2012 Q4 2012 6,3 66,8 7,9 19,1 100,0
Q4 2012 Q1 2013 6,5 68,8 8,5 16,3 100,0
Q1 2013 Q2 2013 6,0 70,8 8,4 14,7 100,0
Q2 2013 Q3 2013 9,2 67,6 8,0 15,2 100,0
Q3 2013 Q4 2013 9,1 70,5 5,8 14,6 100,0
Q4 2013 Q1 2014 7,1 70,7 6,6 15,6 100,0
Q1 2014 Q2 2014 8,6 67,0 6,3 18,0 100,0
Q2 2014 Q3 2014 7,9 67,9 7,9 16,3 100,0
Q3 2014 Q4 2014 7,8 68,6 6,8 16,8 100,0
Q1 2015 Q2 2015 9,2 62,8 9,3 18,6 100,0
Q2 2015 Q3 2015 9,2 68,7 8,3 13,8 100,0
Q3 2015 Q4 2015 8,2 71,0 6,8 13,9 100,0

Statistics South Africa A3-21 02-11-02
Labour market dynamics in South Africa, 2015
Table A7: Quarterly transition rates between different labour market states, by length of unemployment
t status: Long term unemployed
Employed Unemployed Discouraged Other NEA Total
Per cent
t quarter t+1 quarter
Q1 2010 Q2 2010 8,2 70,6 6,9 14,4 100,0
Q2 2010 Q3 2010 7,6 69,2 7,2 16,0 100,0
Q3 2010 Q4 2010 6,8 71,6 7,5 14,1 100,0
Q4 2010 Q1 2011 8,3 72,6 6,3 12,8 100,0
Q1 2011 Q2 2011 6,7 73,2 6,7 13,4 100,0
Q2 2011 Q3 2011 8,2 70,8 6,8 14,2 100,0
Q3 2011 Q4 2011 8,1 70,7 6,7 14,5 100,0
Q4 2011 Q1 2012 7,0 72,3 7,3 13,5 100,0
Q1 2012 Q2 2012 7,5 72,0 6,7 13,7 100,0
Q2 2012 Q3 2012 9,6 72,4 6,4 11,5 100,0
Q3 2012 Q4 2012 7,4 69,6 6,9 16,2 100,0
Q4 2012 Q1 2013 9,2 67,4 7,9 15,4 100,0
Q1 2013 Q2 2013 7,6 71,8 7,4 13,2 100,0
Q2 2013 Q3 2013 10,1 68,9 7,5 13,5 100,0
Q3 2013 Q4 2013 10,1 70,9 5,3 13,6 100,0
Q4 2013 Q1 2014 9,1 71,7 6,7 12,5 100,0
Q1 2014 Q2 2014 9,4 68,9 7,0 14,6 100,0
Q2 2014 Q3 2014 9,1 70,0 7,4 13,4 100,0
Q3 2014 Q4 2014 9,1 69,0 7,1 14,8 100,0
Q1 2015 Q2 2015 12,3 63,1 8,3 16,3 100,0
Q2 2015 Q3 2015 10,1 69,0 8,4 12,6 100,0
Q3 2015 Q4 2015 8,9 71,3 6,6 13,3 100,0
t+1 status
t status: Short term unemployed
Employed Unemployed Discouraged Other NEA
Total
Per cent
t quarter t+1 quarter
Q1 2010 Q2 2010 18,7 59,8 7,2 14,4 100,0
Q2 2010 Q3 2010 15,9 59,8 9,3 15,1 100,0
Q3 2010 Q4 2010 17,3 57,6 9,9 15,3 100,0
Q4 2010 Q1 2011 17,1 61,2 7,2 14,5 100,0
Q1 2011 Q2 2011 17,4 62,9 6,4 13,3 100,0
Q2 2011 Q3 2011 14,8 59,9 9,0 16,4 100,0
Q3 2011 Q4 2011 16,7 60,4 9,3 13,6 100,0
Q4 2011 Q1 2012 18,1 57,1 10,0 14,8 100,0
Q1 2012 Q2 2012 16,0 62,4 8,2 13,4 100,0
Q2 2012 Q3 2012 19,1 61,5 8,1 11,4 100,0
Q3 2012 Q4 2012 17,6 61,4 7,4 13,6 100,0
Q4 2012 Q1 2013 16,1 62,3 8,8 12,8 100,0
Q1 2013 Q2 2013 17,5 63,4 7,8 11,4 100,0
Q2 2013 Q3 2013 19,4 61,9 7,9 10,8 100,0
Q3 2013 Q4 2013 18,7 62,5 7,1 11,7 100,0
Q4 2013 Q1 2014 17,8 60,3 7,7 14,2 100,0
Q1 2014 Q2 2014 19,9 58,1 7,9 14,1 100,0
Q2 2014 Q3 2014 20,0 58,3 8,0 13,6 100,0
Q3 2014 Q4 2014 20,3 58,8 7,5 13,5 100,0
Q1 2015 Q2 2015 19,6 59,8 8,2 12,5 100,0
Q2 2015 Q3 2015 21,4 59,6 7,9 11,1 100,0
Q3 2015 Q4 2015 20,6 59,7 7,9 11,8 100,0

Statistics South Africa A3-22 02-11-02
Labour market dynamics in South Africa, 2015
Table A8: Quarterly distribution of those who found employment by sector
Sector
Employed Formal Informal Agriculture Private hh Total
Quarter Per cent
Q2 2010 43,4 33,2 6,7 16,7 100,0
Q3 2010 43,6 33,9 6,5 15,9 100,0
Q4 2010 42,5 37,0 5,8 14,7 100,0
Q1 2011 44,6 31,6 5,5 18,3 100,0
Q2 2011 46,9 33,7 5,8 13,7 100,0
Q3 2011 48,3 31,9 5,4 14,4 100,0
Q4 2011 49,2 32,0 5,8 13,0 100,0
Q1 2012 48,3 31,8 5,5 14,4 100,0
Q2 2012 49,0 30,5 6,1 14,5 100,0
Q3 2012 49,4 33,5 4,0 13,1 100,0
Q4 2012 49,1 31,8 7,6 11,5 100,0
Q1 2013 49,6 30,2 6,4 13,8 100,0
Q2 2013 49,1 33,6 4,8 12,4 100,0
Q3 2013 46,9 33,5 7,8 11,8 100,0
Q4 2013 51,1 31,7 6,4 10,8 100,0
Q1 2014 50,4 30,0 7,4 12,2 100,0
Q2 2014 48,1 32,2 6,9 12,8 100,0
Q3 2014 46,4 33,6 5,9 14,1 100,0
Q4 2015 49,2 32,0 6,5 12,3 100,0
Q1 2015
Q2 2015 46,3 35,6 5,2 12,8 100,0
Q3 2015 42,7 35,4 7,1 14,7 100,0
Q4 2015 47,6 33,7 6,7 12,0 100,0

Statistics South Africa A3-23 02-11-02
Labour market dynamics in South Africa, 2015
Table A9: Quarterly distribution of those who found employment by sector and level of education
Employed with Primary and less education
Sector
Formal Informal Agriculture & Private hh
Total
Per cent
Quarter
Q2 2010 23,2 39,1 37,7 100,0
Q3 2010 21,4 42,3 36,3 100,0
Q4 2010 23,1 42,6 34,2 100,0
Q1 2011 26,1 32,7 41,2 100,0
Q2 2011 30,0 38,6 31,4 100,0
Q3 2011 33,3 39,8 26,9 100,0
Q4 2011 22,8 37,8 39,4 100,0
Q1 2012 28,4 40,1 31,5 100,0
Q2 2012 22,7 42,1 35,2 100,0
Q3 2012 26,2 40,2 33,6 100,0
Q4 2012 25,6 42,7 31,6 100,0
Q1 2013 21,9 40,7 37,4 100,0
Q2 2013 29,2 43,3 27,5 100,0
Q3 2013 22,6 40,5 36,9 100,0
Q4 2013 26,8 41,3 31,9 100,0
Q1 2014 26,6 31,3 42,1 100,0
Q2 2014 22,8 38,6 38,6 100,0
Q3 2014 25,1 43,3 31,6 100,0
Q4 2014 21,4 41,4 37,2 100,0
Q1 2015
Q2 2015 25,6 38,2 36,2 100,0
Q3 2015 26,8 37,7 35,4 100,0
Q4 2015 27,3 39,3 33,4 100,0
Employed with Secondary not completed
Sector
Formal Informal Agriculture& Private hh
Total
Per cent
Quarter
Q2 2010 42,2 35,7 22,1 100,0
Q3 2010 44,4 35,6 20,0 100,0
Q4 2010 42,1 39,9 18,0 100,0
Q1 2011 41,8 35,3 22,9 100,0
Q2 2011 39,3 38,8 21,9 100,0
Q3 2011 44,5 31,1 24,4 100,0
Q4 2011 41,8 38,2 20,0 100,0
Q1 2012 45,0 33,3 21,8 100,0
Q2 2012 49,4 28,8 21,8 100,0
Q3 2012 46,1 35,5 18,4 100,0
Q4 2012 46,0 32,5 21,5 100,0
Q1 2013 50,4 30,2 19,5 100,0
Q2 2013 45,6 35,0 19,4 100,0
Q3 2013 42,6 37,4 20,0 100,0
Q4 2013 47,3 32,5 20,2 100,0
Q1 2014 49,8 32,3 17,8 100,0
Q2 2014 45,2 33,1 21,7 100,0
Q3 2014 41,5 36,0 22,5 100,0
Q4 2014 44,5 36,8 18,7 100,0
Q1 2015
Q2 2015 43,4 39,1 17,5 100,0
Q3 2015 40,1 36,0 24,0 100,0
Q4 2015 49,9 34,3 21,7 100,0

Statistics South Africa A3-24 02-11-02
Labour market dynamics in South Africa, 2015
Table A9: Quarterly distribution of those who found employment by sector and level of education
Employed with Secondary completed
Sector
Formal Informal Agriculture& Private hh
Total
Per cent
Quarter
Q2 2010 61,9 24,8 13,3 100,0
Q3 2010 58,4 26,5 15,2 100,0
Q4 2010 62,7 25,2 12,1 100,0
Q1 2011 64,6 26,2 9,2 100,0
Q2 2011 71,5 22,0 6,4 100,0
Q3 2011 64,1 27,0 8,9 100,0
Q4 2011 71,5 21,0 7,5 100,0
Q1 2012 68,3 22,9 8,7 100,0
Q2 2012 63,2 24,9 12,0 100,0
Q3 2012 65,3 27,8 7,0 100,0
Q4 2012 67,3 23,1 9,6 100,0
Q1 2013 64,7 25,2 10,1 100,0
Q2 2013 67,4 24,8 7,8 100,0
Q3 2013 66,3 25,5 8,3 100,0
Q4 2013 65,0 28,1 6,9 100,0
Q1 2014 66,4 25,4 8,2 100,0
Q2 2014 63,2 30,6 6,2 100,0
Q3 2014 64,4 25,0 10,6 100,0
Q4 2014 71,1 19,4 9,4 100,0
Q1 2015
Q2 2015 58,9 31,7 9,3 100,0
Q3 2015 57,5 33,3 9,2 100,0
Q4 2015 62,5 31,5 6,1 100,0
Employed with Tertiary
Sector
Formal Informal Agriculture & Private hh
Total
Per cent
Quarter
Q2 2010 67,4 24,0 8,7 100,0
Q3 2010 82,9 14,3 2,8 100,0
Q4 2010 64,1 30,9 4,9 100,0
Q1 2011 72,6 17,7 9,7 100,0
Q2 2011 87,8 12,2 0,0 100,0
Q3 2011 68,2 31,1 0,8 100,0
Q4 2011 78,7 14,9 6,4 100,0
Q1 2012 73,0 22,8 4,2 100,0
Q2 2012 80,3 19,7 0,0 100,0
Q3 2012 78,7 18,9 2,4 100,0
Q4 2012 68,1 27,6 4,3 100,0
Q1 2013 83,0 12,5 4,5 100,0
Q2 2013 78,8 18,8 2,4 100,0
Q3 2013 82,5 12,5 4,9 100,0
Q4 2013 83,2 15,6 1,1 100,0
Q1 2014 73,4 25,6 1,0 100,0
Q2 2014 83,8 16,0 0,3 100,0
Q3 2014 74,9 22,9 2,2 100,0
Q4 2014 75,5 23,7 0,8 100,0
Q1 2015
Q2 2015 75,7 21,1 3,1 100,0
Q3 2015 70,8 29,2 0,0 100,0
Q4 2015 84,2 15,8 0,0 100,0
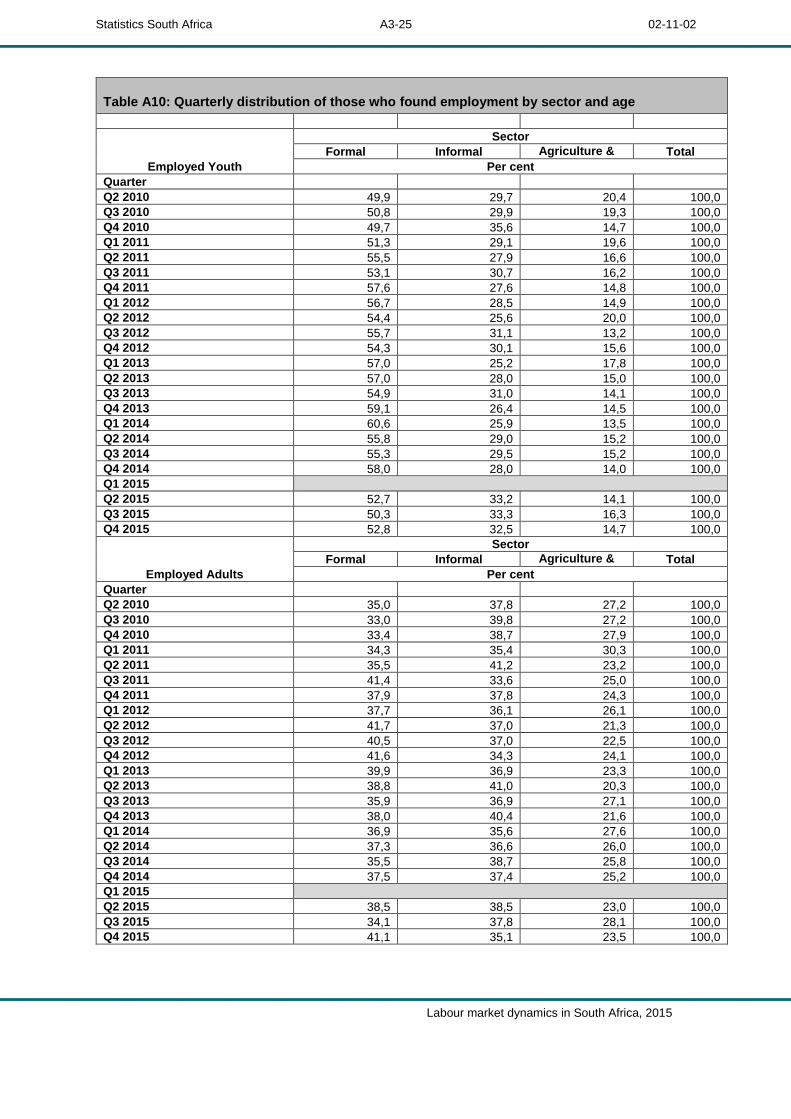
Statistics South Africa A3-25 02-11-02
Labour market dynamics in South Africa, 2015
Table A10: Quarterly distribution of those who found employment by sector and age
Employed Youth
Sector
Formal Informal Agriculture & Private hh
Total
Per cent
Quarter
Q2 2010 49,9 29,7 20,4 100,0
Q3 2010 50,8 29,9 19,3 100,0
Q4 2010 49,7 35,6 14,7 100,0
Q1 2011 51,3 29,1 19,6 100,0
Q2 2011 55,5 27,9 16,6 100,0
Q3 2011 53,1 30,7 16,2 100,0
Q4 2011 57,6 27,6 14,8 100,0
Q1 2012 56,7 28,5 14,9 100,0
Q2 2012 54,4 25,6 20,0 100,0
Q3 2012 55,7 31,1 13,2 100,0
Q4 2012 54,3 30,1 15,6 100,0
Q1 2013 57,0 25,2 17,8 100,0
Q2 2013 57,0 28,0 15,0 100,0
Q3 2013 54,9 31,0 14,1 100,0
Q4 2013 59,1 26,4 14,5 100,0
Q1 2014 60,6 25,9 13,5 100,0
Q2 2014 55,8 29,0 15,2 100,0
Q3 2014 55,3 29,5 15,2 100,0
Q4 2014 58,0 28,0 14,0 100,0
Q1 2015
Q2 2015 52,7 33,2 14,1 100,0
Q3 2015 50,3 33,3 16,3 100,0
Q4 2015 52,8 32,5 14,7 100,0
Employed Adults
Sector
Formal Informal Agriculture & Private hh
Total
Per cent
Quarter
Q2 2010 35,0 37,8 27,2 100,0
Q3 2010 33,0 39,8 27,2 100,0
Q4 2010 33,4 38,7 27,9 100,0
Q1 2011 34,3 35,4 30,3 100,0
Q2 2011 35,5 41,2 23,2 100,0
Q3 2011 41,4 33,6 25,0 100,0
Q4 2011 37,9 37,8 24,3 100,0
Q1 2012 37,7 36,1 26,1 100,0
Q2 2012 41,7 37,0 21,3 100,0
Q3 2012 40,5 37,0 22,5 100,0
Q4 2012 41,6 34,3 24,1 100,0
Q1 2013 39,9 36,9 23,3 100,0
Q2 2013 38,8 41,0 20,3 100,0
Q3 2013 35,9 36,9 27,1 100,0
Q4 2013 38,0 40,4 21,6 100,0
Q1 2014 36,9 35,6 27,6 100,0
Q2 2014 37,3 36,6 26,0 100,0
Q3 2014 35,5 38,7 25,8 100,0
Q4 2014 37,5 37,4 25,2 100,0
Q1 2015
Q2 2015 38,5 38,5 23,0 100,0
Q3 2015 34,1 37,8 28,1 100,0
Q4 2015 41,1 35,1 23,5 100,0

Statistics South Africa A3-26 02-11-02
Labour market dynamics in South Africa, 2015
Table A11: Quarterly distribution of those who found employment by size of firm
Firm size
0-9 employees 10-49 employees >50 employees Don't know Total
Employed Per cent
Quarter
Q2 2010 58,7 17,7 19,1 4,5 100,0
Q3 2010 60,0 19,7 15,8 4,6 100,0
Q4 2010 60,6 18,3 17,0 4,1 100,0
Q1 2011 57,4 20,0 17,6 5,0 100,0
Q2 2011 56,7 21,0 17,6 4,8 100,0
Q3 2011 55,2 19,7 19,5 5,6 100,0
Q4 2011 54,5 21,6 18,4 5,4 100,0
Q1 2012 53,8 20,3 22,0 3,9 100,0
Q2 2012 54,7 21,6 19,8 3,9 100,0
Q3 2012 54,0 19,9 18,3 7,8 100,0
Q4 2012 50,7 22,5 21,2 5,6 100,0
Q1 2013 51,6 23,4 20,3 4,6 100,0
Q2 2013 51,5 24,5 18,3 5,7 100,0
Q3 2013 52,0 23,7 18,2 6,1 100,0
Q4 2013 51,4 20,4 20,8 7,3 100,0
Q1 2014 49,5 22,3 20,0 8,2 100,0
Q2 2014 51,5 21,7 19,5 7,3 100,0
Q3 2014 55,5 18,9 17,3 8,3 100,0
Q4 2014 51,3 22,3 20,9 5,6 100,0
Q1 2015
Q2 2015 53,2 20,4 18,8 7,7 100,0
Q3 2015 56,3 20,9 15,0 7,9 100,0
Q4 2015 52,6 21,5 18,7 7,3 100,0