statsbygg : using bim technology in analysing the eco-footprint of new buildings
TRANSCRIPT

Using BIM technology in analysing the eco-footprint of
new buildings
Bjørne Grimsrud Head of the R & D Department
The Norwegian Public Construction and Property Management

Statsbygg acts on behalf of the Norwegian government as property manager and advisor in construction and property affairs. Property Management
Statsbygg manages approx. 2,6 million m2 of floor space, in Norway and abroad. (annual turnover apx € 400 million)
ConstructionIn total Statsbygg’s annual building budget is approx. NOK 3 billion. (apx.€ 400 million)
ConsultancyStatsbygg offers consultancy and assistance in civil engineering and technical matters to ministries and other governmental organisations.
A presentation by Statsbygg
2

Building Information Modelling Building Information Modelling (BIM) is the process of
generating and managing building data during its life cycle.
Typically it uses three-dimensional, real-time, dynamic building modelling software to increase productivity in building design and construction.
The process produces the Building Information Model (also abbreviated BIM), which encompasses building geometry, spatial relationships, geographic information, and quantities and properties of building components
A presentation by Statsbygg
3

En presentasjon av Statsbygg
Lars Bjørkhaug, Norwegian Building Research Institute Illustrations by : Byggforsk, Olof Granlund, NBLN University of California, Stanford University
Briefing-Functional req.-Estimates-Conditions-Requirements
Knowledge databases-Best practise knowledge-Own practice
Laws and regulations-Building regulations-Building specifications
CAD software-Drawings, calculations-Architect, engineer,…
VRML-Visualisation, 3D models
Simulations-Comfort-Ventilation, heating-Life cycle cost-Light, sound-Insulation-Fire, usage-Environment-Life time predictions
Specifications-Specification sheets-Classification standards-Estimates, accounting
Procurement-Product databases-Price databases
Construction management-Scheduling-Logistics, 4D
Facility management-Letting, sale, operations-Maintenance-Guaranties
Demolition, refurbishment-Rebuild-Demolition-Restoration
Indicates that: •Information is round tripping•That you can work with partial models (extract/enrich/upload)•The information is software independent•Business processes happens in a sequence

Interoperability through standards
En presentasjon av Statsbygg
RD
L (IS
O 1
5926
-4 )
OA
SIS
DE
X
ISO 10303-203, 209, 212, 214, 239,ASD 9300-110
Aeronautics & Space
IFD
Lib
rary
(IS
O 1
2006
-3) ID
M (IS
O TC
59 SC
13)
IFC (ISO 16739)
Built Environment (AEC/FM-BIM)
RD
L (IS
O 1
5926
-4)
DE
X
PLCS (ISO 10303-239),ASD/AIA S1000D,
ADL SCORM
Defense
Term
inol
ogy Process
Digital Storage
RD
L (IS
O 1
5926
-4)
Templates/D
EX
ISO 15926-2
Oil & Gas

Statsbygg's focus on BIM and IFC: Statement from 2007
Statsbygg aims to increase the utility value of its buildings for tenants and users, and aims to significantly reduce construction and operating costs and building damage, through use of BIM based on open, international standards (IFC).
2010 – BIM (IFC) will be the standard carrier of information in ALL our business processes
A presentation by Statsbygg
6

Government clients in the USA (GSA/PBS), Denmark (DECA), Finland (Senate Properties), and Norway (Statsbygg) has signed a joint statement with the intention to support Building Information Modelling (BIM) with Open Standards for public facilities
A presentation by Statsbygg
7

A presentation by Statsbygg
8
Using BIM technology in analysing the eco-footprint

Statsbygg has developed a GHG Accounting Tool www.klimagassregnskap.no (Norwegian only) GHG emission accounting tool for buildings
3 modules today
Holistic Life Cycle Approach - 60 years
Systemizing complex conditions - simple calculations
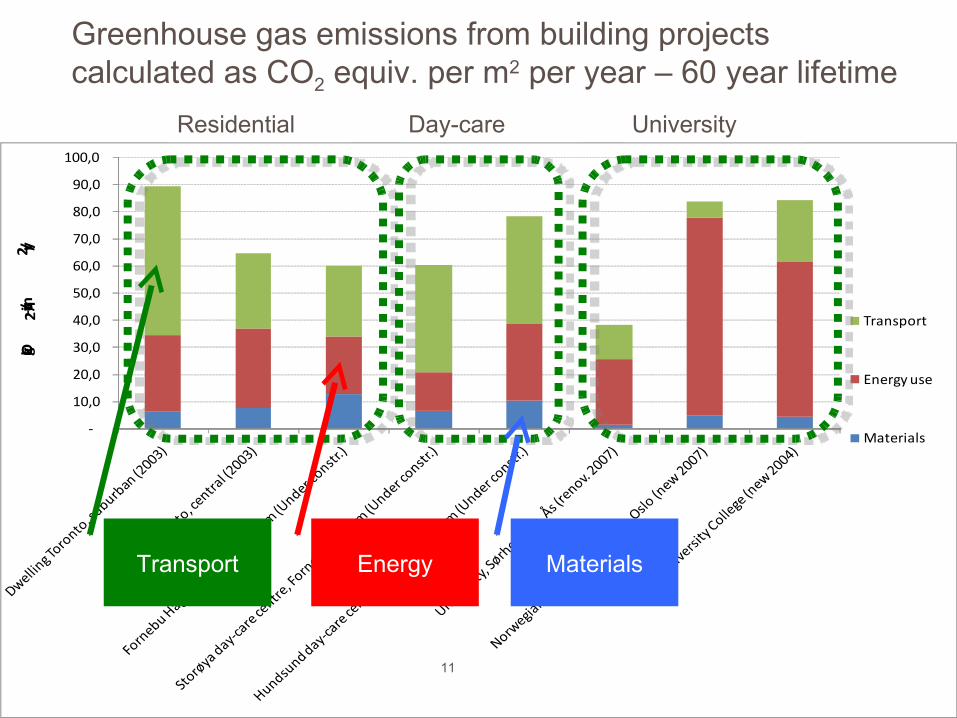
Benchmarking – CO2-eqv./m2
A planning tool to minimize GHG emissions from new buildings

Klimagassregnskap for utbyggingsprosjekter
Demo-liation
Land use changes
The GHG Accounting Tool
-
10,0
20,0
30,0
40,0
50,0
60,0
70,0
80,0
90,0
100,0
kg CO2-
equiv./m2 /yr
Transport
Energy use
Materials
11
Greenhouse gas emissions from building projects calculated as CO2 equiv. per m2 per year – 60 year lifetime
Residential Day-care University
Transport Energy Materials

Information abut the type an amount of the material can be generated from the BIM.
(endres under Vis Topptekst/Bunntekst) PRESENTASJONSNAVN
Ramez Rafat, Statsbygg, 31 mars 2008

A presentation by Statsbygg
13
0123456789
1011121314151617
tonnes of CO2-
eqv./tonne material
Building materials - Embodied Greenhouse Gas Emissionstonnes of CO2-eqv./tonne material
only emissions due to use of fossil fuels and raw materiales includes emissions from electricity used in production
Spikesglass
Alumium – primary and recycled
wood
Polyuretan
concrete
This is combined with generic information on GHG in production

A presentation by Statsbygg
14

15
Hundsund day-care, Material and embodied GHG emissions

Materials5 %
Energy use68 %
Transport 27 %
Bodø University College (in use from 2004)Emission of greenhouse gases - According to main source
Materials21 %
Energy use35 %
Transport 44 %
Fornebu Hage, housing (under construction)Emission of greenhouse gases - According to main source
The relative contribution from materials in a building where energy efficiency has been given priority (Fornebu Hage) and one where it has not (Bodø University College).

Emissions from production of the material quantities
-1 2 3 4 5 6 7 8 9
10 11 12 13 14
kg CO2-
equiv./m2 /yr
Surface treatment
Stairs and balconies
Roofs
Ceilings and floors
Internal walls
Outside walls
Ground and foundations
Load-bearing systems
Basic materials
UniversityDay-care
RenovatedEnvir. fr. materials

GHG - Transport – use phase
Includes transport needs – Personal transport (car or public; bus/metro) and Freight
transport
Amount of trips as a function of:– Type of building (dwellings, hospital, university, e.g.), – Location and distance to city centre services (stores, cinema,
sports, …)– Availability of public transport and parking space (e.g. toll or
not)
Model – Predefined travel length from national and regional travel habit
surveys– Predefined emission factors – national emission inventories +
scenarios for technology improvements

GHG from building projects - transportkg CO2 eq. per m2 per year. “Distances/2”
19
Day-care
Dwellings
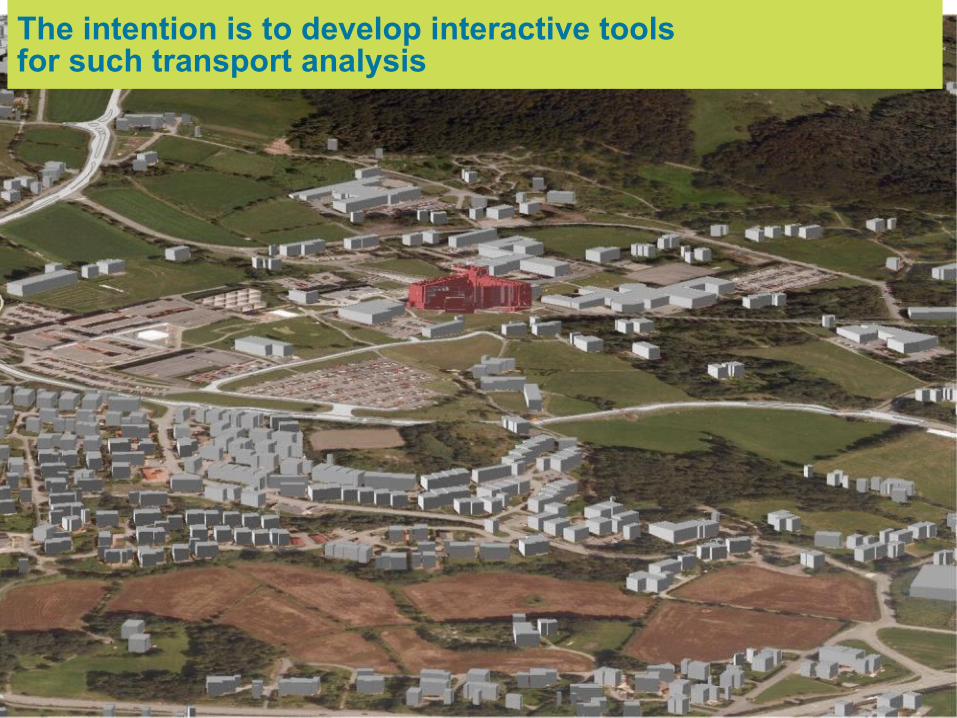
The intention is to develop interactive tools for such transport analysis

GHG - Energy use – use phase
Includes space heating/cooling, warm water, electric appliances
Predefined emissions and efficiency factors Electricity use – default: European OECD nations’
average (2004) of 357 g CO2/kWh , but the users can decide factor
User choose:– m2 building– Building characteristics (residential, non-residential, etc)– climate zone (7 regional zones in Norway)– calculated net energy requirements or measured energy
use– energy sources – oil, NG, bio, DH, El.,..– share of electricity specific consumption– Emission factor for district heating and electricity

GHG from operational energy usekg CO2 eq. per m2 per year
22
357 g/kWh
Electrisity
District heating
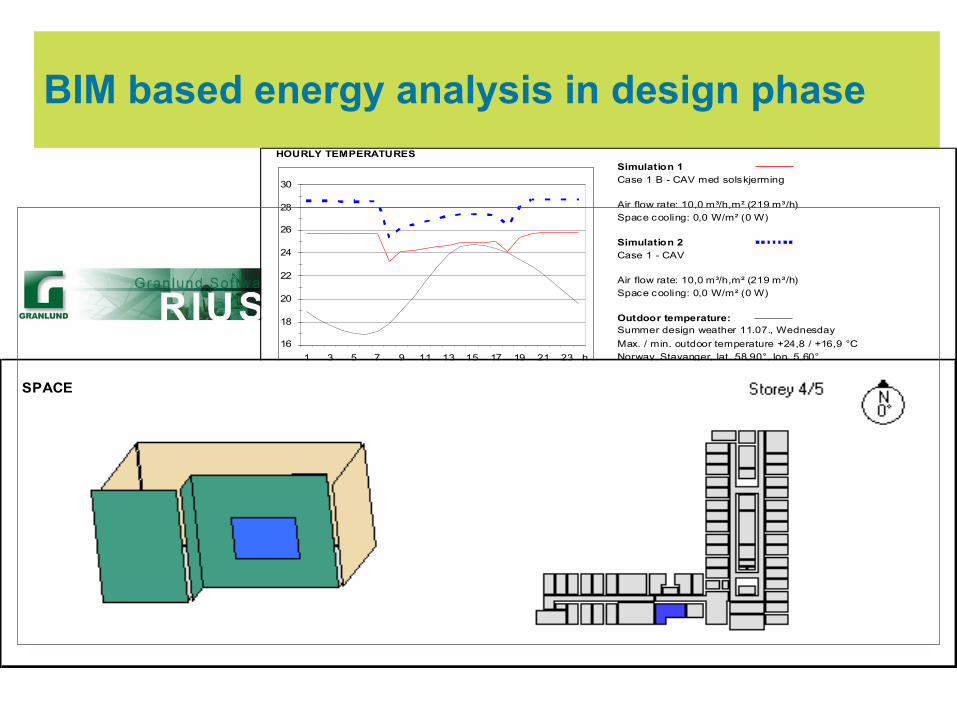
BIM based energy analysis in design phase
BIM i Universitetet i Stavanger
ANNUAL ENERGY CONSUMPTION
MW h NOK kWh/m² kWh/m³ MWh NOK
Lighting electricity 77 38471 24,8 8,2
Equipment electricity 54 27148 17,5 5,8HVAC, cooling electr. 3 1349 0,9 0,3
HVAC, other electr. 43 21530 13,9 4,6
Electricity total 177 88498 57,2 18,8Heating 302 150751 97,4 32
Heating Electricity Facility and user electricity
16 %
11 %
1 %
9 %63 %
16 %
11 %
1 %
9 %63 %
86 %
14 %
Domestic hot waterHeating, spacesHeating, AC system
57 %
43 %
Facility electricityUser electricity
43 %
31 %
2 %
24 %
Lighting electric ityEquipment electricityHVAC, cooling electr.HVAC, other electr.
MONTHLY ENERGY CONSUMPTION
0
10
20
30
40
50
60
70
Lighting electricity 6 5 7 6 7 6 7 7 6 7 7 6
Equipment electricity 5 3 5 5 5 5 5 5 4 5 5 4
HVAC, cooling electr. 0 0 0 0 0 1 1 0 0 0 0 0
HVAC, other electr. 4 3 4 3 4 3 4 4 3 4 4 3
Heating 49 47 41 27 14 6 4 6 10 20 31 47
1 2 3 4 5 6 7 8 9 10 11 12
MWh
ANNUAL ENERGY CONSUMPTION
Simulation 1 Simulation 2
MW h NOK kWh/m² kWh/m³ MWh NOK kWh/m² kW h/m³
Lighting electric ityEquipment electricity
HVAC, cooling electr.
HVAC, other electr.Electricity total
Heating
ENERGY CONSUMPTION
Simulation 1
Simulation 2
ENERGY COST
Simulation 1
Simulation 2
57
73
86
0
519
24
18
1
25
14176
226
3847427148
880
2153088032
113216
7754
2
431457
63
0
519
21
2
43
194
176
880
2153088032
96879
1
119 130
7754
3847427148
2518
86
0 50 100 150 200 250 300 350 400 450
MWh
NOK
0 50000 100000 150000 200000 250000
Heating HVAC, other electr. HVAC, cooling electr. Equipment electric ity Lighting electricity
HOURLY LOADS
Total load W indows Equipment Lighting People Conduction Infiltration
(without windows)
Sim. 1
-10
0
10
20
30
40
1 3 5 7 9 11 13 15 17 19 21 23
W/m2
h
Sim. 2
-10
0
10
20
30
40
1 3 5 7 9 11 13 15 17 19 21 23
W/m2
h
HOURLY TEMPERATURES
Simulation 1
Air flow rate: 10,0 m³/h,m² (219 m³/h)
Space cooling: 0,0 W/m² (0 W)
Simulation 2
Air flow rate: 10,0 m³/h,m² (219 m³/h)
Space cooling: 0,0 W/m² (0 W)
Outdoor temperature:Summer design weather 11.07., Wednesday
Max. / min. outdoor temperature +24,8 / +16,9 °C
Norway, Stavanger, lat. 58,90°, lon. 5,60°
Average space temperature on cooling design day conditions
Case 1 B - CAV med solskjerming
Case 1 - CAV
16
18
20
22
24
26
28
30
1 3 5 7 9 11 13 15 17 19 21 23 h
SPACE

Example of design for low energy use
A presentation by Statsbygg
24

www.klimagassregnskap.no: enables systematic GHG calculations in a holistic,
life-cycle perspective - repeatable• provides new insight into the significance of different
sources of emissions• Basis for Statsbyggs GHG strategy for the future
comparing buildings/cases indicate that:– Choice of energy-efficient design and renewable sources can
reduce energy use and GHG emissions by more than 50 %– Central location can reduced emissions from transport by more
than 50 %– Renovation and reuse of buildings can reduce embodied GHG
emissions by 60–70 % compared with a new building

Klimagassregnskap for utbyggingsprosjekter
Simple living in Norwegian mountains with low GHG emissions per m2!