status and distribution of freshwater mussels (bivalvia ... 2015_felsenthal nwr... · status and...
TRANSCRIPT

STATUS AND DISTRIBUTION OF FRESHWATER MUSSELS (BIVALVIA: UNIONOIDA) INHABITING THE SALINE RIVER WITHIN
FELSENTHAL NATIONAL WILDLIFE REFUGE
Chris L. Davidson
U.S. Fish and Wildlife Service, Arkansas Ecological Services Field Office, Conway, AR 72032
February 2015

1
INTRODUCTION
The Saline River in south central Arkansas has the most diverse and abundant mussel assemblage of any
river west of the Mississippi River. Four federally protected species inhabit the Saline River including
Arkansas Fatmucket (Lampsilis powellii), Pink Mucket (Lampsilis abrupta), Winged Mapleleaf (Quadrula
fragosa), and Rabbitsfoot (Quadrula cylindrica cylindrica). Some of the first comprehensive mussel
surveys of the Saline River (1980s – 1990s) focused on the headwater reaches, including the four forks
and main stem downstream to near the Saline/Grant County line, where Arkansas Fatmucket occurs
(Harris and Gordon 1988, Brown and Brown 1989, Burns and McDonnell 1992a and 1992b, Arkansas
Natural Heritage Commission Database 2014). Prior to 1996, mussel survey effort in the middle and
lower reaches of the Saline River was limited to a few highway crossings that provided easy river access
(Arkansas Natural Heritage Commission Database 2014). Davidson (1997) surveyed and delineated
mussel beds in the lower 18 km of the Saline River that lies within Felsenthal National Wildlife Refuge
(NWR). Davidson and Clem (2002, 2004) provide the first comprehensive survey effort documenting
mussel bed and concentration locations, species composition, and abundance for the 238 km reach of
the Saline River from near Tull, Arkansas, to the northern boundary of Felsenthal NWR.
Davidson and Gosse (2004) and Peck (2010) provide quantitative data for selected mussel beds in the
upper main stem Saline River. In recent years, survey efforts in the Saline River have focused on
determining population estimates and community numeric standing crop for mussel beds in the middle
and lower reaches near Mt. Elba, Arkansas, and between the Arkansas Game and Fish Commission
(AGFC) Longview and Stillions accesses (Harris 2006, U.S. Fish and Wildlife Service [USFWS] unpublished
data). These two reaches have been the focus of resource managers due to the abundant populations
of Pink Mucket, Winged Mapleleaf and Rabbitsfoot.
In 2010 and 2011, AGFC and USFWS conducted post‐2009 flood monitoring of selected beds in the Mt.
Elba and Johnsville reaches. However, there have been no monitoring efforts to reassess the long‐term
(> 10 years) status of mussel beds in the Saline River. Our study presents the first long‐term assessment
(18 years since baseline survey) of mussel bed status in a selected reach (Felsenthal NWR) of the Saline
River. We are providing this information so future conservation efforts, including land management
activities at Felsenthal NWR, can better protect the mussel fauna.
METHODS
Study Area
The Saline River is located in the South Central Plains (Level IV) Ecoregion in south central Arkansas
(Woods et al. 2004). The Saline River flows southward before reaching its confluence with the Ouachita
River near the Arkansas‐Louisiana state line (Figure 1). It is the largest undammed river in the state.
However, the U.S. Army Corps of Engineers operates a series of navigational structures on the lower
Ouachita River. The most downstream structure occurring in Arkansas, Felsenthal Lock and Dam, is
located approximately 21 km downstream of the Saline River confluence with the Ouachita River. This
structure provides a six m lift for 104 km upstream in the Ouachita River and a 1.6 m fish and wildlife

2
pool used to manage the 163 km2 Felsenthal NWR. Physical characteristics in the lower 20 – 25 km of
the Saline River are affected by the lift provided by Felsenthal Lock and Dam.
Figure 1. Location of Saline River study area, 2014.

3
The study area for the Saline River lies within the boundary of Felsenthal NWR. The total drainage basin
is 8,418 km2 (USGS 1979). Channel width varies between 45 – 55 m upstream of the L’Aigle Creek
confluence and becomes wider downstream of the confluence due to the prevalence of side channel
mud flats. During low to moderate flows, the study area contains pools ranging from 3 – 9 m deep. The
substrate is dominated by clay, sand, and gravel with large woody debris and an intact riparian area.
Survey Approach
Davidson (1997) delineated existing mussel beds and provided baseline estimates of species
composition, relative abundance, and population estimates and community numerical standing crop in
the study area. Refuge management expressed an interest in repeating 1996 work completed by
Davidson (1997) to determine status of the existing mussel assemblage. Survey sites were accessed via
boat. Each survey site was sampled using dive techniques and search strategies included hand grubbing.
Surveys were conducted from July 23 – September 17, 2014. Sample methodology for this monitoring
effort uses methods of Harris et al. (1994), Christian (1995), Davidson (1997), and Christian and Harris
(2005). Discharge (flow) was generally greater than the median discharge for the 75 year period of
record during the survey time frame (Figure 2).
Nomenclature follows Turgeon et al. (1998), Inoue et al. (2013), Campbell and Lydeard (2012). The
nomenclature for Quadrula is in flux at this time. We have chosen to reject changes within the Quadrula
genus at this time until there is an empirical analysis of the Quadrula group as a whole.
Initial transect searches of probable mussel habitats were searched from upstream to downstream to
identify and determine the limits of a potential mussel bed. Transect searches generally consisted of an
area extending bank to bank (i.e., wetted channel width) and approximately 60 m in length. Divers
estimated the number of live mussels per m2 by tactile methods. If the number of mussels was ≥ 10
mussels/m2, the diver estimated the width of the bed by traversing the limits in one meter increments.
Additional downstream and upstream “transects” were conducted until the substrate was uninhabited
by mussels or density was < 10 mussels/m2. Total length of a bed was measured using a laser range
finder. Water depth, determined by a depth finder, and substrate type were recorded. Relative
abundance, species composition, and general habitat information were recorded for areas with mussel
densities averaging < 10 mussels/m2, but with no limit as to total area.
Mussel beds were categorized as minor (< 500 m2) or major (> 500 m2). For minor beds (m), five
samples were collected non‐randomly from areas with the greatest density of mussels. For major beds
(M), one m2 quadrat sites were obtained from a random numbers table and applied in an X, Y coordinate
style. Major beds with areas < 2,500 m2 were sampled by removing one percent of the area (e.g., 20
samples for a 2,000 m2 bed), while 25 samples were taken from beds with > 2,500 m2. Mussels within
the quadrat were collected by excavating the substrate and tactily searching through the substrate.
Mussels were placed in a mesh bag and taken to the surface where they were identified, counted, and
returned to the site of collection. We calculated species population estimates and assemblage total
community numeric standing crop using the methods from Sampford (1962), which were identical to
Davidson (1997).

4
Figure 2. Saline River discharge (flow) near Rye, Arkansas, from July 20 – September 19, 2014 (USGS
provisional data,
http://waterdata.usgs.gov/ar/nwis/uv/?site_no=07363500&PARAmeter_cd=00065,00060).
RESULTS
Survey of the 17.4 km of the Saline River required 36 person days to complete. Thirty‐one (31) species
were recorded during the survey. Five species documented by Davidson (1997) were not collected
during this survey. Four species documented during this survey were not collected by Davidson (1997),
including the federally endangered Winged Mapleleaf (Table 1). Davidson (1997) collected one relict
Pink Mucket (federally endangered), while live Pink Mucket individuals were collected during this
survey. Winged Mapleleaf and Pink Mucket were restricted to the river reach upstream of the AGFC
Prairie Island Access.
A total of 13 mussel beds (11 M beds and 2 m beds) were located and delineated and 39 qualitative
transect searches were searched outside of defined beds (Tables 2, 3 and 4A – 4M, Figures 3a – 3f).
Three beds not identified by Davidson (1997) were delineated during this survey (Beds 0m, 6.5M and
7.5M). Mean bed area was 2,101 m2 with a range of 200 – 9,900 m2 (Table 2). Mean density for Mbeds
reported by Davidson (1997) increased for four beds (Beds 1M, 5M, 8M, and 10M) and was similar for

5
Beds 2M, 3M and 6M. Mean density for mbeds reported by Davidson (1997) increased in Bed 9m.
Except for Beds 2m, 5M, and 8M, bed area was larger than areas reported by Davidson (1997).
Table 1. Mussel species (n =35) documented from the Saline River within Felsenthal National Wildlife
Refuge, Arkansas. Asterisk (*) denotes species not found during present survey. Number one (1)
denotes species found in current survey, but not reported from previous surveys.
Species Common Name Actinonaias ligamentina Mucket Amblema plicata Threeridge Anodonta suborbiculata* Flat Floater Ellipsaria lineolata Butterfly Elliptio dilatata Spike Fusconaia flava Wabash Pigtoe Lampsilis abrupta Pink Mucket Lampsilis cardium Plain pocketbook Lampsilis sp. B cf. hydiana Louisiana Fatmucket Lampsilis teres Yellow Sandshell Lasmigona complanata* White Heelsplitter Leptodea fragilis Fragile Papershell Ligumia recta1 Black Sandshell Megalonaias nervosa Washboard Obliquaria reflexa Threehorn Wartyback Obovaria arkansasensis Southern Hickorynut Plectomerus dombeyanus Bankclimber Pleurobema sintoxia1 Round Pigtoe Pleurobema rubrum Pyramid Pigtoe Pleurobema riddelli1 Louisiana Pigtoe Potamilus purpuratus Bleufer Ptychobranchus occidentalis Ouachita Kidneyshell Pyganodon grandis* Giant Floater Quadrula apiculata1 Southern Mapleleaf Quadrula fragosa1 Winged Mapleleaf Quadrula nodulata Wartyback Quadrula metanevra Monkeyface Quadrula nobilis Gulf Mapleleaf Reginaia ebena Ebonyshell Strophitus undulatus Squawfoot Toxolasma lividum Purple Lilliput Tritogonia verrucosa Pistolgrip Truncilla donaciformis* Fawnsfoot Truncilla truncata Deertoe Utterbackia imbecillis* Paper Floater

6
Table 2. Mussel bed location and area in the Saline River within Felsenthal National Wildlife Refuge, 2014.
Site Name Map Label Start End
Bed Width (m2) Bed Area (m2) Latitude Longitude Latitude Longitude
0m* 0m 33.18907 ‐92.13099 33.18892 ‐92.13065 5 200
1M Stratum 1 1M 33.19764 ‐92.13303 33.19755 ‐92.13434 2 260
1M Stratum 2 1M 33.19755 ‐92.13434 33.19744 ‐92.13521 10 900
2M 2m 33.20490 ‐92.12826 33.20412 ‐92.12856 3 270
3M Stratum 1 3M 33.20307 ‐92.13119 33.20214 ‐92.13136 5 475
3M Stratum 2 3M 33.20214 ‐92.13136 33.20124 ‐92.13223 10 1850
4M 4m 33.20586 ‐92.12215 33.20628 ‐92.12280 10 1000
5M 5M 33.21622 ‐92.11717 33.21515 ‐92.11650 20 3200
6M Stratum 1 6M 33.22097 ‐92.11485 33.22029 ‐92.11459 20 1600
6M Stratum 2 6M 33.22029 ‐92.11459 33.21866 ‐92.11477 5 1100
6.5M* 6.5M 33.22342 ‐92.11577 33.22204 ‐92.11626 8 1560
7M 7M 33.22161 ‐92.11000 33.22151 ‐92.11076 10 1300
7.5M* 7.5M 33.22351 ‐92.10917 33.22294 ‐92.10982 10 1200
8M 8M 33.23143 ‐92.08829 33.23143 ‐92.08829 5 1900
9m 9m 33.23283 ‐92.08587 33.23371 ‐92.08556 5 600
10M 10M 33.23506 ‐92.09031 33.23888 ‐92.08618 22 9900
Asterisk (*) denotes mussel bed not identified by Davidson (1997). Upper case “M” denotes major bed (> 500 m2); lower case “m” denotes minor bed (< 500 m2).

7
Table 3. Saline River qualitative mussel survey site locations within Felsenthal National Wildlife Refuge,
2014.
Site Map Label Latitude Longitude
SR 09171409 14‐01 33.179940 ‐92.12901
SR 09171408 14‐02 33.182830 ‐92.13474
SR 09171407 14‐03 33.184200 ‐92.13479
SR 09171406 14‐04 33.182260 ‐92.12849
SR 09171405 14‐05 33.183190 ‐92.12808
SR 09171404 14‐06 33.189040 ‐92.13078
SR 09171403 14‐07 33.188720 ‐92.13271
SR 09161406 14‐08 33.187540 ‐92.13218
SR 09171402 14‐09 33.186410 ‐92.13363
SR 09161405 14‐10 33.186300 ‐92.13419
SR09141401 14‐11 33.186390 ‐92.13512
SR 09161403 14‐12 33.187870 ‐92.13869
SR 09161402 14‐13 33.190900 ‐92.13570
SR 09161404 14‐14 33.188740 ‐92.13837
SR 09161401 14‐15 33.195220 ‐92.13651
SR 09161410 14‐16 33.197640 ‐92.13303
SR 09161409 14‐17 33.197940 ‐92.13267
SR 09161408 14‐18 33.199960 ‐92.13335
SR 09161407 14‐19 33.200940 ‐92.13354
SR 09101404 14‐20 33.204700 ‐92.12830
SR 09101403 14‐21 33.208230 ‐92.12885
SR 09101402 14‐22 33.209350 ‐92.12798
SR 09101401 14‐23 33.209530 ‐92.12718
SR 09091407 14‐24 33.206330 ‐92.12028
SR 09091406 14‐25 33.205320 ‐92.11730
SR 09091404 14‐26 33.206100 ‐92.11585
SR 09091405 14‐27 33.206150 ‐92.11575
SR 09091403 14‐28 33.207200 ‐92.11471
SR 09091402 14‐29 33.208240 ‐92.11399
SR 09091401 14‐30 33.212930 ‐92.11311
SR 07311401 14‐31 33.222690 ‐92.11637
SR 07301401 14‐32 33.223190 ‐92.10965
SR 07251407 14‐33 33.219350 ‐92.10452
SR 07251406 14‐34 33.218630 ‐92.10387
SR 07251405 14‐35 33.219730 ‐92.09998
SR 07251404 14‐36 33.220820 ‐92.09463
SR 07251403 14‐37 33.221550 ‐92.09338
SR 07251402 14‐38 33.223920 ‐92.09202
SR 07251401 14‐39 33.226930 ‐92.08798

8
A total of 8,385 individuals were recorded from M and m beds. Mean species richness for all beds was
16 with a range of 7 – 28 (Tables 4A – 4M), compared to a mean of 15 and range of 7 – 26 in 1996
(Davidson 1997). Mean, minimum and maximum mussel density and relative abundance for each
species for M and m beds is reported in Tables 4A – 4M. Community numeric standing crop for M beds
ranged from 13,900±2,426 (Bed 4M) – 1,004,256±271,786 (Bed 10M).
Five species comprised 80 percent of the total (Table 5). Pimpleback (Quadrula pustulosa) and
Threeridge (Amblema plicata) were the two dominant species comprising 27 and 26 percent of the total,
respectively. Southern Hickorynut (Obovaria arkansesensis), Wabash Pigtoe (Fusconaia flava), and Gulf
Mapleleaf (Quadrula nobilis) comprised the remainder of the 80 percent (17.7, 5.6, and 4.1 percent,
respectively). Two or three species each comprised greater than 10 percent of mussel beds. The
remainder of species in each mussel bed collectively comprised 70 – 89 percent of the total. Thirty‐one
(31) to 63 percent of species present in each mussel bed comprised less than one percent of the total.
Only in one instance (Bed 2m) did a species compose greater than 50 percent of the total community.
Tables 4A – 4M. Physical parameters, species composition, and population and community estimates of
minor and major mussel beds of the Saline River within the Felsenthal National Wildlife Refuge
boundary, Arkansas, 1996 and 2014.
Table 4A. cont’d.
Location: 0m (see Table 2 for latitude/longitude)
1996 2014
Estimated Stratum Area (m2): NA 1.) 5 m x 40 m = 200 m2
1 m2 Quadrats Sampled: NA 5
Min – Max Density (#/m2): NA 11 – 65
Mean Density #/m2 (SD): NA 1.) 33.0 (20.4)
Species 1996 Number Collected
2014 Number Collected
1996 Percent of Total
2014 Percent of Total
1996 Population Estimate
2014 Population Estimate
Amblema plicata NA 68 NA 41.2 NA NC
Fusconaia flava NA 4 NA 2.4 NA NC
Lampsilis sp. B cf. hydiana NA 1 NA 0.6 NA NC
Megalonaias nervosa NA 15 NA 9.1 NA NC
Obliquaria reflexa NA 2 NA 1.2 NA NC
Plectomerus dombeyanus NA 5 NA 3.0 NA NC
Pleurobema sintoxia NA 1 NA 0.6 NA NC
Quadrula apiculata NA 1 NA 0.6 NA NC
Quadrula nobilis NA 24 NA 14.5 NA NC
Quadrula pustulosa NA 42 NA 25.5 NA NC
Reginaia ebena NA 2 NA 1.2 NA NC
Totals NA 165 NA 99.9 NA NC
NA – not applicable
NC – minor bed (< 500 m2), population estimate not calculated
9
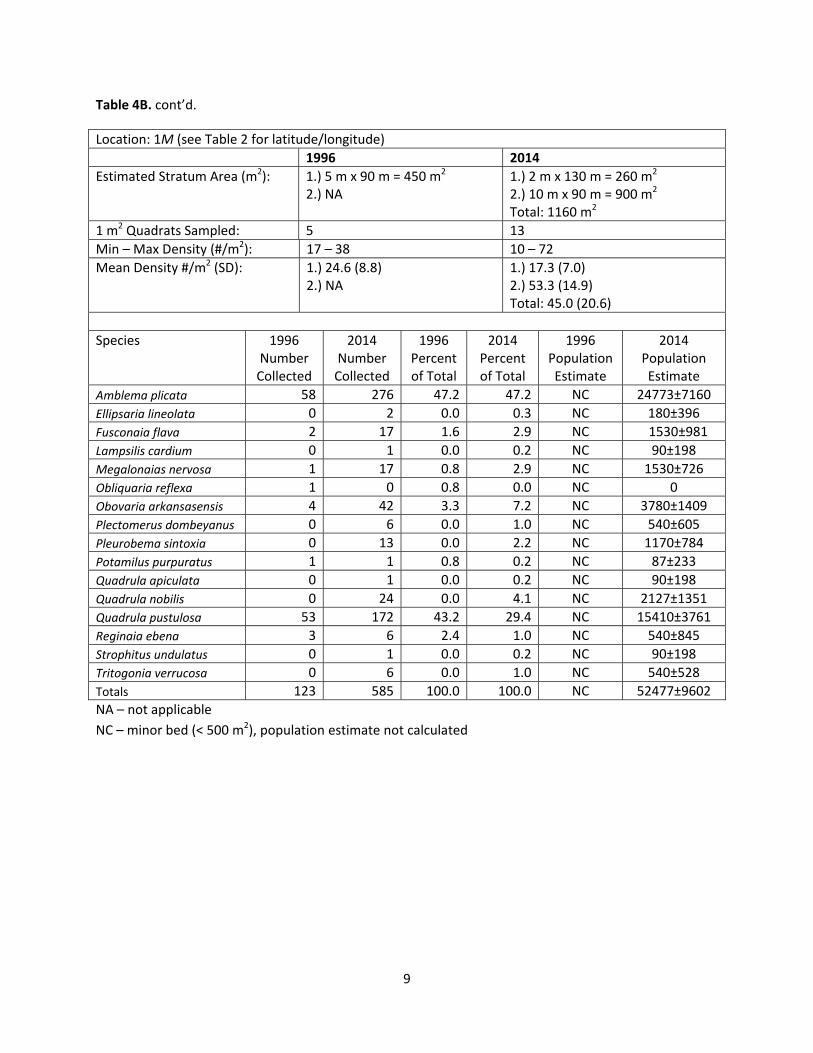
Table 4B. cont’d.
Location: 1M (see Table 2 for latitude/longitude)
1996 2014
Estimated Stratum Area (m2): 1.) 5 m x 90 m = 450 m2 2.) NA
1.) 2 m x 130 m = 260 m2 2.) 10 m x 90 m = 900 m2 Total: 1160 m2
1 m2 Quadrats Sampled: 5 13
Min – Max Density (#/m2): 17 – 38 10 – 72
Mean Density #/m2 (SD): 1.) 24.6 (8.8) 2.) NA
1.) 17.3 (7.0) 2.) 53.3 (14.9) Total: 45.0 (20.6)
Species 1996 Number Collected
2014 Number Collected
1996 Percent of Total
2014 Percent of Total
1996 Population Estimate
2014 Population Estimate
Amblema plicata 58 276 47.2 47.2 NC 24773±7160
Ellipsaria lineolata 0 2 0.0 0.3 NC 180±396
Fusconaia flava 2 17 1.6 2.9 NC 1530±981
Lampsilis cardium 0 1 0.0 0.2 NC 90±198
Megalonaias nervosa 1 17 0.8 2.9 NC 1530±726
Obliquaria reflexa 1 0 0.8 0.0 NC 0
Obovaria arkansasensis 4 42 3.3 7.2 NC 3780±1409
Plectomerus dombeyanus 0 6 0.0 1.0 NC 540±605
Pleurobema sintoxia 0 13 0.0 2.2 NC 1170±784
Potamilus purpuratus 1 1 0.8 0.2 NC 87±233
Quadrula apiculata 0 1 0.0 0.2 NC 90±198
Quadrula nobilis 0 24 0.0 4.1 NC 2127±1351
Quadrula pustulosa 53 172 43.2 29.4 NC 15410±3761
Reginaia ebena 3 6 2.4 1.0 NC 540±845
Strophitus undulatus 0 1 0.0 0.2 NC 90±198
Tritogonia verrucosa 0 6 0.0 1.0 NC 540±528
Totals 123 585 100.0 100.0 NC 52477±9602
NA – not applicable
NC – minor bed (< 500 m2), population estimate not calculated

10
Table 4C. cont’d.
Location: 2m (see Table 2 for latitude/longitude)
1996 2014
Estimated Stratum Area (m2): 1.) 7 m x 65 m = 455 m2 1.) 3 m x 90 m = 270 m2
1 m2 Quadrats Sampled: 5 5
Min – Max Density (#/m2): 10 – 51 10 – 72
Mean Density #/m2 (SD): 1.) 26.6 (16.9) 1.) 27.2 (6.7)
Species 1996 Number Collected
2014 Number Collected
1996 Percent of Total
2014 Percent of
Total
1996 Population Estimate
2014 Population Estimate
Amblema plicata 58 27 43.6 19.8 NC NC
Fusconaia flava 3 0 2.3 0.0 NC NC
Lampsilis sp. B cf. hydiana 1 0 0.8 0.0 NC NC
Lampsilis cardium 2 0 1.5 0.0 NC NC
Lampsilis teres 2 0 1.5 0.0 NC NC
Megalonaias nervosa 1 8 0.8 5.9 NC NC
Obliquaria reflexa 2 0 1.5 0.0 NC NC
Obovaria arkansasensis 6 2 4.5 1.5 NC NC
Plectomerus dombeyanus 8 1 6.0 0.7 NC NC
Potamilus purpuratus 1 0 0.8 0.7 NC NC
Quadrula nobilis 0 19 0.0 14.0 NC NC
Quadrula pustulosa 48 78 36.1 57.3 NC NC
Reginaia ebena 1 1 0.8 0.7 NC NC
Totals 133 136 100.2 100.6 NC NC
NC – minor bed (< 500 m2), population estimate not calculated

11
Table 4D. cont’d.
Location: 3M (see Table 2 for latitude/longitude)
1996 2014
Estimated Stratum Area (m2): 1.) 18 m x 50 m = 900 m2 2.) NA
1.) 5 m x 95 m = 475 m2 2.) 10 m x 185 m = 1850 m2 Total: 2325 m2
1 m2 Quadrats Sampled: 9 23
Min – Max Density (#/m2): 1 – 61 5 – 73
Mean Density #/m2 (SD): 1.) 27.2 (19.8) 2.) NA
1.) 35.6 (21.5) 2.) 26.4 (16.8) Total: 28.4 (18.2)
Species 1996 Number Collected
2014 Number Collected
1996 Percent of Total
2014 Percent of Total
1996 Population Estimate
2014 Population Estimate
Amblema plicata 110 229 44.9 35.0 11000±6993 23077±7440
Ellipsaria lineolata 3 1 1.2 0.2 300±344 103±202
Fusconaia flava 14 22 5.7 3.4 1400±1338 2238±1549
Lampsilis cardium 0 5 0.0 0.8 0 506±494
Lampsilis sp. B cf. hydiana 0 2 0.0 0.3 0 198±260
Lampsilis teres 1 2 0.4 0.3 100±229 198±260
Leptodea fragilis 2 1 0.8 0.2 200±303 103±202
Megalonaias nervosa 3 28 1.2 4.3 300±487 2792±1311
Obliquaria reflexa 3 5 1.2 0.8 300±487 491±383
Obovaria arkansasensis 5 74 2.0 11.3 500±500 7466±3462
Plectomerus dombeyanus 2 28 0.8 4.3 200±303 2722±2314
Pleurobema rubrum 0 3 0.0 0.5 0 308±607
Pleurobema sintoxia 0 15 0.0 2.3 0 1526±1079
Potamilus purpuratus 3 1 1.2 0.2 300±487 103±202 Pyganodon grandis 2 0 0.8 0.0 200±303 0
Quadrula apiculata 0 5 0.0 0.8 0 498±379
Quadrula nobilis 11 31 4.5 4.7 1100±827 3124±1258
Quadrula nodulata 1 1 0.4 0.2 100±229 103±202
Quadrula pustulosa 74 186 30.2 28.4 7400±3606 18759±4137
Reginaia ebena 5 10 2.0 1.5 500±363 1012±770
Tritogonia verrucosa 4 5 1.6 0.8 400±698 498±476
Truncilla truncata 2 0 0.8 0.0 200±303 0
Totals 245 654 99.7 100.3 24500±13600 65832±16254
NA – not applicable
12
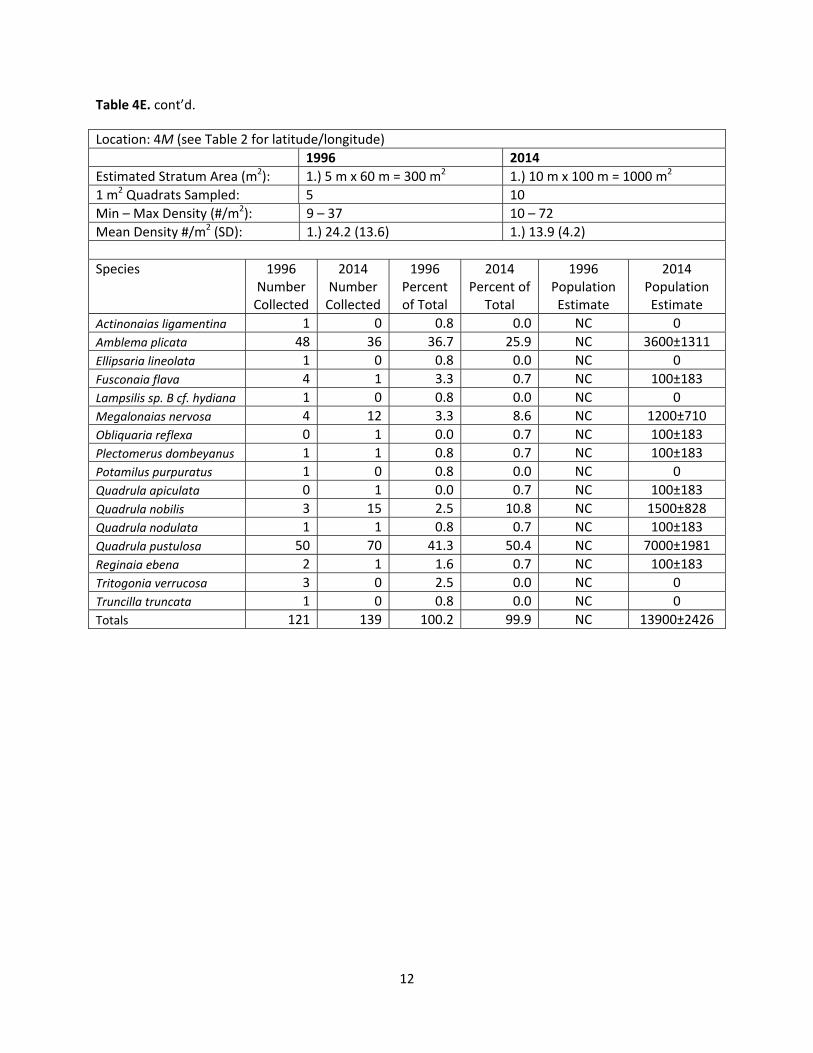
Table 4E. cont’d.
Location: 4M (see Table 2 for latitude/longitude)
1996 2014
Estimated Stratum Area (m2): 1.) 5 m x 60 m = 300 m2 1.) 10 m x 100 m = 1000 m2
1 m2 Quadrats Sampled: 5 10
Min – Max Density (#/m2): 9 – 37 10 – 72
Mean Density #/m2 (SD): 1.) 24.2 (13.6) 1.) 13.9 (4.2)
Species 1996 Number Collected
2014 Number Collected
1996 Percent of Total
2014 Percent of
Total
1996 Population Estimate
2014 Population Estimate
Actinonaias ligamentina 1 0 0.8 0.0 NC 0
Amblema plicata 48 36 36.7 25.9 NC 3600±1311
Ellipsaria lineolata 1 0 0.8 0.0 NC 0
Fusconaia flava 4 1 3.3 0.7 NC 100±183
Lampsilis sp. B cf. hydiana 1 0 0.8 0.0 NC 0
Megalonaias nervosa 4 12 3.3 8.6 NC 1200±710
Obliquaria reflexa 0 1 0.0 0.7 NC 100±183
Plectomerus dombeyanus 1 1 0.8 0.7 NC 100±183
Potamilus purpuratus 1 0 0.8 0.0 NC 0
Quadrula apiculata 0 1 0.0 0.7 NC 100±183
Quadrula nobilis 3 15 2.5 10.8 NC 1500±828
Quadrula nodulata 1 1 0.8 0.7 NC 100±183
Quadrula pustulosa 50 70 41.3 50.4 NC 7000±1981
Reginaia ebena 2 1 1.6 0.7 NC 100±183
Tritogonia verrucosa 3 0 2.5 0.0 NC 0
Truncilla truncata 1 0 0.8 0.0 NC 0
Totals 121 139 100.2 99.9 NC 13900±2426

13
Table 4F. cont’d.
Location: 5M (see Table 2 for latitude/longitude)
1996 2014
Estimated Stratum Area (m2): 1.) 20 m x 90 m = 3200 m2
2.) 10 m x 50 m = 500 m2 Total: 2300 m2
1.) 20 m x 160 m = 3200 m2
2.) NA
1 m2 Quadrats Sampled: 23 25
Min – Max Density (#/m2): 6 – 60 12 – 116
Mean Density #/m2 (SD): 1.) 29.1 (12.2) 2.) 32.0 (19.3) Total: 29.7 (13.6)
1.) 53.4 (26.1) 2.) NA
Species 1996 Number Collected
2014 Number Collected
1996 Percent of Total
2014 Percent of Total
1996 Population Estimate
2014 Population Estimate
Actinonaias ligamentina 1 0 0.1 0.0 100±207 0
Amblema plicata 282 294 41.2 22.0 28200±6678 37632±8057
Ellipsaria lineolata 11 18 1.6 1.3 1100±770 2304±1145
Elliptio dilatata 0 1 0.0 0.1 0 128±224
Fusconaia flava 52 75 7.6 5.6 5200±2103 9600±2929
Lampsilis cardium 4 6 0.6 0.4 400±639 768±1545
Lampsilis sp. B cf. hydiana 0 1 0.0 0.1 0 128±224
Lampsilis teres 0 1 0.0 0.1 0 128±224
Leptodea fragilis 3 2 0.4 0.2 300±335 256±310
Ligumia recta 0 1 0.0 0.1 0 128±224
Megalonaias nervosa 15 36 2.2 2.7 1500±719 4608±1413
Obliquaria reflexa 5 25 0.7 1.9 500±402 3200±1294
Obovaria arkansasensis 10 360 1.5 27.0 1000±570 46080±14135
Plectomerus dombeyanus 7 38 1.0 2.8 700±541 4864±3884
Pleurobema riddellii 0 18 0.0 1.3 0 2304±1666
Pleurobema rubrum 1 13 0.1 1.0 100±207 1664±863
Pleurobema sintoxia 0 82 0.0 6.1 0 10496±2921
Potamilus purpuratus 6 2 0.9 0.2 600±443 256±310
Pyganodon grandis 2 0 0.3 0.0 200±283 0
Pytchobranchus occidentalis 2 0 0.3 0.0 200±283 0
Quadrula apiculata 0 1 0.0 0.1 0 128±224
Quadrula nobilis 18 34 2.6 2.5 1800±838 4352±1581
Quadrula nodulata 0 3 0.0 0.2 0 384±372
Quadrula pustulosa 168 279 24.6 20.9 16800±3782 35712±4010
Reginaia ebena 71 38 10.2 2.8 7100±4640 4864±1715
Tritogonia verrucosa 21 3 3.1 0.2 2100±945 384±372
Truncilla truncata 5 3 0.7 0.2 500±502 384±372
Totals 684 1334 99.9 99.8 24500±13600 170752±29259
NA – not applicable

14
Table 4G. cont’d.
Location: 6M (see Table 2 for latitude/longitude)
1996 2014
Estimated Stratum Area (m2): 1.) 5 m x 85 m = 450 m2
2.) NA 1.) 20 m x 80 m = 1600 m2
2.) 5 m x 220 m = 1100 m2 Total: 2700 m2
1 m2 Quadrats Sampled: 5 25
Min – Max Density (#/m2): 9 – 28 4 – 84
Mean Density #/m2 (SD): 1.) 21.6 (7.4) 2.) NA
1.) 25.6 (21.4) 2.) 19.2 (18.1) Total: 22.9 (19.9)
Species 1996 Number Collected
2014 Number Collected
1996 Percent of Total
2014 Percent of Total
1996 Population Estimate
2014 Population Estimate
Amblema plicata 43 191 39.8 34.7 NC 21619±7700
Ellipsaria lineolata 1 3 0.9 0.5 NC 334±743
Fusconaia flava 6 16 5.6 2.9 NC 1816±1611
Lampsilis cardium 2 3 1.9 0.5 NC 343±326
Leptodea fragilis 1 0 0.9 0.0 0
Megalonaias nervosa 3 9 2.8 1.6 NC 1016±700
Obliquaria reflexa 1 1 0.9 0.2 NC 114±204
Obovaria arkansasensis 7 84 6.5 15.3 NC 9403±8013
Plectomerus dombeyanus 3 20 2.8 3.6 NC 2247±2259
Pleurobema riddellii 0 3 0.0 0.5 NC 330±420
Pleurobema sintoxia 0 5 0.0 0.9 NC 567±657
Potamilus purpuratus 0 6 0.0 1.1 NC 673±663
Quadrula nobilis 4 43 3.7 7.8 NC 4841±1292
Quadrula nodulata 0 1 0.0 0.2 NC 114±647
Quadrula pustulosa 33 147 30.6 26.7 NC 16573±2957
Reginaia ebena 2 17 1.9 3.1 NC 1934±1197
Tritogonia verrucosa 2 0 1.9 0.0 NC 0
Truncilla truncata 0 1 0.0 0.2 NC 110±197
Totals 108 550 100.2 99.8 NC 62034±19445
NA – not applicable
NC – Minor bed (< 500 m2), population estimate not calculated
Note: one Winged Mapleleaf was collected from Bed 6M while delineating bed area.

15
Table 4H. cont’d.
Location: 6.5M (see Table 2 for latitude/longitude)
1996 2014
Estimated Stratum Area (m2): NA 1.) 8 m x 195 m = 1560 m2
1 m2 Quadrats Sampled: NA 16
Min – Max Density (#/m2): NA 9 – 33
Mean Density #/m2 (SD): NA 1.) 18.9 (6.6)
Species 1996 Number Collected
2014 Number Collected
1996 Percent of Total
2014 Percent of Total
1996 Population Estimate
2014 Population Estimate
Amblema plicata NA 100 NA 33.1 NA 9750±2339
Ellipsaria lineolata NA 2 NA 0.7 NA 195±237
Fusconaia flava NA 1 NA 0.3 NA 98±173
Megalonaias nervosa NA 17 NA 5.6 NA 1658±691
Obovaria arkansasensis NA 2 NA 0.7 NA 195±237
Plectomerus dombeyanus NA 5 NA 1.7 NA 488±332
Quadrula apiculata NA 2 NA 0.7 NA 195±237
Quadrula nobilis NA 28 NA 9.3 NA 2730±820
Quadrula nodulata NA 2 NA 0.7 NA 195±237
Quadrula pustulosa NA 133 NA 44.0 NA 12968±2926
Reginaia ebena NA 8 NA 2.6 NA 780±759
Tritogonia verrucosa NA 2 NA 0.7 NA 195±237
Totals NA 302 NA 100.1 NA 29445±4574
NA – not applicable

16
Table 4I. cont’d.
Location: 7M (see Table 2 for latitude/longitude)
1996 2014
Estimated Stratum Area (m2): 1.) 10 m x 100 m = 1000 m2 1.) 10 m x 130 m = 1300 m2
1 m2 Quadrats Sampled: 10 13
Min – Max Density (#/m2): 5 – 74 11 – 47
Mean Density #/m2 (SD): 1.) 29.1 (12.2) 1.) 28.1 (11.8)
Species 1996 Number Collected
2014 Number Collected
1996 Percent of Total
2014 Percent of Total
1996 Population Estimate
2014 Population Estimate
Amblema plicata 114 131 34.8 35.9 11400±7174 13100±5072
Ellipsaria lineolata 6 0 1.8 0.0 600±600 0
Elliptio dilatata 0 1 0.0 0.3 0 100±180
Fusconaia flava 16 5 4.9 1.4 1600±835 500±421
Lampsilis cardium 5 0 1.5 0.0 500±503 0
Lampsilis teres 2 0 0.6 0.0 200±300 0
Leptodea fragilis 2 0 0.6 0.0 200±300 0
Ligumia recta 0 0 0.0 0.0 0 0
Megalonaias nervosa 11 12 3.4 3.3 1100±783 1200±769
Obliquaria reflexa 3 5 0.9 1.7 300±481 500±563
Obovaria arkansasensis 4 2 1.2 0.5 400±368 200±243
Plectomerus dombeyanus 4 1 1.2 0.3 400±368 100±180
Quadrula apiculata 0 6 0.0 0.6 0 600±336
Quadrula nobilis 4 53 1.2 14.5 400±368 5300±1840
Quadrula nodulata 0 5 0.0 1.7 0 500±563
Quadrula pustulosa 117 128 35.6 35.1 11700±5231 12800±2560
Reginaia ebena 24 15 7.3 4.1 2400±1813 1500±910
Tritogonia verrucosa 9 1 2.7 0.3 900±708 100±180
Truncilla truncata 7 0 2.1 0.0 700±825 0
Totals 328 365 99.8 99.7 24500±13600 36500±7638

17
Table 4J. cont’d.
Location: 7.5M (see Table 2 for latitude/longitude)
1996 2014
Estimated Stratum Area (m2): NA 1.) 10 m x 120 m = 1200 m2
1 m2 Quadrats Sampled: NA 12
Min – Max Density (#/m2): NA 16 – 84
Mean Density #/m2 (SD): NA 1.) 43.8 (19.7)
Species 1996 Number Collected
2014 Number Collected
1996 Percent of Total
2014 Percent of Total
1996 Population Estimate
2014 Population Estimate
Amblema plicata NA 109 NA 20.7 NA 10900±4044
Ellipsaria lineolata NA 9 NA 1.7 NA 900±541
Fusconaia flava NA 56 NA 10.6 NA 5600±2615
Lampsilis cardium NA 6 NA 1.1 NA 600±421
Megalonaias nervosa NA 9 NA 1.7 NA 900±659
Obliquaria reflexa NA 9 NA 1.7 NA 900±603
Obovaria arkansasensis NA 35 NA 6.6 NA 3500±2071
Plectomerus dombeyanus NA 5 NA 1.0 NA 500±562
Pleurobema riddellii NA 9 NA 1.7 NA 900±659
Pleurobema rubrum NA 2 NA 0.4 NA 200±243
Pleurobema sintoxia NA 14 NA 2.7 NA 1400±954
Quadrula apiculata NA 1 NA 0.2 NA 100±180
Quadrula nobilis NA 22 NA 4.2 NA 2200±1216
Quadrula pustulosa NA 197 NA 37.5 NA 19700±4174
Reginaia ebena NA 40 NA 7.6 NA 4000±2532
Tritogonia verrucosa NA 3 NA 0.6 NA 300±283
Totals NA 526 NA 100.0 NA 52600±12343
NA – not applicable

18
Table 4K. cont’d.
Location: 8M (see Table 2 for latitude/longitude)
1996 2014
Estimated Stratum Area (m2): 1.) 10 m x 230 m = 2300 m2 1.) 5 m x 380 m = 1900 m2
1 m2 Quadrats Sampled: 23 19
Min – Max Density (#/m2): 5 – 39 10 – 70
Mean Density #/m2 (SD): 1.) 15.3 (9.8) 1.) 34.9 (20.8)
Species 1996 Number Collected
2014 Number Collected
1996 Percent of Total
2014 Percent of Total
1996 Population Estimate
2014 Population Estimate
Amblema plicata 134 184 38.2 27.7 13400±4648 18400±5421
Ellipsaria lineolata 0 7 0.0 1.1 0 700±639
Fusconaia flava 42 32 12.0 4.8 4200±2526 3200±1358
Lampsilis abrupta 0 1 0.0 0.2 0 100±176
Lampsilis sp. B cf. hydiana 3 0 0.9 0.0 300±341 0
Lampsilis cardium 4 2 1.1 0.3 400±486 200±250
Megalonaias nervosa 10 28 2.8 4.2 1000±720 2800±1157
Obliquaria reflexa 6 7 1.7 1.1 600±612 700±459
Obovaria arkansasensis 10 117 2.8 17.6 1000±720 11700±5218
Plectomerus dombeyanus 11 4 3.1 0.6 1100±782 400±322
Pleurobema sintoxia 0 1 0.0 0.2 0 100±176
Ptychobranchus occidentalis 2 0 0.6 0.0 200±285 0
Pleurobema rubrum 2 0 0.6 0.0 200±285 0
Quadrula fragosa 0 1 0.0 0.2 100±176
Quadrula nobilis 5 23 1.4 3.5 500±418 2300±979
Quadrula nodulata 0 3 0.0 0.5 0 300±288
Quadrula pustulosa 102 243 29.1 36.7 10200±3934 24300±4780
Reginaia ebena 10 9 2.8 1.4 1000±780 900±647
Strophitus undulatus 1 0 0.3 0.0 100±205 0
Tritogonia verrucosa 4 1 1.1 0.2 400±486 100±176
Truncilla truncata 5 0 1.4 0.0 500±486 0
Totals 351 663 99.9 100.3 35100±9762 66300±16001

19
Table 4L. cont’d.
Location: 9m (see Table 2 for latitude/longitude)
1996 2014
Estimated Stratum Area (m2): 1.) 5 m x 90 m = 450 m2 1.) 5 m x 120 m = 600 m2
1 m2 Quadrats Sampled: 5 6
Min – Max Density (#/m2): 26 – 50 11 – 115
Mean Density #/m2 (SD): 1.) 39.2 (10.6) 1.) 71.7 (45.8)
Species 1996 Number Collected
2014 Number Collected
1996 Percent of Total
2014 Percent of Total
1996 Population Estimate
2014 Population Estimate
Actinonaias ligamentina 0 1 0.0 0.2 NC NC
Amblema plicata 93 69 47.4 16.0 NC NC
Ellipsaria lineolata 0 4 0.0 0.9 NC NC
Fusconaia flava 20 15 10.2 3.5 NC NC
Lampsilis cardium 3 1 1.5 0.2 NC NC
Leptodea fragilis 2 0 1.0 0.0 NC NC
Megalonaias nervosa 6 2 3.1 0.5 NC NC
Obliquaria reflexa 4 5 2.0 1.2 NC NC
Obovaria arkansasensis 2 167 1.0 38.8 NC NC
Plectomerus dombeyanus 4 3 2.0 0.7 NC NC
Pleurobema riddellii 0 9 0.0 2.1 NC NC
Pleurobema rubrum 0 1 0.0 0.2 NC NC
Pleurobema sintoxia 0 6 0.0 1.4 NC NC
Quadrula apiculata 0 2 0.0 0.5 NC NC
Quadrula fragosa 0 1 0.0 0.2 NC NC
Quadrula nobilis 2 13 1.0 3.0 NC NC
Quadrula pustulosa 53 131 27.0 30.5 NC NC
Reginaia ebena 1 0 0.5 0.0 NC NC
Tritogonia verrucosa 2 0 1.0 0.0 NC NC
Truncilla truncata 4 0 2.0 0.0 NC NC
Totals 196 430 99.7 99.9 NC NC
NC – minor bed (< 500 m2), population estimate not calculated

20
Table 4M. cont’d.
Location: 10M (see Table 2 for latitude/longitude)
1996 2014
Estimated Stratum Area (m2): 1.) 20 m x 130 m = 2600 m2
2.) 20 m x 170 m = 3400 m2 1.) 22 m x 450 m = 9900 m2
1 m2 Quadrats Sampled: 25 25
Min – Max Density (#/m2): 16 – 94 8 – 386
Mean Density #/m2 (SD): 1.) 31.0 (10.2) 2.) 46.1 (21.3); Total: 39.5 (18.6)
1.) 101.4 (78.2)
Species 1996 Number Collected
2014 Number Collected
1996 Percent of Total
2014 Percent of Total
1996 Population Estimate
2014 Population Estimate
Actinonaias ligamentina 7 19 0.7 0.7 1694±1283 7524±3657
Amblema plicata 203 446 20.5 17.6 48781±10435 176616±68560
Ellipsaria lineolata 17 22 1.7 0.9 4077±2627 8712±3662
Elliptio dilatata 3 84 0.3 3.3 729±795 33264±12408
Fusconaia flava 167 229 16.9 9.0 40096±9070 90684±34642
Lampsilis abrupta 0 1 0.0 0.0 0 396±695
Lampsilis sp. B cf. hydiana 8 2 0.8 0.1 1936±1296 792±1391
Lampsilis cardium 15 18 1.5 0.7 3630±2435 7128±3096
Lampsilis teres 9 1 0.9 0.0 2186±1573 396±695
Leptodea fragilis 4 0 0.4 0.0 971±876 0
Megalonaias nervosa 28 48 2.8 1.9 6722±3422 19008±13830
Obliquaria reflexa 10 11 1.7 0.4 2422±1789 4356±2027
Obovaria jacksoniana 14 600 1.4 23.7 3394±2048 237600±58695
Plectomerus dombeyanus 44 109 4.4 4.3 10627±4555 43164±14045
Pleurobema sintoxia 0 65 0.0 2.6 0 25740±14884
Pleurobema riddellii 0 190 0.0 7.5 0 75240±41070
Pleurobema rubrum 69 91 7.0 3.6 16621±7582 36036±12326
Potamilus purpuratus 5 1 0.5 0.0 1214±1183 396±695
Ptychobranchus occidentalis 6 1 0.6 0.0 1457±1591 396±695
Quadrula apiculata 0 6 0.0 0.2 0 2376±1817
Quadrula fragosa 0 3 0.0 0.1 0 1188±1153
Quadrula metanevra 12 6 1.2 0.2 2901±1950 2376±1817
Quadrula nobilis 4 13 0.4 0.5 971±876 5148±3635
Quadrula nodulata 1 0 0.1 0.0 243±498 0
Quadrula pustulosa 257 469 26.0 18.5 61765±16316 185724±42638
Reginaia ebena 48 73 4.9 2.9 11495±4853 28908±12887
Strophitus undulatus 2 3 0.2 0.1 479±679 1188±1153
Toxolasma lividum 0 1 0.0 0.0 0 396±695
Tritogonia verrucosa 24 16 2.4 0.6 5809±3779 6336±3310
Truncilla donaciformis 4 0 0.4 0.0 971±876 0
Truncilla truncata 27 8 2.7 0.3 6544±2911 3168±1935
Utterbackii imbecillis 1 0 0.1 0.0 236±486 0
Totals 989 2536 99.8 99.7 237486±42385 1004256±271786

21
Table 5. Relative abundance, in percent of total, of species from the Saline River, within Felsenthal
National Wildlife Refuge, major and minor mussel beds, 1996 and 2014.
Species 1996 2014
Number of Individuals
Percent of Total
Number of Individuals
Percent of Total
Actinonaias ligamentina 9 0.3 20 0.2
Amblema plicata 1143 34.9 2160 25.8
Ellipsaria lineolata 39 1.2 68 0.8
Elliptio dilatata 3 0.1 86 1.0
Fusconaia flava 326 9.9 473 5.6
Lampsilis abrupta 0 0.0 2 0.0
Lampsilis sp. B cf. hydiana 13 0.4 6 0.1
Lampsilis cardium 35 1.1 42 0.5
Lampsilis teres 14 0.4 4 0.0
Leptodea fragilis 14 0.4 3 0.0
Ligumia recta 0 0.0 1 0.0
Megalonaias nervosa 82 2.5 241 2.9
Obliquaria reflexa 35 1.1 71 0.8
Obovaria arkansasensis 62 1.9 1485 17.7
Plectomerus dombeyanus 84 2.6 226 2.7
Pleurobema sintoxia 0 0.0 187 2.2
Pleurobema riddellii 0 0.0 244 2.9
Pleurobema rubrum 72 2.2 110 1.3
Potamilus purpuratus 17 0.5 10 0.1
Ptychobranchus occidentalis 10 0.3 1 0.0
Pyganodon grandis 4 0.1 0 0.0
Quadrula apiculata 0 0.0 26 0.3
Quadrula fragosa 0 0.0 5 0.1
Quadrula metanevra 12 0.3 6 0.1
Quadrula nobilis 51 1.6 343 4.1
Quadrula nodulata 3 0.1 16 0.2
Quadrula pustulosa 955 29.1 2275 27.1
Reginaia ebena 167 5.1 220 2.6
Strophitus undulatus 3 0.1 4 0.0
Toxolasma lividum 0 0.0 1 0.0 Tritogonia verrucosa 69 2.1 37 0.4
Truncilla donaciformis 4 0.1 0 0.0
Truncilla truncata 51 1.6 12 0.1
Utterbackii imbecillis 1 0.0 0 0.0
Totals 3278 100.0 8385 99.6

22
Figures 3a– 3f. Location of major and minor mussels beds in the Saline River, Felsenthal National
Wildlife Refuge, Arkansas (2014).
Figure 3a. continued.

23
Figure 3b. continued.

24
Figure 3c. continued.

25
Figure 3d. continued.

26
Figure 3e. continued.

27
Figure 3f. continued.
A total of six Winged Mapleleaf and two Pink Mucket individuals were collected from Beds 6M, 8M, 9m,
and 10M (Appendix 1). Mean length of Winged Mapleleaf was 38.6 mm with a range of 29.0 – 46.2 mm.
Length of Pink Mucket individuals were 63.5 and 65.1 mm.
DISCUSSION
The taxonomy for Quadrula, Fusconaia, and Pleurobema species is currently in flux. Davidson (1997)
lumped Round Pigtoe (P. sintoxia) and Louisiana Pigtoe (P. riddelli) with Wabash Pigtoe and Pyramid
Pigtoe (P. rubrum) due to taxonomic uncertainty at the time. Southern Mapleleaf (Q. apiculata) may
have been lumped with Gulf Mapleleaf in 1996. Gulf Mapleleaf was identified as Mapleleaf (Q. quadrula)
in 1996. While these three species appear as new records of occurrence for Felsenthal NWR, they likely
were present, but not identified (due to lumping of taxa), during the 1996 survey.
Mussels vary considerably with respect to their habitat preferences. Four of five species not collected
during this survey prefer sluggish silt (mud) substrate areas in creeks, rivers, and reservoirs. It is not
surprising these species were absent from our survey given our focus on mussel beds in the main
channel. Mussel bed substrate was comprised of gravel with sand. Fawnsfoot (Truncilla donaciformis)
was the only species typically found in gravel dominant substrates not collected during this survey.
Fawnsfoot also was rare (n = 4) in 1996 (Davidson 1997). Black sandshell (Ligumia recta) is widely
distributed throughout the Saline River, but is a new occurrence record for Felsenthal NWR. Winged

28
Mapleleaf is common in the Saline River between AGFC’s Longview and Stillion accesses. Its presence in
Felsenthal NWR is not surprising given the close proximity of the study area to a sizeable population
upstream of the refuge.
Mussel assemblages typically consist of a few dominant, common species and many more less abundant
or rare species (Vaughn 1997). The majority of mussel species (approximately 80%) make up less than
10 percent of mussel beds and a substantial number (approximately 35%) comprise less than one
percent. It is rare for a single species to compose greater than 50 percent of a mussel bed (Haag 2012).
We observed similar results in the 13 mussel beds delineated during this survey.
The five dominant species in this survey comprised 80 percent of the total mussel community.
Compared to Davidson (1997), these same five species comprised 75 percent of the total (Table 5). A
noteworthy increase (approximately 14 percent) in relative abundance occurred with Southern
Hickorynut since 1996. In 1996, Southern Hickorynut was common near the periphery of mussel beds,
typically occurring on descending banks in areas with a greater prevalence of fine substrate particles
(e.g., sand and silt). During this survey, Southern Hickorynut was common throughout the entire bed. It
seems unlikely that fish host abundance played an important role in restructuring the mussel
assemblage since potential fish hosts for Southern Hickorynut include common species such as Bluegill
(Lepomis macrochirus). The substantial increase in Southern Hickorynut abundance may be attributable
to changes in microhabitat conditions (i.e., increase in fine substrate particles), but empirical data is
lacking at this time to support this hypothesis.
Species dominance has been documented to shift in medium to large rivers (e.g., White, Ouachita,
Saline, and Buffalo Rivers) from upstream to downstream reaches as physical characteristics (e.g.,
microhabitat and macrohabitat variables) of the river and host fish presence and abundance change
(Christian 1995; Posey 1997; Davidson and Clem 2002, 2004; Matthews et al. 2010). We observed a
similar community composition shift for species in our study area compared to the river reach
immediately upstream of the refuge (i.e., Johnsville to Stillion). Species routinely collected in the Saline
River between AGFC’s Longview and Stillion accesses (e.g., Spike [Elliptio dilatata], Mucket [Actiononaias
ligamentina], Western Fanshell [Cyprogenia sp. A cf aberti], Monkeyface [Q. metanevra], and
Rabbitsfoot [Q. cylindrica cylindrica]), are notably rare to absent in the study area.
The shift in mussel community composition occurs near the northern boundary of Felsenthal NWR.
Shallow shoal areas common upstream of Felsenthal NWR are absent within the refuge. Construction
and operation of Felsenthal Lock and Dam may partially explain this notable and rather abrupt change in
hydrology. However, it should be noted historical descriptions (e.g., water depth, channel width, maps
of shoals, etc.) of the Saline River within the study are lacking; thus, making it impossible to ascertain
hydrology of the area prior to dam construction.
Bed 4M was the only bed to show a substantial decrease in mean density of mussels compared to
Davidson (1997). Bed 4M was delineated by Davidson (1997) as a mbed. Differences in sampling
methodology for mbeds and Mbeds likely accounts for the difference observed in mean density of Bed
4M. Bed area increased in 70 percent of the beds primarily due to two factors: 1) use of improved

29
(laser) range finders, and 2) more experience by the author delineating mussel beds. While beds may
have expanded or constricted to some degree since 1996, beds appear generally stable with most
differences between 1996 and 2014 bed areas accounted for by the aforementioned factors.
MANAGEMENT CONSIDERATIONS AND MONITORING RECOMMENDATIONS
Protection or improvements in the status of mussels in the Saline River requires proper management of
the watershed and cooperative efforts of stakeholders. The following management and monitoring
recommendations are provided to assist with future refuge management.
1. U.S. Army Corps of Engineers operation and management of Felsenthal Lock and Dam appears
to have altered species richness and abundance in the lower 20 – 25 km of the Saline River.
Efforts focused on summer drawdowns of pool elevation may restore some shoals and increase
species richness and abundance of mussels within the refuge.
2. Collection of baseline sediment composition in mussel beds followed by periodic monitoring of
sediment composition may provide insights into whether influxes of fine sediment loading in the
river are affecting the mussel community.
3. Implementation of best management practices to reduce sediment runoff from construction
sites, county road maintenance, and other land use activities (e.g., forestry) will further improve
water quality and habitat availability in the Saline River. Execution of these management
strategies should improve and/or sustain the quality and quantity of vegetative cover in riparian
areas, decrease siltation, and subsequently improve habitat quality for mussels.
4. Proper management of native mussel resources includes periodic monitoring. Implementation
of a “mussel monitoring program” is needed at Felsenthal NWR to establish and track
population size, demography, recruitment, and status of threatened and endangered mussels
(e.g., Winged Mapleleaf and Pink Mucket), as well as “at‐risk” species. Selected mussel beds
should be quantitatively assessed and monitored at a 10 year interval.
ACKNOWLEDGEMENTS
I thank T. Inebnit, E. Knoll, D. Andrews, and C. Cox for their assistance in the field. R. Eastridge, J. Ertel,
and T. Fotinos helped secure funding for this project. This project was funded by the Service’s Southeast
Region Inventory and Monitoring Network in partnership with Felsenthal NWR and the Arkansas
Ecological Services Field Office. R. Eastridge, M. Stroeh and T. Fotinos provided peer review of this
report.
LITERATURE CITED
Brown, A.V. and K.B. Brown. 1989. Stream inventory of Lampsilis powelli populations on
National Forest lands. Final report submitted to U.S.D.A. Forest Service, Ouachita
National Forest, Hot Springs, AR. 70pp.

30
Burns & McDonnell, Inc. 1992a. Report on surveys for the Arkansas fatmucket mussel.
Prepared for Hope Engineers and the Saline County Rural Development Authority,
Benton, AR.
Burns & McDonnell, Inc. 1992b. Distribution of Arkansas fatmucket mussel (Lampsilis powelli)
in the North Fork of the Saline River. Prepared for Hope Engineers, Benton, AR.
Campbell, D.C. and C. Lydeard. 2012. The genera of Pleurobemini (Bivalvia: Unionidae: Ambleminae).
American Malacological Bulletin 30(1):19‐38.
Christian, A.D. 1995. Analysis of the commercial mussel beds in the Cache and White rivers in Arkansas.
Unpublished M.S. thesis, Arkansas State University, Jonesboro. 197pp.
Christian, A.D., and J.L. Harris. 2005. Development and assessment of a sampling design for mussel
assemblages in large streams. Am. Midl. Nat. 153:284‐292.
Davidson, C.L. 1997. Analysis of mussel beds in the Little Missouri and Saline Rivers, Blue Mountain,
Ozark and Dardanelle Lakes, Arkansas. Unpublished M.S. thesis, Arkansas State University,
Jonesboro. 156pp.
Davidson, C.L., and S.A. Clem. 2002. The freshwater mussel (Bivalvia: Unionacea) resources in a
selected segment of the Saline River: location, species composition and status of mussel beds.
Unpublished report, Arkansas Tech University, Russellville, for The Nature Conservancy, Little Rock,
Arkansas, and Arkansas Game and Fish Commission, Little Rock. 48pp.
Davidson, C.L., and S.A. Clem. 2004. The freshwater mussel (Bivalvia: Unionacea) resources in a selected
segment of the Saline River: location, species composition and status of mussel beds. Addendum 2.
Unpublished report, Arkansas Tech University, Russellville, for the Arkansas Game and Fish
Commission, Little Rock. 23pp.
Davidson, C.L. and D. Gosse. 2004. Status and distribution of freshwater mussels (Unionacea) inhabiting
the Saline River/Holly Creek bottoms area, Saline County, Arkansas. Journal of the Arkansas
Academy of Science 57 (2003):187‐192.
Haag, W.R. 2012. North American freshwater mussels: natural history, ecology, and conservation.
Cambridge University Press, New York, New York.
Harris, J.L. 2006. Quadrula fragosa population estimates at 10 sites in the Ouachita River drainage,
Arkansas. Unpubl. Report submitted to U.S. Fish and Wildlife Service, Arkansas Ecological Services
Field Office. 14pp. + appendix.
Harris, J.L., and M.E. Gordon. 1988. Distribution and status of rare and endangered mussels (Mollusca:
Margaritiferidae, Unionidae) in Arkansas. Journal of the Arkansas Academy of Science 41 (1987):49‐
56.

31
Harris, J.L., P. Rust, S.W. Chordas III, and G.L. Harp. 1994. Distribution and population structure of
freshwater mussels (Unionidae) in Lake Chicot, Arkansas. Proceedings Arkansas Academy of Science
47 (1993):38‐43.
Inoue, K., D.M. Hayes, J.L. Harris, and A.D. Christian. 2013. Phylogenetic and morphometric analyses
reveal ecophenotypic plasticity in freshwater mussels Obovaria jacksoniana and Villosa
arkansasensis (Bivalvia: Unionidae). Ecology and Evolution open access. 14pp.
Matthews, M., F. Usrey, S.W. Hodges, J.L. Harris, and A.D. Christian. 2010. Species richness, distribution,
and relative abundance of freshwater mussels (Bivalvia: Unionidae) of the Buffalo National River,
Arkansas. Journal of the Arkansas Academy of Science 63 (2009):113‐130.
Peck, A.J. 2010. Evaluation of freshwater mussel conservation strategies at multiple scales: macro‐
molecules, behavior, habitat, and policy. Unpubl. pH.D. dissertation, Arkansas State University,
Jonesboro. 439pp.
Posey, W.R., Jr. 1997. Location, species composition, and community estimates for mussel beds in the
St. Francis and Ouachita rivers in Arkansas. Unpublished M.S. thesis, Arkansas State University,
Jonesboro. 178pp.
Sampford, M.R. 1962. An introduction to sampling theory with applications to agriculture. Oliver and
Boyd Ltd., Edinburgh.
Turgeon D.D., J.F. Quinn, Jr, A.E. Bogan, E.V. Coan, F.G. Hochberg, W.G. Lyons, P.M. Mikkelsen, R.J.
Neves, C.F.E. Roper, G. Rosenberg, B. Roth, A. Scheltema, F.G. Thompson, M. Vecchione, and J.D.
Williams. 1998. Common and scientific names of aquatic invertebrates from the United States and
Canada: mollusks, 2nd edition. American Fisheries Society, Special Publication 26, Bethesda,
Maryland. 526pp.
U.S. Geological Survey. 1979. Drainage areas of streams in Arkansas in the Ouachita River basin. U.S.
Geological Survey open file report, Little Rock. 87pp.
Vaughn, C.C. 1997. Regional patterns of mussel species distributions in North American rivers.
Ecography 20:107‐115
Woods A.J., Foti, T.L., Chapman, S.S., Omernik, J.M., Wise, J.A.,Murray, E.O., Prior, W.L., Pagan, J.B., Jr., Comstock, J.A., and Radford, M., 2004, Ecoregions of Arkansas (color poster with map, descriptive text, summary tables, and photographs): Reston, Virginia, U.S. Geological Survey (map scale 1:1,000,000).

Photo 1: Female Pink Mucket collected from Saline
River, Felsenthal National Wildlife Refuge, Arkansas
(2014).
Photo 2: Winged Mapleleaf collected from Saline
River, Felsenthal National Wildlife Refuge,
Arkansas (2014).
Appendix 1