status and trends of mercury in fish tissue in new hampshire … · 2018-11-16 · mercury...
TRANSCRIPT

Status and trends of mercury in fish tissue in New Hampshire waterbodies,
1992–2016
Clement Pond, Hopkinton
November 2018

ii
R-WD-17-22
Status and trends of mercury in fish tissue
in New Hampshire waterbodies, 1992 – 2016
New Hampshire Department of Environmental Services PO Box 95
Concord, NH 03302-3503 (603) 271-8865
Robert R. Scott Commissioner
Eugene J. Forbes, PE
Water Division Director
Ted Diers Watershed Management Bureau Administrator
Prepared by David Neils, Chief Water Pollution Biologist
and Kirsten Nelson, Biologist
In conjunction with Scott Ashley and Walter Henderson
November 2018

iii
TABLE OF CONTENTS 1. INTRODUCTION ................................................................................................................................ 1
Figure 1 – Anthropogenic mercury emissions in the United States, 1990 – 2010 and projected for 2016. Zheng and Jaegl (2013)................................................................................................................................. 2
Table 1 – National and State programs that regulate atmospheric mercury emissions ............................. 3
Table 2 – Primary New Hampshire atmospheric mercury emission sources, 1997 and 2016, NHDES Air Division ......................................................................................................................................................... 4
Figure 2 – Mercury deposition by precipitation in the northeastern United States, 2005-2013. ............... 5
2. METHODS ......................................................................................................................................... 6
2.1 Data Sources .................................................................................................................................. 6
2.2 Laboratory Methods ...................................................................................................................... 6
Map 1 – New Hampshire waterbodies sampled for mercury in fish tissue, 1992 – 2016. .......................... 7
2.3 Data Evaluation ............................................................................................................................. 8
Table 3 – Total mercury concentrations for fish species collected New Hampshire waterbodies. Current analysis (1992-2016 data); 2008 analysis (1992-2007 data) ...................................................................... 10
Table 4 – Mercury in tissue concentrations for fish species collected in New Hampshire with a size-specific consumption advisory; 1992-2016 (current analysis) and 1992-2007 (2008 analysis). Data include only individuals between 20.3 cm (8 in.) - 30.5 cm (12 in.) in total length. .................................. 11
Table 5 – Mean total mercury concentration (mg/kg), 95% confidence intervals, and number of specimens analyzed for select freshwater water fish species greater than 30.5cm total length. ............ 13
3.2 Fish tissue concentrations over time ............................................................................................. 13
Table 6 – Annual mean length-adjusted total mercury concentration (≥5 fish/waterbody; mg Hg /kg fish tissue) in largemouth bass tissue, 1994-2015. ........................................................................................... 14
Figure 4 – Annual mean (+/-1 se) adjusted total mercury concentration in largemouth bass, 1994-2015. .................................................................................................................................................................... 14
Table 7 – Annual mean length-adjusted total mercury concentration (≥5 fish/ waterbody; mg/kg) in yellow perch tissue, 1995-2016. ................................................................................................................ 15
Figure 5 – Annual mean (+/-1 se) adjusted total mercury concentration in yellow perch, 1995 – 2016. Solid line is LOESS smoothed line. .............................................................................................................. 16
Table 8 – Summary of the number and percent of inter-annual and whole waterbody tendencies for adjusted mean total mercury concentrations in the tissue of largemouth bass. ...................................... 16
Table 9 – Summary of the number and percent of inter-annual and whole waterbody tendencies for length-adjusted mean total mercury concentrations in the tissue of yellow perch. ................................. 17
3.3 Geographic patterns .................................................................................................................... 17
Figure 6 – Mean length-adjusted total mercury tissue concentration (+/-1 SE), number of samples, and number of waterbodies sampled by New Hampshire County for yellow perch (a) and largemouth bass (b). .............................................................................................................................................................. 18
Map 2 – Location, number of samples, and mean length-adjusted total mercury tissue category by New Hampshire County in yellow perch, 1992-2016. ........................................................................................ 19

iv
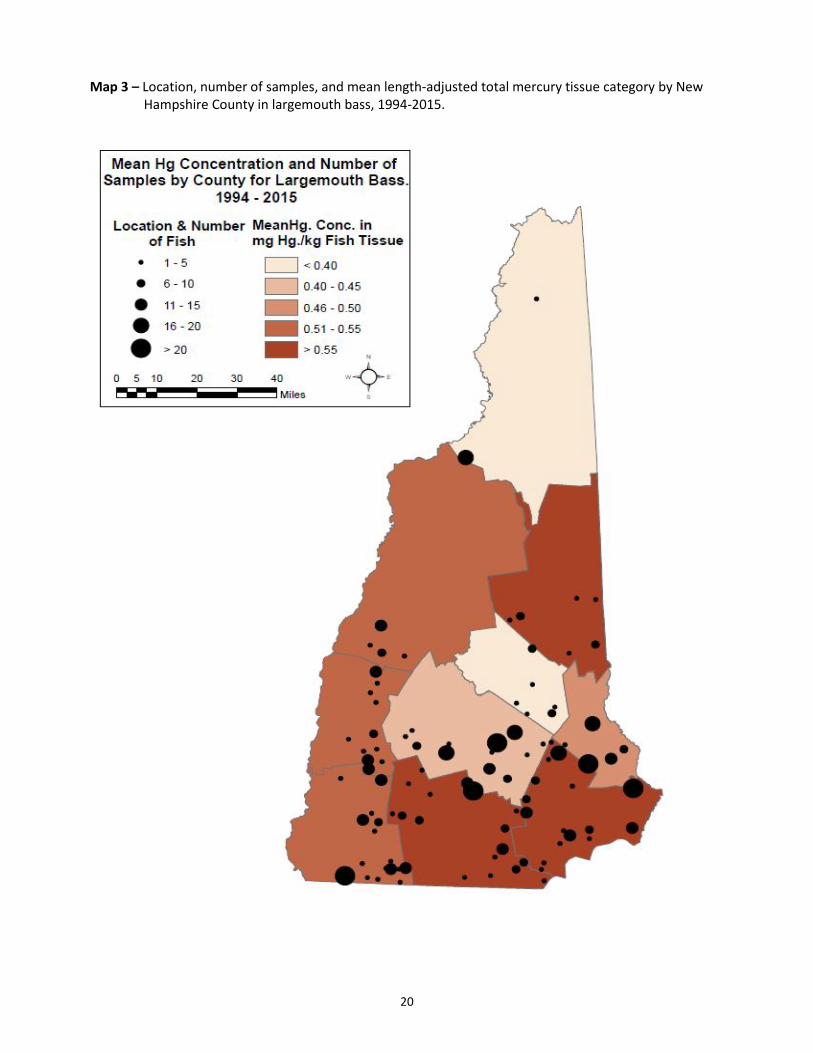
Map 3 – Location, number of samples, and mean length-adjusted total mercury tissue category by New Hampshire County in largemouth bass, 1994-2015. .................................................................................. 20
4. SUMMARY AND RECOMMENDATIONS ........................................................................................... 21
Appendix A – New Hampshire fish consumption guidelines for mercury. ................................................ 30
Appendix B – New Hampshire waterbodies with mercury in fish tissue data sampled through structured and opportunistic sampling efforts, 1992 - 2016. ...................................................................................... 32
Appendix C – Summary of mercury concentrations in largemouth bass for individual waterbodies. (+) indicates an increasing tendency; (-) indicates a decreasing tendency; mean standard error across waterbodies = 0.050. * Applied overall mean standard error to species. ............................................... 43
Appendix D – Summary of mercury concentrations in yellow perch for individual waterbodies. (+) indicates an increasing tendency; (-) indicates a decreasing tendency; mean standard error across waterbodies = 0.052. .................................................................................................................................. 44
Appendix E – Formulas and example calculations of risk-based consumption limit used in New Hampshire fish advisory using average fish concentration assumed by NHDES and EPA-recommended water quality criteria. ................................................................................................................................. 47

1
1. INTRODUCTION The presence of mercury in fish tissue is well documented throughout the United States (Chalmers et al. 2011). High concentrations have been detected in fish that reside in freshwaters of northeastern North America (Kamman et al. 2005). Mercury in fish tissue occurs primarily as methyl-mercury (MeHg), a highly toxic compound to humans. The consumption of fish with high concentrations of methyl-mercury by humans is particularly harmful to the development of the neurological system of unborn and young children, and puts adults at an increased risk of kidney failure, heart attack and compromised immune system (EPA 2010). Thus, monitoring fish to determine the amount of mercury they carry (contaminant burden) is important in assessing the consumptive risk to humans. Mercury also poses a direct threat to the health and long-term survival of aquatic plants and animals (Boening 2000). The concentration of mercury in fish tissue is a result of complex processes, but is ultimately controlled by the amount of mercury available globally. Although mercury occurs naturally, human activities have exacerbated its release into the environment. The primary source of human-generated mercury pollution is via emissions into the atmosphere from burning fossil fuels, medical waste and municipal waste. Mercury deposition is influenced by global, regional and local atmospheric sources, with the highest deposition areas a result of proximity to the emission source(s) as well as the prevailing wind currents. Thus, mercury is found in all precipitation and air samples, even those collected in remote locations. Additionally, mercury persists in the environment for long periods by cycling back and forth between the air and soil surface, all the while changing chemical forms. Atmospheric lifetimes of elemental mercury are estimated to be up to two years, and methyl-mercury is estimated to persist in the soils for decades. Mercury is never removed from the environment; it is just moved to other locations and eventually buried under soils and sediments. Once deposited on the landscape, mercury can be transported to surface waters where it becomes available for assimilation by aquatic organisms (e.g., plants, animals, bacteria). This inorganic mercury is biologically transformed to the more toxic methyl-mercury form via microbial activity that is dependent, in part, on water chemistry, the abundance of wetlands, soil properties and water level management. Methyl-mercury is incorporated into the bodies of aquatic organisms by a process known as bioaccumulation, which is the accumulation of the toxin in the tissues of aquatic organisms as they feed and grow over their lifetimes. As organisms are consumed by predators, the methyl-mercury is transferred, resulting in even higher concentrations for the predators. The end result is that predatory animals at the top of the food chain, in particular popular sport fish, are typically observed to have the highest concentrations of mercury (Kamman et al. 2005, Wentz et al. 2014, Chalmers et al. 2011). In the United States, mercury emissions were estimated to have peaked in the 1970s and have since declined (Driscoll et al. 2007). In the last 25 years, significant progress has been made to reduce non-natural sources of mercury in the environment in an effort to reduce risks to human health and wildlife. Since 1990, atmospheric emissions of mercury in the United States have decreased by about 80% (Figure 1, Zheng and Jaeglé 2013). Several national and state initiatives have been enacted to control the release of mercury into the air (Table 1). In New Hampshire, specifically, estimated atmospheric emissions of mercury were reduced from 1,109 lbs/yr in 1997 to 11.3 lbs/yr in 2016 (Table 2). The reduction in

2
atmospheric emissions of mercury since 1997 in New Hampshire is attributed, in large part, to the cessation of medical waste incineration, the closure of nine out of 10 small solid waste incinerators, and the fact that only one large municipal waste combustion facility remains in operation. In addition, in 2000, the state’s largest source of atmospheric mercury, the Wheelabrator Concord incinerator, installed and made operational a stack-scrubber that reduced mercury emissions of the facility by more than 300 lbs/yr. Lastly, non-atmospheric controls of mercury sources in New Hampshire have included banning the sale of most consumer products containing mercury (e.g., novelty items, thermostats and switches), restricting the disposal of products known to contain mercury, and requiring dental facilities to install amalgam separators.
Figure 1 – Anthropogenic mercury emissions in the United States, 1990 – 2010 and projected for 2016. Zheng and Jaegl (2013)
Mercury deposition is measured by a national atmospheric deposition program called the Mercury Deposition Network (MDN). MDN samples are analyzed for total mercury concentration, while a subset of the samples is analyzed for the more toxic methyl-mercury. Researchers use MDN data to evaluate the role of precipitation as a source of mercury in waterbodies of interest. MDN estimates of mercury deposition by precipitation in the Northeast from 2005 through 2013 indicated that deposition rates ranged between 2-18 µg/m2 (Figure 2).
In 2010 the US Environmental Protection Agency recommended a water quality criterion of 0.30 milligrams of methyl-mercury per kilogram fish tissue (mg/kg) to minimize human health risks (EPA 2010). As a result, fish consumption advisories have been issued in all 50 states, including many that are statewide, regardless of species or waterbody (Wentz et al. 2014). When considered collectively, these advisories cover 16.4 million lake acres and 1.1 million river miles (EPA 2011). In New Hampshire, a statewide fish consumption advisory has been in place since 1994, with revisions in 2001 and 2008

3
(NHDES 2008). The advisory places recommended limits on the number of meals per month that should be consumed and includes statewide guidelines for pregnant and nursing woman, children and adults as well as species- and waterbody-specific restrictions (See Appendix A for full details). The consumption limits are based on a total mercury tissue benchmark concentration of 0.70 mg/kg. Essentially, this assumes that the total mercury concentration of the fish for each meal consumed is 0.70 mg/kg. The end result of using 0.70 mg/kg as a benchmark concentration is that fewer meals are recommended for consumption on a monthly basis than if the EPA criterion were used. Thus, the New Hampshire advisory is conservative and errs on the side of providing ample protection to public health.
Table 1 – National and State programs that regulate atmospheric mercury emissions
Date Goal Sources Effected
1990-present Federal Acid Rain Program
--
Program designed to reduce sulfur and nitrogen emissions from large point sources like power plants. Certain sulfur emission controls also removed a significant amount of mercury from emissions as a co-benefit.
1998-2003 NH 125-C (NH Mercury
Reduction Strategy) 50%
Incineration of municipal solid waste and medical waste, and from the combustion of fossil fuels, such as coal and oil.
2011-2013 NH 125-O (NH Clean Power
Act) 80% Coal burning power plants in New Hampshire. Also mandates
that a scrubber be installed at Merrimack Station in Bow.
2011-2015 Federal MATS rule
90% Oil and coal-fired power plants nationally.
2014-2016 Federal Boiler MACT
Varies
Nationally targets toxic emissions from large (major) industrial, commercial, and institutional boilers and process heaters and small (area) industrial, commercial, and institutional boilers; and commercial and industrial solid waste incineration (CISWI) units.

4
Table 2 – Primary New Hampshire atmospheric mercury emission sources, 1997 and 2016, NHDES Air Division
Town Facility 1997 Mercury
Emissions (Est. Lbs/Yr)
2016 Mercury Emissions
(Est. Lbs/Yr) Large Municipal Waste Combustors
Claremont Wheelabrator Claremont Co., L.P. 154.9 Closed Concord Wheelabrator Concord Co., L.P. 401.6 1.69
Total 556.5 1.69 Small Solid Waste Incinerators
Auburn Town of Auburn Incinerator 5.7 Closed Bridgewater Hebron-Bridgewater SWD 5.5 0.0045 Candia Town of Candia Incinerator 6.7 Closed Lincoln Lincoln/Woodstock SWD 15.0 Closed Litchfield Town of Litchfield Incinerator 4.0 Closed Nottingham Town of Nottingham Incinerator 1.8 Closed Ossipee Town of Ossipee Incinerator 10.9 Closed Pelham Town of Pelham Incinerator 9.3 Closed Sutton Town of Sutton Incinerator 3.4 Closed Wilton Town of Wilton Incinerator 3.2 Closed
Total 65.5 0.0045 Medical Waste Incinerators
Berlin Androscoggin Valley Hospital 1.2 Closed Concord Concord Hospital 35.2 Closed Derry HCA Parkland Medical Center 7.4 Closed Exeter Exeter Hospital 5.2 Closed Hanover Dartmouth Medical School 0.6 Closed Keene The Cheshire Medical Hospital 4.6 Closed Laconia Lakes Region General Hospital 4.0 Closed Lancaster Weeks Memorial Hospital 1.2 Closed Littleton Littleton Regional Hospital 2.1 Closed Manchester Catholic Medical Center 14.4 Closed Elliot Hospital 39.5 Closed Veterans Affairs Medical Center 1.9 Closed Portsmouth HCA Portsmouth Regional Hospital 23.8 Closed
Total 141.1 0.0 Sewage Sludge Incinerators
Manchester 14.3 0.027 Total 14.3 0.027
Coal Fired Power Plants Bow Merrimack Station 259.4 2.21 Portsmouth Schiller Station 67.6 3.33
Total 327.0 5.54 Fuel Oil
#2 Fuel Oil Residential Use 2.7 2.4 #2 Fuel Oil Commercial/Industrial Use 1.0 1.0 #6 Fuel oil Commercial/Industrial Use 1.0 0.6
Total 4.7 4.0 TOTAL EMISSIONS FROM MERCURY SOURCES 1109.1 11.26

5
Figure 2 – Mercury deposition by precipitation in the northeastern United States, 2005-2013. 2013 Mercury
2010 Mercury
2007 Mercury
2011 Mercury
Data collected through the National Atmospheric Deposition Program (NADP): http://nadp.sws.uiuc.edu/mdn/
Until recent years, the Northeastern United States has not seen indications of reduced mercury deposition. Instead, mercury deposition fluctuates from year to year as a function of weather patterns. Given recent state and federal mercury emission regulations and current economics making natural gas combustion a more attractive energy source than mercury-containing coal and oil, mercury emissions and deposition are beginning to decrease. Unfortunately, worldwide emissions of mercury are increasing and some of those emissions are making their way into the United States, including to New Hampshire. The effect of this could slow improvements in our region.
6
In order to evaluate the extent of mercury contamination in freshwater fish species from New Hampshire and, in turn, human health risks, this report examines data from fish tissue collected from 1992-2016 as part of the New Hampshire Department of Environmental Services’ (NHDES) fish tissue mercury monitoring program (FTMMP). The specific objectives of the analyses were to: 1) summarize the data and examine concentrations of individual species with respect to those reported in the 2008 statewide fish advisory technical report; 2) determine the extent of changes in tissue concentrations over time; 3) report on geographic patterns; and 4) make recommendations for modifications to the sampling program. 2. METHODS
2.1 Data Sources Specimens analyzed for the FTMMP were obtained from two primary sources. First, starting in 1992, fish specimens captured primarily by angling were submitted directly to NHDES by citizens. Prior to submission, interested citizens were provided with specific instructions on handling specimens to maintain sample integrity. Once received, samples were frozen until needed for preparation of tissue content analysis. In total, these submissions included 3,262 specimens from 227 waterbodies and 26 fish species. A second, structured sampling effort began in 1998 and included 10 lakes. In each year, two lakes were scheduled for sampling, such that each waterbody was to be sampled twice in a 10-year timeframe. Lakes were selected based on their acidity, water clarity and dissolved oxygen concentrations, as those parameters can influence the amount of methyl-mercury assimilated into fish tissue (Driscoll et al. 2007). For waterbodies included in the structured sampling program, NHDES or New Hampshire Fish and Game Department (NHFG) staff collected fish during night electrofishing surveys that were frozen for later analysis. In total, these sample submissions included 414 individuals that were either largemouth bass (Micropterus salmoides) or yellow perch (Perca flavescens). Overall, the two sources of specimens for analysis provided reasonable distribution of sample points from waterbodies within New Hampshire (Map 1, see Appendix B for list of waterbodies sampled).
2.2 Laboratory Methods Fish were analyzed in the State of New Hampshire Department of Health and Human Services Public Health Laboratory (DHHS-PHL) from 1992-2005 and in the NHDES Jody Connor Limnology Center (JCLC) from 2006-2016. For each individual, fish total length (cm) and weight (g) was recorded and a small section of muscle tissue was removed from above the lateral line in front of the dorsal fin using a clean, stainless steel knife. A tissue sample between 0.1-0.2 g was targeted with the exact weight determined to the nearest 0.001 g.

7
Map 1 – New Hampshire waterbodies sampled for mercury in fish tissue, 1992 – 2016. Mercury cold vapor atomic absorption (EPA method #245.1) was used for all samples with a detection limit of 0.01 mg Hg / kg of fish tissue. Samples processed through the DHHS-PHL utilized a Perkin Elmer Flow Injection Mercury (FIMS) analyzer. Samples processed through the JCLC utilized a Milestone Direct Mercury Analyzer (DMA-80). Sample results were reported as mg Hg / kg of fish tissue wet weight (mg/kg).

8
2.3 Data Evaluation The concentration of total mercury in individual fish species was evaluated using basic statistical summaries that included the calculation of mean and 95% confidence limits (CL). These data were compared to species-specific mercury concentrations included in a 2008 NHDES report on the New Hampshire statewide fish consumption advisory (NHDES 2008). The comparison of the current results versus the results included in the 2008 report was made for two primary reasons; first, to evaluate if the statewide consumption advisory was still warranted and second, to determine if new advisories for individual species were needed. Comparisons of upper 95% CLs (UCLs) were particularly important since they were used as the basis for determining if a revised statewide advisory was necessary and to identify species in need of size restricted consumption limits. (See 2008 report for full explanation of risk-based consumption limits.) Largemouth bass and yellow perch were selected as target species because they are common, distributed statewide and popular for human consumption. For each species, data were inspected for outliers and loge-transformed to improve normality of the data’s distribution. Data were examined for changes in mercury concentration by year (i.e., time series analysis) and for differences among New Hampshire counties (i.e., geographic pattern analysis). The time series analysis did not include fish data from waterbodies containing fewer than five individual fish per waterbody per year to preserve degrees of freedom and reduce variation; however, the geographic pattern analysis included all data minus outliers. For the time series analysis, total mercury concentrations by year were length-adjusted by an analysis of covariance (ANCOVA) using fish length and an interaction between fish length and year as covariates (SAS; Proc Mixed). Waterbody and an interaction between waterbody and year were considered random variables. The final model was: Transformed Mercuryijkl = µ + Yeari + Lengthj + Yeari*Lengthj + Waterbodyk + Yeari*Waterbodyk + Ɛijkl
Annual, a two-year sum, and a three-year sum of precipitation were investigated as random variables; however, these variables accounted for no error and were removed from the final model. An “LSMEANS” statement was used in SAS to acquire the length-adjusted mercury means and their standard error (+/- 1 se) for each year. Two-way nonparametric Mann-Kendall tests (MKT) were conducted for the length-adjusted mercury means in SYSTAT 13 to determine if a significant trend was present (p < 0.05). A LOESS (LOcally weighted regrESSion) smoothing curve was added to provide a year-by-year visual estimate of total length-adjusted mercury tissue concentrations.
For the geographic pattern analyses, total mercury concentrations by county were length-adjusted by an analysis of covariance (ANCOVA) using fish length and an interaction between fish length and year as covariates (SAS; Proc Mixed). Year, waterbody, and an interaction between waterbody and year were considered random variables. The final model was:
Transformed Mercuryijklm = µ + Countyi + Lengthj + Yeark*Lengthj + Yeark + Waterbodyl + Yeark*Waterbodyl + Ɛijklm

9
An “LSMEANS” statement was in used SAS to acquire the length-adjusted mercury means and their standard error (+/- 1 se) for each county. For county-by-county comparisons, length-adjusted mercury concentration means of yellow perch and largemouth bass were plotted by county using simple bar plots. No formal statistical comparisons between counties were made due to the unbalanced nature of the sample collection points (i.e., number of data points per county). The data analysis for geographical patterns represented a gross qualitative assessment and was used to identify broad geographic patterns and data gaps.
For waterbodies sampled as part of the NHDES/NHFG structured sampling effort, tendencies of total mercury concentrations in largemouth bass and yellow perch over time for each waterbody were evaluated using year-to-year (inter-year) comparisons of mean length-adjusted annual mercury concentrations. Although this sampling effort began in 1998, there have been only two to three sampling events on each lake. As a result, a formal trend analysis for each lake was not completed. Instead, inter-year differences in mean length-adjusted total mercury concentrations were tallied either as increasing (+), decreasing (-) or equal (=). Inter-year comparisons were completed for all year-to-year combinations of mean length-adjusted mercury concentrations. For example, if fish tissue samples were collected from an individual lake in 1998, 2003 and 2008, three inter-year comparisons were made (i.e., 1998 to 2003, 1998 to 2008, 2003 to 2008). Inter-year differences of mean length-adjusted mercury concentrations were assigned to one of three levels of severity: 1) greater than or equal to the laboratory detection limit (minimal); 2) greater than or equal to 1 standard error (moderate); 3) greater than or equal to 2 standard errors (large). For the purposes of consistency, a mean standard error for each species was computed from the standard errors of individual waterbodies from each year of sampling. The mean standard error for each respective species was then used to identify the severity of the difference in total mercury concentrations between years. Lastly, an overall waterbody tendency in total mercury concentration was determined as increasing [all inter-year differences positive (+)], decreasing [all inter-year differences negative (-)] or mixed [inter-year differences (+) and (-)]. The determination of the overall waterbody tendency was based on the threshold established for the “minimal” level of severity of inter-year differences (e.g., lab detection limit).
3. RESULTS 3.1 Fish consumption guidelines A total of 4,100 individuals from 26 freshwater fish species were included in the current analysis of total mercury in fish tissue. The combined mean total mercury concentration across all fish species was 0.36 mg/kg (95% CL +/-0.09) with mean concentrations for individual species ranging from 0.07 to 0.67 mg/kg (Table 3). Of those species where a direct comparison between the current analysis and the 2008 report was possible, five had higher and seven had lower mean concentrations. Species observed to have concentration increases greater than 0.10 mg/kg were northern pike, walleye and lake trout. Only yellow bullhead was observed to have decreased in mean concentration greater than 0.10 mg/kg.

10
Table 3 – Total mercury concentrations for fish species collected New Hampshire waterbodies. Current analysis (1992-2016 data); 2008 analysis (1992-2007 data)
Species Common Name
Current vs. 2008 mean
Current analysis 2008 analysis
Mean Hg (mg/kg)
Mean Length (cm)
Hg 95% UCL N
Mean Hg (mg/kg)
Mean Length
(cm)
Upper 95% CI N
Alosa pseudoharengus Alewife = 0.20 27.0 N/A 3 0.2 27.9 ----- 3
Ambloplites rupestris Rock bass - 0.34 20.6 0.41 21 0.32 20.3 0.39 12
Ameiursus natalis* Yellow bullhead - 0.43 23.2 0.73 10 0.54 22.9 ----- 7
Ameiurus nebulosus Brown bullhead - 0.15 22.0 0.18 152 0.23 25.4 0.27 65 Catostomus commersonii White sucker - 0.23 41.1 0.28 52 0.31 40.6 0.35 55
Coregonus clupeaformis Lake whitefish N/A 0.10 44.0 N/A 1 NS
Esox lucius Northern pike + 0.60 79.8 N/A 2 0.5 78.7 ----- 4
Esox niger*# Eastern chain pickerel N/A 0.64 42.1 0.70 253 See Table 4
Lepomis sp. Sunfish - 0.19 17.9 0.26 13 0.27 20.3 ----- 5
Lepomis gibbosus Pumpkinseed = 0.27 18.4 0.32 57 0.27 17.8 0.33 15
Lepomis macrochirus Bluegill - 0.29 19.9 0.34 29 0.3 17.8 0.38 13
Lota lota Cusk - 0.31 62.7 0.35 29 0.35 61 0.42 22 Micropterus dolomieu*# Smallmouth bass N/A 0.67 31.4 0.71 411 See Table 4
Micropterus salmoides# Largemouth bass N/A 0.56 31.8 0.59 632 See Table 4
Morone americana# White perch N/A 0.49 26.2 0.53 210 See Table 4 Notemigonus crysoleucas Golden shiner N/A 0.15 21.5 N/A 1 NS
Oncorhynchus mykiss Rainbow trout N/A 0.08 35.0 0.09 300 NS
Osmerus mordax smelt N/A 0.17 10.5 N/A 1 NS
Perca flavescens# Yellow perch N/A 0.35 20.9 0.36 1659 See Table 4 Pomoxis nigromaculatus Black crappie + 0.44 28.5 0.50 59 0.4 25.4 0.48 42
Salmo salar Atlantic salmon N/A 0.23 42.9 0.27 28 NS
Salmo trutta Brown trout N/A 0.11 27.5 N/A 8 NS
Salvelinus fontinalis Brook trout N/A 0.07 24.0 0.10 91 NS
Salvelinus namaycush Lake trout + 0.44 56.6 0.63 40 0.3 53.3 0.36 18
Sander vitreus* Walleye + 0.66 39.3 0.86 11 0.48 35.6 ----- 5
Semotilus corporalis Fallfish + 0.36 24.6 0.43 27 0.33 22.9 0.38 24
All Species 0.33 32.3 0.43 4,100 Commonly Consumed Species 0.36 33.0 0.44 3,995
Commonly consumed species are emboldened; * species with 95% UCL = /> 0.70 mg / kg; # species-specific consumption advisory applies; NS = no sample. The New Hampshire statewide freshwater fish consumption advisory, as reported in the 2008 report, is 1 meal (8 oz.) per month for sensitive individuals (woman who are, or may become, pregnant and children under age 7) and 4 meals (total 28 oz.) for adults (Appendix A). The number of meals recommended for

11
consumption on a monthly basis in the 2008 advisory corresponds to a fish tissue total mercury concentration of 0.70 mg/kg (benchmark concentration). In the 2008 report, individual species with an upper 95% CL below 0.70 mg/kg of fish tissue were used to indicate that the current statewide advisory would still be protective of human health, while species with 95% UCL concentrations above this level would indicate a potential need for revision. By definition, individual species with a 95% UCL lower than 0.70 mg/kg provides a 95% assurance that the mean total mercury concentration of repeated samples would be below the benchmark concentration, and thus, within current guidelines for freshwater fish consumption. Conversely, 95% UCLs greater than 0.70 mg/kg for individual species indicates that there is a greater than 5% chance that the mean of repeated samples is above the benchmark concentration, and thus, there is a potential for the ingestion of an amount of mercury that is not protective of human health. Of the 26 species reported included in the current analysis, four (yellow bullhead, eastern chain pickerel, smallmouth bass and walleye) had mean tissue concentrations of total mercury with 95% UCLs above or equal to 0.70 mg/kg (Table 3). In addition, two other species (lake trout and largemouth bass) had 95% UCLs of their respective means that were near 0.70 mg/kg (0.63 and 0.59 mg/kg respectively). Yellow bullhead, walleye and lake trout are not currently covered under species-specific consumption advisories and should be considered further (see below). For the remainder of the species, the current statewide advisory would still be protective of human health. Statewide species-specific consumptive advisories are currently in effect for smallmouth bass, largemouth bass, eastern chain pickerel, yellow perch and white perch. The advisories recommend that only individuals less than 30.5cm (12in.) in length be consumed at a rate consistent with the statewide guidelines for all other freshwater species. For comparison to the 2008 report, total mercury concentrations for individuals from 20.3cm (8in.)-30.5cm (12in.) in length were summarized for each of the size-restricted species (Table 4). All five species had mercury concentrations similar to those reported in 2008. More importantly, the 95% UCL of the mean total mercury concentration for each species remained well below 0.70 mg/kg. Thus, the current statewide advisory would still be protective of human health as long as individuals of these species are consumed within the recommended size range.
Table 4 – Mercury in tissue concentrations for fish species collected in New Hampshire with a size-specific consumption advisory; 1992-2016 (current analysis) and 1992-2007 (2008 analysis). Data include only individuals between 20.3 cm (8 in.) - 30.5 cm (12 in.) in total length.
Species Common Name Current Analysis 2008 Analysis
Mean 95% LCL
95% UCL N Mean 95%
UCL N
Morone americana White Perch 0.45 0.40 0.49 151 0.51 0.57 64 Micropterus dolomieu Smallmouth bass 0.43 0.39 0.47 186 0.43 0.48 89
Esox niger Eastern Chain pickerel 0.33 0.26 0.39 39 0.32 0.49 29
Micropterus salmoides Largemouth bass 0.39 0.37 0.42 245 0.38 0.41 121 Perca flavescens Yellow perch 0.41 0.39 0.42 814 0.42 0.47 466

12
For species where consumption of fish less than 30.5 cm (12 in.) is recommended, plots of fish length vs. mercury concentration were helpful in visualizing the frequency of occurrence of individuals with total mercury concentrations above and below the benchmark concentration (0.70 mg/kg) (Figure 3). The percentage of individuals with total mercury concentrations below the benchmark concentration and between 20.3 cm (8 in.) to 30.5 cm (12 in.) in total length was 97% for largemouth, 92% for chain pickerel, 90% for yellow perch, 86% for smallmouth bass and 79% for white perch. These percentages represent the frequency of fish available for consumption (based on the size restriction) and that had total mercury concentrations below the benchmark concentration. Figure 3 – Total mercury concentration versus total length for size-restricted species. Vertical solid line is
20.3 -30.5 cm (8-12 in.) size range*; long dashed line is 0.70 mg/kg benchmark concentration. *
Represents edible size range and is consistent with NHDES (2008).
0
0.5
1
1.5
2
2.5
3
10 20 30 40 50 60 70 80 90
Yellow perch
0
0.5
1
1.5
2
2.5
3
10 20 30 40 50 60 70 80 90
White perch
0.0
0.5
1.0
1.5
2.0
2.5
3.0
10 20 30 40 50 60 70 80 90
Largemouth bass
0.0
0.5
1.0
1.5
2.0
2.5
3.0
10 20 30 40 50 60 70 80 90
Smallmouth bass
0.0
0.5
1.0
1.5
2.0
2.5
3.0
10 20 30 40 50 60 70 80 90
Chain pickerel Below size restricted limit, but >0.70mg Hg/kg fish tissue
Below size restricted limit, but <0.70mg Hg/kg fish tissue
Fish Length (cm)
Conc
entr
atio
n (m
g Hg
/ k
g fis
h tis
sue)
Not recommended for consumption based on size, but >0.70mg Hg / kg fish tissue
Not recommended for consumption based on size, but <0.70mg Hg/kg fish tissue
13
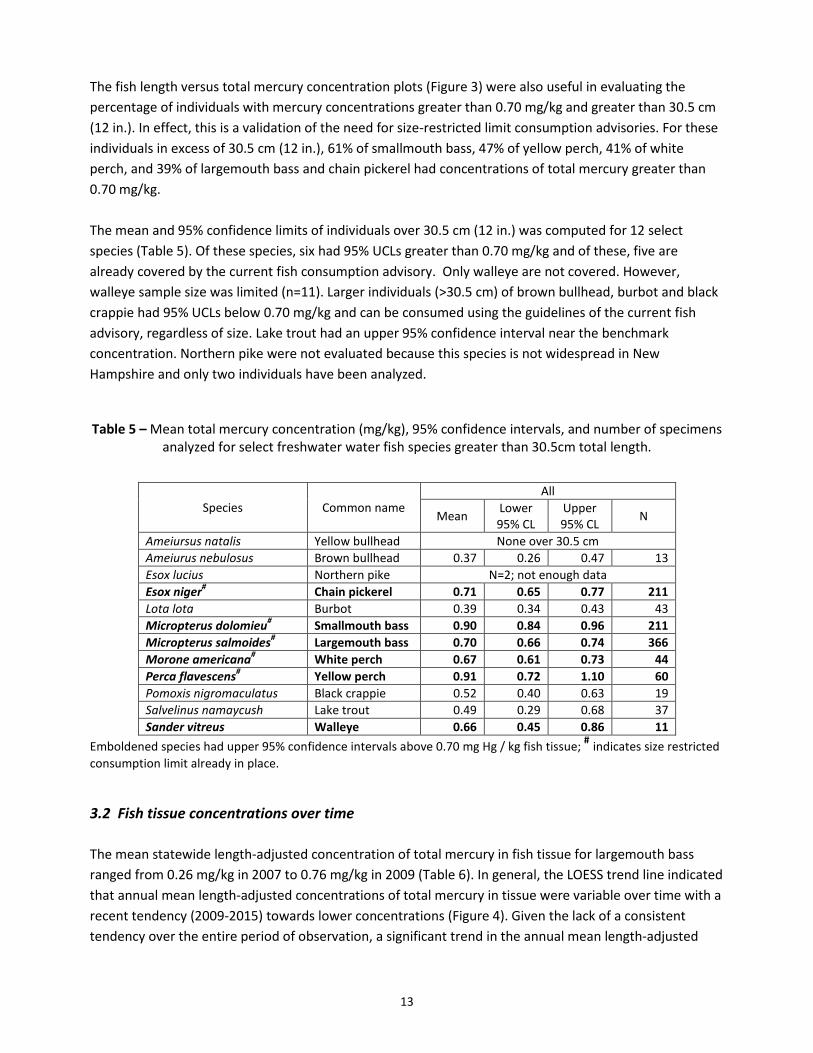
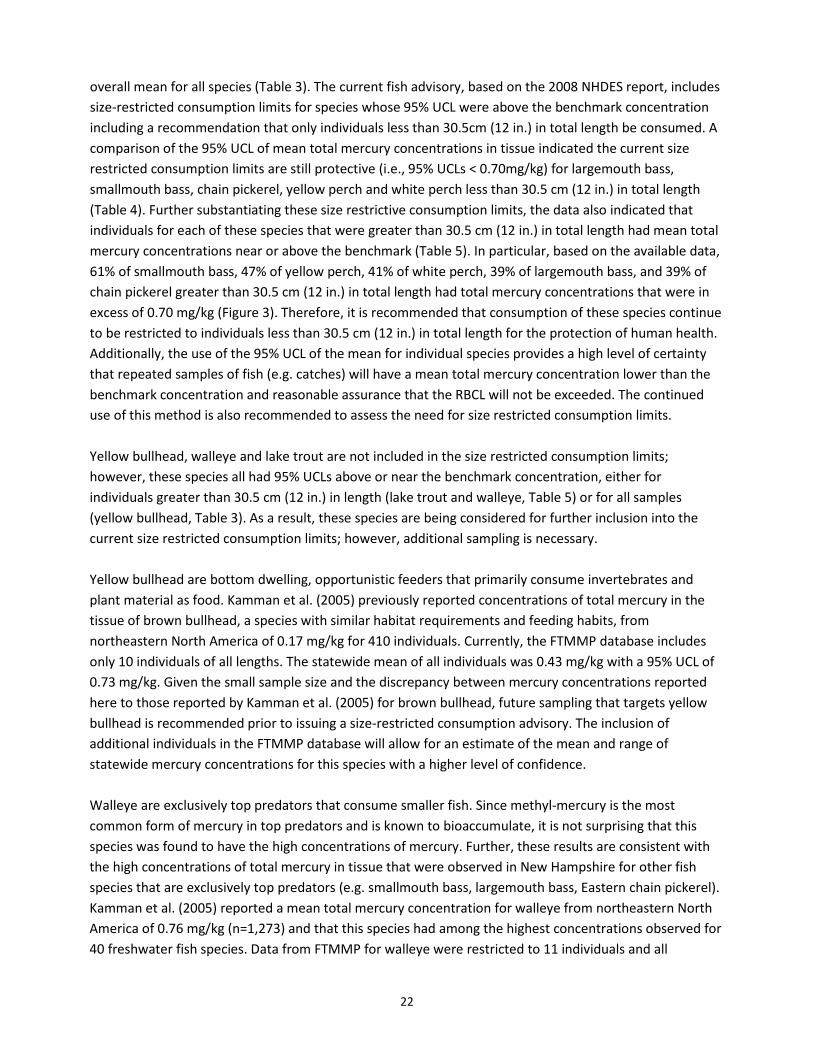
The fish length versus total mercury concentration plots (Figure 3) were also useful in evaluating the percentage of individuals with mercury concentrations greater than 0.70 mg/kg and greater than 30.5 cm (12 in.). In effect, this is a validation of the need for size-restricted limit consumption advisories. For these individuals in excess of 30.5 cm (12 in.), 61% of smallmouth bass, 47% of yellow perch, 41% of white perch, and 39% of largemouth bass and chain pickerel had concentrations of total mercury greater than 0.70 mg/kg. The mean and 95% confidence limits of individuals over 30.5 cm (12 in.) was computed for 12 select species (Table 5). Of these species, six had 95% UCLs greater than 0.70 mg/kg and of these, five are already covered by the current fish consumption advisory. Only walleye are not covered. However, walleye sample size was limited (n=11). Larger individuals (>30.5 cm) of brown bullhead, burbot and black crappie had 95% UCLs below 0.70 mg/kg and can be consumed using the guidelines of the current fish advisory, regardless of size. Lake trout had an upper 95% confidence interval near the benchmark concentration. Northern pike were not evaluated because this species is not widespread in New Hampshire and only two individuals have been analyzed.
Table 5 – Mean total mercury concentration (mg/kg), 95% confidence intervals, and number of specimens analyzed for select freshwater water fish species greater than 30.5cm total length.
Species Common name All
Mean Lower 95% CL
Upper 95% CL N
Ameiursus natalis Yellow bullhead None over 30.5 cm Ameiurus nebulosus Brown bullhead 0.37 0.26 0.47 13 Esox lucius Northern pike N=2; not enough data Esox niger# Chain pickerel 0.71 0.65 0.77 211 Lota lota Burbot 0.39 0.34 0.43 43 Micropterus dolomieu# Smallmouth bass 0.90 0.84 0.96 211 Micropterus salmoides# Largemouth bass 0.70 0.66 0.74 366 Morone americana# White perch 0.67 0.61 0.73 44 Perca flavescens# Yellow perch 0.91 0.72 1.10 60 Pomoxis nigromaculatus Black crappie 0.52 0.40 0.63 19 Salvelinus namaycush Lake trout 0.49 0.29 0.68 37 Sander vitreus Walleye 0.66 0.45 0.86 11
Emboldened species had upper 95% confidence intervals above 0.70 mg Hg / kg fish tissue; # indicates size restricted consumption limit already in place.
3.2 Fish tissue concentrations over time The mean statewide length-adjusted concentration of total mercury in fish tissue for largemouth bass ranged from 0.26 mg/kg in 2007 to 0.76 mg/kg in 2009 (Table 6). In general, the LOESS trend line indicated that annual mean length-adjusted concentrations of total mercury in tissue were variable over time with a recent tendency (2009-2015) towards lower concentrations (Figure 4). Given the lack of a consistent tendency over the entire period of observation, a significant trend in the annual mean length-adjusted

14
mercury concentrations in the tissue of largemouth bass was not detected from 1994 through 2015 (MKT, p = 0.35).
Table 6 – Annual mean length-adjusted total mercury concentration (≥5 fish/waterbody; mg Hg /kg fish tissue) in largemouth bass tissue, 1994-2015.
Year # individuals
# of waterbodies Mean Std.
Error 1994 10 1 0.45 0.14 1995 0 0 n/a n/a 1996 13 2 0.41 0.10 1997 6 1 0.76 0.18 1998 10 2 0.31 0.07 1999 0 0 n/a n/a 2000 41 6 0.43 0.05 2001 30 6 0.47 0.05 2002 10 2 0.38 0.10 2003 60 7 0.59 0.05 2004 11 2 0.45 0.08 2005 51 7 0.55 0.05 2006 21 4 0.43 0.06 2007 40 3 0.26 0.07 2008 15 3 0.58 0.07 2009 10 2 0.76 0.13 2010 10 2 0.44 0.07 2011 29 4 0.40 0.05 2012 15 2 0.50 0.09 2013 5 1 0.32 0.09 2014 5 1 0.37 0.09 2015 15 3 0.35 0.06
Figure 4 – Annual mean (+/-1 se) adjusted total mercury concentration in largemouth bass, 1994-2015.
00.10.20.30.40.50.60.7
mg
Hg /
kg
fish
tissu
e
Year
Mercury Concentration of Largemouth Bass (≥5 fish/ waterbody/ year) in New Hampshire, 1994 - 2015

15
Solid line is LOESS smoothed line. Annual mean yellow perch length-adjusted total mercury tissue concentrations varied from a low of 0.23 mg/kg in 2015 to a high of 0.44 mg/kg in 1996 (Table 7). Length-adjusted mercury concentration in yellow perch significantly declined from 1995 to 2016 (Figure 5; MKT: p < 0.001).
Table 7 – Annual mean length-adjusted total mercury concentration (≥5 fish/ waterbody; mg/kg) in yellow perch tissue, 1995-2016.
Year # of individuals
# of waterbodies Mean Std.
Error 1995 5 1 0.31 0.13 1996 24 3 0.44 0.08 1997 5 1 0.39 0.15 1998 99 8 0.36 0.04 1999 115 23 0.27 0.03 2000 122 14 0.27 0.03 2001 85 17 0.29 0.03 2002 15 3 0.30 0.07 2003 59 4 0.24 0.05 2004 57 8 0.36 0.04 2005 90 13 0.28 0.03 2006 100 14 0.28 0.03 2007 134 18 0.26 0.03 2008 213 9 0.28 0.04 2009 41 5 0.34 0.05 2010 24 4 0.29 0.06 2011 79 10 0.26 0.04 2012 115 8 0.25 0.04 2013 0 0 n/a n/a 2014 26 4 0.26 0.05 2015 17 3 0.23 0.06 2016 5 1 0.24 0.12

16
Figure 5 – Annual mean (+/-1 se) adjusted total mercury concentration in yellow perch, 1995 – 2016. Solid line is LOESS smoothed line.
The direction of length-adjusted total mercury concentrations was evaluated in repeatedly sampled lakes and ponds for largemouth bass and yellow perch. For largemouth bass, a total of 33 inter-year comparisons were made across all lakes (Table 8). Overall, nearly 48% of the changes fell into the large category (increases and decreases combined), 33% in the moderate category, and 15% in the small category. A majority of the lake-wide tendencies for largemouth bass were mixed (60%), 10% increased, and 10% decreased. Appendix C includes a full summary of the results in largemouth bass from each waterbody.
Table 8 – Summary of the number and percent of inter-annual and whole waterbody tendencies for adjusted mean total mercury concentrations in the tissue of largemouth bass.
Severity of Change Number Percent
Inter-annual comparisions Minimal Increases (difference > 0.01) 4 12% Minimal Decreases (difference <-0.01) 1 3% Moderate Increases (difference > 0.056) 5 15% Moderate Decreases (difference < -0.056) 6 18% Large Increases (difference > 0.112) 8 24% Large Decrease (differences < -0.112) 8 24% No Change (Difference -0.01< X <0.01) 1 3% Total number inter-annual comparisons 33 100%
Structured Sampling Program Waterbody Tendencies Increasing Lakes 1 10% Decreasing Lakes 1 10% Mixed Lakes 6 60% No Data 2 20% Total number of waterbodies 10 100%
00.10.20.30.40.50.60.7
mg
Hg /
kg
fish
tissu
e
Year
Mercury Concentration in Yellow Perch (≥5 fish/ waterbody/year) in New Hampshire, 1995 - 2016

17
A total of 76 inter-year comparisons were made to evaluate the tendency of total adjusted mercury concentrations in yellow perch (Table 9). Of these comparisons, 41% indicated a large change, 31% a moderate change, and 17% a minimal change. Lake-wide tendencies for yellow perch were possible from 34 waterbodies with 29% of all waterbodies demonstrating an increasing tendency, 32% a decreasing tendency, 32% a mixed tendency and 6% with no change. A majority (50%) of the waterbodies sampled through the structured sampling program had mixed response. Appendix D includes a full summary of the results in yellow perch from each waterbody.
Table 9 – Summary of the number and percent of inter-annual and whole waterbody tendencies for length-adjusted mean total mercury concentrations in the tissue of yellow perch.
Severity of Change
All Waterbodies Long-term Waterbodies
Number Percent Number Percent Inter-annual comparisons
Minimal Increases (difference > 0.01) 12 16% 2 7% Minimal Decreases (difference <-0.01) 6 8% 3 10% Moderate Increases (difference > 0.056) 7 9% 3 10% Moderate Decreases (difference < -0.056) 15 20% 6 21% Large Increases (difference > 0.112) 12 16% 5 17% Large Decrease (differences < -0.112) 18 24% 7 24% No Change (Difference -0.01< X <0.01) 6 8% 3 10% Total number inter-annual comparisons 76 100% 29 100%
Waterbody Tendencies Increasing Lakes 10 29% 1 10% Decreasing Lakes 11 32% 2 20% Mixed Lakes 11 32% 5 50% No Change (Difference -0.01< X <0.01) 2 6% 1 10% No Data 0 0% 1 10% Total number of waterbodies 34 100% 10 100%
3.3 Geographic patterns Largemouth bass and yellow perch results were summarized by county in order to provide a common understanding of the data’s spatial distribution and the mean length-adjusted concentrations of total mercury in fish tissue across the state. For yellow perch, Grafton county had the greatest number of tissue samples [n=352 (20.8%)] while Rockingham had the greatest number of waterbodies sampled [n= 27 (15.9%)] (Figure 6a). The fewest number of yellow perch tissue samples [n=57 (3.4%)] and waterbodies sampled [n=6 (3.5%)] came from Coos County. For largemouth bass, Rockingham County had the highest number of tissue samples [n=128 (21.3%)] and greatest number of waterbodies sampled [n=18 (18.2%)] (Figure 6b). In contrast, Belknap County had the fewest tissue samples [n=15 (2.5%)] while Coos County had the fewest waterbodies sampled [n=2 (2.0%)].

18
Figure 6 – Mean length-adjusted total mercury tissue concentration (+/-1 SE), number of samples, and number of waterbodies sampled by New Hampshire County for yellow perch (a) and largemouth bass (b).
Mean length-adjusted total mercury concentrations for yellow perch were relatively consistent statewide and ranged from 0.14 mg/kg in Coos County to 0.36 mg/kg in Grafton County (Figure 6a). Mean length-adjusted total mercury concentrations for largemouth bass were highest in Hillsborough (0.59 mg/kg) and Carroll Counties (0.56 mg/kg) (Figure 6b). The lowest mean length-adjusted total mercury concentrations for largemouth bass were observed in Coos County (0.33 mg/kg) and Belknap County (0.34 mg/kg). Overall, the patterns in mean length-adjusted total mercury concentrations by county were dissimilar between yellow perch and largemouth bass. For yellow perch, Grafton and Cheshire counties in western New Hampshire had the highest mean length-adjusted total mercury concentrations (Map 2), whereas for largemouth bass concentrations tended to be highest in the southeastern counties (Hillsborough and Rockingham) (Map 3). Fewer waterbodies were sampled from Coos County than all other New Hampshire counties. These concentration differences documented between yellow perch and largemouth bass may be regional, but also could be due to the variation in the number of individual fish and waterbodies that were sampled.
a) b)

19
Map 2 – Location, number of samples, and mean length-adjusted total mercury tissue category by New Hampshire County in yellow perch, 1992-2016.
20
Map 3 – Location, number of samples, and mean length-adjusted total mercury tissue category by New Hampshire County in largemouth bass, 1994-2015.

21
4. SUMMARY AND RECOMMENDATIONS The overall mean concentration of total mercury in tissue for all species (0.33 mg/kg) and those that are commonly consumed (0.36 mg/kg) were well below the benchmark concentration (0.70 mg/kg) used in establishing New Hampshire’s freshwater fish consumption guidelines. The statewide mean of all species and commonly consumed species, however, is above the EPA-recommended water quality criteria of 0.30 mg/kg for methyl-mercury. In order to adequately protect human health, NHDES assumes total mercury and methyl-mercury concentrations are equivalent. In general, this is relatively accurate for piscivorous fish, but methyl-mercury may be about 80% of total mercury for planktonic fish (Driscoll et al. 2007). The NHDES statewide fish consumption guidelines represent a risk-based consumption limit (RBCL) that is computed using a toxicological reference dose (RfD) and a fish tissue benchmark concentration. Along with an assumed human body weight, this defines the total amount of fish that can be safely consumed over a defined period of time. RBCLs for the statewide fish consumption advisory were computed and expressed as the number of meals per month using a meal size of 0.227 kg (8 oz). Based on the formula for computation of the RBCL, the statewide consumption guidelines that use a benchmark concentration equal to 0.70 mg/kg are more protective (e.g., less fish consumption allowed) than if the guideline were established using a benchmark concentration based on the EPA-recommended water quality criteria (0.30 mg/kg). For example, the current statewide fish consumption advisory for mercury in New Hampshire is 4 meals per month for adults and children over age 7 (non-sensitive individuals) and 1 meal per month for women of childbearing age and children under age 7 (sensitive individuals). (See Appendix E for formula and example calculations.) If the EPA-recommended water quality criteria (0.30 mg/kg) were used as the benchmark concentration to compute a consumption limit using the same RfD and body weights, the resultant guidelines would be 9 meals per month for non-sensitive individuals and 3 meals per month for sensitive individuals. As a result, NHDES has elected to retain its current fish advisory that is based on 0.70mg/kg as a benchmark concentration to evaluate the human health risks with respect to total mercury concentrations in fish tissue. Of the 14 species where comparisons between the 2008 (NHDES 2008) and the current analysis were made, seven had minimal increases or decreases in total mercury (</=0.05 mg/kg). Lake trout, walleye and northern pike had tissue concentrations of total mercury equal to or greater than 0.10 mg/kg higher in the current analysis than in 2008 while concentrations of mercury in tissue of yellow bullhead decreased by at least 0.11 mg/kg. For many of these species, the inclusion of additional individuals in the current analysis provides a better estimate of the statewide mean, and thus, more confidence in making determinations of the risk for consumption than in 2008. In particular, the inclusion and analysis of popular sport fish species that are regularly consumed, such as walleye and lake trout, is critically important to establishing accurate species-specific estimates of mercury concentration. The current analysis includes 40 individuals of lake trout and 11 walleye, an increase of 22 and six individuals, respectively. Similarly, the current analysis includes only two northern pike. Future sampling should target these species since they are top predators and likely to have higher mercury concentrations than fish species that are lower on the food chain. As an added measure of human health safety, NHDES uses the 95% UCL of the mean tissue concentration as a comparison to the benchmark concentration. On average the 95% UCL was 22% higher than the
22
overall mean for all species (Table 3). The current fish advisory, based on the 2008 NHDES report, includes size-restricted consumption limits for species whose 95% UCL were above the benchmark concentration including a recommendation that only individuals less than 30.5cm (12 in.) in total length be consumed. A comparison of the 95% UCL of mean total mercury concentrations in tissue indicated the current size restricted consumption limits are still protective (i.e., 95% UCLs < 0.70mg/kg) for largemouth bass, smallmouth bass, chain pickerel, yellow perch and white perch less than 30.5 cm (12 in.) in total length (Table 4). Further substantiating these size restrictive consumption limits, the data also indicated that individuals for each of these species that were greater than 30.5 cm (12 in.) in total length had mean total mercury concentrations near or above the benchmark (Table 5). In particular, based on the available data, 61% of smallmouth bass, 47% of yellow perch, 41% of white perch, 39% of largemouth bass, and 39% of chain pickerel greater than 30.5 cm (12 in.) in total length had total mercury concentrations that were in excess of 0.70 mg/kg (Figure 3). Therefore, it is recommended that consumption of these species continue to be restricted to individuals less than 30.5 cm (12 in.) in total length for the protection of human health. Additionally, the use of the 95% UCL of the mean for individual species provides a high level of certainty that repeated samples of fish (e.g. catches) will have a mean total mercury concentration lower than the benchmark concentration and reasonable assurance that the RBCL will not be exceeded. The continued use of this method is also recommended to assess the need for size restricted consumption limits. Yellow bullhead, walleye and lake trout are not included in the size restricted consumption limits; however, these species all had 95% UCLs above or near the benchmark concentration, either for individuals greater than 30.5 cm (12 in.) in length (lake trout and walleye, Table 5) or for all samples (yellow bullhead, Table 3). As a result, these species are being considered for further inclusion into the current size restricted consumption limits; however, additional sampling is necessary. Yellow bullhead are bottom dwelling, opportunistic feeders that primarily consume invertebrates and plant material as food. Kamman et al. (2005) previously reported concentrations of total mercury in the tissue of brown bullhead, a species with similar habitat requirements and feeding habits, from northeastern North America of 0.17 mg/kg for 410 individuals. Currently, the FTMMP database includes only 10 individuals of all lengths. The statewide mean of all individuals was 0.43 mg/kg with a 95% UCL of 0.73 mg/kg. Given the small sample size and the discrepancy between mercury concentrations reported here to those reported by Kamman et al. (2005) for brown bullhead, future sampling that targets yellow bullhead is recommended prior to issuing a size-restricted consumption advisory. The inclusion of additional individuals in the FTMMP database will allow for an estimate of the mean and range of statewide mercury concentrations for this species with a higher level of confidence. Walleye are exclusively top predators that consume smaller fish. Since methyl-mercury is the most common form of mercury in top predators and is known to bioaccumulate, it is not surprising that this species was found to have the high concentrations of mercury. Further, these results are consistent with the high concentrations of total mercury in tissue that were observed in New Hampshire for other fish species that are exclusively top predators (e.g. smallmouth bass, largemouth bass, Eastern chain pickerel). Kamman et al. (2005) reported a mean total mercury concentration for walleye from northeastern North America of 0.76 mg/kg (n=1,273) and that this species had among the highest concentrations observed for 40 freshwater fish species. Data from FTMMP for walleye were restricted to 11 individuals and all
23
individuals included in the analysis were over 30.5 cm (12 in.) in length with a mean total mercury concentration of 0.66 mg/kg (95% UCL = 0.86). Despite the low number of individuals included in the FTMMP, it is recommended that size-restricted consumption limits be added for this species in New Hampshire because data from the FTMMP is corroborated by their position at the top of the food web and the high mean concentrations reported by Kamman et al. (2005). The data also indicated that lake trout had mean total mercury concentrations higher than most species (0.49 mg/kg) with a 95% UCL concentration of 0.68 mg/kg based on 37 individuals greater than 30.5 cm in length. Kamman et al. (2005) reported a mean concentration for lake trout of 0.61 mg/kg for 1,076 individuals. Since the 95% UCL of individuals from the FTMMP nearly meets the benchmark concentration, lake trout are top predators, and the high mean concentration reported by Kamman et al. (2005) it is recommended that a size-restricted consumption limits be considered for this species as well. Last, although only two northern pike have been analyzed in the FTMMP, their mean total mercury concentration (0.60 mg/kg) ranks fourth among all the species tested in New Hampshire. Kamman et al. (2005) reported a mean total mercury concentration for northern pike of 0.63 mg/kg for 1,328 individuals. As top predators, northern pike bioaccumulate mercury and represent a likely health risk to humans and wildlife. In New Hampshire, northern pike inhabit a limited number of waterbodies, primarily on the western edge of the state, so there is a lower likelihood of capture and widespread consumption and, in turn, health risk due to mercury contamination. Nonetheless, it is recommended that this species be considered for size-restricted consumption limits. The collection and processing of additional individuals for walleye, lake trout and northern pike should be targeted in the future to increase the level of certainty in the total mercury concentrations. Issuing size-restricted consumption advisories for walleye, northern pike and lake trout needs to be considered in conjunction with the fishing regulations issued by NHFG. In 2017, the minimum length limits for walleye and lake trout were 46 cm (18 in.) and 72 cm (28 in.) for northern pike. Therefore, simply adding the current size-restricted consumption limit that recommends no fish over 30.5 cm (12 in.) can be consumed presents a conflict (i.e., establishment of a catch-and-release fishery in which no fish could be consumed). All three of these species are popular sport fish and maintaining some level of consumption that is safe with respect to mercury, if possible, is highly desirable. Future efforts to better understand mercury concentrations in these species should include an analysis across a range of lengths with a minimum number of individuals in multiple size categories. A robust dataset for each species that meets these objectives will allow for the computation of RBCLs within each size category to determine if there is a safe level of consumption within a given size range that fits within the current NHFG minimum length limit. Annual mean length-adjusted total mercury concentrations in the tissue of yellow perch decreased significantly from 1995-2016 (MKT; p<0.05). In contrast, trends of annual mean adjusted total mercury concentrations in the tissue of largemouth bass were inconclusive (MKT; p>0.05) from 1994-2015. Data from recent years (2009-15) suggest a tendency toward decreasing concentrations; however, additional years of data are needed to confirm if this observation continues.

24
Differences in inter-annual comparisons from waterbodies included in the structured sampling program indicated that most (48%) waterbodies had large change (>2 standard error) in length-adjusted mercury concentrations for largemouth bass. Similarly, comparisons of lake-wide tendencies for yellow perch indicated that the majority (40%) fell into the large change (i.e., >/= 2 standard errors) narrative category. Large inter-annual differences in total mercury concentrations may be an artifact of the gaps in the number of years between sample collections at individual waterbodies, or in the number of fish captured and analyzed. For the opportunistic sampling program, repeated collections at individual waterbodies were not common, and when they did occur, the number of years separating the sample collection was completely random. The number of fish submitted for processing and analysis was also random. The structured sampling program had a five-year scheduled data gap between collections. Without consistent annual samples, it appears as though mercury concentrations in fish tissue are highly variable across timeframes (5+ years) within individual waterbodies for individual species. Observations of lake-wide tendencies from the structured sampling program were limited. For largemouth bass, six of 10 waterbodies experienced a mixture of inter-annual increases and decreases in adjusted mercury concentrations (i.e., mixed tendency). Lake-wide tendencies for yellow perch had a similar frequency of waterbodies with decreased (n=11; 32%), increased (n=10; 29%), and mixed (n=11; 32%) inter-annual comparisons. Overall, the analysis of time series data from the repetitively sampled lakes did not provide a clear indication of either increasing or decreasing trend of the concentration of mercury in fish tissue. Similar to yellow perch in New Hampshire, a study of 23 lakes and ponds in Massachusetts, Hutchinson et al. (2014) documented significant declines in the mercury concentrations in the tissue of yellow perch and largemouth bass between two distinct time periods (1998-2002 vs. 2003-2011). The same research indicated the greatest declines were documented in lakes and ponds located near local atmospheric sources and that the reductions in fish tissue concentrations were likely linked to reduced atmospheric emissions of local sources. National trends in freshwater fish tissue mercury concentrations reported by Chalmers et al. (2011) indicated that 57% of the sites sampled showed no change between 1969 and 2005 and 37% of sites had a declining trend. Chalmers et al. (2011) also reported declining trends in six out of seven Northeast waterbodies sampled from 1969 through 1987. Results from Great Lakes walleye and lake trout tissue indicated consistent downward trends over time in most cases for the period 1970 through 2007 (Bhavsar 2010). The documentation of improvement is an obvious goal when an environmental pollutant source is reduced or removed. With respect to mercury, significant national (Figure 1) and statewide (Tables 1 and 2) reductions in atmospheric emissions have occurred in recent years. The ability to detect corresponding improvements in the fish data available through the FTMMP was restricted to yellow perch (Figure 5). The inability to detect trends for largemouth bass that correspond to reductions in atmospheric emissions is, in part, attributed to the unstructured nature of the sampling design of the FTMPP. A majority of the annual data included in the largemouth bass trend analysis came from less than 30 individuals (17 of 22 years) and less than five waterbodies (18 of 22 years). In contrast, for yellow perch, 18 of 22 years

25
included 30 or more individuals and came from five or more waterbodies in 12 of 22 years. A consistently robust annual dataset was important to detecting long-term trends. In addition, because mercury is a persistent environmental contaminant that is sequestered in bottom sediments, an unknown load of mercury is continuously available for delivery to waterbodies for an extended period (e.g., >100 years) until the source is depleted. Coupled with continued mercury deposition from local and global sources, the ability to detect statewide reductions in mercury concentrations in fish tissues will continue to be challenging. Finally, delayed responses of mercury concentrations in fish tissue to atmospheric emission reductions are possible (Chalmers et al. 2011). These confounding factors are important to consider when judging the effectiveness of reductions in atmospheric mercury with respect to concentrations in fish tissue. Overall, 90% of the fish specimens submitted for inclusion into the FTMPP were submitted to NHDES through a statewide request to citizens. The resultant data, in most cases, represent single sampling events from waterbodies across the state without concern for spatial distribution, nearness to local emission sources, modeled mercury deposition patterns, or in-lake water chemistry. The remaining 10% of the data came from the 10-lake structured sampling effort, where each lake is sampled once every five years, and although this program was started in 1998, these waterbodies have only two to three data points. Collectively, while the FTMMP data provides accurate estimates of statewide mercury concentrations in the tissue for the most commonly consumed freshwater fish, a more rigorous sampling design is needed to track trends in mercury concentrations in fish tissue over time, especially given the complex nature of the factors that control the supply and availability of mercury in the environment. A revised sampling program capable of detecting trends should include annual sampling of specific fish species from a consistent roster of waterbodies statewide. A subset of these repetitively sampled waterbodies should be focused in areas of southeastern New Hampshire as previous research has shown this area is subjected to higher mercury deposition rates than the rest of New Hampshire (Evers et al. 2007, Lombard et al. 2011). Additional “trend” waterbodies should be scattered across the state to provide adequate geographic distribution including areas that are known or suspected of having low mercury deposition rates. Basic water quality parameters such as pH, dissolved organic carbon, acid neutralizing capacity and total phosphorus should be taken into consideration when selecting lakes as they contribute to a waterbody’s mercury sensitivity (Driscoll et al. 2007). The revised program should include up to 20 waterbodies and take into consideration waterbodies with previous mercury in fish tissue data. Many of the waterbodies from the current structured sampling program could be included in the revised program as they were originally selected based on the water chemistry parameters noted above. Mason et al. (2005) provides specific and more detailed suggestions for the establishment of a structured mercury monitoring framework that includes fish. Since 2011, a municipal waste incinerator in the Town of Claremont and the PSNH coal-fired power plant in the Town of Bow collectively reduced statewide atmospheric sources of mercury by approximately 180 kg/yr (~36% of statewide reduction) and contributed significantly to the documented reductions in statewide atmospheric reductions since 1997 (Table 1). The recent significant declining trend observed in tissue concentrations of total mercury for yellow perch and recent tendency toward lower total mercury

26
concentrations in largemouth bass may be related to these atmospheric reductions. Hutchinson et al. (2014) observed similar rapid reductions in mercury concentrations of fish tissue in concert with the reduction of localized mercury emission sources. Evers et al. (2007) reported that mercury concentrations declined 64% in loons (blood and eggs) over a three-year period, and, that these declines coincided with a 45% reduction in upwind atmospheric mercury sources in southern New Hampshire. While these studies provide examples of the potential for rapid declines in mercury concentrations in animals associated with the removal of nearby atmospheric sources, response times depend on a variety of factors including the form(s) of mercury (particulate, gaseous, elemental) removed, coincident changes in regional or global emission rates, the amount of mercury historically deposited across the landscape, climatic conditions and watershed characteristics. The inclusion of future years of data to track trends of mercury in fish tissue concentrations through the FTMPP will confirm whether the current tendency continues and represents a significant reduction over time. Ultimately, if done correctly, coupling fish tissue with emission or deposition data could be used to make associations between the potential supply (availability) and the observed contaminant load in aquatic resources. Total mercury concentrations in fish tissue by New Hampshire County were relatively consistent across the state with largemouth bass typically near or in excess of 0.50 mg/kg and yellow perch near or in excess 0.30 mg/kg (Maps 2 & 3). Coos County had lower total mercury concentrations for both largemouth bass and yellow perch; however, these data consisted of fewer individuals from fewer waterbodies than other counties. Evers et al. (2007) identified “hotspots” of mercury concentrations in fish tissue in southeastern New Hampshire and northeastern Massachusetts. These results were further confirmed in a study of Massachusetts fish tissue by Hutchinson et al. (2014). For the FTMMP, the largest variation in length-adjusted mean total mercury concentrations in fish tissue between counties was observed in largemouth bass with concentrations of fish from two southern New Hampshire counties, Hillsborough and Rockingham, nearly two times higher than fish collected from waterbodies in New Hampshire’s northernmost county, Coos County. Many waterbodies sampled within Hillsborough and Rockingham counties were located downwind or within approximately 50 miles of two of the historically largest atmospheric emission sources in New Hampshire (Merrimack station, Bow, New Hampshire; Schiller Station, Portsmouth, New Hampshire). Yellow perch had less variation across the landscape when mean length-adjusted total mercury concentrations were compared by county and were highest in western New Hampshire counties, yet still indicated that tissue concentrations in fish collected from Coos County (0.16 mg/kg) were lowest and approximately half of the total mercury concentrations observed in eight of the nine remaining New Hampshire counties. Although these observations of county-wide mercury concentrations in fish tissue were based on a non-statistical comparison of means, and for some counties rely on a limited number of samples, they are consistent with observed atmospheric mercury deposition patterns in the northeast reported by Vanarsdale et al. (2005) and modeled for New Hampshire and MA by Evers et al. (2007). The county-wide summaries, especially with respect to largemouth bass, provide some guidance to the public regarding the geographic areas where there exists the greatest potential of catching, and potentially consuming, fish with high mercury concentrations. The current New Hampshire fish consumption advisory includes waterbody-specific advisories on eight waterbodies: three in Grafton County, one in Belknap County, two in Sullivan County, one in Merrimack County, one of Hillsborough

27
County and one in Rockingham County. (See Appendix A for waterbody names and towns.) Future sampling should also include the collection of additional fish tissue samples from northern areas of New Hampshire in order to increase the sample size in an effort to confirm the apparent broader north-to-south patterns reported here and elsewhere. The current dataset is underrepresented with respect to the percentage of fish and waterbodies in Coos County, the largest county in New Hampshire. Additional data are needed for largemouth bass from Belknap, Carroll and Grafton Counties. For yellow perch, more data could be used from Strafford and Belknap Counties. In summary, the FTMMP has provided valuable long-term statewide data on the concentrations of total mercury in the tissue of the most commonly encountered and consumed freshwater fish in New Hampshire. The data are important for evaluating the need for revisions to the statewide fish consumption advisory and an evaluation of mercury concentrations in fish tissue over time and across the state. These data were, in large part, contributed to NHDES by volunteers and ultimately provides a rich dataset by which to analyze mercury in fish tissue data. There are indications that statewide mercury concentrations are declining in fish tissue, especially for yellow perch. The recent tendency in fish tissue concentrations of mercury coincides with reductions of in-state atmospheric emissions of mercury, however, additional fish and emissions data is required to confirm this association. County-wide comparisons of mercury in fish tissue concentrations indicate that southern areas of New Hampshire had fish with higher concentrations than that New Hampshire’s northern-most county, Coos. The data also correspond to known patterns of atmospheric mercury deposition across the New Hampshire landscape. It is recommended that the FTMMP be continued, with some modification, as it serves as an important resource in evaluating the risk to humans from a highly toxic chemical and its persistence in aquatic ecosystems. Since its inception in 1992, the FTMMP has amassed one of the largest and longest running statewide datasets in the country with respect to the content of mercury in fish tissue.

28
5. REFERENCES Boening, D.W. 2000. Ecological effects, transport, and fate of mercury: a general review. Chemosphere 40: 1335-1351. Chalmers, A.T., D.M. Argue, D.A. Gay, M.E. Brigham, C.J. Schmitt, D.L. Lorenz. 2011. Mercury trends in fish from rivers and lakes in the United States, 1969-2005. Environmental Monitoring and Assessment 175:175-191. Bhavsar, S.P., S.B. Gewurtz, D.J. McGoldrick, M.J. Keir, S.M. Backus. 2010. Changes in mercury levels in Great Lakes fish between 1970s and 2007. Environmental Science and Technology 44:3273-3279. Driscoll, C.T., Y. Han, C.Y. Chen, D.C. Evers, K. Fallon Lambert. Mercury contamination in forest and freshwater ecosystems in the northeastern United States. Bioscience 57: 17-28. EPA. 2010. Guidance for Implementing the January 2001 Methylmercury Water Quality Criterion. EPA 823-R-10-001. U.S. Environmental Protection Agency, Office of Water, Washington, D.C.
EPA. 2011. Biennial national listing of fish advisories. EPA-820-F-11-014. U.S. Environmental Protection Agency, Office of Science and Technology, Washington, D.C. Evers, D., Y. Han, C.T. Driscoll, N.C. Kamman, W.W. Goodale, K.F. Lambert, T.M. Holsen, C.Y. Chen, T.A. Clair, T. Butler. 2007. Biological mercury hotspots in northeastern United States and southwestern Canada. Bioscience 57:29-43. Hutchinson, M.S., C.M. Smith, J. Rose, C. Batdorf, O. Pancorbo, C. Rowen West, J. Strube, C. Francis. 2014. Temporal and spatial trends in freshwater fish tissue mercury concentrations associated with mercury emissions reductions. Environmental Science and Technology 48:2193-2202. Kamman, N.C., N.M. Burgess, C.T. Driscoll, H.A. Simonin, W. Goodale, J. Linehan, R. Estabrook, M. Hutchinson, A. Major, A.M. Scheuhammer, D.A. Scruton. 2005. Mercury in freshwater fish of northeast North America – A geographic perspective based on fish tissue monitoring databases. Ecotoxicolgy 14: 163-180. Lombard, M. A. S., J. G. Bryce, H. Mao, R. Talbot. 2011. Mercury deposition in southern New Hampshire, 2006-2009. Atmsospheric Chemistry and Physics. 11:7657-7668. Mason, R.P., M.L. Abbott, R.A. Bodaly, O.R. Russell Bullock, Jr., C.T. Driscoll, D. Evers, S. E. Lindberg, M. Murray, E.B. Swain. 2005. Monitoring the response to changing mercury deposition. Environmental Science and Technology 39:14A-22A.

29
NHDES. 2008. Technical background for the 2008 update to the New Hampshire statewide mercury fish consumption advisory. New Hampshire Department of Environmental Services, Concord, New Hampshire. Publication #R-ARD-08-01. 19pp. NESCAUM. 2007. Tracking progress in reducing mercury in air emissions. Northeast States for Coordinated Air Use Management. 6pp. Vanarsdale, Alan, J. Weiss, G. Keeler, E. Miller, G. Boulet, R. Brulotte, L. Poissant. 2005. Patterns of mercury deposition and concentration in northeastern North America 1996-2002. Ecotoxicology 14:37-52. Wentz, D.A., Brigham, M.E., Chasar, L.C., Lutz, M.A., and Krabbenhoft, D.P., 2014, Mercury in the Nation’s streams — Levels, trends, and implications: U.S. Geological Survey Circular 1395, 90 p., http://dx.doi.org/10.3133/cir1395 . Zheng, Yanxu and L. Jaeglé. 2013. Decreases in mercury wet deposition over the United States during 2004-2010: Roles of domestic and global background emission reductions. Atmosphere 4:113-131.
30
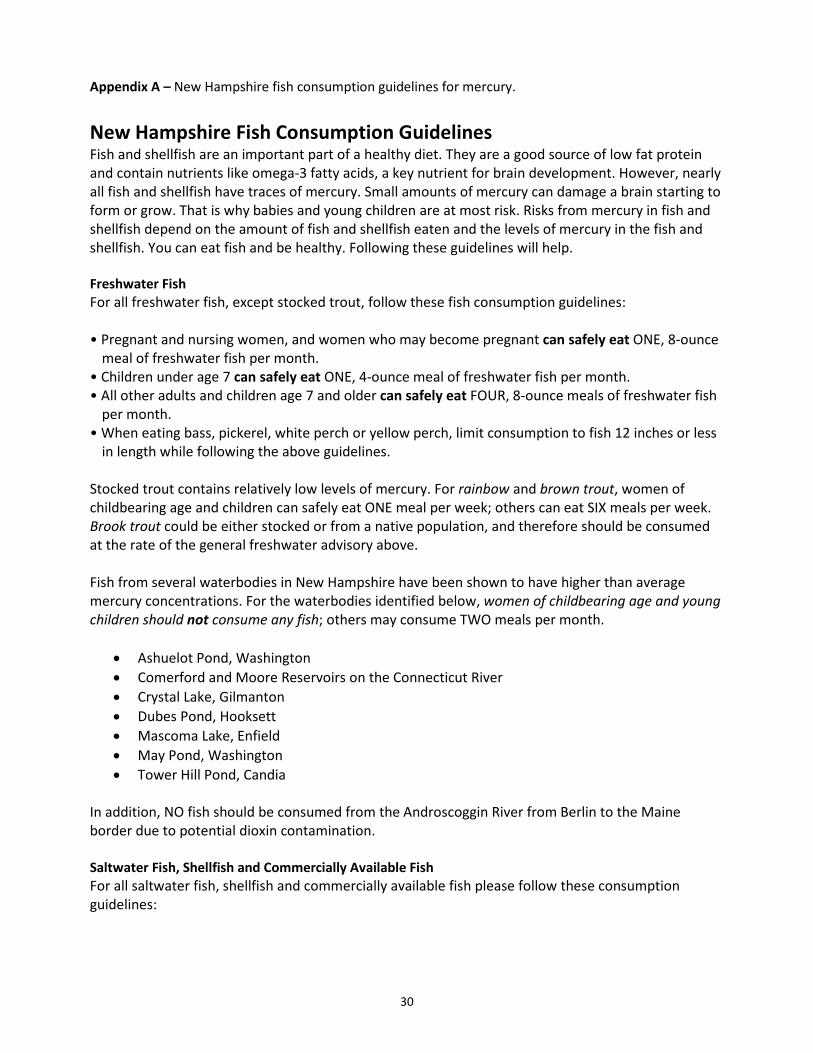
Appendix A – New Hampshire fish consumption guidelines for mercury. New Hampshire Fish Consumption Guidelines Fish and shellfish are an important part of a healthy diet. They are a good source of low fat protein and contain nutrients like omega-3 fatty acids, a key nutrient for brain development. However, nearly all fish and shellfish have traces of mercury. Small amounts of mercury can damage a brain starting to form or grow. That is why babies and young children are at most risk. Risks from mercury in fish and shellfish depend on the amount of fish and shellfish eaten and the levels of mercury in the fish and shellfish. You can eat fish and be healthy. Following these guidelines will help. Freshwater Fish For all freshwater fish, except stocked trout, follow these fish consumption guidelines: • Pregnant and nursing women, and women who may become pregnant can safely eat ONE, 8-ounce
meal of freshwater fish per month. • Children under age 7 can safely eat ONE, 4-ounce meal of freshwater fish per month. • All other adults and children age 7 and older can safely eat FOUR, 8-ounce meals of freshwater fish
per month. • When eating bass, pickerel, white perch or yellow perch, limit consumption to fish 12 inches or less
in length while following the above guidelines. Stocked trout contains relatively low levels of mercury. For rainbow and brown trout, women of childbearing age and children can safely eat ONE meal per week; others can eat SIX meals per week. Brook trout could be either stocked or from a native population, and therefore should be consumed at the rate of the general freshwater advisory above. Fish from several waterbodies in New Hampshire have been shown to have higher than average mercury concentrations. For the waterbodies identified below, women of childbearing age and young children should not consume any fish; others may consume TWO meals per month.
• Ashuelot Pond, Washington • Comerford and Moore Reservoirs on the Connecticut River • Crystal Lake, Gilmanton • Dubes Pond, Hooksett • Mascoma Lake, Enfield • May Pond, Washington • Tower Hill Pond, Candia
In addition, NO fish should be consumed from the Androscoggin River from Berlin to the Maine border due to potential dioxin contamination. Saltwater Fish, Shellfish and Commercially Available Fish For all saltwater fish, shellfish and commercially available fish please follow these consumption guidelines:

31
BEST CHOICES: Catfish, Cod, Flounder, Haddock, Herring, Light Tuna (canned), Pollack, Sole, Salmon, Tilapia and Shellfish (Oysters, Shrimp, Crab, Clams, Scallops, Lobster) • Pregnant and nursing women, women who may become pregnant, and young children can safely
eat TWO meals per week. For all others, no limit as part of a balanced diet. GOOD CHOICES: Halibut, Red Snapper, Tuna Steak and White Tuna (canned) • Pregnant and nursing women, women who may become pregnant, and young children can safely
eat ONE meal per week. For all others, no limit as part of a balanced diet. CAUTION: King Mackerel, Swordfish, Shark and Tilefish • Pregnant and nursing women, women who may become pregnant, and young children should avoid
consumption. For all others, TWO meals per month. All dietary sources of fish should be considered together. For example, a pregnant woman may have one meal of freshwater fish but is advised not to consume any additional mercury containing freshwater or saltwater fish that month. Remember: “meal” sizes are 4 oz. for children under age 7 and 8 oz. for older children and adults.

32
Appendix B – New Hampshire waterbodies with mercury in fish tissue data sampled through structured and opportunistic sampling efforts, 1992 - 2016.
Waterbody Name Waterbody ID Town County Station ID Program
ADDER POND NHLAK700030403-01 ANDOVER MERRIMACK BAKUORF-GEN Opportunistic
ANDROSCOGGIN RIVER NHRIV400010605-09 BERLIN COOS CRYGLM-GEN Opportunistic
ANDROSCOGGIN RIVER NHRIV400010606-10 GORHAM COOS CUBLDVL-GEN Opportunistic
ANDROSCOGGIN RIVER NHRIV400020103-06 SHELBURNE COOS BATWOL-GEN Opportunistic
ANGLE POND NHLAK700061403-01-01 SANDOWN ROCKINGHAM BAXFAR-GEN Opportunistic
ARMINGTON LAKE NHLAK801040201-01 PIERMONT GRAFTON DANMFRE-GEN Opportunistic
ASHEULOT RIVER NHRIV802010403-07 WINCHESTER CHESHIRE BEADEE-GEN Opportunistic
ASHUELOT POND NHLAK802010101-01 WASHINGTON SULLIVAN BEADER-GEN Opportunistic
AYERS ISLAND DAM POND NHIMP700010801-08 NEW HAMPTON BELKNAP BEASWH-GEN Opportunistic
AYERS POND NHLAK600030607-01 BARRINGTON STRAFFORD DEEDRG-GEN Opportunistic
BATSON POND NHLAK700020101-01 WOLFEBORO CARROLL DERCAN-GEN Opportunistic
BAXTER LAKE NHLAK600030602-01 FARMINGTON STRAFFORD BELMBY-GEN Opportunistic
BEARCAMP POND NHLAK600020601-01-01 SANDWICH CARROLL DIASTE-GEN Opportunistic
BEAVER LAKE NHLAK700061203-02-01 DERRY ROCKINGHAM DINSWH-GEN Opportunistic
BEAVER POND NHIMP600030702-01 DEERFIELD ROCKINGHAM DODLEM-GEN Opportunistic
BELLAMY RESERVOIR NHLAK600030903-02 MADBURY STRAFFORD BLASUT-GEN Opportunistic
BIG ISLAND POND NHLAK700061101-01-01 DERRY ROCKINGHAM BOGLIN-GEN Opportunistic
BIG TURKEY POND NHLAK700060301-02-01 CONCORD MERRIMACK BOLSUL-GEN Opportunistic
BLAISDELL LAKE NHLAK700030302-02 SUTTON MERRIMACK BOWSFF-GEN Opportunistic
BOG POND NHLAK700010201-01 LINCOLN GRAFTON BRIBRN-GEN Opportunistic
BOLSTER POND NHLAK802010201-01 SULLIVAN CHESHIRE BRYDOR-GEN Opportunistic
BOW LAKE NHLAK600030604-01-01 STRAFFORD STRAFFORD CANWIN-GEN Opportunistic
BRINDLE POND NHLAK700060402-01 BARNSTEAD BELKNAP CHEEPS-GEN Opportunistic
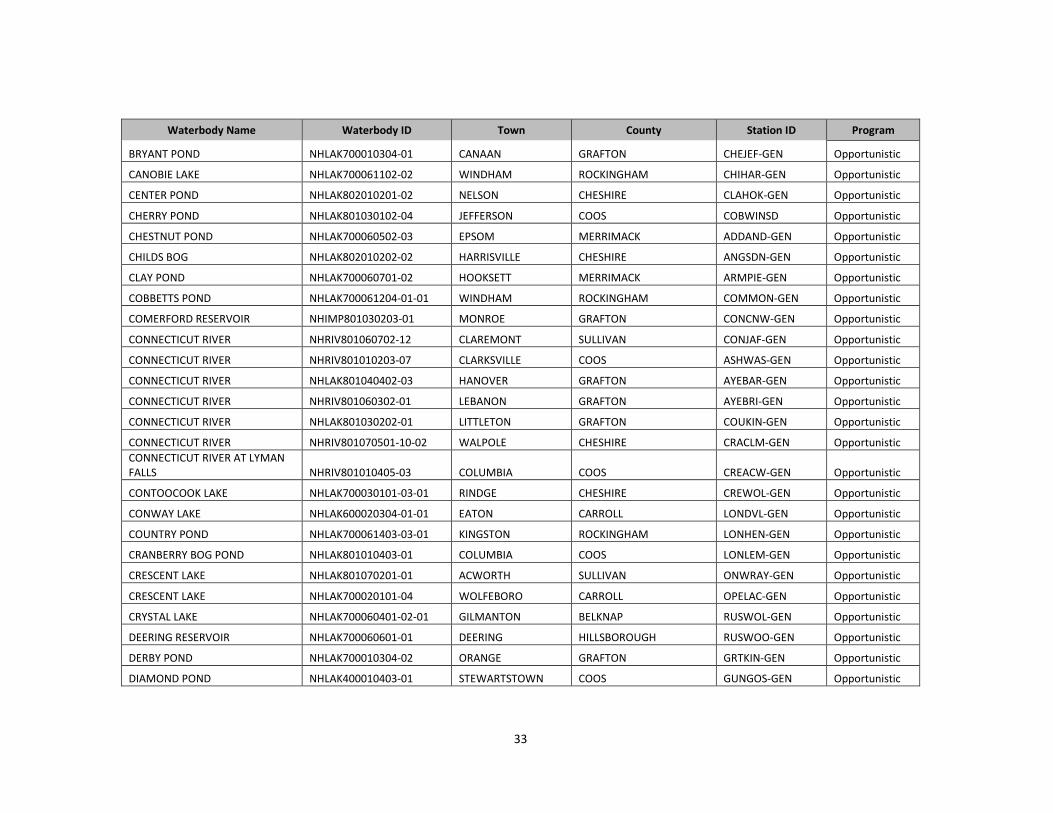
33
Waterbody Name Waterbody ID Town County Station ID Program
BRYANT POND NHLAK700010304-01 CANAAN GRAFTON CHEJEF-GEN Opportunistic
CANOBIE LAKE NHLAK700061102-02 WINDHAM ROCKINGHAM CHIHAR-GEN Opportunistic
CENTER POND NHLAK802010201-02 NELSON CHESHIRE CLAHOK-GEN Opportunistic
CHERRY POND NHLAK801030102-04 JEFFERSON COOS COBWINSD Opportunistic
CHESTNUT POND NHLAK700060502-03 EPSOM MERRIMACK ADDAND-GEN Opportunistic
CHILDS BOG NHLAK802010202-02 HARRISVILLE CHESHIRE ANGSDN-GEN Opportunistic
CLAY POND NHLAK700060701-02 HOOKSETT MERRIMACK ARMPIE-GEN Opportunistic
COBBETTS POND NHLAK700061204-01-01 WINDHAM ROCKINGHAM COMMON-GEN Opportunistic
COMERFORD RESERVOIR NHIMP801030203-01 MONROE GRAFTON CONCNW-GEN Opportunistic
CONNECTICUT RIVER NHRIV801060702-12 CLAREMONT SULLIVAN CONJAF-GEN Opportunistic
CONNECTICUT RIVER NHRIV801010203-07 CLARKSVILLE COOS ASHWAS-GEN Opportunistic
CONNECTICUT RIVER NHLAK801040402-03 HANOVER GRAFTON AYEBAR-GEN Opportunistic
CONNECTICUT RIVER NHRIV801060302-01 LEBANON GRAFTON AYEBRI-GEN Opportunistic
CONNECTICUT RIVER NHLAK801030202-01 LITTLETON GRAFTON COUKIN-GEN Opportunistic
CONNECTICUT RIVER NHRIV801070501-10-02 WALPOLE CHESHIRE CRACLM-GEN Opportunistic CONNECTICUT RIVER AT LYMAN FALLS NHRIV801010405-03 COLUMBIA COOS CREACW-GEN Opportunistic
CONTOOCOOK LAKE NHLAK700030101-03-01 RINDGE CHESHIRE CREWOL-GEN Opportunistic
CONWAY LAKE NHLAK600020304-01-01 EATON CARROLL LONDVL-GEN Opportunistic
COUNTRY POND NHLAK700061403-03-01 KINGSTON ROCKINGHAM LONHEN-GEN Opportunistic
CRANBERRY BOG POND NHLAK801010403-01 COLUMBIA COOS LONLEM-GEN Opportunistic
CRESCENT LAKE NHLAK801070201-01 ACWORTH SULLIVAN ONWRAY-GEN Opportunistic
CRESCENT LAKE NHLAK700020101-04 WOLFEBORO CARROLL OPELAC-GEN Opportunistic
CRYSTAL LAKE NHLAK700060401-02-01 GILMANTON BELKNAP RUSWOL-GEN Opportunistic
DEERING RESERVOIR NHLAK700060601-01 DEERING HILLSBOROUGH RUSWOO-GEN Opportunistic
DERBY POND NHLAK700010304-02 ORANGE GRAFTON GRTKIN-GEN Opportunistic
DIAMOND POND NHLAK400010403-01 STEWARTSTOWN COOS GUNGOS-GEN Opportunistic

34
Waterbody Name Waterbody ID Town County Station ID Program
DINSMORE POND NHLAK700020103-02 SANDWICH CARROLL LONNOR-GEN Opportunistic
DODGE POND NHLAK801070201-02 LEMPSTER SULLIVAN LOOFMT-GEN Opportunistic
DORRS POND NHLAK700060802-01 MANCHESTER HILLSBOROUGH OTTGRE-GEN Opportunistic
DREW LAKE NHLAK700030503-02 HOPKINTON MERRIMACK OTTHUD-GEN Opportunistic
DUBES POND NHLAK700060701-03 HOOKSETT MERRIMACK SANMLW-GEN Opportunistic
DUCK POND NHLAK600020804-03 FREEDOM CARROLL HALALT-GEN Opportunistic
DURGIN POND NHIMP700060502-01 NORTHWOOD ROCKINGHAM HALHAN-GEN Opportunistic
EAST POND NHLAK700010204-01 LIVERMORE GRAFTON LOOPLY-GEN Opportunistic
EASTMAN POND NHLAK801060401-06 GRANTHAM SULLIVAN LOVWAK1D Opportunistic
ELLSWORTH POND NHLAK700010206-01 ELLSWORTH GRAFTON PARLTL-GEN Opportunistic
ELM BROOK POOL NHIMP700030503-01-01 HOPKINTON MERRIMACK HALWAS-GEN Opportunistic
FLAT MOUNTAIN POND NHLAK600020602-02 WATERVILLE VALLEY GRAFTON MANGLM-GEN Opportunistic
FLINTS POND NHLAK700040402-01 HOLLIS HILLSBOROUGH MARLAN-GEN Opportunistic
FOREST LAKE NHLAK802010401-01-01 WINCHESTER CHESHIRE MASAUB1D Opportunistic
FRANKLIN PIERCE LAKE NHLAK700030202-03-01 HILLSBOROUGH HILLSBOROUGH MASAUB2D Opportunistic
FROST POND NHLAK700030102-02 JAFFREY CHESHIRE MASAUB3D Opportunistic
FULLAM POND NHLAK802010403-02 CHESTERFIELD CHESHIRE PAWNOT-GEN Opportunistic
GILES POND NHLAK700010802-02 SANBORNTON BELKNAP SEBBED-GEN Opportunistic
GILMORE POND NHLAK700030101-05 JAFFREY CHESHIRE SESDUM-GEN Opportunistic
GOOSE POND NHLAK801060103-01 CANAAN GRAFTON SHEGLM-GEN Opportunistic
GOULD POND NHLAK700030501-01 HILLSBOROUGH HILLSBOROUGH HARHAR-GEN Opportunistic
GRASSY POND NHLAK700030101-08 RINDGE CHESHIRE MASBRA-GEN Opportunistic
GREAT POND NHLAK700061403-06-01 KINGSTON ROCKINGHAM MASENF1D Opportunistic
GREENWOOD POND NHLAK700061403-07 KINGSTON ROCKINGHAM MASENF-GEN Opportunistic
GREGG LAKE NHLAK700030108-02-01 ANTRIM HILLSBOROUGH PEARIN-GEN Opportunistic
GUNNERSON LAKE NHLAK801060403-02 GOSHEN SULLIVAN PEATHO-GEN Opportunistic
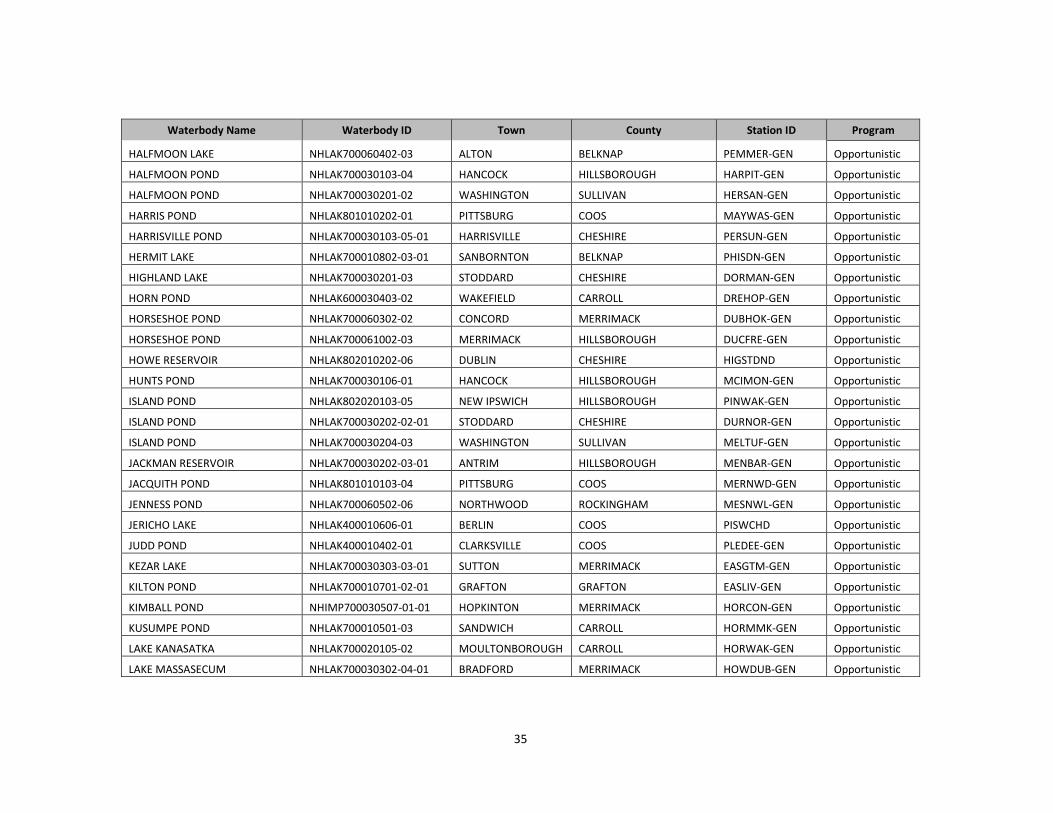
35
Waterbody Name Waterbody ID Town County Station ID Program
HALFMOON LAKE NHLAK700060402-03 ALTON BELKNAP PEMMER-GEN Opportunistic
HALFMOON POND NHLAK700030103-04 HANCOCK HILLSBOROUGH HARPIT-GEN Opportunistic
HALFMOON POND NHLAK700030201-02 WASHINGTON SULLIVAN HERSAN-GEN Opportunistic
HARRIS POND NHLAK801010202-01 PITTSBURG COOS MAYWAS-GEN Opportunistic
HARRISVILLE POND NHLAK700030103-05-01 HARRISVILLE CHESHIRE PERSUN-GEN Opportunistic
HERMIT LAKE NHLAK700010802-03-01 SANBORNTON BELKNAP PHISDN-GEN Opportunistic
HIGHLAND LAKE NHLAK700030201-03 STODDARD CHESHIRE DORMAN-GEN Opportunistic
HORN POND NHLAK600030403-02 WAKEFIELD CARROLL DREHOP-GEN Opportunistic
HORSESHOE POND NHLAK700060302-02 CONCORD MERRIMACK DUBHOK-GEN Opportunistic
HORSESHOE POND NHLAK700061002-03 MERRIMACK HILLSBOROUGH DUCFRE-GEN Opportunistic
HOWE RESERVOIR NHLAK802010202-06 DUBLIN CHESHIRE HIGSTDND Opportunistic
HUNTS POND NHLAK700030106-01 HANCOCK HILLSBOROUGH MCIMON-GEN Opportunistic
ISLAND POND NHLAK802020103-05 NEW IPSWICH HILLSBOROUGH PINWAK-GEN Opportunistic
ISLAND POND NHLAK700030202-02-01 STODDARD CHESHIRE DURNOR-GEN Opportunistic
ISLAND POND NHLAK700030204-03 WASHINGTON SULLIVAN MELTUF-GEN Opportunistic
JACKMAN RESERVOIR NHLAK700030202-03-01 ANTRIM HILLSBOROUGH MENBAR-GEN Opportunistic
JACQUITH POND NHLAK801010103-04 PITTSBURG COOS MERNWD-GEN Opportunistic
JENNESS POND NHLAK700060502-06 NORTHWOOD ROCKINGHAM MESNWL-GEN Opportunistic
JERICHO LAKE NHLAK400010606-01 BERLIN COOS PISWCHD Opportunistic
JUDD POND NHLAK400010402-01 CLARKSVILLE COOS PLEDEE-GEN Opportunistic
KEZAR LAKE NHLAK700030303-03-01 SUTTON MERRIMACK EASGTM-GEN Opportunistic
KILTON POND NHLAK700010701-02-01 GRAFTON GRAFTON EASLIV-GEN Opportunistic
KIMBALL POND NHIMP700030507-01-01 HOPKINTON MERRIMACK HORCON-GEN Opportunistic
KUSUMPE POND NHLAK700010501-03 SANDWICH CARROLL HORMMK-GEN Opportunistic
LAKE KANASATKA NHLAK700020105-02 MOULTONBOROUGH CARROLL HORWAK-GEN Opportunistic
LAKE MASSASECUM NHLAK700030302-04-01 BRADFORD MERRIMACK HOWDUB-GEN Opportunistic

36
Waterbody Name Waterbody ID Town County Station ID Program
LAKE MONOMONAC NHLAK802020103-06 RINDGE CHESHIRE MIRTUF-GEN Opportunistic
LAKE SOLITUDE NHLAK700030301-01 NEWBURY MERRIMACK PLENWL-GEN Opportunistic
LAKE UMBAGOG NHLAK400010602-04 ERROL COOS POORIN-GEN Opportunistic
LAKE UMBAGOG NHLAK400010602-04 ERROL COOS ELLELL-GEN Opportunistic
LAKE WENTWORTH NHLAK700020101-05-01 WOLFEBORO CARROLL ELMHOP-GEN Opportunistic LAKE WINNIPESAUKEE, ALTON BAY NHLAK700020110-02-19 ALTON BELKNAP HUNHAN-GEN Opportunistic
LAKE WINNIPESAUKEE, BROADS NHLAK700020110-02-19 GILFORD BELKNAP ISLDER-GEN Opportunistic LAKE WINNIPESAUKEE, GOV ISLAND NHLAK700020110-02-19 GILFORD BELKNAP MONRINAD Opportunistic LAKE WINNIPESAUKEE, MEREDITH BAY NHLAK700020110-02-19 MEREDITH BELKNAP POTBRL-GEN Opportunistic LAKE WINNIPESAUKEE, MEREDITH BAY NHLAK700020110-02-19 GILFORD BELKNAP FLAWTV-GEN Opportunistic LAKE WINNIPESAUKEE, MOULT. BAY NHLAK700020110-02-19 MOULTONBOROUGH CARROLL FLIHLS-GEN Opportunistic LAKE WINNIPESAUKEE, SMITH COVE NHLAK700020110-02-19 GILFORD BELKNAP ISLLPEL-GEN Opportunistic
LAKE WINNIPESAUKEE, WNT HBR NHLAK700020110-02-19 WOLFEBORO CARROLL ISLNWI-GEN Opportunistic LAKE WINNIPESAUKEE, WOLFE. BAY NHLAK700020110-02-19 WOLFEBORO CARROLL ISLSTD-GEN Opportunistic
LAKE WINNISQUAM NHLAK700020201-05-01 LACONIA BELKNAP ISLWAS-GEN Opportunistic
LAKE WINNISQUAM MOHAWK ISL NHLAK700020201-05-01 BELMONT BELKNAP MOOLTLAD Opportunistic
LAKE WINNISQUAM POT ISLAND NHLAK700020201-05-01 LACONIA BELKNAP MOOLTL-GEN Opportunistic
LAKINS POND NHLAK700060802-02 HOOKSETT MERRIMACK MOOTAM-GEN Opportunistic
LAUREL LAKE NHLAK802020202-02-01 FITZWILLIAM CHESHIRE POWHAN-GEN Opportunistic
LEES POND NHLAK700020103-05 MOULTONBOROUGH CARROLL POWKIN-GEN Opportunistic
LITTLE CUB POND NHLAK700061403-05 DANVILLE ROCKINGHAM PRANWID Opportunistic
LITTLE ISLAND POND NHLAK700061204-02 PELHAM HILLSBOROUGH FORWCH-GEN Opportunistic
LITTLE SQUAM LAKE NHLAK700010502-01-01 HOLDERNESS GRAFTON JACHSB-GEN Opportunistic

37
Waterbody Name Waterbody ID Town County Station ID Program
LITTLE TURKEY POND NHLAK700060301-02-02 CONCORD MERRIMACK JACPIT-GEN Opportunistic
LONG POND NHLAK700061403-09 DANVILLE ROCKINGHAM JENNOR-GEN Opportunistic
LONG POND NHLAK700030502-01 HENNIKER MERRIMACK JERBER-GEN Opportunistic
LONG POND NHLAK802010101-04 LEMPSTER SULLIVAN MOUJAF-GEN Opportunistic
LONG POND NHLAK700060502-07 NORTHWOOD ROCKINGHAM PROEFF-GEN Opportunistic
LOON LAKE NHLAK700010307-01 PLYMOUTH GRAFTON PUREAT-GEN Opportunistic
LOON POND NHLAK600030703-02 FREMONT ROCKINGHAM RAIDER-GEN Opportunistic
LOVELL LAKE NHLAK600030401-01-01 WAKEFIELD CARROLL RANGOS-GEN Opportunistic
LOWER FREESES POND NHLAK600030701-02 DEERFIELD ROCKINGHAM FRAHSBD Opportunistic
LOWER PEVERLY POND NHIMP600030904-05 NEWINGTON ROCKINGHAM FRELDEE-GEN Opportunistic
MANNING LAKE NHLAK700060401-06 GILMANTON BELKNAP JUDCLK-GEN Opportunistic
MARTIN MEADOW POND NHLAK801030102-02 LANCASTER COOS KANMOU-GEN Opportunistic
MASCOMA LAKE NHLAK801060105-04-01 ENFIELD GRAFTON KEZSUT-GEN Opportunistic
MASCOMA LAKE NHLAK801060105-04-01 ENFIELD GRAFTON MOUWEA-GEN Opportunistic
MASSABESIC LAKE NHLAK700060702-03 AUBURN ROCKINGHAM REDSWH-GEN Opportunistic
MASSABESIC LAKE NHLAK700060702-03 AUBURN ROCKINGHAM RHUPIT-GEN Opportunistic
MASSABESIC LAKE NHLAK700060702-03 MANCHESTER HILLSBOROUGH RICRIC-GEN Opportunistic
MAY POND NHLAK802010101-05 WASHINGTON SULLIVAN FROJAF-GEN Opportunistic
MCINDOE RESERVOIR NHIMP801030205-02 MONROE GRAFTON FULCHE-GEN Opportunistic
MELVIN POND NHLAK700020104-01 TUFTONBORO CARROLL GILJAF-GEN Opportunistic
MENDUMS POND NHLAK600030707-01 BARRINGTON STRAFFORD GILSAN-GEN Opportunistic
MERRIMACK RIVER NHRIV700060302-25-02 BOW MERRIMACK KILGRA-GEN Opportunistic
MERRYMEETING LAKE NHLAK700020102-03 NEW DURHAM STRAFFORD NATMMK-GEN Opportunistic
MESSER POND NHLAK700030303-04 NEW LONDON MERRIMACK NEWBRI-GEN Opportunistic
MIDDLE DANFORTH POND NHLAK600020803-01-02 FREEDOM CARROLL ROBHUD-GEN Opportunistic
MIRROR LAKE NHLAK700020106-02-01 TUFTONBORO CARROLL ROBSTD-GEN Opportunistic

38
Waterbody Name Waterbody ID Town County Station ID Program
MOORE RESERVOIR NHLAK801030202-01 LITTLETON GRAFTON ROCCRO-GEN Opportunistic
MOORE RESERVOIR NHLAK801030202-01 LITTLETON GRAFTON GOOCAN-GEN Opportunistic
MOORES POND NHLAK600020604-03 TAMWORTH CARROLL KUSSWH-GEN Opportunistic
MOUNT WILLIAM POND NHLAK700060602-02 WEARE HILLSBOROUGH LAKHOK-GEN Opportunistic
MOUNTAIN BROOK RESERVOIR NHLAK700030101-11 JAFFREY CHESHIRE NIPBAR-GEN Opportunistic
NATICOOK LAKE NHLAK700061002-04-01 MERRIMACK HILLSBOROUGH NORHAN-GEN Opportunistic
NEWFOUND LAKE NHLAK700010603-02-01 BRISTOL GRAFTON ROCFIT-GEN Opportunistic
NIPPO POND NHLAK600030605-01 BARRINGTON STRAFFORD ROCGLM-GEN Opportunistic
NORTHWOOD LAKE NHLAK700060502-08-01 NORTHWOOD ROCKINGHAM ROCWEN-GEN Opportunistic
NORTON POND NHLAK600030801-01 RAYMOND ROCKINGHAM ROCWIN-GEN Opportunistic
NORWAY POND NHLAK700030107-02-01 HANCOCK HILLSBOROUGH ROLGLM-GEN Opportunistic
NUBANUSIT LAKE NHLAK700030103-07 HANCOCK HILLSBOROUGH GOUHSB-GEN Opportunistic
NUTT POND NHLAK700060803-01 MANCHESTER HILLSBOROUGH LAUFIT-GEN Opportunistic
ONWAY LAKE NHLAK600030703-03-01 RAYMOND ROCKINGHAM LEEMOU-GEN Opportunistic
OPECHEE BAY NHLAK700020201-06-01 LACONIA BELKNAP NORRAY-GEN Opportunistic
OTTER LAKE NHLAK700030105-02-01 GREENFIELD HILLSBOROUGH NUBNEL-GEN Opportunistic
OTTERNICK POND NHLAK700061206-02 HUDSON HILLSBOROUGH NUTMAN-GEN Opportunistic
PARTRIDGE LAKE NHLAK801030502-03 LITTLETON GRAFTON ROUBAR-GEN Opportunistic
PAWTUCKAWAY LAKE NHLAK600030704-02-01 NOTTINGHAM ROCKINGHAM RUSHAR-GEN Opportunistic
PEAKED HILL POND NHLAK700010205-02 THORNTON GRAFTON RUSSUT-GEN Opportunistic
PEARLY LAKE NHLAK802020103-08 RINDGE CHESHIRE GRARIN-GEN Opportunistic
PEMIGEWASSET LAKE NHLAK700010801-01 MEREDITH BELKNAP GREANT-GEN Opportunistic
PERKINS POND NHLAK801060405-03 SUNAPEE SULLIVAN GREKIN-GEN Opportunistic
PHILLIPS POND NHLAK600030802-03-01 SANDOWN ROCKINGHAM GRELIV-GEN Opportunistic
PINE RIVER POND NHLAK600020703-03 WAKEFIELD CARROLL SWASWA-GEN Opportunistic
PISGAH RESERVOIR NHLAK802010403-05 WINCHESTER CHESHIRE TAYHAM-GEN Opportunistic

39
Waterbody Name Waterbody ID Town County Station ID Program
PLEASANT LAKE NHLAK700060502-09-01 DEERFIELD ROCKINGHAM TEWGRA-GEN Opportunistic
PLEASANT LAKE NHLAK700030402-02-01 NEW LONDON MERRIMACK THOJAF-GEN Opportunistic
POOL POND NHLAK700030101-12 RINDGE CHESHIRE THRUWRR-GEN Opportunistic
POTANIPO POND NHLAK700040401-02-01 BROOKLINE HILLSBOROUGH TODNBY-GEN Opportunistic
POWDER MILL POND NHLAK700030107-03 HANCOCK HILLSBOROUGH TOMWRN-GEN Opportunistic
POWWOW POND NHIMP700061403-04 KINGSTON ROCKINGHAM TOWCND-GEN Opportunistic
PRATT POND NHLAK700060901-03 NEW IPSWICH HILLSBOROUGH TROFRE-GEN Opportunistic
PROVINCE LAKE NHLAK600020902-01 WAKEFIELD CARROLL TROLYM-GEN Opportunistic
PURITY LAKE NHLAK600020803-06 EATON CARROLL TURBCON-GEN Opportunistic
RAINBOW LAKE NHLAK700061203-05 DERRY ROCKINGHAM TURBOW-GEN Opportunistic
RAND POND NHLAK801060403-04-01 GOSHEN SULLIVAN TURLCON-GEN Opportunistic
RED HILL POND NHLAK700020103-08 SANDWICH CARROLL UMBERR1D Opportunistic
RHUBARB POND NHLAK400010202-02 PITTSBURG COOS SUNSUN2D Opportunistic
RICE BROOK NHRIV802010302-01 RICHMOND CHESHIRE SIPFIT-GEN Opportunistic
ROBB RESERVOIR NHIMP700030202-02 STODDARD CHESHIRE UMBERR4D Opportunistic
ROBINSON POND NHLAK700061203-06-01 HUDSON HILLSBOROUGH SMIWAS-GEN Opportunistic
ROCK POND NHLAK700061204-03 WINDHAM ROCKINGHAM SNOCON-GEN Opportunistic
ROCKWOOD POND NHLAK802010303-04 FITZWILLIAM CHESHIRE SOLNBY-GEN Opportunistic
ROCKY POND NHLAK700060201-04 LOUDON MERRIMACK SONNFD-GEN Opportunistic
ROCKY POND NHLAK700010304-06 WENTWORTH GRAFTON WALBOS-GEN Opportunistic
ROCKYBOUND POND NHLAK801060404-01 CROYDON SULLIVAN WARALS-GEN Opportunistic
ROLLINS POND NHLAK700060501-05 GILMANTON BELKNAP SPOCHE-GEN Opportunistic
ROUND POND NHLAK600030606-03-02 BARRINGTON STRAFFORD WATNWI-GEN Opportunistic
ROUND POND NHLAK700060503-05 EPSOM MERRIMACK SPONEL-GEN Opportunistic
RUSSELL POND NHLAK700010203-02 WOODSTOCK GRAFTON SPRDEE-GEN Opportunistic
RUSSELL POND NHLAK700030302-05 SUTTON MERRIMACK SQUHOL2D Opportunistic

40
Waterbody Name Waterbody ID Town County Station ID Program
RUSSELL RESERVOIR NHLAK802010202-07 HARRISVILLE CHESHIRE WEBFRK-GEN Opportunistic
RUST POND NHLAK700020101-07-01 WOLFEBORO CARROLL WENWOL-GEN Opportunistic
SAND POND NHLAK802010101-08 MARLOW CHESHIRE STEMAN-GEN Opportunistic
SEBBINS POND NHLAK700060804-02 BEDFORD HILLSBOROUGH STIRUM-GEN Opportunistic
SESSIONS POND NHLAK400010602-13 DUMMER COOS WHIALB-GEN Opportunistic
SHELLCAMP POND NHLAK700060201-05 GILMANTON BELKNAP STOGTM-GEN Opportunistic
SILVER LAKE NHLAK802010202-09 HARRISVILLE CHESHIRE STUHOP-GEN Opportunistic
SILVER LAKE NHLAK600020801-06-01 MADISON CARROLL WHIHOL-GEN Opportunistic
SIP POND NHLAK802020103-10 FITZWILLIAM CHESHIRE WICMER-GEN Opportunistic
SMITH POND NHLAK700030203-02 WASHINGTON SULLIVAN SUNGRE-GEN Opportunistic
SNOW POND NHLAK700060302-07 CONCORD MERRIMACK WILSOM-GEN Opportunistic
SONDOGARDY POND NHLAK700060101-02-01 NORTHFIELD MERRIMACK WILSWA-GEN Opportunistic
SPOFFORD LAKE NHLAK801070503-01-01 CHESTERFIELD CHESHIRE WINALT-GEN Opportunistic
SPOONWOOD LAKE NHLAK700030103-09 NELSON CHESHIRE SUNMID-GEN Opportunistic
SPRUCE POND NHLAK600030702-02-01 DEERFIELD ROCKINGHAM WINMBEL-GEN Opportunistic
SQUAM LAKE NHLAK700010501-04-01 HOLDERNESS GRAFTON WINBGIL-GEN Opportunistic
STEVENS POND NHLAK700060803-02 MANCHESTER HILLSBOROUGH WINBWOL-GEN Opportunistic
STINSON LAKE NHLAK700010306-01 RUMNEY GRAFTON WINGGIL-GEN Opportunistic
STOCKER POND NHLAK801060401-02 GRANTHAM SULLIVAN WINHWOL-GEN Opportunistic
STUBBS POND NHLAK600030904-01 NEWINGTON ROCKINGHAM WINLAC-GEN Opportunistic
STUMPFIELD-MUDGETT MARSH NHIMP700030503-04 HOPKINTON MERRIMACK WINMERD Opportunistic
SUNAPEE LAKE NHLAK801060402-05-01 SUNAPEE SULLIVAN WINMER-GEN Opportunistic
SUNRISE LAKE NHLAK600030601-05-01 MIDDLETON STRAFFORD WINMOU-GEN Opportunistic
SUNSET LAKE NHLAK700030105-03-01 GREENFIELD HILLSBOROUGH WINPLAC-GEN Opportunistic
SWAINS LAKE NHLAK600030903-03 BARRINGTON STRAFFORD WINSGIL-GEN Opportunistic
SWANZEY LAKE NHLAK802010302-01-01 SWANZEY CHESHIRE WOOROX-GEN Opportunistic
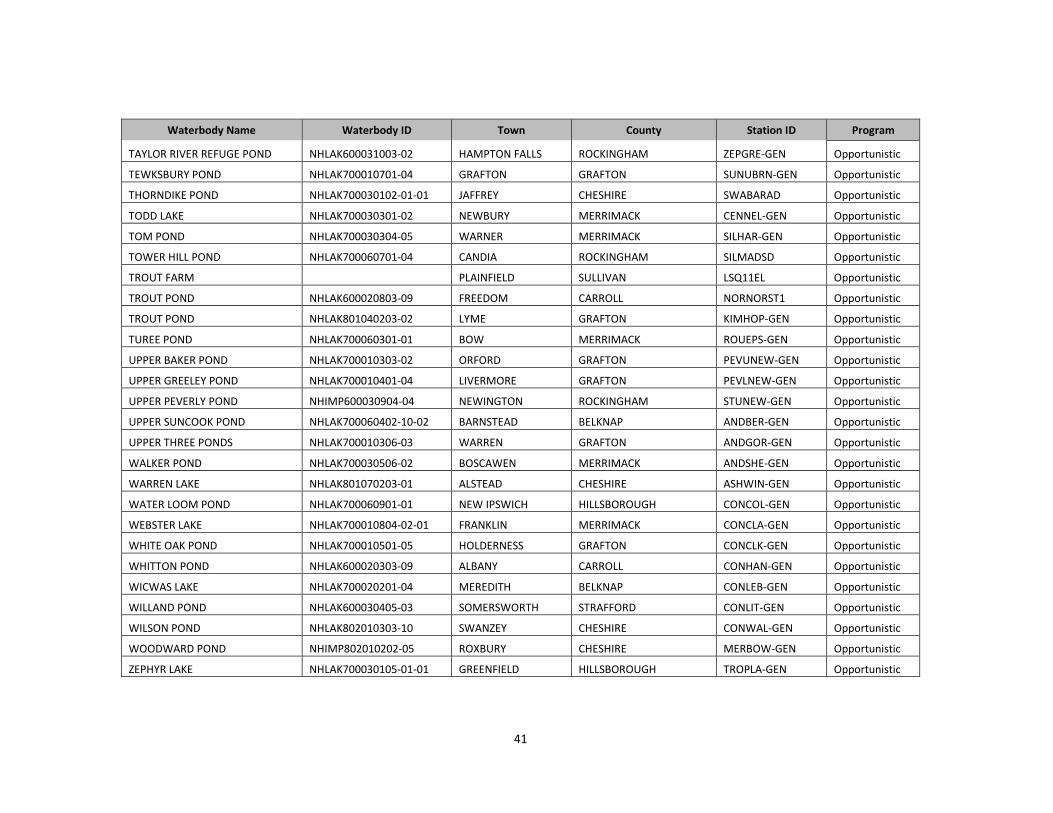
41
Waterbody Name Waterbody ID Town County Station ID Program
TAYLOR RIVER REFUGE POND NHLAK600031003-02 HAMPTON FALLS ROCKINGHAM ZEPGRE-GEN Opportunistic
TEWKSBURY POND NHLAK700010701-04 GRAFTON GRAFTON SUNUBRN-GEN Opportunistic
THORNDIKE POND NHLAK700030102-01-01 JAFFREY CHESHIRE SWABARAD Opportunistic
TODD LAKE NHLAK700030301-02 NEWBURY MERRIMACK CENNEL-GEN Opportunistic
TOM POND NHLAK700030304-05 WARNER MERRIMACK SILHAR-GEN Opportunistic
TOWER HILL POND NHLAK700060701-04 CANDIA ROCKINGHAM SILMADSD Opportunistic
TROUT FARM PLAINFIELD SULLIVAN LSQ11EL Opportunistic
TROUT POND NHLAK600020803-09 FREEDOM CARROLL NORNORST1 Opportunistic
TROUT POND NHLAK801040203-02 LYME GRAFTON KIMHOP-GEN Opportunistic
TUREE POND NHLAK700060301-01 BOW MERRIMACK ROUEPS-GEN Opportunistic
UPPER BAKER POND NHLAK700010303-02 ORFORD GRAFTON PEVUNEW-GEN Opportunistic
UPPER GREELEY POND NHLAK700010401-04 LIVERMORE GRAFTON PEVLNEW-GEN Opportunistic
UPPER PEVERLY POND NHIMP600030904-04 NEWINGTON ROCKINGHAM STUNEW-GEN Opportunistic
UPPER SUNCOOK POND NHLAK700060402-10-02 BARNSTEAD BELKNAP ANDBER-GEN Opportunistic
UPPER THREE PONDS NHLAK700010306-03 WARREN GRAFTON ANDGOR-GEN Opportunistic
WALKER POND NHLAK700030506-02 BOSCAWEN MERRIMACK ANDSHE-GEN Opportunistic
WARREN LAKE NHLAK801070203-01 ALSTEAD CHESHIRE ASHWIN-GEN Opportunistic
WATER LOOM POND NHLAK700060901-01 NEW IPSWICH HILLSBOROUGH CONCOL-GEN Opportunistic
WEBSTER LAKE NHLAK700010804-02-01 FRANKLIN MERRIMACK CONCLA-GEN Opportunistic
WHITE OAK POND NHLAK700010501-05 HOLDERNESS GRAFTON CONCLK-GEN Opportunistic
WHITTON POND NHLAK600020303-09 ALBANY CARROLL CONHAN-GEN Opportunistic
WICWAS LAKE NHLAK700020201-04 MEREDITH BELKNAP CONLEB-GEN Opportunistic
WILLAND POND NHLAK600030405-03 SOMERSWORTH STRAFFORD CONLIT-GEN Opportunistic
WILSON POND NHLAK802010303-10 SWANZEY CHESHIRE CONWAL-GEN Opportunistic
WOODWARD POND NHIMP802010202-05 ROXBURY CHESHIRE MERBOW-GEN Opportunistic
ZEPHYR LAKE NHLAK700030105-01-01 GREENFIELD HILLSBOROUGH TROPLA-GEN Opportunistic

42
Waterbody Name Waterbody ID Town County Station ID Program
CASS POND NHLAK802020203-01 RICHMOND CHESHIRE CASRIC-GEN Structured
CLEMENT POND NHLAK700030505-01 HOPKINTON MERRIMACK CLEHOP-GEN Structured
CROOKED POND NHLAK700060202-04 LOUDON MERRIMACK CROLOU-GEN Structured
CRYSTAL LAKE NHLAK801060104-01 ENFIELD GRAFTON CRYENF-GEN Structured
HARVEY LAKE NHLAK700060502-05 NORTHWOOD ROCKINGHAM HARNOR-GEN Structured
HUBBARD POND NHLAK700030101-10 RINDGE CHESHIRE HUBRIN-GEN Structured
FOREST LAKE NHLAK801030101-02-01 DALTON COOS FORDAL-GEN Structured
GORHAM POND NHLAK700060603-01 DUNBARTON MERRIMACK GORDUN-GEN Structured
TURTLE POND NHLAK700060302-08 CONCORD MERRIMACK TURCON-GEN Structured
SPECTACLE POND NHLAK801060102-03 ENFIELD GRAFTON SPEENF-GEN Structured

43
Appendix C – Summary of mercury concentrations in largemouth bass for individual waterbodies. (+) indicates an increasing tendency; (-) indicates a decreasing tendency; mean standard error across waterbodies = 0.050. * Applied overall mean standard error to species.
Waterbody Program Type Year
Adjusted Mean Concentration (mg Hg/kg fish
tissue)
Standard Error
Number of Fish
Mean length (cm)
Lake Tendency
Ashuelot Pond Opportunistic 2001 0.70 0.06 5 31.2
Increasing 2003 0.83 0.05 8 29.1
Cass Pond Structured
2001 0.60 0.05 5 31.1
Mixed 2004 0.66 0.04 6 32.3
2009 0.75 0.06 5 33.5
2014 0.44 0.04 5 32.5
Clement Pond Structured 1998 0.25 0.05 5 34.0
Mixed 2003 0.39 0.03 8 29.1
2008 0.40 0.04 5 30.7
Crooked Pond Structured 2000 0.47 0.04 5 32.6
Decreasing 2010 0.39 0.04 5 32.4
2015 0.32 0.04 5 34.5
Forest Lake Structured 2001 0.29 0.05 5 31.6
Mixed 2006 0.31 0.05 5 32.1
2011 0.22 0.05 5 28.9
Harvey Lake Structured 2001 0.39 0.11 5 29.2
Mixed 2006 0.47 0.04 5 29.8
2011 0.41 0.04 5 35.3
Hubbard Pond Structured 2004 0.95 0.16 5 31.1
Decreasing 2009 0.89 0.13 5 34.3
Gorham Pond Structured
1998 0.32 0.05 5 31.2
Mixed 2003 0.71 0.03 10 28.3
2008 0.78 0.05 5 28.9
2013 0.41 0.04 5 27.1
Mendums Lake Opportunistic 2011 0.51 0.03 14 33.0
Increasing 2012 0.68 0.05 10 27.4
Turtle Pond Structured
2000 0.51 0.05* 5 31.8
Mixed 2005 0.80 0.05* 5 32.5
2010 0.50 0.05* 5 36.8
2015 0.52 0.05* 5 30.2

44
Appendix D – Summary of mercury concentrations in yellow perch for individual waterbodies. (+) indicates an increasing tendency; (-) indicates a decreasing tendency; mean standard error across waterbodies = 0.052.
Waterbody Program Type Year
Adjusted Mean Concentration (mg Hg/kg fish
tissue)
Standard Error
Number of Fish
Mean length (cm)
Lake Tendency
Angle Pond Opportunistic 2002 0.38 0.04 5 26.1
Increasing 2006 0.39 0.03 7 28.6
Bellemy Reservoir Opportunistic 1997 0.53 0.04 5 22.4
Decreasing 2000 0.38 0.02 10 23.0
Dan Hole Pond Opportunistic 2014 0.25 0.05 5 15.6
Decreasing 2016 0.24 0.06 5 23.2
Bow Lake Opportunistic 2000 0.34 0.04 5 15.9
Mixed 2011 0.20 0.02 10 16.7
2012 0.24 0.01 20 16.1
Canobie Lake Opportunistic 2000 0.28 0.02 5 24.0
Decreasing 2006 0.17 0.03 6 18.8
Clement Pond Structured
1998 0.20 0.10 5 16.1
Mixed 2008 0.18 0.11 5 16.2
2009 0.26 0.03 10 21.5
2014 0.18 0.02 10 20.1
Comeford Reservoir Opportunistic 1998 0.43 0.05 16 23.2
Mixed 2003 0.20 0.02 24 17.9
2008 0.23 0.01 91 17.5
Crooked Pond Structured 2002 0.24 0.04 5 21.0
Mixed 2007 0.15 0.04 5 21.7
2012 0.29 0.09 6 19.3
Crystal Lake, Enfield Structured 2002 0.24 0.05 5 21.7
Mixed 2007 0.15 0.04 5 18.4
2012 0.29 0.05 5 18.6
Crystal Lake, Gilmanton Opportunistic 1998 0.29 0.04 9 26.0
Increasing 2004 0.50 0.05 6 20.6
2005 0.54 0.14 7 17.0
Dubes Pond Opportunistic 2001 0.54 0.06 5 20.1
Increasing 2006 0.80 0.07 5 19.7
Eastman Lake Opportunistic 2014 0.14 0.01 5 19.3
Increasing 2015 0.17 0.01 6 20.6

45
Waterbody Program Type Year
Adjusted Mean Concentration (mg Hg/kg fish
tissue)
Standard Error
Number of Fish
Mean length (cm)
Lake Tendency
Forest Lake Structured 2001 0.36 0.12 5 24.6
Mixed 2006 0.13 0.04 5 17.9
2011 0.14 0.02 6 20.3
Goose Pond Opportunistic 2009 0.47 0.06 6 20.0
Decreasing 2010 0.34 0.08 7 16.0
Gorham Pond Structured 1998 0.25 0.02 5 20.2
No change 2008 0.26 0.02 5 21.7
Grassy Pond Opportunistic 2007 0.50 0.04 10 20.1
Increasing 2009 0.52 0.04 10 22.4
Great Pond, Kingston Opportunistic 2006 0.24 0.03 5 20.4
No change 2007 0.25 0.03 5 20.2
Harvey Lake Structured 2001 0.29 0.04 5 19.5
Decreasing 2006 0.20 0.03 5 21.6
Hubbard Pond Structured 2000 0.25 0.05 7 23.2
Increasing 2004 0.33 0.03 8 21.9
2009 0.54 0.06 5 21.1
Jenness Pond Opportunistic 1999 0.20 0.02 5 18.0
Increasing 2000 0.31 0.02 5 17.2
Lakins Pond Opportunistic 2001 0.49 0.04 5 21.3
Decreasing 2006 0.39 0.03 5 22.9
May Pond Opportunistic
1995 0.52 0.14 5 21.2
Mixed 1996 0.67 0.04 12 19.3
2004 0.53 0.05 8 20.2
2007 0.55 0.04 11 18.0
Mendums Pond Opportunistic 2000 0.39 0.04 5 21.6
Mixed 2011 0.24 0.03 10 16.0
2012 0.30 0.02 20 17.5
Moore Reservoir Opportunistic 1998 0.08 0.07 11 23.8
Mixed 2003 0.31 0.02 22 19.5
2008 0.27 0.01 70 15.4
Northwood Lake Opportunistic 1998 0.22 0.04 21 11.9
Decreasing 2000 0.14 0.11 5 23.5
Pawtuckaway Lake Opportunistic 1999 0.10 0.09 5 24.1
Increasing 2012 0.20 0.02 20 18.2
Robb Reservoir Opportunistic 1999 0.52 0.05 5 21.4 Decreasing

46
Waterbody Program Type Year
Adjusted Mean Concentration (mg Hg/kg fish
tissue)
Standard Error
Number of Fish
Mean length (cm)
Lake Tendency
2006 0.45 0.06 5 24.5
Spectacle Pond Structured 2002 0.34 0.03 5 18.0
Decreasing 2007 0.21 0.03 5 19.4
2012 0.16 0.02 11 18.5
Sunrise Lake Opportunistic 1999 0.16 0.02 5 17.3
Increasing 2008 0.22 0.01 10 17.3
Swains Lake Opportunistic 1998 0.34 0.04 26 11.2
Decreasing 2011 0.19 0.02 10 16.5
2012 0.13 0.03 20 21.1
Turee Pond Opportunistic
2001 0.40 0.10 5 22.4
Mixed 2010 0.33 0.05 6 24.0
2011 0.24 0.08 5 24.8
2014 0.41 0.05 6 23.2
Turtle Pond Structured
2000 0.43 0.14 5 23.5
Mixed 2005 0.71 0.08 5 22.7
2010 0.37 0.06 6 22.9
2015 0.31 0.11 5 19.4
Warren Lake Opportunistic 2008 0.38 0.04 6 22.5
Decreasing 2009 0.36 0.03 10 22.0
Wilson Pond Opportunistic 1999 0.11 0.01 5 17.6
Increasing 2006 0.12 0.01 10 17.0

47
Appendix E – Formulas and example calculations of risk-based consumption limit used in New Hampshire fish advisory using average fish concentration assumed by NHDES and EPA-recommended water quality criteria.
Formulas: Where: CR = Maximum allowable consumption rate (kg / day) RfD = toxicological reference dose for methylmercury (MeHg)
(0.0003 mg / kg / day for children 7 years or older and other adults) (0.0001 mg / kg / day for woman of childbearing age and children under 7 years of age)
BW = Body weight (70 kg; weight of average adult males and females in US population) (61 kg; weight of average adult females in US population)
Cfish = Reference concentration of fish used to set advisory (0.70 mg / kg; average concentration assumed by NHDES) (0.30 mg / kg; EPA recommended water quality criteria) Where: Days per month = 30.4 Portion size = 8 ounces (0.227kg) Examples (using RfD of 0.0003 mg / kg and body weight of 70kg):
CR = 𝑅𝑅𝑅 𝑥 𝐵𝐵𝐶𝑅𝑓𝑓ℎ
RBCL = 𝐶𝑅 𝑥 𝑑𝑑𝑑𝑓 𝑝𝑝𝑝 𝑚𝑚𝑚𝑚ℎ𝑃𝑚𝑝𝑚𝑓𝑚𝑚 𝑆𝑓𝑆𝑝
CR = 0.0003 𝑚𝑚 𝐻𝑚 /𝑘𝑚 𝐵𝐵/𝑑𝑑𝑑 𝑥 70𝑘𝑚 𝐵𝐵0.30 𝑚𝑚 𝐻𝑚/𝑘𝑚𝑓𝑅𝑓𝑓ℎ
CR = 0.070 𝑘𝑘 𝑓𝑓𝑓ℎ/𝑑𝑑𝑑
RBCL = 0.070 𝑘𝑚𝑅𝑓𝑓ℎ/𝑑𝑑𝑑 𝑥 30.4 𝑑𝑑𝑑𝑓/𝑚𝑚𝑚𝑚ℎ0.227 𝑘𝑚 /𝑚𝑝𝑑𝑚
RBCL = 𝟗 𝒎𝒎𝒎𝒎𝒎/𝒎𝒎𝒎𝒎𝒎
EPA reference concentration
CR = 0.0003 𝑚𝑚 𝐻𝑚 /𝑘𝑚 𝐵𝐵/𝑑𝑑𝑑 𝑥 70𝑘𝑚 𝐵𝐵0.70 𝑚𝑚 𝐻𝑚/𝑘𝑚𝑓𝑅𝑓𝑓ℎ
CR = 0.030 𝑘𝑘 𝑓𝑓𝑓ℎ/𝑑𝑑𝑑
RBCL = 0.030 𝑘𝑚𝑅𝑓𝑓ℎ/𝑑𝑑𝑑 𝑥 30.4 𝑑𝑑𝑑𝑓/𝑚𝑚𝑚𝑚ℎ0.227 𝑘𝑚 /𝑚𝑝𝑑𝑚
RBCL = 𝟒 𝒎𝒎𝒎𝒎𝒎/𝒎𝒎𝒎𝒎𝒎
NHDES reference concentration