status and trends of the nation's biological resources ... · pdf fileconsumptive...
TRANSCRIPT
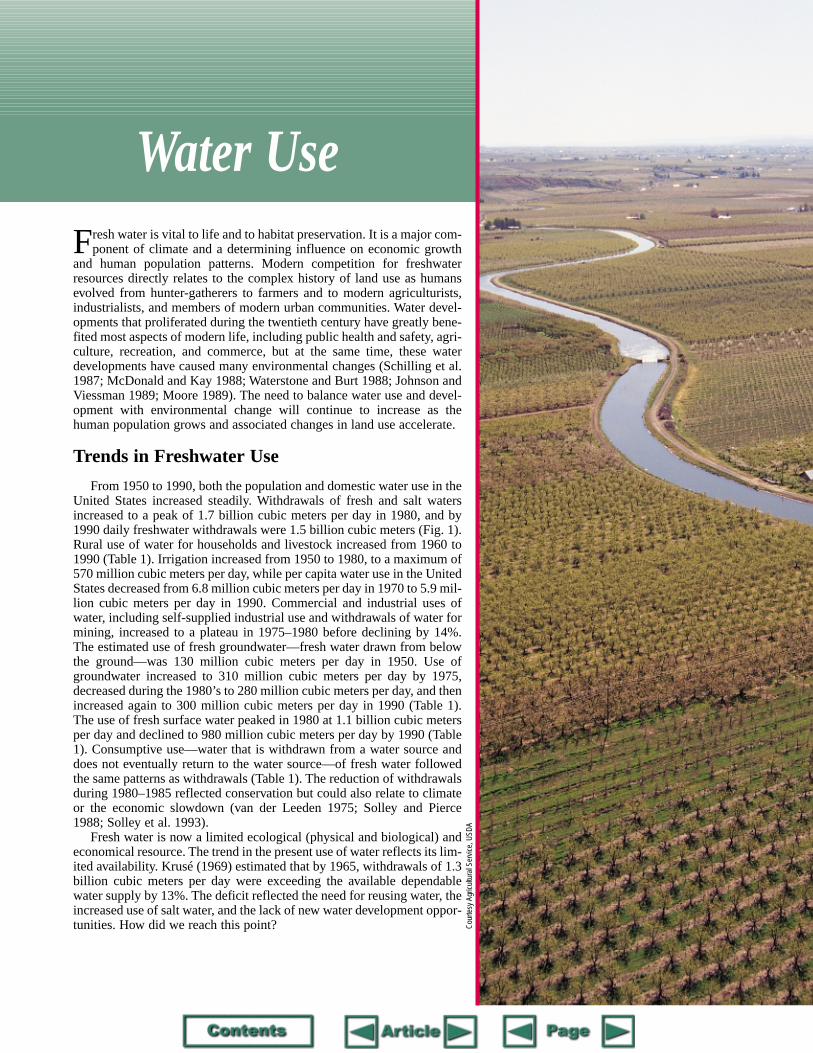
Water UseFresh water is vital to life and to habitat preservation. It is a major com-
ponent of climate and a determining influence on economic growthand human population patterns. Modern competition for freshwaterresources directly relates to the complex history of land use as humansevolved from hunter-gatherers to farmers and to modern agriculturists,industrialists, and members of modern urban communities. Water devel-opments that proliferated during the twentieth century have greatly bene-fited most aspects of modern life, including public health and safety, agri-culture, recreation, and commerce, but at the same time, these waterdevelopments have caused many environmental changes (Schilling et al.1987; McDonald and Kay 1988; Waterstone and Burt 1988; Johnson andViessman 1989; Moore 1989). The need to balance water use and devel-opment with environmental change will continue to increase as thehuman population grows and associated changes in land use accelerate.
Trends in Freshwater Use
From 1950 to 1990, both the population and domestic water use in theUnited States increased steadily. Withdrawals of fresh and salt watersincreased to a peak of 1.7 billion cubic meters per day in 1980, and by
1990 daily freshwater withdrawals were 1.5 billion cubic meters (Fig. 1).Rural use of water for households and livestock increased from 1960 to1990 (Table 1). Irrigation increased from 1950 to 1980, to a maximum of570 million cubic meters per day, while per capita water use in the UnitedStates decreased from 6.8 million cubic meters per day in 1970 to 5.9 mil-lion cubic meters per day in 1990. Commercial and industrial uses ofwater, including self-supplied industrial use and withdrawals of water formining, increased to a plateau in 1975–1980 before declining by 14%.The estimated use of fresh groundwater—fresh water drawn from belowthe ground—was 130 million cubic meters per day in 1950. Use ofgroundwater increased to 310 million cubic meters per day by 1975,decreased during the 1980’s to 280 million cubic meters per day, and thenincreased again to 300 million cubic meters per day in 1990 (Table 1).The use of fresh surface water peaked in 1980 at 1.1 billion cubic metersper day and declined to 980 million cubic meters per day by 1990 (Table1). Consumptive use—water that is withdrawn from a water source anddoes not eventually return to the water source—of fresh water followedthe same patterns as withdrawals (Table 1). The reduction of withdrawalsduring 1980–1985 reflected conservation but could also relate to climateor the economic slowdown (van der Leeden 1975; Solley and Pierce1988; Solley et al. 1993).Fresh water is now a limited ecological (physical and biological) andeconomical resource. The trend in the present use of water reflects its lim-ited availability. Krusé (1969) estimated that by 1965, withdrawals of 1.3billion cubic meters per day were exceeding the available dependablewater supply by 13%. The deficit reflected the need for reusing water, theincreased use of salt water, and the lack of new water development oppor-tunities. How did we reach this point? C
ourte
sy A
gric
ultu
ral S
ervi
ce, U
SDA
64 Status and Trends of the Nations’s Biological Resources — Volume 1
History of Water Use in theUnited States
The beginning of water development inNorth America can be traced to between A.D.600 and A.D. 800, when the Hohokam Indians ofsouthern Arizona dug irrigation canals for corn-
aFor years before 1960, data include the contiguous United States; 1960 –1965, the 50 states; 1970, the 50 states and Puerto Rico; and after 1970, the 50 states, Puerto Rico, and the Virgin Islands.For 1970 and after, consumptive use values are for fresh water only.bThe numbers in this column are not column totals because of rounding.
1950 1955 1960 1965 1970 1975 1980 1985 1990
Offstream useTotal withdrawalsb 680 910 1,000 1,200 1,400 1,600 1,700 1,500 1,500
Public supply 53 64 79 91 100 110 130 140 150Rural domestic livestock 14 14 14 15 17 19 21 29 30Irrigation 340 420 420 450 490 530 570 520 520Industrial
Thermoelectric power 150 270 380 490 640 760 790 710 740Other 140 150 140 170 180 170 170 120 110
Source of waterGroundwater
Fresh 130 180 190 230 260 310 310 280 300Saline 2.3 1.5 1.9 3.8 3.8 3.4 2.5 4.6
Surface waterFresh 530 680 720 790 950 980 1,100 1,000 980Saline 38 68 120 160 200 260 270 230 260
Reclaimed water 0.8 2.3 2.6 1.9 1.9 1.9 2.2 2.8Consumptive use 230 290 330 360 380 350 360Instream useHydroelectric power 4,200 5,700 7,600 8,700 10,600 12,500 12,500 11,500 12,500
Table 1. Water use in the United States, 1950 –1990a (in million cubic meters per day; modified from Solley et al. 1993).
600
500
400
300
200
e (b
illion
s of
cub
ic m
eter
s)
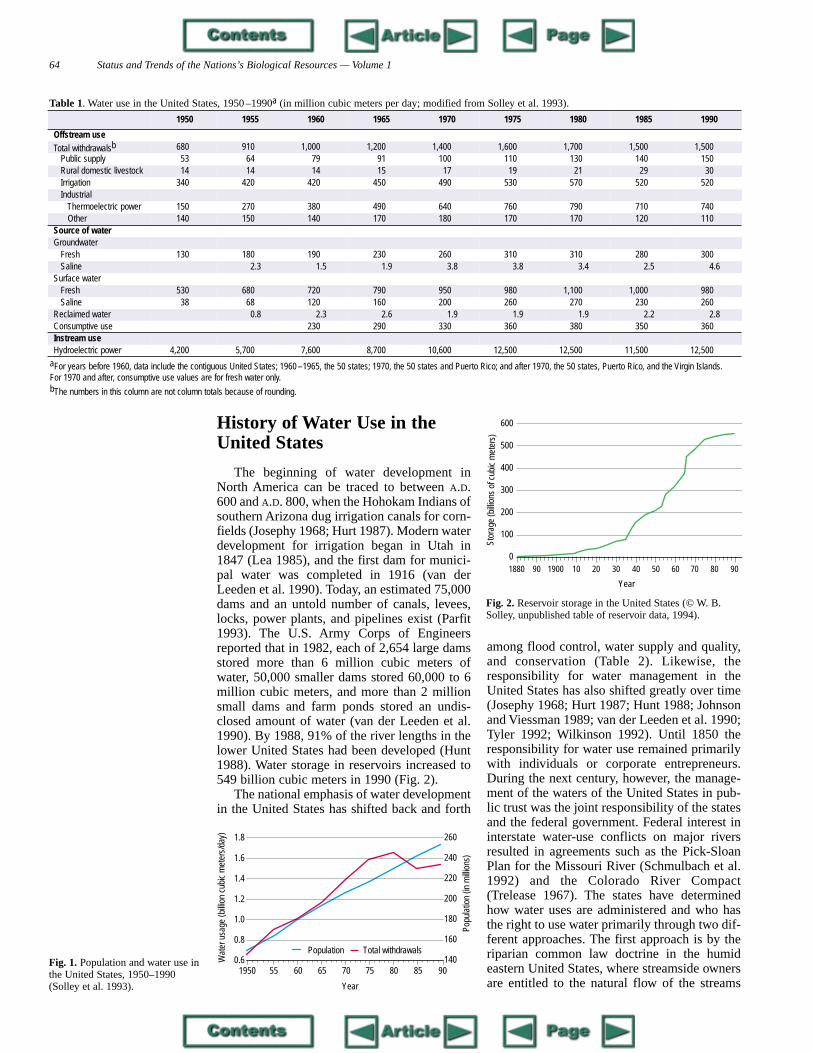
fields (Josephy 1968; Hurt 1987). Modern waterdevelopment for irrigation began in Utah in1847 (Lea 1985), and the first dam for munici-pal water was completed in 1916 (van derLeeden et al. 1990). Today, an estimated 75,000dams and an untold number of canals, levees,locks, power plants, and pipelines exist (Parfit1993). The U.S. Army Corps of Engineersreported that in 1982, each of 2,654 large damsstored more than 6 million cubic meters ofwater, 50,000 smaller dams stored 60,000 to 6million cubic meters, and more than 2 millionsmall dams and farm ponds stored an undis-closed amount of water (van der Leeden et al.1990). By 1988, 91% of the river lengths in thelower United States had been developed (Hunt1988). Water storage in reservoirs increased to549 billion cubic meters in 1990 (Fig. 2).
The national emphasis of water developmentin the United States has shifted back and forth
among flood control, water supply and quality,and conservation (Table 2). Likewise, theresponsibility for water management in theUnited States has also shifted greatly over time(Josephy 1968; Hurt 1987; Hunt 1988; Johnsonand Viessman 1989; van der Leeden et al. 1990;Tyler 1992; Wilkinson 1992). Until 1850 theresponsibility for water use remained primarilywith individuals or corporate entrepreneurs.During the next century, however, the manage-ment of the waters of the United States in pub-lic trust was the joint responsibility of the statesand the federal government. Federal interest ininterstate water-use conflicts on major riversresulted in agreements such as the Pick-SloanPlan for the Missouri River (Schmulbach et al.1992) and the Colorado River Compact(Trelease 1967). The states have determinedhow water uses are administered and who hasthe right to use water primarily through two dif-ferent approaches. The first approach is by theriparian common law doctrine in the humideastern United States, where streamside ownersare entitled to the natural flow of the streams
Fig. 1. Population and water use inthe United States, 1950–1990(Solley et al. 1993).
1950 55 60 65 70 75 80 85 90
1.8
1.6
1.4
1.2
1.0
0.8
0.6Wat
er u
sage
(billi
on c
ubic
met
ers/
day)
Popu
latio
n (in
milli
ons)
260
240
220
200
180
160
140Population Total withdrawals
Year
Fig. 2. Reservoir storage in the United States (© W. B.Solley, unpublished table of reservoir data, 1994).
1880 90 1900 10 20 30 40 50 60 70 80 90
100
0
Stor
ag
Year
Factors Affecting Biological Resources — Water Use 65
past their land, substantially undiminished inquantity and unimpaired in quality (that is, areasonable use of water consistent with like useby others). The second approach is by the priorappropriation doctrine in the arid westernUnited States, where first in time is first in right,and beneficial use of water (not landownership)and priority of use (not equality of right) are thebasis for division when there is not enoughwater for everyone (Trelease 1967). These legalapproaches reflect the public interest in theavailability of water for beneficial uses. Majorfederal projects that support national purposesand respond to national emergencies andregional needs also had a significant influenceon the nature of water development during thenineteenth century (Table 2).
Effects of Water Use onWatersheds
The withdrawal of water or the alteration ofwater quality elicits responses in watersheds—the area drained by a stream or river. Thesealterations occur even in the most remoteplaces, and responses include changes in bio-logical diversity and ultimately in the entirelandscape (Ward and Stanford 1979; Beckerand Neitzel 1992; Pederson 1994). In fact, few
Date Event
A.D. 600–800 Diversion of water for irrigation by the Hohokam Indians
1824 General Survey Act: the U.S. Army Corps of Engineers given responsibility for navigation and flood control of the Mississippi River and other rivers
1847 First modern U.S. irrigation project, Salt Lake City, Utah1848, 1850 Swamp Lands Acts: first federal activity in water resources management1870 Irrigation in Greeley, Colorado1899 Rivers and Harbors Act as amended through 19771902 Reclamation Act: established the Reclamation Service—responsible for irrigation of arid land
1916 Ashokan Dam on Esopus Creek near Olive Bridge, New York, completed. First high dam in United States (over 75 meters high and 1.9 million cubic meters in volume content)
1917, 1928, 1936, 1938 Flood Control Acts: emphasized flood control, not water resources management
1920 Federal Water Power Act: created Federal Power Commission to regulate water resources1922 Colorado River Compact: divided the states' rights to use the Colorado River1933 Bureau of Reclamation joined Public Works Administration1933 Tennessee Valley Authority created, ultimately changing the lower Ohio and Tennessee River valleys1935 Soil Conservation Service created1936 Flood Control Act: had the first benefit–cost analysis for water development1936 Hoover Dam–Lake Mead started operation: supplied power to the urban West1938 Soil Conservation Service given responsibility for flood and soil erosion control1938-1956 Colorado–Big Thompson Project: largest transfer across the Continental Divide1948 Upper Colorado River Compact1956 Federal Water Pollution Control Act (as amended P.L. 92-500, 1972)1965 Water Resources Planning Act: mandated river basin planning1968 Wild and Scenic Rivers Act: effort to protect the remaining undeveloped U.S. rivers1969 National Environmental Policy Act 1970 Rivers and Harbors Act1973 Endangered Species Act1977 Safe Drinking Water Act1977 Clean Water Act, with the Safe Drinking Water Act, provided safe, clean water to the general public
mbia
Table 2. Events that characterize water use in the United States.
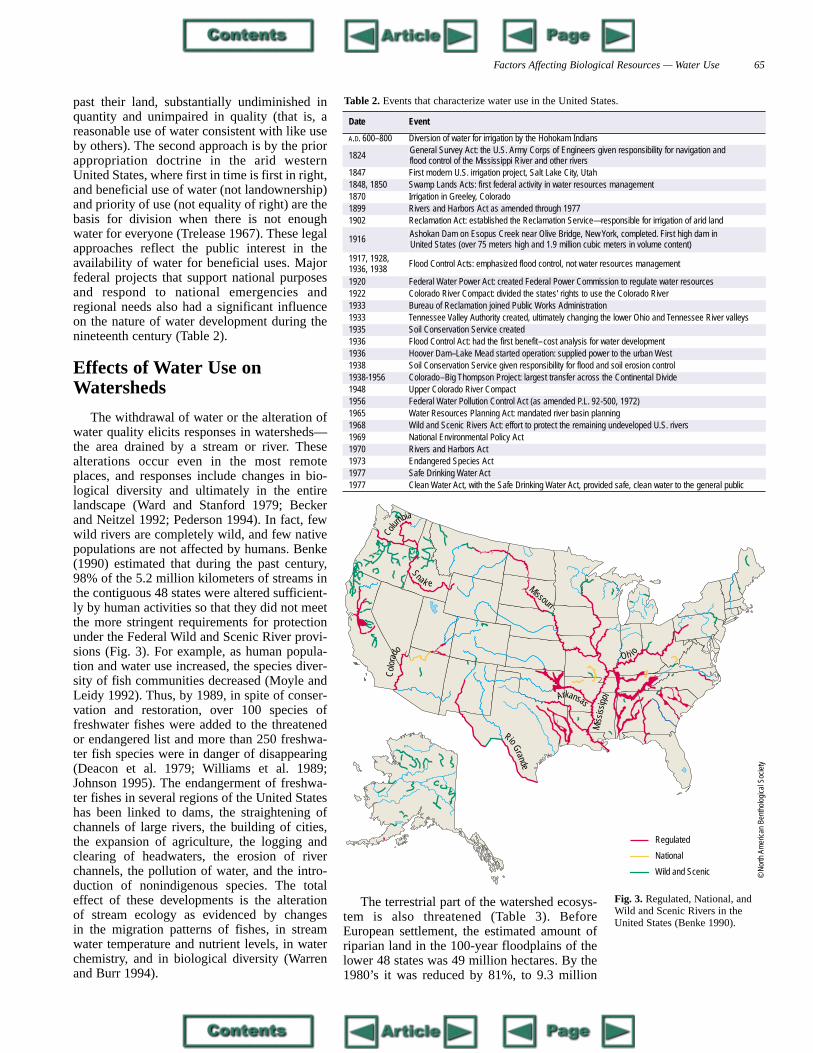
wild rivers are completely wild, and few nativepopulations are not affected by humans. Benke(1990) estimated that during the past century,98% of the 5.2 million kilometers of streams inthe contiguous 48 states were altered sufficient-ly by human activities so that they did not meetthe more stringent requirements for protectionunder the Federal Wild and Scenic River provi-sions (Fig. 3). For example, as human popula-tion and water use increased, the species diver-sity of fish communities decreased (Moyle andLeidy 1992). Thus, by 1989, in spite of conser-vation and restoration, over 100 species offreshwater fishes were added to the threatenedor endangered list and more than 250 freshwa-ter fish species were in danger of disappearing(Deacon et al. 1979; Williams et al. 1989;Johnson 1995). The endangerment of freshwa-ter fishes in several regions of the United Stateshas been linked to dams, the straightening ofchannels of large rivers, the building of cities,the expansion of agriculture, the logging andclearing of headwaters, the erosion of riverchannels, the pollution of water, and the intro-duction of nonindigenous species. The totaleffect of these developments is the alteration of stream ecology as evidenced by changes in the migration patterns of fishes, in streamwater temperature and nutrient levels, in waterchemistry, and in biological diversity (Warrenand Burr 1994).
The terrestrial part of the watershed ecosys-tem is also threatened (Table 3). BeforeEuropean settlement, the estimated amount ofriparian land in the 100-year floodplains of thelower 48 states was 49 million hectares. By the1980’s it was reduced by 81%, to 9.3 million
Regulated
National
Wild and Scenic
Rio Grande
Col
orad
o
Snak e
Colu
Missouri
Arkansas
Mis
siss
ippi
Oh io
Fig. 3. Regulated, National, andWild and Scenic Rivers in theUnited States (Benke 1990).
© N
orth
Am
eric
an B
enth
olog
ical
Soc
iety
66 Status and Trends of the Nations’s Biological Resources — Volume 1
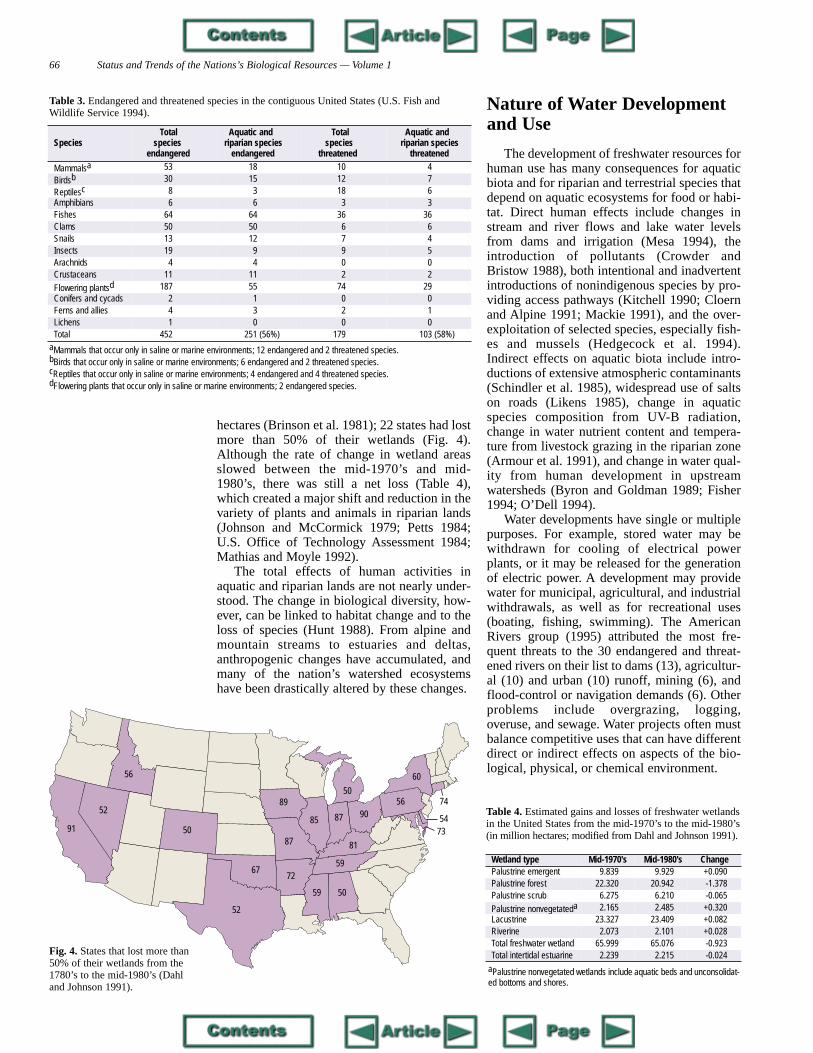
hectares (Brinson et al. 1981); 22 states had lostmore than 50% of their wetlands (Fig. 4).Although the rate of change in wetland areasslowed between the mid-1970’s and mid-1980’s, there was still a net loss (Table 4),which created a major shift and reduction in thevariety of plants and animals in riparian lands
Nature of Water Developmentand Use
The development of freshwater resources forhuman use has many consequences for aquaticbiota and for riparian and terrestrial species thatdepend on aquatic ecosystems for food or habi-tat. Direct human effects include changes instream and river flows and lake water levelsfrom dams and irrigation (Mesa 1994), theintroduction of pollutants (Crowder andBristow 1988), both intentional and inadvertentintroductions of nonindigenous species by pro-viding access pathways (Kitchell 1990; Cloernand Alpine 1991; Mackie 1991), and the over-exploitation of selected species, especially fish-es and mussels (Hedgecock et al. 1994).Indirect effects on aquatic biota include intro-ductions of extensive atmospheric contaminants(Schindler et al. 1985), widespread use of saltson roads (Likens 1985), change in aquaticspecies composition from UV-B radiation,change in water nutrient content and tempera-ture from livestock grazing in the riparian zone(Armour et al. 1991), and change in water qual-ity from human development in upstreamwatersheds (Byron and Goldman 1989; Fisher1994; O’Dell 1994).
Water developments have single or multiple
aMammals that occur only in saline or marine environments; 12 endangered and 2 threatened species.bBirds that occur only in saline or marine environments; 6 endangered and 2 threatened species.cReptiles that occur only in saline or marine environments; 4 endangered and 4 threatened species.dFlowering plants that occur only in saline or marine environments; 2 endangered species.
SpeciesTotal
speciesendangered
Aquatic andriparian species
endangered
Total species
threatened
Aquatic andriparian species
threatened
Mammalsa 53 18 10 4
Birdsb 30 15 12 7
Reptilesc 8 3 18 6Amphibians 6 6 3 3Fishes 64 64 36 36Clams 50 50 6 6Snails 13 12 7 4Insects 19 9 9 5Arachnids 4 4 0 0Crustaceans 11 11 2 2
Flowering plantsd 187 55 74 29Conifers and cycads 2 1 0 0Ferns and allies 4 3 2 1Lichens 1 0 0 0Total 452 251 (56%) 179 103 (58%)
Table 3. Endangered and threatened species in the contiguous United States (U.S. Fish andWildlife Service 1994).
(Johnson and McCormick 1979; Petts 1984;U.S. Office of Technology Assessment 1984;Mathias and Moyle 1992).
The total effects of human activities inaquatic and riparian lands are not nearly under-stood. The change in biological diversity, how-ever, can be linked to habitat change and to theloss of species (Hunt 1988). From alpine andmountain streams to estuaries and deltas,anthropogenic changes have accumulated, andmany of the nation’s watershed ecosystemshave been drastically altered by these changes.
purposes. For example, stored water may bewithdrawn for cooling of electrical powerplants, or it may be released for the generationof electric power. A development may providewater for municipal, agricultural, and industrialwithdrawals, as well as for recreational uses(boating, fishing, swimming). The AmericanRivers group (1995) attributed the most fre-quent threats to the 30 endangered and threat-ened rivers on their list to dams (13), agricultur-al (10) and urban (10) runoff, mining (6), andflood-control or navigation demands (6). Otherproblems include overgrazing, logging,overuse, and sewage. Water projects often mustbalance competitive uses that can have differentdirect or indirect effects on aspects of the bio-logical, physical, or chemical environment.
54
74
73
60
569087
50
85
87
72
81
59
59 50
67
52
89
50
56
52
91
Fig. 4. States that lost more than50% of their wetlands from the1780’s to the mid-1980’s (Dahland Johnson 1991).
aPalustrine nonvegetated wetlands include aquatic beds and unconsolidat-ed bottoms and shores.
Wetland type Mid-1970's Mid-1980's ChangePalustrine emergent 9.839 9.929 +0.090Palustrine forest 22.320 20.942 -1.378Palustrine scrub 6.275 6.210 -0.065
Palustrine nonvegetateda 2.165 2.485 +0.320Lacustrine 23.327 23.409 +0.082Riverine 2.073 2.101 +0.028Total freshwater wetland 65.999 65.076 -0.923Total intertidal estuarine 2.239 2.215 -0.024
Table 4. Estimated gains and losses of freshwater wetlandsin the United States from the mid-1970’s to the mid-1980’s(in million hectares; modified from Dahl and Johnson 1991).
Factors Affecting Biological Resources — Water Use 67
Flood Control
Flood-control structures (dams, levees, anddiversions) may hold back excess runoff(upstream dams), speed runoff (channelization),confine runoff (levees), or do all three for largeriver basins such as the Missouri–MississippiRiver basins. Flood-control structures do notconsume water but remove water from riversand aquatic ecosystems. When flood-controlsystems fail, the consequences are often cata-strophic for the farmlands and cities for whichthe flood control was provided. The effects offlood control on ecosystems of the Red River, atributary to the Mississippi River, include shiftsfrom river to lacustrine aquatic habitats, changefrom river forests to open land from conversionto agriculture, and loss of species richness inhabitats (Hardaway and Yakupzak 1981). Forexample, in the Yazoo Basin on the MississippiRiver, flood control caused a significant declinein the quality of the aquatic ecosystem. Only20% of the stream length now supports a fish-ery, and even fewer kilometers support a sportfishery (U.S. Fish and Wildlife Service 1979).Since 1870 in south-central Oklahoma, 87% ofthe riparian forests and 17% of the channellength have been eliminated by flood control(Barclay 1978).
modern pollution in the upper third of the river,reduced biological diversity. For example,although 159 fish species were identifiedbetween 1819 and 1988, since 1970, 13 of thesespecies have not been found (Pearson 1992).
In Florida, the Jim Woodruff Dam, whichopened in 1957, now traps almost all silt anddebris from the Chattahoochee and Flint rivers,reducing the flow of nutrients and sediments tothe Apalachicola Bay. Dams on theChattahoochee and Flint rivers eliminated thestriped bass fishery and caused a shift to roughand forage fish species (Livingston 1984; Hunt1988).
Similarly, in the major rivers of the MobileBay basin, dams eliminated many aquaticspecies that still occur in the smaller tributaries.Construction of the Tennessee–Tombigbee
5,000
4,000
3,000
2,000
1,000
0 1939 44 49 54 59 64 69 74 79 84 89
Total traffic volume Traffic on inland waterways
Volu
me
(billi
ons
of m
etric
ton-
kilo
met
ers)
Year
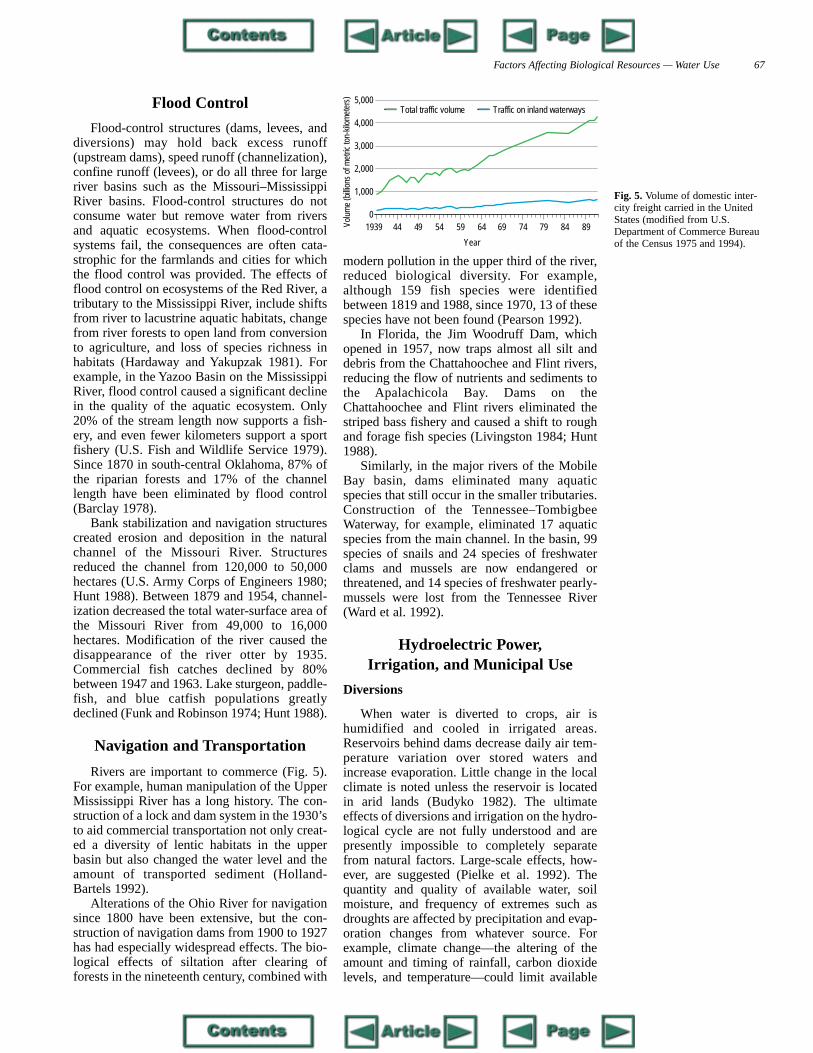
Fig. 5. Volume of domestic inter-city freight carried in the UnitedStates (modified from U.S.Department of Commerce Bureauof the Census 1975 and 1994).
Bank stabilization and navigation structurescreated erosion and deposition in the naturalchannel of the Missouri River. Structuresreduced the channel from 120,000 to 50,000hectares (U.S. Army Corps of Engineers 1980;Hunt 1988). Between 1879 and 1954, channel-ization decreased the total water-surface area ofthe Missouri River from 49,000 to 16,000hectares. Modification of the river caused thedisappearance of the river otter by 1935.Commercial fish catches declined by 80%between 1947 and 1963. Lake sturgeon, paddle-fish, and blue catfish populations greatlydeclined (Funk and Robinson 1974; Hunt 1988).
Navigation and Transportation
Rivers are important to commerce (Fig. 5).For example, human manipulation of the UpperMississippi River has a long history. The con-struction of a lock and dam system in the 1930’sto aid commercial transportation not only creat-ed a diversity of lentic habitats in the upperbasin but also changed the water level and theamount of transported sediment (Holland-Bartels 1992).
Alterations of the Ohio River for navigationsince 1800 have been extensive, but the con-struction of navigation dams from 1900 to 1927has had especially widespread effects. The bio-logical effects of siltation after clearing offorests in the nineteenth century, combined with
Waterway, for example, eliminated 17 aquaticspecies from the main channel. In the basin, 99species of snails and 24 species of freshwaterclams and mussels are now endangered orthreatened, and 14 species of freshwater pearly-mussels were lost from the Tennessee River(Ward et al. 1992).
Hydroelectric Power,Irrigation, and Municipal Use
Diversions
When water is diverted to crops, air ishumidified and cooled in irrigated areas.Reservoirs behind dams decrease daily air tem-perature variation over stored waters andincrease evaporation. Little change in the localclimate is noted unless the reservoir is locatedin arid lands (Budyko 1982). The ultimateeffects of diversions and irrigation on the hydro-logical cycle are not fully understood and arepresently impossible to completely separatefrom natural factors. Large-scale effects, how-ever, are suggested (Pielke et al. 1992). Thequantity and quality of available water, soilmoisture, and frequency of extremes such asdroughts are affected by precipitation and evap-oration changes from whatever source. Forexample, climate change—the altering of theamount and timing of rainfall, carbon dioxidelevels, and temperature—could limit available
68 Status and Trends of the Nations’s Biological Resources — Volume 1
water and therefore adversely affect agriculture.How soil temperature and moisture are affectedby the combination of increased precipitation,carbon dioxide, and temperature is not clear.Therefore, the effects on water caused byanthropogenic change, such as water diversions,cannot be separated easily from processes suchas climate change in any given location(MacCracken et al. 1990).
Fourteen major dams that were constructedon the Columbia River for hydroelectric pro-duction of power, transportation, and agricul-ture provide many economic benefits to theregion but changed a rapid-flowing riverecosystem to a warmer water, slow-flowingseries of impoundments (Strober and Nakatani1992). The dams inhibit or block migrating fish-es and, by flooding spawning grounds, causechanges in competition between species,changes in predator–prey relations, and adecline in the variety and numbers of native fishspecies. In 1911 the commercial fish harvest onthe river was 24,400 metric tons, but by theearly 1970’s it had declined to 6,800 metrictons. In 1949 the Lower Columbia RiverDevelopment Program was funded for fishrestoration. By 1962, 50% of the harvested cohoand chinook salmon were raised in hatcheries.Since then, other innovations, such as protec- nesting success of birds in rookeries. Because
of the loss of prey, the abundance of many
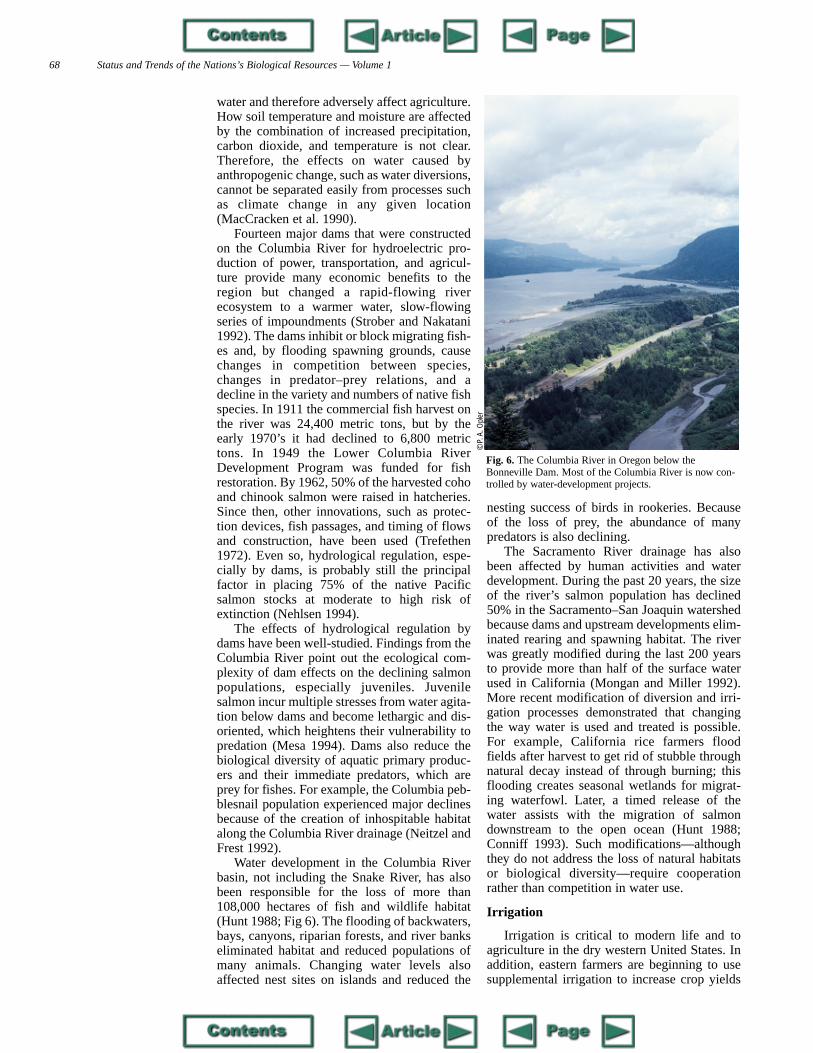
Fig. 6. The Columbia River in Oregon below theBonneville Dam. Most of the Columbia River is now con-trolled by water-development projects.
© P
. A. O
pler
tion devices, fish passages, and timing of flowsand construction, have been used (Trefethen1972). Even so, hydrological regulation, espe-cially by dams, is probably still the principalfactor in placing 75% of the native Pacificsalmon stocks at moderate to high risk ofextinction (Nehlsen 1994).
The effects of hydrological regulation bydams have been well-studied. Findings from theColumbia River point out the ecological com-plexity of dam effects on the declining salmonpopulations, especially juveniles. Juvenilesalmon incur multiple stresses from water agita-tion below dams and become lethargic and dis-oriented, which heightens their vulnerability topredation (Mesa 1994). Dams also reduce thebiological diversity of aquatic primary produc-ers and their immediate predators, which areprey for fishes. For example, the Columbia peb-blesnail population experienced major declinesbecause of the creation of inhospitable habitatalong the Columbia River drainage (Neitzel andFrest 1992).
Water development in the Columbia Riverbasin, not including the Snake River, has alsobeen responsible for the loss of more than108,000 hectares of fish and wildlife habitat(Hunt 1988; Fig 6). The flooding of backwaters,bays, canyons, riparian forests, and river bankseliminated habitat and reduced populations ofmany animals. Changing water levels alsoaffected nest sites on islands and reduced the
predators is also declining. The Sacramento River drainage has also
been affected by human activities and waterdevelopment. During the past 20 years, the sizeof the river’s salmon population has declined50% in the Sacramento–San Joaquin watershedbecause dams and upstream developments elim-inated rearing and spawning habitat. The riverwas greatly modified during the last 200 yearsto provide more than half of the surface waterused in California (Mongan and Miller 1992).More recent modification of diversion and irri-gation processes demonstrated that changingthe way water is used and treated is possible.For example, California rice farmers floodfields after harvest to get rid of stubble throughnatural decay instead of through burning; thisflooding creates seasonal wetlands for migrat-ing waterfowl. Later, a timed release of thewater assists with the migration of salmondownstream to the open ocean (Hunt 1988;Conniff 1993). Such modifications—althoughthey do not address the loss of natural habitatsor biological diversity—require cooperationrather than competition in water use.
Irrigation
Irrigation is critical to modern life and toagriculture in the dry western United States. Inaddition, eastern farmers are beginning to usesupplemental irrigation to increase crop yields
Factors Affecting Biological Resources — Water Use 69
Impounded River Systems
River basin development projects, includ-ing the construction of dams and irriga-
tion diversions, were led by state and feder-al government partnerships during the1950’s and 1960’s. Human demands forflood protection, water for irrigation, hydro-electric power, navigation, and bank stabi-lization resulted in large public worksundertaken by the U.S. Army Corps ofEngineers and the U.S. Bureau ofReclamation. These projects pose pervasivethreats to midcontinent aquatic ecosystemsbecause they have significantly altered thephysical characteristics of most of theregion’s major river systems, which hasresulted in numerous adverse effects,including the loss or decline of many nativeplant and animal species, especially fishes.
In fact, The Nature Conservancy’sTroubled Waters: Aquatic Ecosystems atRisk (Flack and Chipley 1996) states thatnationally 67% of freshwater mussels, 64%of crayfish, 37% of freshwater fishes, and29% of amphibians are at risk. Alterations ofriver habitats have been instrumental incausing the decline in abundance and diver-sity of many species (Figure).
After ImpoundmentThe impacts of damming and flow regu-
lation can be classified as immediate ordelayed (Holden 1979) or as first-, second-,and third-order effects (Becker and Gorton1995). The immediate or first-order effectsare obvious blockage of upstream anddownstream migration of fishes and alter-ation of the downstream habitat by dewater-ing and releasing cool (or cold) and clear(free of suspended fine sediments) waterthrough the low-flow portion of the channel.Many kilometers of upstream river corridorsare inundated and converted to lakelikehabitats. The cold, clear water tends to pickup sediment from the riverbed or banks,which causes the bed to gradually lower orwiden. Water releases from midcontinentreservoirs generally produce lower watertemperatures in summer and higher watertemperatures in winter. Native riverine fish-es adapted to the natural temperature regimeare displaced downstream and may beunsuccessful in reproduction because ofchanges in timing of physiological process-
success of the native riverine fishes is great-ly reduced due to temperature changes andloss of spawning areas. Those fish that dospawn have fewer of the remaining backwa-ter habitats they need to feed and grow. Aspreviously noted, after nonindigenousspecies such as pike and centrarchidsinvade, they compete with native species forhabitat and they prey on the young nativefishes.
Rehabilitation,Monitoring, and Research
Restoration of these declining large-riverecosystems is being discussed widelyamong resource agencies, conservationgroups, and the public. Restoration of theseareas to their natural predevelopment condi-tion is almost impossible, however; mostrestoration efforts are simply attempts torehabilitate selected segments of river tosome predetermined structure and function(Gore and Shields 1995). Dramatic exam-ples include the Kissimmee River in Florida,
Unimpounded RiverCorridors
The large-river systems of the midconti-nent are characterized by native riverinespecies of fish, mussels, and crayfish. Thesesystems course through an arid to semiaridenvironment where often the only forestedhabitat is the extensive riparian corridor thatlines these streams. This riparian zone pro-vides important habitat for wetland speciesand serves as a migratory corridor for water-fowl, shorebirds, mammals, and other ani-mals. The native river fishes require flowingwater habitats for either all of their lifestages (for example, the darters) or for onlya portion of their life history (such as pad-dlefish, sturgeons, and other migratoryspecies).
Melting snowpack in the distant moun-tains and high-intensity summer rainstormsare the dominant forces that shape the riverchannels as they cut through alluvial materi-als. The rivers are composed of shallow,often braided channel habitats, with warm,turbid water interspersed with deep poolsalong the outside of meander bends. Theannual scour and fill cycle deposits sedi-ments on the floodplain and replenishes thebars with the fresh sand and soil necessaryfor cottonwood regeneration.
es keyed to temperature cues. Consequently,these native riverine species may be (andoften are) gradually replaced by generalistspecies, which are often nonindigenousspecies introduced by humans and adaptedto cool or cold water. Basses, sunfish, andnorthern pike often escape from reservoirstocking programs into the river below,where these predatory nonindigenous fishesnot only compete for habitat but also prey onthe young native fishes.
The longer-term effects of dams includea degraded and widened channel that cancarry a higher volume of flow. This, alongwith a decrease in the magnitude of peakflows and the trapping of sediments byreservoirs, results in a much lower frequen-cy of overbank flooding. The lack of over-bank floods, which deposit sediments, andthe erosion of the bed and banks by the sediment-starved reservoir releases result inthe loss of sandbars and cause bankwaterhabitats to be replaced by steep, raw banksalong the channel.
Over a period of decades, the cessationof the annual scour and fill cycle that replen-ishes the bars with fresh sand and soil caus-es riparian cottonwood stands to graduallybecome open; these stands are eventuallyreplaced by nonindigenous plant species.Thus, biological productivity is reduced asthe number and diversity of wetland andriparian communities along the river corri-dors decline. In addition, the reproductive
which biologists are trying to reroute to itsoriginal channel, and the March 1996 “testflooding” by the Department of Interior inthe Grand Canyon, Arizona. Federal listingof several native large-river species asthreatened or endangered and declining bio-diversity of aquatic and riparian communi-ties throughout the midcontinent haveprompted a reevaluation of how the U.S.Army Corps of Engineers and the U.S.Bureau of Reclamation operate many largefederal reservoirs.
Two major studies are ongoing in theColorado River basin: the RecoveryImplementation Program for EndangeredFish Species in the Upper Colorado Riverbasin and the Grand Canyon studies.Extensive monitoring studies have recentlybegun in the Missouri and Yellowstonerivers. The U.S. Army Corps of Engineershas funded wetland, riparian, and fisheriesstudies as part of the Missouri River MasterManual Review and Update Study, and theU.S. Bureau of Reclamation is funding fish-eries and geomorphological studies in theupper Missouri and Yellowstone rivers. Theobjective of these studies is to build ananalysis and decision support system toallow water managers to better understandthe trade-offs associated with various oper-ating scenarios. Biological monitoring isbeing designed and coordinated through theMissouri River Natural ResourcesCommittee, a group of scientists from each
70 Status and Trends of the Nations’s Biological Resources — Volume 1
a. Preimpoundment
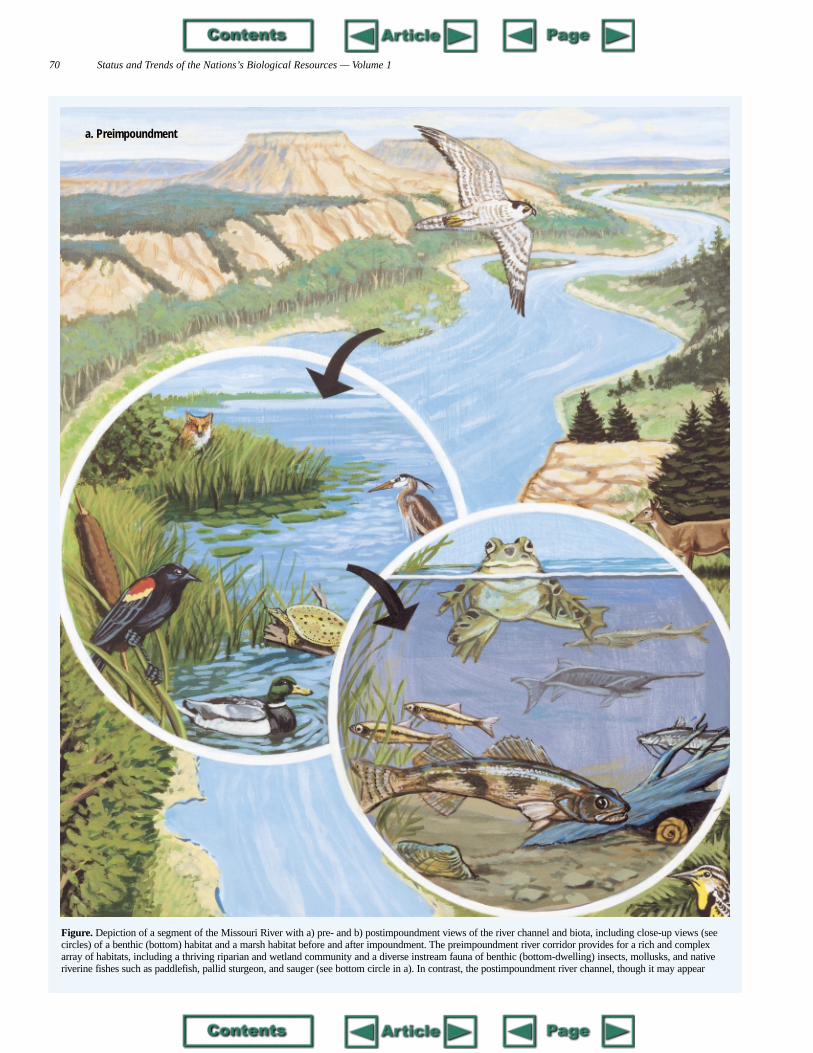
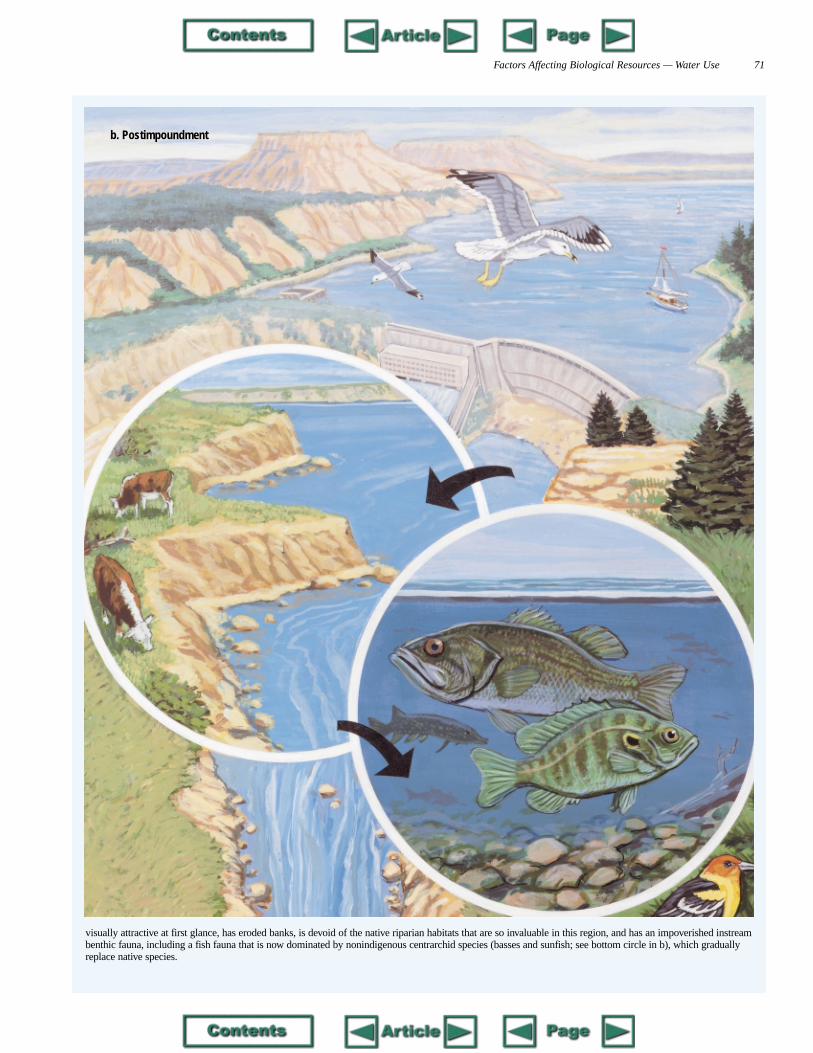
Figure. Depiction of a segment of the Missouri River with a) pre- and b) postimpoundment views of the river channel and biota, including close-up views (seecircles) of a benthic (bottom) habitat and a marsh habitat before and after impoundment. The preimpoundment river corridor provides for a rich and complexarray of habitats, including a thriving riparian and wetland community and a diverse instream fauna of benthic (bottom-dwelling) insects, mollusks, and nativeriverine fishes such as paddlefish, pallid sturgeon, and sauger (see bottom circle in a). In contrast, the postimpoundment river channel, though it may appear
Factors Affecting Biological Resources — Water Use 71
b. Postimpoundment
visually attractive at first glance, has eroded banks, is devoid of the native riparian habitats that are so invaluable in this region, and has an impoverished instreambenthic fauna, including a fish fauna that is now dominated by nonindigenous centrarchid species (basses and sunfish; see bottom circle in b), which graduallyreplace native species.
72 Status and Trends of the Nations’s Biological Resources — Volume 1
and as crop insurance to guard against drought.About 86% of the irrigated land in the UnitedStates is in the West, where irrigation waters aredelivered by furrows or ditches, flooding, sprin-kler systems, or underground systems. Futuregrowth in irrigated agriculture is limited bywater supply and cost, high energy and operat-ing costs, water laws, water pollution from agri-cultural salts and chemicals in runoff, and com-petition for land and water from urban areas.Because urban growth competes for water sup-plies (Lea 1985), it is important to agriculturalwater users. In 1990, 517 million cubic metersof water per day were withdrawn for irrigation,
Juan, and Colorado rivers on the Western Slopeacross the Continental Divide to the EasternSlope of Colorado, where 80% of the state’shuman population resides (Tyler 1992). Thesediversions changed the ecological character ofboth slopes by elevating salinity (chemicalsalts) in Colorado River waters and by reducingthe amount of water in the basin and in the riverthat, according to treaty obligation, should flowto Mexico. The projects limit future growth anddevelopment on the Western Slope and encour-age continued urban growth on the Eastern Slope.
Point and Nonpoint Pollution
of the basin states, the U.S. Army Corps ofEngineers, U.S. Fish and Wildlife Service,U.S. Geological Survey, U.S. Bureau ofReclamation, and the Western Area PowerAuthority.
Much remains to be learned about theecology and life-history requirements of thebiological communities of the midcontinentriver corridor before rehabilitation schemescan be designed by ecologists and naturalresource scientists. The opportunities fordesigning and carrying out scientific studieson the physical and biological processes of
large warmwater environments appear goodfor the next decade. By perfecting large-river sampling techniques and intensivemonitoring in large-scale experiments (suchas the Grand Canyon), we will have morescience-based information about how tomanage these systems, which in turn willallow us to more accurately assess the statusof these biological communities.
Author
Clair StalnakerU.S. Geological Survey
Biological Resources DivisionMidcontinent Ecological Science Center
4512 McMurry AvenueFort Collins, Colorado 80525-3400
Artist
Dale CrawfordRemtech Services, Inc.
Midcontinent Ecological Science Center4512 McMurry Avenue
Fort Collins, Colorado 80525-3400
See end of chapter for references
and 288 million cubic meters per day were con-sumed. During that year, water use for govern-ments, businesses, and households was 148 mil-lion cubic meters per day and consumption was25.6 million cubic meters per day (Solley et al.1993).
Interbasin Transfer
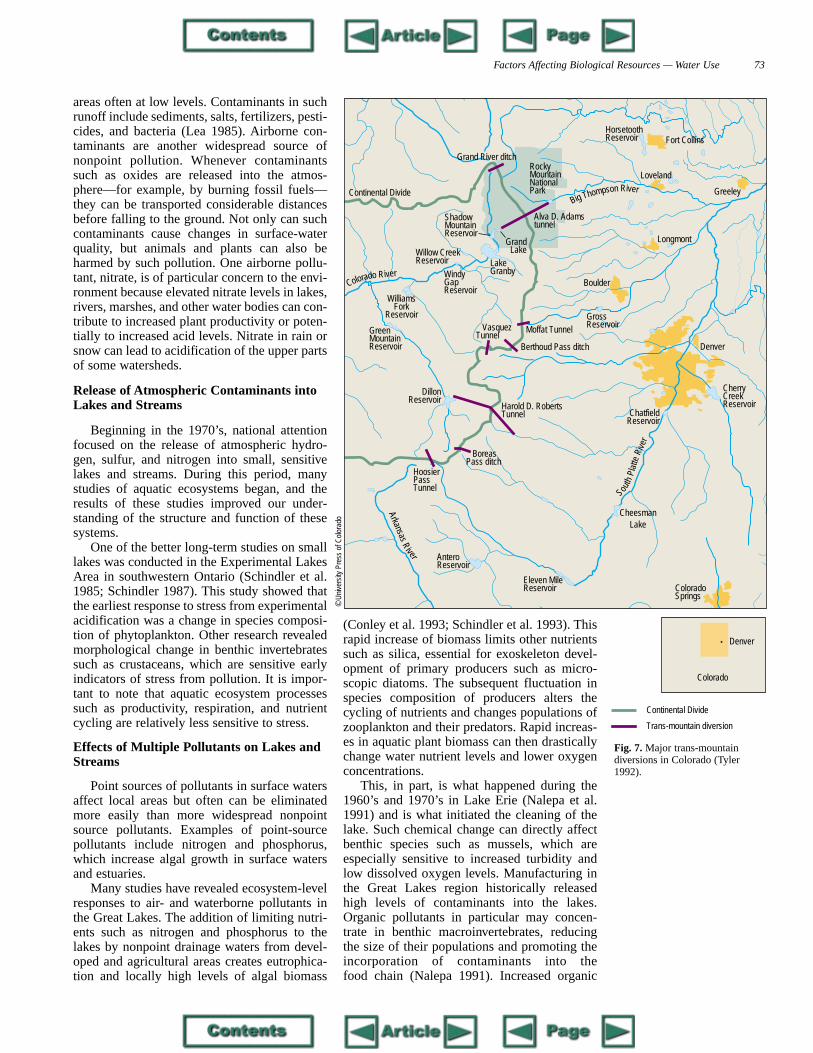
Ten major interbasin transfers, which movewater from one river basin into another bycanal, aqueduct, or pipeline, occur in the west-ern United States (van der Leeden et al. 1990).The movement of water across river divides isnot unique to the West, however. Since 1967,New York City has met about 50% (2.83 millioncubic meters per day) of its daily demand forwater by transferring water from the DelawareRiver (Major 1992). Another example of inter-basin transfer was the construction of theColorado–Big Thompson diversion, whichbegan in 1938 and was completed in 1956; thisdiversion, which transfers water through theAlva D. Adams Tunnel (Fig. 7), was supportedby the federal government under the 1902Reclamation Act. Recent growth of cities andsuburbs has placed additional demand on thiswater. Although the Colorado–Big Thompsondiversion transfers the greatest volume of waterin Colorado, 37 other large and small trans-mountain diversions contribute to the annualtransfer of more than 802 million cubic metersof water from the basins of the Gunnison, San
Public concern about the quality of thenation’s waters was demonstrated by the pas-sage of the Water Pollution Control Act of 1956and its amendments in 1972 and by the passageof the Clean Water and Safe Drinking Wateracts of 1977. These acts developed a clear state-ment of the national goal to restore and main-tain the chemical, physical, and biologicalintegrity of the nation’s waters (Federal WaterPollution Control Act 1972). In spite of sub-stantial cleanup, however, harmful substancesare still discharged into the nation’s naturalwaters, and their effects are often not obvious.The following few examples demonstrate the physical and biological nature and effects of these pollutants (also see chapter onEnvironmental Contaminants).
Pollutant Sources
Many studies have been conducted on theeffects of specific water or airborne pollutantson aquatic biota. Many of these studies, though,have been narrowly focused; assessments of themagnitude of effects on ecosystems are incom-plete or nonexistent. Research on the effects ofatmospheric contaminants, such as hydrogen,nitrogen, and sulfur, on small lake or streamecosystems is an exception and is considered ina separate chapter.
Irrigation runoff is a major source of non-point pollution, which occurs over broad land
Factors Affecting Biological Resources — Water Use 73
areas often at low levels. Contaminants in suchrunoff include sediments, salts, fertilizers, pesti-cides, and bacteria (Lea 1985). Airborne con-taminants are another widespread source ofnonpoint pollution. Whenever contaminantssuch as oxides are released into the atmos-phere—for example, by burning fossil fuels—they can be transported considerable distancesbefore falling to the ground. Not only can suchcontaminants cause changes in surface-waterquality, but animals and plants can also beharmed by such pollution. One airborne pollu-tant, nitrate, is of particular concern to the envi-ronment because elevated nitrate levels in lakes,rivers, marshes, and other water bodies can con-tribute to increased plant productivity or poten-tially to increased acid levels. Nitrate in rain orsnow can lead to acidification of the upper partsof some watersheds.
Release of Atmospheric Contaminants intoLakes and Streams
Beginning in the 1970’s, national attentionfocused on the release of atmospheric hydro-gen, sulfur, and nitrogen into small, sensitivelakes and streams. During this period, manystudies of aquatic ecosystems began, and theresults of these studies improved our under-standing of the structure and function of these
Fort Collins
Willow CreekReservoir Lake
Granby
GrandLake
ShadowMountainReservoir
Windy GapReservoir
WilliamsFork
Reservoir
GreenMountainReservoir Denver
ChatfieldReservoir
Cherry CreekReservoir
Boulder
Longmont
Greeley
Loveland
HorsetoothReservoir
RockyMountainNationalPark
GrossReservoir
Grand River ditch
Alva D. Adamstunnel
Moffat Tunnel
Berthoud Pass ditch
VasquezTunnel
Harold D. RobertsTunnel
BoreasPass ditch
HoosierPassTunnel
DillonReservoir
Big Thompson River
South
Plat
teRi
ver
Arka
Colorado River
Continental Divide
Cheesman
do
systems.One of the better long-term studies on small
lakes was conducted in the Experimental LakesArea in southwestern Ontario (Schindler et al.1985; Schindler 1987). This study showed thatthe earliest response to stress from experimentalacidification was a change in species composi-tion of phytoplankton. Other research revealedmorphological change in benthic invertebratessuch as crustaceans, which are sensitive earlyindicators of stress from pollution. It is impor-tant to note that aquatic ecosystem processessuch as productivity, respiration, and nutrientcycling are relatively less sensitive to stress.
Effects of Multiple Pollutants on Lakes andStreams
Point sources of pollutants in surface watersaffect local areas but often can be eliminatedmore easily than more widespread nonpointsource pollutants. Examples of point-sourcepollutants include nitrogen and phosphorus,which increase algal growth in surface watersand estuaries.
Many studies have revealed ecosystem-levelresponses to air- and waterborne pollutants inthe Great Lakes. The addition of limiting nutri-ents such as nitrogen and phosphorus to thelakes by nonpoint drainage waters from devel-oped and agricultural areas creates eutrophica-tion and locally high levels of algal biomass
(Conley et al. 1993; Schindler et al. 1993). Thisrapid increase of biomass limits other nutrientssuch as silica, essential for exoskeleton devel-opment of primary producers such as micro-scopic diatoms. The subsequent fluctuation inspecies composition of producers alters thecycling of nutrients and changes populations ofzooplankton and their predators. Rapid increas-es in aquatic plant biomass can then drasticallychange water nutrient levels and lower oxygenconcentrations.
This, in part, is what happened during the1960’s and 1970’s in Lake Erie (Nalepa et al.1991) and is what initiated the cleaning of thelake. Such chemical change can directly affectbenthic species such as mussels, which areespecially sensitive to increased turbidity andlow dissolved oxygen levels. Manufacturing inthe Great Lakes region historically releasedhigh levels of contaminants into the lakes.Organic pollutants in particular may concen-trate in benthic macroinvertebrates, reducingthe size of their populations and promoting theincorporation of contaminants into the food chain (Nalepa 1991). Increased organic
Denver
AnteroReservoir
Eleven MileReservoir Colorado
Springs
Colorado
nsasR
iver
Continental Divide
Trans-mountain diversion
Lake
Fig. 7. Major trans-mountaindiversions in Colorado (Tyler1992).
© U
nive
rsity
Pre
ss o
f Col
ora

74 Status and Trends of the Nations’s Biological Resources — Volume 1
contaminant concentrations in predatory fisheslimited human consumption of those fishes,greatly reduced the value of a historicallyimportant fishery, and reduced fish populationsizes and community composition by limitingreproduction.
Long-term studies of point and nonpointpollutants have been conducted in the GreatLakes and their tributaries (Smith et al. 1992).Concentrations of toxic materials such asarsenic, chlordane, dieldrin, dichlorodiphenyl-trichloroethane (DDT) and related compounds,and polychlorinated biphenyls (PCB’s) recentlydeclined, but mercury levels remained constant.These data represent the success of majorefforts to clean up point-source discharges.
Other regions have not improved. Streams inagricultural areas of the Midwest have high her-bicide concentrations. In the Mississippi Riverand its major tributaries, alachlor and atrazineoccasionally exceed the maximum contaminantlevels set by the U.S. Environmental ProtectionAgency (Smith et al. 1992). These contaminantsadhere to the high loads of suspended sedimentsand are carried long distances, which increasestheir potential harm to aquatic organisms andhumans (Ellis 1993).
Most aquatic ecosystems suffer from multi-ple anthropogenic stresses (Karr et al. 1985).
runoff and low in reaches with turbidity andtoxic metals. The poor water quality of theIllinois River is exemplified by high turbidityand low dissolved oxygen levels (Anderson etal. 1991), which have resulted in an increase inabundance of aquatic species that favor cloudywater (bottom-feeding fish). More recent stud-ies (Lerczak and Sparks 1995) have indicatedthat water-quality improvements on the IllinoisRiver have resulted in a return of a more diversefish community.
Sedimentation is a factor in the loss of aquat-ic plants in the Illinois River; sedimentation andthe loss of aquatic plants contributed to the dis-appearance of 20 fish species and the loss of thecommercial fishery. Loss of aquatic plants alsoadversely affects the waterfowl that feed on theplants. In addition, the draining of bottomlandlakes and marshes further decreased the abun-dance of fishes and the habitat of migratorywaterfowl along the river (Starrett 1972;Holland-Bartels 1992). In sum, contaminantsthat are released into the nation’s waters greatlyrestrict the usefulness of receiving waters forhuman water supply, fish habitat, other wildlifehabitat, and water-contact activities.
Sediment
Sediment that erodes from the land into
The Illinois River in the Midwest exemplifies ariver in which increased city populations andagricultural uses in its watershed, hydrologicalregulation, discharge of oxygen-demandingwastes, overuse of water, and introduced non-indigenous species have interacted to drastical-ly alter the aquatic ecosystems. The river, witha drainage area of 73,000 square kilometers,starts southwest of Chicago and flows to theMississippi River. Lands surrounding the riverwere cleared, and bottomlands, including lakes,were drained for agriculture. Sediment, fertiliz-er, and pesticide runoff from agriculture nowenter the river, adding to urban runoff. Elevatedand rising nitrate levels were noticed from 1975to 1994 by Schideman and Blanchard (1994).The number of phytoplankton is high in reach-es with nutrient enrichment from farmlandstreams and rivers is transported to reservoirsand deposited behind dams, where flow veloci-ty decreases. Data compiled by Crowder (1987)indicate that this process has decreased the stor-age volumes of large reservoirs in the UnitedStates by 0.22% annually (van der Leeden et al.1990; Table 5). Hunt (1988) cited losses as highas 73% over 30 years (1942–1972) from theOcoee Dam Number 3 in North Carolina.
Trapped sediment alters river channel char-acteristics, which, in turn, affect water-table ele-vation and adjacent riparian vegetation. With areduced downstream sediment load, riversbelow dams erode their beds and banks. Thisdecreases floodplain width, reduces riparianhabitat area, and alters river channel characterand level. In response to these changes, peopleoften line and stabilize the banks of the main
a The percentage of the sediment in the stream that originated on cropland was calculated by dividing the estimated sedimentation from cropland in thereservoir by the estimated lost water storage capacity.
Farm region Total water storage capacity
Usable water storage capacity
Water storage capacity lost (est.)
Percent water storage capacity
lost (est.)
Reservoirsedimentation from
cropland (est.)
Percent stream sedi-ment originating
on cropland (est.)a
Northeast 45,000 31,100 34.7 0.08 10.1 29Appalachian 73,400 37,800 93.2 0.13 27.0 29Southeast 90,800 58,700 157.1 0.17 51.8 33Lake states 36,200 24,100 97.6 0.27 62.4 64Corn Belt 49,000 18,800 129.3 0.26 81.4 63Delta states 52,700 24,800 108.0 0.20 44.3 41Northern plains 97,400 67,100 227.8 0.23 82.1 36Southern plains 136,100 57,500 255.9 0.19 48.6 19Mountain 206,200 170,400 373.3 0.18 29.9 8Pacific 111,900 92,200 544.9 0.49 49.0 9Total 898,700 582,500 2,021.8 0.22 486.6 24
Table 5. Water storage capacitythat is lost annually (in millioncubic meters) from reservoirsbecause of sedimentation; data arefor reservoirs in the contiguousUnited States with total capacitiesof 6.17 million cubic meters (mod-ified from Crowder 1987).
Factors Affecting Biological Resources — Water Use 75
channel and affected tributaries to protect ripar-ian land and adjacent developments. Such bankstabilization, though, further alters the naturalchannels (Simons 1979; Hunt 1988). An exam-ple of such processes can be seen downstreamof the Gavins Point Dam on the Missouri Riverupstream of Yankton, South Dakota. Betweenthe Gavins Point Dam and Ponca State Park,0.88 hectares of land per kilometer of river havebeen lost each year since the dam was built in1956. Similar data from four Missouri Riverdams show erosion losses below the dams of 53hectares per year (Fort Peck), 30 hectares peryear (Garrison), 121 hectares per year (FortRandall), and 81 hectares per year (GavinsPoint; Hunt 1988). This combination of erosionand siltation from river development and stabi-lization has caused the loss of 40,600 hectaresof aquatic habitat, 26,400 hectares of island andsandbar habitat, and 125,000 hectares of associ-ated riparian habitat along the Missouri River(Hunt 1988).
Habitat modification by sedimentation andsiltation has caused extensive separation of fishpopulations in the Southeast. The most imper-iled aquatic species live in creeks and smallrivers, where they depend on clean stream-bottom substrates, especially for reproduction.Poor land-use patterns, though, have eliminated
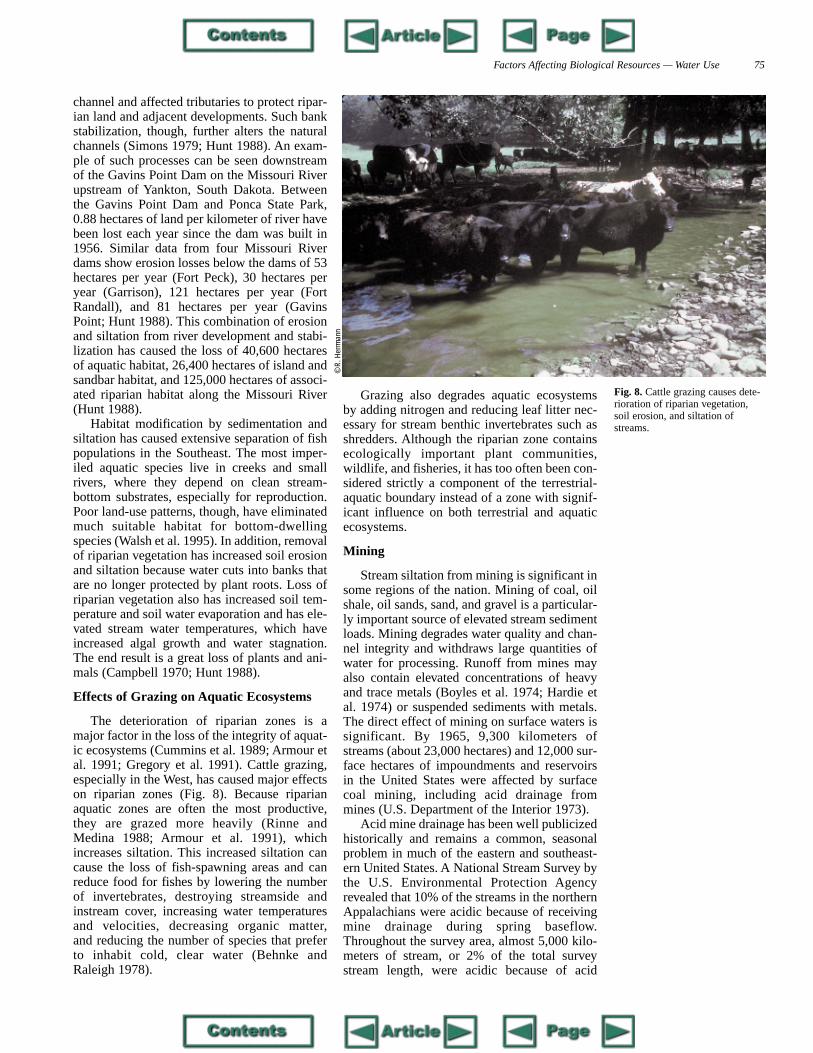
Grazing also degrades aquatic ecosystemsby adding nitrogen and reducing leaf litter nec-essary for stream benthic invertebrates such asshredders. Although the riparian zone containsecologically important plant communities,wildlife, and fisheries, it has too often been con-sidered strictly a component of the terrestrial-aquatic boundary instead of a zone with signif-icant influence on both terrestrial and aquatic
Fig. 8. Cattle grazing causes dete-rioration of riparian vegetation,soil erosion, and siltation ofstreams.
© R
. Her
rman
n
much suitable habitat for bottom-dwellingspecies (Walsh et al. 1995). In addition, removalof riparian vegetation has increased soil erosionand siltation because water cuts into banks thatare no longer protected by plant roots. Loss ofriparian vegetation also has increased soil tem-perature and soil water evaporation and has ele-vated stream water temperatures, which haveincreased algal growth and water stagnation.The end result is a great loss of plants and ani-mals (Campbell 1970; Hunt 1988).
Effects of Grazing on Aquatic Ecosystems
The deterioration of riparian zones is amajor factor in the loss of the integrity of aquat-ic ecosystems (Cummins et al. 1989; Armour etal. 1991; Gregory et al. 1991). Cattle grazing,especially in the West, has caused major effectson riparian zones (Fig. 8). Because riparianaquatic zones are often the most productive,they are grazed more heavily (Rinne andMedina 1988; Armour et al. 1991), whichincreases siltation. This increased siltation cancause the loss of fish-spawning areas and canreduce food for fishes by lowering the numberof invertebrates, destroying streamside andinstream cover, increasing water temperaturesand velocities, decreasing organic matter,and reducing the number of species that preferto inhabit cold, clear water (Behnke andRaleigh 1978).
ecosystems.
Mining
Stream siltation from mining is significant insome regions of the nation. Mining of coal, oilshale, oil sands, sand, and gravel is a particular-ly important source of elevated stream sedimentloads. Mining degrades water quality and chan-nel integrity and withdraws large quantities ofwater for processing. Runoff from mines mayalso contain elevated concentrations of heavyand trace metals (Boyles et al. 1974; Hardie etal. 1974) or suspended sediments with metals.The direct effect of mining on surface waters issignificant. By 1965, 9,300 kilometers ofstreams (about 23,000 hectares) and 12,000 sur-face hectares of impoundments and reservoirsin the United States were affected by surfacecoal mining, including acid drainage frommines (U.S. Department of the Interior 1973).
Acid mine drainage has been well publicizedhistorically and remains a common, seasonalproblem in much of the eastern and southeast-ern United States. A National Stream Survey bythe U.S. Environmental Protection Agencyrevealed that 10% of the streams in the northernAppalachians were acidic because of receivingmine drainage during spring baseflow.Throughout the survey area, almost 5,000 kilo-meters of stream, or 2% of the total surveystream length, were acidic because of acid
76 Status and Trends of the Nations’s Biological Resources — Volume 1
drainage from mines; another 6,000 kilometerswere severely affected (Herlihy et al. 1990).
Although the effects of gravel mining onaquatic ecosystems have been little publicized,the removal of gravel from one area of a chan-nel affects areas upstream and downstream asbedload materials move to establish a new equi-librium in the stream bottom (Kondolf 1994).Following mining, gravel necessary for spawn-ing by fishes is lost, and suspended sedimentscan travel far downstream, eliminating evenmore spawning area and altering the environ-ment for benthic invertebrates. Stream instabili-ty from such mining also eliminates sandbarswhere migratory shorebirds often nest. Forexample, colonial waterbirds, such as the
endangered least tern and the threatened pipingplover, must use areas such as sand pits in placeof lost sandbar habitat along the Platte River inNebraska (Sidle and Kirsch 1993).
Ecological Ramifications ofWater Use
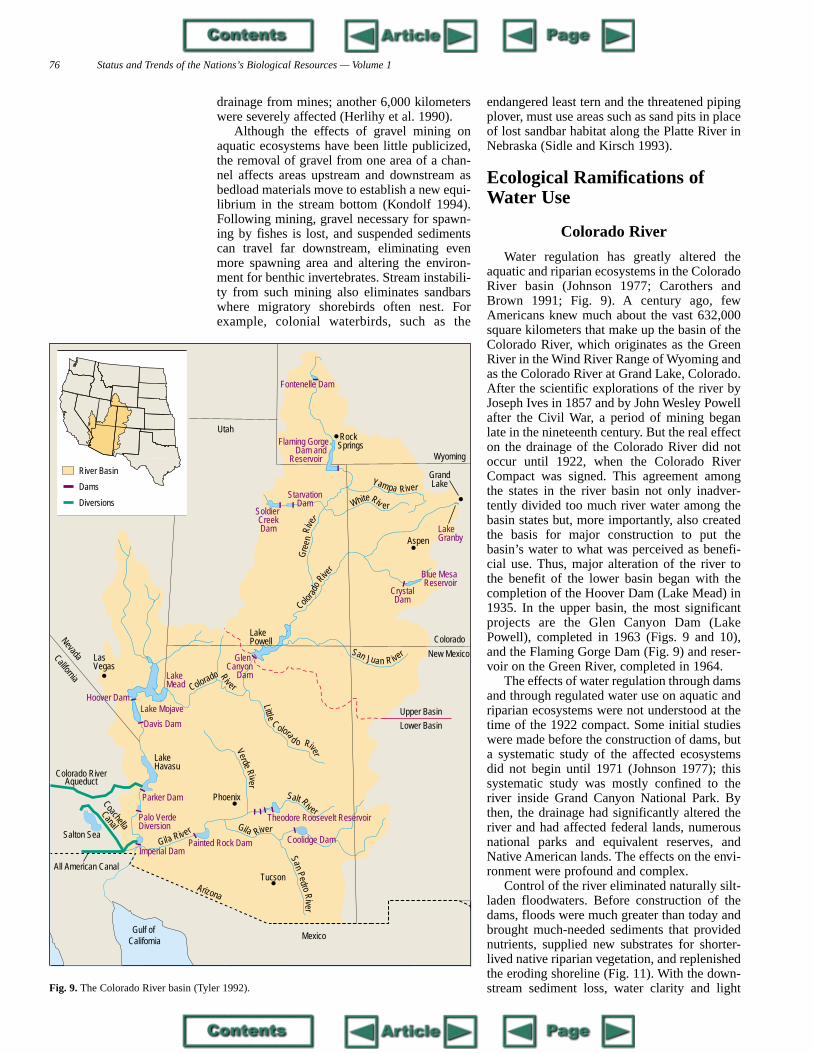
Colorado River
Water regulation has greatly altered theaquatic and riparian ecosystems in the ColoradoRiver basin (Johnson 1977; Carothers andBrown 1991; Fig. 9). A century ago, fewAmericans knew much about the vast 632,000square kilometers that make up the basin of theColorado River, which originates as the GreenRiver in the Wind River Range of Wyoming andas the Colorado River at Grand Lake, Colorado.After the scientific explorations of the river byJoseph Ives in 1857 and by John Wesley Powellafter the Civil War, a period of mining beganlate in the nineteenth century. But the real effecton the drainage of the Colorado River did notoccur until 1922, when the Colorado RiverCompact was signed. This agreement amongthe states in the river basin not only inadver-tently divided too much river water among thebasin states but, more importantly, also created
Wyoming
Utah
Fontenelle Dam
Flaming Gorge Dam and
Reservoir
RockSprings
er
Yampa River
White Riv erSoldier Creek
StarvationDam
River Basin
Dams
Diversions
GrandLake
the basis for major construction to put thebasin’s water to what was perceived as benefi-cial use. Thus, major alteration of the river tothe benefit of the lower basin began with thecompletion of the Hoover Dam (Lake Mead) in1935. In the upper basin, the most significantprojects are the Glen Canyon Dam (LakePowell), completed in 1963 (Figs. 9 and 10),and the Flaming Gorge Dam (Fig. 9) and reser-voir on the Green River, completed in 1964.
The effects of water regulation through damsand through regulated water use on aquatic andriparian ecosystems were not understood at thetime of the 1922 compact. Some initial studieswere made before the construction of dams, buta systematic study of the affected ecosystemsdid not begin until 1971 (Johnson 1977); thissystematic study was mostly confined to theriver inside Grand Canyon National Park. Bythen, the drainage had significantly altered theriver and had affected federal lands, numerousnational parks and equivalent reserves, andNative American lands. The effects on the envi-ronment were profound and complex.
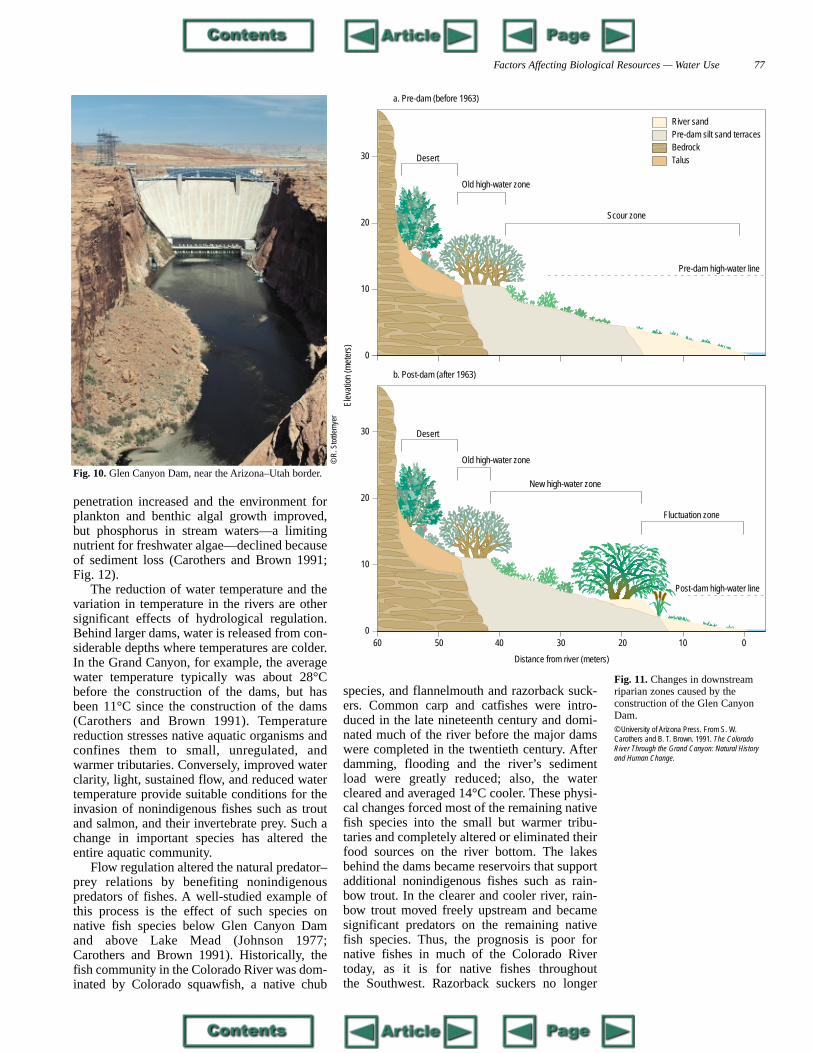
Control of the river eliminated naturally silt-laden floodwaters. Before construction of thedams, floods were much greater than today andbrought much-needed sediments that providednutrients, supplied new substrates for shorter-lived native riparian vegetation, and replenishedthe eroding shoreline (Fig. 11). With the down-stream sediment loss, water clarity and light
Lake Mead
Lake Mohave
Virgin River
Pluvial White
River System
Colorado
New Mexico
Arizona
NevadaCalifornia
Gre
e nRi
vDam LakeGranby
Colora
doRive
r
Lake Powell
Colorado River
LittleC
olora
d o River
Las Vegas
Hoover Dam
LakeMead
Lake Mojave
Davis Dam
Parker Dam
LakeHavasu
Palo Verde Diversion
Imperial DamPainted Rock Dam
Phoenix Salt RiverTheodore Roosevelt Reservoir
SanPedro
River
Tucson
VerdeRiver
Aspen
CrystalDam
Blue Mesa Reservoir
San Juan R iver
Salton Sea
Glen Canyon
Dam
Coolidge DamGil a River Gila River
Upper Basin
Lower Basin
Mexico
Mexico
Gulf of California Mexico
Colorado RiverAqueduct
All American Canal
Coachella
Canal
Fig. 9. The Colorado River basin (Tyler 1992).
Factors Affecting Biological Resources — Water Use 77
penetration increased and the environment forplankton and benthic algal growth improved,
Fig. 10. Glen Canyon Dam, near the Arizona–Utah border.
© R
. Sto
ttlem
yer
30
20
30
20
10
0
Desert
Old high-water zone
Scour zone
Pre-dam high-water line
Desert
Old high-water zone
New high-water zone
Fluctuation zone
River sandPre-dam silt sand terracesBedrockTalus
b. Post-dam (after 1963)
a. Pre-dam (before 1963)
Elev
atio
n (m
eter
s)
but phosphorus in stream waters—a limitingnutrient for freshwater algae—declined becauseof sediment loss (Carothers and Brown 1991;Fig. 12).
The reduction of water temperature and thevariation in temperature in the rivers are othersignificant effects of hydrological regulation.Behind larger dams, water is released from con-siderable depths where temperatures are colder.In the Grand Canyon, for example, the averagewater temperature typically was about 28°Cbefore the construction of the dams, but hasbeen 11°C since the construction of the dams(Carothers and Brown 1991). Temperaturereduction stresses native aquatic organisms andconfines them to small, unregulated, andwarmer tributaries. Conversely, improved waterclarity, light, sustained flow, and reduced watertemperature provide suitable conditions for theinvasion of nonindigenous fishes such as troutand salmon, and their invertebrate prey. Such achange in important species has altered theentire aquatic community.
Flow regulation altered the natural predator–prey relations by benefiting nonindigenouspredators of fishes. A well-studied example ofthis process is the effect of such species onnative fish species below Glen Canyon Damand above Lake Mead (Johnson 1977;Carothers and Brown 1991). Historically, thefish community in the Colorado River was dom-inated by Colorado squawfish, a native chub
species, and flannelmouth and razorback suck-ers. Common carp and catfishes were intro-duced in the late nineteenth century and domi-nated much of the river before the major damswere completed in the twentieth century. Afterdamming, flooding and the river’s sedimentload were greatly reduced; also, the watercleared and averaged 14°C cooler. These physi-cal changes forced most of the remaining nativefish species into the small but warmer tribu-taries and completely altered or eliminated theirfood sources on the river bottom. The lakesbehind the dams became reservoirs that supportadditional nonindigenous fishes such as rain-bow trout. In the clearer and cooler river, rain-bow trout moved freely upstream and becamesignificant predators on the remaining nativefish species. Thus, the prognosis is poor fornative fishes in much of the Colorado Rivertoday, as it is for native fishes throughout the Southwest. Razorback suckers no longer
10
0
Post-dam high-water line
60 50 40 30 20 10 0
Distance from river (meters)
Fig. 11. Changes in downstreamriparian zones caused by the construction of the Glen CanyonDam.© University of Arizona Press. From S. W.Carothers and B. T. Brown. 1991. The ColoradoRiver Through the Grand Canyon: Natural Historyand Human Change.

78 Status and Trends of the Nations’s Biological Resources — Volume 1
reproduce in the Grand Canyon below the GlenCanyon Dam, and their reproductive success ispoor in Colorado River reservoirs; the specieswill probably be eradicated by early in thetwenty-first century. The Colorado squawfish isconsidered extirpated from the Colorado Riverbelow Glen Canyon Dam. The humpback chubis the only remaining chub species, but forspawning it requires water temperatures warmerthan those now found in this stretch of theColorado River. In addition, native fish specieswere deliberately eradicated by poisoningbecause nonindigenous trout provide a moreeconomical sport fishery (Carothers and Brown1991). As with so many studies of species thatwere lost during major human alteration of anaquatic ecosystem, the nearly complete absenceof biological and ecological research on theColorado River before 1960 means the role ofthe human effect in the decline and extinction ofthese species cannot be fully quantified. In addi-tion to the effect from hydrological regulationof the Colorado River, major portions of theriparian habitat were destroyed by grazing,land-use practices, and polluted surface water.
Reservoirs created by damming can also cre-ate their own set of internal problems, such asthe effect of fluctuating water levels on shore-line erosion and developments (Lorang et al.
biomass by allowing longer-lived shrubs andtrees and animal species to exist in that zone—biological diversity increased in part throughspecies substitution. After hydrological regula-tion, restoration of equilibrium in the new ripar-ian community takes more than 10 years, andthe number, frequency, and balance amongnative and nonindigenous species are not wellunderstood.
More than 12 million hectares of riparianand associated habitat were flooded in theColorado River basin by water developmentprojects. This represents a gain of narrow ripar-ian corridors in steep-walled canyons but a large
Fig. 13. Lack of beach replenishment by silt-laden flood-waters means natural erosion in the Grand Canyon signifi-cantly erodes beaches and changes the riparian zone.
© R
. Sto
ttlem
yer
Fig. 12. Control of the ColoradoRiver by dams upstream eliminat-ed naturally silt-laden floodwaters,increasing water clarity and lightpenetration in the river in theGrand Canyon, thereby reducinghabitat for native fishes.
© R
. Sto
ttlem
yer
1993), high fecal coliform levels (Doyle et al.1992), invasions of nonindigenous plants suchas hydrilla (Bain 1989), and high nonpoint con-taminant levels in reservoir sediments (Novotnyand Chesters 1989).
Before the construction of Glen CanyonDam, annual flood flows near the GrandCanyon exceeded 2,400 cubic meters per sec-ond (Carothers and Brown 1991), and frequentflooding subjected the riparian community tounpredictable change. Such natural floodingcreated a roughly 9-meter-wide zone along theriver where only short-lived native species, suchas grasses, could exist in small numbers (Figs.11, 12, and 13). Longer-lived vegetation, suchas mesquite and cat-claw acacia, occur fartherthan 4.5 meters above river level where larger,periodic floods do not reach but from where theplants’ roots can still reach water. Adjacent tothis upper zone is desert vegetation. Overall, theriparian zone is one of the most productive veg-etation associations and is especially importantin drier regions. This zone represents a transi-tion between different ecosystems, and it is amajor pathway for plant and animal migration.Hydrological regulation, though, has caused theinvasion of the riparian zone by nonindigenousvascular plants, particularly saltcedar ortamarisk (Fig. 14). Some native vegetation,especially coyote willow, also became estab-lished in what once was the flood zone. Overall,hydrological regulation increased the riparian
loss of broad riparian flats in other stretches.Although the lost flats made up only a smallpercentage of the landscape, they included theimportant cottonwood and cottonwood–willowforests along the river; the loss of these forestsis attributed to inundation and to dehydrationcaused by the interruption of seasonal stream-flow or reduction of streamflow in unfloodedareas. This, in turn, has caused many bird pop-ulations to decline (Hunt 1988). Farming andranching communities that moved into the basindo not support bird populations as large as thosein native riparian communities (Conine et al.1978).
Fig. 14. Tamarisk (the taller, darker green shrubs) is a non-indigenous plant that has invaded the riparian zone of theColorado River in the Grand Canyon since hydrologicalregulation of the river.
© R
. Sto
ttlem
yer

Factors Affecting Biological Resources — Water Use 79
After three decades, the hydrological regula-tion of the Colorado River in the Grand Canyonhas fundamentally changed the structure andfunction of the aquatic and riparian ecosystems.Changes in aquatic chemical and physical prop-erties do not favor native species of plants andanimals but do support some nonindigenousspecies, which is most apparent in the fewnative fish species that must now compete with20 nonindigenous fish species. In addition, theinvasion of what used to be the riparian scourzone (area of the riverbank that is swept clean ofvegetation by fast-flowing water) has not yetstabilized, and the eventual biological diversity,biomass, and relative mix of native and non-indigenous species is not yet known. Newspecies, especially invertebrates, continue toinvade. The insect community in particular isdynamic (Carothers and Brown 1991).
The Everglades of South Florida
In southern Florida, flood-control structures,canals, and conservation areas drain lands foragriculture, flood natural habitat, and rapidlyremove floodwaters. These projects reduceflooding in the greater Miami urban area andprotect the Biscayne Aquifer, a subsurfacewater-bearing layer and the source of Miami’s
Kissimm
eeR
iver
Gulf of Mexico
Florida Bay
Atlantic Ocean
Kissimmee/ Lake Okeechobee/ Everglades Drainage Basin
Lake Okeechobee
Big Cypress SwampHistoric
FreshwaterEverglades
Kissimm
eeR
iver
Caloosahatchee River
Before
fresh water. A history of use, overuse, and con-servation, beginning in 1896 and continuing tothe present, has ensured sufficient fresh water tothe metropolitan area and lowered water levelsfor agriculture (Fig. 15). But the cost has beenmassive, and the change of the Evergladesecosystem is long term (Davis and Ogden1994).Factors that regulate the amount and diversi-ty of living and dead biomass in time and spaceinclude moisture, temperature, high wind, fire,and nutrient availability (Gunderson and Snyder1994). Long-term cycles, such as shifts in sealevel and climate, episodic events such as hurri-canes and fire, and annual variation such as wetand dry seasons must be understood to measurepotential effects of human use on an ecosystemlike the Everglades. In this diverse ecosystem,species adapt to change by being mobile or,as is true for most plants, by having a wide tolerance for change. Taken together, thesephysical forces drive the biological diversity in the Everglades.
The 5,000-year-old Everglades are anecosystem with rich biological diversity that isdominated by sawgrass, wet prairie, treeislands, sloughs, ponds and creeks, and thehighly productive mangroves (Fig. 16). Theecosystem’s diversity and productivity resultfrom the complex interaction of seasonally highand low water levels that bring in needed inor-ganic nutrients and promote the decomposition
Dense canal areas
Lakes
Everglades agricultural area
Water conservation areas
Big Cypress National Preserve
Everglades National Park
East Everglades National Park expansion area
South Florida Water Management District boundary
Canals
After
Fig. 15. The Florida Everglades,before and after development(from Davis and Ogden 1994).©
St.
Luci
e Pr
ess,
100
E. L
into
n Bl
vd.,
403B
, Del
ray
Beac
h, F
L33
483.
Fro
m E
verg
lade
s: th
e Ec
osys
tem
and
Its
Res
tora
tion.
80 Status and Trends of the Nations’s Biological Resources — Volume 1
of accumulated organic matter. The localchange in topographic relief permits tree islandsto flourish, and the frequent and widespreadfires during the dry season rapidly reduce accu-mulated dead organic matter and release much-needed nutrients. Historically, hurricanes havealso been important for maintaining the biolog-ical diversity of the Everglades, especially ofthe tree islands and perhaps of the mangroves.
Much of the present controversy andresearch focus on Everglades National Park, aWorld Heritage Site, and on adjacent reserves.These protected areas encompass only about20% of what was originally an ecosystem ofmore than a million hectares. Half the originalarea was drained for development and agricul-ture. Much of what remains has been diked for
water conservation areas where water levels andflows are controlled to balance environmentalconcerns and the rapidly expanding human pop-ulation in south Florida. The control of water tothe Everglades is one example of a change inquantity, quality, and seasonal availability ofwater that exceeds natural variation, to the detri-ment of native species (Robertson andFrederick 1994; White 1994).
Research conducted largely since 1970 hasrevealed that most of the ecosystem is deniedsufficient water at the proper time (Fig. 17).This lack of water has permitted the invasion ofsawgrass into wet prairies and sloughs.American alligators moved from former wet-lands, which are now too dry, to the sloughs,and the estuarine salinity is now too high formangroves, thereby reducing the productivity ofthose trees (Lodge 1994). Breeding populationsof birds have sharply declined since 1930. Theabundance of wood storks decreased by 90%,white ibises by 95%, great egrets by 35%, andsmall herons by 90% (Fig. 18). Much of thedecline of these birds is attributed to poorlytimed water releases, which reduce aquatic preyconcentrations for nesting birds. Furthermore,hydrological control structures often redistrib-ute the water far from suitable nesting areas(Ogden 1994). Agriculture in the Everglades
also began early in this century and intensifiedwith the control of water. Agricultural practiceswere not compatible with the high water tableand wet season and, directly or indirectly, arethe major source of nutrient enrichment ofwater that enters the Everglades (Davis 1994).Change in water quality promoted theexpansion of cattails, which are not suitableaquatic habitat for wading birds. Water concen-trations of phosphorus, a limiting nutrient inthis aquatic ecosystem, increased considerablyin water that enters the park, thereby profound-ly changing the primary production and diversi-ty of the aquatic plants and animals on whichbirds and other animals feed (Frederick andPowell 1994). Today, the remnants of this dis-rupted ecosystem are not self-sustaining.
In the Everglades, the introductions of non-indigenous biota and their spread in the human-modified environment are becoming a majorsource of stress on native aquatic species. Forexample, the introduction of Cuban treefrogsand marine toads in the Miami area eliminatedother native amphibians such as the squirreltreefrog, green treefrog, and southern toad.These amphibians have been poorly studied, butbecause of their seasonal abundance, they arecertainly important food sources for wadingbirds and reptiles (Lodge 1994).
Nonindigenous fishes are the most commonintroduced species, and their complex effectsare exemplified by the nonindigenous blue
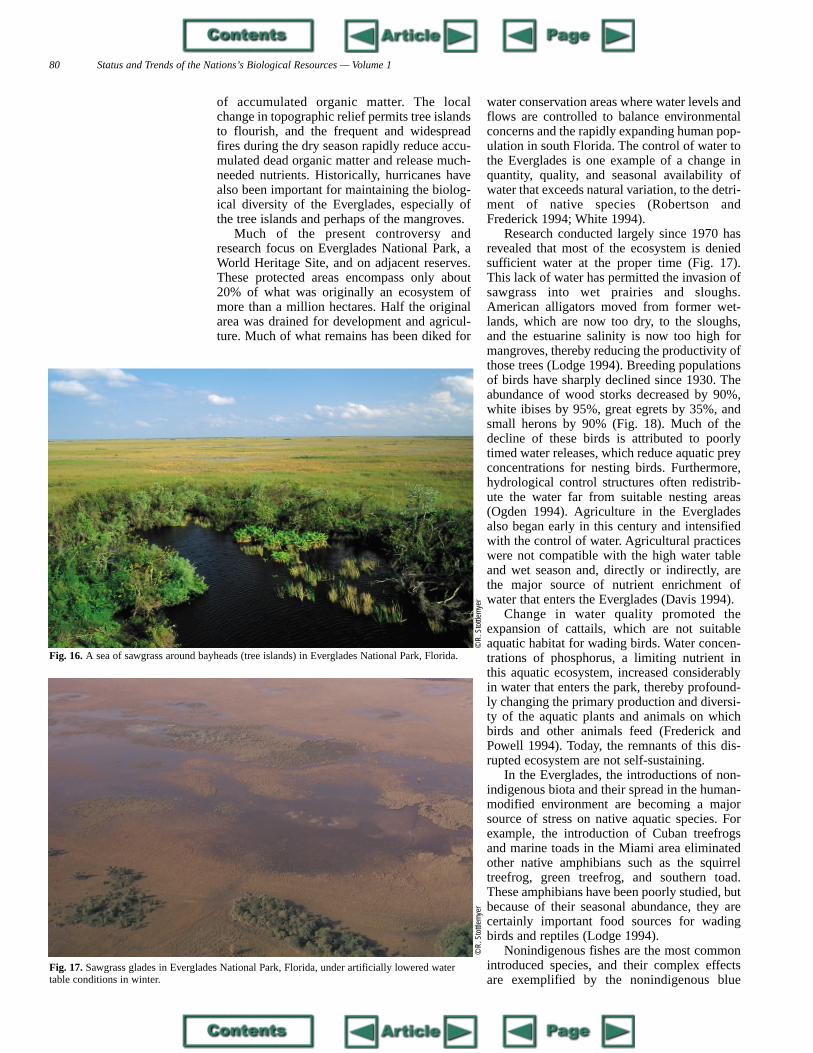
Fig. 16. A sea of sawgrass around bayheads (tree islands) in Everglades National Park, Florida.
© R
. Sto
ttlem
yer
© R
. Sto
ttlem
yer
Fig. 17. Sawgrass glades in Everglades National Park, Florida, under artificially lowered watertable conditions in winter.
Factors Affecting Biological Resources — Water Use 81
tilapia and its close relatives. Locally, thisspecies eliminated the growth of naiads, impor-tant aquatic plants that provide cover for small-er native fishes and food for larger fishes suchas shiners, which, in turn, are important prey formany native waterbirds. The greatest threat thatan introduced species poses to the integrity ofthe Everglades, though, seems to be from theAustralian melaleuca. After humans drainmarsh and swamp, melaleuca invades thestressed sawgrass marsh and cypress swamps(Fig. 19). The tree is fire-tolerant and transpireslarge amounts of water, thereby further dryingout areas it invades.
The water cycle also links the Everglades tothe adjacent estuary of Florida Bay. Alteredamounts and timing of freshwater flows to andthrough the Everglades have sharply increasedthe salt levels in Florida Bay. The increasedsalinity has caused reduced reproduction anddistribution of the aquatic and terrestrial speciesonce typical of the bay (McIvor et al. 1994).
As shown by these examples of widespreaddecline in aquatic ecosystem function and bio-logical diversity, the absence of baselineresearch before a region has experienced majoralteration by humans makes understanding theexact causes of ecosystem decline difficult, ifnot impossible. Without a baseline, recent
Lake Washington in Seattle went through atypical case of eutrophication caused by sewageeffluent, experiencing sharp increases in plantbiomass and reductions in light transmission.The public took corrective action before thedeterioration became serious—in part becauseongoing research revealed the early phases oflake eutrophication (Edmondson 1991). This
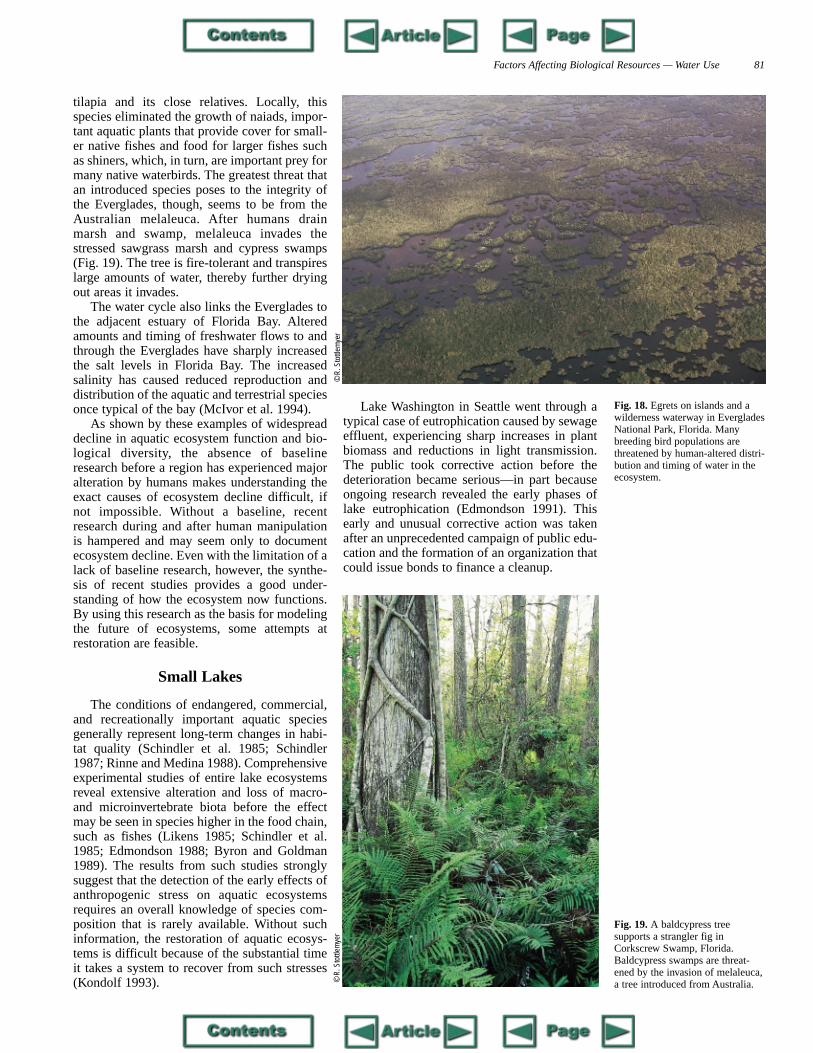
Fig. 18. Egrets on islands and awilderness waterway in EvergladesNational Park, Florida. Manybreeding bird populations arethreatened by human-altered distri-bution and timing of water in theecosystem.
© R
. Sto
ttlem
yer
research during and after human manipulationis hampered and may seem only to documentecosystem decline. Even with the limitation of alack of baseline research, however, the synthe-sis of recent studies provides a good under-standing of how the ecosystem now functions.By using this research as the basis for modelingthe future of ecosystems, some attempts atrestoration are feasible.
Small Lakes
The conditions of endangered, commercial,and recreationally important aquatic speciesgenerally represent long-term changes in habi-tat quality (Schindler et al. 1985; Schindler1987; Rinne and Medina 1988). Comprehensiveexperimental studies of entire lake ecosystemsreveal extensive alteration and loss of macro-and microinvertebrate biota before the effectmay be seen in species higher in the food chain,such as fishes (Likens 1985; Schindler et al.1985; Edmondson 1988; Byron and Goldman1989). The results from such studies stronglysuggest that the detection of the early effects ofanthropogenic stress on aquatic ecosystemsrequires an overall knowledge of species com-position that is rarely available. Without suchinformation, the restoration of aquatic ecosys-tems is difficult because of the substantial timeit takes a system to recover from such stresses(Kondolf 1993).
early and unusual corrective action was takenafter an unprecedented campaign of public edu-cation and the formation of an organization thatcould issue bonds to finance a cleanup.
Fig. 19. A baldcypress tree supports a strangler fig inCorkscrew Swamp, Florida.Baldcypress swamps are threat-ened by the invasion of melaleuca,a tree introduced from Australia.©
R. S
tottl
emye
r
82 Status and Trends of the Nations’s Biological Resources — Volume 1
In sum, aquatic ecosystems, possibly morethan any others, have taken the brunt of humanactivities that are incompatible with the struc-ture and functions of these ecosystems. Humanshave derived tremendous short- and occasional-ly long-term economic benefits from changingaquatic ecosystems but have caused instability,massive losses of integrity that preclude the nat-ural functioning of the systems, and largereductions in species composition. None ofthese are short-term effects. Restorations havenot returned some of these ecosystems to thedegree of self-sufficiency and sustainabilitythey possessed before human perturbation.
Conclusions
For most of the last century and at least untilthe 1950’s, the people of the United Stateslargely ignored the true environmental andlong-term economic costs of water developmentand use. Since 1970 a rapid expansion of thehuman population and per capita consumptionof natural resources has revealed limits to pastwater-use and development practices and to theecological, societal, and ultimately economiccosts of such practices.
The cumulative effects of human activities inaquatic and riparian ecosystems have been dra-
how water is conserved, recycled, and reused(Patrick 1989; Whipple 1989). We must protectour water sources, including groundwater, fromcontamination and overuse, and commit tomaintaining or continuing to restore degradedaquatic systems, riparian forests, and naturalrivers.
Continuing emphasis on water quality andpollution control will draw more attention to theimportance of instream flow issues, and willincrease attention to widespread repercussionsof global changes such as the greenhouse effect(Caulfield 1989). Managers of water resourcesmust recognize the benefits of having sufficientpure fresh water for humans and for ecosystems(Fig. 20).
Limited availability of water for withdrawaland use by urban areas will continue to requireinnovative planning for water use. Traditionalexpansions of capacity no longer solve theproblems of supply and demand for publicwater. Satisfying uncontrolled future require-ments for water is too expensive. Current solu-tions include increasing the supply from exist-ing storage facilities, managing water demand,reducing loss from distribution systems, provid-ing lower-quality supplies for nondrinking pur-poses, encouraging reuse, and conservationthrough pricing (a large increase in costs for
matic but remain poorly understood. We canlink changes in biological diversity to habitatalteration or species loss; the importance oflong-term shifts in habitat are also beingassessed. There are enough scientifically docu-mented declines of species abundances andextinctions of aquatic species that are directresults of human activity to indicate that presentwater-use and development practices cannotcontinue. Although much research is still need-ed, much better use can be made of existinginformation in aquatic resource managementdecisions.
Future Research Needs
The future of water resource management inthe United States will be influenced by anincreasingly complex set of issues because ofexpanding human populations and an uncertain-ty about the United States economy. Theseforces accelerate the rate of present nonpointpollution and the problems arising from incom-patible land and water uses. We must improveour understanding and ability to deal with thesecomplex problems of land and water interac-tions, including agricultural runoff, landfillmanagement, urban industrial waste treatment,sludge disposal, and radioactive or hazardouswastes, while balancing strategic needs to retainthe wetlands and natural rivers that influence
exceeding an established level of use) (Rees1976; Billing and Day 1989). But all competinguses, including the needs of natural ecosystems,
Fig. 20. Fresh water for humans and for natural ecosys-tems: an undammed stream in the Pacific Northwest.
© P
. A. O
pler
Factors Affecting Biological Resources — Water Use 83
must be considered to suitably manage water-sheds and river basins.
Research, especially at the ecosystem level,should be a top priority (Likens 1985) so thatwe can better understand watershed ecosys-tems. Sustained ecological research is essentialfor developing good water-use policy and fordeveloping a more comprehensive basis toeffectively manage or restore aquatic ecosys-tems. An understanding of processes over timeand of their range of natural variation providesa strong tool for an early assessment of whenhuman activities may force these processesbeyond their natural variation. In aquaticecosystems, we must continue to take a specialinterest in monitoring changes in species and incommunity composition.
In addition, we need more replication oflong-term watershed studies. Such studiesshould be initiated primarily in a series of rep-resentative systems, not just in systems that areknown to be affected or which are only repre-sentative of what is defined as sensitive. Toooften, past studies that focused on sensitive sys-tems greatly limited broad application of theirresults.
Most hypothesis testing today is short term,although the importance of long-term monitor-ing and research to provide a context for devel-
water sources, environmental or economic con-cerns, or global events. For these reasons, wemust learn to understand the complex social,ecological, and environmental problems ofwater management in the United States andacquire more information about the relations ofwatersheds with climate, the hydrological cycle,chemical processes, and the biota. Demand forexisting water supplies continues to increaseeven though unallocated supplies are rarelyavailable. In the past, humans looked towardengineering for increasing supplies. In manycases, humans may continue to use constructionto meet their water needs, but environmentalconcerns may be leading us away from manylarge water project choices and toward new models of sustainable uses and watershedmanagement.
To improve the management of watersheds,researchers are striving for a greater under-standing of ecological processes in minimallydisturbed watersheds and the responses of watersheds to various anthropogenic influ-ences. Management depends on an ability topredict the consequences of human interfer-ence. Society’s choices are limited bychanges—many are known, but many are not yet understood. Decisions about water use must take into account resource alterations
oping more meaningful hypotheses cannot beoverstated. Paleoecological techniques, whencalibrated with ecosystem-level experiments,may help resolve deficiencies of past monitor-ing. More effort should also be made to useresults from current long-term studies for thedevelopment and calibration of complex modelsof aquatic and watershed ecosystems.
Future Management of Watersheds
Human effects on watershed ecosystems arelong term. Water-resource management may belimited by past actions, legal or political consid-erations, conflicting user needs, lack of new
that directly and indirectly influence the hydrological cycle and associated lands andbiota. Our ability to manage and to sustainwater resources is constrained by current limits to our understanding of these cause-and-effect relations.
Water is the most limiting factor to life. Fornow, the human species has the capacity to alterthe amount and quality of water for most of theplanet’s animals and plants. In the United Statesand worldwide, however, trends clearly showthat our present water-development and usepractices cannot continue. We must plan wateruse as part of a sustainable relation between theenvironment and society.
Authors
Raymond Herrmann Robert Stottlemyer
U.S. Geological SurveyBiological Resources Division
Midcontinent Ecological ScienceCenter
4512 McMurray AvenueFort Collins, Colorado
80525–3400
Laura ScherbarthColorado State University
Fort Collins, Colorado 80523
Cited ReferencesAmerican Rivers. 1995. North America’s
most endangered and threatened rivers of1995. American Rivers, Washington, D.C.55 pp.
Anderson, R. V., J. W. Grubaugh, and D. B.Markillie. 1991. Summary of water qual-ity characteristics at selected habitat sites,Navigation Pool 26 of the MississippiRiver, July 17 through October 31, 1988.Western Illinois University, Macomb.59 pp.
Armour, C. L., D. A. Duff, and W. Elmore.1991. The effects of livestock grazing onriparian and stream ecosystems. Fisheries16:7–11.
Bain, M. B. 1989. Sterile grass carp maycontrol hydrilla in Guntersville Reservoir.Highlights of Agricultural Research 36:5.
Barclay, J. S. 1978. The effect of channel-ization on riparian vegetation and wildlifein south central Oklahoma. Pages129–138 in R. R. Johnson and J. F.McCormick, editors. Strategies for pro-tection and management of floodplainwetlands and other riparian ecosystems:proceedings of the symposium held 11-13December 1978 in Callaway Gardens,Georgia. U.S. Forest Service GeneralTechnical Report WO-12.
Becker, C. D., and D. A. Neitzel, editors.1992. Water quality in North American
river systems. Battelle Press, Columbus,Ohio. 304 pp.
Behnke, R. J., and R. F. Raleigh. 1978.Grazing and the riparian zone: impact andmanagement perspectives. Pages263–267 in R. R. Johnson and J. F.McCormick, editors. Strategies for pro-tection and management of floodplainwetlands and other riparian ecosystems:proceedings of the symposium held 11-13December 1978 in Callaway Gardens,Georgia. U.S. Forest Service GeneralTechnical Report WO-12.
Benke, A. C. 1990. A perspective onAmerica’s vanishing streams. Journal ofthe North American BenthologicalSociety 9:77–88.
84 Status and Trends of the Nations’s Biological Resources — Volume 1
Billing, R. B., and W. M. Day. 1989.Demand management factors in residen-tial water use: the southern Arizona(U.S.A.) experiment. American WaterWorks Association Journal 81:58–64.
Boyles, J. M., D. Cain, W. Alley, and R. W.Klusman. 1974. Impact of Argo Tunnelacid mine drainage, Clear Creek County,Colorado. Pages 41–53 in R. F. Hadleyand D. T. Snow, editors. Water resource problems related to mining.American Water Resources Association,Minneapolis, Minn.
Brinson, M. M., The National WaterResources Analysis Group, and TheEastern Energy and Land Use Team.1981. Riparian ecosystems: their ecologyand status. The Eastern Energy and LandUse Team of the U.S. Fish and WildlifeService. U.S. Fish and Wildlife ServiceOBS-81/17. 155 pp.
Budyko, M. I. 1982. The Earth’s climate:past and future. Academic Press, NewYork. 307 pp.
Byron, E. R., and C. R. Goldman. 1989.Land-use and water quality in tributary streams of Lake Tahoe,California–Nevada. Journal ofEnvironmental Quality 18:84–88.
Campbell, C. J. 1970. Ecological implica-tions of riparian vegetation management.Journal of Soil and Water Conservation25:49–52.
Carothers, S. W., and B. T. Brown. 1991.The Colorado River through the Grand
Conniff, R. 1993. California: desert in dis-guise. Pages 38–53 in W. Graves, editor.Water: the power, promise, and turmoil ofNorth America’s fresh water. NationalGeographic Special Edition, November1993, 184(5A).
Crowder, A. A., and J. M. Bristow. 1988.The future of waterfowl habitats in theCanadian lower Great Lakes wetlands.Journal of Great Lakes Research14:115–127.
Crowder, B. M. 1987. Economic costs ofreservoir sedimentation: a regionalapproach to estimating cropland erosiondamages. Soil Conservation Society ofAmerica, Journal of Soil and WaterConservation 42:194–197.
Cummins, K. W., M. A. Wilzbach, D. M.Gates, J. B. Perry, and W. B. Taliaferro.1989. Shredders and riparian vegetation.BioScience 39:24–30.
Dahl, T. E., and C. E. Johnson. 1991.Wetlands: status and trends in the conter-minous United States mid-1970’s tomid-1980’s. U.S. Fish and WildlifeService, Washington, D.C. 12 pp.
Davis, S. M. 1994. Phosphorus inputs andvegetation sensitivity in the Everglades.Pages 357–378 in S. M. Davis and J. C.Ogden, editors. Everglades: the ecosys-tem and its restoration. St. Lucie Press,Delray Beach, Fla.
Davis, S. M., and J. C. Ogden, editors. 1994.Everglades: the ecosystem and its restora-tion. St. Lucie Press, Delray Beach, Fla.
Everglades: the ecosystem and its restora-tion. St. Lucie Press, Delray Beach, Fla.
Funk, J. L., and J. W. Robinson. 1974.Changes in the channel of the lowerMissouri and effects on fish and wildlife.Missouri Department of Conservation,Jefferson City. Aquatic Series 11. 52 pp.
Gregory, S. V., F. J. Swanson, W. A. Mckee,and K. W. Cummins. 1991. An ecosystemperspective of riparian zones: focus onlinks between land and water. BioScience41:540–551.
Gunderson, L. H., and J. R. Snyder. 1994.Fire patterns in the southern Everglades.Pages 291–305 in S. M. Davis and J. C.Ogden, editors. Everglades: the ecosys-tem and its restoration. St. Lucie Press,Delray Beach, Fla.
Hardaway, T., and P. Yakupzak. 1981. RedRiver Waterway Project, MississippiRiver to Shreveport, Louisiana, reach andplanning aid report. U.S. Fish andWildlife Service, Division of EcologicalServices, Lafayette, La. 15 pp.
Hardie, M. G., J. C. Jennett, E. Bolter,B. Wixson, and N. Gale. 1974. Waterresource problems and solutions with thenew Lead Belt of southeast Missouri.Pages 109–122 in R. F. Hadley and D. T.Snow, editors. Water resource problemsrelated to mining. American WaterResources Association, Minneapolis,Minn.
Hedgecock, D., P. Siri, and D. R. Strong.1994. Conservation biology of the
Canyon: natural history and humanchange. University of Arizona Press,Tucson. 235 pp.
Caulfield, H. P., Jr. 1989. Future water man-agement problems: the federal role intheir solutions. Pages 21–30 in A. I.Johnson and W. Viessman, Jr., editors.Water management in the 21st century: a25th anniversary collection of essays byeminent members of the American Water Resources Association. AmericanWater Resources Association SpecialPublication 89-2, Bethesda, Md.
Cloern, J., and A. Alpine. 1991.Potamocorbula amurensis, a recentlyintroduced Asian clam, has had dramaticeffects on the phytoplankton biomass andproduction in northern San FranciscoBay. International Zebra Mussel ResearchConference, 5–7 December 1990. Journalof Shellfish Research 10:258–259.
Conine, K. H., B. W. Anderson, R. D.Ohmart, and J. F. Drake. 1978. Responsesof a species to agricultural habitat conver-sions. Pages 248–262 in R. R. Johnsonand J. F. McCormick, editors. Strategiesfor protection and management of flood-plain wetlands and other riparian ecosys-tems: proceedings of the symposium held11–13 December 1978 in CallawayGardens, Georgia. U.S. Forest ServiceGeneral Technical Report WO-12.
Conley, D. J., C. L. Schelske, and E. F.Stoermer. 1993. Modification of the bio-geochemical cycle of silica with eutroph-ication. Marine Ecology Progress Series101:179–192.
826 pp.Deacon, J. E., G. Kobetich, J. D. Williams,
S. Contreras-Balderas, et al. 1979. Fishesof North America endangered, threatened,or of special concern: 1979. Fisheries4:30–44.
Doyle, J. D., B. Tunnicliff, R. Kramer,R. Kuehl, and S. K. Bricker. 1992.Instability of fecal coliform populationsin waters and bottom sediments of recre-ational beaches in Arizona. WaterResearch 26:979–988.
Edmondson, W. T. 1988. Lessons fromWashington lakes. Pages 457–463 in I. G.Poppoff, C. R. Goldman, S. L. Loeb, andL. B. Leopold, editors. Proceedings of theinternational mountain watershed sympo-sium, 8–10 June 1988. Lake Tahoe, Calif.
Edmondson, W. T. 1991. Lake Washingtonand beyond. University of WashingtonPress, Seattle. 329 pp.
Ellis, W. S. 1993. The Mississippi: riverunder siege. Pages 90–105 in W. Graves,editor. Water: the power, promise, and tur-moil of North America’s fresh water.National Geographic Special Edition,November 1993, 184(5A).
Federal Water Pollution Control Act, U. S.Code. 1972. Volume 33, Sections 1251 etseq.
Fisher, F. W. 1994. Past and present status ofCentral Valley chinook salmon.Conservation Biology 8:870–873.
Frederick, P. C., and G. V. N. Powell. 1994.Nutrient transport by wading birds in theEverglades. Pages 571–584 in S. M.Davis and J. C. Ogden, editors.
endangered Pacific salmonids: introduc-tory remarks. Conservation Biology8:863–864.
Herlihy, A., P. R. Kaufman, M. E. Mitch,and D. D. Brown. 1990. Regional esti-mates of acid mine drainage impact onstreams in the mid-Atlantic and south-eastern United States. Water, Air and SoilPollution 50:91–107.
Holland-Bartels, L. E. 1992. Water qualitychanges and their relation to fisheryresources in the upper Mississippi River.Pages 159–180 in C. D. Becker and D. A.Neitzel, editors. Water quality in NorthAmerican river systems. Battelle Press,Columbus, Ohio.
Hunt, C. E. 1988. Down by the river: theimpact of federal water projects and poli-cies on biological diversity. Island Press,Washington, D.C. 266 pp.
Hurt, R. D. 1987. Indian agriculture inAmerica: prehistory to the present.University Press of Kansas, Lawrence.290 pp.
Johnson, A. I., and W. Viessman, Jr. 1989.Water management in the 21st century: a25th anniversary collection of essays byeminent members of the American Water Resources Association. AmericanWater Resources Association SpecialPublication 89–2, Bethesda, Md.
Johnson, J. E. 1995. Imperiled freshwaterfish. Pages 142–144 in E. T. LaRoe, G. S.Farris, C. E. Puckett, P. D. Doran, andM. J. Mac, editors. Our living resources: areport to the nation on the distribution,abundance, and health of U.S. plants, ani-mals, and ecosystems. U.S. Department
Factors Affecting Biological Resources — Water Use 85
of the Interior, National BiologicalService, Washington, D.C.
Johnson, R. R. 1977. Synthesis and manage-ment implications of the Colorado Riverresearch program. Colorado RiverTechnical Report 17, Grand Canyon,Ariz. 75 pp.
Johnson, R. R., and R. F. McCormick, edi-tors. 1979. Strategies for protection andmanagement of floodplain wetlands andother riparian ecosystems. Proceedings ofa symposium held 11-13 December 1978.Callaway Gardens, Georgia. U.S. ForestService General Technical ReportWO-12. 410 pp.
Josephy, A. M., Jr. 1968. The Indian heritageof America. Bantam Books, New York.397 pp.
Karr, J. R., L. A. Toth, and D. R. Dudley.1985. Fish communities of midwesternrivers: a history of degradation.BioScience 35:90–95.
Kitchell, J. F. 1990. The scope for mortalitycaused by sea lamprey. Transactions ofthe American Fisheries Society119:642–648.
Kondolf, G. M. 1993. Lag in stream channeladjustment to livestock enclosure, WhiteMountains, California. RestorationEcology 1:226–230.
Kondolf, G. M. 1994. Geomorphic and envi-ronmental effects of instream gravel min-ing. Landscape and Urban Planning28:225–243.
Krusé, C. W. 1969. Our nation’s water: its
MacCracken, M. C., M. I. Budyko, A. D.Hecht, and Y. A. Izrael, editors. 1990.Prospects for future climate: a specialU.S./U.S.S.R. report on climate and cli-mate change. U.S./U.S.S.R. Agreementon Protection of the Environment. LewisPublishers, Chelsea, Mich. 270 pp.
Mackie, G. L. 1991. Biology of the exoticzebra mussel, Dreissena polymorpha, inrelation to native bivalves and its potentialimpact in Lake St. Clair. Pages 251–268in M. Munawar and T. Edsall, editors.Symposium on environmental assessmentand habitat evaluation in the upper GreatLakes connecting channels. Volume 219.Thirty-first Conference on Great LakesResearch, Hamilton, Ontario, Canada.
Major, D. C. 1992. Urban water supply andglobal environmental change: the watersupply system of New York City. Pages377–385 in R. Herrmann, editor.Managing water resources during globalchange. American Water ResourcesAssociation 28th annual conference andsymposium, 1–5 November 1992 inReno, Nev. American Water ResourcesAssociation, Bethesda, Md.
Mathias, M. E., and P. Moyle. 1992.Wetland and aquatic habitats. Agriculture Ecosystems and Environment42:165–176.
McDonald, A., and D. Kay. 1988. Waterresources: issues and strategies.Longman/John Wiley & Sons, New York.284 pp.
Long-term decline in freshwater mussels(Bivalvia: Unionidae) of the westernbasin of Lake Erie. Journal of GreatLakes Research 17:214–219.
Nehlsen, W. 1994. Salmon stocks at risk:beyond 214. Conservation Biology8:867–869.
Neitzel, D. A., and T. J. Frest. 1992. Surveyof Columbia River basin streams forColumbia pebblesnail Fluminicolacolumbiana and shortfaced lanx Fisherolanuttalli. Battelle Pacific Northwest Labs,Richland, Wash. 83 pp.
Novotny, V., and G. Chesters. 1989.Delivery of sediment and pollutants fromnonpoint sources: a water quality per-spective. Journal of Soil and WaterConservation 44:568–576.
O’Dell, K. M. 1994. Water quality in theShingle Creek basin, Florida, before andafter wastewater diversion. Journal ofEnvironmental Quality 23:563–571.
Ogden, J. C. 1994. A comparison of wadingbird nesting colony dynamics(1931–1946 and 1974–1989) as an indi-cation of ecosystem conditions in thesouthern Everglades. Pages 533–570 inS. M. Davis and J. C. Ogden, editors.Everglades: the ecosystem and its restora-tion. St. Lucie Press, Delray Beach, Fla.
Parfit, M. 1993. When humans harness nat-ural forces. Pages 56–65 in W. Graves,editor. Water: the power, promise, and tur-moil of North America’s fresh water.National Geographic Special Edition,
pollution control and management. Pages41–71 in J. N. Pitts, Jr., and R. L. Metcalf,editors. Advances in environmental sci-ences, Volume 1. John Wiley & Sons,New York.
Lea, D. M. 1985. Irrigation in the UnitedStates. Economic Research Service staffreport AGES840816. U.S. Department ofAgriculture, Natural Resource EconomicsDivision, Economic Research Service,Washington, D.C. 66 pp.
Lerczak, T. V., and R. E. Sparks. 1995. Fishpopulations in the Illinois River. Pages239–241 in LaRoe, E. T., G. S. Farris,C. E. Puckett, P. D. Doran, and M. J. Mac,editors. Our living resources: a report tothe nation on the distribution, abundance,and health of U.S. plants, animals, andecosystems. U.S. Department of theInterior, National Biological Service,Washington D.C. 530 pp.
Likens, G. E. 1985. Pages 441–443 in Anecosystem approach to aquatic ecology.Springer-Verlag, New York.
Livingston, R. J. 1984. The ecology of theApalachicola Bay system: an estuarineprofile. U.S. Fish and Wildlife ServiceOBS-82/05. 165 pp.
Lodge, T. E. 1994. The Everglades hand-book: understanding the ecosystem. St.Lucie Press, Delray Beach, Fla. 228 pp.
Lorang, M. S., P. O. Komar, and J. A.Stanford. 1993. Lake level regulation andshoreline erosion on Flathead Lake,Montana: a response to the redistributionof annual wave energy. Journal of CoastalResearch 9:494–508.
McIvor, C. C., J. A. Ley, and R. D. Bjork.1994. Changes in freshwater inflow fromthe Everglades to Florida Bay includingeffects on biota and biotic processes: areview. Pages 117–146 in S. M. Davis andJ. C. Ogden, editors. Everglades: theecosystem and its restoration. St. LuciePress, Delray Beach, Fla.
Mesa, M. G. 1994. Effects of multiple acutestressors on the predator avoidance abili-ty and physiology of juvenile chinooksalmon. Transactions of the AmericanFisheries Society 123:786–793.
Mongan, T. R., and B. J. Miller. 1992. Waterquality and water managementSacramento–San Joaquin River system.Pages 85–115 in C. D. Becker and D. A.Neitzel, editors. Water quality in NorthAmerican river systems. Battelle Press,Columbus, Ohio.
Moore, J. M. W. 1989. Balancing the needsof water use. Springer-Verlag, New York.267 pp.
Moyle, P. B., and R. A. Leidy. 1992. Loss ofbiodiversity in aquatic ecosystems: evi-dence from fish faunas. Pages 127–169 inP. L. Fielder and S. K. Jain, editors.Conservation biology: the theory andpractice of nature conservation, preserva-tion, and management. Chapman andHall, New York. 507 pp.
Nalepa, T. F. 1991. Status and trends of theLake Ontario macrobenthos. CanadianJournal of Fisheries and Aquatic Sciences48:1558–1567.
Nalepa, T. F., B. A. Manny, J. C. Roth, S. C.Mozley, and D. W. Schloesser. 1991.
November 1993, 184(5A).Patrick, R. 1989. Past, present and future of
water use management. Pages 15–19 inA. I. Johnson and W. Viessman, Jr., edi-tors. Water management in the 21st centu-ry: a 25th anniversary collection of essaysby eminent members of the AmericanWater Resources Association. AmericanWater Resources Association SpecialPublication 89–2, Bethesda, Md.
Pearson, W. D. 1992. Historical changes inwater quality and fishes of the Ohio River.Pages 207–231 in C. D. Becker and D. A.Neitzel, editors. Water quality in NorthAmerican river systems. Battelle Press,Columbus, Ohio.
Pederson, G. L., editor. 1994. National sym-posium on water quality, proceedings.American Water Resources AssociationTechnical Publication TPS-94-4,Bethesda, Md. 322 pp.
Petts, G. E. 1984. Impounded rivers: per-spectives for ecological management.John Wiley & Sons, New York. 326 pp.
Pielke, R. A., J. S. Baron, T. G. F. Kittel, T. J.Lee, T. N. Chase, and J. M. Cram. 1992.Influence of landscape structure on thehydrological cycle and regional and glob-al climate. Pages 283–296 inR. Herrmann, editor. Managing waterresources during global change,American Water Resources Association28th annual conference and symposiumproceedings. 1–5 November 1992, Reno,Nev. American Water ResourcesAssociation Technical Publication SeriesTPS-92-4, Bethesda, Md.
86 Status and Trends of the Nations’s Biological Resources — Volume 1
Rees, J. A. 1976. Rethinking our approachto water supply provision. Geography61:232–245.
Rinne, J. N., and A. L. Medina. 1988.Factors influencing salmonid populationsin six headwater streams, central Arizona,USA. Polish Archives of Hydrobiology35:515–535.
Robertson, W. B., Jr., and P. C. Frederick.1994. The faunal chapters: context, syn-thesis, and departures. Pages 709–737 inS. M. Davis and J. C. Ogden, editors.Everglades: the ecosystem and its restora-tion. St. Lucie Press, Delray Beach, Fla.
Schideman, L. C., and S. F. Blanchard.1994. Nitrate concentrations and trends inselected Illinois streams, 1979–1993.Pages 93–104 in G. L. Pederson, editor.National symposium on water quality,proceedings. American Water ResourcesAssociation Technical PublicationTPS-94-4, Bethesda, Md.
Schilling, K., C. Copeland, J. Dixon,J. Smythe, M. Vincent, and J. Peterson.1987. The nation’s public works: reporton water resources. National Council onPublic Works Improvement, Washington,D.C. 183 pp. + appendixes.
Schindler, D. E., J. F. Kitchell, He-Xi, S. R.Carpenter, J. R. Hodgson, and K. L.Cottingham. 1993. Food web structureand phosphorus cycling in lakes.Transactions of the American FisheriesSociety 122:756–772.
Schindler, D. W. 1987. Detecting ecosystem
the United States in 1990. U.S.Geological Survey Circular 1081. 76 pp.
Solley, W. B., and R. R. Pierce. 1988. Trendsin water use in the United States, 1950–1985. Pages 31–49 inM. Waterstone and R. J. Burt, editors.Proceedings of the symposium onwater-use data for water resources man-agement. American Water ResourcesAssociation, Bethesda, Md.
Starrett, W. C. 1972. Man and the IllinoisRiver. Pages 131–169 in R. T. Oglesby,C. A. Carlson, and J. A. McCann, editors.River ecology and man: proceedings of aninternational symposium. 20–23 June1971, Amherst, Mass. Academic Press,New York.
Strober, Q. J., and R. E. Nakatani. 1992.Water quality and biota of the ColumbiaRiver system. Pages 53–83 in C. D.Becker and D. A. Neitzel, editors. Waterquality in North American river systems.Battelle Press, Columbus, Ohio.
Trefethen, P. 1972. Man’s impact on theColumbia River. Pages 77–97 in R. T.Oglesby, C. A. Carlson, and J. A.McCann. River ecology and man: pro-ceedings of an international symposium.20–23 June 1971, Amherst, Mass.Academic Press, New York.
Trelease, F. J. 1967. Cases and materials onwater law. West Publishing, St. Paul,Minn. 364 pp.
Tyler, D. 1992. The last water hole in theWest: the Colorado–Big Thompson
van der Leeden, F., editor. 1975. Waterresources of the world: selected statistics.Water Information Center, PortWashington, N.Y. 568 pp.
van der Leeden, F., F. L. Troise, and D. K.Todd, editors. 1990. The water encyclope-dia. 2nd edition. Lewis Publishers,Chelsea, Mich. 808 pp.
Walsh, S. J., N. M. Burkhead, and J. D.Williams. 1995. Southeastern freshwaterfishes. Pages 144–147 in E. T. LaRoe,G. S. Farris, C. E. Puckett, P. D. Doran,and M. J. Mac, editors. Our livingresources: a report to the nation on thedistribution, abundance, and health ofU.S. plants, animals, and ecosystems.U.S. Department of the Interior, NationalBiological Service, Washington, D.C.
Ward, A. K., G. M. Ward, and S. C. Harris.1992. Water quality and biological com-munities of the Mobile River drainage,eastern Gulf of Mexico region. Pages277–304 in C. D. Becker and D. A.Neitzel, editors. Water quality in NorthAmerican river systems. Battelle Press,Columbus, Ohio.
Ward, J. V., and J. A. Stanford, editors. 1979.The ecology of regulated streams. PlenumPress, New York. 398 pp.
Warren, M. L., and B. M. Burr. 1994. Statusof freshwater fishes of the United States:an overview of an imperiled fauna.Fisheries 19:6–18.
Waterstone, M., and R. J. Burt, editors.1988. Proceedings of the symposium on
responses to anthropogenic stress.Canadian Journal of Fisheries andAquatic Sciences 44(Supplement 1):6–25
Schindler, D. W., K. H. Mills, D. F. Malley,D. L. Findlay, J. A. Shearer, I. J. Davies,M. A. Turner, G. A. Linsey, and D. R.Cruikshank. 1985. Long-term ecosystemstress: the effects of years of experimentalacidification on a small lake. Science228:1395–1401.
Schmulbach, J. C., L. W. Hesse, and J. E.Bush. 1992. The Missouri River: GreatPlains thread of life. Pages 135–158 inC. D. Becker and D. A. Neitzel, editors.Water quality in North American riversystems. Battelle Press, Columbus, Ohio.
Sidle, J. G., and E. M. Kirsch. 1993. Leasttern and piping plover nesting at sand pitsin Nebraska. Colonial Waterbirds16:139–148.
Simons, D. B. 1979. Effects of stream regu-lation on channel morphology. Pages95–111 in J. V. Ward and J. A. Stanford,editors. The ecology of regulated streams.Plenum Press, New York.
Smith, R. A., R. B. Alexander, and K. J.Lanfear. 1992. Stream water quality in theconterminous United States—status andtrends of selected indicators during the1980’s. Pages 111–140 in U.S.Geological Survey. National water sum-mary 1990–91: hydrologic events andstream water quality. U.S. GeologicalSurvey Water-Supply Paper 2400.
Solley, W. B., R. A. Pierce, and H. A.Perlman. 1993. Estimated use of water in
Project and the Northern Colorado WaterConservancy District. University Press ofColorado, Niwot. 613 pp.
U.S. Army Corps of Engineers. 1980.Missouri River bank stabilization andnavigation project: fish and wildlife miti-gation plan. U.S. Army Corps ofEngineers, Kansas City, Mo.
U.S. Department of Commerce Bureau ofthe Census. 1975. Historical statistics ofthe United States: colonial times to 1970.Bicentennial edition. 2 parts. Washington,D.C. 1200 pp.
U.S. Department of Commerce Bureau ofthe Census. 1994. Statistical abstracts ofthe United States: 1994. 114th edition.Washington, D.C. 1011 pp.
U.S. Department of the Interior. 1973.Surface mining, its nature, extent, andsignificance. Pages 312–334 in R. W.Tank, editor. Focus on environmentalgeology: a collection of case histories andreadings from original sources. OxfordUniversity Press, New York.
U.S. Fish and Wildlife Service. 1979. TheYazoo Basin: an environmental overview.U.S. Fish and Wildlife Service, Divisionof Ecological Services, Vicksburg, Miss.32 pp.
U.S. Fish and Wildlife Service. 1994.Endangered and threatened wildlife andplants. 50 CFR 17.11 & 17.12.Washington, D.C. 42 pp.
U.S. Office of Technology Assessment.1984. Wetlands: their use and regulation.United States Congress, Washington,D.C. OTA-0-206. 208 pp.
water use data for water resources man-agement. American Water ResourcesAssociation Technical PublicationTPS-88-2, Bethesda, Md. 830 pp.
Whipple, W., Jr. 1989. Future directions forwater resources. Pages 9–14 in A. I.Johnson and W. Viessman, Jr., editors.Water management in the 21st century: a25th anniversary collection of essays byeminent members of the American Water Resources Association. AmericanWater Resources Association SpecialPublication 89-2, Bethesda, Md.
White, P. S. 1994. Synthesis: vegetation pat-tern and processes in the Evergladesecosystem. Pages 445–458 in S. M. Davisand J. C. Ogden, editors. Everglades: theecosystem and its restoration. St. LuciePress, Delray Beach, Fla.
Wilkinson, C. F. 1992. Crossing the nextmeridian: land, water, and the future ofthe West. Island Press, Washington, D.C.376 pp.
Williams, J. E., J. E. Johnson, D. A.Hendrickson, S. Contreras-Balderas, J. D.Williams, M. Navarro-Mendoza, D. E.McAllister, and J. E. Deacon. 1989.Fishes of North America endangered,threatened, or of special concern: 1989.Fisheries 14:2–20.
Impounded River SystemsBecker, D. A., and R. D. Gorton. 1995. The
Missouri River: a formula for ecosystemchange. Pages 275–297 in S. R. Johnson

Factors Affecting Biological Resources — Water Use 87
and A. Bouzaher, editors. Conservation ofGreat Plains ecosystems: current science,future options. Kluwer Academic,Dordrecht, The Netherlands.
Flack, S., and R. Chipley, editors. 1996.Troubled waters: protecting our aquaticheritage. The Nature Conservancy,Arlington, Va. 17 pp.
Gore, F. A., and F. D. Shields, Jr. 1995. Canlarge rivers be restored? BioScience45:142–152.
Holden, P. B. 1979. Ecology of riverine fish-es in regulated stream systems withemphasis on the Colorado River. Pages57–74 in J. V. Ward and J. A. Stanford,editors. The ecology of regulated streams.Plenum Press, New York.