status and trends of wetlands in minnesota: wetland...
TRANSCRIPT

Minnesota Department of Natural Resources Division of Ecological and Water Resources
Status and Trends of Wetlands in Minnesota: Wetland Quantity Baseline
Steven M. Kloiber
December 2010

Minnesota Department of Natural Resources Division of Ecological and Water Resources
Acknowledgements
This document was developed for the Minnesota Wetland Status and Trends Monitoring Program which
has received funding from the Minnesota Department of Natural Resources (DNR), the Minnesota
Pollution Control Agency (MPCA), and an Environmental Protection Agency (EPA) Region 5 Wetland
Program Development grant.
The data acquisition, photo-interpretation, and field verification was conducted by the DNR Resource
Assessment Office in Grand Rapids, Minnesota under the leadership of Mike Hoppus, Steve Flackey,
Tim Aunan, and Gentry Carlson. In addition, the author gratefully acknowledges the contributions from
reviewers including Doug Norris (DNR Division of Ecological and Water Resources), Ray Norrgard
(DNR Division of Fish and Wildlife) as well as from Mark Gernes, John Genet, Mike Bourdaghs, and
Dan Helwig (MPCA Biological Monitoring Unit).
For comments and questions about this document, please contact the DNR Wetland Monitoring
Coordinator, Steve Kloiber, by phone at 651-259-5164 or by e-mail at [email protected].

Minnesota Department of Natural Resources Ecological and Water Resources Report, December 2010
1
Status and Trends of Wetlands in Minnesota: Wetland Quantity Baseline
Steven M. Kloiber
Wetland Monitoring Coordinator
Minnesota Department of Natural Resources
Division of Ecological and Water Resources
500 Lafayette Road North
Saint Paul, Minnesota 55155
Abstract – The state of Minnesota has developed a monitoring program to collect scientifically sound
data that can be used to assess status and trends of wetland quantity and quality for Minnesota. This
paper summarizes the wetland quantity results for the first three-year cycle of the Minnesota Wetland
Status and Trends Monitoring Program (WSTMP) to serve as a baseline for future trend analyses. The
results for the WSTMP are compared to the National Wetland Inventory (NWI) data and the geographic
distribution of wetlands is described. Based on the WSTMP data, the current total wetland area for
Minnesota is 10.62 (±0.363) million acres. If deepwater habitats are included, the total area is 13.24
(±0.410) million acres. Remarkably, the statewide estimate of wetland area based on WSTMP (2006-
2008) is the same as that from the National Wetland Inventory for Minnesota (1976-1984). However,
there are differences in the geographic distribution as well as differences in the distribution of wetland
types. These differences are likely a result of a combination of factors including differences in source
data, methodology, mapping policies, climate, and ecological succession. Therefore, caution should be
used in attempting to draw conclusions about wetland change between these two surveys. The Prairie
Parkland and Paleozoic Plateau regions have considerably less wetland than the Eastern Broadleaf
Forest and Laurentian Mixed Forest regions. Wetland and deepwater land cover for these regions are
6.90%, 5.35%, 19.9%, and 41.3%, respectively. Field validation efforts indicate that the WSTMP data
correctly distinguish between wetland and upland 94% of the time and correctly classify wetland and
upland cover types 89% of the time. Analysis of 250 annual plots shows little change in wetland area
from year-to-year for the initial three-year sampling cycle.

2
Introduction
It has been estimated that Minnesota has lost
approximately half of its original presettlement
wetlands due to draining and filling for
agriculture and development, with some regions
of the State having lost more than 90 percent of
their original wetlands (Anderson and Craig
1984). In response to concern over the loss of
wetlands, Minnesota passed one of the most
comprehensive wetland protection laws in the
nation, the Minnesota Wetland Conservation
Act of 1991 (WCA). This law set forth a goal of
no net loss of wetlands and requires anyone
proposing to drain, fill, or excavate a wetland to
first avoid disturbing the wetland whenever
possible; second, to minimize impacts to the
wetland; and finally to replace any lost wetland
area or functions.
While wetland gains and losses under WCA are
compiled and reported, various exemptions and
unreported violations make it nearly impossible
to reliably assess whether the State is achieving
its no-net-loss goal. Consequently, the State has
developed a monitoring program to collect
scientifically sound data that can be used to
assess status and trends in wetland quantity and
quality for Minnesota. This paper summarizes
the wetland quantity results for the first three-
year cycle of the Minnesota Wetland Status and
Trends Monitoring Program (WSTMP). These
data will serve as the baseline for future trend
analyses. In addition, this paper compares the
results for the WSTMP to the National Wetland
Inventory (NWI) data and other sources of
wetland data and characterizes the geographic
distribution of these wetlands.
Methods
Measurements of wetland area were made by
mapping wetlands for 4,990 randomly selected,
permanent 1-mi2 plots, known as primary
sampling units (PSUs). Survey plots were
selected using the Generalized Random
Tessellation Stratified design to ensure that
random samples are spatially distributed across
the state (Stevens and Olsen 2004). The PSUs
are arranged in a cyclical, interpenetrating panel
structure. The program design consists of three
panels of 1,580 PSUs that are mapped in
successive years, so that each panel is mapped
every third year. In addition, 250 PSUs are
mapped every year to allow assessment of
annual variability. The mapping protocol calls
for mapping all wetlands within the sampled
plots that are at least 0.5 acres in size.
Additional details regarding the classification
system and methods used are provided in the
technical procedures document (Kloiber et al.
2010). The overall design of the program is
patterned after the national wetland status and
trends program described by Dahl and Bergeson
(2009).
Mapping was performed by the Minnesota
Department of Natural Resources (DNR) using
photo-interpretation of high-resolution color
stereo-imagery. Imagery was collected during
leaf-off (spring) periods at a typical altitude of
6,700 feet on medium-format film (41 x 56 mm
frame size), which is subsequently scanned at
2400 dots per inch and georeferenced to create a
digital image with a ground sampling resolution
of approximately two feet. Hard copy prints are
made at a print scale of 1:12,000 for stereo
photo-interpretation. Land cover for each PSU
was delineated and classified into 12 land cover
classes; six wetland classes, one deepwater
class, and five upland classes (Table 1).
A field verification process is used to ensure
consistency and accuracy of the wetland
interpretation. Roadway accessible wetlands
were randomly selected throughout the state,
with a goal of field checking at least 30
polygons of each wetland type. Error rates for
omission, commission, and overall error rates
were calculated using an error matrix following
procedures described in Congalton and Green
(1999).
3
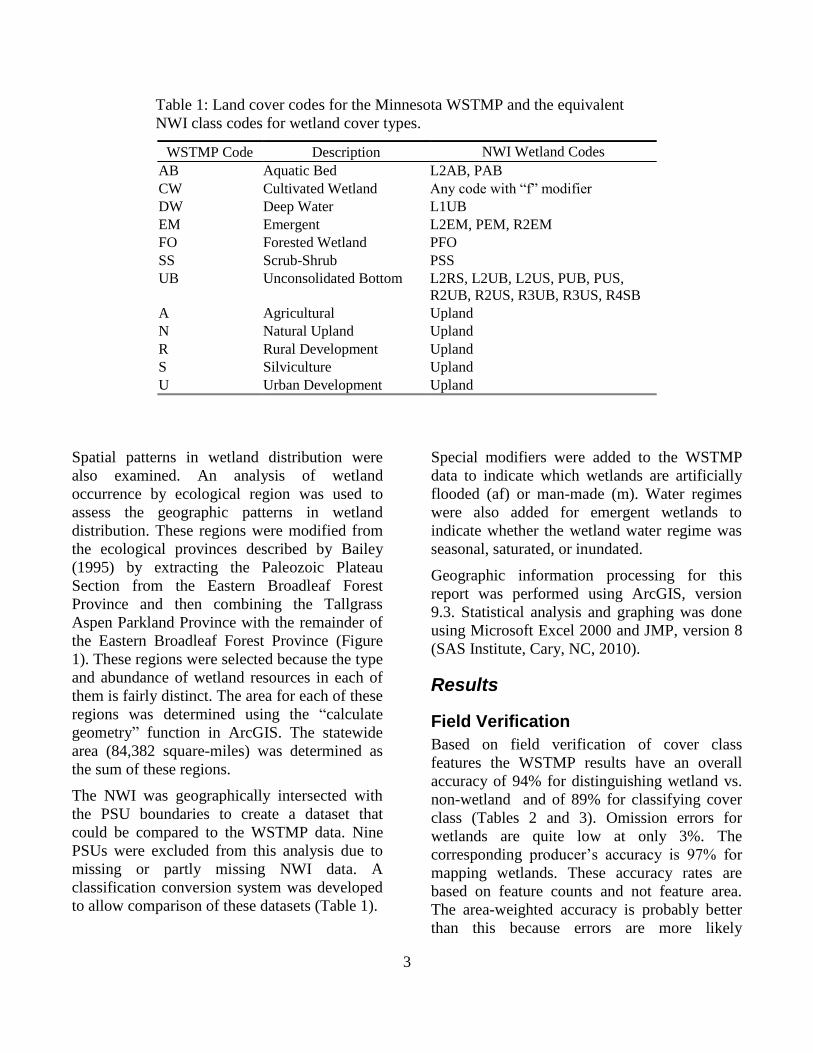
Table 1: Land cover codes for the Minnesota WSTMP and the equivalent
NWI class codes for wetland cover types.
WSTMP Code Description NWI Wetland Codes
AB Aquatic Bed L2AB, PAB
CW Cultivated Wetland Any code with “f” modifier
DW Deep Water L1UB
EM Emergent L2EM, PEM, R2EM
FO Forested Wetland PFO
SS Scrub-Shrub PSS
UB Unconsolidated Bottom L2RS, L2UB, L2US, PUB, PUS,
R2UB, R2US, R3UB, R3US, R4SB
A Agricultural Upland
N Natural Upland Upland
R Rural Development Upland
S Silviculture Upland
U Urban Development Upland
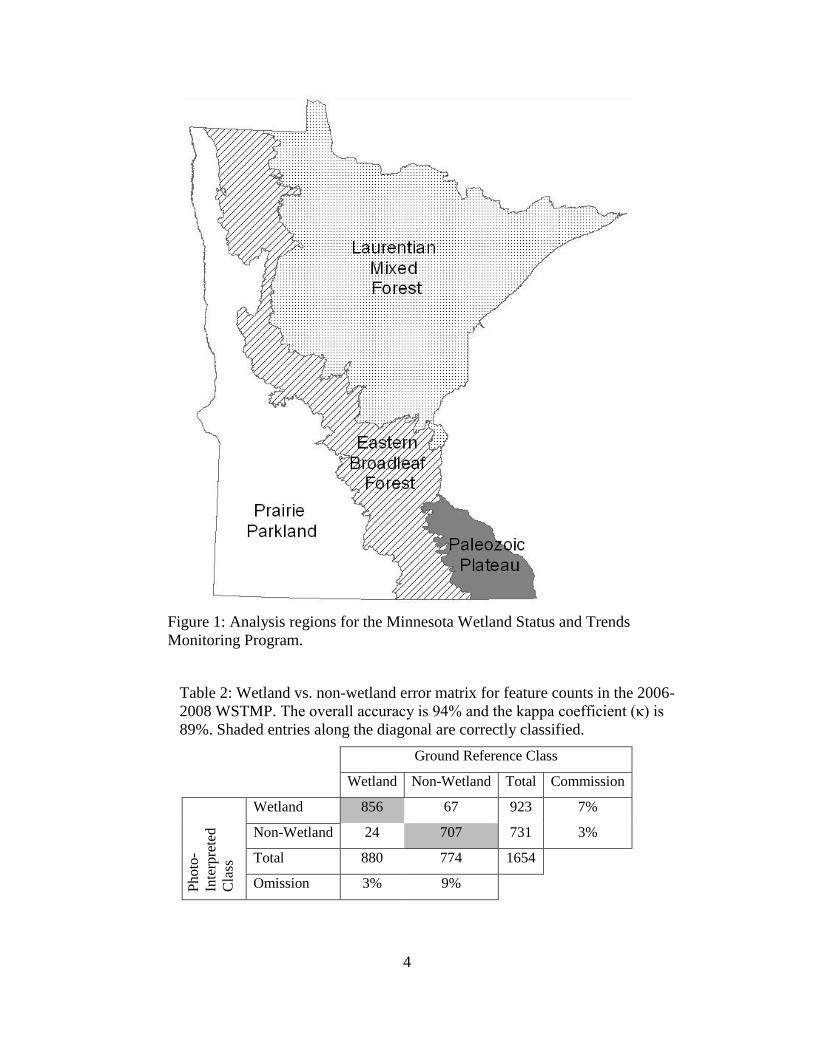
Spatial patterns in wetland distribution were
also examined. An analysis of wetland
occurrence by ecological region was used to
assess the geographic patterns in wetland
distribution. These regions were modified from
the ecological provinces described by Bailey
(1995) by extracting the Paleozoic Plateau
Section from the Eastern Broadleaf Forest
Province and then combining the Tallgrass
Aspen Parkland Province with the remainder of
the Eastern Broadleaf Forest Province (Figure
1). These regions were selected because the type
and abundance of wetland resources in each of
them is fairly distinct. The area for each of these
regions was determined using the “calculate
geometry” function in ArcGIS. The statewide
area (84,382 square-miles) was determined as
the sum of these regions.
The NWI was geographically intersected with
the PSU boundaries to create a dataset that
could be compared to the WSTMP data. Nine
PSUs were excluded from this analysis due to
missing or partly missing NWI data. A
classification conversion system was developed
to allow comparison of these datasets (Table 1).
Special modifiers were added to the WSTMP
data to indicate which wetlands are artificially
flooded (af) or man-made (m). Water regimes
were also added for emergent wetlands to
indicate whether the wetland water regime was
seasonal, saturated, or inundated.
Geographic information processing for this
report was performed using ArcGIS, version
9.3. Statistical analysis and graphing was done
using Microsoft Excel 2000 and JMP, version 8
(SAS Institute, Cary, NC, 2010).
Results
Field Verification
Based on field verification of cover class
features the WSTMP results have an overall
accuracy of 94% for distinguishing wetland vs.
non-wetland and of 89% for classifying cover
class (Tables 2 and 3). Omission errors for
wetlands are quite low at only 3%. The
corresponding producer’s accuracy is 97% for
mapping wetlands. These accuracy rates are
based on feature counts and not feature area.
The area-weighted accuracy is probably better
than this because errors are more likely
4
Figure 1: Analysis regions for the Minnesota Wetland Status and Trends
Monitoring Program.
Table 2: Wetland vs. non-wetland error matrix for feature counts in the 2006-
2008 WSTMP. The overall accuracy is 94% and the kappa coefficient (κ) is
89%. Shaded entries along the diagonal are correctly classified.
Ground Reference Class
Wetland Non-Wetland Total Commission
Ph
oto
-
Inte
rpre
ted
Cla
ss
Wetland 856 67 923 7%
Non-Wetland 24 707 731 3%
Total 880 774 1654
Omission 3% 9%

5
Table 3: Cover class error matrix for feature counts in the 2006-2008 WSTMP. The overall accuracy is 89% and the kappa coefficient
(κ) is 87%. Shaded entries along the diagonal are correctly classified.
Ground Reference Cover Class
DW UB AB EM SS FO CW N S A R U Totals Commission
Ph
oto
-inte
rpre
ted C
over
Cla
ss
DW 100 1 2 103 3%
UB 5 134 4 2 145 8%
AB 7 93 5 105 11%
EM 4 2 315 11 1 17 6 1 2 359 12%
SS 9 100 8 7 2 126 21%
FO 1 4 98 12 115 15%
CW 11 47 15 73 36%
N 2 7 8 135 1 3 3 2 161 16%
S 3 103 106 3%
A 2 1 1 6 1 135 2 2 150 10%
R 122 2 124 2%
U 1 86 87 1%
Totals 105 146 99 349 123 114 49 180 105 161 129 94 1654
Omission 5% 8% 6% 10% 19% 14% 4% 25% 2% 16% 5% 9%

6
associated with smaller features (features with
lower weight); however, the validation sample
was not selected according to feature size, so an
analysis of the area-weighted accuracy is not
possible.
The individual cover classes generally have
errors of commission and omission that are less
than 15%. Notable exceptions include cultivated
wetlands which have a relatively high
commission error rate of 36% and the natural
upland class which has an omission error rate of
25%. The classes most commonly confused
with the cultivated wetland class are emergent
wetlands and agricultural land. The scrub-shrub
wetland class also has moderately high rates of
commission error (21%) and omission error
(19%) and is most frequently confused with
emergent wetlands, forested wetland, or natural
upland. All other classes have relatively modest
error rates ranging approximately from 5% to
15%.
Wetland Quantity
The total area assessed through the 2006-2008
cycle of the wetland status and trends
monitoring program was 4,965 square miles.
This area is slightly less than the number of
PSUs because some PSUs fall on the state
border and the portion that lies outside of the
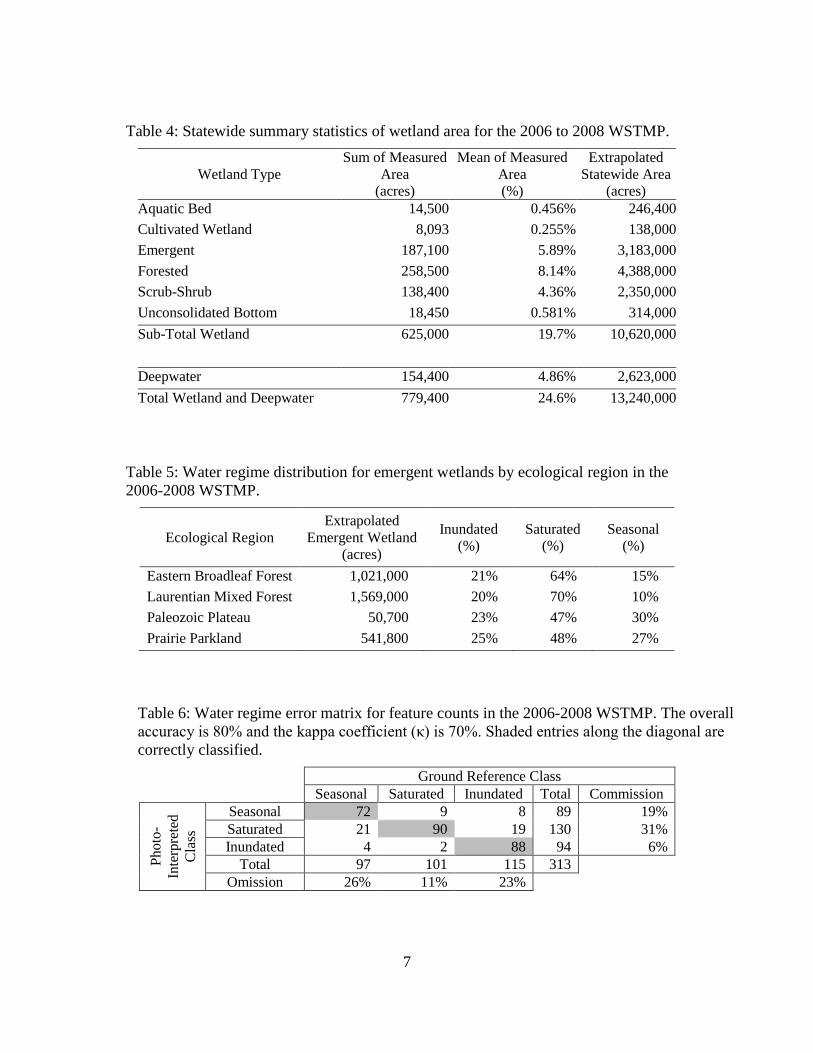
state was not measured. Wetlands occupy 19.7%
of the sampled area and deepwater habitats
cover 4.86% (Table 4). Total wetland and
deepwater habitat cover 24.6% of the area. The
most prevalent type of wetland identified
through this monitoring program was forested
wetlands, which occupy 8.14% of the assessed
area. The next most prevalent wetland types are
emergent wetlands (5.89%) and scrub-shrub
wetlands (4.36%).
Extrapolating from the data in Table 4 and given
a total area for the state of Minnesota of 84,382
square-miles, the total area of wetland for
Minnesota is 10.62 million acres, not including
deepwater habitat. The margin of error for
wetland area in Minnesota is ±0.363 million
acres (two-tailed, 95% confidence limit). If
deepwater habitat is included, the total area is
13.24 million acres with a margin of error of
±0.410 million acres. These error estimates are
extrapolated from the standard error of the mean
for all PSUs and include the effect of both
sampling uncertainty and measurement error.
Water Regime
Water regimes for emergent wetland were also
classified for this program. The three water
regime classes are seasonally flooded, saturated,
and inundated (either permanently or semi-
permanently). The inundated water regime
comprises 20% to 25% of all emergent wetlands
across the four assessment regions (Table 5).
Saturated water regimes predominate in the
Eastern Broadleaf Forest and Laurentian Mixed
Forest regions with 64% and 70% occurrence,
respectively. The occurrence of the saturated
water regime is somewhat lower in the
Paleozoic Plateau and the Prairie Parkland
regions at just below 50% and seasonal water
regimes tend to be more common in these
regions than in other regions.
Accuracy for water regime classification is
generally lower than the accuracy of wetland
identification or type classification (Table 6).
The overall accuracy for water regime
classification is estimated to be 80% with a
kappa coefficient of 70%.
Special Modifiers
Special modifiers were added to the wetland
classification data to indicate wetlands that were
found to have water levels that are artificially
manipulated (modifier = af) and wetlands that
are man-made or modified (modifier = m). Only
four cover classes have cases where these
modifiers were applied, including aquatic bed,
emergent, unconsolidated bottom, and
deepwater classes. Of these classes, the
modifiers were most frequently applied to
7
Table 4: Statewide summary statistics of wetland area for the 2006 to 2008 WSTMP.
Wetland Type
Sum of Measured
Area
(acres)
Mean of Measured
Area
(%)
Extrapolated
Statewide Area
(acres)
Aquatic Bed 14,500 0.456% 246,400
Cultivated Wetland 8,093 0.255% 138,000
Emergent 187,100 5.89% 3,183,000
Forested 258,500 8.14% 4,388,000
Scrub-Shrub 138,400 4.36% 2,350,000
Unconsolidated Bottom 18,450 0.581% 314,000
Sub-Total Wetland 625,000 19.7% 10,620,000
Deepwater 154,400 4.86% 2,623,000
Total Wetland and Deepwater 779,400 24.6% 13,240,000
Table 5: Water regime distribution for emergent wetlands by ecological region in the
2006-2008 WSTMP.
Ecological Region
Extrapolated
Emergent Wetland
(acres)
Inundated
(%)
Saturated
(%)
Seasonal
(%)
Eastern Broadleaf Forest 1,021,000 21% 64% 15%
Laurentian Mixed Forest 1,569,000 20% 70% 10%
Paleozoic Plateau 50,700 23% 47% 30%
Prairie Parkland 541,800 25% 48% 27%
Table 6: Water regime error matrix for feature counts in the 2006-2008 WSTMP. The overall
accuracy is 80% and the kappa coefficient (κ) is 70%. Shaded entries along the diagonal are
correctly classified.
Ground Reference Class
Seasonal Saturated Inundated Total Commission
Ph
oto
-
Inte
rpre
ted
Cla
ss
Seasonal 72 9 8 89 19%
Saturated 21 90 19 130 31%
Inundated 4 2 88 94 6%
Total 97 101 115 313
Omission 26% 11% 23%

8
emergent or unconsolidated bottom wetlands.
The man-made modifier (m) was applied to
14.2% of unconsolidated bottom wetlands and
2.3% of emergent wetlands (Table 7). The
artificially flooded modifier (af) was applied to
3.6% of unconsolidated bottom wetlands and
1.0% of emergent wetlands. The man-made
modifier was also applied to 1.4% of aquatic
bed wetlands. Modifiers were applied to 0.5%
or less of deepwater habitats.
Annual Variability
Of the 250 annually-sampled PSUs, only five
exhibited changes between 2006 and 2007 that
triggered boundary updates between upland and
wetland land cover types. One PSU showed a
net decrease in wetland area of 0.08 acres. All
of the net increases in wetland area were less
than 0.33 acres, with the exception of one
relatively large change of +15.9 acres that
resulted from a wetland constructed for
mitigation purposes. The vast majority of the
annual PSUs (245) showed no net change in
wetland area from 2006 to 2007.
Looking at the change from 2007 to 2008 in
these same annual PSUs, there were nine PSUs
with net decreases in wetland area and four
PSUs with net increases in wetland area. The
net decreases ranged from -0.1 to -1.2 acres.
The net increases ranged from +0.3 to +1.6
acres. Again, the vast majority of PSUs (237)
showed no change in net wetland area.
Geographic Distribution
Wetland occurrence varies considerably across
the state, with a general pattern of increasing
wetland occurrence from south to north. The
distribution of wetland types also varies across
the state (Table 8). Further breakdown of the
wetland data is provided in the appendix.
The Paleozoic Plateau ecological region has the
lowest frequency of occurrence of total wetland
area at 4.05% while the Laurentian Mixed
Forest has the highest frequency of wetland area
at 33.2% (Table 8). If deepwater habitat is
included, the values for these two ecological
regions increase to 5.35% and 41.3%,
respectively.
Table 7: Area of artificially flooded and man-made wetlands by wetland type in
the 2006-2008 WSTMP.
Extrapolated Statewide Area (acres)
Wetland Type Total Area Artificially Flooded Man-Made
Aquatic Bed 246,400 443 3,448
Deepwater 2,623,000 64 13,790
Emergent 3,183,000 32,560 73,360
Unconsolidated Bottom 314,000 11,330 44,410

9
Aquatic bed, cultivated, and unconsolidated
bottom wetlands comprise less than 1% of the
area of each of the four regions and show
relatively little variability across these
provinces. The Paleozoic Plateau has the lowest
frequency of occurrence for all wetlands except
forested, which is lowest in the Prairie Parkland
region. The Laurentian Mixed Forest region has
a far higher frequency of deepwater habitat,
forested wetlands, and scrub-shrub wetlands
than any other region. It has more than twice the
frequency of deepwater and scrub-shrub
wetlands than the next highest region and seven
times more forested wetlands. The Eastern
Broadleaf Forest region has the highest
frequency of aquatic bed and emergent wetlands
(Table 8).
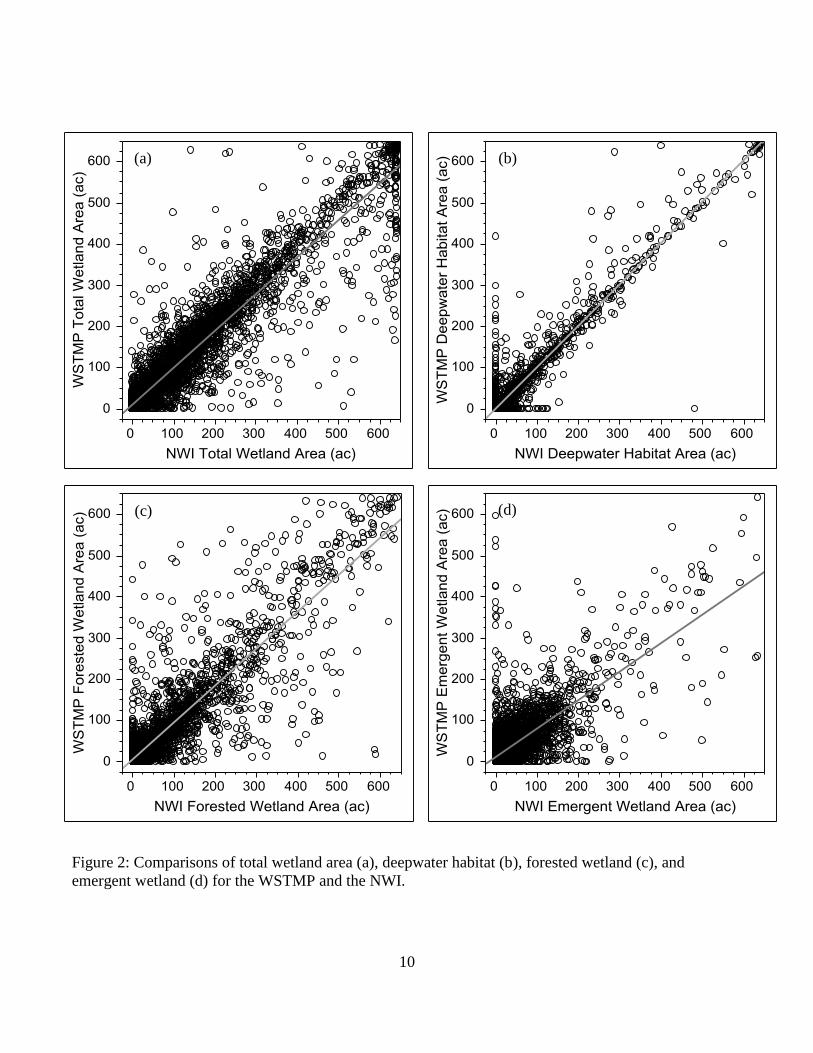
Comparison to National Wetland Inventory
Comparing the percent wetland area for the
WSTMP and the NWI on a plot-by-plot basis
shows a strong correlation with an r-squared
value of 0.89 and a fitted line with a slope that is
nearly 1:1 (Figure 2a). However, while the
majority of data fall close to the line, there are
many deviations. Comparing the deepwater
habitat for these two datasets also yields a very
strong relationship with an r-squared value of
0.95 (Figure 2b) and the slope almost matches
the expected 1:1 line. The relationship for
forested wetlands exhibits more scatter about
the prediction line, and the r-squared value is
slightly weaker at 0.81 (Figure 2c). For
emergent wetland, there is even more variability
about the line and the r-squared value drops to
0.55 (Figure 2d).
Table 8: Proportion of area of wetland type by ecological region in the 2006-2008 WSTMP.
Wetland Type
Area (%)
Prairie
Parkland
Paleozoic
Plateau
Eastern
Broadleaf
Forest
Laurentian Mixed
Forest
Aquatic Bed 0.214% 0.360% 0.741% 0.487%
Cultivated Wetland 0.421% 0.0387% 0.392% 0.0940%
Emergent 3.37% 1.92% 8.44% 6.77%
Forested 0.402% 1.29% 2.46% 17.2%
Scrub-Shrub 0.418% 0.214% 3.24% 8.14%
Unconsolidated Bottom 0.517% 0.229% 0.911% 0.494%
Sub-Total Wetland 5.34% 4.05% 16.2% 33.2%
Deepwater 1.56% 1.31% 3.75% 8.13%
Total Wetland and Deepwater 6.90% 5.35% 19.9% 41.3%
10
Figure 2: Comparisons of total wetland area (a), deepwater habitat (b), forested wetland (c), and
emergent wetland (d) for the WSTMP and the NWI.
(a) (b)
(c) (d)
11
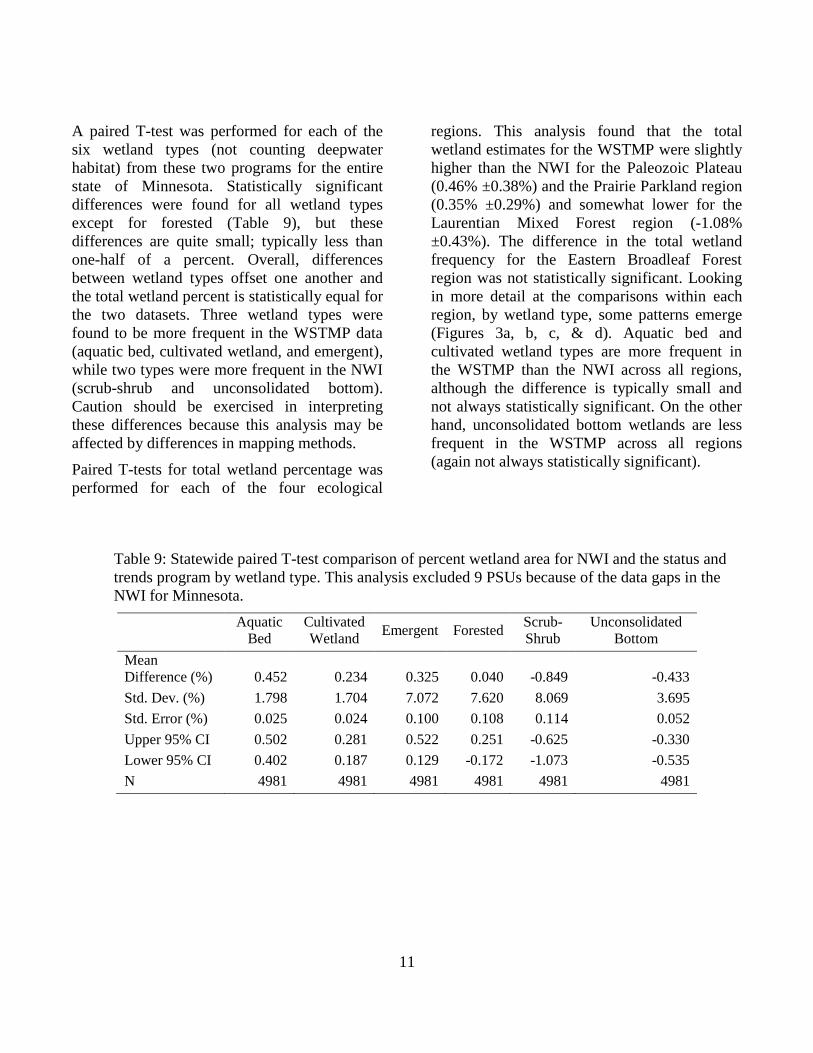
A paired T-test was performed for each of the
six wetland types (not counting deepwater
habitat) from these two programs for the entire
state of Minnesota. Statistically significant
differences were found for all wetland types
except for forested (Table 9), but these
differences are quite small; typically less than
one-half of a percent. Overall, differences
between wetland types offset one another and
the total wetland percent is statistically equal for
the two datasets. Three wetland types were
found to be more frequent in the WSTMP data
(aquatic bed, cultivated wetland, and emergent),
while two types were more frequent in the NWI
(scrub-shrub and unconsolidated bottom).
Caution should be exercised in interpreting
these differences because this analysis may be
affected by differences in mapping methods.
Paired T-tests for total wetland percentage was
performed for each of the four ecological
regions. This analysis found that the total
wetland estimates for the WSTMP were slightly
higher than the NWI for the Paleozoic Plateau
(0.46% ±0.38%) and the Prairie Parkland region
(0.35% ±0.29%) and somewhat lower for the
Laurentian Mixed Forest region (-1.08%
±0.43%). The difference in the total wetland
frequency for the Eastern Broadleaf Forest
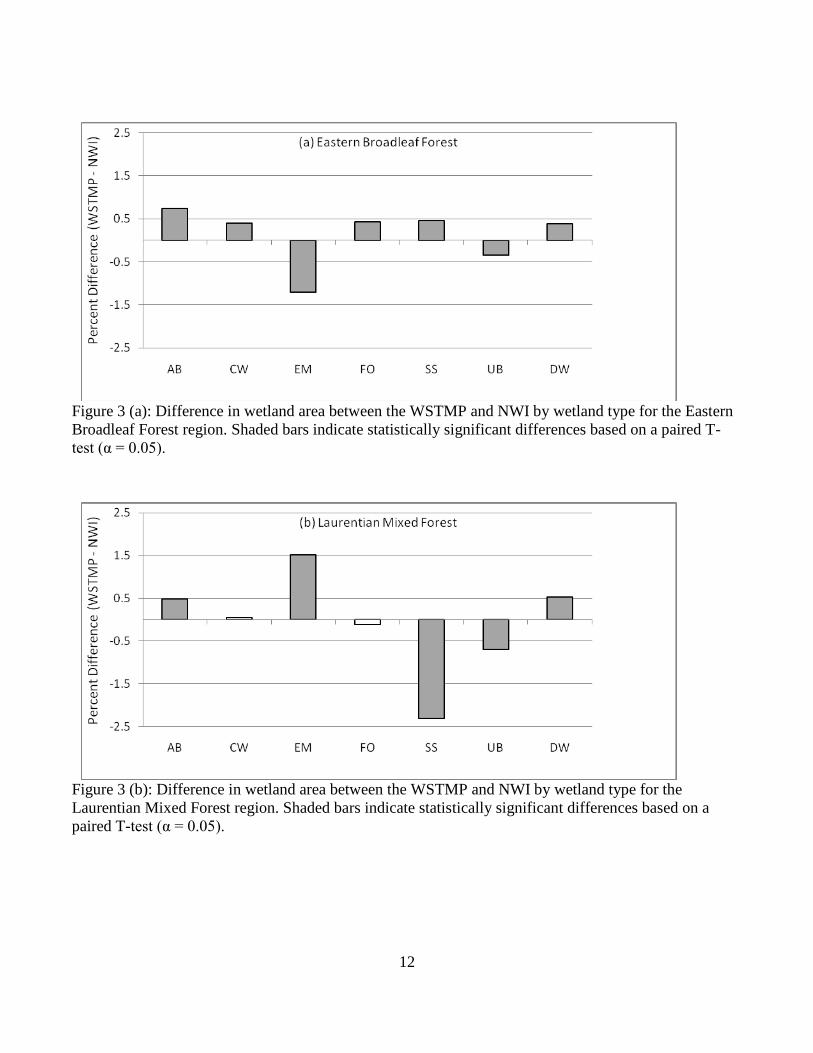
region was not statistically significant. Looking
in more detail at the comparisons within each
region, by wetland type, some patterns emerge
(Figures 3a, b, c, & d). Aquatic bed and
cultivated wetland types are more frequent in
the WSTMP than the NWI across all regions,
although the difference is typically small and
not always statistically significant. On the other
hand, unconsolidated bottom wetlands are less
frequent in the WSTMP across all regions
(again not always statistically significant).
Table 9: Statewide paired T-test comparison of percent wetland area for NWI and the status and
trends program by wetland type. This analysis excluded 9 PSUs because of the data gaps in the
NWI for Minnesota.
Aquatic
Bed
Cultivated
Wetland Emergent Forested
Scrub-
Shrub
Unconsolidated
Bottom
Mean
Difference (%) 0.452 0.234 0.325 0.040 -0.849 -0.433
Std. Dev. (%) 1.798 1.704 7.072 7.620 8.069 3.695
Std. Error (%) 0.025 0.024 0.100 0.108 0.114 0.052
Upper 95% CI 0.502 0.281 0.522 0.251 -0.625 -0.330
Lower 95% CI 0.402 0.187 0.129 -0.172 -1.073 -0.535
N 4981 4981 4981 4981 4981 4981
12
Figure 3 (a): Difference in wetland area between the WSTMP and NWI by wetland type for the Eastern
Broadleaf Forest region. Shaded bars indicate statistically significant differences based on a paired T-
test (α = 0.05).
Figure 3 (b): Difference in wetland area between the WSTMP and NWI by wetland type for the
Laurentian Mixed Forest region. Shaded bars indicate statistically significant differences based on a
paired T-test (α = 0.05).

13
Figure 3 (c): Difference in wetland area between the WSTMP and NWI by wetland type for the
Paleozoic Plateau region. Shaded bars indicate statistically significant differences based on a paired T-
test (α = 0.05).
Figure 3 (d): Difference in wetland area between the WSTMP and NWI by wetland type for the Prairie
Parkland region. Shaded bars indicate statistically significant differences based on a paired T-test (α =
0.05).
14
Discussion
Annual Variability
The annual panel of 250 PSUs was included in
the design to assess the influence of year-to-year
changes and thus the validity of the assumption
that three panels from each year of the cycle
could be combined. Only 5 PSUs were found to
have changed in wetland area from 2006 to
2007 and only 13 PSUs changed in wetland area
from 2007 to 2008. Given that the vast majority
of the annual panel showed no change, it seems
logical to conclude that the data from all three
years of the first cycle can be combined to
provide a single, statewide baseline assessment.
Total Wetland Area
There are several previous estimates of wetland
area in Minnesota. One of the earliest of these
was a study by Anderson and Craig (1984) that
estimated that there were 8.7 million acres of
wetland in Minnesota based on an analysis of
soils data and land use data from 1969. This is
significantly less than the 10.62 million acres of
wetland estimated by the WSTMP. This
difference is likely due partly to a broadening
understanding of what constitutes a wetland and
better data for the WSTMP. Anderson and Craig
(1984) used land use and soil attributes for 40-
acre blocks. The land use data were produced
using interpretation of high-altitude, black and
white, 1:90:000 scale imagery (Nelson et al.
1981). The print scale for the stereo photos for
WSTMP was 1:12,000. It seems clear that the
Anderson and Craig (1984) estimate of wetland
area is low.
The Minnesota Board of Water and Soil
Resources tabulated a total wetland area of 10.6
million acres using the NWI (BWSR 2001), an
estimate of wetland area essentially equal to the
WSTMP estimate of 10.62 million acres. This
result may suggest that there has been no net
change in wetland acreage since the NWI, a
conclusion which might appear to conflict with
studies suggesting that wetlands have been lost
(Genet and Olson 2008; Oslund et al. 2009).
However, there are a couple of facts that might
reconcile this apparent discrepancy.
First, while Minnesota law requires
compensatory replacement for wetland loss, it
does not generally require this replacement to
occur locally. A wetland loss in one location
may have been replaced elsewhere within the
state. Earlier studies suggesting wetland losses
may be occurring were generally limited in
geographic scope. Thus, while there may be
instances of localized wetland loss, it is possible
that on a statewide basis that these losses have
been offset.
Second, differences in source data and mapping
methods between the NWI and WSTMP has
resulted in identification of some wetlands that
were missed by the NWI, potentially offsetting
any losses. The NWI program produced
1:24,000 scale wetland maps for Minnesota
using aerial photography from the National
High Altitude Imagery Program (NHAP)
collected between about 1976 to 1984 (mostly
spring imagery). NHAP acquired black-and-
white film imagery at an approximate scale of
1:80,000 for a portion of northeast Minnesota
and color-infrared film at an approximate scale
of 1:58,000 for the rest of the state (MnGeo
2007). The NWI program had a tendency to err
on the side of omission of wetlands, especially
in areas that only had 1:80,000 scale black and
white imagery, missing many forested and drier-
end emergent wetlands. A pilot study conducted
to update the NWI for a forested region of
Minnesota near Duluth using 1:15,840 scale
film imagery and 1-meter resolution, summer
digital imagery found nearly four times as many
wetlands than the original NWI (Gernes and
Norris 2006). Further comparison of wetland
estimates for the northeast region is presented
later in this report.
A more recent estimate of wetland area for
Minnesota was published as part of the National
Resources Inventory (NRI) conducted by the
U.S. Department of Agriculture. The NRI
15
estimates that Minnesota has about 10.88
million acres of wetland on non-federal lands
with a margin of error of 0.456 million acres
(USDA 2009). If deepwater habitat is included,
the NRI estimate is 13.94 million acres with a
margin of error of 0.461 million acres. The
NRCS uses a sampling approach and an
assessment method that involves aerial
photography, field office records, soil survey
maps, and other ancillary data. This program
includes approximately 70,000 primary
sampling units with a nominal size of ¼ square
mile spread across the 48 coterminous states.
Imagery for this program has varied; however,
the most recent specifications are for film
imagery collected at 1:7,920-scale with a digital
imagery ground sample distance of 6-inches
(USDA 2010).
The NRI wetland estimate for Minnesota cannot
be directly compared to the WSTMP estimate
because the NRI does not count wetlands on
federal lands. However, we can extrapolate from
the NRI estimate. The NRI states that there are
3.34 million acres of federal land in Minnesota
(USDA 2009), most of which is located in
wetland rich northeastern Minnesota.
Conservatively assuming an average wetland
land cover of 30% and deepwater land cover of
10% for these lands, the statewide totals would
be 11.88 million acres of wetland and 15.28
million acres of total wetland and deepwater
habitat in Minnesota. Using this assumption, it
would appear that the 2007 NRI estimate for
wetlands in Minnesota is higher than the
estimate from the WSTMP by roughly 1.3
million acres. Even considering the margin of
error for both programs, the upper 95%
confidence limit for WSTMP is 10.98 million
acres of wetland is less than the lower 95%
confidence limit for the NRI of 11.43 million
acres (based on the extrapolation described
above).
There are a number of possible reasons for the
difference in the statewide wetland estimates
between the WSTMP and the NRI. Probably the
most important reason is the difference in
sampling design. Both programs use an inter-
penetrating, rotational panel design, with
subsets of segments (or PSUs) assigned to
different rotating panels and a smaller subset
that is sampled every year. However, the
WSTMP program uses a spatially-balanced,
random sample selection method, whereas the
NRI documentation indicates that selection is
based on geographical and historical factors. For
example land enrolled in the USDA
Conservation Reserve Program (CRP) has a
significantly higher chance of selection than
forested land (USDA 2009). Therefore, the NRI
is not an unbiased sample. Other reasons for the
differences in the results from these two
programs could also include differences in
source imagery and methodology as well as
potential errors in extrapolating the NRI results
from non-federal lands to a statewide estimate.
Wetland Type Distribution
While there is agreement on the total wetland
area between the WSTMP and the NWI, there
are differences in the distribution among
wetland types. Reasons for these differences
include both methodology and natural
influences.
The WSTMP program uses summer as well as
spring imagery to classify wetland types,
whereas multi-season imagery was probably not
available for the NWI. The lack of multi-
seasonal imagery for the NWI would likely lead
to erroneously classifying many aquatic bed
wetlands as unconsolidated bottom wetlands
because non-persistent aquatic vegetation (e.g.
Nymphaea odorata or Potamogeton sp.) would
not likely be developed enough in spring
imagery to be visible. This may explain the
general tendency for higher frequency of
occurrence of aquatic bed wetlands and lower
frequency of occurrence of unconsolidated
bottom wetlands in the WSTMP.
Differences in classification rules may also lead
to the observed differences in the wetland types
16
between the NWI and the WSTMP. For
example, the NWI only mapped about 60
farmed wetlands for the entire state of
Minnesota, even though the official policy
appears to have been to map farmed prairie
pothole wetlands (Dahl et al. 2009). It seems
likely that there was a systematic bias against
mapping farmed wetlands for the NWI in
Minnesota. It should be noted that the cultivated
wetland class is one of the most difficult
wetland types to accurately interpret due to a
typically ephemeral inundation period for these
wetlands combined with varying degrees of
human disturbance. The accuracy assessment
for the WSTMP data indicated that there is a
commission error rate for cultivated wetlands of
36%. It should come as little surprise that there
might be significant differences in the
distribution across wetland types, especially for
some of the easily confused wetland types.
Wetland class may also change due to
ecological succession or changes in climate. For
example, a scrub-shrub wetland may develop
into a forested wetland over time. These
changes can be affected by disturbances in the
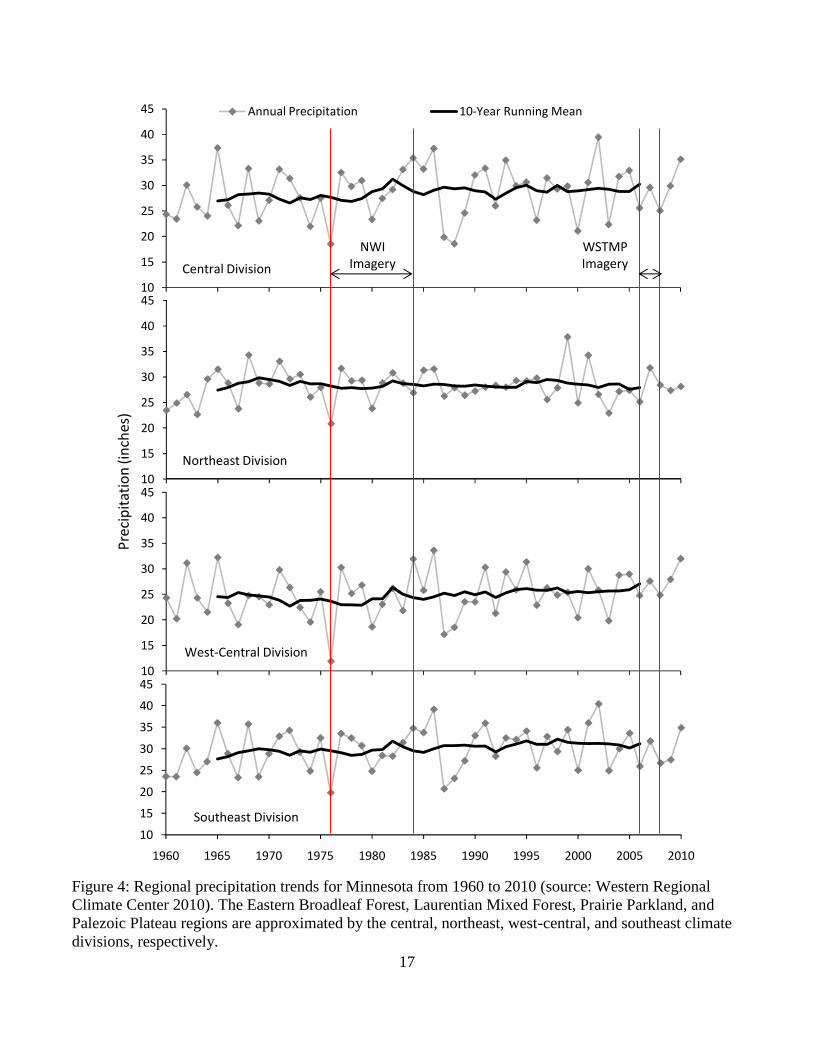
water regime. While precipitation during the
2006-2008 baseline assessment for the WSTMP
is fairly comparable to that during the NWI
imagery acquisition (approximately 1976 to
1984), the 10-year rolling average precipitation
for the period preceding the WSTMP (1996-
2005) is about 1.5 to 1.9 inches/year higher
than the rolling average preceding the NWI
(1966-1975) for most of Minnesota with the
exception of the northeast, which actually
showed a slight decrease in long-term average
precipitation (Figure 4) (Western Regional
Climate Center 2010). Differences in
precipitation are likely to lead to difference in
wetland water regime and thus potentially affect
wetland type, but how much of an effect this has
is unknown.
Minnesota is located on the boundary between
the semi-humid climate of the eastern U.S.,
where annual precipitation exceeds
evapotranspiration, and the semi-arid climate to
the west, where evapotranspiration exceeds
precipitation. In Minnesota, the boundary
between these climate regimes cuts the State
roughly into east-west halves (DNR 2010).
Wetlands in glacial landscapes, like Minnesota,
may be highly sensitive to changes in
temperature and precipitation, especially if they
are relatively isolated from groundwater
systems (Winter 2000). A shift in long-term
precipitation patterns of even an inch or two
might have an effect on the frequency and
distribution of wetland occurrence. Wetlands
that were on the drier end of the water regime
may shift to wetland types with longer periods
of inundation (Neimuth et al. 2010). Lands that
were once dry enough to cultivate, might
experience more frequent flooding causing
farmers to forgo planting in these areas,
potentially increasing wetland area.
Geographic Distribution
The fact that WSTMP had a slightly higher
wetland area than the NWI in the Prairie
Parkland and Paleozoic Plateau regions may
seem to contradict earlier studies (Genet and
Olson 2008; Oslund et al. 2009); however, the
potential reasons for this apparent very slight
gain are similar to those previously discussed in
this paper with respect to the statewide wetland
estimate. Briefly, the reasons include the
possibility that wetlands lost within parts of
these regions are replaced elsewhere within the
region and that the WSTMP may have lower
errors of omission than the NWI (or it may have
higher errors of commission). Furthermore, as
mentioned above, it may be that a trend of
increasing precipitation for these regions
(Figure 4) may have an offsetting effect.
However, it should be kept in mind that while
the differences between the WSTMP and the
NWI were found to be statistically significant
for the Prairie Parkland and Paleozoic Plateau
regions, the actual magnitude of these
differences were very small (< 0.5%).
17
10
15
20
25
30
35
40
45
1960 1965 1970 1975 1980 1985 1990 1995 2000 2005 2010
10
15
20
25
30
35
40
45
10
15
20
25
30
35
40
45
10
15
20
25
30
35
40
45
Annual Precipitation 10-Year Running Mean
NWIImagery
WSTMPImagery
Pre
cip
itat
ion
(in
ches
)
Central Division
Northeast Division
West-Central Division
Southeast Division
Figure 4: Regional precipitation trends for Minnesota from 1960 to 2010 (source: Western Regional
Climate Center 2010). The Eastern Broadleaf Forest, Laurentian Mixed Forest, Prairie Parkland, and
Palezoic Plateau regions are approximated by the central, northeast, west-central, and southeast climate
divisions, respectively.
18
Perhaps somewhat more perplexing is the fact
that the WSTMP mapped a slightly lower
amount of wetland for the Laurentian Mixed
Forest region than the NWI. The metadata for
the NWI suggest that the NWI under-represents
forested wetlands especially in northeastern
Minnesota where the base imagery was
1:80,000 scale black and white aerial photos
(MnGeo 2007). However, forested wetlands,
which comprise the dominant wetland form in
this region, were not statistically different
between the WSTMP and the NWI. The greatest
difference between the two datasets was for
scrub-shrub wetlands (Figure 3b) with the
WSTMP showing generally less scrub-shrub
wetland.
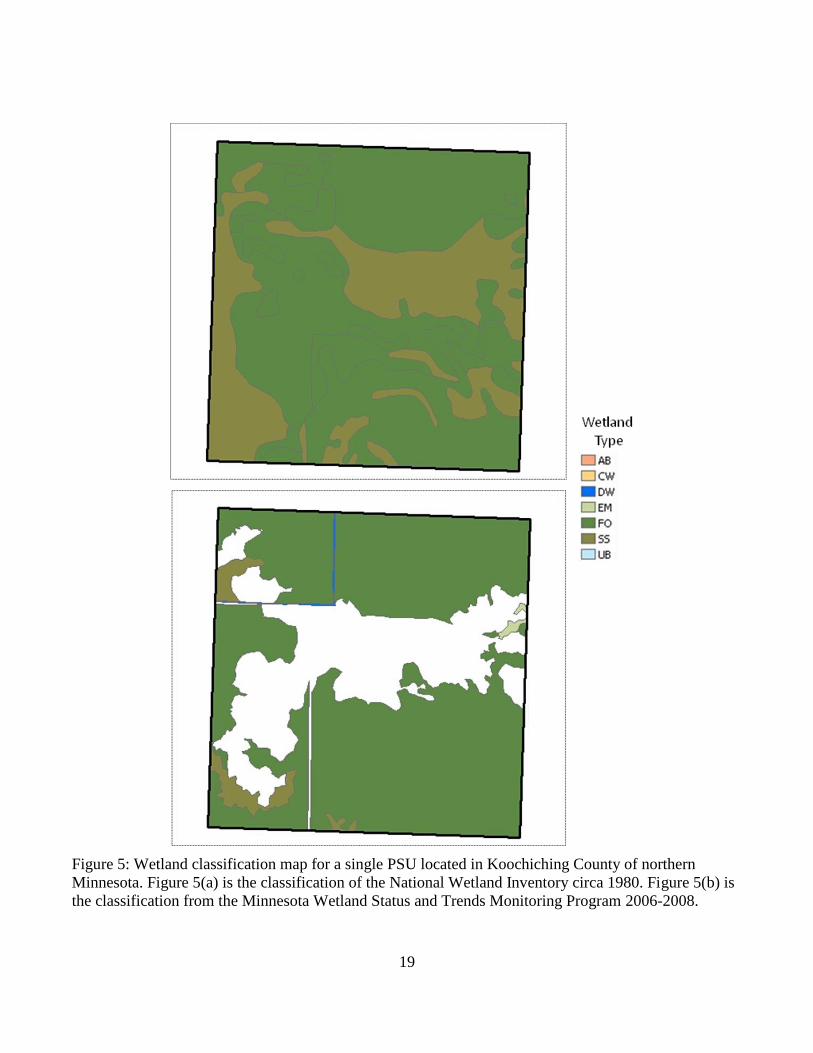
For the purpose of illustration, we examined the
differences between the NWI and the WSTMP
for a single PSU in northern Minnesota
(Koochiching County). The total wetland area
for this PSU is 453 acres according to the
WSTMP and 640 acres according to the NWI
(Figure 5a & 5b).
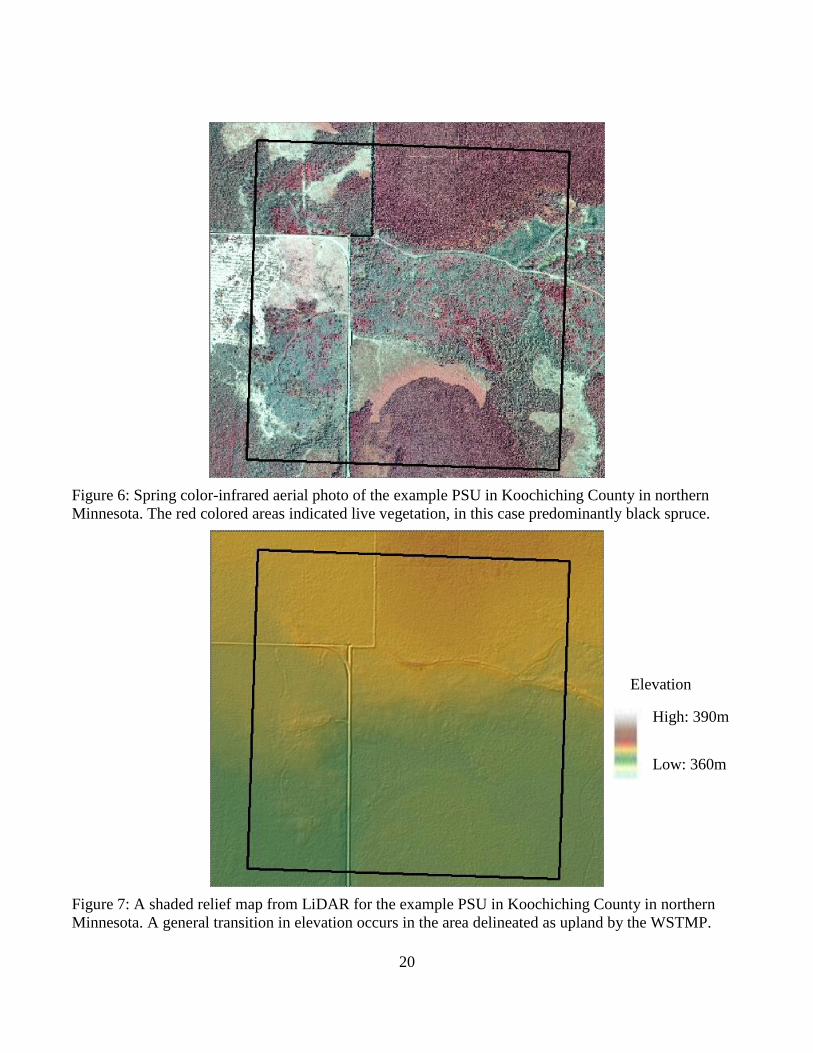
An examination of recent high-resolution CIR
imagery along with ancillary data supports
wetland interpretation of the WSTMP for this
PSU. The CIR imagery shows a distinct
signature that corresponds with the upland area
identified in the WSTMP data (Figure 6). This
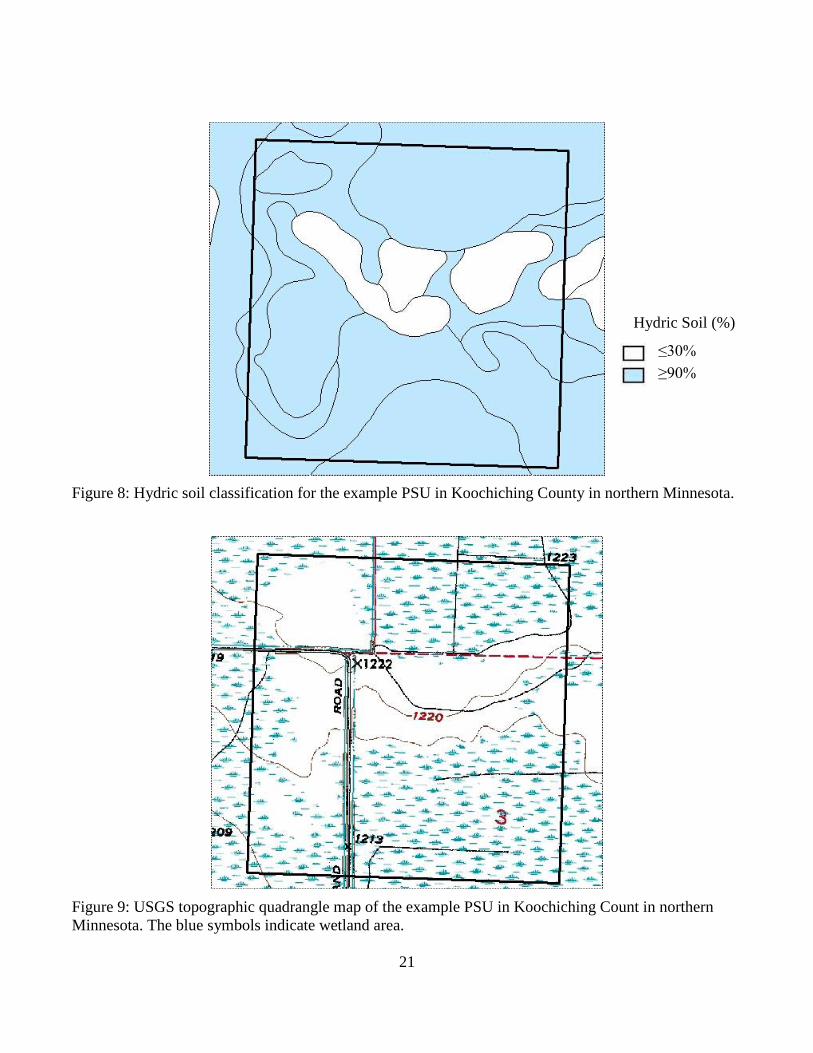
area in the WSTMP data also corresponds with
a slope that divides flatter areas shown on the
LiDAR shaded relief map and with soil map
units that have little or no inclusions of hydric
soil (Figures 7 & 8).
The shape of the upland area in the WSTMP
data also corresponds well with the upland area
on the USGS topographic quadrangle (Figure
9). As such, we believe that the WSTMP
interpretation of this plot is better than the NWI
and that some of what the NWI had classified as
forested and scrub-shrub wetland is, in fact,
upland. Further investigation into these
differences for other PSUs is warranted.
19
Figure 5: Wetland classification map for a single PSU located in Koochiching County of northern
Minnesota. Figure 5(a) is the classification of the National Wetland Inventory circa 1980. Figure 5(b) is
the classification from the Minnesota Wetland Status and Trends Monitoring Program 2006-2008.
20
Figure 6: Spring color-infrared aerial photo of the example PSU in Koochiching County in northern
Minnesota. The red colored areas indicated live vegetation, in this case predominantly black spruce.
Figure 7: A shaded relief map from LiDAR for the example PSU in Koochiching County in northern
Minnesota. A general transition in elevation occurs in the area delineated as upland by the WSTMP.
Elevation
High: 390m
Low: 360m
21
Figure 8: Hydric soil classification for the example PSU in Koochiching County in northern Minnesota.
Figure 9: USGS topographic quadrangle map of the example PSU in Koochiching Count in northern
Minnesota. The blue symbols indicate wetland area.
Hydric Soil (%)
≤30%
≥90%
22
Summary & Conclusions
The Wetland Status and Trends Monitoring
Program data from 2006 to 2008 provides the
most comprehensive and up-to-date assessment
of the current status of wetlands in Minnesota.
Based on these data the current total wetland
area for Minnesota is 10.62 (±0.363) million
acres. If deepwater habitats are included, the
total area is 13.24 (±0.410) million acres. Field
validation efforts indicate that the WSTMP data
correctly distinguish between wetland and
upland 94% of the time and correctly classify
wetland and upland cover types 89% of the
time. Analysis of the 250 annual PSUs generally
shows little change in wetland area from year-
to-year, although there was a single instance of
a relatively large wetland gain (15.9 acres) for a
single PSU resulting from a wetland mitigation
project.
Wetlands are not evenly distributed across the
state. The Prairie Parkland and Paleozoic
Plateau regions have wetland and deepwater
land cover over 6.90% and 5.35% of their total
area, respectively.
Wetlands and deepwater habitats cover 19.9%
and 41.3% of the Eastern Broadleaf Forest and
Laurentian Mixed Forest regions, respectively.
Remarkably, the statewide estimate of wetland
area based on WSTMP (2006-2008) is the same
as that from the National Wetland Inventory for
Minnesota (1976-1984). However, there are
differences in the geographic distribution as
well as differences in the distribution of wetland
types. These differences are likely a result of
differences in source data, methodology,
mapping policies, climate, and ecological
succession. Therefore, caution should be used in
attempting to draw conclusions about wetland
change between these two surveys. The
difficulties in comparing these wetland
estimates illustrates the need for an ongoing
status and trends monitoring program that is
based on consistent source data, methods and
classification rules.
23
References
Anderson, J.P. and W.J. Craig. 1984. Growing
Energy Crops on Minnesota’s Wetlands: The
Land Use Perspective. University of Minnesota,
Minneapolis, MN. 95 pp.
Bailey, R.G. 1995 Description of the Ecoregions
of the United States. U.S. Dept. of Agriculture.
Miscellaneous Publication No. 1391. 2nd
Edition. USDA, Washington, D.C.
BWSR. 2001. 1999/2000 Minnesota Wetland
Report. Minnesota Board of Water and Soil
Resources. St. Paul, MN. 84 pp.
Congalton, R.G. and K. Green. 1999. Assessing
the accuracy of remotely sensed data: principles
and practices. CRC/Lewis Press, Boca Raton,
FL. 137 pp.
Kloiber, S.M., M.C. Gernes, D.J. Norris, S.
Flackey, and G. Carlson. 2010. Technical
Procedures for the Minnesota Wetland Status
and Trends Monitoring Program: Wetland
Quantity Assessment. Minnesota Department of
Natural Resources, Ecological Resources
Division, St. Paul, MN. 41 pp.
Dahl, T.E. and M.T. Bergeson. 2009. Technical
Procedures for Conducting Status and Trends of
the Nation’s Wetlands. U.S. Fish and Wildlife
Service, Division of Habitat and Resource
Conservation, Washington, D.C. 75 pp.
Dahl, T.E., J. Dick, J. Swords and B.O. Wilen.
2009. Data Collection Requirements and
Procedures for Mapping Wetland, Deepwater
and Related Habitats of the United States.
Division of Habitat and Resource Conservation,
National Standards and Support Team,
Madison, WI. 85 p.
DNR. 2010. Climate impact on water
availability. DNR website.
http://www.dnr.state.mn.us/climate/water_availa
bility.html as accessed on December 8, 2010.
Genet, J.A. and A.R. Olson. 2008. Assessing
depressional wetland quantity and quality using
a probabilistic sampling design in the Redwood
River Watershed, Minnesota, USA. Wetlands.
28:2:324-335.
Gernes, M. and D.J. Norris. 2006. A
Comprehensive Wetland Assessment,
Monitoring, and Mapping Strategy for
Minnesota. Minnesota Pollution Control
Agency and Minnesota Department of Natural
Resources, St. Paul, MN. 54 pp.
MnGeo. 2007. Metadata for the National
Wetlands Inventory (NWI), Minnesota. As
accessed at
http://www.mngeo.state.mn.us/chouse/metadata/
nwi.html on September 2, 2010.
Neimuth, N.D., B. Wangler, R.E. Reynolds.
2010. Spatial and temporal variation in wet area
of wetlands in the Prairie Pothole Region of
North Dakota and South Dakota. Wetlands.
30:1053-1064.
Nelson, C.A., D.E. Meisner, and B. Smekofski.
1981. Techniques to update a land management
information system with Landsat. Proceedings
of the Seventh International Symposium of
Machine Processing of Remotely Sensed Data.
Purdue University, Laboratory Applications of
Remote Sensing. West Lafayette, Indiana. 505-
516.
Oslund, F.T., R.R. Johnson, and D.R. Hertel.
2009. Asessing wetland changes in the Prairie
Pothole Region of Minnesota from 1980 to
2007. Journal of Fish and Wildlife Management.
In Press. 14 pp.
Stevens, D.L. and A.R. Olsen. 2004. Spatially
balanced sampling of natural resources. Journal
of the American Statistical Assoc. 99:465:262-
278.
USDA. 2009. Summary Report: 2007 National
Resources Inventory, Natural Resources
Conservation Service, Washington, DC, and
Center for Survey Statistics and Methodology,
Iowa State University, Ames, Iowa. 123 pp.
24
USDA. 2010. Request for Proposal. Solicitation
Number USDA-NRCS-2-10. Aerial
Photography Field Office, Salt Lake City, Utah.
As accessed at
http://www.apfo.usda.gov/Internet/FSA_File/us
da_nrcs_210_mod1.pdf on August 19, 2010. 72
pp.
Western Regional Climate Center. 2010. U.S.A.
Divisional Climate Data: Time Series Plot #1.
As accessed at
http://www.wrcc.dri.edu/spi/divplot1map.html
on November 29, 2010.
Winter, T.C. 2000. The vulnerability of
wetlands to climate change: a hydrologic
landscape perspective. Journal of the American
Water Resources Association. 36:2:305-311.
25
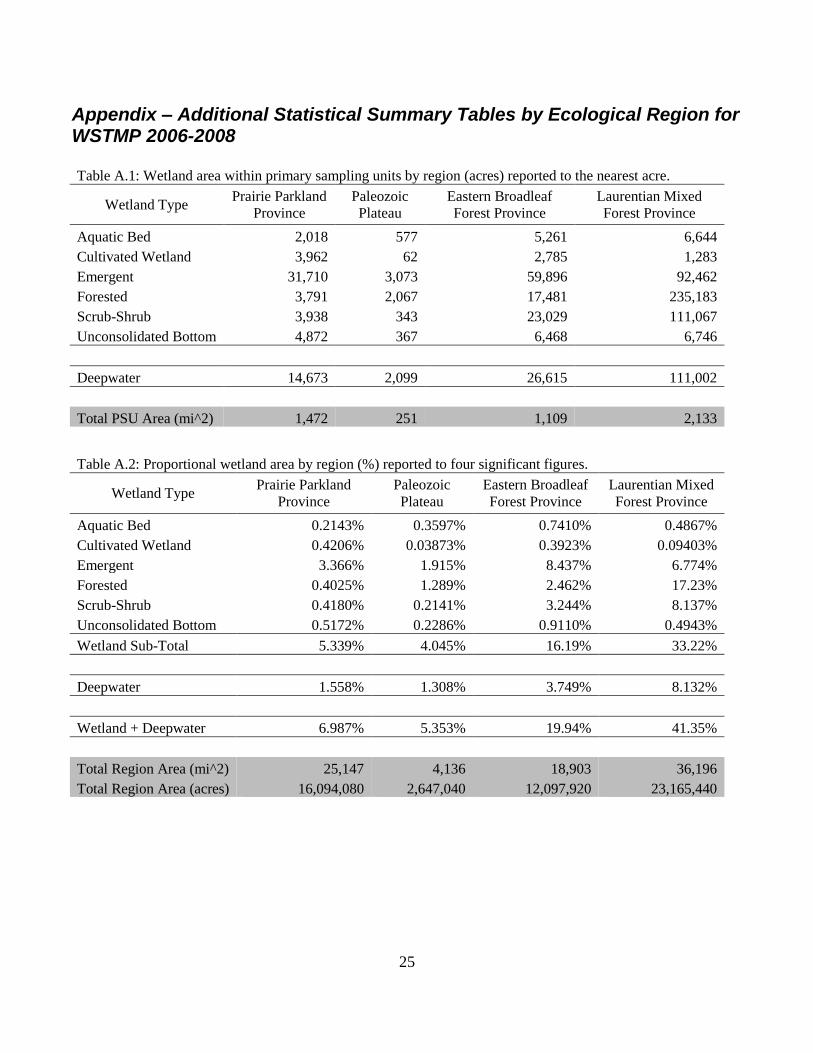
Appendix – Additional Statistical Summary Tables by Ecological Region for WSTMP 2006-2008
Table A.1: Wetland area within primary sampling units by region (acres) reported to the nearest acre.
Wetland Type Prairie Parkland
Province
Paleozoic
Plateau
Eastern Broadleaf
Forest Province
Laurentian Mixed
Forest Province
Aquatic Bed 2,018 577 5,261 6,644
Cultivated Wetland 3,962 62 2,785 1,283
Emergent 31,710 3,073 59,896 92,462
Forested 3,791 2,067 17,481 235,183
Scrub-Shrub 3,938 343 23,029 111,067
Unconsolidated Bottom 4,872 367 6,468 6,746
Deepwater 14,673 2,099 26,615 111,002
Total PSU Area (mi^2) 1,472 251 1,109 2,133
Table A.2: Proportional wetland area by region (%) reported to four significant figures.
Wetland Type Prairie Parkland
Province
Paleozoic
Plateau
Eastern Broadleaf
Forest Province
Laurentian Mixed
Forest Province
Aquatic Bed 0.2143% 0.3597% 0.7410% 0.4867%
Cultivated Wetland 0.4206% 0.03873% 0.3923% 0.09403%
Emergent 3.366% 1.915% 8.437% 6.774%
Forested 0.4025% 1.289% 2.462% 17.23%
Scrub-Shrub 0.4180% 0.2141% 3.244% 8.137%
Unconsolidated Bottom 0.5172% 0.2286% 0.9110% 0.4943%
Wetland Sub-Total 5.339% 4.045% 16.19% 33.22%
Deepwater 1.558% 1.308% 3.749% 8.132%
Wetland + Deepwater 6.987% 5.353% 19.94% 41.35%
Total Region Area (mi^2) 25,147 4,136 18,903 36,196
Total Region Area (acres) 16,094,080 2,647,040 12,097,920 23,165,440
26
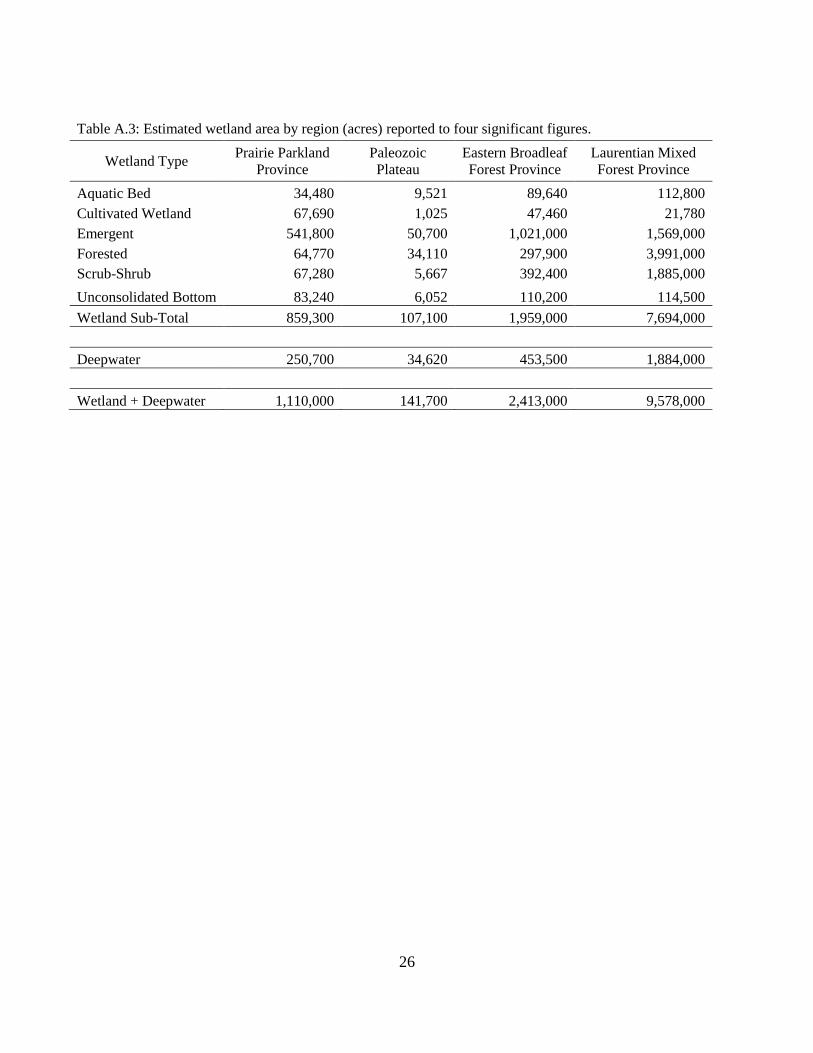
Table A.3: Estimated wetland area by region (acres) reported to four significant figures.
Wetland Type Prairie Parkland
Province
Paleozoic
Plateau
Eastern Broadleaf
Forest Province
Laurentian Mixed
Forest Province
Aquatic Bed 34,480 9,521 89,640 112,800
Cultivated Wetland 67,690 1,025 47,460 21,780
Emergent 541,800 50,700 1,021,000 1,569,000
Forested 64,770 34,110 297,900 3,991,000
Scrub-Shrub 67,280 5,667 392,400 1,885,000
Unconsolidated Bottom 83,240 6,052 110,200 114,500
Wetland Sub-Total 859,300 107,100 1,959,000 7,694,000
Deepwater 250,700 34,620 453,500 1,884,000
Wetland + Deepwater 1,110,000 141,700 2,413,000 9,578,000