status of e-waste generation/ management in goagoaspcb.gov.in/media/default/uploads/6)...
TRANSCRIPT

REPORT
ON
STATUS OF E-WASTE GENERATION/ MANAGEMENT
IN GOA
Submitted to
GOA STATE POLLUTION CONTROL BOARD
PANAJI - GOA
Prepared By
M/S. UPL ENVIRONMENTAL ENGINEERS LTD. Nr. Banco Products, Bill V illage, Padra Road,
VADODARA – 391 410
September 2011

INDEX
Sr. No. CHAPTER PAGE No.
EXECUTIVE SUMMARY 1-2
1 INTRODUCTION 3-16
1.1 Definition & history of e-waste 3
1.2 International scenario 5
1.3 Basel convention 6
1.4 Indian scenario & current status 6
1.4.1 Rules & regulations for e-waste management 8
1.4.2 Composition of e-waste (hazardous substances in e-waste) 9-12
1.5 Handling of e-waste 13-16
2 STUDY FORMULATION, METHODOLOGY AND AREA 17-28
2.1 Study conceptualization 17
2.2 Methodology and approach 17-18
2.2.1 Methodology for carrying out the work 19-20
2.2.2 Description 21
2.3 V isits and survey 21-23
2.3.1 Information from key stakeholders 23-24
2.3.2 Questionnaire & data collection 24
2.4 About Goa, population, size & distribution 24-25
2.5 Major sources of e-waste generation 26-28
3 E-WASTE QUANTIFICATION 29-37
i

3.1 Chart wise data distribution 30-34
3.2 Quantification & evaluation 34-35
3.2.1 Estimated quantity of electronic items other than PC's 35-36
3.2.2 Overall e-waste generation 36-37
4 MANAGEMENT OF E-WASTE 38-41
4.1 Responsibility of various regulatory authorities 39
4.2 Responsibility and role of industries 39-40
4.3 Responsibility of the citizen 40-41
5 DISCUSSION & RECOMMENDATION 42-44
6 ANNEXURES 45-58
7 REFERENCES 59
ii

EXECUTIVE SUMMARY
The electronic waste (e-waste) is one of the fastest growing waste streams in the world. The
increasing “market penetration” in developing countries, “replacement market” in
developed countries and “high obsolescence rate” make e-waste as one of the fastest
growing waste streams. Environmental issues and trade associated with e-waste at local,
trans-boundary and international level has driven many countries to introduce interventions.
There is a need to facilitate the recovery and/or reuse of useful materials from waste
generated from a process and/or from the use of any material thereby, reducing the wastes
destined for final disposal and to ensure the environmentally sound management of all
materials.
It is much more expensive in the developed countries to recycle or dispose off electronic
waste, as there are many more environmental safeguards that have to be addressed while
handling hazardous waste. India has emerged as one of the most significant global hot spots
for electronic waste. Economic extremities and rampant urban poverty have made the
processing of old and discarded electronic products. The growth of e-waste has significant
economic and social impacts. The increase of electrical and electronic products,
consumption rates and higher obsolescence rate leads to higher generation of e-waste. The
increasing obsolescence rate of electronic products also adds to the huge import of used
electronic products. The e-waste inventory based on this obsolescence rate in India for the
year 2005 has been estimated to be 1,46,189 tonnes which is expected to exceed 8,00,000
tonnes by 2012.
In India, e-waste has already been covered for recycling/reprocessing under the Hazardous
Wastes (Management, Handling and Transboundary Movement) Rules, 2008. E-wastes
covered in these Rules are components of waste electrical and electronic assembles
comprising accumulators and other batteries included on list A, mercury-switches, activated
glass cullets from cathode-ray tubes and other activated glass and PCB-capacitors, or any
other component contaminated with schedule 2 constituents (e.g. cadmium, mercury, lead,
polychlorinated biphenyl) to an extent that they exhibit hazard characteristics indicated in
part C of this schedule. Separate Rules have recently been notified under Environment
(Protection) Act, 1986, called E-waste (Management & Handling) Rules, 2011, which shall
UPL Environmental Engineers Ltd. 1 E-waste Generation / Management in Goa
come into effect from 1st
May, 2012. The Central Pollution Control Board has also brought
out guidelines for Environmentally Sound Management of E-waste on March, 2008.
This study is an effort to know the quantity of e-waste generated / management in Goa. As
the quantity of e-waste generated in Goa is considerably very less compared to Metro cities,
still needed to be evaluated, verified and re-emphasized for raising an alarm over the sheer
magnitude of the problem. Some of the things that boost the economy of Goa are
agriculture, business and commerce, electronic and IT industry, fisheries, mining and
tourism. The 2001 census of India, however, holds it at 1.4 million. Goa enjoys a literacy rate
of 76 % as against the all India literacy rate of 52.2%.
UPL Environmental Engineers Ltd. 2 E-waste Generation / Management in Goa

1.1 DEFINITION AND HISTORY OF E-WASTE
1.1.1 Definition by European Union
CHAPTER 1
INTRODUCTION
"Electronic waste" may be defined as all secondary computers, entertainment electronic
devices, mobile phones, and other items such as TVs and refrigerators, whether sold,
donated, or discarded by their original owners. This definition includes used electronics
which are destined for reuse, resale, salvage, recycling, or disposal. Others define the
reusable (working and repairable electronics) and secondary scrap (copper, steel, plastic,
etc.) to be "commodities", and reserve the term "waste" for residue or material which was
represented as working or repairable but which is dumped or disposed or discarded by the
buyer rather than recycled, including residue from reuse and recycling operations. Because
loads of surplus electronics are frequently commingled (good, recyclable, and non
recyclable), several public policy advocates apply the term "e-waste" broadly to all surplus
electronics.
The United States Environmental Protection Agency (EPA) refers to obsolete computers
under the term "hazardous household waste".
Debate continues over the distinction between "commodity" and "waste" electronics
definitions. Some exporters may deliberately leave difficult-to-spot obsolete or non-working
equipment mixed in loads of working equipment (through ignorance, or to avoid more costly
treatment processes). Protectionists may broaden the definition of "waste" electronics. The
high value of the computer recycling subset of electronic waste (working and reusable
laptops, computers, and components like RAM) can help pay the cost of transportation for a
large number of worthless "commodities".
1.1.2 Definition by Basel convention
Waste Electronic and Electrical Equipment (WEEE) was defined in different technique policy,
regulations and management ordinance respectively in China, but the major content was
quite identical. The typical definition was from “Technique Policy for Waste Household
Electric and Electronic Equipment Pollution Prevention” which was issued by State
Environmental Protection Administration (hereinafter “SEPA”) in April 27th, 2006 and the
UPL Environmental Engineers Ltd. 3 E-waste Generation / Management in Goa
definition of WEEE was as following:
Home electric and electronic equipment: home electric equipment and similar appliance,
including TV, refrigerator, air conditioner, washing machine, cleaner, etc., electronic
equipment means information technology and communication equipment, office
equipment, including personal computer, printer, electro graph, duplicating machine
telephone, etc.
Waste home electric and electronic equipment: means discarded home electric and
electronic equipment those lost use value or use value could not satisfy requirement; and
their component, accessory and materials, including:
Waste home electric and electronic equipment by consumers (users).
Disqualification products and their components, accessory and material in the
process of e-products generation.
Waste components, accessory and material in the process of servicing or updating.
Those were regarded as waste home electric and electronic equipment according to
relevant law and regulations.
In many researching reports, books, newspapers, journals and any other literature, “Waste
home electric and electronic equipment” equals to “waste electronic and electric
equipment”, shorted by “e-waste”.
1.1.3 Definition of e-waste in India
‘E-waste’ means waste electrical and electronic equipment, whole or in part or rejects from
their manufacturing and repair process, which are intended to be discarded. E-waste
comprises of wastes generated from used electronic devices and house hold appliances
which are not fit for their original intended use and are destined for recovery, recycling or
disposal. Such wastes encompasses wide range of electrical and electronic devises such as
computers, hand held cellular phones, telephones, printers, copying equipment, facsimile,
including large household appliances such as television sets, washing machines,
refrigerators, air conditioners etc. E-waste contain over 1000 different substances many of
which are toxic and potentially hazardous to environment and human health, if these are not
handled in an environmentally sound manner. (CPCB Guidelines, 2008)
The growth of e-waste has significant economic and social impacts. The increase of electrical
and electronic products, consumption rates and higher obsolescence rate leads to higher
UPL Environmental Engineers Ltd. 4 E-waste Generation / Management in Goa

generation of e-waste. The increasing obsolescence rate of electronic products also adds to
the huge import of used electronic products.
1.1.4 History of e-waste
E-waste is collected from different sources and stored in the scrap yards. From here the e-
waste is packed and transported to other cities. It was observed that the cheapest mode of
transport is rail route.
Why recycling?
Recycling is critical to our efforts to conserve the earth's natural resources. Recycling also
reduces litter and the costs of solid waste disposal. The Acoma Pueblo pot tells an ancient
story of recycling. Pueblo Indian women crafted clay pots that lasted for years of use. When
the pots eventually broke, they were not thrown into a dump. The broken pots were crushed
down to a fine clay powder. The powder was then soaked to soften it to a workable clay
consistency. This recovered clay was used to make strong and beautiful new pots. Today, we
use many materials once, and then consider them waste. Like broken pots, these materials
are actually precious resources. We are all learning that we cannot afford to continue
throwing away resources in our garbage cans. Our task now is to develop again the age-old
art of recycling. Recycling is defined as the collecting, manufacturing, and selling/buying of
new products made from what once was thought of as waste.
1.2 INTERNATIONAL SCENARIO
Strict disposal laws in the developed countries ensure that e-waste does not flow into the
general waste stream. Private companies and authorized agencies carry out e-waste
collection, handling and recycling. Given the high wages, the cost of collection, handling and
disposal makes it expensive operation. Unscrupulous agents take the easy way out by
exporting e-waste to developing countries in the name of trade, charity, etc.
The dumping of e-waste, especially computer waste by the United States of America and
United Kingdom, on India, China and Pakistan has reached to an alarming proportion. The
exporters of e-waste not only charge users in developed countries for so-called disposal, but
also sell this e-waste to traders in developing nations, thus making substantial profit.
According to the US-based Silicon Valley Toxics Coalition's study, it is ten times cheaper to
UPL Environmental Engineers Ltd. 5 E-waste Generation / Management in Goa

export computer scrap than to recycle it within the developed countries.
About 80% of the world's electronic trash is exported to Asia every year. India gets a decent
share of this toxic pie. India has ratified the Basel Convention that strictly regulates the trans
boundary movement of hazardous substances, including e-waste, specially from developed
to developing nations.
Practices followed:
Fifty to eighty percent of e-waste collected is exported for recycling by US, as
export is legal in US.
Export is due to cheaper labor and laxed standard in poor countries.
E-waste recycling and disposal in China, India and Pakistan are highly polluting.
China has banned import of e-waste.
1.3 BASEL CONVENTION
The Basel Convention on the Control of Transboundary Movements of Hazardous Wastes
and their Disposal is the most comprehensive global environmental agreement on hazardous
and other wastes. The Convention has 172 Parties and aims to protect human health and the
environment against the adverse effects resulting from the generation, management,
transboundary movements and disposal of hazardous and other wastes. The Basel
Convention came into force in 1992.
1.4 INDIAN SCENARIO & CURRENT STATUS
General
The world’s second most populous nation is aiming to join the famed league of developed
nations by the year 2020. This target appears to be within an achievable range with India
undergoing a phase of accelerated industrial growth and averaging eight percent of GDP.
Within this version, the Information Technology (IT) sector is being pegged as the main
driver for India's future economic growth.
Material generation
However the twin-processes of increased production and matching demands have led to a
phenomenal increase in the overall waste generation and new varieties of trash is being
added to the waste stream. Currently, in India, this category of waste is being handled by its
UPL Environmental Engineers Ltd. 6 E-waste Generation / Management in Goa

mammoth informal sector without any concern towards its impact on health and
environment.
As per MAIT-GTZ e-Waste Assessment Study 2007, India generated 3,80,000 tonnes of e-
waste, in 2007, which accounts for 1040 tonnes per day.
Though India has a relatively small electronics market in global terms, and is ranked 26th
worldwide, its electronic imports have steadily increased in the recent years- accounting for
41 percent of the market in 2001 compared to 16 percent in 1993.
Technological advancement and new hardware requirements render electronic equipment
obsolete in a very short span of time. These gadgets eventually become a part of the fast-
growing waste stream of e-waste.
After China imposed a ban on the import of e-waste in 2002, India has emerged as one of
the largest dumping grounds for the developed world. Once the electronic equipment,
mostly computers, turns obsolete in the West, they are exported as e-waste into the South
Asian market, mostly to India and Pakistan. A large number of workers, who work in this
recycling industry, extracting useful metals from electronic waste, are putting both their
health and the environment to great risk.
Management
The big computer manufacturers with global presence have been adopting a double
standard recycling policy for developed and developing countries. This is because developing
countries easily twist environmental laws and regulations to suit the trade and economy. For
example, International Business Machines (IBM) and Hewlett Packard (HP) are major
manufacturers of computers, they have different rules for the US and different rules for us.
HP has a recycling sector in the US. HP follows a take-back-policy in the US but it doesn’t
follow any such rule in India.
The Basel Convention was formulated to promote cleaner technology and ban import of
toxic waste, including obsolete computers. India ratified this convention in 1990.
In India, there is a system of registration of recyclers/reprocessors of e-waste, under the
Hazardous Wastes (Management, Handling and Transboundary Movement) Rules, 2008. The
list of recyclers registered with CPCB as on 23rd
September, 2010 is given in Annexure-I(A)
UPL Environmental Engineers Ltd. 7 E-waste Generation / Management in Goa

and total number of recyclers registered state-wise is given in Annexure-I(B). As per the
amendment brought out to the said Rules, the powers have now been delegated to the State
Pollution Control Boards/Pollution Control Committees for registration of recyclers.
India as a developing country needs simpler, low cost technology keeping in view of
maximum resource recovery in environmental friendly methodologies.
The registered recycling units have eco-friendly methodology for reusing, recycling and
recovery of metals, glass & plastics.
The study attempts to arrive at the quantum of e-waste generated in the state of Goa, which
includes PC's and allied computer goods as well as other electrical & electronic items and
the current procedure followed to dispose the same.
1.4.1 RULES & REGULATIONS FOR E-WASTE MANAGEMENT
In India, e-waste has already been covered for recycling/reprocessing under the Hazardous
Wastes (Management, Handling and Transboundary Movement) Rules, 2008. E-wastes
covered in these Rules are components of waste electrical and electronic assembles
comprising accumulators and other batteries included on list A, mercury-switches, activated
glass cullets from cathode-ray tubes and other activated glass and PCB-capacitors, or any
other component contaminated with schedule 2 constituents (e.g. cadmium, mercury, lead,
polychlorinated biphenyl) to an extent that they exhibit hazard characteristics indicated in
part C of this schedule. Separate Rules have recently been notified under Environment
(Protection) Act, 1986, called E-waste (Management & Handling) Rules, 2011, which shall
come into effect from 1st
May, 2012. The Central Pollution Control Board has also brought
out guidelines for Environmentally Sound Management of E-waste on March, 2008.
E-waste Rules not only cover registration of recyclers but requirement of obtaining
authorization by producers of electrical & electronic equipment as listed in schedule-I to
channelize it after use for recycling and disposal as well as by bulk consumers of such
equipment for channelization of e-waste generated by them to authorized collection
centre(s) or registered dismantler(s) or recycler(s) or returning to the producer under the
pickup or take back services. E-waste Rules also cover the requirement of obtaining
authorization by collection centre(s) of e-wastes for storing in secured manner till it is sent to
registered dismantler(s) or recycler(s).
UPL Environmental Engineers Ltd. 8 E-waste Generation / Management in Goa

1.4.2 COMPOSITION OF E-WASTE (HAZARDOUS SUBSTANCES IN E-WASTE)
Composition of E-waste:
Composition of E-waste is very diverse and differs in products across different categories. It
contains more than 1000 different substances, which fall under “hazardous” and “non-
hazardous” categories. Broadly, it consists of ferrous and non-ferrous metals, plastics, glass,
wood & plywood, printed circuit boards, concrete and ceramics, rubber and other items.
Iron and steel constitutes about 50% of the e-waste followed by plastics (21%), non-ferrous
metals (13%) and other constituents. Non-ferrous recyclable metals are copper, aluminum
and precious such as silver, gold, platinum, palladium etc. The presence of elements like
lead, mercury, arsenic, cadmium, selenium and hexavalent chromium and flame retardants
beyond threshold quantities in e-waste classifies them as hazardous waste.
Components of e-waste:
Personal Computer, Monitor and Laptop represent IT and telecom which is a main category
of e-waste. E-waste components are metal, motor / compressor, plastic, insulation, glass,
LCD, electrical wiring, transformer, circuit board, fluorescent lamp, BFR-containing plastic,
batteries and external electric cables. The kinds of components found in PCs, monitors and
laptops are described in the following table.
Computer systems
Components Personal Computer
base
PC monitor Laptop
Metal
� - -
Motor / compressor
� -
�
Plastic
�
�
�
CRT -
� -
LCD -
�
�
Wiring / electrical
� -
�
Transformer
� -
�
Circuit board
�
�
�
Fluorescent lamp - -
�
BFR containing plastic - -
�
Batteries
� -
�
External electric cables
�
�
�
UPL Environmental Engineers Ltd. 9 E-waste Generation / Management in Goa

� Plastic, circuit board, wiring/electrical and external electric cables are present in all
items. BFR containing plastic and fluorescent lamps are present in laptop.
� Metals found in PC base while motor and transformer found in both PC base and
laptop. CRT is found in PC while LCD and batteries are found in PC and laptop.
(Based on CPCB Guidelines, 2008)
� Various categories of E-waste and list of products covered under the categories are as
follow, as per E-waste (Management and Handling) Rules, 2011:
Sr. No Categories of electrical and electronic equipment
i Information Technology and telecommunication equipment:
Centralised data processing:
Mainframes, Microcomputers
Personal computing:
Personal computers (Central Processing Unit with input and output devices)
Laptop computers (Central Processing Unit with input and output devices)
Notebook computers
Notepad computers
Printers including cartridges
Copying equipment
Electrical and electronic typewriters
User terminals and systems
Facsimile
Telex
Telephones
Pay telephones
Cordless telephones
Cellular telephones
Answering systems
ii Consumer electrical and electronics:
Television sets (including sets based on Liquid Crystal Display and Light Emitting
Diode technology), Refrigerators, Washing Machines, Air-conditioners excluding
centralized air conditioning plants
UPL Environmental Engineers Ltd. 10 E-waste Generation / Management in Goa

Possible hazardous substances present in e-waste
The possible substance of concern, which may found in selected e-waste items are given in
table below.
Components Possible hazardous content
Metal
Motor / compressor
Plastic Phthalate plasticize, BFR
CRT Lead, Antimony, Mercury, Phosphorous
LCD Mercury
Wiring / electrical Phthalate plasticize, Lead, BFR
Transformer
Circuit Board Lead, Beryllium, Antimony, BFR
Fluorescent lamp Mercury, Phosphorous, Flame retardants
BFR containing plastic BFRs
Batteries Lead, Lithium, Cadmium, Mercury
External electric cables BFRs, plasticizers
(CPCB Guidelines, 2008)
The substances within the above mentioned components, which cause most concern are the
heavy metals such as lead, mercury, cadmium and chromium(IV), Poly Chlorinated Biphenyls,
plastics and circuit boards that contain brominated flame retardants (BFRs). BFR can give rise
to dioxins and furans during incineration. Others are arsenic, asbestos, nickel and copper.
These may act as catalyst to increase formation of dioxins during incineration. The
description about some of these substances where uncertainty exists regarding their 'level of
concern' based on literature review are given below:
Plastics containing BFRs, LCDs, Components containing plasticizers / stabilizers, Circuit
boards, Flame retardants, Lead, Mercury, Beryllium (Annexure-II)
(i) Plastics containing Brominated Flame Retardants (BFRs)
Two families of BFRs have been used in electrical & electronic equipment. The first is Poly
brominated dipheny1 ethers (PBDPEs), which includes DBPE (decabromodipheny1 oxide),
and PBPE (penta bromo di-phenyl oxide). In the electronics industry, BDPE is the dominant
and PBDPE BFR is used primarily in computer housings. The second family of BFRs is the
phenolic, which includes TBBPA (tetra bromo-bis phenol A). TBBPA (also referred to as TBBA)
UPL Environmental Engineers Ltd. 11 E-waste Generation / Management in Goa

is used primarily in printed circuit boards.
(ii) Liquid Crystal Display (LCDs)
LCD consists of liquid crystals, which are embedded between thin layers of glass and
electrical elements. A cellular phone display can contain about 0.5 mg of liquid crystals, a
notebook display about half a gram. The LCD, first used predominately in notebook and
laptop computers, is now moving into the desktop computer market. Most LCDs have a
lamp. For small LCDs, the main consideration for the dismantler will be whether or not there
is a lamp present. Liquid crystals come under suspicion of being a health hazard. About
50,000 liquid crystal substances are known, but only about 500 are key components for LCD
technology. Examples are MBBA (4-methoxy benzylidene-4-butyl aniline) and 5CB (4-penty1-
4-cyanobipheny1). Currently there appear to be no toxicological tests results on liquid crystal
materials.
(iii) Components containing Plasticizers/Stabilizers
The concerns here include the use of Phthalate plasticizers and lead stabilizers in plastics and
rubbers. For example, di-butyl phthalate and diethylhexy1 phthalate are considered “Toxic
for Reproduction” at concentrations >=0.5%.
(iv) Circuit Boards
While most boards are typically 70% non metallic, they also contain about 16% copper, 4%
solder and 2% nickel along with iron, silver, gold, palladium and tantalum. Approximately
90% of the intrinsic value of most scarp boards is in the gold and palladium content.
Consequently, traditional reprocessing of circuit boards has concentrated on the recovery of
metals values. Some of the components found in circuit boards are described below.
(v) Flame Retardants
The circuit board laminate consists of a glass fiber reinforced epoxy and is likely to contain
flame retardant substances at a level of about 15%. The main flame retardant material used
in circuit boards is tetra bromo bis phenol-A (TBBPA). TBBPA is claimed to have a lower
dioxin generation potential than PBDE (penta bromo di phenyl ether).
(vi) Lead
The typical Pb/Sn solder content in scrap of printed circuit boards ranges between 4-6%,
UPL Environmental Engineers Ltd. 12 E-waste Generation / Management in Goa

consequently lead represents 2-3% of the weight of the original board. The concerns about
lead in circuit appear to relate to the possibility of lead leaching from circuit boards disposed
of in landfills.
(vii) Mercury
It is estimated that 22% of the yearly world consumption of mercury is used in electrical and
electronic equipment (ex. in fluorescent lamps). Its use in electrical & electronic equipment
has declined significantly in recent years. It has been used in thermostats, (position) sensors,
relays and switches (ex. on printed circuit boards and in measuring equipment), batteries
and discharge lamps. Furthermore, it is used in medical equipment, data transmission,
telecommunications, and mobile phones. The estimated concentration level of mercury in
computers is 0.002%.
(viii) Beryllium
Copper beryllium alloys are used in electronic connectors where a capability for repeated
connection and disconnection is desired, and thus where solder is not used to make a
permanent joint. Such connectors are often gold plated, so that copper oxide is not created
on their surfaces, and does not form a non-electrically conductive barrier between the two
connectors. A second use of beryllium in the electronics industry is as beryllium oxide, or
beryllia. Beryllia transmits heat very efficiently, and is used in heat sinks. These sinks project
heat-generating devices by rapidly distributing their heat to a much larger volume and
surface area, where it can be further safely discharged into a moving air stream. Beryllia heat
sinks have been used in specific designed parts, which are attached to a heat source, and
have also been built into specific microelectronic devices as integral parts of the substrates
of those devices. Beryllium oxide (BeO) or beryllia is found in some power transistors,
transistor and valve bases, and some resistors.
1.5 HANDLING OF E-WASTE
There can not be a material in god’s creation which can be called ‘waste’. Every material /
object has certain use in appropriate place. Therefore, placing it in the right place solves the
problem.
This is the technology to be adopted. We see to that there is minimal processing in waste
management so that there is no environmental pollution. Our strength lies in identifying
UPL Environmental Engineers Ltd. 13 E-waste Generation / Management in Goa

who needs the components most and what best is the use for various parts of e-waste. For
example, a cooler fan in CPU may be used as such by the computer service center. If the
same fan is broken it sells for a lesser value as metal and plastic.
Every screw or bolt if segregated properly can be reused at appropriate place.
Following are the steps involved in e-waste handling:
(a) Collection
Scrap dealers informally collect the large quantity of e-waste from different source
points in form of obsolete PC's. There is no proper estimation that how much scrap are
collected from various sources by scrap dealers. The old PC's are also taken back by the
distributors and at time of supply of upgraded or latest model of PC's which is either
passed on to scrap dealers or the working obsolete computers are sold to into market
as second hand PC's.
(b) Storage
Scrap dealers collect the obsolete PC's from different sources and store at their
respective local scrap yards.
(c) Dismantling & Segregation
Scrap dealer after collection and identifying the part or PC's, dismantle and segregate
the different parts of computers and sell them into markets. Dismantling is carried out
to extract plastics, iron and copper. Open burning is carried out by the scrap dealers to
extract important metal such as copper releasing the poisonous gases into the
atmosphere. In Goa no such activity takes place. The whole unit is stored and
transported to other cities for dismantling and recycling.
(d) Recycling/ Recovery
The composition of e-waste consists of diverse items like ferrous and non-ferrous
metals, glass, plastic, electronic components and other items and it is also revealed
that e-waste consists of hazardous elements. Treatment of e-waste is to reduce the
concentration of these hazardous chemicals and elements through recycle and
recovery. In the process of recycling or recovery, certain e-waste fractions act as
secondary raw material for recovery of valuable items. The recycle and recovery
includes the following unit operations.
(i) Dismantling: Removal of parts containing dangerous substances (CFC's,
switches, PCB); removal of easily accessible parts containing valuable
UPL Environmental Engineers Ltd. 14 E-waste Generation / Management in Goa

substances (cable containing copper, steel, iron and precious metals).
(ii) Segregation of ferrous & non-ferrous metals & plastic: This separation is
normally done in a shredder process.
(iii) Refurbishment and reuse: Refurbishment and reuse of e-waste has potential for
those used electrical and electronic equipment which can be easily refurbished
to put to its original use.
(iv) Recycling/ Recovery of Valuable materials: Ferrous metals in electrical are
ferrous, non-ferrous metals in smelting plants, precious metals in separating
works.
(v) Treatment/Disposal of dangerous materials and waste: Shredder light fraction is
disposed of in landfill sites or sometimes incinerated, CFC's are treated
thermally, PCB is incinerated or disposed off in underground storages, Hg is
often recycled or disposed off in underground landfill sites.
Various recycling units registered with Central Pollution Control Board employ
manual or automated operations which are given below.
S.No. Name of the unit Description
01 M/s Attero Recycling Pvt. Ltd.,
Roorkee, Uttrakhand
Manual dismantling, automated
segregation and metal recovery through
electrolytic process.
02 M/s Eco Recycling Pvt. Ltd.
Andheri(East), Mumbai
Automated dismantling and segregation.
No CRT cutting
03 M/s Earth Sense Recycle Pvt.Ltd.
Hyderabad, Andhra Pradesh
Manual dismantling and CRT cutting
04 M/s Earth Sense Recycling Pvt.
Ltd. Gurgaon
Manual dismantling and CRT cutting
05 M/s K. G. Nandini, near Bangalore
Karnataka
Automated dismantling and segregation
06 M/s E-Parisara Pvt.Ltd.,Bangalore
Karnataka
Manual dismantling and CRT cutting
07 M/s Earth Sense Recycling Pvt.
Ltd. Mumbai
Manual dismantling and CRT cutting
08 M/s TIC Ltd, Noida Manual dismantling, CRT cutting and
mechanized CRT crusher
UPL Environmental Engineers Ltd. 15 E-waste Generation / Management in Goa

09 M/s Ash Recyclers, Bangalore
Karnataka
Manual dismantling and re-furbishing
10 M/s Trishiraya Recyclers, Ltd,
Chennai
Manual dismantling, segregation and CRT
cutting
11 M/s Tess Amm Ltd, Chennai Automated dismantling and segregation
12 M/s NewPort Computer Services
(India) Private Limited, Bangalore
Manual dismantling and segregation
(e) Treatment & Disposal
The presence of hazardous elements in e-waste offers the potential of increasing the
intensity of their discharge in environment due to landfilling and incineration. The
potential treatment disposal options based on the composition are given below:
(i) Landfilling: Degradation process in landfills are very complicated and run over a
wide time span. Landfills contain mixtures of various waste streams and
emission of pollutants from landfills can be delayed for many years.
(ii) Incineration: Advantage of incineration of e-waste is the reduction of waste
volume and the utilization of the energy content of combustible materials. By
incineration some environmentally hazardous organic substances are converted
into less hazardous compounds. Disadvantage of incineration are the emission
to air of substances escaping flue gas cleaning and the large amount of residues
from gas cleaning and combustion. Waste incineration plants contribute
significantly to the annual emissions of cadmium and mercury. In addition,
heavy metals not emitted into the atmosphere are transferred to exhaust gas
residues and can re-enter the environment on disposal. Therefore, e-waste
incineration will increase these emissions, if no reduction measures like
removal of heavy metals are taken.
UPL Environmental Engineers Ltd. 16 E-waste Generation / Management in Goa

CHAPTER 2
STUDY FORMULATION METHODOLOGY & AREA
2.1 STUDY CONCEPTUALIZATION
The Study included the following:
1. Literature review
2. Survey and visits to commercial, residential and industrial areas.
3. Collection of Sales and usage data of PC and allied goods
4. Analyzed the computer market sales related to the population growth
5. Percentage rise in PC Sales which is approx 4% annually.
6. Discussions with various stake holders and scrap dealers during field survey
7. As there is no municipal dumping site for e-waste, all the electronic waste is sent to
other cities like Delhi and Mumbai.
8. Sector wise data distribution and calculation of e-waste generation by Market
Supply Method.
9. Quantification of e-waste generation of all sectors (Personal Computer)
10. Quantification of e-waste other than Personal Computers.
11. Overall quantification of e-waste has been done. PC's contribute to around 30% of
the total e-waste. Rest 70 % of the waste is from the other electrical and electronic
goods.
2.2 METHODOLOGY AND APPROACH
(i) Report on E-waste generated in important towns, Industrial units in Goa: This is
achieved by making visits to industrial units/industrial estates, Municipal Solid Waste
disposal sites and local scrap yards and obtaining information from concerned
statutory agencies. Information available with GSPCB as well as Local bodies,
Distributors, Retailers of Computers and other allied electronic goods etc., was
obtained
UEEL collected data from the concerned Industries, departments/ distributors/
retailers, local bodies to form basis of the inventory and the report. A study of
municipal solid waste disposal sites of the Municipal Council / Corporation and local
UPL Environmental Engineers Ltd. 17 E-waste Generation / Management in Goa
scrap yards was resorted to.
Evaluation of generation of e-waste from Industrial and non-industrial and other
sources was also done. The report preparation is as per the guidelines issued by the
CPCB for the collection/recycling and disposal of e-waste.
A comprehensive report has been prepared, as per the format prescribed by CPCB.
(ii) UEEL focused to collect following information either from industries, or from various
government bodies
� Basic information on the materials from manufacturers, processors and
importers and to maintain an inventory of these materials. The information
includes toxicity and potential harmful effects.
� Identification of potentially harmful substances which require the industry to
test them for adverse health and environmental effects.
� Control risks from manufacture, processing, distribution, use and disposal of
electronic wastes.
� Beneficial reuse of "e-waste" and encouraging business activities that use
waste". Setting up of programs to promote recycling among citizens and
businesses.
� Educating the e-waste generators on reuse/recycling options
(iii) Final Report:
The report includes the survey and the inventory carried out as per the first point
mentioned above in TOR. The report is prepared as per the provisions of the
Hazardous Wastes (Management, Handling and Transboundary Movement) Rules,
2008 and E-waste (Management and Handling) Rules, 2011.
UPL Environmental Engineers Ltd. 18 E-waste Generation / Management in Goa

2.2.1 Methodology for carrying out the work:
OBJECTIVES TASKS SOURCE OF DATA
To identify sources
of e-waste
To identify various stake
holders, manufacturers,
dealers, distributors, scrap
dealers
Primary surveys
Secondary information
To identify various
issues regarding e-
waste
To analyze PC sales and E-
waste scrap markets of the
Goa
To assess existing handling
processes in Goa
Discussion with various
stakeholders through field survey
MAIT information
Toxic links information
To develop a
methodology for
quantification of E-
waste
To establish E-waste trade
cycle
To analyze computer market
trend, urban population,
computer dealers etc
Literature review
Stakeholder Discussion
MAIT survey information
Toxic links information
To assess existing
system of
collection, and to
suggest appropriate
option
To review existing handling
practices of collection of E-
waste
To analyze PC sales trend and
PC scrap generation in future
Suggest management options
looking into current and
projected PC trend.
To suggest recycling process
Discussion with scrap dealers
Field survey
MAIT and Toxic links literature
review
Interaction with All Goa scrap
dealers association
UPL Environmental Engineers Ltd. 19 E-waste Generation / Management in Goa
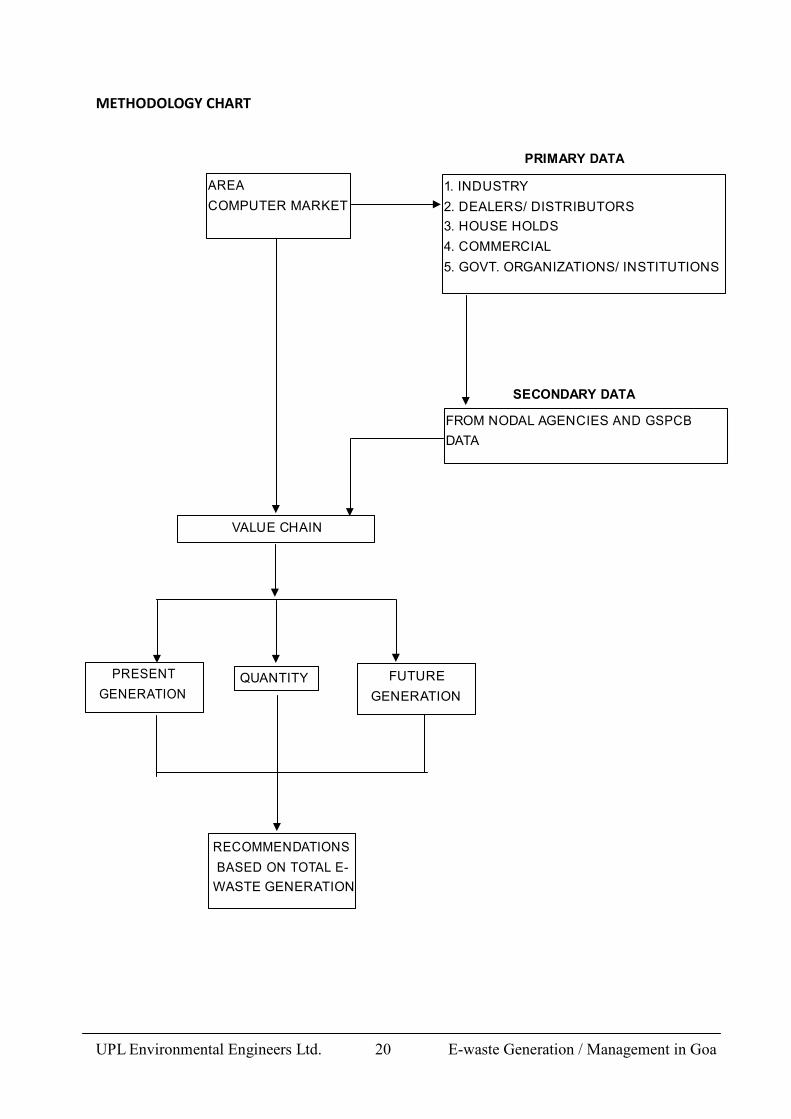
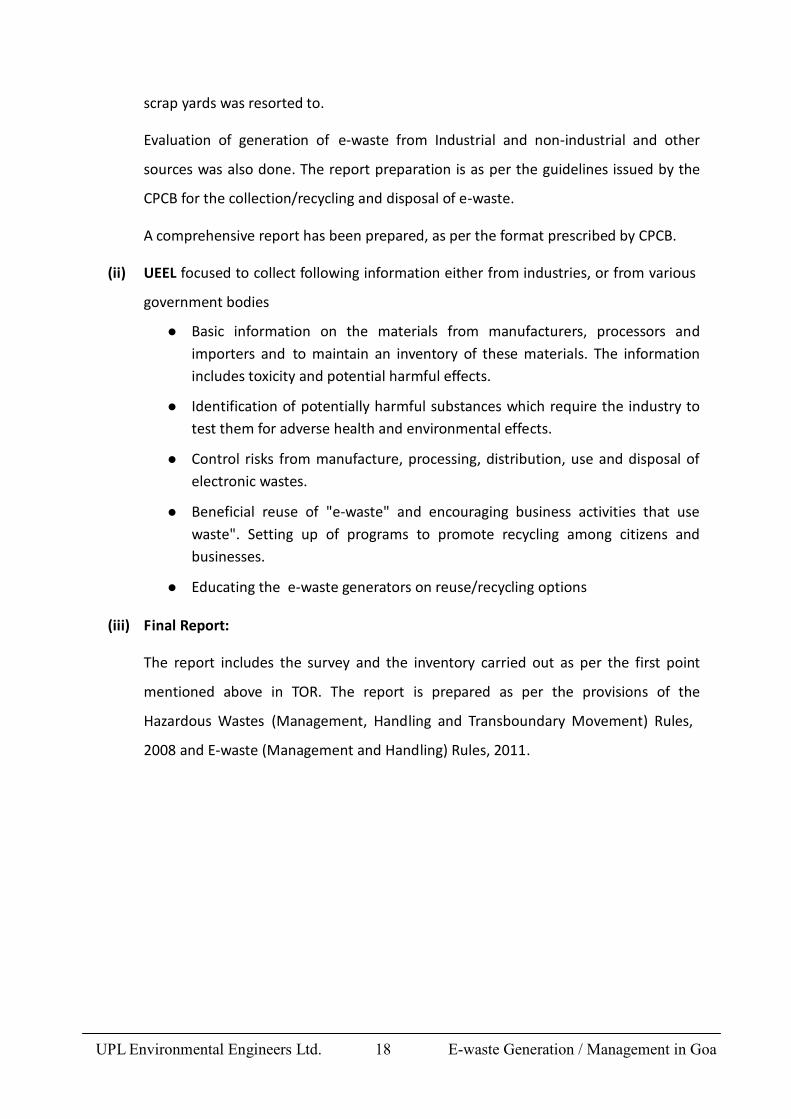
METHODOLOGY CHART
AREA
COMPUTER MARKET
PRIMARY DATA
1. INDUSTRY
2. DEALERS/ DISTRIBUTORS
3. HOUSE HOLDS
4. COMMERCIAL
5. GOVT. ORGANIZATIONS/ INSTITUTIONS
SECONDARY DATA
FROM NODAL AGENCIES AND GSPCB
DATA
VALUE CHAIN
PRESENT
GENERATION
QUANTITY FUTURE
GENERATION
RECOMMENDATIONS
BASED ON TOTAL E-
WASTE GENERATION
UPL Environmental Engineers Ltd. 20 E-waste Generation / Management in Goa

2.2.2 Description
(i) Defining sample area (computer market)
Major users like industries, Govt. offices, Industries, Institutions, house holds
(ii) Sampling (field visits)
Dealers/distributors- total dealers, large and small dealers, percentage of
total dealers visited, sales data collected
Govt. organizations- total no. of govt. organizations, total usage in each dept,
Industries- type of industry, scale of operation, computer usage, life cycle,
House hold- total population, persons per house, total families, distribution
according to the class- low income, middle class, high and effluent,
percentage of house holds in each such category,
(iii) Data collection – from life cycle of electronic product, scrap dealers, sales data,
(iv) Value chain- Market based and from material flow.
(v) Management practices
Status on e-waste in Goa
City wide practices like Delhi, Mumbai, Bangalore, Pune
International practices
2.3 VISITS & SURVEY
A survey around Goa was carried out in Feb-March 2009 to estimate the E-waste generation
in state of Goa. V isit was made in following areas: Government Offices, Government
Organizations, Private and Nationalized banks, Computer Dealers / Distributors, Computer
service centers, Scrap Dealers, Hotels, Schools, Goa University, Goa-IDC, Industrial Estates
and Industries (Large Scale, Medium Scale and Small scale Industries).
Various Govt. Offices were visited for E-waste like Corporation of City of Panaji, Police
Head Quarter, Goa-IDC, Goa Electricity Board and Goa Electronics Ltd (GEL). Government
Organizations like National Institute of Oceanography (NIO), Goa Electronics Ltd. (GEL) and
Goa University were visited. Private and nationalized banks like HDFC Bank, Canara Bank and
UPL Environmental Engineers Ltd. 21 E-waste Generation / Management in Goa

State Bank of India were visited. Various computer dealers and distributors as well as Service
providers were contacted in Panjim, Margao, Vasco and Ponda for details on sale of
computer and e-waste generation. Scrap dealers located in different locations were also
visited regarding the e-waste collection status and quantity they receive every month. Scrap
dealers collecting exclusively e-waste were visited located in Margao and Batlim area. All
Goa Scrap dealers association located at Fatorda, Margao was visited and useful information
was gathered for the same. Major Hotels were also visited like Fidalgo at Panjim. Schools
were also included in study as they are also the major user of computers for education
purpose. During survey and visit, Industries were divided into small scale, medium scale and
large scale industries. Various industrial estates like Verna Industrial Estate, Kundaim
Industrial Estate, Corlim Industrial Estate, Sancoale Industrial Estate, Bethora Industrial
Estate, Madkaim Industrial Estate, Canacona Industrial Estate and Usgao Industrial Estate
were visited too. The observations are tabulated below.
VISITS KEY STAKE HOLDERS OBSERVATION
Government Offices Police Head Quarters
Goa-IDC
Goa Electronics ltd.
Goa Electricity Board
Corporation of City of Panaji
Obsolete PC's discarded to Scrap
dealers as an when they are generated.
Some Govt. offices store the obsolete
PC's and printers as scrap in their
premises.
Banks SBI Bank
Canara Bank
HDFC Bank
Computers sold to the scrap dealers.
Also have the buy back facility with the
PC dealers.
Dealers/ Distributors/
Service Centers
Kreativ Solutions
Orbits Technologies
PC clinik
Kimberly's Computer
Infotech Solution &
Peripherals
Microcity
City Computer Resources
Technoworld
Avon Computers
Some dealers/distributors have fixed
scrap dealers, as an when they receive
the scrap they hand over the E-waste
to them. Some of the Govt. suppliers
get fixed quantity of waste on regular
basis.
IT Industries D-Link
Zenith Computers
While assembling, e-waste parts are
then sent back to the distributors
supplying spares.
Industries
Large, Medium and
Small Scale
Wyeth Ltd.
Syngenta India Ltd
Anmol Industries
Large Scale industries give the PC's to
the employees or discarded. Most of
the Large scale industries send back
UPL Environmental Engineers Ltd. 22 E-waste Generation / Management in Goa

industries) Encube Ethicals Pvt. Ltd (SSI)
BT Composites Ltd (MSI)
Indi Pharma Pvt. Ltd (SSI)
Cromptor Greaves Ltd (LSI)
the obsolete PC's to their head quarter
in Mumbai or directly to the
manufacturers of those PC's. Small and
Medium Scale industries sell the
obsolete PC's to the scrap dealers.
Government
Organizations
National Institute of
Oceanography (NIO)
Goa University
Computers and PC's auctioned from
NIO. HP toners & Cartridges are
collected & sent to the approved e-
waste recycling facility in Bangalore.
Computer Institutes Koenig Solutions (P) Ltd
Manipal Institute of
Computer Education (MICE)
They mostly donate the old PC's to the
village students.
Scrap Dealers Subhash Scrap Dealer,
Mapusa
Mr. Sarfaraz, Batlim
They collect the scrap from around
Goa. Further they sell those obsolete
PC's mostly to Delhi parties in
Selampur area.
Scrap Dealer
Association
All Goa Scrap Dealers
Association
E-waste is generated & collected from
all over Goa yearly by the scrap dealers
in Goa.
Total 300 registered scrap yards all
around Goa.
The supply of raw materials and mineral resources in the world is steadily becoming scanty.
As technology depends on the supply of natural resources and the availability of raw
materials, the lack of it can act as a hindrance to the growth in the technology field. Hence,
the primary need for recycling of the products arises.
2.3.1 Information from key stakeholders
Approached to various stakeholders with checklist or questionnaire suitably designed to
obtain information on e-waste generation/ quantification through value chain, also to
evaluate the quantity of e-waste likely to be disposed in future.
Sr. No. Stake holders Information
1 Generator (Govt. offices / Banks /
Industries / Residential / Institutions)
E-waste quantity calculated based on the
questionnaire
2 Computer Market- Computer Dealers,
Service centers / repair shops
E-waste quantity through value chain and
questionnaire
3 Scrap Dealer- Kabadiwala, Secondary
Dealer
Questionnaire and value chain
4 Recycler/ Reprocessor- Informal, Formal Existing practices not followed
UPL Environmental Engineers Ltd. 23 E-waste Generation / Management in Goa
5 GSPCB / CPCB Assessment conducted on e-waste and formation
of Guidelines document for environmentally
sound management of e-waste.
2.3.2 Questionnaire & data collection
Questions as per Annexure-III were asked and information was collected from Government
Offices, Government Organization, Private and Nationalized banks, Computer Dealers /
Distributors, Computer service centers, Scrap Dealers, Hotels, Schools, Goa University, Goa-
IDC, Industrial Estates and Industries (Large Scale, Medium Scale and Small scale).
2.4 ABOUT GOA, POPULATION, SIZE & DISTRIBUTION
(a) Introduction to Goa
The State of Goa is located in the western coast of India. It is bound by Maharashtra in the
North, Karnataka in the south and east. It is administratively divided into two districts and 11
talukas. In 2001 census, 359 villages including 12 uninhabited villages form the rural areas
and 44 towns (14 statutory and 30 census towns) constitute urban areas.
Though the State has a length of 105 kms from north to south and it spread upto 60 kms in
its width west to east.
(b) Population size and distribution of population
According to 2001 census, population of Goa is 1347668 consisting of 687548 males and
660420 females. The population of the state has increased by 177875 persons over 1169793
registered in 1991. The population of Goa accounts for a small proportion (0.13 per cent) of
the India’s population. The state ranks 26th amongst 35 states and union territories. The
population of the state is evenly distributed among rural (51.2 per cent) and urban areas
(49.8 per cent). Of the two districts, North Goa is more populous accounting for 56.2 per
cent of the population of the state.
Goa is best known as a tourist paradise, both in India and abroad. Lavishly gifted by nature
for its scenic beauty, virgin beaches girdling its 105-km long palm-fringed coast interspersed
with enchanting coves, bays and estuaries, paddy fields, shady coconut, cashew and mango
groves dotted with tiny picturesque villages, temples and churches renowned for worship
and pilgrims, forts and monuments and above all, friendly and hospitable people, Goa
presents an ideal tourism profile.
UPL Environmental Engineers Ltd. 24 E-waste Generation / Management in Goa

Tourism is so prominent that the number of tourists almost equals the number of state
population.
Goa attracts almost 12% of total foreign tourists arriving in India. In terms of direct charters,
it is 75% of the total direct charter traffic in India. To give a big fillip to hospitality industry in
the state, the Department of Tourism has taken multi-pronged strategy involving both
private and government organization.
E-WASTE TRADE CHAIN
UPGRADED FOR
RESALE
EXCHANGED
WITH VENDORS
FOR HIGHER
CONFIGURATION
VENDOR LOBBY
AUCTIONED TO
SCRAP DEALER
After use VENDORS
DONATED TO
INSTITUTIONS
TRANSPORTED
TO OTHER CITIES
FOR RECYCLING
DOMESTIC
INDUSTRIAL /
GOVERNMENT /
PVT.
CONSUMER
E-WASTE TRADE CHAIN IN GOA
UPL Environmental Engineers Ltd. 25 E-waste Generation / Management in Goa

2.5 MAJOR SOURCES OF E-WASTE GENERATION
2.5.1 E-waste from banking and financial institutions
The Banking and Financial services sector is among the largest buyers of IT products, both
software and hardware.
Sr. No Item Period North Goa South Goa Total
1 Number of scheduled
commercial banking offices
excluding co-operative banks
As on
31/03/01
184 127 311
2 Number of co-operative
banking offices
As on
31/03/01
80 51 131
Survey in the Banking sector confirmed that there are substantial quantities of E-waste being
generated. SBI bank in Panjim a fully computerized bank sold some 50 odd obsolete
computers to local scrap dealer in year 2007 on quotation basis. Canara Bank has buy back
facility with HCL computers. So some of the PC's are sold back to the HCL to get new PC's in
return. Obsolete PC's other than HCL are sold to Sai Computer Services in Bangalore.
2.5.2 E-waste from Government Offices
There are several examples like that of Goa Industrial Development Corporation (Goa-IDC)
which is a government owned organization is also disposing e-waste on quotation basis to
scrap dealers. Items discarded in October 2008 were 15 computers, 17 color CRT monitors, 5
printers, 1 scanner and 1 office jet printer. Other was Goa Electricity Board in Panjim, the
scrap generated is lying idle in the office premises since an year which consists of 5 PC's with
CRT monitors and 1dot matrix printer. Similar case was found in Corporation of City of Panaji
where E-waste is stored in a similar fashion since long time which consists of 7 PC's with CRT
monitors and 5 dot matrix printers. Goa Electronics Ltd. (GEL), a government supplier of
computers to government offices generates small quantity of waste i.e. 1-2 cartridges a
month. The list of Government offices is given in Annexure-IV.
2.5.3 E-waste from Industrial Units
Goa region has some industrial estates and hence industries cover manufacturing units,
assembling units of computer and allied parts, besides other manufacturing units like
UPL Environmental Engineers Ltd. 26 E-waste Generation / Management in Goa

pharmaceuticals, beverage, ferrous and non-ferrous, home appliance etc. Various industrial
estates were covered for study on e-waste generation which includes Verna Industrial Estate,
Kundaim Industrial Estate, Corlim Industrial Estate, Sancoale Industrial Estate, Bethora
Industrial Estate, Madkaim Industrial Estate, Canacona Industrial Estate and Usgao Industrial
Estate. Various industries were visited in these industrial estates according to the scale of
operation. Industries were divided into small scale, medium scale and large scale industries.
Wyeth Ltd. In Verna Industrial estate a medium scale industry does not generate any e-waste
in Goa, as after use the computers are sold to employees and the obsolete PC's are sent
back to the Head Office as their company policy. Syngenta India Ltd. a large scale company
uses 300 computers and in last 6 months 70% of the PC's were replaced, some given to
employees and some discarded to scrap dealers. Zenith computers ltd. an assembling unit
has not generated e-waste till date. Encube Ethicals also a small scale industry has generated
8 computers with CRT monitors and 3 printers since last 2 years. Anmol industries a small
scale steel manufacturing unit generated 1 PC last year as e-waste.
In brief, mostly small scale and medium scale industries sell the obsolete PC's to scrap
dealers. Large scale industries have company policy to send back the obsolete PC's back to
the head office and hence they do not generate much e-waste in Goa. Some industries invite
quotations from other cities recyclers and sell e-waste directly to them. According to the
scrap dealers, the e-waste mostly is collected from small and medium scale industries only.
There are quite a few industries in Goa. But all these have their headquarters in Mumbai and
hence the procurements of IT infrastructures are usually done from Mumbai itself.
2.5.4 E-waste collected by scrap dealers
In Goa approximately 300 authorized scrap dealers are present. There are no scrap dealers
which collect exclusively e-waste. A scrap dealer in Batlim area collects approx. 20-30
computers a month as scrap. It is then sold to scrap dealers in Selampur, New Delhi. A scrap
dealer in Kraswada, Mapusa sold 100-150 computers in January 2009 to Delhi parties. On an
average a dealer collects approx. 50 computers as scrap every 1-2 month. According to Mr.
Sayed Abdul Aziz, secretary All Goa Scrap Dealers Association in Fatorda, Margao, maximum
10-15 tons of e-waste is generated and collected from all over Goa every year. In Goa no
segregation, treatment and recycling activity takes place. The whole unit is stored and
transported to other cities for dismantling and recycling.
UPL Environmental Engineers Ltd. 27 E-waste Generation / Management in Goa

2.5.5 E-waste from service centers
Service providers generate mostly the obsolete parts of the computer and allied goods. Most
of the obsolete parts are sent back to the manufacturers. Some of the service providers sell
scrap to scrap dealers and some give scrap back to the customers after repairing or replacing
with new part.
2.5.6 Dealers / distributors
There are over 200 channel partners serving Goa's entire IT hardware and basic software
needs. Of this, only about 100+ are active partners. Of these 100, less than 10 partners are in
to solutions providing, with revenues ranging from Rs 1 crore to Rs 4 crore. The rest all are
under the 1 crore revenue bracket.
Only a few cater to the corporate and the Government segment. Most Government deals
involve the participation of vendors and a handful of distributors directly. Customers in the
corporate segment are mostly banks and industries.
2.5.7 E-waste from Governmental Organizations
Governmental Organizations like National Institute of Oceanography (NIO) was contacted for
e-waste generation/ management details as NIO is the major user of computer and allied
goods. Computers and printers are auctioned from NIO. T ill February 2009, 205 PC's and 125
printers auctioned from NIO. HP toners and cartridges are collected and sent to the
approved e-waste recycling facility in Bangalore.
2.5.8 E-waste from private Computer Institutes
Computer institutes are also the major user of E-goods. Manipal Institute of Computer
Education (MICE) is the major user of PC and allied goods. Old PC's are donated to village
schools. In year 2007, 10 PC's were donated to village schools. Another was Koenig Solutions
a private computer institute have not yet generated any e-waste as the institute established
in year 2004. JETKING was another institute which does not generate E-waste, but instead
they buy computer scrap from scrap dealers for study purpose. The list of computer training
institutes is given in Annexure-V.
UPL Environmental Engineers Ltd. 28 E-waste Generation / Management in Goa

CHAPTER 3
E-WASTE QUANTIFICATION
The various factors which are specific to a city may effect E-waste generation, thus a city
specific framework was developed for Goa. The important factors used for developing such
framework for quantification of E-waste includes computer market status and trend, value
chain flows, scale of operation of computer distribution, socio-economic status and trend of
city population and marketing strategy. The change in average age of computer, consumer
behavior and computer trend of city are the important factors need to be understand. The
reasons of change of the average age of computers can further be attributed to day to day
advanced technology, higher disposable income of people, model attractiveness
(style/shape/color of computers); higher computing requirements (higher level education).
The following points are taken into consideration for framework development and the data
were collected on each of them through questionnaire survey, household survey and
secondary sources.
Estimation
Based on the secondary information, it was understood that the average age of computer is
8 years in Goa. Thus to calculate E-waste for 2010-11, computer market data for and
percentage of scrap generation of PC's for last 7-8 years were collected. It means that
computers sold in year 2004 are contributing to the E-waste being generated in year 2011.
Due to technological advancements and cheaper price of PC's, the scrap generation starts
from 2nd
year.
After analyzing the questionnaire survey it was found that the numbers of small and large
dealers/ distributors were 310 and 59, making a total number of 369.
TYPE SMALL DEALERS LARGE DEALERS TOTAL
PC 310 59 369
PC sales from following above dealers were:
UPL Environmental Engineers Ltd. 29 E-waste Generation / Management in Goa

small dealers
No. of PC's/ year
total sales/ year
310 22 6820
large dealers average sales/ dealer/ annum total sales/ year
59 79 4661
Thus the total sales of PC was estimated to be 11,481 PC's per year in 2008-09 and the
market is growing at the rate of 4% annually.
Sales pattern from sample dealers were distributed percent wise as under also the total sales
during the year 2008-09:
SALES PATTERN % DISTRIBUTION SALES
Industrial 55% 6315
Residential 30% 3444
Commercial 15% 1722
TOTAL 100% 11481
3.1 CHART WISE DATA DISTRIBUTION
E-waste generated from Goa was collected from following 3 main sectors: Industries,
Residential and Commercial areas. Industries includes all the small scale, medium scale and
large scale units and the commercial areas include all the Government offices, Banks, private
institutes, schools, colleges etc.
This method is also known as Market Supply Method. This method ensures that the
estimate captures more accurately the disposal pattern that the PC's are not made obsolete
all together, but in fact are disposed in varying quantities over successive years.
The distributed disposal pattern is more realistic because on the one side some PC's,
especially in commercial establishments, are made obsolete due to technological, rather
than functional obsolescence, even much before their average lifetime and on the other
side, some are reused and stored beyond their average lifetime.
3.1.1 Industrial scrap quantification
Total numbers of small, medium and large scale industries contribute to around 626 in
numbers. Contributing small scale industry as 488, medium scale as 108 and large scale as
30 industries. Thus calculating the total PC use in the industries is 17,344 in numbers.
UPL Environmental Engineers Ltd. 30 E-waste Generation / Management in Goa

YEAR
PC sold
to
AVERAGE LIFETIME (REDUCTION IN YEARS) No. of
Obsolet
e PC's
Weight in
tonnes
(27.2
KG/PC)
1st year
(0%)
2nd year
(5%)
3rd year
(10%)
4th year
(25%)
5th year
(30%)
6th year
(18%)
7th year
(8%)
8th year
(4%)
2004 5399 0 0 0
2005 5615 0 270 270 7.34
2006 5839 0 281 540 821 22.32
2007 6072 0 292 562 1350 2203 59.93
2008 6315 0 304 584 1404 1620 3911 106.38
2009 6062 0 316 607 1460 1685 972 5039 137.06
2010 6304 0 303 632 1518 1752 1011 432 5647 153.6
2011 6557 0 315 606 1579 1822 1051 449 216 6038 164.23
2012 6819 0 328 630 1516 1895 1093 467 225 6153 167.36
2013 7092 0 341 656 1576 1819 1137 486 234 6247 169.93
2014 7375 0 355 682 1639 1891 1091 505 243 6406 174.25
2015 7670 0 369 709 1705 1967 1135 485 253 6622 180.12
Industries No. PC/
Industry
Total PC
use Type Number
small 488 8 3904
medium 108 55 5940
large 30 250 7500
Total 626 17344
According to the sales data from the dealers/ distributors, the total sale of computers in
industries is 6315 computers per year (2008 data).
Based on the discussion and questionnaire survey it is understood that all the PC's are used
for at least 1 year in industries. The disposal starts in the 2nd year onwards, in which 5% of
the PC's are made obsolete in 2nd year itself, 10% in the 3rd year, then 25% in 4th and it
reaches its peak in 5th year contributing to 30% PC's reaches the E-waste stream. At this
point, the largest parts, 70% of the PC's, have already been disposed, and the balance 30% is
disposed over the last 3 years.
Based on the total annual PC sales, PC already installed and year wise obsolence rate the
estimated quantity of PC's is given in chart below.
Chart 1: Estimation of E-waste (in tons) from Industrial areas
For example, as shown in the Chart 1 above, lot of 270 PC's of the 5399 PC 's sold in year
2004 from Industrial areas come into waste stream in their 2nd
year in 2005. In their 3rd
year
540 PC's comprising 10% of the PC sales of 2004 come to the waste stream. 4th
year the 1350
PC's comprising 25% of the PC sales of 2004 come to the waste stream, and further
UPL Environmental Engineers Ltd. 31 E-waste Generation / Management in Goa

increasing to 1620 PC's in their 5th
year, which is the highest disposal rate at 30%. The 6th
, 7th
and 8th
year see disposals of 972, 432 and 216 PC's, thereby completing the disposal of all
the PC's sold in 2004.
The number of obsolete PC's in a year is calculated by summing up the PC's disposed across
the distribution. The following rows shaded have PC disposal data from all previous 8 years,
giving full picture of the number of obsolete PC's annually. Thus, at the end of year 2009,
137 tons of e-waste estimated to be generated from the industries during 2009.
3.1.2 Residential
The total population of Goa is around 14,00,000 lacs, in which urban population can be
considered as 55% of the total population, which comes to around 7,70,000 persons. Total
number of families would be approximately 1,92,500. PC sold to residential areas according
to the calculation from the dealer’s sale data is approximately 3444 PC's during the year
2008.
Population of Goa 1400000
Urban population 55% 770000
Avg. no. of person in a family 4
Total No. of Families 192500
Calculating the usage of PC's in the residential areas, comes to around 2310 PC's
(770000*3/1000) i.e. 3 PC's per 1000 persons. Average life of PC in residential areas is
approximately 8 years.
UPL Environmental Engineers Ltd. 32 E-waste Generation / Management in Goa

YEAR
PC sold
to
AVERAGE LIFETIME (REDUCTION IN YEARS)
No. of
Obsolet
e PC's
Weight in
tonnes
(27.2
KG/ PC)
1st year
(0%)
2nd year
(0%)
3rd year
(8%)
4th year
(15%)
5th year
(22%)
6th year
(30%)
7th year
(18%)
8th year
(7%)
2004 2946 0 0 0
2005 3063 0 0 0 0
2006 3185 0 0 236 236 6.41
2007 3312 0 0 245 442 687 18.68
2008 3444 0 0 255 459 648 1362 37.06
2009 3582 0 0 265 478 674 884 2300 62.57
2010 3725 0 0 276 497 701 919 530 2922 79.48
2011 3874 0 0 287 517 729 956 551 206 3245 88.26
2012 4029 0 0 298 537 758 994 573 214 3374 91.78
2013 4190 0 0 310 559 788 1033 596 223 3509 95.44
2014 4358 0 0 322 581 820 1075 620 232 3649 99.26
2015 4532 0 0 335 604 852 1118 645 241 3795 103.23
Chart 2: Estimation of E-waste (in tons) from Residential areas
As shown in the Chart 2 above, the first lot of 236 PC's of the 2946 PC 's sold in year 2004
from Residential areas come into waste stream in their 3rd
year in 2006. In their 4th
year 442
PC's comprising 15% of the PC sales of 2004 come to the waste stream. 5th
year the 648 PC's
comprising 22% of the PC sales of 2004 come to the waste stream, and further increasing to
884 PC's in their 6th
year, which is the highest disposal rate at 30%. The 7th
and 8th
year see
disposals of 530 and 206 PC's, thereby completing the disposal of all the PC's sold in 2004.
The number of obsolete PC's in a year is calculated by summing up the PC's disposed across
the distribution. The following rows shaded have PC disposal data from all previous 8 years,
giving full picture of the number of obsolete PC's annually. Thus, at the end of year 2009,
62.5 tons of e-waste will be generated from the industries.
3.1.3 Commercial
The commercial areas include all the Government offices, banks, computer institutes
Government Organizations etc. According to the sales data collected from the dealers/
distributors the total sales of PC's in Commercial areas is approximately 1722 PC's in year
2008.
UPL Environmental Engineers Ltd. 33 E-waste Generation / Management in Goa

YEAR
PC sold to
Commercial
AVERAGE LIFETIME (REDUCTION IN YEARS)
No. of
Obsolete
PC's
Weight in
tonnes
(27.2
KG/PC)
1st year
(0%)
2nd year
(5%)
3rd year
(9%)
4th year
(23%)
5th year
(32%)
6th year
(17%)
7th year
(8%)
8th year
(6%)
2004 1472 0 0 0
2005 1531 0 74 74 2
2006 1592 0 77 132 209 5.69
2007 1656 0 80 138 339 556 15.12
2008 1722 0 83 143 352 471 1049 28.54
2009 1688 0 86 149 366 490 250 1341 36.49
2010 1756 0 84 155 381 509 260 118 1508 41.01
2011 1826 0 88 152 396 530 271 122 88 1647 44.8
2012 1899 0 91 158 388 551 282 127 92 1689 45.95
2013 1975 0 95 164 404 540 293 132 96 1724 46.89
2014 2054 0 99 171 420 562 287 138 99 1775 48.29
2015 2136 0 103 178 437 584 298 135 103 1838 50
Chart 3: Estimation of E-waste (in tons) from Commercial areas
As shown in the Chart 3 above, the lot of 74 PC's of the 1472 PC 's sold in year 2004 from
Commercial areas come into waste stream in their 2nd
year in 2005. In their 3rd
year 132 PC's
comprising 9% of the PC sales of 2004 come to the waste stream. 4th
year the 339 PC's
comprising 23% of the PC sales of 2004 come to the waste stream, and further increasing to
471 PC's in their 5th
year, which is the highest disposal rate at 32%. The 6th
, 7th
and 8th
year
see disposals of 250, 118 and 88 PC's, thereby completing the disposal of all the PC's sold in
2004.
The number of obsolete PC's in a year is calculated by summing up the PC's disposed across
the distribution. The following rows shaded have PC disposal data from all previous 8 years,
giving full picture of the number of obsolete PC's annually. Thus, at the end of year 2009,
36.5 tons of e-waste will be generated from the Commercial areas.
3.2 QUANTIFICATION & EVALUATION
The total e-waste generated from the State of Goa is calculated by summing up of all
the computer wastes generated from Residential, Commercial and Industrial areas. The
following table below explains the total e-waste generated from the PC from year 2004 to
2015.
UPL Environmental Engineers Ltd. 34 E-waste Generation / Management in Goa

Year
Industries
Residential
Commercial
Total E-waste
(tons)
2004 0 0 0 0
2005 7.34 0 2 9.34
2006 22.32 6.41 5.69 34.42
2007 59.93 18.68 15.12 93.73
2008 106.38 37.06 28.54 171.97
2009 137.06 62.57 36.49 236.12
2010 153.6 79.48 41.01 274.09
2011 164.23 88.26 44.8 297.29
2012 167.36 91.78 45.95 305.09
2013 169.93 95.44 46.89 312.26
2014 174.25 99.26 48.29 321.8
2015 180.12 103.23 50 333.35
Table: E-waste generation (in tons) of PC's from Industrial, Residential & Commercial areas
The total e-waste generation (in tons) from the PC's discarded during the following years is
calculated above.
3.2.1 Estimated quantity of electronic items other than PC's:
According to the notification by MoEF dated 12th
May 2011, the category of e-waste covers
various used electronic items besides personal computers and some of the electrical
equipment.
To estimate the quantity of such wastes, various scrap dealers were contacted and following
information was collected.
Major electronic & electrical items as waste from household are television sets,
refrigerators, air conditioners and Washing machines.
Details from the scrap dealer indicate that the appliances are mostly 8-10 years old. The
average quantity of appliances as waste collected is as follows:
UPL Environmental Engineers Ltd. 35 E-waste Generation / Management in Goa

Sr. No. Item Avg. Number of
units / month
Quantity (kg /
month)
Quantity
(tons/year)
1 Television Set 3 120 1.44
2 Refrigerator 1 180 2.16
3 Washing Machine 2 152 1.82
4 Air Conditioner 2 150 1.8
5 Telephone 22 20 0.24
6 Answering machine 3 6 0.1
7.56
Estimated Waste Collection from Scrap Dealers of other electronic wastes
Sr. No Distribution % Scrap Dealers Approx. Scrap
Dealers
Waste Collection
from a scrap
dealer / Year
(tons)
Total Waste collection
from all Scrap Dealers
(tons)
1
Large
30
90
4
360
2
Medium
50
150
1.5
225
3
Small
20
60
1
60
3.2.2 Overall e-waste generation
To estimate e-waste other than PCs, main products are used television sets, refrigerators, air
conditioners and washing machines under household appliances.
The total e-waste generated includes the domestic electronic goods like refrigerators,
washing machines and television sets which is also known as WEEE (Waste from Electronic
and Electrical Equipments). The e-waste from the PC is only 30% of the total e-waste
generated. So the total e-waste (WEEE) including the obsolete PC's and domestic electronic
goods is calculated below.
UPL Environmental Engineers Ltd. 36 E-waste Generation / Management in Goa

Year
Total E-waste (tons)
Total WEEE (tons)
2004 0 0
2005 9.34 28.03
2006 34.42 103.25
2007 93.73 281.2
2008 171.97 515.92
2009 236.12 708.36
2010 274.09 822.27
2011 297.29 891.88
2012 305.09 915.27
2013 312.26 936.79
2014 321.8 965.4
2015 333.35 1000.04
Table: Total WEEE generation (tons) in Goa
The e-waste generated in the coming years would be even greater in view of increasing
penetration of electronic and electric appliances in urban households, while at the same
time, the number of such appliances is increasing and appliances becoming obsolete earlier.
UPL Environmental Engineers Ltd. 37 E-waste Generation / Management in Goa

CHAPTER 4
MANAGEMENT OF E-WASTE It is estimated that 75% of the electronic items are stored due to uncertainty of how to
manage it. These electronic junks lie unattended in houses, offices, warehouses etc. and
normally mixed with household wastes, which are finally disposed off at landfills. This
necessitates implemental management measures. Management of E-waste basically talks
about management of E-waste starting at the manufacturing of products.
Issue and problems
Day to day technological advancement in PC market increases the computer
obsoleteness which generates more obsolete PCs by company which are given back
to distributors through buy-back system. In distributors place, storage and disposal of
junk computers is a problem.
Informal recycling process is carried out to recover important metals. Goa does not
have any recycling facility to deal with e-waste.
Non- functional computer scrap parts may be disposed with Municipal solid waste by
scrap dealers which increase the risk of landfill site contamination or disposed
anywhere in open place.
Current practice in Goa for e-waste management is limited to collection and transportation
of e-waste to other cities like Delhi, Bangalore etc. The e-waste collected by various active
scrap dealers in Goa is packed and transported mostly by rail (cheap transportation) for
recycling activities.
Various e-waste management practices in Goa are as follow:
1. Collection system- scrap vendors collect e-waste from Govt. offices, residential areas,
industries, private institutes, Banks etc. Such E-waste is then stored at the scrap
yards.
2. Mixing of E-waste with MSW- may be some amount of wires and cables gets mixed
with the MSW and reaches MSW dumping sites.
3. When the considerable e-waste is collected at the scrap yards they are then packed
and transported to the recycling facilities at other cities. No dismantling and
UPL Environmental Engineers Ltd. 38 E-waste Generation / Management in Goa
segregation of e-waste is done in Goa.
Proposed Activities for E-waste management in Goa-
Considering the severity of the problem, it is imperative that certain management options
be adopted to handle the bulk e-wastes. The approach for e-waste management is given in
ANNEXURE-VI. Following are some of the management options suggested for the regulatory
authorities, industries and the public.
4.1 Responsibilities of the various Regulatory Authorities
In Schedule-III of E-waste (Management and Handling) Rules, 2011, the responsibilities of
the Central Pollution Control Board, State Pollution Control Boards/Pollution Control
Committees in Union Territories and Urban Local Bodies (Municipal
Committee/Council/Corporation), have been mentioned (Annexure-VII).
4.2 Responsibility and role of industries
(i) All personnel involved in handling e-waste in industries including those at the
policy, management, control and operational levels, should be well qualified and
trained. Companies can adopt their own policies while handling e-wastes. Some are
given below:
a) Use label materials to assist in recycling (particularly plastics).
b) Standardize components for easy disassembly.
c) Re-evaluate 'cheap products' use, make product cycle 'cheap' and so that it
has no inherent value that would encourage a recycling infrastructure.
d) Create computer components and peripherals of materials which after use
could be recyclable or biodegradable.
e) Utilize technology sharing particularly for manufacturing and environmentally
sound recycling of e-waste.
f) Encourage / promote / require green procurement for corporate buyers.
(ii) Manufacturing companies can and should adopt waste minimization techniques,
which will make a significant reduction in the quantity of e-waste generated and
thereby lessening the impact on the environment. It is a "reverse production"
system that designs infrastructure to recover and reuse every material contained
UPL Environmental Engineers Ltd. 39 E-waste Generation / Management in Goa

within e-wastes like metals such as lead, copper, aluminum and gold, and various
plastics, glass and wire.
(iii) Manufacturers, distributors, and retailers should undertake the responsibility of
recycling/disposal of their own products.
(iv) Manufacturers of computer monitors, television sets and other electronic devices
containing hazardous materials must be responsible for educating consumers and
the general public regarding the potential threat to public health and the
environment posed by their products. At minimum, all computer monitors,
television sets and other electronic devices containing hazardous materials must be
clearly labeled to identify environmental hazards and proper materials
management.
(v) Mandate sustained capacity building for industrial E-waste handling for policy
makers, managers, controllers and operators. Enhance consumer awareness
regarding the potential threat to public health and environment by electronic
products, if not disposed properly.
(vi) Enforce labeling of all computer monitors, television sets and other
household/industrial electronic devices for declaration of hazardous material
contents with a view to identifying environmental hazards and ensuring proper
material management and E-waste disposal.
4.3 Responsibilities of the Citizen
Waste prevention is perhaps more preferred to any other waste management option
including recycling. Donating electronic item(s) for reuse extends the lives of valuable
products and keeps them out of the waste management system for a longer time.
Reuse, in addition to being an environmentally preferable alternative, also benefits
society. By donating used electronic item(s) to schools, non-profit organizations, and
lower-income families make them to afford use of such equipment.
E-wastes should never be disposed with garbage and other household wastes. This
should be segregated at the site and sold or donated to various organizations.
While buying electronic products opt for those that:
UPL Environmental Engineers Ltd. 40 E-waste Generation / Management in Goa

(i) are made with fewer toxic constituents
(ii) use recycled content
(iii) are energy efficient
(iv) are designed for easy upgrading or disassembly
(v) utilize minimal packaging
(vi) offer leasing or take back options
(vii) have been certified by regulatory authorities. Customers should option for
upgrading their computers or other electronic items to the latest versions
rather than buying new equipment.
NGOs should adopt a participatory approach in management of e-wastes.
UPL Environmental Engineers Ltd. 41 E-waste Generation / Management in Goa

CHAPTER 5
DISCUSSION & RECOMMENDATION
It is concluded that Electronic waste is a serious problem at global level but it is a serious
emerging issue for country like India. India has reached a stage where it needs to think about
e-waste occupational hazards and associated management options.
5.1 CONCLUSION OF E-WASTE MANAGEMENT BASED ON INDIAN CONTEXT
(i) It is concluded that in India, cities, do not have any proper system for quantification
of electronic waste.
(ii) There are now proper recycling technologies used by registered recyclers to recover
material including precious metals. Recycling processes are carried out also in
informal units in enclosed area where recyclers and workers are not aware about
occupational hazards.
(iii) In informal sector, due to lack of available recycling technology, the process of e-
waste for recycling is done by open burning, acid bath and other hazardous
methods.
(iv) There are guidelines now available for environmentally sound management of e-
waste, prepared by CPCB and there is a system of registration for e-waste recyclers
in the country under Hazardous Waste (Management, Handling and Transboundary
Movement) Rules, 2008. Various provisions have been made for responsibilities of
electronic item manufacturers, its bulk consumers, e-waste recyclers, and
collection centers of e-waste under new Rules called E-waste (Management and
Handling) Rules, 2011, which will come to effect from May 1st
, 2012.
5.2 CONCLUSION OF E-WASTE MANAGEMENT BASED ON GOA CONTEXT
With continuous advancement in technology and increasing acceptability of computer
products as basic requirement, the future of computer hardware industry looks promising in
particularly in cities. The computer market in cities has been increasing due to lot of
commercial development and IT developed activities. Cities are emerging with a large
middle class group who are willing to buy PC's. A large chunk of demand is still met by
Assemblers who compete primarily on low cost advantage. Assemble markets are
UPL Environmental Engineers Ltd. 42 E-waste Generation / Management in Goa

dominated in residential sector and MNCs/Branded PC's market has been shifting to
commercial sector. PC usage increases with the increase of the Income level and education
level of people. Even though MNCs and branded PC's cover larger market in cities, grey
market finds its place in between assemble and branded markets. Actually assemble market
is the main originator of grey market because majority of obsolete PC's are diverted to the
grey markets, non functional parts are changed and fixed with the new parts in PC's and
further sold back to customers and remaining miscellaneous scraps are sold to scrap-dealers
and recyclers.
a) There are no recyclers in Goa specially doing recycling for obsolete PC's.
b) Existing E-waste handling practices can not manage future E-waste generation so
there will be requirement of formal collection center(s) and at later date to have
processing/recycling facility where e-waste can be segregated, dismantled and
recycled.
c) There is lack of awareness in public regarding E-waste handling, treatment and
disposal.
5.3 RECOMMENDATION
(i) Following suggestions need to be implemented to manage E-waste in Goa:
a) Awareness among all the stakeholders and people in E-waste chain.
b) Active participation of various stakeholders of E-waste chain in Goa.
c) Effective implementation of regulations and guidelines
(ii) Techniques for e-waste recycling should be based on 3R principle (Reduce, Recycle
and Recover) which would minimize environment and health impacts as well as
would save resources.
(iii) Need to create awareness among various stakeholders, general public and
regulatory authorities by stakeholders participation.
(iv) Creating awareness by distributing brochures, demonstration of pictures and
advertisement in the news papers, magazines, on radio and TV.
(v) Assist the informal sectors like scrap dealers with a formal trainings and knowledge
about e-waste handling and disposal options and also on requirement under e-
waste Rules.
(vi) Improve existing Informal collection system, as e-waste is collected by scrap dealers
UPL Environmental Engineers Ltd. 43 E-waste Generation / Management in Goa

in Goa. A buy back system needs to be implemented where customers would have
been given the knowledge about e-waste issue and to encourage the customers to
give back their obsolete PC's. This system would collect large amount of obsolete
PC's and improve existing informal collection system.
(vii) Looking into existing and future e-waste trend, there is a requirement of authorized
e-waste collection centers and recycling unit(s) for dismantling, segregation and
recycling in environmentally sound manner.
(viii) The most effective option to minimize e-waste is the extension of product lifespan
i.e., to extend a computer's lifespan, its working life, before it fails or becomes
obsolete.
(ix) The manufacturers should adopt cleaner production technology and eliminate the
use of hazardous substances such as cadmium, mercury, hexavalent chromium and
halogenated flame retardants from electronic products.
UPL Environmental Engineers Ltd. 44 E-waste Generation / Management in Goa

ANNEXURE-I(A)
UPL Environmental Engineers Ltd. 45 E-waste Generation / Management in Goa

UPL Environmental Engineers Ltd. 46 E-waste Generation / Management in Goa

UPL Environmental Engineers Ltd. 47 E-waste Generation / Management in Goa

UPL Environmental Engineers Ltd. 48 E-waste Generation / Management in Goa

UPL Environmental Engineers Ltd. 49 E-waste Generation / Management in Goa

ANNEXURE-I(B)
Number of Registered E-waste Recyclers State wise in the Country
S.No State No. of Registered
Unit(s)
Capacity in MTA
1. Andhra Pradesh 2 11800
2. Gujarat 1 12000
3. Haryana 3 4300
4. Karnataka 13 12900
5. Maharashtra 6 9550
6. Rajasthan 2 2250
7. Tamil Nadu 19 154436
8. Uttrakhand 1 12000
Total 47 219236
UPL Environmental Engineers Ltd. 50 E-waste Generation / Management in Goa

ANNEXURE-II
Table I summarizes the health effects of certain constituents in e-wastes. If these electronic
items are discarded with other household garbage, the toxic substances pose a threat to
both health and vital components of the ecosystem.
Table I: Effects of E-Waste constituent on health
Source of e-wastes
Constituent
Health effects
Solder in printed circuit
boards, glass panels and
gaskets in computer
monitors
Lead (PB)
Damage to central and peripheral nervous
systems, blood systems and kidney
damage.
Affects brain development of children.
Chip resistors and
semiconductors
Cadmium (CD)
Toxic irreversible effects on human health.
Accumulates in kidney and liver.
Causes neural damage.
Teratogenic.
Relays and switches,
printed circuit boards
Mercury (Hg)
Chronic damage to the brain.
Respiratory and skin disorders due to
bioaccumulation in fishes.
Corrosion protection of
untreated and galvanized
steel plates, decorator or
hardner for steel housings
Hexavalent
chromium (Cr) VI
Asthmatic bronchitis.
DNA damage.
Cabling and computer
housing
Plastics including
PVC
Burning produces dioxin. It causes
Reproductive and developmental
problems;
Immune system damage;
Interfere with regulatory hormones
Plastic housing of
electronic equipments and
circuit boards.
Brominated flame
retardants (BFR)
Disrupts endocrine system functions
Front panel of CRTs
Barium (Ba)
Short term exposure causes:
Muscle weakness;
Damage to heart, liver and spleen.
Motherboard
Beryllium (Be)
Carcinogenic (lung cancer)
Inhalation of fumes and dust. Causes
chronic beryllium disease or beryllicosis.
Skin diseases such as warts.
UPL Environmental Engineers Ltd. 51 E-waste Generation / Management in Goa

ANNEXURE-III
Questionnaire to Govt. Offices, Govt. Organizations, private and nationalized banks:
� Total number of staff having access to computers?
� How many computers and allied goods in use?
� Monitors with CRT or TFT? Quantity?
� How old are the PC's?
� What is the average life of computers in the Govt. offices?
� What is the quantity of e-waste generated in last 5 years?
� Contact details of dealers/ distributors/ retailers?
� Details of service providers?
� What is done with the obsolete computer and allied wastes?
� Contact details of scrap dealers?
Questionnaire to Computer Dealers / Distributors / Computer service centers
1. Quantity of IT products distributed/sold in last 5 years?
2. What service provided by the service centers?
3. Buy back facility of e-waste generated?
4. Details of scrap dealers if any?
Questionnaire to Industrial Estates and Industries (Large Scale, Medium Scale and Small
scale Industries)
1. Total number of employees using IT products?
2. Scale of operation?
3. Turnover of the company?
4. Number of computers and allied IT goods in use?
5. Life of Computers in the company?
6. AMC with the dealers/ distributors?
7. Quantity of obsolete computers generated?
8. Is obsolete computers with CRT of TFT monitors? Quantity?
9. What is done with the obsolete computer and other IT goods?
10. Details of scrap dealers?
Questionnaire to IT industry
� Total number of employees using IT products?
UPL Environmental Engineers Ltd. 52 E-waste Generation / Management in Goa

� Scale of operation?
� Turnover of the company?
� Quantity of computers manufactured?
� Quantity of computers sold in Goa market? (5 years data)
� Number of computers and allied IT goods used in company?
� Life of Computers in the company?
� Quantity of obsolete computers generated?
� Is obsolete computers with CRT of TFT monitors? Quantity?
� What is done with the obsolete computer and other IT goods?
� Details of scrap dealers?
Questionnaire to Scrap Dealer
� Number of workers working in the scrap yard?
� Per month how much quantity of e-waste collected from around Goa?
� Quantity of CRT monitors received as waste?
� What is done with the e-waste?
� E-waste sold to which cities?
� How much quantity of e-waste sold to other cities?
Questionnaire to All Goa Scrap Dealers Association
� How many registered scrap dealers active in and around Goa?
� Average number of Employees working with these scrap dealers?
� Quantity of e-waste collected every year?
� From where the e-wastes are being collected?
� What is done with the e-waste?
� E-waste sold to which cities?
Questionnaire to Hotel
2. Number of rooms in hotel?
3. Classification of rooms?
Single – Double – Suite – Others
4. How many beds in total?
5. How many Television sets?
6. Number of computers in use?
UPL Environmental Engineers Ltd. 53 E-waste Generation / Management in Goa
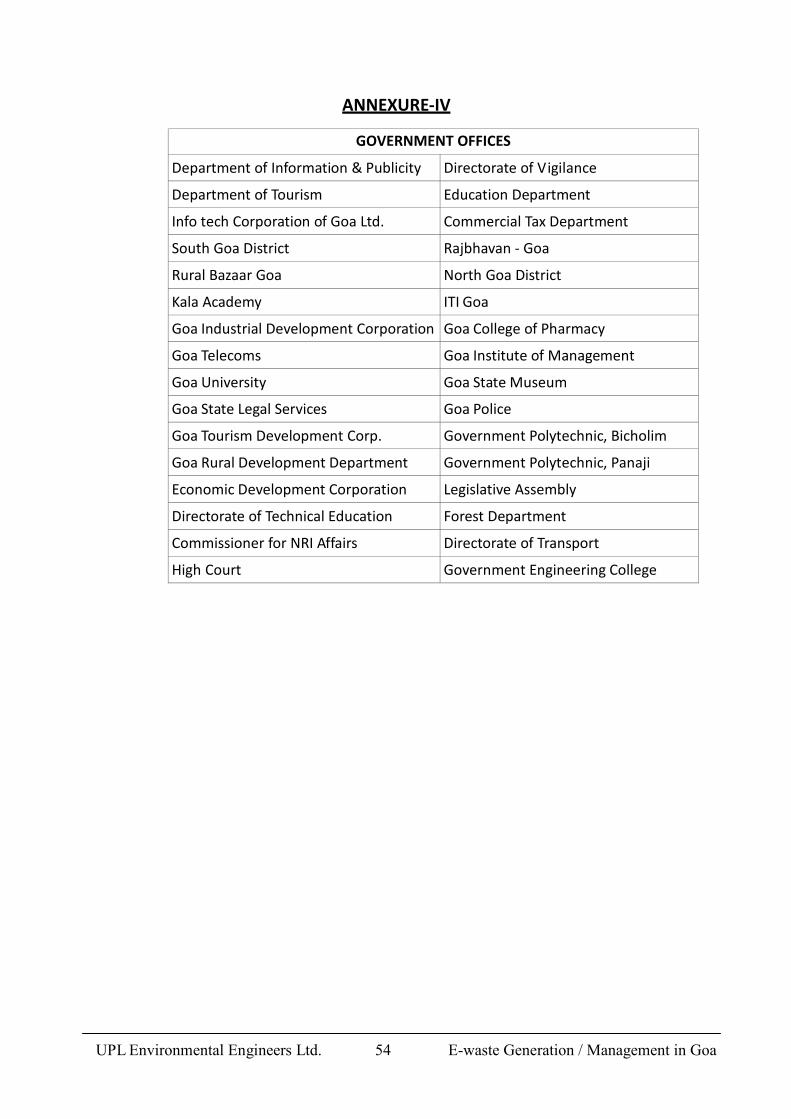
ANNEXURE-IV
GOVERNMENT OFFICES
Department of Information & Publicity Directorate of V igilance
Department of Tourism Education Department
Info tech Corporation of Goa Ltd. Commercial Tax Department
South Goa District Rajbhavan - Goa
Rural Bazaar Goa North Goa District
Kala Academy ITI Goa
Goa Industrial Development Corporation Goa College of Pharmacy
Goa Telecoms Goa Institute of Management
Goa University Goa State Museum
Goa State Legal Services Goa Police
Goa Tourism Development Corp. Government Polytechnic, Bicholim
Goa Rural Development Department Government Polytechnic, Panaji
Economic Development Corporation Legislative Assembly
Directorate of Technical Education Forest Department
Commissioner for NRI Affairs Directorate of Transport
High Court Government Engineering College
UPL Environmental Engineers Ltd. 54 E-waste Generation / Management in Goa
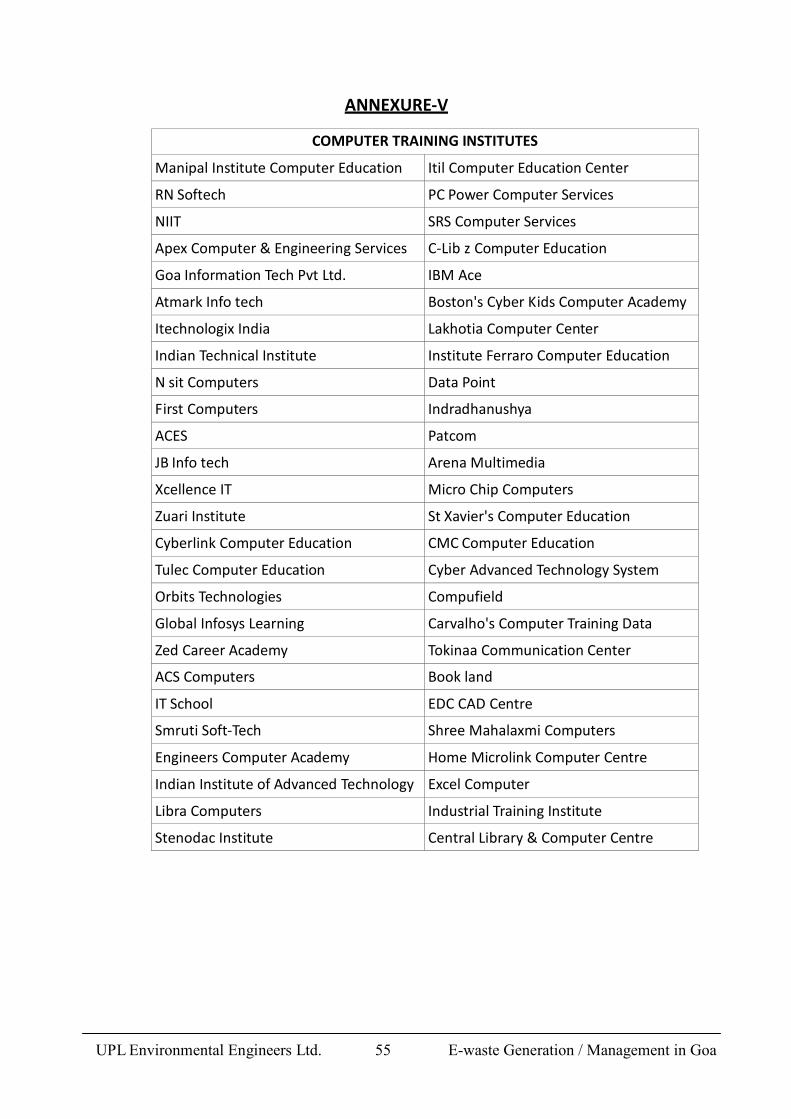
ANNEXURE-V
COMPUTER TRAINING INSTITUTES
Manipal Institute Computer Education Itil Computer Education Center
RN Softech PC Power Computer Services
NIIT SRS Computer Services
Apex Computer & Engineering Services C-Lib z Computer Education
Goa Information Tech Pvt Ltd. IBM Ace
Atmark Info tech Boston's Cyber Kids Computer Academy
Itechnologix India Lakhotia Computer Center
Indian Technical Institute Institute Ferraro Computer Education
N sit Computers Data Point
First Computers Indradhanushya
ACES Patcom
JB Info tech Arena Multimedia
Xcellence IT Micro Chip Computers
Zuari Institute St Xavier's Computer Education
Cyberlink Computer Education CMC Computer Education
Tulec Computer Education Cyber Advanced Technology System
Orbits Technologies Compufield
Global Infosys Learning Carvalho's Computer Training Data
Zed Career Academy Tokinaa Communication Center
ACS Computers Book land
IT School EDC CAD Centre
Smruti Soft-Tech Shree Mahalaxmi Computers
Engineers Computer Academy Home Microlink Computer Centre
Indian Institute of Advanced Technology Excel Computer
Libra Computers Industrial Training Institute
Stenodac Institute Central Library & Computer Centre
UPL Environmental Engineers Ltd. 55 E-waste Generation / Management in Goa

Approach for E-waste Management
ANNEXURE-VI
Approach to e-waste management follows the guidelines provided by the Central Pollution
Control Board, (CPCB).
Point 1 – APPROACH
11. Identify the category: Identification of technology used and tentative year of
manufacture gives information on likely components present in the e-waste.
12. Identification of the composition of e-waste: Knowing composition will help the
hazardousness of the waste / its components since the limiting values are already
known. Plan for disposal / treatment / recycling options based on this information.
13. Plan recycling / disposal: Contact the supplier / dealer / manufacturer / hardware
expert who will help identification appropriate reuse for segregated components.
Disposal will be planned based on the likely composition
Point 2 – REUSE, RECYCLING AND RECOVERY PROCESS
7. Dismantling : manual operation with sufficient tools and protective equipment.
8. Segregation : Segregation into plastics (segregated into ABS, HIP, PC, PE, PP), ferrous
and non-ferrous metals sold to recyclers(Cu, Al, Au, Ag, Pb, Sn), useful components
(PC boards – non-processing, stored for disposal and CRT – glass cut under vacuum
trap), hazardous material, Treatment and disposal – shredding, pulverizing, disposal
to TSDF.
9. Refurbishment and reuse: components in working condition are tested and stored for
reuse for its original use.
Point 3 – SEGREGATION OF PLASTICS
Density separation of mixture of segregated plastic waste containing ABS, HIP, PC, PP, PE.
First fraction PE + PP and second fraction is ABS + HIP. In Sink float density separation
method, top layer is PC and ABS while bottom layer is Nylon and glass. Separate into
individual items by tertiary separation.
ABS : Acrilonitrile Butadiene Styrene
HIP : High Impact Polystyrene
UPL Environmental Engineers Ltd. 56 E-waste Generation / Management in Goa

PC : Poly carbonate
PE : Poly ethylene
PP : Poly propylene
Point 4 – CRT TREATMENT
Used CRT monitors are manually removed from metal and plastic casings. Then picture tube
split is done by Nichrome hot wire cutting under vacuum trap. Screen section is the Front
glass separated for reuse (screen glass) and funnel section is with the internal phosphor
coating separated for reuse (funnel glass). Wire brush / strong vacuum for removal of
phosphor in powder form. Air filter system used to collect phosphor dust.
The PCBs in Technology
Printed Circuit Boards: Printed Circuit Boards (PCBs) are of utmost importance and offer
major challenges in handling hazardous e-waste. They contain hazardous constituents such
as brominated fire retardants, lead in the solder, mercury, copper and precious metal such as
gold. There are currently few facilities available in India to properly treat and extract
valuable metals from these PCBs. These are generally sent abroad for reprocessing. However,
there are several recyclers in the unorganized sector who recover useful metals from PCBs.
Poly Chlorinated Biphenyls: There is an increasing trend of not using poly chlorinated
byphenyls in the manufacture of electrical and electronic equipment. This is due to
regulation on Reduction of the Hazardous Substances (RoHS) that many countries are
adopting now. Currently, in India there is no processing is done for components containing
poly chlorinated byphenyls.
UPL Environmental Engineers Ltd. 57 E-waste Generation / Management in Goa

ANNEXURE-VII
UPL Environmental Engineers Ltd. 58 E-waste Generation / Management in Goa

REFERENCE
S
1. Goa Industrial Development Corporation (G-IDC) website: www.goaidc.com
2. Guidelines for environmentally sound management of e-waste, MoEF, CPCB
3. Manufacturers Association for Information Technology (MAIT)
4. National Informatics Centre. Goa State Centre. Ministry of Communications
and information Technology. (http://www.nicgoa.nic.in/)
5. Government of India, MoEF, Notifiaction dated 24th
September, 2008 for Hazardous
Waste (Management, Handling and Transboundary Movement) Rules, 2008.
6. Government of India, MoEF, Notification dated 12th
May, 2011 for E-waste
(Management and Handling) Rules, 2011
Websites
1. www.e-waste.in
2. www.toxiclink.org
3. www.goaspcb.gov.in/intro1.htm
4. http://144.16.93.203/energy/paper/ewaste/ewaste.html
5. www.assocham.org/events/recent/event_64
6. http://wgbis.ces.iisc.ernet.in/energy/paper/ewaste/ewaste.html
7. http://maps.google.co.in/maps
UPL Environmental Engineers Ltd. 59 E-waste Generation / Management in Goa