status of native woody species regeneration in the plantation
DESCRIPTION
The International Institute for Science, Technology and Education (IISTE). Science, Technology and Medicine Journals Call for Academic ManuscriptsTRANSCRIPT
Journal of Natural Sciences Research www.iiste.org
ISSN 2224-3186 (Paper) ISSN 2225-0921 (Online)
Vol.4, No.16, 2014
91
Status of Native Woody Species Regeneration in the Plantation
Stands of Yeraba Priority State Forest, Amhara Region, Ethiopia
Getachew Mulugeta (Ph.D) 1*
, Biruk Alemayehu 2
1. Southern Agricultural Research Institute, Awassa Agricultural Research Center
P.O.Box 6 Awassa, Ethiopia
E-mail: [email protected]
2.Amhara Regional State Bureau of Agricultural, Bahir Dar-Ethiopia
Abstract
The type of species, diversity, density, similarity and status of naturally regenerated woody plants under
monoculture plantation stands of four exotic species (Eucalyptus globules, Cupressus lustanica, Acacia
decurrence and Acacia melanoxylon) and the adjacent natural forest stand were investigated and compared to
verify the hypothesis that plantation stands of exotic species can foster natural regeneration and to determine the
status of regeneration and succession. A total of forty quadrate plots, with an area of 100m2 (10 m × 10 m) for
each, were established in all stands, i.e. eight plots in each plantation stand and the adjacent natural forest,
independently. In each plot, naturally regenerated native species name and abundance were recorded. And
numerical data on numbers of seedling were collected in a sub-plot (1m2) lay within each major plot. A total of
31 species which belongs to 23 families were recorded. The diversity of understory woody plant regenerated
species (H’) is 1.96, 1.80, 1.81, and 1.53 in the Cupressus lusitanica, Eucalyptus globules, Acacia melanoxylon,
and Acacia decurrence plantations respectively and 2.05 in the natural forest stand. The density was 5790, 1510,
1090, 2590 and stems/ha in Cupressus lustanica, Acacia melanoxylon, Eucalyptus globules and Acacia
decurrence plantations respectively, and 7950 stems/ha in the natural forest stand. Relatively high similarity of
regenerated woody species composition (0.625) was found between the under-growths of the Euc. globules and
Ac. melanoxylon plantation stands. There is disturbed status of natural regeneration and succession in all stands.
The findings revealed that there is significant difference in undergrowth and succession between upper story
species, mainly due to crown characteristics and stand density. Generally, plantation forests can foster natural
regeneration and succession provided that there is an adjacent seed source and dispersal agents, and an
appropriate management to protect the regeneration.
Keywords: natural regeneration; woody species diversity, plantation forest, Yeraba state forest
INTRODUCTION
Ethiopia has the most highland areas of any country in Africa. These highlands have a large number of plants
and animals found nowhere else in the world. The Ethiopian highlands are threatened by wide scale deforestation
and erosion, partly a result of high population pressure. This is true at all levels of the highlands, but particularly
in the “Dega” areas (an agroclimatic zone which lie between altitude 2300 to 3200masl) where growing
conditions are often extreme (Mark, et al., 2002). Massive tree planting and reforestation programs were
conducted in Ethiopia in the past decades to rehabilitate denuded areas and to protect and develop natural forests,
especially the National Forest Priority Areas (NFPA), where large unified natural forests still exist. And almost
all of the afforestation programs were focusing more on the plantation of exotic species mainly Eucalyptus and
Cupressus species.
Amhara region, where more soil erosion and environmental degradation observed, was one of the
regions where extensive afforestation and reforestation activities taken place as that of plantation campaign of
the previous regime, the Dreg. And currently there are remnants of those forests containing over-matured trees
grown densely. There is an opinion that draws attention to the harmful effects of such old plantation forests of
exotic tree species to the environment, especially for the undergrowth. However, as the counterbalance for the
opinion, different researches carried in tropical countries showed that the canopies of exotic trees can exert
protective functions and nurse effect for the regeneration of natural forest (Feyera and Demil, 2002a). As
evidence, with recently carried forest inventory, the existence of under canopy natural regeneration of native
woody species were reported under the canopy of an old plantation forest at Yeraba Priority State Forest (Enyew
and Gebeyehu, 2010). I the researcher also encountered the existence of regeneration of native woody species
under the canopies of aged plantation forests, while I had field visits in different areas of the region. So this issue
draws my attention and I wanted to do this research to confirm this fact through scientific investigation at one of
the above mentioned remnant old plantation forest of NFPAs, Yeraba Priority State Forest. This forest
comprising plantation stands of four exotic species.
In Ethiopia, there is poor biodiversity and ecosystem based research EFAP (1994). Especially
information on seedling ecology and natural regeneration status and diversity of native woody species under
plantation stands is limited (Feyera and Demel, 2002a). Despite the fact that plantation of exotic species have
Journal of Natural Sciences Research www.iiste.org
ISSN 2224-3186 (Paper) ISSN 2225-0921 (Online)
Vol.4, No.16, 2014
92
proved instrumental in the rehabilitation of degraded lands. Knowledge on the promoted indigenous species, the
natural regeneration diversity and status of regeneration of the developing flora is lacking. This creates gap of
knowledge to manage and conserve the understory biodiversity in plantation sites. The attention given to the
conservation and sustainable use of these biological resources has been inadequate (IBC, 2005). In some areas,
the under-canopy of old plantation sites are utilized as grazing field. In others, like that of the plantation areas of
NFPAs, where there is protection and guarding, the natural under growth often cleared as a weed in cleaning the
forest floor from fire hazard. Generally, there is undervaluation of such environmental resources due to low-level
of awareness about the role of plantation ecosystems in promoting the natural regeneration.
Fortunately the current national and global perception is directed to the significance of a scientific way
of exploration of the natural regeneration and diversity of adaptive woody species, especially under the canopy
of plantations, protection of natural re-growth under plantation stands may in fact be a more effective and
cheaper way to ensure long-term survival. And this is basic to the future transition of plantation forests to the
natural ecosystem. Many scholars believe that such transition to be the shortcut and cheapest method of
environmental rehabilitation than area closure, which needs longer period to rehabilitate and get with useful
species (Bekele-Tessema, 2007). But the transition needs identification of the undergrowth species, their
diversity and status of regeneration, an appropriate management of the under growth native vegetation and
maintaining optimal condition for regeneration under the stand of upper-canopy species. In this research we
investigated natural regeneration of native woody species under pure plantation stands of exotic species, at
Yeraba Priority State Forest (YPSF) in Amhara region Ethiopia. The canopy species of this research were Cup.
lustanica Miller (Cupressaceae), Ac. melanoxylon, Ac. decurrence and Euc. globules Labill (Myrtaceae), and an
adjacent natural forest which is located within the plantation forest are used for comparison or control. In the
present research the following hypothesis were tested. 1) Exotic tree plantations can foster the regeneration of
native woody species. 2) The diversity and status of regeneration under each exotic species are similar.
The objectives of this study were to: 1) to determine the composition, density of the naturally
regenerated woody species; 2) assess the regeneration status of woody species and compare the species
composition (similarity) between stands; 3) to identify the differences in regeneration between stands.
MATERIALS AND METHODS
Materials
Sunto (Silva) compass, Jallow, Measuring tape (50m) were used for the alignment of transects and the spacing
between quadrates. Wooden pegs and plastic rope is used to locate the corner points of the quadrate and sub-plot.
Collar diameter of the regenerated plants and DBH of canopy trees measured using tree caliper. Centimeter
marked wooden stick of length 3.5m was made at field and used to measure the height of regenerated plants.
And Sunto hypsometer was used to measure the height of canopy trees. Scissors, News papers, Corrugated
papers ‘carton’, Fiber rope and wooden sticks used to collect plant sample and press parts for identification.
Clinometers and Altimeter were used to collect landscape data such as slope, aspect and altitude. Plastic paint
was used to locate sampled stations or quadrates. Wireless internet apparatus (CDMA) was used to browse
information. Scientific calculator, Lap-top computer and Microsoft Excel Soft-ware were used to compile and
organize the data and to make analysis and Microsoft Word was used for writing. Goggle Earth was used to
download the satellite picture of the area. And Hewlett Printer, Photocopier, paper, tonner, carbon, fix pencil,
pen, marker, ruler etc… were used at the field and in office.
Description of the study area The study was carried at YPSF. This forest is located 295 km North of Addis Ababa on the way to Bahir Dar, in
East Gojam Zone of Amhara National Regional State (ANRS), Ethiopia. This forest is located at geographical
reference of 10018’35’’N latitude and 37
045’29’’E longitude. The altitude ranges between 2400 masl to 2551
masl. The forest covers a total area of 315 hectares. There are different land uses bordering the forest namely
‘Aygereb pasture land’ in the East, ‘Abedeg pasture land’ in the West, ‘Engich got’ farm land at the North and
the main asphalt road and a small village ‘Chemoga’ at the South. The landform of the study area is
characterized by undulating plain topography, and dominated by gentle slopes and a localized moderate steep
slopes ranging from 2-15%. The study area is located at the lowest boundary of ‘Moist Dega’ agroclimatic zone
(National Atlas of Ethiopia (NAE)) (Azene, 2005), and has a uni-modal type of rainfall pattern. The mean annual
rainfall is recorded to be 1200 mm. The mean annual temperature, according to the ‘Management plan’ survey
(Enyew and Gebeyehu, 2010), is 16oC. The months May to October are the rainy months. The soil is Nitosol and
is red in color, good physical properties, stable structure, deep rooting volume, and high moisture storage volume
(EMA, 1988). This zone is zone of high agricultural activity with Barley, Wheat, and Pulses as main crops. One
cropping season only. There is old history of land use with high erosion damages.
In the vicinity, the grassland is heavily overgrazed. There are few forests left and the acute scarcity of
fuel wood in many places means that dung is being used instead. Juniperus procera, form dominant but broken
forest stands, with medium sized trees. With this canopy, indigenous tree species such as Croton macrostachys,
Journal of Natural Sciences Research www.iiste.org
ISSN 2224-3186 (Paper) ISSN 2225-0921 (Online)
Vol.4, No.16, 2014
93
Ekebergia capensis, Olea africana, Hagenia abyssinica, Pygeum africana etc are found. As an area
rehabilitation measure, exotic species like Cupressus lusitanica, Acacia decurrence, Ac. melanoxylon and
Eucalyptus globules etc are successfully introduced as artificial plantations in to this area (Sjoholm, 1989).
Descriptions and other relevant information about these species can be found in the works of Azene et al. (1993)
and Fichtl & Admassu (1994). The study site, YPSF, is composed of these four mentioned exotic plantation
species. And all stands are aged, more than 20 years. And the research investigates the condition of the
undergrowth within these four species, and uses the natural forest stand, which is located at the center of these
stands, for comparison.
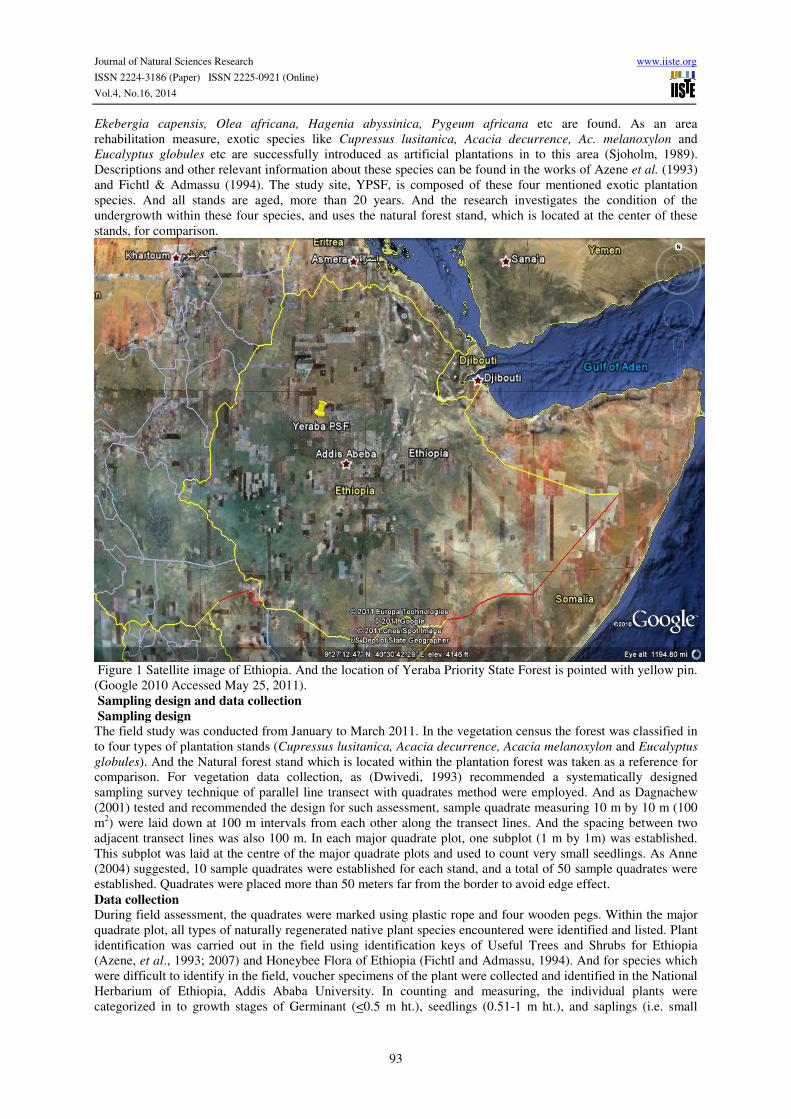
Figure 1 Satellite image of Ethiopia. And the location of Yeraba Priority State Forest is pointed with yellow pin.
(Google 2010 Accessed May 25, 2011).
Sampling design and data collection
Sampling design
The field study was conducted from January to March 2011. In the vegetation census the forest was classified in
to four types of plantation stands (Cupressus lusitanica, Acacia decurrence, Acacia melanoxylon and Eucalyptus
globules). And the Natural forest stand which is located within the plantation forest was taken as a reference for
comparison. For vegetation data collection, as (Dwivedi, 1993) recommended a systematically designed
sampling survey technique of parallel line transect with quadrates method were employed. And as Dagnachew
(2001) tested and recommended the design for such assessment, sample quadrate measuring 10 m by 10 m (100
m2) were laid down at 100 m intervals from each other along the transect lines. And the spacing between two
adjacent transect lines was also 100 m. In each major quadrate plot, one subplot (1 m by 1m) was established.
This subplot was laid at the centre of the major quadrate plots and used to count very small seedlings. As Anne
(2004) suggested, 10 sample quadrates were established for each stand, and a total of 50 sample quadrates were
established. Quadrates were placed more than 50 meters far from the border to avoid edge effect.
Data collection
During field assessment, the quadrates were marked using plastic rope and four wooden pegs. Within the major
quadrate plot, all types of naturally regenerated native plant species encountered were identified and listed. Plant
identification was carried out in the field using identification keys of Useful Trees and Shrubs for Ethiopia
(Azene, et al., 1993; 2007) and Honeybee Flora of Ethiopia (Fichtl and Admassu, 1994). And for species which
were difficult to identify in the field, voucher specimens of the plant were collected and identified in the National
Herbarium of Ethiopia, Addis Ababa University. In counting and measuring, the individual plants were
categorized in to growth stages of Germinant (<0.5 m ht.), seedlings (0.51-1 m ht.), and saplings (i.e. small
Journal of Natural Sciences Research www.iiste.org
ISSN 2224-3186 (Paper) ISSN 2225-0921 (Online)
Vol.4, No.16, 2014
94
saplings of 1.01-2 m, and juveniles of 2.01-3 m ht.) and counted and recorded accordingly. Counting and
measuring of very small/ minute but abundant seedlings was carried out in the subplot. This classification was
used to balance the samples across size classes, because the number of individuals expected to decline with
increasing stem height or diameter size and it helps to see the population structure clearly. The categorization
considers the life form and taxonomic structure of a few of the woody plants.
Methods of Data Analysis
Species Richness ‘S’, Diversity ‘H’’, Evenness ‘E’’, and Status of the Natural Regeneration of native woody
species under each stand, were analyzed using commonly used biodiversity measuring formulas and methods.
And the results were compared between stands to evaluate the condition of regeneration under each stand, and
the similarity ‘JCS’ (Jacard’s Coefficient of Similarity) of the undergrowth between stands were compared.
A computer program, Microsoft Excel, was employed to make computation and analysis for diversity, evenness,
abundance and status of growth and to draw graphs, curves and tables. The measurements and methods
employed in this research are expressed as follows:
The Species richness is measured to know how much number of different kinds of organisms present in each
stand; and from the results to compare between stands species composition. Species richness computed simply
by counting the number of types of native woody species (taxa) regenerated in a stand (S’). And the Margalef
index “R” (Margalef, 1958), were used to compute the species richness for each stand. This index takes the total
observed individuals ‘N’ as one factor in the computation. And the formula is as follows:
R=(S’-1)/LnN ………………………………………………………. (1)
Where, R is Margalef index of species richness;
S’ is number of taxa or species;
N is number of individuals.
Thus, the higher the R index value, the richer is the stand in species.
The diversity of species is computed to know how diverse (in kind and abundance) the species present in each
stand. Or to know how much is the average degree of uncertainty in predicting to what species an individual
chosen at random is from the population of a collection of species. Species diversity is analyzed by using the
most popular of metrics Shannon-Wiener Diversity Index (H’) (Kent and Coker 1994). And the formula is as
follows:
S
H' = − ∑ Pi LnPi ……………………………………… (1)
i=1
Where, H’ is observed diversity;
S is the number of species;
pi is the proportion of the individual species to the total, ni/N (where, ni= the abundance of the
individual species; and N is the total abundance); and
‘Ln’ is Natural Logarithm.
Thus the higher the H’ value, the diverse the undergrowth in the stand.
Evenness is a measure of how similar species are in their abundances (Anne, 2004). And as a heterogeneity
measure, it describes the equitability of species abundance in the community (Dagnachew, 2001 cited Alatalo
1981 and Molinari 1989). Evenness is calculated using Shannon Evenness index (E’) (Krebs, 1989). And the
formula of evenness index is as follows:
E’= H′/H′max or E’=H’/lnS ……………………… (2)
Where, H’ is observed diversity;
H′max is equal to natural logarithm of richness, ln S.
Thus, an assemblage in which most species are equally abundant is one that has high evenness. And it is
conventional to equate high diversity with high evenness (equivalent to low dominance of one or few species)
(Magurran, 2004).
The Density of species expresses how many members of that particular specie are found in the forest. Or it
expresses the abundance of the specie in that forest. And it is computed as the division of the number of plants of
a certain species by the area surveyed expressed in hectare, and the formula is as follows:
Density = total # of stems of the species/ sampled area in ha
The frequency of species (%): expresses how frequent the species is observed in all samples. In other words it
explains its distribution over the forest. And it is derived from the division of the number of quadrates of
occurrence of a species to the total quadrates sampled multiplied by 100. And the formula is:
Frequency %= (# of quadrates with the plant/Total # of quadrates sampled) × 100
To compare the differences in species abundance between stands one of the best known and most informative
Journal of Natural Sciences Research www.iiste.org
ISSN 2224-3186 (Paper) ISSN 2225-0921 (Online)
Vol.4, No.16, 2014
95
methods, the Rank/Abundance Plot (or Dominance/Diversity Curve) or Whittaker plots using Log10 scale
(Krebs, 1989). The rank/abundance using Log10 scale is plotted as a graph. In this graph species are plotted in
sequence from most to least abundant along the horizontal (or x- axis) and their relative abundances are typically
displayed in a log10 format (on the y axis).
These plots are often the best way of illustrating differences in evenness and species richness.
Contrasting patterns of species richness are clearly displayed from the rank. When there are relatively few
species all information concerning their relative abundances is clearly visible, whereas it would be inefficiently
displayed in a histogram format (Wilson 1991). Furthermore, they highlight differences in evenness amongst
assemblages (Nee et al., 1992). And their diversity and Evenness can be identified from their regression slope.
The more the steepness of the regression slope the least diverse and the less even the stand.
The Similarity analysis is used to identify the highly similar and or dissimilar stands in their understory plant
composition. The similarity is analyzed using a statistical measure of similarity Jaccard’s Similarity Coefficient
(JSC) (Krebs 1989). The Jacard index for two sets, set A and set B, is defined as the cardinality of their
intersection divided by the cardinality of their union.
Mathematically,
J(A,B)=[AnB]/[AUB]
The status of natural regeneration of native woody species in a stand or in a forest as a hole can be determined
from population structures. Population structure refers to the distribution of individuals in arbitrarily defined
Diameter or height classes. In this study I follow the height class distribution of regenerates. Then the values
evaluated by using height class histograms, (Height class vs. % proportion of density). The height classes <0.5m
for Germinant, 0.51-1m for seedlings, 0.01-3m for sapling are used. But to see the structure clearly the sapling
class divided in to two, 1.01-2m and 2.01-3m. And from the population structure one of the two types of
regeneration status will be determined: good regeneration status or poor regeneration status. Those Species
which possess high number of individuals in the lower height classes, particularly in the first class, are
considered to have good regeneration potential. Whereas, other species which possess either no or few number
of individuals is in poor regeneration status. From this analysis, the species which show good regeneration or
hampered regeneration status in each stand or for the forest as a hole will be described.
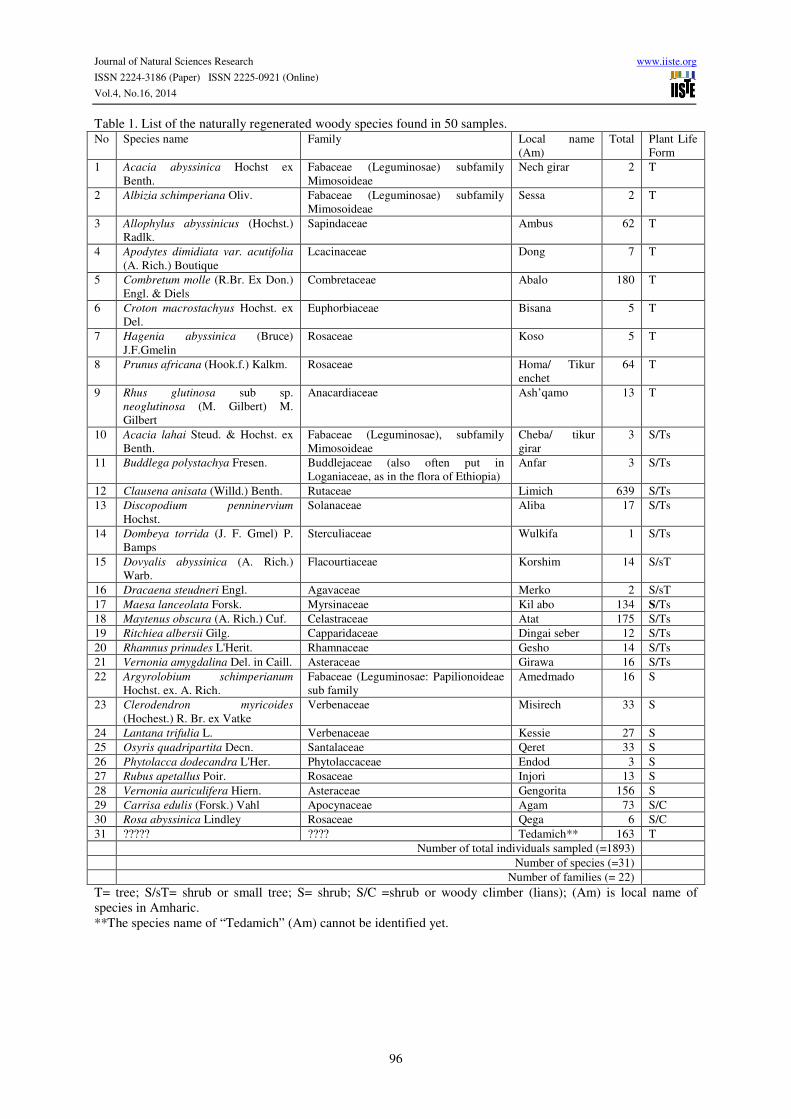
RESULTS AND DISCUSSIONS Floristic composition and richness: List of the naturally regenerated woody species found in a stands of the
plantations and the natural forest stand in Yeraba state forest are described in Table 1. A total of 31 woody
species with 22 families and 1893 individuals as a hole were recorded, in 50 sample quadrates, growing under
plantation stands and in the natural forest stand. Concerning the life form of the plants according to the
classifications of Fichtl and Admassu (1994), among the 31 native woody species recorded 9 species are trees,
12 species are shrubs/small trees, 7 are shrubs, and 2 species are shrub/woody climbers (Table 1).
The type genes /taxa of naturally regenerated native woody species encountered in each stands were
assessed and listed (Table 2). The species composition in different stands ranged from 11 to 27 species. And the
species taxa for each stands is: 19 in Cupressus lusitanica, 15 in Acacia melanoxylon, 15 in Acacia decurence,
11 in Eucalyptus globules and 27 in the Natural forest stands. The highest number of species was found in the
Natural forest stand. Whereas among plantation stands, the highest number of species was recorded in Cup.
lusitanica stand, and the least species are recorded in Euc. Globules stand. And concerning plant families, the
highest 14 recorded under Cup. lusitanica stand and the least is Euc. globules (7 families). The natural forest
stand contained 19 families. Among the 31 identified woody species, 9 species were only recorded in the Natural
forest stand.
Journal of Natural Sciences Research www.iiste.org
ISSN 2224-3186 (Paper) ISSN 2225-0921 (Online)
Vol.4, No.16, 2014
96
Table 1. List of the naturally regenerated woody species found in 50 samples. No Species name Family Local name
(Am)
Total Plant Life
Form
1 Acacia abyssinica Hochst ex
Benth.
Fabaceae (Leguminosae) subfamily
Mimosoideae
Nech girar 2 T
2 Albizia schimperiana Oliv. Fabaceae (Leguminosae) subfamily
Mimosoideae
Sessa 2 T
3 Allophylus abyssinicus (Hochst.)
Radlk.
Sapindaceae Ambus 62 T
4 Apodytes dimidiata var. acutifolia
(A. Rich.) Boutique
Lcacinaceae Dong 7 T
5 Combretum molle (R.Br. Ex Don.)
Engl. & Diels
Combretaceae Abalo 180 T
6 Croton macrostachyus Hochst. ex
Del.
Euphorbiaceae Bisana 5 T
7 Hagenia abyssinica (Bruce)
J.F.Gmelin
Rosaceae Koso 5 T
8 Prunus africana (Hook.f.) Kalkm. Rosaceae Homa/ Tikur
enchet
64 T
9 Rhus glutinosa sub sp.
neoglutinosa (M. Gilbert) M.
Gilbert
Anacardiaceae Ash’qamo 13 T
10 Acacia lahai Steud. & Hochst. ex
Benth.
Fabaceae (Leguminosae), subfamily
Mimosoideae
Cheba/ tikur
girar
3 S/Ts
11 Buddlega polystachya Fresen. Buddlejaceae (also often put in
Loganiaceae, as in the flora of Ethiopia)
Anfar 3 S/Ts
12 Clausena anisata (Willd.) Benth. Rutaceae Limich 639 S/Ts
13 Discopodium penninervium
Hochst.
Solanaceae Aliba 17 S/Ts
14 Dombeya torrida (J. F. Gmel) P.
Bamps
Sterculiaceae Wulkifa 1 S/Ts
15 Dovyalis abyssinica (A. Rich.)
Warb.
Flacourtiaceae Korshim 14 S/sT
16 Dracaena steudneri Engl. Agavaceae Merko 2 S/sT
17 Maesa lanceolata Forsk. Myrsinaceae Kil abo 134 S/Ts
18 Maytenus obscura (A. Rich.) Cuf. Celastraceae Atat 175 S/Ts
19 Ritchiea albersii Gilg. Capparidaceae Dingai seber 12 S/Ts
20 Rhamnus prinudes L'Herit. Rhamnaceae Gesho 14 S/Ts
21 Vernonia amygdalina Del. in Caill. Asteraceae Girawa 16 S/Ts
22 Argyrolobium schimperianum
Hochst. ex. A. Rich.
Fabaceae (Leguminosae: Papilionoideae
sub family
Amedmado 16 S
23 Clerodendron myricoides
(Hochest.) R. Br. ex Vatke
Verbenaceae Misirech 33 S
24 Lantana trifulia L. Verbenaceae Kessie 27 S
25 Osyris quadripartita Decn. Santalaceae Qeret 33 S
26 Phytolacca dodecandra L'Her. Phytolaccaceae Endod 3 S
27 Rubus apetallus Poir. Rosaceae Injori 13 S
28 Vernonia auriculifera Hiern. Asteraceae Gengorita 156 S
29 Carrisa edulis (Forsk.) Vahl Apocynaceae Agam 73 S/C
30 Rosa abyssinica Lindley Rosaceae Qega 6 S/C
31 ????? ???? Tedamich** 163 T
Number of total individuals sampled (=1893)
Number of species (=31)
Number of families (= 22)
T= tree; S/sT= shrub or small tree; S= shrub; S/C =shrub or woody climber (lians); (Am) is local name of
species in Amharic.
**The species name of “Tedamich” (Am) cannot be identified yet.
Journal of Natural Sciences Research www.iiste.org
ISSN 2224-3186 (Paper) ISSN 2225-0921 (Online)
Vol.4, No.16, 2014
97
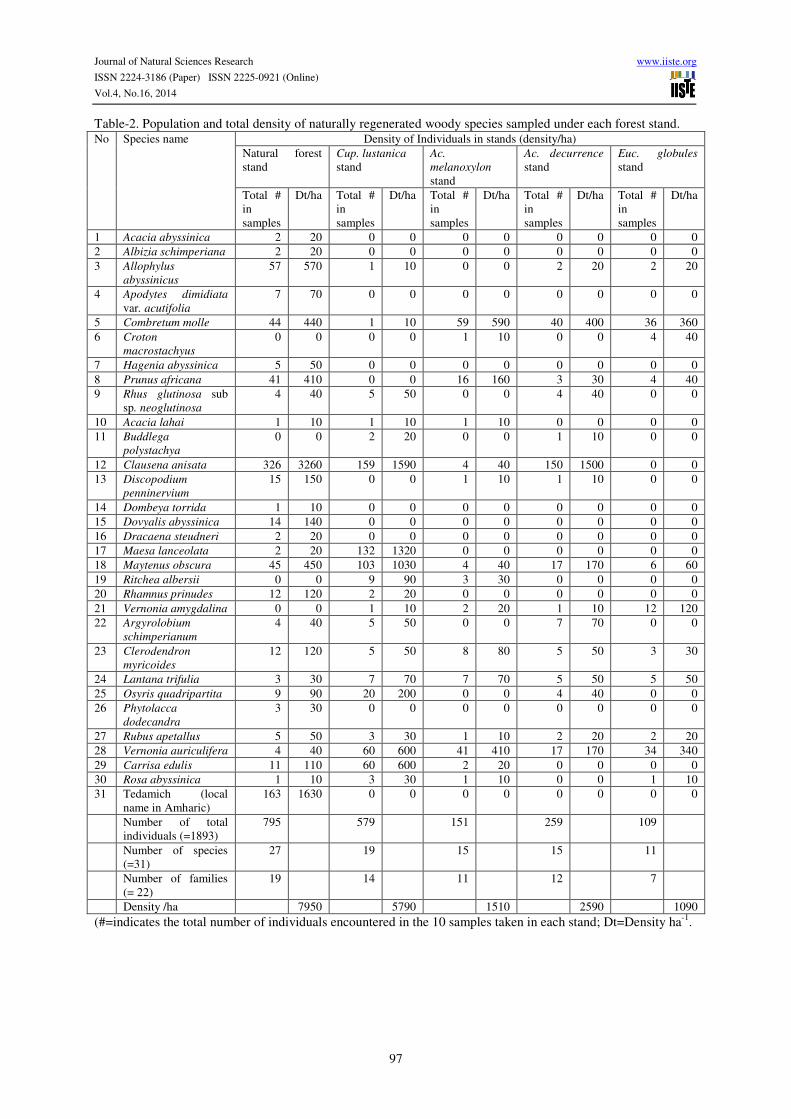
Table-2. Population and total density of naturally regenerated woody species sampled under each forest stand. No Species name Density of Individuals in stands (density/ha)
Natural forest
stand
Cup. lustanica
stand
Ac.
melanoxylon
stand
Ac. decurrence
stand
Euc. globules
stand
Total #
in
samples
Dt/ha Total #
in
samples
Dt/ha Total #
in
samples
Dt/ha Total #
in
samples
Dt/ha Total #
in
samples
Dt/ha
1 Acacia abyssinica 2 20 0 0 0 0 0 0 0 0
2 Albizia schimperiana 2 20 0 0 0 0 0 0 0 0
3 Allophylus
abyssinicus
57 570 1 10 0 0 2 20 2 20
4 Apodytes dimidiata
var. acutifolia
7 70 0 0 0 0 0 0 0 0
5 Combretum molle 44 440 1 10 59 590 40 400 36 360
6 Croton
macrostachyus
0 0 0 0 1 10 0 0 4 40
7 Hagenia abyssinica 5 50 0 0 0 0 0 0 0 0
8 Prunus africana 41 410 0 0 16 160 3 30 4 40
9 Rhus glutinosa sub
sp. neoglutinosa
4 40 5 50 0 0 4 40 0 0
10 Acacia lahai 1 10 1 10 1 10 0 0 0 0
11 Buddlega
polystachya
0 0 2 20 0 0 1 10 0 0
12 Clausena anisata 326 3260 159 1590 4 40 150 1500 0 0
13 Discopodium
penninervium
15 150 0 0 1 10 1 10 0 0
14 Dombeya torrida 1 10 0 0 0 0 0 0 0 0
15 Dovyalis abyssinica 14 140 0 0 0 0 0 0 0 0
16 Dracaena steudneri 2 20 0 0 0 0 0 0 0 0
17 Maesa lanceolata 2 20 132 1320 0 0 0 0 0 0
18 Maytenus obscura 45 450 103 1030 4 40 17 170 6 60
19 Ritchea albersii 0 0 9 90 3 30 0 0 0 0
20 Rhamnus prinudes 12 120 2 20 0 0 0 0 0 0
21 Vernonia amygdalina 0 0 1 10 2 20 1 10 12 120
22 Argyrolobium
schimperianum
4 40 5 50 0 0 7 70 0 0
23 Clerodendron
myricoides
12 120 5 50 8 80 5 50 3 30
24 Lantana trifulia 3 30 7 70 7 70 5 50 5 50
25 Osyris quadripartita 9 90 20 200 0 0 4 40 0 0
26 Phytolacca
dodecandra
3 30 0 0 0 0 0 0 0 0
27 Rubus apetallus 5 50 3 30 1 10 2 20 2 20
28 Vernonia auriculifera 4 40 60 600 41 410 17 170 34 340
29 Carrisa edulis 11 110 60 600 2 20 0 0 0 0
30 Rosa abyssinica 1 10 3 30 1 10 0 0 1 10
31 Tedamich (local
name in Amharic)
163 1630 0 0 0 0 0 0 0 0
Number of total
individuals (=1893)
795 579 151 259 109
Number of species
(=31)
27 19 15 15 11
Number of families
(= 22)
19 14 11 12 7
Density /ha 7950 5790 1510 2590 1090
(#=indicates the total number of individuals encountered in the 10 samples taken in each stand; Dt=Density ha-1
.
Journal of Natural Sciences Research www.iiste.org
ISSN 2224-3186 (Paper) ISSN 2225-0921 (Online)
Vol.4, No.16, 2014
98
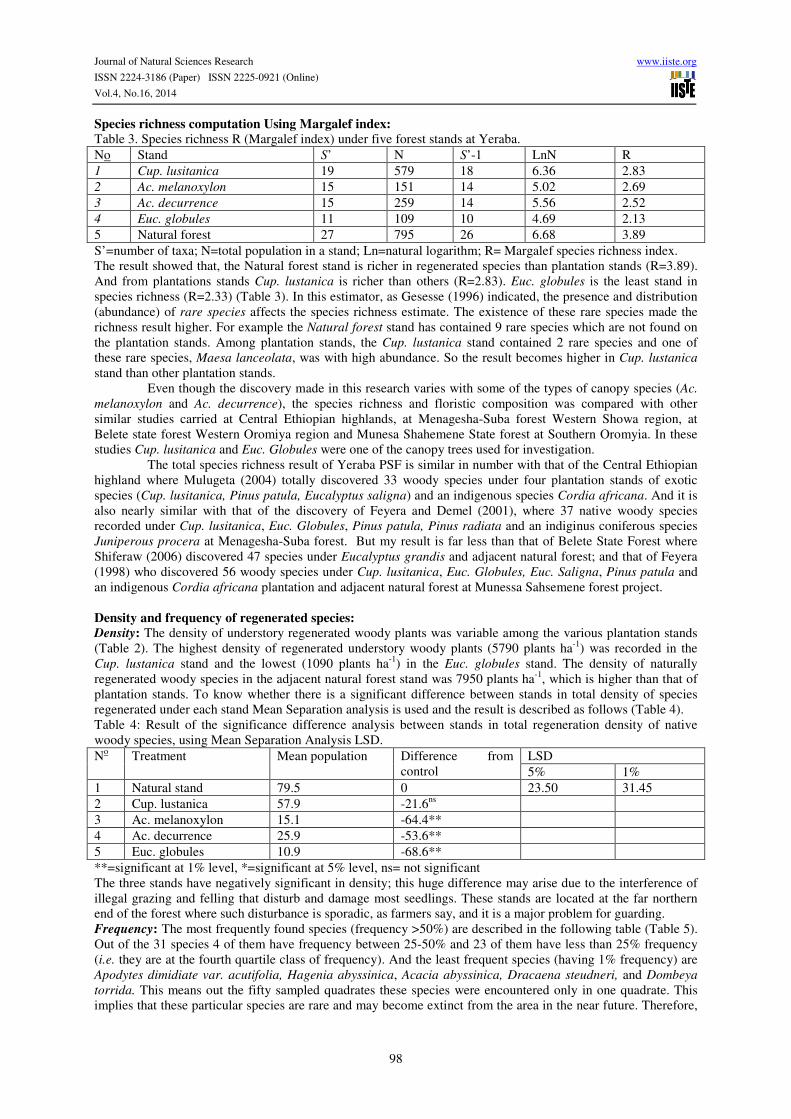
Species richness computation Using Margalef index:
Table 3. Species richness R (Margalef index) under five forest stands at Yeraba.
No Stand S’ N S’-1 LnN R
1 Cup. lusitanica 19 579 18 6.36 2.83
2 Ac. melanoxylon 15 151 14 5.02 2.69
3 Ac. decurrence 15 259 14 5.56 2.52
4 Euc. globules 11 109 10 4.69 2.13
5 Natural forest 27 795 26 6.68 3.89
S’=number of taxa; N=total population in a stand; Ln=natural logarithm; R= Margalef species richness index.
The result showed that, the Natural forest stand is richer in regenerated species than plantation stands (R=3.89).
And from plantations stands Cup. lustanica is richer than others (R=2.83). Euc. globules is the least stand in
species richness (R=2.33) (Table 3). In this estimator, as Gesesse (1996) indicated, the presence and distribution
(abundance) of rare species affects the species richness estimate. The existence of these rare species made the
richness result higher. For example the Natural forest stand has contained 9 rare species which are not found on
the plantation stands. Among plantation stands, the Cup. lustanica stand contained 2 rare species and one of
these rare species, Maesa lanceolata, was with high abundance. So the result becomes higher in Cup. lustanica
stand than other plantation stands.
Even though the discovery made in this research varies with some of the types of canopy species (Ac.
melanoxylon and Ac. decurrence), the species richness and floristic composition was compared with other
similar studies carried at Central Ethiopian highlands, at Menagesha-Suba forest Western Showa region, at
Belete state forest Western Oromiya region and Munesa Shahemene State forest at Southern Oromyia. In these
studies Cup. lusitanica and Euc. Globules were one of the canopy trees used for investigation.
The total species richness result of Yeraba PSF is similar in number with that of the Central Ethiopian
highland where Mulugeta (2004) totally discovered 33 woody species under four plantation stands of exotic
species (Cup. lusitanica, Pinus patula, Eucalyptus saligna) and an indigenous species Cordia africana. And it is
also nearly similar with that of the discovery of Feyera and Demel (2001), where 37 native woody species
recorded under Cup. lusitanica, Euc. Globules, Pinus patula, Pinus radiata and an indiginus coniferous species
Juniperous procera at Menagesha-Suba forest. But my result is far less than that of Belete State Forest where
Shiferaw (2006) discovered 47 species under Eucalyptus grandis and adjacent natural forest; and that of Feyera
(1998) who discovered 56 woody species under Cup. lusitanica, Euc. Globules, Euc. Saligna, Pinus patula and
an indigenous Cordia africana plantation and adjacent natural forest at Munessa Sahsemene forest project.
Density and frequency of regenerated species:
Density: The density of understory regenerated woody plants was variable among the various plantation stands
(Table 2). The highest density of regenerated understory woody plants (5790 plants ha-1
) was recorded in the
Cup. lustanica stand and the lowest (1090 plants ha-1
) in the Euc. globules stand. The density of naturally
regenerated woody species in the adjacent natural forest stand was 7950 plants ha-1
, which is higher than that of
plantation stands. To know whether there is a significant difference between stands in total density of species
regenerated under each stand Mean Separation analysis is used and the result is described as follows (Table 4).
Table 4: Result of the significance difference analysis between stands in total regeneration density of native
woody species, using Mean Separation Analysis LSD.
No Treatment Mean population Difference from
control
LSD
5% 1%
1 Natural stand 79.5 0 23.50 31.45
2 Cup. lustanica 57.9 -21.6ns
3 Ac. melanoxylon 15.1 -64.4**
4 Ac. decurrence 25.9 -53.6**
5 Euc. globules 10.9 -68.6**
**=significant at 1% level, *=significant at 5% level, ns= not significant
The three stands have negatively significant in density; this huge difference may arise due to the interference of
illegal grazing and felling that disturb and damage most seedlings. These stands are located at the far northern
end of the forest where such disturbance is sporadic, as farmers say, and it is a major problem for guarding.
Frequency: The most frequently found species (frequency >50%) are described in the following table (Table 5).
Out of the 31 species 4 of them have frequency between 25-50% and 23 of them have less than 25% frequency
(i.e. they are at the fourth quartile class of frequency). And the least frequent species (having 1% frequency) are
Apodytes dimidiate var. acutifolia, Hagenia abyssinica, Acacia abyssinica, Dracaena steudneri, and Dombeya
torrida. This means out the fifty sampled quadrates these species were encountered only in one quadrate. This
implies that these particular species are rare and may become extinct from the area in the near future. Therefore,
Journal of Natural Sciences Research www.iiste.org
ISSN 2224-3186 (Paper) ISSN 2225-0921 (Online)
Vol.4, No.16, 2014
99
due attention should be given to treat and manage the regeneration of these 23 species as a target to biodiversity
conservation.
Table 5: List of the four most frequently found species (F >50%) in all sampled stands at Yeraba PSF.
No species Local name
(Am)
Total
sampled
# of quadrates with
the plant.* out of
50 sampled plots
Frequency
F (%)
Remark
1 Vernonia auriculifera Gengerita 156 36 72
3 Combretum molle Abalo 180 30 60
2 Maytenus obscura Atat 175 30 60
4 Clausena anisata Limich 639 25 50
*# of quadrates with the plant out of 50 sampled plots.
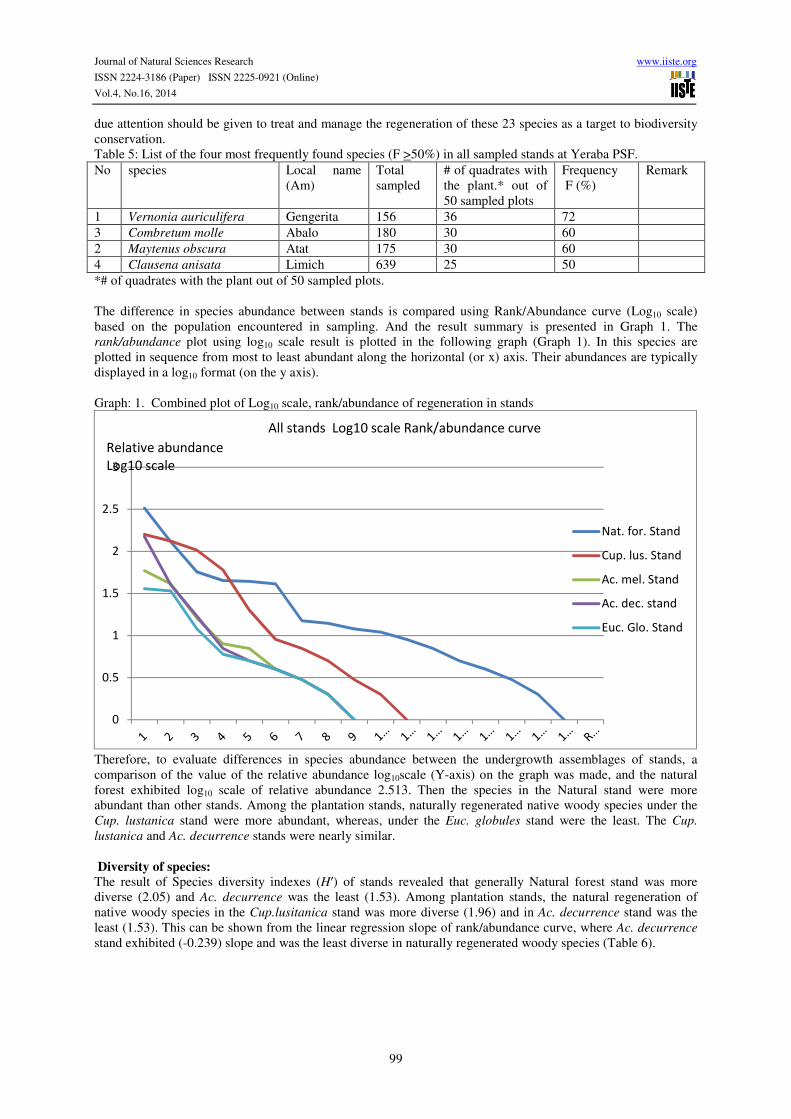
The difference in species abundance between stands is compared using Rank/Abundance curve (Log10 scale)
based on the population encountered in sampling. And the result summary is presented in Graph 1. The
rank/abundance plot using log10 scale result is plotted in the following graph (Graph 1). In this species are
plotted in sequence from most to least abundant along the horizontal (or x) axis. Their abundances are typically
displayed in a log10 format (on the y axis).
Graph: 1. Combined plot of Log10 scale, rank/abundance of regeneration in stands
Therefore, to evaluate differences in species abundance between the undergrowth assemblages of stands, a
comparison of the value of the relative abundance log10scale (Y-axis) on the graph was made, and the natural
forest exhibited log10 scale of relative abundance 2.513. Then the species in the Natural stand were more
abundant than other stands. Among the plantation stands, naturally regenerated native woody species under the
Cup. lustanica stand were more abundant, whereas, under the Euc. globules stand were the least. The Cup.
lustanica and Ac. decurrence stands were nearly similar.
Diversity of species:
The result of Species diversity indexes (H′) of stands revealed that generally Natural forest stand was more
diverse (2.05) and Ac. decurrence was the least (1.53). Among plantation stands, the natural regeneration of
native woody species in the Cup.lusitanica stand was more diverse (1.96) and in Ac. decurrence stand was the
least (1.53). This can be shown from the linear regression slope of rank/abundance curve, where Ac. decurrence
stand exhibited (-0.239) slope and was the least diverse in naturally regenerated woody species (Table 6).
0
0.5
1
1.5
2
2.5
3
Nat. for. Stand
Cup. lus. Stand
Ac. mel. Stand
Ac. dec. stand
Euc. Glo. Stand
All stands Log10 scale Rank/abundance curve
Relative abundance
Log10 scale
Journal of Natural Sciences Research www.iiste.org
ISSN 2224-3186 (Paper) ISSN 2225-0921 (Online)
Vol.4, No.16, 2014
100
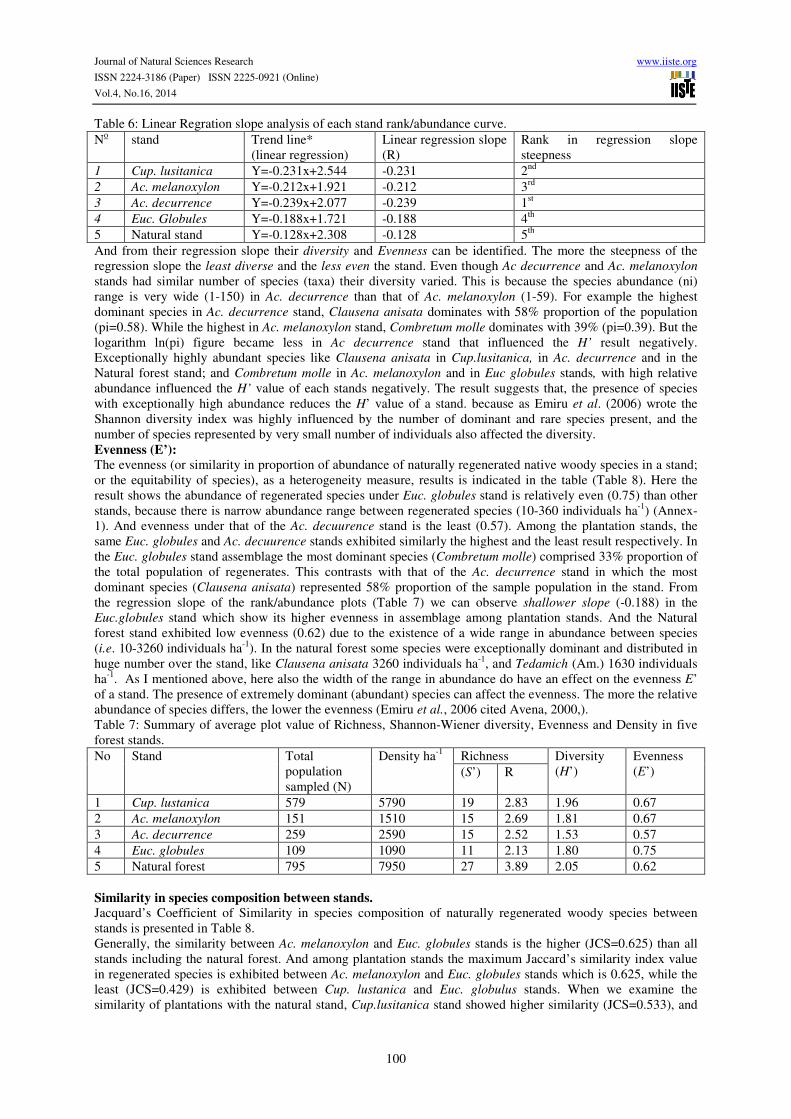
Table 6: Linear Regration slope analysis of each stand rank/abundance curve.
No stand
Trend line*
(linear regression)
Linear regression slope
(R)
Rank in regression slope
steepness
1 Cup. lusitanica Y=-0.231x+2.544 -0.231 2nd
2 Ac. melanoxylon Y=-0.212x+1.921 -0.212 3rd
3 Ac. decurrence Y=-0.239x+2.077 -0.239 1st
4 Euc. Globules Y=-0.188x+1.721 -0.188 4th
5 Natural stand Y=-0.128x+2.308 -0.128 5th
And from their regression slope their diversity and Evenness can be identified. The more the steepness of the
regression slope the least diverse and the less even the stand. Even though Ac decurrence and Ac. melanoxylon
stands had similar number of species (taxa) their diversity varied. This is because the species abundance (ni)
range is very wide (1-150) in Ac. decurrence than that of Ac. melanoxylon (1-59). For example the highest
dominant species in Ac. decurrence stand, Clausena anisata dominates with 58% proportion of the population
(pi=0.58). While the highest in Ac. melanoxylon stand, Combretum molle dominates with 39% (pi=0.39). But the
logarithm ln(pi) figure became less in Ac decurrence stand that influenced the H’ result negatively.
Exceptionally highly abundant species like Clausena anisata in Cup.lusitanica, in Ac. decurrence and in the
Natural forest stand; and Combretum molle in Ac. melanoxylon and in Euc globules stands, with high relative
abundance influenced the H’ value of each stands negatively. The result suggests that, the presence of species
with exceptionally high abundance reduces the H’ value of a stand. because as Emiru et al. (2006) wrote the
Shannon diversity index was highly influenced by the number of dominant and rare species present, and the
number of species represented by very small number of individuals also affected the diversity.
Evenness (E’): The evenness (or similarity in proportion of abundance of naturally regenerated native woody species in a stand;
or the equitability of species), as a heterogeneity measure, results is indicated in the table (Table 8). Here the
result shows the abundance of regenerated species under Euc. globules stand is relatively even (0.75) than other
stands, because there is narrow abundance range between regenerated species (10-360 individuals ha-1
) (Annex-
1). And evenness under that of the Ac. decuurence stand is the least (0.57). Among the plantation stands, the
same Euc. globules and Ac. decuurence stands exhibited similarly the highest and the least result respectively. In
the Euc. globules stand assemblage the most dominant species (Combretum molle) comprised 33% proportion of
the total population of regenerates. This contrasts with that of the Ac. decurrence stand in which the most
dominant species (Clausena anisata) represented 58% proportion of the sample population in the stand. From
the regression slope of the rank/abundance plots (Table 7) we can observe shallower slope (-0.188) in the
Euc.globules stand which show its higher evenness in assemblage among plantation stands. And the Natural
forest stand exhibited low evenness (0.62) due to the existence of a wide range in abundance between species
(i.e. 10-3260 individuals ha-1
). In the natural forest some species were exceptionally dominant and distributed in
huge number over the stand, like Clausena anisata 3260 individuals ha-1
, and Tedamich (Am.) 1630 individuals
ha-1
. As I mentioned above, here also the width of the range in abundance do have an effect on the evenness E’
of a stand. The presence of extremely dominant (abundant) species can affect the evenness. The more the relative
abundance of species differs, the lower the evenness (Emiru et al., 2006 cited Avena, 2000,).
Table 7: Summary of average plot value of Richness, Shannon-Wiener diversity, Evenness and Density in five
forest stands.
No Stand Total
population
sampled (N)
Density ha-1
Richness Diversity
(H’)
Evenness
(E’) (S’) R
1 Cup. lustanica 579 5790 19 2.83 1.96 0.67
2 Ac. melanoxylon 151 1510 15 2.69 1.81 0.67
3 Ac. decurrence 259 2590 15 2.52 1.53 0.57
4 Euc. globules 109 1090 11 2.13 1.80 0.75
5 Natural forest 795 7950 27 3.89 2.05 0.62
Similarity in species composition between stands.
Jacquard’s Coefficient of Similarity in species composition of naturally regenerated woody species between
stands is presented in Table 8.
Generally, the similarity between Ac. melanoxylon and Euc. globules stands is the higher (JCS=0.625) than all
stands including the natural forest. And among plantation stands the maximum Jaccard’s similarity index value
in regenerated species is exhibited between Ac. melanoxylon and Euc. globules stands which is 0.625, while the
least (JCS=0.429) is exhibited between Cup. lustanica and Euc. globulus stands. When we examine the
similarity of plantations with the natural stand, Cup.lusitanica stand showed higher similarity (JCS=0.533), and
Journal of Natural Sciences Research www.iiste.org
ISSN 2224-3186 (Paper) ISSN 2225-0921 (Online)
Vol.4, No.16, 2014
101
Euc. globules show the least (JCS=0.310) (Table 9). The number of common species shared by any two stands
ranged between 8. Table 8: Jaccard’s Coefficient of Similarity in species composition of naturally regenerated
woody species between stands.
stand Cup. lustanica Ac. melanoxylon Ac. deccurence Euc. globulus Natural forest
Cup. lusitanica 1.000 0.545 0.619 0.429 0.533
Ac. melanoxylon 1.000 0.500 0.625 0.400
Ac. deccurence 1.000 0.529 0.448
Euc. globulus 1.000 0.310
Natural forest 1.000
Status of natural regeneration
Forestry literatures’ indicated that “a naturally regenerated stand of trees, even on forests where there is not
human interference, may have thousands of seedlings per hectare in the beginning, the number decreases as the
plants grow, at first rapidly, then more slowly. As plants reach the maturity stage only a few hundred of trees per
hectare are remaining. This continuous decrease in tree number is mostly the result of rigorous natural selection.
Most vigorous or best adapted trees are most likely to survive the intense competition for light, moisture and
nutrients. This process is not entirely a steady and progressive selection of the fittest; at the same time natural
accidents eliminate trees at random (Anna-Lisa, 1981). If there is an additional human interference and
management failure on top of this natural process, things grow worsening for the natural succession through
regeneration. The status of the natural regeneration under the canopies of forests can be revealed from the Height
Class Distribution histograms of the species.
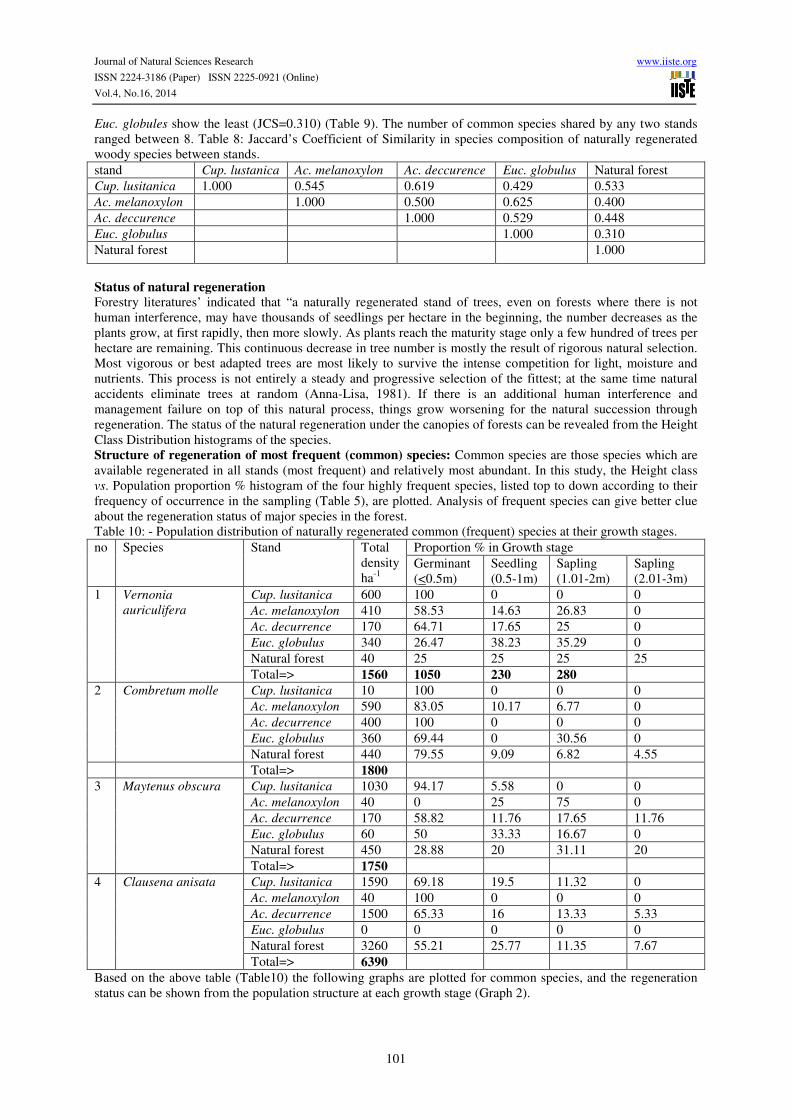
Structure of regeneration of most frequent (common) species: Common species are those species which are
available regenerated in all stands (most frequent) and relatively most abundant. In this study, the Height class
vs. Population proportion % histogram of the four highly frequent species, listed top to down according to their
frequency of occurrence in the sampling (Table 5), are plotted. Analysis of frequent species can give better clue
about the regeneration status of major species in the forest.
Table 10: - Population distribution of naturally regenerated common (frequent) species at their growth stages.
no Species Stand Total
density
ha-1
Proportion % in Growth stage
Germinant
(<0.5m)
Seedling
(0.5-1m)
Sapling
(1.01-2m)
Sapling
(2.01-3m)
1 Vernonia
auriculifera
Cup. lusitanica 600 100 0 0 0
Ac. melanoxylon 410 58.53 14.63 26.83 0
Ac. decurrence 170 64.71 17.65 25 0
Euc. globulus 340 26.47 38.23 35.29 0
Natural forest 40 25 25 25 25
Total=> 1560 1050 230 280
2 Combretum molle Cup. lusitanica 10 100 0 0 0
Ac. melanoxylon 590 83.05 10.17 6.77 0
Ac. decurrence 400 100 0 0 0
Euc. globulus 360 69.44 0 30.56 0
Natural forest 440 79.55 9.09 6.82 4.55
Total=> 1800
3 Maytenus obscura Cup. lusitanica 1030 94.17 5.58 0 0
Ac. melanoxylon 40 0 25 75 0
Ac. decurrence 170 58.82 11.76 17.65 11.76
Euc. globulus 60 50 33.33 16.67 0
Natural forest 450 28.88 20 31.11 20
Total=> 1750
4 Clausena anisata Cup. lusitanica 1590 69.18 19.5 11.32 0
Ac. melanoxylon 40 100 0 0 0
Ac. decurrence 1500 65.33 16 13.33 5.33
Euc. globulus 0 0 0 0 0
Natural forest 3260 55.21 25.77 11.35 7.67
Total=> 6390
Based on the above table (Table10) the following graphs are plotted for common species, and the regeneration
status can be shown from the population structure at each growth stage (Graph 2).

Journal of Natural Sciences Research www.iiste.org
ISSN 2224-3186 (Paper) ISSN 2225-0921 (Online)
Vol.4, No.16, 2014
102
CONCLUSION
The result of this research evidenced that forest plantations can be used to catalyses the regeneration of native
woody species, thereby increasing biological diversity. But there should be seed sources in the vicinity of the
plantations and the area should be protected from grazing and human interference. And appropriate management
of the regeneration is very crucial to maintain succession. The study revealed there is difference in the type of
taxa, diversity, evenness and density of naturally regenerated native species among the plantation stands of
exotic species; this may be due to their crown architecture and density, which is related to the amount of light
passing to the lower floor to enhance regeneration and growth. Some species are rare and may come extinct in
the area, and some others are new in the area. The rarity of species may be due to climate change. As Seppala
et.al. (2009) indicated, narrowly endemic species that are limited by non-climatic factors (e.g. soil conditions)
may be at risk of extinction under climate change.
The new species, as farmers indicated, were known to the local farmers as lowland species “Yekola
tekil” and they were not familiar to this area. This may suggest that the climatic change related to the
environmental disorder may push this species beyond their usual location, or the lower periphery of the Moist
Dega agroclimatic boundary may shifted up to higher altitudes. Seppala et.al (2009) indicated that the
distributional changes of species toward higher latitudes and elevations have been well documented and
correlated with climate warming.
After climate change, dominant endemic species may no longer be adapted to the changed
environmental conditions of their habitat, affording the opportunity for introduced species to invade, and to alter
successional patterns, ecosystem function and resource distribution (Seppala et.al, 2009).
REFERENCES
Anna-Liisa Raunio. 1981a. Teaching Mannual on Silviculture of the Natural Forest. Forestry Resource Institute.
Wondo Genet, Ethiopia.
Anna-Lisa. 1981b. Plantations establishment and maintenance. Personal contact (Lecture Note). Wondo Genet,
Ethiopia.
Anonymus-1. 2010. Ethiopia’s Biodiversity. http://www.google.com/ethiopia/biodiversity. Accessed 21 Aug
2010.
Azene Bekele-Tesemma with A. Barnie and B. Tengnas, 1993. Useful Trees and Shrubs for Ethiopia:
Identification, propagation, management for agricultural and pastoral communities. Regional Soil Conservation
Unit (RSCU) of the Swedish International Development Authority (SIDA), English Press, Nairobi, Kenya.
Azene Bekele-Tesemma. 2007. Useful trees of Ethiopia: identification, propagation and management in 17
Agroecological zones. Nairobi: RELMA in ICRAF Project, 552p.
Dagnachew Gebeyehu. 2001. Sampling strategy for assessment of woody species diversity: a study in Tara
Gedam natural forest, Ethiopia. M.Sc. Thesis, ISSM 1402-201X (2002:56) SLU, Sweden, pp.59
Dwivedi, A. P., 1993. A Text Book of Silviculture. India.
EFAP. 1994. Ethiopian Forestry Action Program. Final report, Vol III – Issues and Actions, Ministry of Natural
Resources Development and Environmental Protection, Addis Ababa.
EMA (Ethiopian Mapping Authority). 1998. National Atlas of Ethiopia. Addis Ababa, Ethiopia, 76 pp.
Emiru Birhane, Demel Teketay and Pia Barklund. 2006. Actual and Potential contribution of exclosures to
enhance biodiversity of woody species in the drylands of Eastern Tigray. Journal of the Drylands 1(2): 134-147.
Enyew Getahun, and Gebeyehu Astatke, 2010. Management Plan of Yeraba Priority State Forest. East Gojam
Zone Agricultural and Rural Development, Natural Resources Development, Conservation and Utilization
Process. Debre Marikos.
Feyera Senbeta. 1998. Native woody species regeneration under the canopies of tree plantations at Munessa
Shashemene Forest Project area, Southern Oromia, Ethiopia. M.sc. Thesis, ISSN 1402-201X (1998:38) SLU,
Sweden. Pp.62.
Feyera Senbeta and Demel Teketay. 2001. Regeneration of indigenous woody species under the canopies of tree
plantations in Central Ethiopia. Tropical Ecology 42 (2): 175-185.
Feyera Senbeta and Demel Teketay, 2002). The potential of tree plantations to foster regeneration of indigenous
woody species in degraded lands of Ethiopia. in: proceedings of the Fourth Annual Conference on “Forests and
Environment”, pp.51-58. Forestry Society of Ethiopia 14-15 january 2002, Addis Ababa. Pp. 137.
Feyera Senbeta and Demil Teketay, 2002a. Soil seed banks in plantations and adjacent natural dry afromontane
forest of central and Southern Ethiopia. Tropical Ecology 43(2): 1-14
Feyera Senbeta, Beck, Erwin and Lüttge, Ulrich. 2002. Exotic trees as nurse-trees for the regeneration of natural
tropical forests. Trees: Structure & Function 16: 245-249.
Fichtl, R. and Admasu Adi. 1994. Honeybee flora of Ethiopia. DED. Weikersheim: Margraf. Pp510. ISBN 3-
8236-1234-4.
Gessesse Dessie. 1996. Comparison of two sampling methods to estimate the density of rare tree species in
Journal of Natural Sciences Research www.iiste.org
ISSN 2224-3186 (Paper) ISSN 2225-0921 (Online)
Vol.4, No.16, 2014
103
Wondo Genet. Ethiopia. M.Sc. Thesis. International Institute for Aerospace Survey and Earth Sciences (ITC).
The Netherlands. Pp 94.
IBC. 2005. National Biodiversity Strategy and Action Plan. Government of the Federal Democratic Republic of
Ethiopia. Addis Ababa, Ethiopia.
Kent M, Coker P. 1994. Vegetation description and analysis: a practical approach. England: John Wiley and
Sons, 363pp
Krebs, C.J, 1989. Ecological Methodology. Harper and Row Cop., New York.
Magurran, Anne E., 2004. Measuring Biological Diversity. Blackwell Science ltd. USA.256p.
Margalef, R., 1958. Information theory in Ecology, Genetic and Systematic, 3: 36-71.
Mark MacLachlan, Getachew Eshete and Tafere Fentahun. 2002. Manual of highland Ethiopian trees and
shrubs. Prepared for development agents of ‘Dega’ areas in Region 3. SIM Forestry Study Project, Region 3,
Ethiopia. pp465.
Mulugeta Limenih, 2004. Effects of Land Use Changes on Soil Quality and Native Flora Degradation and
Restoration in the Highlands of Ethiopia. Ph.D Dissertation, Swedish University of Agricultural Sciences,
Uppsala, Sweden.pp 64.
Seppala, R., Alexander Buck and Pia Katila (eds.). 2009. Adaptation of Forest and People to Climate Change. A
Global Assessment Report. IUFRO World Series Volume 22. Helsinki. 224p.
Shiferaw Alem, 2006. Regeneration of Indiginous Woody Plants, Status of Soil Fertility and Quality of Coffe
found in an Eucalyptus grandis Plantation and The adjacent Natural Forest in Southwestern Ethiopia. MSc
Thesis, Addis Ababa University. Ethiopia. PP.53
Sjoholm, Hakan. 1989. Community Forestry in Ethiopia. Guideline. Community Forestry and Soil Conservation
Development Department (CFSCDD), Minstry of Agriculture, Ethiopia.

The IISTE is a pioneer in the Open-Access hosting service and academic event
management. The aim of the firm is Accelerating Global Knowledge Sharing.
More information about the firm can be found on the homepage:
http://www.iiste.org
CALL FOR JOURNAL PAPERS
There are more than 30 peer-reviewed academic journals hosted under the hosting
platform.
Prospective authors of journals can find the submission instruction on the
following page: http://www.iiste.org/journals/ All the journals articles are available
online to the readers all over the world without financial, legal, or technical barriers
other than those inseparable from gaining access to the internet itself. Paper version
of the journals is also available upon request of readers and authors.
MORE RESOURCES
Book publication information: http://www.iiste.org/book/
IISTE Knowledge Sharing Partners
EBSCO, Index Copernicus, Ulrich's Periodicals Directory, JournalTOCS, PKP Open
Archives Harvester, Bielefeld Academic Search Engine, Elektronische
Zeitschriftenbibliothek EZB, Open J-Gate, OCLC WorldCat, Universe Digtial
Library , NewJour, Google Scholar