status report newsletter, vol. 56, no. 1, february 26, 2021
TRANSCRIPT
Insurance Institute for Highway Safety | Highway Loss Data Institute Vol. 56, No. 1 February 26, 2021
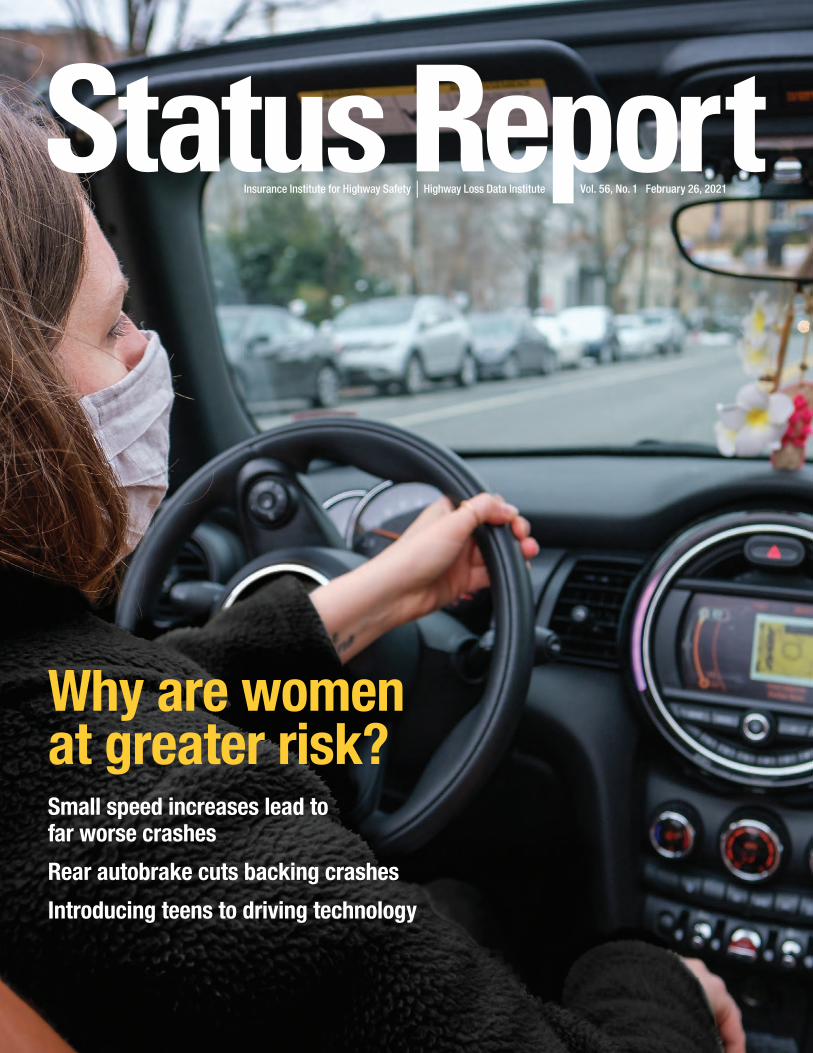
Why are women at greater risk?Small speed increases lead to far worse crashes
Rear autobrake cuts backing crashes
Introducing teens to driving technology
Status Report

2 | Status Report — Vol. 56, No. 1
Vehicle choice, crash differences help explain why women face greater injury risks
Women are much more likely than men to suffer a serious injury when they are in-volved in a crash, but much of the height-ened risk is related to the types of vehicles women drive and the circumstances of their crashes, rather than physical differences, new research from IIHS shows.
“Our study shows that today’s crash test-ing programs have helped women as much as men,” says Jessica Jermakian, IIHS vice president of vehicle research and one of the study’s authors. “That said, we found that women are substantially more likely to suffer leg injuries, which is something that will require more investigation.”
ROAD IIHS RESEARCH
“Injury risks and crashworthiness benefits for females and males: Which differences are physiological?” by M.L. Brumbelow and J.S. Jermakian
To request this paper, email [email protected].
Though men are involved in more fatal crashes than women, on a per-crash basis women are 20-28 percent more likely than men to be killed and 37-73 percent more likely to be seriously injured after adjusting for speed and other factors. However, when IIHS researchers limited the comparison to similar crashes, they found those discrepan-cies mostly disappeared and that crashwor-thiness improvements have benefited men and women more or less equally.
“The numbers indicate that women more often drive smaller, lighter cars and that they’re more likely than men to be driving the struck vehicle in side-impact

February 26, 2021 | 3
and front-into-rear crashes,” says Jer-makian. “Once you account for that, the difference in the odds of most injuries nar-rows dramatically.”
Recently, the discrepancy in injury risk for men and women has prompted calls for new crash test dummies that better re-flect how women’s bodies react to the forces of collisions and other changes to crash-test-ing programs.
In a 2019 article, Consumer Reports argued that the absence of a dummy that represents an average adult female has had “deadly consequences.” The same year, author Caroline Criado Perez flagged the issue in her book Invisible Women: Data Bias in a World Designed for Men, prompting many newspaper articles on the subject.
With this new study, IIHS sought to shed more light on the issue and to see what kind of changes to its vehicle testing program might be warranted.
The researchers analyzed the injuries of men and women in police-reported tow-away front and side crashes from 1998-2015.
In front crashes, they found women were 3 times as likely to experience a moderate injury such as a broken bone or concussion and twice as likely to suffer a serious one like a collapsed lung or traumatic brain injury. In side crashes, the odds of a moderate injury were about equal for men and women, while women were about 50 percent more likely to be seriously injured, but neither of those re-sults was statistically significant.
To determine how much of the discrepan-cy was due to physical differences between
men and women, the researchers then re-peated the analysis with a limited set of “compatible” front crashes. This subset was restricted to single-vehicle crashes and two-vehicle crashes in which the vehicles were a similar size or weight or the crash configu-ration was such that a size or weight differ-ence would not have played a big role. To further reduce differences among crashes, only those with a front airbag deployment were included.
The sample included too few cases to do the same thing with side crashes.
Limiting the analysis to compatible front impacts flattened the disparity considerably, though women were still twice as likely to be moderately injured and a bit more likely to be seriously hurt.
A further analysis of those crashes, as well as the unrestricted set of side crashes, showed that good ratings in the Institute’s moderate overlap front and side tests low-ered the odds of most injuries more or less equally for both sexes. In the compatible front crashes, the benefits of a good rating in the moderate overlap front test were greater for women except in the case of leg injuries, where the benefit was similar. In the side-impact crashes, a good rating in the side test benefited men and women about equal-ly where moderate injuries were concerned, but the benefits of a more crashworthy vehi-cle were greater for women for most types of serious injuries.
These results are in line with previous re-search that shows serious and fatal injury risk has declined more for women than men as vehicles have gotten safer.
One explanation of the higher injury rates for women could be vehicle choice. Men and women crashed in minivans and SUVs in about equal proportions. However, around 70 percent of women crashed in cars, com-pared with about 60 percent of men. More than 20 percent of men crashed in pickups, compared with less than 5 percent of women. Within vehicle classes, men also tended to crash in heavier vehicles. Larger, heavier ve-hicles provide more protection in crashes than smaller, lighter ones, so both differenc-es mean women are exposed to greater risk.
In a separate analysis of data from the fed-eral Fatality Analysis Reporting System, the researchers also found that in two-vehicle front-to-rear and front-to-side crashes, men are more likely to be driving the striking ve-hicle. Because the driver of the striking ve-hicle is at lower risk of injury than the struck vehicle in such crashes, this could also ac-count for some of the differences in crash outcomes for men and women.
The researchers’ analysis of compatible front crashes did show some sex-related dif-ferences, however. Women were still more than 2½ times as likely to suffer moderate leg injuries. They were also about 70 percent more likely than men to suffer serious leg injuries, though that figure wasn’t statistical-ly significant.
“The good news is that changes like strengthening the occupant compartment and improving seat belts and airbags have helped protect both men and women,” says Jermakian. “Homing in on the risk dispari-ties that still exist in compatible crashes gives us an opportunity to make further gains.” n
Female injury risk relative to males
Moderate Serious Moderate Serious
Head,neck,torsoand
pelvisinjuriesLeg/foot
injuries
+70%+31%*
+338%
+172%
+72%*+74%* +71%-2%*
* not statistically significant
ALL FRONT CRASHES
CONTROLLING FOR VEHICLEAND CRASH DIFFERENCES
* not statistically significant
ALL FRONT CRASHES
CONTROLLING FOR VEHICLEAND CRASH DIFFERENCES

4 | Status Report — Vol. 56, No. 1
Crash tests show how higher speeds undermine advances in crash protection
ROAD IIHS RESEARCH
“Impact of speeds on drivers and vehicles — results from crash tests” by W. Kim et al.
To request this paper, email [email protected].
Drivers want to save time, and local trans-portation agencies want to improve traffic flow, but at what cost? With posted speed limits increasing on roadways around the country, a vehicle’s ability to protect drivers in crashes is in doubt.
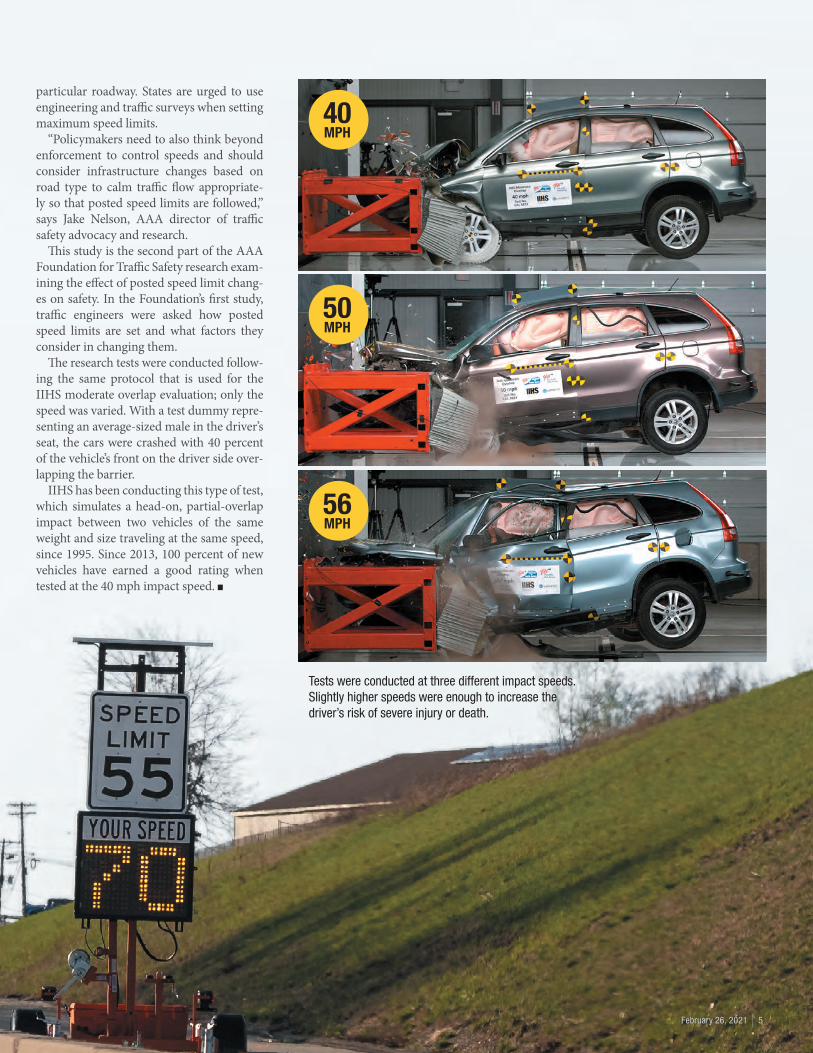
Small speed increases can have huge ef-fects on crash outcomes, as shown in new crash tests by the AAA Foundation for Traf-fic Safety, IIHS and Humanetics. The safety organizations conducted crashes at three different impact speeds (40, 50 and 56 mph). They found the slightly higher speeds were enough to increase the driver’s risk of severe injury or death.
Drivers often travel faster than posted speed limits, but when officials raise limits to match travel speeds, people still go faster. Today, 41 states allow speeds of 70 mph or higher on some roadways. Of those, eight states have maximum speeds of 80 mph or more. A 2019 IIHS study found that rising speed limits have cost nearly 37,000 lives over 25 years. AAA and IIHS urge pol-icymakers to factor in this danger from higher speeds when considering speed limit changes.
“We conducted these crash tests to assess the effect of speeds on drivers and learned that a small increase could make a big differ-ence on the harm to a human body,” says Dr. David Yang, executive director of the AAA Foundation for Traffic Safety. “A speeding driver may arrive at their destination a few
minutes faster, but is the trade-off of get-ting severely injured or even losing one’s life worth it if a crash occurs?”
The AAA Foundation collaborated with IIHS and Humanetics, the leading manufac-turer of biofidelic crash test dummies, to ex-amine how speed affects the likelihood and severity of occupant injury in a crash. Three 2010 Honda CR-V EX crossovers were used because they represented the average age (11.8 years) of a typical vehicle on U.S. road-ways and earned the top rating in the IIHS moderate overlap front test. Calspan Corpo-ration conducted all the tests in its crash lab-oratory in Buffalo, New York.
As the crash speed increased in the tests, re-searchers found more structural damage and greater forces on the dummy’s entire body.
“Higher speed limits cancel out the ben-efits of vehicle safety improvements like air-bags and improved structural designs,” says Dr. David Harkey, IIHS president. “The faster a driver is going before a crash, the less likely it is that they’ll be able to get down to a survivable speed even if they have a chance to brake before impact.”
At the 40 mph impact speed, there was minimal intrusion into the driver’s space. But at the 50 mph impact speed, there was noticeable deformation of the driver side door opening, dashboard and foot area. At 56 mph, the vehicle interior was significant-ly compromised, with the dummy’s sen-sors registering severe neck injuries and a
likelihood of fractures to the long bones in the lower leg.
“Our crash test dummies are instrument-ed with hundreds of sensors to measure the injury risk so that we understand the sci-entific limits of safety and injury preven-tion. Understanding that the risk of serious and permanent injury becomes significant-ly higher in crashes beyond statutory speed limits clearly demonstrates why there are limits in the first place,” says Jack Jensen, vice president of engineering at Humanetics.
At both 50 and 56 mph, the steering wheel’s upward movement caused the dum-my’s head to go through the deployed airbag. This caused the face to smash into the steer-ing wheel. Measurements taken from the dummy showed a high risk of facial frac-tures and severe brain injury.
When correctly set and enforced, speed limits improve traffic flow and maximize all public road users’ safety.
“Cars are safer than they’ve ever been, but nobody’s figured out how to make them defy the laws of physics,” says Harkey of IIHS. “Rather than raising speed limits, states should vigorously enforce the limits they have. This includes using proven coun-termeasures like high-visibility enforcement and carefully implemented speed-camera programs to consistently and equitably en-force speed limits 24/7.”
Speed limits should not be raised or low-ered only to manipulate traffic volume on a
February 26, 2021 | 5
Tests were conducted at three different impact speeds. Slightly higher speeds were enough to increase the driver’s risk of severe injury or death.
particular roadway. States are urged to use engineering and traffic surveys when setting maximum speed limits.
“Policymakers need to also think beyond enforcement to control speeds and should consider infrastructure changes based on road type to calm traffic flow appropriate-ly so that posted speed limits are followed,” says Jake Nelson, AAA director of traffic safety advocacy and research.
This study is the second part of the AAA Foundation for Traffic Safety research exam-ining the effect of posted speed limit chang-es on safety. In the Foundation’s first study, traffic engineers were asked how posted speed limits are set and what factors they consider in changing them.
The research tests were conducted follow-ing the same protocol that is used for the IIHS moderate overlap evaluation; only the speed was varied. With a test dummy repre-senting an average-sized male in the driver’s seat, the cars were crashed with 40 percent of the vehicle’s front on the driver side over-lapping the barrier.
IIHS has been conducting this type of test, which simulates a head-on, partial-overlap impact between two vehicles of the same weight and size traveling at the same speed, since 1995. Since 2013, 100 percent of new vehicles have earned a good rating when tested at the 40 mph impact speed. n
40MPH
50MPH
56MPH

6 | Status Report — Vol. 56, No. 1
Evidence mounts for effectiveness of rear autobrake
ROAD HLDI RESEARCH
“Compendium of HLDI collision avoidance research” HLDI Bulletin Vol. 37, No. 12: December 2020
To request this paper, email [email protected].
Front automatic emergency braking (AEB) systems have great-er potential to save lives, but rear AEB is saving drivers the hassle and expense of many a fender bender, an updated analysis from HLDI shows.
Rear AEB was the standout feature in HLDI’s annual compilation of its research on the impact of crash avoidance technologies.
The updated rear AEB analysis adds insurance data for model year 2015-18 Subaru vehicles with and without the feature to an earlier analysis of 2014-15 General Motors vehicles. The researchers found that vehicles equipped with rear AEB had 28 percent fewer property damage liability claims and 10 percent fewer collision claims across the two manufacturers.
Collision insurance covers damage to the insured driver’s vehicle, while property damage liability insurance covers damage to the other vehicle involved in a crash when the insured driver is at fault.
“We haven’t seen that kind of reduction in claims for vehicle and other property damage from any other advanced driver assistance system,” says HLDI Senior Vice President Matt Moore.
The impact of rear AEB on injury crashes was relatively small, which makes sense based on the type of crashes the technology is de-signed to avoid.
“Backing crashes generally happen at lower speeds than front-to-rear crashes,” Moore says. “That means they’re less dangerous, but the costs from vehicle damage can add up.”
Low-speed backing crashes represent a substantial portion of in-surance claims, a separate HLDI analysis that looked at the point of impact of crashes found. Collision claims with rear damage of less than $2,000 accounted for 17 percent of all collision claims and over $8 billion in estimated damage during calendar years 2010–17.
In comparison, HLDI has found that front AEB reduces the fre-quency of collision claims by 3 percent and property damage liabil-ity claims by 14 percent. However, it slashes the frequency of bodily injury liability claims, which are for injuries that at-fault drivers in-flict on occupants of other vehicles or others on the road, by nearly a quarter.
A similar study of police-reported crashes by IIHS found that the technology reduced front-to-rear crashes by 50 percent.
Both front and rear AEB use sensors like cameras or radar to detect when the vehicle is getting too close to an obstacle and auto-matically apply the brakes to avoid or mitigate collisions. IIHS tests and rates both systems. Only front crash prevention performance is a criterion for the Institute’s TOP SAFETY PICK and TOP SAFETY PICK+ awards.
Effect of crash avoidance features on insurance claim rates
HLDI also found that two other features designed to prevent back-ing crashes, parking sensors and rear cameras, which are both more common than rear AEB, were much less effective. Data from seven other manufacturers showed that rear cameras reduced the fre-quency of property damage liability claims by 5 percent and actually increased the frequency of collision claims slightly, though that in-crease was not statistically significant. Parking sensors also reduced the frequency of property damage liability claims by 5 percent and reduced the frequency of collision claims by 1 percent.
“Claims data show that collision avoidance technologies that auto-matically intervene to prevent or mitigate crashes are more effective than warning-based systems,” says Moore, noting that forward colli-sion warning is also associated with smaller claims reductions than front AEB.
Aside from rear AEB, front AEB and forward collision warning are the only stand-alone driver assistance features analyzed by HLDI that show double-digit percent reductions in claim frequency under any type of coverage. n
CollisionProperty damage liabilityBodily injury
Medical paymentPersonal injury protectionStatistically significant
Forward collisionwarning
FrontAEB
RearAEB
Parkingsensors
Rearcamera
-30%
-25%
-20%
-15%
-10%
-5%
0%
5%

February 26, 2021 | 7
Parents worry vehicle tech might prevent teens from mastering the basics
ROAD IIHS RESEARCH
“Learning to drive: parental attitudes toward introducing teen drivers to advanced driver assistance systems” by R.A. Weast, A.S. Mueller and K. Kolodge
To request this paper, email [email protected].
Advanced driver assistance features have the potential to improve safety for young, novice drivers, but parents have mixed opinions about how to introduce such tech-nologies to their teenagers, a new study from IIHS shows.
“Parents who have used advanced driv-ing assistance features with their teens worry that things like blind spot monitor-ing or lane departure warning systems could prevent them from learning the basics of driving, but they’re also aware those same features might save them from a crash,” says IIHS Research Scientist Rebecca Weast, the lead author of the study.
Teenage drivers are 3 times as likely as those 20 or older to be involved in a fatal crash. Those deaths are often the result of single-vehicle crashes caused by speed-ing or other errors that cause the driver to lose control.
Because teens most often drive older, cheaper vehicles, they’re also less likely to benefit from proven crash prevention tech-nologies like automatic emergency braking (AEB) — which is expected to be installed in less than a quarter of the vehicles on U.S. roads by 2023 despite a major push from manufacturers. But AEB and other features like blind spot monitoring systems and sen-sors that warn the driver when the vehicle is drifting out of its lane are becoming more and more common on the cars that their parents drive and they learn on.
To explore how parents feel about these technologies, IIHS worked with J.D. Power to conduct three focus groups. The discus-sions involved a total of 21 parents who had used a vehicle equipped with at least four common driver assistance features to teach their teens to drive. These common features included blind spot monitoring, forward collision warning, front or rear AEB, lane departure warning and lane departure pre-vention — which steers the vehicle back on
course when it drifts out of its lane. While many parents said they believe these fea-tures provide some safety benefits, they were divided about when and how they should be used during the process of learning to drive.
“Those features make driving safer, but they don’t make you a safer driver,” said one parent.
“Say my teen is driving in a car with all those features engaged [and] that’s what they get used to. Then they go out and buy their own car, and it’s got none of those fea-tures. That would be really scary for me.”
Overall, the parents expressed doubts about the technology more often than strong faith in its effectiveness. Some com-plained that the beeps and buzzes and warn-ing lights could themselves be distracting, or that systems that momentarily take over the steering wheel to prevent lane departures could startle their teen into overreacting.
However, others were optimistic that the technologies could give fearful teens the confidence to learn. A few used the system alerts to help monitor the teen’s driving and give immediate feedback about unsafe ma-neuvers. AEB had already helped another parent’s teen avoid a crash.
Parents’ opinions were split about wheth-er new drivers should be introduced to the driving assistance features at the begin-ning of the learning process or after they’d learned some of the basic skills. “I’m train-ing my daughter to use all the technolo-gy that’s available with the car,” said a third parent, adding that young people are often more tech-savvy than older adults. “If it’s there, why not?”
The study did not include parents who had decided not to use these features at all during the learning process. However, some said they turned the features off after exper-imenting with them during driving prac-tice to ensure their child didn’t use them as a crutch. These parents said they would later incorporate them into their sessions, since such technology was only going to become more common.
“More research is needed to determine what role these features should play in learn-ing to drive and how to ensure new driv-ers use these features properly,” says Weast. “That’s complicated because owners of vehi-cles with advanced driver assistance systems often themselves don’t understand their ca-pabilities and limitations.” n

MEMBER GROUPSAcceptance InsuranceAcuity InsuranceAllstate Insurance GroupAmericanAgAmerican Family InsuranceAmerican NationalAmica Mutual Insurance CompanyAuto Club EnterprisesAuto Club GroupAuto-Owners InsuranceCelina Insurance GroupCHUBBColorado Farm Bureau Insurance CompanyCommonwealth Casualty CompanyConcord Group InsuranceCONNECT, powered by American Family InsuranceCooperators Financial Services LimitedCOUNTRY FinancialCSAA Insurance GroupCSE Insurance GroupDesjardins InsuranceDonegal Insurance GroupDTRIC InsuranceECM Insurance GroupElephant Insurance CompanyEMC Insurance GroupEncova InsuranceErie Insurance GroupEsuranceFarm Bureau Financial ServicesFarm Bureau Insurance Company of MichiganFarm Bureau Insurance of TennesseeFarm Bureau Mutual Insurance Company of IdahoFarmers Insurance GroupFarmers Mutual of NebraskaFlorida Farm Bureau Insurance CompaniesFrankenmuth InsuranceGainsco InsuranceGEICO CorporationThe General InsuranceGeorgia Farm Bureau Mutual Insurance CompanyGoodville Mutual Casualty CompanyGrange InsuranceGrinnell MutualHallmark Financial Services, Inc.The Hanover Insurance GroupThe HartfordHaulers Insurance Company, Inc.Horace Mann Insurance CompaniesImperial Fire & Casualty Insurance CompanyIndiana Farm Bureau InsuranceIndiana Farmers InsuranceInfinity Property & CasualtyKemper CorporationKentucky Farm Bureau Mutual Insurance CompaniesLiberty Mutual InsuranceLouisiana Farm Bureau Insurance CompanyMain Street America InsuranceMAPFRE Insurance Group
Mercury Insurance GroupMetLifeMetromileMississippi Farm Bureau Casualty Insurance CompanyMMG InsuranceMunich Reinsurance America, Inc.Mutual Benefit Group®
Mutual of Enumclaw Insurance CompanyNationwideNJM Insurance GroupNodak Insurance CompanyThe Norfolk & Dedham Group®
North Carolina Farm Bureau Mutual Insurance CompanyNorth Star Mutual Insurance CompanyNorthern Neck Insurance CompanyNYCM InsuranceOhio Mutual Insurance GroupOregon Mutual Insurance CompanyPEMCO Mutual Insurance CompanyPlymouth Rock AssuranceProgressive InsurancePURE InsuranceQualitas Insurance CompanyRedpoint County Mutual Insurance CompanyThe Responsive Auto Insurance CompanyRider InsuranceRockingham InsuranceRoot Insurance CoRSA CanadaSafe Auto Insurance CompanySafeco Insurance®
Samsung Fire & Marine Insurance CompanySay InsuranceSECURA InsuranceSelective Insurance Company of AmericaSentry InsuranceShelter Insurance®
Sompo InternationalSouth Carolina Farm Bureau Mutual Insurance Company®
Southern Farm Bureau Casualty Insurance CompanyState Auto Insurance CompaniesState Farm Insurance CompaniesStillwater Insurance GroupSwiss Reinsurance Company LtdTexas Farm Bureau InsuranceThe Travelers Companies, Inc.USAAVirginia Farm Bureau Mutual InsuranceWest Bend Mutual Insurance CompanyWestfield
FUNDING ASSOCIATIONSAmerican Property Casualty Insurance AssociationNational Association of Mutual Insurance Companies
Status ReportVol. 56, No. 1 | February 26, 2021
Editor: Sarah Karush
Writer: Jason Overdorf
Creative Director: Leslie Oakey
Photographers: Craig Garrett and Vladimir Shutov
Inquiries/print subscriptions: [email protected]
Copy may be republished with attribution. Images require permission to use.
IIHS is an independent, nonprofit scientific and educational organization dedicated to reducing the losses — deaths, injuries and property damage — from motor vehicle crashes.
HLDI shares and supports this mission through scientific studies of insurance data represent-ing the human and economic losses resulting from the ownership and operation of different types of vehicles and by publishing insurance loss results by vehicle make and model.
Both organizations are wholly supported by auto insurers and insurance associations.
iihs.org
facebook /iihs.org
twitter @IIHS_autosafety
instagram @iihs_autosafety
youtube IIHS
Insurance Institute for Highway Safety Highway Loss Data Institute 4121 Wilson Boulevard, 6th floor Arlington, VA 22203
IIHS-HLDI Vehicle Research Center 988 Dairy Road Ruckersville, VA 22968