status report on the medicare prescription drug program ... · 384 status report on the medicare...
TRANSCRIPT
Status report on the Medicare prescription drug program (Part D)
C H A P T E R14

383 Repo r t t o t h e Cong r e s s : Med i ca r e Paymen t P o l i c y | Ma r ch 2017
Status report on the Medicare prescription drug program (Part D)
C H A P T E R 14Chapter summary
In 2015, Medicare spent $80.1 billion for the Part D benefit, accounting for 12
percent of total Medicare outlays. Enrollees’ out-of-pocket (OOP) spending
for premiums and cost sharing totaled $11.5 billion and $15.1 billion,
respectively. In 2016, 41 million individuals (72 percent of all Medicare
beneficiaries) were enrolled in Part D: Of those enrolled, 60 percent were in
stand-alone prescription drug plans (PDPs) and 40 percent were in Medicare
Advantage–Prescription Drug plans (MA–PDs). In general, Part D has
improved Medicare beneficiaries’ access to prescription drugs, with plans
available to all individuals.
Each year, the Commission provides a status report on the Medicare
prescription drug benefit established under Part D that describes beneficiaries’
access to prescription drugs: enrollment levels, plan benefit designs, and the
quality of Part D services. The report also analyzes changes in plan bids,
premiums, and program costs.
Last year, we noted concern that a growing share of Part D program
spending has been for high-cost enrollees—beneficiaries who reach the
catastrophic phase of Part D’s benefit. This year’s status report provides
evidence that this trend has continued, and we point to factors that contribute
toward greater catastrophic-phase spending. The Commission’s June 2016
recommendations addressed concerns about Part D’s financial sustainability
In this chapter
• Enrollment, plan choices in 2016, and benefit offerings for 2017
• Market structure of plan sponsors
• Strategies for controlling growth in plan premiums
• Drug pricing
• Program costs
• Beneficiaries’ access to prescription drugs
• Quality in Part D
384 S ta tus repor t on the Medicare presc r ip t ion drug program (Par t D )
and affordability for its enrollees while maintaining the program’s market-based
approach.
Medicare beneficiaries’ drug coverage in 2016 and benefit offerings for 2017—
Among the 41 million Part D enrollees in 2016, 12 million received the low-income
subsidy (LIS). Nearly 2 million additional individuals (3 percent of all beneficiaries)
received drug coverage through employer-sponsored plans that receive Medicare’s
retiree drug subsidy. In 2013, the latest year of available survey data, 12 percent
of beneficiaries had no drug coverage or coverage less generous than Part D. Our
previous analysis showed that beneficiaries with no creditable coverage tended to be
healthier, on average.
In 2017, plan sponsors are offering 746 PDPs, a 16 percent decrease from 2016, and
1,734 MA–PDs, a 3 percent increase from 2016. PDP reductions reflect mergers
and acquisitions among plan sponsors as well as consolidation of plan offerings
into fewer, more widely differentiated products. Even with these consolidations,
beneficiaries have between 18 and 24 PDPs to choose from, depending on where
they live, as well as typically 10 or more Medicare Advantage options. MA–PDs
continue to be more likely than PDPs to offer enhanced benefits. For 2017, 231
premium-free PDPs are available to enrollees who receive the LIS, a 2 percent
increase from 2016. All regions of the country continue to have at least 3 and as
many as 10 PDPs available at no premium to LIS enrollees.
In 2016, all of the 10 PDPs with the highest enrollment used a 5-tier formulary with
differential cost sharing between preferred and other generics, preferred brand-name
drugs, nonpreferred drugs, and a specialty tier for high-cost drugs. Also in 2016,
nearly 85 percent of PDPs used tiered pharmacy networks that included preferred
pharmacies offering lower cost sharing. These strategies provide financial incentives
for enrollees to use lower cost drugs or pharmacies, potentially reducing program
costs. However, if LIS enrollees do not use preferred generics or pharmacies with
preferred cost sharing, these approaches will not result in lower Medicare spending
for LIS enrollees (since the LIS covers most or all of these enrollees’ cost sharing).
Part D program costs—Between 2007 and 2015, Part D spending on an incurred
basis increased from $46 billion to $80 billion (an average annual growth rate
of more than 7 percent). Reinsurance became the largest component of program
spending in 2014 and has remained the fastest growing component, at an average
annual growth rate of 20 percent between 2007 and 2015. Enrollees who incur
spending high enough to reach the catastrophic phase of the benefit (high-cost
enrollees) have started to drive Part D program costs, accounting for 53 percent
of gross spending in 2015, up from about 40 percent before 2011. Spending on

385 Repo r t t o t h e Cong r e s s : Med i ca r e Paymen t P o l i c y | Ma r ch 2017
a per enrollee basis for these high-cost individuals grew by more than 9 percent,
driven primarily by increases in the average price per prescription filled (reflecting
both price inflation and changes in the mix of drugs used). In particular, the Part D
program experienced higher than anticipated spending on new hepatitis C therapies
during 2014 and 2015. Going forward,the pharmaceutical pipeline is shifting
toward greater numbers of biologic products and specialty drugs, many of which
have few therapeutic substitutes and high prices. The use of high-priced drugs by
Part D enrollees will likely grow and put significant upward pressure on Medicare
spending for individual reinsurance and the LIS.
Access to prescription drugs—Giving plans greater flexibility to use management
tools could help ensure that prescribed medicines are safe and appropriate for
the patient and could potentially reduce overuse or misuse. However, for some
beneficiaries, those same tools could also limit access to needed medications. Plan
sponsors must strike a balance between providing access to medications while
encouraging enrollees to use lower cost therapies through their formulary designs.
Medicare requires plan sponsors to establish coverage determination and appeals
processes with the goal of ensuring access to needed medications. Beneficiary
advocates, prescribers, plan sponsors, and CMS have all noted frustrations with Part
D coverage determinations, exceptions, and appeals processes. A more efficient
approach would be to resolve such issues at the point of prescribing through
e-prescribing and electronic prior authorization rather than at the pharmacy counter.
Quality in Part D—In 2017, the average star rating among Part D plans increased
somewhat for PDPs while remaining about the same for MA−PDs. The utility of
star ratings to measure quality of prescription drug services may be limited because
data for quality measures do not account for all clinically relevant factors. Part D
plans are required to implement medication therapy management (MTM) programs
to improve quality. Although the Commission supports the goal of improving
medication management, we have been concerned with the effectiveness of plans’
MTM programs. In 2017, Medicare begins testing enhanced MTM programs by
providing incentives for stand-alone PDPs to conduct medication reviews and tailor
drug benefit designs that encourage adherence to appropriate drug therapies. Six
Part D sponsors operating PDPs in 5 regions of the country, with an estimated 1.6
million enrollees, are participating in CMS’s enhanced MTM model. ■


387 Repo r t t o t h e Cong r e s s : Med i ca r e Paymen t P o l i c y | Ma r ch 2017
Part D, Medicare pays competing private plans to deliver drug benefits to enrollees. Instead of setting prices administratively, Medicare’s payments are based on bids submitted by plan sponsors. Part D pays for drug benefits whether beneficiaries enroll in a stand-alone prescription drug plan (PDP) or in a Medicare Advantage−Prescription Drug plan (MA−PD).
The design of the program is intended to give plan sponsors incentives to offer beneficiaries attractive prescription drug coverage while controlling growth in drug spending. Policymakers envisioned that plans would compete for enrollees based on premiums, benefit structure (e.g., deductible amount), formularies, quality of services, and networks of pharmacies.
The drug benefitMedicare defines a standard Part D benefit with parameters that change at the same rate as the annual change in beneficiaries’ average drug expenses (Table 14-1). For 2017, the defined standard benefit includes a $400 deductible and 25 percent coinsurance until the enrollee reaches $3,700 in total covered drug spending. Enrollees whose spending exceeds that amount face a coverage gap up to a threshold of $4,950 in out-of-pocket (OOP) spending, excluding cost sharing paid by most sources of supplemental coverage such as employer-sponsored policies. Above the OOP threshold, enrollees pay the greater of 5 percent coinsurance or $3.30 to $8.25 per prescription.
Background
In 2016, 41 million Medicare beneficiaries were enrolled in Part D plans. Between 2006 (the year Part D began) and 2016, the share of beneficiaries with drug coverage increased from 75 percent to nearly 90 percent.1 Part D generally has improved beneficiaries’ access to prescription drugs, with plans available to all. Surveys indicate that Medicare beneficiaries enrolled in Part D continue to be satisfied with the Part D program and their plans (KRC Research 2013, Medicare Today 2015a, Medicare Today 2015b).
Medicare subsidizes nearly three-quarters of the cost of basic benefits for Part D enrollees. In 2015, the Medicare program spent over $80 billion on Part D on an incurred basis, accounting for slightly over 12 percent of Medicare outlays (Boards of Trustees 2016).2 In addition, Part D enrollees paid $11.5 billion in plan premiums and $15 billion in cost sharing. Each year, the Commission provides a status report on Part D and makes recommendations as necessary. We examine several performance indicators: enrollment patterns, plan benefit offerings, market structure, drug pricing, program costs, beneficiaries’ access to medications, and quality.
Part D’s approachMedicare’s payment system for Part D is different from payment systems under Part A and Part B. For
T A B L E14–1 Parameters of the defined standard benefit increase over time
2006 2016 2017
Average annual
growth rate 2006–2017
Deductible $250.00 $360.00 $400.00 4.4%Initial coverage limit 2,250.00 3,310.00 3,700.00 4.6Annual out-of-pocket spending threshold 3,600.00 4,850.00 4,950.00 2.9Estimated total covered drug spending at annual out-of-pocket threshold 5,100.00 7,515.22* 8,071.16* 4.3Minimum cost sharing above annual out-of-pocket threshold:
Copayment for generic/preferred multisource drugs 2.00 2.95 3.30 4.7Copayment for other prescription drugs 5.00 7.40 8.25 4.7
Note: *An individual’s total covered drug spending at the annual out-of-pocket threshold depends on each enrollee’s mix of brand-name and generic drugs filled in the coverage gap. The amounts for 2016 and 2017 are estimated by CMS for an individual with an average mix of drugs who does not receive Part D’s low-income subsidy and has no supplemental coverage.
Source: Centers for Medicare & Medicaid Services 2016d.
388 S ta tus repor t on the Medicare presc r ip t ion drug program (Par t D )
bids to CMS that represent their revenue requirements (including administrative costs and profit) for delivering the standard benefit to an enrollee of average health. Part D is different from Part C (i.e., Medicare Advantage) in that Medicare’s payments for outpatient drug benefits do not involve any comparison with an administratively set benchmark amount. Instead, CMS calculates a nationwide enrollment-weighted average among all the bid submissions.
Enrollees pay a monthly base beneficiary premium ($35.63 in 2017) plus (or minus) any difference between their plan’s bid and the nationwide average bid (Medicare Payment Advisory Commission 2016b). If enrollees choose a plan that is costlier than average, they pay a premium higher by the difference between the plan’s bid and the nationwide average. If they select a plan that has a lower than average bid, their premium is lower by that difference. If enrollees pick a plan that includes supplemental coverage, they must pay the full price for the additional coverage (i.e., Medicare does not subsidize it). This approach is designed to give sponsors the incentive to control enrollees’ spending so that they can bid low and keep premiums attractive. At the same time, sponsors must balance this incentive with beneficiaries’ desire to have access to medications. A plan with a very limited number of covered drugs might not attract enrollees.
A second avenue of competition involves keeping plan premiums at or below regional LIS benchmarks.4 Part D’s bidding process determines the maximum premium amount Medicare will pay on behalf of LIS enrollees. This amount varies across the country’s 34 Part D regions. It is based on an average of premiums for plans with basic benefits, weighted by each plan’s LIS enrollment in the previous year. The formula also ensures that at least one stand-alone PDP is available to LIS enrollees at no premium.
This approach to subsidizing LIS enrollees also provides incentives for plan sponsors to control drug spending and bid low. If sponsors do so, they can win or maintain market share without having to incur marketing expenses for LIS enrollees. Each year there is turnover in benchmark plans—those that qualify as premium free for LIS enrollees. If LIS enrollees are in a plan with a premium above the benchmark and do not choose a plan themselves, CMS reassigns these enrollees randomly to a new benchmark plan. Instead of accepting the new assignment, LIS enrollees may choose a plan themselves.
Part D includes a low-income subsidy (LIS) that provides assistance with premiums and cost sharing for individuals with low incomes and assets. Individuals who qualify for this subsidy pay zero or nominal cost sharing set by statute. In 2017, most individuals receiving the LIS pay between $0 and $3.30 for generic drugs and between $0 and $8.25 for brand-name drugs.
Before 2011, enrollees exceeding the initial coverage limit were responsible for paying the full price of covered drugs (usually not reflecting manufacturers’ rebates) up to the annual OOP threshold. Part D’s OOP threshold is also known as a “true OOP” cap because it excludes cost sharing paid on behalf of a beneficiary by most sources of supplemental coverage such as employer-sponsored policies and enhanced benefits provided by Part D plans. Because of changes made by the Patient Protection and Affordable Care Act of 2010 (PPACA), since 2011, non-LIS beneficiaries face reduced cost sharing for both brand-name and generic drugs filled during the coverage gap (Medicare Payment Advisory Commission 2016b). In particular, under PPACA, manufacturers must provide a 50 percent discount as a condition for Part D to cover their drugs, and the discount is added to the enrollee’s own spending for purposes of determining whether the enrollee has reached the OOP threshold. In 2017, cost sharing for prescriptions filled during the gap phase is 40 percent for brand-name drugs and 51 percent for generic drugs.3 An individual with no other source of drug coverage is estimated to reach the $4,950 limit at about $8,100 in total drug expenses. (An individual’s level of drug spending at the OOP threshold depends on the mix of brand-name and generic prescriptions they fill. CMS estimates that for a non-LIS enrollee with an average mix of drugs and no supplemental coverage, the amount would be $8,071.16.)
Plan sponsors can and do offer alternative benefit designs. For example, a plan can offer a deductible lower than $400, or use tiered copayments rather than coinsurance—provided the alternative benefit meets requirements for actuarial equivalence. Once a plan sponsor offers a plan with basic benefits in a region, it can also offer plans with additional drug coverage that supplements the standard benefit, called enhanced plans.
Two avenues of competition in Part DPlan sponsors concentrate much of their attention on premium competition to attract enrollees because premiums are the most salient feature on which consumers can compare plan options. Part D plan sponsors submit

389 Repo r t t o t h e Cong r e s s : Med i ca r e Paymen t P o l i c y | Ma r ch 2017
plan sponsors. Today, participation in the market for prescription drug plans is healthy, but the financial sustainability of Part D is a growing concern because of sizable increases in program expenditures for high-cost enrollees (those who reach Part D’s OOP threshold). In June 2016, the Commission recommended a combination of changes designed to address concerns and improve Part D for the future while maintaining the program’s market-based approach (see text box on the Commission’s 2016 recommendations).
However, if their selected plan has a premium higher than the benchmark, they must pay the difference between the plan’s premium and the benchmark amount. Once LIS enrollees select a plan themselves, CMS no longer reassigns them to a new plan. Instead, the agency sends some of these beneficiaries letters about premium-free plan options in the enrollee’s region.
Much of Part D’s original structure from 2006 reflects a system of federal subsidies and regulations designed to encourage broad participation of enrollees and private
The Commission’s 2016 recommendations to improve Part D
In its June 2016 report to the Congress, the Commission recommended changes to Part D in light of certain trends in the pharmaceutical industry
(Medicare Payment Advisory Commission 2016c). Going forward, many new biopharmaceutical products in the development pipeline will have substantially higher prices than previous treatments, even when alternative therapeutic products are available. This trend will exert strong upward pressure on premiums, beneficiary cost sharing, and program costs.
One set of changes would give plan sponsors greater financial incentives and stronger tools to manage the benefits of high-cost enrollees. Medicare’s subsidy of basic Part D benefits would remain unchanged at 74.5 percent, but plan sponsors would receive more of that subsidy through capitated payments instead of open-ended reinsurance. Over a transition period, Medicare would significantly lower the amount of reinsurance it pays plans, from 80 percent of spending above Part D’s out-of-pocket (OOP) threshold to 20 percent, and the insurance risk that plan sponsors shoulder for catastrophic spending would rise commensurately from 15 percent to 80 percent. At the same time, plan sponsors would be given greater flexibility to use formulary tools to manage benefits.5
Other parts of the Commission’s recommendations would exclude manufacturer discounts on brand-name drugs from counting as enrollees’ true OOP spending, but would also provide greater insurance protection
to all enrollees not receiving the low-income subsidy (LIS) through a real OOP cap (although some enrollees would incur higher OOP costs than they do today). The recommended improvements would also moderately increase financial incentives for enrollees who receive the LIS to use lower cost drugs and biologics.
Under the combined recommendations, Part D’s risk adjusters would become more important as a tool for counterbalancing plan incentives for selection, and CMS would need to take steps to recalibrate the risk adjustment system. Similarly, because plans would have greater flexibility to use management tools, CMS would need to continue monitoring plan operations, such as reviewing formularies and pharmacy networks, to ensure beneficiary access. The agency would also need to ensure that the appeals and grievance procedures under Part D function effectively.
On net, the Commission’s recommendations restrain overall drug costs and make the benefit more affordable for beneficiaries and taxpayers in the long run. The recommendations enhance the Part D benefit so that the program would provide real insurance protection against catastrophic OOP spending. However, the recommendations would also expose some beneficiaries to higher cost sharing in the coverage gap. To the extent that the adoption of this combined set of recommendations results in net program savings, the Congress could consider enhancing protections for non-LIS beneficiaries facing high cost-sharing burdens. ■
390 S ta tus repor t on the Medicare presc r ip t ion drug program (Par t D )
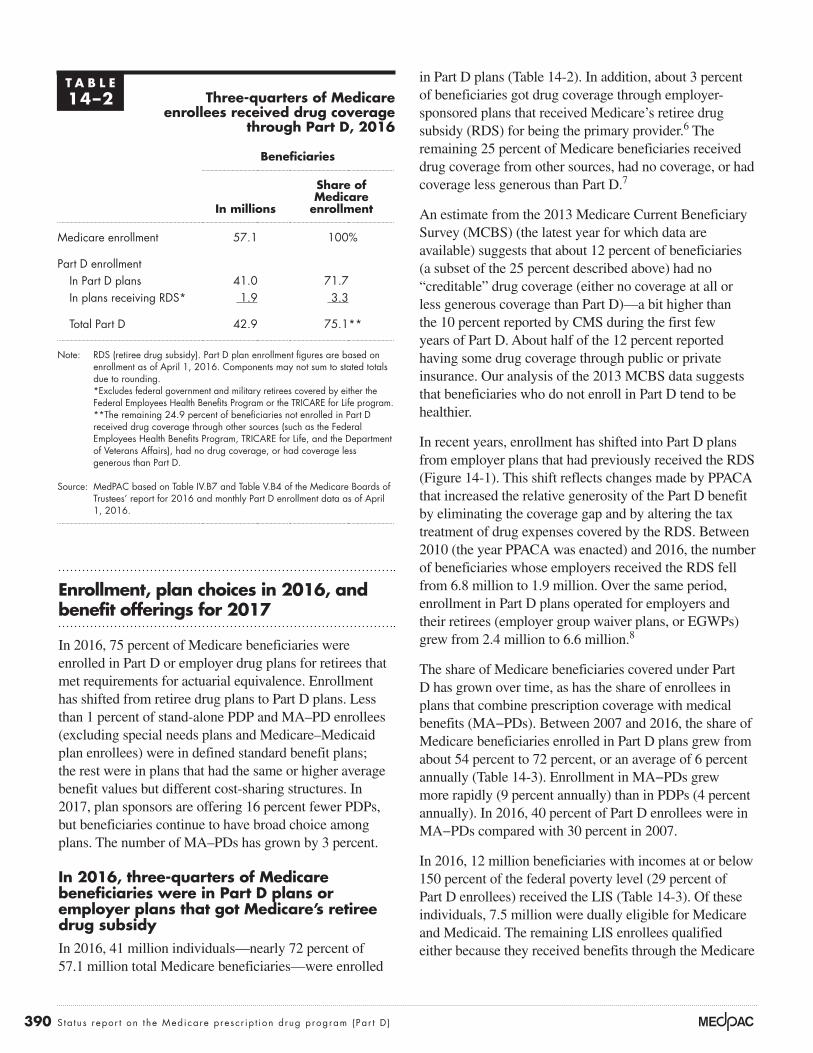
in Part D plans (Table 14-2). In addition, about 3 percent of beneficiaries got drug coverage through employer-sponsored plans that received Medicare’s retiree drug subsidy (RDS) for being the primary provider.6 The remaining 25 percent of Medicare beneficiaries received drug coverage from other sources, had no coverage, or had coverage less generous than Part D.7
An estimate from the 2013 Medicare Current Beneficiary Survey (MCBS) (the latest year for which data are available) suggests that about 12 percent of beneficiaries (a subset of the 25 percent described above) had no “creditable” drug coverage (either no coverage at all or less generous coverage than Part D)—a bit higher than the 10 percent reported by CMS during the first few years of Part D. About half of the 12 percent reported having some drug coverage through public or private insurance. Our analysis of the 2013 MCBS data suggests that beneficiaries who do not enroll in Part D tend to be healthier.
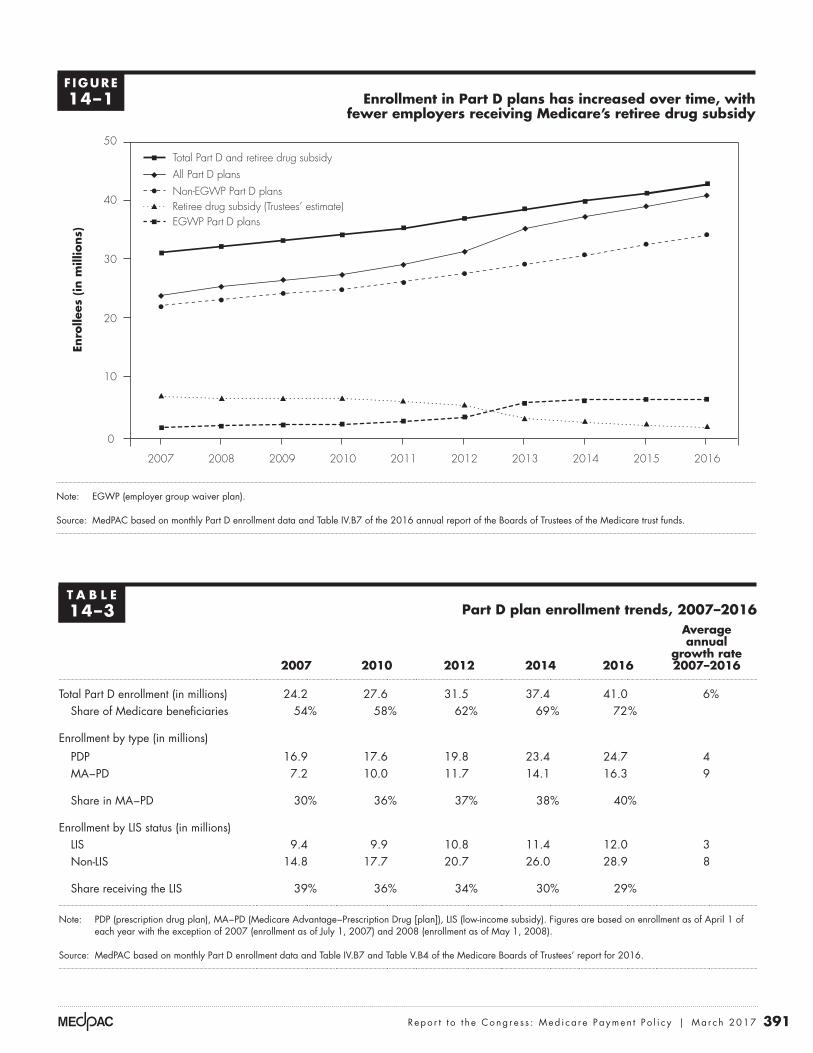
In recent years, enrollment has shifted into Part D plans from employer plans that had previously received the RDS (Figure 14-1). This shift reflects changes made by PPACA that increased the relative generosity of the Part D benefit by eliminating the coverage gap and by altering the tax treatment of drug expenses covered by the RDS. Between 2010 (the year PPACA was enacted) and 2016, the number of beneficiaries whose employers received the RDS fell from 6.8 million to 1.9 million. Over the same period, enrollment in Part D plans operated for employers and their retirees (employer group waiver plans, or EGWPs) grew from 2.4 million to 6.6 million.8
The share of Medicare beneficiaries covered under Part D has grown over time, as has the share of enrollees in plans that combine prescription coverage with medical benefits (MA−PDs). Between 2007 and 2016, the share of Medicare beneficiaries enrolled in Part D plans grew from about 54 percent to 72 percent, or an average of 6 percent annually (Table 14-3). Enrollment in MA−PDs grew more rapidly (9 percent annually) than in PDPs (4 percent annually). In 2016, 40 percent of Part D enrollees were in MA−PDs compared with 30 percent in 2007.
In 2016, 12 million beneficiaries with incomes at or below 150 percent of the federal poverty level (29 percent of Part D enrollees) received the LIS (Table 14-3). Of these individuals, 7.5 million were dually eligible for Medicare and Medicaid. The remaining LIS enrollees qualified either because they received benefits through the Medicare
Enrollment, plan choices in 2016, and benefit offerings for 2017
In 2016, 75 percent of Medicare beneficiaries were enrolled in Part D or employer drug plans for retirees that met requirements for actuarial equivalence. Enrollment has shifted from retiree drug plans to Part D plans. Less than 1 percent of stand-alone PDP and MA–PD enrollees (excluding special needs plans and Medicare–Medicaid plan enrollees) were in defined standard benefit plans; the rest were in plans that had the same or higher average benefit values but different cost-sharing structures. In 2017, plan sponsors are offering 16 percent fewer PDPs, but beneficiaries continue to have broad choice among plans. The number of MA–PDs has grown by 3 percent.
In 2016, three-quarters of Medicare beneficiaries were in Part D plans or employer plans that got Medicare’s retiree drug subsidyIn 2016, 41 million individuals—nearly 72 percent of 57.1 million total Medicare beneficiaries—were enrolled
T A B L E14–2 Three-quarters of Medicare
enrollees received drug coverage through Part D, 2016
Beneficiaries
In millions
Share of Medicare
enrollment
Medicare enrollment 57.1 100%
Part D enrollmentIn Part D plans 41.0 71.7In plans receiving RDS* 1.9 3.3
Total Part D 42.9 75.1**
Note: RDS (retiree drug subsidy). Part D plan enrollment figures are based on enrollment as of April 1, 2016. Components may not sum to stated totals due to rounding. *Excludes federal government and military retirees covered by either the Federal Employees Health Benefits Program or the TRICARE for Life program.
**The remaining 24.9 percent of beneficiaries not enrolled in Part D received drug coverage through other sources (such as the Federal Employees Health Benefits Program, TRICARE for Life, and the Department of Veterans Affairs), had no drug coverage, or had coverage less generous than Part D.
Source: MedPAC based on Table IV.B7 and Table V.B4 of the Medicare Boards of Trustees’ report for 2016 and monthly Part D enrollment data as of April 1, 2016.
391 Repo r t t o t h e Cong r e s s : Med i ca r e Paymen t P o l i c y | Ma r ch 2017
Enrollment in Part D plans has increased over time, with fewer employers receiving Medicare’s retiree drug subsidy
Note: EGWP (employer group waiver plan).
Source: MedPAC based on monthly Part D enrollment data and Table IV.B7 of the 2016 annual report of the Boards of Trustees of the Medicare trust funds.
Title here....En
rolle
es (
in m
illio
ns)
Note: Note and Source are in InDesign.
Source:
0
10
20
30
40
50
2016201520142013201220112010200920082007
Notes about this graph:• Data is in the datasheet. Make updates in the datasheet.• I deleted the years from the x-axis and put in my own.• I had to manually draw tick marks and axis lines because they kept resetting when I changed any data.• The dashed line looked ok here, so I didn’t hand draw it.• I can’t delete the legend, so I’ll just have to crop it out in InDesign.• Use direct selection tool to select items for modification. Otherwise if you use the black selection tool, they will reset to graph default when you change the data.• Use paragraph styles (and object styles) to format.
FIGUREX-X
All Part D plans
EGWP Part D plans
Non-EGWP Part D plansRetiree drug subsidy (Trustees’ estimate)
Total Part D and retiree drug subsidy
F IGURE14–1
T A B L E14–3 Part D plan enrollment trends, 2007–2016
2007 2010 2012 2014 2016
Average annual
growth rate 2007–2016
Total Part D enrollment (in millions) 24.2 27.6 31.5 37.4 41.0 6%Share of Medicare beneficiaries 54% 58% 62% 69% 72%
Enrollment by type (in millions)
PDP 16.9 17.6 19.8 23.4 24.7 4MA−PD 7.2 10.0 11.7 14.1 16.3 9
Share in MA−PD 30% 36% 37% 38% 40%
Enrollment by LIS status (in millions)LIS 9.4 9.9 10.8 11.4 12.0 3Non-LIS 14.8 17.7 20.7 26.0 28.9 8
Share receiving the LIS 39% 36% 34% 30% 29%
Note: PDP (prescription drug plan), MA−PD (Medicare Advantage−Prescription Drug [plan]), LIS (low-income subsidy). Figures are based on enrollment as of April 1 of each year with the exception of 2007 (enrollment as of July 1, 2007) and 2008 (enrollment as of May 1, 2008).
Source: MedPAC based on monthly Part D enrollment data and Table IV.B7 and Table V.B4 of the Medicare Boards of Trustees’ report for 2016.
392 S ta tus repor t on the Medicare presc r ip t ion drug program (Par t D )
needs plans (SNPs)) has grown because some individuals have selected these plans or joined them through the Medicare–Medicaid financial alignment initiative.
Beneficiaries’ enrollment decisions in 2016Most Part D enrollees are in plans that differ from Part D’s defined standard benefit; these plans are actuarially equivalent to the standard benefit or are enhanced in some way. Actuarially equivalent plans have the same average benefit value as defined standard plans but a different benefit structure. For example, a plan may use tiered copayments (e.g., charging $5 per generic drug and $50 for a brand-name drug) that can be higher or lower for a given drug compared with the 25 percent coinsurance under the defined standard benefit. Alternatively, a plan may exempt certain types of prescriptions such as preferred generics from the deductible, or use a cost-sharing rate higher than 25 percent rather than having a deductible at all. Once a PDP sponsor offers at least one plan with basic benefits in a region, it can also offer a plan with enhanced benefits by including, for example, lower cost sharing, coverage for drugs filled during the gap (beyond what is required by PPACA), or an expanded drug formulary that includes non–Part D drugs.
Savings Programs or the Supplemental Security Income program or because they were eligible after they applied directly to the Social Security Administration. Compared with non-LIS enrollees, LIS enrollees are more likely to be female; more than twice as likely to be African American, Hispanic, or Asian; and nearly five times more likely to be under age 65 (Medicare Payment Advisory Commission 2016a).
Between 2007 and 2016, enrollment growth for Part D enrollees who received the LIS was slower (3 percent per year) than for non-LIS enrollees (8 percent per year). Non-LIS enrollees’ faster enrollment growth is partly attributable to the recent growth in EGWPs that shifted beneficiaries to Part D plans from employer plans that had previously received the RDS. Consequently, the share that received the LIS fell from 39 percent to 29 percent. About 66 percent (8 million) of LIS enrollees were in PDPs; the rest were in MA−PDs (data not shown). Most individuals receiving the LIS are enrolled in traditional Medicare rather than Medicare Advantage. If these individuals have not chosen a Part D plan themselves, CMS autoassigns them randomly to benchmark plans, all of which are PDPs. However, LIS enrollment in MA−PDs (including special
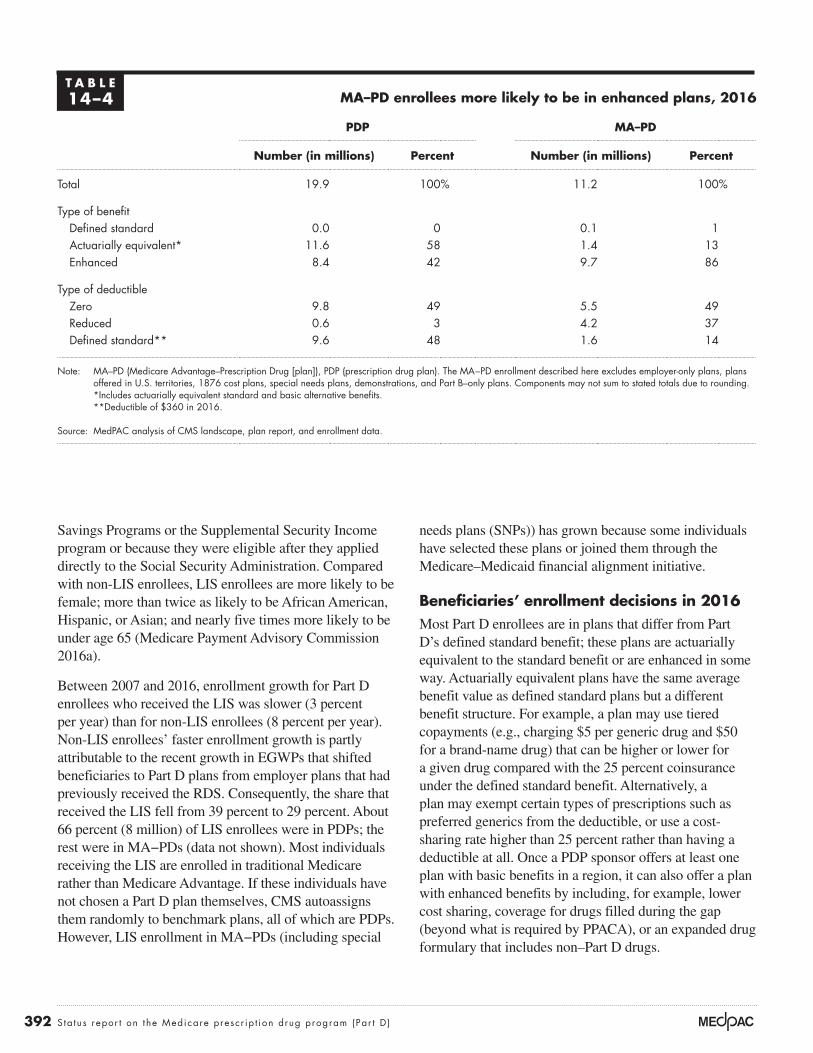
T A B L E14–4 MA–PD enrollees more likely to be in enhanced plans, 2016
PDP MA–PD
Number (in millions) Percent Number (in millions) Percent
Total 19.9 100% 11.2 100%
Type of benefitDefined standard 0.0 0 0.1 1Actuarially equivalent* 11.6 58 1.4 13Enhanced 8.4 42 9.7 86
Type of deductible Zero 9.8 49 5.5 49Reduced 0.6 3 4.2 37Defined standard** 9.6 48 1.6 14
Note: MA–PD (Medicare Advantage–Prescription Drug [plan]), PDP (prescription drug plan). The MA−PD enrollment described here excludes employer-only plans, plans offered in U.S. territories, 1876 cost plans, special needs plans, demonstrations, and Part B–only plans. Components may not sum to stated totals due to rounding.
*Includes actuarially equivalent standard and basic alternative benefits. **Deductible of $360 in 2016.
Source: MedPAC analysis of CMS landscape, plan report, and enrollment data.
393 Repo r t t o t h e Cong r e s s : Med i ca r e Paymen t P o l i c y | Ma r ch 2017
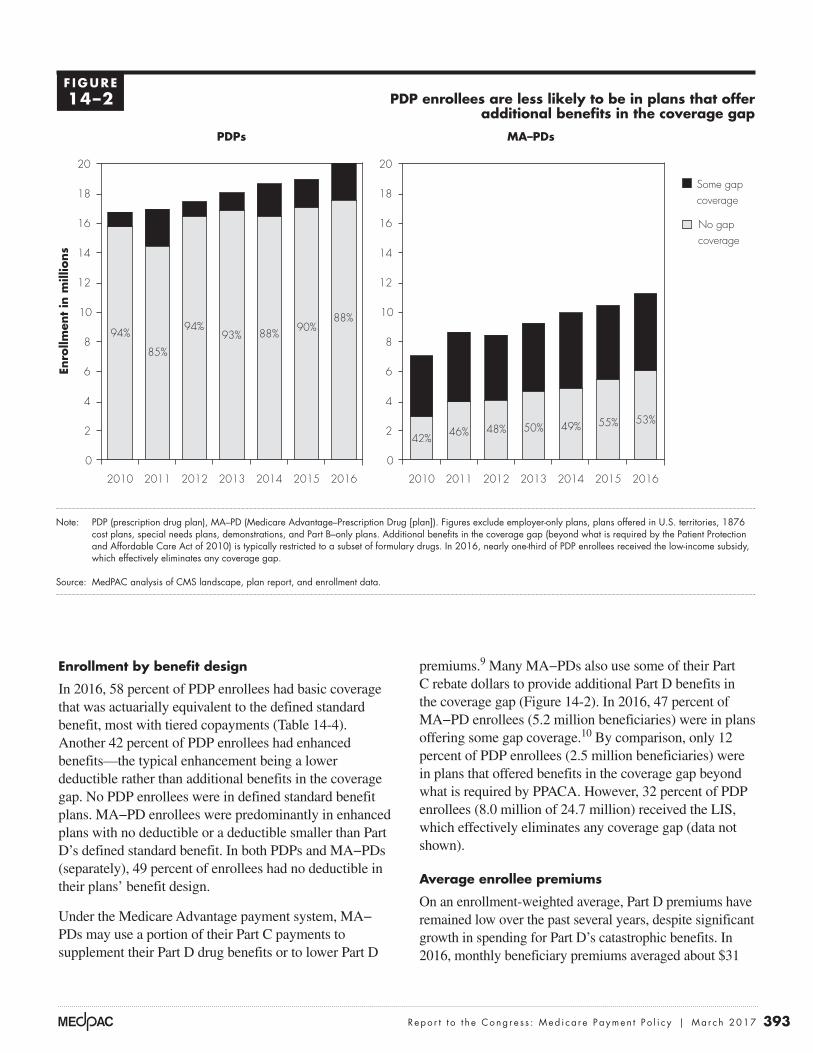
premiums.9 Many MA−PDs also use some of their Part C rebate dollars to provide additional Part D benefits in the coverage gap (Figure 14-2). In 2016, 47 percent of MA−PD enrollees (5.2 million beneficiaries) were in plans offering some gap coverage.10 By comparison, only 12 percent of PDP enrollees (2.5 million beneficiaries) were in plans that offered benefits in the coverage gap beyond what is required by PPACA. However, 32 percent of PDP enrollees (8.0 million of 24.7 million) received the LIS, which effectively eliminates any coverage gap (data not shown).
Average enrollee premiums
On an enrollment-weighted average, Part D premiums have remained low over the past several years, despite significant growth in spending for Part D’s catastrophic benefits. In 2016, monthly beneficiary premiums averaged about $31
Enrollment by benefit design
In 2016, 58 percent of PDP enrollees had basic coverage that was actuarially equivalent to the defined standard benefit, most with tiered copayments (Table 14-4). Another 42 percent of PDP enrollees had enhanced benefits—the typical enhancement being a lower deductible rather than additional benefits in the coverage gap. No PDP enrollees were in defined standard benefit plans. MA−PD enrollees were predominantly in enhanced plans with no deductible or a deductible smaller than Part D’s defined standard benefit. In both PDPs and MA−PDs (separately), 49 percent of enrollees had no deductible in their plans’ benefit design.
Under the Medicare Advantage payment system, MA−PDs may use a portion of their Part C payments to supplement their Part D drug benefits or to lower Part D
PDP enrollees are less likely to be in plans that offer additional benefits in the coverage gap
Note: PDP (prescription drug plan), MA–PD (Medicare Advantage–Prescription Drug [plan]). Figures exclude employer-only plans, plans offered in U.S. territories, 1876 cost plans, special needs plans, demonstrations, and Part B–only plans. Additional benefits in the coverage gap (beyond what is required by the Patient Protection and Affordable Care Act of 2010) is typically restricted to a subset of formulary drugs. In 2016, nearly one-third of PDP enrollees received the low-income subsidy, which effectively eliminates any coverage gap.
Source: MedPAC analysis of CMS landscape, plan report, and enrollment data.
Enro
llmen
t in
mill
ions
PDP enrollees...FIGUREX-X
0
2
4
6
8
10
12
14
16
18
20
2016201520142013201220112010
Notes about this graph:• Data is in the datasheet. Make updates in the datasheet.• I reformatted the years from the x-axis.• I had to manually draw tick marks and axis lines because they kept resetting when I changed any data.• Use direct selection tool to select items for modification. Otherwise if you use the black selection tool, they will reset to graph default when you change the data.• Use paragraph styles (and object styles) to format.
PDPs MA–PDs
Some gapcoverage
No gapcoverage
Drugs covered in the gap Some generics but no brand-name drugs 1.2 1.2 2.2 2.5 2.3 3.0 Some generics and some brand-name drugs 0.2 0.4 1.4 1.6 1.7 1.6 None 3.6 3.3 2.1 2.4 2.9 3.9
94%
85%
94%93%
90%88%88%
0
2
4
6
8
10
12
14
16
18
20
2016201520142013201220112010
42% 46% 48% 50% 55% 53%49%
F IGURE14–2
394 S ta tus repor t on the Medicare presc r ip t ion drug program (Par t D )
premium for Part B, the higher Part D premiums apply to individuals with an annual adjusted gross income greater than $85,000 and to couples with an adjusted gross income greater than $170,000. A beneficiary whose income exceeds these levels pays an income-related monthly adjustment amount in addition to the Part D premium paid to a plan. In 2017, the adjustment amount ranges from $13.30 to $76.20 per month, depending on income.
Second, individuals enrolling in Part D outside of their initial enrollment period must have proof that they had drug coverage as generous as the standard benefit under Part D (i.e., creditable coverage) to avoid the late enrollment penalty (LEP). The LEP amount depends on the length of time an individual goes without creditable coverage and is calculated by multiplying 1 percent of the base beneficiary premium times the number of full, uncovered months an individual was eligible but was not enrolled in a Part D plan and went without other creditable coverage.
Benefit offerings for 2017Beneficiaries are encouraged to reexamine their plan options each year during an open enrollment period that
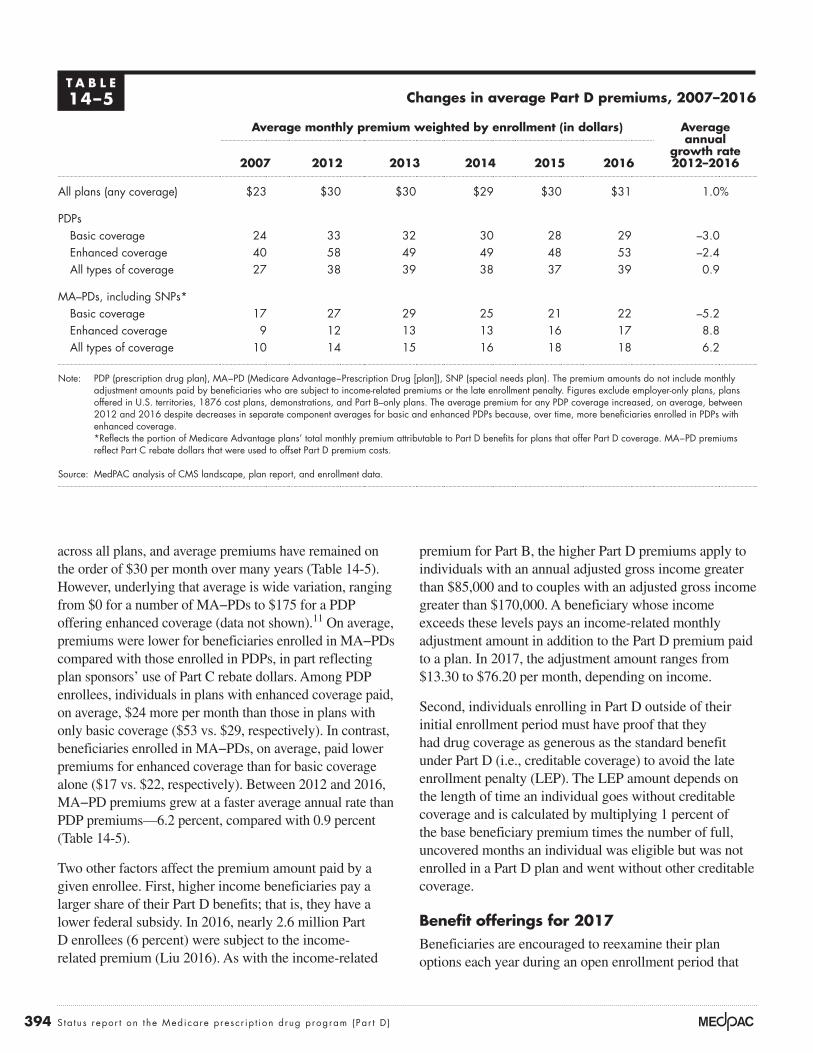
across all plans, and average premiums have remained on the order of $30 per month over many years (Table 14-5). However, underlying that average is wide variation, ranging from $0 for a number of MA−PDs to $175 for a PDP offering enhanced coverage (data not shown).11 On average, premiums were lower for beneficiaries enrolled in MA−PDs compared with those enrolled in PDPs, in part reflecting plan sponsors’ use of Part C rebate dollars. Among PDP enrollees, individuals in plans with enhanced coverage paid, on average, $24 more per month than those in plans with only basic coverage ($53 vs. $29, respectively). In contrast, beneficiaries enrolled in MA−PDs, on average, paid lower premiums for enhanced coverage than for basic coverage alone ($17 vs. $22, respectively). Between 2012 and 2016, MA−PD premiums grew at a faster average annual rate than PDP premiums—6.2 percent, compared with 0.9 percent (Table 14-5).
Two other factors affect the premium amount paid by a given enrollee. First, higher income beneficiaries pay a larger share of their Part D benefits; that is, they have a lower federal subsidy. In 2016, nearly 2.6 million Part D enrollees (6 percent) were subject to the income-related premium (Liu 2016). As with the income-related
T A B L E14–5 Changes in average Part D premiums, 2007–2016
Average monthly premium weighted by enrollment (in dollars) Average annual
growth rate 2012–20162007 2012 2013 2014 2015 2016
All plans (any coverage) $23 $30 $30 $29 $30 $31 1.0%
PDPsBasic coverage 24 33 32 30 28 29 –3.0Enhanced coverage 40 58 49 49 48 53 –2.4All types of coverage 27 38 39 38 37 39 0.9
MA–PDs, including SNPs*Basic coverage 17 27 29 25 21 22 –5.2Enhanced coverage 9 12 13 13 16 17 8.8All types of coverage 10 14 15 16 18 18 6.2
Note: PDP (prescription drug plan), MA−PD (Medicare Advantage−Prescription Drug [plan]), SNP (special needs plan). The premium amounts do not include monthly adjustment amounts paid by beneficiaries who are subject to income-related premiums or the late enrollment penalty. Figures exclude employer-only plans, plans offered in U.S. territories, 1876 cost plans, demonstrations, and Part B–only plans. The average premium for any PDP coverage increased, on average, between 2012 and 2016 despite decreases in separate component averages for basic and enhanced PDPs because, over time, more beneficiaries enrolled in PDPs with enhanced coverage.
*Reflects the portion of Medicare Advantage plans’ total monthly premium attributable to Part D benefits for plans that offer Part D coverage. MA−PD premiums reflect Part C rebate dollars that were used to offset Part D premium costs.
Source: MedPAC analysis of CMS landscape, plan report, and enrollment data.
395 Repo r t t o t h e Cong r e s s : Med i ca r e Paymen t P o l i c y | Ma r ch 2017
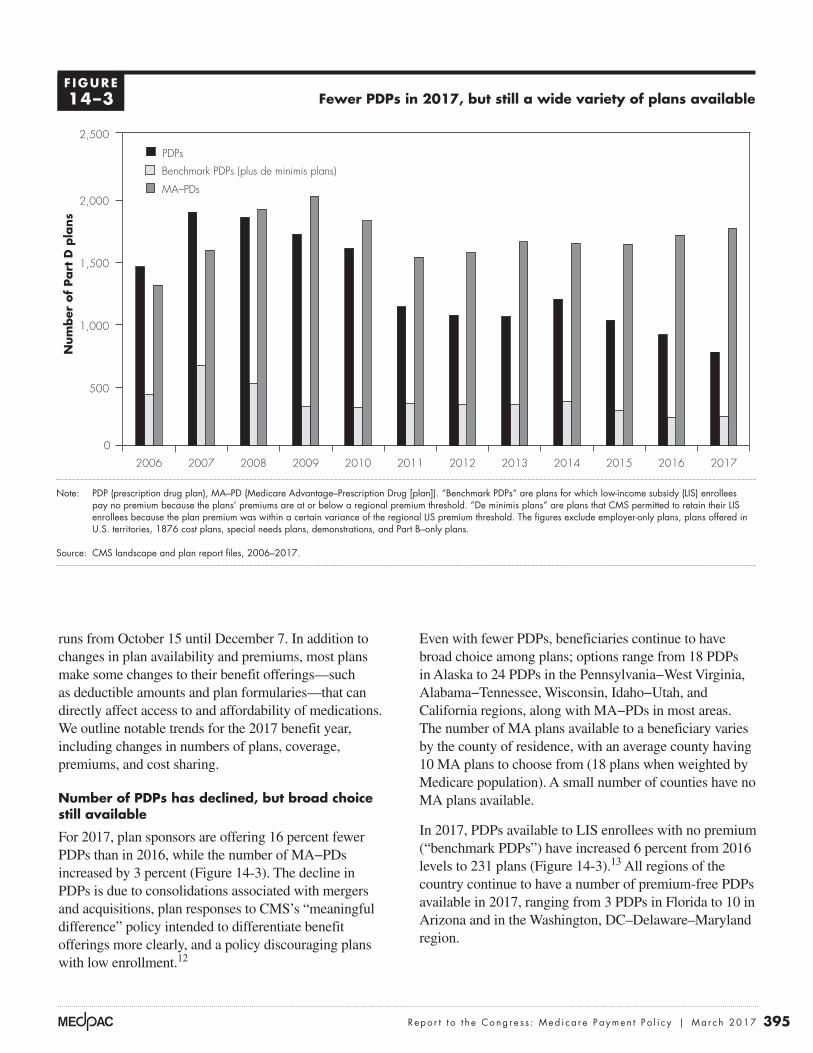
Even with fewer PDPs, beneficiaries continue to have broad choice among plans; options range from 18 PDPs in Alaska to 24 PDPs in the Pennsylvania−West Virginia, Alabama−Tennessee, Wisconsin, Idaho−Utah, and California regions, along with MA−PDs in most areas. The number of MA plans available to a beneficiary varies by the county of residence, with an average county having 10 MA plans to choose from (18 plans when weighted by Medicare population). A small number of counties have no MA plans available.
In 2017, PDPs available to LIS enrollees with no premium (“benchmark PDPs”) have increased 6 percent from 2016 levels to 231 plans (Figure 14-3).13 All regions of the country continue to have a number of premium-free PDPs available in 2017, ranging from 3 PDPs in Florida to 10 in Arizona and in the Washington, DC–Delaware–Maryland region.
runs from October 15 until December 7. In addition to changes in plan availability and premiums, most plans make some changes to their benefit offerings—such as deductible amounts and plan formularies—that can directly affect access to and affordability of medications. We outline notable trends for the 2017 benefit year, including changes in numbers of plans, coverage, premiums, and cost sharing.
Number of PDPs has declined, but broad choice still available
For 2017, plan sponsors are offering 16 percent fewer PDPs than in 2016, while the number of MA−PDs increased by 3 percent (Figure 14-3). The decline in PDPs is due to consolidations associated with mergers and acquisitions, plan responses to CMS’s “meaningful difference” policy intended to differentiate benefit offerings more clearly, and a policy discouraging plans with low enrollment.12
Fewer PDPs in 2017, but still a wide variety of plans available
Note: PDP (prescription drug plan), MA–PD (Medicare Advantage–Prescription Drug [plan]). “Benchmark PDPs” are plans for which low-income subsidy (LIS) enrollees pay no premium because the plans’ premiums are at or below a regional premium threshold. “De minimis plans” are plans that CMS permitted to retain their LIS enrollees because the plan premium was within a certain variance of the regional LIS premium threshold. The figures exclude employer-only plans, plans offered in U.S. territories, 1876 cost plans, special needs plans, demonstrations, and Part B–only plans.
Source: CMS landscape and plan report files, 2006–2017.
Numbers of Part D plans...N
um
ber
of
Part
D p
lans
FIGURE14-4
Note: Note and Source are in InDesign.
Source:
Notes about this graph:• Data is in the datasheet. Make updates in the datasheet.• WATCH FOR GLITCHY RESETS WHEN YOU UPDATE DATA!!!!• The column totals were added manually.• I had to manually draw tick marks and axis lines because they kept resetting when I changed any data.• I can’t delete the legend, so I’ll just have to crop it out in InDesign.• Use direct selection tool to select items for modification. Otherwise if you use the black selection tool, they will reset to graph default when you change the data.• Use paragraph styles (and object styles) to format. • Data was from: R:\Groups\MGA\data book 2007\data book 2007 chp1
PDPs
Benchmark PDPs (plus de minimis plans)
MA–PDs
0
500
1,000
1,500
2,000
2,500
201720162015201420132012201120102009200820072006
100%
F IGURE14–3
396 S ta tus repor t on the Medicare presc r ip t ion drug program (Par t D )
percent. Our analysis of Part C plan bids suggests that, on average, MA–PDs allocated about the same share of Part C rebate dollars for Part D benefits in 2017 as in 2016 (34 percent, or about $30 per enrollee per month, split nearly equally between basic and enhanced benefits).
Continued differentiation among PDP offerings
With the reduction in numbers of PDPs, plan sponsors continue to consolidate offerings into fewer, but more widely differentiated, products. For 2017, sponsors continue to use alternatives to Part D’s defined standard benefit; the market includes no PDPs with the standard benefit design, which was also true in 2016. Between 2016 and 2017, the share of PDPs that charged the defined standard benefit’s deductible amount ($400 in 2017) fell from 53 percent to 48 percent, while the share of plans that charged no deductible increased from 33 percent to 38 percent. For 2017, 15 percent of plans use a deductible less than $400. A larger share of PDPs offers additional coverage in the gap: 28 percent in 2017 compared with 22 percent in 2016 (see endnote 9).
Trends among PDPs with the most enrollment in 2016
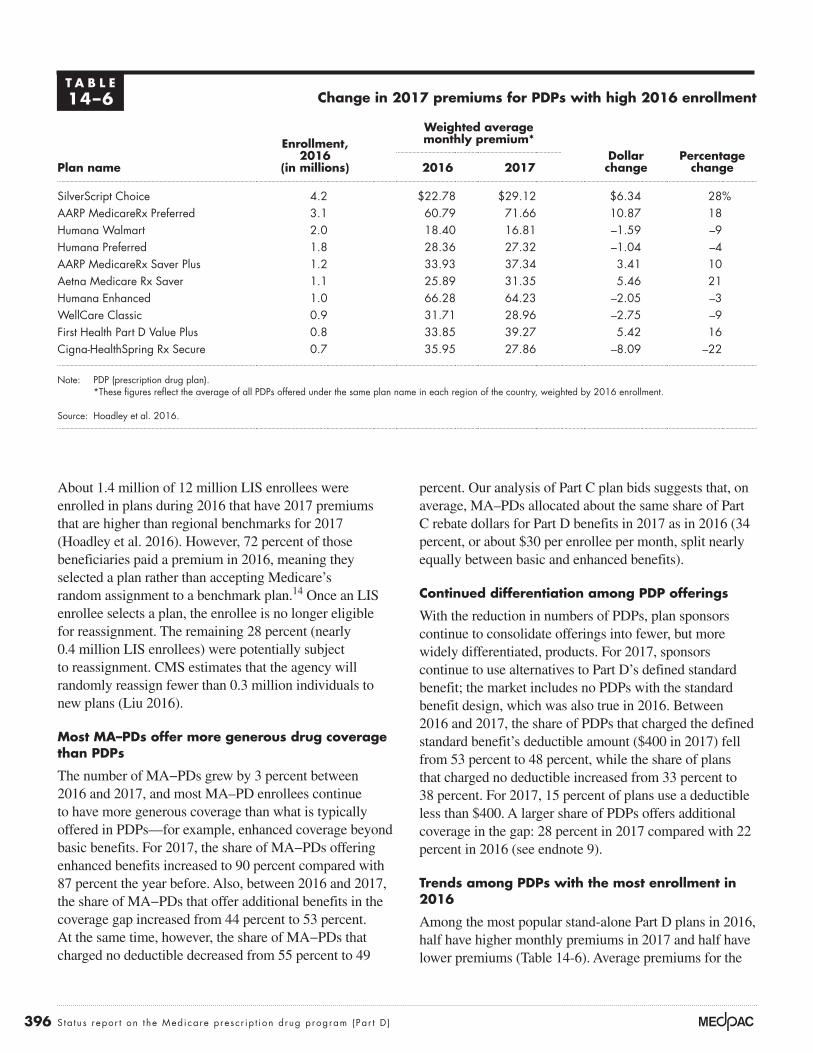
Among the most popular stand-alone Part D plans in 2016, half have higher monthly premiums in 2017 and half have lower premiums (Table 14-6). Average premiums for the
About 1.4 million of 12 million LIS enrollees were enrolled in plans during 2016 that have 2017 premiums that are higher than regional benchmarks for 2017 (Hoadley et al. 2016). However, 72 percent of those beneficiaries paid a premium in 2016, meaning they selected a plan rather than accepting Medicare’s random assignment to a benchmark plan.14 Once an LIS enrollee selects a plan, the enrollee is no longer eligible for reassignment. The remaining 28 percent (nearly 0.4 million LIS enrollees) were potentially subject to reassignment. CMS estimates that the agency will randomly reassign fewer than 0.3 million individuals to new plans (Liu 2016).
Most MA–PDs offer more generous drug coverage than PDPs
The number of MA−PDs grew by 3 percent between 2016 and 2017, and most MA–PD enrollees continue to have more generous coverage than what is typically offered in PDPs—for example, enhanced coverage beyond basic benefits. For 2017, the share of MA−PDs offering enhanced benefits increased to 90 percent compared with 87 percent the year before. Also, between 2016 and 2017, the share of MA−PDs that offer additional benefits in the coverage gap increased from 44 percent to 53 percent. At the same time, however, the share of MA−PDs that charged no deductible decreased from 55 percent to 49
T A B L E14–6 Change in 2017 premiums for PDPs with high 2016 enrollment
Plan name
Enrollment, 2016
(in millions)
Weighted average monthly premium*
Dollar change
Percentage change2016 2017
SilverScript Choice 4.2 $22.78 $29.12 $6.34 28%AARP MedicareRx Preferred 3.1 60.79 71.66 10.87 18Humana Walmart 2.0 18.40 16.81 –1.59 –9Humana Preferred 1.8 28.36 27.32 –1.04 –4AARP MedicareRx Saver Plus 1.2 33.93 37.34 3.41 10Aetna Medicare Rx Saver 1.1 25.89 31.35 5.46 21Humana Enhanced 1.0 66.28 64.23 –2.05 –3WellCare Classic 0.9 31.71 28.96 –2.75 –9First Health Part D Value Plus 0.8 33.85 39.27 5.42 16Cigna-HealthSpring Rx Secure 0.7 35.95 27.86 –8.09 –22
Note: PDP (prescription drug plan). *These figures reflect the average of all PDPs offered under the same plan name in each region of the country, weighted by 2016 enrollment.
Source: Hoadley et al. 2016.

397 Repo r t t o t h e Cong r e s s : Med i ca r e Paymen t P o l i c y | Ma r ch 2017
functions such as marketing, enrollment, customer support, claims processing, coverage determinations, and the appeals and grievances processes. Sponsors must also carry out other specialized functions of pharmacy benefit managers (PBMs), using either in-house organizations or a commercial PBM under contract. These functions include:
• developing and maintaining formularies—lists of drugs the plan covers and the terms and cost-sharing amounts under which it covers them;
• negotiating rebates—payments from drug manufacturers; and
• setting up pharmacy networks and negotiating contracts on prices the sponsor will pay pharmacies for prescriptions filled, dispensing fees, discount agreements, and any performance-based fees.
Rebates from pharmaceutical manufacturers and price discounts and fees from pharmacies are key factors affecting plan sponsors’ net costs for enrollees’ Part D benefits. Sponsors and PBMs generally use rebates and pharmacy fees to offset plans’ benefit spending (reducing plan premiums and lowering copayments or increasing profits) rather than lower enrollees’ prescription prices at the pharmacy (gross or list prices). By law, the Medicare program is prohibited from becoming involved in negotiations among plan sponsors, drug manufacturers, and pharmacies.
Concentrated enrollmentHaving large numbers of enrollees is the central means by which plan sponsors and their PBMs can exert greater bargaining leverage with drug manufacturers and pharmacies. Covering a large number of beneficiaries can also lead to economies of scale that help lower costs of delivering and dispensing prescription benefits.
A small number of large organizations offer stand-alone PDPs in each of the 34 Part D regions across the country, with millions of enrollees. More sponsors offer MA−PDs than PDPs, and MA−PD sponsors vary in size, with the smallest plans operating only in one or a few counties with fewer than 100 enrollees.
Since the start of Part D, enrollment has become more concentrated. In 2016, the top 9 insurers (those with 900,000 or more Part D enrollees) plus a group of 14 Blue Cross and Blue Shield companies that collectively own their own PBM (Prime Therapeutics) together sponsored
10 plans with the highest enrollment ranged from about $17 per month for the Humana Walmart plan to nearly $72 per month for AARP MedicareRx Preferred. Among the five popular PDPs with premium decreases for 2017, the Humana Preferred plan lowered its premium by about $1 per month, while the Cigna-HealthSpring Rx Secure plan’s premium was $8 per month lower. The remaining five plans had premium increases that range from over $3 more per month (AARP MedicareRx Saver Plus) to nearly $11 more per month (AARP MedicareRx Preferred).
Although cost-sharing requirements in Part D plans have generally risen over the years, PDPs with the highest enrollment made relatively few changes to cost sharing for 2017. All of the top 10 PDPs (ranked by 2016 enrollment) continue to use a 5-tiered formulary with differential cost sharing between preferred and nonpreferred drugs, as well as a specialty tier for high-cost drugs. The most popular plan, SilverScript Choice, increased its cost sharing while the second most popular PDP, AARP MedicareRx Preferred, kept 2017 cost-sharing requirements the same as in 2016. Other top PDPs had a mixture of cost-sharing increases and decreases.
Over time, many plan sponsors have moved from charging fixed-dollar copayments to coinsurance for certain tiers. All of the top 10 PDPs use coinsurance rather than fixed-dollar copayments for medications on nonpreferred drug tiers, charging 30 percent to 50 percent of each prescription’s full price in 2017. By charging enrollees a share of the price of their prescriptions rather than a flat copayment, plan sponsors put more of the risk of price increases for those drugs on beneficiaries.
Market structure of plan sponsors
Nearly 300 organizations participate in Part D as plan sponsors—private entities that act as both insurers and administrators of Medicare prescription drug benefits. The market structure of plan sponsors has changed significantly since Part D began and will likely continue to evolve as organizations position themselves to better manage the use of and spending for high-priced specialty drugs and biologics.
The role of private plan sponsors All sponsors must hold valid insurance licenses in the states in which they operate, and they must carry out
398 S ta tus repor t on the Medicare presc r ip t ion drug program (Par t D )
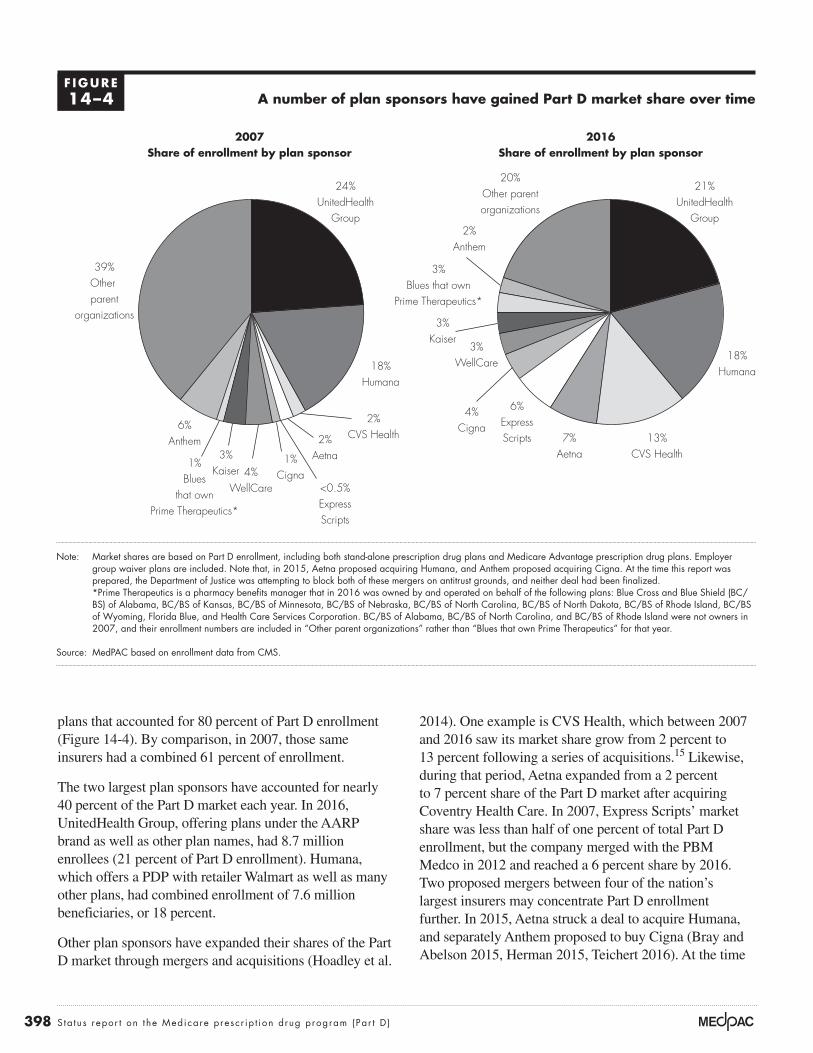
2014). One example is CVS Health, which between 2007 and 2016 saw its market share grow from 2 percent to 13 percent following a series of acquisitions.15 Likewise, during that period, Aetna expanded from a 2 percent to 7 percent share of the Part D market after acquiring Coventry Health Care. In 2007, Express Scripts’ market share was less than half of one percent of total Part D enrollment, but the company merged with the PBM Medco in 2012 and reached a 6 percent share by 2016. Two proposed mergers between four of the nation’s largest insurers may concentrate Part D enrollment further. In 2015, Aetna struck a deal to acquire Humana, and separately Anthem proposed to buy Cigna (Bray and Abelson 2015, Herman 2015, Teichert 2016). At the time
plans that accounted for 80 percent of Part D enrollment (Figure 14-4). By comparison, in 2007, those same insurers had a combined 61 percent of enrollment.
The two largest plan sponsors have accounted for nearly 40 percent of the Part D market each year. In 2016, UnitedHealth Group, offering plans under the AARP brand as well as other plan names, had 8.7 million enrollees (21 percent of Part D enrollment). Humana, which offers a PDP with retailer Walmart as well as many other plans, had combined enrollment of 7.6 million beneficiaries, or 18 percent.
Other plan sponsors have expanded their shares of the Part D market through mergers and acquisitions (Hoadley et al.
A number of plan sponsors have gained Part D market share over time
Note: Market shares are based on Part D enrollment, including both stand-alone prescription drug plans and Medicare Advantage prescription drug plans. Employer group waiver plans are included. Note that, in 2015, Aetna proposed acquiring Humana, and Anthem proposed acquiring Cigna. At the time this report was prepared, the Department of Justice was attempting to block both of these mergers on antitrust grounds, and neither deal had been finalized. *Prime Therapeutics is a pharmacy benefits manager that in 2016 was owned by and operated on behalf of the following plans: Blue Cross and Blue Shield (BC/BS) of Alabama, BC/BS of Kansas, BC/BS of Minnesota, BC/BS of Nebraska, BC/BS of North Carolina, BC/BS of North Dakota, BC/BS of Rhode Island, BC/BS of Wyoming, Florida Blue, and Health Care Services Corporation. BC/BS of Alabama, BC/BS of North Carolina, and BC/BS of Rhode Island were not owners in 2007, and their enrollment numbers are included in “Other parent organizations” rather than “Blues that own Prime Therapeutics” for that year.
Source: MedPAC based on enrollment data from CMS.
2007Share of enrollment by plan sponsor
Medicare population
Note: Note and Source are in InDesign.
Source:
FIGUREX-X
24%UnitedHealth
Group
18%Humana
6%Anthem 2%
Aetna
39%Other parent
organizations
2%CVS Health 13%
CVS Health1%Cigna4%
WellCare
3%Kaiser
1%Blues
that ownPrime Therapeutics*
<0.5%ExpressScripts
2016Share of enrollment by plan sponsor
21%UnitedHealth
Group
18%Humana
2%Anthem
7%Aetna
20%Other parentorganizations
6%ExpressScripts
4%Cigna
3%WellCare
3%Kaiser
3%Blues that own
Prime Therapeutics*
F IGURE14–4
399 Repo r t t o t h e Cong r e s s : Med i ca r e Paymen t P o l i c y | Ma r ch 2017
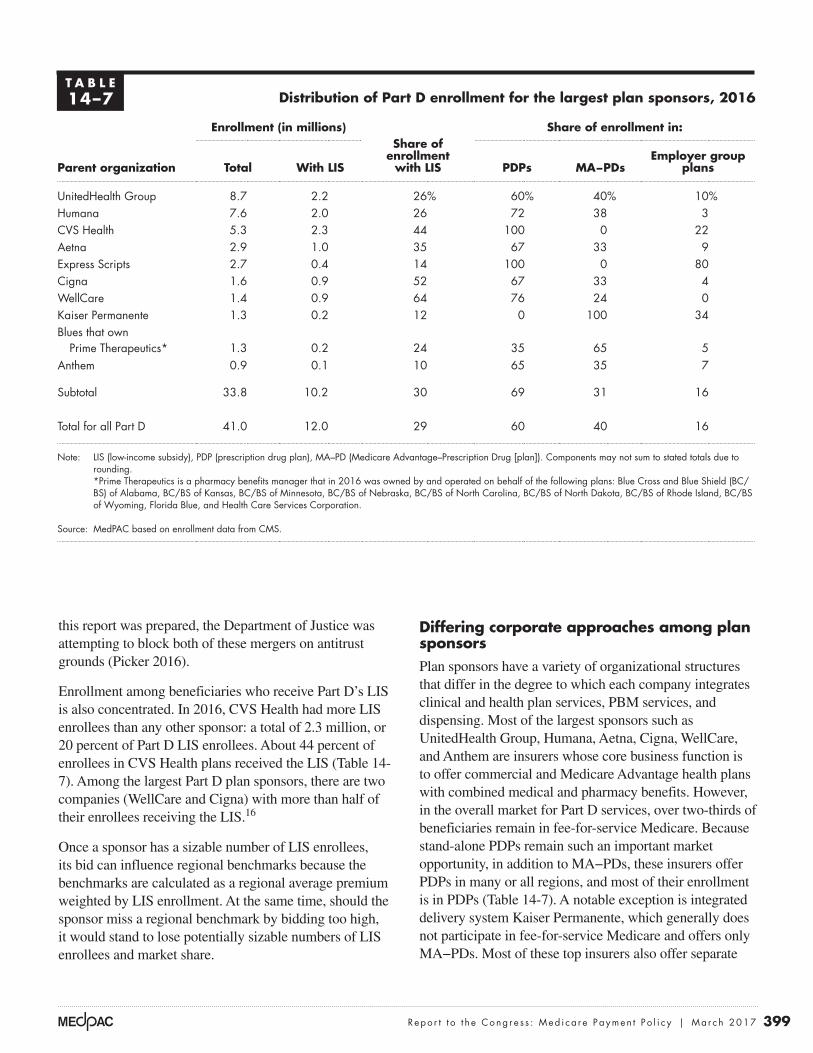
Differing corporate approaches among plan sponsorsPlan sponsors have a variety of organizational structures that differ in the degree to which each company integrates clinical and health plan services, PBM services, and dispensing. Most of the largest sponsors such as UnitedHealth Group, Humana, Aetna, Cigna, WellCare, and Anthem are insurers whose core business function is to offer commercial and Medicare Advantage health plans with combined medical and pharmacy benefits. However, in the overall market for Part D services, over two-thirds of beneficiaries remain in fee-for-service Medicare. Because stand-alone PDPs remain such an important market opportunity, in addition to MA−PDs, these insurers offer PDPs in many or all regions, and most of their enrollment is in PDPs (Table 14-7). A notable exception is integrated delivery system Kaiser Permanente, which generally does not participate in fee-for-service Medicare and offers only MA−PDs. Most of these top insurers also offer separate
this report was prepared, the Department of Justice was attempting to block both of these mergers on antitrust grounds (Picker 2016).
Enrollment among beneficiaries who receive Part D’s LIS is also concentrated. In 2016, CVS Health had more LIS enrollees than any other sponsor: a total of 2.3 million, or 20 percent of Part D LIS enrollees. About 44 percent of enrollees in CVS Health plans received the LIS (Table 14-7). Among the largest Part D plan sponsors, there are two companies (WellCare and Cigna) with more than half of their enrollees receiving the LIS.16
Once a sponsor has a sizable number of LIS enrollees, its bid can influence regional benchmarks because the benchmarks are calculated as a regional average premium weighted by LIS enrollment. At the same time, should the sponsor miss a regional benchmark by bidding too high, it would stand to lose potentially sizable numbers of LIS enrollees and market share.
T A B L E14–7 Distribution of Part D enrollment for the largest plan sponsors, 2016
Parent organization
Enrollment (in millions)Share of
enrollment with LIS
Share of enrollment in:
Total With LIS PDPs MA−PDsEmployer group
plans
UnitedHealth Group 8.7 2.2 26% 60% 40% 10%Humana 7.6 2.0 26 72 38 3CVS Health 5.3 2.3 44 100 0 22Aetna 2.9 1.0 35 67 33 9Express Scripts 2.7 0.4 14 100 0 80Cigna 1.6 0.9 52 67 33 4WellCare 1.4 0.9 64 76 24 0Kaiser Permanente 1.3 0.2 12 0 100 34Blues that own
Prime Therapeutics* 1.3 0.2 24 35 65 5Anthem 0.9 0.1 10 65 35 7
Subtotal 33.8 10.2 30 69 31 16
Total for all Part D 41.0 12.0 29 60 40 16
Note: LIS (low-income subsidy), PDP (prescription drug plan), MA–PD (Medicare Advantage–Prescription Drug [plan]). Components may not sum to stated totals due to rounding. *Prime Therapeutics is a pharmacy benefits manager that in 2016 was owned by and operated on behalf of the following plans: Blue Cross and Blue Shield (BC/BS) of Alabama, BC/BS of Kansas, BC/BS of Minnesota, BC/BS of Nebraska, BC/BS of North Carolina, BC/BS of North Dakota, BC/BS of Rhode Island, BC/BS of Wyoming, Florida Blue, and Health Care Services Corporation.
Source: MedPAC based on enrollment data from CMS.
400 S ta tus repor t on the Medicare presc r ip t ion drug program (Par t D )
CVS Health operates a similarly large PBM (Caremark) that offers central-fill home delivery, and it runs the nation’s largest specialty pharmacy (Fein 2016d). Its approach differs from Express Scripts in that CVS Health also owns a range of dispensing channels: It runs a chain of more than 9,600 retail drugstores and long-term care pharmacy services (Fein 2016f).21 CVS Health also operates more than 1,100 MinuteClinics and provides home infusion services. Even though home delivery of prescriptions is convenient, many consumers continue to prefer shopping at retail pharmacies. To compete with home delivery, CVS Health has moved toward offering 90-day prescription fills at its chain drugstores for the same copayment as by mail. The company also participates in Red Oak Sourcing, a joint venture with drug wholesaler Cardinal Health that jointly negotiates purchases of generic drugs for both.
Strategies for controlling growth in plan premiums
Over the past decade, the use of generics has expanded dramatically. However, generic substitution may be reaching a saturation point. More recently, spending for specialty drugs has begun to drive overall growth in drug spending. To keep Part D premiums competitive, plan sponsors try to better manage the use of specialty therapies and direct enrollees toward lower cost sites of dispensing.
Part D law and regulations were designed to ensure that Medicare beneficiaries, with their higher disease burden, have access to medications. At the same time, law and regulations also limit how sponsors may manage their Part D populations compared with how the same companies manage their commercial populations. In its June 2016 report, the Commission recommended ways in which plan sponsors might be given increased flexibility to manage benefits in return for bearing more insurance risk (see text box on the Commission’s June 2016 recommendations on p. 389). Sponsors employ several key tools to manage pharmacy benefits, including formulary design, manufacturer rebates, design of pharmacy networks, and use of specialty pharmacies.
Formulary designFormularies remain the most important tool for managing drug benefits. Plan sponsors decide which drugs to list on their formulary, which cost-sharing tier is appropriate
Part D employer group plans, which can take the form of MA−PDs or PDPs.
Some insurers such as UnitedHealth Group and Humana manage all or most of their pharmacy benefits in-house (through PBM subsidiaries OptumRx and Humana Pharmacy Solutions).17 Similarly, 14 Blue Cross and Blue Shield plans own their own PBM, Prime Therapeutics. A potential advantage of this approach is that analyzing combined data on medical and drug use and spending could help plans evaluate the effectiveness of treatments and integrate patients’ care. Others insurers like Aetna, Cigna, and Anthem have, over time, outsourced some PBM functions to companies such as Express Scripts and CVS Health’s Caremark to obtain larger rebates from drug manufacturers through the greater negotiating leverage that comes from combined scale. Such arrangements can be complex.18,19 If pending mergers between Anthem-Cigna and Aetna-Humana proceed, the combined companies will need to decide between expanding their capabilities to manage pharmacy benefits in-house versus the potential benefits of an external PBM’s scale.
Other plan sponsors, such as Express Scripts and CVS Health, have core business models that focus primarily on pharmacy benefit management and dispensing. In their capacity as plan sponsors (rather than as PBMs under contract to other Part D sponsors), CVS Health and Express Scripts offer only PDPs (Table 14-7, p. 399). Although similar in this regard, the two plan sponsors have major differences in their organizational structures and approaches.
Express Scripts is considered a “pure” PBM in the sense that it does not own “bricks and mortar” retail drugstores; it focuses on providing PBM services to employers, health plans, and federal and state government programs (Fein 2016f). As a result, Express Scripts’ combined book of business makes it the nation’s largest PBM and mail pharmacy, with sizable specialty pharmacy and specialty distribution subsidiaries. Home delivery of prescriptions through highly automated “central-fill” pharmacies can be the lowest cost method of dispensing.20 For this reason, many employers who offer health benefits try to encourage (or require) home delivery of prescriptions. About 80 percent of Express Scripts’ Part D enrollees are in employer group PDPs—a much higher share than for other large plan sponsors (Table 14-7, p. 399). Express Scripts is vertically integrated in that it jointly owns Econdisc, a group purchasing organization, with Kroger and Supervalu, to combine their generic purchasing volume (Fein 2014a).
401 Repo r t t o t h e Cong r e s s : Med i ca r e Paymen t P o l i c y | Ma r ch 2017
PDPs reduced the share of formulary reference file drugs listed on their formularies by 2 percentage points to 5 percentage points.
Similarly, the use of utilization management tools in Part D—including quantity limits, step therapy, and prior authorization—has grown over the years. Sponsors use such tools for drugs that are expensive; potentially risky; or subject to abuse, misuse, and experimental use. These tools are also used to encourage the use of lower cost therapies. For 2017, many of the most popular PDPs increased the share of drugs subject to utilization management by 1 percentage point to 5 percentage points.
Part D plans with a high share of LIS enrollees face a different challenge with respect to designing their formularies. The maximum amounts of cost sharing that LIS enrollees pay out of pocket are set in law, and Part D plan sponsors cannot vary those amounts. In 2017, most LIS enrollees pay nominal cost-sharing amounts, face no coverage gap, and have no cost sharing above the OOP threshold.
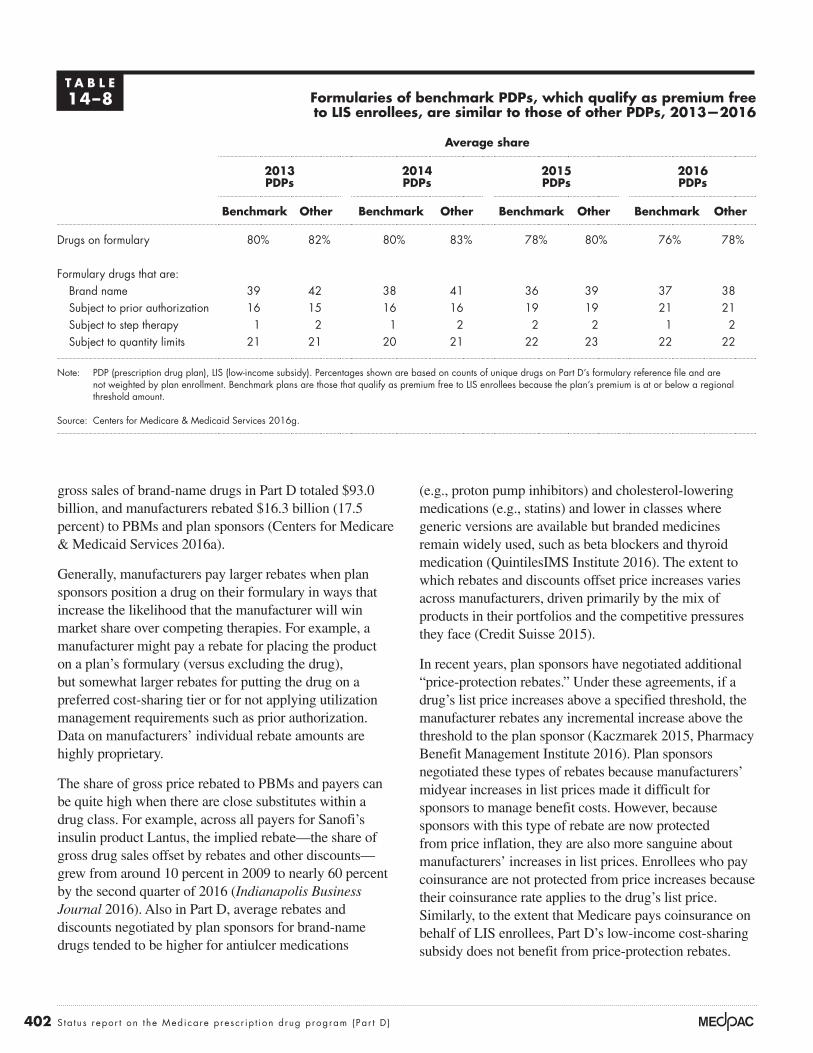
Because sponsors cannot change LIS copayments, sponsors of plans with higher shares of LIS enrollees could be expected to manage drug spending through tighter formularies. While that strategy is used to an extent, a recent CMS analysis does not find large differences between formularies of benchmark PDPs—those with premiums at or below regional LIS benchmark amounts—and formularies of other PDPs (Centers for Medicare & Medicaid Services 2016g). On average, benchmark PDPs listed a 2 percentage point smaller share of unique drugs than other PDPs (Table 14-8, p. 402). Between 2013 and 2016, the average share of drugs listed on each plan’s formulary declined by about 4 percentage points for both benchmark and other PDPs. The average share of formulary drugs that were brand-name drugs was slightly smaller for benchmark PDPs, but this difference decreased over time. The average share of formulary drugs subject to prior authorization, step therapy, or quantity limits has been consistently similar between benchmark and other PDPs.
Manufacturer rebatesIn classes that have competing drug therapies, sponsors and their PBMs negotiate with manufacturers for rebates that are paid after a prescription has been filled. Individual negotiations can vary, but producers of brand-name drugs with no therapeutic substitutes and manufacturers of generic drugs typically do not provide rebates. In 2014,
for each drug, and whether a drug will be subject to prior authorization or other forms of utilization management. Those decisions, in turn, require that plan sponsors strike a balance between providing access to medications while encouraging enrollees to use preferred therapies and dispensing sites. Decisions about formulary design also affect plan sponsors’ bargaining leverage with manufacturers over rebates.
Part D regulations limit how plan sponsors may operate their formularies relative to how the same companies operate their formularies for commercial populations. CMS must approve each plan’s formulary to ensure that it would not substantially discourage enrollment by any group of eligible individuals, such as those with certain conditions. For most drug classes, plans must include two distinct drugs that are not therapeutically equivalent or bioequivalent, and plans must include “all or substantially all drugs” in six protected classes.22 As with commercial plans, Part D plans must allow formulary exceptions—coverage of a nonformulary drug under certain circumstances. However, unlike commercial plans, Part D plans must also allow tiering exceptions—requests for the enrollee to pay lower preferred cost sharing for nonpreferred drugs.
To encourage use of less costly medicines, plans charge lower copayments for preferred generics and brands relative to nonpreferred drugs. Over time, plans have moved toward using more cost-sharing tiers. In 2007, most enrollees were in plans that used three tiers: for generics, preferred brands, and nonpreferred brand-name drugs. By 2016, 97 percent of PDP enrollees and 76 percent of MA−PD enrollees were in plans with five tiers, including two generic tiers, a preferred brand-name tier, a nonpreferred tier, and a specialty tier (Medicare Payment Advisory Commission 2016a). Specialty tiers carry 25 percent to 33 percent cost sharing, and under Part D rules, enrollees may not request a tiering exception for specialty-tier drugs.23
Within the constraints of Part D regulations, plan sponsors have tightened formularies modestly in recent years. Although imperfect measures, the number of drugs listed on a plan’s formulary and the use of utilization management could provide measures of the breadth of plans’ coverage.24 Between 2016 and 2017, the number of drugs in CMS’s formulary reference file, which is used as a denominator to calculate the share of all distinct chemical entities listed on plan formularies, has increased by about 5 percent.25 At the same time, most of the largest
402 S ta tus repor t on the Medicare presc r ip t ion drug program (Par t D )
(e.g., proton pump inhibitors) and cholesterol-lowering medications (e.g., statins) and lower in classes where generic versions are available but branded medicines remain widely used, such as beta blockers and thyroid medication (QuintilesIMS Institute 2016). The extent to which rebates and discounts offset price increases varies across manufacturers, driven primarily by the mix of products in their portfolios and the competitive pressures they face (Credit Suisse 2015).
In recent years, plan sponsors have negotiated additional “price-protection rebates.” Under these agreements, if a drug’s list price increases above a specified threshold, the manufacturer rebates any incremental increase above the threshold to the plan sponsor (Kaczmarek 2015, Pharmacy Benefit Management Institute 2016). Plan sponsors negotiated these types of rebates because manufacturers’ midyear increases in list prices made it difficult for sponsors to manage benefit costs. However, because sponsors with this type of rebate are now protected from price inflation, they are also more sanguine about manufacturers’ increases in list prices. Enrollees who pay coinsurance are not protected from price increases because their coinsurance rate applies to the drug’s list price. Similarly, to the extent that Medicare pays coinsurance on behalf of LIS enrollees, Part D’s low-income cost-sharing subsidy does not benefit from price-protection rebates.
gross sales of brand-name drugs in Part D totaled $93.0 billion, and manufacturers rebated $16.3 billion (17.5 percent) to PBMs and plan sponsors (Centers for Medicare & Medicaid Services 2016a).
Generally, manufacturers pay larger rebates when plan sponsors position a drug on their formulary in ways that increase the likelihood that the manufacturer will win market share over competing therapies. For example, a manufacturer might pay a rebate for placing the product on a plan’s formulary (versus excluding the drug), but somewhat larger rebates for putting the drug on a preferred cost-sharing tier or for not applying utilization management requirements such as prior authorization. Data on manufacturers’ individual rebate amounts are highly proprietary.
The share of gross price rebated to PBMs and payers can be quite high when there are close substitutes within a drug class. For example, across all payers for Sanofi’s insulin product Lantus, the implied rebate—the share of gross drug sales offset by rebates and other discounts—grew from around 10 percent in 2009 to nearly 60 percent by the second quarter of 2016 (Indianapolis Business Journal 2016). Also in Part D, average rebates and discounts negotiated by plan sponsors for brand-name drugs tended to be higher for antiulcer medications
T A B L E14–8 Formularies of benchmark PDPs, which qualify as premium free
to LIS enrollees, are similar to those of other PDPs, 2013—2016
Average share
2013 PDPs
2014 PDPs
2015 PDPs
2016 PDPs
Benchmark Other Benchmark Other Benchmark Other Benchmark Other
Drugs on formulary 80% 82% 80% 83% 78% 80% 76% 78%
Formulary drugs that are:Brand name 39 42 38 41 36 39 37 38Subject to prior authorization 16 15 16 16 19 19 21 21Subject to step therapy 1 2 1 2 2 2 1 2Subject to quantity limits 21 21 20 21 22 23 22 22
Note: PDP (prescription drug plan), LIS (low-income subsidy). Percentages shown are based on counts of unique drugs on Part D’s formulary reference file and are not weighted by plan enrollment. Benchmark plans are those that qualify as premium free to LIS enrollees because the plan’s premium is at or below a regional threshold amount.
Source: Centers for Medicare & Medicaid Services 2016g.
403 Repo r t t o t h e Cong r e s s : Med i ca r e Paymen t P o l i c y | Ma r ch 2017
for beneficiary cost sharing.26 When Part D enrollees pay a percentage coinsurance rather than fixed-dollar copayments, their cost-sharing amount is based on their drug’s undiscounted list price (i.e., it does not reflect rebates). For this reason, enrollees accumulate enough spending to reach Part D’s coverage gap and OOP threshold more quickly than they would otherwise. Coinsurance can be especially burdensome for beneficiaries who require high-priced specialty drugs or medications such as insulin, to which adherence is especially critical for managing their condition.
The way in which plan sponsors apply rebates to aggregate benefits affects Medicare program spending in different ways. Using rebates to reduce plan premiums lowers Medicare program spending because (1) Medicare retains a portion of aggregate rebates to offset a share of program payments for individual reinsurance and (2) Medicare subsidizes a portion of plan premiums for all enrollees, and rebates lower those subsidies. However, an offsetting effect is that a higher proportion of enrollees reach Part D’s OOP threshold—the point at which Medicare pays for 80 percent of benefits. Recently, one actuarial firm pointed out that Part D’s unique benefit design, Medicare’s reinsurance payments, and plan sponsors’ focus on premium competition may affect plan incentives regarding their formulary decisions (see text box on incentives to list high-price, high-rebate drugs on formulary, pp. 404–405).
Pharmacy networks In addition to formulary structure and rebates, health plans and PBMs manage drug spending by encouraging enrollees to use pharmacies that dispense prescriptions at lower cost. For their non-Medicare business, health plans use a variety of approaches, depending on how tightly a payer wants to control spending. For example, some employers require enrollees to fill prescriptions within an exclusive network of retail pharmacies; some require enrollees who take certain maintenance medicines for chronic conditions to refill prescriptions by mail rather than through retail pharmacies; and some encourage enrollees to fill their prescriptions with a larger days’ supply by paying lower cost sharing for a 90-day supply compared with three 30-day fills.
Part D law and CMS guidance limit plan sponsors from using some dispensing approaches. For example, Part D plan sponsors can offer but not require enrollees to use home delivery. CMS guidance states that if a sponsor includes a mail-order pharmacy within its network, the
CMS refers to manufacturer rebates, pharmacy fees, and other such payments that offset benefit costs collectively as direct and indirect remuneration (DIR). Plan sponsors must submit DIR data to CMS for purposes of reconciling Medicare’s prospective reinsurance payments to plans and for calculating risk-corridor payments between Medicare and plans (see the Commission’s June 2016 report for a discussion of risk-corridor payments (Medicare Payment Advisory Commission 2016c)).
The aggregate amount of rebate payments in Part D has been growing. Using plan sponsors’ assumptions about rebates from their 2016 bids, the Medicare Trustees estimated that Part D DIR—made up predominantly of manufacturers’ rebates—amounted to 20.6 percent of total drug costs (averaged across all drugs, including those for which plans do not receive any rebates) (Boards of Trustees 2016). This amount is a significant increase from DIR of about 9.6 percent in 2007, and even from 2015, when “the intensified competition in the hepatitis C drug market” resulted in higher DIR (17.2 percent) than expected (Boards of Trustees 2016, Boards of Trustees 2015).
In theory, plan sponsors could apply manufacturer rebates in one of two ways. They could:
• reduce the price of the prescription that generated the rebate at the point of sale or
• offset aggregate benefit costs with the aggregate amount of rebate payments.
Under the first approach, enrollees who use drugs for which a rebate is negotiated would benefit from the price discount. Under the second approach, the aggregate amount of rebate payments would be used to lower the plan’s premium for all enrollees. The first approach is not always practical if, for example, the amount of rebate payments is determined retroactively based on performance goals for the pharmacy or the magnitude of price increases. In addition, plans and their PBMs overwhelmingly use the second approach because beneficiaries evaluate premiums closely when comparing Part D plans, and premiums are the basis on which plans qualify as premium free to LIS enrollees. This approach is a key reason average premiums in Part D have grown very slowly, even as spending for catastrophic benefits has grown rapidly.
Recently, the issue of rebates in drug pricing has garnered attention primarily because of its implications

404 S ta tus repor t on the Medicare presc r ip t ion drug program (Par t D )
Incentives to list high-price, high-rebate drugs on formulary
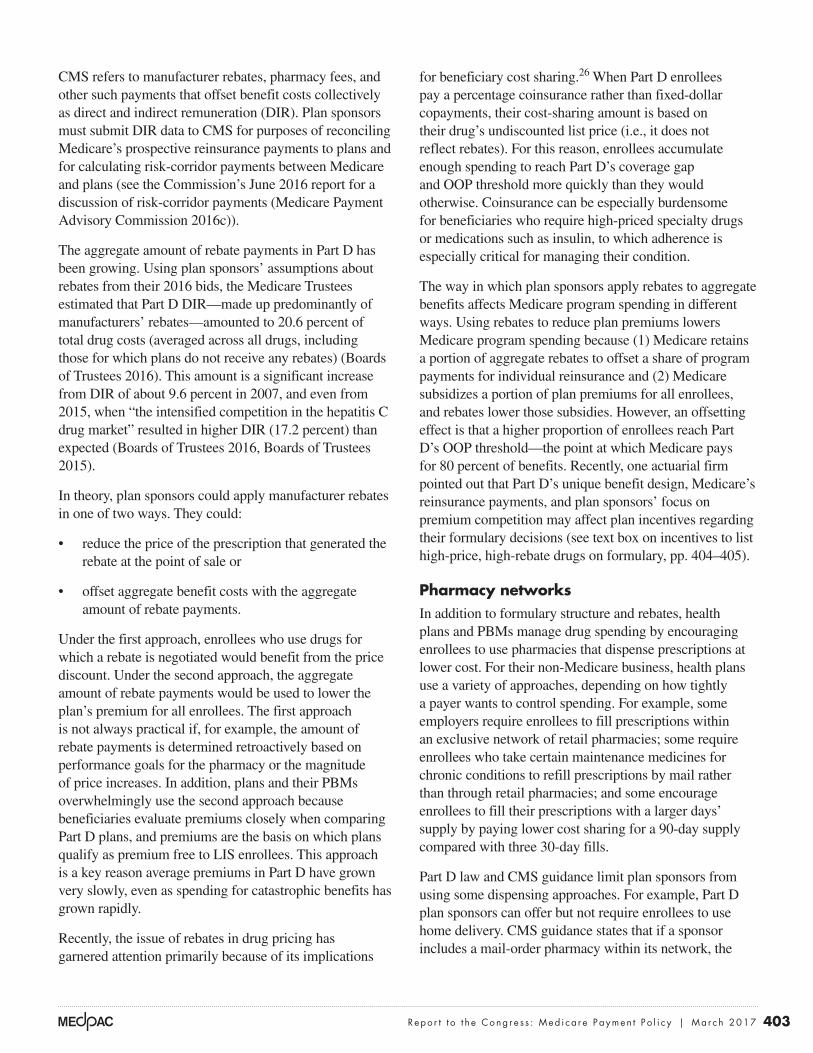
A recent analysis suggests that sponsors may in some cases prefer drugs with high prices at the point of sale (list prices) and large
postsale rebates to medications with lower point-of-sale prices (Barnhart and Gomberg 2016). That is, sponsors’ decisions to place certain higher priced drugs on their formularies may be a rational response to the financial incentives they face. The incentives arise because in Part D, sizable portions of the benefit are not paid by the plan. For example, in the coverage gap, enrollees and manufacturers pay for most of the prescription costs, even after 2020 when the coverage gap is scheduled to close.27 Above the out-of-pocket (OOP) threshold, Medicare reinsurance pays for 80 percent of covered benefits. A further reason is that for purposes of reconciling Medicare’s payments to plans, CMS requires plans to allocate a portion of rebate dollars to Medicare reinsurance based on how much of each plan’s gross spending was above Part D’s OOP threshold (Centers for Medicare & Medicaid Services 2011b). Plans must use this approach even if rebates are generated from drugs that are more likely to cause the beneficiary to reach the OOP threshold. If most of the plan’s overall spending falls below the threshold but rebates were largely attributable to drugs that put beneficiaries above the threshold, CMS guidance leads sponsors to offset benefit costs (and reduce plan premiums) using a disproportionate share of rebates and pharmacy fees.
To illustrate, consider a beneficiary who takes just one prescription drug. In this hypothetical situation, we consider only the plan sponsor’s financial incentives and assume that the drugs being compared are close therapeutic substitutes. In its negotiations with drug manufacturers, the plan has a choice of putting on its formulary either a brand-name drug that has a list price of $1,000 per month ($12,000 annually) with a 25 percent rebate or a generic drug at $250 per month ($3,000 annually) but with no rebate (Table 14-9, Example 1). The beneficiary’s cost sharing would be lower with the generic drug. It would appear initially that between the two alternatives, the plan sponsor would also find it more desirable to put the generic drug on its formulary. However, after offsetting
plan costs with manufacturer rebates and pharmacy discounts and fees, and after deducting Medicare’s individual reinsurance payments to the plan, the sponsor’s net liability would be lower with the high-price, high-rebate brand-name drug ($1,313) than with the generic ($1,950).28
The Commission’s June 2016 recommendation to change how Medicare’s overall subsidy of Part D is composed would remedy these financial incentives (see text box on the Commission’s June 2016 recommendations, p. 389). Table 14-9 shows the net effects if Medicare paid for 20 percent of catastrophic costs through reinsurance rather than the current 80 percent. (Under the Commission’s recommendations, Medicare would simultaneously increase plans’ monthly capitated payments to keep Medicare’s overall subsidy at 74.5 percent. CMS would also need to recalibrate its Part D risk adjustment system for the higher capitated payments.) From a sponsor’s perspective, including the generic drug on its formulary would lower plan costs relative to the higher priced brand-name drug. That selection would also reduce beneficiary cost sharing ($1,050, rather than $3,089 for the brand-name drug).
Table 14-9 shows a similar comparison for a plan sponsor negotiating with drug manufacturers between including a brand-name drug with a list price of $60,000 with a 25 percent rebate on its formulary compared with a $30,000 drug that is also offered with a 25 percent rebate. In this scenario, the rebate and reinsurance amounts are so large that the sponsor could actually reduce its plan liability (and help lower its premiums or increase profits) by placing the more expensive drug on its formulary: a net liability of –$287 (i.e., savings), compared with a net cost of $713 for the medicine with the lower price. The table’s “net effect” shows that if Medicare’s reinsurance were reduced to 20 percent from the current 80 percent, the sponsor would face much higher costs if it placed the more expensive brand on its formulary (net plan liability of $28,010 compared with $12,510). By selecting the lower priced medicine, beneficiaries who use that drug would also experience lower cost sharing ($3,989 rather than $5,489). ■
405 Repo r t t o t h e Cong r e s s : Med i ca r e Paymen t P o l i c y | Ma r ch 2017
Incentives to list high-price, high-rebate drugs on formulary (cont.)
T A B L E14–9 Examples of how plan sponsors may have incentives to include
certain drugs with high list prices and high rebates on their formularies
Spending for a beneficiary who takes one prescription drug
Example 1: Brand versus generic Example 2: Brand versus brand
Brand with list price of $12,000,
25% rebate
Generic with list price of $3,000,
no rebate
Brand with list price of $60,000,
25% rebate
Brand with list price of $30,000,
25% rebate
Gross drug spendingBeneficiary cost sharing $3,089 $1,050 $5,489 $3,989Coverage gap discount 2,069 0 2,069 2,069Covered benefits 6,842 1,950 52,442 23,942
Subtotal 12,000 3,000 60,000 30,000
Allocation of rebates and fees assuming 80% reinsurance*Medicare reinsurance (at 80%) 800 0 4,000 2,000Plan liability 2,200 0 11,000 5,500
Subtotal 3,000 0 15,000 7,500
Net effectBeneficiary cost sharing 3,089 1,050 5,489 3,989Medicare reinsurance after rebates 2,529 0 37,729 15,729Plan liability after rebates and reinsurance 1,313 1,950 –287 713
Allocation of rebates and fees assuming 20% reinsurance*Medicare reinsurance (at 20%) 200 0 1,000 500Plan liability 2,800 0 14,000 7,000
Subtotal 3,000 0 15,000 7,500
Net effectBeneficiary cost sharing 3,089 1,050 5,489 3,989Medicare reinsurance after rebates 632 0 9,432 3,932Plan liability after rebates and reinsurance 3,210 1,950 28,010 12,510
Note: Both examples estimate financial effects using Part D’s defined standard benefit for 2017. *Medicare reduces its reinsurance payments to plans by a portion of the rebates and fees plan sponsors receive from manufacturers and pharmacies. CMS first calculates the share of each plan’s gross covered spending that occurred above Part D’s out-of-pocket (OOP) threshold. In these examples, we assume one-third of the plan’s gross covered spending was above the cap. Medicare’s share of the rebates and fees is calculated as the reinsurance rate (80 percent in the top panels, 20 percent in the lower panels) multiplied by the rebate amount multiplied by the percentage of gross spending above the OOP threshold. An individual’s gross covered spending at the OOP threshold depends on the mix of brand-name and generic prescriptions they fill in the coverage gap. In Example 1, if the beneficiary takes the generic rather than the brand-name drug, he or she would not receive any coverage-gap discount and would not reach the OOP threshold. These examples do not display effects on enrollees’ and Medicare’s payments for premiums. However, in the Commission’s June 2016 recommendations for Part D, Medicare would increase capitated monthly payments to plans at the same time that it reduced reinsurance to maintain an overall subsidy of 74.5 percent.
Source: MedPAC analysis.
406 S ta tus repor t on the Medicare presc r ip t ion drug program (Par t D )
and Walmart are major chains that participate as preferred pharmacies with a variety of plan sponsors in 2017.
A key reason for lower participation by some pharmacies may be postsale fees they pay to plan sponsors to obtain preferred status in tiered networks (Fein 2016e). When setting up networks, plan sponsors negotiate additional price concessions and incentive payments, called “pharmacy DIR fees” since they must be reported to CMS as “other direct and indirect remuneration.” According to independent pharmacies, pharmacy DIR fees have grown steadily in recent years (National Community Pharmacists Association 2016a). CMS reports that in 2014, Part D DIR totaled $17.4 billion and, of that amount, manufacturer rebates made up $16.3 billion (Centers for Medicare & Medicaid Services 2017a, Centers for Medicare & Medicaid Services 2016a). The difference in amounts suggests that pharmacy DIR fees could have been on the order of $1 billion in 2014. By not participating as a preferred pharmacy in a Part D plan’s tiered network, pharmacies can avoid the fees, but they may also lose prescription volume associated with customers who shop for lower prescription cost sharing (Fein 2016a).
As with rebates from drug manufacturers, DIR fees are collected after the point of sale. DIR fees can include amounts that are a condition for participating as a preferred cost-sharing pharmacy; “true-up” payments related to drug reimbursement rates; and performance fees that are assessed on quality measures, such as rates of dispensing generics and preferred drugs, or adherence measures (Fein 2016a, National Community Pharmacists Association 2016a). Critics contend that the way in which plan sponsors and their PBMs calculate pharmacy DIR fees is not transparent (National Community Pharmacists Association 2016c). Moreover, they believe that plan sponsors tend to ignore or understate DIR fees when preparing Part D bids, leading to enrollee premiums that are too high (National Community Pharmacists Association 2016b). PBMs and sponsors that support the use of pharmacy DIR fees counter that they are a means by which to encourage greater use of generics and reduce enrollees’ premiums and OOP spending (Holtz-Eakin 2014). To the extent that beneficiaries select plans with tiered networks and use preferred pharmacies that are more efficient, the approach may also lower Medicare spending (Kaczmarek et al. 2013).
Tiered networks have been controversial because of past concerns that some enrollees do not have adequate access to preferred pharmacies with lower cost sharing. Because
plan must also permit enrollees to receive similar benefits (such as an extended 90-day supply) through a network retail pharmacy.29 Economies of scale at mail pharmacies are large, so encouraging beneficiaries to receive their prescriptions through home delivery could help to lower dispensing costs. However, few Part D enrollees take advantage of home delivery options: In 2014, about 5 percent of Part D prescriptions were filled by mail pharmacies.
Most notably, Part D law requires that plan sponsors permit within their networks any pharmacy that is willing to accept the sponsors’ terms and conditions.30 In other words, plan sponsors cannot use exclusive pharmacy contracts. However, sponsors can designate a subset of network pharmacies that offer preferred (lower) cost sharing. The strategy of designating certain “preferred cost-sharing pharmacies” (subsequently referred to as preferred pharmacies) has the potential to lower costs for Medicare and enrollees if it encourages enrollees to fill prescriptions at more efficient pharmacies. Differences between cost sharing at preferred pharmacies and other network pharmacies can vary substantially among plans, with some plans providing much stronger incentives to use preferred pharmacies than others (Medicare Payment Advisory Commission 2016d).
Humana was the first Part D plan sponsor to use a tiered pharmacy network when it introduced a PDP cobranded with Walmart for 2011. Subsequently, most other large plan sponsors adopted the same strategy. Between 2011 and 2017, use of tiered pharmacy networks in Part D grew from about 7 percent of PDPs to 85 percent (Fein 2016c). Among the top 10 PDPs with the highest enrollment in 2016, all but 2 (SilverScript Choice and WellCare Classic) use tiered pharmacy networks in 2017.
For 2017, some pharmacies seem less willing to participate as preferred pharmacies than in 2016. Despite intense competition for pharmacy business, retail pharmacy chains CVS and Rite Aid signed up as preferred pharmacies for relatively few PDPs (Fein 2016e). Smaller independent pharmacies participate in pharmacy services administration organizations (PSAOs) to combine their leverage when negotiating with plan sponsors for network contracts. The four largest PSAOs account for about three-quarters of all independent retail pharmacy locations (Fein 2016e). Although independent pharmacies represented by these PSAOs are participating in some Part D plans as preferred pharmacies in 2017, they were preferred in only 1 of the 10 most popular plans in 2016. In contrast, Walgreens
407 Repo r t t o t h e Cong r e s s : Med i ca r e Paymen t P o l i c y | Ma r ch 2017
There are many varieties of specialty pharmacies. Some are owned by PBMs, pharmacy chains, or health plans that, by virtue of representing so many covered lives, may be able to negotiate for sizable rebates from drug manufacturers in drug classes that have competing therapies. The largest specialty pharmacies are owned by CVS Health, Express Scripts, Walgreens Boots Alliance, OptumRx, Diplomat Pharmacy (a publicly traded independent specialty pharmacy), Prime Therapeutics, and Humana (Fein 2016d). Other specialty pharmacies tend to be smaller and specialize in dispensing medicines for a subset of diseases. Some operate regionally. Smaller chain and independent retail pharmacies also dispense specialty drugs that can be purchased through the wholesale channel.
For their commercial business, payers and PBMs typically try to manage specialty costs and patient adherence by setting up a narrower network of specialty pharmacies.35 Specialty pharmacies can help ensure that patients meet specific clinical criteria through their plans’ prior authorization process before dispensing the prescription. They can also reduce waste by, for example, initially dispensing a 7- or 14-day supply and observing the patient for side effects, treatment effectiveness, and adherence before providing a 30-day supply.
In Part D, plan sponsors may not set up a narrower network of specialty pharmacies. With a few exceptions, Part D’s convenient access standards apply to the dispensing of all types of drugs, including specialty drugs. Unless dispensing of a drug requires “extraordinary specialty handling, provider coordination, or patient education that cannot be met by a network pharmacy,” the sponsor may not restrict access to a subset of network pharmacies (Centers for Medicare & Medicaid Services 2011a). An exception is made if a manufacturer uses a limited distribution network: In this situation, the Part D enrollee would be able to fill that prescription at only one of the designated specialty pharmacies.
If Part D plan sponsors were permitted to use narrower networks of specialty pharmacies, the implications for cost and beneficiary access would depend, in large part, on the nature of pharmacies that participated in the networks. Some businesses labeled as specialty pharmacies have attracted attention to the industry. One example was Philidor Rx Services, affiliated with Valeant Pharmaceuticals, which gained notoriety because it was manufacturer controlled and was used to dispense primarily its owner’s products at high prices (Nisen 2015). Recently, PBMs have actively “pruned” specialty
Part D pays for most or all of LIS enrollees’ cost sharing, if LIS enrollees have less opportunity to use preferred pharmacy networks, the strategy could also lead to higher Medicare spending. Out of these concerns, CMS guidance directs that plans are permitted to offer lower cost sharing at preferred pharmacies only if the approach does not raise Medicare payments (Centers for Medicare & Medicaid Services 2015b, Centers for Medicare & Medicaid Services 2014d).
To participate in Part D, plan sponsors must set up pharmacy networks that meet convenient access standards.31 Access standards apply to a plan’s entire network rather than to its preferred network. Among plans offered in 2015, CMS found that on average, enrollees living in urban (rather than rural) areas were less likely to have convenient access to preferred pharmacies that offered lower cost sharing (Centers for Medicare & Medicaid Services 2015a, Centers for Medicare & Medicaid Services 2014a). That result may reflect fewer “big-box” retailers with pharmacies in urban centers. For plans with particularly low access, CMS began requiring that marketing materials disclose that information, among other measures. For the 2016 benefit year, CMS found that access to preferred pharmacies had increased dramatically (Centers for Medicare & Medicaid Services 2016e).32 CMS has not yet released an analysis of sponsors’ pharmacy networks for their 2017 plans.
Specialty pharmaciesManufacturers of many specialty drugs manage the pharmacy channels permitted to dispense their medications by establishing a limited distribution network of specialty pharmacies (Fein 2016b). Specialty pharmacies largely provide complex therapies to patients with conditions such as cancer, hepatitis C, multiple sclerosis, and HIV/AIDS (National Association of Specialty Pharmacy 2016). Although some offer retail locations, most specialty pharmacies deliver prescriptions to the patient by mail and offer additional support services such as connecting them with patient assistance programs that may reduce their OOP cost sharing.33 Advocates contend that specialty pharmacies can lead to better patient education and improved adherence and can maintain product integrity and security. Manufacturers also collect data from specialty pharmacies in their limited distribution networks as part of their Risk Evaluation and Mitigation Strategy (REMS) or as a way to help monitor adherence and effectiveness under newer value-based payment contracts.34
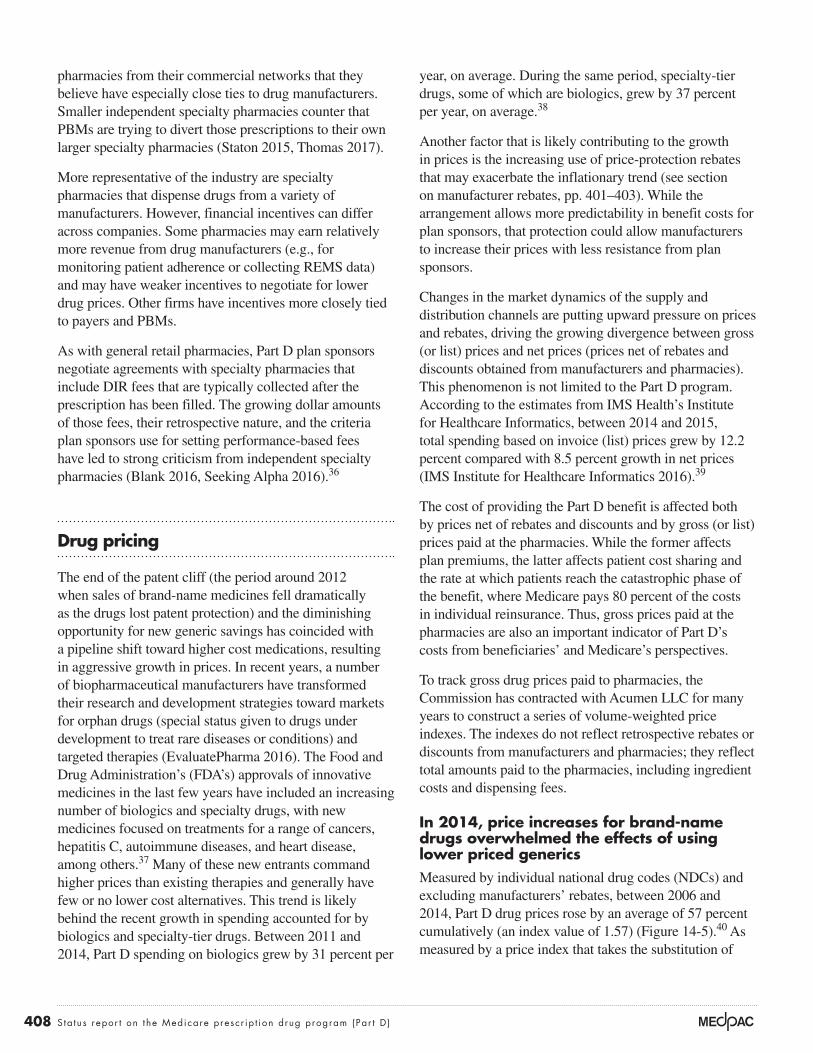
408 S ta tus repor t on the Medicare presc r ip t ion drug program (Par t D )
year, on average. During the same period, specialty-tier drugs, some of which are biologics, grew by 37 percent per year, on average.38
Another factor that is likely contributing to the growth in prices is the increasing use of price-protection rebates that may exacerbate the inflationary trend (see section on manufacturer rebates, pp. 401–403). While the arrangement allows more predictability in benefit costs for plan sponsors, that protection could allow manufacturers to increase their prices with less resistance from plan sponsors.
Changes in the market dynamics of the supply and distribution channels are putting upward pressure on prices and rebates, driving the growing divergence between gross (or list) prices and net prices (prices net of rebates and discounts obtained from manufacturers and pharmacies). This phenomenon is not limited to the Part D program. According to the estimates from IMS Health’s Institute for Healthcare Informatics, between 2014 and 2015, total spending based on invoice (list) prices grew by 12.2 percent compared with 8.5 percent growth in net prices (IMS Institute for Healthcare Informatics 2016).39
The cost of providing the Part D benefit is affected both by prices net of rebates and discounts and by gross (or list) prices paid at the pharmacies. While the former affects plan premiums, the latter affects patient cost sharing and the rate at which patients reach the catastrophic phase of the benefit, where Medicare pays 80 percent of the costs in individual reinsurance. Thus, gross prices paid at the pharmacies are also an important indicator of Part D’s costs from beneficiaries’ and Medicare’s perspectives.
To track gross drug prices paid to pharmacies, the Commission has contracted with Acumen LLC for many years to construct a series of volume-weighted price indexes. The indexes do not reflect retrospective rebates or discounts from manufacturers and pharmacies; they reflect total amounts paid to the pharmacies, including ingredient costs and dispensing fees.
In 2014, price increases for brand-name drugs overwhelmed the effects of using lower priced genericsMeasured by individual national drug codes (NDCs) and excluding manufacturers’ rebates, between 2006 and 2014, Part D drug prices rose by an average of 57 percent cumulatively (an index value of 1.57) (Figure 14-5).40 As measured by a price index that takes the substitution of
pharmacies from their commercial networks that they believe have especially close ties to drug manufacturers. Smaller independent specialty pharmacies counter that PBMs are trying to divert those prescriptions to their own larger specialty pharmacies (Staton 2015, Thomas 2017).
More representative of the industry are specialty pharmacies that dispense drugs from a variety of manufacturers. However, financial incentives can differ across companies. Some pharmacies may earn relatively more revenue from drug manufacturers (e.g., for monitoring patient adherence or collecting REMS data) and may have weaker incentives to negotiate for lower drug prices. Other firms have incentives more closely tied to payers and PBMs.
As with general retail pharmacies, Part D plan sponsors negotiate agreements with specialty pharmacies that include DIR fees that are typically collected after the prescription has been filled. The growing dollar amounts of those fees, their retrospective nature, and the criteria plan sponsors use for setting performance-based fees have led to strong criticism from independent specialty pharmacies (Blank 2016, Seeking Alpha 2016).36
Drug pricing
The end of the patent cliff (the period around 2012 when sales of brand-name medicines fell dramatically as the drugs lost patent protection) and the diminishing opportunity for new generic savings has coincided with a pipeline shift toward higher cost medications, resulting in aggressive growth in prices. In recent years, a number of biopharmaceutical manufacturers have transformed their research and development strategies toward markets for orphan drugs (special status given to drugs under development to treat rare diseases or conditions) and targeted therapies (EvaluatePharma 2016). The Food and Drug Administration’s (FDA’s) approvals of innovative medicines in the last few years have included an increasing number of biologics and specialty drugs, with new medicines focused on treatments for a range of cancers, hepatitis C, autoimmune diseases, and heart disease, among others.37 Many of these new entrants command higher prices than existing therapies and generally have few or no lower cost alternatives. This trend is likely behind the recent growth in spending accounted for by biologics and specialty-tier drugs. Between 2011 and 2014, Part D spending on biologics grew by 31 percent per
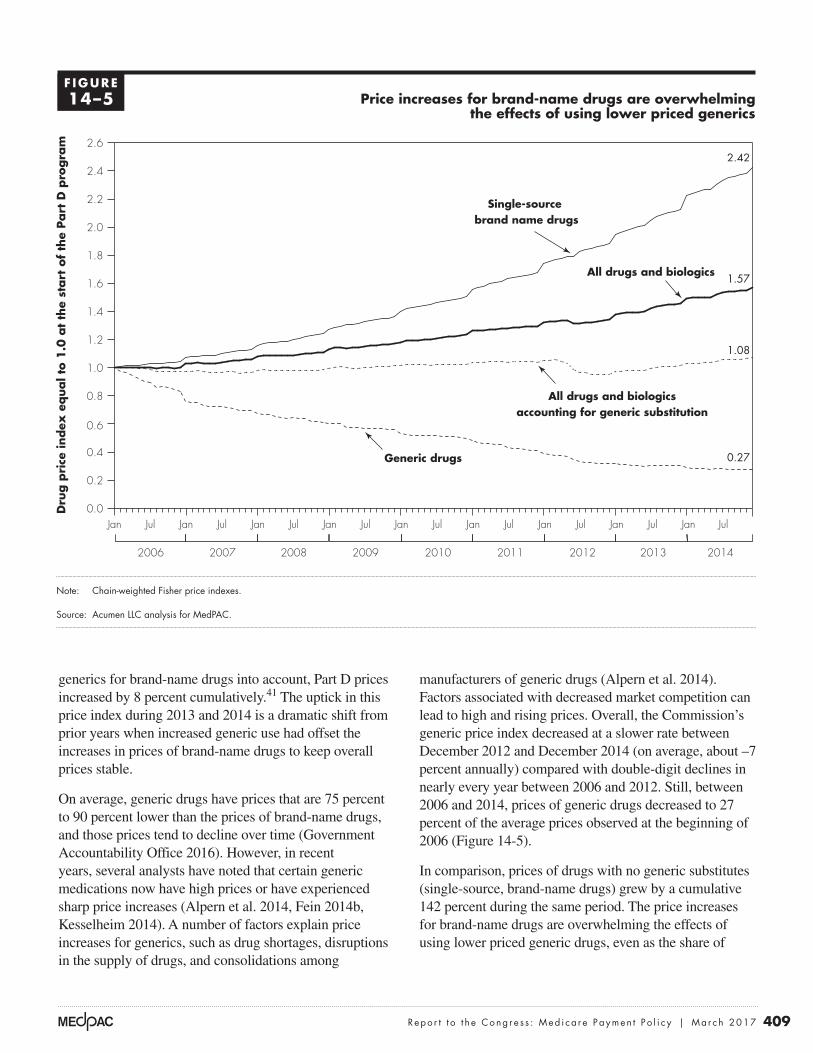
409 Repo r t t o t h e Cong r e s s : Med i ca r e Paymen t P o l i c y | Ma r ch 2017
manufacturers of generic drugs (Alpern et al. 2014). Factors associated with decreased market competition can lead to high and rising prices. Overall, the Commission’s generic price index decreased at a slower rate between December 2012 and December 2014 (on average, about –7 percent annually) compared with double-digit declines in nearly every year between 2006 and 2012. Still, between 2006 and 2014, prices of generic drugs decreased to 27 percent of the average prices observed at the beginning of 2006 (Figure 14-5).
In comparison, prices of drugs with no generic substitutes (single-source, brand-name drugs) grew by a cumulative 142 percent during the same period. The price increases for brand-name drugs are overwhelming the effects of using lower priced generic drugs, even as the share of
generics for brand-name drugs into account, Part D prices increased by 8 percent cumulatively.41 The uptick in this price index during 2013 and 2014 is a dramatic shift from prior years when increased generic use had offset the increases in prices of brand-name drugs to keep overall prices stable.
On average, generic drugs have prices that are 75 percent to 90 percent lower than the prices of brand-name drugs, and those prices tend to decline over time (Government Accountability Office 2016). However, in recent years, several analysts have noted that certain generic medications now have high prices or have experienced sharp price increases (Alpern et al. 2014, Fein 2014b, Kesselheim 2014). A number of factors explain price increases for generics, such as drug shortages, disruptions in the supply of drugs, and consolidations among
Price increases for brand-name drugs are overwhelming the effects of using lower priced generics
Note: Chain-weighted Fisher price indexes.
Source: Acumen LLC analysis for MedPAC.
Mixed success...D
rug p
rice
index
equal t
o 1
.0 a
t th
e st
art
of
the
Part
D p
rogra
m
0.0
0.2
0.4
0.6
0.8
1.0
1.2
1.4
1.6
1.8
2.0
2.2
2.4
2.6
Notes about this graph:• Data is in the datasheet. Make updates in the datasheet.• I deleted the years from the x-axis and put in my own.• I had to manually draw tick marks and axis lines because they kept resetting when I changed any data.• I changed the lines with a pattern by applying graphic styles from from the ‘figure styles’ library.• For lines with a pattern (e.g., dotted lines in a line graph), you may have to copy the line from the graph, overlay it on a different layer, join it, then make the line in the actual graph a stroke of none. Otherwise, the pattern resets from every line point and makes it funky. • I can’t delete the Illustrator legend, so I’ll just have to crop it out in InDesign. • Use direct selection tool to select items for modification. Otherwise if you use the black selection tool, they will reset to graph default when you change the data.• Use paragraph styles (and object styles) to format.
Jan Jul Jul Jul Jul Jul
FIGURE14-X
Single-source brand name drugs
All drugs and biologics
All drugs and biologicsaccounting for generic substitution
Generic drugs
2006
Jan
2007
Jan
2008
Jan Jan JulJan JulJan JulJanJulJan
2009 2010 2011 2012 2013 2014
2.42
1.08
1.57
0.27
F IGURE14–5
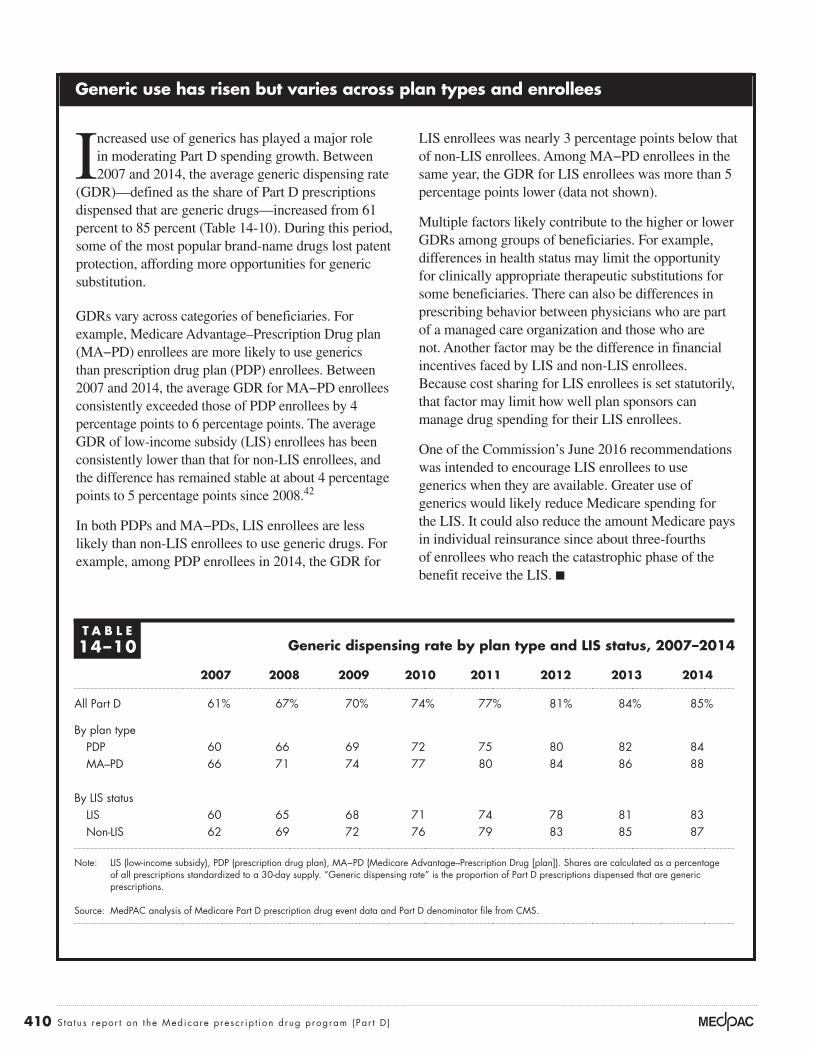
410 S ta tus repor t on the Medicare presc r ip t ion drug program (Par t D )
Generic use has risen but varies across plan types and enrollees
Increased use of generics has played a major role in moderating Part D spending growth. Between 2007 and 2014, the average generic dispensing rate
(GDR)—defined as the share of Part D prescriptions dispensed that are generic drugs—increased from 61 percent to 85 percent (Table 14-10). During this period, some of the most popular brand-name drugs lost patent protection, affording more opportunities for generic substitution.
GDRs vary across categories of beneficiaries. For example, Medicare Advantage–Prescription Drug plan (MA−PD) enrollees are more likely to use generics than prescription drug plan (PDP) enrollees. Between 2007 and 2014, the average GDR for MA−PD enrollees consistently exceeded those of PDP enrollees by 4 percentage points to 6 percentage points. The average GDR of low-income subsidy (LIS) enrollees has been consistently lower than that for non-LIS enrollees, and the difference has remained stable at about 4 percentage points to 5 percentage points since 2008.42
In both PDPs and MA−PDs, LIS enrollees are less likely than non-LIS enrollees to use generic drugs. For example, among PDP enrollees in 2014, the GDR for
LIS enrollees was nearly 3 percentage points below that of non-LIS enrollees. Among MA−PD enrollees in the same year, the GDR for LIS enrollees was more than 5 percentage points lower (data not shown).
Multiple factors likely contribute to the higher or lower GDRs among groups of beneficiaries. For example, differences in health status may limit the opportunity for clinically appropriate therapeutic substitutions for some beneficiaries. There can also be differences in prescribing behavior between physicians who are part of a managed care organization and those who are not. Another factor may be the difference in financial incentives faced by LIS and non-LIS enrollees. Because cost sharing for LIS enrollees is set statutorily, that factor may limit how well plan sponsors can manage drug spending for their LIS enrollees.
One of the Commission’s June 2016 recommendations was intended to encourage LIS enrollees to use generics when they are available. Greater use of generics would likely reduce Medicare spending for the LIS. It could also reduce the amount Medicare pays in individual reinsurance since about three-fourths of enrollees who reach the catastrophic phase of the benefit receive the LIS. ■
T A B L E14–10 Generic dispensing rate by plan type and LIS status, 2007–2014
2007 2008 2009 2010 2011 2012 2013 2014
All Part D 61% 67% 70% 74% 77% 81% 84% 85%
By plan typePDP 60 66 69 72 75 80 82 84MA–PD 66 71 74 77 80 84 86 88
By LIS statusLIS 60 65 68 71 74 78 81 83Non-LIS 62 69 72 76 79 83 85 87
Note: LIS (low-income subsidy), PDP (prescription drug plan), MA−PD (Medicare Advantage–Prescription Drug [plan]). Shares are calculated as a percentage of all prescriptions standardized to a 30-day supply. “Generic dispensing rate” is the proportion of Part D prescriptions dispensed that are generic prescriptions.
Source: MedPAC analysis of Medicare Part D prescription drug event data and Part D denominator file from CMS.
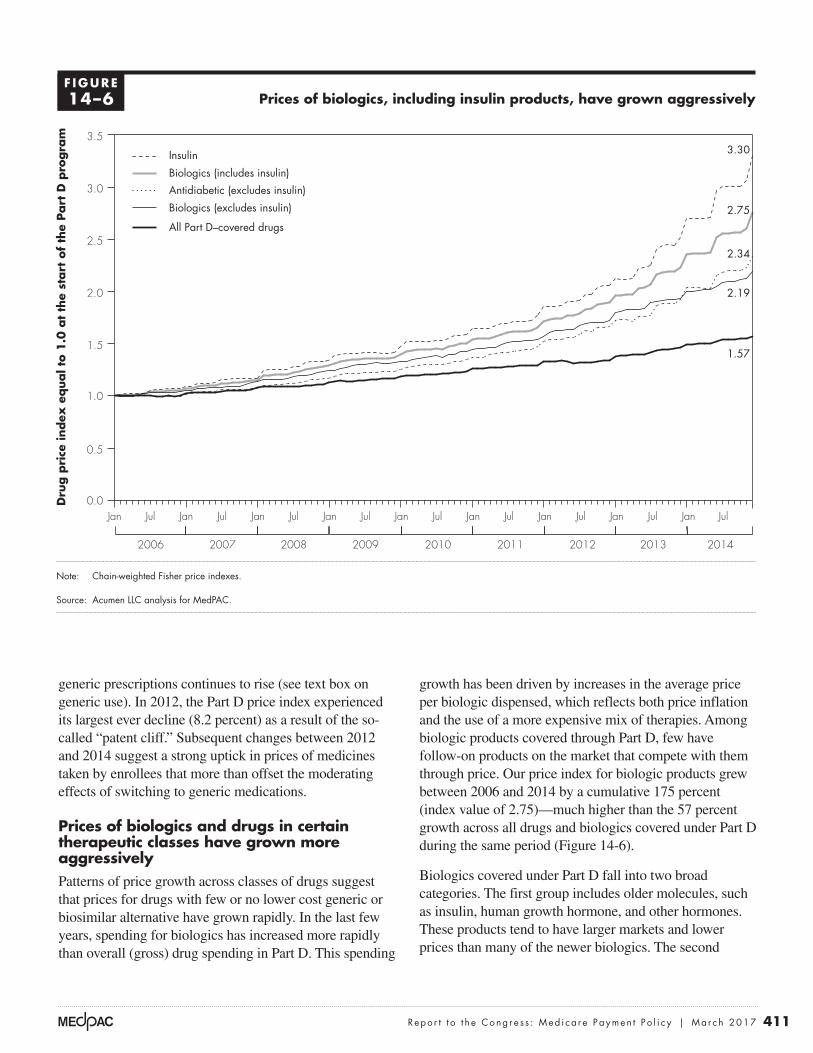
411 Repo r t t o t h e Cong r e s s : Med i ca r e Paymen t P o l i c y | Ma r ch 2017
growth has been driven by increases in the average price per biologic dispensed, which reflects both price inflation and the use of a more expensive mix of therapies. Among biologic products covered through Part D, few have follow-on products on the market that compete with them through price. Our price index for biologic products grew between 2006 and 2014 by a cumulative 175 percent (index value of 2.75)—much higher than the 57 percent growth across all drugs and biologics covered under Part D during the same period (Figure 14-6).
Biologics covered under Part D fall into two broad categories. The first group includes older molecules, such as insulin, human growth hormone, and other hormones. These products tend to have larger markets and lower prices than many of the newer biologics. The second
generic prescriptions continues to rise (see text box on generic use). In 2012, the Part D price index experienced its largest ever decline (8.2 percent) as a result of the so-called “patent cliff.” Subsequent changes between 2012 and 2014 suggest a strong uptick in prices of medicines taken by enrollees that more than offset the moderating effects of switching to generic medications.
Prices of biologics and drugs in certain therapeutic classes have grown more aggressivelyPatterns of price growth across classes of drugs suggest that prices for drugs with few or no lower cost generic or biosimilar alternative have grown rapidly. In the last few years, spending for biologics has increased more rapidly than overall (gross) drug spending in Part D. This spending
Prices of biologics, including insulin products, have grown aggressively
Note: Chain-weighted Fisher price indexes.
Source: Acumen LLC analysis for MedPAC.
Mixed success...D
rug p
rice
index
equal t
o 1
.0 a
t th
e st
art
of
the
Part
D p
rogra
m
0.0
0.5
1.0
1.5
2.0
2.5
3.0
3.5
Notes about this graph:• Data is in the datasheet. Make updates in the datasheet.• I deleted the years from the x-axis and put in my own.• I had to manually draw tick marks and axis lines because they kept resetting when I changed any data.• I changed the lines with a pattern by applying graphic styles from from the ‘figure styles’ library.• For lines with a pattern (e.g., dotted lines in a line graph), you may have to copy the line from the graph, overlay it on a different layer, join it, then make the line in the actual graph a stroke of none. Otherwise, the pattern resets from every line point and makes it funky. • I can’t delete the Illustrator legend, so I’ll just have to crop it out in InDesign. • Use direct selection tool to select items for modification. Otherwise if you use the black selection tool, they will reset to graph default when you change the data.• Use paragraph styles (and object styles) to format.
Jan Jul Jul Jul Jul Jul
FIGURE14-X
2006
Jan
2007
Jan
2008
Jan Jan JulJan JulJan JulJanJulJan
2009 2010 2011 2012 2013 2014
3.30
2.34
2.75
1.57
2.19
Insulin
Biologics (excludes insulin)
Biologics (includes insulin)
Antidiabetic (excludes insulin)
All Part D–covered drugs
F IGURE14–6
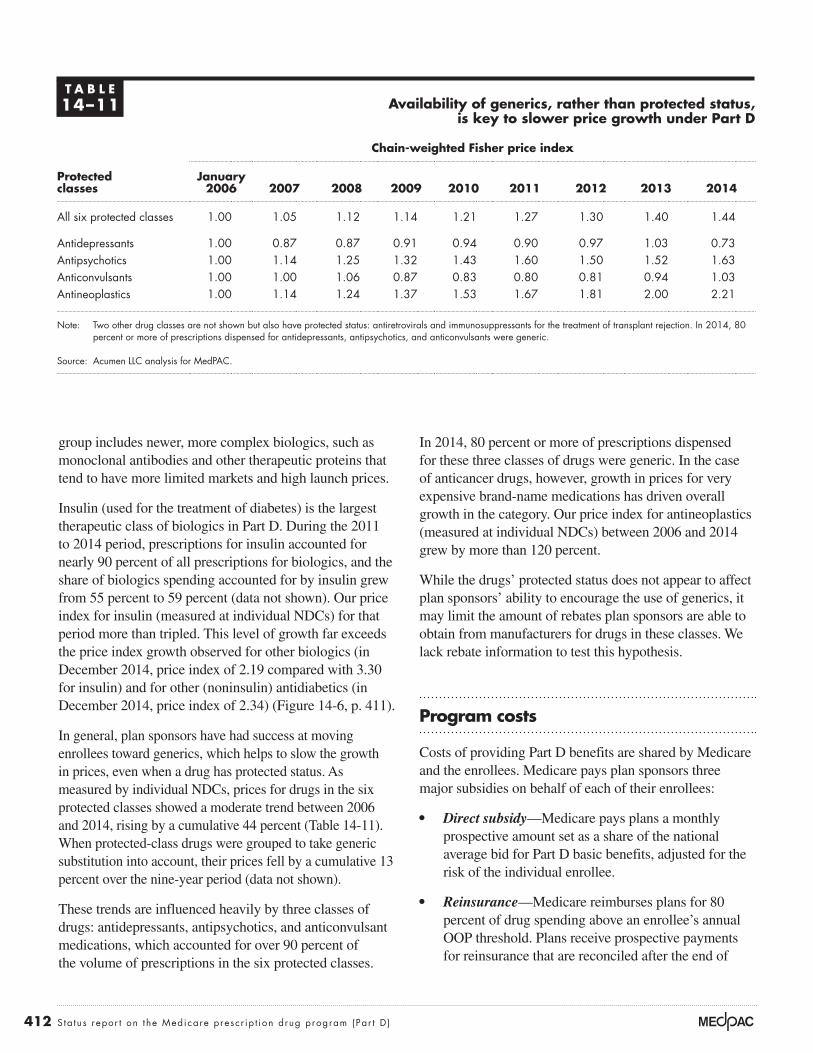
412 S ta tus repor t on the Medicare presc r ip t ion drug program (Par t D )
In 2014, 80 percent or more of prescriptions dispensed for these three classes of drugs were generic. In the case of anticancer drugs, however, growth in prices for very expensive brand-name medications has driven overall growth in the category. Our price index for antineoplastics (measured at individual NDCs) between 2006 and 2014 grew by more than 120 percent.
While the drugs’ protected status does not appear to affect plan sponsors’ ability to encourage the use of generics, it may limit the amount of rebates plan sponsors are able to obtain from manufacturers for drugs in these classes. We lack rebate information to test this hypothesis.
Program costs
Costs of providing Part D benefits are shared by Medicare and the enrollees. Medicare pays plan sponsors three major subsidies on behalf of each of their enrollees:
• Direct subsidy—Medicare pays plans a monthly prospective amount set as a share of the national average bid for Part D basic benefits, adjusted for the risk of the individual enrollee.
• Reinsurance—Medicare reimburses plans for 80 percent of drug spending above an enrollee’s annual OOP threshold. Plans receive prospective payments for reinsurance that are reconciled after the end of
group includes newer, more complex biologics, such as monoclonal antibodies and other therapeutic proteins that tend to have more limited markets and high launch prices.
Insulin (used for the treatment of diabetes) is the largest therapeutic class of biologics in Part D. During the 2011 to 2014 period, prescriptions for insulin accounted for nearly 90 percent of all prescriptions for biologics, and the share of biologics spending accounted for by insulin grew from 55 percent to 59 percent (data not shown). Our price index for insulin (measured at individual NDCs) for that period more than tripled. This level of growth far exceeds the price index growth observed for other biologics (in December 2014, price index of 2.19 compared with 3.30 for insulin) and for other (noninsulin) antidiabetics (in December 2014, price index of 2.34) (Figure 14-6, p. 411).
In general, plan sponsors have had success at moving enrollees toward generics, which helps to slow the growth in prices, even when a drug has protected status. As measured by individual NDCs, prices for drugs in the six protected classes showed a moderate trend between 2006 and 2014, rising by a cumulative 44 percent (Table 14-11). When protected-class drugs were grouped to take generic substitution into account, their prices fell by a cumulative 13 percent over the nine-year period (data not shown).
These trends are influenced heavily by three classes of drugs: antidepressants, antipsychotics, and anticonvulsant medications, which accounted for over 90 percent of the volume of prescriptions in the six protected classes.
T A B L E14–11 Availability of generics, rather than protected status,
is key to slower price growth under Part D
Protected classes
Chain-weighted Fisher price index
January 2006 2007 2008 2009 2010 2011 2012 2013 2014
All six protected classes 1.00 1.05 1.12 1.14 1.21 1.27 1.30 1.40 1.44
Antidepressants 1.00 0.87 0.87 0.91 0.94 0.90 0.97 1.03 0.73Antipsychotics 1.00 1.14 1.25 1.32 1.43 1.60 1.50 1.52 1.63Anticonvulsants 1.00 1.00 1.06 0.87 0.83 0.80 0.81 0.94 1.03Antineoplastics 1.00 1.14 1.24 1.37 1.53 1.67 1.81 2.00 2.21
Note: Two other drug classes are not shown but also have protected status: antiretrovirals and immunosuppressants for the treatment of transplant rejection. In 2014, 80 percent or more of prescriptions dispensed for antidepressants, antipsychotics, and anticonvulsants were generic.
Source: Acumen LLC analysis for MedPAC.
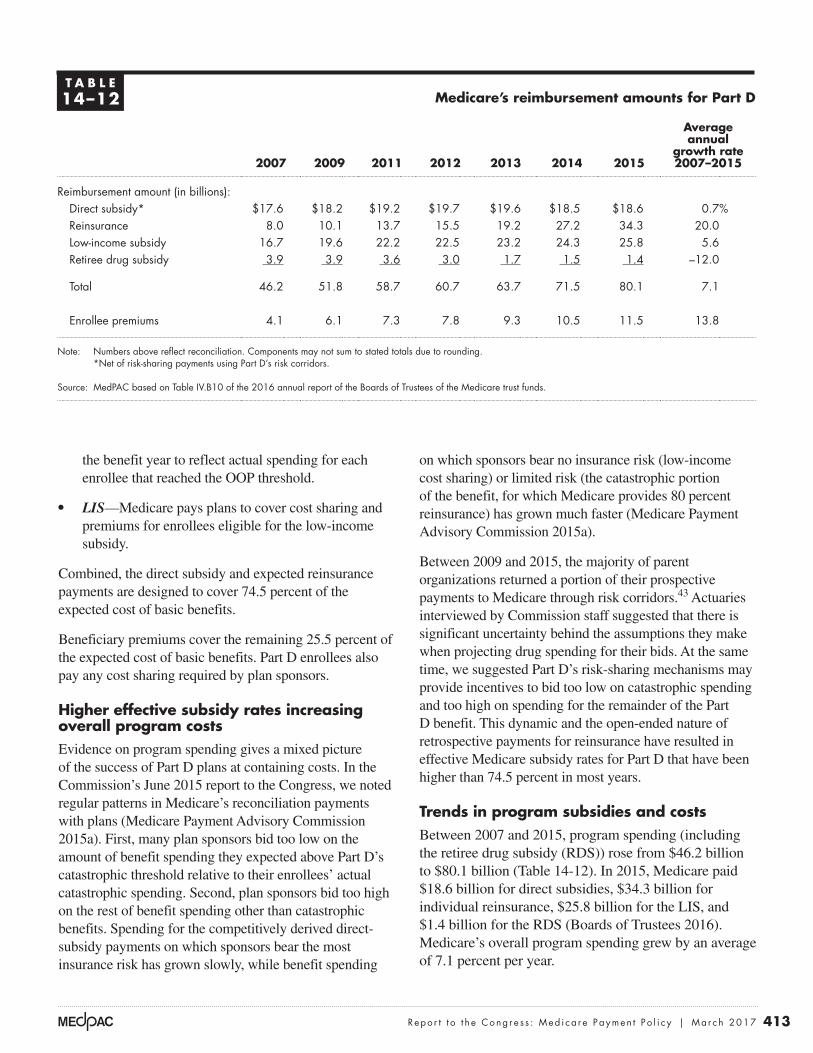
413 Repo r t t o t h e Cong r e s s : Med i ca r e Paymen t P o l i c y | Ma r ch 2017
on which sponsors bear no insurance risk (low-income cost sharing) or limited risk (the catastrophic portion of the benefit, for which Medicare provides 80 percent reinsurance) has grown much faster (Medicare Payment Advisory Commission 2015a).
Between 2009 and 2015, the majority of parent organizations returned a portion of their prospective payments to Medicare through risk corridors.43 Actuaries interviewed by Commission staff suggested that there is significant uncertainty behind the assumptions they make when projecting drug spending for their bids. At the same time, we suggested Part D’s risk-sharing mechanisms may provide incentives to bid too low on catastrophic spending and too high on spending for the remainder of the Part D benefit. This dynamic and the open-ended nature of retrospective payments for reinsurance have resulted in effective Medicare subsidy rates for Part D that have been higher than 74.5 percent in most years.
Trends in program subsidies and costsBetween 2007 and 2015, program spending (including the retiree drug subsidy (RDS)) rose from $46.2 billion to $80.1 billion (Table 14-12). In 2015, Medicare paid $18.6 billion for direct subsidies, $34.3 billion for individual reinsurance, $25.8 billion for the LIS, and $1.4 billion for the RDS (Boards of Trustees 2016). Medicare’s overall program spending grew by an average of 7.1 percent per year.
the benefit year to reflect actual spending for each enrollee that reached the OOP threshold.
• LIS—Medicare pays plans to cover cost sharing and premiums for enrollees eligible for the low-income subsidy.
Combined, the direct subsidy and expected reinsurance payments are designed to cover 74.5 percent of the expected cost of basic benefits.
Beneficiary premiums cover the remaining 25.5 percent of the expected cost of basic benefits. Part D enrollees also pay any cost sharing required by plan sponsors.
Higher effective subsidy rates increasing overall program costsEvidence on program spending gives a mixed picture of the success of Part D plans at containing costs. In the Commission’s June 2015 report to the Congress, we noted regular patterns in Medicare’s reconciliation payments with plans (Medicare Payment Advisory Commission 2015a). First, many plan sponsors bid too low on the amount of benefit spending they expected above Part D’s catastrophic threshold relative to their enrollees’ actual catastrophic spending. Second, plan sponsors bid too high on the rest of benefit spending other than catastrophic benefits. Spending for the competitively derived direct-subsidy payments on which sponsors bear the most insurance risk has grown slowly, while benefit spending
T A B L E14–12 Medicare’s reimbursement amounts for Part D
Average annual
growth rate 2007–20152007 2009 2011 2012 2013 2014 2015
Reimbursement amount (in billions):Direct subsidy* $17.6 $18.2 $19.2 $19.7 $19.6 $18.5 $18.6 0.7%Reinsurance 8.0 10.1 13.7 15.5 19.2 27.2 34.3 20.0Low-income subsidy 16.7 19.6 22.2 22.5 23.2 24.3 25.8 5.6Retiree drug subsidy 3.9 3.9 3.6 3.0 1.7 1.5 1.4 –12.0
Total 46.2 51.8 58.7 60.7 63.7 71.5 80.1 7.1
Enrollee premiums 4.1 6.1 7.3 7.8 9.3 10.5 11.5 13.8
Note: Numbers above reflect reconciliation. Components may not sum to stated totals due to rounding. *Net of risk-sharing payments using Part D’s risk corridors.
Source: MedPAC based on Table IV.B10 of the 2016 annual report of the Boards of Trustees of the Medicare trust funds.
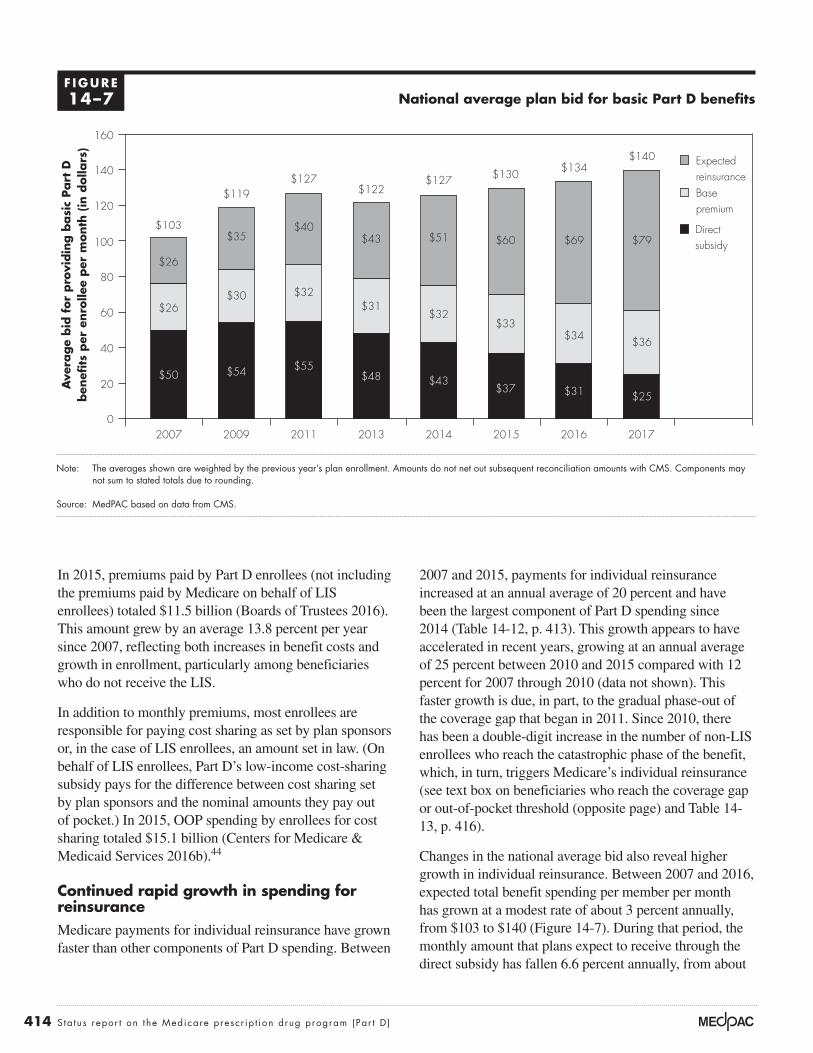
414 S ta tus repor t on the Medicare presc r ip t ion drug program (Par t D )
2007 and 2015, payments for individual reinsurance increased at an annual average of 20 percent and have been the largest component of Part D spending since 2014 (Table 14-12, p. 413). This growth appears to have accelerated in recent years, growing at an annual average of 25 percent between 2010 and 2015 compared with 12 percent for 2007 through 2010 (data not shown). This faster growth is due, in part, to the gradual phase-out of the coverage gap that began in 2011. Since 2010, there has been a double-digit increase in the number of non-LIS enrollees who reach the catastrophic phase of the benefit, which, in turn, triggers Medicare’s individual reinsurance (see text box on beneficiaries who reach the coverage gap or out-of-pocket threshold (opposite page) and Table 14-13, p. 416).
Changes in the national average bid also reveal higher growth in individual reinsurance. Between 2007 and 2016, expected total benefit spending per member per month has grown at a modest rate of about 3 percent annually, from $103 to $140 (Figure 14-7). During that period, the monthly amount that plans expect to receive through the direct subsidy has fallen 6.6 percent annually, from about
In 2015, premiums paid by Part D enrollees (not including the premiums paid by Medicare on behalf of LIS enrollees) totaled $11.5 billion (Boards of Trustees 2016). This amount grew by an average 13.8 percent per year since 2007, reflecting both increases in benefit costs and growth in enrollment, particularly among beneficiaries who do not receive the LIS.
In addition to monthly premiums, most enrollees are responsible for paying cost sharing as set by plan sponsors or, in the case of LIS enrollees, an amount set in law. (On behalf of LIS enrollees, Part D’s low-income cost-sharing subsidy pays for the difference between cost sharing set by plan sponsors and the nominal amounts they pay out of pocket.) In 2015, OOP spending by enrollees for cost sharing totaled $15.1 billion (Centers for Medicare & Medicaid Services 2016b).44
Continued rapid growth in spending for reinsuranceMedicare payments for individual reinsurance have grown faster than other components of Part D spending. Between
National average plan bid for basic Part D benefits
Note: The averages shown are weighted by the previous year’s plan enrollment. Amounts do not net out subsequent reconciliation amounts with CMS. Components may not sum to stated totals due to rounding.
Source: MedPAC based on data from CMS.
Cumulative change....FIGUREX-X
Note: Note and Source are in InDesign.
Source:
Ave
rage
bid
for
pro
vidin
g b
asi
c Part
Dben
efits
per
enro
llee
per
month
(in
dolla
rs)
0
20
40
60
80
100
120
140
160
20172016201520142013201120092007
$26
$50
$26
$103
$54
$30
$35
$119
$55
$32
$40
$127
$43
$32
$51
$127
$37
$33
$60
$130
$31
$34
$69
$134
$25
$36
$79
$140
$48
$31
$43
$122
Direct subsidy
Base premium
Expectedreinsurance
F IGURE14–7
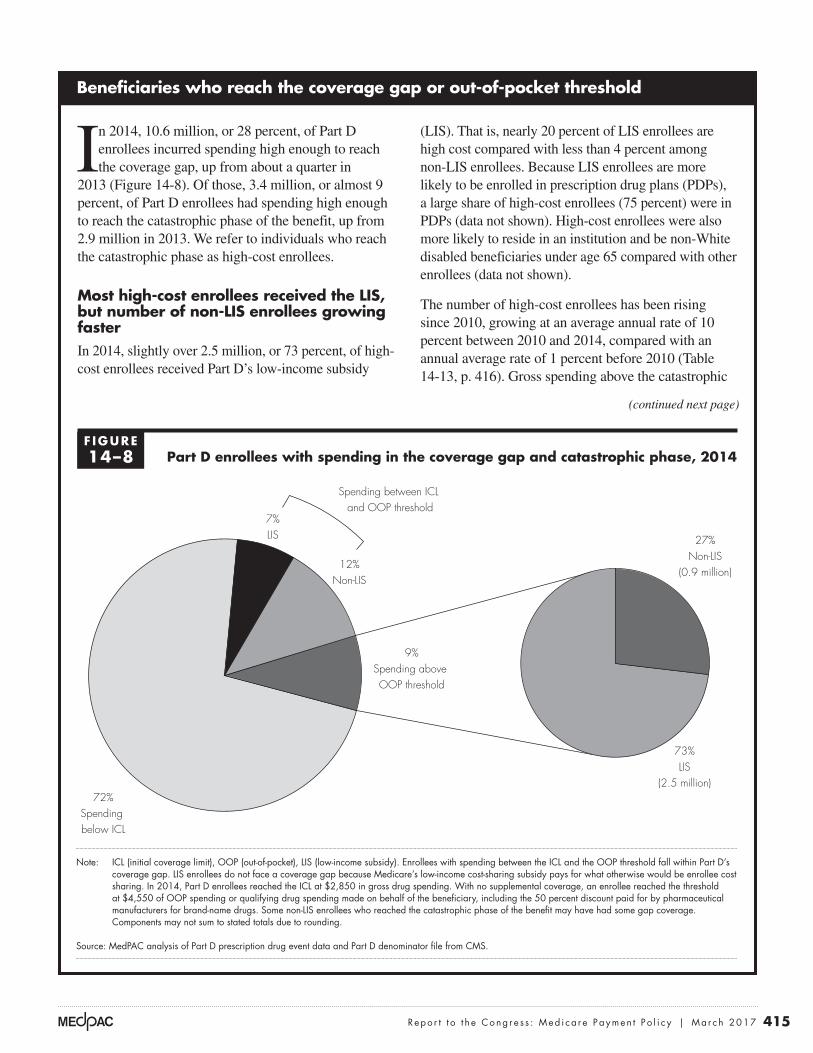
415 Repo r t t o t h e Cong r e s s : Med i ca r e Paymen t P o l i c y | Ma r ch 2017
Beneficiaries who reach the coverage gap or out-of-pocket threshold
In 2014, 10.6 million, or 28 percent, of Part D enrollees incurred spending high enough to reach the coverage gap, up from about a quarter in
2013 (Figure 14-8). Of those, 3.4 million, or almost 9 percent, of Part D enrollees had spending high enough to reach the catastrophic phase of the benefit, up from 2.9 million in 2013. We refer to individuals who reach the catastrophic phase as high-cost enrollees.
Most high-cost enrollees received the LIS, but number of non-LIS enrollees growing fasterIn 2014, slightly over 2.5 million, or 73 percent, of high-cost enrollees received Part D’s low-income subsidy
(LIS). That is, nearly 20 percent of LIS enrollees are high cost compared with less than 4 percent among non-LIS enrollees. Because LIS enrollees are more likely to be enrolled in prescription drug plans (PDPs), a large share of high-cost enrollees (75 percent) were in PDPs (data not shown). High-cost enrollees were also more likely to reside in an institution and be non-White disabled beneficiaries under age 65 compared with other enrollees (data not shown).
The number of high-cost enrollees has been rising since 2010, growing at an average annual rate of 10 percent between 2010 and 2014, compared with an annual average rate of 1 percent before 2010 (Table 14-13, p. 416). Gross spending above the catastrophic
(continued next page)
Part D enrollees with spending in the coverage gap and catastrophic phase, 2014
Note: ICL (initial coverage limit), OOP (out-of-pocket), LIS (low-income subsidy). Enrollees with spending between the ICL and the OOP threshold fall within Part D’s coverage gap. LIS enrollees do not face a coverage gap because Medicare’s low-income cost-sharing subsidy pays for what otherwise would be enrollee cost sharing. In 2014, Part D enrollees reached the ICL at $2,850 in gross drug spending. With no supplemental coverage, an enrollee reached the threshold at $4,550 of OOP spending or qualifying drug spending made on behalf of the beneficiary, including the 50 percent discount paid for by pharmaceutical manufacturers for brand-name drugs. Some non-LIS enrollees who reached the catastrophic phase of the benefit may have had some gap coverage. Components may not sum to stated totals due to rounding.
Source: MedPAC analysis of Part D prescription drug event data and Part D denominator file from CMS.
Medicare population
Note: Note and Source are in InDesign.
Source:
FIGURE1-3
7%LIS
12%Non-LIS
9%Spending above OOP threshold
Spending between ICL and OOP threshold
72%Spending below ICL
27%Non-LIS
(0.9 million)
73%LIS
(2.5 million)
F IGURE14–8
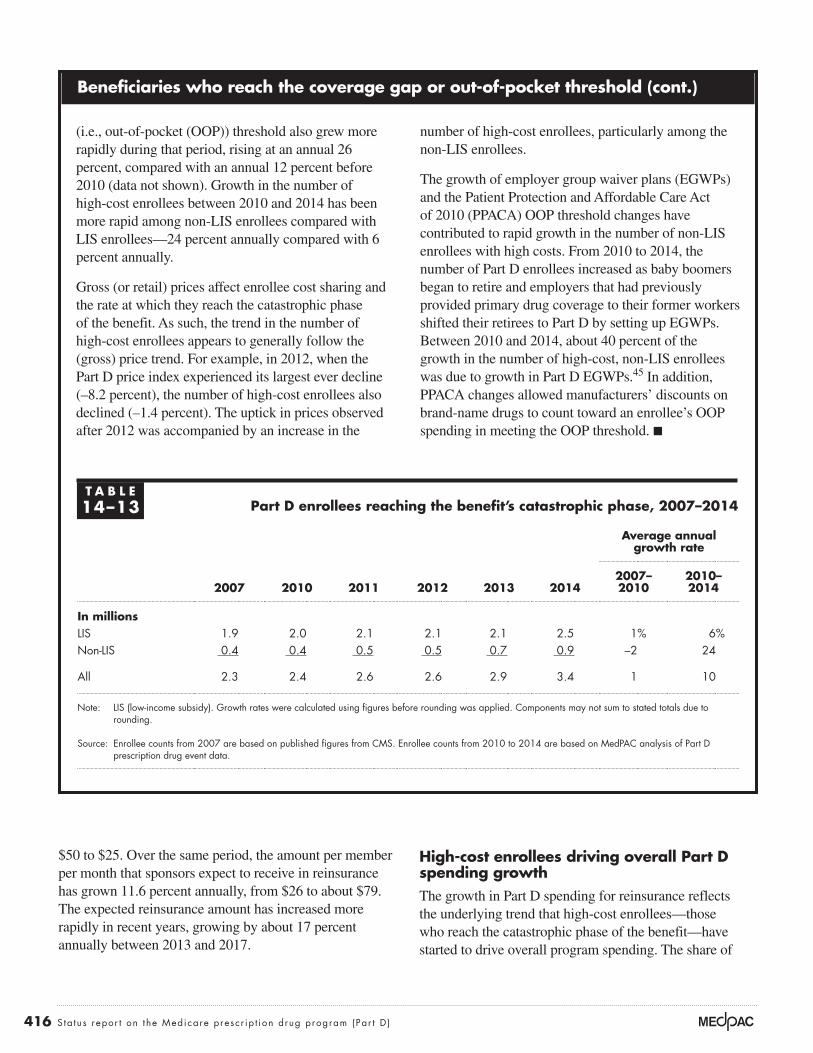
416 S ta tus repor t on the Medicare presc r ip t ion drug program (Par t D )
High-cost enrollees driving overall Part D spending growthThe growth in Part D spending for reinsurance reflects the underlying trend that high-cost enrollees—those who reach the catastrophic phase of the benefit—have started to drive overall program spending. The share of
$50 to $25. Over the same period, the amount per member per month that sponsors expect to receive in reinsurance has grown 11.6 percent annually, from $26 to about $79. The expected reinsurance amount has increased more rapidly in recent years, growing by about 17 percent annually between 2013 and 2017.
Beneficiaries who reach the coverage gap or out-of-pocket threshold (cont.)
(i.e., out-of-pocket (OOP)) threshold also grew more rapidly during that period, rising at an annual 26 percent, compared with an annual 12 percent before 2010 (data not shown). Growth in the number of high-cost enrollees between 2010 and 2014 has been more rapid among non-LIS enrollees compared with LIS enrollees—24 percent annually compared with 6 percent annually.
Gross (or retail) prices affect enrollee cost sharing and the rate at which they reach the catastrophic phase of the benefit. As such, the trend in the number of high-cost enrollees appears to generally follow the (gross) price trend. For example, in 2012, when the Part D price index experienced its largest ever decline (–8.2 percent), the number of high-cost enrollees also declined (–1.4 percent). The uptick in prices observed after 2012 was accompanied by an increase in the
number of high-cost enrollees, particularly among the non-LIS enrollees.
The growth of employer group waiver plans (EGWPs) and the Patient Protection and Affordable Care Act of 2010 (PPACA) OOP threshold changes have contributed to rapid growth in the number of non-LIS enrollees with high costs. From 2010 to 2014, the number of Part D enrollees increased as baby boomers began to retire and employers that had previously provided primary drug coverage to their former workers shifted their retirees to Part D by setting up EGWPs. Between 2010 and 2014, about 40 percent of the growth in the number of high-cost, non-LIS enrollees was due to growth in Part D EGWPs.45 In addition, PPACA changes allowed manufacturers’ discounts on brand-name drugs to count toward an enrollee’s OOP spending in meeting the OOP threshold. ■
T A B L E14–13 Part D enrollees reaching the benefit’s catastrophic phase, 2007–2014
Average annual growth rate
2007 2010 2011 2012 2013 20142007– 2010
2010– 2014
In millionsLIS 1.9 2.0 2.1 2.1 2.1 2.5 1% 6%Non-LIS 0.4 0.4 0.5 0.5 0.7 0.9 –2 24
All 2.3 2.4 2.6 2.6 2.9 3.4 1 10
Note: LIS (low-income subsidy). Growth rates were calculated using figures before rounding was applied. Components may not sum to stated totals due to rounding.
Source: Enrollee counts from 2007 are based on published figures from CMS. Enrollee counts from 2010 to 2014 are based on MedPAC analysis of Part D prescription drug event data.
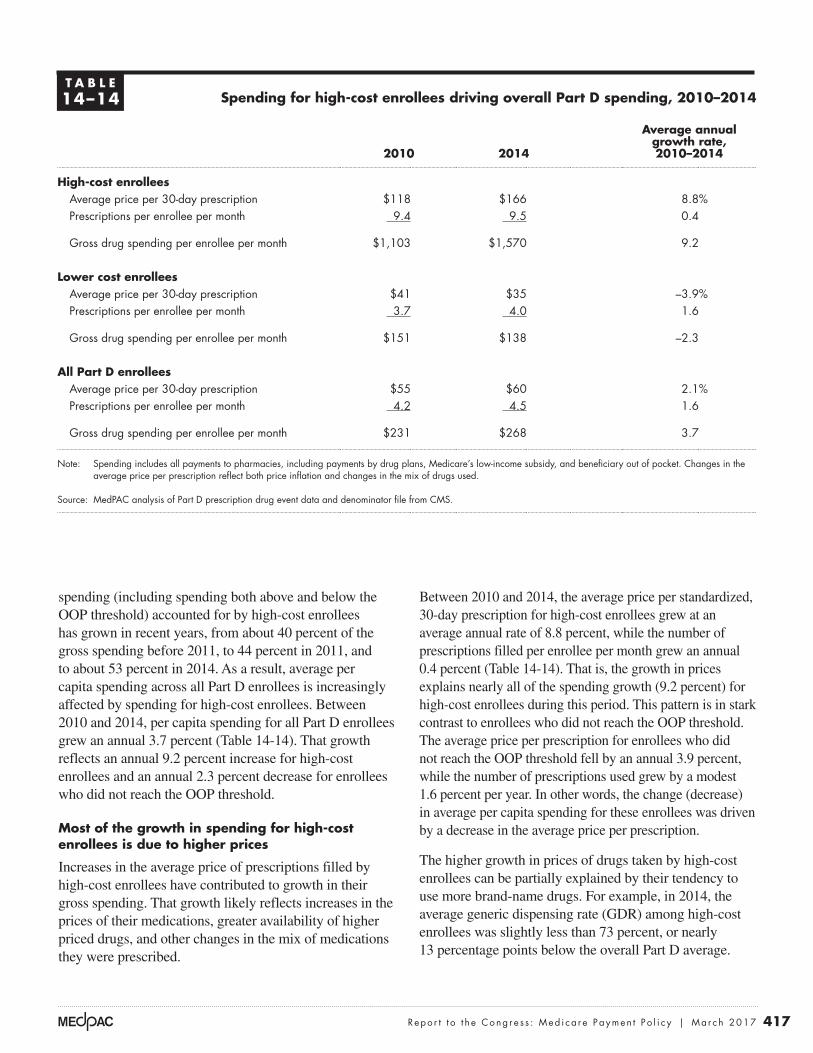
417 Repo r t t o t h e Cong r e s s : Med i ca r e Paymen t P o l i c y | Ma r ch 2017
Between 2010 and 2014, the average price per standardized, 30-day prescription for high-cost enrollees grew at an average annual rate of 8.8 percent, while the number of prescriptions filled per enrollee per month grew an annual 0.4 percent (Table 14-14). That is, the growth in prices explains nearly all of the spending growth (9.2 percent) for high-cost enrollees during this period. This pattern is in stark contrast to enrollees who did not reach the OOP threshold. The average price per prescription for enrollees who did not reach the OOP threshold fell by an annual 3.9 percent, while the number of prescriptions used grew by a modest 1.6 percent per year. In other words, the change (decrease) in average per capita spending for these enrollees was driven by a decrease in the average price per prescription.
The higher growth in prices of drugs taken by high-cost enrollees can be partially explained by their tendency to use more brand-name drugs. For example, in 2014, the average generic dispensing rate (GDR) among high-cost enrollees was slightly less than 73 percent, or nearly 13 percentage points below the overall Part D average.
spending (including spending both above and below the OOP threshold) accounted for by high-cost enrollees has grown in recent years, from about 40 percent of the gross spending before 2011, to 44 percent in 2011, and to about 53 percent in 2014. As a result, average per capita spending across all Part D enrollees is increasingly affected by spending for high-cost enrollees. Between 2010 and 2014, per capita spending for all Part D enrollees grew an annual 3.7 percent (Table 14-14). That growth reflects an annual 9.2 percent increase for high-cost enrollees and an annual 2.3 percent decrease for enrollees who did not reach the OOP threshold.
Most of the growth in spending for high-cost enrollees is due to higher prices
Increases in the average price of prescriptions filled by high-cost enrollees have contributed to growth in their gross spending. That growth likely reflects increases in the prices of their medications, greater availability of higher priced drugs, and other changes in the mix of medications they were prescribed.
T A B L E14–14 Spending for high-cost enrollees driving overall Part D spending, 2010–2014
2010 2014
Average annual growth rate, 2010–2014
High-cost enrolleesAverage price per 30-day prescription $118 $166 8.8%Prescriptions per enrollee per month 9.4 9.5 0.4
Gross drug spending per enrollee per month $1,103 $1,570 9.2
Lower cost enrolleesAverage price per 30-day prescription $41 $35 –3.9%Prescriptions per enrollee per month 3.7 4.0 1.6
Gross drug spending per enrollee per month $151 $138 –2.3
All Part D enrolleesAverage price per 30-day prescription $55 $60 2.1%Prescriptions per enrollee per month 4.2 4.5 1.6
Gross drug spending per enrollee per month $231 $268 3.7
Note: Spending includes all payments to pharmacies, including payments by drug plans, Medicare’s low-income subsidy, and beneficiary out of pocket. Changes in the average price per prescription reflect both price inflation and changes in the mix of drugs used.
Source: MedPAC analysis of Part D prescription drug event data and denominator file from CMS.
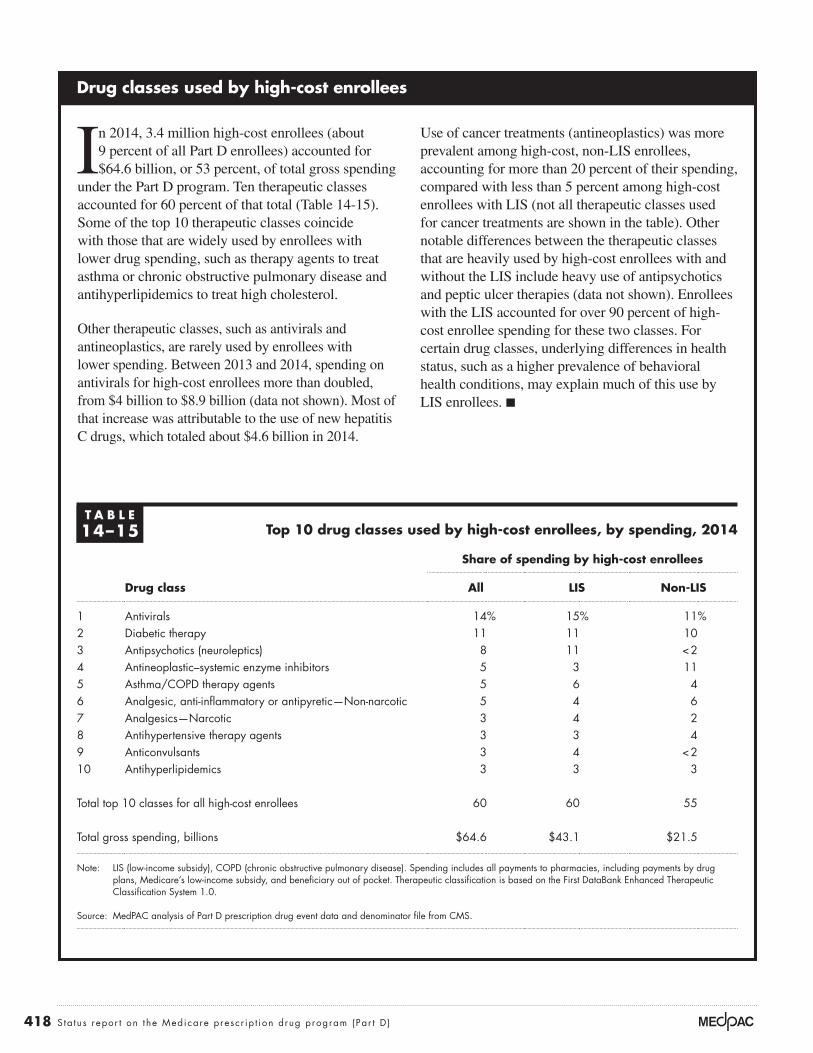
418 S ta tus repor t on the Medicare presc r ip t ion drug program (Par t D )
Drug classes used by high-cost enrollees
In 2014, 3.4 million high-cost enrollees (about 9 percent of all Part D enrollees) accounted for $64.6 billion, or 53 percent, of total gross spending
under the Part D program. Ten therapeutic classes accounted for 60 percent of that total (Table 14-15). Some of the top 10 therapeutic classes coincide with those that are widely used by enrollees with lower drug spending, such as therapy agents to treat asthma or chronic obstructive pulmonary disease and antihyperlipidemics to treat high cholesterol.
Other therapeutic classes, such as antivirals and antineoplastics, are rarely used by enrollees with lower spending. Between 2013 and 2014, spending on antivirals for high-cost enrollees more than doubled, from $4 billion to $8.9 billion (data not shown). Most of that increase was attributable to the use of new hepatitis C drugs, which totaled about $4.6 billion in 2014.
Use of cancer treatments (antineoplastics) was more prevalent among high-cost, non-LIS enrollees, accounting for more than 20 percent of their spending, compared with less than 5 percent among high-cost enrollees with LIS (not all therapeutic classes used for cancer treatments are shown in the table). Other notable differences between the therapeutic classes that are heavily used by high-cost enrollees with and without the LIS include heavy use of antipsychotics and peptic ulcer therapies (data not shown). Enrollees with the LIS accounted for over 90 percent of high-cost enrollee spending for these two classes. For certain drug classes, underlying differences in health status, such as a higher prevalence of behavioral health conditions, may explain much of this use by LIS enrollees. ■
T A B L E14–15 Top 10 drug classes used by high-cost enrollees, by spending, 2014
Share of spending by high-cost enrollees
Drug class All LIS Non-LIS
1 Antivirals 14% 15% 11%2 Diabetic therapy 11 11 103 Antipsychotics (neuroleptics) 8 11 < 24 Antineoplastic–systemic enzyme inhibitors 5 3 115 Asthma/COPD therapy agents 5 6 46 Analgesic, anti-inflammatory or antipyretic—Non-narcotic 5 4 67 Analgesics—Narcotic 3 4 28 Antihypertensive therapy agents 3 3 49 Anticonvulsants 3 4 < 210 Antihyperlipidemics 3 3 3
Total top 10 classes for all high-cost enrollees 60 60 55
Total gross spending, billions $64.6 $43.1 $21.5
Note: LIS (low-income subsidy), COPD (chronic obstructive pulmonary disease). Spending includes all payments to pharmacies, including payments by drug plans, Medicare’s low-income subsidy, and beneficiary out of pocket. Therapeutic classification is based on the First DataBank Enhanced Therapeutic Classification System 1.0.
Source: MedPAC analysis of Part D prescription drug event data and denominator file from CMS.
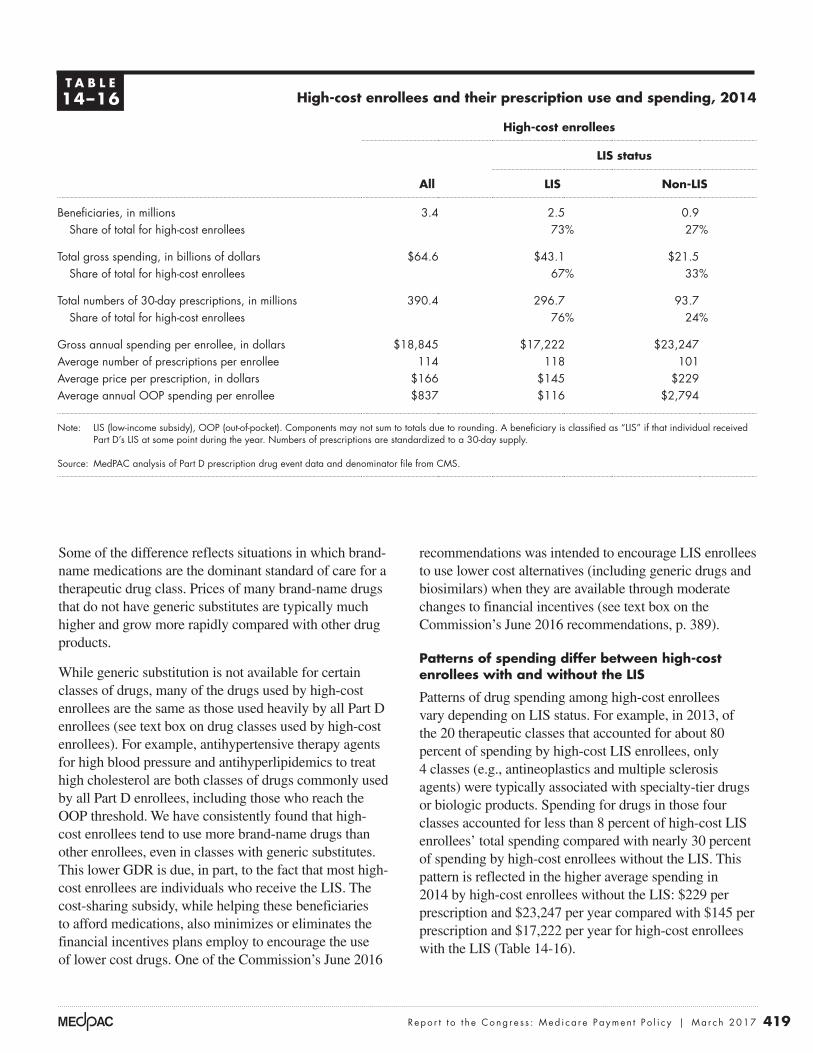
419 Repo r t t o t h e Cong r e s s : Med i ca r e Paymen t P o l i c y | Ma r ch 2017
recommendations was intended to encourage LIS enrollees to use lower cost alternatives (including generic drugs and biosimilars) when they are available through moderate changes to financial incentives (see text box on the Commission’s June 2016 recommendations, p. 389).
Patterns of spending differ between high-cost enrollees with and without the LIS
Patterns of drug spending among high-cost enrollees vary depending on LIS status. For example, in 2013, of the 20 therapeutic classes that accounted for about 80 percent of spending by high-cost LIS enrollees, only 4 classes (e.g., antineoplastics and multiple sclerosis agents) were typically associated with specialty-tier drugs or biologic products. Spending for drugs in those four classes accounted for less than 8 percent of high-cost LIS enrollees’ total spending compared with nearly 30 percent of spending by high-cost enrollees without the LIS. This pattern is reflected in the higher average spending in 2014 by high-cost enrollees without the LIS: $229 per prescription and $23,247 per year compared with $145 per prescription and $17,222 per year for high-cost enrollees with the LIS (Table 14-16).
Some of the difference reflects situations in which brand-name medications are the dominant standard of care for a therapeutic drug class. Prices of many brand-name drugs that do not have generic substitutes are typically much higher and grow more rapidly compared with other drug products.
While generic substitution is not available for certain classes of drugs, many of the drugs used by high-cost enrollees are the same as those used heavily by all Part D enrollees (see text box on drug classes used by high-cost enrollees). For example, antihypertensive therapy agents for high blood pressure and antihyperlipidemics to treat high cholesterol are both classes of drugs commonly used by all Part D enrollees, including those who reach the OOP threshold. We have consistently found that high-cost enrollees tend to use more brand-name drugs than other enrollees, even in classes with generic substitutes. This lower GDR is due, in part, to the fact that most high-cost enrollees are individuals who receive the LIS. The cost-sharing subsidy, while helping these beneficiaries to afford medications, also minimizes or eliminates the financial incentives plans employ to encourage the use of lower cost drugs. One of the Commission’s June 2016
T A B L E14–16 High-cost enrollees and their prescription use and spending, 2014
High-cost enrollees
All
LIS status
LIS Non-LIS
Beneficiaries, in millions 3.4 2.5 0.9Share of total for high-cost enrollees 73% 27%
Total gross spending, in billions of dollars $64.6 $43.1 $21.5Share of total for high-cost enrollees 67% 33%
Total numbers of 30-day prescriptions, in millions 390.4 296.7 93.7Share of total for high-cost enrollees 76% 24%
Gross annual spending per enrollee, in dollars $18,845 $17,222 $23,247Average number of prescriptions per enrollee 114 118 101Average price per prescription, in dollars $166 $145 $229Average annual OOP spending per enrollee $837 $116 $2,794
Note: LIS (low-income subsidy), OOP (out-of-pocket). Components may not sum to totals due to rounding. A beneficiary is classified as “LIS” if that individual received
Part D’s LIS at some point during the year. Numbers of prescriptions are standardized to a 30-day supply.
Source: MedPAC analysis of Part D prescription drug event data and denominator file from CMS.

420 S ta tus repor t on the Medicare presc r ip t ion drug program (Par t D )
If larger numbers of beneficiaries begin to use specialty drugs at the same time that Part D’s coverage gap is eliminated, the number who reach the OOP threshold will continue to rise. In turn, Medicare spending for individual reinsurance and low-income cost sharing will also rise.
Beneficiaries’ access to prescription drugs
A key goal for the Part D program is to provide Medicare beneficiaries with good access to clinically appropriate medications while remaining financially sustainable to taxpayers. That goal involves finding a balance between managing medication therapies to encourage adherence to drugs with good therapeutic value while being judicious about whether the overall number and mix of medicines prescribed is beneficial to a particular patient (Medicare Payment Advisory Commission 2016c). Formulary management is one of the most important tools used by plan sponsors to strike this balance.
Greater flexibility to use management tools could help ensure that prescribed medicines are safe and appropriate for the patient, potentially reducing overuse and misuse. However, for some beneficiaries, those same tools could also limit access to needed medications. To ensure beneficiary access, CMS reviews and approves each plan’s formulary to ensure that Part D plans are providing good access to a wide range of therapeutic classes used by the Medicare population. Part D law also requires sponsors to have a transition process to ensure that new enrollees, as well as current members whose drugs are no longer covered or are subject to new restrictions, have access to the medicines they have already been taking.48 Medicare requires plan sponsors to establish coverage determination and appeals processes with the explicit goal of ensuring that plan formularies do not impede access to needed medications.
Part D’s exceptions and appeals processPart D’s exceptions and appeals process is complex, involving multiple levels (Medicare Payment Advisory Commission 2014b). It begins when an enrollee’s prescription is denied at the pharmacy because of a plan’s utilization management or cost-sharing requirements, or because the drug is not listed on the plan’s formulary. The pharmacy is required to provide the enrollee with written information on how to obtain a detailed written notice from the enrollee’s plan about why the benefit was
High-cost LIS enrollees pay lower cost sharing out of pocket than high-cost non-LIS enrollees. Average annual OOP cost-sharing amounts for high-cost LIS enrollees were $116 compared with $2,794 among non-LIS enrollees. One might expect average annual OOP spending for high-cost non-LIS enrollees to be higher than $4,550, which was Part D’s OOP threshold in 2014. The average amount is lower primarily because those enrollees received credit that counted as OOP spending for the 50 percent discount provided by brand-name manufacturers in the coverage gap.
Use of higher cost drugs poses challenges for Part DDrugs with very high prices pose a particular challenge for Part D. As more expensive therapies become available, larger numbers of beneficiaries will reach the catastrophic phase of the benefit, when Medicare pays for 80 percent of the costs through individual reinsurance. The use of higher cost drugs and biologics has already been growing rapidly in the last few years. Between 2010 and 2014, the use of drugs placed on specialty tiers has grown by an annual average of more than 20 percent, compared with about 2 percent before 2010. In general, spending for high-cost drugs has grown rapidly in the last few years. Between 2010 and 2015, drugs with average monthly prices of $1,000 or more accounted for two-thirds of spending in the catastrophic phase of the benefit in 2015 compared with just one-third in 2010 (Office of Inspector General 2017).
For the future, the high and increasing cost of specialty drugs poses a big challenge in Part D because these drugs are concentrated in drug classes that treat conditions that are prevalent in the Medicare population such as rheumatoid arthritis and other inflammatory diseases, cancer, and HIV (Express Scripts 2014). Many payers project that growth in price and use of specialty drugs will continue to drive trends in spending.46 In the drug pipeline, fewer blockbuster drugs face expiring patents, and more than half of the FDA’s approvals of new drugs in 2013 were for specialty drugs (CatamaranRx 2014). Because many of these therapies have few substitutes, prices for specialty drugs tend to be high, affording PBMs and insurers less ability to exert downward pressure on price.
As the use of specialty drugs increases, Part D enrollees and the Medicare program will face increasingly higher costs. Coinsurance on high-priced medicines could become so burdensome that some non-LIS enrollees could be discouraged from initiating or completing treatment.47
421 Repo r t t o t h e Cong r e s s : Med i ca r e Paymen t P o l i c y | Ma r ch 2017
plans’ efforts to manage drug spending. A plan sponsor’s representative described for us the sponsor’s experience in which the plan’s decisions denying coverage of drugs because they were not on the plan’s formulary were routinely overturned by an independent review entity (IRE). The plan sponsor was generally not successful in appealing IRE decisions; appeals were typically denied on the grounds that supporting statements provided by prescribers proved the medical necessity for the drug—even when those statements were extremely general such as, “this is the right drug for the patient.” Because a Part D plan’s star rating includes how often its coverage decisions are overturned by the IRE, such cases can have a chilling effect on a plan’s willingness to use formulary tools—including on-formulary or off-formulary status—to manage the use of expensive medications. That reluctance to use formulary tools, in turn, can affect the rebate negotiations with pharmaceutical manufacturers.
In our discussions, stakeholders—beneficiary advocates, prescribers, plan sponsors, and CMS—have all noted frustrations with Part D coverage determinations, exceptions, and appeals. A more efficient approach would be to resolve such issues at the point of prescribing through e-prescribing and electronic prior authorization rather than at the pharmacy counter. Such tools could reduce the need for coverage determinations and appeals and increase the likelihood that beneficiaries receive an appropriate medicine at the pharmacy. Automated processes could also lower the administrative burden and lead to a more uniform approach for beneficiaries, prescribers, and plans (American Medical Association 2015). Part D plan sponsors are required to support electronic prescribing, but e-prescribing is optional for physicians and pharmacies.49 While beneficiary advocates are generally supportive of such steps, some contend that they would not be sufficient to address persistent challenges (Medicare Rights Center 2016).
Quality in Part D
CMS collects quality and performance data to monitor sponsors’ operations. A subset of data is used to rate plans in a 5-star system, from which CMS determines Medicare Advantage (MA) quality bonus payments (quality bonus payments do not apply to stand-alone PDPs). Quality data are also made available to the public to help beneficiaries evaluate their plan options during Part D’s annual open enrollment. CMS also requires plan sponsors to carry out
denied and the right to appeal. To initiate a request for an appeal, the enrollee must contact the plan for the basis of the denial of benefits and initiate a request for a coverage determination with supporting justification from the prescriber.
Part D requires quicker adjudication time frames than Medicare Advantage medical benefits because “the majority of Part D coverage requests involve prescription drugs an enrollee has not yet received, which increases the risk of adverse clinical outcomes if access to the drug is delayed” (Centers for Medicare & Medicaid Services 2016d, Centers for Medicare & Medicaid Services 2016e). Plan sponsors must make a decision about exceptions and coverage determination within 72 hours of a request or within 24 hours for expedited requests. If the plan contacts the prescriber but is not able to obtain the supporting information needed to make a coverage determination within the allotted time, the plan must issue a denial and then process any subsequent information it receives as a redetermination.
After examining Part D’s exceptions and appeals process, we found insufficient data to evaluate how well the process is working for beneficiaries to gain access to needed medications (Medicare Payment Advisory Commission 2015b, Medicare Payment Advisory Commission 2014b). We also found that the process can be time consuming and frustrating and is burdensome for some individuals (Hargrave et al. 2015, Hargrave et al. 2012). CMS continues to find that a significant share of audited plans have difficulties in the areas of Part D transition fills, coverage determinations, appeals, and grievances. For example, a common shortfall is that many plans provide enrollees with too little information about the rationale for a coverage denial or do not demonstrate that they have reached out to prescribers for additional information to make a coverage decision (Centers for Medicare & Medicaid Services 2016f). At the start of benefit year 2016, CMS applied intermediate sanctions against several Part D plan sponsors for failure to comply with regulations in multiple areas, including Part D formulary and benefit administration and Part D coverage determinations, appeals, and grievances (Centers for Medicare & Medicaid Services 2017b). The sanctions imposed immediate suspension of marketing to and enrollment of Medicare beneficiaries, and they remain in effect until corrective actions are taken.
At the same time, exceptions and appeals that routinely overturn plans’ coverage decisions could undermine
422 S ta tus repor t on the Medicare presc r ip t ion drug program (Par t D )
Among PDPs, the average star rating for 2017 (weighted by 2016 enrollment) increased to 3.55 from 3.40 a year earlier (Centers for Medicare & Medicaid Services 2016c). About 40 percent of PDP enrollees (based on the 2016 enrollment) are in contracts with 4 or more stars. Among MA−PDs offered for 2017, the average star rating remained stable at 4.00. (See the Medicare Advantage chapter for a discussion of star ratings for MA plans and MA–PDs.) About 68 percent of MA–PD enrollees are in contracts with 4 or more stars.
Star ratings could provide useful information when enrollees are choosing among plan options or when plan sponsors are evaluating certain areas for improvement. However, none of the beneficiaries who participated in the Commission’s focus groups mentioned using the Medicare star ratings as a source of information to choose a health plan (Wesolowski 2016). Further, the utility of star ratings to measure quality of prescription drug services tends to be limited. For example, one measure of intermediate outcomes in star ratings is use of high-risk medications (HRMs). The measure is defined as the share of beneficiaries 65 years and older who received two or more prescription fills for the same drug with a high risk of serious side effects in the elderly (Centers for Medicare & Medicaid Services 2016h). CMS notes that while its HRM measure is endorsed by both the Pharmacy Quality Alliance and National Quality Forum, “the addition of a drug to the HRM list is not a contraindication to use, rather an encouragement to avoid use in the senior population without consideration of risks and benefits based on individual patient characteristics” (Centers for Medicare & Medicaid Services 2016e). Because quality measures calculated only from prescription claims (i.e., without the corresponding medical claim(s)) cannot account for all clinically relevant factors, such a metric “may create unintended consequences including the inappropriate encouragement of certain non-HRM medications, which may not be the best choice for an individual beneficiary’s clinical circumstances” (Centers for Medicare & Medicaid Services 2016e). Further, changes in the composition of the measures CMS uses to rate plans over the years makes it difficult to use the star ratings to measure changes in quality of services provided by plans over time.
Medication therapy management programsPart D plans are required to implement MTM programs to improve the quality of the pharmaceutical care for beneficiaries who may be at risk for adverse drug events, including adverse drug interactions. These programs are
medication therapy management (MTM) programs to improve the quality of the pharmaceutical care for high-risk beneficiaries. Although the Commission supports CMS’s goal of improving medication management, we have ongoing concerns about the effectiveness of plans’ MTM programs. In 2017, CMS began a new enhanced MTM model. We plan to examine the effectiveness of the new MTM program once additional information becomes available.
Measuring plan performanceCMS collects Part D plan quality and performance data from several sources—the Consumer Assessment of Healthcare Providers and Systems® (CAHPS®) survey, agency monitoring of plans, data furnished by plan sponsors, and claims information (Centers for Medicare & Medicaid Services 2014c). Selected performance measures are available on the Plan Finder at www.medicare.gov to help beneficiaries evaluate their plan options during Part D’s annual open enrollment. The lowest rated plans are flagged to caution beneficiaries about choosing those plans. The highest rated plans can enroll beneficiaries outside the annual open enrollment period. In addition, for MA−PDs, Part D performance data affect the MA program’s overall plan ratings to determine the amount of bonus payment.
For 2017, Part D plan ratings are based on up to 15 metrics that measure plan performance on intermediate outcomes, patient experience and access, and process (Centers for Medicare & Medicaid Services 2016c). Intermediate outcome measures (four metrics, e.g., adherence to selected class of medications) each receive a weight of 3, while the eight measures related to patient experience and access (e.g., CAHPS survey results on ease with which plan members get needed medicines) each receive a weight of 1.5. Two process measures (e.g., accuracy of drug prices posted on the Plan Finder) receive a weight of 1. Finally, drug plan quality improvement, a measure reflecting changes in drug plans’ performance from one year to the next, is assigned the highest weight (5). Most MA−PDs are rated on up to 32 measures that assess the quality of medical services provided under Part C (i.e., the MA program), in addition to the 15 measures used to assess the quality of prescription drug (Part D) services provided. CMS aggregates individual scores for each measure (15 for PDPs and 44 for MA−PDs) on the Plan Finder in a 5-star system; 5 stars reflects excellent performance, and 1 star reflects poor performance.
423 Repo r t t o t h e Cong r e s s : Med i ca r e Paymen t P o l i c y | Ma r ch 2017
wide variation in participation across sponsors and plans. The authors contend that most sponsors have chosen to offer services to a narrow segment of enrollees, missing opportunities to improve medication management (Stuart et al. 2016). A concern is that sponsors of stand-alone PDPs do not have financial incentives to engage in MTM or other activities that, for example, increase adherence to appropriate medications. In addition, physicians may be reluctant to accept recommendations from drug plans with which they have no direct relationship. Evidence suggests that the effectiveness of the MTM services currently offered by Part D plans “fall[s] short of their potential to improve quality and reduce unnecessary medical expenditures” (Centers for Medicare & Medicaid Services 2015c, Marrufo et al. 2013).
In 2017, CMS began an enhanced MTM model in five regions of the country to test whether payment incentives and greater regulatory flexibility in designing MTM programs will “achieve better alignment of PDP sponsor and government financial interests, while also creating incentives for robust investment and innovation in better MTM targeting and interventions” (Center for Medicare & Medicaid Innovation 2015). Regulatory flexibility combined with financial incentives provided under the model have the potential to address some of the Commission’s concerns regarding coordination with a beneficiary’s care team and plans’ incentive to offer MTM programs (Medicare Payment Advisory Commission 2014a) (see text box, p. 424). We plan to continue to monitor how well the current MTM program is working and report on the new enhanced MTM model as more information becomes available. ■
intended to optimize therapeutic outcomes and reduce adverse drug events through improved medication use among beneficiaries who have multiple chronic conditions, take multiple medications, and are likely to have annual drug spending that exceeds the annual cost threshold ($3,919 for 2017). Our earlier review of MTM programs revealed wide variations in eligibility criteria and the kinds of interventions provided to enrollees (Medicare Payment Advisory Commission 2009).
Plan sponsors are required to offer all eligible enrollees a comprehensive medication review (CMR) at least annually and a targeted medication review (TMR) at least quarterly for ongoing monitoring and follow-up of any medication-related issues.50 CMS has changed criteria for plans’ MTM programs over time to broaden eligibility. Currently, plan sponsors can no longer set narrower eligibility criteria than requiring beneficiaries to have more than three chronic conditions or use more than eight medications. Eligible enrollees must opt out of participation.
Although the Commission supports CMS’s goal of improving medication management, we have long-standing concerns about the overall outreach and effectiveness of Part D’s MTM program. As CMS has noted in the past, plans are often unable to reach eligible beneficiaries, and many refuse the service. In 2014, 11.9 percent of Part D enrollees were eligible for MTM services using Part D’s standard criteria, and another 0.7 percent were eligible through expanded plan-specific criteria (Centers for Medicare & Medicaid Services 2016k). Among those eligible for the services that year, 19 percent received a CMR, or just 2 percent of all Part D enrollees. A recent analysis of MTM programs found
424 S ta tus repor t on the Medicare presc r ip t ion drug program (Par t D )
2017 launch of enhanced medication therapy management
Six Part D sponsors operating prescription drug plans (PDPs) in five regions of the country are participating in CMS’s enhanced medication
therapy management (MTM) model over a five-year period.51 (Not every sponsor is participating in each region.) An estimated 1.6 million enrollees will be eligible to participate in the first year (Centers for Medicare & Medicaid Services 2016l). Part D’s program requirements related to uniformity of benefits and cost sharing will be waived for participating PDPs, which would provide plan sponsors with the ability to offer MTM interventions tailored to an individual’s needs, including cost-sharing assistance to financially needy beneficiaries (Centers for Medicare & Medicaid Services 2015c).
CMS’s stated goal is for the participating PDPs to explore different communication strategies to improve beneficiary, pharmacist, and medical provider coordination and engagement. To aid that effort, CMS can provide participating PDPs with their enrollees’ Part A and Part B claims data and information on beneficiaries’ participation in integrated care models such as accountable care organizations (Center for Medicare & Medicaid Innovation 2017).
Because stand-alone PDPs may not necessarily benefit financially from providing MTM services that could improve enrollees’ health outcomes and lower costs for the Medicare program, the model test also includes financial incentives for participating PDPs:
• a plan-specific prospective payment for MTM services that is outside the annual Part D bid and does not therefore impact plan premiums and
• a performance-based payment in the form of an increased beneficiary premium subsidy (in a future year) for plans that successfully achieve a 2 percent reduction in expected beneficiary fee-for-service expenditures (net of model prospective payments).
Sponsors participating in the enhanced MTM model will be required to collect and submit MTM-related encounter data for both monitoring and evaluation purposes, including “whether the plan interventions are correlated with outcomes such as mortality, emergency department utilization, hospital readmissions, or beneficiary satisfaction measures” (Centers for Medicare & Medicaid Services 2016l). ■
425 Repo r t t o t h e Cong r e s s : Med i ca r e Paymen t P o l i c y | Ma r ch 2017
1 The prescription drug coverage that beneficiaries had before 2006 may or may not have been as generous as the Part D benefit. Since implementation of Part D, nearly 90 percent of beneficiaries have drug coverage that is as generous as Part D’s basic benefit.
2 Table II.B.1 of the Medicare Trustees’ 2016 report lists Part D expenditures for 2015 as $89.8 billion (Boards of Trustees 2016). That larger amount includes reconciliation payments made during 2015 between Medicare and plan sponsors for benefits delivered in previous years.
3 In 2017, the Part D benefit provides gap coverage of 10 percent for brand-name drugs, in addition to a 50 percent discount provided by drug manufacturers, reducing cost sharing in the gap to about 40 percent (Centers for Medicare & Medicaid Services 2016e). Cost sharing for brand-name drugs filled depends on the dispensing fee charged since the 10 percent covered by Part D applies to both the ingredient cost and the dispensing fee, while the 50 percent manufacturer discount applies only to ingredient costs.
4 CMS’s de minimus policy (codified under Section 3303(a) of PPACA) allows plan sponsors to voluntarily waive the portion of the monthly adjusted basic beneficiary premium that is above the low-income subsidy (LIS) benchmark for a subsidy-eligible individual, up to a de minimis amount (Centers for Medicare & Medicaid Services 2016i). The de minimis amount for 2017 is $2.
5 The Commission recommended removing protected status from two out of the six drug classes in which plan sponsors must now cover all drugs on their formularies (antidepressants and immunosuppressants for transplant rejection), streamlining the process for formulary changes, requiring prescribers to provide supporting justifications with more clinical rigor when applying for exceptions, and permitting plan sponsors to use selected tools to manage specialty drug benefits while maintaining appropriate access to needed medications (Medicare Payment Advisory Commission 2016c).
6 If an employer agrees to provide primary drug coverage to retirees with an average benefit value equal to or greater than Part D (called “creditable coverage”), Medicare provides a tax-free subsidy to the employer for 28 percent of each eligible retiree’s drug costs that fall within a specified range of spending. Under PPACA, employers still receive the RDS tax free, but as of 2013, they can no longer deduct drug expenses for which they receive the subsidy as a cost of doing business. However, they can still deduct prescription drug expenses not covered by the subsidy.
7 Other sources of coverage include the Federal Employees Health Benefits Program, TRICARE for Life, and the Department of Veterans Affairs.
8 Employer group waiver plans, or EGWPs, are Part D plans sponsored by employers that contract directly with CMS or with an insurer or a pharmacy benefit manager to administer a drug benefit on the employer’s behalf. EGWPs differ from employer plans that receive the RDS in that they are considered Part D plans; that is, Medicare Part D is the primary payer rather than the employer. However, unlike other Part D plans, EGWPs are offered only to Medicare-eligible retirees of a particular employer (i.e., the requirement that anyone be allowed to enroll in such a plan is waived).
9 Under the Part C payment system, a portion of the difference between the plan’s benchmark payment and its bid for providing Part A and Part B services is referred to as Part C rebate dollars. The rebate dollars can be used to supplement benefits or lower premiums for services provided under Part C or Part D.
10 Extra coverage in the gap (beyond what is required by the PPACA) is typically restricted to a subset of formulary drugs.
11 MA−PD premiums reflect Medicare Advantage plans’ total monthly premium attributable to Part D benefits for plans that offer Part D coverage. The premiums are net of Part C rebate dollars that were used to offset Part D premium costs.
12 CMS allows sponsors to offer several plans in a given service area if the plans are “meaningfully different.” To be considered meaningfully different for 2017, a beneficiary’s expected OOP costs between basic and enhanced PDPs must differ by at least $23 per month. If a sponsor is offering two enhanced PDPs in the same service area, the second plan must have a higher value than the first, with an OOP difference of at least $34 per month.
13 Twenty-five of the benchmark plans are offered by Cigna-HealthSpring Rx, which CMS currently has placed under sanction, meaning that those plans cannot accept new enrollees.
14 More than half of LIS enrollees who paid a premium in 2016 were in enhanced plans (Hoadley et al. 2016).
15 The company itself is a product of the acquisition of the PBM Caremark by CVS in 2007. Since the beginning of Part D, CVS Health acquired Longs Drug Stores’ RxAmerica plans,
Endnotes

426 S ta tus repor t on the Medicare presc r ip t ion drug program (Par t D )
20 When using a mail pharmacy, enrollees generally receive a 90-day rather than a 30-day prescription.
21 CVS Health purchased the nation’s largest long-term care pharmacy company, Omnicare, in 2015.
22 The six protected classes include anticonvulsants, antidepressants, antineoplastics, antipsychotics, antiretrovirals, and immunosuppressants for the treatment of transplant rejection.
23 For 2017, CMS permits plans to place a drug on a specialty tier if its average cost is at least $670 per month. If a plan uses the same deductible as in Part D’s defined standard benefit, it must charge 25 percent coinsurance for drugs on its specialty tier. Plans with no deductible may charge up to 33 percent coinsurance on their specialty tier.
24 These measures need to be used with caution because they can be misleading in some circumstances. For example, some plan sponsors list relatively few drugs on their formulary but have an exceptions process that permits good access to other medications. Alternatively, other sponsors list most drugs on their formulary but require prior authorization for a relatively larger number of drugs.
25 For this calculation, we define drugs at the level of chemical entities—a broad grouping that encompasses all of a chemical’s forms, strengths, and package sizes—that combine brand and generic versions of the same specific chemical entity (Medicare Payment Advisory Commission 2008).
26 Recent controversy over price growth for certain brand-name drugs has led to concern about the use of rebates. According to one analysis, list prices for the epinephrine autoinjection device EpiPen grew by 150 percent between 2013 and 2016 (CVS Health 2016). The EpiPen drew attention because commercially insured individuals in high-deductible plans often pay for full increases in list prices. However, the chief executive officer of Mylan (EpiPen’s manufacturer) defended the company’s pricing on the grounds that net prices (that is, list prices after rebates to PBMs and payments to wholesalers and distributors) were substantially smaller (Bresch 2016). PBMs counter that the price concessions they negotiate lower overall costs to the health care system (American Pharmacy News 2016).
27 After 2020, in the range of spending that was formerly the coverage gap, manufacturers of brand-name drugs will continue to provide a 50 percent discount and plan sponsors will be liable only for 25 percent of spending, compared with plan liability of 75 percent between the deductible and initial coverage limit.
Universal American’s Community CCRx and Pennsylvania Life product lines, and Health Net Orange PDPs.
16 Another plan sponsor with large numbers of LIS enrollees is Rite Aid. That company became a plan sponsor in 2015 when it acquired EnvisionRx, a PBM that was already participating in Part D. In 2016, 76 percent of Rite Aid’s enrollees (0.3 million) received the LIS, and plans offered by Rite Aid accounted for 2 percent of all LIS enrollment. Rite Aid currently operates a chain of about 4,600 drugstores and is due to be acquired by Walgreens Boots Alliance, which operates 8,200 U.S. drugstores (Mattioli et al. 2015). The merger has been under regulatory review and is scheduled to close in 2017.
17 Some in-house PBMs also provide PBM services under contract to other payers. For example, OptumRx has won recent contracts with General Electric and the California Public Employees’ Retirement System.
18 PBMs can earn revenues in a number of ways, including administrative fees from payers and manufacturers, retaining a portion of manufacturers’ rebates, and through the “spread” between what the PBM receives from a payer for a prescription and what the PBM pays the pharmacy. Under newer arrangements for conditions such as hepatitis C, PBMs may refund drug costs to payers if a patient is not adherent to treatment (Rubenfire 2016). Some investment analysts contend that over time, a greater share of PBM revenue has come from administrative fees than from rebates and spread. Critics of the industry argue that the opacity of drug pricing and rebates makes it difficult to monitor whether the PBM is obtaining the lowest prices possible and sharing revenues appropriately with clients (Applied Policy 2015). PBMs counter that their contracts provide transparency and pass along rebates to the extent demanded in the competitive market and in response to negotiations with individual clients.
19 A recent dispute between one major insurer and its PBM over repricing provisions in their 10-year contract has been acrimonious. In 2009, Express Scripts purchased Anthem’s (then WellPoint’s) in-house PBM, NextRx (Anthem 2009). As part of the agreement, Anthem signed a 10-year contract to use Express Scripts as its PBM. In March 2016, Anthem filed suit against Express Scripts for pricing and operational contract breaches, requesting damages of $13 billion and permission to end the contract (Silverman 2016). Express Scripts filed a countersuit, alleging that Anthem did not negotiate repricing in good faith (Walker 2016). In July 2016, a lawsuit against both Anthem and Express Scripts seeking class-action status was launched on behalf of insured employees whose employers used the services of Anthem. The suit alleges that insured employees paid too much because of “above competitive pricing levels” (Appleby 2016). Express Scripts and Anthem both deny the allegations.
427 Repo r t t o t h e Cong r e s s : Med i ca r e Paymen t P o l i c y | Ma r ch 2017
require beneficiaries to use designated specialty pharmacy providers (Fein 2015).
36 A specific concern raised by independent specialty pharmacies is that plans and PBMs are using performance-based criteria that do not apply to the types of drugs they dispense, such as adherence to drugs for treatment of cholesterol or diabetes.
37 The industry does not have one consistent definition of specialty drugs, but these drugs tend to be characterized as high cost and are used to treat a rare condition, require special handling, use a limited distribution network, or require ongoing clinical assessment. Most biologics are a subset of specialty drugs (see American Journal of Managed Care 2013).
38 These figures are based on the Acumen LLC analysis of the Part D prescription drug event data for the Commission. Most plans use specialty tiers for drugs and biologic products that meet the dollar per month cost threshold ($670 in 2017) set by CMS. A specialty-tier drug is different from a specialty drug in that it is identified based on its placement on a plan’s specialty tier and varies across plans. Typically, plans charge enrollees coinsurance of 25 percent to 33 percent for drugs placed on specialty tiers.
39 IMS Health defines invoice prices as the amounts paid to distributors by their pharmacy or hospital customers, which is different from gross spending reflected in Part D’s prescription drug event data (total payments to pharmacies before accounting for any rebates or discounts pharmacies retain). Net prices measure the amount received by pharmaceutical manufacturers and therefore reflect rebates, off-invoice discounts, and other price concessions made by manufacturers to distributors, health plans, and intermediaries.
40 An individual NDC uniquely identifies the drug’s labeler, drug, dosage form, strength, and package size. Typically, the same drug has many different NDCs.
41 For this index, Acumen grouped NDCs that are pharmaceutically identical, aggregating prices across drug trade names, manufacturers, and package sizes. As a result, brand-name drugs are grouped with their generics if they exist, and the median price more closely reflects the degree to which market share has moved between the two.
42 Differences in GDRs vary by therapeutic classes. In 2012, for some of the most commonly used classes of drugs, the average GDR for LIS enrollees was from 5 percentage points to 13 percentage points lower than for non-LIS enrollees. We observed this finding in both PDPs and MA−PDs.
28 Note that, if many enrollees used certain drugs with higher list prices, it could affect the share of rebates and pharmacy fees that Medicare would keep, and correspondingly could affect plan costs.
29 However, if the cost of dispensing an extended supply is higher at the retail pharmacy, the plan sponsor can charge the enrollee cost sharing that is higher by as much as that cost differential.
30 Some pharmacies may choose not to contract with certain plans because they do not like the terms and conditions the plans offer. Plan sponsors are not obligated to cover prescriptions at an out-of-network pharmacy, except under certain circumstances.
31 The minimum standard for pharmacy network access, based on the TRICARE standard, is as follows—urban areas: at least 90 percent of Medicare beneficiaries in the sponsor’s service area reside within 2 miles of a network retail pharmacy; suburban areas: at least 90 percent of Medicare beneficiaries in the sponsor’s service area reside within 5 miles of a network retail pharmacy; rural areas: at least 70 percent of Medicare beneficiaries in the sponsor’s service area reside within 15 miles of a network retail pharmacy.
32 The Commission has expressed support for plan innovations that increase efficiency, and we agree with CMS that the competition created by preferred pharmacy networks should result in lower costs for the program and for Part D enrollees. However, we noted in a 2014 comment letter to CMS that a separate pharmacy access standard may be required to ensure that plan enrollees have reasonable access to preferred cost sharing (Medicare Payment Advisory Commission 2014a).
33 Part D enrollees may apply to bona fide independent charity patient assistance programs (PAPs) for help with cost sharing. Pharmaceutical manufacturers can provide cash donations to independent charity PAPs without invoking anti-kickback concerns if the charity is structured properly. Guidance from the Department of Health and Human Services Office of Inspector General states that independent charity PAPs must provide assistance to broad rather than narrow disease groups, manufacturers must not exert direct or indirect control over the charity, and the PAP must not limit assistance to a subset of available products (Office of Inspector General 2014).
34 A Risk Evaluation and Mitigation Strategy describes measures beyond labeling that are sometimes required as a condition of FDA approval to ensure that a new drug is dispensed to patients for whom benefits outweigh risks.
35 As of 2013, 66 percent of commercial health plans mandate that self-administered specialty drugs be dispensed by a specialty pharmacy, and about three-quarters of health plans

428 S ta tus repor t on the Medicare presc r ip t ion drug program (Par t D )
long-term care facilities, the temporary supply may be for up to 31 days and may be renewed as necessary during the entire length of the 90-day transition period. Each year since 2012, CMS has conducted a transition monitoring program analysis to evaluate whether plan sponsors are following Part D transition requirements. In 2016, 6 percent of Part D contracts exceeded CMS’s thresholds of noncompliance (Centers for Medicare & Medicaid Services 2016j).
49 The exception is New York, which mandates electronic prescribing.
50 CMRs must include an interactive, person-to-person, or telehealth consultation performed by a pharmacist or other qualified provider and a written summary of the review that includes a medication list and action plan, if any, provided to beneficiaries in CMS’s standardized format. In 2014, 85 percent of CMRs were conducted by pharmacists over the telephone (Centers for Medicare & Medicaid Services 2016k). A TMR is distinct from a CMR because it is focused on specific medication-related problems, actual or potential. A TMR can be person to person or system generated, and interventions can be delivered by mail or faxed to the beneficiary or the prescriber, as appropriate (Centers for Medicare & Medicaid Services 2014b).
51 Participating plans are basic PDPs in the following five regions: Region 7 (Virginia), Region 11 (Florida), Region 21 (Louisiana), Region 25 (Iowa, Minnesota, Montana, Nebraska, North Dakota, South Dakota, Wyoming), and Region 28 (Arizona) (Centers for Medicare & Medicaid Services 2016l).
43 For benefits delivered in 2014 and 2015, the majority of the plan sponsors received additional individual reinsurance payments from Medicare at reconciliation, much of which was because of higher than anticipated spending on new hepatitis C therapies and the continuing growth in cost for specialty drugs (Boards of Trustees 2016). Even with that unexpectedly higher spending, most plan sponsors made risk-corridor payments to Medicare.
44 Our analysis is based on CMS’s dashboard. CMS’s data excludes claims for all over-the-counter drugs.
45 The Patient Protection and Affordable Care Act of 2010 changed the tax treatment of Medicare’s retiree drug subsidy and made the Part D benefit more generous through the phased closure of the coverage gap and the provision of brand discounts. These changes in the law likely motivated employers that had previously provided primary drug coverage to their former workers to move their retirees into Part D by setting up employer group waiver plans for them.
46 Among PBMs, growth in price and use of specialty drugs has been driving the overall trend in spending. Across their entire non-Medicare and Medicare books of business, PBMs’ spending on specialty drugs reached about 30 percent in 2012 and may reach 50 percent of spending by 2018 (Seeking Alpha 2013).
47 Recall that enrollees typically face coinsurance of 25 percent to 33 percent until they reach the catastrophic phase of the benefit.
48 The transition fill is a temporary one-time supply of up to 30 days of medication provided during the first 90 days in a plan for new enrollees and during the first 90 days of the new contract year for existing enrollees. For individuals living in
429 Repo r t t o t h e Cong r e s s : Med i ca r e Paymen t P o l i c y | Ma r ch 2017
Alpern, J. D., W. M. Stauffer, and A. S. Kesselheim. 2014. High-cost generic drugs—Implications for patients and policymakers. New England Journal of Medicine 371, no. 20 (November 13): 1859–1862.
American Journal of Managed Care. 2013. The growing cost of specialty pharmacy: Is it sustainable? Published online February 18. http://www.ajmc.com/payer-perspectives/0213/The-Growing-Cost-of-Specialty-PharmacyIs-it-Sustainable#sthash.JGUiDV3K.pdf.
American Medical Association. 2015. Prior authorization: The current landscape. Chicago, IL: AMA.
American Pharmacy News. 2016. PCMA CEO challenges EpiPen price hike explanation. American Pharmacy News, September 21.
Anthem. 2009. Express Scripts completes acquisition of WellPoint’s NextRx subsidiaries. December 1. http://ir.antheminc.com/phoenix.zhtml?c=130104&p=irol-newsArticle&ID=1360094.
Appleby, J. 2016. Anthem, Express Scripts face legal challenge over prescription drug prices. Kaiser Health News, July 1.
Applied Policy. 2015. Concerns regarding the pharmacy benefit management industry. Policy brief. Alexandria, VA: Applied Policy.
Barnhart, A., and J. Gomberg. 2016. The AIDS Institute: Financial incentives in Medicare Part D. Brookfield, WI: Milliman.
Blank, C. 2016. Impossible task: Specialty pharmacists battle soaring costs, dwindling reimbursement and consolidation. Drug Topics, October 10. http://drugtopics.modernmedicine.com/drug-topics/news/impossible-task?page=0,0&rememberme=1&ts=18102016.
Boards of Trustees, Federal Hospital Insurance and Federal Supplementary Medical Insurance Trust Funds. 2016. 2016 annual report of the Boards of Trustees of the Federal Hospital Insurance and Federal Supplementary Insurance Trust Funds. Washington, DC: Boards of Trustees.
Boards of Trustees, Federal Hospital Insurance and Federal Supplementary Medical Insurance Trust Funds. 2015. 2015 annual report of the Boards of Trustees of the Federal Hospital Insurance and Federal Supplementary Insurance Trust Funds. Washington, DC: Boards of Trustees.
Bray, C., and R. Abelson. 2015. Aetna agrees to acquire Humana for $37 billion in cash and stock. New York Times, July 3.
Bresch, H. 2016. Testimony of Mylan CEO Heather Bresch. Hearing testimony before the United States House of Representatives, Committee on Oversight and Government Reform. September 21. https://oversight.house.gov/wp-content/uploads/2016/09/2016-09-21-Mylan-CEO-Bresch-Testimony.pdf.
CatamaranRx. 2014. Informed trends: Moments of opportunity. Schaumburg, IL: CatamaranRx. https://trendreport.catamaranrx.com/pdf/2014_Trend_Analysis_Report.pdf.
Center for Medicare & Medicaid Innovation, Centers for Medicare & Medicaid Services, Department of Health and Human Services. 2017. Medicare Part D Enhanced Medication Therapy Management Model: Request for applications. https://innovation.cms.gov/Files/x/mtm-rfa.pdf.
Center for Medicare & Medicaid Innovation, Centers for Medicare & Medicaid Services, Department of Health and Human Services. 2015. Announcement of Part D Enhanced Medication Therapy Management Model test. https://innovation.cms.gov/Files/x/mtm-announcement.pdf.
Centers for Medicare & Medicaid Services, Department of Health and Human Services. 2017a. Medicare Part D: Direct and indirect remuneration (DIR). Press release. January 19. https://www.cms.gov/Newsroom/MediaReleaseDatabase/Fact-sheets/2017-Fact-Sheet-items/2017-01-19-2.html.
Centers for Medicare & Medicaid Services, Department of Health and Human Services. 2017b. Part C and Part D enforcement actions. https://www.cms.gov/Medicare/Compliance-and-Audits/Part-C-and-Part-D-Compliance-and-Audits/PartCandPartDEnforcementActions-.html.
Centers for Medicare & Medicaid Services, Department of Health and Human Services. 2016a. 2014 Part D rebate summary for all brand-name drugs. https://www.cms.gov/Research-Statistics-Data-and-Systems/Statistics-Trends-and-Reports/Information-on-Prescription-Drugs/2014_PartD_Rebates.html.
Centers for Medicare & Medicaid Services, Department of Health and Human Services. 2016b. 2015 Medicare drug spending data. https://www.cms.gov/Research-Statistics-Data-and-Systems/Statistics-Trends-and-Reports/Information-on-Prescription-Drugs/2015MedicareData.html.
Centers for Medicare & Medicaid Services, Department of Health and Human Services. 2016c. 2017 star ratings. October 7. Fact sheet. Baltimore, MD: CMS.
References
430 S ta tus repor t on the Medicare presc r ip t ion drug program (Par t D )
Centers for Medicare & Medicaid Services, Department of Health and Human Services. 2015a. Analysis of Part D beneficiary access to preferred cost sharing pharmacies (PCSPs). Baltimore, MD: CMS. https://www.cms.gov/Medicare/Prescription-Drug-Coverage/PrescriptionDrugCovContra/Downloads/PCSP-Key-Results-Report-Final-v04302015.pdf.
Centers for Medicare & Medicaid Services, Department of Health and Human Services. 2015b. Announcement of calendar year (CY) 2016 Medicare Advantage capitation rates and Medicare Advantage and Part D payment policies and final call letter. Note from Sean Cavanaugh, Deputy Administrator, Centers for Medicare & Medicaid Services, and Jennifer Lazio, Director, Parts C & D Actuarial Group, Office of the Actuary, to Medicare Advantage organizations, prescription drug plan sponsors, and other interested parties, April 6. http://www.cms.gov/Medicare/Health-Plans/MedicareAdvtgSpecRateStats/Downloads/Announcement2016.pdf.
Centers for Medicare & Medicaid Services, Department of Health and Human Services. 2015c. Part D Enhanced Medication Therapy Management Model fact sheet. https://www.cms.gov/Newsroom/MediaReleaseDatabase/Fact-sheets/2015-Fact-sheets-items/2015-09-28.html.
Centers for Medicare & Medicaid Services, Department of Health and Human Services. 2014a. Convenient access to retail pharmacies–Analysis on preferred cost-sharing pharmacy networks. Baltimore, MD: CMS.
Centers for Medicare & Medicaid Services, Department of Health and Human Services. 2014b. CY 2015 Medication Therapy Management Program guidance and submission instructions. Memo from Jennifer R. Shapiro, MPH, Acting Deputy Director, Medicare Drug Benefit and C & D Data Group. May 7.
Centers for Medicare & Medicaid Services, Department of Health and Human Services. 2014c. Medicare 2014 Part C & D star rating technical notes. Baltimore, MD: CMS.
Centers for Medicare & Medicaid Services, Department of Health and Human Services. 2014d. Medicare program; contract year 2015 policy and technical changes to the Medicare Advantage and the Medicare prescription drug benefit programs. Proposed rule. Federal Register 79, no. 7 (January 10): 1918–2073.
Centers for Medicare & Medicaid Services, Department of Health and Human Services. 2011a. Prescription Drug Benefit Manual. Chapter 5: Benefits and beneficiary protections. Baltimore, MD: CMS. http://www.cms.gov/Medicare/Prescription-Drug-Coverage/PrescriptionDrugCovContra/Downloads/MemoPDBManualChapter5_093011.pdf.
Centers for Medicare & Medicaid Services, Department of Health and Human Services. 2016d. Advance notice of methodological changes for calendar year (CY) 2017 for Medicare Advantage capitation rates, Part C and Part D payment policies and 2017 call letter. https://www.cms.gov/Medicare/Health-Plans/MedicareAdvtgSpecRateStats/Downloads/Advance2017.pdf.
Centers for Medicare & Medicaid Services, Department of Health and Human Services. 2016e. Announcement of calendar year (CY) 2017 Medicare Advantage capitation rates and Medicare Advantage and Part D payment policies and final call letter. https://www.cms.gov/Medicare/Health-Plans/MedicareAdvtgSpecRateStats/Downloads/Announcement2017.pdf.
Centers for Medicare & Medicaid Services, Department of Health and Human Services. 2016f. Civil money enforcement actions for 2015 program audits. https://www.cms.gov/Medicare/Compliance-and-Audits/Part-C-and-Part-D-Compliance-and-Audits/Downloads/HPMS_Memo-2015_Program_Audit_CMPs.pdf.
Centers for Medicare & Medicaid Services, Department of Health and Human Services. 2016g. LIS formulary drug coverage. Fact sheet. https://www.cms.gov/Medicare/Prescription-Drug-Coverage/PrescriptionDrugCovGenIn/Downloads/LIS-Formulary-Drug-Coverage-Fact-Sheet.pdf.
Centers for Medicare & Medicaid Services, Department of Health and Human Services. 2016h. Medicare 2017 Part C & D star rating technical notes. September 26. Baltimore, MD: CMS. https://www.cms.gov/Medicare/Prescription-Drug-Coverage/PrescriptionDrugCovGenIn/PerformanceData.html.
Centers for Medicare & Medicaid Services, Department of Health and Human Services. 2016i. Memo to all Medicare Advantage organizations and Medicare prescription drug plan sponsors regarding the release of the de minimis amount and operational guidance. https://www.cms.gov/Medicare/health-Plans/MedicareAdvtgSpecRateStats/Downloads/PartDandMABenchmarks2017.pdf.
Centers for Medicare & Medicaid Services, Department of Health and Human Services. 2016j. Memo to all Medicare Part D sponsors regarding the Part D transition monitoring program, December 29.
Centers for Medicare & Medicaid Services, Department of Health and Human Services. 2016k. Part C and D annual report. https://www.cms.gov/Medicare/Prescription-Drug-Coverage/PrescriptionDrugCovContra/PartCDDataValidation.html.
Centers for Medicare & Medicaid Services, Department of Health and Human Services. 2016l. Participants selected for Part D Enhanced Medication Therapy Management Model. Press release. October 3. https://www.cms.gov/Newsroom/MediaReleaseDatabase/Fact-sheets/2016-Fact-sheets-items/2016-10-03.html.
431 Repo r t t o t h e Cong r e s s : Med i ca r e Paymen t P o l i c y | Ma r ch 2017
Fein, A. 2014b. Retail generic drug inflation reaches new heights. Drug Channels blog. August 12. http://www.drugchannels.net/2014/08/retail-generic-drug-inflation-reaches.html.
Government Accountability Office. 2016. Generic drugs under Medicare: Part D generic drug prices declined overall, but some had extraordinary price increases. GAO–16–706. Washington, DC: GAO.
Hargrave, E., L. Summer, D. Liffmann, et al. 2015. Findings from focus groups and interviews on access to care, coverage choices, the organization of care and urgent care. Draft final report prepared by staff from NORC at the University of Chicago for the Medicare Payment Advisory Commission. Washington, DC: MedPAC.
Hargrave, E., L. Summer, D. Liffmann, et al. 2012. Findings from focus groups with beneficiaries and physicians and site visits with physicians, care coordinators, and other staff. Report prepared by staff from NORC at the University of Chicago for the Medicare Payment Advisory Commission. Washington, DC: MedPAC.
Herman, B. 2015. Anthem acquiring Cigna in largest ever health insurance deal: $54.2 B. Modern Healthcare, July 24.
Hoadley, J., J. Cubanski, and T. Neuman. 2016. Medicare Part D: A first look at prescription drug plans in 2017. Issue brief. Washington, DC: Kaiser Family Foundation.
Hoadley, J., L. Summer, E. Hargrave, et al. 2014. Medicare Part D in its ninth year: The 2014 marketplace and key trends, 2006–2014. Washington, DC: Kaiser Family Foundation.
Holtz-Eakin, D. 2014. CMS is at it again . . . Increasing Rx costs for seniors. American Action Forum Insight. https://www.americanactionforum.org/insight/cms-is-at-it-again-increasing-rx-costs-for-seniors/.
IMS Institute for Healthcare Informatics. 2016. Medicines use and spending in the U.S. Parsippany, NJ: IMS Institute.
Indianapolis Business Journal. 2016. Analysis: Diabetes drug price war likely to claim more casualties. September 30. http://www.ibj.com/articles/60623-analysis-diabetes-drug-price-war-likely-to-claim-more-casualties.
Kaczmarek, S. 2015. Pharmacy manufacturer rebate negotiation strategies: A common ground for a common purpose. http://www.milliman.com/insight/2015/Pharmacy-manufacturer-rebate-negotiation-strategies-A-common-ground-for-a-common-purpose/.
Kaczmarek, S., A. Sheldon, and D. Liner. 2013. The impact of preferred pharmacy networks on federal Medicare Part D costs, 2014–2023. Windsor, CT: Milliman.
Centers for Medicare & Medicaid Services, Department of Health and Human Services. 2011b. Prescription drug event job aids. http://www.csscoperations.com/Internet/Cssc3.Nsf/files/PDE_Job_Aids_050812.pdf/$File/PDE_Job_Aids_050812.pdf.
Credit Suisse. 2015. Global pharma. Equity research. May 1. https://doc.research-and-analytics.csfb.com/docView?language=ENG&format=PDF&source_id=csplusresearchcp&document_id=1047911451&serialid=hfXhzuK6sK6xRrBsMZzLqZ96QTl7v2YM0kkwWJRGRVU%3D.
CVS Health. 2016. EpiPen: What you need to know. Insights Commentary, October 11.
EvaluatePharma. 2016. World preview 2016, Outlook to 2022. London, UK: Evaluate Ltd.
Express Scripts. 2014. The 2013 drug trend report. Tempe, AZ: Express Scripts. http://lab.express-scripts.com/~/media/7f14884da6ef434dbf30abd82dd7e655.ashx.
Fein, A. 2016a. Behind Diplomat Pharmacy’s plunge: A primer on DIR fees in Medicare Part D. Drug Channels blog. November 8. http://www.drugchannels.net/2016/11/behind-diplomat-pharmacys-plunge-primer.html.
Fein, A. 2016b. Five industry trends for U.S. drug wholesalers in 2017. Drug Channels blog. December 15. http://www.drugchannels.net/2016/12/five-industry-trends-for-us-drug.html.
Fein, A. 2016c. Preferred pharmacy networks are back in 85% of the 2017 Medicare Part D plans. Drug Channels blog. October 5. http://www.drugchannels.net/2016/10/exclusive-preferred-pharmacy-networks.html.
Fein, A. 2016d. The top 10 specialty pharmacies of 2015. Drug Channels blog. March 8. http://www.drugchannels.net/2016/03/the-top-10-specialty-pharmacies-of-2015.html.
Fein, A. 2016e. Walgreens plays to win: Our exclusive analysis of 2017’s Part D preferred pharmacy networks. Drug Channels blog. October 25. http://www.drugchannels.net/2016/10/walgreens-plays-to-win-our-exclusive.html.
Fein, A. 2016f. Why the Walgreens/Prime deal could transform the PBM industry. Drug Channels blog. September 7. http://www.drugchannels.net/2016/09/why-walgreensprime-deal-could-transform.html.
Fein, A. 2015. 2014–15 economic report on retail, mail, and specialty pharmacies. Philadelphia, PA: Pembroke Consulting Inc. and Drug Channels Institute.
Fein, A. 2014a. 2014–2015 economic report on pharmaceutical wholesalers and specialty distributors. Philadelphia, PA: Pembroke Consulting, Inc. and Drug Channels Institute.
432 S ta tus repor t on the Medicare presc r ip t ion drug program (Par t D )
Medicare Payment Advisory Commission. 2009. Report to the Congress: Medicare payment policy. Washington, DC: MedPAC.
Medicare Payment Advisory Commission. 2008. Report to the Congress: Medicare payment policy. Washington, DC: MedPAC.
Medicare Rights Center. 2016. Comments to CMS on the 2017 advance call letter, March 4.
Medicare Today. 2015a. Morning Consult national tracking poll. http://medicaretoday.org/wp-content/uploads/2016/07/2015_Medicare_Today_National_Seniors_Poll.pdf.
Medicare Today. 2015b. Nearly nine of 10 seniors satisfied with Medicare Part D prescription drug coverage, national survey finds. http://medicaretoday.org/2015/07/nearly-nine-of-10-seniors-satisfied-with-medicare-part-d-prescription-drug-coverage-national-survey-finds/.
National Association of Specialty Pharmacy. 2016. NASP definitions of specialty pharmacy and specialty medications. http://naspnet.org/wp-content/uploads/2016/06/633570_864cb572b8b042909a3f207eaf764d7a.pdf.
National Community Pharmacists Association. 2016a. Frequently asked questions (FAQs) about pharmacy “DIR” fees. http://www.ncpa.co/pdf/faq-direct-indirect-remuneration-fees.pdf.
National Community Pharmacists Association. 2016b. Letter to Dr. Francis Crosson, Chair, Medicare Payment Advisory Commission, regarding Medicare Part D considerations for March 3–4, 2016, MedPAC meeting. February 29.
National Community Pharmacists Association. 2016c. Letter to Dr. Francis Crosson, Chair, Medicare Payment Advisory Commission, regarding MedPAC review of effects of “DIR fees” assessed against retail pharmacies by insurers and pharmacy benefit managers in the Medicare Part D context. January 6.
Nisen, M. 2015. Fighting the drugstore cowboys. Bloomberg Gadfly. http://www.bloomberg.com/gadfly/articles/2015-11-17/specialty-pharmacy-crackdown-benefit-managers-conflicted-but-right.
Office of Inspector General, Department of Health and Human Services. 2017. High-price drugs are increasing federal payments for Medicare Part D catastrophic coverage. Washington, DC: OIG.
Office of Inspector General, Department of Health and Human Services. 2014. Supplemental special advisory bulletin: Independent charity patient assistance programs. Federal Register 79, no. 104 (May 30): 31120–31123.
Kesselheim, A. 2014. Why are some generic drugs skyrocketing in price? Hearing testimony before the United States Senate, Committee on Health, Education, Labor, and Pensions, Subcommittee on Primary Health and Aging. November 20.
KRC Research. 2013. Seniors’ opinions about Medicare prescription drug coverage: 8th year update. Presentation prepared for Medicare Today. http://www.medicaretoday.org/MT2013/KRC%20Survey%20of%20Seniors%20for%20Medicare%20Today%20%20FINAL.pdf.
Liu, D.-L., Office of the Actuary, Centers for Medicare & Medicaid Services. 2016. Personal e-mail communication with author, November 30.
Marrufo, G., A. Dixit, D. Perlroth, et al. 2013. Medication therapy management in a chronically ill population: Interim report. Prepared for the Centers for Medicare & Medicaid Services by Acumen LLC. Contract HHSM–500–2011–00012I/TOT0001. Baltimore, MD: CMS.
Mattioli, D., M. Siconolfi, and D. Cimilluca. 2015. Walgreens, Rite Aid unite to create drug store giant. Wall Street Journal, October 27.
Medicare Payment Advisory Commission. 2016a. A data book: Health care spending and the Medicare program. Washington, DC: MedPAC.
Medicare Payment Advisory Commission. 2016b. Payment basics: Part D payment system. Washington, DC: MedPAC.
Medicare Payment Advisory Commission. 2016c. Report to the Congress: Medicare and the health care delivery system. Washington, DC: MedPAC.
Medicare Payment Advisory Commission. 2016d. Report to the Congress: Medicare payment policy. Washington, DC: MedPAC.
Medicare Payment Advisory Commission. 2015a. Report to the Congress: Medicare and the health care delivery system. Washington, DC: MedPAC.
Medicare Payment Advisory Commission. 2015b. Report to the Congress: Medicare payment policy. Washington, DC: MedPAC.
Medicare Payment Advisory Commission. 2014a. Letter to Ms. Marilyn Tavenner, Administrator, Centers for Medicare & Medicaid Services, regarding request for comments on the “Medicare program; contract year 2015 policy and technical changes to the Medicare Advantage and the Medicare prescription drug benefit programs, proposed rule.” February 28.
Medicare Payment Advisory Commission. 2014b. Report to the Congress: Medicare payment policy. Washington, DC: MedPAC.
433 Repo r t t o t h e Cong r e s s : Med i ca r e Paymen t P o l i c y | Ma r ch 2017
Staton, T. 2015. Big three PBMs cut loose more specialty pharmacies as scrutiny grows. Fierce Pharma, November 16. http://www.fiercepharma.com/pharma/big-three-pbms-cut-loose-more-specialty-pharmacies-as-scrutiny-grows.
Stuart, B., F. B. Hendrick, X. Shen, et al. 2016. Eligibility for and enrollment in Medicare Part D medication therapy management programs vary by plan sponsor. Health Affairs 35, no. 9 (September 1): 1572–1580.
Teichert, E. 2016. Aetna-Humana merger challenge to be decided in January. Modern Healthcare, August 10.
Thomas, K. 2017. Specialty pharmacies say benefit managers are squeezing them out. New York Times, January 9.
Walker, J. 2016. Express Scripts countersues Anthem in contract dispute. Wall Street Journal, April 19.
Wesolowski, A. 2016. Final report: Coverage choices, access to care, practice transformation efforts, care delivery and coordination, and behavioral health integration: Findings from Medicare beneficiary focus groups and provider interviews. A study conducted by staff from NORC at the University of Chicago for the Medicare Payment Advisory Commission. Washington, DC: MedPAC.
Pharmacy Benefit Management Institute. 2016. 2015–2016 drug benefit report. Plano, TX: PBMI. http://www.pbmi.com/ItemDetail?iProductCode=2015-2016_BDR&Category=BDR.
Picker, L. 2016. Anthem and Cigna accuse each other of breaching merger deal. New York Times, September 21.
QuintilesIMS Institute. 2016. Estimate of Medicare Part D costs after accounting for manufacturer rebates. Parsippany, NJ: QuintilesIMS Institute. https://www.imshealth.com/files/web/IMSH%20Institute/Reports/IIHI_Estimate_of_Medicare_Part_D_Costs.pdf.
Rubenfire, A. 2016. Pay-for-performance drug pricing: Drugmakers asked to eat costs when products don’t deliver. Modern Healthcare, December 10.
Seeking Alpha. 2016. Diplomat Pharmacy’s (DPLO) CEO Phil Hagerman on Q3 2016 results—Earnings call transcript. http://seekingalpha.com/article/4018624-diplomat-pharmacys-dplo-ceo-phil-hagerman-q3-2016-results-earnings-call-transcript.
Seeking Alpha. 2013. CVS Caremark’s CEO hosts 2013 analyst day conference (transcript). December 18. http://seekingalpha.com/article/1906311-cvs-caremarks-ceo-hosts-2013-analyst-day-conference-transcript.
Silverman, E. 2016. Anthem and Express Scripts war could change the pharmacy benefits model. STAT, March 22.
