staying in the flow using procedural content … · staying in the flow using procedural content...
TRANSCRIPT
STAYING IN THE FLOW USING PROCEDURAL CONTENT GENERATION
AND DYNAMIC DIFFICULTY ADJUSTMENT
by
Ravi Parekh
A Thesis
Submitted to the Faculty
of the
WORCESTER POLYTECHNIC INSTITUTE
in partial fulfillment of the requirements for the
Degree of Master of Science
in
Interactive Media and Game Development
May 2017
APPROVED:
_________________________________________
Professor Charles Rich, Advisor
_________________________________________
Professor Lee Sheldon, Committee/Reader
_________________________________________
Professor Mark Claypool, Committee/Reader
Contents
Table of Figures .............................................................................................................................................. i
Acknowledgements ....................................................................................................................................... ii
Abstract ........................................................................................................................................................ iii
1. Introduction .......................................................................................................................................... 1
2. Related Work ........................................................................................................................................ 2
2.1. Procedural Content Generation .................................................................................................... 2
2.2. Flow ............................................................................................................................................... 4
2.3. Dynamic Difficulty Adjustment ..................................................................................................... 6
2.4. Infinite Mario Bros ........................................................................................................................ 7
3. Design .................................................................................................................................................... 8
3.1. Why DDA + PCG + Flow? ............................................................................................................... 8
3.2. Solution ....................................................................................................................................... 10
3.3. The Conjecture ............................................................................................................................ 11
4. Algorithm ............................................................................................................................................ 12
5. Evaluation ........................................................................................................................................... 18
5.1. Infinite Mario Bros ...................................................................................................................... 18
5.1.1. Procedural Content Generation .......................................................................................... 22
5.1.2. Dynamic Difficulty Adjustment ........................................................................................... 24
5.1.3. Defining Performance Metric ............................................................................................. 26
5.2. Study Design................................................................................................................................ 28
5.3. Hypotheses ................................................................................................................................. 29
5.4. Experimental Procedure ............................................................................................................. 29
5.5. Results and Discussion ................................................................................................................ 30
6. Conclusion ........................................................................................................................................... 33
7. References .......................................................................................................................................... 33
Appendix A .................................................................................................................................................. 38
Pre – Test Questions ............................................................................................................................... 38
Post – Test Questions .............................................................................................................................. 39
i
Table of Figures
Figure 1: Version of Flow diagram used in this thesis .................................................................................. 5
Figure 2: Explaining the problem statement ................................................................................................ 9
Figure 3: DDA and PCG working together to maintain Flow ...................................................................... 10
Figure 4: Defining α and β and respective difficulties for skill S1 ............................................................... 10
Figure 5: Identifying the zone based on player performance ..................................................................... 11
Figure 6: Visual representation of DDA behavior for increasing difficulty ................................................. 13
Figure 7: Visual representation of DDA behavior for decreasing difficulty ................................................ 14
Figure 8: Behavior of DDA when performance increases in the zone ........................................................ 16
Figure 9: Behavior of DDA when performance drops in the zone .............................................................. 17
Figure 10: Infinite Mario Bros. Title Screen ................................................................................................ 18
Figure 11: Scene while playing Infinite Mario Bros. ................................................................................... 20
Figure 12: Chart showing the results of using all the parameters for performance calculations .............. 27
Figure 13: Chart showing the expected shape of the graph using coins .................................................... 28
Figure 14: Participant performance for difficult start with DDA ................................................................ 30
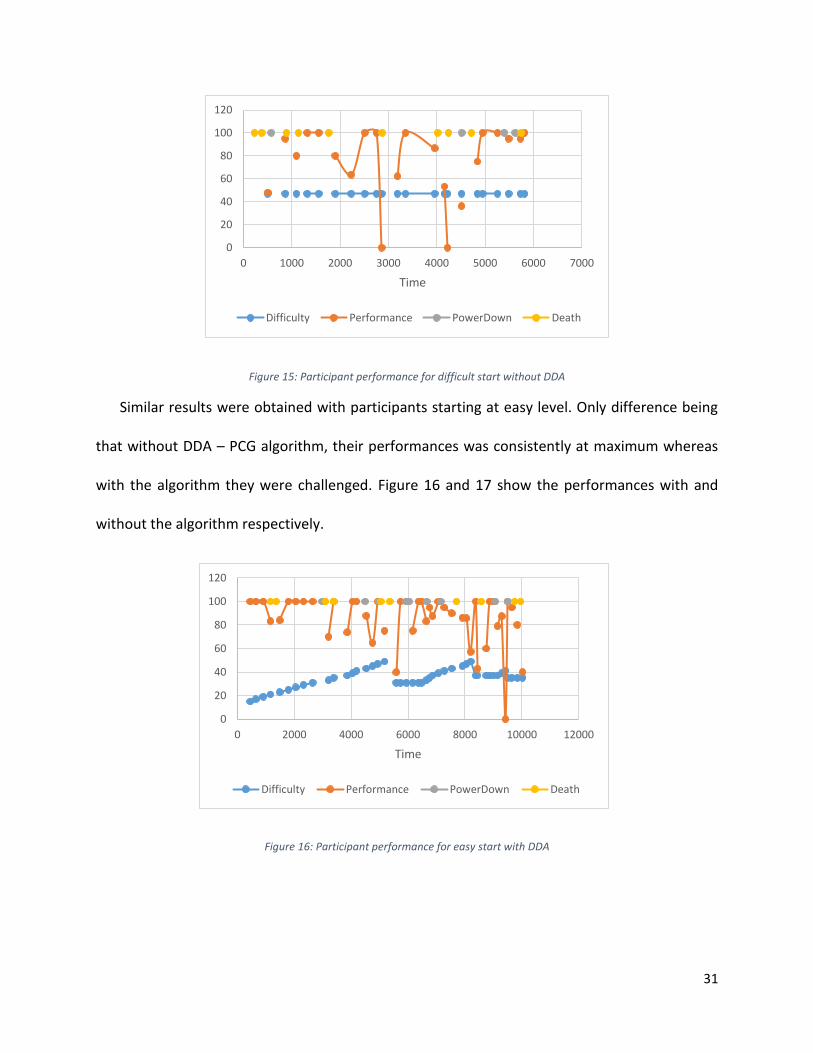
Figure 15: Participant performance for difficult start without DDA ........................................................... 31
Figure 16: Participant performance for easy start with DDA ..................................................................... 31
Figure 17: Participant performance for easy start without DDA ................................................................ 32

ii
Acknowledgements
I would like to thank my advisor, Professor Charles Rich for his continuous support, guidance
and patience for this thesis and my academics. You have been a great teacher and I look forward
to learn more from you. I also thank Professors Mark Claypool and Lee Sheldon, for their
encouragement and support.
I also thank my family for all the moral support and being there from across borders waking
me up early in the mornings so that I do not miss my deadlines.
I would also like to my friends here at WPI for all the entertainment that they provided when
I was stressed out due to academics.
Thank you WPI for giving me the opportunity to learn from some of the best teachers and
providing all the resources and infrastructure for a great learning experience.
iii
Abstract
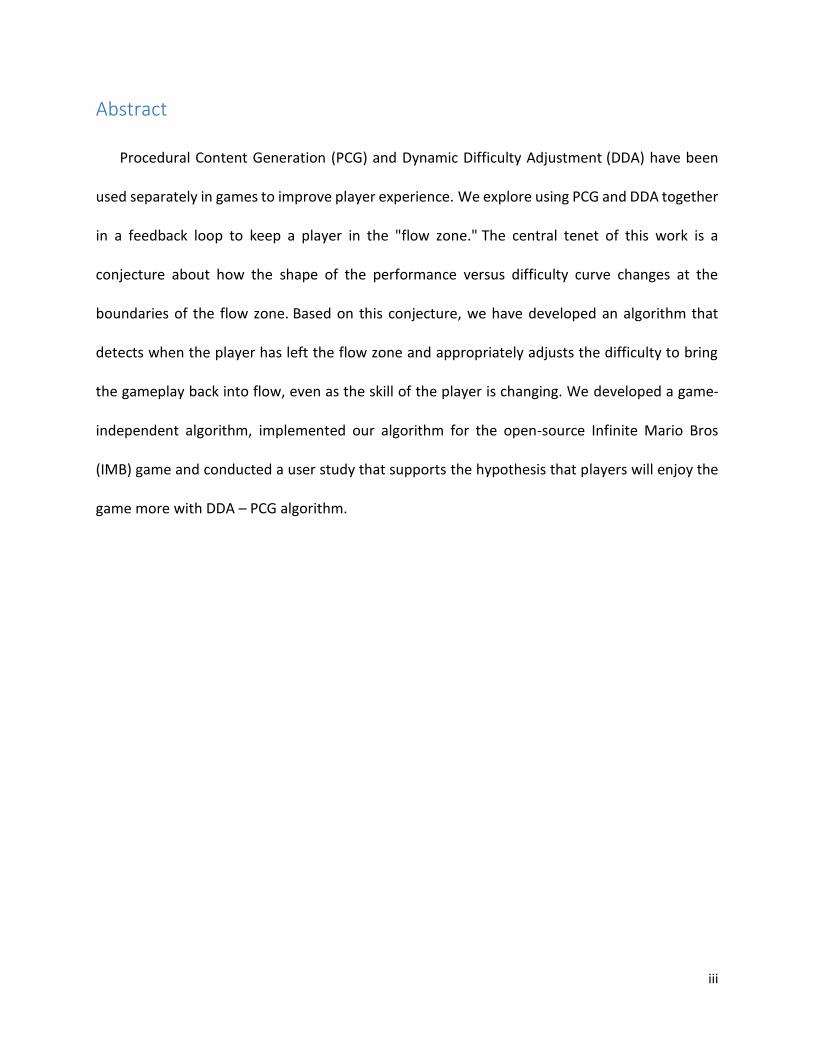
Procedural Content Generation (PCG) and Dynamic Difficulty Adjustment (DDA) have been
used separately in games to improve player experience. We explore using PCG and DDA together
in a feedback loop to keep a player in the "flow zone." The central tenet of this work is a
conjecture about how the shape of the performance versus difficulty curve changes at the
boundaries of the flow zone. Based on this conjecture, we have developed an algorithm that
detects when the player has left the flow zone and appropriately adjusts the difficulty to bring
the gameplay back into flow, even as the skill of the player is changing. We developed a game-
independent algorithm, implemented our algorithm for the open-source Infinite Mario Bros
(IMB) game and conducted a user study that supports the hypothesis that players will enjoy the
game more with DDA – PCG algorithm.

1
1. Introduction
Today’s video game industry comprises of an extensive number of games which are identified
under a number of genres and are played on various platforms. There are millions of players who
play these games and each player has a different skill level to play each game. In addition, players
show a unique learning curve for every game that they play. It thus becomes difficult to entertain
each player with preset difficulty levels that are defined by designers. These difficulty levels are
static and are designed to target a general demographic set. This hinders the game play
experience for players who cannot be identified in the demographic set of that game.
There is a need for technologies and techniques to be developed that enable game designers
and developers to create games that are adaptive. Various technologies and techniques are being
implemented to achieve better user experience for each player.
This thesis aims to help integrate Procedural Content Generation (PCG) and Dynamic
Difficulty Adjustment (DDA) to generate better user experience in various game genres. This will
be achieved using a side scrolling platform game - Infinite Mario Bros (IMB). The genre was
selected especially due to the fact that it has game content outside the viewing area and this
makes it easier to generate game content dynamically.
PCG is widely being used in games to procedurally generate maps and levels. In No Man Sky
(Braham, 2016), PCG is used to generate the entire game universe procedurally. DDA has been
used to improve player experience in games by manipulating game object properties based on
the player performance parameters. Crash Bandicoot (Siller, 1996) uses DDA to slow down
obstacles and increase continue points based on the players’ number of deaths.

2
The written work discusses PCG, DDA and Flow based on some research done in each field. It
further discusses the proposed Performance – Difficulty curve and how an algorithm was created
and implemented in Infinite Mario Bros. The paper will also review the procedures for player
study, its results and conclusions and then speculate on the next steps for future works in this
direction.
2. Related Work
2.1. Procedural Content Generation
PCG in games is automated or semi-automated creation of game content using algorithms.
This gives a varied unpredictable content within a controlled acceptable range. Game
components that have been generated using PCG include: levels, maps, game rules, textures,
stories, quests, puzzles, music, characters, weapons and vehicles. Some of these components can
directly affect the gameplay. Other components such as textures and music do not directly affect
the gameplay but are supportive of the overall experience.
PCG has been used in games for about four decades now and there thus has been
considerable research on implementing and optimizing algorithms for PCG. Extensive work can
be found for procedural generation of levels, maps and narratives. There has been significant
work on procedurally generating other game components too. For example, Search Based PCG
has been an important contribution to procedural map generation for strategy games (Togelius,
2010). It uses multiobjective evolutionary algorithms to search a space of maps for candidates
that satisfy a pair of fitness functions.
3
Shaker (2016), discusses several reasons why PCG is used in games. One of the primary
reasons to use PCG is to save on time and resources for game development. Given the
technological advancements of various platforms on which games are played, increasing time
and resources are required to generate the content. Using PCG algorithms can produce content
faster and cheaper than getting similar work done by artists, programmers and designers. Apart
from better time and resource utilization, the content generated using PCG can be tailored to the
tastes and needs of the player by combining PCG with player modeling techniques. Another
reason is that PCG helps us create more original content. Humans have a tendency to imitate
each other and themselves. This can lead to similar or repetitive content.
One of the earliest games to implement PCG was Beneath Apple Manor (Worth, 1978), an
early dungeon game where the goal is to obtain a Golden Apple at the bottom floor of the
dungeon. Rogue (Toy, 1980), another early pioneer, gained more attention than Beneath Apple
Manor due to the procedural generation of the dungeon each time the game starts or the player
moves to the next level. Since these two games, games with PCG such as Elite (Braben, 1984),
Dwarf Fortress (Adams, 2006), Spore (Maxis, 2008) and Borderland (Armstrong, 2009) have had
an important impact on the gaming industry.
A method proposed by Compton (2006) involves the use of linear pattern and cell structures
to form non-linear level designs. It proposes a physics model similar to Super Mario Bros
(Miyamoto, 1985) and uses a hill-climbing algorithm to find patterns that are close to the
required difficulty level. Adding to this, Pedersen (2010) discusses about the use of preference
learning using feature subsets in Perrson (2008). This was further supported by Shaker (2010) in
a study where extended sets of features were used. But this study was performed on AI agents
4
rather than human subjects. Dahlskog (2012) used pattern recognition to build the levels for
Super Mario Bros game. Here the components of level design are tagged with numbers and the
level generator creates numbered patterns representing levels. A pattern recognition search
then discards any levels that do not satisfy a set of predefined rules.
In addition, there has been a considerable amount of work on games such as Angry Bird
(Mäki, 2009) that use close-to-real-world physics in the game mechanics. Ferreira (2014a) uses
estimation of distribution algorithms to generate three probabilities for each component, and
the components are then placed based on these probabilities. The process is repeated after
placing every component. This process was further explored and supported by Stephenson
(2016). In addition to the probabilities, several rules for the eligibility of a component were
added. Also, in-air platforms were added to the game. Genetic algorithms have also been able to
provide reasonable results. Ferreira (2014b) used genetic algorithm to initialize a population,
each individual representing a level structure. The individuals are then crossed over or mutated,
or both, based on a set of rules and a fitness function. The resulting population is a set of
acceptable levels out of which one can be picked using an appropriate method.
2.2. Flow
"The best moments in our lives are not the passive, receptive, relaxing times… The best
moments usually occur if a person’s body or mind is stretched to its limits in a voluntary effort to
accomplish something difficult and worthwhile." Csikszentmihalyi (1990).
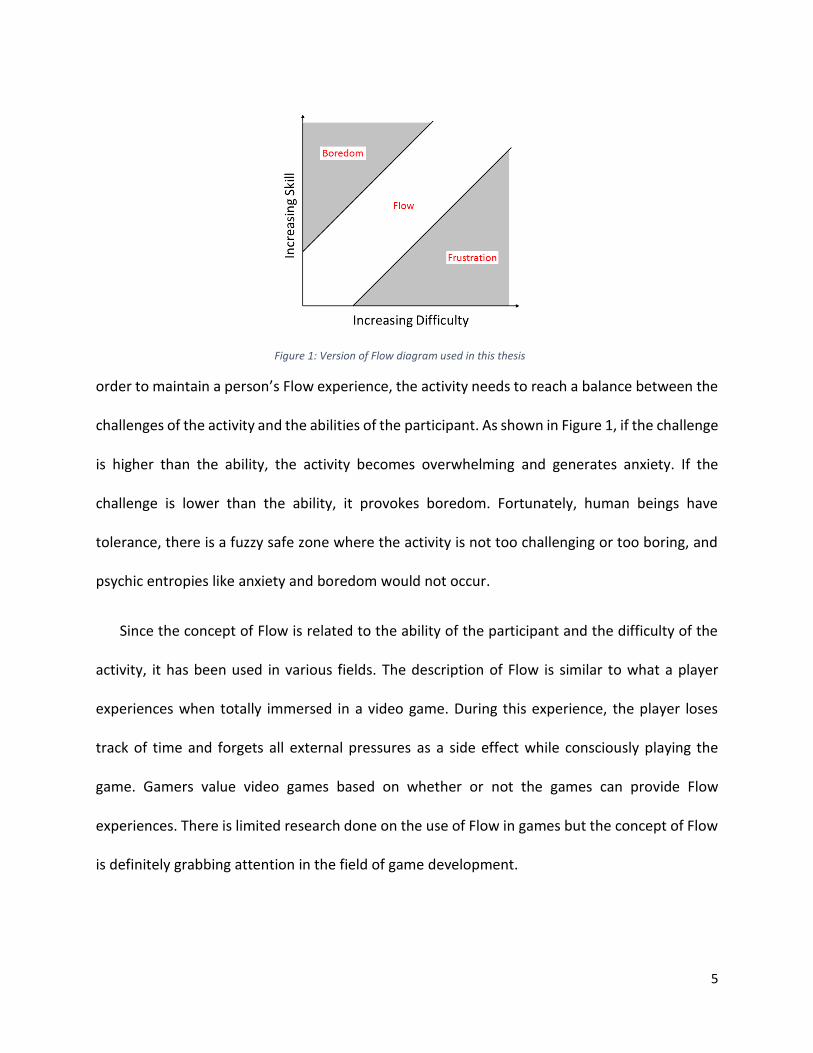
‘Flow’ as described by psychologist Mihaly Csikszentmihalyi is the state of consciousness
where an individual experiences the peak enjoyment or fulfillment while doing an activity. In
5
order to maintain a person’s Flow experience, the activity needs to reach a balance between the
challenges of the activity and the abilities of the participant. As shown in Figure 1, if the challenge
is higher than the ability, the activity becomes overwhelming and generates anxiety. If the
challenge is lower than the ability, it provokes boredom. Fortunately, human beings have
tolerance, there is a fuzzy safe zone where the activity is not too challenging or too boring, and
psychic entropies like anxiety and boredom would not occur.
Since the concept of Flow is related to the ability of the participant and the difficulty of the
activity, it has been used in various fields. The description of Flow is similar to what a player
experiences when totally immersed in a video game. During this experience, the player loses
track of time and forgets all external pressures as a side effect while consciously playing the
game. Gamers value video games based on whether or not the games can provide Flow
experiences. There is limited research done on the use of Flow in games but the concept of Flow
is definitely grabbing attention in the field of game development.
Figure 1: Version of Flow diagram used in this thesis
6
2.3. Dynamic Difficulty Adjustment
Dynamic Difficulty Adjustment (DDA) refers to automatically changing parameters, scenarios
and behavior in a game according to player’s performance while the game is being played. This
type of adjustment helps to keep the player from becoming bored (when the game is too easy)
or frustrated (when the game is too hard) during game play. DDA is often associated with the
concept of Flow as it enables the game to adjust with pre – decided game parameters to deliver
a better experience to the player. Referring to the flow model in Figure 1, the goal is to keep the
player in the Flow Channel.
Although DDA is a relatively new technology, several approaches to implement it have
already been proposed. Hunicke (2004) discusses the Hamlet system used in Half-Life (Laidlaw,
1998) and uses functions for monitoring game statistics based on predefined metrics, defining
and executing adjustment action and policies, generating play session tracing.
Moffett (2010) discusses the use of causal models for DDA. A causal model is a directed acyclic
graph where the node represents modeled factors and the edges indicate the influence of these
factors on the target factor. The aim is to get a formal notation that approximates ‘flow’, which
is an abstract concept. Each node is converted into a linear regression equation. These equations
can be individually used to determine an estimate for any node or can be collapsed to form an
equation for ‘flow’. This approach was applied to two games to validate the hypothesis: – Slime
Volleyball (Pendragon, 2007) and Project: Starfighter (Sweeney, 2001).
Video games usually follow a predefined difficulty curve. The nature of the difficulty curve is
conventionally dictated by the initial difficulty selection that the player make (Michael, 2013) .
7
The choices normally range from easy to hard and sometimes very easy to very hard. Some of
the game elements that might be manipulated for dynamic difficulty in a platformer are:
Speed / health of enemies
Frequency of enemies / power ups
Power of player / enemies
2.4. Infinite Mario Bros
Infinite Mario Bros (IMB) has been used in a number of researches related to games. It has
especially been common in research related to procedural content generation. Some research
trying to propose algorithms to improve user experience also use IMB as an option to implement
the algorithms and study the outputs. These researches prefer IMB either because the intended
research is to be applied to platform games or simply because IMB is a game that can be easily
modified as required by the study without affecting its gameplay complexity. This section talks
about some interesting researches that use IMB.
In Mawhorter (2010), IMB is used to implement an algorithm that uses Occupancy –
Regulated Extension. The algorithm uses a chunk based approach in which each chunk comprises
of a certain layout. A key point in each chunk is the anchor which represents the start position of
the player for that chunk. The algorithm builds the level by selecting a chunk that matches the
rules for eligibility given the current chunk. The algorithm proposed has the ability to manage
chunks of any scale giving it the adaptability required to incorporate human – designed
components as well. This is a good attempt at adding human – like creativity to algorithm based
level design.
8
Blom et al. (2014) performed a research in personalized user experience similar to the one
being done in this thesis. They used facial recognition to identify player emotions and used this
feedback to decide the difficulty of the next segment of the game. This approach leverages
computer – based techniques to unobtrusively monitor user emotions to increase player
experience. Even though the study provided promising results, it depended on the use of external
image capture devices for enhanced player experience. On the other hand, this study collects
player related game data directly from within the game.
Ortega (2012) tries to imitate human playing styles using AI. This novel approach aims at
creating Non Player Characters (NPCs) that can be perceived as having human – like style in the
game. The research studies a number of direct and indirect methods of training the AI system to
imitate human gameplay. From user study, it was concluded that the indirect methods of training
gave promising results and Neuroevolution method gave the best output amongst the algorithms
that were considered for the study.
3. Design
The objective of this thesis is to help keep players in the flow using PCG and DDA. To achieve
this, we will modify the open source version of IMB and implement the proposed PCG and DDA
algorithms.
3.1. Why DDA + PCG + Flow?
As discussed, DDA is the dynamic adjustment of game parameters based on the game’s
understanding of factors such as player’s skill and enjoyment levels. DDA uses algorithms that
help represent factors like flow, difficulty and skill into measureable quantities. Using this basic
9
concept, we can say that DDA can determine when to change the game parameters and in what
direction the parameters need to be changed, i.e. whether to make the parameter more difficult
or easier.
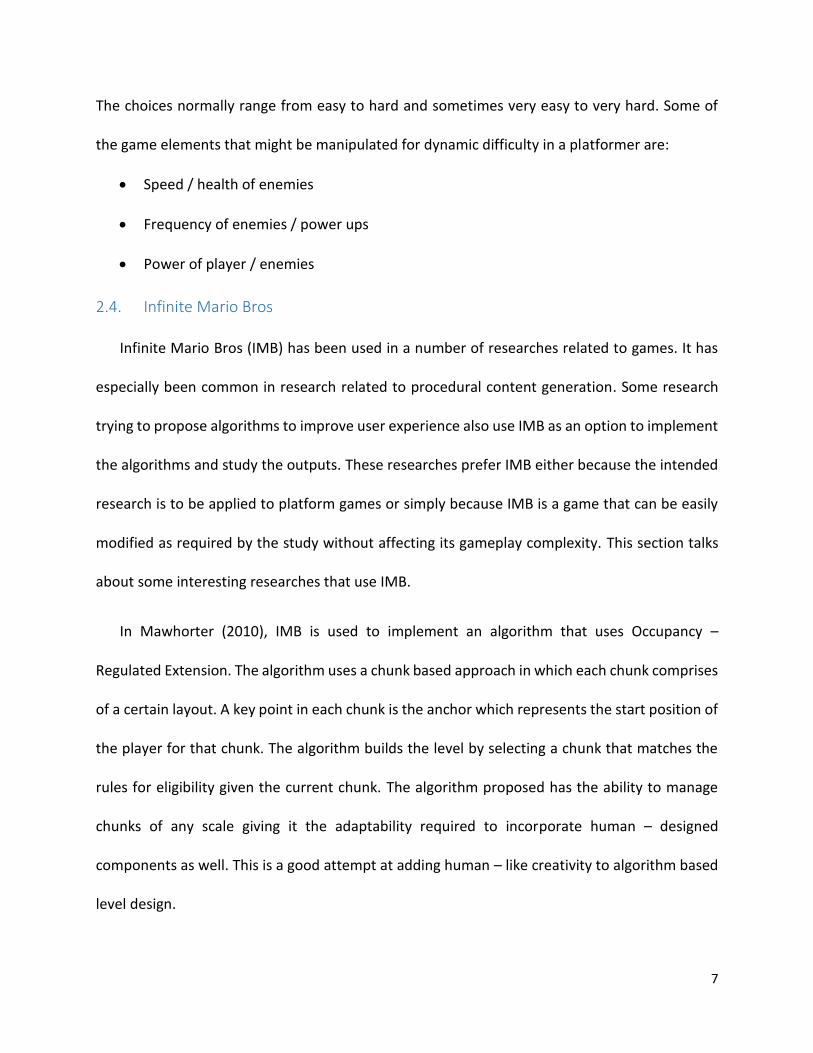
The challenge with the Flow Graph in Figure 2 is to identify the region in which the player
currently lies for a given difficulty level. If the player is in the ‘Frustration’ region, he needs to be
brought into the zone by lowering the difficulty. If the player is in ‘Boredom’ region, he needs to
be pushed into the zone by increasing the difficulty. If the player is already within the ‘Flow’
region, no changes need to be made to the difficulty.
PCG, on the other hand, is about dynamically generating relevant content in a game given
certain target parameters. In context to this thesis, we can say that PCG will determine how to
generate content of a specified difficulty level.
Figure 2: Explaining the problem statement
10
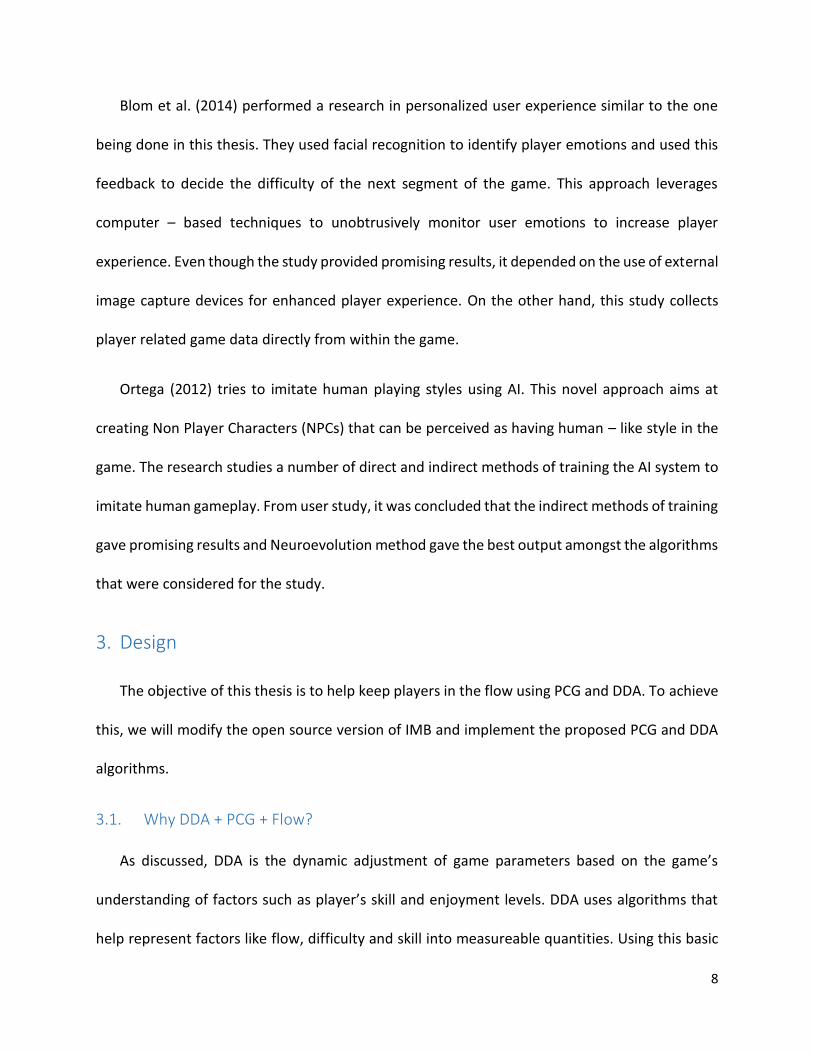
As shown in Figure 3, both DDA and PCG will work in harmony for this thesis. DDA will monitor
the game play and determine when a change is needed in the difficulty of the game and in what
direction. The decision will be the input for PCG, which will then determine the way in which the
next phase of the game needs to be designed to achieve the expected results.
3.2. Solution
Skill is a player property and thus manipulating it in the game becomes impossible. On the
other hand, difficulty is something that can be easily defined in games and we can easily
manipulate difficulty during runtime using DDA.
Figure 3: DDA and PCG working together to maintain Flow
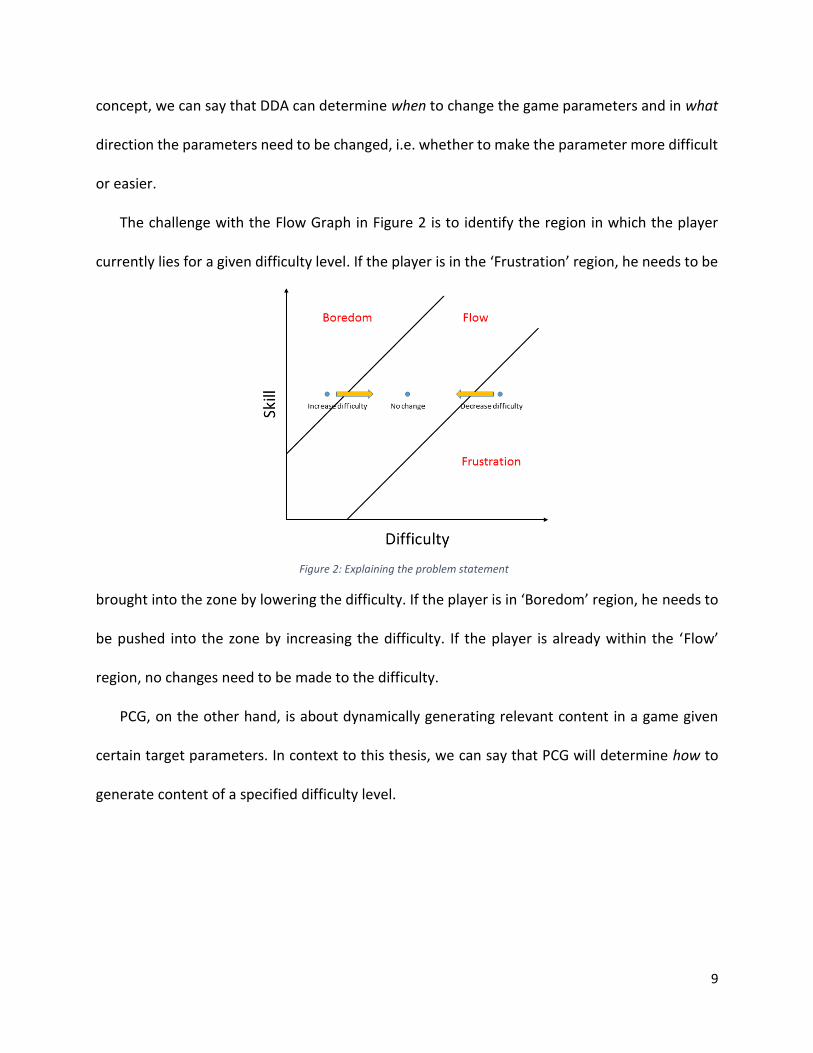
Figure 4: Defining α and β and respective difficulties for skill S1

11
In the Flow Graph shown in Figure 4, let us name the borders holding the Zone as α and β
that correspond to difficulties d1 and d2. Let us also pick a skill level S1 and take a cross section
of the graph and try to map it to a Performance Vs Difficulty Graph in Figure 4. The need is to
map the difficulty against a player property that can be mathematically calculated and is related
to player skill. One such player property can be player performance. Mathematically,
performance can be defined as a function of skill and difficulty.
𝑃 = 𝑓(𝑆, 𝐷)
In the above equation, P is the player performance at a given skill level S and difficulty D.
Based on this we can form a graph of difficulty against performance and relate it to the Flow
Graph as shown in Figure 5.
3.3. The Conjecture
The shape of the graph in Figure 5 is the central conjecture of this thesis. The goal is to find
difficulties d1 and d2 that represent the start and end of the zone. Once d1 and d2 are found the
Figure 5: Identifying the zone based on player performance
12
objective is to keep the difficulty between d1 and d2 where the player is expected to be in the
flow.
The player will be at the best of his performance when the difficulty is low. This stays true
and can have a ‘ceiling effect’ until the difficulty hits the starting of the zone α from where the
performance will drop with a gentle slope. The performance will continue to drop with a constant
slope until the difficulty reaches the end of the zone at β. The player performance then drops
with a steep slope with further increase in difficulty and may get a ‘floor effect’ where the player
has a constant low performance. The slope after β is highly dependent on the game and its
design.
Once the players are brought into their zones, chances are that their performance will
improve or deteriorate over time. The target is to keep monitoring the player performance after
bringing the player into the zone and then recalculate the zone in case the performance increases
or decreases considerably.
4. Algorithm
The DDA is a critical part of this thesis as it makes that decision on when and which direction
to change the difficulty so as to bring the player into the flow zone. The algorithm can is game –
independent and its working is discussed below.
The DDA starts with calculating the performance and analyzing it for 3 cycles. During this the
difficulty is increased by Δd every cycle. DDA calculates the average performance over the cycles
and determines if increasing difficulty or decreasing difficulty is required. To determine this the
DDA uses preset performance threshold values. If the performance is greater than the threshold,
13
the difficulty is increased by Δd every cycle and if the performance is less than the threshold,
difficulty is decreased by Δd every cycle.
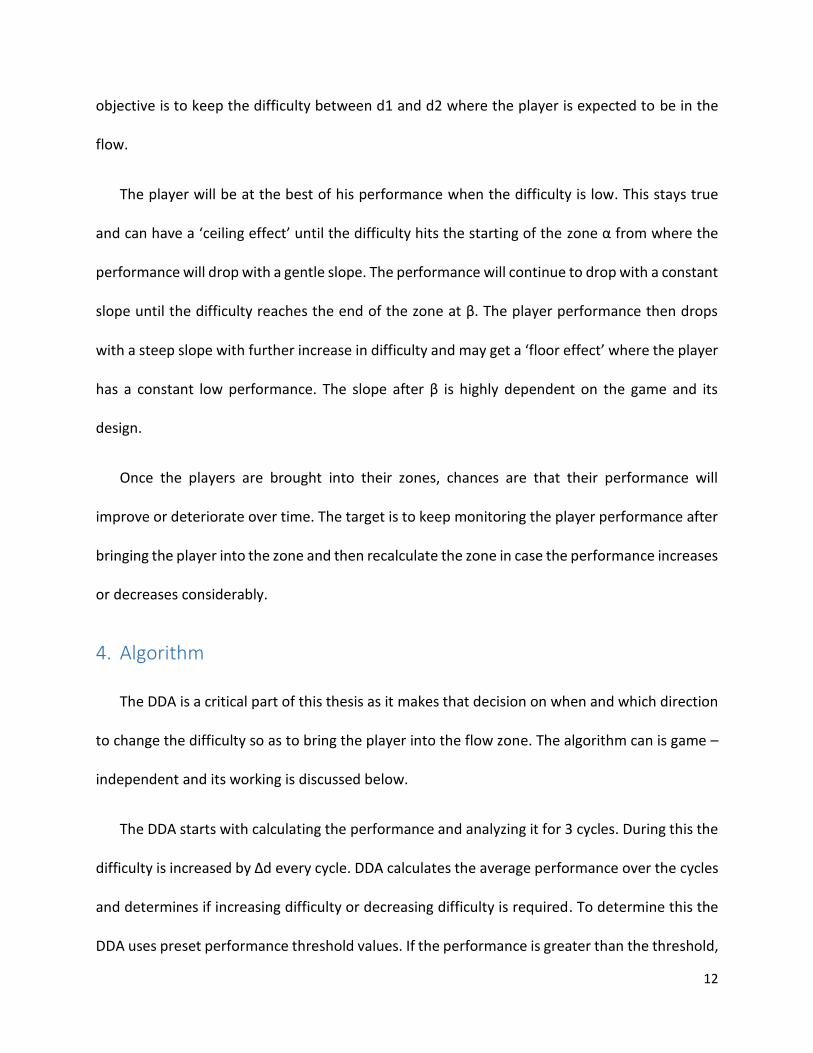
For increasing difficulty, the DDA looks to calculate d1 first and then d2 as shown in Figure 6. The
DDA keeps increasing the difficulty by Δd until both d1 and d2 are found. At the end of every
cycle, the DDA runs a sliding window of size 3 from left to right, averaging out performances on
each iteration until it finds a group of difficulties where average performance is below α
Threshold. The first difficulty from the left in this group is set to d1.
The DDA continues to increase the difficulty after d1 is calculated. It runs the same sliding
window of size 3 from left to right, averaging out performances each iteration. If the DDA finds a
group of difficulties where average performance is below β Threshold, the first difficulty from the
left in the group is set to d2.
The algorithm for DDA behavior during increasing difficulty can be summarized in a
pseudocode as follows:
if increasing difficulty
Figure 6: Visual representation of DDA behavior for increasing difficulty
14
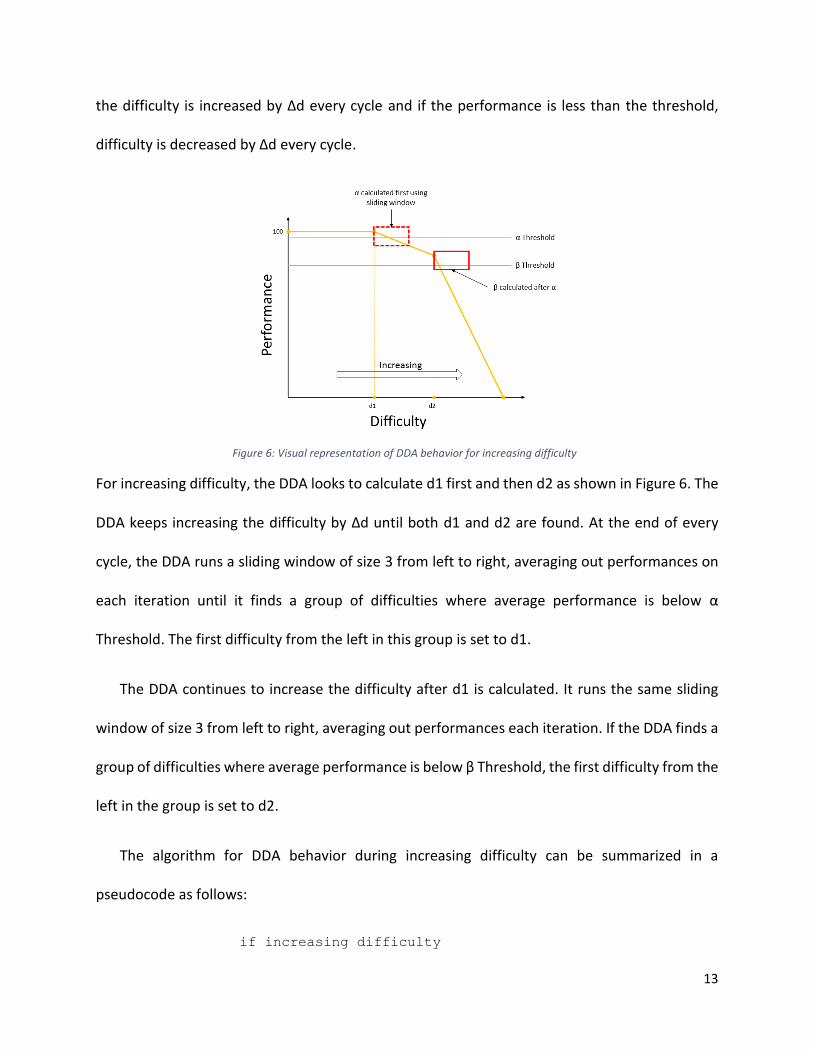
{
if α not found
{
calculate α
}
else if α found and β not found
{
calculate β
}
else
{
difficulty += Δd
}
}
For decreasing difficulty, the DDA looks to calculate d2 first and then d1 as shown in Figure
7. The DDA keeps decreasing the difficulty by Δd until both d2 and d1 are found. At the end of
every cycle, the DDA runs a sliding window of size 3 from right to left, averaging out performances
on each iteration until it finds a group of difficulties where average performance is above β
Threshold. The first difficulty from the right in this group is set to d2.
The DDA continues to decrease the difficulty even after d2 is calculated. It runs the same
sliding window of size 3 from right to left, averaging out performances each iteration. If the DDA
Figure 7: Visual representation of DDA behavior for decreasing difficulty
15
finds a group of difficulties where average performance is above α Threshold, the first difficulty
from the right in the group is set to d1.
The algorithm for DDA behavior during decreasing difficulty can be summarized using the
following pseudocode:
if decreasing difficulty
{
if β not found
{
calculate β
}
else if β found and α not found
{
calculate α
}
else
{
difficulty += Δd
}
}
α Threshold and β Threshold are performance value such that it is an overlap between
performance drops due to accidental external stimuli and the performance drops due to
increasing difficulty. This value is reached upon by experimental observations and approximation
such that it satisfies both the above conditions. Thus the thresholds stay same for all players.
More work needs to be done to automate the process of determining the thresholds which would
enable the DDA to generate player specific thresholds.
In either case, once d1 and d2 are identified, the DDA brings the player into the zone by
setting the difficulty in between α and β. That means, the difficulty on every cycle will now stay
at:
𝑍𝑜𝑛𝑒 𝐷𝑖𝑓𝑓𝑖𝑐𝑢𝑙𝑡𝑦 =(𝛼 + 𝛽)
2
16
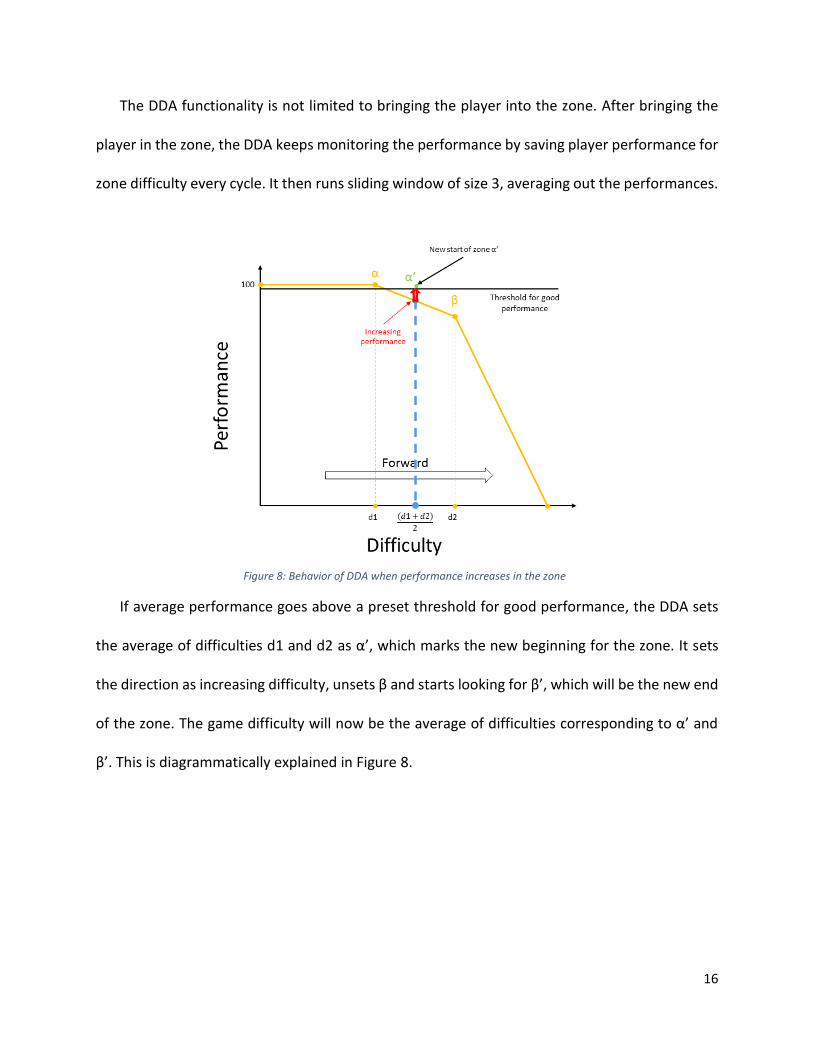
The DDA functionality is not limited to bringing the player into the zone. After bringing the
player in the zone, the DDA keeps monitoring the performance by saving player performance for
zone difficulty every cycle. It then runs sliding window of size 3, averaging out the performances.
If average performance goes above a preset threshold for good performance, the DDA sets
the average of difficulties d1 and d2 as α’, which marks the new beginning for the zone. It sets
the direction as increasing difficulty, unsets β and starts looking for β’, which will be the new end
of the zone. The game difficulty will now be the average of difficulties corresponding to α’ and
β’. This is diagrammatically explained in Figure 8.
Figure 8: Behavior of DDA when performance increases in the zone
17
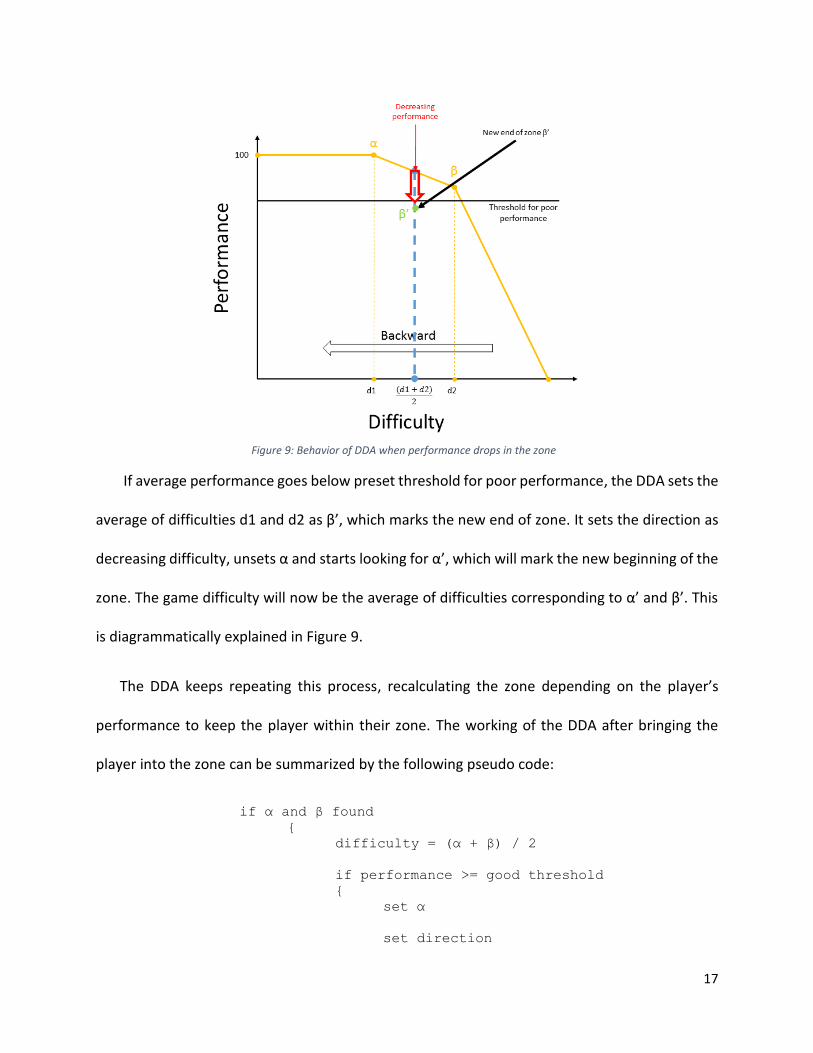
If average performance goes below preset threshold for poor performance, the DDA sets the
average of difficulties d1 and d2 as β’, which marks the new end of zone. It sets the direction as
decreasing difficulty, unsets α and starts looking for α’, which will mark the new beginning of the
zone. The game difficulty will now be the average of difficulties corresponding to α’ and β’. This
is diagrammatically explained in Figure 9.
The DDA keeps repeating this process, recalculating the zone depending on the player’s
performance to keep the player within their zone. The working of the DDA after bringing the
player into the zone can be summarized by the following pseudo code:
if α and β found
{
difficulty = (α + β) / 2
if performance >= good threshold
{
set α
set direction
Figure 9: Behavior of DDA when performance drops in the zone
18
calculate zone()
}
else if performance <= poor threshold
{
set β
set direction
calculate zone()
}
}
5. Evaluation
Using the algorithm discussed in the previous section, we modified IMB to implement the
DDA – PCG loop. This section discusses the IMB game structure, the changes done to the game,
the participant study and the results and conclusion.
5.1. Infinite Mario Bros
The open source version of IMB is readily available on GitHub for download and falls under
the public domain. The code can be used without any restrictions but the images and sounds
used in the game are property of Nintendo and cannot be used for commercial purposes.
Figure 10: Infinite Mario Bros. Title Screen

19
The game has the traditional damsel-in-distress storyline where the player has to play as
Mario and rescue Princess Peach. For this the player has to navigate a world map clearing a level
of the game at each node on the world map. The world map and the levels in IMB are generated
procedurally. Each time the game runs, a world map is generated using a set of predefined rules.
The player would have to complete the world in a single run as a rerun would present a different
world altogether.
The levels too are generated procedurally based on predefined set of rules and parameters
passed by the world based on the location of the level node on the map. There are three types
of levels – ground, under water and castle. The difficulty of the levels is directly related to the
level number. The difficulty of the game is determined by type of terrain and number of enemies
presented. The bricks walls, coins and power ups are additional game objects that are added
along with the terrain and enemies.
The terrains in IMB can be categorized into five types:
Straight – A straight platform. It is the most basic type of terrain and all other terrains use this
as the base.
Hill – It is a vertically extended platform with varied height and width on a straight platform.
There can be a single hill or a group of hills generated close to each other.
20
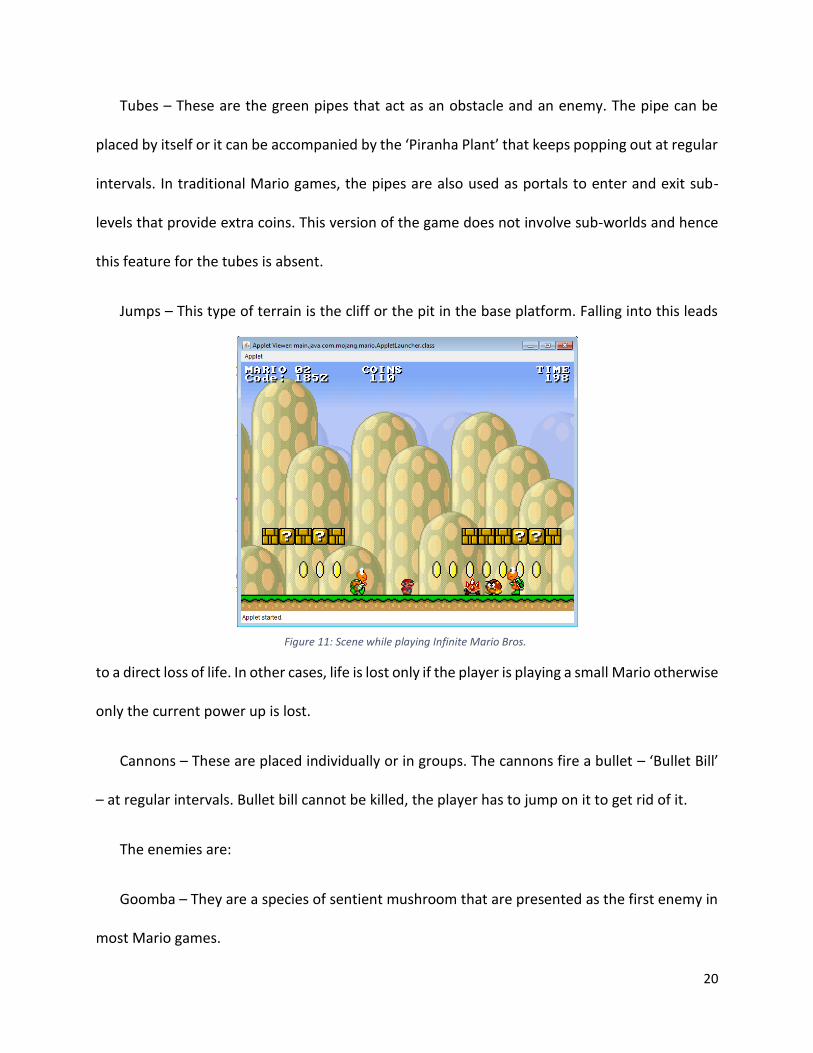
Tubes – These are the green pipes that act as an obstacle and an enemy. The pipe can be
placed by itself or it can be accompanied by the ‘Piranha Plant’ that keeps popping out at regular
intervals. In traditional Mario games, the pipes are also used as portals to enter and exit sub-
levels that provide extra coins. This version of the game does not involve sub-worlds and hence
this feature for the tubes is absent.
Jumps – This type of terrain is the cliff or the pit in the base platform. Falling into this leads
to a direct loss of life. In other cases, life is lost only if the player is playing a small Mario otherwise
only the current power up is lost.
Cannons – These are placed individually or in groups. The cannons fire a bullet – ‘Bullet Bill’
– at regular intervals. Bullet bill cannot be killed, the player has to jump on it to get rid of it.
The enemies are:
Goomba – They are a species of sentient mushroom that are presented as the first enemy in
most Mario games.
Figure 11: Scene while playing Infinite Mario Bros.
21
Koopa – They turtle like creatures that present a slightly stronger enemy than the Goombas.
They are of two types. The green Koopas maintain current direction of movement until they
encounter an obstacle, in which case, they reverse the direction. The red Koopas maintain
current direction of movement until they reach the end of the platform that they are on.
Spiny – They are similar to Koopas but on four legs. They have spikes on their shells and can
only be killed by a kicked Koopa shell.
Piranha Plant – As discussed earlier, they keep popping out of tubes and can be killed only by
fireballs thrown by Mario in the Super form.
Bullet Bill – Bullet Bills are the bullets shot by the cannons. They keep travelling in the
direction that they are shot in until they reach a threshold outside the screen. They can be
annoying if they are travelling in the direction of gameplay. The only way to get rid of them, apart
from them going out of the screen, is to jump on them to immobilize them and make them fall
down the screen.
All enemies except Piranha Plant and Bullet Bill can be generated in their winged version
where they have a jumping movement to present a higher challenge in tackling them.
The game also contains some other static objects that can be interacted with. These we will
term as ‘decorations’. These decorations include the brick walls, power up boxes – the boxes with
animated ‘?’ on them – and coins. The coins are placed generously over the terrain wherever
there is enough space in the terrain. They contribute to the total score and thus one of the
objectives is to collect as many coins as possible through the game. The brick walls and power up

22
boxes are placed in groups and can be interacted with by jumping under them. In this version of
the game, the brick walls and power up boxes both provide coins and power ups generously.
5.1.1. Procedural Content Generation
The original IMB stared by generating a world map where the player navigates to a level node
to enter a level. Our version of IMB does not generate a world map and takes the player directly
into a level. The levels in original IMB were generated procedurally and had a start and end
points. We modified the procedural level generation to just have a start point without having an
end. Technically, if the difficulty is kept to a minimum, the player can keep playing the game
forever or until they chose to manually close down the game.
The PCG in the original IMB used probabilities to set the rules for generation of content. We
continued using this approach for content generation because platformers like IMB do not have
complex content rules and thus, a little uncertainty in the generation rules can give the varied
results that are expected.
For the terrain the probabilities were preset for straight and hill type of terrain. The other
terrains had a probability that was dependent on the difficulty of the game. We modified the
probabilities for all terrains such that they were dependent on the difficulty. The relation
between the probabilities and difficulty is such that the simpler terrains are generated more at
lower difficulties and the difficult ones are generated more during higher difficulty.
In platform games, one of the factors affecting the difficulty is the number of enemies that
the player has to face during a given time. The original IMB uses this fact to generate number and
23
type of enemies based on the difficulty, again using probabilities. We simply tweaked the
probabilities to our requirements and left the logic as is.
The original IMB provided the coins and power ups generously. For this thesis, the coins are
a prime factor in calculating the performance of a player and thus the player needs to put in some
effort to have them. The number of coins that are presented was such that the coins would
appear regularly but collecting all of them would present a challenge based on the difficulty.
Similarly, the number of power ups has been controlled so that the player values having the
power up. Too often would mean that the player will not mind running into enemies to collect
the coins. Too rare would mean that the player will not be in a position to face enemies thus
making it difficult to progress.
The PCG generates the level infinitely. For this a major modification was done to how the
level is created in terms of its entirety. In the original version of IMB, the level had a limit to its
length and thus all the features in the level were pre-calculated. The game objects were then
drawn by the renderer based on the pre-calculated values. In the version for this thesis, the PCG
generates the level in terms of screens such that each screen length is greater than one and half
viewing window. The actual length of the screen may vary slightly each cycle due to the difference
in the lengths of its building blocks. For this reason, all the calculations in the DDA consider one
cycle as one screen length.
After all modifications to the PCG the base logic of content creation can be summarized in a
pseudo code as:
set required difficulty == received from DDA
24
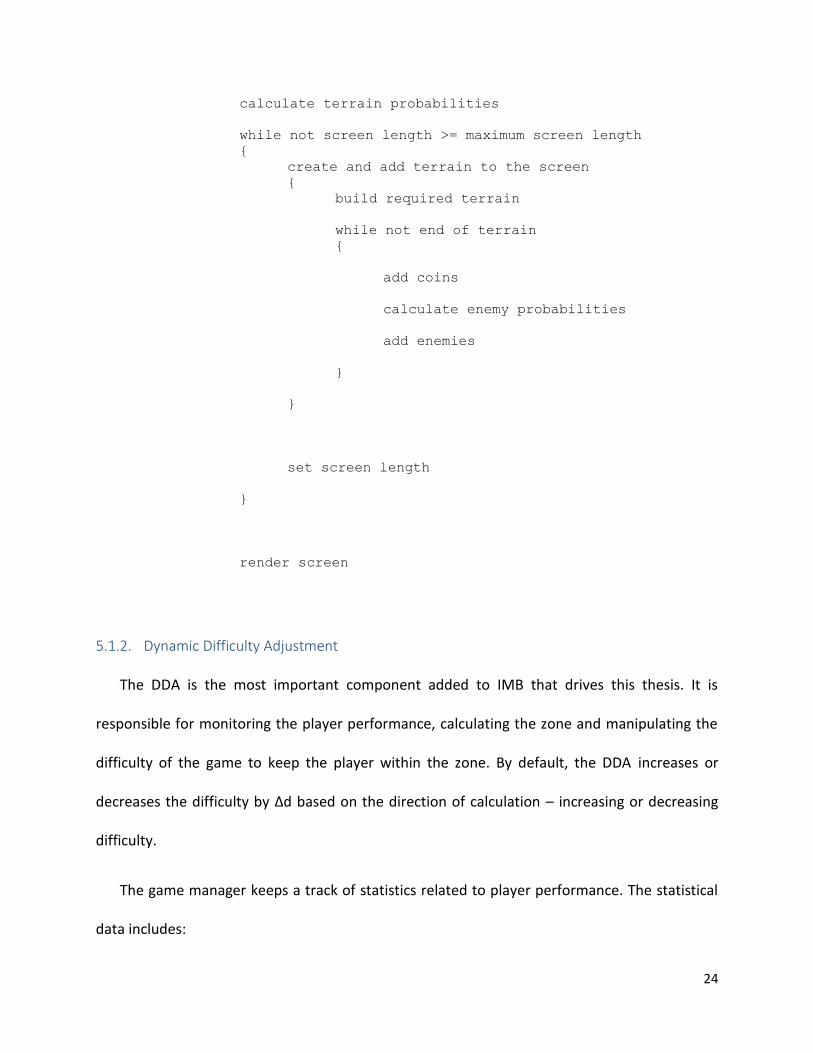
calculate terrain probabilities
while not screen length >= maximum screen length
{
create and add terrain to the screen
{
build required terrain
while not end of terrain
{
add coins
calculate enemy probabilities
add enemies
}
}
set screen length
}
render screen
5.1.2. Dynamic Difficulty Adjustment
The DDA is the most important component added to IMB that drives this thesis. It is
responsible for monitoring the player performance, calculating the zone and manipulating the
difficulty of the game to keep the player within the zone. By default, the DDA increases or
decreases the difficulty by Δd based on the direction of calculation – increasing or decreasing
difficulty.
The game manager keeps a track of statistics related to player performance. The statistical
data includes:
25
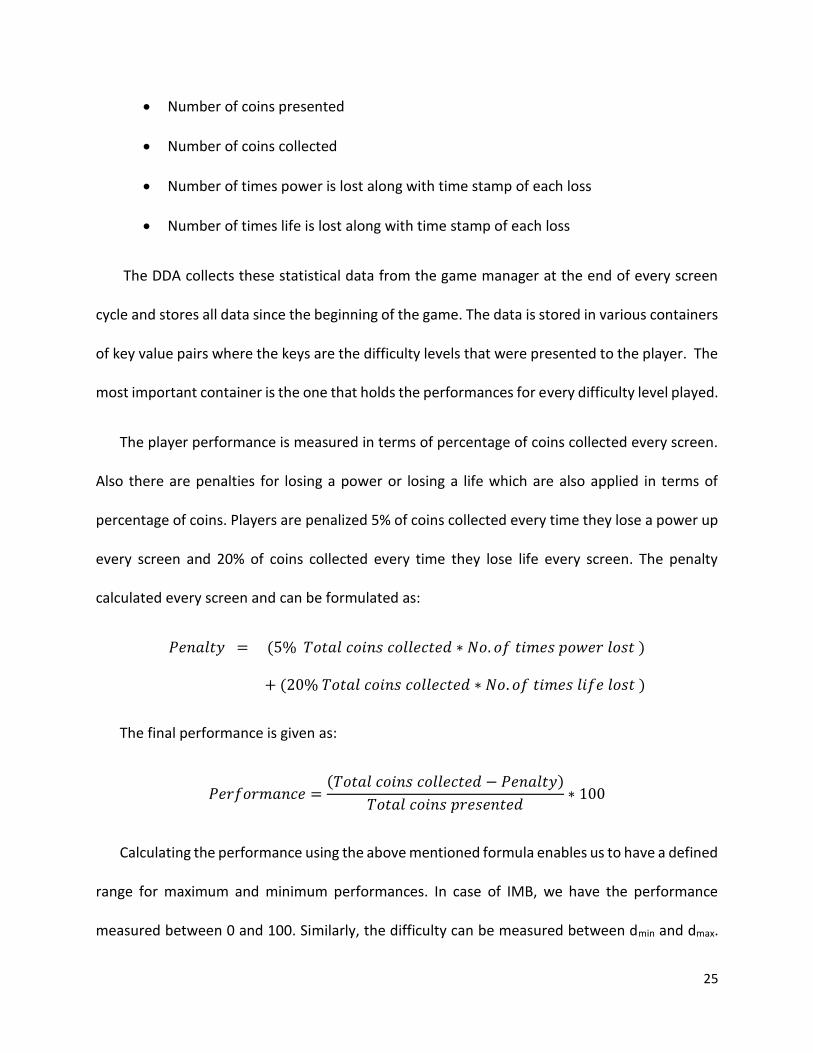
Number of coins presented
Number of coins collected
Number of times power is lost along with time stamp of each loss
Number of times life is lost along with time stamp of each loss
The DDA collects these statistical data from the game manager at the end of every screen
cycle and stores all data since the beginning of the game. The data is stored in various containers
of key value pairs where the keys are the difficulty levels that were presented to the player. The
most important container is the one that holds the performances for every difficulty level played.
The player performance is measured in terms of percentage of coins collected every screen.
Also there are penalties for losing a power or losing a life which are also applied in terms of
percentage of coins. Players are penalized 5% of coins collected every time they lose a power up
every screen and 20% of coins collected every time they lose life every screen. The penalty
calculated every screen and can be formulated as:
𝑃𝑒𝑛𝑎𝑙𝑡𝑦 = (5% 𝑇𝑜𝑡𝑎𝑙 𝑐𝑜𝑖𝑛𝑠 𝑐𝑜𝑙𝑙𝑒𝑐𝑡𝑒𝑑 ∗ 𝑁𝑜. 𝑜𝑓 𝑡𝑖𝑚𝑒𝑠 𝑝𝑜𝑤𝑒𝑟 𝑙𝑜𝑠𝑡 )
+ (20% 𝑇𝑜𝑡𝑎𝑙 𝑐𝑜𝑖𝑛𝑠 𝑐𝑜𝑙𝑙𝑒𝑐𝑡𝑒𝑑 ∗ 𝑁𝑜. 𝑜𝑓 𝑡𝑖𝑚𝑒𝑠 𝑙𝑖𝑓𝑒 𝑙𝑜𝑠𝑡 )
The final performance is given as:
𝑃𝑒𝑟𝑓𝑜𝑟𝑚𝑎𝑛𝑐𝑒 =(𝑇𝑜𝑡𝑎𝑙 𝑐𝑜𝑖𝑛𝑠 𝑐𝑜𝑙𝑙𝑒𝑐𝑡𝑒𝑑 − 𝑃𝑒𝑛𝑎𝑙𝑡𝑦)
𝑇𝑜𝑡𝑎𝑙 𝑐𝑜𝑖𝑛𝑠 𝑝𝑟𝑒𝑠𝑒𝑛𝑡𝑒𝑑∗ 100
Calculating the performance using the above mentioned formula enables us to have a defined
range for maximum and minimum performances. In case of IMB, we have the performance
measured between 0 and 100. Similarly, the difficulty can be measured between dmin and dmax.
26
In case of IMB, the game would have dmin as a difficulty where the level would be as easy as
possible, that is, only a straight terrain with no enemies that almost any player can navigate
through. Whereas, dmax would have a terrain with jumps, tubes or cannons and a lot of enemies
such that it would be virtually impossible to move forward. Thus, in mathematical terms, the DDA
would start the difficulty at dmin and increment the difficulty by Δd.
Once the DDA has calculated the player performance, it looks to calculate the start and end
of the zone for the player, that is, α and β. If they are calculated, the DDA looks to keep the
difficulty within the zone. Even if the player is kept in the zone, the DDA looks for any changes in
player performance within the zone and recalculates and moves the zone as required.
5.1.3. Defining Performance Metric
The first challenge faced in setting up the DDA was to identify the parameters to take into
consideration for the calculations of player performance. Earlier in the development, all the
parameters – number of coins collected, number of coins generated, number of enemies killed,
number of enemies generated, power ups taken, power up lost, time taken to travel a distance
– were accounted while calculating the performance. Even though this seems to be the ideal way
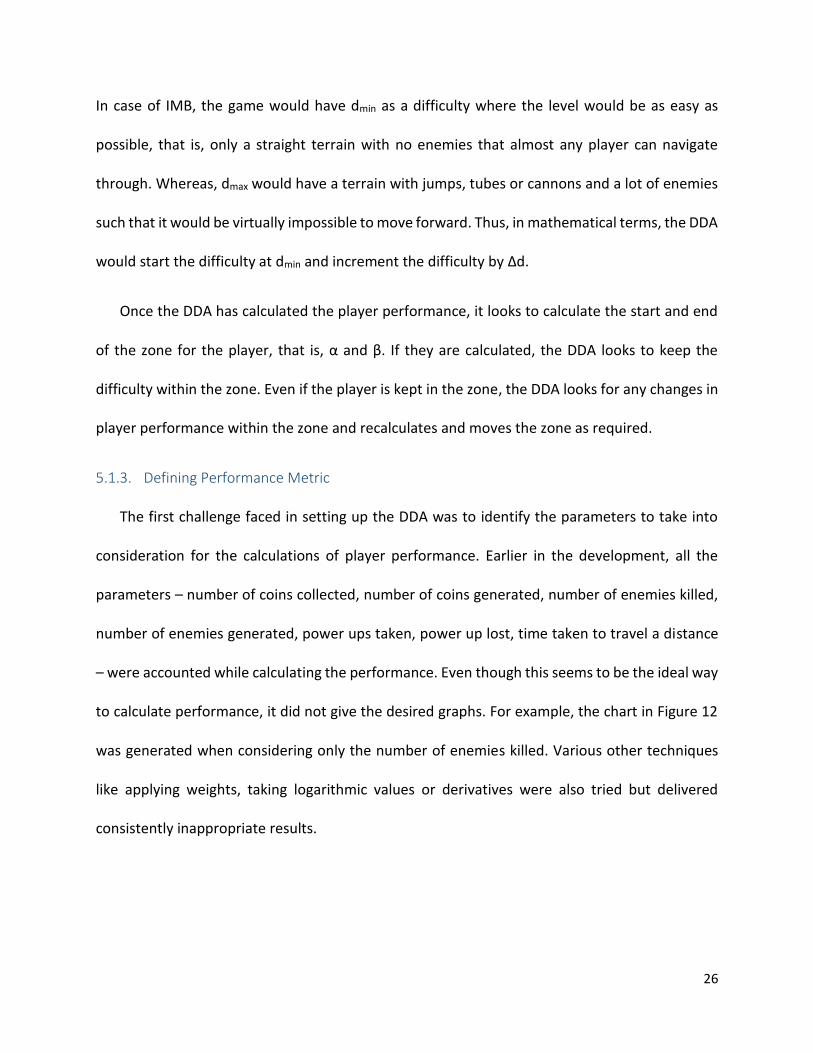
to calculate performance, it did not give the desired graphs. For example, the chart in Figure 12
was generated when considering only the number of enemies killed. Various other techniques
like applying weights, taking logarithmic values or derivatives were also tried but delivered
consistently inappropriate results.
27
Figure 12: Chart showing the results of using all the parameters for performance calculations
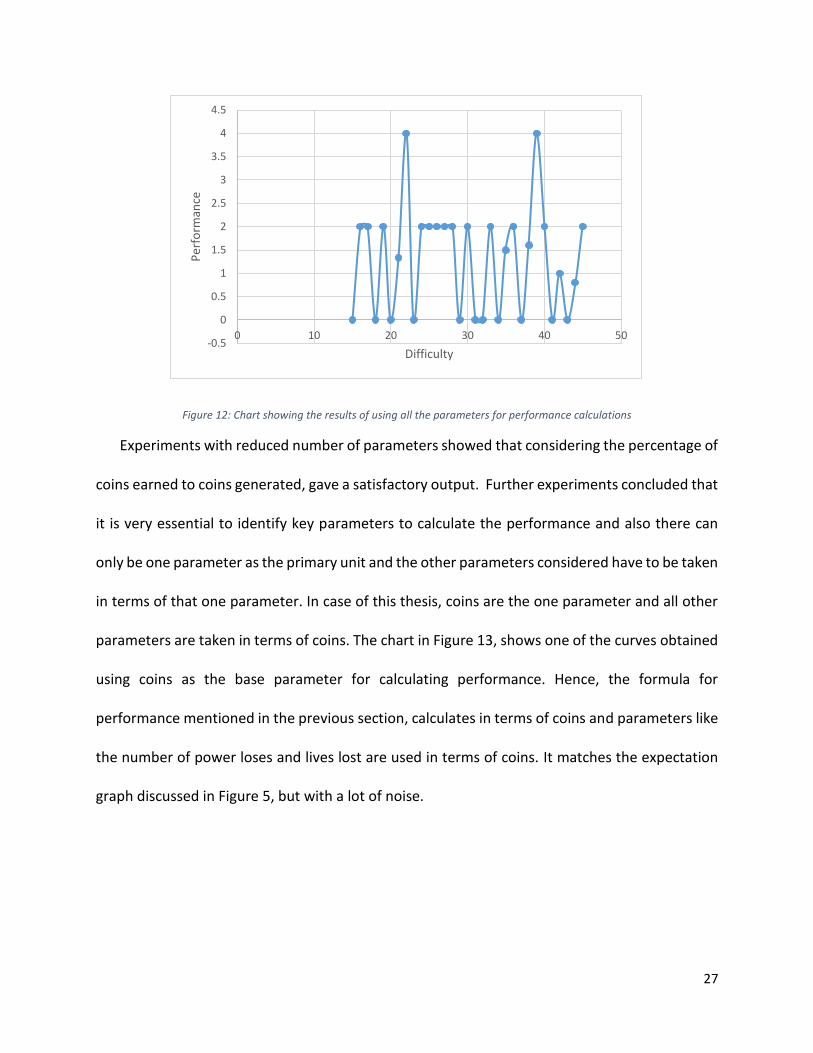
Experiments with reduced number of parameters showed that considering the percentage of
coins earned to coins generated, gave a satisfactory output. Further experiments concluded that
it is very essential to identify key parameters to calculate the performance and also there can
only be one parameter as the primary unit and the other parameters considered have to be taken
in terms of that one parameter. In case of this thesis, coins are the one parameter and all other
parameters are taken in terms of coins. The chart in Figure 13, shows one of the curves obtained
using coins as the base parameter for calculating performance. Hence, the formula for
performance mentioned in the previous section, calculates in terms of coins and parameters like
the number of power loses and lives lost are used in terms of coins. It matches the expectation
graph discussed in Figure 5, but with a lot of noise.
-0.5
0
0.5
1
1.5
2
2.5
3
3.5
4
4.5
0 10 20 30 40 50
Per
form
ance
Difficulty
28
Figure 13: Chart showing the expected shape of the graph using coins
In case of IMB, the player character eventually dies if the player consistently plays poorly and
thus we do not get floor effect at the end. As soon as the game becomes overwhelming, we see
a sharp drop off and it hits zero when the player character dies.
5.2. Study Design
The original IMB was modified as discussed in previous section and experiments were
performed to support the hypothesis. The study used a combination of between-participants
and within-participant methods of user study. The participants were divided into two groups –
each playing with a different starting difficulty. One half of the participants were given an easier
difficulty to start with and the other half had to start with a difficult level.
In case of either groups, each participant played the game twice. Once with the DDA
implemented and once without the DDA. In both cases, the participant started with the same
difficulty level. Hence, the participants who were given the easy level to start with, played the
game once at easy level with the DDA implemented and once at easy level with DDA turned off.
0
20
40
60
80
100
120
0 10 20 30 40 50 60 70
Per
form
ance
Difficulty
29
Similarly, the participants who played the game at difficult level, played the game once at
difficult level with DDA working and once at difficult level with DDA turned off.
5.3. Hypotheses
Based on the discussions from previous sections, the following hypotheses were tested
through this study:
H1: Participants without DDA will more often report that the game was too easy or too hard,
as compared to participants with DDA.
H2: Participants without DDA will more often report that the game was frustrating or boring,
as compared to participants with DDA.
5.4. Experimental Procedure
A pilot study was performed to test the integrity of the game and to review the study
procedures. The study was performed with 10 participants between ages 22 and 30, 7 of which
were males and 3 females. Some issues with the study procedures were identified and necessary
changes were made. The game worked as expected and the results were promising. Yet the game
required tweaks to get more accurate results. The necessary actions were taken and then a final
study was performed.
The final study was performed with 32 participants of which 9 were females and 21 males.
The age range for this set of participants was 19 – 28 years.

30
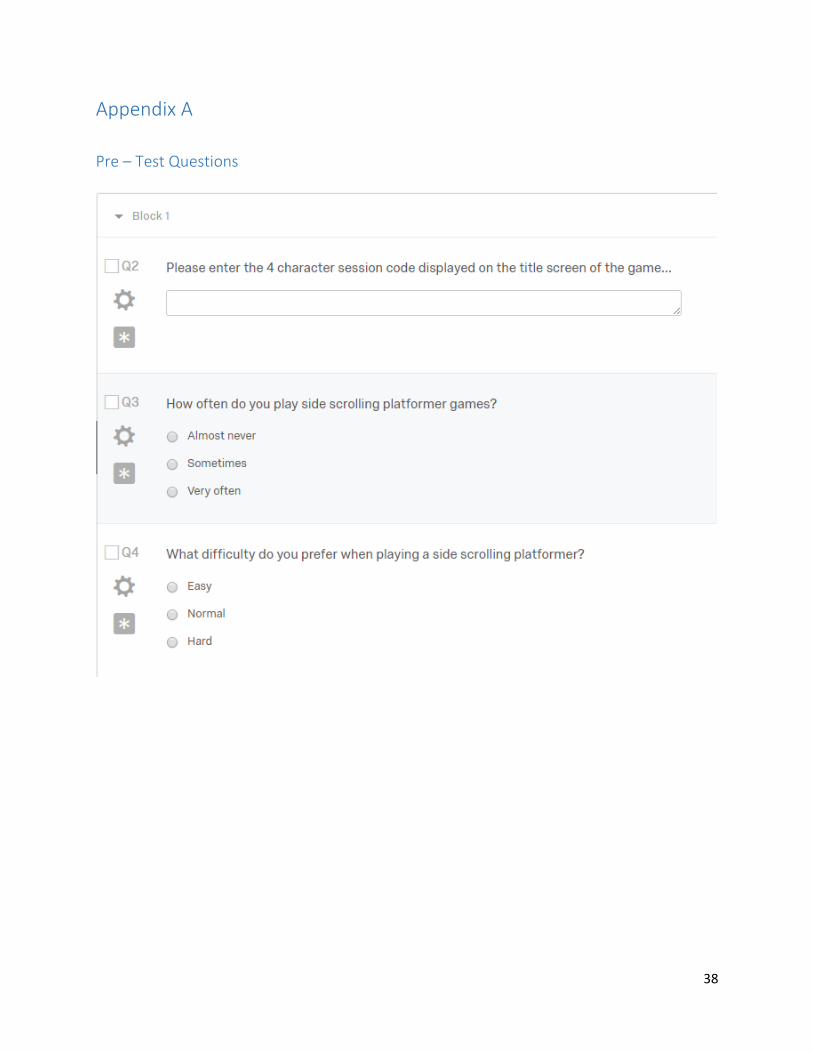
Each participant was asked to answer a pre – test questionnaire before playing the game.
A post – test questionnaire was asked to be filled at the end of each round of game play. The
screen captures of the questionnaire can be found in Appendix A.
Two key questions in the questionnaires helped determine the players’ experience. One
asked about the difficulty experienced on a Likert scale ranging from ‘Too easy’ to ‘Too
difficult’. The other asked about the overall experience on a scale of ‘Boring’ to ‘Frustrating’.
5.5. Results and Discussion
Figure 14 shows the chart of a participant’s performance, difficulty and the loss of lives and
power along a timeline with the DDA – PCG algorithm. It shows that whenever the average player
performance deteriorated considerably, the difficulty was brought down.
Figure 14: Participant performance for difficult start with DDA
Figure 15 shows the performance of the same participant without the DDA – PCG algorithm.
It clearly shows consistently poor performance.
0
20
40
60
80
100
120
0 2000 4000 6000 8000 10000
Time
Difficulty Performance PowerDown Death
31
Figure 15: Participant performance for difficult start without DDA
Similar results were obtained with participants starting at easy level. Only difference being
that without DDA – PCG algorithm, their performances was consistently at maximum whereas
with the algorithm they were challenged. Figure 16 and 17 show the performances with and
without the algorithm respectively.
Figure 16: Participant performance for easy start with DDA
0
20
40
60
80
100
120
0 1000 2000 3000 4000 5000 6000 7000
Time
Difficulty Performance PowerDown Death
0
20
40
60
80
100
120
0 2000 4000 6000 8000 10000 12000
Time
Difficulty Performance PowerDown Death

32
Figure 17: Participant performance for easy start without DDA
The study data shows that for either version, players enjoyed the game more with the DDA –
PCG. The Likert scale for the two key questions was a little unusual with the score values of 0 in
the center and +1 and +2 on either sides depending on the size of the scale. Hence, the scale for
the question related to H1 was (2, 1, 0, 1, and 2) and for H2 was (1, 0, and 1). This scale structure
was selected because of the fact that for this case, closer to the middle is better. The following
table shows the p – values for the various version of the game:
Easy Start Difficult Start
With DDA Without DDA With DDA Without DDA
H1 Mean ± SD 1.4 ± 1.34 2.6 ± 3.44 1.2 ± 1.3 2.6 ± 4.22
p-value 0.0456 0.0497
H2 Mean ± SD 2 ± 2.65 2.33 ± 3.21 1.667 ± 2.89 2.33 ± 3.21
p-value 0.0177 0.0151
Table 1: Summary of the obtained results for each hypothesis
The above table shows p-values less than 0.05 which suggests that there are at most 5%
chance of the results being random. Thus, hypotheses of the study is supported by the results
and the conjecture of the thesis is hence supported by the study hypotheses.
0
20
40
60
80
100
120
0 2000 4000 6000 8000 10000 12000
Time
Difficulty Performance PowerDown Death
33
6. Conclusion
The objective of this thesis was to find a way to keep players in the Flow using PCG and DDA.
The results of the study suggest that this can be achieved for side-scrolling platform games like
IMB using the approach discussed in this work.
Lesson learnt is that in games like IMB, the DDA calculates the player performance using game
data relevant to player skills and then makes a decision on whether to increase / decrease the
difficulty or to make no change and informs the PCG. The PCG can be designed to generate
required level design based on the desired difficulty input given by the DDA. One important point
to remember is that deciding what game parameters to take into consideration for calculating
player performance is a difficult task and needs considerable experimentation.
The thresholds in this thesis were calculated manually and were fixed for all players.
Automated techniques to find these thresholds specific to the players can be tested and
implemented.
For the next steps, this approach can be studied with games from different genres and a
generic model can created. Also, it is believed that the algorithms used for DDA and PCG
individually do not affect the model. The only condition being that the DDA should be able to
decide a required difficulty and pass it to the PCG and the PCG should be able to construct or
reconstruct the game accordingly. This belief needs to be verified by implementing different
combinations of PCG and DDA algorithms on various games.
7. References
34
1. Adams, T. (2006) [Windows, Mac OS X, Linux]: Bay 12 Games.
2. Allmer, M. (2009). The 13 Basic Principles of Gameplay Design. Retrieved from
http://www.gamasutra.com/view/feature/132341/the_13_basic_principles_of_.php
3. Armstrong, M. (2009) Borderlands. [Microsoft Windows, OS X, PlayStation 3, Xbox 360]:
2K Games.
4. Bates, B. (2006). Principles of Game Design. Retrieved from
https://www.deltacollege.edu/emp/elane/GameDesign/ClassOne/
5. Blom, P. M., Bakkes, S., Tan, C. T., Whiteson, S., Roijers, D., Valenti, R., & Gevers, T. (2014).
Towards Personalised Gaming via Facial Expression Recognition. In I. Horswill, & A. Jhala
(Eds.), Proceedings of the Tenth Artificial Intelligence and Interactive Digital
Entertainment Conference (AIIDE 2014). (pp. 30-36). Palo Alto, California: AAAI Press
6. Braham, W. (2016). No Man Sky, Hello Games.
7. Braben, D., & Bell, I. (1984). Elite: Acornsoft, Firebird, Imagineer.
8. Chen, J. (2006). Flow in Games. M.S. Thesis, University of Southern California's School of
Cinematic Arts, Los Angeles, CA.
9. Compton, K., & Mateas, M. (2006). Procedural Level Design for Platform Games. In Second
Artificial Intelligence and Interactive Digital Entertainment Conference. p. 109-111.
Marina Del Rey, CA.
10. Csikszentmihalyi, Mihaly (1990). Flow: The Psychology of Optimal Experience. New York,
NY: Harper and Row.
35
11. Dahlskog, S., & Togelius, J. (2012). Patterns and procedural content generation: revisiting
Mario in world 1 level 1. In DPG '12 Proceedings of the First Workshop on Design Patterns
in Games. p. 1. New York, NY.
12. Ferreira, L., & Toledo, C. (2014a). Generating Levels for Physics-based Puzzle Games with
Estimation of Distribution Algorithms. In ACE '14 Proceedings of the 11th Conference on
Advances in Computer Entertainment Technology. p. 25. New York, NY.
13. Ferreira, L., & Toledo, C. (2014b). A Search-based Approach for Generating Angry Birds
Levels. In Computational Intelligence and Games (CIG), IEEE. p. 1-8. Dortmund, Germany.
14. Hoei Corporation. (1981). Jump Bug. [Arcadia 2001]: Sega, Rock-Ola.
15. Hunicke, R., & Chapman, V. (2004). AI for Dynamic Difficulty Adjustment in Games. Thesis,
Northwestern University, Evanston, IL.
16. Jennings-Teats, M., Smith, G., & Wardrip-Fruin, N. (2010). Polymorph: dynamic difficulty
adjustment through level generation. In PCGames '10 Proceedings of the 2010 Workshop
on Procedural Content Generation in Games. p. 11. New York, NY.
17. Laidlaw, M. (1998). Half-Life. [Microsoft Windows, PlayStation 2, OS X, Linux]: Sierra
Studios. Valve Corporation.
18. Mawhorter, P., & Mateas, M. (2010). Procedural level generation using occupancy-
regulated extension. Proceedings of the 2010 IEEE Conference on Computational
Intelligence and Games. doi:10.1109/itw.2010.5593333
19. Maxis. (2008). Spore. [Microsoft Windows Mac OS X, iOS]: Electronic Arts.
20. Michael, D., & Chang, J. (2010). Dynamic Difficulty Adjustment in Computer Games. Thesis,
School of Electronics and Computer Science University of Southampton.
36
21. Moffett, J. P. (2010). Applying Causal Models to Dynamic Difficulty Adjustment in Video
Games. M.S. Thesis, Worcester Polytechnic Institute, Worcester, MA.
22. Musial, P. (2011). Anomaly: Warzone Earth. [Windows, Mac OS X, Linux, iOS, Android,
Xbox 360, PlayStation Network, Blackberry 10]: Headup Games.
23. Miyamoto, S. (1985). Super Mario Bros. [NES]: Nintendo.
24. Mäki, R., Grönberg, H., & Häkkinen, M. (2009). Angry Birds: Rovio Entertainment.
25. Pedersen, C., Togelius, J., & Yannakakis, G. N. (2010). Modeling Player Experience for
Content Creation. IEEE Transactions on Computational Intelligence and AI in Games, 2(1).
54-67.
26. Pendragon Q. (2007). Slime Volleyball.
27. Perrson, M. (2008). Infinite Mario Bros.
28. Shaker, N., Togelius, J., & Nelson, M. J. (2016). Procedural Content Generation in Games:
A Textbook and an Overview of Current Research: Springer.
29. Shaker, N., Yannakakis, G., & Togelius, J. (2010). Towards Automatic Personalized Content
Generation for Platform Games. In Sixth AAAI Conference on Artificial Intelligence and
Interactive Digital Entertainment. p. 63-68. Stanford.
30. Siller, D. (1996). Crash Bandicoot. Naughty Dog.
31. Stephenson, M., & Renz, J. (2016). Procedural Generation of Levels for Angry Birds Style
Physics Games. In Twelfth Artificial Intelligence and Interactive Digital Entertainment
Conference
37
32. Sweeney, S. J. (2001). Project: Starfighter. [Cross-platform]: Parallel Realities.
33. Togelius, J., Preuss, M., & Yannakakis, G. N. (2010). Towards multiobjective procedural
map generation. In PCGames '10 Proceedings of the 2010 Workshop on Procedural
Content Generation in Games. p. 3. New York, NY.
34. Toy M. (1980). Rogue: Epyx.
35. Wikipedia. (2008). 12 Basic Principles of Animation. Retrieved from Wikipedia:
https://en.wikipedia.org/wiki/12_basic_principles_of_animation
36. Worth, D. (1978). Beneath Apple Manor: The Software Factory.
38
Appendix A
Pre – Test Questions

39
Post – Test Questions