staying power. - cooperative energy just electricity. rural electricity revolutionized mississippi....
TRANSCRIPT

1A N N U A L R E P O R T 2 0 1 5
STAYINGPOWER.

2
South Mississippi Electric was formed in 1941 to serve the rural, under-served areas of our state. Since then, we have worked to improve the quality of those areas and of our members’ lives by providing more than just electricity. Rural electricity revolutionized Mississippi.
Over the years, our mission has remained simple: to deliver to our Members reliable and affordable energy in a safe and environmentally responsible manner. That mission has withstood the test of time. Our members expect, and deserve, affordable, reliable power. Affordable, reliable power provides stability and security to the communities we serve.
Economic prosperity for our communities means families can breathe a little easier and worry a little less. Affordable electric rates matter to families and businesses. Good jobs are also critical to healthy communities. Electric cooperatives deliver all of these.
Last, our members desire, and deserve, a responsible power supplier. That means operating safely to protect our employees and communities. That means respecting the environment. That means making careful, responsible decisions when spending our Members’ money. That also means protecting and maintaining our members’ investments in power supply and power delivery systems so they operate reliably and for a long time. We act responsibly because our members have entrusted us with serving their homes, their communities, and their lives with affordable, reliable power.
Members matter the most at South Mississippi Electric. Our philosophy focuses our efforts on the things that matter most to members; this is our staying power.
AFFORDABLERELIABLEPOWER
=RESPONSIBLE
POWER=
STAYINGPOWER
3
Table of Contents
04 ........The First 75 Years
06 ........SME’s Story
08 .........SME Today
09 ..............2015 At a Glance
10 ........Our Mission
11 ........System Map
12 ........Generation Assets
13 ........Board/CEO
14 ........2015 Milestones
18 ........Executive Summary
20 ........Financial Review
28 ..............Auditor’s Report
48 ............Retirees/In Memory
On the Cover: Top: Linemen Corey Bond, Michael Bolton, Jared Davis, Zac Luckey, Michael Servolini 2015; Bottom: Former Railcar Maintenance Employee Eddie Heard 1985
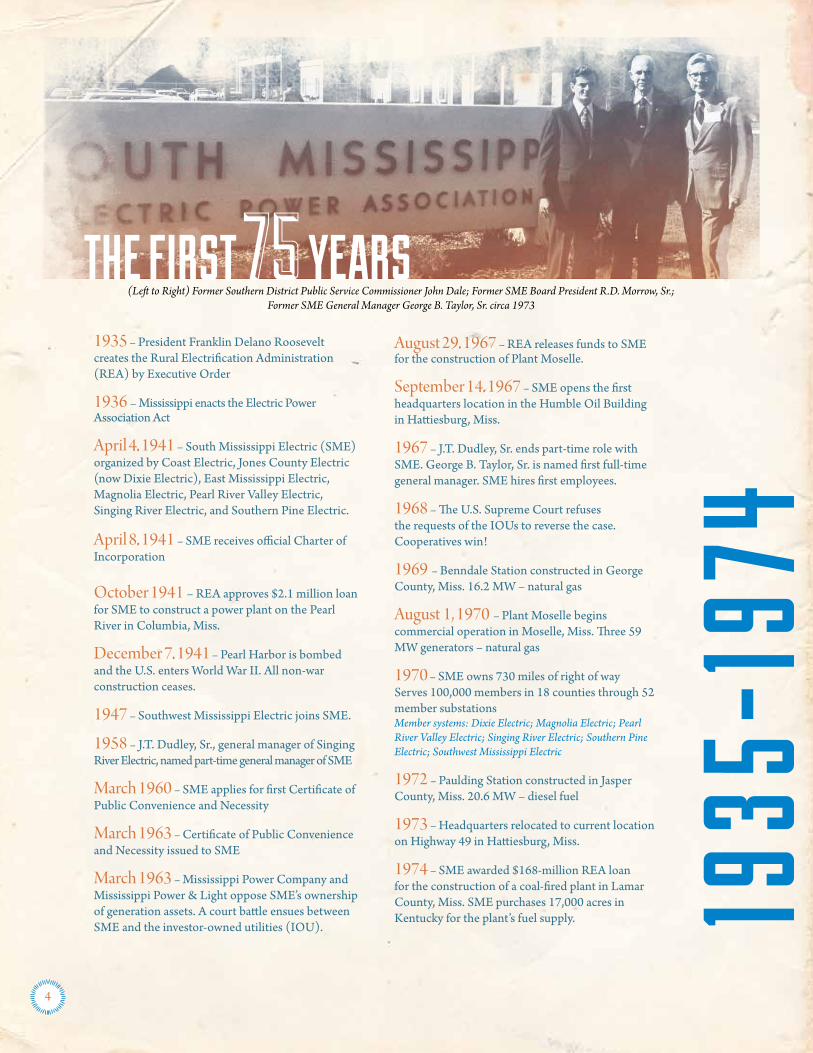
1935 – President Franklin Delano Roosevelt creates the Rural Electrification Administration (REA) by Executive Order
1936 – Mississippi enacts the Electric Power Association Act
April 4, 1941 – South Mississippi Electric (SME) organized by Coast Electric, Jones County Electric (now Dixie Electric), East Mississippi Electric, Magnolia Electric, Pearl River Valley Electric, Singing River Electric, and Southern Pine Electric.
April 8, 1941 – SME receives official Charter of Incorporation
October 1941 – REA approves $2.1 million loan for SME to construct a power plant on the Pearl River in Columbia, Miss.
December 7, 1941 – Pearl Harbor is bombed and the U.S. enters World War II. All non-war construction ceases.
1947 – Southwest Mississippi Electric joins SME.
1958 – J.T. Dudley, Sr., general manager of Singing River Electric, named part-time general manager of SME
March 1960 – SME applies for first Certificate of Public Convenience and Necessity
March 1963 – Certificate of Public Convenience and Necessity issued to SME
March 1963 – Mississippi Power Company and Mississippi Power & Light oppose SME’s ownership of generation assets. A court battle ensues between SME and the investor-owned utilities (IOU).
August 29, 1967 – REA releases funds to SME for the construction of Plant Moselle.
September 14, 1967 – SME opens the first headquarters location in the Humble Oil Building in Hattiesburg, Miss.
1967 – J.T. Dudley, Sr. ends part-time role with SME. George B. Taylor, Sr. is named first full-time general manager. SME hires first employees.
1968 – The U.S. Supreme Court refuses the requests of the IOUs to reverse the case. Cooperatives win!
1969 – Benndale Station constructed in George County, Miss. 16.2 MW – natural gas
August 1, 1970 – Plant Moselle begins commercial operation in Moselle, Miss. Three 59 MW generators – natural gas
1970 – SME owns 730 miles of right of wayServes 100,000 members in 18 counties through 52 member substationsMember systems: Dixie Electric; Magnolia Electric; Pearl River Valley Electric; Singing River Electric; Southern Pine Electric; Southwest Mississippi Electric
1972 – Paulding Station constructed in Jasper County, Miss. 20.6 MW – diesel fuel
1973 – Headquarters relocated to current location on Highway 49 in Hattiesburg, Miss.
1974 – SME awarded $168-million REA loan for the construction of a coal-fired plant in Lamar County, Miss. SME purchases 17,000 acres in Kentucky for the plant’s fuel supply. 19
35-1
974
1975-2016
THE FIRST 75 YEARS
4
(Left to Right) Former Southern District Public Service Commissioner John Dale; Former SME Board President R.D. Morrow, Sr.;Former SME General Manager George B. Taylor, Sr. circa 1973
1935
-197
4
1975-2016
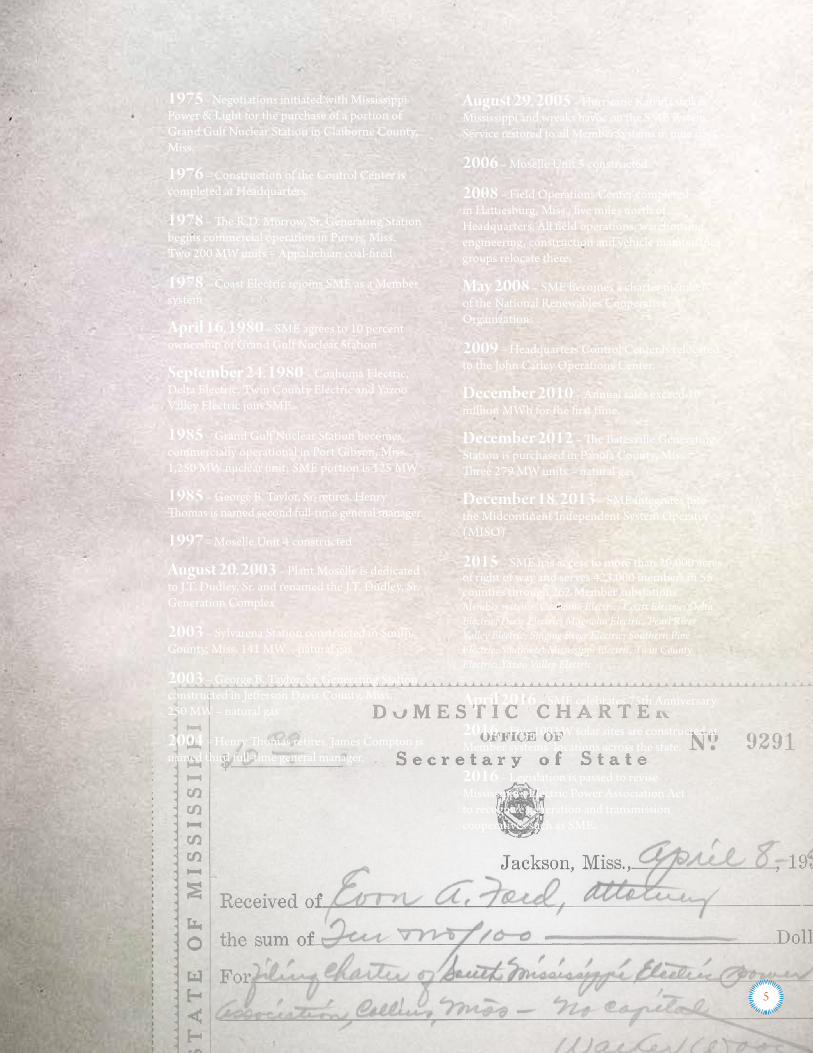
1975 - Negotiations initiated with Mississippi Power & Light for the purchase of a portion of Grand Gulf Nuclear Station in Claiborne County, Miss.
1976 – Construction of the Control Center is completed at Headquarters.
1978 – The R.D. Morrow, Sr. Generating Station begins commercial operation in Purvis, Miss.Two 200 MW units – Appalachian coal-fired
1978 – Coast Electric rejoins SME as a Member system
April 16, 1980 – SME agrees to 10 percent ownership of Grand Gulf Nuclear Station
September 24, 1980 – Coahoma Electric, Delta Electric, Twin County Electric and Yazoo Valley Electric join SME.
1985 – Grand Gulf Nuclear Station becomes commercially operational in Port Gibson, Miss. 1,250 MW nuclear unit; SME portion is 125 MW
1985 – George B. Taylor, Sr. retires. Henry Thomas is named second full-time general manager.
1997 – Moselle Unit 4 constructed
August 20, 2003 – Plant Moselle is dedicated to J.T. Dudley, Sr. and renamed the J.T. Dudley, Sr. Generation Complex
2003 – Sylvarena Station constructed in Smith County, Miss. 141 MW – natural gas
2003 – George B. Taylor, Sr. Generating Station constructed in Jefferson Davis County, Miss.250 MW – natural gas
2004 – Henry Thomas retires. James Compton is named third full-time general manager.
August 29, 2005 – Hurricane Katrina strikes Mississippi and wreaks havoc on the SME system. Service restored to all Member systems in nine days.
2006 – Moselle Unit 5 constructed
2008 – Field Operations Center completed in Hattiesburg, Miss., five miles north of Headquarters. All field operations, warehousing, engineering, construction and vehicle maintenance groups relocate there.
May 2008 – SME becomes a charter member of the National Renewables Cooperative Organization.
2009 – Headquarters Control Center is relocated to the John Carley Operations Center.
December 2010 – Annual sales exceed 10 million MWh for the first time.
December 2012 – The Batesville Generating Station is purchased in Panola County, Miss.Three 279 MW units – natural gas
December 18, 2013 – SME integrates into the Midcontinent Independent System Operator (MISO)
2015 – SME has access to more than 20,000 acres of right of way and serves 423,000 members in 55 counties through 262 Member substationsMember systems: Coahoma Electric; Coast Electric; Delta Electric; Dixie Electric; Magnolia Electric; Pearl River Valley Electric; Singing River Electric; Southern Pine Electric; Southwest Mississippi Electric, Twin County Electric; Yazoo Valley Electric
April 2016 – SME celebrates 75th Anniversary
2016 – Five 100 kW solar sites are constructed at Member systems’ locations across the state.
2016 – Legislation is passed to revise Mississippi’s Electric Power Association Act to recognize generation and transmission cooperatives such as SME.
5
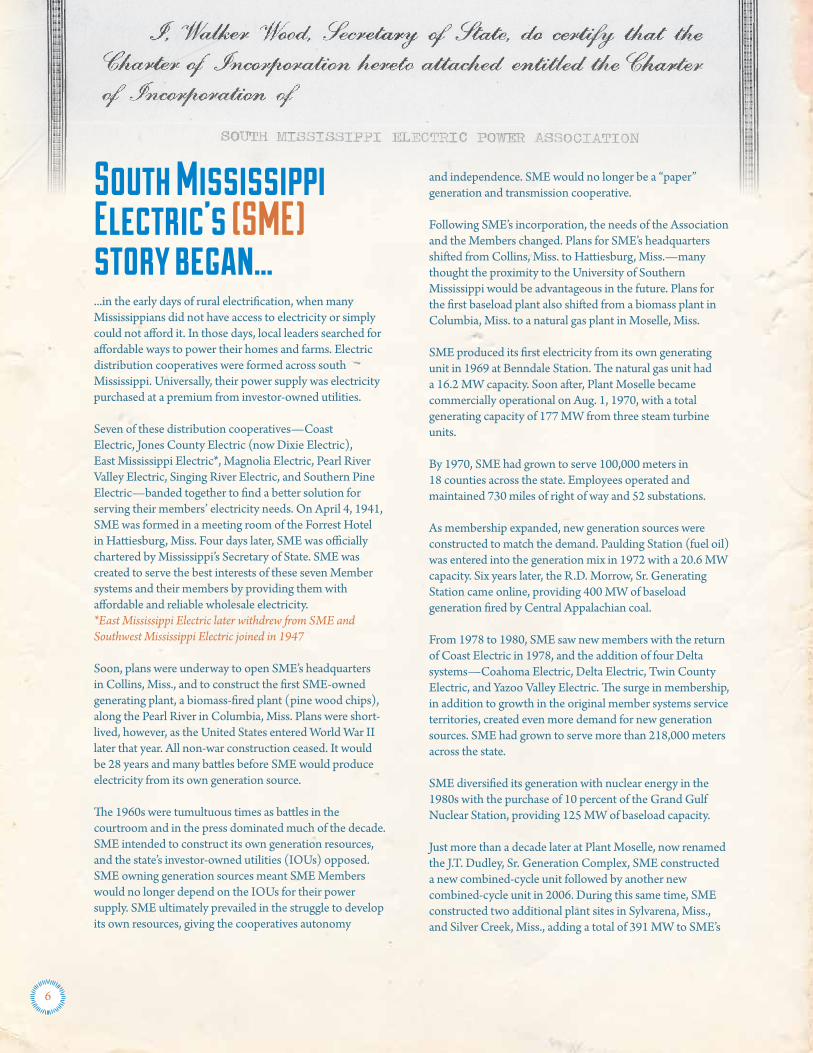
South Mississippi Electric’s (SME)story began...
...in the early days of rural electrification, when many Mississippians did not have access to electricity or simply could not afford it. In those days, local leaders searched for affordable ways to power their homes and farms. Electric distribution cooperatives were formed across south Mississippi. Universally, their power supply was electricity purchased at a premium from investor-owned utilities. Seven of these distribution cooperatives—Coast Electric, Jones County Electric (now Dixie Electric), East Mississippi Electric*, Magnolia Electric, Pearl River Valley Electric, Singing River Electric, and Southern Pine Electric—banded together to find a better solution for serving their members’ electricity needs. On April 4, 1941, SME was formed in a meeting room of the Forrest Hotel in Hattiesburg, Miss. Four days later, SME was officially chartered by Mississippi’s Secretary of State. SME was created to serve the best interests of these seven Member systems and their members by providing them with affordable and reliable wholesale electricity. *East Mississippi Electric later withdrew from SME and Southwest Mississippi Electric joined in 1947
Soon, plans were underway to open SME’s headquarters in Collins, Miss., and to construct the first SME-owned generating plant, a biomass-fired plant (pine wood chips), along the Pearl River in Columbia, Miss. Plans were short-lived, however, as the United States entered World War II later that year. All non-war construction ceased. It would be 28 years and many battles before SME would produce electricity from its own generation source.
The 1960s were tumultuous times as battles in the courtroom and in the press dominated much of the decade. SME intended to construct its own generation resources, and the state’s investor-owned utilities (IOUs) opposed. SME owning generation sources meant SME Members would no longer depend on the IOUs for their power supply. SME ultimately prevailed in the struggle to develop its own resources, giving the cooperatives autonomy
and independence. SME would no longer be a “paper” generation and transmission cooperative.
Following SME’s incorporation, the needs of the Association and the Members changed. Plans for SME’s headquarters shifted from Collins, Miss. to Hattiesburg, Miss.—many thought the proximity to the University of Southern Mississippi would be advantageous in the future. Plans for the first baseload plant also shifted from a biomass plant in Columbia, Miss. to a natural gas plant in Moselle, Miss.
SME produced its first electricity from its own generating unit in 1969 at Benndale Station. The natural gas unit had a 16.2 MW capacity. Soon after, Plant Moselle became commercially operational on Aug. 1, 1970, with a total generating capacity of 177 MW from three steam turbine units.
By 1970, SME had grown to serve 100,000 meters in 18 counties across the state. Employees operated and maintained 730 miles of right of way and 52 substations.
As membership expanded, new generation sources were constructed to match the demand. Paulding Station (fuel oil) was entered into the generation mix in 1972 with a 20.6 MW capacity. Six years later, the R.D. Morrow, Sr. Generating Station came online, providing 400 MW of baseload generation fired by Central Appalachian coal.
From 1978 to 1980, SME saw new members with the return of Coast Electric in 1978, and the addition of four Delta systems—Coahoma Electric, Delta Electric, Twin County Electric, and Yazoo Valley Electric. The surge in membership, in addition to growth in the original member systems service territories, created even more demand for new generation sources. SME had grown to serve more than 218,000 meters across the state.
SME diversified its generation with nuclear energy in the 1980s with the purchase of 10 percent of the Grand Gulf Nuclear Station, providing 125 MW of baseload capacity.
Just more than a decade later at Plant Moselle, now renamed the J.T. Dudley, Sr. Generation Complex, SME constructed a new combined-cycle unit followed by another new combined-cycle unit in 2006. During this same time, SME constructed two additional plant sites in Sylvarena, Miss., and Silver Creek, Miss., adding a total of 391 MW to SME’s
6
growing generation portfolio.
Increased owned generation sources and a more diverse portfolio mix became the focus in the early 2000s. In order to become more efficient and less dependent on power purchased from others, SME completed a repower of Plant Moselle in 2012, increasing the efficiency of two of the plant’s original units by 35 percent and increasing capacity by 172 MW. Additionally, SME purchased the natural-gas fired Batesville Generating Station in 2012, adding another 837 MW of efficient generation to the portfolio.
SME’s generation portfolio has been planned and built for reliability, affordability, and environmental performance. Generating electricity, however, is only the first step in SME’s history of providing reliable service. The seven and one-half decades of change and growth also required significant expansion of the transmission system to deliver that energy.
SME developed and grew as its Member systems grew. SME was buying rights of way and building transmission lines, and its Members were also building their own transmission lines. Eventually, as SME became the sole power provider for the Member systems, those Member-owned transmission lines were transferred to the SME system.
The system was designed per Rural Electrification Administration (REA) requirements to match the voltage of the Tennessee Valley Authority (TVA), as REA saw TVA as the only likely future utility interconnection for SME. (REA provided funding for the transmission system.) Years would pass before SME and TVA would ever establish an interconnection. Mississippi Power Company (MPC) and Entergy Mississippi (EMI), however allowed SME to interconnect, although they operated at a different voltage (115 kV and 231 kV).
Construction of the original 69kV transmission system began in 1967. In the early 1970s, 161kV lines were constructed to support the system and its capacity. As SME developed interconnections with surrounding utilities other than the TVA, investments were required for the installation of transformers to enable SME’s transmission system to connect with the transmission systems of MPC, EMI and PowerSouth Energy Cooperative (PS). SME now maintains interconnections with MPC, EMI, PS and TVA,
giving all entities stronger operational flexibility and better reliability.
Today, 1,763 miles of transmission lines crisscross SME’s on-system service area, connecting homes and businesses from the Coast to the Delta with the electricity that powers our Members’ lives. These lines are supported by approximately 23,000 poles covering more than 20,000 acres of right-of-way property.
SME joined the Midcontinent Independent System Operator (MISO) in Dec. 2013, causing an additional transformation. MISO is a regional transmission organization that serves 42 million consumers from Canada to the Gulf of Mexico. MISO regulates, controls and monitors the use of the bulk electric transmission system for its members, including SME. The goal of MISO is to efficiently manage use of the bulk electric system, allowing member utilities, such as SME, to buy and sell power across interconnected grids. Membership in MISO has resulted in benefits to both SME and the Member systems.
SME has seen growth and change over the decades, but has remained unchanged in one regard—our purpose. Purpose makes electric cooperatives special and different. We do not exist to make a profit. We exist to serve our Members with affordable and reliable wholesale electricity.
Over the past 75 years, SME has stayed true to our purpose. We are bigger and better than ever. Seventy-five years of challenges, adversity, and opportunity has proven one indisputable fact—SME has staying power.
75 years have prepared us to:
• Face new environmental regulations• Promote economic growth • Keep electricity affordable
• Maintain reliability• Keep employees safe
• Remain a trusted sources for our Membersand their members
7
South Mississippi Electric TodayToday, SME serves as the only not-for-profit wholesale electric power provider headquartered in Mississippi. In this role, SME generates and transmits electricity for 11 Member distribution systems located in the southern and western areas of the state. SME and these 11 distribution systems, collectively known as the Power of 12, provide power to more than 423,000 homes and businesses across the state, ultimately serving more than one million Mississippians.
SME and its Members power the quality of life in 55 counties spanning from the Gulf Coast to the Mississippi Delta. The distribution systems are connected to SME’s generation sources by 1,763 miles of high-voltage transmission lines.
SME owns generation sources that include a diverse mix of coal, natural gas and nuclear power plants. Total sales from SME’s resources in 2015 were 13 million MWh. In addition to owned generation, SME’s portfolio is balanced with power purchase agreements.
Today, we have expanded our renewable energy resources to include solar energy. SME broke ground in 2015 on five small solar installations (100 kW or less) at five Member electric cooperative locations spread geographically across the state: Coahoma (Lyon), Coast (Kiln), Delta (Greenwood), Singing River (Lucedale), and Southern Pine (Taylorsville).
These small-scale sites signify SME’s first step in solar power generation. SME announced in September 2015 plans to purchase all electrical output from a 52 MW solar facility to be built near Sumrall in Lamar County by Origis Energy USA. The facility will produce enough electricity during its first year of operation to power approximately 10,000 average homes.
SME employs more than 425 skilled and professional employees, all of whom are focused on safely providing the highest levels of affordability and reliability to the 11 Member systems. Our employees are at the core of our staying power.
SME will meet the challenges of tomorrow with the same vigor and dedication to our purpose—our Members. Aligning the interests of our organization with those of our Members has given us staying power.
8
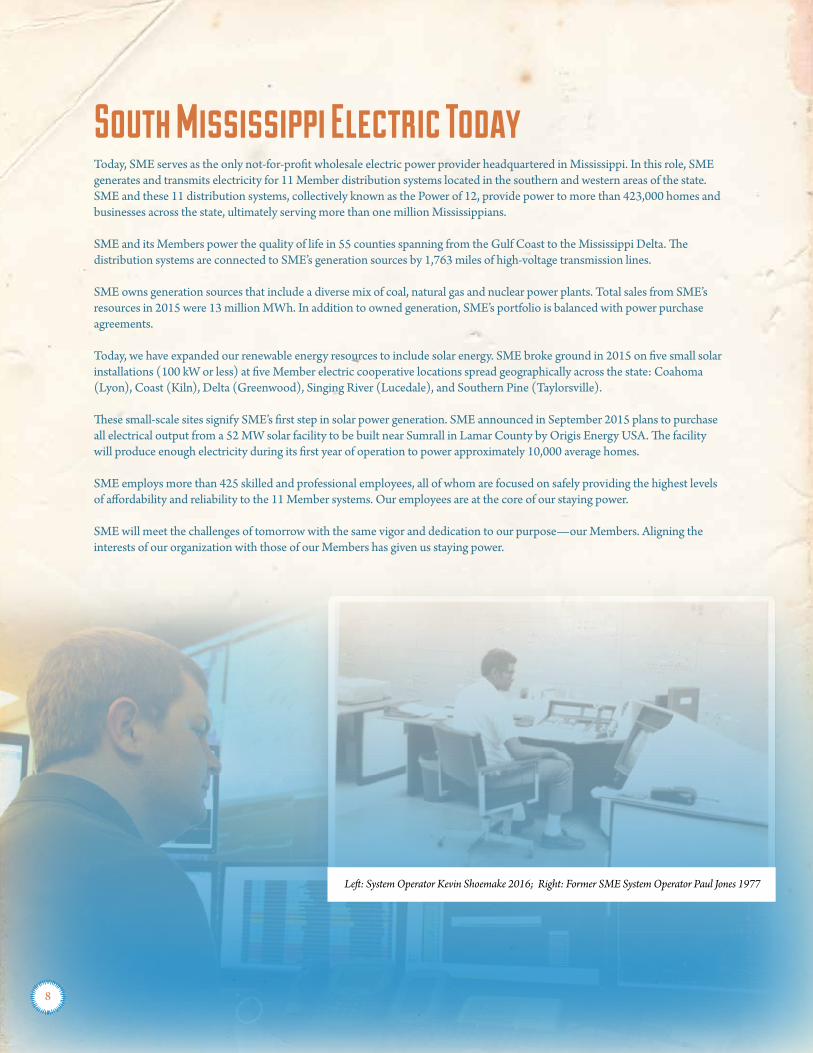
Left: System Operator Kevin Shoemake 2016; Right: Former SME System Operator Paul Jones 1977
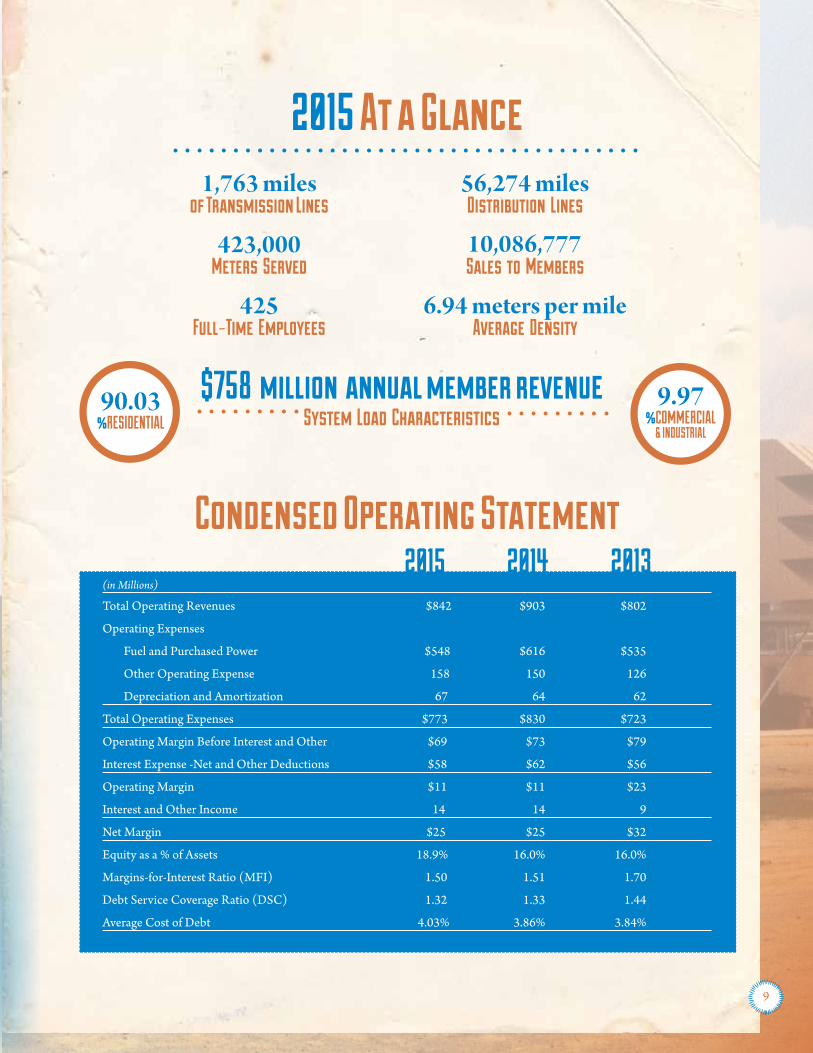
2015 At a Glance
$758 million annual member revenueSystem Load Characteristics
Condensed Operating Statement 2015 2014 2013(in Millions)
Total Operating Revenues $842 $903 $802
Operating Expenses
Fuel and Purchased Power $548 $616 $535
Other Operating Expense 158 150 126
Depreciation and Amortization 67 64 62
Total Operating Expenses $773 $830 $723
Operating Margin Before Interest and Other $69 $73 $79
Interest Expense -Net and Other Deductions $58 $62 $56
Operating Margin $11 $11 $23
Interest and Other Income 14 14 9
Net Margin $25 $25 $32
Equity as a % of Assets 18.9% 16.0% 16.0%
Margins-for-Interest Ratio (MFI) 1.50 1.51 1.70
Debt Service Coverage Ratio (DSC) 1.32 1.33 1.44
Average Cost of Debt 4.03% 3.86% 3.84%
9

Mission StatementSouth Mississippi Electric’s Mission is to deliver to our Members reliable and affordable energy in a safe and environmentally-responsible manner.
Inherent in this commitment is a set of core Values, which guide our everyday activities:
• Member Focus• Transparency and Responsiveness• Fiscal, Regulatory and Environmental Compliance• Safety and Reliability• Serve as a Trusted and Value-Adding Resource for Member-owners
Competitive Strengths include:
• An Experienced, Skilled Workforce• A Long-Term Contractual Relationship with Member Systems• Financial Health, including that of Members• Long-range Planning for Cost-Effective Generation Resources• Fuel Diversity in Generation Resources
10
Pictured: Former SME Lineman Charley Butler 1970s
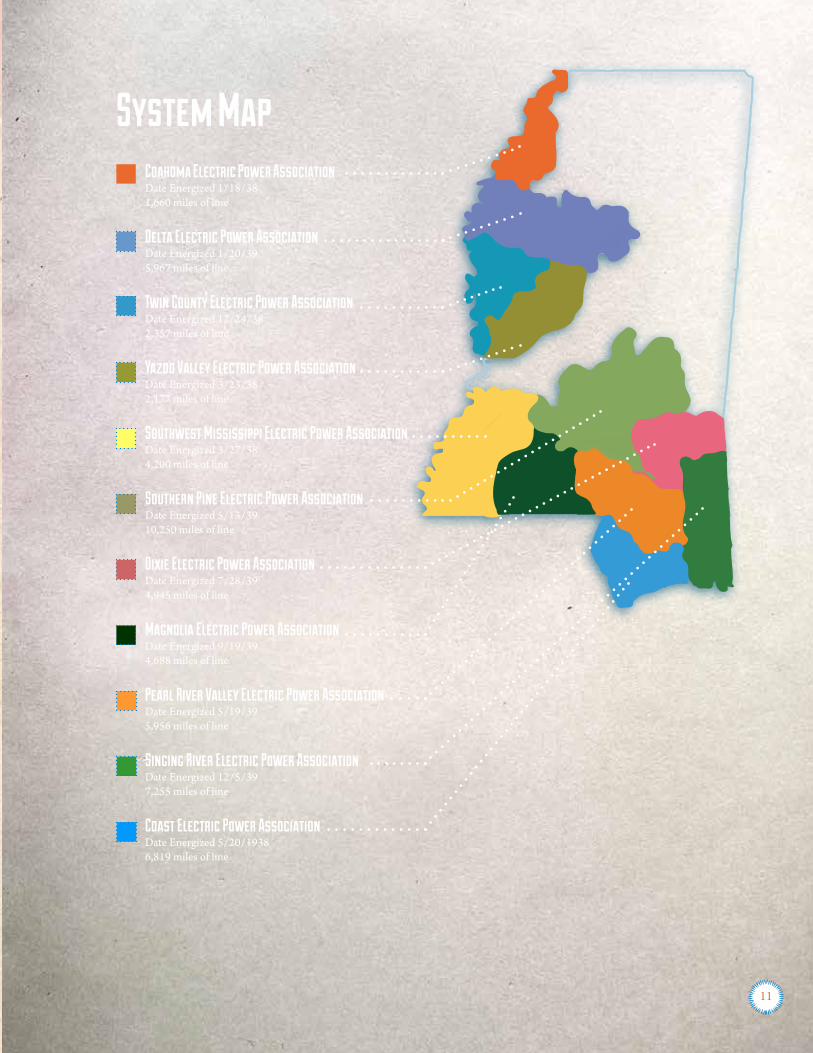
System MapCoahoma Electric Power AssociationDate Energized 1/18/381,660 miles of line
Delta Electric Power AssociationDate Energized 1/20/395,967 miles of line
Twin County Electric Power AssociationDate Energized 12/24/382,357 miles of line
Yazoo Valley Electric Power AssociationDate Energized 3/23/382,177 miles of line
Southwest Mississippi Electric Power AssociationDate Energized 3/27/384,200 miles of line
Southern Pine Electric Power AssociationDate Energized 5/13/3910,250 miles of line
Dixie Electric Power AssociationDate Energized 7/28/394,945 miles of line
Magnolia Electric Power AssociationDate Energized 9/19/394,688 miles of line
Pearl River Valley Electric Power AssociationDate Energized 5/19/395,956 miles of line
Singing River Electric Power AssociationDate Energized 12/5/397,255 miles of line
Coast Electric Power AssociationDate Energized 5/20/19386,819 miles of line
11
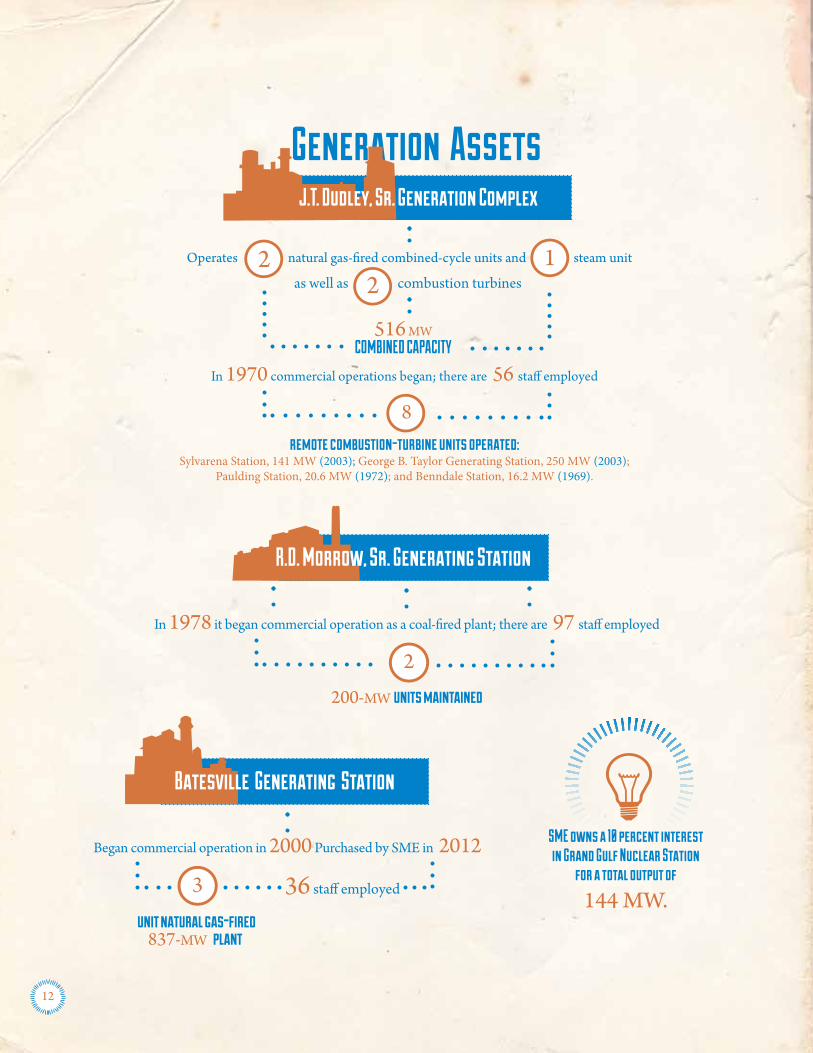
Generation Assets
36 staff employed
as well as 2 combustion turbines
12

Board of DirectorsPresident Henry C. Waterer, Jr., Delta Electric Power Association
Vice President William Hardin, Coahoma Electric Power AssociationSecretary/Treasurer Mack Mauldin, Dixie Electric Power Association
James Ginn, Coast Electric Power AssociationOdell McKenzie, Magnolia Electric Power Association
Lawrence Warren, Pearl River Valley Electric Power AssociationHoward Davis, Singing River Electric Power AssociationMickey Berry, Southern Pine Electric Power Association
Billy Key Smith, Southwest Mississippi Electric Power AssociationJack Reed, Twin County Electric Power Association
Louis Thompson, Yazoo Valley Electric Power Association
Coahoma Electric Power Association – Keith Hurt, General ManagerCoast Electric Power Association – Robert Occhi, President/CEO
Delta Electric Power Association – David O’Bryan, General ManagerDixie Electric Power Association – Randy Smith, General Manager
Magnolia Electric Power Association – Darrell Smith, General ManagerPearl River Valley Electric Power Association – Randy Wallace, General ManagerSinging River Electric Power Association – Mike Smith, General Manager/CEO
Southern Pine Electric Power Association – Donald Jordan, General ManagerSouthwest Mississippi Electric Power Association – Kevin Bonds, General Manager
Twin County Electric Power Association – John Mosley, ManagerYazoo Valley Electric Power Association – Ron White, General Manager
13
Pictured: Former SME Employees circa 1983

2015
MILE
STON
ES
14
Pictured: Operations Superintendent Jeff Brown; Administrative Assistant Lara Hages; Moselle Storekeeper I Allen Moree; Power Market Settlements Analyst Juan De La Paz, 2016SME Cooperative Student Mike Cannady 1973
2015MILESTONESJanuaryInstalled transformer gas monitoring equipment with remote communications on the generator step-up transformers at Batesville
Peak load of the year for South Mississippi Electric’s (SME) Local Balancing Authority was set on Jan. 8 with 1,645 MW
Revised and updated SME’s System Restoration Plan
FebruaryEnergized South Hoy Substation and Line 180 connecting the substation to Plant Moselle
Completed Pine Ridge Repeater on Feb. 4, which concluded Phase 5 of the microwave communication network expansion project
MarchCompleted the Energy Management System audit by the SERC Reliability Corporation and the North American Electric Reliability Corporation
Set the 2015 generation peak on March 6 with 2,229 MW
Placed SME’s new Energy Management System in service on March 31
AprilEstablished a contract with Medical Analysis, SME’s new employee medical clinic
Developed SME’s financial transmission rights and annual revenue rights auction tools
MayCompleted Line 165 relay upgrades and other site upgrades at the Purvis Bulk Substation
Presented the findings of SME’s Summer Operating Study with Member systems at the Engineering and Operations meeting
JuneCompleted second year with MISO serving as SME’s Reliability Coordinator
Installed E911 software in the Control Center to enable system operators to assist anytime there is a 911 call made from an SME facility
The new communication site at Southeast Natchez started carrying radio traffic June 29
JulySet SME’s summer peak Local Balancing Authority load on July 15 with 1,471 MW
15
Meter Technician I Matt Simpson 2016
August Completed SERC Reliability Corporation’s Operations and Planning audit with no findings
Conducted a facility transmission study for the Origis Energy USA large solar facility to be constructed in Lamar County
The new communication site at Summit started carrying radio traffic Aug. 19
Completed SME’s critical infrastructure protection physical security audit with no findings
SeptemberPlaced in service the newly constructed Line 120 that connects Eucutta to Heidelberg
Placed in service the Heidelburg and Eucutta gang operated air break switches (GOABs)
Established direct interface between SME’s power marketing group and MISO for all day-ahead marketing activities, enabling SME employees to perform all functions for day-ahead operations
OctoberCompleted the reconstruction of Line 14A between the South Hoy substation and Hoy switching station.
Assisted with efforts to reduce the proposed Southeastern Power Administration (SEPA) Cumberland rate adjustment and worked with SEPA to apply for the cost recovery provisions of the Dam Safety Act for repairs to the Wolf Creek and Center Hill dams
NovemberCompleted the final phase of a project to reconstruct Line 89 through a challenging stretch of the Pascagoula River swamp
Hosted first companywide health fair at the 2015 All-Employee Meeting
Completed the reconstruction of Line 64 from Homewood to Morton
Placed in service the newly constructed Line 122 up to the new South Collins delivery point
Field Operations Center tower work completed November 6, 2015
16
DecemberPlaced in service the new South Collins delivery point
Completed two years of operation in the MISO market
Developed a new scheduling transmission arrangement with PowerSouth Energy Cooperative and the Southern Company Network Integrated Transmission Service for the transmission of hydroelectric power generated by SEPA’s Alabama/Georgia system
The new communication site at Midway Road started carrying radio traffic on Dec. 16
Completed Phase 6 of the microwave communication network expansion project and started carrying radio traffic on Dec. 22
Year-LongPurchased a total of 125,505 kWh from South Mississippi Electric Members through distributed generation agreements for a total of $5,505.95
SME’s generating units achieved a record gas burn for the second consecutive year due to participation in MISO and low gas prices. SME’s units consumed 43 billion cubic feet of natural gas
SME successfully achieved compliance with the Cross- State Air Pollution Rule, which regulates emissions of nitrous oxides by generating units. Compliance was achieved utilizing allowances allocated by the Environmental Protection Agency.
Sixty-four percent of SME’s active capital projects were completed by December 2015
Completed the balance of plant and turbine control systems upgrades for all three units at Sylvarena Station, improving the functionality, performance and reliability of the units
Concluded the Smart Grid Investment Grant program, which was a collaboration between SME and Coast, Magnolia, Pearl River Valley, Southern Pine and Southwest Mississippi electric power cooperatives
Completed the installation of stainless piping for the ammonia injection system at the Batesville Generating Station
17
Executive SummaryTo Our Members:
SME is celebrating our 75th anniversary, and the theme of this year’s annual report focuses on our Staying Power. An anniversary is a fitting time to survey the events of the past. This report details the foundations of our present strength and those elements that put us in a favorable position to reach our future goals. We continue to work toward those goals of stability and better service for our Members.
The 2014 SME Annual Report was dedicated to our employees. The timing of that choice was excellent, as 2015 was a great year for employee performance, and, as a result, an outstanding year for SME’s Members and those they serve. Last year also saw a number of changes in strategy for SME.
Safety performance continued to improve with a decrease in recordable injuries from six in 2014 to three in 2015. Our Total Case Incident Rate (TCIR) was zero for all facilities except the Field Operations Center (FOC). The FOC’s TCIR was 3.4, still well below the national average of 6.5. Days Away, Restricted, Transferred (DART) was also zero at all facilities except the FOC, but the FOC’s DART of 2.3 was still below the national average of 3.3. Our company-wide TCIR was 0.7 and DART was 0.5, also well below national averages. Our Workers’ Compensation experience modifier is 0.58, an exceptional achievement that provides significant savings in Workers’ Compensation premiums.
Transmission reliability did not fare as well. Total outage time for SME’s system was 7.44 hours, (7.17 hours was due to outages on radial lines) up from 0.98 hours in 2014. Southern Company outage time was 0.7 hours, and Entergy outage time was 94.82 hours, both small improvements from 2014.
SME’s total system peak demand occurred in January, and was 2,385 MW, 5.4 percent less than 2014, but 7.9 percent above budget. The annual load factor was 48 percent, an improvement of 2 percent over 2014. Energy sales to Members were 10.1 million MWh, 1.5 percent below budget. Our industrial sector was particularly hard hit, with sales to energy load down 9.4 percent. Sales into MISO, however, continued to increase, driving total energy sales to nearly 13 million MWh, an all-time record.
These record sales were a function of lower natural gas prices
and SME’s fleet of efficient, reliable natural gas plants. SME generation facilities provided 7 million MWh, 2.8 million above budget. Natural gas burn for 2015 set another record at 43 billion cubic feet. Batesville Generating Station led the way with production of 3.8 million MWh, a facility record. Significant investments in plant maintenance and upgraded systems, combined with excellent employee and management performance, enabled Batesville to perform well in 2015. Moselle and its employees also had an excellent year, with generation of 1.8 million MWh, more than double budget. Grand Gulf Nuclear Station was off somewhat, providing 1.2 million MWh, and the Plum Point and NRG contracts were well below budget due to extended plant outages. Fortunately, other SME resources were ready and able to make up the difference.
A number of needed transmission projects were completed, and our transmission crews continued to expand their construction performance. Significant projects included Line 180, a 161kV project from Plant Moselle to the new South Hoy substation. This project was delayed in the past due to difficult land acquisition and construction issues. SME’s land, legal, design and construction teams overcame those challenges to complete the project effectively. Significant progress was made in the communications area also. The microwave project to improve communications with Member delivery points began in 2010 and was substantially completed in 2015. The decision to join MISO continued to provide economic
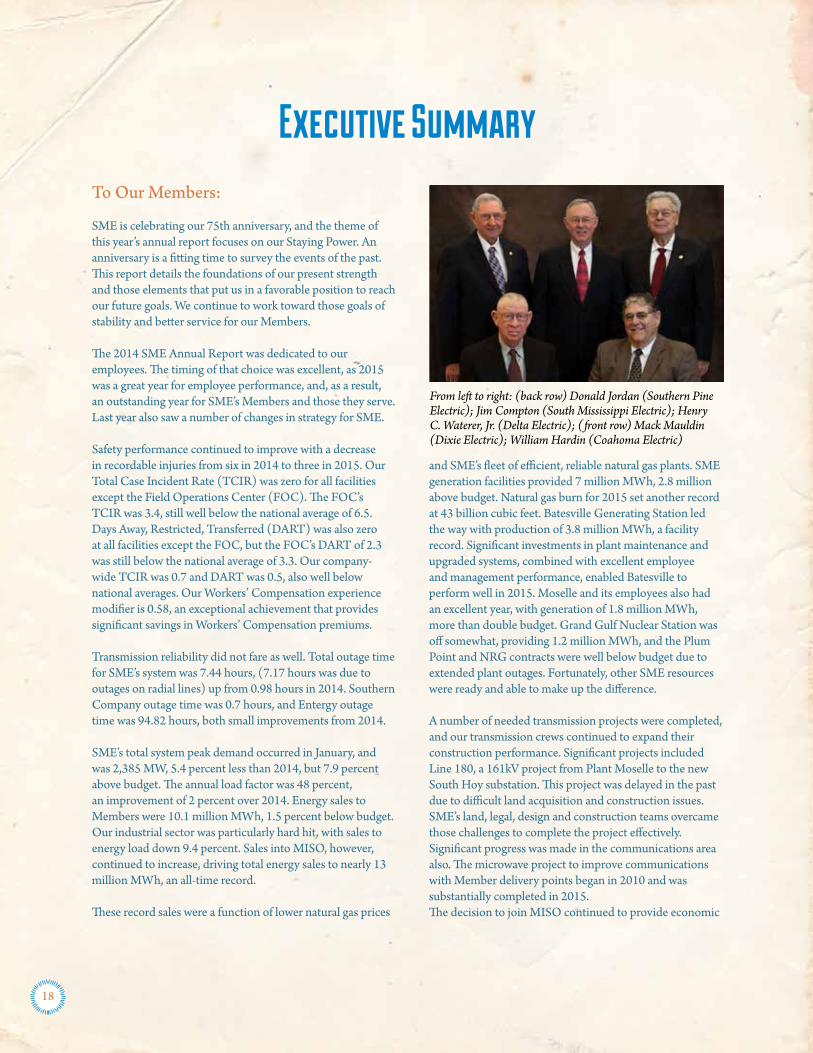
From left to right: (back row) Donald Jordan (Southern Pine Electric); Jim Compton (South Mississippi Electric); Henry C. Waterer, Jr. (Delta Electric); (front row) Mack Mauldin (Dixie Electric); William Hardin (Coahoma Electric)
18
value. Mild weather and depressed market prices were dominant in 2015. Real-time hourly locational marginal prices peaked at $578.25/MWh on March 6, 2015, but such spikes were limited and short lived. While our generator margins were significant, the real value driver was SME’s energy cost to serve its Members’ load, about $30/MWh. A major contributor to low load cost is accurate day-ahead load prediction by our power-marketing group. In 2015, the real-time variances from load forecasts resulted in the need to purchase an additional 25,000 MWh out of total load of 6.8 million MWh to meet Member load requirements, a remarkable 0.37 percent annual MWh error. On a cost basis, SME’s load purchases were 99.74 percent efficient, or a $520 thousand cost out of a $200 million MISO load exposure. Given the unpredictability of weather, this is quite an achievement. Considering generator margins as variable revenue, net variable cost to serve Member load in MISO in 2015 was $21/MWh.
We referred earlier to changes in strategy. The end of SME’s potential purchase of 15 percent of the Kemper County IGCC facility came in 2015. In May the board elected to end pursuit of ownership, and to withdraw our deposit of $301 million. However, because we purchase 27.5 percent of our Members’ energy from Mississippi Power Company on a Federal Energy Regulatory Commission-regulated, cost-based rate, the ultimate commercial operation date, cost, and prudency determination by the Mississippi Public Service Commission will all remain items of financial interest to us.
Another strategic decision in 2015 was with regard to Plant Morrow. Our only owned coal asset, Morrow continues to be challenged by environmental regulations and high delivered fuel costs. Our board made the difficult decision to begin the conversion process to natural gas at Morrow, and we made application to modify the air permit to enable co-firing the plant with natural gas. The board also approved accelerating depreciation on Morrow. Fortunately, we were able to make up the loss of coal energy with production from natural gas. In 2008, SME’s energy mix was 59 percent coal and 25 percent natural gas. In 2015 coal was 21 percent and natural gas was 68 percent. We would not have been able to make such a monumental change, and to take advantage of current low natural gas prices, without the Batesville purchase and the Moselle Repower Project.
In 2015, SME begin a media outreach in conjunction with Godwin Group centered on the Power of 12, which represents SME and its eleven Members. Surveys showed that many of our younger members do not know that we are not-for-profit or understand the cooperative business model. Therefore, we developed an educational outreach program
including a new website, myelectriccooperative.com. We also began dedicating resources to public policy for the first time to ensure that our concerns are communicated to federal and state policy makers effectively.
SME expanded its renewable energy options in 2015. When Member surveys showed a strong interest in expanded renewable energy, we researched costs and determined that adding solar from larger sites was economic. SME’s board approved five initial 100kW solar sites, as well as a contract for a 52 MW solar farm, projected to produce 122,000 MWh in its first year of production. Solar energy will be added to our existing hydropower renewable resources.
Financial results are reported herein, but our dramatically lower cost of service allowed us to cancel a budgeted April three-mill rate increase, provide Member bill credits of $10.5 million, and defer $52 million of excess margins into 2016 and beyond, lowering revenue needed from Members in the future. We have followed SME finances since the 1980s, and 2015 was SME’s best year financially, by far.
Years of planning, investing, and attention to details came to fruition in 2015, enabling us to deliver excellent results for our Members. Although many of the challenges we faced years ago have been met, new ones face us. Environmental regulations continue to bedevil the electric generation sector, and the ultimate outcome of these regulations remains unclear. However, since SME has already reduced our CO2 intensity per MWh produced by 53 percent since 2005, we are confident we will be able to successfully manage any needed transition to a lower carbon production requirement.
Our ability to be analytical, adaptable, and forward-thinking has helped us rise to meet many challenges over the years as well as to bring us to the secure position we currently hold. The upcoming year will bring new challenges for our employees – to continue to lower the cost to serve our Members, and to navigate the difficult, ever-changing environment in the electric industry. However, this is exactly what we have been doing for 75 years now, and we are confident our employees will rise to the occasion and meet the facing challenges.
Jim Compton, General Manager/CEO
Henry C. Waterer, Jr., SME Board President
19
2015 Financial Review
I. Results of Operations 1) Opening Narrative 2) Revenues and Energy Sales a. 2015 vs. 2014 b. 2014 vs. 2013
3) Fuel and Purchased Power Expenses a. 2015 vs. 2014 b. 2014 vs. 2013 c. TABLE: “Cost of Fuel for Owned and Contracted Generation”
4) ENERGY SUPPLIES: a. TABLE: “Sources of Supply” b. TABLE:” Sources of Owned Generation” c. TABLE: “Energy Supplied For Total System From All Sources by Fuel Type”
5) Other Operating Expenses a. 2015
6) Non-Operating Margin a. 2015
II. Financial Condition 1) Investment Activities 2) Cash Flow from Operations 3) Financing Activities 4) Liquidity 5) Credit Ratings
III. Five Year Financial Summary
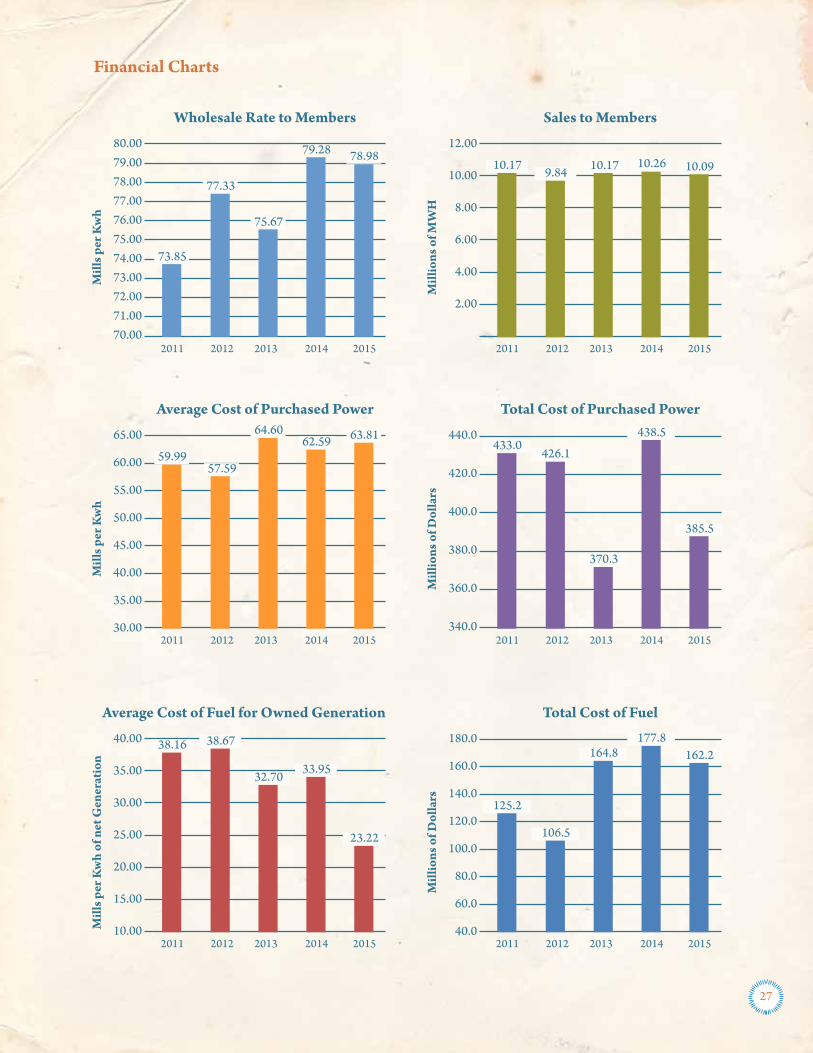
IV. Financial Charts 1) Wholesale Rate to Members 2) Sales to Members 3) Average Cost of Purchased Power 4) Total Cost of Purchased Power 5) Average Cost of Fuel for Owned Generation 6) Total Cost of Fuel
20
South Mississippi Electric Power Association2015 Financial Review
Results of OperationsSouth Mississippi Electric (SME or Association) provides generation and transmission services to 11 member distribution cooperatives (Members) located in southern and western portions of Mississippi under individual all-requirements wholesale power contracts that expire in 2055. SME’s financial results from operations in 2015 were sufficient to ensure compliance with financial covenants and maintenance of an adequate liquidity position. A condensed statement of revenues and expenses is presented on the inside front cover of this report.
Decline in Cost of Service Sets the Table for Lower Rates in 2016As a not-for-profit generation and transmission cooperative, SME’s mission is to deliver to its Members reliable and affordable energy in a safe and environmentally-responsible manner. When opportunities permit a reduction in this cost of service, SME takes pride in passing those savings on to Members in the form of lower rates.
SME’s cost of service includes both fixed cost and variable cost. The components of fixed cost include: 1) Plant cost (including generation facilities, transmission assets and support facilities), comprising of non-fuel operation and maintenance expenses, depreciation and amortization expenses and interest expense net of interest income, 2) Engineering and transmission costs, 3) General and Administration cost, and 4) Purchased Power demand charges for contracted resources. The components of variable cost include: 1) Fuel, 2) Environmental Allowances, and 3) Purchased Power energy cost for contracted resources and net purchases from MISO.
During 2015, SME’s total cost of service for Member and non-Member sales decreased 6.9% from the prior year to $817.3 million. While total fixed cost in 2015 remained steady at $446.9 million, total variable cost was $370.4 million in 2015, a decrease of 13.6%, or $58.3 million, as compared with 2014. The lower total variable cost in 2015 was achieved despite a 6.4%, or 777,102 MWh, increase in total energy sales.
As further described in the commentary below, the lower overall cost of service was accomplished by a substantial shift in the mix of resources being dispatched. The decrease in total variable cost was attributable to a lower volume of energy purchases and a substantial drop in fuel prices. Resources fueled by natural gas played a major role in this shift.
Revenues and Energy Sales2015 vs. 2014 Operating revenues in 2015 decreased 6.8% from the prior year, to $842 million. This decrease was attributed to both a decrease in electric energy revenue from Members and a decrease in other electric energy revenue. Electric energy revenue from Members, net of deferred revenue, was $757.5 million in 2015, a decrease of 6.5% as compared with 2014. The decrease in Member revenues was due to a deferral of $51.8 million collected from Members in 2015 that will be accreted to revenues in 2016 and future periods. Partially offsetting this deferral was the recognition of $13 million of Power Cost Adjustment (PCA) revenues in 2015 that was collected from Members during 2014. The Member rate schedule in 2015 was unchanged from the one in effect during 2014. However, in the third quarter of 2015 SME awarded $10.5 million in bill credits to its Members. Other electric energy revenue, principally net sales to the Midcontinent Independent System Operator, Inc. (MISO), decreased $9.0 million to $82.2 million in 2015 due to lower average selling prices in 2015.
Energy sales to Members decreased 1.7% to 10.1 million MWh in 2015 when compared with the prior year. This decrease in sales occurred primarily in the non-summer months, partially offset by increased sales during the summer months. During January 2015 SME recorded its yearly peak demand of 2,385MW which was 5% below the prior year peak of 2,521MW that occurred during January 2014. Sales to Members’ large power customers decreased approximately 9.4% in 2015 from the prior year due to reduced sales to fuel pumping stations, paper mills and natural gas storage facilities. Large power customers represented 13.0% and 14.1% of the total Member load in 2015 and 2014, respectively.
2014 vs. 2013 Operating revenues in 2014 increased 12.6% from the prior year, to $903 million. This increase was attributed to both an increase in electric energy revenue from Members and an increase in other electric energy revenue. Electric energy revenue from Members, net of deferred revenue, was $810.0 million in 2014, an increase of 3.6% as compared with 2013. During 2014, $13 million in Power Cost Adjustment (PCA) revenue collected from Members was deferred to 2015 while SME
21
recognized $9.5 million of PCA revenues in 2014 that were collected from Members during 2013. Member revenue in 2014 was also affected by a 2.95 mill increase in the PCA component of the rate schedule that took effect in December 2013 and remained unchanged in 2014. Other electric energy revenue increased $70.8 million to $90.2 million in 2014. SME joined MISO in December 2013, so 2014 non-member sales reflect the Company’s first full year in the MISO market.
Energy sales to Members increased 0.9% to 10.3 million MWh despite lower sales in seven months of 2014 compared with the prior year. After a colder than normal first quarter temperatures and weather conditions moderated during 2014. Energy sales to Members were 13.1% higher during the first quarter of 2014 compared with the same period during 2013. During January 2014 SME recorded its yearly peak demand of 2,521MW which was 26% higher than the prior year peak of 1,998MW that occurred during August 2013. Sales to Member large power customers decreased approximately 4% in 2014 from the prior year due to reduced sales to fuel pumping stations, energy recovery pumping and natural gas storage facilities.
Fuel and Purchased Power ExpensesFuel expense is affected by a number of factors, including the volume of energy generated by owned facilities, the mix of units utilized and commodity prices for fuels. The volume of generation is influenced by the relative competitive position of SME’s owned generation facilities in MISO’s economic dispatch model and the level of energy demand. Transmission congestion costs and unit reliability also affect dispatch volume and fuel expense.
Purchased-power expenses depend upon the demand or capacity costs and the energy price for contracted resources, the quantity of energy purchased, and pricing of economy power purchased in the MISO market. SME seeks to minimize the cost of energy supplied to Members through the economic dispatch of available resources. To the extent that SME’s sales to MISO and purchases from MISO offset each other, the cost to serve Member load largely reflects SME’s production cost and purchased power cost for contracted resources.
Resources for a portion of Member load are provided by Mississippi Power Company (MPC) through all-requirements contracts under which MPC supplies the all-requirements needs at certain Member delivery points. The delivery points are served under a municipal and rural association (MRA) cost-based rate that is subject to Federal Energy Regulatory Commission (FERC) approval. The MRA rate includes a fuel cost adjustment that is revised annually.
2015 vs. 2014 Fuel and purchased-power costs were $548 million and $616 million in 2015 and 2014, respectively. These costs represent 70.9% and 74.2% of total operating expenses in 2015 and 2014, respectively. The decrease in the aggregate cost of fuel and purchased power in 2015 is attributable to both lower fuel expense and lower purchase power cost.
Fuel expense declined $15.7 million, or 8.8%, in 2015 as compared with the previous year despite a 33.3% increase in energy volume produced from owned facilities. The increase in sales from owned facilities in 2015 was attributable to higher dispatch of SME’s Batesville Generating Station, Grand Gulf Nuclear Station (GGNS), and the J.T. Dudley, Sr. Generation Complex (Plant Moselle) offsetting lower dispatch of R.D. Morrow, Sr. Generation Complex (Plant Morrow). The combined-cycle units at Batesville Generating Station and Plant Moselle accounted for approximately 28.9% and 11.3%, respectively, of SME’s total energy available for sale during 2015.
The cost of natural gas purchased for owned units averaged $3.31/MMBtu during 2015, inclusive of hedge and gas storage costs, as compared with $5.03/MMBtu during 2014.
Purchased power costs decreased 12.1% during 2015 to $386 million due to a 13.8% decrease in the volume of purchased energy partially offset by a 2.0% increase in the average unit price. The average cost of purchased power during 2015 was $63.87/MWh compared to $62.59/MWh during 2014 due to a shift in the mix of power purchases. Energy purchases from MPC under the MRA contracts decreased 1.8% in 2015 compared to the prior year. The average rate paid to MPC during 2015 under the contracts was $79.94/MWh compared to $80.51/MWh in 2014. Energy supplied to Members under the MRA contracts comprised approximately 21.4% of SME’s total energy sales in 2015 and 27.5% of total Member load during the year. Energy purchases from Plum Point increased 11.9% in 2015 compared to the prior year. The average cost of power from Plum Point during 2015 was $59.95/MWh compared to $64.04/MWh in 2014. SME’s costs for net energy purchases of economy energy from MISO decreased $34.9 million, or 64.8%, in 2015 to $18.9 million. The average rate paid to MISO during 2015 was $25.83/MWh compared to $34.41/MWh in 2014. Net energy purchases from MISO comprised approximately 7.3% of total Member load during the year.
2014 vs. 2013 Fuel and purchased-power costs were $616 million and $535 million in 2014 and 2013, respectively. These costs represent 74.2% and 74.1% of total operating expenses in 2014 and 2013, respectively. The increase in the aggregate cost of fuel and purchased power in 2014 was attributable to higher energy sales during 2014, primarily net energy sales to MISO.
Fuel expense rose $13 million, or 7.9%, in 2014 as compared with the previous year. Energy from owned facilities increased 3.9% in 2014, with higher dispatch of the Batesville Generating Station offsetting lower dispatch at Plant Morrow, GGNS,
22

and Plant Moselle. The Batesville Generating Station accounted for approximately 19% of SME’s total energy available for sale during 2014.
The cost of natural gas purchased for owned units averaged $5.03/MMBtu during 2014, inclusive of hedge and gas storage costs, as compared with $4.33/MMBtu during 2013.
Purchased power costs increased 18.4% during 2014 to $438 million due to a 22.2% increase in the volume of purchased energy partially offset by a 3.1% decline in the average unit price. The average cost of purchased power during 2014 was $62.59/MWh compared to $64.60/MWh in 2013. SME’s purchased power costs in 2014 included $53.8 million expense for net energy purchases of economy energy from MISO. Energy purchases from MPC under the MRA contracts remained virtually unchanged in 2014 compared to the prior year. However, the average rate paid to MPC during 2014 under the contracts was $80.51/MWh compared to $72.01/MWh during 2013. The MRA rate increase reflects the inclusion in MPC’s rate base a portion of its carrying cost related to Plant Ratcliffe.
Cost of Fuel for Owned and Contracted Generation (*) ($/MWh) 2015 2014 __________ __________Coal $ 24.14 $ 28.64Nuclear 8.45 9.14Natural Gas 25.63 39.33
(*) Contracted generation refers to resources under contracts with Plum Point Energy Associates (PPEA), Louisiana Generating (LA Gen), Power Sale Agreement with Mississippi Power Company (MPC PSA), and Southeastern Power Administration (SEPA).
Energy Supplies: 2015 over 2014 2015 over 2014 Sources of Supply (1000 MWh) 2015 2014 Increase/(Decrease) % change
Total Owned and Contracted Generation (*) 9,504 7,844 1,660 21.2%
Net Purchases from MISO 733 1,565 (832) (53.2%)
MPCo All-Requirements Contracts 2,773 2,823 (50) (1.8%)
Other Purchased Power 9 11 (2) (18.2%)
Total Energy Available 13,019 12,243 776 6.3%
Energy Losses 49 51 (2) (3.9%)
Total Sales 12,970 12,192 778 6.4%
(*) Contracted generation refers to resources under contract with PPEA, LA Gen, MPC PSA, and SEPA.
Sources of Owned Generation 2015 over 2014 2015 over 2014 (1000 MWh) 2015 2014 Increase/(Decrease) % change
Batesville Generation Station 3,762 2,323 1,439 61.9%
Plant Moselle 1,485 860 625 72.7%
GGNS 1,172 1,026 146 14.2%
Plant Morrow 246 764 (518) (67.8%)
Other Owned Generation 318 265 53 20.0%
Total Owned Generation 6,983 5,238 1,745 33.3%
Energy Supplied For Total System From All Sources by Fuel Type 2015 2014 __________ __________Coal 21.3% 34.8%Nuclear 9.0% 8.4%Natural Gas 67.8% 54.2%Hydro 1.9% 2.6% 100.0% 100.0% 23
Other Operating Expenses2015 Other operating expenses are comprised of non-fuel operating and maintenance expenses related to generation, transmission expenses and administrative and general costs. Other operating expenses represented $12.19/MWh and $12.36/MWh in 2015 and 2014, respectively.
In 2015, other operating expenses increased 5.0% primarily due to higher expense related to the transmission system and to overhead expenses, which increased $3.7 million and $4.2 million, respectively, as compared to the prior year. Overhead expenses were affected by higher costs for engineering, legal and communication services.
Interest expense of $51.8 million, net of approximately $1.3 million in capitalized interest, in 2015 was 5.3% lower compared to the prior year, primarily due to a 9.1% decrease in the daily average balance of debt outstanding, offset in part by higher cost related to the conversion of low-cost variable rate loans to long-term fixed rate debt. The Association’s average cost of debt was 4.03% in 2015.
Non-Operating Margin2015 Interest income was $12.8 million in 2015 compared to $13.4 million in 2014. This decrease is due to the mid-year refund of all balances on deposit with MPC related to the planned partial ownership Plant Ratcliffe offset in part by an increase in balances on deposit in the Rural Utilities Service (RUS) “cushion of credit” program during the year.
Financial ConditionThe Association’s financial plan targets a number of key financial metrics that are intended to ensure sufficient cash flow to meet obligations as they become due and capital to meet Members’ future resource needs. One such financial target is that the annual cash coverage of interest and scheduled principal payments (debt service coverage ratio or DSC) be equal to or greater than 1.20 times. The Association’s DSC ratio in 2015 and 2014 was 1.32 and 1.33, respectively.
SME’s net margin for the year ended December 31, 2015 was $24.7 million compared to $25.1 million for 2014. In formulating budgets and long-term financial plans, SME considers its annual “margins for interest” (MFI) ratio that is defined in the Association’s mortgage indenture. SME’s indenture requires the maintenance of a MFI ratio of 1.10 times in order to be permitted to issue additional secured obligations. The Association’s credit agreements with banks also have a financial covenant that SME maintain an annual MFI ratio no less than 1.10 times. SME’s MFI ratio was 1.50 and 1.51 for 2015 and 2014, respectively.
A strong balance sheet provides assurance to Members and other stakeholders that SME has the financial resources to meet its obligations. The Association has a medium-term goal to increase equity as a percentage of assets to 20%. At year-end 2015, the equity-to-assets ratio was 18.9% compared to 16.0% at the prior year-end.
SME’s mortgage indenture permits limited cash distributions of patronage capital, provided equity is not less than 20% of total equity and long-term debt. At year end 2015 equity exceeded the required threshold, and the Association retired $7.6 million of patronage capital.
The rate schedule for Members that is adopted each year in the Association’s annual budget is intended to cover SME’s cost of service and meet or exceed target financial ratios. The Association reviews its financial position each month with the board of directors, which may make adjustments to Member rates during the year in order to achieve financial targets and other objectives.
Investment ActivitiesSouth Mississippi Electric’s total assets decreased $240 million during 2015 to $1.9 billion at year-end. Capital expenditures in 2015 were $68 million and were primarily attributable to improvements to SME’s transmission system. The Association’s deposits in the RUS “cushion of credit” increased to $169 million as of year-end 2015. The Association used a portion of the “cushion of credit” balance in 2015 to meet scheduled principal and interest payments on RUS and Federal Financing Bank debt as the payments became due.
During March 2012, the Association initially placed a deposit of $150 million with MPC. On January 2, 2014 and October 9, 2014, SME placed additional deposits with MPC, $75 million and $50 million, respectively. The deposits were meant to mitigate accrued financing cost to be paid to MPC at the closing of SME’s planned purchase of a 15% ownership
24
in the Kemper County energy facility (Plant Ratcliffe). Following termination of the ownership agreement in May 2015, the $275 million deposit was refunded in June 2015 with $26 million of accrued interest. The Association utilized the funds returned by MPC and cash from operations to reduce debt.
At year-end 2015, SME’s aggregate debt balance was $282.2 million less than year-end 2014. During 2015 SME also increased deposits in the RUS “cushion of credit” which is an interest bearing account that is available for future payments of principal and interest on RUS and FFB loans. The “cushion of credit” balance at year-end 2015 was $168.9 million, approximately $100.2 million higher than the prior year-end.
Cash Flow from OperationsCash provided by operating activities amounted to $117 million during 2015 compared to $156 million during 2014. Net margins and non-cash depreciation expense totaled $101 million during 2015 and $96 million during 2014. Working capital movements affected operating cash flows to a lesser extent in 2015 than the prior year. Current assets, excluding cash, increased $3 million at year end 2015 as compared with prior year-end. Fuel inventory, principally coal, at year-end 2015 was $5.8 million lower than the prior year.
Financing ActivitiesDuring 2015, SME received $48 million in loan disbursements from RUS under loan contracts, including the ‘AD8’ loan that closed in June 2015. These RUS loan advances provide long-term financing for various transmission system improvement and generation system improvement projects. The RUS loan advances are generally for a 20-to-30-year period and carry interest rates that are fixed at the time of the advance. The interest rates for RUS loan advances made in 2015 ranged between 2.62% and 2.74% and the weighted average interest rate for these loan advances was 2.70%. At year-end 2015, the Association had $73 million in undrawn commitments available from RUS under three loan contracts.
Upon SME’s request, in September 2015, RUS notified SME that the $480 million ‘AA8’ loan commitment for the Association’s 15% ownership of Plant Ratcliffe had been terminated.
LiquidityAt year-end 2015, SME had $342 million in available undrawn commitments under unsecured credit facilities. The credit facilities have various final maturities between July 2017 and September 2019. SME believes it has adequate access to bank markets to renew or replace the credit facilities in due course as appropriate.
Liquidity available to meet the Association’s funding requirements is composed of unrestricted cash-on-hand and amounts available under the committed bank facilities described above. Unrestricted cash and committed credit facilities available for immediate funding at year-end 2015 represented 190 days coverage of the average daily operating cash expense in 2015.
Credit RatingsAt year-end 2015, SME was assigned the following credit ratings:
S&P Moody’s FitchSenior Secured Debt A-/Stable A2/Stable A-/StableIssuer Credit Rating A-/Stable A3/Stable -
25
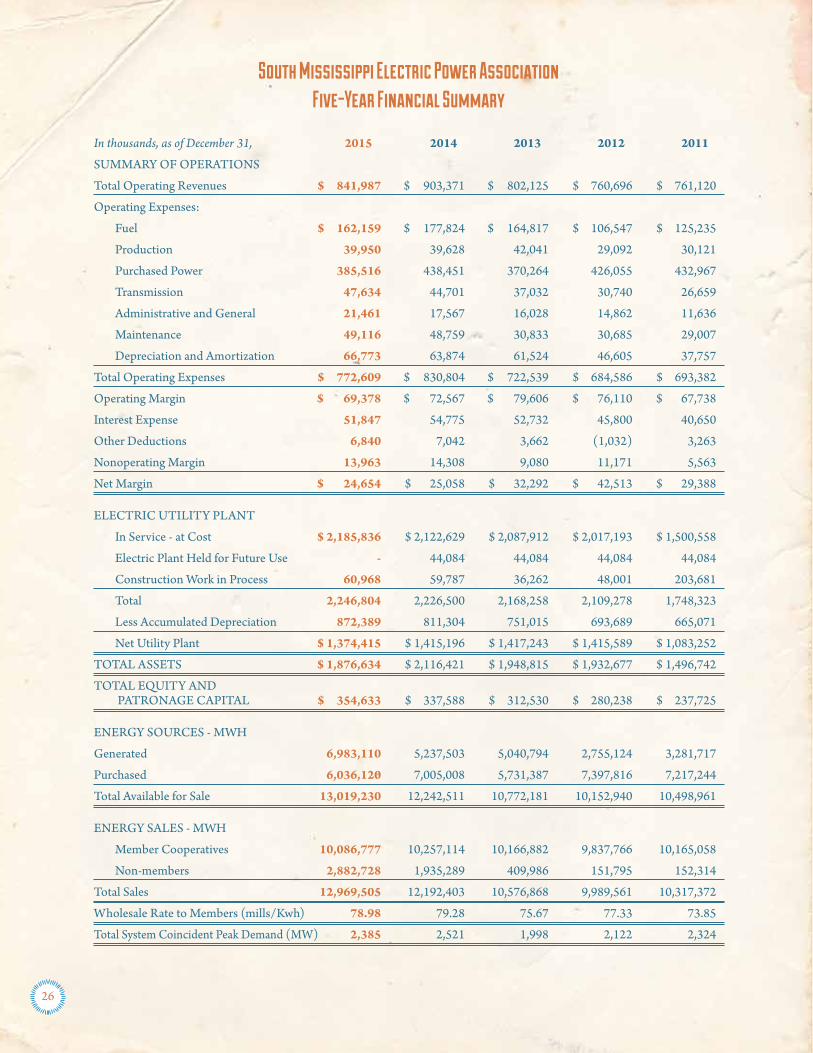
In thousands, as of December 31, 2015 2014 2013 2012 2011
SUMMARY OF OPERATIONS
Total Operating Revenues $ 841,987 $ 903,371 $ 802,125 $ 760,696 $ 761,120
Operating Expenses:
Fuel $ 162,159 $ 177,824 $ 164,817 $ 106,547 $ 125,235
Production 39,950 39,628 42,041 29,092 30,121
Purchased Power 385,516 438,451 370,264 426,055 432,967
Transmission 47,634 44,701 37,032 30,740 26,659
Administrative and General 21,461 17,567 16,028 14,862 11,636
Maintenance 49,116 48,759 30,833 30,685 29,007
Depreciation and Amortization 66,773 63,874 61,524 46,605 37,757
Total Operating Expenses $ 772,609 $ 830,804 $ 722,539 $ 684,586 $ 693,382
Operating Margin $ 69,378 $ 72,567 $ 79,606 $ 76,110 $ 67,738
Interest Expense 51,847 54,775 52,732 45,800 40,650
Other Deductions 6,840 7,042 3,662 (1,032) 3,263
Nonoperating Margin 13,963 14,308 9,080 11,171 5,563
Net Margin $ 24,654 $ 25,058 $ 32,292 $ 42,513 $ 29,388
ELECTRIC UTILITY PLANT
In Service - at Cost $ 2,185,836 $ 2,122,629 $ 2,087,912 $ 2,017,193 $ 1,500,558
Electric Plant Held for Future Use - 44,084 44,084 44,084 44,084
Construction Work in Process 60,968 59,787 36,262 48,001 203,681
Total 2,246,804 2,226,500 2,168,258 2,109,278 1,748,323
Less Accumulated Depreciation 872,389 811,304 751,015 693,689 665,071
Net Utility Plant $ 1,374,415 $ 1,415,196 $ 1,417,243 $ 1,415,589 $ 1,083,252
TOTAL ASSETS $ 1,876,634 $ 2,116,421 $ 1,948,815 $ 1,932,677 $ 1,496,742
TOTAL EQUITY AND PATRONAGE CAPITAL $ 354,633 $ 337,588 $ 312,530 $ 280,238 $ 237,725
ENERGY SOURCES - MWH
Generated 6,983,110 5,237,503 5,040,794 2,755,124 3,281,717
Purchased 6,036,120 7,005,008 5,731,387 7,397,816 7,217,244
Total Available for Sale 13,019,230 12,242,511 10,772,181 10,152,940 10,498,961
ENERGY SALES - MWH
Member Cooperatives 10,086,777 10,257,114 10,166,882 9,837,766 10,165,058
Non-members 2,882,728 1,935,289 409,986 151,795 152,314
Total Sales 12,969,505 12,192,403 10,576,868 9,989,561 10,317,372
Wholesale Rate to Members (mills/Kwh) 78.98 79.28 75.67 77.33 73.85
Total System Coincident Peak Demand (MW) 2,385 2,521 1,998 2,122 2,324
South Mississippi Electric Power AssociationFive-Year Financial Summary
26
Financial Charts
Mill
s per
Kw
h
Wholesale Rate to Members
73.85
75.67
79.28 78.9880.0079.0078.0077.0076.0075.0074.0073.0072.0071.0070.00
77.33
2011 2012 2013 2014 2015
Mill
ions
of M
WH
Sales to Members
12.00
10.00
8.00
6.00
4.00
2.00
2011 2012 2013 2014 2015
10.17 9.84 10.17 10.26 10.09
Mill
s per
Kw
h
Average Cost of Purchased Power
65.00
60.00
55.00
50.00
45.00
40.00
35.00
30.002011 2012 2013 2014 2015
59.9957.59
64.6062.59 63.81
Mill
ions
of D
olla
rs
Total Cost of Purchased Power
440.0
420.0
400.0
380.0
360.0
340.02011 2012 2013 2014 2015
433.0426.1
370.3
438.5
385.5
Mill
s per
Kw
h of
net
Gen
erat
ion
Average Cost of Fuel for Owned Generation
40.00
35.00
30.00
25.00
20.00
15.00
10.002011 2012 2013 2014 2015
38.16 38.67
32.70 33.95
23.22
Mill
ions
of D
olla
rs
Total Cost of Fuel
180.0
160.0
140.0
120.0
100.0
80.0
60.0
40.02011 2012 2013 2014 2015
125.2
106.5
164.8177.8
162.2
27
Independent Auditors’ ReportThe Board of DirectorsSouth Mississippi Electric Power Association:
We have audited the accompanying financial statements of South Mississippi Electric Power Association, which comprise the balance sheets as of December 31, 2015 and 2014, and the related statements of revenues, expenses, and patronage capital, and cash flows for the years then ended, and the related notes to the financial statements.
Management’s Responsibility for the Financial StatementsManagement is responsible for the preparation and fair presentation of these financial statements in accordance with U.S. generally accepted accounting principles; this includes the design, implementation, and maintenance of internal control relevant to the preparation and fair presentation of financial statements that are free from material misstatement, whether due to fraud or error.
Auditors’ ResponsibilityOur responsibility is to express an opinion on these financial statements based on our audits. We conducted our audits in accordance with auditing standards generally accepted in the United States of America. Those standards require that we plan and perform the audit to obtain reasonable assurance about whether the financial statements are free from material misstatement.
An audit involves performing procedures to obtain audit evidence about the amounts and disclosures in the financial statements. The procedures selected depend on the auditors’ judgment, including the assessment of the risks of material misstatement of the financial statements, whether due to fraud or error. In making those risk assessments, the auditor considers internal control relevant to the entity’s preparation and fair presentation of the financial statements in order to design audit procedures that are appropriate in the circumstances, but not for the purpose of expressing an opinion on the effectiveness of the entity’s internal control. Accordingly, we express no such opinion. An audit also includes evaluating the appropriateness ofaccounting policies used and the reasonableness of significant accounting estimates made by management, as well as evaluating the overall presentation of the financial statements.
We believe that the audit evidence we have obtained is sufficient and appropriate to provide a basis for our audit opinion.
OpinionIn our opinion, the financial statements referred to above present fairly in all material respects, the financial position of South Mississippi Electric Power Association as of December 31, 2015 and 2014, and the results of its operations and its cash flows for the years then ended in accordance with U.S. generally accepted accounting principles.
Jackson, MississippiMarch 22, 2016
28
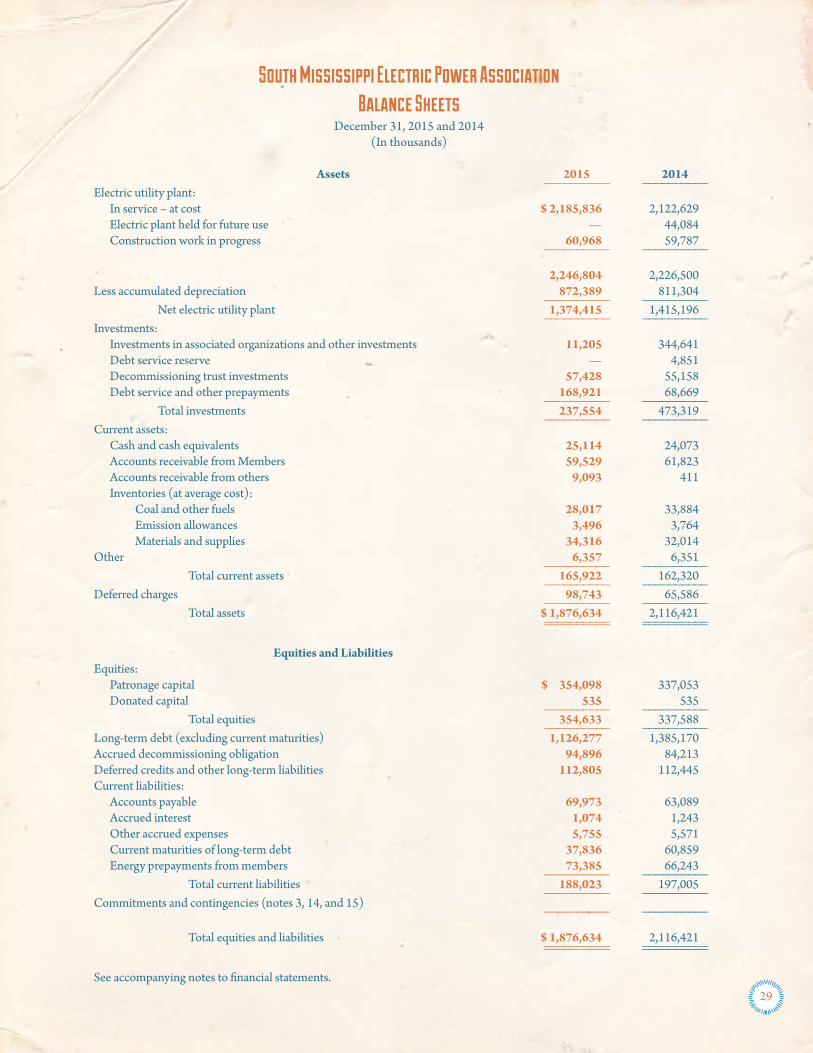
South Mississippi Electric Power AssociationBalance Sheets
December 31, 2015 and 2014(In thousands)
Assets 2015 2014 __________ __________Electric utility plant: In service – at cost $ 2,185,836 2,122,629 Electric plant held for future use — 44,084 Construction work in progress 60,968 59,787 __________ __________
2,246,804 2,226,500Less accumulated depreciation 872,389 811,304 __________ __________ Net electric utility plant 1,374,415 1,415,196 __________ __________Investments: Investments in associated organizations and other investments 11,205 344,641 Debt service reserve — 4,851 Decommissioning trust investments 57,428 55,158 Debt service and other prepayments 168,921 68,669 __________ __________ Total investments 237,554 473,319 __________ __________Current assets: Cash and cash equivalents 25,114 24,073 Accounts receivable from Members 59,529 61,823 Accounts receivable from others 9,093 411 Inventories (at average cost): Coal and other fuels 28,017 33,884 Emission allowances 3,496 3,764 Materials and supplies 34,316 32,014Other 6,357 6,351 __________ __________ Total current assets 165,922 162,320 __________ __________Deferred charges 98,743 65,586 __________ __________ Total assets $ 1,876,634 2,116,421 __________ __________ __________ __________
Equities and LiabilitiesEquities: Patronage capital $ 354,098 337,053 Donated capital 535 535 __________ __________ Total equities 354,633 337,588 __________ __________Long-term debt (excluding current maturities) 1,126,277 1,385,170Accrued decommissioning obligation 94,896 84,213Deferred credits and other long-term liabilities 112,805 112,445Current liabilities: Accounts payable 69,973 63,089 Accrued interest 1,074 1,243 Other accrued expenses 5,755 5,571 Current maturities of long-term debt 37,836 60,859 Energy prepayments from members 73,385 66,243 __________ __________ Total current liabilities 188,023 197,005 __________ __________Commitments and contingencies (notes 3, 14, and 15) __________ __________
Total equities and liabilities $ 1,876,634 2,116,421 __________ __________ __________ __________
See accompanying notes to financial statements.29

South Mississippi Electric Power AssociationStatements of Revenues, Expenses, And Patronage Capital
Years ended December 31, 2015 and 2014(In thousands)
2015 2014 __________ __________Operating revenues: Electric energy revenue from Members $ 757,544 809,956 Other electric energy revenue 82,221 91,179 Other – net 2,222 2,236 __________ __________ Total operating revenues 841,987 903,371 __________ __________Operating expenses: Fuel 162,159 177,824 Production 39,950 39,628 Purchased power 385,516 438,451 Transmission 47,634 44,701 Administrative and general 21,461 17,567 Maintenance expenses: Production 38,492 39,284 Transmission 4,280 3,433 General 6,344 6,042 Depreciation and amortization 66,773 63,874 __________ __________ Total operating expenses 772,609 830,804 __________ __________ Operating margin before interest and other deductions 69,378 72,567Interest and other: Interest, net of amounts capitalized 51,847 54,775 Other 6,840 7,042 __________ __________ Total interest and other 58,687 61,817 __________ __________ Operating margin 10,691 10,750Nonoperating margin: Interest income 12,882 13,489 Other 1,081 819 __________ __________ Total nonoperating margin 13,963 14,308 __________ __________ Net margin 24,654 25,058Patronage capital at beginning of year 337,053 311,995Patronage distributions (7,609) — __________ __________Patronage capital at end of year $ 354,098 337,053 __________ __________ __________ __________
See accompanying notes to financial statements.
30
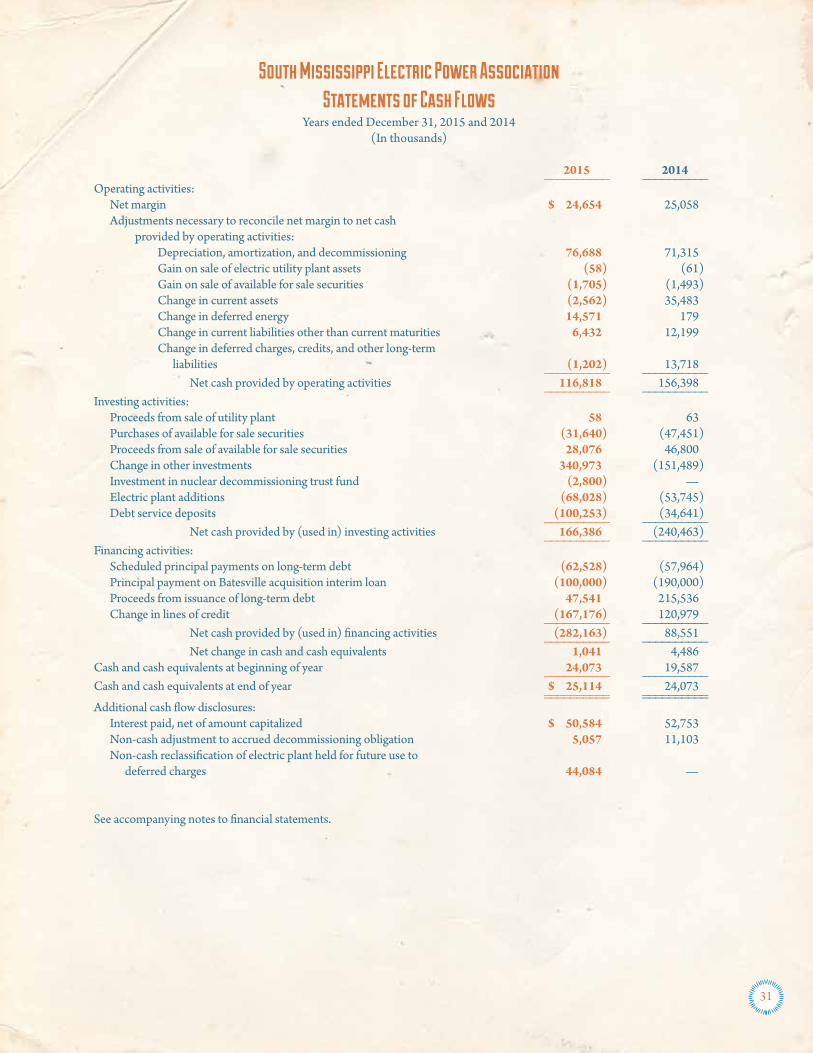
South Mississippi Electric Power AssociationStatements of Cash Flows
Years ended December 31, 2015 and 2014(In thousands)
2015 2014 __________ __________Operating activities: Net margin $ 24,654 25,058 Adjustments necessary to reconcile net margin to net cash provided by operating activities: Depreciation, amortization, and decommissioning 76,688 71,315 Gain on sale of electric utility plant assets (58) (61) Gain on sale of available for sale securities (1,705) (1,493) Change in current assets (2,562) 35,483 Change in deferred energy 14,571 179 Change in current liabilities other than current maturities 6,432 12,199 Change in deferred charges, credits, and other long-term liabilities (1,202) 13,718 __________ __________ Net cash provided by operating activities 116,818 156,398 __________ __________Investing activities: Proceeds from sale of utility plant 58 63 Purchases of available for sale securities (31,640) (47,451) Proceeds from sale of available for sale securities 28,076 46,800 Change in other investments 340,973 (151,489) Investment in nuclear decommissioning trust fund (2,800) — Electric plant additions (68,028) (53,745) Debt service deposits (100,253) (34,641) __________ __________ Net cash provided by (used in) investing activities 166,386 (240,463) __________ __________Financing activities: Scheduled principal payments on long-term debt (62,528) (57,964) Principal payment on Batesville acquisition interim loan (100,000) (190,000) Proceeds from issuance of long-term debt 47,541 215,536 Change in lines of credit (167,176) 120,979 __________ __________ Net cash provided by (used in) financing activities (282,163) 88,551 __________ __________ Net change in cash and cash equivalents 1,041 4,486Cash and cash equivalents at beginning of year 24,073 19,587 __________ __________Cash and cash equivalents at end of year $ 25,114 24,073 __________ __________ __________ __________Additional cash flow disclosures: Interest paid, net of amount capitalized $ 50,584 52,753 Non-cash adjustment to accrued decommissioning obligation 5,057 11,103 Non-cash reclassification of electric plant held for future use to deferred charges 44,084 —
See accompanying notes to financial statements.
31
1) Nature of Operations
South Mississippi Electric Power Association (SME) is a member-owned, not-for-profit electric generation and transmission cooperative that supplies wholesale electricity and other services to its 11 member distribution cooperatives (the Members), which, in turn, provide retail electric service to consumers in certain areas of Mississippi through approximately 423,000 meters. Under long-term wholesale power contracts with each of its Members, SME is obligated to provide all of the power required by the member systems. Financing assistance is provided by the United States Department of Agriculture, Rural Utilities Service (RUS). In addition to being subject to regulation by its own governing board of directors, SME is subject to certain rules and regulations promulgated for rural electric borrowers by RUS. SME maintains its accounting records in accordance with the Federal Energy Regulatory Commission’s (FERC) Chart of Accounts, as modified and adopted by RUS. Revenue is generally recognized when power is delivered to its Members. However, as a regulated utility, the methods of allocating costs and revenue to time periods may differ from those principles generally applied to nonregulated companies.
SME owns a 10% undivided interest in a nuclear generating plant known as Grand Gulf Unit 1 (Grand Gulf). System Energy Resources, Inc. (System Energy), a subsidiary of Entergy Corporation (Entergy), owns the remaining 90%, either outright or through leasehold interests. Entergy Operations, also a subsidiary of Entergy, operates the plant along with other nuclear plants owned by Entergy, subject to owner oversight. Grand Gulf commenced commercial operation on July 1, 1985.
2) Summary of Significant Accounting Principles
a) Electric Utility Plant and Depreciation
Electric utility plant is stated at cost, which includes contract work, materials, and direct labor, allowance for funds used during construction, and allocable overhead costs. The cost of electric generating stations and related facilities also includes costs of training and production incurred, less revenue earned, prior to the date of commercial operation.
Depreciation is provided by straight-line group method for electric utility plant in service at the following annual composite rates:
Nuclear generation plant 2.85% Nonnuclear generation plant .6% to 4.55% Transmission plant 2.75% General plant and transportation equipment 2% to 25%
At the time that units of the electric utility plant are retired, their original cost and cost of removal, less salvage value, are charged to accumulated depreciation. Replacements of the electric utility plant involving less than a designated unit of property are charged to maintenance expense. With the exception of turbine inspections, repair and maintenance costs incurred during a planned major maintenance outage are expensed when incurred. Costs associated with turbine inspections are recorded as regulatory assets and amortized over the periods between inspections.
SME evaluates long-lived assets for impairment when events or changes in circumstances indicate that the carrying value of such assets may not be recoverable, based upon expectations of nondiscounted cash flows and operating income. No impairments were incurred in either 2015 or 2014.
b) Allowance for Funds Used during Construction
SME capitalizes interest on certain significant construction and development projects while the projects are under construction. The interest cost capitalized related to debt specifically borrowed for construction and development projects during construction is reflected as a reduction of interest expense. The imputed interest cost related to construction and development projects funded without specific borrowings during construction is reflected as allowance for funds used during construction. During 2015 and 2014, total interest cost amounted to $53.1 million and $55.8 million, respectively, with $1.3 million and $1.0 million, respectively, capitalized as part of the electric utility plant.
South Mississippi Electric Power AssociationNotes to Financial Statements
December 31, 2015 and 2014
32
c) Cost of Decommissioning Nuclear Plant
SME’s portion of the estimated decommissioning cost of Grand Gulf (see note 3) is charged to operating expenses over the estimated service life of the plant. The current operating license received from the Nuclear Regulatory Commission (NRC) terminates in 2024. In December 2011, the Nuclear Regulatory Commission accepted a License Renewal Application (LRA) for Grand Gulf Unit No. 1 and commenced a process to review the requested extension of the operating license to 2044.
d) Investment Securities
Decommissioning trust investments are categorized as available for sale and are carried at fair value. In 2009, the Board of Directors authorized SME to refund or recover any trust investment gains or losses through future rates. In accordance with the regulatory treatment for such decommissioning trust funds, beginning in 2009, SME records a regulatory asset or liability for the amount of unrealized gains or unrealized losses, respectively.
Debt service reserve and other investments are categorized as held to maturity and are carried on the balance sheet at amortized cost. SME has the intent and ability to hold these securities until their estimated maturities but may sell them under certain circumstances.
The primary components that determine a debt security’s fair value are its coupon rate, maturity, and credit characteristics. When the fair value of a security falls below amortized cost, an evaluation must be made to determine if the unrealized loss is a temporary or other-than-temporary impairment. Securities that are deemed to be other than temporarily impaired are written down to net realizable value by a charge to expense. Premiums and discounts are amortized and accreted to operations using the level yield method, adjusted for prepayments as applicable. Gains and losses on sales of investment securities are computed using the specific identification method.
e) Cash and Cash Equivalents
For purposes of reporting cash flows, all temporary investments with original maturities of three months or less are deemed to be cash equivalents.
f) Inventories
Inventories of fuel and materials and supplies are valued using the rolling weighted average cost method and any inventories that are obsolete or excess are written down to their estimated disposal value.
g) Emission Allowances
In accordance with the Federal Clean Air Interstate Rule (CAIR), promulgated by the EPA, pursuant to the Federal Clean Air Act, SME maintained an allotment of emission allowances. These allowances were carried at cost and included in inventories in the financial statements. Effective January 1, 2015, CAIR was superseded by the Cross-State Air Pollution Rule (CSAPR), thus rendering CAIR emission allowances worthless. Accordingly, in 2014, SME removed the remaining CAIR allowances of approximately $2.0 million from inventory and recorded a regulatory asset that was recovered in rates during the 12-month period ended December 31, 2015 (see note 7). SME maintains an inventory of Sulfur Dioxide Emission allowances for the acid rain program.
h) Regulatory Accounting
SME’s accounting policies include compliance with Accounting Standards Codification (ASC) No. 980, Regulated Operations. Regulatory assets represent probable future reductions in revenues, or increase in expenses, associated with certain items that are expected to be recovered from customers through the ratemaking process. Regulatory liabilities represent probable future revenues associated with amounts that are expected to be credited to customers through the ratemaking process. In the event that SME is no longer able to comply with ASC 980 as the result of a change in regulation or effects of competition, SME would be required to recognize the effects of its regulatory assets and liabilities currently in its statements of revenues, expenses, and patronage capital.
Periodically, the Board of Directors will set a benchmark power cost adjustment rate to be collected from Members in order to more closely match revenues with actual and forecasted fuel and purchased power costs consistent with the cooperative not-for-profit operation of SME. Material variances between these revenues and costs may cause the recognition of deferred credits or deferred charges from one year to the next in accordance with how these revenues and or costs are expected to be recovered or refunded.
Additional details regarding regulatory assets and liabilities are included in notes 7 and 10.
33

i) Patronage Capital
The bylaws of SME provide that any excess of revenues over expenses and accumulated prior-year deficits shall be treated as advances of capital by the Member patrons and credited to them on the basis of their patronage.
j) Income Taxes
SME is exempt from United States income taxes pursuant to Section 501(c)(12) of the Internal Revenue Code, which requires that at least 85% of SME’s gross income be derived from its Members.
k) Derivative Financial Instruments
Derivative and hedge accounting requires that all derivatives be recognized in the balance sheet either as an asset or liability, measured at fair value, unless they meet the normal purchases and sales exemption criteria. Contracts in which SME is effectively hedging the variability of cash flows relate to forecasted natural gas purchases, transmission congestion cost, energy sales into MISO, and interest rates. Any gains or losses resulting from the fair value measurement of natural gas hedges, energy sales, and transmission congestion cost hedges are passed through to Members using the mechanisms of the benchmark power cost adjustment rate. Therefore, these derivative instruments are recorded at fair value in the accompanying balance sheets, along with a corresponding offsetting regulatory asset or liability. See note 11 for the values of the derivatives and the financial statement line item in which the derivatives are reported in the financial statements, and for further disclosure related to the interest rate hedge.
l) Electric Energy Revenues
Revenues are recorded when power is delivered to a Member or Midcontinent Independent System Operator (MISO), a Regional Transmission Organization (RTO). MISO acts as a centralized market in which SME and other MISO participants sell all their energy to MISO and purchase all their energy requirements to serve their load from MISO at market clearing prices. During hours in which SME sells more energy into MISO than purchased from MISO to meet the energy requirements for our 11 member cooperatives, SME recognizes these excess sales, also referred to as net sales, as other electric energy revenues on the statements of revenues, expenses, and patronage capital. Uncollectible accounts have historically been negligible, so SME does not provide an allowance for doubtful accounts.
m) Use of Estimates
The preparation of financial statements in conformity with accounting principles generally accepted in the United States of America requires management to make estimates and assumptions that affect the reported amounts of assets and liabilities and disclosure of contingent assets and liabilities at the date of the financial statements, and the reported amounts of revenues and expenses during the reporting period. Actual results could differ from those estimates.
n) Recently Issued Accounting Standards
During April 2015, the Financial Accounting Standards Board (FASB) issued Accounting Standards Update 2015-03, Simplifying the Presentation of Debt Issuance Costs. SME adopted this new standard retrospectively in 2015. This new standard requires entities to present debt issuance costs in the balance sheet as a direct reduction of debt. Prior to the new standard, debt issuance costs were classified as deferred charges in the assets section of the balance sheet. The amortization period and amortization method for these costs remain unchanged. Long-term debt reported in the balance sheets at December 31, 2015 and 2014 has accordingly been reduced by debt issuance costs of $1.9 million, and $2.2 million, respectively.
o) Bond and Debt Issuance Costs
Bond and debt issue costs are being amortized by the straight-line method, which does not differ materially from the interest method, over the term of the related debt. The amortization during the period of construction is capitalized.
p) Subsequent Events
SME has evaluated subsequent events through March 22, 2016, the date these financial statements were available to be issued.
3) Commitments and Contingencies Regarding Grand Gulf
SME and System Energy are co-licensees and parties to a joint ownership contract that sets forth the rights and obligations of the Grand Gulf owners, with SME generally obligated to pay 10% of all operating and capital costs and entitled to receive 10% of the electricity generated by the plant. SME paid $35.1 million and $38.5 million under the contract in 2015 and 2014, respectively.
34
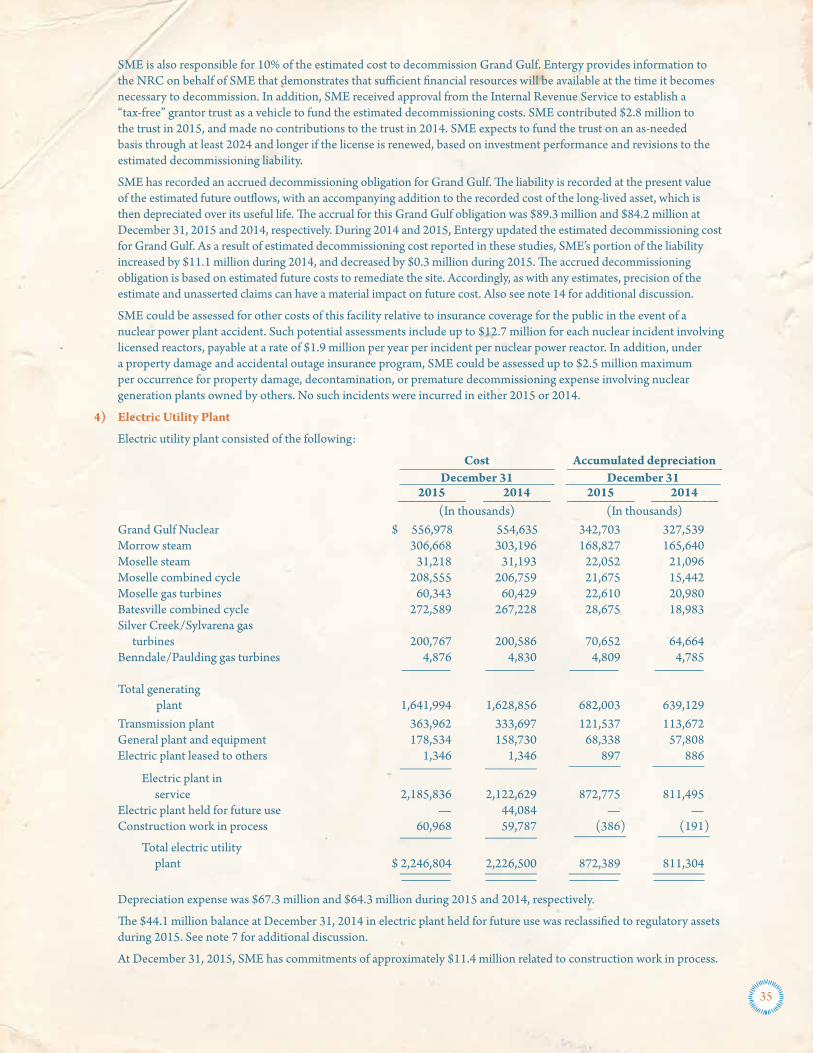
SME is also responsible for 10% of the estimated cost to decommission Grand Gulf. Entergy provides information to the NRC on behalf of SME that demonstrates that sufficient financial resources will be available at the time it becomes necessary to decommission. In addition, SME received approval from the Internal Revenue Service to establish a “tax-free” grantor trust as a vehicle to fund the estimated decommissioning costs. SME contributed $2.8 million to the trust in 2015, and made no contributions to the trust in 2014. SME expects to fund the trust on an as-needed basis through at least 2024 and longer if the license is renewed, based on investment performance and revisions to the estimated decommissioning liability.
SME has recorded an accrued decommissioning obligation for Grand Gulf. The liability is recorded at the present value of the estimated future outflows, with an accompanying addition to the recorded cost of the long-lived asset, which is then depreciated over its useful life. The accrual for this Grand Gulf obligation was $89.3 million and $84.2 million at December 31, 2015 and 2014, respectively. During 2014 and 2015, Entergy updated the estimated decommissioning cost for Grand Gulf. As a result of estimated decommissioning cost reported in these studies, SME’s portion of the liability increased by $11.1 million during 2014, and decreased by $0.3 million during 2015. The accrued decommissioning obligation is based on estimated future costs to remediate the site. Accordingly, as with any estimates, precision of the estimate and unasserted claims can have a material impact on future cost. Also see note 14 for additional discussion.
SME could be assessed for other costs of this facility relative to insurance coverage for the public in the event of a nuclear power plant accident. Such potential assessments include up to $12.7 million for each nuclear incident involving licensed reactors, payable at a rate of $1.9 million per year per incident per nuclear power reactor. In addition, under a property damage and accidental outage insurance program, SME could be assessed up to $2.5 million maximum per occurrence for property damage, decontamination, or premature decommissioning expense involving nuclear generation plants owned by others. No such incidents were incurred in either 2015 or 2014.
4) Electric Utility Plant
Electric utility plant consisted of the following:
Cost Accumulated depreciation _____________________ _____________________ December 31 December 31 _____________________ _____________________ 2015 2014 2015 2014 __________ __________ __________ __________ (In thousands) (In thousands) Grand Gulf Nuclear $ 556,978 554,635 342,703 327,539 Morrow steam 306,668 303,196 168,827 165,640 Moselle steam 31,218 31,193 22,052 21,096 Moselle combined cycle 208,555 206,759 21,675 15,442 Moselle gas turbines 60,343 60,429 22,610 20,980 Batesville combined cycle 272,589 267,228 28,675 18,983 Silver Creek/Sylvarena gas
turbines 200,767 200,586 70,652 64,664 Benndale/Paulding gas turbines 4,876 4,830 4,809 4,785 Total generating
plant 1,641,994 1,628,856 682,003 639,129 Transmission plant 363,962 333,697 121,537 113,672 General plant and equipment 178,534 158,730 68,338 57,808 Electric plant leased to others 1,346 1,346 897 886 _______ _______ _______ _______ Electric plant in
service 2,185,836 2,122,629 872,775 811,495 Electric plant held for future use — 44,084 — — Construction work in process 60,968 59,787 (386) (191) _______ _______ _______ _______ Total electric utility
plant $ 2,246,804 2,226,500 872,389 811,304 _______ _______ _______ _______
Depreciation expense was $67.3 million and $64.3 million during 2015 and 2014, respectively.
The $44.1 million balance at December 31, 2014 in electric plant held for future use was reclassified to regulatory assets during 2015. See note 7 for additional discussion.
At December 31, 2015, SME has commitments of approximately $11.4 million related to construction work in process.
35
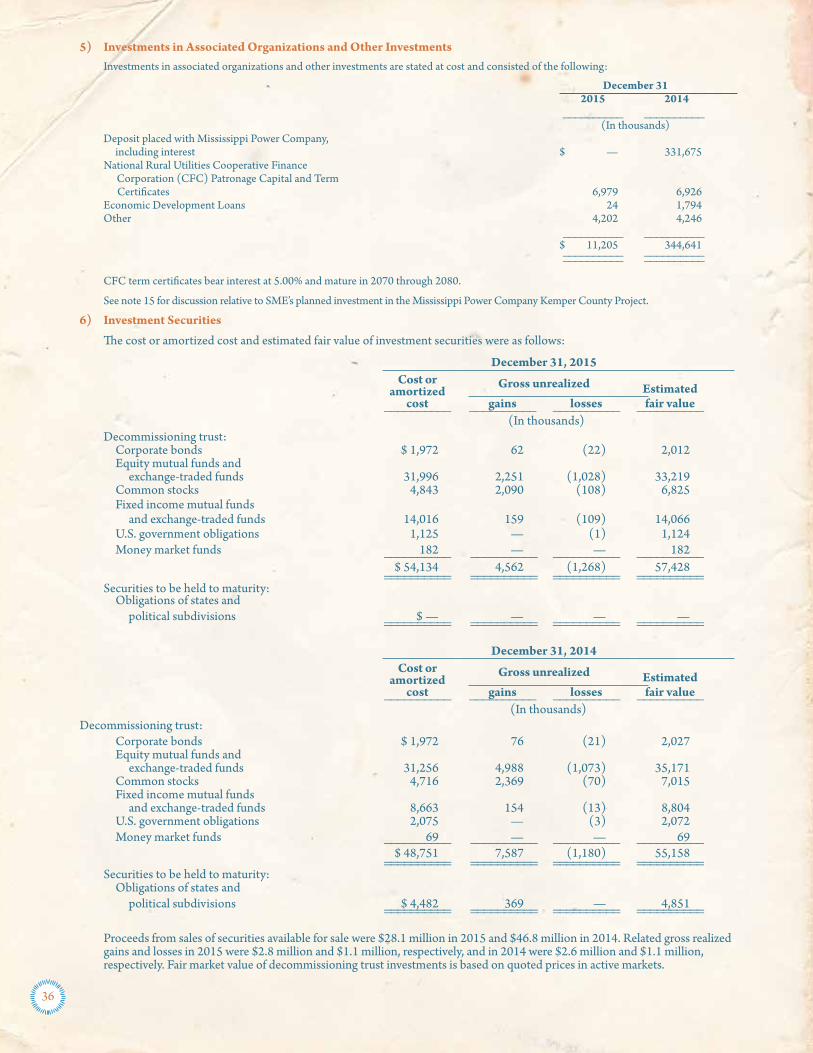
5) Investments in Associated Organizations and Other Investments Investments in associated organizations and other investments are stated at cost and consisted of the following:
December 31 2015 2014 __________ __________ (In thousands) Deposit placed with Mississippi Power Company,
including interest $ — 331,675 National Rural Utilities Cooperative Finance
Corporation (CFC) Patronage Capital and Term Certificates 6,979 6,926
Economic Development Loans 24 1,794 Other 4,202 4,246 __________ __________ $ 11,205 344,641 __________ __________ __________ __________
CFC term certificates bear interest at 5.00% and mature in 2070 through 2080.
See note 15 for discussion relative to SME’s planned investment in the Mississippi Power Company Kemper County Project.
6) Investment Securities
The cost or amortized cost and estimated fair value of investment securities were as follows:
December 31, 2015 Cost or amortized Gross unrealized Estimated cost gains losses fair value __________ __________ __________ __________ (In thousands) Decommissioning trust: Corporate bonds $ 1,972 62 (22) 2,012 Equity mutual funds and exchange-traded funds 31,996 2,251 (1,028) 33,219 Common stocks 4,843 2,090 (108) 6,825 Fixed income mutual funds and exchange-traded funds 14,016 159 (109) 14,066 U.S. government obligations 1,125 — (1) 1,124 Money market funds 182 — — 182 __________ __________ __________ __________ $ 54,134 4,562 (1,268) 57,428 __________ __________ __________ __________ __________ __________ __________ __________ Securities to be held to maturity: Obligations of states and political subdivisions $ — — — — __________ __________ __________ __________ __________ __________ __________ __________ December 31, 2014 Cost or amortized Gross unrealized Estimated cost gains losses fair value __________ __________ __________ __________ (In thousands) Decommissioning trust: Corporate bonds $ 1,972 76 (21) 2,027 Equity mutual funds and exchange-traded funds 31,256 4,988 (1,073) 35,171 Common stocks 4,716 2,369 (70) 7,015 Fixed income mutual funds and exchange-traded funds 8,663 154 (13) 8,804 U.S. government obligations 2,075 — (3) 2,072 Money market funds 69 — — 69 __________ __________ __________ __________ $ 48,751 7,587 (1,180) 55,158 __________ __________ __________ __________ __________ __________ __________ __________ Securities to be held to maturity: Obligations of states and political subdivisions $ 4,482 369 — 4,851 __________ __________ __________ __________ __________ __________ __________ __________
Proceeds from sales of securities available for sale were $28.1 million in 2015 and $46.8 million in 2014. Related gross realized gains and losses in 2015 were $2.8 million and $1.1 million, respectively, and in 2014 were $2.6 million and $1.1 million, respectively. Fair market value of decommissioning trust investments is based on quoted prices in active markets.
36
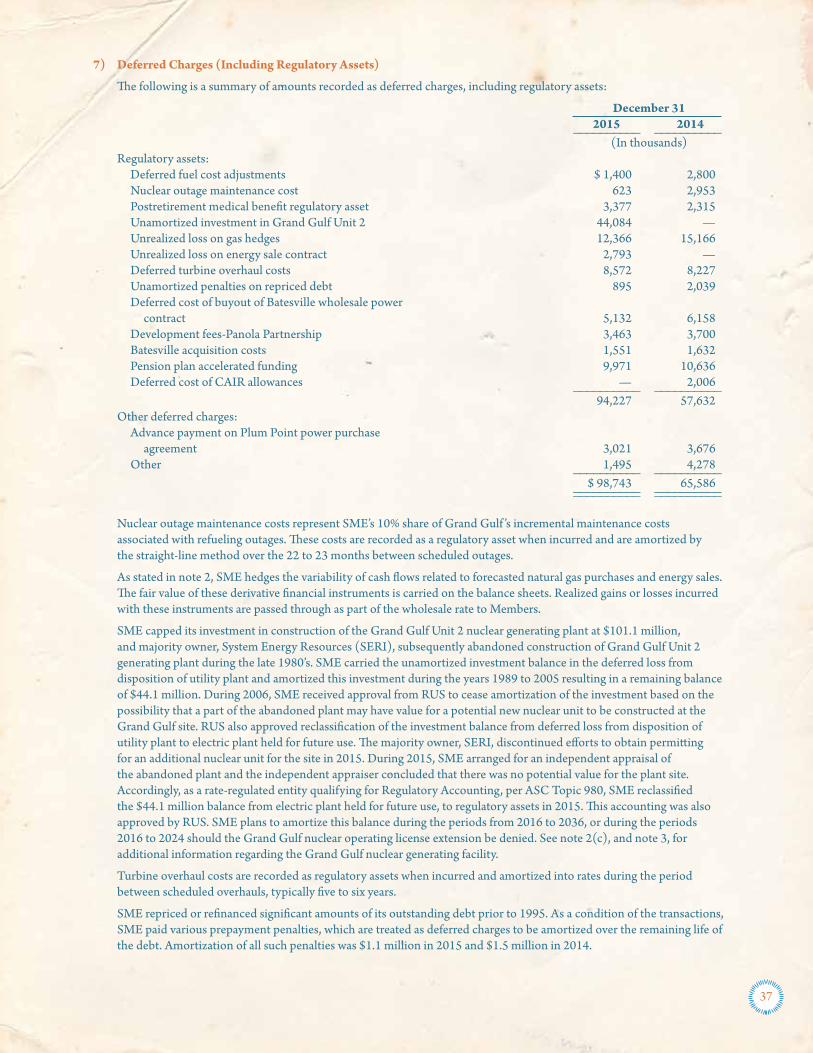
7) Deferred Charges (Including Regulatory Assets)
The following is a summary of amounts recorded as deferred charges, including regulatory assets:
December 31 2015 2014 __________ __________ (In thousands) Regulatory assets: Deferred fuel cost adjustments $ 1,400 2,800 Nuclear outage maintenance cost 623 2,953 Postretirement medical benefit regulatory asset 3,377 2,315 Unamortized investment in Grand Gulf Unit 2 44,084 — Unrealized loss on gas hedges 12,366 15,166 Unrealized loss on energy sale contract 2,793 — Deferred turbine overhaul costs 8,572 8,227 Unamortized penalties on repriced debt 895 2,039 Deferred cost of buyout of Batesville wholesale power contract 5,132 6,158 Development fees-Panola Partnership 3,463 3,700 Batesville acquisition costs 1,551 1,632 Pension plan accelerated funding 9,971 10,636 Deferred cost of CAIR allowances — 2,006 __________ __________ 94,227 57,632 Other deferred charges: Advance payment on Plum Point power purchase agreement 3,021 3,676 Other 1,495 4,278 __________ __________ $ 98,743 65,586 __________ __________ __________ __________
Nuclear outage maintenance costs represent SME’s 10% share of Grand Gulf ’s incremental maintenance costs associated with refueling outages. These costs are recorded as a regulatory asset when incurred and are amortized by the straight-line method over the 22 to 23 months between scheduled outages.
As stated in note 2, SME hedges the variability of cash flows related to forecasted natural gas purchases and energy sales. The fair value of these derivative financial instruments is carried on the balance sheets. Realized gains or losses incurred with these instruments are passed through as part of the wholesale rate to Members.
SME capped its investment in construction of the Grand Gulf Unit 2 nuclear generating plant at $101.1 million, and majority owner, System Energy Resources (SERI), subsequently abandoned construction of Grand Gulf Unit 2 generating plant during the late 1980’s. SME carried the unamortized investment balance in the deferred loss from disposition of utility plant and amortized this investment during the years 1989 to 2005 resulting in a remaining balance of $44.1 million. During 2006, SME received approval from RUS to cease amortization of the investment based on the possibility that a part of the abandoned plant may have value for a potential new nuclear unit to be constructed at the Grand Gulf site. RUS also approved reclassification of the investment balance from deferred loss from disposition of utility plant to electric plant held for future use. The majority owner, SERI, discontinued efforts to obtain permitting for an additional nuclear unit for the site in 2015. During 2015, SME arranged for an independent appraisal of the abandoned plant and the independent appraiser concluded that there was no potential value for the plant site. Accordingly, as a rate-regulated entity qualifying for Regulatory Accounting, per ASC Topic 980, SME reclassified the $44.1 million balance from electric plant held for future use, to regulatory assets in 2015. This accounting was also approved by RUS. SME plans to amortize this balance during the periods from 2016 to 2036, or during the periods 2016 to 2024 should the Grand Gulf nuclear operating license extension be denied. See note 2(c), and note 3, for additional information regarding the Grand Gulf nuclear generating facility.
Turbine overhaul costs are recorded as regulatory assets when incurred and amortized into rates during the period between scheduled overhauls, typically five to six years.
SME repriced or refinanced significant amounts of its outstanding debt prior to 1995. As a condition of the transactions, SME paid various prepayment penalties, which are treated as deferred charges to be amortized over the remaining life of the debt. Amortization of all such penalties was $1.1 million in 2015 and $1.5 million in 2014.
37
In 2005, SME renegotiated its contract for rights to the output of a 279-megawatt gas-fired, combined-cycle combustion turbine-generator located near Batesville, Mississippi. In so doing, SME paid approximately $16.0 million to buy out the remaining 15-year commitment with a wholesale power distributor. During December 2012, SME purchased the Batesville facility. The $16.0 million buy-out payment will continue to be amortized and recovered in rates over the life of the original power purchase contract.
The development fees – Panola Partnership represent fees paid under an inducement agreement and use agreements for the Batesville Generating Facility. The payment will be amortized and recovered in rates over the life of the agreement or the period from December 2013 through July 2031.
The NRECA Board of Directors approved an option to allow participating cooperatives in the Retirement Security (RS) Plan (a defined benefit multiemployer pension plan) to make an accelerated payment and reduce future required contributions. The prepayment amount is a cooperative’s share, as of January 1, 2013, of future contributions required to fund the RS Plan’s unfunded value of benefits earned using the RS’s actuarial valuation assumptions. After making the prepayment, the billing rate was reduced by approximately 25%, retroactive to January 1, 2013. The 25% differential in billing rates is expected to continue for approximately 15 years. However changes in interest rates, asset returns and other plan experience different from that expected, plan assumption changes, and other factors may have an impact on the differential in billing rates and the 15 year period. During February 2013, SME made an $11.9 million payment under this option. In accordance with RUS guidance, the payment is being amortized over an 18 year period based on the difference in the normal Plan retirement age, and average age of the SME workforce.
During 2006, SME paid $3.5 million as a refinancing cost under terms of the Plum Point power purchase agreement; this payment was made in lieu of an increase in the reservation payments associated with power purchased under this contract. During 2008, $0.5 million of preliminary survey costs associated with this power purchase agreement were also recorded as a deferred charge. During 2010, SME paid $6.2 million as its share of costs associated with transmission system interconnections at this facility. These funds will be amortized into rates over the life of the power purchase agreement, which began during 2010 when the related plant came online. During 2011, SME was refunded $2.4 million as transmission service credits relating to payments of the transmission system interconnect cost.
8) Patronage Capital
Patronage capital consisted of the following:
December 31 2015 2014 __________ __________ (In thousands) Cumulative margins $ 367,561 342,907 Less retirements to date 13,463 5,854 __________ __________ $ 354,098 337,053 __________ __________ __________ __________
Under SME’s Indenture of Deed of Trust, Security Agreement and Financing Statement (Indenture), the security document governing first mortgage obligations, the return to Members of contributed capital is not permitted if after giving effect to the distribution SME’s equity would be less than 20% of SME’s total long-term debt and equity. If SME’s equity is at least 20% but less than 30% of total long-term debt and equity, then SME is permitted to distribute to Members up to 35% of the aggregate amount of net margins earned after the date at which the equity to long-term debt and equity first reached 20%. If SME’s equity is more than 30% of long-term debt and equity after giving effect to the distribution there is no restriction on return of capital to Members. Equity of SME represents 23.4% and 18.9% of the aggregate long-term debt and equity at December 31, 2015 and 2014, respectively.
9) Debt
The listing below details SME’s committed unsecured credit agreements:
Unsecured revolving credit agreements Outstanding Commitment balance as of Amount 12/31/2015 Expiration Date ___________ ___________ ____________________ (In thousands) Trustmark National Bank (TNB) $ 25,000 3,112 July 1, 2017 BancorpSouth 20,000 — September 30, 2017 Syndicated Line of Credit 300,000 — September 30, 2019 ___________ ___________ Total $ 345,000 3,112 ___________ ___________ ___________ ___________
38
These revolving credit agreements bear interest at variable rates generally based on LIBOR or Prime. At December 31, 2015, $3.1 million was outstanding under the revolving credit agreements at variable interest rates.
SME also has a $25.0 million letter of credit facility with National Rural Utilities Cooperative Finance Corporation (CFC). At December 31, 2015, there was $17.5 million outstanding under this facility. A $10.5 million letter of credit is utilized to satisfy security requirements of the Plum Point purchased power agreement, and a $7.0 million letter of credit is utilized as financial security for certain transactions with MISO.
Long-term debt consisted of the following:
December 31 2015 2014 __________ __________ (In thousands) Mortgage notes payable in quarterly installments to Federal Financing Bank (FFB) at interest rates varying from 2.208% to 9.602%, through 2050 $ 962,920 964,244 Mortgage notes payable in quarterly installments to CFC (2.9% at December 31, 2015 and 3.0% at December 31, 2014), maturing in 2022 1,757 2,014 RUS mortgage notes payable in monthly or quarterly installments (5% to 5.75%), maturing in 2015 through 2030 6,929 8,116 RUS Economic Development notes payable in monthly installments at 0%; repaid in 2015 — 1,759 Mortgage notes payable in quarterly installments to CoBank (3.25% at December 31, 2015 and 2014), maturing in 2022 706 803 1985 Series G Claiborne County, Mississippi, Pollution Control Bonds, variable interest rates (0.35% at December 31, 2014); repaid in 2015 — 4,445 2009 Gulf Opportunity Zone Bonds, fixed interest to maturity, annual sinking fund payments commence 2011, maturing 2024 and 2037, 4.70%, and 5.0%, respectively 35,430 36,420 First Mortgage Bonds, Series 2010A Bonds – $38.2 million at 4.08%, maturing December 9, 2030, $108.0 million at 5.40%, maturing December 9, 2040 146,176 150,000 Bancorp South revolving line of credit, matures September 2017, variable interest rate(1) — 20,000 Trustmark National Bank revolving line of credit, matures July 2017, variable interest rate(1) 3,112 20,288 Syndicated line of credit, matures September 2019, variable interest rates(1) — 130,000 CoBank note payable in quarterly installments maturing in 2023, fixed interest rate(1) 9,036 10,141 CoBank note, matures November 20, 2016, variable interest rate(1); repaid in 2015 — 50,000 CFC note payable maturing in November 2016, fixed interest rate; repaid in 2015(1) — 50,000 __________ __________ 1,166,066 1,448,230 Less debt issuance cost 1,953 2,201 Less current maturities 37,836 60,859 __________ __________ Long-term debt (excluding current maturities) $ 1,126,277 1,385,170
(1) Denotes an unsecured agreement.
39
In 2011, funding became available for one FFB loan guaranteed by RUS in an amount of $267.4 million, for capital expenditures. The remaining unadvanced commitment was $35.4 million and $44.9 million as of December 31, 2015 and 2014, respectively. In 2013, funding became available for another FFB loan guaranteed by RUS in an amount of $90.9 million, for capital expenditures. The remaining unadvanced commitment was $8.4 million and $21.4 million as of December 31, 2015 and 2014, respectively. In 2014, funding became available for another FFB loan guaranteed by RUS in the amount of $181.8 million. Proceeds from this loan were utilized to repay a portion of interim debt incurred in connection with the purchase of the Batesville generating station in December 2012. During 2015, funding became available for another FFB loan guaranteed by RUS in the amount of $54.3 million, for capital expenditures. The remaining unadvanced commitment was $29.3 million at December 31, 2015. Substantially all assets of SME are pledged as collateral for long-term debt that is secured under the Indenture agreement.
Approximate annual maturities (scheduled periodic principal payments) of long-term debt for the next five years are as follows (in thousands):
2016 $ 37,836 2017 46,739 2018 53,226 2019 43,203 2020 44,249
SME is required by debt compliance covenants to maintain certain levels of patronage capital, maintain certain financial ratios of interest coverage and annual debt service coverage, and to limit the amount of unsecured indebtedness. SME’s management believes they were in compliance with such requirements at December 31, 2015 and 2014.
10) Deferred Credits and Other Long-Term Liabilities (Including Regulatory Liabilities)
The following is a summary of deferred credits and other long-term liabilities, including regulatory liabilities:
December 31 2015 2014 __________ __________ (In thousands) Regulatory liabilities: Regulatory liability for deferred revenue from power cost adjustments $ 31,892 12,821 Power Supply Development Fund 35,000 25,000 Amortization and Depreciation Fund 10,000 — Unrealized gain on Decommissioning Trust 3,418 7,257 __________ __________ 80,310 45,078
Other deferred credits and long-term liabilities: Liability for clean air (CAIR) permits utilized — 265 Natural gas hedge liability 11,767 14,400 Energy sales hedge liability 2,793 — Reserve for economic development contributions 3,460 3,646 Unrealized gain transmission congestion hedge 173 408 Medical insurance claim funding 2,564 2,857 Capital lease 1,105 1,191 Postretirement benefit obligation (other than pensions) 10,633 8,953 Deferred interest income-Mississippi Power deposit — 35,647 __________ __________ $ 112,805 112,445 __________ __________ __________ __________
The liability in 2014 for deferred revenue from power cost adjustments of $12.8 million was collected from Members during 2014 and recognized as revenue in 2015. Accordingly, the $31.9 million liability recorded in 2015 represents amounts collected from Members during 2015 and is expected to be recognized as revenue in 2016 and 2017.
The Power Supply Development Fund (PSDF) was created by the Board of Directors in 2009 with a Board Resolution. The fund was established to facilitate the funding of future capital projects needed to supply the increasing requirements
40
of Members with additional generation sources and to comply with changes in environmental regulation. The initial $25.0 million regulatory liability for the PSDF was collected from Members in 2010. An additional $10.0 million collected from members during 2015 was deposited in the fund. The PSDF is expected to be recognized as costs associated with large generation and environmental projects impact rates are incurred in future periods.
The $10.0 million liability for the Amortization and Depreciation Fund represents amounts collected from Members during 2015 and is expected to be fully accreted into revenue no later than year 2036. This fund, created by the Board of Directors, will offset expenses related to the amortization of the investment in Grand Gulf Unit II.
See notes 2(k) and 11(a) for additional information regarding accounting for natural gas and energy sale hedges.
See note 15 for additional discussion relative to interest due SME on the Mississippi Power Deposit. The 2014 deferred interest income represented interest payable to SME that was the differential between Mississippi Power Company’s cost of capital, and SME’s cost of capital. Since payment of this deferred interest, per terms of the agreement, was contingent upon SME closing the transaction to purchase 15% of the integrated gasification combined cycle (IGCC) generating facility in Kemper County, Mississippi, interest was recorded as a deferred credit.
During 2009, the SME Board authorized transfer of the balance of unrealized gains and losses in the Grand Gulf Decommissioning Trust Fund from the equity section of the balance sheet to the regulatory liability or asset section of the balance sheet. The balance in the regulatory account will be amortized into rates over the remaining license life of Grand Gulf. The initial transfer into the regulatory asset account during 2009 amounted to approximately $ 8.0 million, with $0.7 million and $0.7 million amortized into 2015 and 2014 rates, respectively.
11) Financial Instruments
a) Derivative Financial Instruments
SME enters into financial hedging arrangements for natural gas used in owned and contracted generating units. SME enters into these hedging arrangements to lessen the impact of natural gas price fluctuations on the cost of service. Under terms of the four agreements, SME is allowed credit exposures of up to $115.0 million. Physical purchases, actual natural gas usage, and financial hedge positions are considered when calculating amounts due to the counterparty. At December 31, 2015 and 2014, approximately $11.8 million and $14.4 million, respectively, of financial hedges were in a net liability position based on the fair value of the derivative. At December 31, 2015 and 2014, SME had posted no collateral with a counterparty.
As of December 31, 2015, SME has acquired financial hedges to cover approximately 34% of forecasted natural gas consumption for 2016, and 40% of forecasted natural gas consumption for 2017. Additionally, SME has acquired financial hedges to cover approximately 11%, 10%, and 11%, respectively, of forecasted natural gas consumption for years 2018, 2019 and 2020.
During August 2015, in an attempt to normalize revenues earned from SME generating units in the MISO energy market, SME entered into a financial option electricity contract with NextEra Energy Power Marketing, LLC. The agreement expires May 31, 2016. At December 31, 2015, approximately $2.8 million of the hedge was in a net liability position based on the fair value of the derivative.
During 2009, pursuant to the bankruptcy of Lehman Brothers Special Financing, Inc., and the reissue of the Gulf Opportunity Zone Bonds, the SME Board determined it in the best interest of SME to take steps to terminate the Series 2007 swap agreement for the bonds. This hedge was originally entered into in order to hedge interest rate fluctuations for the aforementioned debt. Accordingly, SME accrued a $4.0 million charge in 2009. This charge was included as interest expense in 2009. SME is continuing to negotiate with the bankruptcy trustee regarding the final settlement of this agreement. While the settlement amount is in dispute, based on the information available at this time, SME has no evidence that the $4 million liability recorded during 2009 has materially changed, and this recorded amount represents management’s best estimate of this liability at December 31, 2015 and 2014.
41
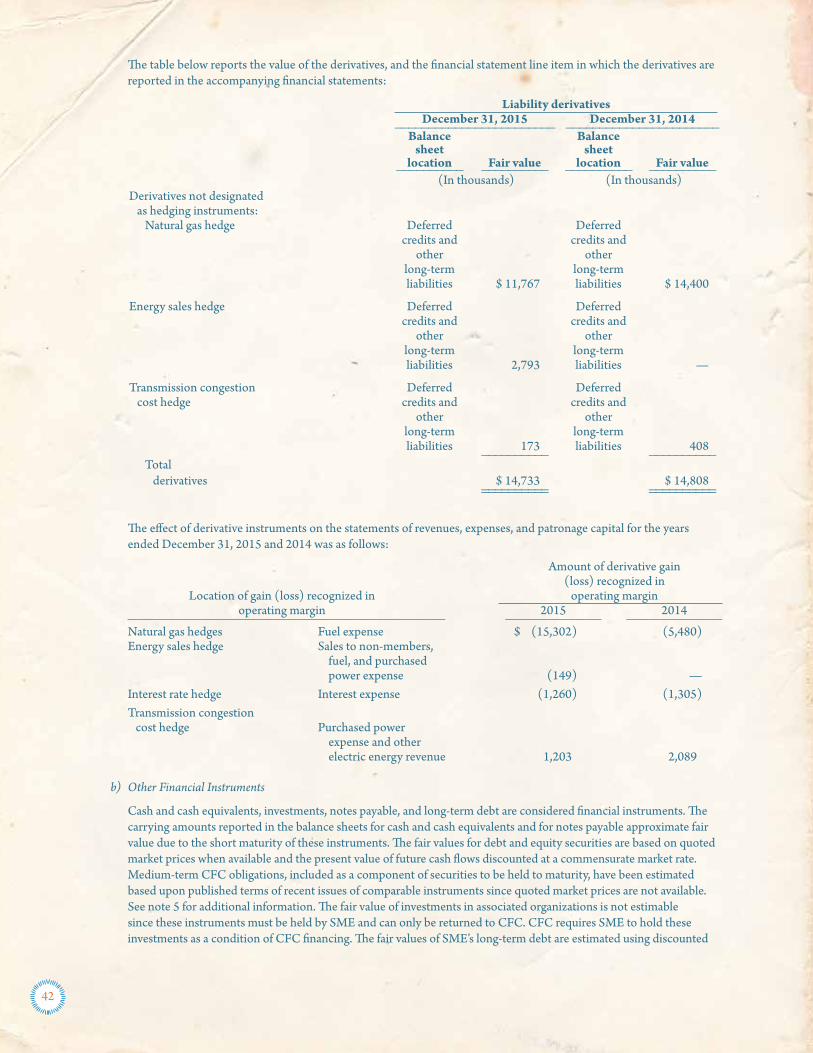
The table below reports the value of the derivatives, and the financial statement line item in which the derivatives are reported in the accompanying financial statements:
Liability derivatives December 31, 2015 December 31, 2014 ________________________ _______________________ Balance Balance sheet sheet location Fair value location Fair value __________ __________ __________ __________ (In thousands) (In thousands) Derivatives not designated as hedging instruments: Natural gas hedge Deferred Deferred credits and credits and other other long-term long-term liabilities $ 11,767 liabilities $ 14,400
Energy sales hedge Deferred Deferred credits and credits and other other long-term long-term liabilities 2,793 liabilities —
Transmission congestion Deferred Deferred cost hedge credits and credits and other other long-term long-term liabilities 173 liabilities 408 __________ __________ Total derivatives $ 14,733 $ 14,808 __________ __________ __________ __________
The effect of derivative instruments on the statements of revenues, expenses, and patronage capital for the years ended December 31, 2015 and 2014 was as follows:
Amount of derivative gain (loss) recognized in Location of gain (loss) recognized in operating margin operating margin 2015 2014 ___________________________________________ _____________ _____________ Natural gas hedges Fuel expense $ (15,302) (5,480) Energy sales hedge Sales to non-members, fuel, and purchased power expense (149) — Interest rate hedge Interest expense (1,260) (1,305) Transmission congestion cost hedge Purchased power expense and other electric energy revenue 1,203 2,089
b) Other Financial Instruments
Cash and cash equivalents, investments, notes payable, and long-term debt are considered financial instruments. The carrying amounts reported in the balance sheets for cash and cash equivalents and for notes payable approximate fair value due to the short maturity of these instruments. The fair values for debt and equity securities are based on quoted market prices when available and the present value of future cash flows discounted at a commensurate market rate. Medium-term CFC obligations, included as a component of securities to be held to maturity, have been estimated based upon published terms of recent issues of comparable instruments since quoted market prices are not available. See note 5 for additional information. The fair value of investments in associated organizations is not estimable since these instruments must be held by SME and can only be returned to CFC. CFC requires SME to hold these investments as a condition of CFC financing. The fair values of SME’s long-term debt are estimated using discounted
42
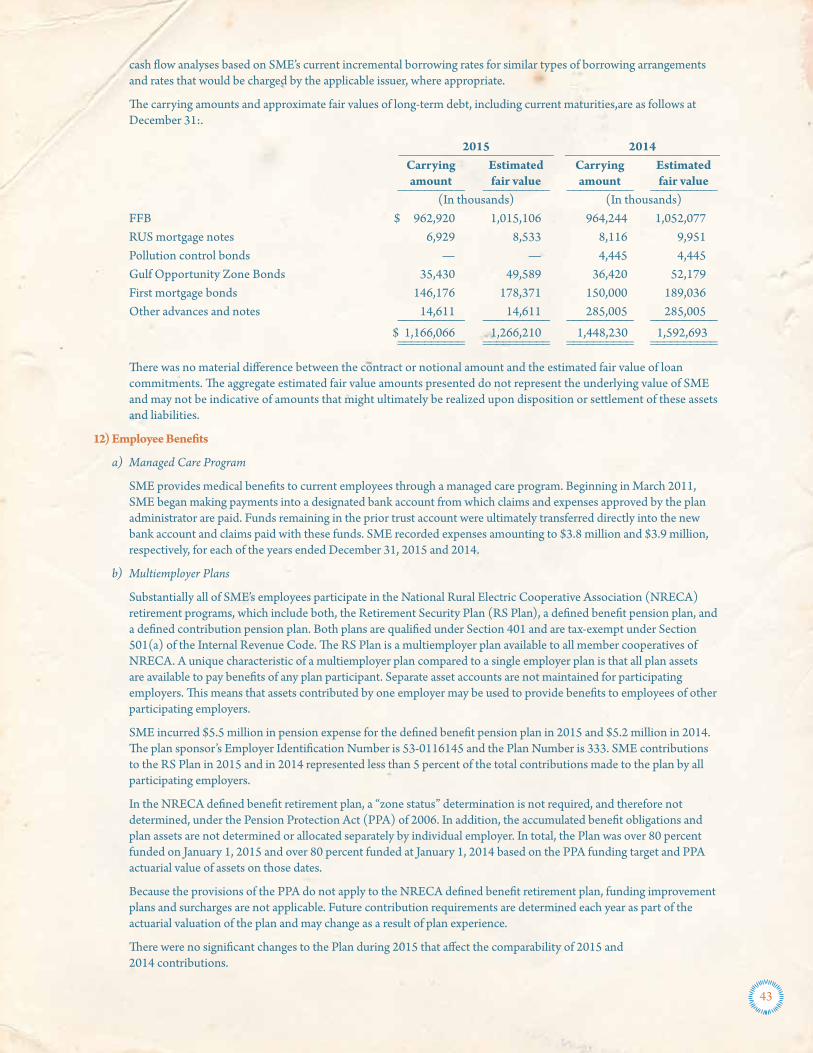
cash flow analyses based on SME’s current incremental borrowing rates for similar types of borrowing arrangements and rates that would be charged by the applicable issuer, where appropriate.
The carrying amounts and approximate fair values of long-term debt, including current maturities,are as follows at December 31:.
2015 2014 _____________________ _____________________ Carrying Estimated Carrying Estimated amount fair value amount fair value __________ __________ __________ __________ (In thousands) (In thousands) FFB $ 962,920 1,015,106 964,244 1,052,077 RUS mortgage notes 6,929 8,533 8,116 9,951 Pollution control bonds — — 4,445 4,445 Gulf Opportunity Zone Bonds 35,430 49,589 36,420 52,179 First mortgage bonds 146,176 178,371 150,000 189,036 Other advances and notes 14,611 14,611 285,005 285,005 __________ __________ __________ __________ $ 1,166,066 1,266,210 1,448,230 1,592,693 __________ __________ __________ __________ __________ __________ __________ __________
There was no material difference between the contract or notional amount and the estimated fair value of loan commitments. The aggregate estimated fair value amounts presented do not represent the underlying value of SME and may not be indicative of amounts that might ultimately be realized upon disposition or settlement of these assets and liabilities.
12) Employee Benefits
a) Managed Care Program
SME provides medical benefits to current employees through a managed care program. Beginning in March 2011, SME began making payments into a designated bank account from which claims and expenses approved by the plan administrator are paid. Funds remaining in the prior trust account were ultimately transferred directly into the new bank account and claims paid with these funds. SME recorded expenses amounting to $3.8 million and $3.9 million, respectively, for each of the years ended December 31, 2015 and 2014.
b) Multiemployer Plans
Substantially all of SME’s employees participate in the National Rural Electric Cooperative Association (NRECA) retirement programs, which include both, the Retirement Security Plan (RS Plan), a defined benefit pension plan, and a defined contribution pension plan. Both plans are qualified under Section 401 and are tax-exempt under Section 501(a) of the Internal Revenue Code. The RS Plan is a multiemployer plan available to all member cooperatives of NRECA. A unique characteristic of a multiemployer plan compared to a single employer plan is that all plan assets are available to pay benefits of any plan participant. Separate asset accounts are not maintained for participating employers. This means that assets contributed by one employer may be used to provide benefits to employees of other participating employers.
SME incurred $5.5 million in pension expense for the defined benefit pension plan in 2015 and $5.2 million in 2014. The plan sponsor’s Employer Identification Number is 53-0116145 and the Plan Number is 333. SME contributions to the RS Plan in 2015 and in 2014 represented less than 5 percent of the total contributions made to the plan by all participating employers.
In the NRECA defined benefit retirement plan, a “zone status” determination is not required, and therefore not determined, under the Pension Protection Act (PPA) of 2006. In addition, the accumulated benefit obligations and plan assets are not determined or allocated separately by individual employer. In total, the Plan was over 80 percent funded on January 1, 2015 and over 80 percent funded at January 1, 2014 based on the PPA funding target and PPA actuarial value of assets on those dates.
Because the provisions of the PPA do not apply to the NRECA defined benefit retirement plan, funding improvement plans and surcharges are not applicable. Future contribution requirements are determined each year as part of the actuarial valuation of the plan and may change as a result of plan experience.
There were no significant changes to the Plan during 2015 that affect the comparability of 2015 and 2014 contributions.
43
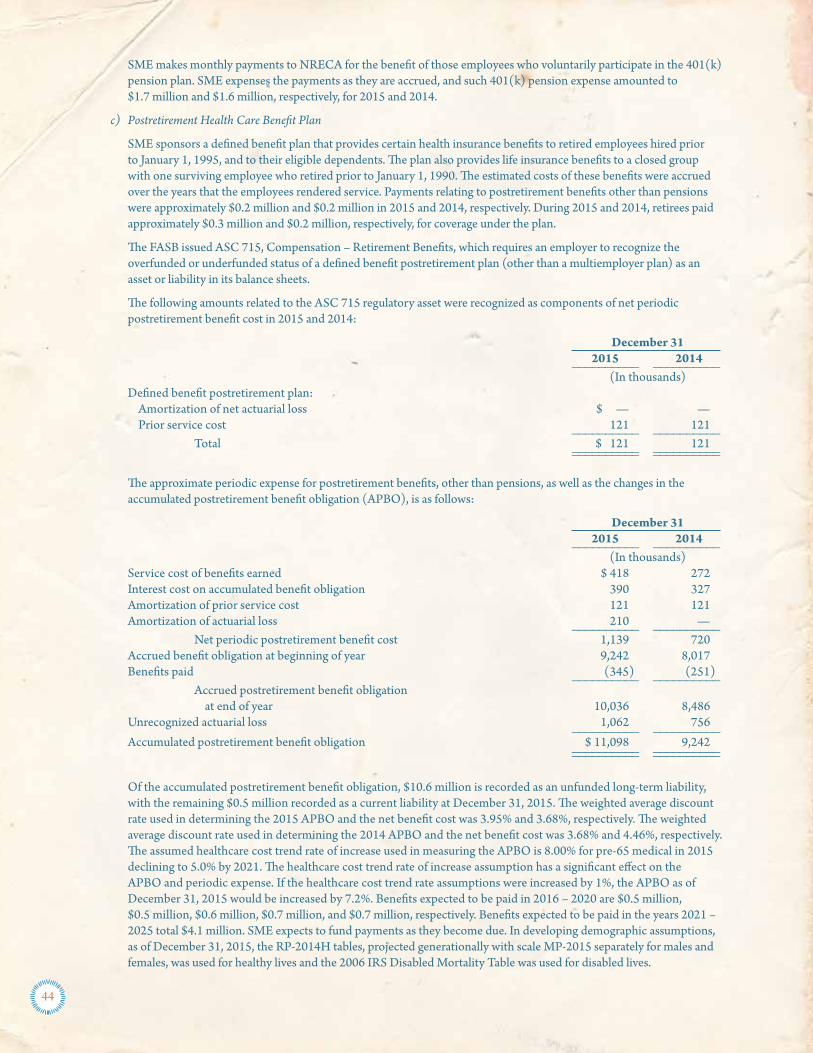
SME makes monthly payments to NRECA for the benefit of those employees who voluntarily participate in the 401(k) pension plan. SME expenses the payments as they are accrued, and such 401(k) pension expense amounted to $1.7 million and $1.6 million, respectively, for 2015 and 2014.
c) Postretirement Health Care Benefit Plan
SME sponsors a defined benefit plan that provides certain health insurance benefits to retired employees hired prior to January 1, 1995, and to their eligible dependents. The plan also provides life insurance benefits to a closed group with one surviving employee who retired prior to January 1, 1990. The estimated costs of these benefits were accrued over the years that the employees rendered service. Payments relating to postretirement benefits other than pensions were approximately $0.2 million and $0.2 million in 2015 and 2014, respectively. During 2015 and 2014, retirees paid approximately $0.3 million and $0.2 million, respectively, for coverage under the plan.
The FASB issued ASC 715, Compensation – Retirement Benefits, which requires an employer to recognize the overfunded or underfunded status of a defined benefit postretirement plan (other than a multiemployer plan) as an asset or liability in its balance sheets.
The following amounts related to the ASC 715 regulatory asset were recognized as components of net periodic postretirement benefit cost in 2015 and 2014:
December 31 2015 2014 __________ __________ (In thousands)
Defined benefit postretirement plan: Amortization of net actuarial loss $ — — Prior service cost 121 121 __________ __________ Total $ 121 121 __________ __________ __________ __________
The approximate periodic expense for postretirement benefits, other than pensions, as well as the changes in the accumulated postretirement benefit obligation (APBO), is as follows:
December 31 2015 2014 __________ __________ (In thousands)
Service cost of benefits earned $ 418 272 Interest cost on accumulated benefit obligation 390 327 Amortization of prior service cost 121 121 Amortization of actuarial loss 210 — __________ __________ Net periodic postretirement benefit cost 1,139 720 Accrued benefit obligation at beginning of year 9,242 8,017 Benefits paid (345) (251) __________ __________ Accrued postretirement benefit obligation at end of year 10,036 8,486 Unrecognized actuarial loss 1,062 756 __________ __________ Accumulated postretirement benefit obligation $ 11,098 9,242 __________ __________ __________ __________
Of the accumulated postretirement benefit obligation, $10.6 million is recorded as an unfunded long-term liability, with the remaining $0.5 million recorded as a current liability at December 31, 2015. The weighted average discount rate used in determining the 2015 APBO and the net benefit cost was 3.95% and 3.68%, respectively. The weighted average discount rate used in determining the 2014 APBO and the net benefit cost was 3.68% and 4.46%, respectively. The assumed healthcare cost trend rate of increase used in measuring the APBO is 8.00% for pre-65 medical in 2015 declining to 5.0% by 2021. The healthcare cost trend rate of increase assumption has a significant effect on the APBO and periodic expense. If the healthcare cost trend rate assumptions were increased by 1%, the APBO as of December 31, 2015 would be increased by 7.2%. Benefits expected to be paid in 2016 – 2020 are $0.5 million, $0.5 million, $0.6 million, $0.7 million, and $0.7 million, respectively. Benefits expected to be paid in the years 2021 – 2025 total $4.1 million. SME expects to fund payments as they become due. In developing demographic assumptions, as of December 31, 2015, the RP-2014H tables, projected generationally with scale MP-2015 separately for males and females, was used for healthy lives and the 2006 IRS Disabled Mortality Table was used for disabled lives.
44
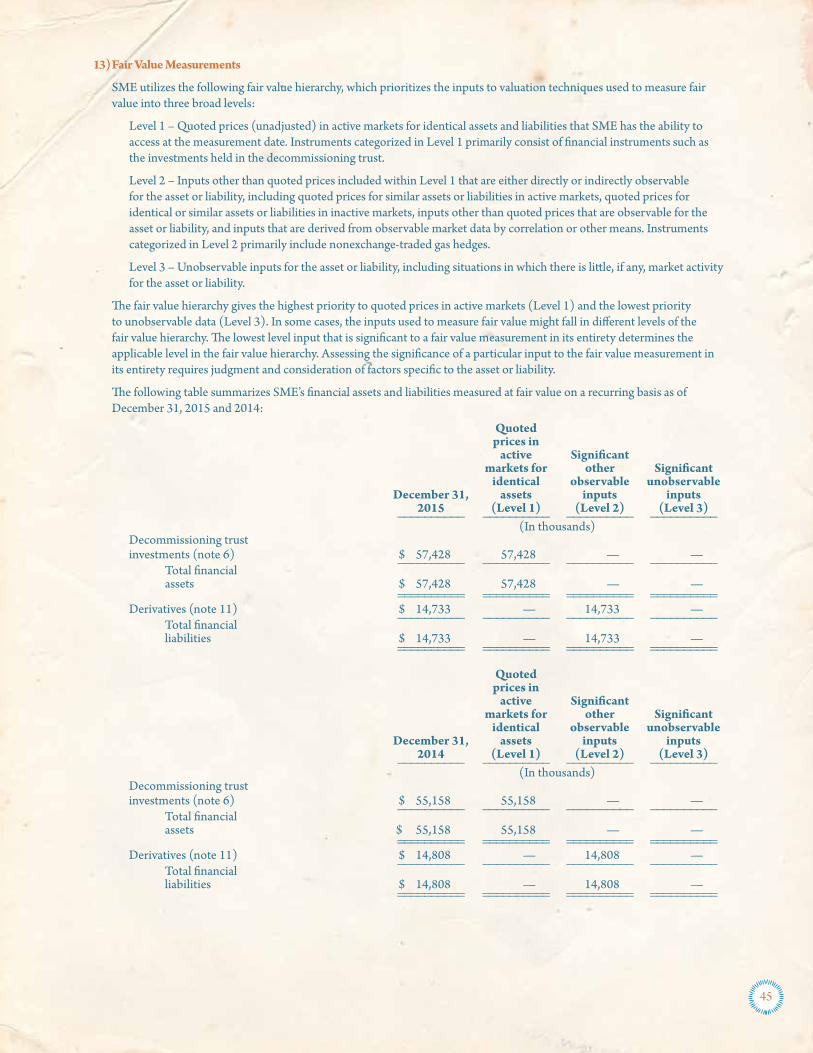
13) Fair Value Measurements
SME utilizes the following fair value hierarchy, which prioritizes the inputs to valuation techniques used to measure fair value into three broad levels:
Level 1 – Quoted prices (unadjusted) in active markets for identical assets and liabilities that SME has the ability to access at the measurement date. Instruments categorized in Level 1 primarily consist of financial instruments such as the investments held in the decommissioning trust.
Level 2 – Inputs other than quoted prices included within Level 1 that are either directly or indirectly observable for the asset or liability, including quoted prices for similar assets or liabilities in active markets, quoted prices for identical or similar assets or liabilities in inactive markets, inputs other than quoted prices that are observable for the asset or liability, and inputs that are derived from observable market data by correlation or other means. Instruments categorized in Level 2 primarily include nonexchange-traded gas hedges.
Level 3 – Unobservable inputs for the asset or liability, including situations in which there is little, if any, market activity for the asset or liability.
The fair value hierarchy gives the highest priority to quoted prices in active markets (Level 1) and the lowest priority to unobservable data (Level 3). In some cases, the inputs used to measure fair value might fall in different levels of the fair value hierarchy. The lowest level input that is significant to a fair value measurement in its entirety determines the applicable level in the fair value hierarchy. Assessing the significance of a particular input to the fair value measurement in its entirety requires judgment and consideration of factors specific to the asset or liability.
The following table summarizes SME’s financial assets and liabilities measured at fair value on a recurring basis as of December 31, 2015 and 2014:
Quoted prices in active Significant markets for other Significant identical observable unobservable December 31, assets inputs inputs 2015 (Level 1) (Level 2) (Level 3) __________ __________ __________ __________ (In thousands) Decommissioning trust investments (note 6) $ 57,428 57,428 — — __________ __________ __________ __________ Total financial assets $ 57,428 57,428 — — __________ __________ __________ __________ __________ __________ __________ __________ Derivatives (note 11) $ 14,733 — 14,733 — __________ __________ __________ __________ Total financial liabilities $ 14,733 — 14,733 — __________ __________ __________ __________ __________ __________ __________ __________
Quoted prices in active Significant markets for other Significant identical observable unobservable December 31, assets inputs inputs 2014 (Level 1) (Level 2) (Level 3) __________ __________ __________ __________ (In thousands) Decommissioning trust investments (note 6) $ 55,158 55,158 — — __________ __________ __________ __________ Total financial assets $ 55,158 55,158 — — __________ __________ __________ __________ __________ __________ __________ __________ Derivatives (note 11) $ 14,808 — 14,808 — __________ __________ __________ __________ Total financial liabilities $ 14,808 — 14,808 — __________ __________ __________ __________ __________ __________ __________ __________
45
14) Asset Retirement Obligations
Asset retirement obligations represent legal obligations associated with retirement of tangible long-lived assets. These amounts, recorded in the liabilities section of the balance sheet, are developed utilizing estimated closure, and post-closure monitoring, costs, adjusted for inflation, and discounted utilizing a credit-adjusted, risk-free interest rate. An accompanying addition to the recorded cost of the long-lived asset is recorded and depreciated over its useful life.
As discussed in note 3, SME is responsible for 10% of costs to decommission the Grand Gulf nuclear generating facility.
During April 2015, the disposal of Coal Combustion Residuals (CCR) from Electric Utilities final rule was published in the Federal Register. The rule establishes a set of requirements for disposal of CCRs, commonly known as coal ash. Accordingly, during 2015, SME recorded an asset retirement obligation in the amount of $5.3 million for the coal ash landfill at Plant Morrow.
A reconciliation of the beginning and ending aggregate carrying amount of the asset retirement obligations as of December 31, 2015 and 2014, follows (in thousands):
2015 2014 __________ __________ Balance - beginning of year $ 84,213 68,462 New obligations incurred 5,336 —Revisions to estimated cash flows (279) 11,103Accretion expense 5,626 4,648 __________ __________ Balance - end of year $ 94,896 84,213 __________ __________ __________ __________
15) Commitments and Contingencies
In the normal course of business, SME has entered into contractual commitments for coal transportation that extend through the year 2019 and for purchased power that extend through the year 2040. All such contractual costs are expected to be recovered through normal operating revenue.
SME uses natural gas as the fuel for several of its generating units and also purchases power from others that use natural gas as fuel. A portion of natural gas purchases are subject to short-term changes in the market price for gas, and such market prices are quite volatile. In the normal course of operations, SME enters into forward purchase commitments for certain over-the-counter financial swap contracts that extend through the year 2016. All such commitments are expected to be recovered through normal operating revenue.
On July 31, 2006, SME entered into a 30-year power purchase agreement with Plum Point Energy Associates (Plum Point) for the purchase of 200 megawatts of capacity and associated energy out of a nominal 665-megawatt coal-fired electric generation facility that was constructed by Plum Point in Mississippi County, Arkansas. A capacity charge began in 2010 and escalates annually through the initial 30-year term that began on the commercial operation date, which was September 1, 2010. At the end of the initial term, SME has options to extend the contract an additional 10 years at a reduced charge or to purchase 200 megawatts at the then-market value.
On July 27, 2010, SME entered into an agreement with Mississippi Power Company (MPC), and as subsequently amended, whereby SME acquired the right to purchase an undivided 15% ownership interest in an integrated gasification combined cycle (IGCC) generating facility to be located in Kemper County, Mississippi. The closing of this transaction was conditioned upon certain conditions precedent, including but not limited to, the successful negotiation and execution of a joint ownership and operating agreement, receipt of all construction permits and government approvals, SME financing, an independent engineer report acceptable to SME, and transmission and interconnection arrangements acceptable to SME. SME was not obligated to fund any project costs until closing. Per data provided by MPC, assuming closing occurred on March 31, 2016, SME’s total investment, including initial working capital and spares, would have been approximately $699 million. The investment amount was subject to further negotiation between the parties, including but not limited to, such matters as the reduction of MPC’s charges for carrying costs due to project delays.
The Asset Purchase agreement had been amended to permit SME to make refundable deposits with MPC prior to closing in order to mitigate certain MPC capital cost accruals on the Kemper project to be paid by SME at closing.
On May 20, 2015, SME’s Board of Directors voted to end pursuit of ownership in the Kemper County energy facility. In accordance with the terms of the asset purchase agreement, on June 3, 2015, MPC refunded approximately $301 million, representing principal and accrued interest on the deposits. Deferred interest income on the deposits representing the amount of additional interest income conditioned on closing of the purchase was removed from the balance sheet following termination of the asset purchase agreement.
46
The Environmental Protection Agency (EPA) has promulgated and proposed several regulations that will have major impacts on electric utilities, and ultimately energy consumers, due to the massive amounts of capital, and on-going operating and maintenance costs that may be required to bring coal fired generating facilities into compliance with these regulations. Specifically, EPA has promulgated the Clean Power Plan (CPP) regulating carbon dioxide emissions for new, modified and existing electric utility generators. This rule is being scrutinized by affected parties and will be subjected to a full vetting of judicial review. On February 9, 2016, the Supreme Court issued a stay of the CPP. The stay specifically prohibits the EPA from implementing the rule until all legal proceedings have concluded. The Mercury and Air Toxics Standards (MATS) for coal and oil-fired utility boilers took effect during April 2015. SME received a oneyear extension to the compliance deadline. SME has installed controls on its coal-fired Morrow generating plant to comply with the MATS rule. Commissioning and initial compliance demonstration is scheduled to be completed during the first quarter of 2016. Additionally, the EPA has issued final rules for Coal Combustion Residuals (CCR) that will require new and additional investment in groundwater monitoring associated with facilities which produce coal combustion wastes (fly ash, bottom ash, and synthetic gypsum). The EPA has also published its Effluent Limitations Guidelines (ELG) rule which will result in significant investment in wastewater treatment at coal fired generating plants. SME will continue to monitor these regulations and evaluate the most economical methods to achieve compliance.
SME is a defendant in certain litigation incurred in the normal course of business. Management, based on advice of legal counsel, is of the opinion that the ultimate resolution of such litigation will not have a material adverse effect on SME’s financial statements.
47
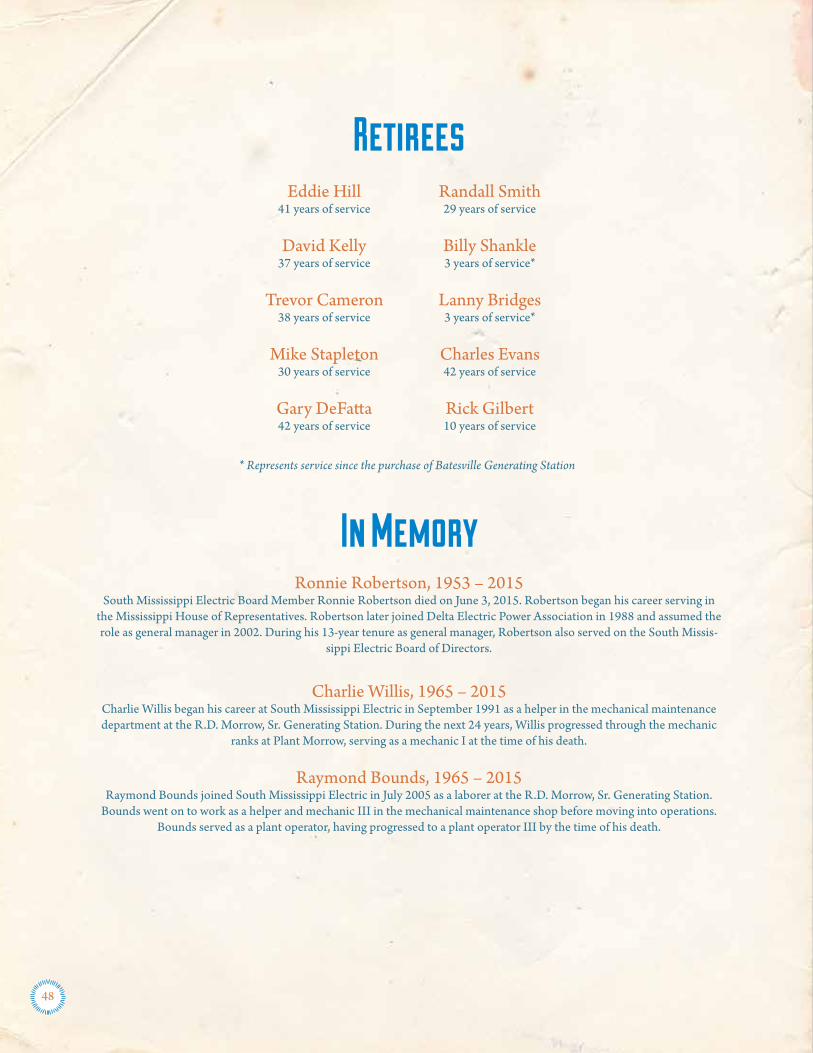
Retirees
In MemoryRonnie Robertson, 1953 – 2015
South Mississippi Electric Board Member Ronnie Robertson died on June 3, 2015. Robertson began his career serving in the Mississippi House of Representatives. Robertson later joined Delta Electric Power Association in 1988 and assumed the role as general manager in 2002. During his 13-year tenure as general manager, Robertson also served on the South Missis-
sippi Electric Board of Directors.
Charlie Willis, 1965 – 2015Charlie Willis began his career at South Mississippi Electric in September 1991 as a helper in the mechanical maintenance department at the R.D. Morrow, Sr. Generating Station. During the next 24 years, Willis progressed through the mechanic
ranks at Plant Morrow, serving as a mechanic I at the time of his death.
Raymond Bounds, 1965 – 2015Raymond Bounds joined South Mississippi Electric in July 2005 as a laborer at the R.D. Morrow, Sr. Generating Station.
Bounds went on to work as a helper and mechanic III in the mechanical maintenance shop before moving into operations. Bounds served as a plant operator, having progressed to a plant operator III by the time of his death.
Eddie Hill41 years of service
David Kelly37 years of service
Trevor Cameron38 years of service
Mike Stapleton30 years of service
Gary DeFatta42 years of service
Randall Smith29 years of service
Billy Shankle3 years of service*
Lanny Bridges3 years of service*
Charles Evans42 years of service
Rick Gilbert10 years of service
* Represents service since the purchase of Batesville Generating Station
48
EQUAL EMPLOYMENT OPPORTUNITY AND STATEMENT OF NONDISCRIMINATIONSouth Mississippi Electric (SME) is an Equal Opportunity Employer. Employment is based upon personal capabilities and qualifications without regard to race, color, sex, sexual orientation, gender identity, age, religion, national origin, disability (mental or physical), genetic information, veteran’s status or any other protected characteristic as established by law. This policy applies to all areas of employment including recruitment, hiring, training and development, promotion, transfer, termination, compensation, benefits, and all other conditions and privileges of employment. Also, as a recipient of federal assistance, either directly or indirectly, from the Rural Utilities Service, an agency of the U.S. Department of Agriculture (USDA), SME is subject to the provisions of federal law on nondiscrimination and the policies of the above mentioned agency. In addition, SME is committed to furthering the principles of equal employment opportunity through its continuing Affirmative Action Program (AAP). The full AAP is available for inspection upon request and may be viewed during normal work hours at SME’s Human Resources offices.
James Compton, general manager/CEO of SME, is responsible for coordinating the organization’s nondiscrimination compliance efforts. All supervisors and managers are responsible for creating an atmosphere free of discrimination. Further, each employee is expected to maintain a productive and non-discriminatory work environment and to treat all colleagues with respect and professionalism. Any employee who engages in discrimination will be subject to disciplinary action, up to and including termination.
Employees who believe they have experienced conduct that is prohibited by SME’s discrimination policy are encouraged to first inform their supervisor. If their supervisor is named in the complaint, or directly involved in the discriminatory conduct, the employee should inform their second-level supervisor or Department Head, who will in turn contact the Human Resources Director. Alternatively, employees may contact the Human Resources Director directly, or any other Department Head. Employees also have the option of filing complaints with the U.S. Equal Employment Opportunity Commission or the Office of Federal Contract Compliance Programs.
Any applicant or specific class of individuals who believe they have been subjected to discrimination may file a complaint with SME’s Director of Human Resources as soon as possible after the alleged discrimination occurs. If appropriate action does not result, a report should be made to the GM/CEO.
Individuals may also file a Civil Rights Program Complaint with the Rural Utilities Service, an agency of the U.S. Department of Agriculture (USDA) by completing the USDA Program Discrimination Complaint Form, found online at http://www.ascr.usda.gov/complaint_filing_cust.html, or at any USDA office or call (866) 632-9992 to request the form. Individuals may also write a letter containing all of the information requested in the form and send completed complaint form or letter by mail to the U.S. Department of Agriculture, Director, Office of Adjudication, 1400 Independence Avenue, S.W., Washington, D.C. 20250-9410, by fax (202) 690-7442 or email at [email protected].
Complaints must be filed within 180 days after the alleged discriminatory action, or by such later date if extended. Retaliation for filing a claim or participating in an investigation is strictly prohibited.
49

50
Post Office Box 15849Hattiesburg, MS 39404-5849
601-268-2083www.smepa.coop