staying safe joint strategic needs assessment...
TRANSCRIPT

JSNA Staying Safe - draft for Health and Wellbeing Board
Staying Safe
Joint Strategic Needs Assessment
(JSNA)
August 2016
DRAFT Version v0.7
Last updated 18 August 2016

JSNA Staying Safe - draft for Health and Wellbeing Board
Page 2 of 108
Contents 1 Introduction .................................................................................................................... 5
2 Key issues and gaps ...................................................................................................... 6
2.1 Key issues .............................................................................................................. 6
2.1.1 Crime and community safety: who is at risk? ................................................... 7
2.1.2 Crime and community safety trends ................................................................. 7
2.2 Gaps and limitations in knowledge .......................................................................... 9
3 Recommendations for consideration for commissioners ............................................... 10
4 Cumbria’s population.................................................................................................... 11
4.1 People and communities ....................................................................................... 11
4.2 Poverty and deprivation ........................................................................................ 11
4.3 Household income ................................................................................................ 12
4.4 Unemployment ...................................................................................................... 12
5 What is the level of need and where are the gaps? ...................................................... 13
5.1 Introduction ........................................................................................................... 13
5.2 All Crime ............................................................................................................... 13
5.3 Acquisitive crime ................................................................................................... 18
5.3.1 Theft from a motor vehicle ............................................................................. 19
5.3.2 Theft of a motor vehicle ................................................................................. 20
5.3.3 Burglary (dwelling) ......................................................................................... 21
5.3.4 Burglary (other) .............................................................................................. 22
5.4 Violent Crime ........................................................................................................ 23
5.4.1 Violence against the person ........................................................................... 23
5.4.2 Hospital admissions for violent crime (including sexual violence) ................... 25
5.4.3 Domestic abuse ............................................................................................. 27
5.4.4 Sexual offences ............................................................................................. 28
5.5 Children and young people ................................................................................... 31
5.5.1 Child abuse .................................................................................................... 32
5.5.2 Child Sexual Exploitation ............................................................................... 32
5.5.3 Children missing from home .......................................................................... 33
5.5.4 Young people’s offending............................................................................... 34
5.6 Other crime ........................................................................................................... 35
5.6.1 Fraud ............................................................................................................. 35
5.6.2 Cybercrime .................................................................................................... 36

JSNA Staying Safe - draft for Health and Wellbeing Board
Page 3 of 108
5.6.3 Serious and organised crime ......................................................................... 37
5.6.4 Terrorism ....................................................................................................... 37
5.6.5 Rural crime .................................................................................................... 38
5.6.6 Business crime .............................................................................................. 39
5.6.7 Anti-social behaviour ...................................................................................... 40
5.6.8 Criminal damage (including arson) ................................................................. 41
5.6.9 Hate crime ..................................................................................................... 42
5.7 Offending and Re-offending .................................................................................. 45
5.8 Drug and alcohol misuse ....................................................................................... 48
5.8.1 Substance misuse.......................................................................................... 48
5.8.2 Drug possession and supply .......................................................................... 50
5.8.3 Alcohol related crime ..................................................................................... 51
5.8.4 Alcohol related violent crime .......................................................................... 52
5.8.5 Alcohol related sexual offences...................................................................... 54
5.8.6 Alcohol specific mortality ................................................................................ 54
5.8.7 Hospital admissions – alcohol specific (all) .................................................... 55
5.8.8 Hospital admissions – alcohol specific (under 18 year olds) ........................... 56
5.9 Fire safety and other emergency incidents ............................................................ 57
5.9.1 All incidents ................................................................................................... 60
5.9.2 Fires .............................................................................................................. 62
5.9.3 Deliberate fires ............................................................................................... 63
5.9.4 False alarms .................................................................................................. 63
5.9.5 Non-Road Traffic Collison Special Service Calls ............................................ 64
5.10 Road Safety: Killed and Seriously Injured (KSI) statistics ...................................... 66
5.10.1 Road Traffic Collision Special Service Calls ................................................... 67
5.11 Adult Safeguarding ............................................................................................... 69
6 Housing and communities ............................................................................................ 71
7 Geographical differences in need ................................................................................. 73
7.1 Cumbria and districts crime rate statistical comparison ......................................... 73
7.2 Allerdale district..................................................................................................... 75
7.2.1 Allerdale ward map ........................................................................................ 76
7.3 Barrow-in-Furness district ..................................................................................... 78
7.3.1 Barrow ward map ........................................................................................... 80
7.4 Carlisle district ...................................................................................................... 82
7.4.1 Carlisle ward map .......................................................................................... 84
7.5 Copeland district ................................................................................................... 86
JSNA Staying Safe - draft for Health and Wellbeing Board
Page 4 of 108
7.5.1 Copeland ward map ....................................................................................... 87
7.6 Eden district .......................................................................................................... 89
7.6.1 Eden ward map .............................................................................................. 90
7.7 South Lakeland district .......................................................................................... 92
7.7.1 South Lakeland ward map ............................................................................. 93
7.8 North and South Clinical Commissioning Group Areas ......................................... 95
7.8.1 Cumbria CCG boundary map ......................................................................... 96
8 Current Services and Assets ........................................................................................ 97
9 Community views ......................................................................................................... 99
10 Equality Impact Assessment ...................................................................................... 102
11 Key Contacts .............................................................................................................. 102
12 Related Documents .................................................................................................... 103
13 Links to data sources ................................................................................................. 103
14 References ................................................................................................................. 104
15 Acronyms ................................................................................................................... 108

JSNA Staying Safe - draft for Health and Wellbeing Board
Page 5 of 108
1 Introduction This Joint Strategic Needs Assessment (JSNA) Staying Safe chapter provides an overall
assessment of the issues that impact on the safety of Cumbria’s communities. The aim of
the chapter is to provide an insight into a range of topics including:
crime and disorder;
drug and alcohol misuse;
fire safety;
road safety;
adult safeguarding;
housing and communities.
The chapter is designed to provide commissioners and other relevant authorities with
knowledge and an understanding of the safety needs of Cumbria’s communities, to help
inform future strategic planning.
Research, evidence and intelligence have been gathered from local, regional and national
sources. Analysis has been undertaken to understand which communities have the greatest
needs to stay safe in Cumbria. A selection of data sources have been explored, including
data sources around recorded and fear of crime available at smaller geographical areas,
mainly ward level.
Being a victim of crime or anti-social behaviour, or worrying about becoming a victim can
have a hugely negative impact on health and wellbeing, both physical and emotional.
Having a safe and secure place in which to live is essential for everyone, and it needs to be
somewhere where people not only are safe, but where they feel safe.

JSNA Staying Safe - draft for Health and Wellbeing Board
Page 6 of 108
2 Key issues and gaps
2.1 Key issues
Cumbria is a relatively safe place in which to live, work and visit. In many areas, crime and
community safety issues are better than the national and / or North West regional average
and these areas are identified within this JSNA chapter. However, evidence within this
chapter suggests there are some areas of concern in relation to ‘staying safe’.
There is not always a correlation between the chances of becoming a victim of crime and the
fear of crime. Of the 21 wards identified as being least safe, around one in five (19.0%, 4)
did not rank in the top 15 wards for any fear of crime categories.
The link between crime and deprivation is well documented and has long been understood.
Cumbria has 29 communities (Lower Super Output Areas) that rank within the 10% most
deprived in England, with the most deprived community in the county located within Central
ward in Barrow-in-Furness. In total, over half (52.4%, 11) of the 21 wards identified as being
least safe contain communities that rank within the 10% most deprived in England. In each
district the wards which data suggests are least safe are shown below and ranked for levels
of deprivation in Cumbria.
Allerdale: Moss Bay (IMD rank 5th) St Michaels (IMD rank 11th) Moorclose (IMD rank 12th) Netherhall (IMD rank 21st) St. John's (IMD rank 62nd)
Carlisle:
Castle (IMD rank 17th) Currock (IMD rank 22nd) Denton Holme (IMD rank 37th) Morton (IMD rank 18th) St. Aidans (IMD rank 40th) Belle Vue (IMD rank 30th) Harraby (IMD rank 43rd) Botcherby (IMD rank 14th) Upperby (IMD rank 6th)
Barrow-in-Furness: Central (IMD rank 1st) Hindpool (IMD rank 2nd) Barrow Island (IMD rank 3rd) Risedale (IMD rank 9th)
Copeland:
Harbour (IMD rank 15th) Eden:
Penrith West (IMD rank 103rd) South Lakeland:
Kendal Fell (IMD rank 100th)
Maps showing the geographical location of the above wards can be viewed in the
Geographical differences in need section of this document.
Protected characteristics can make people more vulnerable to crime and safety. Evidence
within this JSNA chapter shows that age, gender and pregnancy are factors: pregnant
women are vulnerable to domestic abuse; young females (particularly those aged 25 to 29
years) are more likely to be victims of violence against the person offences; females are
more likely to be victims of sexual offences, particularly those aged from 0 to 17 years.
Disability, transgender, race, religion and belief, and sexual orientation are drivers of hate
crime incidents. Age and disability are additional factors making people vulnerable.

JSNA Staying Safe - draft for Health and Wellbeing Board
Page 7 of 108
2.1.1 Crime and community safety: who is at risk?
Evidence within this chapter indicates that the group most likely to become victims of crime
as well as offenders are males aged between 18 and 30 years. There are some exceptions,
and gender is a factor in becoming a victim in some crime areas. Females aged between
18 and 30 years are more likely to become victims of theft from the person offences and
young females are more likely to become victims of sexual offences. In 2015-16, three
quarters (75.4%) of victims of sexual offences were female, with those aged from 0 to 17
years the group most at risk.
Violence against the person affects both sexes. Both males and females aged between
18 and 30 years are more likely to become victims of violence against the person offences,
whilst those aged 18 to 40 years are the group most at risk of alcohol related violence
against the person offences.
People missing from home are more likely to be aged from 12 to 17 years and living in
residential care homes or local authority care. Children missing from home are the group
who are most at risk of experiencing abuse and sexual exploitation.
In 2014-15, the majority (79.1%) of First Time Entrants to the Youth Justice System were
male. A large proportion (29.4%) of First Time Entrants had already had involvement with
Cumbria’s Children’s Services.
Cumbria’s communities face risks in their own homes. Fire is a greater risk for people who
smoke, for those who live in areas where there are high levels of poverty and deprivation,
those who are single parent families, single person households, social renters, those who
are disabled or suffer from illness, or those who are unemployed.
Adults (those aged 18 and over) with health or social care needs are more at risk of abuse or
neglect.
Out and about on the county’s roads, it is young, recently qualified drivers who are most at
risk of death or serious injury whilst driving. Young male drivers are the group more likely to
incur risks by drink-driving and drug-driving.
2.1.2 Crime and community safety trends
In 2015-16, overall crime levels increased in Cumbria by +5.0% (+1,243) compared to
2014-15, and +8.4% (+2,018) compared to 2013-14. Of Cumbria’s districts, the largest
percentage increase was seen in South Lakeland +14.9% (+516). The highest number and
rate of overall crime was seen in Castle ward in the Carlisle district with a total of
1,820 crimes, a rate of 317.6 per 1,000 population.
Offence rates varied across different crime categories. Burglary (dwelling) offences
increased in 2015-16 by +7.9% (+56) compared to 2014-15 and +9.3% (+65) compared to
2013-14. The highest percentage increase occurred in the Copeland district +28.4% (+23)
whilst Carlisle had the highest crime rate for burglary (dwelling) at 2.2 per 1,000 population.
Violence against the person offences increased +12.6% (+826) in 2015-16 compared to the
2014-15. Barrow-in-Furness had the highest offence rate for violence against the person

JSNA Staying Safe - draft for Health and Wellbeing Board
Page 8 of 108
offences (21.3 per 1,000) whilst Carlisle had the highest number of crimes (2,017).
Domestic abuse incidents increased by +1.1% (+81) in 2015-16 compared to 2014-15 and
by +2.8% (+195) compared to 2013-14. Eden district had the largest increase in recorded
domestic abuse incidents (+19.0%; +60); the largest number of recorded domestic abuse
incidents occurred in the Carlisle district (1,887).
Reported sexual offences also increased in 2015-16, by +23.5% (+163) compared to
2014-15, and +102.1% (+433) compared to 2013-14. Increases were seen in all districts
except Allerdale and Barrow-in-Furness. Carlisle district had the largest percentage
increase +58.9% (+76). Although hospital admissions for violent crime (including sexual
violence) have decreased in 2012-13/2014-15, the rate in Barrow-in-Furness (69.0 per
100,000) remains significantly worse than England (47.5).
Anti-social behaviour incidents increased in Carlisle and Allerdale in 2015-16 comparted to
2014-15 (+20.4% / +192 and +17.9% / +108 respectively). Criminal damage offences
(including arson) increased across the county by +5.0% (+245) compared to 2014-15.
Recorded hate crimes (all types) also saw an increase across the county, rising by +12.1%
(+41) to a total of 379 in 2015-16 compared to 2014-15, +60.6% (+143) compared to 2013-
14. Hate crime increase across all Cumbria’s districts, and the majority were racially
motivated. Copeland district experience the highest percentage increase (+100% / +25).
In 2013, almost a third of Cumbria’s offenders (29.1%) went on to re-offend, +1.7 percentage
points compared to the previous year. This proportion is higher than both the proportion in
the North West (28.0%) and England (26.4%). The largest proportion of offenders who went
on to re-offend in 2013 occurred in Barrow-in-Furness district (31.8%).
Alcohol has a significant impact on crime and community safety being directly involved in
13.9% (3,626) of all crimes in 2015-16, +2.4% (+84) compared to 2014-15. Alcohol played a
part in a large proportion of all violence against the person offences in 2015-16 (29.3%;
2,161).
Eden district saw the largest percentage rise in all alcohol related crimes in 2015-16
(+24.0%; +42) and the second largest percentage increase in alcohol related violence
against the person offences (+9.8%; +11).
The largest increase in terms of numbers of all alcohol related crimes occurred in the
Carlisle district +153 (+18.2%), and Carlisle also saw the largest percentage increase in
alcohol related violence against the person offences in 2015-16, +10.1% (+52). Support is
available from Unity Drug and Alcohol Services Cumbria (Unity) for people misusing drugs
and alcohol. Reflecting the rise in alcohol related crime, the data show that alcohol misuse
referrals to Unity increased in Carlisle in 2015-16 (+5.9%, +16). Carlisle had the largest
number of Unity drug and alcohol clients in 2015-16 of all the districts (790 clients). Alcohol
misuse is having a detrimental effect on health within the Carlisle district, with an increase in
the district’s male alcohol specific mortality rate of +23.8% to 14.7 per 100,000 in 2012-14,
the second highest percentage increase of all the districts.

JSNA Staying Safe - draft for Health and Wellbeing Board
Page 9 of 108
Barrow-in-Furness had the second largest number of Unity drug and alcohol clients in
2015-16 (616 clients). Data show that alcohol specific hospital admissions (all persons, all
ages) in Barrow-in-Furness (689 per 100,000) are significantly worse than both the North
West (558) and England (364), having increased by +13.9% compared to 2012-13 and by
+17.8% compared to 2010-11. Across Cumbria, alcohol specific hospital admissions for
under 18 year olds in 2012-13/2014-15 (crude rate 58.2 per 100,000 population) are similar
to the North West region (53.5 per 100,000) and significantly worse than England (36.6 per
100,000). However, within the Barrow-in-Furness district, alcohol specific hospital
admissions for under 18 year olds (90.2 per 100,000) are significantly worse than the North
West. This is also the case in the Copeland district, where alcohol specific hospital
admissions for under 18 year olds at 104.4 per 100,000 population are significantly worse
than the North West, and the highest of all Cumbria’s districts.
Alcohol specific hospital admissions (all persons, all ages) in South Lakeland in 2014-15
(333 per 100,000) are now similar to England (364), having previously been significantly
better.
Alcohol misuse is having a detrimental impact on health in the Allerdale district. Allerdale’s
female alcohol specific mortality rate in 2012-14 (16.4 per 100,000) increased by +25.2%
compared to the 2011-13 rate of 13.1 and by +72.6% compared to the 2010-12 rate of 9.5
and was significantly worse than England (7.4) in 2012-14. Allerdale district’s male alcohol
specific mortality rate also increased in 2012-14 by +47.2% to 22.5 per 100,000, the highest
percentage increase of all Cumbria’s districts.
Copeland was the only district in 2015-16 with a significant increase in drug misuse referrals
to Unity (+18.5%; +38).
Vulnerable Adult alerts to Cumbria County Council’s Health and Care Services increased by
+20.3% (+397) to 2,349 in 2015-16 compared to the previous year. The incidence of
physical abuse made up 48% of all referrals, significantly higher than the England average of
27%. Psychological abuse (12%) and financial abuse (13%) are slightly below the England
averages of 16% and 18% respectively. Neglect has risen by 3.0 percentage points to 25%
of all cases, but is below the England average of 29%. The majority of alerts (47%) continue
to be in relation to people living in a care home setting, higher than the England average of
36%.
2.2 Gaps and limitations in knowledge
Evidence within this JSNA chapter has highlighted some gaps and limitations in knowledge.
Lack of recording of enhanced data for assault-related injury attendances at hospital
Emergency Departments means it is not possible to further understand assault date, time,
location or weapon which could be recorded.
Quantifying the extent of sexual offences and domestic violence is difficult as these incidents
are known to be under reported. Cumbria Constabulary and other agencies are working
towards improving their response to victims, however, figures are largely influenced by the
willingness of victims to come forward.

JSNA Staying Safe - draft for Health and Wellbeing Board
Page 10 of 108
Data for Child Sexual Exploitation, children missing from home, Vulnerable Child reports and
Vulnerable Adult reports were available at county level only for 2015-16. Although the
available data paint a broad picture at county level it should be noted that interpretation is
limited without an understanding of data at lower level geographies.
Victim data under represents the impact on health and wellbeing.
The proportion of non-white service users accessing Unity Drug and Alcohol Services in
Cumbria does not mirror the proportion of residents from Black and Minority Ethnic (BME)
groups across the county’s districts. It is unclear whether drug and alcohol problems are
less prevalent amongst BME groups, or whether cultural differences inhibit BME groups
seeking help from drug and alcohol service providers.
Offending behaviour is often linked to physical and mental health and wellbeing. Mental
disorder and its subsequent impact on crime is considered to be significant, with links
established to persistent offending. Data regarding the proportion of offenders with mental
health problems in Cumbria is not available and the extent of the potential problem is not
fully understood.
3 Recommendations for consideration for commissioners This JSNS Staying Safe chapter identifies a range of factors which can have a significant
impact on the health and wellbeing of Cumbria’s communities. Although different aspects of
crime and community safety have been addressed separately, the groups and communities
affected are often similar, and the issues should not be viewed in isolation. It is
recommended that commissioners consider all aspects included within this JSNA chapter
when developing services to support communities to be safe, and feel safe, in Cumbria.

JSNA Staying Safe - draft for Health and Wellbeing Board
Page 11 of 108
4 Cumbria’s population
4.1 People and communities
Cumbria is England’s second largest county, covering an area of 6,767 square km and much
more sparsely populated than the national average with an average population density of
74 people per square km compared to 380 for England and Wales. Over half (54%) of
Cumbria’s residents live in rural areas, compared to 18% across England and Wales.
Cumbria’s population differs in comparison with the national (England and Wales) picture in
the number of ways. Cumbria has lower proportions of people in the three younger age
groups (0-14; 15-29; 30-44), higher proportions in the four older age groups (45-59; 60-74;
75-84; 85+), with decreasing proportions in the two younger age groups (0-14 and 30-44).
Overall by 2037, further decreases are projected in residents aged under 65, whilst Cumbria
is projected to have greater proportions of those aged over 65 than the national average.
Census 2011 data indicates that proportions of residents from BME groups in (3.5%) are
much lower than the average for England and Wales (19.5%).
Just as Cumbria differs from the national picture, demographics vary between Cumbria’s
districts. Comprehensive information relating to population estimates and projections, socio-
economic profiles, equality, migration, housing and households can be accessed via the
Cumbria Intelligence Observatory website:
http://www.cumbriaobservatory.org.uk/Population/peopleandpopulation.asp
4.2 Poverty and deprivation
Cumbria has 29 communities (Lower Super Output Areas) that rank within the 10% most
deprived of areas in England; these communities are located within the districts of Allerdale,
Barrow-in-Furness, Carlisle and Copeland. The most deprived community falls within
Central ward in Barrow-in-Furness. Full briefings on the 2015 Indices of Deprivation for
Cumbria and the districts can be viewed via the Cumbria Intelligence Observatory in the
following location:
http://www.cumbriaobservatory.org.uk/antipoverty/povertyincumbria.asp
There are currently 11,700 children aged 1-15 years living in poverty in Cumbria (14.5% of
all children aged under 16 years); 13,200 children aged 0-19 live in poverty (13.8%). Both
are below national levels of 18.6% and 18.0% respectively. Levels of child poverty in all
districts, with the exception of Barrow-in-Furness, are below national levels. In
Barrow-in-Furness, 20.8% of all children aged 0-15 years are living in poverty; 20.0% of all
children aged 0-19 years. Three wards with the greatest proportion of children living in
poverty are : Central ward in Barrow-in-Furness (44.0%); Sandwith ward in Copeland
(42.2%); and Moss Bay ward in Allerdale (33.6%). In total, 30 Cumbrian wards have child
poverty levels greater than the national average. Child poverty briefings can be accessed
via the Cumbria Intelligence Observatory in the following location:
http://www.cumbriaobservatory.org.uk/antipoverty/childpoverty.asp

JSNA Staying Safe - draft for Health and Wellbeing Board
Page 12 of 108
One in ten Cumbrian households (10.9%) are estimated to be in fuel poverty, above national
levels. Levels of fuel poverty in Barrow-in-Furness fall within the worst 10% nationally, and
are also greater than the national average in Allerdale and Eden. A fuel poverty briefing is
available via the Cumbria Intelligence Observatory website in the following location:
http://www.cumbriaobservatory.org.uk/antipoverty/fuelpoverty.asp
4.3 Household income
According to Paycheck (a modelled index of annual household income which has been
developed by the company CACI Ltd and is subscribed to by the Cumbria Intelligence
Observatory) median household income in Cumbria at May 2016 was £26,192 which is
lower than the national (GB) average of £29,449.
When compared to Great Britain, Cumbria had a greater proportion of households with an
annual income of less than £10k; 13.3% compared to 11.6% nationally. Of Cumbria’s
districts, Barrow-in-Furness had the greatest proportion of households with an annual
income of less than £10k (16.4%). In contrast, South Lakeland had the smallest proportion
of households in the county with annual incomes of less than £10k (9.3%).
A household income briefing for Cumbria and districts can be accessed via the Cumbria
Intelligence Observatory website in the following location:
http://www.cumbriaobservatory.org.uk/economy/householdincome.asp
4.4 Unemployment
In May 2016 there were 4,705 people in Cumbria claiming either Job Seekers Allowance or
Universal Credit (those not in employment), 15 less than in May 2015. Over the year the
claimant count in Cumbria has fallen more slowly than nationally (UK), -0.3% compared
to -5.7%.
The claimant rate in May 2016 in Cumbria was 1.6%, 0.2% lower than the national rate of
1.8%. Barrow had the highest number of claimants at 1,150 and the highest rate at 2.8%.
Claimant rates are also above the 1.8% national average in Allerdale (1.9%) and
Copeland (2.1%).
Cumbrian claimant rates for 18-24 year olds (4.3%) and 25-29 year olds (2.7%) are higher
than the national average of 3.6% and 2.4% respectively. Rates for 18-24 year olds are
double the national average in Barrow-in-Furness (7.5%) and are also higher than the
national rate in Allerdale (5.3%) and Copeland (6.5%) (Cumbria County Council. (2016d).
Labour market briefings are prepared monthly and can be accessed via the Cumbria
Intelligence Observatory website in the following location:
http://www.cumbriaobservatory.org.uk/economy/unemployment.asp

JSNA Staying Safe - draft for Health and Wellbeing Board
Page 13 of 108
5 What is the level of need and where are the gaps?
5.1 Introduction
Different aspects of crime and community safety issues are covered in the following sections
to provide a sense of the issues that affect the residents of Cumbria. Sections cover: all
crime; acquisitive crime; violent crime; issues affecting children and young people; other
crime including anti-social behaviour, criminal damage and hate crime; offending and
re-offending; drug and alcohol misuse; fire safety; road safety and safeguarding. Unless
stated otherwise, crime data has been provided by Cumbria Constabulary via the Crime and
Disorder Dashboard to 31 March 2016.
It should be noted that crime numbers reported in this chapter are based on when a crime is
recorded, rather than when a crime is committed and therefore some crime categories will
include historical offences. The location of offences and incidents is based on the
geographical location of the incident itself.
Offence rates have been based on mid-2014 population estimates for 2014 wards in
England and Wales as published by the Office for National Statistics.
5.2 All Crime
Introduction
Crime response and management is covered by a range of legislation. Local authorities and
police services have a duty, under the Crime and Disorder Act 1998, to work together to
develop crime and disorder audits and to implement crime and disorder reduction strategies,
in addition to working in partnership with other agencies via Community Safety Partnerships
(CSPs) to tackle any problems identified The Crime and Disorder Act 1998 was revised by
the Police and Justice Act 2006, which placed duties on responsible authorities to share
evidence based data to support CSPs. CSP membership includes the Fire Service,
Probation Service, Health Service, Police, local authorities, and a representative from
Housing Associations. CSPs have a duty under the legislation to come together as a formal
strategic group to carry out assessments of drug misuse, crime levels and patterns, and to
produce community safety plans.
Major changes affected police authorities occurred following implementation of the Policing
and Social Responsibility Act 2011. From 2012, police authorities were replaced by elected
Police and Crime Commissioners (PCCs) for each police force outside London. PCCs are
elected representatives. They have responsibility for: setting police and crime objectives for
their area through a police and crime plan; setting the police force budget; holding Chief
Constables and the police force to account. PCCs aim to cut crime and deliver an effective
and efficient police service within their force area, bringing community safety and criminal
justice partners together to ensure that local priorities are joined up (Association of Police
and Crime Commissioners, 2016). The Policing and Social Responsibility Act sets out the
basic duties of a Police and Crime Commissioner. There is also provision for amendments
to the Licencing Act 2003, providing the police and local authorities stronger powers to
refuse licences or remove licences form premises that are causing problems, and enabling
local councils to charge more for late-night licences to cover additional policing costs.
Amendments to the Misuse of Drugs Act 1971 are also included in the Act; this gives the

JSNA Staying Safe - draft for Health and Wellbeing Board
Page 14 of 108
Secretary of State power to temporarily ban new psychoactive substances for up to one year
while health issues can be investigated by independent experts.
Further reforms and changes are expected. The draft Policing and Crime Bill reached the
second reading stage in the House of Commons in mid-July 2016. The bill aims to
strengthen collaboration between the emergency services and to ensure that policing
services are more accountable and more effective. Changes to policing powers are
included, such as detention of people suffering mental health crises, and the length of time
people can be held on police bail before they are charged. The draft bill also covers areas
such as alcohol licensing and child sexual exploitation.
The all crime data provided by Cumbria Constabulary cover a number of main crime
categories as shown in Table 1:
Table 1: Main crime categories making up ‘all crime’
Main crime category Includes
Violence against the person
violence with injury; violence without injury
Sexual offences rape; other sexual offences
Robbery robbery of business property; robbery of personal property
Theft offences theft from the person; bicycle theft; shoplifting; all other theft offences
burglary dwelling; burglary other theft of a motor vehicle; theft from a motor vehicle
Criminal damage and arson offences
arson damage to dwellings; damage to other buildings; damage
to vehicles; other damage racially or religiously aggravated damage
Other crimes against society
possession of weapons offences drugs offences (trafficking and possession) public order offences miscellaneous crimes against society
Theft offences accounted for the largest proportion of all crimes in 2015-16 (35.5%; 9,328).
Proportions for all the main categories during 2015-16 are illustrated in Figure 1.

JSNA Staying Safe - draft for Health and Wellbeing Board
Page 15 of 108
Figure 1: Proportions of all main crime categories in 2015-16
Who is at risk, and why?
Local data suggests that males and females aged between 18 and 30 are most at risk of
being a victim of crime, whilst males aged 18 to 30 years are most likely to be the
perpetrators (Cumbria Constabulary, 2016a).
What local data tells us
Cumbria is a relatively safe in which to live work and visit, and the fear of crime is generally
lower than in other areas of the country (Cumbria Constabulary, 2015b).
However, crime levels have again increased during 2015-16. The snapshot of crime
provided by Cumbria Constabulary within the Crime and Disorder Dashboard indicates that
the total number of offences recorded in Cumbria to the end of March 2016 reached 26,004,
an increase of +5.0% (+1,243) compared to 2014-15, and +8.4% (+2,018) compared to
2013-14. This is lower than the national (England and Wales) increase of +7% (Office for
National Statistics, 2015b). The rate for all crime increased by +2.4 to 52.2 per 1,000
population compared to 2014-15. Variations can be seen across the districts. South
Lakeland has seen the largest percentage increase compared to the previous year
+14.9% (+516) and the largest rise over a three year period +21.3% (+697). The largest
decrease in reported crime levels has occurred in Copeland, a decrease of -2.6% (-93)
compared to the previous year. Three districts (Allerdale, Barrow-in-Furness and Carlisle)
have crime rates per 1,000 population higher than the county average of 52.2, with the
highest crime rate found in Carlisle (68.0). The lowest crime rate was found in Eden (36.1).
Within the county, 43 wards have crime rates per 1,000 population higher than the county
rate, and 10 wards have particularly higher crime rates for all crime, at over 100.0 per 1,000
population, more than twice the county rate: two of these are in Allerdale (St Michael’s and
St John’s); three in Barrow-in-Furness (Hindpool, Central and Barrow Island); two in Carlisle
(Castle and Currock); one in Copeland (Harbour); one in Eden (Penrith West); and one in
South Lakeland (Kendal Fell) (Cumbria Constabulary, 2016a). Castle Ward in Carlisle had
the highest number of all crimes in 2015-16 at 1,820, followed by Hindpool ward in
9,238 36%
7,376 28%
5,194 20%
3,266 13%
857 3% 73
0%
Proportion of all crime categories, 2015-16 Theft offences
Violence against theperson
Criminal damage andarson
Other crimes againstsociety
Sexual offences
Robbery

JSNA Staying Safe - draft for Health and Wellbeing Board
Page 16 of 108
Barrow-in-Furness with 1,273. Crime rates for ten wards with the highest offence rates are
illustrated in Figure 2.
Figure 2: All crime – 10 wards in Cumbria with the highest offence rate per
1,000 population
Source: (Cumbria Constabulary, 2016a)
Maps identifying geographical locations of all Cumbria’s wards are provided in the
Geographical differences in need section within this document.
Rates for all crime for wards across the county are illustrated in Figure 3.
317.6 224.3 199.7 196.0 177.5 172.2 144.7 134.4 114.1 107.4
1,820
1,273
458
775 798 863 902 747
287 349
Castle Hindpool KendalFell
Harbour Central StMichael's
Currock St John's BarrowIsland
PenrithWest
All crime, wards with highest offence rates per 1,000 population (2015-16)
rate per 1,000 Nr of crimes

JSNA Staying Safe - draft for Health and Wellbeing Board
Page 17 of 108
Figure 3: Map of all crime rates across Cumbria’s wards, 2015-16

JSNA Staying Safe - draft for Health and Wellbeing Board
Page 18 of 108
Flood related crime
In the aftermath of Storm Desmond in early December 2015, offences were committed that
were classed as directly flood related. By 17 January 2016, a total of 63 directly flood
related offences had been committed, over three quarters (77.8%, 49) related to acquisitive
crime. Over a third (36.5%, 23) were in relation of burglary (other) or attempted burglary
(other); a further 17.5% (11) were burglary (dwelling) or attempted burglary (dwelling). One
fifth of offences (20.6%, 13) were damage related, including damaged to dwellings, other
buildings and vehicles. One offence of deception was also recorded. In addition to recorded
crimes, 74 suspicious incidents were recorded, the majority of which (87.8%, 65) occurred
within the north of the county (Cumbria Constabulary, 2016d).
Overall crime rates (including flood and non-flood related offences) had increased by
+8% (+82) across the county, and by +20% (+64) in the north of the county between
5 December 2015 and 10 January 2016 compared to the previous year (Cumbria
Constabulary, 2016d). Given the known number of reported flood related offences, the
majority of this increase is likely to be a direct result of flooding. The incidents are not
surprising given the scale of flooding, and that large numbers of flood damaged properties
would have been empty and unprotected.
Not all categories of offences and community safety issues have seen an increase
compared to the previous 12 months. Decreases were seen in the following categories:
Alcohol related violence against the person offences Total number 2,161 Reduction -2.4% (-52) Hospital admissions for violence (including sexual violence) Total number 592 Reduction -12.7% (-86) Deliberate fires Total number 532 Reduction -5.8% (-33) Drug possession and supply Total number 1,070 Reduction -22.4% (-308) Alcohol specific hospital admissions (under 18 year olds) Total number 164 Reduction -15.0% (-29)
Crime rates, counts and trends over the last 12 months for Cumbria and the county’s six
districts can be viewed in the crime rate statistical comparison in the appendices.
5.3 Acquisitive crime
Acquisitive crimes are those in which an offender acquires or takes items from another
person, and cover a number of different offence types. The following sections look at theft
from a motor vehicle, theft of a motor vehicle, domestic burglary and other types of burglary.
Targeting acquisitive crime is a priority for Cumbria Constabulary (Cumbria Constabulary,
2015a).

JSNA Staying Safe - draft for Health and Wellbeing Board
Page 19 of 108
Who is at risk, and why?
Young people aged 16-24 are more likely to be victims of theft: households owned or rented
by people in this age range are more likely to experience burglary and theft or attempted
theft of or from a vehicle; young adults aged 16-24 are also more likely to have personal
property stolen whilst away from home, either through snatch or stealth theft (Office for
National Statistics, 2013). Females aged between 18 and 30 years made up the largest
proportion of victims of theft from the person offences in Cumbria in 2015-16, 16.8% (21);
females aged 60 and over made up the second largest proportion, 16.0% (20). People aged
over 60 years, both male and female, are also likely to become victims of household
burglaries (Cumbria Constabulary, 2016a).
In Cumbria, males of all ages are twice as likely to be victims of vehicle offences. The age
group most at risk (for both males and females) is that of people aged between 18 and 30
years (Cumbria Constabulary, 2016a). Males aged 41 years and over are more likely to be
a victim of burglary other (not in a dwelling) (Cumbria Constabulary, 2016a).
In terms of all other theft offences, victims in 2015-16 were fairly even spread between male
and females over the age of 18 years, with 2,059 victims in total. Two wards each had more
than 100 victims of ‘all other theft’ offences: Castle ward in Carlisle (134); Hindpool ward in
Barrow-in-Furness (107) (Cumbria Constabulary, 2016a).
5.3.1 Theft from a motor vehicle
The data shows that 818 thefts from motor vehicles were reported across the county during
2015-16, an increase of +11.0% (+81) compared to 2014-15. Numbers had been falling
from 1,137 in 2012-13 to a low of 737 in 2014-15. The figure for 2015-16 is the first increase
in four years.
Rising trends over the 12 month period between 2014-15 and 2015-16 were seen across
Allerdale, Barrow-in-Furness, Carlisle and South Lakeland, with the highest increase seen in
Barrow-in-Furness (+49.3%, 33 reported crimes). The highest rates per 1,000 population
occurred in Allerdale and Carlisle (both 2.1 per 1,000) higher than the county average of 1.6.
The crime rate for Eden, at 1.7 per 1,000 is also higher than the county average, although
Eden experienced the second lowest number of thefts from a motor vehicle (88). Thefts
from motor vehicles fell across Copeland and Eden, with the greatest numerical decrease
occurring in Eden (-27.3%, -33). Copeland had the lowest crime rate at 1.0 per 1,000 and
the lowest number of crimes related to thefts from motor vehicles (70).
Variations can be seen across Cumbria’s communities. In total, 52 wards had crime rates
for theft from motor vehicles higher than the county average of 1.6 per 1,000 population, and
one quarter (13) of these wards were situated within the Allerdale district. One ward,
Crummock ward in Allerdale, had a crime rate more than 10 times higher (17.0 per 1,000)
than the county rate. Castle ward in Carlisle had the highest number of crimes at 35
instances in 2015-16. Ten wards across four of the county’s districts with the highest crime
rates are illustrated in Table 2 (Cumbria Constabulary, 2016a).

JSNA Staying Safe - draft for Health and Wellbeing Board
Page 20 of 108
Table 2: Theft from a motor vehicle, Cumbrian wards with the highest offence rates
2015-16
Theft from a motor vehicle, 2015-16
District Ward Number of crimes
Offence rate per 1,000
population
Allerdale Crummock 26 17.0
Allerdale Derwent Valley 14 9.1
Eden Ullswater 11 7.9
Copeland Ennerdale 7 7.2
Eden Orton with Tebay 9 6.6
Allerdale Boltons 12 6.5
Barrow Central 29 6.4
Carlisle Castle 35 6.1
Carlisle St Aidans 34 5.6
Carlisle Irthing 10 5.0
Source: (Cumbria Constabulary, 2016a)
It is known from information provided by Cumbria Constabulary that theft from motor
vehicles is linked to thefts from rural car parks during peak tourist periods (Cumbria
Constabulary, 2015a). The first six wards listed in Table 2 cover large geographical areas
and are relatively sparsely populated. They are also cover areas that are popular with
tourists. It would seem likely that thefts in these areas are tourist related.
The majority of victims of vehicle offences in Cumbria during 2015-16 were male (63.5%).
For both males and females, those aged between 18 and 30 years were more likely to be
victims of vehicle offences (15.4% and 8.8% respectively).
Four wards had more than ten victims of vehicle offences aged 18 to 30 in 2015-16:
Barrow-in-Furness: Central ward (12)
Carlisle: Castle (22); Currock (13; St Aidan’s (11)
5.3.2 Theft of a motor vehicle
Thefts of motor vehicles have remained relatively stable across the county compared to
2014-15, totalling 284 instances, and show a decrease over a three year period
of -6.9% (-21). The picture varies across the districts, with the trend increasing over the
12 month period across Allerdale, Barrow-in-Furness and Copeland, and down across
Carlisle and Eden. The highest crime rate per 1,000 population was seen in Carlisle (0.8),
higher than the county average (0.6). The lowest crime rates were held jointly by Eden and
South Lakeland (0.4). Eden had the lowest number of crimes relating to theft from a motor
vehicle (22). Copeland showed the largest percentage increase, +43.5% (+10) compared to
2014-15 and +22.2% (+6) compared to 2013-14. The highest decrease was seen in
Eden, -51.1% (-23) compared to 2014-15 and -43.6% (-17) over three years.
Motor vehicle theft crimes vary across Cumbria’s wards. In total, 51 wards have crime rates
higher than the county average of 0.6 per 1,000 population for theft of a motor vehicle.
Almost of quarter (12; 23.5%) of these wards can be found within the Allerdale district. Four
wards have crime rates more than three times the county rate: Castle ward and Morton ward

JSNA Staying Safe - draft for Health and Wellbeing Board
Page 21 of 108
in Carlisle at 2.3 and 2.2 per 1,000 respectively; Kirkoswald ward in Eden (2.1); and Barrow
Island ward in Barrow-in-Furness (2.0) (Cumbria Constabulary, 2016a). The ten wards with
the highest crime rates in Cumbria are summarised in Table 3.
Table 3: Theft of a motor vehicle, Cumbrian wards with the highest offence rates
2015-16
Theft of a motor vehicle, 2015-16
District Ward Number of crimes
Offence rate per 1,000
population
Carlisle Castle 13 2.3
Carlisle Morton 13 2.2
Eden Kirkoswald 3 2.1
Barrow-in-Furness Barrow Island 5 2.0
Copeland Kells 4 1.6
Carlisle Denton Holme 10 1.5
Eden Warcop 2 1.5
Allerdale Moorclose 7 1.4
Allerdale St Michael's 7 1.4
South Lakeland Kendal Underley 3 1.4
Source: (Cumbria Constabulary, 2016a)
Of the ten wards in Table 3, all but two (Kirkoswald and Warcop) are wards with lower car or
van availability per household than the county average (78.6%). Six wards lie within the
lowest 10% in relation to car or van availability per household of all wards in the county:
Barrow Island (48.4%); Castle (59.8%); St Michael’s (62.6%); Morton (63.4%); Moorclose
64.6%); Denton Holme (65.2%). Kells and Kendal Underley lie within the lowest 25% of
wards in relation to car or van availability per household (71.9% and 75.2% respectively)
(Office for National Statistics, 2011a).
5.3.3 Burglary (dwelling)
During 2015-16, 766 burglary (dwelling) offences were committed. Burglaries of dwellings
have increased in 2015-16 by +7.9% (+56) compared to 2014-15 mirroring a three year
trend of +9.3% (+65). This upward trend applies to all districts, with the exception of
Allerdale and Barrow-in-Furness, where decreases have been seen over a three year
period: Allerdale -30.4% (-62); Barrow-in-Furness -17.0% (-26). The highest increase in
2015-16 compared to the previous year was seen in Copeland at +28.4% (+23).
Barrow-in-Furness and Carlisle had crime rates per 1,000 population higher than the county
average of 1.5, with the highest rate found in Carlisle (2.2). Eden and South Lakeland had
crime rates lower than the county average, with the lowest rate in South Lakeland (0.9).
Crime rates vary across Cumbria’s wards. Almost one third of wards (50, 30.1%) have
experienced crime rates higher than the county average (1.5 per 1,000) in 2015-16. Three
wards have crime rates for burglary (dwelling) more than four times the county average:
Barrow Island ward in Barrow-in-Furness (6.8 per 1,000), St Aidans ward in Carlisle (6.2)
and St Michael’s ward in Allerdale (6.2) (Cumbria Constabulary, 2016a). Ten wards with the
highest crime rates in the county can be viewed in Table 4.

JSNA Staying Safe - draft for Health and Wellbeing Board
Page 22 of 108
Table 4: Burglary (dwelling), Cumbrian wards with the highest offence rates 2015-16
Burglary (dwelling), 2015-16
District Ward Number of crimes
Offence rate per 1,000 population
Barrow Barrow Island 17 6.8
Carlisle St Aidans 38 6.2
Allerdale St Michael's 31 6.2
Carlisle Castle 31 5.4
Barrow Central 23 5.1
Allerdale Netherhall 13 4.2
Barrow Hindpool 22 3.9
Carlisle Upperby 20 3.6
Copeland Cleator Moor South 9 3.3
Copeland Sandwith 9 3.3
Source: (Cumbria Constabulary, 2016a)
During 2015-16, 745 people across Cumbria were reported as victims of burglaries within
homes. As all but 0.4% of victims are aged 18 and over, and analysis shows that the
number of victims in each ward matches the number of burglary (other) crimes in all but a
handful of instances, it would appear that the number of victims is more likely to represent
the people reporting the offence rather than the wider number of victims within the home.
The number of victims may well not reflect the number of children affected.
5.3.4 Burglary (other)
The number of burglaries (other) rose to 1,458 across the county in 2015-16, an increase of
+18.6% (+229) compared to 2014-15. However, as crime numbers for burglary (other) were
significantly lower in 2014-15 compared to previous years, the trend over a three year period
shows that crimes have in fact fallen by -8.9% (-143) compared to 2013-14. Over the
12 months to March 2016, all districts with the exception of Eden and South Lakeland have
experienced an increase in burglary (other) crimes, with the highest increase shown in
Barrow-in-Furness +82.7% (+81). A decrease is apparent in Eden during this same
period, -13.0% (-20).
The overall crime rate for the county stands at 2.9 per 1,000 population for 2015-16. Crime
rates in Allerdale and Barrow-in-Furness are both higher than the county average at 3.8 and
3.2 respectively. South Lakeland has the lowest rate at 2.4.
Crime rates for burglary (other) very across the county’s wards. Two wards in Allerdale have
rates more than three times higher than the county rate: St Michael’s ward (12.0 per 1,000)
and Crummock ward (11.1) (Cumbria Constabulary, 2016a). Cumbria’s ten wards with the
highest crime rates for burglary (other) are show in Table 5.

JSNA Staying Safe - draft for Health and Wellbeing Board
Page 23 of 108
Table 5: Burglary (other), Cumbrian wards with the highest offence rates 2015-16
Burglary (other), 2015-16
District Ward Number of crimes
Offence rate per 1,000
population
Allerdale St Michael's 60 12.0
Allerdale Crummock 17 11.1
Allerdale Stainburn 14 8.4
South Lakeland Kendal Fell 18 7.8
South Lakeland Windermere Bowness South 17 7.6
Copeland Frizington 20 7.5
Carlisle Castle 42 7.3
Copeland Ennerdale 7 7.2
Eden Kirkby Stephen 18 6.9
Allerdale Moss Bay 35 6.8
Source: (Cumbria Constabulary, 2016a)
Known victims of burglary (other) totalled 959 in 2015-16 and were predominately male
(64.4%, 618) compared to 26.2% (251) female. Gender of a further 90 victims (9.4%) is
unknown. Males aged 41 and over made up almost half of all victims (46.9%, 450). Five
wards had more than 10 male victims of burglary (other) in the 41+ age range:
Barrow-in-Furness: Risedale (13); Newbarns (15)
Carlisle: Denton Holme (12); Dalston (11)
Copeland: Egremont South (12) (Cumbria Constabulary, 2016a)
However, as the number of known victims (959) is less than the total number of burglary
(other) offences (1,458) it is likely that the current picture of victims may be incomplete.
5.4 Violent Crime
Violent crime is an offence in which an offender uses or threatens force upon a victim. The
following sections look at various aspects of violent crime: violence against the person;
hospital admissions for violent crime (including sexual violence); domestic abuse; and sexual
offences. Alcohol related violence against the person offences are covered in the Drug and
alcohol misuse section.
5.4.1 Violence against the person
Who is at risk, and why?
The Crime Survey for England and Wales in 2011-12 established that 3 in every 100 adults
had been a victim of violent crime of some sort in the preceding 12 months. The likelihood
of becoming a victim of violent crime decreased with age, particularly for those aged 75 and
over. The age group most at risk of violent crime is considered to be young adult males,
aged 16-24 (Office for National Statistics, 2013).
Women and girls are at risk of violence. One in six cases (16.3%) of all the Crown
Prosecution Service caseload in 2014-15 was related to violence against women and girls,
an increase of 3.8 percentage points compared to 2013-14. From victims where age was
recorded, two thirds (66%) were aged 25-59 years, 23% were aged 18-24 years. Victims
can be vulnerable for a wide range of reasons, including age, drugs, alcohol, learning

JSNA Staying Safe - draft for Health and Wellbeing Board
Page 24 of 108
difficulties and mental health issues. Of the defendants prosecuted, 93% of those with
recorded gender were male, 7% female. The majority of defendants (71%) were aged
25-59 years, although just over one fifth (22%) were aged 18-24 (Crown Prosecution
Service, 2015).
In Cumbria, local data suggests that victims of violence against the person crimes are more
likely to be aged 18 to 30 years, both male and female.
What local data tells us
Cumbria has seen a rise in reported violence against the person offences across the county
during 2015-16 to 7,376 in total. Violence against the person offences have also increased
nationally (England and Wales) by 27% and are considered to reflect improvements in crime
recording processes by the police (Office for National Statistics, 2015b). County-wide,
reported crimes increased by +12.6% (+826) compared to the previous year, less than the
national increase. Alcohol played a part in 29.3% (2,161) of violence against the person
offences in 2015-16, a reduction of 4.4 percentage points compared to the previous year.
Violence against the person offences have been rising over a four year period, from 4,448 in
2012-13 to 7,376 in 2015-16. Recorded crimes have risen in all districts with the exception
of Allerdale, where reported crimes have remained stable. Three districts
(Barrow-in-Furness, Carlisle and Copeland) had crime rates higher than the county average
of 14.8 per 1,000 population. Barrow-in-Furness had the highest rate (21.3) whilst Carlisle
had the highest number of recorded crimes (2,017). The lowest crime rate was found in
Eden (8.1).
The picture of violence against the person crime varied across the county in 2015-16. Three
wards had crime rates more than four times the county rate in 2015-16: Castle ward in
Carlisle (88.8 per 1,000), Hindpool ward in Barrow-in-Furness (69.8) and Harbour ward in
Copeland (59.2). Wards across five districts made up the ten wards with the highest crime
rates in the county (Cumbria Constabulary, 2016a). These are illustrated in Table 6.
Table 6: Violence against the person, Cumbrian wards with the highest offence rates
2015-16
Violence against the person, 2015-16
District Ward Number of crimes
Offence rate per 1,000
population
Carlisle Castle 509 88.8
Barrow Hindpool 396 69.8
Copeland Harbour 234 59.2
Barrow Central 243 54.0
South Lakeland Kendal Fell 111 48.4
Barrow Barrow Island 105 41.7
South Lakeland Lyth Valley 84 39.2
Allerdale St Michael's 189 37.7
Carlisle Currock 214 34.3
Allerdale St John's 171 30.8
Source: (Cumbria Constabulary, 2016a)

JSNA Staying Safe - draft for Health and Wellbeing Board
Page 25 of 108
Rising violence against the person crime rates may be a result of improved crime recording
practices in recent times rather than increased levels of crime. Following an inspection of
crime data integrity, carried out by Her Majesty’s Inspectorate of Constabulary, a report
published in November 2014 found that violence against the person offences had the
highest under-recording rates, and that one third (33%) of violence offences that should
have been recorded as crimes were not recorded as such. Following the report, steps have
been taken by Cumbria Constabulary to improve crime data integrity and compliance with
the National Crime Recording Standard (Cumbria Constabulary, 2015a)..
The Force Strategic Assessment (Cumbria Constabulary, 2015a). states that one of the
largest increases is in offences classified as harassment. Targeting violent crime remains a
priority for Cumbria Constabulary (Cumbria Constabulary, 2015a).
In 2015-16, 45.5% of violence against the person victims were female, 44.4% male; gender
was unknown in the remaining 10.1% of instances. Females and males aged between 18
and 30 years were the group most at risk of violence against the person (16.5% and 14.1%
of victims respectively). Six wards in the county had more than 50 violence against the
person victims aged 18 to 30 years in 2015-16:
Allerdale: St John’s ward (81); St Michael’s ward (66)
Barrow-in-Furness: Hindpool ward (166); Central ward (98)
Carlisle: Castle ward (250); Currock ward (79) (Cumbria Constabulary, 2016a)
5.4.2 Hospital admissions for violent crime (including sexual violence)
Introduction
The policy paper Call to end violence against women and girls published by the Home Office
in 2010 under the 2010 to 2015 Conservative and Liberal Democrat coalition government set
out the strategic ambition to address violent crime, including sexual violence. Since 2009/10
hospital admissions for violent crime (including sexual violence) have been falling across the
North West and England (Public Health England, 2015).
Who is at risk, and why?
Females and males aged between 18 and 30 years were the group most at risk of violence
against the person in Cumbria during 2015-16. Females aged from 0-17 years were the
group most at risk of sexual offences in 2015-16 in Cumbria.
What local data tells us – hospital admissions
Cumbria’s directly age standardised rate of hospital admissions for violence (including
sexual violence) was 43.2 per 100,000 population in 2012-13 / 2014-15, significantly better
than both the national (England) rate of 47.5 and the North West rate of 74.6, having
previously been similar to the England rate. Cumbria’s rate has seen a steady improvement
since 2010-11/2012-13 when the county’s rate was 52.3. North West and England rates
have also improved within this time period. In terms of numbers, 592 people were admitted
to hospital in Cumbria for reasons of violence and sexual violence during 2012-13/2014-15,
a decrease of -12.7% (-86) (Public Health England, 2015).
Variations can be seen across Cumbria’s districts. Although hospital admission rates have
decreased in 2012-13/2014-15 compared to the previous reporting period in Allerdale

JSNA Staying Safe - draft for Health and Wellbeing Board
Page 26 of 108
(40.6 per 100,000), Carlisle (42.6) and Copeland (45.3), their rates are similar to the England
rate rather than significantly better. Copeland has the second highest rate of all Cumbria’s
districts. Carlisle had the highest number of admissions (137 people) (Public Health
England, 2015).
The rate in Barrow-in-Furness has seen a small decrease in 2012-13/2014-15 to 69.0 per
100,000 from 71.9 in the previous reporting period. However, the decrease has been
smaller than the fall seen nationally and regionally and Barrow-in-Furness remains
significantly worse than England (47.5) and similar to the North West. Barrow-in-Furness
has the highest rate of all Cumbria’s districts (Public Health England, 2015).
Although Eden remains significantly better than England and the North West at 21.4 per
100,000 the district’s rate has increased from 19.8 per 100,000 in the previous reporting
period. However, in terms of numbers the increase is relatively small: 30 people were
admitted to hospital in 2012-13/2014/15, an increase of +2. Eden has the lowest rate of all
the districts (Public Health England, 2015).
South Lakeland similarly has seen a small rate rise in 2012-13/2014-15 to 37.2 per 100,000
from 36.3, although numbers admitted remain the same at 94 people. Whilst South
Lakeland remains significantly better than England and the North West, the gap between
South Lakeland and the England rate is narrowing (Public Health England, 2015).
What local data tells us - hospital Emergency Department attendances
As promoted by the World Health Organisation (WHO), the recording and sharing of
Emergency Department (ED) data is a key element of injury prevention and therefore data
collected by EDs can contribute to the reduction of violence. Within Cumbria there are three
Emergency Departments (EDs): Cumberland Infirmary in Carlisle; West Cumberland
Hospital in Whitehaven; and Furness General Hospital in Barrow-in-Furness.
Between April 2014 to March 2015, there were 41,352 ED injury attendances in Cumbria, a
figure which includes non-Cumbrian residents. Compared to the previous year this was an
increase of +1.0% (+405) from 40,947. Between the same period, there were 1,209 assault
related attendances, an increase of +144 (13.5%) from the previous year. Males aged
between 15 to 29 accounted for the greatest proportion (42.4%) of assault related injuries
over this three year period. Between 2014-15, there were 7,439 children aged 0-14 years
presenting with injuries, of those 52 (0.7%) were assault related attendances; 6,879 young
people aged 15-24 years presented with injuries, of those 472 (6.9%) were assault related
attendances (Liverpool John Moores University, 2016).
However, there are limitations with the data. Hospitals within the North Cumbria University
Hospitals NHS Trust (Cumberland Infirmary and West Cumberland Hospital) currently do not
collect enhanced data for assault-related injury attendances, and therefore it is not possible
to differentiate between assault types. For example, sexual violence is not specified, but is
marked generally as “assault”. Furness General Hospital has started to record enhanced
data, although improvements in data quality are required before reporting is available. A
breakdown of assault attendances by district is not currently available.

JSNA Staying Safe - draft for Health and Wellbeing Board
Page 27 of 108
5.4.3 Domestic abuse
Introduction
Targeting domestic abuse is a priority for Cumbria Constabulary (Cumbria Constabulary,
2015a).
Who is at risk, and why?
Refuge (2016) report that over a third of domestic abuse starts or gets worse when a woman
becomes pregnant, putting both the mother and unborn baby at risk. Abuse can increase
the risk of miscarriage, infection, premature birth, low birth weight, foetal injury and death.
What does local data tell us?
Recorded instances of domestic abuse have increased slightly in 2015-16 by +1.1% (+81)
compared to the previous year and by +2.8% (+195) over a three year period. The largest
increase compared to the previous year has occurred in the Eden district at +19.0% (+60),
whilst Carlisle district has the largest number of recorded domestic abuse incidents (1,887).
Eden district remains the district with the fewest number of domestic abuse crimes, with 375
recorded in 2015-16. An increase was also apparent in Barrow-in-Furness (+4.9%, +70) and
Carlisle (+7.3%, +129). Two districts experienced decreases in recorded domestic abuse
crimes: Allerdale (-6.4%, -96) and Copeland (-6.9%, -86). There was no significant change
in South Lakeland.
Cumbria’s crime rate for domestic abuse in 2015-16 is 14.3 per 1,000 population, an
increase of +0.1 percentage point compared to 2014-15. Four districts have rates higher
than that of the county: Allerdale (14.6), Carlisle (17.5), Copeland (16.7) and the highest rate
in Barrow-in-Furness (22.3). The lowest rate is found in Eden, at 7.1 per 1,000.
Proportionally, repeat victims accounted for 38.8% of all domestic abuse incidents in
2015-16, a decrease of -0.3 percentage points compared to 2014-15. At least a third of
domestic abuse victims in all districts were repeat victims in 2015-16. Proportions were
higher than that of the county as a whole in three districts: Barrow-in-Furness had the
greatest proportion of repeat victims (41.2%), followed closely by Copeland (40.2%) and
Carlisle (39.6%). Eden district had the lowest proportion of repeat victims (33.1%) although
the highest percentage point change (+7.7) of all the districts. South Lakeland also saw the
proportion of repeat victims increase by +5.1 percentage points to 34.4%. The largest
percentage point decrease occurred in Allerdale district, -3.7 percentage point to 37.8%.
During 2015-16, there were 435 referrals to access Cumbria’s Independent Domestic
Violence Advisory services through ‘Let Go’, an increase of +4.1% (+17). Of these,
304 (69.9%) were new referrals, clients who have not previously accessed the service. The
majority were female (94.7%, 412). The majority of clients (80.0%, 348) were aged between
21 and 50 years old. The age group with the largest proportion of referrals (32.2%, 140) is
that of those aged 21 to 30 years. Referred clients were mainly White British or Irish
(94.0%, 409). The proportion of clients with a BME background in 2015-16 was 5.1%
(22 referrals), an increase of +2.0 percentage points (+9 referrals) compared to 2014-15
(Let Go, 2016). The proportion of BME clients referred to Let Go (5.1%) is higher than the
proportion of BME residents in Cumbria identified within the 2011 Census (3.5%). Although
the proportion of referred BME clients is higher, the numbers are relatively small. The
increase in BME referrals is indicative that there are established referral routes to these

JSNA Staying Safe - draft for Health and Wellbeing Board
Page 28 of 108
communities that are generally considered harder to reach. Further analysis on proportions
of BME referrals is limited given the BME client data available.
In two thirds of referrals in 2015-16 there were children in the household. In total,
572 children were present, an average of 2.1 per household. The majority of children
(65.2%, 373) were aged from 0 to 11 years; 22 clients (5.1%) were pregnant (Let Go, 2016).
In economic terms, 54.7% (238) of referred clients were not in paid employment, and
43.0% (187) had an annual household income of less than £15,599. One third (36.6%, 159)
either had, or foresaw having financial problems, an increase of +5.0 percentage points
compared to 2014-15 (Let Go, 2016).
Mental health issues were common and suffered by 40.2% (175) of clients, 68% (119) of
whom have accessed a specialist service. Around one in eight (11.7%, 51) have either
planned or attempted suicide, 11.5% (50) have self-harmed, 5.1% (22) have misused drugs
and 9.0% (39) have misused alcohol. Disability affects 15.6% (68) of clients (Let Go, 2016).
In the three months prior to intake, physical abuse was experienced by 55.9% (243) of
clients; 19.3% (84) experienced sexual abuse; 64.8% (282) experienced harassment and
stalking; and 75.6% (329) experienced jealous and controlling behaviours (Let Go, 2016).
There are serious socio-economic issues surrounding the perpetrators: 39.5% (172) have
misused drugs; 40.2% (175) have misused alcohol; 41.6% (181) had mental health issues;
22.3% (97) had financial problems; and 41.8% (182) had a criminal record related to
domestic violence. The majority of perpetrators were male (94.5%, 411); females made up
5.5% (24) of the total in 2015-16 (Let Go, 2016).
5.4.4 Sexual offences
Introduction
Quantifying the true prevalence of sexual offences is difficult. There are difficulties in
obtaining reliable information on the extent of sexual offences as these incidents are under
reported. Police forces and other agencies have worked towards improving their response
to the victims of sexual violence, however, figures on sexual offences are largely influenced
by the willingness of victims to come forward (NHS Cumbria CCG, 2013).
Reported sexual offences have continued an increasing trend within Cumbria as they have
nationally. The increase is considered to be due to a combination of improvements in
recording by the police and an increase in the willingness of victims to come forward and
report to the police (Office for National Statistics, 2015b).
Who is at risk, and why?
The number of people accessing support services demonstrates a high demand and need
for support. Cumbria’s Bridgeway Sexual Assault Service became fully operational in
December 2015, and has confirmed the need for clinical, therapeutic and support services.
By the financial year end 2015-16 over 200 people had been supported by the Independent
Sexual Violence Advisor (ISVA) service, with the number accessing forensic examination
(which includes immediate sexual health care) higher than expected. Approximately half the
cases were under 16 years old. A number of self-referrals have come forward who have

JSNA Staying Safe - draft for Health and Wellbeing Board
Page 29 of 108
then been supported to report to the police. This indicates a demand and need for non-
police routes to services (Office of the Police and Crime Commissioner, 2016).
Sexual violence and harassment of young people is not uncommon. A survey
commissioned by the Commons’ Women and Equalities Committee indicates that around a
quarter (27%) of young adults aged 16 to 25 years had felt pressured into “sexting” and
sexual activity. Survey results have been captured within the report, Sexual Harassment
and Violence in Schools (Fixers, 2016). Within the report, young people report that they had
felt under enormous pressure to have sex and behave in a sexualised way from around the
age of 12 years, and sometimes younger. Bullying and blackmail, both in the digital and
physical world, are potential consequences when sexual images are broadcast to
unintended recipients, a situation which can potentially result in young people dropping out
of school and having suicidal thoughts. Pressure facing young adults is intense. Some girls
report being “bullied for being a virgin”, or branded as “frigid” by their peers; others describe
a “lad culture” where boys are awarded “lad points” for having sex (Fixers, 2016).
Young people aged under 16 years are more likely to be the victim of sexual offences.
Victims aged over 16 are more likely to be female (Office of the Police and Crime
Commissioner, 2016). Evidence suggests that one in five women aged between 16 and 59
have experienced some form of sexual violence since the aged of 16 (Safety Net, 2015).
What local data tells us
Cumbria Constabulary sexual offences data for 12 months to March 2015 suggest that just
under half of all sexual offences (46%) had an adult victim over the age of 16, and that
17% (50) of reported offences were historic. Over a three year period 83% (247) of victims
aged 16 and over were female. During the period April 2014 to March 2015 19% (56) of 298
sexual offences with victims aged over 16 were committed by a stranger, 42% (125) of
victims knew the offender and 71 (24%) were marked as the relationship between the victim
and offender being partner, ex-partner or family (Office of the Police and Crime
Commissioner, 2016).
In 2015-16, reported sexual offences totalled 857, around 3.3% of all crime in this period.
Reported sexual offences increased by +23.5% (+163) compared to 2014-15, and by
+102.1% (+433) compared to 2013-14. The increase in Cumbria’s sexual offences in
2015-16 compared to the previous year was less than the national increase (England and
Wales), at +29% (Office for National Statistics, 2015b).
The rise in 2015-16 is mirrored across all districts with the exception of Allerdale and
Barrow-in-Furness, where no significant change has been seen. The highest increase
during 2015-16 compared to the previous year can be seen in Carlisle, +58.9% (+76); no
districts have experienced a decrease over the same time period.
Although no significant change has been seen in Barrow-in-Furness, the district has the
highest crime rate (2.1 per 1,000 population). Crime rates for Barrow-in-Furness, Carlisle
and South Lakeland are all higher than the county rate (1.7). Eden has the lowest rate (1.3).
Three wards across the county have a higher crime rate for sexual offences than the county
rate: Lyth Valley ward in South Lakeland is the highest at 9.8 per 1,000 population, 5.7 times

JSNA Staying Safe - draft for Health and Wellbeing Board
Page 30 of 108
higher than the county rate; Central ward in Barrow-in-Furness was 6.7 per 1,000 and
Sedbergh and Kirkby Lonsdale ward in South Lakeland 6.6 per 1,000. However, it should be
noted that for two of these wards (Lyth Valley / Sedbergh and Kirkby Lonsdale) the offence
rates are likely to be high as a result of two large scale historical investigations dating back
several decades. Cumbria’s ten wards with the highest crime rates are listed in Table 7.
Table 7: Sexual offences, Cumbrian wards with the highest offence rates 2015-16
Sexual offences, 2015-16
District Ward Number of crimes
Offence rate per 1,000
population
South Lakeland Lyth Valley 21 9.8
Barrow-in-Furness Central 30 6.7
South Lakeland Sedbergh and Kirkby Lonsdale 40 6.6
Carlisle Castle 35 6.1
Barrow-in-Furness Hindpool 27 4.8
South Lakeland Kendal Fell 10 4.4
South Lakeland Kendal Far Cross 9 4.3
South Lakeland Kendal Highgate 9 4.0
Eden Penrith West 13 4.0
Carlisle Botcherby 24 3.8
Copeland Harbour 15 3.8
Source: (Cumbria Constabulary, 2016a)
The greatest proportion of victims of sexual offences in 2015-16 were female (75.4%). Male
victims accounted for one in five (19.9%) of all victims; gender is not known in the remaining
4.7% of offences. Females aged from 0-17 years accounted for 43.0% of all victims, with
females aged between 18 and 30 years making up 17.8%. The largest proportion of male
victims of sexual offence crimes were aged from 0-17 years (17.3%, 146).
Five wards had 10 or more female victims of sexual offences aged between 0 and 17 years:
Barrow-in-Furness: Central (14); Parkside (13); Hindpool (10)
Carlisle: Botcherby (16); Castle (11) (Cumbria Constabulary, 2016a)
(Cumbria Constabulary, 2015a) Cumbria Constabulary’s Force Strategic Assessment raises
concerns around an increase in taking or making indecent images of children, which has
risen nearly four-fold from 13 offences in 2012-13 to 48 offences in 2014-15. In this type of
offence, it is becoming increasingly common for children to become offenders by taking and
sharing photographs of themselves and others in their peer group via social media and text.
The proportion of child offenders under 16 years old in 2014-15 in relation to indecent
images of children was 46% (41 out of 90 offenders in 69 offences). It is likely that the
availability of internet devices and technology to increasingly younger children is enabling
this type of offence to take place. In 2012-13 the youngest offender was aged 13 years; this
reduced to 11 years in 2014-15 (Cumbria Constabulary, 2015a). It is unclear whether this
increase in offenders aged under 16 years represents an actual increase, or whether it
relates to improvements in recording, awareness amongst young people, and a greater
willingness to come forward to report crimes.

JSNA Staying Safe - draft for Health and Wellbeing Board
Page 31 of 108
Evidence of what works
A partnership of public, private, charitable and voluntary agencies has been working to
improve prevention and support to victims of sexual offences. It has identified that the needs
of victims could be met through a number of measures:
Continuing to keep a high profile for sexual assault and providing supportive options
for people to come forward to obtain help;
Providing a range of support for the physical and sexual health needs, emotional or
therapeutic needs and practical difficulties of victims;
Joining-up services so that people obtain all the services they need and experience a
service that is as seamless as possible;
Providing awareness raising and challenging beliefs (particularly views on consent)
to reduce sexual offending and help people be more resilient (not implying in any way
that they are to blame for becoming a victim) alongside preventative work with people
showing sexually harmful behaviour;
Increasing the confidence of professionals and acceptance of responsibility for
identifying sexual abuse or risk factors, including child sexual exploitation (Office of
the Police and Crime Commissioner, 2016).
In December 2015 a countywide service under the umbrella of The Bridgeway became fully
operational. The Bridgeway provides ISVA services from age 5 (previously different services
were offered in different parts of the county and limited support for under 16s), some
therapeutic services, forensic-medical care, a 24/7 helpline and a single point of access to
support services for sexual assault / abuse victim across Cumbria. A new specialist centre
in Penrith means that victims of sexual offences no longer have to travel to Preston to have
a forensic-medical examination. Therapeutic services in the county have also expanded
over recent years so that there are specialist services available across the county for adults
affected by sexual abuse as well as children (Office of the Police and Crime Commissioner,
2016).
The National Society for the Protection of Cruelty to Children (NSPCC) provides a range of
support programmes for children who have been victims of child sexual exploitation, sexual
abuse, are displaying sexually harmful behaviour and those children where abuse is
suspected but has not been disclosed. Safety Net (North, East and West Cumbria) and
Birchall Trust (South Cumbria) provide specialist therapeutic services for children and adults
who have been victims of sexual abuse, including working as part of the Bridgeway service.
Victim Support (as well as providing the ISVA service for The Bridgeway) also supports
victims of sexual offences through specially trained volunteers for the offences and levels of
risk which are less high, complementing the service provided by the ISVAs. The Brathay
Trust is running a relatively new programme with young people identified as being at risk of
child sexual exploitation. There is additional support from Freedom Project and Let Go
specialist services for people affected by domestic abuse, where sexual abuse is quite often
a factor (Office of the Police and Crime Commissioner, 2016).
5.5 Children and young people
Issues around child abuse, child sexual exploitation and children missing from home,
including who is at risk and evidence of what works are covered in detail in the JSNA
Children and Families chapter, published in November 2015, and available via the Cumbria

JSNA Staying Safe - draft for Health and Wellbeing Board
Page 32 of 108
Intelligence Observatory website. The following sections provide an overview and include
information that has become available since the original chapter was published.
5.5.1 Child abuse
Cumbria Constabulary (Cumbria Constabulary, 2015a) report that more children are victims
of sexual offences than adults. During the 12 months to the end of July 2015, 57% of victims
were aged under 16 years, with over a quarter of child sexual abuse occurring within the
family (Cumbria Constabulary, 2015a). The Crime and Disorder Dashboard (Cumbria
Constabulary, 2016b) indicates that there were 177 recorded instances of child cruelty
during 2015-16, an increase of +24.6% (+35) compared to the previous year. Targeting
child abuse is a priority for Cumbria Constabulary (Cumbria Constabulary, 2015a).
5.5.2 Child Sexual Exploitation
Introduction
Targeting child sexual exploitation (CSE) is national priority and has a high media profile. It
is also a priority for Cumbria Constabulary (Cumbria Constabulary, 2015a).
Who is at risk, and why?
Children missing from home form the majority of vulnerable missing persons; this group is
considered to be often the group most at risk of abuse and CSE whilst missing from home.
The most common group for victims of grooming is 13 to 14 year old girls (Cumbria
Constabulary, 2015a).
What local data tells us
The overall picture of CSE within Cumbria is identified as single victim / single offender type
offending; little is associated with groups or gangs (Cumbria Constabulary, 2015a).
During 2015-16, reported crimes with a CSE marker totalled 349, an increase of +47.9%
(+113) compared to 2014-15 (Cumbria Constabulary, 2016a).
It is acknowledged that the ‘selfie’ and ‘sexting’ culture is increasing the risks faced by
children and young people. Children and young people are more easily exposed to
pornography with increased use and availability of the internet. This exposure may affect
their judgement of what is acceptable and normal behaviour, increasing risk of making them
vulnerable to abuse and exploitation (Cumbria Constabulary, 2015a).
Sexual grooming offences have remained fairly low across Cumbria, totalling 13 in 2015-16,
an increase of +8.3% (+1) compared to 2014-15.
Evidence of what works
Increases in crimes with a CSE marker are considered by Cumbria Constabulary to be a
result of increased awareness of CSE as a result of awareness raising initiatives. One
initiative used in Cumbria is the theatrical production, Chelsea’s Choice, a play designed to
educate young people aged 12+ about the serious and emotional issue of CSE, raising
awareness of the issues and the devastating impact that sexual exploitation has on a young
person’s life. The play has been performed to around 14,000 young people in schools over
the last two years (Cumbria Constabulary, 2016c).

JSNA Staying Safe - draft for Health and Wellbeing Board
Page 33 of 108
A further initiative is being trialled in the county. The project ‘Tackling CSE in Cumbria’
works in partnership with the Office of the Police and Crime Commissioner, Cumbria
Constabulary, Brathay Trust and Local Safeguarding Children Board and is a programme for
young people who are being, or are at risk of being, sexually exploited. The programme will
be delivered by Brathay Trust over two years and aims to create an on-going project that
reduces sexual exploitation and achieves sustainable change and has a wider impact on
service delivery. The Commissioner has agreed to provide £82,500 over two years to
support the delivery of the programme (Office of the Police and Crime Commissioner, 2015).
5.5.3 Children missing from home
Who is at risk, and why?
Young people aged between 12 and 17 years are the most likely group to be missing from
home (Cumbria Constabulary, 2015a). Cumbria Constabulary report that the majority of
people repeatedly missing from home are vulnerable children, living in either residential care
homes or local authority care of some description. It recognised that being missing from
home is an indicator that a child or young person may be the victim of physical and /or
sexual abuse, and that while missing from home vulnerable young people are placed at
increased risk of CSE (Cumbria Constabulary, 2015a).
What local data tells us
In 2015-16, there were a total of 2,404 missing from home cases, an increase of +80.6%
(+1,073) compared to 2014-15. Children and young people under the age of 18 years made
up 93.1% of these cases, an increase of +158.7% (+1,373) compared to the previous year.
Missing from home cases over the age of 18 decreased by -64.4% (-300) compared to the
previous year, and made up 6.9% (166) of the total.
The rise in missing from home incidents in children and young people aged under 18 years
is mainly down to the fact that the ‘absent’ category has been dropped by Cumbria
Constabulary, a decision supported by an All Party Parliamentary Group report which
recommended not using this category (Cumbria Constabulary, 2016c).
Young people aged between 12 and 17 years are the most likely group to be missing from
home. There is a relatively equal gender split between missing 12-17 year olds. Frequent
missing from home incidents contribute towards the total; in the 12 months to July 2015,
frequent missing from home incidents accounted for 40.6% of all reported incidents
(Cumbria Constabulary, 2015a).
During 2015-16 there were 9,180 Vulnerable Child referrals, an increase of +16.4% (+1,292)
compared to the previous year (Cumbria Constabulary, 2016a). Children are considered
vulnerable for a range of reasons including neglect, Children Sexual Exploitation, physical
and/or sexual abuse (Cumbria Constabulary, 2015a). The rise in Vulnerable Child referrals
is mainly as a consequence of the submission of reports in domestic abuse incidents
alongside domestic abuse reports to ensure the risk to children in the household is
adequately assessed. An increase in CSE reporting has also increased the number of
vulnerable child reports (Cumbria Constabulary, 2016c).

JSNA Staying Safe - draft for Health and Wellbeing Board
Page 34 of 108
5.5.4 Young people’s offending
Introduction
Cumbria’s Youth Offending Service (YOS) is a partnership created by the Crime and
Disorder Act 1998, and made up from a range of statutory and other key partners such as
the Police, Probation Service and Health. The service works to: prevent offending and re-
offending by young people aged from 10 to 17 years; deal appropriately with those who do
offend, including encouraging them to make amends for their crimes; and support victims of
crime (Cumbria County Council, 2016f).
Who is at risk, and why?
The majority of young people at risk are male, aged 15 years or older, from a White ethnic
background. Vulnerable young people who are known to Children’s Services may be more
at risk of offending.
What local data tells us
During 2015-16 a total of 320 crimes were committed by young people in Cumbria, a
reduction of -60.4% (-489) compared to 2014-15. The overall number of young people
involved in the criminal justice system stood at 140, a reduction of -57.8% (-192). First Time
Entrants (FTEs) to the youth justice system also reduced from 192 in the period January to
December 2014, to 172 during January to December 2015, a reduction of -10.4% (-20)
(Cumbria County Council, 2016f).
In the 12 months to March 2015 there were 195 FTEs to the youth justice system compared
to the previous 12 months, an increase of +33.6% (+49). The increase in the financial year
to March 2015 was caused by a spike in FTEs between July 2014 and June 2015 (177 FTEs
in this period). However, numbers have since reduced, and overall for the period January to
December 2015 FTEs decreased by -10.4% (Cumbria County Council, 2016e).
Of the 177 FTEs between July 2014 and June 2015, one fifth were female (20.9%, 37) the
majority male (79.1%, 140). Offences of violence are the main reason for which young
people enter the criminal justice system, followed by criminal damage and theft offences.
Notably offences of violence are prevalent in each of the three operational areas in Cumbria:
and North (Carlisle and Eden), South (Barrow-in-Furness, South Lakeland) and West
(Allerdale and Copeland). Of the 177 cases during this period that entered the criminal
justice system, almost a third of cases (55, 31.1%) did so through offences of violence. In
total, 97 of the 177 (54.8%) were made subject to a Referral Order, 65 (36.7%) received a
Youth Caution or Youth Conditional Caution and the remaining 15 young people (8.4%)
received other court disposals. A large proportion of the young people who entered the
criminal justice system as a FTE already had involvement with Cumbria Children’s Services.
Of the 177 young people, 52 had current involvement representing 29.4% of the cohort. A
further 26 had had previous involvement (14.7%) (Cumbria County Council, 2016e).
Youth re-offending rates after 12 months in respect of the July 2013 to June 2014 cohort
stand at 1.08 re-offences per young person overall, lower than both the England and North
West rates (1.18 and 1.37 respectively) and a small reduction of -0.16 compared to 2013-14
(1.24) (Cumbria County Council, 2016f). Not all go on to re-offend. Of the 354 young
offenders in the July 2013 to June 2014 cohort, two-fifths (41.0%, 145) went on to reoffend
resulting in 2.63 re-offences per young person (382 re-offences in total). However,

JSNA Staying Safe - draft for Health and Wellbeing Board
Page 35 of 108
compared to the same period in 2013-14 there were 16% fewer re-offenders, representing
28 young people, and a -29% reduction in the number of re-offences (-156). Fewer
re-offenders and fewer re-offences resulted in fewer victims over this period (Cumbria
County Council, 2016e).
Custodial sentences have steadily reduced over the years. In 2015-16 Cumbria saw 16
custodial sentences, a reduction of -50.0% (-16) compared to 2014-15 and a reduction
of -60.0% (-24) over a five year period (Cumbria County Council, 2016f).
Data from the Youth Justice Board indicates that of the young people in England and Wales
who received an out of court or court disposal (a substantive outcome) in the year ending
2015, the majority (82%) were male, 77% were aged 15 years or older and 78% came from
a White ethnic background (Ministry of Justice, 2016).
Evidence of what works
Prevention of young people entering the youth justice system is paramount and as part of
the County Councils 11-19 years contracts the Youth Crime Prevention Triage Service was
commissioned to deal with young people who are arrested for a low level offence and admit
guilt. This service was delivered by Cumbria Nacro Services, however recent developments
have seen all 11-19 years contracts brought in-house, this area of work is now under a
‘statement of change’ (Cumbria County Council, 2016e).
During the period January 2014 to June 2015 (inclusive) a total of 433 young people were
referred to the Prevention Triage Services: 152 in the north area; 133 in the south; 148 in the
west. Of those who received Prevention Triage Services, it is known that around 34 went on
to re-offend and enter the criminal justice system (7.9%), suggesting a 92.1% success rate.
It is acknowledged that further analysis and scrutiny involving a larger cohort may influence
this figure, however based on these findings this would indicate very positive performance
(Cumbria County Council, 2016e).
5.6 Other crime
The following sections explore other areas of crime that affect people living in Cumbria that
have not been capture in other sections. This section covers the following: fraud;
cybercrime; serious and organised crime; terrorism; rural crime; business crime; anti-social
behaviour; criminal damage (including arson); deliberate fires; and hate crime.
5.6.1 Fraud
Who is at risk, and why?
Fraud is a deceptive crime, often targeting organisations and individuals indiscriminately.
Some victims may be unaware that a crime has taken place, or that they are a victim.
Others may be so embarrassed that they have been a victim, that they are unwilling to report
the offence to the police (Office for National Statistics, 2015b).
What local data tells us
The Office for National Statistics (2015b) report an increase of +4% in the volume of fraud
offences referred to the National Fraud Intelligence Bureau (NFIB) at the City of London
Police. In the year to the end of December 2015, referred fraud crimes totalled 617,618
offences. It is considered that these figures do not capture the full picture of fraud, as it is

JSNA Staying Safe - draft for Health and Wellbeing Board
Page 36 of 108
known that many cases of fraud do not come to the attention of the police. It is estimated
that under half of all fraud crimes are reported.
Nationally the largest increase in fraud referred to the NFIB 2015 was in the banking and
credit industry fraud (+12%), crimes involving frauds relating to cheques, plastic cards, and
online bank accounts. This increase is considered to be the result of an increase in reported
identity fraud in account applications. Financial Fraud Action UK reported 1.5 million cases
of fraud on UK-issued cards, cheques and remote banking. Over three quarters of reported
fraud crimes (around 1.2 million, 78%) related to remote purchase fraud, including
telephone, internet and mail order purchases.
Data regarding the extent of reported fraud crimes in Cumbria has not been available for this
JSNA chapter, but should be available in the future.
Evidence of what works
A number of bodies work to prevent the occurrence of fraud offences. These include: Action
Fraud, the UK’s national reporting centre; Cifas, a UK-wide fraud prevention service; and
Financial Fraud Action UK, a body that represents the UK payments industry (Office for
National Statistics, 2015b).
5.6.2 Cybercrime
Advances in technology including the internet, social media, smart phones and tablets have
played a large part in reshaping criminal activity. As well as offenders using technology to
plan and coordinate traditional crimes, a new range of crimes are emerging that are being
committed solely in cyberspace (Cumbria Constabulary, 2015a)..
A national cybercrime definition, published by the National Policing Lead for Cybercrime in
2014, defines cybercrime into three types:
Cyber Dependent Crimes - where a digital system is the target as well as the means
of attack (eg attacks on computer systems to disrupt IT infrastructure, and stealing
data over a network using malware)
Cyber Enabled Crimes – ‘existing’ crimes that have been transformed in scale or
form by their use of the Internet.
The use of the Internet to facilitate drug dealing, people smuggling and many other 'traditional' crime types (Cumbria Constabulary, 2015a)..
What local data tells us
From August 2014 to July 2015, cybercrimes in Cumbria recorded by Action Fraud
increased by +20% (+15) compared to the same period in the previous year, and the number
of cybercrime victims increased by +37% (+421). The number of NFIB disseminations to
Cumbria Constabulary for investigation more than doubled (+111%, +52). It is difficult to
determine whether this increase is an actual increase in cybercrime, or whether it is the
result of increased awareness, and improved reporting and recording processes (Cumbria
Constabulary, 2015a).
Since April 2015, Cumbria Constabulary have been carrying out research to establish
reported cybercrime types. Data available for April to June 2015 suggests an average of
23 offences each month, over half (57%) related to harassment offences. Almost all the

JSNA Staying Safe - draft for Health and Wellbeing Board
Page 37 of 108
harassment offences involved social media use, mainly Facebook or Twitter, and most
related to harassment between ex-partners (Cumbria Constabulary, 2015a)..
Bullying on social media is becoming increasingly common, and can take a variety of forms
including:
Sending threatening or abuse text messages, embarrassing images or videos
‘Trolling’, the practice of sending menacing or upsetting message on social networks
Setting up hate sites or groups about a particular person
Encouraging people to self-harm
Voting for or against someone in an abusive poll
Sending explicit message, also known as sexting
Pressuring children into sending sexual images or engaging in sexual conversations
(House of Commons Library, 2016b).
Indications are that cyberbullying is increasing. The NSPCC report that in 2015-16
cyberbullying was mentioned in 4,541 Childline counselling sessions, an increase of +13%
compared to 2014-15. Sexting was also mentioned in 1,392 counselling sessions, an
increase of +15% compared to the previous year. Much of the bullying is sexist, racist or
homophobic in nature. Cyberbullying can have a detrimental effect on the mental and
physical wellbeing of victims (House of Commons Library, 2016b).
Farmers are the most recent target for cyber criminals. Criminals are aware that farmers
receive considerable annual payments under the EU Common Agricultural Policy, and
attempt to gain fraudulent access to bank accounts (Cumbria Constabulary, 2015a).
Evidence of what works
Cumbria Constabulary has been developing a cybercrime training process over the last
12 months that has improved understanding and will contribute towards better recording and
investigation of cybercrime (Cumbria Constabulary, 2015a).
5.6.3 Serious and organised crime
What local data tells us
(Cumbria Constabulary, 2015a): Organised crime gangs have not historically been a major
issue for Cumbria. However, the Force Strategic Assessment (Cumbria Constabulary,
2015a) suggests that youth gang culture has recently increased in Workington, with
associated offending ranging from anti-social behaviour and criminal damage to serious
violence and sexual offences.
5.6.4 Terrorism
Introduction
Section 47A of the Terrorism Act 2000 allows a police constable in uniform to stop and
search any vehicle and its occupants, or any pedestrian if there is reasonable suspicion that
an act of terrorism will take place House of Commons Library, 2016c).
Who is at risk, and why?
The majority of people arrested and charged with terrorism offences are male, aged under
30 years and British nationals. Many offenders in prison are vulnerable to those promoting
extremist views House of Commons Library, 2016c).

JSNA Staying Safe - draft for Health and Wellbeing Board
Page 38 of 108
What data tells us
Between 11 September 2001 and 31 December 2015, there have been 53 deaths nationally
(England, Scotland and Wales) as a direct result of terrorist acts (excluding that of the
perpetrators). Over this time period 3,157 people were arrested for terrorism related
offences. The majority of those arrested (92%, 2,893) were male, a proportion that was
maintained for those charged and subsequently convicted. Over half (53%) of those
arrested were aged under 30 years; 3% (108) were under the age of 18 at the time of arrest.
The majority (60%) of those convicted of terrorism related offences were under 30 years old.
Over half of those arrested since 2001 (55%) were British nationals. However, the
proportion of British nationals being arrested is changing and in 2015/16 three quarters
(75%) of those arrested were British nationals House of Commons Library, 2016c).
The government has growing concerns in respect of potential radicalisation of individuals
within the prison system. At the end of June 2015, there were 182 prisoners in England and
Wales convicted of, or on remand for offences linked to terrorism and extremism. A wider
group of prisoners hold extremist views but have been convicted for other offences. A much
wider group of prisoners are considered vulnerable to those who would promote extremist
views. There are concerns regarding peer-to-peer radicalisation, and targeting of prisoners
on probation House of Commons Library, 2016c).
Evidence of what works
To support the delivery of the ‘Prevent Strategy’ (part of the Government’s counter-terrorism
strategy designed to tackle the problem of terrorism at its roots and preventing people from
supporting terrorism or becoming terrorists themselves) Cumbria Constabulary will produce
Counter Terrorism Local Profiles that will be shared with Partners to allow for informed
decision making. A Counter Terrorism Local Profile is a report that outlines the threat and
vulnerability from terrorism-related activity within a specific area such as a police Basic
Command Unit, Local Policing Unit, local authority area or force (Cumbria County Council,
2016c).
5.6.5 Rural crime
Cumbria Constabulary’s Rural Crime Strategy 2014-16 identifies rural crime as “any crime
and anti-social behaviour that takes place in a rural location or as identified as rural crime by
the victim”. Four main types of rural crime have been identified: theft, burglary other than in
a dwelling, theft from motor vehicles and criminal damage. Over three years between
2010-2012 rural crime accounted for 19% of all crime in Cumbria affecting rural businesses,
wildlife and the environment, tourism and local people alike (Cumbria Constabulary, 2014).
Average crime rates are considered to be lower in rural areas compared to urban areas
according to the Department for Environment, Food and Rural Affairs (DEFRA). Overall, the
rate of rural crime has been decreasing between 2005-06 and 2012-13 for all crime types
(DEFRA, 2013). Evidence put together by NFU Mutual using claims data also suggests that
rural crime rates are falling. The cost of rural theft was down overall by -15.0% in the UK in
2014. However, rural crime is increasing in some areas, in particular around quad bike theft
and livestock crime (NFU Mutual, 2015).

JSNA Staying Safe - draft for Health and Wellbeing Board
Page 39 of 108
Although rates may be falling, the impact of rural crime is still significant. A survey carried
out by the National Rural Crime Network (2015) across England, Wales and Northern Ireland
in 2015 estimates the financial cost to rural communities to be in the region of £800 million.
The impact could be even greater as the survey established that a significant level of crime
goes unreported.
Criminal gangs often have an impact on Cumbria in relation to acquisitive crime, particularly
in the east of the county, in the Eden district. Farmers too have fallen victim to criminals
from outside the county who target farm buildings and machinery, again particularly in the
Eden district with its links to main arterial routes into the county (A66, A69 and A684)
(Cumbria Constabulary, 2015a).
5.6.6 Business crime
Recorded incidents of business crime continue to rise in Cumbria with 4,866 incidents during
2015-16, an increase of +7.3% (+333) compared to the previous year, and +9.0% (+401)
compared to 2013-14. The largest increase compared to the previous year is in Allerdale
district, +22.1% (+196). Smaller increases were seen in South Lakeland +13.2% (+93) and
Copeland +5.6% (+25). No significant change was observed in Barrow-in-Furness, Carlisle
and Eden. Carlisle continues to have the highest number of recorded business crimes
(1,441) and the highest crime rate at 13.3 per 1,000 population. Allerdale and
Barrow-in-Furness both had crime rates of 11.2 per 1,000 which is higher than the overall
Cumbria rate of 9.8. Eden district had the lowest number of business crimes (322) and the
lowest rate (6.1).
Shoplifting accounted for almost half of all recorded business crimes in Cumbria in 2015-16
(47.4%, 2,308), an increase of +7.0% (+150) compared to the previous year. Shoplifting
increased across all districts with the exception of Barrow-in-Furness where the offence
decreased by -10.5% (-45) compared to the previous year. However, shoplifting continues
to comprise 50.7% (383) of all business crime in Barrow-in-Furness. Shoplifting proportions
were greatest in the Carlisle district, making up 59.5% (858) of recorded crimes, an increase
of +4.4% (+36). Shoplifting proportions were smallest in the Eden district (32.3%, 104)
although the district also experienced an increase of +35.1% (+27).
Criminal damage made up almost a quarter of recorded crimes across the county
(23.5%, 1,142), an increase of +15.2% (+151). The criminal damage proportion of crime
was similar in Allerdale district (22.9%) although the percentage increase (+41.7%, +73) was
higher than the county picture and the highest of all the districts. Barrow-in-Furness had the
largest proportion of criminal damage crimes of all the districts (27.5%) and the second
largest increase in recorded crimes (+24.6%, +41). Copeland experienced the largest
decrease, -9.1% (-11).
The third largest proportion of recorded business crimes for Cumbria as a whole was made
up from the “all other theft offences” category (14.0%, 679), a reduction of -9.1% (-68)
compared to 2014-15. Carlisle district had the lowest proportion of crimes in this category
(9.6%), a decrease of -24.5% (-45) compared to the previous year. Eden had the highest
proportion (23.6%), a decrease of -9.5% (-8). For Allerdale district, a different crime
category made up the district’s third largest crime group; burglary in a building other than a

JSNA Staying Safe - draft for Health and Wellbeing Board
Page 40 of 108
dwelling made up 14.3% of all Allerdale business crimes, an increase of +52.0% (+53)
compared to the previous reporting period.
5.6.7 Anti-social behaviour
Reported anti-social behaviour incidents continue to fall across the county. Throughout
2015-16 a total of 13,803 anti-social behaviour offences were reported, a decrease
of -31.7% (-6,405) compared to 2014-15 and -42.2% (-10,071) compared to 2013-14. This
trend is mirrored across all the districts, with decreases compared to 2014-15 ranging
from -27.5% (-770) in South Lakeland to -36.2% (-527) in Eden. The largest number of
reported offences occurred in Carlisle, where 3,785 crimes were recorded.
Cumbria’s crime rate for anti-social behaviour in 2015-16 is 27.7 per 1,000 population. Two
districts have crime rates higher than the county average: Barrow-in-Furness (41.8) and
Carlisle (35.0). Eden has the lowest crime rate (17.7) and the smallest number of reported
offences (929) during 2015-16. The picture varies across Cumbria’s wards. One quarter
(25.9%, 43) of all wards have crime rates for anti-social behaviour higher than the rate for
the county. Two wards have rates more than five times higher than the county rate: Central
ward in Barrow-in-Furness (170.8 per 1,000); Castle ward in Carlisle (141.2). Ten wards in
Cumbria with the highest crime rate per 1,000 population are listed in Table 8.
Table 8: Anti-social behaviour, Cumbrian wards with the highest offence rates 2015-16
Anti-social behaviour 2015-16
District Ward Number of crimes
Offence rate per 1,000
population
Barrow-in-Furness Central 768 170.8
Carlisle Castle 809 141.2
Copeland Harbour 457 115.6
South Lakeland Kendal Far Cross 225 106.3
Barrow-in-Furness Hindpool 522 92.0
Allerdale St Michael's 443 88.4
Barrow-in-Furness Barrow Island 205 81.5
South Lakeland Kendal Mintsfeet 164 76.5
Carlisle Currock 432 69.3
Eden Penrith South 183 69.0 Source: (Cumbria Constabulary, 2016a)
Youth anti-social behaviour
The picture for youth anti-social behaviour is slightly different. During 2015-16, youth
anti-social behaviour incidents increased very slightly by +1.6% (+61) compared to 2014-15,
giving a crime rate of 7.7 per 1,000 population compared to 7.6 in 2014-15. Reported youth
anti-social behaviour crimes had been decreasing previously. The largest increase during
2015-16 was seen in Carlisle at +20.4% (+192); Allerdale also saw a large increase of
+17.9% (+108). Conversely, Copeland and Eden saw large decreases of -18.8% (-107) and
-17.0% (-40) respectively.
Crime rates in 2015-16 for Barrow-in-Furness and Carlisle are higher than the county (7.7) at
11.6 and 10.5 respectively. Eden has the lowest rate of all the districts (3.7).

JSNA Staying Safe - draft for Health and Wellbeing Board
Page 41 of 108
The picture of youth anti-social behaviour varies across Cumbria’s wards. Three in ten
wards (30.1%) have crime rates for anti-social behaviour higher than the county rate, and
three wards have crime rates four or more times higher than the county rate: Central ward in
Barrow-in-Furness (44.7 per 1,000); Kendal Mintsfeet ward (35.5); and Kendal Far Cross
ward (31.2). Central ward in Barrow-in-Furness had the highest number of recorded
anti-social behaviour crimes (201). Crime rates and numbers for ten wards throughout the
county with the highest anti-social behaviour crime rates can be seen in Table 9.
Table 9: Youth anti-social behaviour, Cumbrian wards with the highest offence rates
2015-16
Youth anti-social behaviour 2015-16
District Ward Number of crimes
Offence rate per 1,000
population
Barrow-in-Furness Central 201 44.7
South Lakeland Kendal Mintsfeet 76 35.5
South Lakeland Kendal Far Cross 66 31.2
Carlisle Castle 174 30.4
Allerdale St Michael's 150 29.9
Barrow-in-Furness Hindpool 154 27.1
Carlisle Belle Vue 174 26.2
Eden Penrith South 65 24.5
South Lakeland Kendal Highgate 41 18.3
Copeland Harbour 72 18.2
South Lakeland Kendal Kirkland 37 18.2
Source: (Cumbria Constabulary, 2016a)
5.6.8 Criminal damage (including arson)
Who is at risk, and why?
Young adults aged between 18 and 30 years were more frequently the victims of criminal
damage and arson crimes in Cumbria in 2015-16 (Cumbria Constabulary, 2016a).
What local data tells us
During 2015-16 there were 5,194 criminal damage offences (including arson) recorded in
Cumbria, an increase of +5.0% (+245) compared to 2014-15. However there has been no
significant change over three years from 2013-14, -0.7% (-37).
All districts saw an increase in offences during 2015-16, with the exception of Copeland
where there was a decrease of -19.1% (-166). The highest increase was in Carlisle,
+15.6% (+189). South Lakeland has also seen a large increase of +31.5% (+182) over three
years compared to 2013-14.
Three districts had crime rates in 2015-16 higher than the county rate of 10.4 per 1,000
population: Barrow-in-Furness (13.0), Eden (13.0) and Allerdale (11.5). Eden had the lowest
rate at 6.3.

JSNA Staying Safe - draft for Health and Wellbeing Board
Page 42 of 108
Across the county, 47 wards had crime rates higher than the county’s rate, 11 of these
wards were in South Lakeland. Three wards had rates almost four times the county rate:
Central and Hindpool wards in Barrow-in-Furness, and Castle ward in Carlisle. Rates and
crime numbers for the ten wards with the highest crime rates during 2015-16 are set out in
Table 10.
Table 10: Criminal damage (including arson), Cumbrian wards with the highest
offence rates, 2015-16
Criminal damage (including arson), 2015-16
District Ward Number of crimes
Offence rate per 1,000
population
Barrow-in-Furness Central 184 40.9
Carlisle Castle 234 40.8
Barrow-in-Furness Hindpool 229 40.3
South Lakeland Kendal Fell 83 36.2
Allerdale St Michael's 174 34.7
South Lakeland Kendal Mintsfeet 69 32.2
Allerdale St John's 167 30.0
Copeland Harbour 112 28.3
Allerdale Moss Bay 138 26.9
Carlisle Currock 155 24.9 Source: (Cumbria Constabulary, 2016a)
During 2015-16, data from Cumbria Constabulary (Cumbria Constabulary, 2016a) indicates
that of the 3,934 people recorded as victims of criminal damage and arson offences, almost
a quarter (23.6%, 928) were aged from 18 to 30 years (both male and female). Eight wards
had 25 or more recorded victims in this age group, with the highest found in Hindpool ward
in Barrow-in-Furnes (46 victims). Five wards were situated within the Carlisle district. All
eight wards are listed below:
Allerdale: Moss Bay (27)
Barrow: Hindpool (46); Central (37)
Carlisle: Castle (37); Belle Vue (35); Currock (30); Morton (27); Denton Holme (25)
5.6.9 Hate crime
What local data tells us
Recorded hate crimes (all types) across the county rose by +12.1% (+41) to a total of 379 in
2015-16 compared to 2014-15, and have risen by +60.6% (+143) over a three year period.
Recorded hate crimes have increased across all districts compared to 2013-14; the lowest
percentage increase has been seen in Barrow at +43.8% (+14) whilst the highest
percentage increase has occurred in Copeland, where recorded hate crimes have doubled,
+100% (+25).
Variations can be seen across the county in 2015-16 compared to the previous year. Hate
crimes have increased in Allerdale, Carlisle, Eden and South Lakeland, with the largest
percentage increase apparent in Eden, +76.5% (+13). However, recorded hate crimes have
decreased in one district, Barrow-in-Furness, by -30.3% (-20) compared to the previous
year. There is no significant change in Copeland.

JSNA Staying Safe - draft for Health and Wellbeing Board
Page 43 of 108
Crime rates for hate crime vary across the districts, from 0.4 per 1,000 population in South
Lakeland to 1.2 in Carlisle. The overall rate for Cumbria is 0.8. Crime rates vary across
Cumbria’s wards. Three wards have crime rates more than five times higher than the county
rate: Castle ward in Carlisle (7.3 per 1,000); Harbour ward in Copeland (4.6) and Hindpool
ward in Barrow-in-Furness (3.9). Crime numbers and rates for ten wards with the highest
hate crime rates in 2015-16 are captured within Table 11.
Table 11: Hate crime (all types), Cumbrian wards with the highest offence rates 2015-
16
Hate crime (all types), 2015-16
District Ward Number of crimes
Offence rate per 1,000
population
Carlisle Castle 42 7.3
Copeland Harbour 18 4.6
Barrow-in-Furness Hindpool 22 3.9
South Lakeland Kendal Fell 7 3.1
Carlisle Currock 17 2.7
Allerdale Christchurch 9 2.6
Eden Appleby (Appleby) 3 2.4
South Lakeland Windermere Bowness South 5 2.2
Allerdale St Michael's 11 2.2
Carlisle Belle Vue 13 2.0
Source: (Cumbria Constabulary, 2016a)
The majority of hate crimes in 2015-16 were racially motivated. Figure 4 provides a
breakdown of hate type crime. It should be noted that a hate crime can have more than one
hate type per crime, so that the total number of hate crimes in the county is less than the
sum of the individual hate crime types (Cumbria Constabulary, 2016a).
Figure 4: Proportion of hate crime by type, 2015-16
Source: (Cumbria Constabulary, 2016a)
Transgender Religious RacistSexual
orientationDisability
% hate crime types 6.3% 5.0% 57.0% 18.7% 14.8%
Nr hate crime types 24 19 216 71 56
0
50
100
150
200
250
Nr
/ %
hat
e cr
ime
typ
es
Hate crime types in Cumbria, 2015-16
JSNA Staying Safe - draft for Health and Wellbeing Board
Page 44 of 108
Recorded instances of hate crime have increased in Cumbria in 2015-16 compared to the
previous year in relation to transgender motivated hate crimes (+300%, +18), religiously
motivated crimes (+35.7%, +5) and racism related crimes (+18.7%, +34). Hate crimes
related to sexual orientation have remained static, whilst disability related crimes have seen
a slight decrease across the county (-6.7%, -4).
The majority of hate crimes within Cumbria in 2015-16 were racially motivated, with the
highest number occurring in Carlisle district (91). Increases were seen in South Lakeland
(+68.8%, +11), Carlisle (+24.7%, +18) and Copeland (+16.0%, +4). The largest percentage
increase was found in Eden district (+77.8%, +7). Only one district experienced a decrease
in racially motivated crimes, Barrow-in-Furness, with a decrease of -21.9% (-7).
Over three in five (62.0%) of hate crimes related to sexual orientation occurred within
Allerdale and Carlisle, with 22 crimes recorded in each district. For Allerdale, this
represented an increase of +83.3% (+10) compared to the previous year, whilst for Carlisle
the increase was smaller at +15.8% (+3). An increase of +5 was recorded in the Eden
district, compared to no recorded crimes over the previous year. Decreases were
experienced by Barrow-in-Furness of -55.0% (-11), Copeland -33.3% (-4) and South
Lakeland -37.5% (-3).
Recorded disability related crimes have decreased slightly in Cumbria in 2015-16 compared
to the previous year (-6.7%, -4), and this is mirrored across three districts. Recorded crimes
decreased in Allerdale (-9.5%, -2), Carlisle (-29.4%, -5), Eden (-20.0%, -1). Increases were
seen however in Barrow-in-Furness (+37.5%, +3) and South Lakeland (+33.3%, +1). There
was no change in Copeland.
Transgender related crimes saw the largest increase in Carlisle, from no recorded crimes in
2014-15 to 8 in 2015-16. Allerdale also saw 8 transgender related crimes in 2015-16,
compared to one in the previous year. Transgender related crimes decreased in Copeland
by -100.0% (-4) with no crimes reported in 2015-16.
Hate crimes for religious reasons decreased in Allerdale (-25.0%, -1) Barrow-in-Furness
(-50.0%, -1) and South Lakeland (-50.0%, -1) in 2015-16 compared to the previous year.
Carlisle saw an increase of +60.0% (+3), whilst Copeland saw the highest increase +400.0%
(+4).
Evidence of what works
It is suspected that hate crime is likely to be under reported and is therefore likely to be
higher. It could therefore be seen as encouraging that numbers of reported hate crime
incidents are increasing.
Initiatives are being carried out in Cumbria to raise awareness and encourage people to
report hate crime. Cumbria Constabulary has 49 Hate Incident Reporting Centres located
throughout the county and online hate crime reporting facilities. In addition, the Cumbria
Office of the Police and Crime Commissioner Turning the Spotlight on Hate Crime
Programme aims to tackle the root causes of hate crime. Individuals who have been
perpetrators of hate crime or who are at risk of offending can be referred to the programme

JSNA Staying Safe - draft for Health and Wellbeing Board
Page 45 of 108
which aims to help and support those individuals to have a better understanding of different
communities and the impact of hate crime on victims, witnesses and their families.
5.7 Offending and Re-offending
The concept of a "dangerous offender" was introduced by the Criminal Justice Act 2003.
Since April 2005, the Act has allowed indefinite imprisonment sentences to be applied in the
interest of public protection and extended imprisonment sentences to be applied in relation
to dangerous sexual offenders and violent offenders.
An estimated 15% of the incidents dealt with by the police in the UK have a mental health
concern. There is difficulty around defining offenders with a mental disorder (whether they
are offenders with a mental health disorder, or people whose mental health disorder has led
them to commit a crime) and therefore whether they should be dealt with by the police or by
mental health services (Community-safety.info, 2015). Whilst the 1983 Mental Health Act
focused on strengthening the rights of patients to seek independent reviews of their
treatment, the Mental Health Act 2007 made some key changes. The main focus is now on
public protection and risk management, and the Act has introduced compulsory community
treatment orders. Police officers have the power to remove anyone from a public place who
is considered to be mentally disordered and requiring immediate care of control. People
have to be moved to a place of safety, such as a hospital or care home, although police
stations can be used as a last resort. Under Section 136, people can be held for up to
72 hours, and during this time they should be assessed by a doctor and an Approved Mental
Health Professional (AMHP).
Who is at risk, and why?
Offending behaviour is often linked to physical and mental health and wellbeing. Mental
disorder and its subsequent impact on crime is considered to be significant, with links
established to persistent offending (Community-safety.info, 2015). A large proportion of
families with multiple needs are managed through the criminal justice system, with needs
often across the generations. Offenders often experience significant health inequalities. It is
understood that re-offending has an impact that is wider than the individual, but affects
additionally offenders’ children, families and the wider communities of which they are part. It
is estimated that Cumbria Constabulary are dealing with an average of 30 to 40 mental
health cases each day (Cumbria Office of the Police and Crime Commissioner, 2016).
In 2014-15, there were a total of 4,855 people registered with a mental health condition
(schizophrenia, bipolar affective disorder and other psychoses) on GP Registers across
Cumbria CCG, a registration rate of 0.94%; this is above the England average of 0.88%.
Levels of deprivation are a key determinant of mental health disorders. People living in more
deprived areas are likely to have higher levels of mental health conditions and higher needs
for services.
Offending - what local data tells us
Probation services were divided in 2014 into a public sector National Probation Service and
21 new Community Rehabilitation Companies (CRCs) operated by primarily private
providers. The National Probation Service has responsibility for monitoring and managing all
high risk of harm offenders and those convicted of sexual offences. Within Cumbria, the
Cumbria and Lancashire Community Rehabilitation Company (CLCRC) manages all

JSNA Staying Safe - draft for Health and Wellbeing Board
Page 46 of 108
offenders not managed by the National Probation Service. The aim of the CLCRC is to
protect the public by delivering effective offender management and rehabilitation services to
low and medium risk offenders who are serving community sentences or have been
released from prison on licence.
CLCRC operate teams covering Barrow-in-Furness, Carlisle and Workington / Kendal. A
further team manages low risk offenders from a central hub. Information provided by
CLCRC at mid-June 2016 indicates there are 1,458 offenders currently residing in Cumbria.
The majority of these (83.7%) are male, 16.3% female. Just over half of all offenders
(53.8%, 784) have been assessed as low risk or re-offending or causing harm, with
45.5% (664) assessed as medium risk. One offender was assessed high risk. In total,
73 offenders are on the active child protection register, an increase of +10.6% (+7)
compared to mid-August 2015, and 219 offenders are on the domestic violence perpetrator
register, an increase of +36.9% (+59) (CLCRC, 2016).
Robbery and violence account for 32.0% of offences committed by offenders managed by
CLCRC, theft (non-motor) makes up 11.0%, drug possession and / or supply account for
10.7%, whilst public order offences make up 10.5% (CLCRC, 2016).
As of June 2016, the National Probation Service in Cumbria was managing 765 offenders.
The majority of the caseload were male (95%, 728), the remainder female (5%, 37). Over
half (57%, 433) were assessed as being of medium risk, 40% (306) were high risk, and
1% (11) were assessed as very high risk. Over half are in custody (53%, 405) and the
remainder serving sentences in the community (47%, 360). The majority of the caseload is
made up of violent offenders (41%, 335), and this will include domestic violence offences.
Almost one fifth (19%, 153) have been convicted of sexual offences against children and
11% (91) of sexual offences against adults (National Probation Service, 2016).
Risks posed by the most serious sexual and violent offenders are managed under
Multi-Agency Public Protection Arrangements (MAPPA), which brings the police, probation
and prison services together as a MAPPA Responsible Authority, working with other local
agencies. At the end of March 2015, there were 608 MAPPA-eligible offenders in Cumbria,
an increase of +10.1% (+56) compared to March 2014. Registered sex offenders accounted
for 72.0% (438) of the total, an increase of +14.4% (+55) compared to the previous year.
Violent offenders made up 27.8% totalling 169 offenders, numbers similar to the previous
year (MAPPA, 2015). At mid-June 2016, the National Probation Service were managing
681 MAPPA-eligible offenders in Cumbria, 89% of the total caseload (National Probation
Service, 2016).
Across a range of 8,377 crimes committed in 2015-16 the majority (78.0%) were committed
by males, with almost a third (32.1%) committed by males aged between 18 and 30 years.
Castle ward in Carlisle had the highest number of crimes committed by males aged 18 to 30
years, with 306 offences during 2015-16. Seven wards with the highest numbers of crimes
committed by males aged 18 to 30 years are situated in four districts:
Allerdale: St John’s (114); St Michael’s (85)
Barrow-in-Furness: Hindpool (176); Central (104)
Carlisle: Castle (306); Currock (101)
Copeland: Harbour (119) (Cumbria Constabulary, 2016a).

JSNA Staying Safe - draft for Health and Wellbeing Board
Page 47 of 108
The majority of offenders of alcohol related violent crimes (with and without injury) in
2015-16 were male (77.6%), with 40.4% of offences committed by males aged 18 to 30
years. Two wards had 80 alcohol related violent crimes committed by male offenders in this
age range: Hindpool ward in Barrow-in-Furness (96 offences) and Castle ward in Carlisle
(80 offences) (Cumbria Constabulary, 2016a).
Although the overall proportion of female offending across a range of crimes is in the region
of 22.0%, some crime categories have higher proportions of female offenders, notably
shoplifting (33.3%) (Cumbria Constabulary, 2016a). Five crime categories with the highest
proportion of female offenders are illustrated in Figure 5.
Figure 5: Crime categories with higher levels of female offenders
Source: (Cumbria Constabulary, 2016a)
Re-offending – what local data tells us
Ministry of Justice proven re-offending statistics for 2013 indicate that 29.1% of offenders in
Cumbria went on to re-offend. This represents an increase of +1.7 percentage points
compared to the previous year, and is a higher proportion than that of the North West
(28.0%) and England (26.4%). Differences were seen across Cumbria’s districts. Three
districts had proportions higher than the Cumbria average: Allerdale (31.3%);
Barrow-in-Furness (31.8%); Carlisle (31.1%). Proportions in Eden (20.3%) and South
Lakeland (23.4%) were lower than England and the North West (Public Health England,
2013).
All districts saw increases in the proportion of re-offenders with the exception of Copeland,
where the proportion decreased by -0.5 percentage points to 27.8%. Barrow-in-Furness had
the largest proportion of offenders who went on to re-offend of all the districts, and Allerdale
Shoplifting All othertheft
offences
Alcoholrelated
violencewithoutinjury
Violencewithout
injury
Violencewith injury
33.3 27.6 27.2 26.4 25.0
66.6 72.1 72.8 73.4 74.8
0.1 0.3 0.0 0.1 0.2
Proportion of male / female offenders
% Female % Male % unknown

JSNA Staying Safe - draft for Health and Wellbeing Board
Page 48 of 108
had the largest increase in percentage points (+4.2). Eden district had the lowest proportion
of all Cumbria’s districts (Public Health England, 2013).
In 2013 re-offences increased across the county by +12.7% to 0.89 re-offences per offender
(from 0.79 in 2012) and were higher than England (0.82) although comparable to the North
West region (0.88). Three districts had rates higher than the Cumbria average: Allerdale
(1.01), Barrow-in-Furness (1.01), Carlisle (0.99). Allerdale had the highest percentage
increase (+34.7%), with a rate higher than England and the North West, having previously
been lower than the North West. The rate in Barrow-in-Furness and Carlisle remained
higher than both the England and North West rate. The rate in Allerdale is now higher than
the North West rate. Rates in Eden (0.49) and South Lakeland (0.60) remained largely
unchanged.
5.8 Drug and alcohol misuse
Issues around drug and alcohol misuse, who is at risk, and evidence of what works are
covered in detail within the JSNA Healthy Living and Lifestyles Chapter published in October
2015 and available via the Cumbria Intelligence Observatory website. The following
sections provide an overview and include information that has become available since the
original chapter was published.
5.8.1 Substance misuse
During 2015-16 there were 2,923 service users in contact with Unity Drug and Alcohol
Services Cumbria (Unity), the county’s provider of statutory services to adults (aged 18+)
with alcohol and drug problems. This represents a decrease of -6.3% in drug and alcohol
referrals (-195 service users) compared to 2014-15 and a decrease of -9.8% (-317 users)
compared to 2013-14. Eden district saw the largest percentage decrease in drug and
alcohol referrals, -17.1% (-40 users) whilst Barrow-in-Furness saw the largest reduction in
terms of numbers (-123, -16.6%) (Unity,2016). The largest number of Unity drug and alcohol
clients are in Carlisle (790) and Barrow-in-Furness (616).
Drug misuse clients reduced overall by -2.8% (-50) within Cumbria in 2015-16. Variations
occurred across the districts. Eden had the largest percentage reduction (-21.1%, -23 users)
whilst Barrow-in-Furness had the largest reduction in terms of numbers (-48, -11.0%).
Carlisle saw a small decrease in drug referrals (-2.3%, -12 users). Copeland was the only
district with a significant increase in drug misuse referrals, +18.5% (+38). There was no
significant change in Allerdale and South Lakeland (Unity, 2016).
Alcohol misuse referrals reduced by -11.0% (-145) across the county in 2015-16, with
reductions in all districts with the exception of Carlisle (+5.9%, +16). The largest reduction in
alcohol referrals was seen in Barrow-in-Furness (-24.8%, -75 service users) (Unity, 2016).
The main use of the service is for drugs related issues (59.8%; 1,749); 40.2% (1,174) use
the service for alcohol related problems. Opiate drugs account for half (50.7%; 1,482) of all
service users, with heroin the most commonly used drug (44.5% / 1,300 of all service users
in the county) (Unity, 2016).
Variations in relation to the main use of Unity’s services across Cumbria’s districts are
illustrated in Figure 6.

JSNA Staying Safe - draft for Health and Wellbeing Board
Page 49 of 108
Figure 6: Main reason for accessing Unity services in Cumbria 2015-16
Source: (Unity, 2016)
Allerdale, Barrow-in-Furness and Carlisle had higher proportions of service users with drug
related problems than the county average (59.8%) at 65.6% (338 service users),
63.0% (388) and 63.5% (502) respectively. The lowest proportion accessing services in
relation to drug problems were found in Eden district (44.3%; 86 service users). Eden was
the only district with a higher proportion of service users with alcohol related problems than
drug problems; 55.7% (108) of service users in Eden accessed the service in relation to
alcohol issues, the highest of all the districts. The split between drug and alcohol problems
in South Lakeland was relatively evenly split: 50.8% (192) service users with drug related
issues, and 49.2% (186) with alcohol related problems (Unity, 2016).
Heroin was the most commonly used drug among Unity service users across all districts,
comprising 44.5% of all clients (1,300). Carlisle district had the highest proportion, with
51.3% (405) of all service users using heroin as their main drug. Allerdale and
Barrow-in-Furness also had high proportions of service users with heroin as their main drug
(49.9% / 257 and 48.7% / 300 respectively) (Unity, 2016).
Two thirds (66.1%; 1,931) of Unity service users in Cumbria during 2015-16 were male,
33.9% (992) female, a picture that is similar across the county’s districts. The majority
(66.0%; 1,930) of all users were aged between 30 to 49 years old with almost one fifth
(19.1%; 557) aged between 35 to 39 years old. Barrow-in-Furness had the largest
proportion of service users aged 30-49 (68.8%, 424), and also the highest proportion aged
35-39 (21.1%, 130). Allerdale also had a larger proportion of service users aged 35-39 than
the county average (21.0%, 108) (Unity, 2016).
In terms of ethnicity, 99.0% of service users in 2015-16 were white. Eden had the largest
proportion of non-white clients (2.1%, 17), whilst Carlisle had the largest number (23, 1.0%)
(Unity, 2016). The proportion of non-white service users does not mirror the proportion of
residents from BME groups across the county’s districts.
0%
50%
100%
55.9% 55.0% 55.2% 42.8% 37.1% 43.1% 50.7%
9.7% 8.0% 8.4% 13.7%
7.2% 7.7% 9.1%
34.4% 37.0% 36.5% 43.5% 55.7% 49.2% 40.2%
Main reason for accessing Unity services 2015-16
Alcohol
Non-opiates
Opiates (incheroin)

JSNA Staying Safe - draft for Health and Wellbeing Board
Page 50 of 108
Across the county, one fifth of service users (583, 19.9%) had children living with them in
2015-16. Three districts had larger proportions of service users with children than the
county average: Barrow-in-Furness, Copeland and South Lakeland. South Lakeland had the
largest proportion (24.6%, 93 service users); Barrow-in-Furness had the second highest
proportion and the highest number (24.4%, 150 service users); Copeland had 22.3%, 96
service users with children. Carlisle had the second highest number of service users with
children, 127 (16.1%) (Unity,2016).
5.8.2 Drug possession and supply
Introduction
Although illegal drug use has fallen over the last decade in England and Wales, the social
costs of drug supply remain significant. Communities are affected through related violence,
anti-social behaviour and acquisitive crime, as organised criminals protect their interests and
users fund drug use. Targeting drug supply, particularly Class A drugs, is a priority for
Cumbria Constabulary (Cumbria Constabulary, 2015a).
Who is at risk, and why?
Local data tells us that those trafficking in drugs are more likely to be male, aged between 18
to 40 years.
What local data tells us
Recorded drug crimes (trafficking and possession) have continued to decrease in the county
in 2015-16. During the year, 1,070 crimes were recorded, a decrease of -22.4% (-308)
compared to 2014-15 and -30.0% (-459) compared to 2013-14. Decreases were seen in all
districts, with the exception of South Lakeland where there was no significant change. The
largest percentage decrease was seen in Allerdale, -39.6% (-120). Large decreases were
also seen in Carlisle, -25.5% (-103) and Eden, -23.7% (-37). The crime rate for Cumbria has
decreased to 2.1 per 1,000 population compared to 2.8 in 2014-15. Three districts have
rates higher than Cumbria: Barrow-in-Furness (2.6); Carlisle (2.8); and Eden (2.3).
Recorded drug possession and supply offences varied across the county’s wards in
2015-16. Almost one quarter (24.7%) of the county’s wards had drug possession and supply
crime rates higher than the county rate. Four wards had rates more than five times the
county rate: Askham ward in Eden (25.3 per 1,000); Castle ward in Carlisle (17.3); Central
ward in Barrow-in-Furness (12.5) and Kendal Fell ward in South Lakeland (11.3) (Cumbria
Constabulary, 2016a).
Recorded drug offences are heavily dependent on police activity and may therefore be much
higher than currently stated (Cumbria Constabulary, 2015a). The high number of offences in
Askham ward are most likely to be a result of the annual music festival, ‘Kendal Calling’, held
annually in the ward and the associated policing opportunities to detect offences at the
event.
Offence numbers and rates for ten wards in the county with the highest crime rates are set
out in Table 12.

JSNA Staying Safe - draft for Health and Wellbeing Board
Page 51 of 108
Table 12: Drug trafficking and possession, Cumbrian wards with the highest offence
rates 2015-16
Drug trafficking and possession 2015-16
District Ward Number of crimes
Offence rate per 1,000
population
Eden Askham 36 25.3
Carlisle Castle 99 17.3
Barrow Central 56 12.5
South Lakeland Kendal Fell 26 11.3
Barrow Barrow Island 23 9.1
Copeland Harbour 35 8.9
South Lakeland Windermere Bowness South 17 7.6
Eden Penrith West 24 7.4
Allerdale St John's 41 7.4
Barrow Hindpool 33 5.8
Source: (Cumbria Constabulary, 2016a)
Those trafficking drugs are more likely to be male, aged between 18 and 30 years. In
2015-16 a total of 91 (44.2%) offenders fell into this category. Males aged 31 to 40 made up
a further 27.2% (56). Botcherby ward in Carlisle had the highest incidence of male offenders
in the 18 to 40 age range (14). Five wards with the highest number of those trafficking drugs
are:
Allerdale: Broughton St Bridget’s (9)
Barrow: Hindpool (8); Central (8)
Carlisle: Botcherby (14); Currock (10) (Cumbria Constabulary, 2016a).
5.8.3 Alcohol related crime
During 2015-16 alcohol was involved in 13.9% (3,626) of all crimes. All alcohol related
crimes across the county increased by +2.4% (+84) compared to 2014-15. Eden saw the
largest percentage rise, +24.0% (+42), whilst Carlisle district saw the largest increase in
terms of number of alcohol related crimes +153 (+18.2%). Allerdale and Barrow-in-Furness
saw a decrease of -6.4% (-38) and -9.6% (-82) respectively. Overall, the crime rate for
Cumbria increased by +0.2 to 7.3 per 1,000 population. Three districts had rates higher than
this: Barrow-in-Furness (11.4 per 1,000); Carlisle (9.2); and Copeland (8.2). Eden had the
lowest crime rate at 4.1 per 1,000.
Variations in alcohol related crime occurred across Cumbria’s wards. In total, 37 wards,
22.3% of all wards in the county, had crime rates for alcohol related crime higher than that of
the county (7.3). Three wards had rates more than seven times higher than the county rate:
Castle ward in Carlisle (64.2 per 1,000); Harbour ward in Copeland (55.6); and Hindpool
ward in Barrow-in-Furness (51.4). Harbour ward and Castle ward both experienced
increases in alcohol related crime rates (+9.6 per 1,000 (+38) and +8.9 per 1,000 (+51)
respectively).
Number of crimes and rates for ten wards in the county with the highest rates are set out in
Table 13. Penrith West ward in the Eden district has replaced Netherhall in Allerdale in tenth

JSNA Staying Safe - draft for Health and Wellbeing Board
Page 52 of 108
place, having seen an increase in crime rate from 15.1 per 1,000 in 2014-15 to 20.6 per
1,000 (+18 offences).
Table 13: All crime (alcohol related), Cumbrian wards with the highest offence rates
2015-16
All crime (alcohol related), 2015-16
District Ward Number of crimes
Offence rate per 1,000
population
Carlisle Castle 368 64.2
Copeland Harbour 220 55.6
Barrow Hindpool 292 51.4
South Lakeland Kendal Fell 107 46.6
Barrow Central 150 33.4
Barrow Barrow Island 58 23.1
South Lakeland Windermere Bowness South 49 22.0
Allerdale St John's 116 20.9
Currock Currock 129 20.7
Eden Penrith West 67 20.6
Source: (Cumbria Constabulary, 2016a)
Victims of all crime
Cumbria Constabulary data for 18,627 victims of a range of crimes in 2015-16 indicate that
males and females aged between 18 and 30 were the group most at risk of being a victim of
crime (26.8%, 4,996 people). Ten wards had more than 100 victims of crime, both male and
female, aged between 18 and 30 years. Five are in the Carlisle district; Castle ward had the
highest number of victims in this age group (433). All ten wards and numbers of victims
aged 18 to 30 years are listed below:
Allerdale: St John’s (132); St Michael’s (122)
Barrow-in-Furness: Hindpool (292); Central (188)
Carlisle: Castle (433); Currock (176); Belle Vue (133); St Aidan’s (108); Denton
Holme (105)
Harbour (163) (Cumbria Constabulary, 2016a)
5.8.4 Alcohol related violent crime
Introduction
Although alcohol related crime and disorder has a widespread impact across all parts of
policing in Cumbria, the majority is violence related. Tackling alcohol related violent crime
remains a priority for Cumbria Constabulary (Cumbria Constabulary, 2015a).
Who is at risk, and why?
Victims of alcohol related violent crime in Cumbria are more likely to be aged between 18
and 40 years, both male and female (Cumbria Constabulary, 2016a).
What local data tells us
During 2015-16 there were 2,161 alcohol related violence against the person offences. This
represents almost one third (29.3%) of all the violence against the person offences, a
reduction of -4.4 percentage points compared to 2014-15. Overall, alcohol related offences

JSNA Staying Safe - draft for Health and Wellbeing Board
Page 53 of 108
have fallen slightly across the county by -2.3% (-52) during 2015-16, the first reduction to be
seen since 2012-13. However, variations between the districts can be observed: reported
crimes have increased in Carlisle by +10.1% (+52) and in Eden by +9.8% (+11); there is no
significant change within Copeland.
The overall crime rate for the county stands at 4.3 per 1,000 population. Barrow-in-Furness,
Carlisle and Copeland have crime rates higher than the county average at 6.9, 5.3 and 5.3
respectively. Eden has the lowest rate (2.3) and the smallest number of reported offences
(123).
Violence against the person as a result of alcohol misuse varied across Cumbria’s wards.
Four wards had rates more than five times the county rate: Castle ward in Carlisle
(36.8 per 1,000); Harbour ward in Copeland (34.6); Hindpool ward in Barrow-in-Furness
(32.1); and Kendal Fell ward in South Lakeland (24.0). The ten wards with the highest crime
rates for alcohol related violence against the person offences in Cumbria are illustrated in
Table 14.
Table 14: Alcohol related violence against the person offences, Cumbrian wards with
the highest offence rates, 2015-16
Alcohol related violence against the person offences, 2015-16
District Ward Number of crimes
Offence rate per 1,000
population
Carlisle Castle 211 36.8
Copeland Harbour 137 34.6
Barrow-in-Furness Hindpool 182 32.1
South Lakeland Kendal Fell 55 24.0
Barrow-in-Furness Central 81 18.0
Barrow-in-Furness Barrow Island 35 13.9
Allerdale St John's 75 13.5
Allerdale Netherhall 37 11.8
South Lakeland Ulverston Town 22 11.6
South Lakeland Windermere Bowness South 25 11.2
Source: (Cumbria Constabulary, 2016a)
Proportions of alcohol related violent crime victims in Cumbria during 2015-16 were fairly
evenly split between males (46.0%) and females (44.2%). For both male and female, people
aged 18 to 40 were the groups most at risk. Males aged 18-340 made up 30.7% of all
victims, and females aged 18-40 constituted 30.0%. Six wards in Cumbria had 50 or more
victims of alcohol related violent crime in 2015-16 aged between 18-40 years. These were
situated in the following districts:
Allerdale: St John’s ward (60)
Barrow-in-Furness: Hindpool (139); Central (60)
Carlisle: Castle (170); Currock (50)
Copeland: Harbour (100) (Cumbria Constabulary, 2016a).

JSNA Staying Safe - draft for Health and Wellbeing Board
Page 54 of 108
5.8.5 Alcohol related sexual offences
In 2015-16 over one in six 14.8% (127) of all recorded sexual offences were alcohol related,
representing a county rate of 0.3 per 1,000 population compared to 1.7 per 1,000 for all
sexual offences, and 14.8 per 1,000 for all violence against the person offences. The
highest number of alcohol related sexual offences occurred in the Carlisle district, with
36 crimes recorded, although the highest rate per 1,000 population occurred in the Barrow-
in-Furness district at 0.4 per 1,000 population. The Eden district recorded the lowest
number of crimes (9) and the lowest crime rate (0.2 per 1,000). Variations were seen
however between the county’s wards. Three wards had crime rates more than five times
higher than the county rate: Hindpool ward in Barrow-in-Furness (1.8 per 1,000); Castle
ward in Carlisle (1.4) and Kendal Fell ward in South Lakeland (1.3). Crime numbers and
rates for the ten wards with the highest offence rates can be viewed in Table 15:
Table 15: Alcohol related sexual offences, Cumbrian wards with the highest offence
rates 2015-16
Alcohol related sexual offences, 2015-16
District Ward Number of crimes
Offence rate per 1,000
population
Barrow-in-Furness Hindpool 10 1.8
Carlisle Castle 8 1.4
South Lakeland Kendal Fell 3 1.3
South Lakeland Kendal Kirkland 2 1.0
Allerdale Netherhall 3 1.0
Carlisle Great Corby and Geltsdale 2 0.9
South Lakeland Windermere Applethwaite and Troutbeck 2 0.9
Eden Penrith West 3 0.9
Carlisle Denton Holme 6 0.9
South Lakeland Ulverston East 2 0.9 (Cumbria Constabulary, 2016a)
5.8.6 Alcohol specific mortality
Alcohol consumption is a contributing factor to mortality from a wide range of conditions.
The Office for National Statistics defines alcohol-related deaths as only those where the
causes are considered to the direct result of alcohol consumption. The definition does not
include instances where alcohol has some level of causal relationship, for example
conditions such as cancer of the oesophagus or liver, and also excludes other external
causes of death such as road traffic accidents and other accidents. Excessive drinking is
estimated to result in approximately 3.3 million (5.9%) of all deaths globally each year (Office
for National Statistics, 2016a).
In a move to reduce alcohol consumption, the Home Office Alcohol Strategy 2012 introduced
a minimum unit price for alcohol. Guidelines for alcohol consumption published by the
government in January 2016 recommend that men and women should drink no more than
14 units of alcohol each week, spread over several days, and are intended to help people
live longer, healthier and more fulfilling lives (Office for National Statistics, 2016a).

JSNA Staying Safe - draft for Health and Wellbeing Board
Page 55 of 108
Who is at risk, and why?
In 2014, death rates among males were twice that of females (19.4 deaths per 100,000 for
males compared to 9.6 deaths per 100,000 for females). Office for National Statistics data
shows that deaths as a direct result of alcohol misuse increase steadily with age. Rates for
males in 2014 were highest between ages 60 to 64 years (47.6 deaths per 100,000 men).
For women, rates were highest for 55 to 59 year olds (22.1 per 100,000 women) and lowest
amount 25 to 29 year olds (1.1 per 100,000). Deaths with alcohol as a cause for both sexes
were significantly higher in the north of England than the south in 2014 (Office for National
Statistics, 2016a).
What local data tells us
Local Alcohol Profiles for England (Public Health England, 2016) indicate that 128 males and
63 females lost their lives during 2012-14 from alcohol specific causes. For the county as a
whole, alcohol specific mortality rates for males at 17.0 per 100,000 population (directly
standardised rate), and females at 7.9 per 100,000 are not significantly different to the
national (England) rate (16.1 males and 7.4 females) and are significantly better than the
north west rate (22.6 males and 11.4 females).
There are some exceptions to this. Male alcohol specific mortality rates in 2012-14 in
Allerdale (22.5 per 100,000), Barrow-in-Furness (20.7) and Copeland (19.6) are not
significantly different to the North West rate. Compared to England, the female alcohol
specific mortality rate in Allerdale (16.4) remains significantly worse whilst the South
Lakeland rate (2.9) is significantly better. Female rates for all districts, with the exception of
South Lakeland, are not significantly different to the North West for females; Copeland (5.3)
had been significantly better than the North West over the last two reporting periods in
2010-12 and 2011-13.
Male alcohol specific mortality rates have been falling slightly in England and the North
West. However, the male rate in Cumbria increased to 17.0 per 100,000 in 2012-14, an
increase of +10.4% compared to the 2011-13 rate of 15.4 per 100,000. Male rates have
been increasing in some districts, with the largest increases seen in Allerdale (+47.2% to
22.5 per 100,000) and Carlisle (+23.8% to 14.7 per 100,000). The largest male rate
decrease has been in Barrow-in-Furness, reduced by -16.4% to 20.7 per 100,000. Eden has
the lowest male rate at 8.3.
Female alcohol specific mortality rates have remained relatively static in England, whilst
falling slightly across the North West. Cumbria’s overall female rate has seen no significant
change compared to 2011-13. However, the rate for Allerdale, the highest female rate of all
the districts at 16.4 per 100,000 has increased by +25.2% compared to the 2011-13 rate of
13.1 and by +72.6% compared to 2010-12 when the rate was 9.5. The female rate in
Barrow-in-Furness has also seen an increase of +26.3% to 9.9 in 2012-14 from 7.8 in
2011-13. Conversely rates fell in Eden and South Lakeland by -27.7% to 4.9 per 100,000
and -29.6% to 2.9 respectively.
5.8.7 Hospital admissions – alcohol specific (all)
Alcohol consumption is a contributing factor to hospital admissions and deaths from a wide
range of conditions. The misuse of alcohol is estimated to cost the National Health Service

JSNA Staying Safe - draft for Health and Wellbeing Board
Page 56 of 108
in the region of £3.5 billion each year, and wider society as a whole around £21 billion
annually. Reducing alcohol-related harm is one of seven priorities for Public Health England
(Public Health England, 2016).
What local data tells us
The directly standardised rate for all alcohol specific hospital admissions in Cumbria during
2014-15 was 418 per 100,000 population, a rate significantly worse than England (364)
although significantly better than North West region (558). The rate in Cumbria is relatively
static compared to 2013-14 (Public Health England, 2016).
The rate in Allerdale was down slightly in 2014-15, standing at 372 per 100,000 population,
a decrease of -4.0%, and is similar to the rate for England. The rate for Eden (215 per
100,000) is the lowest of all the districts, and remains significantly better than England; it has
also decreased slightly (-5.6%) compared to 2013-14. The rate in South Lakeland (333 per
100,000) is now similar to England, having previously been significantly better. South
Lakeland had been significantly better than England since 2009-10, but its rate has
increased by +18.9% since 2012-13, closing the gap between the district and national rate
(Public Health England, 2016).
Barrow-in-Furness is again significantly worse than both the North West and England, and
the rate for the district has risen steadily from 605 per 100,000 in 2012-13 to 689 in 2014-15,
the highest of all the districts, and an increase of +13.9% over three years and +17.8% over
five years. Copeland however has seen some improvement, and is now considered to be
better than the North West, having had a rate similar to the North West since 2012-13.
Copeland’s rate in 2014-15 (477 per 100,000) has decreased by -7.9% compared to the
previous year. Carlisle (431 per 100,000) has also seen a rate decrease of -6.0%
compared to the previous year (Public Health England, 2016).
During 2014-15 a total of 2,090 people were admitted to hospital in Cumbria for alcohol
specific reasons. Admissions from Carlisle and Barrow-in-Furness both made up 22.2% of
the total (465 people from each district). The smallest proportion came from the Eden
district, 5.7% (120 people) (Public Health England, 2016).
5.8.8 Hospital admissions – alcohol specific (under 18 year olds)
Excessive alcohol consumption in people under the age of 18 years is a cause of hospital
admissions that is avoidable (Public Health England, 2016).
During the period 2012-13 to 2014-15 young people under the age of 18 years were
admitted to hospital for alcohol specific reasons in 164 instances, a reduction of -29
instances compared to 2011-12 to 2013-14. Cumbria’s crude rate for alcohol specific
hospital admissions in 2012-13 to 2014-15 was 58.2 per 100,000 population. Although the
rate has been falling steadily since 2006-07 to 2008-09, the same has been happening in
the North West region and nationally (England). Cumbria’s rate remains similar to the North
West region (53.5 per 100,000) and significantly worse than England (36.6 per 100,000).
However national admissions are decreasing at a slower rate than in Cumbria, and the gap
between the county and England is narrowing. Variations can be seen across the districts:
Barrow-in-Furness (90.2) and Copeland (104.4) are significant worse than the North West,
whilst Eden (24.5) is significantly better (Public Health England, 2016).

JSNA Staying Safe - draft for Health and Wellbeing Board
Page 57 of 108
The rate in Allerdale (39.9) for 2012-13 to 2014-15 although statistically similar to the North
West, has actually fallen faster than the regional rate. This improvement means that
Allerdale is now similar to England (36.6), having previously been significantly worse.
Carlisle (36.6) and Eden (24.5) are also similar to the England rate (Public Health England,
2016).
Copeland district had the highest rate had the highest rate of all the districts in 2012-13 to
2014-15 at 104.4 per 100,000 almost double that of the North West (53.5) and showing no
significant change compared to 2011-12 to 2013-14. In terms of admission incidents, this
equates to 42 incidents in Copeland during 2012-13 to 2014-15. Barrow has the second
highest rate (90.2), a small reduction of -3.6% compared to the previous reporting period,
with 37 admissions in 2012-13 to 2014-15. Eden has the lowest rate (24.5), with
7 admissions during 2012-13 to 2014-15 (Public Health England, 2016).
5.9 Fire safety and other emergency incidents
The Department for Communities and Local Government produced the Fire and Rescue
National Framework for England in July 2012 to provide overall strategic direction to fire and
rescue authorities. In January 2016 responsibility for the fire service moved from
Department of Communities and Local Government to the Home Office (DCLG, 2012).
The Policing and Crime Bill was introduced to the House of Commons on 10 February 2016
and supports greater collaboration of emergency services. The new framework includes
steps towards greater integration such as enabling PCCs to take on the functions and duties
of their local Fire and Rescue Authority, and establishing a new inspection framework (Home
Office, 2016).
As part of the move towards greater integration, the Department for Communities and Local
Government has provided £4.6 million to Cumbria County Council to take the lead to
construct a co-located emergency response centre – the Furness Peninsula Blue light Hub in
Ulverston. This will provide a combined base for Cumbria Fire and Rescue Service (CFRS),
North West Ambulance Service and facilities for Cumbria police. Construction of the new
Hub is beginning in spring 2016 with the aim of opening at the end of the year (Cumbria
County Council, 2015d).
Who is at risk, and why?
The Cumbria Fire and Rescue Service Integrated Risk Management Plan 2016-2020
(Cumbria County Council, 2015a) indicates the following groups are at greater risk of having
a fire:
People who smoke
People living in areas of poverty and deprivation
Single parent families
Single person households
Those living in socially rented accommodation
People with a disability or suffering from illness
People who are unemployed and have never worked

JSNA Staying Safe - draft for Health and Wellbeing Board
Page 58 of 108
Further social factors identified include family stress and critical life events such as
hospitalisation, chronic disease or a change of residence increases risk.
In order to support service management decisions, risk is currently assessed at Lower Super
Output Area (LSOA) level. The Risk Model combines analysis of the number of fires and
associated casualties, alongside levels of deprivation to take account of the
socio-demographic factors listed above. This allows LSOAs to be categorised as high,
medium or low risk (Cumbria County Council, 2015a).
Table 16: Cumbria primary fires - risk level profile 2010-11 and 2015-16
Risk level
LSOAs at risk of primary fire
2010/11 Risk 2015-16
Number % Number %
High 15 5% 1 0%
Medium 139 43% 97 30%
Low 167 52% 223 69%
Source: (Cumbria County Council, 2015a)
As of 2015-16 there is only one LSOA in the whole county classified as “high” fire risk
out of a total of 321 (part of St Michael’s Ward, Workington). This has reduced from
15 LSOAs in 2010/11 and a starting point of 20 LSOAs in 2005/06.

JSNA Staying Safe - draft for Health and Wellbeing Board
Page 59 of 108
Figure 7: Profile of LSOA fire risk levels 2015-16
Source: (Cumbria County Council, 2015a)

JSNA Staying Safe - draft for Health and Wellbeing Board
Page 60 of 108
5.9.1 All incidents
Cumbria Fire and Rescue Service attend a wide range of emergencies which fall into four
overarching categories:
Fires – this relates to all fires;
False Alarms – A false alarm is when the fire and rescue service attends a location
believing there to be a fire incident, but on arrival discovers that no such incident
exists, or existed;
Road Traffic Collision Special Service Calls - Road traffic collision (RTC) incidents
which require the attendance of an appliance or officer (covered under Road Safety:
Killed and Seriously Injured (KSI) statistics);
Non-Road Traffic Collision Special Service Calls - Non-fire incidents and non-road
traffic collisions that require the attendance of an appliance or officer, such a floods
or animal rescue.
The majority of incidents attended by CFRS are false alarms (43%), followed by fires (31%).
Just under one fifth of incidents are non-road traffic collisions (19%) and just under a tenth of
incidents are road traffic collisions (7%) (Cumbria County Council. 2016a).
Table 17: Profile of incidents attended by Cumbria Fire and Rescue Service
Type of incident attended 2010/11 2015-16
Number % Number %
All false alarms 2,319 43% 1,950 43%
All fires 2,141 40% 1,408 31%
Non-RTC Special Service calls 605 11% 860 19%
RTC Special Service calls 283 5% 300 7%
TOTAL 5,348 100% 4,518 100%
Source: (Cumbria County Council, 2016a)
Overall the total number of emergencies attended by Cumbria Fire and Rescue Service has
decreased from 5,348 in 2010/11 to 4,518 in 2015-16 – a decrease of 15%. In same period,
the national rate has decreased by 23% (Cumbria County Council, 2016a).
The relatively higher level of emergencies in 2015-16 in Cumbria is as a direct result of the
December 2015 floods, rising from 4,110 incidents in 2014/15 to 4,518 in 2015-16 - an
increase of 408 incidents or +9% (Cumbria County Council, 2016a).
The rate of Cumbrian fires in 2015-16 is similar to the national rate (28.3 per 10,000 people
in Cumbria compared to 28.5 nationally). Cumbria had over twice the rate of chimney fires
(2.4 per 10,000 of the population) compared to national rate (1.0) (Cumbria County Council,
2016a).
The total number of fires in the county has dropped by just over a third (-34%) from 2,141 in
2010/11 to 1,408 in 2015-16. This is a decrease in rate of 43.2 fires per 10,000 people to
28.3 fires per 10,000 people (Cumbria County Council, 2016a).
The number of casualties (injuries and deaths) in fires (accidental dwelling fires) has also
decreased by a quarter (-25%) from a total of 36 in 2010-11 to 9 individuals in 2015-16
(Cumbria County Council, 2016a).

JSNA Staying Safe - draft for Health and Wellbeing Board
Page 61 of 108
The rate of false alarms in Cumbria (39.2 per 10,000 population) is similar to the national
rate of 39.7. In line with the national trend, this rate has dropped in the last five years (from
46.8 in 2010/11). However the last two years have both shown higher rates (of around 250
more false alarms in each year) when compared to Cumbria’s lowest rate of 1,674 in
2013/14 (Cumbria County Council, 2016a). CFRS has introduced a more robust call
challenge procedure and will not always respond to activations of fire alarms. Going
forward, this should see a further reduction in the number of unnecessary emergency
responses to some automatic fire alarm activations.
As a result of the December 2015 floods Cumbria Fire and Rescue Service experienced
more than double the number of call-outs when compared to the previous year - rising from
415 incidents in 2014/15 to 860 in 2015-16,. This increase in incidents can be narrowed
down to December, when the fire and rescue service attended over 15 times the amount of
calls compared to the previous year (26 calls in December 2014 compared to 393 in
December 2015) (Cumbria County Council, 2016a).
Barrow-in-Furness has the highest rate of incidents (98.7 per 10,000) in 2015-16 compared to Copeland with the lowest rate of incidents (81.2 per 10,000). Table 18: CFRS - number and rate of all incidents by district 2015-16
District All incidents (number)
All incidents (rate)
Barrow-in-Furness 553 98.7
Allerdale 923 96.7
Eden 490 91.8
South Lakeland 1038 90.2
Carlisle 933 86.6
Copeland 576 81.2
Grand Total 4518 90.7
Source: (Cumbria County Council, 2015b) Castle ward in Carlisle has the highest number (193 incidents) and the highest rate (337 per 10,000) of total incidents. This is followed by Kendal Mintsfeet ward with a total number of 72 incidents and a rate of 336. Table 19: CFRS - ten wards with highest rate of total incidents 2015-16
District Ward Total Incidents
(Number) Total Incidents
(Rate)
Carlisle Castle 193 337
South Lakeland Kendal Mintsfeet 72 336
Allerdale St. Michael's 125 249
South Lakeland Kendal Fell 57 248
South Lakeland Ambleside and Grasmere 91 235
Barrow-in-Furness Dalton North 43 232
Copeland Harbour 89 225
Eden Ullswater 31 222
Copeland Hensingham 88 217
Allerdale Flimby 38 217

JSNA Staying Safe - draft for Health and Wellbeing Board
Page 62 of 108
Source: (Cumbria County Council, 2015c)
5.9.2 Fires
The rate of Cumbrian fires in 2015-16 (28.3 per 10,000) is similar to the national rate (28.5), though Cumbria had over twice the rate of chimney fires (2.4 per 10,000 of the population) compared to a national rate of 1.0. The total number of fires in the county has dropped by just over a third (34%) from 2,141 in 2010/11 to 1,408 in 2015-16. This is a decrease in rate of 43.2 fires per 10,000 in 2010/11 to 28.3 fires per 10,000 people in 2015-16. Allerdale has the highest rate of all fires (35.8 per 10,000) compared to the lowest rate of 20.2 in South Lakeland. Table 20: Number and rate of fires by district 2015-16
District Total fires (number) Total fires (rate)
Allerdale 345 35.8
Barrow-in-Furness 222 32.8
Carlisle 323 29.9
Copeland 182 26.1
Eden 127 24.1
South Lakeland 209 20.2
TOTAL 1408 28.3
Source: (Cumbria County Council, 2015b) Allerdale has two wards (Flimby and St. Michael’s) with the highest rate of fires (126 and 122 compared to a Cumbrian average rate of 28.3). Table 21: Ten wards with highest rate of fires 2015-16
District Ward Total Fires
(Number)
Total Fires
(Rate)
Allerdale Flimby 22 126
Allerdale St. Michael's 61 122
Barrow-in-Furness Dalton North 16 86
Carlisle Castle 44 77
Allerdale Moss Bay 36 70
Barrow-in-Furness Barrow Island 17 68
Copeland Ennerdale 6 62
Carlisle Denton Holme 39 60
Carlisle Longtown and Rockcliffe 24 58
Barrow-in-Furness Hindpool 33 58
Source: (Cumbria County Council, 2015c) The number of casualties (injuries and deaths) in fires (accidental dwelling fires) has also decreased by a quarter (25%) from a total of 36 in 2010/11 to 9 individuals in 2015-16 (Cumbria County Council, 2016a).

JSNA Staying Safe - draft for Health and Wellbeing Board
Page 63 of 108
5.9.3 Deliberate fires
What local data tells us
Deliberate fires accounted for 37.9% of all Cumbria’s fires in 2015-16. Across the county,
deliberate fires decreased by -5.8% (-33) in 2015-16 compared to 2014-15, and this is
mirrored across Barrow-in-Furness, Copeland, Eden and South Lakeland. Deliberate fires in
Allerdale have increased by +19.7% (+26) over the same time period. The largest
percentage decrease occurred in Copeland, -29.3% (-34). There is no significant change
within Carlisle. Per 1,000 population, the rate across Cumbria for deliberate fires is 1.1 for
2015-16. Three districts have rates higher than Cumbria: Allerdale (1.6); Carlisle (1.4); and
Copeland (1.2). The lowest rate can be found in Eden (0.2) (Cumbria County Council.
(2016b).
Six communities across the county had a dozen or more deliberate fires during 2015-16.
Four are situated within Allerdale: two within St Michael’s ward (35 deliberate fires); one in
Flimby ward (16); and one in Moss Bay ward (13). The remain two are situated within
Carlisle: one in Botcherby (13 deliberate fires); one in Belle Vue (12) (Cumbria County
Council, 2016b)
5.9.4 False alarms
The rate of false alarms in Cumbria (39.2 per 10,000 of the population) is similar to the national rate of 39.7. In line with the national trend, this rate has dropped in the last five years (from 46.8 in Cumbria in 2010/11). However the last two years have both shown higher rates (of around 250 more false alarms in each year) when compared to Cumbria’s lowest rate of 1,674 in 2013/14 (Cumbria County Council, 2016a).
South Lakeland has the highest number of false alarms (471) and Barrow-in-Furness has the highest rate of false alarms (45.8 per 10,000 population). Allerdale has the lowest rate of false alarms (34.3). Table 22: CFRS - number and rate of false alarms by district 2015-16
District Total false alarms (number)
Total false alarms (rate)
Barrow-in-Furness 263 45.8
South Lakeland 471 41.4
Copeland 276 38.8
Eden 201 38.0
Carlisle 408 38.0
Allerdale 329 34.3
Grand Total 1952 39.2
Source: (Cumbria County Council, 2015b) Castle ward in Carlisle has the highest rate of false alarms in 2015-16 (194 per 10,000 population, however South Lakeland had four wards within the top ten wards (Kendal Mintsfeet, Kendal Fell, Kendal Highgate, and Windermere Applethwaite and Troutbeck).

JSNA Staying Safe - draft for Health and Wellbeing Board
Page 64 of 108
Table 23: CFRS - ten wards with highest rate of false alarms 2015-16
District Ward
Total
False
Alarms
(Number)
Total
False
Alarms
(Rate)
Carlisle Castle 111 194
South Lakeland Kendal Mintsfeet 39 182
South Lakeland Kendal Fell 41 179
Copeland Hensingham 63 156
Copeland Harbour 56 142
South Lakeland Kendal Highgate 26 116
Barrow-in-Furness Hindpool 63 111
Barrow-in-Furness Barrow Island 27 107
South Lakeland Windermere Applethwaite and Troutbeck 22 104
Eden Ullswater 14 100
Source: (Cumbria County Council, 2015c)
5.9.5 Non-Road Traffic Collison Special Service Calls
As a result of the December 2015 floods Cumbria Fire and Rescue Service experienced more than double the number of call-outs when compared to the previous year - rising from 415 incidents in 2014/15 to 860 in 2015-16,. This increase in incidents can be narrowed down to December, when the fire and rescue service attended over 15 times the amount of calls compared to the previous year (26 calls in December 2014 compared to 393 in December 2015) (Cumbria County Council, 2016a). The highest rate of non-road traffic collision special service calls occurred in Allerdale (205 calls, a rate of 21.4) in 2015-16. The lowest levels were in Copeland; a total of 77 calls and a rate of 11.0 per 10,000 population. Table 24: Number and rate of Non-Road Traffic Collision Special Service Calls by
district 2015-16
District Total non RTC SSC (number)
Total non RTC SSC (rate)
Allerdale 205 21.4
South Lakeland 233 21.2
Eden 98 18.6
Barrow-in-Furness 96 16.0
Carlisle 153 14.1
Copeland 77 11.0
Grand Total 863 17.3
Source: (Cumbria County Council, 2015b)
Kendal Mintsfeet had the highest rate of non-RTC SSCs (103 per 10,000 population)
followed by Ambleside and Grasmere which had the second highest rate (85) and the
highest number of calls (33).
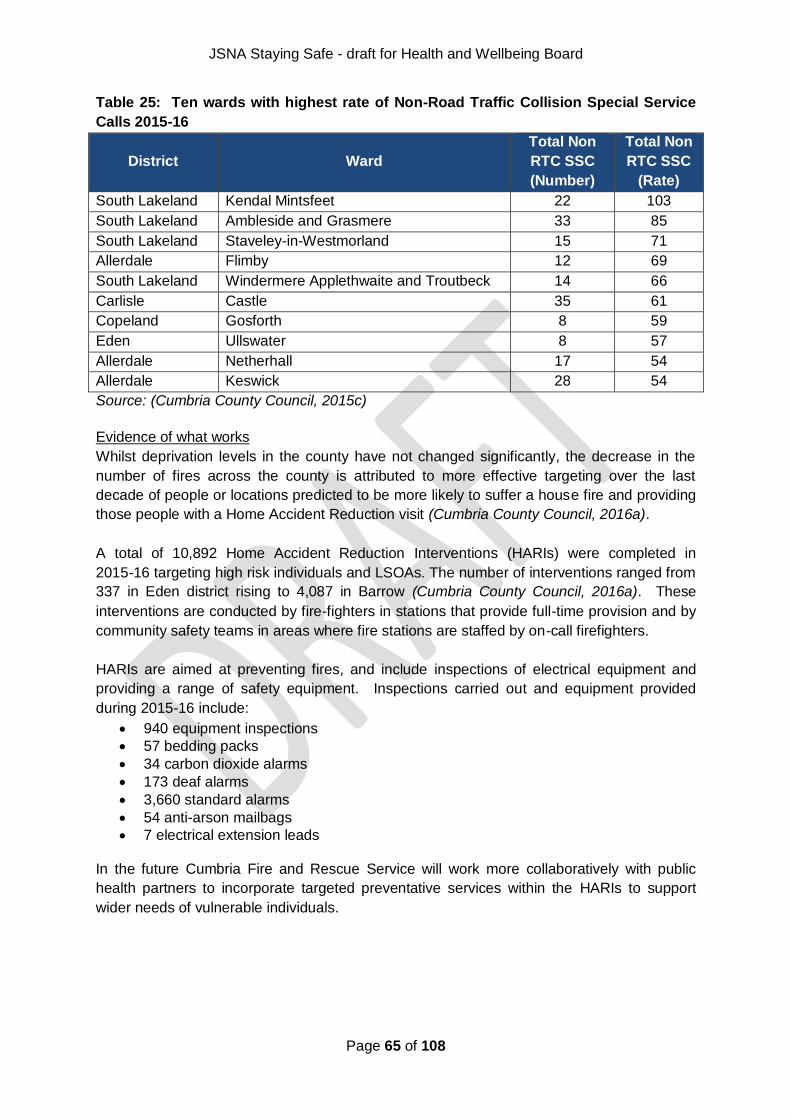
JSNA Staying Safe - draft for Health and Wellbeing Board
Page 65 of 108
Table 25: Ten wards with highest rate of Non-Road Traffic Collision Special Service
Calls 2015-16
District Ward
Total Non
RTC SSC
(Number)
Total Non
RTC SSC
(Rate)
South Lakeland Kendal Mintsfeet 22 103
South Lakeland Ambleside and Grasmere 33 85
South Lakeland Staveley-in-Westmorland 15 71
Allerdale Flimby 12 69
South Lakeland Windermere Applethwaite and Troutbeck 14 66
Carlisle Castle 35 61
Copeland Gosforth 8 59
Eden Ullswater 8 57
Allerdale Netherhall 17 54
Allerdale Keswick 28 54
Source: (Cumbria County Council, 2015c)
Evidence of what works
Whilst deprivation levels in the county have not changed significantly, the decrease in the
number of fires across the county is attributed to more effective targeting over the last
decade of people or locations predicted to be more likely to suffer a house fire and providing
those people with a Home Accident Reduction visit (Cumbria County Council, 2016a).
A total of 10,892 Home Accident Reduction Interventions (HARIs) were completed in
2015-16 targeting high risk individuals and LSOAs. The number of interventions ranged from
337 in Eden district rising to 4,087 in Barrow (Cumbria County Council, 2016a). These
interventions are conducted by fire-fighters in stations that provide full-time provision and by
community safety teams in areas where fire stations are staffed by on-call firefighters.
HARIs are aimed at preventing fires, and include inspections of electrical equipment and
providing a range of safety equipment. Inspections carried out and equipment provided
during 2015-16 include:
940 equipment inspections
57 bedding packs
34 carbon dioxide alarms
173 deaf alarms
3,660 standard alarms
54 anti-arson mailbags
7 electrical extension leads In the future Cumbria Fire and Rescue Service will work more collaboratively with public
health partners to incorporate targeted preventative services within the HARIs to support
wider needs of vulnerable individuals.

JSNA Staying Safe - draft for Health and Wellbeing Board
Page 66 of 108
5.10 Road Safety: Killed and Seriously Injured (KSI) statistics
Introduction
Throughout Great Britain, reported road deaths increased by +4% in 2014 compared to
2013. Serious injuries increased by +5% in 2014, and overall casualties increased for the
first time since 1997. Pedestrians accounted for three quarters of the increase in fatalities
between 2013-14. The DfT report indicates that traffic levels were on average 2.4% higher
across the country compared to 2013, which would have led to an increased exposure for
road users. However, when adjusted for weather conditions, the rise is not considered
significant. Failing to look properly remains the most common factor contributing to
accidents in 2014 (DfT, 2015).
Who is at risk, and why?
Self-reported drink and drug driving in 2014-15 indicates that 6.2% of drivers nationally had
driven whilst over the legal alcohol limit at least once in the last 12 months, and 0.9% of
drivers admitted to driving under the influence of illegal drugs, proportions that are not
significantly different from those reported in 2013-14. Both drink and drug driving are more
prevalent amongst males and younger drivers. Final estimates for 2013 show that between
220 and 260 people were killed in accidents in Great Britain where at least one driver was
over the drink drive limit, around 14% of all deaths (DfT, 2015).
Accidents on rural roads are more likely to be fatal than those on urban roads, as rural roads
have a much higher average speed than urban roads, and are often more winding and
narrow in nature (DfT, 2015).
Young novice drivers who have just passed their test are most at risk of death or serious
injury whilst driving on the roads than any other road user group (Cumbria Road Safety
Partnership, 2016).
What local data tells us
Numbers of people reported as being killed or seriously injured (all KSIs) on Cumbria’s roads
in 2015 have remained similar to 2014 levels, increasing by +1 to a total of 232. Over the
same time period, there were 29 fatalities making up 12.5% of all KSIs, an increase of
+16.0% (+4). Child KSIs remained relatively low (13) during 2015, no change compared to
2014, accounting for 5.6% of all KSIs. KSI trends vary across the districts in 2015 compared
to the previous year. The largest increase was seen in South Lakeland, up by +21.8%
(+12). Barrow-in-Furness had the largest decrease in all KSIs, down -39.1% (-9). The
Cumbria Road Safety Partnership remains committed to reducing KSIs in Cumbria (Cumbria
Road Safety Partnership, 2016).
Although all KSIs have remained similar to 2014 levels, the total number of casualties
(including slight injuries) reduced by -11.2% (-217) to 1,715 compared to 2014. This
downward trend was mirrored by all districts with the exception of Eden, which saw an
increase in all KSIs of +5.9% (+15) (Cumbria Road Safety Partnership, 2016).
In 2015, the county’s KSI rate was 0.5 per 1,000 population, no change from 2014. Three
districts have rates equal to, or above the county rate: Allerdale (0.5), South Lakeland (0.6)
and the highest in Eden (0.9). The lowest rate was found in Barrow-in-Furness (0.2). The

JSNA Staying Safe - draft for Health and Wellbeing Board
Page 67 of 108
highest number of KSIs (67) occurred in South Lakeland (Cumbria Road Safety Partnership,
2016). Variations between the districts may reflect the number of households with access to
a car or van. Census 2011 data shows that car or van availability is highest in Eden at
86.1%, and also high in South Lakeland (84.7%). It is lowest in Barrow-in-Furness at 70.1%
(Office for National Statistics, 2011a). Rurality may also be a factor. Within Eden 71% of
residents live in rural areas, compared to 54% across Cumbria generally. DfT data shows
that just over half (51.3%, 716) of all accidents in Cumbria in 2014 occurred on minor roads,
44.8% (626) took place on ‘A’ class roads, and the remainder (3.9%, 55) happened on the
M6. The proportion of accidents on minor roads and ‘A’ class roads is similar to the North
West region (51.5% and 42.1% respectively) (DfT, 2015).
5.10.1 Road Traffic Collision Special Service Calls
Cumbria Fire and Rescue service attended 300 road traffic collisions in 2015-16. This is a
rate of 6.0 RTCs per 10,000 which is slightly higher than the national rate of 5.3. It is also an
increase of 6% since 2010-11 when 283 incidents were attended. This is in contrast to an
increased number of Road Awareness Training Sessions over the same period (44 sessions
were delivered in 2010-11 compared to 71 sessions in 2015-16) (Cumbria County Council,
2016a).
The longitudinal picture shows that there are higher levels of RTCs in the summer months
when there are around 19 million visitors to the county, and again in the winter months when
the weather worsens. Therefore it is expected that the numbers of RTCs will be significantly
influenced by external factors, such as number of visitors and severity of winter weather
conditions (Cumbria County Council, 2016a).
The highest rate of road traffic collision special service calls occurred in Eden (61 calls, a
rate of 11.0) in 2015-16. The lowest levels were in Barrow-in-Furness; a total of 12 calls and
a rate of 4.1 per 10,000 of the population.
Table 26: Number and rate of Road Traffic Collision Special Service Calls by District
2015-16
District Total RTC SSC (number)
Total RTC SSC (rate)
Eden 61 11.0
South Lakeland 88 7.4
Copeland 38 5.3
Allerdale 48 5.3
Carlisle 50 4.6
Barrow-in-Furness 12 4.1
Grand Total 297 6.0
(Source: Ref 053)
Many of the wards that include the M6 in the south of Cumbria had the highest rate of non-
RTC SSCs (including Orton with Tebay and Whinfell which both had a total number of RTC
SSCs of 13. .

JSNA Staying Safe - draft for Health and Wellbeing Board
Page 68 of 108
Table 27: Ten wards with highest rate of Road Traffic Collision Special Service Calls
2015-16
District Ward
Total RTC
SSC
(Number)
Total RTC
SSC
(Rate)
Eden Orton with Tebay 13 96
South Lakeland Whinfell 13 64
South Lakeland Burton and Holme 19 50
Eden Long Marton 5 42
South Lakeland Lyth Valley 8 37
Eden Shap 5 36
South Lakeland Coniston and Crake Valley 5 33
Allerdale Warnell 6 31
Eden Brough 4 30
Eden Warcop 4 30
Source: (Cumbria County Council, 2015c)
Evidence of what works
Cumbria’s Road Safety Partnership carry out a range of activities to promote road safety.
For primary school aged children, ‘Bikeability’ cycle training is delivered to as many
Cumbrian primary schools as possible. In 2015-16 a total of 4,288 children received cycle
training. For young people, Road Awareness Training (RAT) is provided by the Cumbria
Fire and Rescue Service as an educational package, available in the final year of secondary
school to raise awareness of the possible consequences of irresponsible road use. In total,
56 RAT sessions were delivered to secondary schools in 2015-16 (Cumbria Road Safety
Partnership, 2016).
Young drivers can take advantage of the Pass Plus+ scheme which provides subsidised
extra driving tuition to young drivers after they have passed their driving tests. The scheme
provides six practical modules on subjects that are not currently included when learning to
drive, such as motorway driving. In 2015-16, a total of 154 new drivers received subsidy
vouchers to undertake Pass Plus training with a driving instructor (Cumbria Road Safety
Partnership, 2016).
The Cumbria Road Safety Partnership subsidised Enhanced Rider training for
155 motorcyclists and Institute of Advanced Motorist Skill for Life training for a further 20. In
addition, Cumbria Constabulary provided their Bike Safe programme, which follows a
national syllabus, to 54 motorcyclists (Cumbria Road Safety Partnership, 2016).
Training is also available for older drivers. The Cumbria Road Safety Partnership delivered
its ‘Drive Safer Longer’ scheme to 52 drivers aged 65+ in 2015-16, an opportunity for older
drivers to refresh their driving skills and knowledge through information drives accompanies
by a local driving instructor (Cumbria Road Safety Partnership, 2016).

JSNA Staying Safe - draft for Health and Wellbeing Board
Page 69 of 108
5.11 Adult Safeguarding
Introduction
Adult safeguarding is the protection of adults, aged 18 and over, who appear to have health
and social care needs, from abuse or neglect. The Safeguarding Vulnerable Groups Act
2006 provides the legislative framework for the vetting and barring scheme, aimed to ensure
that unsuitable people are not able to work with children or vulnerable adults. Local
authorities have safeguarding duties under the Care Act 2014 which sets out a clear legal
framework for how local authorities and others should protect adults at risk of abuse or
neglect. Child safeguarding is covered under the JSNA Children and Families chapter.
Who is at risk, and why?
Adults aged 18 and over with health or social care needs. An adult at risk may be a person
who:
Is elderly and frail due to ill health, physical disability or cognitive impairment;
Has a learning disability;
Has a physical disability and / or sensory impairment;
Has mental health needs, including dementia or a personality disorder;
Has a long term illness / condition;
Misuses substances or alcohol;
Is a carer and is subject to abuse;
Is unable to demonstrate the capacity to make a decision and is in need of care and
support Cumbria Safeguarding Adults Board, 2015).
What local data tells us
Vulnerable Adult alerts to Cumbria County Council’s Health and Care Services totalled 2,349
in 2014-15, an increase of +20.3% (+397) compared to the previous year. The conversion
rate from alert to safeguarding referral remains around 30.0% in line with the national
(England) average, resulting in 705 referrals in Cumbria in 2014-15. The incidence of
physical abuse made up 48% of all referrals, significantly higher than the England average of
27%. Psychological abuse (12%) and financial abuse (13%) are slightly below the England
averages of 16% and 18% respectively. Neglect has risen by 3.0 percentage points to 25%
of all cases, but is below the England average of 29%. The majority of alerts (47%) continue
to be in relation to people living in a care home setting, higher than the England average of
36% (Cumbria Safeguarding Adults Board, 2015).
Of the Vulnerable Adult referrals made by Cumbria Constabulary to other agencies during
2014-15 the majority related to mental health issues (62.2% 4,904). Other reasons included
physical abuse, (5.4%, 427), financial abuse (2.1%, 165), neglect (1.4%, 108) and sexual
abuse (2.5%, 201) (Cumbria Safeguarding Adults Board, 2015).
Cumbria Constabulary made 7,131 Vulnerable Adult referrals during 2015-16. This
represents a decrease of -2.3% (-171) compared to the previous year (Cumbria
Constabulary, 2016a). It is considered that education around Vulnerable Adults and the
criteria for submission of a Vulnerable Adult has resulted in a reduction as the number of
inappropriate submissions drop (Cumbria Constabulary, 2016c).
Evidence of what works

JSNA Staying Safe - draft for Health and Wellbeing Board
Page 70 of 108
A number of agencies work together through the Cumbria Safeguarding Hub to support
vulnerable adults. Membership includes: Cumbria County Council, Cumbria Partnership
NHS Foundation Trust, North Cumbria University Hospitals Trust, Morecambe Bay
University Hospitals NHS Trust, Cumbria Clinical Commissioning Group, Cumbria
Constabulary, National Probation Services, HMP Haverigg. The Cumbria Clinical
Commissioning Group has a safeguarding adults GP in post to work with main safeguarding
contacts in the six localities to ensure that the work of safeguarding adults has a high profile
in GP practices and that GPs are provided with adequate training and support to recognise
problems and raise concerns Cumbria Safeguarding Adults Board, 2015).
JSNA Staying Safe - draft for Health and Wellbeing Board
Page 71 of 108
6 Housing and communities The Office for National Statistics report that 89.2% of households in 2013-14 reported being
either very or fairly satisfied with their accommodation, a decrease of -1.4 percentage points
compared to the previous year (90.6%). The majority of owner occupiers (93.8%) were very
or fairly satisfied with their accommodation, a situation in stark contrast to those who rent
their properties, where 80.6% of social renters and 81.8% of private renters were either very
or fairly unsatisfied with their accommodation (Office for National Statistics, 2016b).
Census 2011 data for Cumbria indicates there are five communities within the county where
at least two thirds of housing is rented:
Allerdale: LSOAs within the wards of Moss Bay (70.1%) and Ewanrigg (66.6%)
Barrow-in-Furness: LSOAs within the wards of Barrow Island (73.1%) and Ormsgill
(67.0%)
Copeland: LSOA within Sandwith ward (70.5%) (Office for National Statistics, 2011b)
Feeling positive about the area in which we live helps to create strong, inclusive
communities, places where people feel they belong, and where they feel safe. The ONS
report that in 2011-12 almost two thirds of people (63.3%) either agreed or agreed strongly
that they felt a sense of belonging to their neighbourhood, a decrease of -2.7 percentage
points compared to the previous year (66.6%). A sense of belonging to a neighbourhood
appears to increase with age. Around half of young people aged 16 to 24 years either
agreed, or agreed strongly, that they belonged to their neighbourhood. This is in contrast to
those aged 75 years and over, 81.1% of whom felt a that they belonged to their
neighbourhood (Office for National Statistics, 2016b).
In 2014-15 the majority (85.8%) of men aged 16 and over felt in England and Wales either
fairly safe, or very safe, when walking alone after dark in their local area, no overall change
compared to the previous year (85.1%). For women the proportion is lower at 61.7%.
However, this is an improvement compared to 2013-14 when 58.0% of women reported
feeling safe (Office for National Statistics, 2016b).
It is recognised that provision of safe and adequate housing has a part to play in the health
and wellbeing of communities. Good quality, accessible housing in safe neighbourhoods
with good connections, access to facilities and green spaces helps people maintain networks
and independence, and supports healthy lifestyles. The provision of community resources
can provide a venue and focal point for social activities. Neighbourhoods that are planned
and designed to prevent and reduce opportunities for crime, with safe pavements and
lighting, with connections to facilities and transport links, can contribute to people’s
perception of safety (Chartered Institute of Housing & Housing Learning and Improvement
Network, 2015).
Work is being undertaken in Cumbria to license landlords under the Cumbria Landlord
Accreditation Scheme, a scheme designed to benefit both tenants and landlords. The
scheme is administered by the National Landlords Association on behalf of Cumbrian
districts. Under the scheme landlords make a commitment to keeping high standards and
following good practice in the way their properties are managed. In return, landlords receive
a number of benefits including assistance with fire precaution and energy efficiency

JSNA Staying Safe - draft for Health and Wellbeing Board
Page 72 of 108
measures, landlord training events, ability to use the scheme logo to assure tenants that
they are dealing with responsible landlords who understand their responsibilities and
obligations (Eden District Council, 2014).
Further work in relation to housing will be covered in the Environment and Sustainability
JSNA chapter planned for 2017. Homelessness is covered in the JSNA Health Inequalities
chapter published in July 2015, and available via the Cumbria Intelligence Observatory
website.

JSNA Staying Safe - draft for Health and Wellbeing Board
Page 73 of 108
7 Geographical differences in need
7.1 Cumbria and districts crime rate statistical comparison Indicator Allerdale
Count (rate) Barrow
Count (rate) Carlisle
Count (rate) Copeland Count (rate)
Eden Count (rate)
South Lakeland
Count (rate)
CUMBRIA Count (rate)
Total crime (rate per 1,000 population, 2015-16) 4,975 (51.6)
4,367 (64.6)
7,342 (68.0)
3,453 (49.4)
1,899 (36.1)
3,968 (38.4)
26,004 (52.2)
Total alcohol related crime (rate per 1,000 population, 2015-16)
(5.8) 770 (11.4)
994 (9.2)
574 (8.2)
217 (4.1)
515 (5.0)
3,626 (7.3)
Acquisitive crime
Theft from a motor vehicle (rate per 1,000 population, 2015-16)
205 (2.1)
100 (1.5)
230 (2.1)
70 (1.0)
88 (1.7)
125 (1.2)
818 (1.6)
Theft of a motor vehicle (rate per 1,000 population, 2015-16)
60 (0.6)
41 (0.6)
90 (0.8)
33 (0.5)
22 (0.4)
38 (0.4)
284 (0.6)
Burglary (dwelling) (rate per 1,000 population, 2015-16)
142 (1.5)
127 (1.9)
238 (2.2)
104 (1.5)
57 (1.1)
98 (0.9)
766 (1.5)
Burglary (other) (rate per 1,000 population, 2015-16)
369 (3.8)
179 (2.6)
323 (3.2)
189 (2.7)
134 (2.5)
244 (2.4)
1,458 (2.9)
Violent crime
Violence against the person (rate per 1,000 population 2015-16)
1,223 (12.7)
1,444 (21.3)
2,017 (18.7)
1,102 (15.8)
428 (8.1)
1,162 (11.3)
7,376 (14.8)
Alcohol related violence against the person offences (rate per 1,000 population 2015-16)
345 (3.6)
467 (6.9)
569 (5.3)
369 (5.3)
123 (2.3)
288 (2.8)
2,161 (4.3)
Hospital admissions, violence (inc. sexual violence) (rate per 100,000 population 2012-13 / 2014-15)
106 (40.6)
135 (69.0)
137 (42.6)
90 (45.3)
30 (21.4)
94 (37.2)
592 (43.2)
Domestic abuse (rate per 1,000 population 2015-16)
1,405 (14.6)
1,508 (22.3)
1,887 (17.5)
1,165 (16.7)
375 (7.1)
787 (7.6)
7,127 (14.3)
Sexual offences (rate per 1,000 population 2015-16)
141 (1.5)
145 (2. 1)
205 (1.9)
98 (1.4)
71 (1.3)
197 (1.9)
857 (1.7)

JSNA Staying Safe - draft for Health and Wellbeing Board
Page 74 of 108
Indicator Allerdale Count (rate)
Barrow Count (rate)
Carlisle Count (rate)
Copeland Count (rate)
Eden Count (rate)
South Lakeland
Count (rate)
CUMBRIA Count (rate)
Other crime
Business crime (rate per 1,000 population, 2015-16)
1,082 (11.2)
756 (11.2)
1,441 (13.3)
470 (6.7)
322 (6.1)
795 (7.7)
4,866 (9.8)
Anti-social behaviour (rate per 1,000 population, 2015-16)
2,362 (24.5)
2,829 (41.8)
3,785 (35.0)
1,873 (26.8)
929 (17.7)
2,025 (19.6)
13,803 (27.7)
Anti-social behaviour involving young people (rate per 1,000 population, 2015-16)
713 (7.4)
786 (11.6)
1,132 (10.5)
461 (6.6)
195 (3.7)
568 (5.5)
3,855 (7.7)
Criminal damage (including arson) (rate per 1,000 population, 2015-16)
1,111 (11.5)
882 (13.0)
1,403 (13.0)
705 (10.1)
334 (6.3)
759 (7.3)
5,194 (10.4)
Deliberate fires (rate per 1,000 population, 2015-16)
158 (1.6)
76 (1.1)
148 (1.4)
82 (1.2)
13 (0.2)
55 (0.5)
532 (1.1)
Hate crime (rate per 1,000 population, 2015-16)
79 (0.8)
46 (0.7)
135 (1.2)
50 (0.7)
30 (0.6)
39 (0.4)
377 (0.8)
Re-offending levels (average number of re-offences per offender, 2013)
966 (1.01)
1,018 (1.01)
1,449 (0.99)
603 (0.81)
150 (0.49)
417 (0.60)
4,603 (0.89)
Drug and alcohol misuse
Drug possession and supply (rate per 1,000 population, 2015-16)
183 (1.9)
176 (2.6)
301 (2.8)
140 (2.0)
119 (2.3)
151 (1.5)
1,070 (2.1)
Alcohol specific mortality: males (all ages) (DSR per 100,000 population 2012-14)
22.5 20.7 14.7 19.6 8.3 14.1 17.0
Alcohol specific mortality: females (all ages) (DSR per 100,000 population 2012-14)
16.4 9.9 7.7 5.3 4.9 2.9 7.9
Alcohol specific hospital admissions: all persons, all ages (DSR per 100,000 population 2014-15)
372 689 431 477 215 333 418
Alcohol specific hospital admissions: under 18 year olds (crude rate per 100,000 in 2012/13-2014/15)
39.9 90.2 36.6* 104.4 24.5* 61.1 58.2
Road Safety: Killed and Seriously Injured (KSI) statistics (rate per 1,000 population, 2015)
48 (0.5)
14 (0.2)
30 (0.3)
25 (0.4)
48 (0.9)
67 (0.6)
232 (0.5)
(DSR: Directly Standardised Rate)
* trend over 12 months not available, as data for previous reporting period (2011/12-2013/14) was suppressed by Public Health England
Key: trend over 12 months = increase
= decrease
= no significant change

JSNA Staying Safe - draft for Health and Wellbeing Board
Page 75 of 108
7.2 Allerdale district
Geographical differences in need:
Two wards with rates for all crime ranking within the highest eight wards: St John’s
(134.4) and St Michael’s (172.2), both much higher than the county rate (52.2)
Theft from a motor vehicle offences increasing (+16.5%, +29)
One quarter of all wards with crime rates for theft from a motor vehicle higher than
the county average (1.6) situated within Allerdale (13 wards)
Highest crime rate for theft from a motor vehicle in Crummock ward (17.0 per 1,000),
more than 10 times higher than the county rate
Second highest theft from a motor vehicle rate in Derwent Valley ward (9.1 per
1,000)
Theft of a motor vehicle offences increasing (+36.4%, +16)
Almost a quarter (12; 23.5%) of the wards with crime rates for theft of a motor vehicle
higher than the county average (0.6 per 1,000) situated in Allerdale
St Michael’s ward has a crime rate for burglary (dwelling) (6.2 per 1,000), the third
highest of all the wards, and more than four times the county rate (1.5)
Crime rate for burglary (other) is higher at 3.8 per 1,000 population than the county
average (2.9)
St Michael’s ward had the highest crime rate (12.0 per 1,000) and number of crimes
(60) for burglary (other) of all Cumbria’s wards
Largest increase in business crime (+22.1%, +196).
Second largest increase in youth anti-social behaviour of all the districts
(+17.9%; +108)
Largest increase in the proportion of re-offenders in 2013 who went on to re-offend of
all the districts (+4.2 percentage points)
Joint highest number of re-offences per offender in 2013 (1.01 per offender) with
Barrow-in-Furness
Female alcohol specific mortality rate (16.4 per 100,000 population) is significantly
worse than the England rate (7.4). Highest of all the districts; increase of +25.2% in
the rate compared to 2011-13 and +72.6% compared to 2010-12
Largest percentage increase in male alcohol specific mortality rate of all the districts
(+47.2%)
Highest rate of all fires in 2015-16 of all the districts (35.8 per 10,000); Flimby and St
Michael’s wards had the highest and second highest rate respectively of all
Cumbria’s wards (126 and 122 per 10,000)
Deliberate fires increased by +19.7% (+26) in 2015-16; highest rate (1.6 per
1,000 population) of all the districts
Four communities had a dozen or more deliberate fires during 2015-16: two within St
Michael’s ward (35 deliberate fires); one in Flimby ward (16); and one in Moss Bay
ward (13).

JSNA Staying Safe - draft for Health and Wellbeing Board
Page 76 of 108
7.2.1 Allerdale ward map
The location of wards within the Allerdale district and the levels of deprivation at LSOA level
are illustrated in the map below. The map legend and ward names for each identification
number can be viewed in Figure 8 and Table 28.

JSNA Staying Safe - draft for Health and Wellbeing Board
Page 77 of 108
Figure 8: Legend for Allerdale Indices of Multiple Deprivation map
Table 28: Allerdale – ward name and map identification number
Ward Name Map ID Ward Name Map ID
All Saints 1 Marsh 17
Aspatria 2 Moorclose 18
Boltons 3 Moss Bay 19
Broughton St Bridget's 4 Netherhall 20
Christchurch 5 St John's 21
Clifton 6 St Michael's 22
Crummock 7 Seaton 23
Dalton 8 Silloth 24
Derwent Valley 9 Solway 25
Ellen 10 Stainburn 26
Ellenborough 11 Wampool 27
Ewanrigg 12 Warnell 28
Flimby 13 Waver 29
Harrington 14 Wharrels 30
Holme 15 Wigton 31
Keswick 16

JSNA Staying Safe - draft for Health and Wellbeing Board
Page 78 of 108
7.3 Barrow-in-Furness district
Geographical differences in need:
Rate for all crime (64.6 per 1,000) higher than the county average (52.2); second
highest of all the districts
Three wards with rates for all crime ranking within the highest nine wards: Hindpool
(224.3); Central (177.5); Barrow Island (114.1)
Hindpool ward had the second highest number of all crimes of all wards (1,273)
Highest increase in theft from a motor vehicle offences of all the districts (+49.3%,
+33)
Crime rate in Central ward for theft from a motor vehicle (6.4 per 1,000) ranks in the
top seven wards, almost four times the county rate (1.6)
Theft of a motor vehicle offences increasing (+24.2%, +8)
Theft of a motor vehicle crime rate more than three times the county rate (0.6 per
1,000) in Barrow Island ward (2.0 per 1,000)
Barrow Island ward has the highest crime rate for burglary (dwelling) (6.8 per 1,000)
of all the wards, a rate that is more than four times the county rate (1.5)
Barrow had the highest increase in burglary (other) crimes of all the districts in
2015-16 (+82.7%, +81)
Crime rate for burglary (other) is higher at 3.2 per 1,000 population than the county
average (2.9)
Highest crime rate for violence against the person offences (21.3 per 1,000)
Highest rate of hospital admissions for violent crime (including sexual violence) of all
the districts (69.0 per 100,000); significantly worse than England rate (47.5)
Greatest proportion of repeat victims of domestic abuse (41.2%) of all the districts
Barrow-in-Furness - highest crime rate for sexual offences of all the districts
(2.1 per 1,000 population)
Highest crime rate for anti-social behaviour (41.8 per 1,000); Central ward had the
highest anti-social behaviour crime rate of all Cumbria’s wards (170.8 per 1,000)
Offence rate for youth anti-social behaviour (11.6 per 1,000) highest of all the districts
Central ward had the highest offence rate for youth anti-social behaviour
(44.7 per 1,000) of all Cumbria’s wards
Highest crime rate for criminal damage (including arson) offences of all the districts
(13.0 per 1,000); Central and Hindpool wards had the highest and third highest crime
rates of all Cumbria’s wards (40.9 and 40.3 per 1,000 respectively)
Hindpool ward had the third highest crime rate for hate crime of all Cumbria’s wards
(3.9 per 1,000)
Largest proportion of re-offenders in 2013 who went on to re-offend of all the districts
(31.8%)
Joint highest number of re-offences per offender in 2013 (1.01 per offender) with
Allerdale
Second largest number of service users in contact with Unity Drug and Alcohol
Services Cumbria (616)
Three wards within the top ten wards in the county for drug possession and supply
offences: Central ward (12.5 per 1,000 population); Barrow Island (9.1); Hindpool
(5.8). Central ward third highest of all Cumbria’s wards.
Hindpool ward had the third highest offence rate for alcohol related crime of all
Cumbria’s wards (51.4 per 1,000)

JSNA Staying Safe - draft for Health and Wellbeing Board
Page 79 of 108
Highest crime rate for alcohol related violent crime (6.9 per 1,000 population)
Hindpool ward had the third highest crime rate for alcohol related violence against
the person offences of all Cumbria’s wards (32.1 per 1,000)
Highest rate of alcohol related sexual offences (0.4 per 1,000 population); Hindpool
ward had the highest offence rate of all Cumbria’s wards (1.8 per 1,000)
Second highest increase in female alcohol specific mortality rate (+26.3% compared
to 2011-13)
Alcohol specific hospital admissions for all ages (689 per 100,000) significantly worse
than both the North West (558 per 100,000) and England (364 per 100,000); highest
rate percentage increase of all the districts compared to 2012-13 (+13.9%)
Alcohol specific hospital admissions (under 18 year olds) significantly worse than the
North West (90.2 compared to 53.5), and the second highest of all the districts
Dalton North ward had the third highest rate for all fires of all Cumbria’s wards
(86 per 10,000 population)

JSNA Staying Safe - draft for Health and Wellbeing Board
Page 80 of 108
7.3.1 Barrow ward map
The location of wards within the Barrow-in-Furness district and the levels of deprivation at
LSOA level are illustrated in the map below. The map legend and ward names for each
identification number can be viewed in Figure 9 and Table 29.

JSNA Staying Safe - draft for Health and Wellbeing Board
Page 81 of 108
Figure 9: Legend for Barrow-in-Furness Indices of Multiple Deprivation map
Table 29: Barrow-in-Furness – ward name and map identification number
Ward Name Map ID
Barrow Island 32
Central 33
Dalton North 34
Dalton South 35
Hawcoat 36
Hindpool 37
Newbarns 38
Ormsgill 39
Parkside 40
Risedale 41
Roosecote 42
Walney North 43
Walney South 44

JSNA Staying Safe - draft for Health and Wellbeing Board
Page 82 of 108
7.4 Carlisle district
Geographical differences in need:
Highest crime rate for all crime of all the districts (68.0 per 1,000 population)
Castle ward has the highest crime rate and number of crimes of all wards (317.6;
1,820)
Two wards with rates for all crime ranking in the top seven wards: Castle (317.6 per
1,000) and Currock (144.7)
Theft from a motor vehicle offences increasing (+17.3%; +34)
Castle ward had the highest number of thefts from a motor vehicle crimes (35)
Highest crime rate per 1,000 population for theft of a motor vehicle (0.8) of all the
districts, higher than the county average (0.6)
Theft of a motor vehicle crime rate more than three times the county rate (0.6 per
1,000) in Castle ward (2.3) and Morton ward (2.2 ), and are the highest rates of all
the county’s wards. Denton Holme (1.5) also ranks in the top six wards.
Burglary (dwelling) offences are increasing (+25.3%, +48); Carlisle has the highest
crime rate of all the districts (2.2 per 1,000)
St Aidan’s ward has the second highest crime rate for burglary (dwelling) (6.2 per
1,000) of all the wards, a rate that is more than four times the county average (1.5)
Highest number of violence against the person crimes (2,017)
Castle ward had the highest violence against the person crime rate (88.8 per 1,000)
of all Cumbria’s wards
Highest number of hospital admissions for violent crime (including sexual violence) of
all the districts (137)
Largest number of reported domestic abuse crimes of all the districts (1,887)
Carlisle - highest increase in sexual offences of all the districts +58.9% (+76)
Highest number of recorded business crimes (1,441) and the highest crime rate (13.3
per 1,000 population)
Largest number of reported anti-social behaviour offences in 2015-16 (3,785); higher
crime rate (35.0 per 1,000) than the county average (27.7);
Castle ward had the second highest anti-social behaviour crime rate of all Cumbria’s
wards (141.2 per 1,000)
Largest increase in youth anti-social behaviour of all the districts during 2015-16
(+20.4%; +192); crime rate (10.5 per 1,000) second highest of all the districts
Highest increase in criminal damage (including arson) offences of all the districts
(+15.6%; +189); Castle ward had the second highest crime rate of all Cumbria’s
wards (40.8 per 1,000)
Highest hate crime rate of all Cumbria’s districts in 2015-16 (1.2 per 1,000); Castle
ward had the highest hate crime rate of all Cumbria’s wards (7.3 per 1,000)
Largest number of service users in contact with Unity Drug and Alcohol Services
Cumbria (790); increase in alcohol misuse referrals to Unity (+5.9%, +16); highest
proportion of service users using heroin as their main drug 51.3% (405).
Castle ward had the second highest offence rate for drug possession and supply in
2015-16 (17.3 per 1,000 population)
Largest increase in terms of number of alcohol related crimes +153 (+18.2%); Castle
ward had the highest offence rate of all Cumbria’s wards (64.2 per 1,000 population)
Highest increase in alcohol related violent crime (+10.1%; +52)

JSNA Staying Safe - draft for Health and Wellbeing Board
Page 83 of 108
Castle ward had the highest crime rate for alcohol related violence against the
person offences of all Cumbria’s wards (36.8 per 1,000)
Highest number of alcohol related sexual offences in 2015-16 (36 crimes recorded);
Castle ward had the second highest offence rate of all Cumbria’s wards (1.4 per
1,000)
Second largest increase in male alcohol specific mortality rates (+23.8% to 14.7 per
100,000).
Two communities had a dozen or more deliberate fires during 2015-16: one in
Botcherby (13 deliberate fires); one in Belle Vue (12)

JSNA Staying Safe - draft for Health and Wellbeing Board
Page 84 of 108
7.4.1 Carlisle ward map
The location of wards within the Carlisle district and the levels of deprivation at LSOA level
are illustrated in map below. The map legend and ward names for each identification
number can be viewed in Figure 10 and Table 30.

JSNA Staying Safe - draft for Health and Wellbeing Board
Page 85 of 108
Figure 10: Legend for Carlisle Indices of Multiple Deprivation map
Table 30: Carlisle – ward name and map identification number
Ward Name Map ID Ward Name Map ID
Belah 45 Hayton 56
Belle Vue 46 Irthing 57
Botcherby 47 Longtown and Rockcliffe 58
Brampton 48 Lyne 59
Burgh 49 Morton 60
Castle 50 St Aidans 61
Currock 51 Stanwix Rural 62
Dalston 52 Stanwix Urban 63
Denton Holme 53 Upperby 64
Great Corby and Geltsdale 54 Wetheral 65
Harraby 55 Yewdale 66
Fire and Rescue (Cumbria County Council, 2015b)
Carlisle has the second lowest rate of overall fire and rescue incidents in Cumbria (86.6
per 10,000) compared to other districts and has a lower rate than the Cumbrian average
(90.7 incidents).
This is a result of Carlisle having the second lowest rate of false alarms (38.0 per
10,000) compared to other districts, and its higher rate than the Cumbrian average (39.2
per 10,000). Carlisle also has the second lowest rate of road traffic collision special
service calls (4.6 per 10,000) compared to other districts and has a lower rate than the
Cumbrian average (6.0 per 10,000). It also has the second lowest rate of non-road
traffic collisions (14.1 per 10,000) compared other districts and is lower than the
Cumbrian average (17.3 per 10,000).
Carlisle has the third highest rate of fires (29.9 per 10,000), which is just lower than the
Cumbrian average rate of 28.3 (Cumbria County Council, 2015b).

JSNA Staying Safe - draft for Health and Wellbeing Board
Page 86 of 108
7.5 Copeland district
Geographical differences in need:
All crime rate in Harbour ward (196.0 per 1,000) almost four times the county rate
(52.2)
Crime rate for theft from a motor vehicle in Ennerdale ward (7.2 per 1,000) more than
four times the county rate (1.6); fourth highest of all the wards
Theft of a motor vehicle offences increasing; largest percentage increase, (+43.5%;
+10) of all the districts. Crime rate for Kells ward (1.6 per 1,000) ranks in the top five
of all the wards, and is almost three times higher than the county rate (0.6).
Burglary (dwelling) offences are increasing (+28.4%; +23); Copeland has the highest
increase of all the districts
Second highest rate of hospital admissions for violent crime (including sexual
violence) of all the districts (45.3 per 100,000)
Second largest proportion of repeat victims of domestic abuse (40.2%) of all the
districts
Harbour ward had the third highest anti-social behaviour crime rate of all Cumbria’s
wards (115.6 per 1,000)
Harbour ward had the second highest crime rate for hate crime of all Cumbria’s
wards (4.6 per 1,000)
Only district with a significant increase in drug misuse referrals to Unity Drug and
Alcohol Services Cumbria (+18.5%; +38)
Harbour ward had the second highest offence rate for alcohol related crime of all
Cumbria’s wards (55.6 per 1,000)
Harbour ward had the second highest crime rate for alcohol related violence against
the person offences of all Cumbria’s wards (34.6 per 1,000)
Alcohol specific hospital admissions (under 18 year olds) significantly worse than the
North West (104.4 compared to 53.5), and the highest of all the districts

JSNA Staying Safe - draft for Health and Wellbeing Board
Page 87 of 108
7.5.1 Copeland ward map
The location of wards within the Copeland district and the levels of deprivation at LSOA level
are illustrated in the map below. The map legend and ward names for each identification
number can be viewed in Figure 11 and Table 31.

JSNA Staying Safe - draft for Health and Wellbeing Board
Page 88 of 108
Figure 11: Legend for Copeland Indices of Multiple Deprivation map
Table 31: Copeland - ward name and map identification number
Ward Name Map ID Ward Name Map ID
Arlecdon 67 Haverigg 80
Beckermet 68 Hensingham 81
Bootle 69 Hillcrest 82
Bransty 70 Holborn Hill 83
Cleator Moor North 71 Kells 84
Cleator Moor South 72 Millom Without 85
Distington 73 Mirehouse 86
Egremont North 74 Moresby 87
Egremont South 75 Newtown 88
Ennerdale 76 St Bees 89
Frizington 77 Sandwith 90
Gosforth 78 Seascale 91
Harbour 79

JSNA Staying Safe - draft for Health and Wellbeing Board
Page 89 of 108
7.6 Eden district
Geographical differences in need:
All crime rate in Penrith West ward (107.4 per 1,000) more than twice the county rate
(52.2)
Crime rate for theft from a motor vehicle in Ullswater ward (7.9 per 1,000) almost five
times the county rate (1.6), and third highest of all the wards
Theft of a motor vehicle crime rate in Kirkoswald ward (2.1 per 1,000) is the third
highest in the county, and more than three and a half times higher than the county
rate (0.6)
Burglary (dwelling) offences are increasing (+18.8%, +9)
Largest increase in reported domestic abuse crimes of all the districts (+19.0%, +60)
Highest percentage increase in hate crimes in 2015-16 (+76.5%; +13)
Askham ward had the highest offence rate for drug possession and supply (25.3 per
1,000), most likely as a result of “Kendal Calling”
Largest percentage rise in alcohol related crime of all the districts (24.0%; +42)
Highest rate of people killed or seriously injured on Cumbria’s roads (0.9 per 1,000
population)

JSNA Staying Safe - draft for Health and Wellbeing Board
Page 90 of 108
7.6.1 Eden ward map
The location of wards within the Eden district and the levels of deprivation at LSOA level are
illustrated in the map below. The map legend and ward names for each identification
number can be viewed in Figure 12 and Table 32.

JSNA Staying Safe - draft for Health and Wellbeing Board
Page 91 of 108
Figure 12: Legend for Eden Indices of Multiple Deprivation map
Table 32: Eden – ward name and map identification number
Ward Name Map ID Ward Name Map ID
Alston Moor 92 Lazonby 107
Appleby (Appleby) 93 Long Marton 108
Appleby (Bongate) 94 Morland 109
Askham 95 Orton with Tebay 110
Brough 96 Penrith Carleton 111
Crosby Ravensworth 97 Penrith East 112
Dacre 98 Penrith North 113
Eamont 99 Penrith Pategill 114
Greystoke 100 Penrith South 115
Hartside 101 Penrith West 116
Hesket 102 Ravenstonedale 117
Kirkby Stephen 103 Shap 118
Kirkby Thore 104 Skelton 119
Kirkoswald 105 Ullswater 120
Langwathby 106 Warcop 121

JSNA Staying Safe - draft for Health and Wellbeing Board
Page 92 of 108
7.7 South Lakeland district
Geographical differences in need:
Largest percentage increase in all crime of all the districts (+14.9%; +516) and the
largest rise over a three year period (+21.3%; +697)
All crime rate in Kendal Fell ward (199.7 per 1,000) ranking in the highest three
wards in the county, and almost four times the county rate (52.2)
Theft from a motor vehicle offences increasing (+40.4%, +36) the second highest
increase of all the districts
Burglary (dwelling) offences are increasing (+7.7%; +7)
Kendal Mintsfeet and Kendal Far Cross wards had the second and third highest
offence rates for youth anti-social behaviour of all Cumbria’s wards (35.5 and 31.2
per 1,000 population respectively)
Four wards within the top ten highest crime rates for alcohol related sexual offences:
Kendal Fell (1.3 per 1,000); Kendal Kirkland (1.0); Windermere Applethwaite and
Troutbeck (0.9); Ulverston East (0.9)
Largest increase in people reported as being killed or seriously injured on Cumbria’s
roads in 2015 (+21.8%; +12); highest number in 2015 of all the districts (67)

JSNA Staying Safe - draft for Health and Wellbeing Board
Page 93 of 108
7.7.1 South Lakeland ward map
The location of wards within the South Lakeland district and the levels of deprivation at
LSOA level are illustrated in the map below. The map legend and ward names for each
identification number can be viewed in Figure 13 and Table 33.

JSNA Staying Safe - draft for Health and Wellbeing Board
Page 94 of 108
Figure 13: Legend for South Lakeland Indices of Multiple Deprivation map
Table 33: South Lakeland - ward name and map identification number
Ward Name Map ID Ward Name Map ID
Ambleside and Grasmere 122 Kendal Stonecross 145
Arnside and Beetham 123 Kendal Strickland 146
Broughton 124 Kendal Underley 147
Burneside 125 Levens 148
Burton and Holme 126 Low Furness 149
Cartmel and Grange West 127 Lyth Valley 150
Coniston and Crake Valley 128 Mid Furness 151
Crooklands 129 Milnthorpe 152
Grange North 130 Sedbergh and Kirkby Lonsdale 153
Grange South 131 Staveley-in-Cartmel 154
Hawkshead 132 Staveley-in-Westmorland 155
Holker 133 Ulverston Central 156
Kendal Castle 134 Ulverston East 157
Kendal Far Cross 135 Ulverston North 158
Kendal Fell 136 Ulverston South 159
Kendal Heron Hill 137 Ulverston Town 160
Kendal Highgate 138 Ulverston West 161
Kendal Kirkland 139 Whinfell 162
Kendal Mintsfeet 140 Windermere Applethwaite and Troutbeck
163
Kendal Nether 141 Windermere Bowness North 164
Kendal Oxenholme and Natland 142 Windermere Bowness South 165
Kendal Parks 143 Windermere Town 166
Kendal Romney 144

JSNA Staying Safe - draft for Health and Wellbeing Board
Page 95 of 108
7.8 North and South Clinical Commissioning Group Areas
During 2017, Cumbria’s Clinical Commissioning Group (CCG) will be implementing
boundary changes to create and establish Integrated Care Communities (ICCs). This will
split Cumbria’s CCG into two main areas: north and south.
Cumbria’s north CCG area will include the districts of Allerdale, Carlisle, Eden and Copeland
with the exception of four wards in the Copeland district (Haverigg; Holborn Hill;
Millom Without; Newtown). The south CCG area will include the districts of South Lakeland
and Barrow-in-Furness with the addition of the four wards in the Copeland district as
mentioned previously. Individual ICC boundary areas can be viewed in Figure 14.
To reflect CCG changes, Table 34 outlines differences in need in respect of staying safe
between north and south CCG areas where data is available for these geographies.
Table 34: CCG north and south, geographical differences in need
Offence category (Cumbria offence rate per 1,000 in 2015-16)
CCG Area CCG area offence rate per 1,000
All crime (Cumbria rate 52.2 per 1,000)
North 54.4
South 47.9 Burglary (dwelling) (Cumbria rate 1.5 per 1,000)
North 1.7
South 1.3
Burglary (other) (Cumbria rate 2.9 per 1,000)
North 3.2
South 2.4 Drug possession and supply (Cumbria rate 2.1 per 1,000)
North 2.3
South 1.9
Theft from a motor vehicle (Cumbria rate 1.6 per 1,000)
North 1.8
South 1.3
Theft of a motor vehicle (Cumbria rate 0.6 per 1,000)
North 0.6
South 0.5
Criminal damage (including arson) (Cumbria rate 10.4 per 1,000)
North 10.9
South 9.5
Sexual offences (Cumbria rate 1.7 per 1,000)
North 1.6
South 1.9 Violence against the person (Cumbria rate 14.8 per 1,000)
North 14.6
South 15.1
Hate crime (Cumbria rate 0.8 per 1,000)
North 0.9
South 0.5 Alcohol related violence against the person (Cumbria rate 4.3 per 1,000)
North 4.3
South 4.3
Alcohol related sexual offences (Cumbria rate 0.3 per 1,000)
North 0.2
South 0.3
Alcohol related all crime (Cumbria rate 7.3 per 1,000)
North 7.3
South 7.4
Anti-social behaviour (Cumbria rate 27.7 per 1,000)
North 27.8
South 27.5
Youth anti-social behaviour (Cumbria rate 7.7 per 1,000)
North 7.8
South 7.6 Key:
Higher than county rate for offence category in 2015-16
Equal to county rate for offence category in 2015-16
Lower than county rate for offence category in 2015-16

JSNA Staying Safe - draft for Health and Wellbeing Board
Page 96 of 108
7.8.1 Cumbria CCG boundary map
Figure 14: Cumbria Integrated Care Community boundary areas
(Source: NHS North of England Commissioning Support Unit, 2016)

JSNA Staying Safe - draft for Health and Wellbeing Board
Page 97 of 108
8 Current Services and Assets The following services are currently provided in Cumbria to support safety of communities
and individuals.
Victims of (all) crime:
Victims Information Service website and Freephone Helpline (0808 168 9293) set up
by Victim Support and the Ministry of Justice in April 2015 House of Commons
Library, 2016a)
Turning the Spotlight
Cumbria Victims Charitable Trust (generates additional income to supplement
Ministry of Justice funding)
Support for victims of sexual violence and / or domestic abuse (Office of the Police and
Crime Commissioner, 2016)
Bridgeway Sexual Assault Service (Cumbria: complete package of support for men,
women and children who live or have been raped or sexually assaulted within
Cumbria, including contactable 24 hours a day throughout the year).
Safety Net (North, East and West Cumbria) provide specialist therapeutic services for
children and adults who have been victims of sexual abuse, including working as part
of the Bridgeway service.
Birchall Trust (South Cumbria) provide specialist therapeutic services for children and
adults who have been victims of sexual abuse, including working as part of the
Bridgeway service.
NSPCC (provides a range of support for children who have been victims of child
sexual exploitation, sexual abuse, are displaying sexually harmful behaviour and
those children where abuse is suspected but has not been disclosed)
Victim Support (provides the ISVA service for The Bridgeway Sexual Assault Service
and also supports victims of sexual offences through specially trained volunteers for
the offences and levels of risk which are less high, complementing the service
provided by the ISVAs)
Freedom Project (specialist services for people affected by domestic abuse, where
sexual abuse is quite often a factor)
Let Go (specialist services for people affected by domestic abuse, where sexual
abuse is quite often a factor)
Child Sexual Exploitation:
Cumbria Constabulary
Brathay Trust (runs a relatively new programme with young people identified as
being at risk of Child Sexual Exploitation)
Local Safeguarding Children Board
Young People’s offending:
Cumbria County Council Youth Offending Team
Youth Crime Prevention Triage Service

JSNA Staying Safe - draft for Health and Wellbeing Board
Page 98 of 108
Fraud:
Action Fraud
Cifas
Financial Fraud Action UK
Cyberbullying:
Stop Abuse Online (national government funded website, launched 17 June 2016)
Terrorism:
Counter Terrorism Local Profiles
Hate crime:
Turning the Spotlight Programme (Cumbria)
Cumbria Constabulary - online hate crime reporting, 49 Hate Incident Reporting
Centres located throughout the county
Offending / re-offending:
Cumbria and Lancashire Community Rehabilitation Company
National Probation Service
Drug / alcohol misuse:
Unity Drug and Alcohol Services Cumbria
The Well (Barrow-in-Furness)
Fire safety – Cumbria Fire and Rescue Service (fire prevention):
Cumbria Fire and Rescue Service Home Accident Reduction Interventions (home
visits)
Fire safety – Cumbria Fire and Rescue Service (response) (Cumbria County Council,
2015b):
Allerdale: seven fire stations; nine fire engines; one boat; one wildlife Landrover.
Workington station is crewed by a combination of regular and on-call fire-fighters and
the other six are crewed solely by on-call fire-fighters.
Barrow-in-Furness: two fire stations; three fire engines; one aerial ladder platform;
national Incident Response Unit. Barrow station is crewed by regular fire-fighters
(with a separate cohort of on-call firefighters that crew a resilience fire engine during
periods of high demand); Walney station is crewed by on-call fire-fighters.
Carlisle: Four fire stations; four fire engines; one boat. Two stations (Carlisle East
and West) are crewed by regular fire-fighters and Longtown and Brampton are
crewed by on-call fire-fighters.
Copeland: Six fire stations; seven fire engines; one wildlife Landrover. Whitehaven
station is crewed by a combination of regular and on-call fire-fighters and the other
five are crewed by on-call fire-fighters.
Eden: Seven fire stations; eight fire engines; one boat; one wildlife Landrover;
national Enhanced Logistical Support vehicle; Water Bowser; Environmental
Protection Unit. The station in Penrith serves as the Cumbria Fire and Rescus
Service headquarters and is crewed by a combination of regular and on-call fire-
fighters and six are crewed solely by on-call fire-fighters.

JSNA Staying Safe - draft for Health and Wellbeing Board
Page 99 of 108
South Lakeland: 12 fire stations; 14 fire engines; one wildlife Landrover; national
High Volume Pump based at Kendal Fire Station. Two stations (Kendal and
Ulverston) are crewed by a combination of regular and on-call fire-fighters and 10
stations are crewed solely by on-call fire-fighters.
Road safety:
Cumbria Road Safety Partnership
Vulnerable adults:
Cumbria Safeguarding Hub
9 Community views The Office for National Statistics (2015a) carried out a national survey regarding perceptions
of anti-social behaviour. Responses show that 11.0% of adults perceive there to be a high
level of anti-social behaviour. The main concerns were around rubbish or litter lying around
(28.8% of respondents considered this to be a very or fairly big problem), people using or
dealing drugs (24.3%), people being drunk or rowdy in public places (18.3%), teenagers
hanging around on the streets (17.3%) and vandalism, graffiti and other deliberate damage
to property (16.0%).
At a local level, Cumbria Constabulary conducted an annual public consultation survey
during August 2015, sending the survey to members of Cumbria Constabulary’s Citizens
Panel, 2,000 random households across the county and minority groups via the Diversity
Manager. The survey was also available online. In total 1,207 usable surveys were
returned by the closing date, which means we can be 95% confident that the views
expressed represent those of the population as a whole. Over half the respondents (53.7%,
646) identified speeding vehicles as their main concern (Cumbria Constabulary, 2016e).
The main five concerns across the county are illustrated in Table 35.
Table 35: Main concerns of Cumbrian residents
Local Concern – CUMBRIA Number selecting this concern
% of respondents who selected this concern
(selected 5)
Speeding vehicles 646 53.7%
Dwelling burglary 523 43.4%
Dangerous driving 459 38.1%
Drug dealing 457 38.0%
Antisocial behaviour on the streets 412 34.2% Source: (Cumbria Constabulary, 2016e)
Speeding vehicles is the top concern across all Cumbria’s districts, except for Carlisle where
it holds second priority place. Some variations were seen across other categories.
Allerdale, Carlisle and Copeland had the same five main concerns, however for Allerdale
respondents antisocial behaviour had a higher priority (44.1%, 64) than it did across the
county. Dwelling burglary is the top concern in Carlisle (58.3%, 77). In Copeland, a higher
proportion than the county average cited drug dealing (43.4%, 45) and antisocial behaviour

JSNA Staying Safe - draft for Health and Wellbeing Board
Page 100 of 108
(40.4%, 42) as a concern; a lower proportion are concerned about dwelling burglary (30.8%,
32) (Cumbria Constabulary, 2016e).
Whilst speeding vehicles, dwelling burglary and drug dealing are concerns in Barrow-in-
Furness, 41.7% (35) respondents selected ‘protecting vulnerable people (both children and
adults)’ and 38.1% (32) ‘criminal damage (vandalism)’ as two of their top five concerns.
Both Eden and South Lakeland included ‘rural crime (eg agricultural theft such as
machinery, metal, oil, diesel, livestock)’ as concerns 51.8% (43) and 40.4% (65).
Respondents in South Lakeland also included ‘criminal damage (vandalism)’ (32.3%, 52). It
should be noted that the number of returns allocated to Barrow-in-Furness and Eden districts
were fairly low, making up just 7.0% and 6.9% of the returns respectively. However, a large
proportion of returns (498, 41.3%) could not be allocated to a particular district, although it is
known that all but 31 of these are resident within Cumbria (Cumbria Constabulary, 2016e).
ACORN data provided by CACI Ltd provide an indication of the fear of crime amongst
Cumbria’s residents. Across the county 8.2% of residents are considered to be worried
about becoming a victim of crime, with concern highest in Barrow-in-Furness district (9.3%)
and lowest in Eden (6.6%). Fear of becoming a victim is considered to be highest in Moss
Bay and Moorclose wards in Allerdale (13.3% and 12.5% respectively) (CACI Ltd, 2016).
Wards with the highest proportion of residents worried about becoming victims of crime are
shown in Table 36.
Table 36: Fear of becoming a victim of crime
District Ward Fear of being a victim of crime (number with
behaviour)
Fear of being a victim of crime
(% with behaviour)
Allerdale Moss Bay 669 13.3%
Allerdale Moorclose 618 12.5%
Carlisle Upperby 671 12.3%
Copeland Mirehouse 524 12.2%
Carlisle Botcherby 753 12.1%
Barrow-in-Furness Hindpool 668 11.8%
Copeland Sandwith 308 11.7%
South Lakeland Kendal Kirkland 230 11.6%
Barrow-in-Furness Central 499 11.6%
Barrow-in-Furness Risedale 673 11.2% © 1979 – 2016 CACI Limited. This data shall be used solely for academic, personal and/ or non-
commercial purposes.
Fear of crime is considered to be higher in Barrow-in-Furness than in other districts across a
range of potential crimes including: being attacked because of skin colour, ethnic origin or
religion (4.0%); being raped (9.2%); being physically attacked by strangers (9.0%); theft from
a vehicle (7.2%); theft of a vehicle (7.9%); being mugged or robbed (8.6%); dwelling burglary
(11.9%) (CACI Ltd, 2016).
Worry about burglary (dwelling) would appear to be the highest crime category of concern
for one in ten residents (10.3%). Wards estimated to have the highest proportion of
residents with this behaviour are shown in Table 37.

JSNA Staying Safe - draft for Health and Wellbeing Board
Page 101 of 108
Table 37: Fear of becoming a victim of burglary (dwelling)
District Ward Fear of being a victim of crime (number with
behaviour)
Fear of being a victim of crime
(% with behaviour)
Allerdale Moss Bay 810 16.1%
Allerdale Moorclose 797 16.1%
Copeland Mirehouse 672 15.6%
Carlisle Upperby 839 15.3%
Carlisle Botcherby 927 14.9%
Barrow-in-Furness Central 639 14.8%
Copeland Sandwith 389 14.8%
South Lakeland Kendal Kirkland 287 14.5%
Barrow-in-Furness Risedale 869 14.5%
Barrow-in-Furness Hindpool 818 14.4% © 1979 – 2016 CACI Limited. This data shall be used solely for academic, personal and/ or non-
commercial purposes.
Analysis of reported instances of burglary (dwelling) crimes shows that there is not always a
correlation between the chances of becoming a victim of burglary, and the fear of becoming
a victim. Of the wards with the highest reported incidents of burglary (dwelling) during 2015-
16, only three (Central, Hindpool and Upperby) had high levels of worry regarding becoming
victims of burglary. Of the wards with the highest crime rates for burglary (other), only four
had high levels of worry: the three wards as mentioned previously, with the addition of
Sandwith ward.

JSNA Staying Safe - draft for Health and Wellbeing Board
Page 102 of 108
10 Equality Impact Assessment A range of protected characteristics are recognised under the Equality Act 2010:
Age
Disability
Gender reassignment (identity)
Marriage and civil partnerships
Pregnancy and maternity
Race
Religion and belief
Sex (gender)
Sexual orientation (Government Equalities Office, 2015).
It is recognised from evidence within this JSNA chapter that people with protected
characteristics as outlined above are more likely than others to be victims of certain
offences.
Pregnant women are vulnerable to domestic abuse.
Age and gender is a factor in violence, domestic violence and sexual offences:
o Females (women and girls) are more likely to be victims of violence against
the person offences, particularly those aged 25 to 59 years;
o Females (women and girls) are more likely to be victims of sexual offences,
particularly those aged from 0 to 17 years.
Disability, transgender, race, religion and belief, and sexual orientation are factors in
hate crime incidents.
Safety for people with protected characteristics are also at greater risk than others in some
circumstances.
People with a disability are at greater risk of having a fire in their home.
Elderly and / or disabled adults are more likely to be the subject of Vulnerable Adult
referrals.
11 Key Contacts Catherine White, Senior Analyst
Performance and Intelligence Team, Performance and Risk Unit, Cumbria County Council
Telephone: 07974 327370
Email: [email protected] or [email protected]
JSNA Staying Safe - draft for Health and Wellbeing Board
Page 103 of 108
12 Related Documents
JSNA Healthy Living and Lifestyles Chapter http://www.cumbriaobservatory.org.uk/health/JSNA/2015/healthylivinglifestyles.asp
JSNA Children and Families Chapter http://www.cumbriaobservatory.org.uk/health/JSNA/2015/childrenandfamilies.asp
JSNA Health Inequalities chapter http://www.cumbriaobservatory.org.uk/health/JSNA/2015/inequalities.asp
13 Links to data sources
English indices of deprivation https://www.gov.uk/government/collections/english-indices-of-deprivation
Population estimates, mid-2014 http://webarchive.nationalarchives.gov.uk/20160105160709/http://www.ons.gov.uk/ons/rel/sape/small-area-population-estimates/mid-2014-and-mid-2013/stb-sape-2013-2014.html

JSNA Staying Safe - draft for Health and Wellbeing Board
Page 104 of 108
14 References
Association of Police and Crime Commissioners, The (APCCS). (2016). Role of the PCC. Location: http://www.apccs.police.uk/role-of-the-pcc/ [accessed 18/05/2016] CACI Ltd. (2016). ACORN Knowledge. Provided direct to Cumbria County Council © 1979 – 2016 CACI Limited. This data shall be used solely for academic, personal and/ or non-commercial purposes. Chartered Institute of Housing & Housing Learning and Improvement Network. (2015). Developing your local housing offer for health and care: Targeting outcomes. Location: http://www.cih.org/freepublications [accessed 14/07/2016] Community-safety.info. (2015). Mental Disorder & Offending. Location: http://www.community-safety.info/39.html [accessed 27/06/2016] Crime and Disorder Act 1998 c.37. Location: http://www.legislation.gov.uk/ukpga/1998/37 [accessed 25/04/2016] Criminal Justice Act 2003 c.44. Location: http://www.legislation.gov.uk/ukpga/2003/44/contents [accessed 26/04/2016] Crown Prosecution Service, The. (2015). Violence Against Women and Girls Crime Report 2014-15. Location: http://www.cps.gov.uk/publications/equality/vaw/#a02 [accessed 12/04/2016] Cumbria and Lancashire Community Rehabilitation Company. (2016). Cumbria caseload data provided by the Cumbria and Lancashire Community Rehabilitation Company Performance Team, by email, 13/06/2016. Cumbria Constabulary. (2014). Rural Crime Strategy 2014-2016. Penrith: Cumbria Constabulary. Cumbria Constabulary. (2015a). Force Strategic Assessment 2015. Sanitised version provided by Cumbria Constabulary, by email, 13 April 2016 Cumbria Constabulary. (2015b). Making Cumbria an even safer place, A Police and Crime Plan for Cumbria 2013-2017, Revised 2015. Location: http://www.cumbria-pcc.gov.uk/working-for-you/police-and-crime-plan.aspx [accessed 18/05/2016] Cumbria Constabulary. (2016a). Breakdown of crime data, Excel spreadsheets, provided by Cumbria Constabulary, Information Management Section, 20/06/2016 Cumbria Constabulary. (2016b). Crime and Disorder Dashboard to 31 March 2016. (Data provided by Cumbria Constabulary in Excel spreadsheet format) Cumbria Constabulary. (2016c). CSE, Missing from Home, vulnerable child and vulnerable adult data provided by Cumbria Constabulary, HQ PPU – Safeguarding Hub, by email, 20/06/2016 Cumbria Constabulary. (2016d). Information regarding flood-related offence types provided by email, 21/01/2016. Cumbria Constabulary. (2016e). Results from Cumbria Constabulary annual public consultation survey provided by email, 12/04/2016. Cumbria County Council. (2015a). Cumbria Fire and Rescue Service Integrated Risk Management Plan 2016-20. Location: http://www.cumbria.gov.uk/eLibrary/Content/Internet/535/612/41697155631.pdf [accessed 22/06/2016]

JSNA Staying Safe - draft for Health and Wellbeing Board
Page 105 of 108
Cumbria County Council. (2015b). FireCore data analysis based on rate from ONS Population Estimates for UK, England and Wales, Scotland and Northern Ireland, Mid-2014 Cumbria County Council. (2015c). FireCore data analysis based on rate from ONS Population Estimates for UK, England and Wales, Scotland and Northern Ireland, Mid-2015 Cumbria County Council. (2015d). Furness Peninsula Blue Light Hub – factsheet, September 2016. Location: http://www.cumbria.gov.uk/elibrary/Content/Internet/536/6181/42258152039.pdf [accessed 22/06/2016] Cumbria County Council. (2016a). Corporate Performance Report incorporating progress against Council Plan Delivery Plan, March 2016. Location: http://councilportal.cumbria.gov.uk/ieListMeetings.aspx?CId=117&Year=0 [accessed 22/06/2016] Cumbria County Council. (2016b). Fire and deliberate fire data provided by the Performance and Intelligence Team, 19 May 2016 Cumbria County Council. (2016c). Information regarding Counter Terrorism Local Profiles provided by email, 20/07/2016. Cumbria County Council. (2016d). Labour Market Briefing June 2016. Location: http://www.cumbriaobservatory.org.uk/economy/unemployment.asp [accessed 27/06/2016] Cumbria County Council. (2016e). Youth Offending data provided by Cumbria Youth Offending Service, by email, 10/06/2016. Cumbria County Council. (2016f). Cumbria Youth Offending Service Strategic Plan 2016-17 (DRAFT) provided by Cumbria Youth Offending Service, by email, 17/06/2016 Cumbria Multi-Agency Public Protection Arrangements (MAPPA). (2015). Annual Report 2014/15. Location: https://www.gov.uk/government/publications/multi-agency-public-protection-arrangements-mappa-annual-reports-2014-to-2015 [accessed 12/04/2016] Cumbria Office of the Police and Crime Commissioner. (2016). Innovation Fund media release, by email, 17/03/2016. Cumbria Road Safety Partnership. (2016). Road Safety Report 2015-16. Location: http://www.crsp.co.uk/page/129/Our-Plan-for-the-2013-14-Financial-Year.htm [accessed 23/05/2016] Cumbria Safeguarding Adults Board. (2015). Safeguarding Adults at Risk Annual Report 2015. Location: http://www.cumbria.gov.uk/healthandsocialcare/adultsocialcare/safe/default.asp [accessed 07/07/2016] Department for Communities and Local Government. (2012). Fire and Rescue National Framework for England Location: https://www.gov.uk/government/publications/fire-and-rescue-national-framework-for-england [accessed 22/06/2016] Department for Environment, Food & Rural Affairs. (2013). Rural crime. Location: https://www.gov.uk/government/statistics/rural-crime [accessed 08/07/2016] Department for Transport. (2015). Reported Road Casualties Great Britain: 2014 Annual Report. Location: https://www.gov.uk/search?q=reported+road+casualties+great+britain [accessed 25/05/2016] Eden District Council. (2014). Cumbria Landlord Accreditation Scheme. Location: http://www.eden.gov.uk/housing/landlords/cumbria-landlord-accreditation-scheme/ [accessed 14/07/2016]

JSNA Staying Safe - draft for Health and Wellbeing Board
Page 106 of 108
Fixers. (2016). Sexual Harassment and Violence in Schools. Location: http://www.parliament.uk/business/committees/committees-a-z/commons-select/women-and-equalities-committee/news-parliament-2015/sexual-harassment-and-sexual-violence-in-schools-launch-15-16/ [accessed 23/06/2016] Government Equalities Office. (2015) Equality Act 2010: Guidance. Location: https://www.gov.uk/guidance/equality-act-2010-guidance [accessed 14/07/2016] Home Office. (2016). Policing and Crime Bill: overarching documents. Location: https://www.gov.uk/government/publications/policing-and-crime-bill-overarching-documents [accessed 22/06/2016] House of Commons Library. (2016a). A new victims’ law in England and Wales? Location: http://researchbriefings.parliament.uk/ResearchBriefing/Summary/SN07139#fullreport [accessed 27/06/2016] House of Commons Library. (2016b). Online abuse. Location: http://researchbriefings.parliament.uk/ResearchBriefing/Summary/CDP-2016-0138 [accessed 06/07/2016] House of Commons Library. (2016c). Terrorism in Great Britain: the statistics. Location: http://researchbriefings.parliament.uk/ResearchBriefing/Summary/CBP-7613 [accessed 24/06/2016] Let Go. (2016). Let Go Cumbria SafeLives Insights Data Report, All Roles 12 months to July 2016. Liverpool John Moores University. (2016). TIIG Cumbria Overview Report April 2012 to March 2015. Mental Health Act 2007 c.12. Location: http://www.legislation.gov.uk/ukpga/2007/12/contents [accessed 26/04/2016] Ministry of Justice. (2016). Youth justice annual statistics: 2014 to 2015. Location: https://www.gov.uk/government/statistics/youth-justice-annual-statistics-2014-to-2015 [accessed 13/04/2016] National Probation Service. (2016). Cumbria caseload profile provided by the Head of Performance & Quality, National Probation Service North West, by email, 15/06/2016. National Rural Crime Network. (2015). The true cost of crime in rural areas. Location: http://www.nationalruralcrimenetwork.net/research/internal/national-rural-crimes-survey-2015/ [accessed 16/05/2016] NFU Mutual. (2015). Rural Crime 2015 – Secure Together. Location: https://www.nfumutual.co.uk/farming/initiatives/rural-crime/ [accessed 16/05/2016] NHS Cumbria Clinical Commissioning Group. (2013). Response to Sexual Violence Needs Assessment, December 2013. NHS North of England Commissioning Support Team. (2016). CCG / ICC boundary data provided by the NHS North of England Commissioning Support Team, by email, 27/07/2016. Office for National Statistics. (2011a). Census 2011 – car or van availability. Location: https://www.nomisweb.co.uk/ [accessed 25/05/2016] Office for National Statistics. (2011b). Key Statistics 402EW – Tenure. (from Nomis). Location: https://www.nomisweb.co.uk [accessed 13/07/2016] Office for National Statistics. (2013). The likelihood of becoming a victim of crime. Location: http://webarchive.nationalarchives.gov.uk/20160105160709/http://www.ons.gov.uk/ons/rel/crime-stats/crime-statistics/period-ending-march-2012/sty-a-victim-of-crime.html [accessed 15/04/2016]

JSNA Staying Safe - draft for Health and Wellbeing Board
Page 107 of 108
Office for National Statistics. (2015a). ‘Crime in England and Wales, Year Ending March 2015’ [online]. Available at: http://www.ons.gov.uk/ons/rel/crime-stats/crime-statistics/year-ending-march-2015/index.html Last accessed: 13 August 2015 Office for National Statistics. (2015b). Crime in England and Wales: year ending September 2015. Location: http://www.ons.gov.uk/peoplepopulationandcommunity/crimeandjustice/bulletins/crimeinenglandandwales/yearendingseptember2015 [accessed 12/04/2016] Office for National Statistics. (2016a). Alcohol Related Deaths in the United Kingdom: Registered in 2014 Location: http://www.ons.gov.uk/peoplepopulationandcommunity/healthandsocialcare/causesofdeath/bulletins/alcoholrelateddeathsintheunitedkingdom/registeredin2014 [accessed 04 July 2016] Office for National Statistics. (2016b). Measuring national well-being: Life in the UK: 2016. Location: http://www.ons.gov.uk/peoplepopulationandcommunity/wellbeing/articles/measuringnationalwellbeing/2016 [accessed 13/07/2016] Office of the Police and Crime Commissioner. (2015). Making Cumbria even Safer Location: http://www.cumbria-pcc.gov.uk/working-for-you/decisions.aspx [accessed 06/07/2016] Office of the Police and Crime Commissioner. (2016). Sexual violence data, provided by the Partnerships and Strategy Manager for the Office of the Police and Crime Commissioner, by email, 17/06/2016, 27/06/2016 and 07/07/2016 Police and Justice Act 2006 c.48. Location: http://www.legislation.gov.uk/ukpga/2006/48/contents [accessed 25/04/2016] Police Reform and Social Responsibility Act 2011 c13. Location: http://www.legislation.gov.uk/ukpga/2011/13/contents/enacted [accessed 26/04/2016] Policing and Crime Bill 2015-16. Location: http://services.parliament.uk/bills/2015-16/policingandcrime.html [accessed 17/05/2016] Public Health England. (2013). Public Health Outcomes Framework: Re-offending levels (indicators 1.13i and 1.13ii). Location: http://www.phoutcomes.info/ [accessed 07/07/2016] Public Health England. (2015). Public Health Outcomes Framework: Violent crime (including sexual violence) – hospital admissions for violence (indicator 1.12i). Location: http://www.phoutcomes.info/ [accessed 08/07/2016] Public Health England. (2016). Local Alcohol Profiles for England. Location: http://fingertips.phe.org.uk/profile/local-alcohol-profiles/data [accessed 10/05/2016] Refuge. (2016). Domestic violence and pregnancy. Location: http://www.refuge.org.uk/get-help-now/what-is-domestic-violence/domestic-violence-and-pregnancy/ [accessed 14/07/2016] Safeguarding Vulnerable Groups Act 2006 c.47. Location: http://www.legislation.gov.uk/ukpga/2006/47/contents [accessed 18/05/2016] Safety Net. (2015). Getting it right in Cumbria for Adults following Rape and Sexual Assault. Location: http://safetynetuk.org/adults.pdf [accessed 05/07/2016] Unity Drug and Alcohol Services Cumbria. (2016). Drug and alcohol misuse data, provided by a Unity Information Analyst, by email, 6 June 2016.

JSNA Staying Safe - draft for Health and Wellbeing Board
Page 108 of 108
15 Acronyms
ACORN A Classification of Residential Neighbourhoods
BME Black and Minority Ethnic
CFRS Cumbria Fire and Rescue Service
CLCRC Cumbria and Lancashire Community Rehabilitation Company
CRCs Community Rehabilitation Companies
CSE Child Sexual Exploitation
CSPs Community Safety Partnership
DEFRA Department for Environment, Food and Rural Affairs
ED(s) Emergency Department(s)
EU European Union
FTEs First Time Entrants
HARIs Home Accident Reduction Interventions
IMD Indices of Multiple Deprivation
ISVA Independent Sexual Violence Advisor
JSNA Joint Strategic Needs Assessment
KSI Killed and Seriously Injured
LSOA Lower Super Output Area
MAPPA Multi-Agency Public Protection Arrangements
NFIB National Fraud Intelligence Bureau
NSPCC National Society for the Protection of Cruelty to Children
PCCs Police and Crime Commissioners
RTC Road Traffic Collision
SSCs Special Service Calls
YOS Youth Offending Service