stearoyl-coa desaturase: rogue or innocent bystander?
TRANSCRIPT

Progress in Lipid Research 52 (2013) 15–42
Contents lists available at SciVerse ScienceDirect
Progress in Lipid Research
journal homepage: www.elsevier .com/locate /p l ipres
Review
Stearoyl-CoA desaturase: rogue or innocent bystander? q
Leanne Hodson a,⇑,1, Barbara A. Fielding a,b
a Oxford Centre for Diabetes, Endocrinology and Metabolism, Churchill Hospital, Oxford OX3 7LE, UKb Diabetes and Metabolic Medicine, Institute of Biosciences and Medicine, University of Surrey, Guildford GU2 7WG, UK
a r t i c l e i n f o
Article history:Received 31 May 2012Received in revised form 27 August 2012Accepted 27 August 2012Available online 21 September 2012
Keywords:Stearoyl-CoA desaturasePalmitoleateOleateAdiposeLiver
0163-7827/$ - see front matter � 2012 Elsevier Ltd. Ahttp://dx.doi.org/10.1016/j.plipres.2012.08.002
Abbreviations: ACAT, acyl-CoA:cholesterol acyltraferase; AMPK, AMP-activated protein kinase; APOE, apcAMP, cyclic adenosine monophosphate; CCT, CTP:chohomologous protein; ChREBP, carbohydrate responseCV, coefficient of variation (%); CVD, cardiovascular dlong-chain fatty acid elongase; ER, endoplasmic reticIRMS, gas chromatography–combustion–isotope ratioarterial endothelial cells; HDL, high density lipoprotehormone-sensitive lipase; IMTAG, intramyocellular triknockout model; LXR, liver X receptor; MUFA, monoesterified fatty acids; PC, phosphatidylcholine; PE, pactivated receptor c co-activator-1a; PL, phospholipidretinoid X receptor; SCD, stearoyl-CoA desaturase; SFpalmitoytransferase; SRE, sterol responsive element;factor; UCP, uncoupling protein; ULSAM, Uppsala Lon
q This work was in part supported by the British H⇑ Corresponding author. Tel.: +44 1865 857224; fax
E-mail address: [email protected] (L1 British Heart Foundation Intermediate Fellow in Ba
a b s t r a c t
Different lipid fractions in humans have characteristic fatty acid profiles and these are maintained partlythrough diet and to a lesser extent through endogenous synthesis. The enzyme stearoyl-CoA desaturase(SCD; EC 1.14.99.5) is the rate-limiting enzyme in the synthesis of monounsaturated fatty acids such aspalmitoleic acid (16:1 n-7) and oleic acid (18:1 n-9). These are the two most abundant monounsaturatedfatty acids in human plasma lipids, membranes and adipose tissue. Although in quantitative terms, theendogenous synthesis of fatty acids in humans is not great in most circumstances, it is becoming increas-ingly evident that SCD plays important structural and metabolic roles. In addition, 16:1 n-7 has beenpurported to act as a beneficial ‘lipokine’ in an animal model. Research in humans has relied on indirectmeasurements of SCD1 activity and therefore, much of our understanding has come from work on animalmodels. However, results have been somewhat counterintuitive and confusing, so the purpose of thisreview is to try to summarise our current understanding of this fascinating enzyme.
� 2012 Elsevier Ltd. All rights reserved.
Contents
1. Introduction . . . . . . . . . . . . . . . . . . . . . . . . . . . . . . . . . . . . . . . . . . . . . . . . . . . . . . . . . . . . . . . . . . . . . . . . . . . . . . . . . . . . . . . . . . . . . . . . . . . . . . . . . . 17
1.1. Evolutionary history . . . . . . . . . . . . . . . . . . . . . . . . . . . . . . . . . . . . . . . . . . . . . . . . . . . . . . . . . . . . . . . . . . . . . . . . . . . . . . . . . . . . . . . . . . . . . . 172. Structure and biochemistry . . . . . . . . . . . . . . . . . . . . . . . . . . . . . . . . . . . . . . . . . . . . . . . . . . . . . . . . . . . . . . . . . . . . . . . . . . . . . . . . . . . . . . . . . . . . . . 17
2.1. Location and structure . . . . . . . . . . . . . . . . . . . . . . . . . . . . . . . . . . . . . . . . . . . . . . . . . . . . . . . . . . . . . . . . . . . . . . . . . . . . . . . . . . . . . . . . . . . . 172.2. Isolation and characterization . . . . . . . . . . . . . . . . . . . . . . . . . . . . . . . . . . . . . . . . . . . . . . . . . . . . . . . . . . . . . . . . . . . . . . . . . . . . . . . . . . . . . . 172.3. Turnover . . . . . . . . . . . . . . . . . . . . . . . . . . . . . . . . . . . . . . . . . . . . . . . . . . . . . . . . . . . . . . . . . . . . . . . . . . . . . . . . . . . . . . . . . . . . . . . . . . . . . . . 182.4. Specificity. . . . . . . . . . . . . . . . . . . . . . . . . . . . . . . . . . . . . . . . . . . . . . . . . . . . . . . . . . . . . . . . . . . . . . . . . . . . . . . . . . . . . . . . . . . . . . . . . . . . . . . 182.5. Tissue-specific expression. . . . . . . . . . . . . . . . . . . . . . . . . . . . . . . . . . . . . . . . . . . . . . . . . . . . . . . . . . . . . . . . . . . . . . . . . . . . . . . . . . . . . . . . . . 192.5.1. Rodents . . . . . . . . . . . . . . . . . . . . . . . . . . . . . . . . . . . . . . . . . . . . . . . . . . . . . . . . . . . . . . . . . . . . . . . . . . . . . . . . . . . . . . . . . . . . . . . . . 192.5.2. Man . . . . . . . . . . . . . . . . . . . . . . . . . . . . . . . . . . . . . . . . . . . . . . . . . . . . . . . . . . . . . . . . . . . . . . . . . . . . . . . . . . . . . . . . . . . . . . . . . . . . 19
ll rights reserved.
nsferase; ACC, acetyl-CoA carboxylase; AKO, adipose tissue-specific Scd1 knockout model; ALT, alanine aminotrans-olipoprotein E; ASOs, antisense oligonucleotide inhibitors; ATP, adenosine triphosphate; BMI, body mass index (kg/m2);line cytidylyltransferase; CE, cholesteryl ester; CHO, Chinese hamster ovary; CHOP, CCAAT/-enhancer-binding protein
element binding protein; CLA, conjugated linoleic acid; CPT1, carnitine palmitoyltransferase I; CRP, C-reactive protein;isease; DAG, diacylglycerol; DGAT, acyl-coenzyme A:diacylglycerol acyltransferase; DNL, de novo lipogenesis; Elovl6,
ulum; FABP, fatty acid binding protein; FAS, fatty acid synthase; FFA, free fatty acids; GC, gas chromatograph; GC–C–mass spectrometer; GC–MS, gas chromatograph–mass spectrometer; GKO, Scd1 global knockout model; HAECs, humanin; HNF-4a, hepatocyte nuclear factor 4 alpha; HOMA-IR, homeostatic model assessment of insulin resistance; HSL,acylglycerol; IR, insulin receptor; LAKO, liver and adipose tissue-specific Scd1 knockout model; LKO, liver-specific Scd1unsaturated fatty acids; NAFLD, non-alcoholic fatty liver disease; NASH, non-alcoholic steatohepatitis; NEFA, non-
hosphatidylethanolamine; PEMT, phosphatidylethanolamine N-methyltransferase; PGC-1a, peroxisome proliferator-s; PPAR, peroxisome proliferator-activated receptor; PS, phosphatidylserine; PUFA, polyunsaturated fatty acids; RXR,
A, saturated fatty acids; SKO, skin-specific Scd1 knockout model; SNPs, single-nucleotide polymorphisms; SPT, serineSREBP, sterol responsive element binding protein; TAG, triacylglycerol; TLR, toll-like receptor; TNF, tumor necrosisgitudinal Study of Adult Men; UPR, unfolded protein response; VLDL, very low-density lipoprotein.
eart Foundation (Project Grant PG/09/003).: +44 1865 857213.
. Hodson).sic Science.

16 L. Hodson, B.A. Fielding / Progress in Lipid Research 52 (2013) 15–42
3. Measurement . . . . . . . . . . . . . . . . . . . . . . . . . . . . . . . . . . . . . . . . . . . . . . . . . . . . . . . . . . . . . . . . . . . . . . . . . . . . . . . . . . . . . . . . . . . . . . . . . . . . . . . . . 19
3.1. Direct assay . . . . . . . . . . . . . . . . . . . . . . . . . . . . . . . . . . . . . . . . . . . . . . . . . . . . . . . . . . . . . . . . . . . . . . . . . . . . . . . . . . . . . . . . . . . . . . . . . . . . . 193.2. Fatty acid ratios. . . . . . . . . . . . . . . . . . . . . . . . . . . . . . . . . . . . . . . . . . . . . . . . . . . . . . . . . . . . . . . . . . . . . . . . . . . . . . . . . . . . . . . . . . . . . . . . . . 193.3. Isotopic fatty acid ratios . . . . . . . . . . . . . . . . . . . . . . . . . . . . . . . . . . . . . . . . . . . . . . . . . . . . . . . . . . . . . . . . . . . . . . . . . . . . . . . . . . . . . . . . . . . 204. Stearoyl-CoA desaturase (SCD) in tissues . . . . . . . . . . . . . . . . . . . . . . . . . . . . . . . . . . . . . . . . . . . . . . . . . . . . . . . . . . . . . . . . . . . . . . . . . . . . . . . . . . . 20
4.1. Adipose tissue . . . . . . . . . . . . . . . . . . . . . . . . . . . . . . . . . . . . . . . . . . . . . . . . . . . . . . . . . . . . . . . . . . . . . . . . . . . . . . . . . . . . . . . . . . . . . . . . . . . 204.2. The liver . . . . . . . . . . . . . . . . . . . . . . . . . . . . . . . . . . . . . . . . . . . . . . . . . . . . . . . . . . . . . . . . . . . . . . . . . . . . . . . . . . . . . . . . . . . . . . . . . . . . . . . . 204.3. Plasma . . . . . . . . . . . . . . . . . . . . . . . . . . . . . . . . . . . . . . . . . . . . . . . . . . . . . . . . . . . . . . . . . . . . . . . . . . . . . . . . . . . . . . . . . . . . . . . . . . . . . . . . . 205. The role of SCD in lipid synthesis . . . . . . . . . . . . . . . . . . . . . . . . . . . . . . . . . . . . . . . . . . . . . . . . . . . . . . . . . . . . . . . . . . . . . . . . . . . . . . . . . . . . . . . . . 21
5.1. De novo lipogenesis (DNL) . . . . . . . . . . . . . . . . . . . . . . . . . . . . . . . . . . . . . . . . . . . . . . . . . . . . . . . . . . . . . . . . . . . . . . . . . . . . . . . . . . . . . . . . . 215.2. Triacylglycerol (TAG). . . . . . . . . . . . . . . . . . . . . . . . . . . . . . . . . . . . . . . . . . . . . . . . . . . . . . . . . . . . . . . . . . . . . . . . . . . . . . . . . . . . . . . . . . . . . . 215.2.1. Co-localization of SCD and acyl-coenzyme A:diacylglycerol acyltransferase . . . . . . . . . . . . . . . . . . . . . . . . . . . . . . . . . . . . . . . . . . 216. Regulation. . . . . . . . . . . . . . . . . . . . . . . . . . . . . . . . . . . . . . . . . . . . . . . . . . . . . . . . . . . . . . . . . . . . . . . . . . . . . . . . . . . . . . . . . . . . . . . . . . . . . . . . . . . . 21
6.1. Insulin . . . . . . . . . . . . . . . . . . . . . . . . . . . . . . . . . . . . . . . . . . . . . . . . . . . . . . . . . . . . . . . . . . . . . . . . . . . . . . . . . . . . . . . . . . . . . . . . . . . . . . . . . 216.2. Leptin . . . . . . . . . . . . . . . . . . . . . . . . . . . . . . . . . . . . . . . . . . . . . . . . . . . . . . . . . . . . . . . . . . . . . . . . . . . . . . . . . . . . . . . . . . . . . . . . . . . . . . . . . . 216.3. Sex differences. . . . . . . . . . . . . . . . . . . . . . . . . . . . . . . . . . . . . . . . . . . . . . . . . . . . . . . . . . . . . . . . . . . . . . . . . . . . . . . . . . . . . . . . . . . . . . . . . . . 226.4. Dietary influences . . . . . . . . . . . . . . . . . . . . . . . . . . . . . . . . . . . . . . . . . . . . . . . . . . . . . . . . . . . . . . . . . . . . . . . . . . . . . . . . . . . . . . . . . . . . . . . . 22
6.4.1. Carbohydrate content of the diet. . . . . . . . . . . . . . . . . . . . . . . . . . . . . . . . . . . . . . . . . . . . . . . . . . . . . . . . . . . . . . . . . . . . . . . . . . . . . 226.4.1.1. Sucrose . . . . . . . . . . . . . . . . . . . . . . . . . . . . . . . . . . . . . . . . . . . . . . . . . . . . . . . . . . . . . . . . . . . . . . . . . . . . . . . . . . . . . . . . . . . . . . . . 226.4.1.2. Fructose . . . . . . . . . . . . . . . . . . . . . . . . . . . . . . . . . . . . . . . . . . . . . . . . . . . . . . . . . . . . . . . . . . . . . . . . . . . . . . . . . . . . . . . . . . . . . . . 226.4.2. Saturated fatty acids (SFAs) . . . . . . . . . . . . . . . . . . . . . . . . . . . . . . . . . . . . . . . . . . . . . . . . . . . . . . . . . . . . . . . . . . . . . . . . . . . . . . . . . 236.4.3. Monounsaturated fatty acids (MUFAs) . . . . . . . . . . . . . . . . . . . . . . . . . . . . . . . . . . . . . . . . . . . . . . . . . . . . . . . . . . . . . . . . . . . . . . . . 236.4.4. Polyunsaturated fatty acids (PUFAs) . . . . . . . . . . . . . . . . . . . . . . . . . . . . . . . . . . . . . . . . . . . . . . . . . . . . . . . . . . . . . . . . . . . . . . . . . . 236.4.5. Conjugated linoleic acid (CLA) . . . . . . . . . . . . . . . . . . . . . . . . . . . . . . . . . . . . . . . . . . . . . . . . . . . . . . . . . . . . . . . . . . . . . . . . . . . . . . . 246.4.6. Essential fatty acids . . . . . . . . . . . . . . . . . . . . . . . . . . . . . . . . . . . . . . . . . . . . . . . . . . . . . . . . . . . . . . . . . . . . . . . . . . . . . . . . . . . . . . . 246.4.7. Cholesterol . . . . . . . . . . . . . . . . . . . . . . . . . . . . . . . . . . . . . . . . . . . . . . . . . . . . . . . . . . . . . . . . . . . . . . . . . . . . . . . . . . . . . . . . . . . . . . 246.4.8. Protein. . . . . . . . . . . . . . . . . . . . . . . . . . . . . . . . . . . . . . . . . . . . . . . . . . . . . . . . . . . . . . . . . . . . . . . . . . . . . . . . . . . . . . . . . . . . . . . . . . 246.4.9. Dietary restriction/lifestyle intervention. . . . . . . . . . . . . . . . . . . . . . . . . . . . . . . . . . . . . . . . . . . . . . . . . . . . . . . . . . . . . . . . . . . . . . . 246.4.10. Cyclopropene acids. . . . . . . . . . . . . . . . . . . . . . . . . . . . . . . . . . . . . . . . . . . . . . . . . . . . . . . . . . . . . . . . . . . . . . . . . . . . . . . . . . . . . . . 266.4.11. Alcohol . . . . . . . . . . . . . . . . . . . . . . . . . . . . . . . . . . . . . . . . . . . . . . . . . . . . . . . . . . . . . . . . . . . . . . . . . . . . . . . . . . . . . . . . . . . . . . . . 26
6.5. Other factors that may influence SCD . . . . . . . . . . . . . . . . . . . . . . . . . . . . . . . . . . . . . . . . . . . . . . . . . . . . . . . . . . . . . . . . . . . . . . . . . . . . . . . . 26
6.5.1. Cold . . . . . . . . . . . . . . . . . . . . . . . . . . . . . . . . . . . . . . . . . . . . . . . . . . . . . . . . . . . . . . . . . . . . . . . . . . . . . . . . . . . . . . . . . . . . . . . . . . . . 266.5.2. Smoking . . . . . . . . . . . . . . . . . . . . . . . . . . . . . . . . . . . . . . . . . . . . . . . . . . . . . . . . . . . . . . . . . . . . . . . . . . . . . . . . . . . . . . . . . . . . . . . . 266.5.3. Shear stress . . . . . . . . . . . . . . . . . . . . . . . . . . . . . . . . . . . . . . . . . . . . . . . . . . . . . . . . . . . . . . . . . . . . . . . . . . . . . . . . . . . . . . . . . . . . . . 267. SCD mouse models. . . . . . . . . . . . . . . . . . . . . . . . . . . . . . . . . . . . . . . . . . . . . . . . . . . . . . . . . . . . . . . . . . . . . . . . . . . . . . . . . . . . . . . . . . . . . . . . . . . . . 26
7.1. Genetic background . . . . . . . . . . . . . . . . . . . . . . . . . . . . . . . . . . . . . . . . . . . . . . . . . . . . . . . . . . . . . . . . . . . . . . . . . . . . . . . . . . . . . . . . . . . . . . 267.2. SCD knockout models . . . . . . . . . . . . . . . . . . . . . . . . . . . . . . . . . . . . . . . . . . . . . . . . . . . . . . . . . . . . . . . . . . . . . . . . . . . . . . . . . . . . . . . . . . . . . 277.2.1. Scd1 global knockout model (GKO) . . . . . . . . . . . . . . . . . . . . . . . . . . . . . . . . . . . . . . . . . . . . . . . . . . . . . . . . . . . . . . . . . . . . . . . . . . . 277.2.2. Scd2 global knockout model . . . . . . . . . . . . . . . . . . . . . . . . . . . . . . . . . . . . . . . . . . . . . . . . . . . . . . . . . . . . . . . . . . . . . . . . . . . . . . . . 277.2.2.1. Scd2 during development . . . . . . . . . . . . . . . . . . . . . . . . . . . . . . . . . . . . . . . . . . . . . . . . . . . . . . . . . . . . . . . . . . . . . . . . . . . . . . . . . 277.2.3. Tissue specific knockout model . . . . . . . . . . . . . . . . . . . . . . . . . . . . . . . . . . . . . . . . . . . . . . . . . . . . . . . . . . . . . . . . . . . . . . . . . . . . . . 277.2.3.1. Liver specific Scd1 knockout model (LKO) . . . . . . . . . . . . . . . . . . . . . . . . . . . . . . . . . . . . . . . . . . . . . . . . . . . . . . . . . . . . . . . . . . . . 277.2.3.2. Skin specific Scd1 knockout model (SKO) . . . . . . . . . . . . . . . . . . . . . . . . . . . . . . . . . . . . . . . . . . . . . . . . . . . . . . . . . . . . . . . . . . . . 287.2.3.3. Adipose tissue Scd1 specific knockout model (AKO) . . . . . . . . . . . . . . . . . . . . . . . . . . . . . . . . . . . . . . . . . . . . . . . . . . . . . . . . . . . . 287.2.3.4. Combined liver and adipose tissue Scd1 specific knockout model (LAKO) . . . . . . . . . . . . . . . . . . . . . . . . . . . . . . . . . . . . . . . . . . 28
7.3. Other mouse models . . . . . . . . . . . . . . . . . . . . . . . . . . . . . . . . . . . . . . . . . . . . . . . . . . . . . . . . . . . . . . . . . . . . . . . . . . . . . . . . . . . . . . . . . . . . . . 28
7.3.1. Obese-hyperglycemic (ob/ob) mouse. . . . . . . . . . . . . . . . . . . . . . . . . . . . . . . . . . . . . . . . . . . . . . . . . . . . . . . . . . . . . . . . . . . . . . . . . . 287.3.2. Asebia (ab) mouse . . . . . . . . . . . . . . . . . . . . . . . . . . . . . . . . . . . . . . . . . . . . . . . . . . . . . . . . . . . . . . . . . . . . . . . . . . . . . . . . . . . . . . . . 287.3.3. Agouti-induced and diet-induced obese models . . . . . . . . . . . . . . . . . . . . . . . . . . . . . . . . . . . . . . . . . . . . . . . . . . . . . . . . . . . . . . . . 287.3.4. Streptozotocin-induced diabetic mouse/rat model. . . . . . . . . . . . . . . . . . . . . . . . . . . . . . . . . . . . . . . . . . . . . . . . . . . . . . . . . . . . . . . 287.3.5. Hormone-sensitive lipase (HSL) null mouse . . . . . . . . . . . . . . . . . . . . . . . . . . . . . . . . . . . . . . . . . . . . . . . . . . . . . . . . . . . . . . . . . . . . 287.3.6. Liver X receptor (LXR) knockout mouse . . . . . . . . . . . . . . . . . . . . . . . . . . . . . . . . . . . . . . . . . . . . . . . . . . . . . . . . . . . . . . . . . . . . . . . 297.3.7. Fatty acid bind protein (FABP) knockout mouse . . . . . . . . . . . . . . . . . . . . . . . . . . . . . . . . . . . . . . . . . . . . . . . . . . . . . . . . . . . . . . . . 297.3.8. Sterol responsive element binding protein 1c (SREBP-1c) knockout mouse. . . . . . . . . . . . . . . . . . . . . . . . . . . . . . . . . . . . . . . . . . . 297.3.9. TR4. nuclear receptor knockout mouse . . . . . . . . . . . . . . . . . . . . . . . . . . . . . . . . . . . . . . . . . . . . . . . . . . . . . . . . . . . . . . . . . . . . . . . . 297.3.10. BTBR mouse . . . . . . . . . . . . . . . . . . . . . . . . . . . . . . . . . . . . . . . . . . . . . . . . . . . . . . . . . . . . . . . . . . . . . . . . . . . . . . . . . . . . . . . . . . . . 297.3.11. Leptin receptor-deficient (db/db) mouse . . . . . . . . . . . . . . . . . . . . . . . . . . . . . . . . . . . . . . . . . . . . . . . . . . . . . . . . . . . . . . . . . . . . . . 297.3.12. Peroxisome proliferator-activated receptor-a (PPARa) mouse . . . . . . . . . . . . . . . . . . . . . . . . . . . . . . . . . . . . . . . . . . . . . . . . . . . . 298. Human SCD polymorphisms . . . . . . . . . . . . . . . . . . . . . . . . . . . . . . . . . . . . . . . . . . . . . . . . . . . . . . . . . . . . . . . . . . . . . . . . . . . . . . . . . . . . . . . . . . . . . 299. What is the evidence for SCD and risk of disease? . . . . . . . . . . . . . . . . . . . . . . . . . . . . . . . . . . . . . . . . . . . . . . . . . . . . . . . . . . . . . . . . . . . . . . . . . . . 29
9.1. TAG and lipotoxicity . . . . . . . . . . . . . . . . . . . . . . . . . . . . . . . . . . . . . . . . . . . . . . . . . . . . . . . . . . . . . . . . . . . . . . . . . . . . . . . . . . . . . . . . . . . . . . 299.2. Obesity . . . . . . . . . . . . . . . . . . . . . . . . . . . . . . . . . . . . . . . . . . . . . . . . . . . . . . . . . . . . . . . . . . . . . . . . . . . . . . . . . . . . . . . . . . . . . . . . . . . . . . . . . 30
9.2.1. Adipose tissue . . . . . . . . . . . . . . . . . . . . . . . . . . . . . . . . . . . . . . . . . . . . . . . . . . . . . . . . . . . . . . . . . . . . . . . . . . . . . . . . . . . . . . . . . . . . 309.2.2. Liver. . . . . . . . . . . . . . . . . . . . . . . . . . . . . . . . . . . . . . . . . . . . . . . . . . . . . . . . . . . . . . . . . . . . . . . . . . . . . . . . . . . . . . . . . . . . . . . . . . . . 30
9.3. Liver steatosis . . . . . . . . . . . . . . . . . . . . . . . . . . . . . . . . . . . . . . . . . . . . . . . . . . . . . . . . . . . . . . . . . . . . . . . . . . . . . . . . . . . . . . . . . . . . . . . . . . . 30
9.3.1. Hypertriglyceridemia . . . . . . . . . . . . . . . . . . . . . . . . . . . . . . . . . . . . . . . . . . . . . . . . . . . . . . . . . . . . . . . . . . . . . . . . . . . . . . . . . . . . . . 309.4. Muscle . . . . . . . . . . . . . . . . . . . . . . . . . . . . . . . . . . . . . . . . . . . . . . . . . . . . . . . . . . . . . . . . . . . . . . . . . . . . . . . . . . . . . . . . . . . . . . . . . . . . . . . . . 319.5. Heart . . . . . . . . . . . . . . . . . . . . . . . . . . . . . . . . . . . . . . . . . . . . . . . . . . . . . . . . . . . . . . . . . . . . . . . . . . . . . . . . . . . . . . . . . . . . . . . . . . . . . . . . . . 319.6. The pancreas . . . . . . . . . . . . . . . . . . . . . . . . . . . . . . . . . . . . . . . . . . . . . . . . . . . . . . . . . . . . . . . . . . . . . . . . . . . . . . . . . . . . . . . . . . . . . . . . . . . . 32
9.6.1. SCD and insulin resistance . . . . . . . . . . . . . . . . . . . . . . . . . . . . . . . . . . . . . . . . . . . . . . . . . . . . . . . . . . . . . . . . . . . . . . . . . . . . . . . . . . 32
9.7. Inflammation . . . . . . . . . . . . . . . . . . . . . . . . . . . . . . . . . . . . . . . . . . . . . . . . . . . . . . . . . . . . . . . . . . . . . . . . . . . . . . . . . . . . . . . . . . . . . . . . . . . . 329.8. Bone health . . . . . . . . . . . . . . . . . . . . . . . . . . . . . . . . . . . . . . . . . . . . . . . . . . . . . . . . . . . . . . . . . . . . . . . . . . . . . . . . . . . . . . . . . . . . . . . . . . . . . 32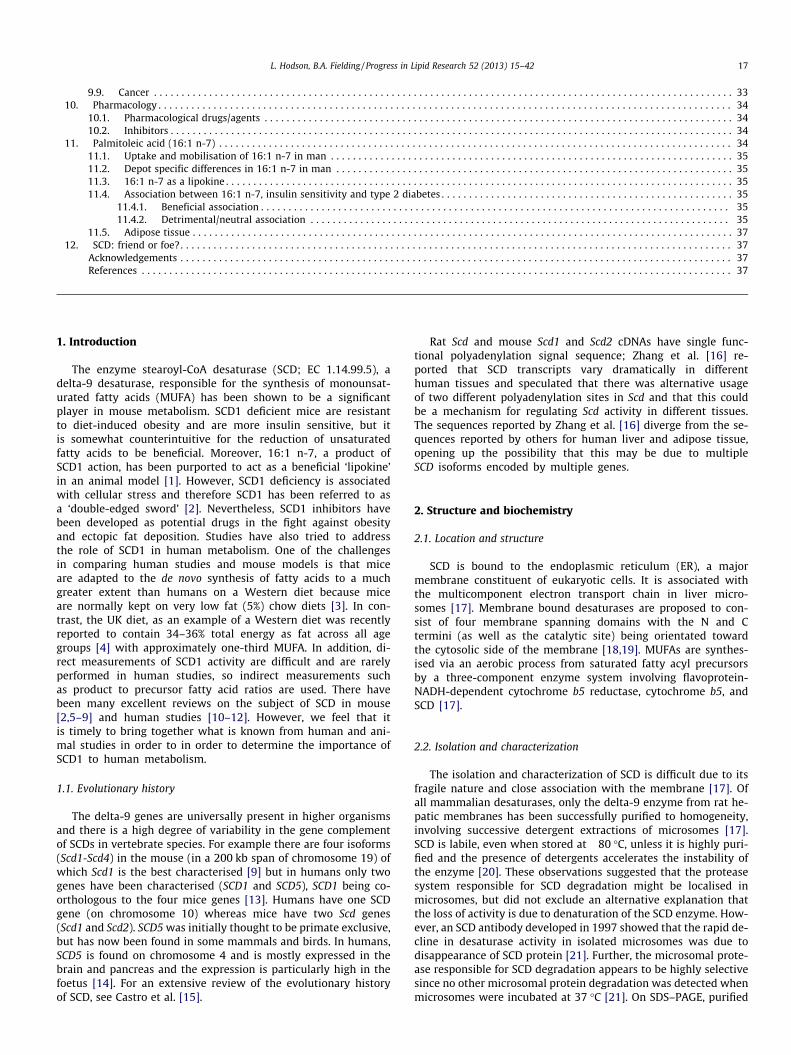
L. Hodson, B.A. Fielding / Progress in Lipid Research 52 (2013) 15–42 17
9.9. Cancer . . . . . . . . . . . . . . . . . . . . . . . . . . . . . . . . . . . . . . . . . . . . . . . . . . . . . . . . . . . . . . . . . . . . . . . . . . . . . . . . . . . . . . . . . . . . . . . . . . . . . . . . . 33
10. Pharmacology . . . . . . . . . . . . . . . . . . . . . . . . . . . . . . . . . . . . . . . . . . . . . . . . . . . . . . . . . . . . . . . . . . . . . . . . . . . . . . . . . . . . . . . . . . . . . . . . . . . . . . . . 3410.1. Pharmacological drugs/agents . . . . . . . . . . . . . . . . . . . . . . . . . . . . . . . . . . . . . . . . . . . . . . . . . . . . . . . . . . . . . . . . . . . . . . . . . . . . . . . . . . . . . 3410.2. Inhibitors . . . . . . . . . . . . . . . . . . . . . . . . . . . . . . . . . . . . . . . . . . . . . . . . . . . . . . . . . . . . . . . . . . . . . . . . . . . . . . . . . . . . . . . . . . . . . . . . . . . . . . 34
11. Palmitoleic acid (16:1 n-7) . . . . . . . . . . . . . . . . . . . . . . . . . . . . . . . . . . . . . . . . . . . . . . . . . . . . . . . . . . . . . . . . . . . . . . . . . . . . . . . . . . . . . . . . . . . . . 34
11.1. Uptake and mobilisation of 16:1 n-7 in man . . . . . . . . . . . . . . . . . . . . . . . . . . . . . . . . . . . . . . . . . . . . . . . . . . . . . . . . . . . . . . . . . . . . . . . . . 3511.2. Depot specific differences in 16:1 n-7 in man . . . . . . . . . . . . . . . . . . . . . . . . . . . . . . . . . . . . . . . . . . . . . . . . . . . . . . . . . . . . . . . . . . . . . . . . 3511.3. 16:1 n-7 as a lipokine . . . . . . . . . . . . . . . . . . . . . . . . . . . . . . . . . . . . . . . . . . . . . . . . . . . . . . . . . . . . . . . . . . . . . . . . . . . . . . . . . . . . . . . . . . . . 3511.4. Association between 16:1 n-7, insulin sensitivity and type 2 diabetes . . . . . . . . . . . . . . . . . . . . . . . . . . . . . . . . . . . . . . . . . . . . . . . . . . . . . 3511.4.1. Beneficial association . . . . . . . . . . . . . . . . . . . . . . . . . . . . . . . . . . . . . . . . . . . . . . . . . . . . . . . . . . . . . . . . . . . . . . . . . . . . . . . . . . . . . 3511.4.2. Detrimental/neutral association . . . . . . . . . . . . . . . . . . . . . . . . . . . . . . . . . . . . . . . . . . . . . . . . . . . . . . . . . . . . . . . . . . . . . . . . . . . . 35
11.5. Adipose tissue . . . . . . . . . . . . . . . . . . . . . . . . . . . . . . . . . . . . . . . . . . . . . . . . . . . . . . . . . . . . . . . . . . . . . . . . . . . . . . . . . . . . . . . . . . . . . . . . . . 37
12. SCD: friend or foe?. . . . . . . . . . . . . . . . . . . . . . . . . . . . . . . . . . . . . . . . . . . . . . . . . . . . . . . . . . . . . . . . . . . . . . . . . . . . . . . . . . . . . . . . . . . . . . . . . . . . 37Acknowledgements . . . . . . . . . . . . . . . . . . . . . . . . . . . . . . . . . . . . . . . . . . . . . . . . . . . . . . . . . . . . . . . . . . . . . . . . . . . . . . . . . . . . . . . . . . . . . . . . . . . . 37References . . . . . . . . . . . . . . . . . . . . . . . . . . . . . . . . . . . . . . . . . . . . . . . . . . . . . . . . . . . . . . . . . . . . . . . . . . . . . . . . . . . . . . . . . . . . . . . . . . . . . . . . . . . 37
1. Introduction
The enzyme stearoyl-CoA desaturase (SCD; EC 1.14.99.5), adelta-9 desaturase, responsible for the synthesis of monounsat-urated fatty acids (MUFA) has been shown to be a significantplayer in mouse metabolism. SCD1 deficient mice are resistantto diet-induced obesity and are more insulin sensitive, but itis somewhat counterintuitive for the reduction of unsaturatedfatty acids to be beneficial. Moreover, 16:1 n-7, a product ofSCD1 action, has been purported to act as a beneficial ‘lipokine’in an animal model [1]. However, SCD1 deficiency is associatedwith cellular stress and therefore SCD1 has been referred to asa ‘double-edged sword’ [2]. Nevertheless, SCD1 inhibitors havebeen developed as potential drugs in the fight against obesityand ectopic fat deposition. Studies have also tried to addressthe role of SCD1 in human metabolism. One of the challengesin comparing human studies and mouse models is that miceare adapted to the de novo synthesis of fatty acids to a muchgreater extent than humans on a Western diet because miceare normally kept on very low fat (5%) chow diets [3]. In con-trast, the UK diet, as an example of a Western diet was recentlyreported to contain 34–36% total energy as fat across all agegroups [4] with approximately one-third MUFA. In addition, di-rect measurements of SCD1 activity are difficult and are rarelyperformed in human studies, so indirect measurements suchas product to precursor fatty acid ratios are used. There havebeen many excellent reviews on the subject of SCD in mouse[2,5–9] and human studies [10–12]. However, we feel that itis timely to bring together what is known from human and ani-mal studies in order to in order to determine the importance ofSCD1 to human metabolism.
1.1. Evolutionary history
The delta-9 genes are universally present in higher organismsand there is a high degree of variability in the gene complementof SCDs in vertebrate species. For example there are four isoforms(Scd1-Scd4) in the mouse (in a 200 kb span of chromosome 19) ofwhich Scd1 is the best characterised [9] but in humans only twogenes have been characterised (SCD1 and SCD5), SCD1 being co-orthologous to the four mice genes [13]. Humans have one SCDgene (on chromosome 10) whereas mice have two Scd genes(Scd1 and Scd2). SCD5 was initially thought to be primate exclusive,but has now been found in some mammals and birds. In humans,SCD5 is found on chromosome 4 and is mostly expressed in thebrain and pancreas and the expression is particularly high in thefoetus [14]. For an extensive review of the evolutionary historyof SCD, see Castro et al. [15].
Rat Scd and mouse Scd1 and Scd2 cDNAs have single func-tional polyadenylation signal sequence; Zhang et al. [16] re-ported that SCD transcripts vary dramatically in differenthuman tissues and speculated that there was alternative usageof two different polyadenylation sites in Scd and that this couldbe a mechanism for regulating Scd activity in different tissues.The sequences reported by Zhang et al. [16] diverge from the se-quences reported by others for human liver and adipose tissue,opening up the possibility that this may be due to multipleSCD isoforms encoded by multiple genes.
2. Structure and biochemistry
2.1. Location and structure
SCD is bound to the endoplasmic reticulum (ER), a majormembrane constituent of eukaryotic cells. It is associated withthe multicomponent electron transport chain in liver micro-somes [17]. Membrane bound desaturases are proposed to con-sist of four membrane spanning domains with the N and Ctermini (as well as the catalytic site) being orientated towardthe cytosolic side of the membrane [18,19]. MUFAs are synthes-ised via an aerobic process from saturated fatty acyl precursorsby a three-component enzyme system involving flavoprotein-NADH-dependent cytochrome b5 reductase, cytochrome b5, andSCD [17].
2.2. Isolation and characterization
The isolation and characterization of SCD is difficult due to itsfragile nature and close association with the membrane [17]. Ofall mammalian desaturases, only the delta-9 enzyme from rat he-patic membranes has been successfully purified to homogeneity,involving successive detergent extractions of microsomes [17].SCD is labile, even when stored at �80 �C, unless it is highly puri-fied and the presence of detergents accelerates the instability ofthe enzyme [20]. These observations suggested that the proteasesystem responsible for SCD degradation might be localised inmicrosomes, but did not exclude an alternative explanation thatthe loss of activity is due to denaturation of the SCD enzyme. How-ever, an SCD antibody developed in 1997 showed that the rapid de-cline in desaturase activity in isolated microsomes was due todisappearance of SCD protein [21]. Further, the microsomal prote-ase responsible for SCD degradation appears to be highly selectivesince no other microsomal protein degradation was detected whenmicrosomes were incubated at 37 �C [21]. On SDS–PAGE, purified
AT
pNE
FApT
AG
pPL
ePL
pltP
LpC
EpT
otal
16:1
n-7
/16:
0
0.0
0.1
0.2
0.3
0.4
AT
pNE
FApT
AG
pPL
ePL
pltP
LpC
EpT
otal
18:1
n-9
/18:
0
0
5
10
15
20
scA
bdo
scG
F
scA
rm
Om
ent
Per
i/Vis
c
16:1
n-7
/16:
0
0.0
0.1
0.2
0.3
0.4
scA
bdo
scG
F
scA
rm
Om
ent
Per
i/Vis
c
18:1
n-9
/18:
0
0
2
4
6
8
10
12
14
16
A B
C D
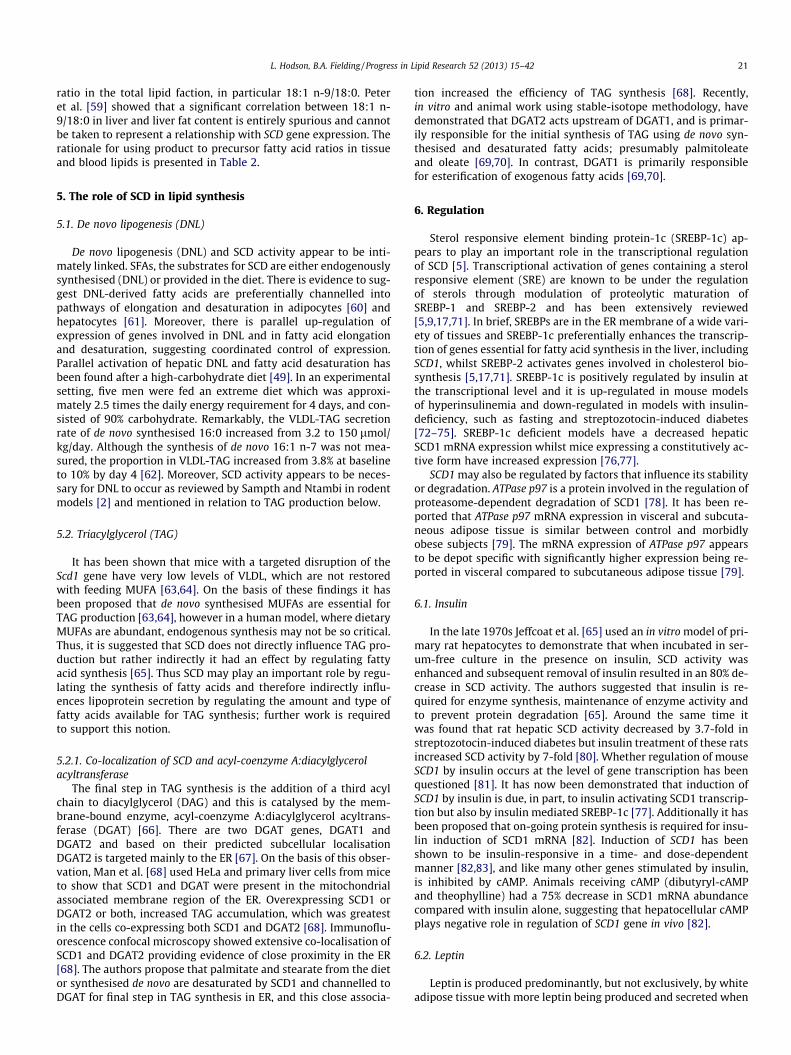
Fig. 1. A-D. The calculated product to precursor fatty acid ratios for different blood and tissue lipid fractions in humans. (A) The 16:1 n-7/16:0 ratio for adipose tissue andblood lipid fractions (Ratios were calculated from data published in the review by Hodson et al. [43]). (B) The 18:1 n-9/18:0 ratio for adipose tissue and blood lipid fractions(Ratios were calculated from data published in the review by Hodson et al. [43]). (C) The 16:1 n-7/16:0 ratio for different adipose tissue depots in humans data from [46,52–56,192]. (D) The 18:1 n-9/18:0 ratio for different adipose tissue depots in humans data from [46,52–56,192]. The data points represent mean ± SEM. Abbreviations: AT,subcutaneous adipose tissue; pNEFA, plasma non-esterified fatty acids; pTAG, plasma triacylglycerol; pPL, plasma phospholipids; ePL, erythrocyte phospholipids; pltPL,platelet phospholipids; pCE, plasma cholesteryl ester; pTotal, plasma total fatty acids; scAbdo, subcutaneous abdominal adipose tissue; scGF, subcutaneous gluteofemoraladipose tissue; scArm, subcutaneous arm adipose tissue; Omen, omental adipose tissue; Peri/Visc, peri-renal or visceral adipose tissue.
Table 1Aspects of adipose tissue monounsaturated fatty acid composition illustrating that monounsaturated fatty acids are over-represented in adipose tissue fatty acid compared withthe diet. The table also shows that between-person variability in adipose tissue composition is greater for 16:1 n-7 than 18:1 n-9. However, the adipose tissue 16:1 n-7/16:0 and18:1 n-9/18:0 ratios are equally variable between people. The differences between diet and adipose tissue for 16:1 n-7/16:0 and 18:1 n-9/18:0 are primarily due to higher 16:1 n-7 and lower 18:0 in adipose tissue.
16:1 n-7/16:0 18:1 n-9 /18:0 16:1 n-7 16:0 18:1 n-9 18:0
Mean fatty acid composition of the diet and adipose tissue, 72 white men on a vegetarian diet Data from Knutsen et al. [45]Adipose tissue 0.30 13.2 4.4 17 39.7 3Diet 0.02 4.4 0.3 16.7 35 8
Mean and between person variation in adipose tissue composition. Data from Pinnick et al. [46]Adipose tissue 0.2 12.9 6.2 27.1 42.7 3.6Coefficient of variation 28.3 32.3 25.1 6.3 4.9 29.3
18 L. Hodson, B.A. Fielding / Progress in Lipid Research 52 (2013) 15–42
SCD migrates as single polypeptide with an apparent molecularweight of approximately 37 kDa [17].
2.3. Turnover
The protein components of the ER are in a constant state of re-newal with the mean half-life of an ER protein being approxi-mately two days although degradation rates of individualproteins and species vary [17]. The half-life of hepatic SCD is only3–5 h [21–23] and the physiological basis for this rapid degrada-tion remains unclear. SCD degradation and synthesis have impor-tant physiological consequences in the maintenance of the ratioof saturated to unsaturated fatty acids. Degradation of SCD in
mammalian cells and isolated liver microsomes has been reviewed[17,24].
2.4. Specificity
The fatty acid substrates for SCD1 are primarily the fatty acylderivatives of 18:0 and 16:0 because of the high abundance of18:0 and 16:0 in most lipid fractions. The specificity of partiallypurified SCD extracted from rat liver microsomes has been foundto be in the order 18:0 > 17:0 > 16:0 > 19:0 > 14:0 > 15:0 [25] butderivatives containing 9–20 carbons are capable of binding to theenzyme [26]. Using fatty acid stable isotope tracers, desaturationof 16:0 and 18:0 has been demonstrated in humans in vivo; theoverall conversion of 18:0 to 18:1 n-9 was 14% whereas that of
Time (min) after the start of the intravenous infusion of tracer
0 60 120 180 240 300 360 420 480
[U-1
3 C]1
6:1
n-7/
16:1
n-7
in V
LDL-
TG
0.0000
0.0002
0.0004
0.0006
0.0008
0.0010
0.0012
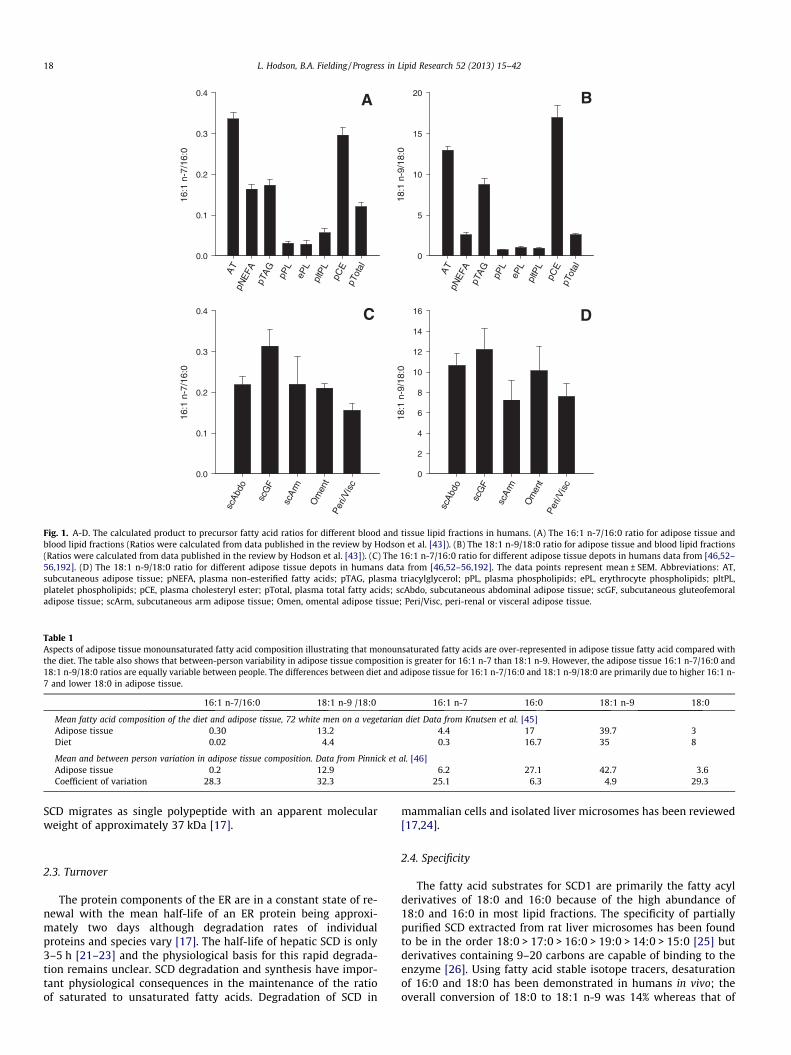
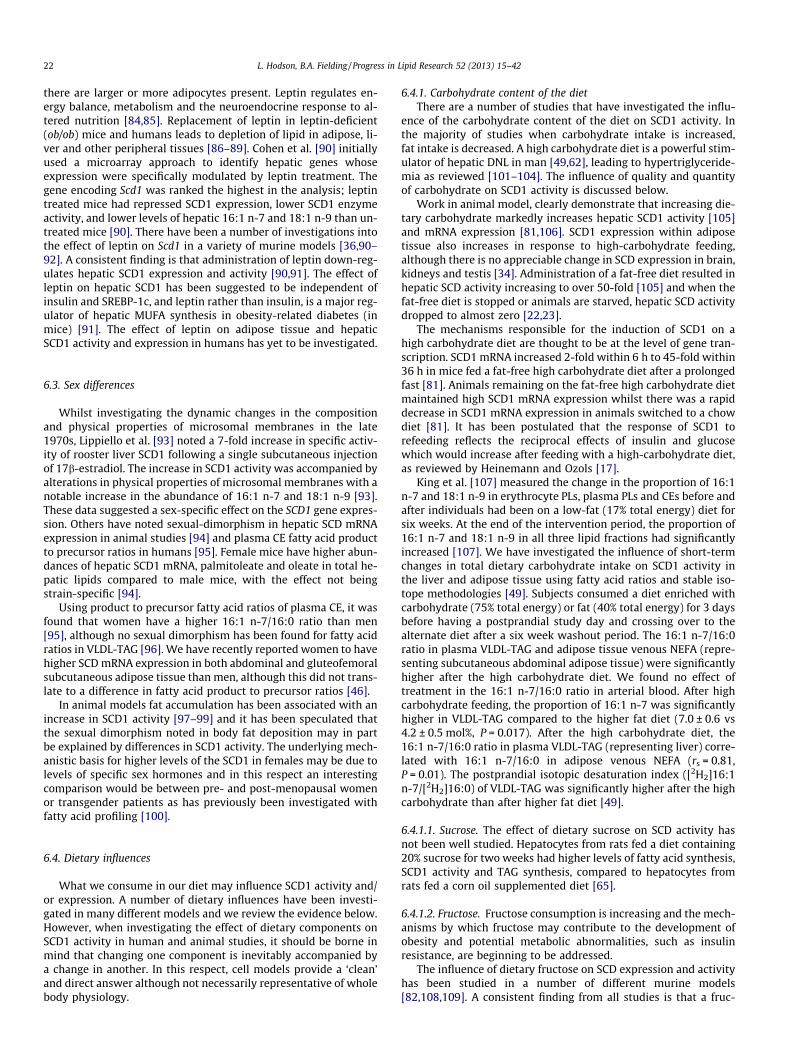
Fig. 2. Product of desaturation of 16:0 in vivo in humans. The graph showsappearance of [U-13C] tracer in 16:1 n-7 in VLDL-TAG after an intravenous infusionof [U-13C]16:0. Filled circles (d) represent VLDL1 TAG, open circles (s), representVLDL2 TAG. The data points represent mean ± SEM in 56 healthy women (Hodsonand Fielding unpublished data).
L. Hodson, B.A. Fielding / Progress in Lipid Research 52 (2013) 15–42 19
16:0 to 16:1 n-7 was 2% in plasma over 7 days [27], in agreementwith the findings of Emken et al. [28].
2.5. Tissue-specific expression
2.5.1. RodentsIn adult mice the Scd1 isoform is expressed in lipogenic tis-
sues including liver, adipose tissue (brown and white) and seba-ceous glands [5,17,29]. The Scd2 isoform is expressed in mosttissues except liver [30]. Scd3 expression is restricted to seba-ceous glands (sebocytes) in mouse skin, the harderian and prepu-tial glands [31] whereas Scd4 is expressed exclusively in theheart [32]. It has been demonstrated that SCD1, 2 and 4 have asignificantly greater specificity for 18:0 compared to 16:0,whereas SCD3 has a significantly greater specificity for 16:0 vs18:0 [33].
In the rat under normal dietary conditions SCD1 and 2 are pres-ent in low amounts in kidney, liver, brain, testis, with SCD1 beingconstitutively expressed in adipose tissue [34]. SCD2 is constitu-tively expressed in the brain, and induced in kidney, lung, spleen,
Table 2Rationale for using 16:1 n-7/16:0 and 18:1 n-9/18:0 ratios in tissue and blood lipids to re
Evidence/rationale
Adipose tissue TAG/totalfatty acids
Significant correlation with SCD1 mRNA expression* in16:0 and 18:1 n-9/18:0, respectively.
VLDL-TAG Reflects fatty acid desaturation in the liver, significant c9/18:0 [57].
Plasma TAG Plasma TAG is a surrogate for VLDL-TAG, and thereforPlasma PL Fatty acid desaturation ratios are low in plasma PL (see
Therefore its use as a biomarker of SCD activity may bErythrocyte PL Erythrocyte PL are incapable of de novo PL synthesis an
is therefore not likely to reflect tissue specific SCD actipool.
Plasma CE Liver CE fatty acid composition is correlated with SCD1of plasma CE ratios for tissue mRNA expression of SCD
Plasma NEFA Reflects fatty acid ratios in adipose tissue for 16:1 n-7Plasma total fatty acids It is not recommended to measure fatty acid ratios in
Abbreviations: TAG, triacylglycerol; VLDL, very low-density lipoprotein; PL, phospholipid* Indicates quantification by Q-PCR.
and adipose tissue in response to a high carbohydrate diet [35].Therefore in rodent models, consideration of the isoform shouldbe made in relation to the tissue of interest if fatty acid ratios areused to assess SCD activity (see Section 3.2).
2.5.2. ManSCD1 is highly expressed in liver and adipose tissue (similar to
mouse orthologue, mScd1) although expression in the liver is lowerthan the mouse [36]. In 2005 Wang and colleagues [14] reported anovel human SCD isoform, which they termed hSCD5. SCD5 hassince been found to be mostly expressed in the brain and pancreasin both mammals and chicken [37]. The gene encoding hSCD5 waspreviously cloned as ACOD4 from the chromosome inversion site ina family with cleft lip. Wang et al. [14] demonstrated that ACOD4encodes a functional delta 9 desaturase and is localised on ER mem-brane and hSCD5 is not the orthologue of any of four mice Scd genes.
3. Measurement
3.1. Direct assay
In order to measure tissue activity of SCD, tissue homogenatesare exposed to a radioactive precursor such as 14C labelled stearicacid or 14Cpalmitoyl-CoA under optimal conditions for the enzyme[38,39]. After a defined period of time, the reaction is stopped andthe lipids extracted with solvent. Thin layer chromatography platesimpregnated with AgNO3 (argentation chromatography) allow sep-aration of the saturated and unsaturated fatty acids. It is importantto run sample blanks in case of tracer contamination/carry over[39]. The measurement of specific activity of fatty acids in the lipidfractions allows the calculation of enzyme activity expressed asnmol/h per mg protein or mg tissue. SCD1 activity can also be mea-sured in microsomal fractions of tissues or cells by the generationof 3H2O from the substrate [9,10-3H]stearoyl-CoA [40]. Althoughchanges in hepatic SCD microsomal specific activity occur beforechanges in hepatic SCD protein and transcription, these events pos-itively correlate with time course and direction of change [41]. Asimplified version of this type of assay has recently been reportedfor use in primary rat hepatocytes [42] but it remains difficult tocarry out the analysis in human samples. Therefore, our under-standing of the role of SCD1 in human metabolism has, in part,been hampered by a lack of a good measure of its activity.
3.2. Fatty acid ratios
The least technically demanding method to estimate SCD1activity is probably the measurement of the product to precursor
flect SCD1 enzyme activity.
abdominal [46,229] and buttock [229] subcutaneous adipose tissue for 16:1 n-7/
orrelation with hepatic SCD1 mRNA expression* for 16:1 n-7/16:0 but not 18:1 n-
e 16:1 n-7/16:0 is arguably the better ratio.Fig. 1A and B), are tightly regulated and reflect a number of different lipid pools.e limited.
d the composition reflects exchange with plasma lipid pools as reviewed [43] andvity. In addition, the 16:1 n-7/16:0 and 18:1 n-9/18:0 ratios are low in this lipid
mRNA expression* for16:1 n-7/16:0 but not 18:1 n-9/18:0 [57]. The significance1 is not known./16:0 but not 18:1 n-9/18:0 [43].a heterogeneous lipid pool (see Section 3.2).
; CE, cholesteryl ester; NEFA, non-esterified fatty acids.
20 L. Hodson, B.A. Fielding / Progress in Lipid Research 52 (2013) 15–42
ratio (usually 18:1 n-9/18:0 or 16:1 n-7/16:0 [43]), although the14:1 n-5/14:0 ratio has also been used [44]. Fatty acid data is oftenexpressed as weight % of total fatty acids because that is the formatof the raw data from a gas chromatograph (GC). Therefore fattyacid ratios are often expressed in the same terms. Strictly speaking,however, the ratios should be expressed in molar terms. There area number of plasma or tissue lipid fractions that could potentiallybe used. We have previously collated fatty acid composition datafrom a large number of published studies [43] and now use thisdata to calculate SCD1 indices (16:1 n-7/16:0 and 18:1 n-9/18:0)in different lipid fractions in blood and tissues (Fig. 1A and B).The various fractions and tissues vary greatly in the value of theSCD1 indices. For example, for 16:1 n-7/16:0, the value in adiposetissue is ten times greater than in erythrocyte total phospholipids(PL). For 18:1 n-9/18:0, the ratio is over twenty times higher inplasma CE than in plasma PL. This reflects the high proportion of18:0 in the plasma PL fraction. It has been assumed that the socalled ‘SCD1 index’ reflects enzyme activity.
There is a large difference in the empirical values for the 18:1 n-9/18:0 and 16:1 n-7/16:0 ratios in different human lipid pools.Since dietary fatty acid intake is a major determinant of tissueand blood fatty acid composition, this difference probably reflectsthe high dietary intake of 18:1 n-9, rather than the difference inenzyme specificity. This is borne out by data taken from theAdventist Health Study [45], one of very few studies to report die-tary and adipose tissue 16:1 n-7 content as well as 18: 1n-9 (Ta-ble 1). We also looked at between person differences for 18:1 n-9/18:0 and 16:1 n-7/16:0 ratios in subcutaneous abdominal adi-pose tissue, using data from Pinnick et al. [46]. We found thatthe variation in the two indices was similar (CV 28% and 32%, Ta-ble 1). However, examination of the variation of individual fattyacids showed that the MUFA was most variable for the 16:1 n-7/16:0 ratio, whereas the saturated fatty acid (SFAs) was most vari-able for the 18:1 n-9/18:0 ratio (Table 1). This may be because18:1 n-9 and 16:0 are ubiquitously found in foodstuffs in the diet[47], and are therefore relatively invariant in the diet and adiposetissue. It can be seen in Table 1 that the differences between dietand adipose tissue for 16:1 n-7/16:0 and 18:1 n-9/18:0 in Table 1are primarily due to higher 16:1 n-7 and lower 18:0 in adipose tis-sue. In other words the fatty acid ratios do not reflect the same pat-tern of differences in precursors (i.e. 16:0 and 18:0) or products(i.e. 16:1 n-7 and 18:1 n-9). As we discuss later, these two fattyacid ratios do not change in parallel within adipose tissue or otherorgans and do not necessarily correlate in the same way with SCD1mRNA expression. The partitioning of fatty acids in tissues to oxi-dative or synthetic pathways is also ultimately likely have a biginfluence on the measured fatty acid ratios in tissue or plasma [48].
3.3. Isotopic fatty acid ratios
Stable isotope tracers have been used to compare substratespecificity, as mentioned above and we have also administered sta-ble isotopes in humans in vivo, to calculate an isotopic desaturationindex. [2H2]palmitate was given by intravenous infusion and theratio ([2H2] 16:1 n-7/[2H2] 16:0) in very low density lipoprotein-triacylglycerol (VLDL-TAG) taken as an index of hepatic fatty aciddesaturation [49]. In that paper, we used GC–MS to calculate theisotopic ratio, but we have since changed the infusate to[U–13C]palmitate and transferred the method to a GC coupled toa combustion-isotope ratio mass spectrometer (GC–C–IRMS),which is a much more sensitive platform [50]. We are using alow polarity phase, 5% diphenyl/95% dimethyl polysiloxane capil-lary column (Rtx�-5, Thames Restek, Saunderton, UK) which elutes16:1 n-7 before 16:0. This is important as it completely removescontamination of [U–13C]palmitate in the palmitoleate peak [51]during chromatographic separation. As shown in Fig. 2, the ratio
reaches a steady value at about 360 min after the start of the infu-sion. The ratio obtained by this method is considerably lower thanthe ratios calculated from non-isotopic measurement (Fig. 1A).This may reflect a number of things: firstly our isotopic ratio re-flects fasting SCD1 activity, rather than a ‘long-term average’ ofSCD1 activity. Also, there is no influence of dietary fatty acids inthese isotopic ratios. Furthermore, the isotopic ratio does not re-flect desaturation of newly synthesised 16:0.
4. Stearoyl-CoA desaturase (SCD) in tissues
4.1. Adipose tissue
There are differences in both 16:1 n-7/16:0 and 18:1 n-9/18:0fatty acid ratios in different human adipose tissue depots [46,52–56] (Fig. 1C and D). The ratios were consistently and significantlyhigher in the gluteal depot, reflecting significantly lower propor-tions of 16:0 and 18:0, and higher proportions of 16:1 n-7 and18:1 n-9 [46]. Moreover, this was in accordance with SCD1 mRNAexpression which was consistently higher (P < 0.01) in gluteal thanabdominal depots [46]. Although in the abdominal depot, therewas a strong (r = 0.64, P = 0.005) association between SCD1 mRNAexpression and 16:1 n-7/16:0 ratio, this was not found for the glu-teal depot.
4.2. The liver
In human liver biopsies, SCD1 expression was correlated withthe ratio of 16:1 n-7/16:0 in liver TAG, free fatty acids (FFA), cho-lesteryl ester (CE), PL and total lipids [57]. However the 18:1 n-9/18:0 ratio was not correlated to hepatic SCD1 expression for anyof these lipid fractions. This suggests that 18:1 n-9/18:0 and 16:1n-7/16:0 may not necessarily be interchangeable. Whether or not16:1 n-7/16:0 best reflects enzyme activity remains to be seen.
4.3. Plasma
The choice of plasma lipid fraction is very important as there isa large difference in 18:1 n-9/18:0 and 16:1 n-7/16:0 ratios in dif-ferent human lipid pools (Fig. 1A and B), reflecting gene expressionin the tissue of origin, fatty acid partitioning and dietary intake.However, the use of 16:1 n-7/16:0 has been validated in plasma to-tal VLDL and VLDL-TAG for hepatic SCD1 expression in humans[57]. A correlation of r = 0.67 (P = 0.006) was found betweenSCD1 gene expression in the liver and VLDL-TAG 16:1 n-7/16:0 in15 samples. Moreover, a correlation of r = 0.91 (P < 0.0001) was ob-served between 16:1 n-7/16:0 in liver TAG and VLDL-TAG [57]implying that VLDL-TAG 16:1 n-7/16:0 is a good index of SCD1gene expression in the liver. It was noted that the proportion ofoleate in VLDL-TAG was slightly lower than in total hepatic TAG(39.1% vs 42.5%, respectively).
In some cases, a total lipid fraction has been used to comparegroups, or compare interventions. This can lead to erroneous re-sults because any difference or change in the concentration of spe-cific fractions (e.g. plasma TAG) could lead to a difference in therelative abundance of specific fractions [43] (with different inher-ent SCD indices) and could lead to an artifactual change or differ-ence in the SCD index (in total plasma fatty acids). Thus themeasurement of 16:1 n-7/16:0 ratio in a total plasma lipid fractionto infer SCD1 activity in people with hyperlipidaemia has beencautioned against [58]. It is also clear that the SCD1 index shouldnot be used in the liver total lipid fraction in people with varyingdegrees of liver fat. This is because a greater deposition of liverTAG alters the balance of TAG and PL in the liver. This in turn altersthe balance of fatty acids in the liver, artifactually increasing the
L. Hodson, B.A. Fielding / Progress in Lipid Research 52 (2013) 15–42 21
ratio in the total lipid faction, in particular 18:1 n-9/18:0. Peteret al. [59] showed that a significant correlation between 18:1 n-9/18:0 in liver and liver fat content is entirely spurious and cannotbe taken to represent a relationship with SCD gene expression. Therationale for using product to precursor fatty acid ratios in tissueand blood lipids is presented in Table 2.
5. The role of SCD in lipid synthesis
5.1. De novo lipogenesis (DNL)
De novo lipogenesis (DNL) and SCD activity appear to be inti-mately linked. SFAs, the substrates for SCD are either endogenouslysynthesised (DNL) or provided in the diet. There is evidence to sug-gest DNL-derived fatty acids are preferentially channelled intopathways of elongation and desaturation in adipocytes [60] andhepatocytes [61]. Moreover, there is parallel up-regulation ofexpression of genes involved in DNL and in fatty acid elongationand desaturation, suggesting coordinated control of expression.Parallel activation of hepatic DNL and fatty acid desaturation hasbeen found after a high-carbohydrate diet [49]. In an experimentalsetting, five men were fed an extreme diet which was approxi-mately 2.5 times the daily energy requirement for 4 days, and con-sisted of 90% carbohydrate. Remarkably, the VLDL-TAG secretionrate of de novo synthesised 16:0 increased from 3.2 to 150 lmol/kg/day. Although the synthesis of de novo 16:1 n-7 was not mea-sured, the proportion in VLDL-TAG increased from 3.8% at baselineto 10% by day 4 [62]. Moreover, SCD activity appears to be neces-sary for DNL to occur as reviewed by Sampth and Ntambi in rodentmodels [2] and mentioned in relation to TAG production below.
5.2. Triacylglycerol (TAG)
It has been shown that mice with a targeted disruption of theScd1 gene have very low levels of VLDL, which are not restoredwith feeding MUFA [63,64]. On the basis of these findings it hasbeen proposed that de novo synthesised MUFAs are essential forTAG production [63,64], however in a human model, where dietaryMUFAs are abundant, endogenous synthesis may not be so critical.Thus, it is suggested that SCD does not directly influence TAG pro-duction but rather indirectly it had an effect by regulating fattyacid synthesis [65]. Thus SCD may play an important role by regu-lating the synthesis of fatty acids and therefore indirectly influ-ences lipoprotein secretion by regulating the amount and type offatty acids available for TAG synthesis; further work is requiredto support this notion.
5.2.1. Co-localization of SCD and acyl-coenzyme A:diacylglycerolacyltransferase
The final step in TAG synthesis is the addition of a third acylchain to diacylglycerol (DAG) and this is catalysed by the mem-brane-bound enzyme, acyl-coenzyme A:diacylglycerol acyltrans-ferase (DGAT) [66]. There are two DGAT genes, DGAT1 andDGAT2 and based on their predicted subcellular localisationDGAT2 is targeted mainly to the ER [67]. On the basis of this obser-vation, Man et al. [68] used HeLa and primary liver cells from miceto show that SCD1 and DGAT were present in the mitochondrialassociated membrane region of the ER. Overexpressing SCD1 orDGAT2 or both, increased TAG accumulation, which was greatestin the cells co-expressing both SCD1 and DGAT2 [68]. Immunoflu-orescence confocal microscopy showed extensive co-localisation ofSCD1 and DGAT2 providing evidence of close proximity in the ER[68]. The authors propose that palmitate and stearate from the dietor synthesised de novo are desaturated by SCD1 and channelled toDGAT for final step in TAG synthesis in ER, and this close associa-
tion increased the efficiency of TAG synthesis [68]. Recently,in vitro and animal work using stable-isotope methodology, havedemonstrated that DGAT2 acts upstream of DGAT1, and is primar-ily responsible for the initial synthesis of TAG using de novo syn-thesised and desaturated fatty acids; presumably palmitoleateand oleate [69,70]. In contrast, DGAT1 is primarily responsiblefor esterification of exogenous fatty acids [69,70].
6. Regulation
Sterol responsive element binding protein-1c (SREBP-1c) ap-pears to play an important role in the transcriptional regulationof SCD [5]. Transcriptional activation of genes containing a sterolresponsive element (SRE) are known to be under the regulationof sterols through modulation of proteolytic maturation ofSREBP-1 and SREBP-2 and has been extensively reviewed[5,9,17,71]. In brief, SREBPs are in the ER membrane of a wide vari-ety of tissues and SREBP-1c preferentially enhances the transcrip-tion of genes essential for fatty acid synthesis in the liver, includingSCD1, whilst SREBP-2 activates genes involved in cholesterol bio-synthesis [5,17,71]. SREBP-1c is positively regulated by insulin atthe transcriptional level and it is up-regulated in mouse modelsof hyperinsulinemia and down-regulated in models with insulin-deficiency, such as fasting and streptozotocin-induced diabetes[72–75]. SREBP-1c deficient models have a decreased hepaticSCD1 mRNA expression whilst mice expressing a constitutively ac-tive form have increased expression [76,77].
SCD1 may also be regulated by factors that influence its stabilityor degradation. ATPase p97 is a protein involved in the regulation ofproteasome-dependent degradation of SCD1 [78]. It has been re-ported that ATPase p97 mRNA expression in visceral and subcuta-neous adipose tissue is similar between control and morbidlyobese subjects [79]. The mRNA expression of ATPase p97 appearsto be depot specific with significantly higher expression being re-ported in visceral compared to subcutaneous adipose tissue [79].
6.1. Insulin
In the late 1970s Jeffcoat et al. [65] used an in vitro model of pri-mary rat hepatocytes to demonstrate that when incubated in ser-um-free culture in the presence on insulin, SCD activity wasenhanced and subsequent removal of insulin resulted in an 80% de-crease in SCD activity. The authors suggested that insulin is re-quired for enzyme synthesis, maintenance of enzyme activity andto prevent protein degradation [65]. Around the same time itwas found that rat hepatic SCD activity decreased by 3.7-fold instreptozotocin-induced diabetes but insulin treatment of these ratsincreased SCD activity by 7-fold [80]. Whether regulation of mouseSCD1 by insulin occurs at the level of gene transcription has beenquestioned [81]. It has now been demonstrated that induction ofSCD1 by insulin is due, in part, to insulin activating SCD1 transcrip-tion but also by insulin mediated SREBP-1c [77]. Additionally it hasbeen proposed that on-going protein synthesis is required for insu-lin induction of SCD1 mRNA [82]. Induction of SCD1 has beenshown to be insulin-responsive in a time- and dose-dependentmanner [82,83], and like many other genes stimulated by insulin,is inhibited by cAMP. Animals receiving cAMP (dibutyryl-cAMPand theophylline) had a 75% decrease in SCD1 mRNA abundancecompared with insulin alone, suggesting that hepatocellular cAMPplays negative role in regulation of SCD1 gene in vivo [82].
6.2. Leptin
Leptin is produced predominantly, but not exclusively, by whiteadipose tissue with more leptin being produced and secreted when
22 L. Hodson, B.A. Fielding / Progress in Lipid Research 52 (2013) 15–42
there are larger or more adipocytes present. Leptin regulates en-ergy balance, metabolism and the neuroendocrine response to al-tered nutrition [84,85]. Replacement of leptin in leptin-deficient(ob/ob) mice and humans leads to depletion of lipid in adipose, li-ver and other peripheral tissues [86–89]. Cohen et al. [90] initiallyused a microarray approach to identify hepatic genes whoseexpression were specifically modulated by leptin treatment. Thegene encoding Scd1 was ranked the highest in the analysis; leptintreated mice had repressed SCD1 expression, lower SCD1 enzymeactivity, and lower levels of hepatic 16:1 n-7 and 18:1 n-9 than un-treated mice [90]. There have been a number of investigations intothe effect of leptin on Scd1 in a variety of murine models [36,90–92]. A consistent finding is that administration of leptin down-reg-ulates hepatic SCD1 expression and activity [90,91]. The effect ofleptin on hepatic SCD1 has been suggested to be independent ofinsulin and SREBP-1c, and leptin rather than insulin, is a major reg-ulator of hepatic MUFA synthesis in obesity-related diabetes (inmice) [91]. The effect of leptin on adipose tissue and hepaticSCD1 activity and expression in humans has yet to be investigated.
6.3. Sex differences
Whilst investigating the dynamic changes in the compositionand physical properties of microsomal membranes in the late1970s, Lippiello et al. [93] noted a 7-fold increase in specific activ-ity of rooster liver SCD1 following a single subcutaneous injectionof 17b-estradiol. The increase in SCD1 activity was accompanied byalterations in physical properties of microsomal membranes with anotable increase in the abundance of 16:1 n-7 and 18:1 n-9 [93].These data suggested a sex-specific effect on the SCD1 gene expres-sion. Others have noted sexual-dimorphism in hepatic SCD mRNAexpression in animal studies [94] and plasma CE fatty acid productto precursor ratios in humans [95]. Female mice have higher abun-dances of hepatic SCD1 mRNA, palmitoleate and oleate in total he-patic lipids compared to male mice, with the effect not beingstrain-specific [94].
Using product to precursor fatty acid ratios of plasma CE, it wasfound that women have a higher 16:1 n-7/16:0 ratio than men[95], although no sexual dimorphism has been found for fatty acidratios in VLDL-TAG [96]. We have recently reported women to havehigher SCD mRNA expression in both abdominal and gluteofemoralsubcutaneous adipose tissue than men, although this did not trans-late to a difference in fatty acid product to precursor ratios [46].
In animal models fat accumulation has been associated with anincrease in SCD1 activity [97–99] and it has been speculated thatthe sexual dimorphism noted in body fat deposition may in partbe explained by differences in SCD1 activity. The underlying mech-anistic basis for higher levels of the SCD1 in females may be due tolevels of specific sex hormones and in this respect an interestingcomparison would be between pre- and post-menopausal womenor transgender patients as has previously been investigated withfatty acid profiling [100].
6.4. Dietary influences
What we consume in our diet may influence SCD1 activity and/or expression. A number of dietary influences have been investi-gated in many different models and we review the evidence below.However, when investigating the effect of dietary components onSCD1 activity in human and animal studies, it should be borne inmind that changing one component is inevitably accompanied bya change in another. In this respect, cell models provide a ‘clean’and direct answer although not necessarily representative of wholebody physiology.
6.4.1. Carbohydrate content of the dietThere are a number of studies that have investigated the influ-
ence of the carbohydrate content of the diet on SCD1 activity. Inthe majority of studies when carbohydrate intake is increased,fat intake is decreased. A high carbohydrate diet is a powerful stim-ulator of hepatic DNL in man [49,62], leading to hypertriglyceride-mia as reviewed [101–104]. The influence of quality and quantityof carbohydrate on SCD1 activity is discussed below.
Work in animal model, clearly demonstrate that increasing die-tary carbohydrate markedly increases hepatic SCD1 activity [105]and mRNA expression [81,106]. SCD1 expression within adiposetissue also increases in response to high-carbohydrate feeding,although there is no appreciable change in SCD expression in brain,kidneys and testis [34]. Administration of a fat-free diet resulted inhepatic SCD activity increasing to over 50-fold [105] and when thefat-free diet is stopped or animals are starved, hepatic SCD activitydropped to almost zero [22,23].
The mechanisms responsible for the induction of SCD1 on ahigh carbohydrate diet are thought to be at the level of gene tran-scription. SCD1 mRNA increased 2-fold within 6 h to 45-fold within36 h in mice fed a fat-free high carbohydrate diet after a prolongedfast [81]. Animals remaining on the fat-free high carbohydrate dietmaintained high SCD1 mRNA expression whilst there was a rapiddecrease in SCD1 mRNA expression in animals switched to a chowdiet [81]. It has been postulated that the response of SCD1 torefeeding reflects the reciprocal effects of insulin and glucosewhich would increase after feeding with a high-carbohydrate diet,as reviewed by Heinemann and Ozols [17].
King et al. [107] measured the change in the proportion of 16:1n-7 and 18:1 n-9 in erythrocyte PLs, plasma PLs and CEs before andafter individuals had been on a low-fat (17% total energy) diet forsix weeks. At the end of the intervention period, the proportion of16:1 n-7 and 18:1 n-9 in all three lipid fractions had significantlyincreased [107]. We have investigated the influence of short-termchanges in total dietary carbohydrate intake on SCD1 activity inthe liver and adipose tissue using fatty acid ratios and stable iso-tope methodologies [49]. Subjects consumed a diet enriched withcarbohydrate (75% total energy) or fat (40% total energy) for 3 daysbefore having a postprandial study day and crossing over to thealternate diet after a six week washout period. The 16:1 n-7/16:0ratio in plasma VLDL-TAG and adipose tissue venous NEFA (repre-senting subcutaneous abdominal adipose tissue) were significantlyhigher after the high carbohydrate diet. We found no effect oftreatment in the 16:1 n-7/16:0 ratio in arterial blood. After highcarbohydrate feeding, the proportion of 16:1 n-7 was significantlyhigher in VLDL-TAG compared to the higher fat diet (7.0 ± 0.6 vs4.2 ± 0.5 mol%, P = 0.017). After the high carbohydrate diet, the16:1 n-7/16:0 ratio in plasma VLDL-TAG (representing liver) corre-lated with 16:1 n-7/16:0 in adipose venous NEFA (rs = 0.81,P = 0.01). The postprandial isotopic desaturation index ([2H2]16:1n-7/[2H2]16:0) of VLDL-TAG was significantly higher after the highcarbohydrate than after higher fat diet [49].
6.4.1.1. Sucrose. The effect of dietary sucrose on SCD activity hasnot been well studied. Hepatocytes from rats fed a diet containing20% sucrose for two weeks had higher levels of fatty acid synthesis,SCD1 activity and TAG synthesis, compared to hepatocytes fromrats fed a corn oil supplemented diet [65].
6.4.1.2. Fructose. Fructose consumption is increasing and the mech-anisms by which fructose may contribute to the development ofobesity and potential metabolic abnormalities, such as insulinresistance, are beginning to be addressed.
The influence of dietary fructose on SCD expression and activityhas been studied in a number of different murine models[82,108,109]. A consistent finding from all studies is that a fruc-
L. Hodson, B.A. Fielding / Progress in Lipid Research 52 (2013) 15–42 23
tose-rich diet induces SCD1 expression in models where Scd1 is notdeficient [82,108,109]. Fructose feeding in Scd1 deficient mice doesnot induce SREBP-1c, fatty acid synthase (FAS), or acetyl-CoA car-boxylase (ACC) mRNA expression [109], and lead to a 54% decreasein plasma TAG concentrations compared to wild type mice. Supple-menting the fructose diet with triolein caused a 4.8-fold increase inhepatic TAG and ‘normalised’ plasma TAG concentrations in Scd1deficient compared to wild type mice. Interestingly, supplementa-tion with fructose and tristearin or tripalmitin did not have theseeffects [109]. The authors concluded that oleate is required forfructose mediated elevation of liver and plasma TAG concentra-tions [109]. It remains unclear if palmitoleate could also have thiseffect.
Feeding a high fructose diet (80%) to diabetes-induced mice re-sulted in a 23-fold increase in hepatic SCD1 mRNA compared to ahigh glucose diet [82]. Feeding fructose or glucose whilst givinginsulin induced 45- and 46-fold increases respectively, in hepaticSCD1 mRNA within 24 h [82]. These data suggest that insulin isnot required to initiate fructose induction of hepatic SCD1 mRNA,but insulin is required for complete induction of the gene [82].
Using a TR4 nuclear receptor deficient mouse model with amarkedly reduced expression of hepatic SCD1, Kim et al. [108] re-ported that a high fructose diet (60%) resulted in a significantlyhigher hepatic Scd1 gene expression compared to control mice.The authors suggested that fructose induced Scd1 gene expressionin a TR4-independent manner [108].
Fructose feeding increased hepatic DNL in humans [110] butdata demonstrating the influence of fructose on SCD1 in humansis limited. Therefore we have used the data from Chong et al.[101] to calculate the 16:1 n-7/16:0 ratio in VLDL-TAG after theacute ingestion of fructose vs glucose. The mean ratio from 240to 360 min after the test meal was significantly higher after fruc-tose (0.14 ± 0.02 vs 0.11 ± 0.01, P < 0.05, n = 10). Le et al. [111] re-ported that a high fructose diet increased SCD1 gene expressionin the muscle of healthy men. Overall these data show that dietaryfructose or a metabolite of fructose, positively regulates hepaticSCD1 activity and expression.
6.4.2. Saturated fatty acids (SFAs)In most models, the influence of SFAs on SCD is compared to
other fatty acids, so interpretation of the data can be challenging,particularly when SFAs are compared to PUFAs. Compared to achow diet, mice consuming a SFA rich diet have significantly higherhepatic SCD1 mRNA expression [112] and feeding beef tallow,compared to linseed or fish oil, increased SCD1 activity in rat livermicrosomes [113]. More recently, diets containing tristearin havebeen compared to diets containing triolein [63,114,115]. Rats feda tristearin-rich diet have significantly greater cardiac SCD1 mRNAexpression than animals fed triolein or chow diets [115]. HepaticSCD1 mRNA expression and activity in wild type mice are signifi-cantly higher in tristearin than triolein fed animals [114].
Very few human studies have been undertaken to investigatethe effect of SFAs on SCD1. Warensjo et al. [116] investigated theeffects of diets high in saturated (enriched in butter) and unsatu-rated (enriched with rapeseed oil) fatty acids. SCD1 activity wasestimated by measuring the 16:1 n-7/16:0 and 18:1 n-9/18:0 ra-tios in serum CEs and PLs. However, the two ratios gave differingresults. The 16:1 n-7/16:0 ratio was significantly higher but the18:1 n-9/18:0 ratio was significantly lower after the SFA diet forboth plasma CE and PL (P < 0.001 for all), except for the 16:1 n-7/16:0 ratio in PL, which was only borderline significant. The authorsproposed that as the changes in the 16:1 n-7/16:0 seem to reflectchanges in SFA intake this ratio maybe a useful marker of SFA in-take in Western countries [116]. It would have been of interestto see the association between the changes in plasma CE 16:1 n-7/16:0 and SFA intake, however this was not reported. Using
16:1 n-7/16:0 as a marker of SFA intake would be challenging asdistinguishing between those that have a high SFA intake andthose on a low-fat high-carbohydrate diet will be almost impossi-ble, as both dietary regimes appear to increase the 16:1 n-7/16:0ratio. Therefore, it could be anticipated that the use of fatty acid ra-tios, namely 16:1 n-7/16:0 and 18:1 n-9/18:0 as a biomarker of to-tal or specific dietary fat intakes would be limited. Further work isrequired in humans to understand the extent and the tissues inwhich SFA has an influence on SCD1 expression and activity.
6.4.3. Monounsaturated fatty acids (MUFAs)In vitro work has been undertaken to understand the presence
of prevalent circulating fatty acids on TAG formation and fatty acidoxidation in b-cells [117]. MIN6 cells exposed to palmitoleate oroleate for up to 48 h significantly decreased SCD1 and 2 expressioncompared to control cells, whilst SFAs (palmitate or stearate) in-creased expression of SCD1 only [117]. There was significantlymore TAG in all cells cultured in fatty acid but cells cultured in ole-ate had almost 2-fold more TAG than other cells despite higherfatty acid oxidation [117]. In an animal model where a high carbo-hydrate diet was supplemented with either olive oil or fish oil, he-patic SCD1 mRNA expression was higher in the olive oil than fishoil fed group [118]. Compared to tristearin, feeding triolein didnot change hepatic SCD1 expression in wild type mice [114]. Theinfluence of MUFAs, namely oleate, on gene expression has re-cently been investigated [119]. Kaur et al. [119] treated FAO hepa-toma cells with oleate for 48 h and found no difference in SREBP-1c, FAS and carbohydrate response element binding protein (ChRE-BP) expression compared to control cells, whilst ACC expressionwas significantly increased [119]. There was no difference in theprotein levels of SREBP-1c and ACC compared to control cells[119]. On the basis that oleate did not affect SREBP-1c and FASexpression, it could be speculated that there would be very littlechange in SCD1 expression. Although data is somewhat limited, iftaken together it would seem that MUFAs may have a modest ef-fect on SCD1 expression.
6.4.4. Polyunsaturated fatty acids (PUFAs)By the late 1970s it was well recognised that dietary linoleic
acid (18:2 n-6) (when given as safflower oil) reduced the synthesisand half-life of FAS compared to a fat-free diet [120] thus it washypothesised that dietary linoleate would have a similar effecton hepatic SCD1 [121]. Feeding a linoleate rich diet (60% w/w) toyoung rats invoked a more rapid decrease in hepatic SCD1 activity,while changes in FAS to took longer to occur [121]. Interestingly, itwas calculated that 1 g dietary linoleic acid could suppress theinductive effects of 18 g sucrose in a rat which when extrapolatedto a human would require the ingestion of 3–4 g linoleic acid perday to offset the inductive effects that 60 g of sugars would haveon hepatic SCD1 [122].
Feeding mice a fat-free diet supplemented with TAGs contain-ing with either trilinolein (18:2 n-6), trilinolenin (18:3 n-3) and tri-arachidonin (20:4 n-6) repressed induction of hepatic SCD1 mRNAwhilst supplementation with tripalmitin (16:0), tristearin (18:0),and triolein (18:1 n-9) had little effect [81]. The level of suppres-sion obtained by PUFA on hepatic Scd1 seemed to be related tothe number of carbons and double bonds present in the fatty acids,with triarachidonin resulting in the most dramatic effect on Scd1suppression [81]. Using H2.35 cells Ntambi and colleagues [123]demonstrated that the insulin-stimulated expression of SCD1mRNA is significantly blunted when linoleic acid and arachidonicacid are supplemented in the induction media.
Supplementation of INS-1 b-cells with arachidonic acid leads toa decrease in SCD1 expression [124]. Feeding a high-PUFA diet(48% corn oil) to lean or obese zucker rats significantly decreasedadipose tissue and hepatic SCD1 mRNA expression compared to a

24 L. Hodson, B.A. Fielding / Progress in Lipid Research 52 (2013) 15–42
control diet [125]. Sessler et al. [126] reported that treatment of3T3-L1 adipocytes with arachidonic acid decreased SCD1 enzymeactivity and expression and although there was no change in thetranscription of the SCD1 gene, the half-life was reduced. Treat-ment of the cells with linoleic acid, linolenic acid and eicosapenta-enoic acid (20:5 n-3) also reduced SCD1 mRNA, but oleic acid andstearic acid did not [126]. The authors concluded that PUFAs re-press the expression of the SCD1 gene in mature adipocytes byreducing the stability of the SCD1 mRNA [126].
SCD expression is down-regulated in a dose dependent mannerby linoleic acid in 3T3-L1 adipocytes [125]. Moreover, the activityof the SCD promoter, from four different species (mouse, man, pigand sheep) is reduced in a dose-dependent fashion by the additionof linoleic acid which is dependent on the presence of a PUFA re-sponse region [127]. In the species studied, the PUFA response re-gion of the SCD promoter was shown to have an active SRE [127]. Ithad been postulated that this SRE was responsible for the fatty acidresponsiveness of SCD [5]. PUFAs have been shown to inhibitSREBP-1c transcription [128] and as discussed above (Section 6)SREBP-1c may play an integral role the transcriptional regulationof SCD.
As described above (Section 6.4.2) Warensjo et al. [116] investi-gated the effects of a diets high in unsaturated (enriched with ra-peseed oil) and saturated (enriched in butter) fatty acids. The16:1 n-7/16:0 ratio in serum CE and PL was significantly lowerafter the unsaturated fat compared to the SFA diet, whilst the18:1 n-9/18:0 was higher after the unsaturated compared to SFAdiet in both plasma lipid fractions [116]. A more recent dietaryintervention aimed to compare participants in whom either thelinoleic acid content of the diet (n-6 PUFA), or the SFA content ofthe diet was increased. Participants consuming the high PUFA diethad significantly lower liver fat and a lower 16:1 n-7/16:0 ratio inthe plasma CE fraction [129].
The potent influence of PUFA on repressing SCD1 activity orexpression is a consistent finding across studies, although of noteis the fact that PUFA does not repress SCD4 [32]. More human workis required to better understand how repression of SCD1 influenceshuman metabolic health.
6.4.5. Conjugated linoleic acid (CLA)Conjugated linoleic acid (CLA) is a collective term for a group of
positional and geometric conjugated dienoic isomers of linoleicacid. There are two predominant isomers, cis-9,trans-11 (c9,t11)and trans-10,cis-12 (t10,c12). In vitro work using HepG2 cells re-ported t10,c12 CLA to suppress SCD1 activity compared to c9,t11CLA [130]. Studies in animal models have reported t10,c12 CLAto suppress hepatic SCD1 mRNA expression and enzyme activity[131–133]. Data on the effects of CLA on SCD1 in humans is limitedand it would seem that supplementing with c9,t11 CLA or t10,c12CLA does not bring about notable changes in the 16:1 n-7/16:0 or18:1 n-9/18:0 ratios of plasma PLs, CEs and TAG, nor does it changeSCD1 mRNA expression of peripheral blood mononuclear cells[134]. The evidence from in vitro and animal work clearly demon-strates that CLA, notably t10,c12 represses SCD1, a finding that hasnot been replicated in human work. A possible explanation is thatthe human work supplemented with 3 g of CLA, and in the contextof a ‘typical Western diet’ this would equate to approximately 4%(or less) of total fat intake, whilst animal work have been supple-mented with higher amounts.
6.4.6. Essential fatty acidsEssential fatty acids are those that cannot be synthesised in the
body and must be supplied by the diet and include the n-6 and n-3fatty acids, linoleic and a-linolenic acid, the precursors to the n-6and n-3 series of fatty acids. PUFAs regulate a wide variety of bio-logical functions including important roles in inflammation and
immune function [135–137]. The optimal dietary ratio of n-6:n-3PUFA is around 1–4:1 however, the ratio in a Western diet is inthe range of 10:1–20:1 [137] and as noted above (Section 6.4.4)n-3 and n-6 PUFAs suppress hepatic SCD1 activity and mRNAexpression. Deficiency in essential fatty acids is rare but in casesof severe dietary restriction or in circumstances of severe fat mal-absorption symptoms may manifest such as cracked scaly skin,excessive thirst and impaired liver function resulting from accu-mulation of liver fat [138]. In essential fatty acid deficiency thereis elongation and desaturation of oleic acid to eicosatrienoic acid(20:3 n-9) which is normally present in trace amounts. The impactof essential fatty acid deficiency on SCD1 activity and expressionhas not been investigated. However, an in vitro model of keratino-cyte essential fatty acid deficiency noted there was a significant in-crease in the relative abundance of 16:1 n-7 and 18:1 n-9 and itcould be speculated that this was due to an increase in SCD1 activ-ity [139]. Treatment with linoleic acid reduces symptoms, theabundance of 16:1 n-7 and 18:1 n-9 and presumably SCD1 activity[5].
6.4.7. CholesterolSCD is thought to play important role in cholesterol metabolism
by providing MUFAs for CE synthesis in the liver [63]. Dietary cho-lesterol induces SCD1 mRNA expression [140] whilst SCD2 activityis repressed by the presence of cholesterol [30]. In rats fed variousdiets supplemented with cholesterol, hepatic SCD1 enzyme activ-ity and mRNA levels were increased [141], and this effect was irre-spective of the fatty acid fed with the cholesterol [113]. In vitrodata has suggested that liver X receptor/retinoid X receptor (LXR/RXR) transcription factors induce a number of genes involved inregulation of cellular cholesterol efflux and SCD1 may play a rolein modulating this [142]. In HEK 293 cells co-transfection of ABCA1and SCD1 or SCD2 inhibited ABCA1-mediated cholesterol efflux,and over expressing SCD1 in chinese hamster ovary (CHO) cellslead to a decreased cholesterol efflux [142].
More recent work proposes that SCD1 activity may enhance cellviability by providing substrate for acyl-CoA:cholesterol acyltrans-ferase (ACAT)-mediated CE synthesis thus reducing free choles-terol-mediated lipotoxicity [143]. Inhibition of SCD1 suppressedCE biosynthesis, suggesting that SCD1 mediated synthesis of oleateis an important step in the synthesis of cholesteryl-oleate [143].Inhibiting SCD1 activity increased free cholesterol, which may leadto membrane remodelling. These data suggest that SCD1 activity isrequired for efficient cholesterol esterification to MUFA. In a re-view by Kim et al. [71] it was suggested that induction of SCD1gene expression by cholesterol occurs through a mechanism thatis independent of SREBP-1c maturation.
6.4.8. ProteinLiver microsome fatty acid precursor to product ratio (16:0/
16:1 n-7) was measured in monkeys fed either a control or low-protein diet for 12 months [144]. The fatty acid ratio was foundto be significantly higher for animals that were on the low-proteindiet compared to the control group.
6.4.9. Dietary restriction/lifestyle interventionIn a rat model, prolonged food restriction increased SCD1 mRNA
expression in liver, perirenal, epididymal and subcutaneous adi-pose tissue when compared to control animals and expressionwas further enhanced with refeeding [145]. In contrast, fastingfor 72 h suppressed SCD1 expression, relative to controls [145].The authors proposed that the increased SCD1 expression withfood restriction and refeeding may be part of a molecular mecha-nism(s) by which fatty acid synthesis after caloric restriction con-fers enhanced susceptibility to obesity and insulin resistance [145].Mainieri et al. [146] reported that SCD1 expression in retroperito-
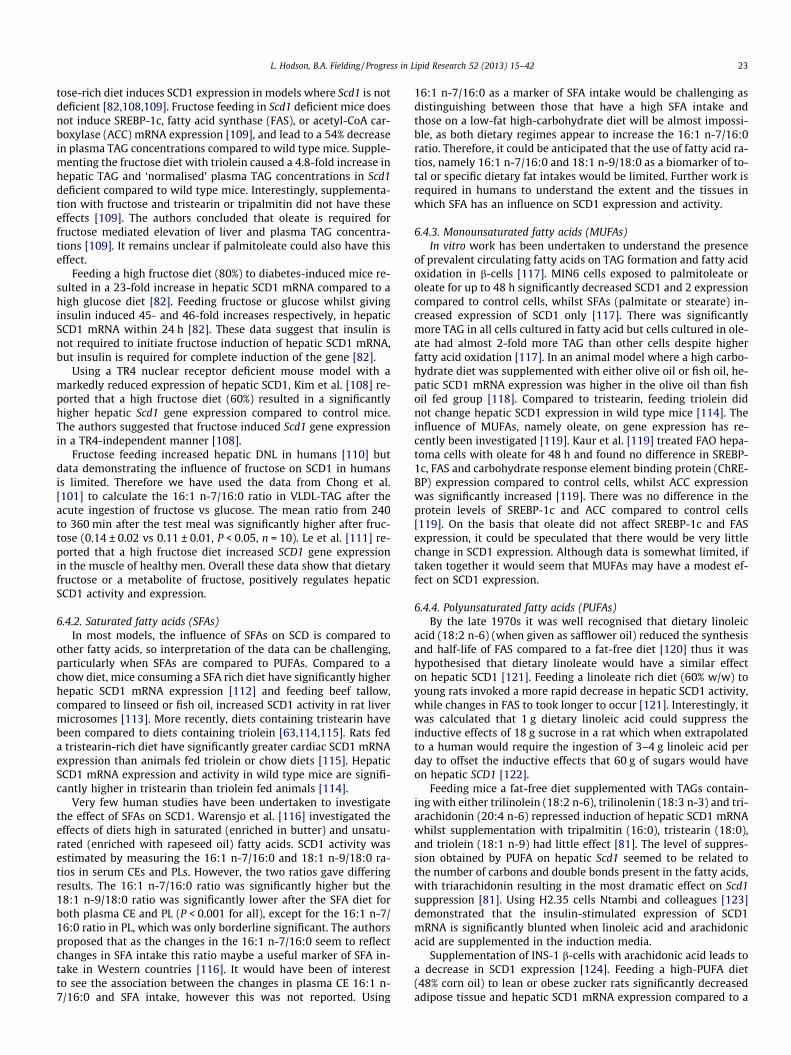
Table 3Overview of studies that have used mouse models.
Author Mouse model(s)* Background� Aim of the study
Biddinger et al. [163] B6 C57Bl/B6 Investigate the effect of a low-fat and high-fat diet under normal conditions129 129S6/SvEvTac
Biddinger et al. [91] Leptin deficient ob/ob Investigate the roles of leptin and insulin in the regulation of SCD1Liver insulin receptor knockout 129SvEVSREBP-1c�/� 129SvEV
Cohen et al. [90] ob/ob Used transcription profiling to identify leptin-regulated genes in liverabJ/abJ
abJ/abJ;ob/ob
Cao et al. [1] FABP�/� C57BL/6J Explore how metabolic alterations in AT are linked to whole-body metabolismthrough lipid signals
Dobryzn et al. [164] SCD1�/� Not stated Investigate the influence of SCD1 deficiency on ceramide synthesis in skeletalmuscleob/ob
ob/ob;SCD1�/�
Dobrzyn et al. [165] SCD1�/� SV129 Examine the effect of dietary PUFA on AMPK in liver, heart and skeletal muscle
Dobryzn et al. [166] SCD1�/� SV-129 Determine the effect of SCD1 deficiency on glycerophospholipid profiles
Dobryzn et al. [176] SCD1�/� 129 SV Examine the mechanisms by which SCD1 deficiency up-regulates fatty acid b-oxidationabJ/abJ;ob/ob C57BL/6J
Dobrzyn et al. [223] SCD1�/� B6 Investigate if loss of SCD1 function could be beneficial in the treatment of lipid-induced heart diseaseob/ob;SCD1�/� B6
Fernandez et al. [189] HSL null C57BL/6J/SV128 Examine the influence of fasting and feeding (chow and a high-fat diet) on lipidmetabolism
Fernandez et al. [190] HSL null C57BL/6J/SV129 Determine the role of HSL in lipid metabolism
Flowers et al. [92] BTBR SCD1�/� SV129 Determine if SCD1 deficiency, in an insulin resistant model, can preventobesity-induced diabetesBTBR leptinob/ob SCD1�/� C57BL/6J
Flowers et al. [181] SCD1 skin-specific deletion C57BL/6J Investigate the metabolic changes in skin caused by SCD1 deficiency with afocus on retinol metabolism
Flowers et al. [183] SCD1 AT-specific deletion C57BL/6J Investigate if deletion of SCD1 from AT and liver prevents obesitySCD1 liver-specific deletion C57BL/6JSCD1 liver and AT-specificdeletion
C57BL/6J
Flowers et al. [174] SCD1�/� C57BL/6J Determine the effect of a very low-fat diet on SCD1 deficient mice
Hyun et al. [182] SCD1 AT-specific deletion C57BL/6 Investigate the effects of deleting SCD1 in AT
Kim et al. [108] TR4�/� mice C57BL/6 Investigate the role of the hepatic nuclear receptor TR4 in the regulation oflipogenesisLeptin receptor-deficient db/db
Lee et al. [173] SCD1�/� 129 SV Investigate effect of SCD1 deficiency on basal and cold-induced thermogenesis
Liu et al. [175] SCD1�/� C57BL6/J To identify the effects of SCD1 on the inflammatory response of a paracrinenetwork involving adiocytes, macrophages, and endothelial cells
Miyazaki et al. [167] SCD1�/� 129S6/SvEv To determine if increased fatty acid oxidation observed in SCD1 deficiency isdependent on activation of the PPARa pathwaySCD1�/�PPARa�/� 129/Sv Jae
Miyazaki et al. [179] SCD1 liver-specific deletion C57BL/6 To understand the tissue-specific role of SCD1 in energy homeostasis
Miyazaki et al. [63] Aesbia SCD1�/� Examine the role of SCD1 gene expression in the synthesis of hepatic CEs andTAGs
Miyazaki et al. [64] Asebia SCD1�/� Examine the role of SCD1 gene expression in the induction of de novo synthesisof hepatic TAG
Miyazaki et al. [109] SCD1�/� 129 SV Examine the role of SCD1 gene expression in fructose-mediated induction oflipogenic genesSREBP-1c�/� 129S6/SvEv
Miyazaki et al. [168] SCD1�/� C57BL/6 Determine the effects of SCD1 inhibition on adiposity and insulin sensitivitySCD1�/�;ob/ob
Miyazaki et al. [29] SCD2�/� C57BL/6 Determine the biological function of the SCD2 isoform
Ntambi et al. [169] SCD1�/� SV129 Examine the role of SCD1 on adiposity
Rahman et al. [171] SCD1�/� SV129 Determine the role of SCD1 in brown AT metabolism
Rahman et al. [170] SCD1�/� SV129 Examine the role of SCD1 in skeletal muscle insulin signalling
Sampath et al. [114] SCD1�/� 129SvEv Understand the role of SCD1 in the metabolism of dietary SFAs
Sampath et al. [180] SCD1 skin-specific deletion C57Bl/6 J Examine the role of SCD1 in skin lipid composition and energy expenditure
Waters and Ntambi [82] CD-1 with streptozotocininduced diabetes
Study the regulatory role of carbohydrate and insulin on expression of hepaticSCD1
Abbreviations: SCD, stearoyl-CoA desaturase; SREBP, sterol responsive element binding protein; AT, adipose tissue; PPAR, peroxisome proliferator-activated receptor; SFA,saturated fatty acid; PUFA, polyunsaturated fatty acid; AMPK, AMP-activated protein kinase.* The mouse models are presented as described by the authors, control animal information have not been presented here. SCD1�/� refers to the SCD1 global knockout modelunless otherwise stated.� In the format reported by the authors.
L. Hodson, B.A. Fielding / Progress in Lipid Research 52 (2013) 15–42 25

26 L. Hodson, B.A. Fielding / Progress in Lipid Research 52 (2013) 15–42
neal white adipose tissue and liver was down-regulated with semi-starvation and remained unaltered by refeeding, whilst epididymaladipose tissue SCD1 expression remained unaltered during semi-starvation and refeeding, compared to control animals. In contrast,SCD1 mRNA expression in skeletal muscle was significantly higherwith semi-starvation and refeeding compared to control animals[146]. The intramyocellular lipid content of muscle increased withsemi-starvation and decreased with feeding compared to controlswith the 16:1 n-7/16:0 fatty acid ratio of muscle TAG being lowerand the 18:1 n-9/18:0 being significantly higher than controls[146]. Microsomal SCD1 activity was found to parallel the elevatedSCD1 mRNA expression after semi-starvation and refeeding [146].
In human studies Mangravite et al. [147] measured SCD1expression in adipose tissue from the ‘flanking’ region after oneof four dietary regimes, after acute weight loss and after weightstabilisation [147]. SCD1 gene expression was reduced after acuteweight loss and changed more modestly in response to altered dietcomposition [147].
Although the effects of dietary restriction/lifestyle interventionon SCD1 have not been investigated by many it is apparent thatthere is tissue-specific regulation of SCD1 expression in responseto nutritional state. It would be of interest to further understandthe influence of dietary restriction/lifestyle intervention on SCD1as it may be of importance when considering the factors that re-quire standardisation prior to undertaking investigations of SCD1in humans.
6.4.10. Cyclopropene acidsCyclopropene acids are a group of fatty acids with the best
known cyclopropene acids being malvalic acid (7-(2-octyl-1-cyclopropenyl)heptanoic acid) and sterculic acid (8-(2-Octacyclo-propen-1-yl)octanoic acid). Sterculic acid is present in sterculia oilsand at low levels in kapok seed oil (approx. 12%), cottonseed oil(approx. 1%), and in the seeds of the tree Sterculia foetida (approx.65–78%). These acids are highly reactive and are destroyed duringrefining and hydrogenation of the oils. Cyclopropene acids havebeen used as a dietary agent to investigate the regulation of micro-somal desaturation. A consistent finding is that sterculic acidinhibits hepatic microsomal desaturation activity in animal models[148–150] and adipose tissue [148]. Early work suggested that theinhibition of hepatic SCD1 may be due to irreversible binding ofenzyme sulfhydryl groups by cyclopropene group [148,149], butthis has yet to be substantiated.
6.4.11. AlcoholIn response to chronic alcohol consumption, the proportion of
oleate in membrane lipids was increased whereas that of palmitatewas decreased [151]. In animal models the influence of chronicalcohol consumption on hepatic SCD1 mRNA expression is incon-sistent with Tomita et al. noting significant increases in SCD1and SCD2 [152] whilst Wada et al. [153] found not change in hepa-tic SCD1 expression, although FAS expression significantly in-creased. Hepatic SCD1 activity was significantly reduced in themicrosomes of ethanol fed rats with an 80% reduction in the desat-uration of palmitoyl-CoA and a near 100% reduction in stearoyl-CoA desaturation [154].
In humans, the effect of alcohol consumption is not well docu-mented but it has been noted that with increasing alcohol con-sumption there is an increased abundance of 16:1 n-7 in plasmaPLs [155]. It would be of interest to determine the influence ofalcohol intake on SCD1 in humans as it may be an important die-tary factor to control for when undertaking studies.
6.5. Other factors that may influence SCD
6.5.1. ColdPoikilothermic animals, those whose internal temperature var-
ies considerably as a consequence of variation in the ambient envi-ronmental temperature, respond to chronic cold by increasingtheir phosphoglyceride unsaturation to restore the fluidity ofcold-rigidified membranes [41]. The desaturation of SFAs to havea greater abundance of cis-MUFAs has a notable effect on mainte-nance of membrane fluidity as cis-unsaturated fatty acids lowerthe temperature for membrane lipid phase changes [156]. Whencarp that had been maintained at 30 �C were cooled to 10 �C therewas an 8- to 10-fold increase in the specific activity of the micro-somal SCD1 [41]. Additionally, there was a 10-fold increase inthe cold-induced up-regulation of SCD1 gene transcription 48–60 h [41]. The fatty acid composition of blubber TAG from ringedseals (Phoca hispida) taken near the skin on the trunk or from any-where on the flippers had a greater proportion of 16:1 n-7 and 18:1n-9 and fewer saturates than blubber from near the muscles [157],suggesting SCD1 may play an important role in the thermal gradi-ent noted in these animals. It remains unknown if human SCD1expression and activity are cold-inducible.
6.5.2. SmokingThe effect of cigarette smoking on SCD1 has not been directly
investigated but a number of epidemiological studies have foundthat cigarette smoking was associated with higher proportions of16:1 n-7 and 18:1 n-9 in plasma CE and PL in the majority [158–161] but not all [155] studies. We have previously speculated thatcigarette smoking up-regulates SCD1 or alternatively, alters thecatabolism of 16:1 n-7 and 18:1 n-9 [43]. It would be of interestto determine the effect of cigarette smoking on SCD1 as it maybe an important confounding factor in many studies.
6.5.3. Shear stressShear stress, the frictional force created by blood flow, can exert
a variety of metabolic effects on endothelial cells. Qin et al. [162]investigated the effects of laminar flow on SCD1 gene expressionusing in vitro and in vivo models. Laminar shear stress was foundto markedly increase SCD1 gene and protein expression whichwas mediated by the flow-activation of the PPARc pathway[162]. The authors suggested this mechanism may contribute toshear stress mediated protection of vascular endothelial cells[162].
7. SCD mouse models
7.1. Genetic background
The genetic background strains for Scd1 knockout models aretypically C57BL/6 or SV129 (129S6/SvEvTac) mice and this mayinfluence the phenotype of the model [163]. Interestingly, C57BL/6 mice develop features of the metabolic syndrome even on alow-fat diet but SV129 do not [163]. In both models a high-fat dietincreased liver TAG content, but this was more notable in C57BL/6than SV129 mice. On a low-fat diet hepatic SCD1 mRNA expressionand SCD1 activity (measured as production of oleate from stearateby liver microsomes) was higher in C57BL/6 compared to SV129mice [163]. High-fat feeding increased the relative expression ofhepatic SCD1 mRNA and SCD1 activity in both models but it wasmore pronounced in C57BL/6 mice [163].
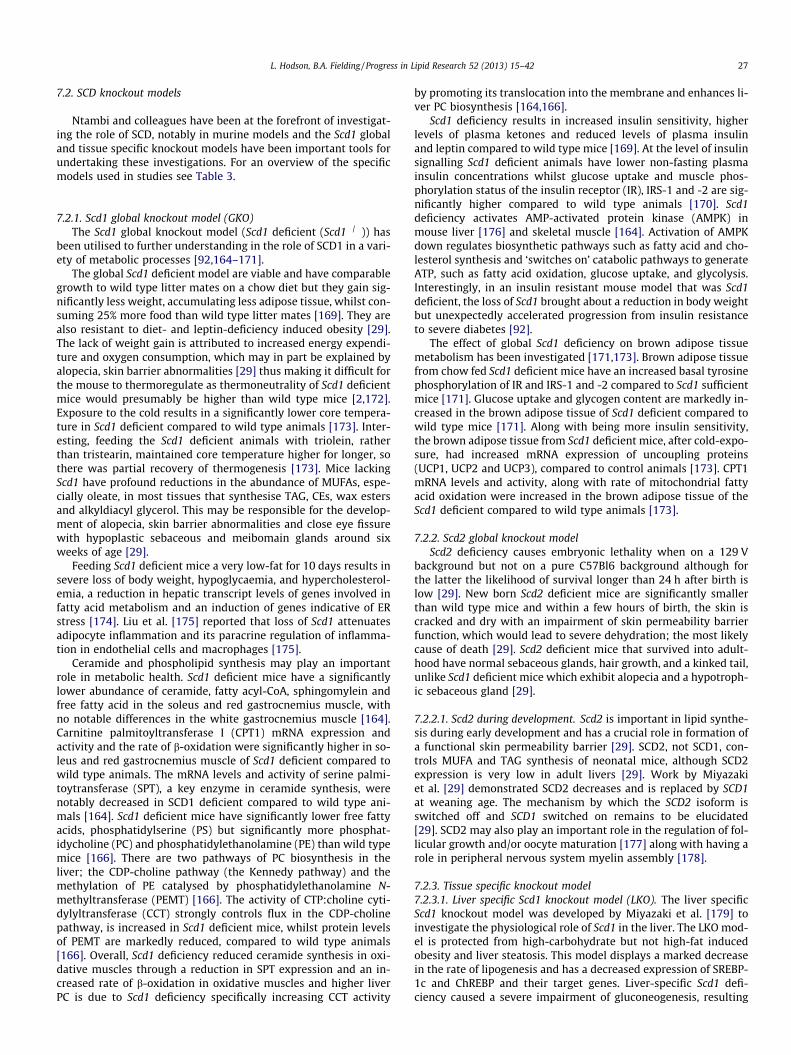
L. Hodson, B.A. Fielding / Progress in Lipid Research 52 (2013) 15–42 27
7.2. SCD knockout models
Ntambi and colleagues have been at the forefront of investigat-ing the role of SCD, notably in murine models and the Scd1 globaland tissue specific knockout models have been important tools forundertaking these investigations. For an overview of the specificmodels used in studies see Table 3.
7.2.1. Scd1 global knockout model (GKO)The Scd1 global knockout model (Scd1 deficient (Scd1�/�)) has
been utilised to further understanding in the role of SCD1 in a vari-ety of metabolic processes [92,164–171].
The global Scd1 deficient model are viable and have comparablegrowth to wild type litter mates on a chow diet but they gain sig-nificantly less weight, accumulating less adipose tissue, whilst con-suming 25% more food than wild type litter mates [169]. They arealso resistant to diet- and leptin-deficiency induced obesity [29].The lack of weight gain is attributed to increased energy expendi-ture and oxygen consumption, which may in part be explained byalopecia, skin barrier abnormalities [29] thus making it difficult forthe mouse to thermoregulate as thermoneutrality of Scd1 deficientmice would presumably be higher than wild type mice [2,172].Exposure to the cold results in a significantly lower core tempera-ture in Scd1 deficient compared to wild type animals [173]. Inter-esting, feeding the Scd1 deficient animals with triolein, ratherthan tristearin, maintained core temperature higher for longer, sothere was partial recovery of thermogenesis [173]. Mice lackingScd1 have profound reductions in the abundance of MUFAs, espe-cially oleate, in most tissues that synthesise TAG, CEs, wax estersand alkyldiacyl glycerol. This may be responsible for the develop-ment of alopecia, skin barrier abnormalities and close eye fissurewith hypoplastic sebaceous and meibomain glands around sixweeks of age [29].
Feeding Scd1 deficient mice a very low-fat for 10 days results insevere loss of body weight, hypoglycaemia, and hypercholesterol-emia, a reduction in hepatic transcript levels of genes involved infatty acid metabolism and an induction of genes indicative of ERstress [174]. Liu et al. [175] reported that loss of Scd1 attenuatesadipocyte inflammation and its paracrine regulation of inflamma-tion in endothelial cells and macrophages [175].
Ceramide and phospholipid synthesis may play an importantrole in metabolic health. Scd1 deficient mice have a significantlylower abundance of ceramide, fatty acyl-CoA, sphingomylein andfree fatty acid in the soleus and red gastrocnemius muscle, withno notable differences in the white gastrocnemius muscle [164].Carnitine palmitoyltransferase I (CPT1) mRNA expression andactivity and the rate of b-oxidation were significantly higher in so-leus and red gastrocnemius muscle of Scd1 deficient compared towild type animals. The mRNA levels and activity of serine palmi-toytransferase (SPT), a key enzyme in ceramide synthesis, werenotably decreased in SCD1 deficient compared to wild type ani-mals [164]. Scd1 deficient mice have significantly lower free fattyacids, phosphatidylserine (PS) but significantly more phosphat-idycholine (PC) and phosphatidylethanolamine (PE) than wild typemice [166]. There are two pathways of PC biosynthesis in theliver; the CDP-choline pathway (the Kennedy pathway) and themethylation of PE catalysed by phosphatidylethanolamine N-methyltransferase (PEMT) [166]. The activity of CTP:choline cyti-dylyltransferase (CCT) strongly controls flux in the CDP-cholinepathway, is increased in Scd1 deficient mice, whilst protein levelsof PEMT are markedly reduced, compared to wild type animals[166]. Overall, Scd1 deficiency reduced ceramide synthesis in oxi-dative muscles through a reduction in SPT expression and an in-creased rate of b-oxidation in oxidative muscles and higher liverPC is due to Scd1 deficiency specifically increasing CCT activity
by promoting its translocation into the membrane and enhances li-ver PC biosynthesis [164,166].
Scd1 deficiency results in increased insulin sensitivity, higherlevels of plasma ketones and reduced levels of plasma insulinand leptin compared to wild type mice [169]. At the level of insulinsignalling Scd1 deficient animals have lower non-fasting plasmainsulin concentrations whilst glucose uptake and muscle phos-phorylation status of the insulin receptor (IR), IRS-1 and -2 are sig-nificantly higher compared to wild type animals [170]. Scd1deficiency activates AMP-activated protein kinase (AMPK) inmouse liver [176] and skeletal muscle [164]. Activation of AMPKdown regulates biosynthetic pathways such as fatty acid and cho-lesterol synthesis and ‘switches on’ catabolic pathways to generateATP, such as fatty acid oxidation, glucose uptake, and glycolysis.Interestingly, in an insulin resistant mouse model that was Scd1deficient, the loss of Scd1 brought about a reduction in body weightbut unexpectedly accelerated progression from insulin resistanceto severe diabetes [92].
The effect of global Scd1 deficiency on brown adipose tissuemetabolism has been investigated [171,173]. Brown adipose tissuefrom chow fed Scd1 deficient mice have an increased basal tyrosinephosphorylation of IR and IRS-1 and -2 compared to Scd1 sufficientmice [171]. Glucose uptake and glycogen content are markedly in-creased in the brown adipose tissue of Scd1 deficient compared towild type mice [171]. Along with being more insulin sensitivity,the brown adipose tissue from Scd1 deficient mice, after cold-expo-sure, had increased mRNA expression of uncoupling proteins(UCP1, UCP2 and UCP3), compared to control animals [173]. CPT1mRNA levels and activity, along with rate of mitochondrial fattyacid oxidation were increased in the brown adipose tissue of theScd1 deficient compared to wild type animals [173].
7.2.2. Scd2 global knockout modelScd2 deficiency causes embryonic lethality when on a 129 V
background but not on a pure C57Bl6 background although forthe latter the likelihood of survival longer than 24 h after birth islow [29]. New born Scd2 deficient mice are significantly smallerthan wild type mice and within a few hours of birth, the skin iscracked and dry with an impairment of skin permeability barrierfunction, which would lead to severe dehydration; the most likelycause of death [29]. Scd2 deficient mice that survived into adult-hood have normal sebaceous glands, hair growth, and a kinked tail,unlike Scd1 deficient mice which exhibit alopecia and a hypotroph-ic sebaceous gland [29].
7.2.2.1. Scd2 during development. Scd2 is important in lipid synthe-sis during early development and has a crucial role in formation ofa functional skin permeability barrier [29]. SCD2, not SCD1, con-trols MUFA and TAG synthesis of neonatal mice, although SCD2expression is very low in adult livers [29]. Work by Miyazakiet al. [29] demonstrated SCD2 decreases and is replaced by SCD1at weaning age. The mechanism by which the SCD2 isoform isswitched off and SCD1 switched on remains to be elucidated[29]. SCD2 may also play an important role in the regulation of fol-licular growth and/or oocyte maturation [177] along with having arole in peripheral nervous system myelin assembly [178].
7.2.3. Tissue specific knockout model7.2.3.1. Liver specific Scd1 knockout model (LKO). The liver specificScd1 knockout model was developed by Miyazaki et al. [179] toinvestigate the physiological role of Scd1 in the liver. The LKO mod-el is protected from high-carbohydrate but not high-fat inducedobesity and liver steatosis. This model displays a marked decreasein the rate of lipogenesis and has a decreased expression of SREBP-1c and ChREBP and their target genes. Liver-specific Scd1 defi-ciency caused a severe impairment of gluconeogenesis, resulting
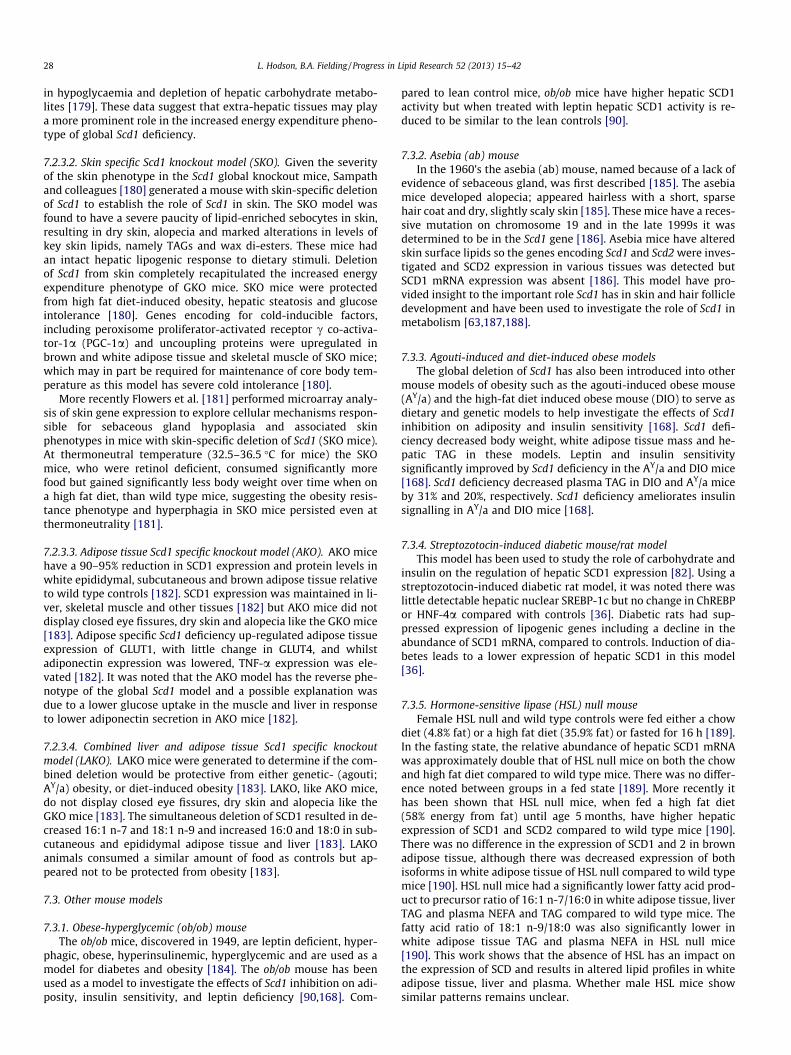
28 L. Hodson, B.A. Fielding / Progress in Lipid Research 52 (2013) 15–42
in hypoglycaemia and depletion of hepatic carbohydrate metabo-lites [179]. These data suggest that extra-hepatic tissues may playa more prominent role in the increased energy expenditure pheno-type of global Scd1 deficiency.
7.2.3.2. Skin specific Scd1 knockout model (SKO). Given the severityof the skin phenotype in the Scd1 global knockout mice, Sampathand colleagues [180] generated a mouse with skin-specific deletionof Scd1 to establish the role of Scd1 in skin. The SKO model wasfound to have a severe paucity of lipid-enriched sebocytes in skin,resulting in dry skin, alopecia and marked alterations in levels ofkey skin lipids, namely TAGs and wax di-esters. These mice hadan intact hepatic lipogenic response to dietary stimuli. Deletionof Scd1 from skin completely recapitulated the increased energyexpenditure phenotype of GKO mice. SKO mice were protectedfrom high fat diet-induced obesity, hepatic steatosis and glucoseintolerance [180]. Genes encoding for cold-inducible factors,including peroxisome proliferator-activated receptor c co-activa-tor-1a (PGC-1a) and uncoupling proteins were upregulated inbrown and white adipose tissue and skeletal muscle of SKO mice;which may in part be required for maintenance of core body tem-perature as this model has severe cold intolerance [180].
More recently Flowers et al. [181] performed microarray analy-sis of skin gene expression to explore cellular mechanisms respon-sible for sebaceous gland hypoplasia and associated skinphenotypes in mice with skin-specific deletion of Scd1 (SKO mice).At thermoneutral temperature (32.5–36.5 �C for mice) the SKOmice, who were retinol deficient, consumed significantly morefood but gained significantly less body weight over time when ona high fat diet, than wild type mice, suggesting the obesity resis-tance phenotype and hyperphagia in SKO mice persisted even atthermoneutrality [181].
7.2.3.3. Adipose tissue Scd1 specific knockout model (AKO). AKO micehave a 90–95% reduction in SCD1 expression and protein levels inwhite epididymal, subcutaneous and brown adipose tissue relativeto wild type controls [182]. SCD1 expression was maintained in li-ver, skeletal muscle and other tissues [182] but AKO mice did notdisplay closed eye fissures, dry skin and alopecia like the GKO mice[183]. Adipose specific Scd1 deficiency up-regulated adipose tissueexpression of GLUT1, with little change in GLUT4, and whilstadiponectin expression was lowered, TNF-a expression was ele-vated [182]. It was noted that the AKO model has the reverse phe-notype of the global Scd1 model and a possible explanation wasdue to a lower glucose uptake in the muscle and liver in responseto lower adiponectin secretion in AKO mice [182].
7.2.3.4. Combined liver and adipose tissue Scd1 specific knockoutmodel (LAKO). LAKO mice were generated to determine if the com-bined deletion would be protective from either genetic- (agouti;AY/a) obesity, or diet-induced obesity [183]. LAKO, like AKO mice,do not display closed eye fissures, dry skin and alopecia like theGKO mice [183]. The simultaneous deletion of SCD1 resulted in de-creased 16:1 n-7 and 18:1 n-9 and increased 16:0 and 18:0 in sub-cutaneous and epididymal adipose tissue and liver [183]. LAKOanimals consumed a similar amount of food as controls but ap-peared not to be protected from obesity [183].
7.3. Other mouse models
7.3.1. Obese-hyperglycemic (ob/ob) mouseThe ob/ob mice, discovered in 1949, are leptin deficient, hyper-
phagic, obese, hyperinsulinemic, hyperglycemic and are used as amodel for diabetes and obesity [184]. The ob/ob mouse has beenused as a model to investigate the effects of Scd1 inhibition on adi-posity, insulin sensitivity, and leptin deficiency [90,168]. Com-
pared to lean control mice, ob/ob mice have higher hepatic SCD1activity but when treated with leptin hepatic SCD1 activity is re-duced to be similar to the lean controls [90].
7.3.2. Asebia (ab) mouseIn the 1960’s the asebia (ab) mouse, named because of a lack of
evidence of sebaceous gland, was first described [185]. The asebiamice developed alopecia; appeared hairless with a short, sparsehair coat and dry, slightly scaly skin [185]. These mice have a reces-sive mutation on chromosome 19 and in the late 1999s it wasdetermined to be in the Scd1 gene [186]. Asebia mice have alteredskin surface lipids so the genes encoding Scd1 and Scd2 were inves-tigated and SCD2 expression in various tissues was detected butSCD1 mRNA expression was absent [186]. This model have pro-vided insight to the important role Scd1 has in skin and hair follicledevelopment and have been used to investigate the role of Scd1 inmetabolism [63,187,188].
7.3.3. Agouti-induced and diet-induced obese modelsThe global deletion of Scd1 has also been introduced into other
mouse models of obesity such as the agouti-induced obese mouse(AY/a) and the high-fat diet induced obese mouse (DIO) to serve asdietary and genetic models to help investigate the effects of Scd1inhibition on adiposity and insulin sensitivity [168]. Scd1 defi-ciency decreased body weight, white adipose tissue mass and he-patic TAG in these models. Leptin and insulin sensitivitysignificantly improved by Scd1 deficiency in the AY/a and DIO mice[168]. Scd1 deficiency decreased plasma TAG in DIO and AY/a miceby 31% and 20%, respectively. Scd1 deficiency ameliorates insulinsignalling in AY/a and DIO mice [168].
7.3.4. Streptozotocin-induced diabetic mouse/rat modelThis model has been used to study the role of carbohydrate and
insulin on the regulation of hepatic SCD1 expression [82]. Using astreptozotocin-induced diabetic rat model, it was noted there waslittle detectable hepatic nuclear SREBP-1c but no change in ChREBPor HNF-4a compared with controls [36]. Diabetic rats had sup-pressed expression of lipogenic genes including a decline in theabundance of SCD1 mRNA, compared to controls. Induction of dia-betes leads to a lower expression of hepatic SCD1 in this model[36].
7.3.5. Hormone-sensitive lipase (HSL) null mouseFemale HSL null and wild type controls were fed either a chow
diet (4.8% fat) or a high fat diet (35.9% fat) or fasted for 16 h [189].In the fasting state, the relative abundance of hepatic SCD1 mRNAwas approximately double that of HSL null mice on both the chowand high fat diet compared to wild type mice. There was no differ-ence noted between groups in a fed state [189]. More recently ithas been shown that HSL null mice, when fed a high fat diet(58% energy from fat) until age 5 months, have higher hepaticexpression of SCD1 and SCD2 compared to wild type mice [190].There was no difference in the expression of SCD1 and 2 in brownadipose tissue, although there was decreased expression of bothisoforms in white adipose tissue of HSL null compared to wild typemice [190]. HSL null mice had a significantly lower fatty acid prod-uct to precursor ratio of 16:1 n-7/16:0 in white adipose tissue, liverTAG and plasma NEFA and TAG compared to wild type mice. Thefatty acid ratio of 18:1 n-9/18:0 was also significantly lower inwhite adipose tissue TAG and plasma NEFA in HSL null mice[190]. This work shows that the absence of HSL has an impact onthe expression of SCD and results in altered lipid profiles in whiteadipose tissue, liver and plasma. Whether male HSL mice showsimilar patterns remains unclear.
L. Hodson, B.A. Fielding / Progress in Lipid Research 52 (2013) 15–42 29
7.3.6. Liver X receptor (LXR) knockout mouseLXR is activated by specific classes of naturally occurring oxi-
dised derivatives of cholesterol [191]. These oxysterols are concen-trated in tissues where cholesterol metabolism and LXR expressionare high (such as liver, brain, and placenta). Two LXR proteins (aand b) are known to exist in mammals and the expression of LXRais higher in liver. To further address the physiological role of LXRaand its potential to regulate cholesterol catabolism, Peet et al.[191] characterised the phenotype of mice harbouring targetednull mutations in LXR genes. Mice lacking the LXRa gene lose thecapacity to regulate the catabolism of dietary cholesterol in the li-ver. The consequence of the loss of LXRa is rapid accumulation ofhepatic CEs that eventually leads to liver failure. In LXRa deficientmice fed a low-cholesterol diet there was an up-regulation of genesinvolved in cholesterol biosynthesis and down-regulation ofSREBP-1c, FAS and, most notably Scd1 [191]. Thus, Scd1 geneexpression is intimately associated with the regulation of choles-terol synthesis.
7.3.7. Fatty acid bind protein (FABP) knockout mouseFABPs are cytosolic fatty acid chaperones that play a critical role
in the systemic regulation of lipid and glucose metabolism. Micedeficient in the fatty acid binding proteins aP2 and mal1 fed witha chow or high-fat diet have lower adiposity, hepatic TAG, and he-patic SCD1 activity than wild type mice [192]. In agreement withthese findings, an ob/ob FABP (aP2 and mal1) deficient mouse mod-el was generated and despite developing obesity, they were pro-tected from insulin resistance and there was a robustsuppression of hepatic SCD1 compared to ob/ob mice [193].
7.3.8. Sterol responsive element binding protein 1c (SREBP-1c)knockout mouse
As discussed in Section 6, the Scd1 gene is regulated at a tran-scriptional level by a number of factors [109]. Feeding fructose, apotent activator of Scd1, to SREBP-1c deficient animals resultedin an induced expression of SCD1 and other lipogeneic genes anda further increase in expression of these genes occurred whenthe fructose diet was supplemented with oleate [109].
7.3.9. TR4. nuclear receptor knockout mouseHepatic TR4 is a member of the nuclear receptor superfamily
and is suggested to be involved in the regulation of lipogenesisand insulin sensitivity [108]. Mice deficient in TR4 have a markedlyreduced hepatic SCD1 expression compared to controls [108].
7.3.10. BTBR mouseThe BTBR mouse strain has excess abdominal obesity associated
with insulin resistance in heart, soleus muscle and adipose tissue.The effect of Scd1 deficiency on insulin action in vivo was assessedin lean BTBR mice [92]. Results showed that loss of Scd1 in BTBRlean mice significantly increased glucose disposal, primarily byincreasing heart, soleus muscle and adipose tissue insulin sensitiv-ity [92].
7.3.11. Leptin receptor-deficient (db/db) mouseThe leptin receptor-deficient mouse is used as a model of obes-
ity, diabetes, and dyslipidemia. This model was used by Kim et al.[108] to confirm findings of hepatic Scd1 induction by TR4. In-creased expression of both TR4 and SCD1 in livers of leptin recep-tor-deficient compared to wild type mice was found [108].
7.3.12. Peroxisome proliferator-activated receptor-a (PPARa) mouseThe peroxisome proliferator-activated receptors (PPARs) are
members of the superfamily of nuclear receptors that consist ofthree isoforms, a, b/d, and c and each isoform has different ligandspecificities and tissue distribution [194]. PPARa deficient mice
have been utilised to investigate the influence of Scd1 on this path-way through the generation of a SCD1;PPARa deficient model[167].
8. Human SCD polymorphisms
SCD1 maps to a region of chromosome 10, which is linked totype 2 diabetes and therefore may influence susceptibility to type2 diabetes and related traits [195,196]. Overall, no association (atallele, genotype or haplotype level) were found between theSCD1 gene and susceptibility to type 2 diabetes [195]. However,Warensjö et al. [196] noted that subjects who were homozygousfor rare alleles of rs10883463, rs7849, rs2167444, rs508374 hada lower BMI and waist circumference and improved insulin sensi-tivity. There were only minor effects of single-nucleotide polymor-phisms (SNPs) on the product to precursor fatty acid ratios inplasma CEs [196]. Taken together it would appear that polymor-phisms in the human SCD1 gene have a very limited influence onobesity and diabetes risk.
9. What is the evidence for SCD and risk of disease?
The expression of SCD could influence membrane fluidity(which may influence cell-cell interaction), lipid metabolism, fattyacid partitioning and potentially adiposity. High SCD1 activity andalterations in the balance between SFA and MUFA are implicated invarious disease states including cancer, heart disease, atherosclero-sis, obesity and insulin resistance. In human studies, fatty acidproduct to precursor ratios, in adipose tissue and various blood li-pid fractions, have been used to investigate the association be-tween SCD1 and risk of a number of diseases. Overall, the data issomewhat conflicting, which may in part be explained by thechoice of lipid fraction that the fatty acid product to precursor ratio(e.g. 16:1 n-7/16:0) has been measured in. For example some stud-ies have assessed the relationship between the 16:1 n-7/16:0 ratioin plasma total fatty acids and adiposity in adults [197] and chil-dren [198] and although a consistent finding is that the 16:1 n-7/16:0 ratio is positively related to abdominal obesity [197,198], asnoted above (Section 3.2) caution is required when interpretingthe data. Here we review the evidence for SCD1 being associatedwith risk of a variety of diseases in cell, animal and human models.
9.1. TAG and lipotoxicity
Elevated non-esterified fatty acids (NEFAs) have been suggestedto contribute to the pathogenesis of metabolic diseases. Ideallystorage of excess fatty acids is in the form of TAG within adiposetissue [199]. Non-adipose tissues such as skeletal muscle cells, car-diac myocytes, b-cells, and hepatocytes have a limited capacity forthe storage of lipid. Inappropriately stored fat in non-adipose tis-sue organs (ectopic fat) can potentially lead to cell dysfunctionand/or cell death, a phenomenon known as lipotoxicity. Saturatedand unsaturated fatty acids have been reported to differ signifi-cantly in their contributions to lipotoxicity in a variety of experi-mental models [112,200–206]. Taken together these data suggestthat lipotoxicity arising from the accumulation of long chain fattyacids is specific to SFAs. It is suggested that cellular TAG accumu-lation itself is not initially toxic. A large number of studies tendto investigate the effect of an individual fatty acid but when a com-bination of a SFA and MUFA are given, the hallmarks of lipotoxicityare not as evident [112]. MUFA compared to SFA promote TAGaccumulation and do not affect cell viability [112]. Listenbergeret al. [203] noted SCD1 activity correlated with TAG storage andsuggested that endogenously synthesised MUFAs promote TAGproduction. They also demonstrated that when SCD1 was overex-

30 L. Hodson, B.A. Fielding / Progress in Lipid Research 52 (2013) 15–42
pressed in cells, the morphological changes associated with celldeath were less evident than in the control cells [203]. A potentialmechanism which may explain, in part, the anti-inflammatory andanti-lipotoxic actions of SCD1 has recently been identified. Leeet al. [207] described the protein UBXD8 as a sensor for unsatu-rated fatty acids and a regulator of TAG synthesis. In cultured cellsdeplete of fatty acids, Ubxd8 inhibited TAG synthesis by blockingconversion of DAGs to TAGs by inhibiting DGAT acitivity. The pres-ence of unsaturated, but not saturated, fatty acids relieved thisinhibition [207]. Thus, if SCD1 were not present to generate MUFAsUbxd8 would inhibit DGAT activity, leading to inhibition of TAGsynthesis and an accumulation of FFAs and DAG which have beenimplicated in lipotoxicity.
9.2. Obesity
9.2.1. Adipose tissueIn 1975 Enser [38] measured the conversion of stearic to oleic
acid using radio-tracer in preparations of adipose tissue from leanand obese (ob/ob) mice. The total desaturase activity was 3-foldhigher in the perigenital adipose from obese compared to leanmice but when expressed per gram of adipose tissue, activitywas 2-fold greater in the tissue from lean compared to obese mice.It is unclear if the higher desaturase activity is due to an increase inthe quantity of the enzyme or a change in the enzymes kineticparameters [38]. Jones et al. [125] compared adipose tissue SCD1expression from lean and obese zucker rats. They noted thatSCD1 mRNA expression was dramatically elevated in abdominaladipose tissue from obese compared to lean rats [125].
In humans, differences in adipose tissue SCD1 activity, in rela-tion to obesity have been assessed using fatty acid product to pre-cursor ratios [79,208], with SCD1 mRNA expression also beingmeasured [79]. Visceral and subcutaneous adipose tissue frommorbidly obese (BMI >50 kg/m2) and overweight controls (BMI27.5 kg/m2) was compared. The adipose tissue 18:1 n-9/18:0 ratiofrom both depots was significantly higher in the morbidly obesecompared to the control group, but there was no difference inthe 16:1 n-7/16:0 ratio between groups or depots [79]. In contrast,SCD1 mRNA expression was significantly higher in both visceraland subcutaneous adipose tissue from controls compared to mor-bidly obese subjects but the latter group had significantly greateradipose tissue SCD1 protein levels than controls [79]. Gong et al.[208] reported both 16:1 n-7/16:0 and 18:1 n-9/18:0 to be signif-icantly higher in the adipose tissue from the buttock of obese com-pared to lean individuals.
9.2.2. LiverEnser [38] measured the conversion of stearic to oleic acid using
radio-tracer in preparations of liver from lean and obese (ob/ob)mice. Hepatic desaturation of stearic acid was greater in obesecompared to lean mice at all ages. Hepatic SCD1 activity in obesemice was elevated at 8 weeks of age and remained high until24 weeks but there was 50% reduction from 24 to 48 weeks [38].
We have assessed the influence of obesity on hepatic desatura-tion using stable-isotope methodologies [209]. Postprandial hepa-tic fatty acid isotopic product to precursor ratio ([2H2]16:1 n-7/[2H2] 16:0) were significantly higher in VLDL-TAG from abdomi-nally-obese compared to lean men over a 24 h period [209].
Plasma CE product to precursor fatty acid ratios have been asso-ciated with markers of adiposity in large cohort of adult Swedishmen and women [95]. In males and females plasma CE 16:1 n-7/16:0 ratio was positively correlated with sagittal abdominal diam-eter (r = 0.24, P < 0.001), BMI (r = 0.24, P < 0.001), and waist girth(r = 0.20, P < 0.001). However, there was no relationship betweenplasma CE 18:1 n-9/18:0 ratio and markers of adiposity [95]. Morerecently Vessby et al. [210] compared the plasma CE 16:1 n-7/16:0
ratio in women from two Amerindian populations (Shuar andLima) and Sweden and found the fatty acid ratio to be positivitycorrelated with BMI in all three groups [210].
Data from the animal and human models demonstrate that agreater adipose tissue mass is associated with an increase inSCD1 activity in adipose tissue and liver, although why this is re-mains unclear. A plausible explanation may be that obese individ-uals tend to have higher plasma insulin concentrations comparedto lean individuals and as discussed in Section 6.1, insulin posi-tively regulates SCD1 activity.
9.3. Liver steatosis
It has been hypothesised that hepatic SCD1 activity may be in-volved in the pathophysiology of fatty liver disease in humans. Inhuman studies, a variety of approaches have been taken to assessthe role of SCD1 in liver fat metabolism with fatty acid ratios beingmeasured in liver tissue [211] or plasma lipids [96,212].
The 18:1 n-9/18:0 ratio of total liver lipids from individualswith and without liver fat was measured by Kotronen et al. andfound to be positively correlated to percentage liver fat (assessedby proton spectroscopy) [211]. Although the authors state thatfatty liver is characterised by an increase in hepatic SCD1 (as as-sessed by 18:1 n-9/18:0), caution needs to be taken in the interpre-tation of these data as total, rather than specific lipid fractionswere assessed. In contrast to the data of Kotronen et al., theVLDL-TAG 18:1 n-9/18:0 ratio was found to be negatively corre-lated with liver fat content after adjustment for sex and visceralfat content [96]. The 18:1 n-9/18:0 ratio was strongly correlatedwith liver fat in obese (r = �0.57, P = 0.004) but not lean subjects[96] which may be due to the smaller range of liver fat in the latter.After a lifestyle intervention, the VLDL-TAG 18:1 n-9/18:0 ratiowas associated with change in liver fat in the obese group [96].The authors suggested that the liver-specific down-regulation ofSCD1 may impair VLDL assembly and subsequently may reducethe capacity for the liver to clear intra-hepatic TAG. Therefore itwas speculated that a high SCD1 activity may protect from hepaticfat accumulation [96]. The role of hepatic SCD1 in prevention of he-patic inflammation, apoptosis and fibrosis in a model of steatosiswas investigated by Li et al. [112] by using an in vitro (murineand human hepatocytes) and in vivo animal model. Their findingssuggest that up-regulation of hepatic SCD1 may be a crucial adap-tive mechanism in the prevention of liver damage and hepatitis inhepatic steatosis [112].
The relationship between serum alanine aminotransferase(ALT), a marker of liver fat content, and the 16:1 n-7/16:0 ratioof serum CEs was assessed in a large cohort of elderly Swedishmales [212]. There was a weak correlation noted between serumALT and the product to precursor fatty acid ratio (r = 0.11,P < 0.0001). The authors concluded that an elevated SCD1 indexmay contribute to a higher ALT level (and potentially liver fat) inelderly men [212]. Interestingly the conclusion from this work isin contrast to that of Stefan et al. [96]. It is yet to be elucidatedwhether a high or low SCD1 activity is beneficial for lowering liverfat accumulation.
9.3.1. HypertriglyceridemiaHypertriglyceridemia is a common lipid disorder in humans and
given that the liver has the ability to synthesize MUFAs, it is notunreasonable to speculate that hepatic SCD1 activity may play animportant role in human TAG metabolism [49,187,213,214]. Anumber of studies have used product to precursor fatty acid ratiosof plasma total lipids to test the hypothesis that SCD1 activity isassociated with plasma TAG concentrations [187,213,214]. Takentogether, results from these studies imply that SCD1 may play animportant role in the development of hypertriglyceridemia. How-
L. Hodson, B.A. Fielding / Progress in Lipid Research 52 (2013) 15–42 31
ever, caution needs to be made when interrupting these results. Allof these studies measured the fatty acid product to precursor ratiosin plasma total lipids, and as mentioned above this may lead toerroneous results due to the fact that a total lipid fraction containsa mixture of different lipid fractions [43]. A better measure wouldbe fatty acid product to precursor ratios in VLDL-TAG which hasbeen shown to reflect hepatic SCD mRNA expression (seeSection 3.2).
9.4. Muscle
Unlike the liver, where blood lipid proxy markers can be used toassess SCD1 activity (Table 2) there are currently no surrogatemarkers available of to assess SCD1 activity in muscle thereforemeasures have been made either directly on muscle biopsies oron primary myocytes obtained from different phenotypes.
The molecular mechanisms that implicates SCD1 in the aetiol-ogy of fatty acid induced insulin resistance were assessed in an ani-mal model fed either a chow or high fat diet and also a geneticallyobese rodent model [215]. L6 skeletal muscle myotubes were har-vested from animals and SCD1 protein was transiently decreasedor increased using interfering (si)RNA or liposome-mediated trans-fection. Reducing SCD1 protein did not alter fatty acid oxidation oresterification into TAG but there was a 2-fold increase in the incor-poration of palmitate into DAG compared to native L6 and controltreated cells. In contrast, overexpression of SCD1 resulted in a sig-nificant increase in fatty acid esterification into TAG, with de-creases in fatty acid oxidation and accumulation of lipidmetabolites such as ceramides [215]. The authors suggested theirdata indicate that SCD1 protects muscle cells from fatty acid in-duced insulin resistance by reducing ceramide and DAG accumula-tion [215].
The role of SCD1 in the partitioning of excess fatty acids towardintramyocellular TAG (IMTAG) in skeletal muscle during acute andchronic exercise has been investigated in human and animal mod-els. Work by Schenk and Horowitz [216] demonstrated that under-taking an acute bout of exercise (1 h running on a treadmill) priorto being challenged with a lipid infusion was sufficient to increaseTAG synthesis and prevent fatty acid-induced insulin resistance.These changes were characterised by increased SCD1 expressionand concomitantly reduced DAG and ceramide production [216].Dobrzyn et al. [217] investigated the effects of chronic exercisein an animal model. SCD1 mRNA, protein levels and the 18:1 n-9/18:0 ratio of total muscle lipid significantly increased in onlythe soleus muscle of exercised trained animals. There was also aconcomitant increase in the expression of oxidative genes, in thesoleus. On the basis of these observations the authors suggestthe SCD1 overexpression is required for muscle TAG synthesis in-duced by endurance training and plays an important role in adap-tation of oxidative muscle to long-term exercise [217]. A similarobservation in humans has also been made. Bergman et al. [218]observed that endurance-trained male cyclists have a significantlygreater skeletal muscle IMTAG and SCD1 mRNA expression andprotein content than control subjects, suggesting that high muscleSCD1 activity is advantageous. Whether this observation translatesto risk of metabolic disease, such as insulin resistance, with a sed-entary lifestyle is yet to be elucidated.
Paradoxically, obesity and aerobic fitness are important deter-minants of IMTAG, although IMTAG and insulin sensitivity are neg-atively correlated in untrained individuals [219]. Thamer et al.[219] elegantly demonstrated, in a large heterogeneous cohort ofhealthy, nondiabetic subjects that percentage body fat and VO2
max were independent determinants of IMTAG in the tibialis ante-rior but not IMTAG in the soleus. Hulver et al. [220] also noted anassociation between IMTAG and obesity and type 2 diabetes in hu-mans, although the underlying cause of the perturbation remains
unclear. The role of SCD1 in skeletal muscle lipid metabolismwas investigated by transcriptional profiling of muscle (rectusabdominus) from lean (mean BMI 24) and obese-non-diabetic(mean BMI 58) individuals [221]. There was a robust, 3-fold, in-crease in transcript levels of SCD1 in skeletal muscle from obesecompared to lean subjects. Muscle SCD1 mRNA expression waspositively correlated with BMI, rate of IMTAG synthesis, and nega-tively with fatty acid oxidation [221]. Fatty acid oxidation wasfound to be notably lower whilst fatty acid incorporation intoTAG, SCD1 mRNA and protein levels were higher in primary humanskeletal myocytes from obese compared to lean donors [221].Overexpressing SCD1 in primary myocytes from lean subjectsand incubating in oleate resulted in a decrease in fatty acid oxida-tion and increased incorporation into TAG; suggesting SCD1 repar-titioned fatty acids toward esterification and away from oxidation[221]. The authors of this work proposed that elevated expressionof SCD1 in skeletal muscle may represent a core mechanism con-tributing to reduced fatty acid oxidation, increased IMTAG synthe-sis and progression of metabolic syndrome [221]. To further testthis hypothesis, skeletal muscle SCD1 would need to be repressedto determine if insulin sensitivity is improved and skeletal musclefatty acid partitioning altered. Using primary human myotubescollected from 39 metabolically characterised individuals, Peteret al. [222] examined whether individual differences in the regula-tion of SCD1 expression by palmitate exist. They found that SCD1mRNA expression and inducibility by palmitate in cultured myotu-bes showed broad inter-individual variation and high SCD1 induc-ibility was associated with low inflammatory and ER stressresponse to palmitate [222]. Palmitate stimulated SCD1 mRNAexpression and inducibility were positively correlated with theintramyocelluar lipid content of the donor and their insulin sensi-tivity (r = 0.54, P = 0.003 and r = 0.38, P = 0.047, respectively) [222].The authors concluded that myocellular SCD1 inducibility by pal-mitate is an individual characteristic that modulates lipid storage,palmitate-induced inflammation, ER stress, and insulin resistance[222].
9.5. Heart
Four isoforms of Scd are expressed and regulated in a hormone-dependent fashion in the heart of mice [32]. Lipogenesis is de-creased in the heart of Scd1 deficient mice and is accompaniedby a reduction in intracellular fatty acid and TAG content. Heartmicrosome SCD1 activity is also significantly decreased in leptindeficient ob/ob mice, which is characterised by pathological leftventricular hypertrophy along with elevated TAG content and in-creased myocyte apoptosis [223]. The mRNA expression of SCD1and SCD4 was measured and there was significantly greaterexpression of SCD4 in ob/ob models compared to wild type withSCD1 expression similar in ob/ob and wild type animals. Scd1 defi-ciency decreased apoptosis in the heart of the ob/ob mice [223]. Inthe ob/ob model Scd1 deficiency resulted in a reduction in myocar-dial lipid accumulation and inhibition of apoptosis which appearedto the main mechanisms responsible for improved left ventriclefunction in ob/ob mice [223].
The hypothesis that cardiac substrate utilisation is affected byoleic acid originating from both endogenous conversion of stearateand the diet was tested in a rat model [115]. Rats were fed a 20%(by weight) tristearin or triolein diet which lead to higher levelsof heart TAG in the triolein compared to tristearin group. SCD1mRNA levels in the heart were significantly elevated in the tristea-rin group but there was no difference between controls and the tri-olein group. Cardiac fatty acid metabolism was assessed and it wasfound that both dietary and de novo oleate affected cardiac metab-olism by shifting substrate utilisation toward fatty acid uptake andoxidation and away from glucose utilisation.

32 L. Hodson, B.A. Fielding / Progress in Lipid Research 52 (2013) 15–42
The presence and beneficial role of SCD1 expression in primaryhuman arterial endothelial cells (HAECs) has been demonstrated[224]. Human SCD1 is not up-regulated in HAECs upon palmitatetreatment however treatment with the LXR activator TO-901317upregulated human SCD1 and protected the cells against palmitateinduced cytotoxicity [224]. In this model, up-regulation of humanSCD1 leads to desaturation of SFAs and facilitates their esterifica-tion and storage thus preventing downstream effects of lipotoxic-ity [224].
The role of SCD1 in human heart function and heart health hasnot been investigated directly, rather the product to precursor fattyacid ratios in plasma CEs and the risk of cardiovascular disease(CVD) has been explored. The fatty acid composition of plasmaCEs in just over 2000 individuals from the Uppsala LongitudinalStudy of Adult Men (ULSAM) study was measured in relation toCVD and total mortality [225]. There was an increased risk ofCVD mortality and total mortality with an increased plasma CE16:1 n-7/16:0 ratio [225]. The authors suggested that fatty aciddesaturation is associated with and may contribute to mortality.
9.6. The pancreas
The adaptive mechanisms by which b-cells might protect them-selves against lipoapoptosis was investigated by selecting cellsfrom the murine b-cell line MIN6 that were resistant to palmi-tate-induced apoptosis and comparing these with non-resistantMIN6 cells [226]. After treatment with palmitate in both the resis-tant and non-resistant cells there was increased expression ofSCD1 but this was more marked in palmitate-resistant cells[226]. After palmitate treatment there was an increase in the pro-portion of 16:1 n-7 in total lipids, but only the palmitate resistantcells showed an increase in 18:1 n-9 and 18:1 n-7. The authorsconcluded that desaturation per se is more important in protectingb-cells from cytotoxic effects of palmitate than is the nature ofneutral lipid storage pool generated [226].
Knocking down SCD in MIN6 cells and culturing in palmitate for48 h resulted in higher levels of ER stress markers and apoptosis inSCD1 knockdown compared to control cells, but there were no dif-ferences in fatty acid oxidation or insulin release [227].
The fatty acid composition of pancreatic, hepatic and visceral fatof mice fed a high linoleate diet (40% by weight) was compared to acontrol diet (5% fat by weight). Control NMRI white mice had ahigher product to precursor 16:1 n-7/16:0 ratio in adipose tissueand pancreatic fat than liver TAG. The adipose tissue in C57BL/6mice on the high fat diet had significantly reduced ratios of 16:1n-7/16:0 and 18:1 n-9/16:0 compared to C57BL/6 controls,although this was not evident in the liver or pancreas fat depots[3].
An interesting observation has been that humans who had morethan 5% pancreatic fat (indication of overall obesity) had higherpancreatic fat 16:1 n-7/16:0 and 18:1 n-9/18:0 ratios, comparedto people with less than 5% pancreatic fat [3].
9.6.1. SCD and insulin resistanceA number of studies have investigated the association between
insulin resistance and fatty acid product to precursor ratios in adi-pose tissue and various plasma lipid fractions, although the non-tissue specific plasma CE fraction has been most often measured[95,96,210,225,228–232] (Table 4).
The relationship between insulin resistance and product to pre-cursor fatty acid ratios in subcutaneous adipose tissue from thebuttock [229] and abdomen [228] have been investigated. Bothstudies found strong positive correlations between adipose tissue18:1 n-9/18:0 ratio and insulin resistance, but no relationship forthe 16:1 n-7/16:0 ratio [228,229] (Table 4).
By measuring product to precursor fatty acid ratios in plasmaCEs in men (ULSAM study) at the age of 50 years and again at70 years with and without metabolic syndrome, Warensjö et al.[230,231] reported that men with the metabolic syndrome had ahigher 16:1 n-7/16:0 ratio. Additionally, having a high 16:1 n-7/16:0 ratio at the age of 50 years was predictive of having metabolicsyndrome at 70 years [230,231]. The association of the 16:1 n-7/16:0 and 18:1 n-9/18:0 ratio in adipose tissue TAG, plasma PLsand FFA fractions and HOMA-IR have been assessed and the resultsare variable and weak [233] (Table 4). In contrast to this, VLDL-TAG16:1 n-7/16:0 ratio was positively correlated with insulin sensitiv-ity. When adjusted for sex and body fat, the association betweenVLDL-TAG 16:1 n-7/16:0 and insulin sensitivity was diminishedin lean subjects but was notably stronger in obese individual[96]. The reasons for these divergent results may be because ofthe different plasma lipid fractions analysed.
Improving insulin sensitivity through lifestyle intervention wasrelated to a decrease in the plasma CE 16:1 n-7/16:0 ratio. Regres-sion analysis suggested that changes in the 16:1 n-7/16:0 ratiocontributed significantly to HOMA-IR in subjects with a total fat in-take <35.5% total energy, this association was not noted in subjectswith a higher fat intake [232].
Vessby et al. [210] measured plasma CE 16:1 n-7/16:0 ratio inwomen from two Amerindian populations (Shuar and Lima) anda Swedish cohort. The plasma CE 16:1 n-7/16:0 ratio was positivelycorrelated with HOMA-IR in the Lima and Swedish women, but notthe Shuar women who had the highest 16:1 n-7/16:0 ratio (0.44and 0.32 vs 0.92, respectively) [210]. Interestingly, Shuar womenhad similar HOMA-IR and BMI values to the Swedish women butthey had a lower percentage body fat compared to Lima women,a variable not analysed in the Swedish women. The diets of theShuar women had a very low fat content and high proportion ofnon-refined carbohydrates compared to other groups, which mayexplain the markedly higher fatty acid ratio.
9.7. Inflammation
Fatty acid composition may be a contributing factor to low-grade inflammation [234,235]. The longitudinal ULSAM studyexamined the association between the 16:1 n-7/16:0 ratio in plas-ma CE and a marker of systemic inflammation, C-reactive protein(CRP) [236]. The 16:1 n-7/16:0 ratio in plasma CE was positivelyassociated with plasma CRP concentrations and in multivariateanalysis it was found the ratio was a significant predictor of CRPconcentrations 20 years later, independent of obesity and insulinresistance [236]. A further study by Petersson et al. [237] investi-gated the association between the 16:1 n-7/16:0 ratio in plasmaCE and markers of inflammatory and endothelial function in a co-hort of elderly men and women. In multivariate analysis the plas-ma CE 16:1 n-7/16:0 ratio was associated with plasma CRPconcentrations but not to other markers of inflammation or endo-thelial function. The authors commented that the positive relation-ship between 16:1 n-7/16:0 and CRP indicates the involvement ofendogenous fatty acid metabolism in low-grade inflammation[237]. An alternative explanation may be that systemic inflamma-tion results in SCD1 up-regulation. Recently, evidence from animalstudies indicating a relationship between SCD1 and inflammationhas been reviewed [2].
9.8. Bone health
The relationship between SCD1 activity, as determined by the16:1 n-7/16:0 in plasma CE, and the risk of fracture was investi-gated in the ULSAM study [238]. Over a 20 years follow-up periodit was found the relative risk of fracture was associated with an in-creased 16:1 n-7/16:0 ratio. In a sub-group of men re-examined at

Table 4Overview of studies that have correlated fatty acid product to precursor ratios (as a marker of SCD1 activity) with anthropometric and biochemical variables.
Author Subjects Country (Age(years))
Lipidfraction
Product toprecursor ratio
Variable
BMI Waist HDL pTAG HOMA-IR
HOMA-IS
pLeptin pALT pCRP
Sjögren et al. [229] n = 294 Swedish AT-B 16:1 n-7/16:0 NSM 62–64 years 18:1 n-9/18:0 0.27c
Warensjo et al. [233] n = 301 Swedish AT-B 16:1 n-7/16:0 0.17b NSM 25.9 years 18:1 n-9/18:0 0.35c 0.24c
Roberts et al. [228] n = 59 UK AT-A 16:1 n-7/16:0 NS NSM&F 19–58 years 18:1 n-9/18:0 0.40b �0.51b
Paillard et al. [197] n = 134 French pTotal 16:1 n-7/16:0 0.33c
M 28–70 years
Shiwaku et al. [214] n = 411 Japanese pTotal 18:1 n-9/18:0M&F 30–60 years M 0.67c
F 0.55c
Shiwaku et al. [214] n = 418 Korean pTotal 18:1 n-9/18:0M&F 30–60 years M 0.49c
F 0.11
Shiwaku et al. [214] n = 251 Mongolian pTotal 18:1 n-9/18:0M&F 30–60 years M 0.36c
F 0.50c
Attie et al. [187] n = 175 pTotal 16:1 n-7/16:0 NS 0.10c,*
M&F 18:1 n-9/18:0 0.17c,* 0.53c,*
Okada et al. [198] n = 59 Japan pTotal 16:1 n-7/16:0 NS 0.29a
M&F 11.8 years
Warensjo et al. [95] n = 849 Swedish pCE 16:1 n-7/16:0 0.24c 0.20c
M&F 18:1 n-9/18:0 NS NS
Vessby et al. [210] n = 59 Shur pCE 16:1 n-7/16:0 0.28a NS 0.31a
F 35.7 years
Vessby et al. [210] n = 141 Lima pCE 16:1 n-7/16:0 0.28c 0.30c 0.36c
F 40 years
Vessby et al. [210] n = 295 Swedish pCE 16:1 n-7/16:0 0.27c 0.22c
F 40.6 years
Petersson et al. [212] n = 546 Swedish pCE 16:1 n-7/16:0 0.10c,�
M 71.3 years
Petersson et al. [236] n = 767 Swedish pCE 16:1 n-7/16:0 0.13c
M
Petersson et al. [237] n = 264 Swedish pCE 16:1 n-7/16:0 0.22c
M&F
Warensjo et al. [233] n = 301 Swedish pPL 16:1 n-7/16:0 0.15b NSM 18:1 n-9/18:0 �0.31c �0.41c
Warensjo et al. [233] n = 301 pFFA 16:1 n-7/16:0 NS �0.16b
Abbreviations: M, males; F, females; BMI, Body Mass Index (kg/m2); waist, waist circumference (cm); HDL, plasma high densitly lipoprotein cholesterol; pTAG, plasmatriacylgycerol; HOMA-IR, homeostatic model assessment-insulin resistance; HOMA-IS, homeostatic model assessment-insulin sensitivity; pLeptin, plasma leptin; pALT,plasma alanine transaminase; pCRP, plasma C-reactive protein; AT-B, adipose tissue from buttock; AT-A, subcuteanous abdominal adipose tissue; pTotal, plasma total fattyacids; pCE, plasma cholesteryl ester; pPL, plasma phospholipid; pFFA, plasma free fatty acids.Age is shown as range or mean as reported by the paper.NS = not significant.
a P < 0.05 indicates statistical significance as reported by the paper.b P < 0.01 indicates statistical significance as reported by the paper.c P < 0.001 indicates statistical significance as reported by the paper.
�> <Indciates data reported as a b regression coefficient.* Indicates data reported as r2 value.
L. Hodson, B.A. Fielding / Progress in Lipid Research 52 (2013) 15–42 33
age 70 years, a significant relationship between change in the SCD1desaturation index and fracture risk was noted [238]. The authorssuggest that high SCD1 activity, which indicates an elevation inendogenous lipogenesis, substantially increases the risk of fracture.Animal work has shown that the PPARc pathway, which is thedominant regulator of adipogenesis, inhibits osteoblast differentia-tion [239], and that leptin, an anorexigenic metabolic hormonethat is secreted in proportion to fat mass, is a regulator of bothbone formation and resorption [240,241]. Although this is an inter-esting concept, the mechanism by which SCD1 relates to bonehealth in humans is yet to be elucidated.
9.9. Cancer
Fatty acid biosynthetic and desaturation pathways have beenimplicated as a requirement for tumour cell survival [242–245].The metabolic requirements of the different stages of the cell cyclemay be an important determinant of SCD1 activity [242,245].These pathways are upregulated in cancer, as reviewed by Igal[242], in order to ensure a supply of PL for cell proliferation. Thereis a high de novo formation of SFAs in cancer cells, produced byconstitutively overexpressed FAS, and these fatty acids are themain substrate for SCD1 [242]. Up-regulation of SCD1 gene expres-

34 L. Hodson, B.A. Fielding / Progress in Lipid Research 52 (2013) 15–42
sion or activity seems particularly important for cell growth,whereas the presence of exogenous MUFAs for cell growth remainsunclear [246,247]. It has been suggested that exogenous andendogenous MUFAs enter separate metabolic compartments andmay have different intracellular regulatory roles [248]. SCD1 geneexpression and activity have been positively associated with can-cer progression [249,250], although this may not be the case forall tumour types [251]. It has been suggested that SCD1 activitymay be essential only in highly mitogenic cells [242]. Additionally,there is some evidence to suggest that decreased SCD1 activity (asassessed by blood lipid or red blood cell fatty acid product to pre-cursor ratios) may be related to a decreased risk of breast cancer inpremenopausal women [252–255]. Validation of blood lipid fattyacid product to precursor ratios as markers of SCD1 activity withintumour cells to assess cancer risk has yet to be undertaken.
Genetic and pharmacological ablation of SCD1 severely impairsthe ability of cancer cells to proliferate, as discussed by Hess et al.[247,256]. Their work showed that SCD1 controls the rate of cancercell mitogenesis by modulating cell cycle progression [247]. Addi-tionally, inhibition of SCD1 on cancer cell proliferation appears notto be cancer cell-type specific with the antigrowth effect of SCD1depletion being observed in a variety of neoplastic cells [242]whereas suppression of SCD1 maybe cancer cell-type specific. Inhi-bition of de novo MUFA synthesis, by SCD1 extinction induced theunfolded protein response (UPR) and cell death in cancer cellsthrough activation of the proapoptotic protein CHOP (CCAAT/-en-hancer-binding protein homologous protein) activation [257]. Oth-ers have reported inhibition of SCD1 increases basal apoptosis andsensitises cancer cells to the cytotoxic effects of SFAs [245] althoughpharmacological inhibition of SCD1 inactivates ACC activity, via theactivation of AMPK, leading to decreased cell proliferation [258].
As discussed in Section 6.4.5, the addition of CLA to in vitro andanimal models supresses SCD1 activity and expression but expo-sure of two breast cancer cell lines, MDA-MB-231 and MCF-7 toc9,t11 and t10,c12 CLA isomers produced a divergence in response[259]. Treatment of the cells lines with either isomer did not re-press SCD1 mRNA expression however c9,t11 and t10,c12 signifi-cantly decreased SCD1 protein levels and SCD1 activity in MDA-MB-231 cell. In MCF-7 cells, both isomers did not affect proteinlevels, but inhibited SCD1 activity [259].
It is apparent that up-regulation of SCD1 activity and/or expres-sion is crucial for cancer cell development and may be an impor-tant target for novel pharmacological approaches in cancerinterventions [242].
10. Pharmacology
Specific inhibitors of SCD1 exist but side effects such as alopeciaare problematic [260] which has led to the development of liver-target drugs [261]. However, effects on inflammation, as recentlyreviewed [2], whether systemic or in specific organ systems maynot be desirable for the treatment of the complications of obesity.The thiazoladinedione class of drugs activate PPARc and increasefatty acid desaturation [262] through activation of SCD1 and areassociated with increased insulin sensitivity. In addition, fibrates(PPARa agonists) are associated with reduced fatty acid synthesishave also been found to upregulate SCD1 and pharmacologicalinhibition of SCD1 for the treatment of cancer (because of the highdemand for lipids in proliferating cells as discussed above), is alsounder investigation.
10.1. Pharmacological drugs/agents
Clofibrate markedly increases the activity of hepatic SCD1 witha concomitant increase in hepatic unsaturated fatty acids in rats
[263]. Clofibrate and gemfibrozil administered to mice induced li-ver SCD1 mRNA levels 3-fold within 6 h to a maximum of 22-foldin 30 h. The induction was primarily due to an increase in tran-scription of SCD1 gene [264]. The effect was independent of PUFAs[264]. More recently, Oosterveer et al. [265] treated male micewith fenofibrate and found the hepatic desaturation index for16:0 and 18:0 and SCD1 gene expression both increased aftertwo weeks treatment. This was accompanied by an increase in he-patic TAG content and plasma 3-hydroxybutyrate concentrations[265]. Taken together these data indicate that treatment withfenofibrate (in a murine model) increases lipogenesis and desatu-ration whilst simultaneously inducing fatty acid b-oxidation. How-ever, fenofibrate treatment inhibited the development of non-alcoholic steatohepatitis (NASH) in a high-fat fed APOE knock-inmice model [266].
There is quite strong evidence that thiazolidinediones upregu-late SCD1. Riserus et al. [262] found that rosiglitazone treatmentincreased adipose tissue SCD1 gene expression in patients withtype 2 diabetes, with an increase in the 16:1 n-7/16:0 ratio in plas-ma TAG. In addition, a patient with a dominant-negative P467LPPARc mutation was found to have a low 16:1 n-7/16:0 ratio inthe plasma TAG pool that increased by over 50-fold after rosiglitaz-one treatment. The restored SCD1 activity index after rosiglitazonein the P467L PPARc mutation supports pivotal role of PPARc inSCD1 regulation.
Increased scd1 gene expression in liver, adipose tissue and skel-etal muscle has been reported in mice fed a high-fat diet, treatedwith rosiglitazone [267]. This was accompanied by a marked in-crease in the MUFA content of liver but not adipose tissue.
10.2. Inhibitors
AMPK functions as a sensor of cellular energy, which can beactivated by the antidiabetes drug metformin [268]. Recently ithas been demonstrated that metformin suppresses SCD1 expres-sion [108]. Antisense oligonucleotide inhibitors (ASOs) of SCD1were used by Jiang et al. [269] to investigate inhibition of SCD1in the absence of alopaecia. ASO treatment lead to decreasedexpression of lipogenic genes, de novo fatty acid synthesis and he-patic steatosis with lower 16:1 n-7/16:0 and 18:1 n-9/18:0 ratiosin the liver. Gutierrez-Juarez et al. [270] also administered ASOsof SCD1 to rats given a high-lard diet in order to target reduce he-patic SCD1 expression. Scd1 deficiency moderately decreasedexpression of lipogenic genes in the liver and increased insulin sen-sitivity but hepatic TAG content was higher. Inhibiting Scd1, usingASOs in a mouse model of hyperlipidemia and atherosclerosis(LDLr�/�Apob100/100) resulted in unexpected promotion of aorticatherosclerosis, which was not reversed by dietary oleate [271].Additionally, Scd1 inhibition promoted accumulation of SFAs inplasma and tissue, reduced plasma TAG concentrations, and pro-moted marked hypersensitivity to toll-like receptor 4 (TLR4) ago-nists [271]. These data argue against the safe inhibition of SCD1as a therapeutic target for lowering the risk of metabolic-associ-ated disease. Overall the evidence for inhibiting SCD1 is not cleardue to a limited number of studies and the different models inwhich these have been undertaken. Whether SCD1 inhibition inhumans would have beneficial or detrimental effects remains tobe elucidated.
11. Palmitoleic acid (16:1 n-7)
Of all the products of SCD action, we feel that palmitoleic acid(16:1 n-7), the 2nd most abundant MUFA in human adipose tissue(7.2%, [43] and Table 1), is worth a special mention because it hasrecently been described as a beneficial ‘lipokine’ [1]. The dietary in-
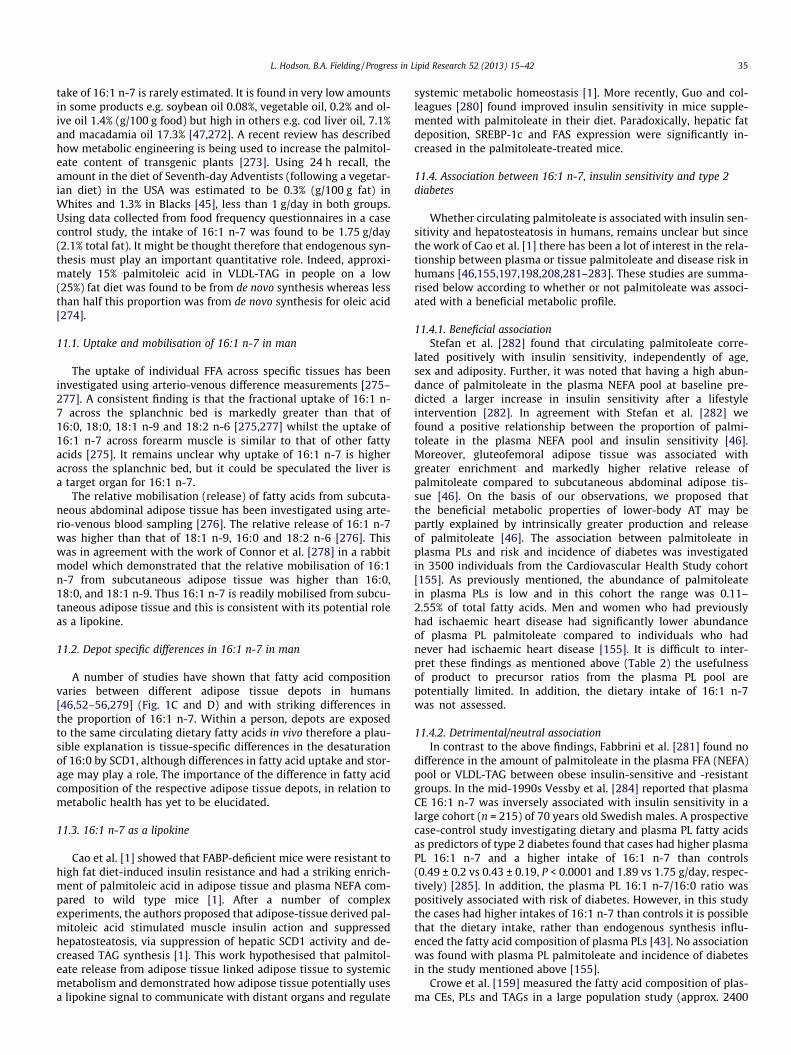
L. Hodson, B.A. Fielding / Progress in Lipid Research 52 (2013) 15–42 35
take of 16:1 n-7 is rarely estimated. It is found in very low amountsin some products e.g. soybean oil 0.08%, vegetable oil, 0.2% and ol-ive oil 1.4% (g/100 g food) but high in others e.g. cod liver oil, 7.1%and macadamia oil 17.3% [47,272]. A recent review has describedhow metabolic engineering is being used to increase the palmitol-eate content of transgenic plants [273]. Using 24 h recall, theamount in the diet of Seventh-day Adventists (following a vegetar-ian diet) in the USA was estimated to be 0.3% (g/100 g fat) inWhites and 1.3% in Blacks [45], less than 1 g/day in both groups.Using data collected from food frequency questionnaires in a casecontrol study, the intake of 16:1 n-7 was found to be 1.75 g/day(2.1% total fat). It might be thought therefore that endogenous syn-thesis must play an important quantitative role. Indeed, approxi-mately 15% palmitoleic acid in VLDL-TAG in people on a low(25%) fat diet was found to be from de novo synthesis whereas lessthan half this proportion was from de novo synthesis for oleic acid[274].
11.1. Uptake and mobilisation of 16:1 n-7 in man
The uptake of individual FFA across specific tissues has beeninvestigated using arterio-venous difference measurements [275–277]. A consistent finding is that the fractional uptake of 16:1 n-7 across the splanchnic bed is markedly greater than that of16:0, 18:0, 18:1 n-9 and 18:2 n-6 [275,277] whilst the uptake of16:1 n-7 across forearm muscle is similar to that of other fattyacids [275]. It remains unclear why uptake of 16:1 n-7 is higheracross the splanchnic bed, but it could be speculated the liver isa target organ for 16:1 n-7.
The relative mobilisation (release) of fatty acids from subcuta-neous abdominal adipose tissue has been investigated using arte-rio-venous blood sampling [276]. The relative release of 16:1 n-7was higher than that of 18:1 n-9, 16:0 and 18:2 n-6 [276]. Thiswas in agreement with the work of Connor et al. [278] in a rabbitmodel which demonstrated that the relative mobilisation of 16:1n-7 from subcutaneous adipose tissue was higher than 16:0,18:0, and 18:1 n-9. Thus 16:1 n-7 is readily mobilised from subcu-taneous adipose tissue and this is consistent with its potential roleas a lipokine.
11.2. Depot specific differences in 16:1 n-7 in man
A number of studies have shown that fatty acid compositionvaries between different adipose tissue depots in humans[46,52–56,279] (Fig. 1C and D) and with striking differences inthe proportion of 16:1 n-7. Within a person, depots are exposedto the same circulating dietary fatty acids in vivo therefore a plau-sible explanation is tissue-specific differences in the desaturationof 16:0 by SCD1, although differences in fatty acid uptake and stor-age may play a role. The importance of the difference in fatty acidcomposition of the respective adipose tissue depots, in relation tometabolic health has yet to be elucidated.
11.3. 16:1 n-7 as a lipokine
Cao et al. [1] showed that FABP-deficient mice were resistant tohigh fat diet-induced insulin resistance and had a striking enrich-ment of palmitoleic acid in adipose tissue and plasma NEFA com-pared to wild type mice [1]. After a number of complexexperiments, the authors proposed that adipose-tissue derived pal-mitoleic acid stimulated muscle insulin action and suppressedhepatosteatosis, via suppression of hepatic SCD1 activity and de-creased TAG synthesis [1]. This work hypothesised that palmitol-eate release from adipose tissue linked adipose tissue to systemicmetabolism and demonstrated how adipose tissue potentially usesa lipokine signal to communicate with distant organs and regulate
systemic metabolic homeostasis [1]. More recently, Guo and col-leagues [280] found improved insulin sensitivity in mice supple-mented with palmitoleate in their diet. Paradoxically, hepatic fatdeposition, SREBP-1c and FAS expression were significantly in-creased in the palmitoleate-treated mice.
11.4. Association between 16:1 n-7, insulin sensitivity and type 2diabetes
Whether circulating palmitoleate is associated with insulin sen-sitivity and hepatosteatosis in humans, remains unclear but sincethe work of Cao et al. [1] there has been a lot of interest in the rela-tionship between plasma or tissue palmitoleate and disease risk inhumans [46,155,197,198,208,281–283]. These studies are summa-rised below according to whether or not palmitoleate was associ-ated with a beneficial metabolic profile.
11.4.1. Beneficial associationStefan et al. [282] found that circulating palmitoleate corre-
lated positively with insulin sensitivity, independently of age,sex and adiposity. Further, it was noted that having a high abun-dance of palmitoleate in the plasma NEFA pool at baseline pre-dicted a larger increase in insulin sensitivity after a lifestyleintervention [282]. In agreement with Stefan et al. [282] wefound a positive relationship between the proportion of palmi-toleate in the plasma NEFA pool and insulin sensitivity [46].Moreover, gluteofemoral adipose tissue was associated withgreater enrichment and markedly higher relative release ofpalmitoleate compared to subcutaneous abdominal adipose tis-sue [46]. On the basis of our observations, we proposed thatthe beneficial metabolic properties of lower-body AT may bepartly explained by intrinsically greater production and releaseof palmitoleate [46]. The association between palmitoleate inplasma PLs and risk and incidence of diabetes was investigatedin 3500 individuals from the Cardiovascular Health Study cohort[155]. As previously mentioned, the abundance of palmitoleatein plasma PLs is low and in this cohort the range was 0.11–2.55% of total fatty acids. Men and women who had previouslyhad ischaemic heart disease had significantly lower abundanceof plasma PL palmitoleate compared to individuals who hadnever had ischaemic heart disease [155]. It is difficult to inter-pret these findings as mentioned above (Table 2) the usefulnessof product to precursor ratios from the plasma PL pool arepotentially limited. In addition, the dietary intake of 16:1 n-7was not assessed.
11.4.2. Detrimental/neutral associationIn contrast to the above findings, Fabbrini et al. [281] found no
difference in the amount of palmitoleate in the plasma FFA (NEFA)pool or VLDL-TAG between obese insulin-sensitive and -resistantgroups. In the mid-1990s Vessby et al. [284] reported that plasmaCE 16:1 n-7 was inversely associated with insulin sensitivity in alarge cohort (n = 215) of 70 years old Swedish males. A prospectivecase-control study investigating dietary and plasma PL fatty acidsas predictors of type 2 diabetes found that cases had higher plasmaPL 16:1 n-7 and a higher intake of 16:1 n-7 than controls(0.49 ± 0.2 vs 0.43 ± 0.19, P < 0.0001 and 1.89 vs 1.75 g/day, respec-tively) [285]. In addition, the plasma PL 16:1 n-7/16:0 ratio waspositively associated with risk of diabetes. However, in this studythe cases had higher intakes of 16:1 n-7 than controls it is possiblethat the dietary intake, rather than endogenous synthesis influ-enced the fatty acid composition of plasma PLs [43]. No associationwas found with plasma PL palmitoleate and incidence of diabetesin the study mentioned above [155].
Crowe et al. [159] measured the fatty acid composition of plas-ma CEs, PLs and TAGs in a large population study (approx. 2400

SCD
Thiazoladinediones (10.1)
Fibrates (10.1)
Specific inhibitors of SCD (10.2)
Insulin Concentration (6.1)
Leptin (6.2)
+
-
++
-
+
Smoking (6.5.2)
SCD
High carbohydrate /low fat diet (6.4.1)Cholesterol
(6.4.7)
SFA (6.4.2)
PUFA (6.4.4)
Fructose (6.4.1.2)
MUFA (6.4.3) ?
CLA (6.4.5)
Alcohol (6.4.11)
??
SCD
Insulin resistance (9.6.1)
Obesity (9.2)
CVD (9.5)
Hypertriglyceridaemia (9.3.1)Steatosis
(9.3)
Cancer (9.9)
Bone health (9.8)
? ?
?
??
A
B
C
Fig. 3. Summary of factors affecting SCD1 activity. Numbers in brackets represent relevant section for discussion in text. Arrows indicate putative direction of effect and ablunted line represents an inhibitory effect. (A) Effects of biological and pharmacological agents on SCD1 activity. The + or � symbols indicate up or down-regulation of SCD1.(B) Effects of nutrients on SCD1 activity. (C) Association studies of disease and disease risk factors with SCD1 activity. Double ended arrow indicates uncertainty regardingcause or effect. A question mark indicates further evidence is required to be certain of an association. Abbreviations: SCD, stearoyl-CoA desaturase; SFA, saturated fatty acids;MUFA, monounsaturated fatty acids; PUFA, polyunsaturated fatty acids; CLA, conjugated linoleic acid; CVD, cardiovascular disease.
36 L. Hodson, B.A. Fielding / Progress in Lipid Research 52 (2013) 15–42
healthy men and women) and reported strong positive associa-tions between 16:1 n-7 in plasma lipid fractions with age, BMI,plasma total- and HDL and the total to HDL– cholesterol ratio.There was a positive association between plasma CE 16:1 n-7anddairy fat intake (% total energy), although there was no associationwith SFA intake. They noted a negative association between 16:1n-7 abundance in plasma CE and TAG and PUFA intake [159]. It
could be speculated that this inverse association may in part bedue to repression of SCD1 by a high PUFA intake, as discussed inSection 6.4.4.
The distribution of fatty acids within plasma NEFA, DAG, TAGand PL lipid fractions was measured in subjects with non-alcoholicfatty liver disease (NAFLD) [283]. It was found that there was a pro-gressive increase in the abundance of 16:1 n-7 across the control,

L. Hodson, B.A. Fielding / Progress in Lipid Research 52 (2013) 15–42 37
NAFLD and NASH groups in plasma FFA, DAG, TAG and PL lipidfractions [283]. The authors suggested the increase in 16:1 n-7across the spectrum of fatty liver disease were due to an increasein the activity of SCD1, although this was not directly measured[283].
Palmitoleate in the plasma NEFA pool is strongly determined byfatty acid release from subcutaneous adipose tissue with a minorcontribution from visceral adipose tissue [286]. Thus, it wouldstand to reason that palmitoleate in the plasma NEFA pool is pre-ferred when investigating its role in human health: the palmitol-eate content of other plasma lipid fractions, such as plasma PLs,are difficult to assess in this context as they do not reflect adiposetissue well [43]. Although associations between circulating palmi-toleate in the plasma NEFA pool and insulin sensitivity have beenreported [46,282], this was not confirmed by others [281]. Thismay be due to differences in the phenotypes of the study groups(the latter was in obese individuals (average BMI of greater than35 kg/m2)) and the two studies that showed positive associationsbetween insulin sensitivity and palmitoleate were in healthy indi-viduals (average BMI between 24.9 and 29.1 kg/m2).
11.5. Adipose tissue
The association between the fatty acid composition of glutealadipose tissue and insulin sensitivity (as assessed by hyperinsuli-naemic-euglycaemic clamp) in a large cohort (n = 795) from UL-SAM study was assessed [287]. Although statistically significant,the relationship between adipose 16:1 n-7 and insulin sensitivity(M Value) and HOMA-IR were weak (r = �0.15, P < 0.001 andr = 0.14, P < 0.001, respectively).
The relationship between palmitoleate and obesity has alsobeen investigated. The fatty acid composition of subcutaneous glu-teal adipose tissue, from a population based study in Costa Rica(n = 1926) found that obese subjects had a significantly higher pro-portion of adipose tissue palmitoleate and higher desaturationindices than lean individuals [208]. It is possible that whilst withinthe tissue, palmitoleate does not exhibit a lipokine effect; rather itseffect is noted once in systemic circulation. Two earlier studies[197,198] had noted that plasma palmitoleate content was relatedwith obesity in adults [197] and children [198]. In these two stud-ies, total plasma fatty acids were measured, so it is difficult todetermine the origin, adipose tissue or hepatic, of the palmitoleate.
12. SCD: friend or foe?
By way of concluding, we have summarised the main findingsregarding the effects of biological, lifestyle, pharmacological anddietary factors on SCD1 (Fig. 3A and B). We have also attemptedto summarise association studies of disease and disease risk factorswith SCD1 activity (Fig. 3C). Perhaps more so than other areas ofmetabolism, it is particularly difficult to rationalise studies in ro-dents with those in man. SCD1 is tightly linked to de novo fatty acidsynthesis which is very much lower in humans than mice. In addi-tion, fatty acid ratios are used as indices of SCD1 activity in humanstudies without validation against specific measurements of en-zyme activity. The use of 16:1 n-7/16:0 has been validated in plas-ma total VLDL and VLDL-TAG for hepatic SCD1 expression inhumans [57] but decreased hepatic desaturation of palmitate hasbeen found in HSL null mice despite increased expression ofSCD1 [190]. Apart from potentially being sensitive to dietary fattyacid intake, many pathways of fatty acid metabolism could affectthe desaturation index. For example, the long-chain fatty acidelongase, Elovl6, has been shown to be associated with obesity-in-duced insulin resistance [288] and this could ‘muddy the water’when considering the relationship between insulin resistance
and measures of fatty acid desaturation. Studies in humans havecalculated fatty acid ratios in a number of different lipid poolswhich make comparisons difficult. Additionally, it is clear that16:1 n-7/16:0 and 18:1 n-9/18:0 fatty acid ratios are not necessar-ily interchangeable. Further challenges arise when trying to disen-tangle the effect of SCD1 on risk of disease in humans, not least asmany factors are inter-related. For example an obese individualmay consume more saturated fat, carbohydrate or fructose, andmay be more insulin resistant than a lean individual, thus the in-creased SCD1 expression noted in adipose tissue may be a conse-quence of a difference in dietary intake (which is difficult tomeasure) rather than a direct effect of a greater fat mass. So isSCD1 a rogue or an innocent bystander? SCD1 obviously plays arole in cellular metabolism and it is possible that in some cases,up-regulation is its natural response to new stimuli in its localenvironment as increased SCD1 expression and activity (as mea-sured by fatty acid ratios) are found in many models and in situa-tions of increased metabolic risk e.g. obesity and saturated fatintake. This does not necessarily mean that SCD1 causally contrib-utes to metabolic disease. More research is needed to understandthe mechanisms behind the commonly observed link between ele-vated SCD1 activity and metabolic disorders including obesity andinsulin resistance. Ongoing studies in humans should focus onaddressing whether changes in SCD1 activity are cause or effect.
Acknowledgements
We thank Keith Frayn and Fredrik Karpe for helpful discussion.We also thank the reviewers of the manuscript for helpful and con-structive comments.
References
[1] Cao H, Gerhold K, Mayers JR, Wiest MM, Watkins SM, Hotamisligil GS.Identification of a lipokine, a lipid hormone linking adipose tissue to systemicmetabolism. Cell 2008;134:933–44.
[2] Sampath H, Ntambi JM. The role of stearoyl-CoA desaturase in obesity, insulinresistance, and inflammation. Ann NY Acad Sci 2011;1243:47–53.
[3] Pinnick KE, Collins SC, Londos C, Gauguier D, Clark A, Fielding BA. Pancreaticectopic fat is characterized by adipocyte infiltration and altered lipidcomposition. Obesity (Silver Spring) 2008;16:522–30.
[4] Pot GK, Prynne CJ, Roberts C, Olson A, Nicholson SK, Whitton C, et al. NationalDiet and Nutrition Survey: fat and fatty acid intake from the first year of therolling programme and comparison with previous surveys. Br J Nutr2012;107:405–15.
[5] Ntambi JM. Regulation of stearoyl-CoA desaturase by polyunsaturated fattyacids and cholesterol. J Lipid Res 1999;40:1549–58.
[6] Flowers MT, Ntambi JM. Role of stearoyl-coenzyme A desaturase in regulatinglipid metabolism. Curr Opin Lipidol 2008;19:248–56.
[7] Mauvoisin D, Mounier C. Hormonal and nutritional regulation of SCD1 geneexpression. Biochimie 2011;93:78–86.
[8] Ntambi JM, Miyazaki M. Regulation of stearoyl-CoA desaturases and role inmetabolism. Prog Lipid Res 2004;43:91–104.
[9] Sampath H, Ntambi JM. Stearoyl-coenzyme A desaturase 1, sterol regulatoryelement binding protein-1c and peroxisome proliferator-activated receptor-alpha: independent and interactive roles in the regulation of lipidmetabolism. Curr Opin Clin Nutr Metab Care 2006;9:84–8.
[10] Bjermo H, Riserus U. Role of hepatic desaturases in obesity-related metabolicdisorders. Curr Opin Clin Nutr Metab Care 2010;13:703–8.
[11] Popeijus HE, Saris WH, Mensink RP. Role of stearoyl-CoA desaturases inobesity and the metabolic syndrome. Int J Obes (Lond) 2008;32:1076–82.
[12] Vessby B, Gustafsson IB, Tengblad S, Boberg M, Andersson A. Desaturationand elongation of fatty acids and insulin action. Ann NY Acad Sci2002;967:183–95.
[13] Evans H, De Tomaso T, Quail M, Rogers J, Gracey AY, Cossins AR, et al. Ancientand modern duplication events and the evolution of stearoyl-CoA desaturasesin teleost fishes. Physiol Genomics 2008;35:18–29.
[14] Wang J, Yu L, Schmidt RE, Su C, Huang X, Gould K, et al. Characterization ofHSCD5, a novel human stearoyl-CoA desaturase unique to primates. BiochemBiophys Res Commun 2005;332:735–42.
[15] Castro LF, Wilson JM, Goncalves O, Galante-Oliveira S, Rocha E, Cunha I. Theevolutionary history of the stearoyl-CoA desaturase gene family invertebrates. BMC Evol Biol 2011;11:132.
[16] Zhang L, Ge L, Parimoo S, Stenn K, Prouty SM. Human stearoyl-CoAdesaturase: alternative transcripts generated from a single gene by usage oftandem polyadenylation sites. Biochem J 1999;340(Pt 1):255–64.
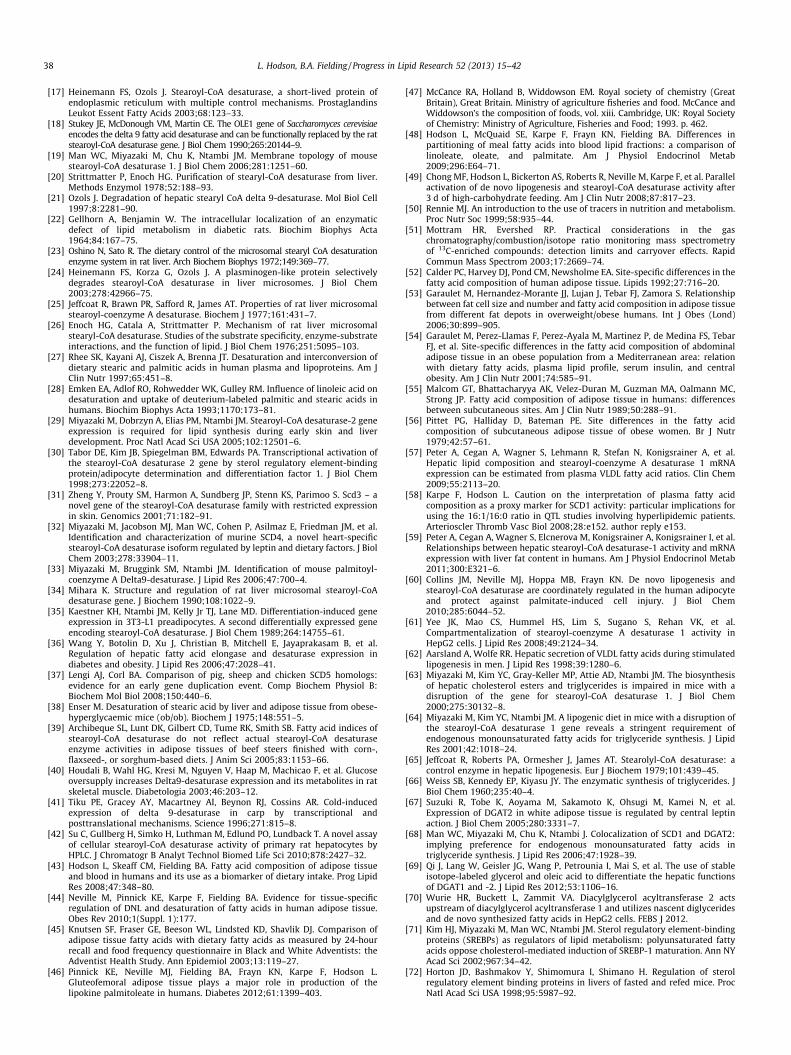
38 L. Hodson, B.A. Fielding / Progress in Lipid Research 52 (2013) 15–42
[17] Heinemann FS, Ozols J. Stearoyl-CoA desaturase, a short-lived protein ofendoplasmic reticulum with multiple control mechanisms. ProstaglandinsLeukot Essent Fatty Acids 2003;68:123–33.
[18] Stukey JE, McDonough VM, Martin CE. The OLE1 gene of Saccharomyces cerevisiaeencodes the delta 9 fatty acid desaturase and can be functionally replaced by the ratstearoyl-CoA desaturase gene. J Biol Chem 1990;265:20144–9.
[19] Man WC, Miyazaki M, Chu K, Ntambi JM. Membrane topology of mousestearoyl-CoA desaturase 1. J Biol Chem 2006;281:1251–60.
[20] Strittmatter P, Enoch HG. Purification of stearyl-CoA desaturase from liver.Methods Enzymol 1978;52:188–93.
[21] Ozols J. Degradation of hepatic stearyl CoA delta 9-desaturase. Mol Biol Cell1997;8:2281–90.
[22] Gellhorn A, Benjamin W. The intracellular localization of an enzymaticdefect of lipid metabolism in diabetic rats. Biochim Biophys Acta1964;84:167–75.
[23] Oshino N, Sato R. The dietary control of the microsomal stearyl CoA desaturationenzyme system in rat liver. Arch Biochem Biophys 1972;149:369–77.
[24] Heinemann FS, Korza G, Ozols J. A plasminogen-like protein selectivelydegrades stearoyl-CoA desaturase in liver microsomes. J Biol Chem2003;278:42966–75.
[25] Jeffcoat R, Brawn PR, Safford R, James AT. Properties of rat liver microsomalstearoyl-coenzyme A desaturase. Biochem J 1977;161:431–7.
[26] Enoch HG, Catala A, Strittmatter P. Mechanism of rat liver microsomalstearyl-CoA desaturase. Studies of the substrate specificity, enzyme-substrateinteractions, and the function of lipid. J Biol Chem 1976;251:5095–103.
[27] Rhee SK, Kayani AJ, Ciszek A, Brenna JT. Desaturation and interconversion ofdietary stearic and palmitic acids in human plasma and lipoproteins. Am JClin Nutr 1997;65:451–8.
[28] Emken EA, Adlof RO, Rohwedder WK, Gulley RM. Influence of linoleic acid ondesaturation and uptake of deuterium-labeled palmitic and stearic acids inhumans. Biochim Biophys Acta 1993;1170:173–81.
[29] Miyazaki M, Dobrzyn A, Elias PM, Ntambi JM. Stearoyl-CoA desaturase-2 geneexpression is required for lipid synthesis during early skin and liverdevelopment. Proc Natl Acad Sci USA 2005;102:12501–6.
[30] Tabor DE, Kim JB, Spiegelman BM, Edwards PA. Transcriptional activation ofthe stearoyl-CoA desaturase 2 gene by sterol regulatory element-bindingprotein/adipocyte determination and differentiation factor 1. J Biol Chem1998;273:22052–8.
[31] Zheng Y, Prouty SM, Harmon A, Sundberg JP, Stenn KS, Parimoo S. Scd3 – anovel gene of the stearoyl-CoA desaturase family with restricted expressionin skin. Genomics 2001;71:182–91.
[32] Miyazaki M, Jacobson MJ, Man WC, Cohen P, Asilmaz E, Friedman JM, et al.Identification and characterization of murine SCD4, a novel heart-specificstearoyl-CoA desaturase isoform regulated by leptin and dietary factors. J BiolChem 2003;278:33904–11.
[33] Miyazaki M, Bruggink SM, Ntambi JM. Identification of mouse palmitoyl-coenzyme A Delta9-desaturase. J Lipid Res 2006;47:700–4.
[34] Mihara K. Structure and regulation of rat liver microsomal stearoyl-CoAdesaturase gene. J Biochem 1990;108:1022–9.
[35] Kaestner KH, Ntambi JM, Kelly Jr TJ, Lane MD. Differentiation-induced geneexpression in 3T3-L1 preadipocytes. A second differentially expressed geneencoding stearoyl-CoA desaturase. J Biol Chem 1989;264:14755–61.
[36] Wang Y, Botolin D, Xu J, Christian B, Mitchell E, Jayaprakasam B, et al.Regulation of hepatic fatty acid elongase and desaturase expression indiabetes and obesity. J Lipid Res 2006;47:2028–41.
[37] Lengi AJ, Corl BA. Comparison of pig, sheep and chicken SCD5 homologs:evidence for an early gene duplication event. Comp Biochem Physiol B:Biochem Mol Biol 2008;150:440–6.
[38] Enser M. Desaturation of stearic acid by liver and adipose tissue from obese-hyperglycaemic mice (ob/ob). Biochem J 1975;148:551–5.
[39] Archibeque SL, Lunt DK, Gilbert CD, Tume RK, Smith SB. Fatty acid indices ofstearoyl-CoA desaturase do not reflect actual stearoyl-CoA desaturaseenzyme activities in adipose tissues of beef steers finished with corn-,flaxseed-, or sorghum-based diets. J Anim Sci 2005;83:1153–66.
[40] Houdali B, Wahl HG, Kresi M, Nguyen V, Haap M, Machicao F, et al. Glucoseoversupply increases Delta9-desaturase expression and its metabolites in ratskeletal muscle. Diabetologia 2003;46:203–12.
[41] Tiku PE, Gracey AY, Macartney AI, Beynon RJ, Cossins AR. Cold-inducedexpression of delta 9-desaturase in carp by transcriptional andposttranslational mechanisms. Science 1996;271:815–8.
[42] Su C, Gullberg H, Simko H, Luthman M, Edlund PO, Lundback T. A novel assayof cellular stearoyl-CoA desaturase activity of primary rat hepatocytes byHPLC. J Chromatogr B Analyt Technol Biomed Life Sci 2010;878:2427–32.
[43] Hodson L, Skeaff CM, Fielding BA. Fatty acid composition of adipose tissueand blood in humans and its use as a biomarker of dietary intake. Prog LipidRes 2008;47:348–80.
[44] Neville M, Pinnick KE, Karpe F, Fielding BA. Evidence for tissue-specificregulation of DNL and desaturation of fatty acids in human adipose tissue.Obes Rev 2010;1(Suppl. 1):177.
[45] Knutsen SF, Fraser GE, Beeson WL, Lindsted KD, Shavlik DJ. Comparison ofadipose tissue fatty acids with dietary fatty acids as measured by 24-hourrecall and food frequency questionnaire in Black and White Adventists: theAdventist Health Study. Ann Epidemiol 2003;13:119–27.
[46] Pinnick KE, Neville MJ, Fielding BA, Frayn KN, Karpe F, Hodson L.Gluteofemoral adipose tissue plays a major role in production of thelipokine palmitoleate in humans. Diabetes 2012;61:1399–403.
[47] McCance RA, Holland B, Widdowson EM. Royal society of chemistry (GreatBritain), Great Britain. Ministry of agriculture fisheries and food. McCance andWiddowson’s the composition of foods, vol. xiii. Cambridge, UK: Royal Societyof Chemistry: Ministry of Agriculture, Fisheries and Food; 1993. p. 462.
[48] Hodson L, McQuaid SE, Karpe F, Frayn KN, Fielding BA. Differences inpartitioning of meal fatty acids into blood lipid fractions: a comparison oflinoleate, oleate, and palmitate. Am J Physiol Endocrinol Metab2009;296:E64–71.
[49] Chong MF, Hodson L, Bickerton AS, Roberts R, Neville M, Karpe F, et al. Parallelactivation of de novo lipogenesis and stearoyl-CoA desaturase activity after3 d of high-carbohydrate feeding. Am J Clin Nutr 2008;87:817–23.
[50] Rennie MJ. An introduction to the use of tracers in nutrition and metabolism.Proc Nutr Soc 1999;58:935–44.
[51] Mottram HR, Evershed RP. Practical considerations in the gaschromatography/combustion/isotope ratio monitoring mass spectrometryof 13C-enriched compounds: detection limits and carryover effects. RapidCommun Mass Spectrom 2003;17:2669–74.
[52] Calder PC, Harvey DJ, Pond CM, Newsholme EA. Site-specific differences in thefatty acid composition of human adipose tissue. Lipids 1992;27:716–20.
[53] Garaulet M, Hernandez-Morante JJ, Lujan J, Tebar FJ, Zamora S. Relationshipbetween fat cell size and number and fatty acid composition in adipose tissuefrom different fat depots in overweight/obese humans. Int J Obes (Lond)2006;30:899–905.
[54] Garaulet M, Perez-Llamas F, Perez-Ayala M, Martinez P, de Medina FS, TebarFJ, et al. Site-specific differences in the fatty acid composition of abdominaladipose tissue in an obese population from a Mediterranean area: relationwith dietary fatty acids, plasma lipid profile, serum insulin, and centralobesity. Am J Clin Nutr 2001;74:585–91.
[55] Malcom GT, Bhattacharyya AK, Velez-Duran M, Guzman MA, Oalmann MC,Strong JP. Fatty acid composition of adipose tissue in humans: differencesbetween subcutaneous sites. Am J Clin Nutr 1989;50:288–91.
[56] Pittet PG, Halliday D, Bateman PE. Site differences in the fatty acidcomposition of subcutaneous adipose tissue of obese women. Br J Nutr1979;42:57–61.
[57] Peter A, Cegan A, Wagner S, Lehmann R, Stefan N, Konigsrainer A, et al.Hepatic lipid composition and stearoyl-coenzyme A desaturase 1 mRNAexpression can be estimated from plasma VLDL fatty acid ratios. Clin Chem2009;55:2113–20.
[58] Karpe F, Hodson L. Caution on the interpretation of plasma fatty acidcomposition as a proxy marker for SCD1 activity: particular implications forusing the 16:1/16:0 ratio in QTL studies involving hyperlipidemic patients.Arterioscler Thromb Vasc Biol 2008;28:e152. author reply e153.
[59] Peter A, Cegan A, Wagner S, Elcnerova M, Konigsrainer A, Konigsrainer I, et al.Relationships between hepatic stearoyl-CoA desaturase-1 activity and mRNAexpression with liver fat content in humans. Am J Physiol Endocrinol Metab2011;300:E321–6.
[60] Collins JM, Neville MJ, Hoppa MB, Frayn KN. De novo lipogenesis andstearoyl-CoA desaturase are coordinately regulated in the human adipocyteand protect against palmitate-induced cell injury. J Biol Chem2010;285:6044–52.
[61] Yee JK, Mao CS, Hummel HS, Lim S, Sugano S, Rehan VK, et al.Compartmentalization of stearoyl-coenzyme A desaturase 1 activity inHepG2 cells. J Lipid Res 2008;49:2124–34.
[62] Aarsland A, Wolfe RR. Hepatic secretion of VLDL fatty acids during stimulatedlipogenesis in men. J Lipid Res 1998;39:1280–6.
[63] Miyazaki M, Kim YC, Gray-Keller MP, Attie AD, Ntambi JM. The biosynthesisof hepatic cholesterol esters and triglycerides is impaired in mice with adisruption of the gene for stearoyl-CoA desaturase 1. J Biol Chem2000;275:30132–8.
[64] Miyazaki M, Kim YC, Ntambi JM. A lipogenic diet in mice with a disruption ofthe stearoyl-CoA desaturase 1 gene reveals a stringent requirement ofendogenous monounsaturated fatty acids for triglyceride synthesis. J LipidRes 2001;42:1018–24.
[65] Jeffcoat R, Roberts PA, Ormesher J, James AT. Stearolyl-CoA desaturase: acontrol enzyme in hepatic lipogenesis. Eur J Biochem 1979;101:439–45.
[66] Weiss SB, Kennedy EP, Kiyasu JY. The enzymatic synthesis of triglycerides. JBiol Chem 1960;235:40–4.
[67] Suzuki R, Tobe K, Aoyama M, Sakamoto K, Ohsugi M, Kamei N, et al.Expression of DGAT2 in white adipose tissue is regulated by central leptinaction. J Biol Chem 2005;280:3331–7.
[68] Man WC, Miyazaki M, Chu K, Ntambi J. Colocalization of SCD1 and DGAT2:implying preference for endogenous monounsaturated fatty acids intriglyceride synthesis. J Lipid Res 2006;47:1928–39.
[69] Qi J, Lang W, Geisler JG, Wang P, Petrounia I, Mai S, et al. The use of stableisotope-labeled glycerol and oleic acid to differentiate the hepatic functionsof DGAT1 and -2. J Lipid Res 2012;53:1106–16.
[70] Wurie HR, Buckett L, Zammit VA. Diacylglycerol acyltransferase 2 actsupstream of diacylglycerol acyltransferase 1 and utilizes nascent diglyceridesand de novo synthesized fatty acids in HepG2 cells. FEBS J 2012.
[71] Kim HJ, Miyazaki M, Man WC, Ntambi JM. Sterol regulatory element-bindingproteins (SREBPs) as regulators of lipid metabolism: polyunsaturated fattyacids oppose cholesterol-mediated induction of SREBP-1 maturation. Ann NYAcad Sci 2002;967:34–42.
[72] Horton JD, Bashmakov Y, Shimomura I, Shimano H. Regulation of sterolregulatory element binding proteins in livers of fasted and refed mice. ProcNatl Acad Sci USA 1998;95:5987–92.

L. Hodson, B.A. Fielding / Progress in Lipid Research 52 (2013) 15–42 39
[73] Shimomura I, Bashmakov Y, Horton JD. Increased levels of nuclear SREBP-1cassociated with fatty livers in two mouse models of diabetes mellitus. J BiolChem 1999;274:30028–32.
[74] Shimomura I, Bashmakov Y, Ikemoto S, Horton JD, Brown MS, Goldstein JL.Insulin selectively increases SREBP-1c mRNA in the livers of rats withstreptozotocin-induced diabetes. Proc Natl Acad Sci USA 1999;96:13656–61.
[75] Shimomura I, Matsuda M, Hammer RE, Bashmakov Y, Brown MS, Goldstein JL.Decreased IRS-2 and increased SREBP-1c lead to mixed insulin resistance andsensitivity in livers of lipodystrophic and ob/ob mice. Mol Cell 2000;6:77–86.
[76] Liang G, Yang J, Horton JD, Hammer RE, Goldstein JL, Brown MS. Diminishedhepatic response to fasting/refeeding and liver X receptor agonists in micewith selective deficiency of sterol regulatory element-binding protein-1c. JBiol Chem 2002;277:9520–8.
[77] Shimomura I, Shimano H, Korn BS, Bashmakov Y, Horton JD. Nuclear sterolregulatory element-binding proteins activate genes responsible for the entireprogram of unsaturated fatty acid biosynthesis in transgenic mouse liver. JBiol Chem 1998;273:35299–306.
[78] Kato H, Sakaki K, Mihara K. Ubiquitin–proteasome-dependent degradation ofmammalian ER stearoyl-CoA desaturase. J Cell Sci 2006;119:2342–53.
[79] Garcia-Serrano S, Moreno-Santos I, Garrido-Sanchez L, Gutierrez-Repiso C,Garcia-Almeida JM, Garcia-Arnes J, et al. Stearoyl-CoA desaturase-1 isassociated with insulin resistance in morbidly obese subjects. Mol Med2011;17:273–80.
[80] Prasad MR, Joshi VC. Regulation of rat hepatic stearoyl coenzyme Adesaturase. The roles of insulin and carbohydrate. J Biol Chem1979;254:997–9.
[81] Ntambi JM. Dietary regulation of stearoyl-CoA desaturase 1 gene expressionin mouse liver. J Biol Chem 1992;267:10925–30.
[82] Waters KM, Ntambi JM. Insulin and dietary fructose induce stearoyl-CoAdesaturase 1 gene expression of diabetic mice. J Biol Chem1994;269:27773–7.
[83] Arbo I, Halle C, Malik D, Brattbakk HR, Johansen B. Insulin induces fatty aciddesaturase expression in human monocytes. Scand J Clin Lab Invest2011;71:330–9.
[84] Friedman JM. Obesity in the new millennium. Nature 2000;404:632–4.[85] Zhang Y, Proenca R, Maffei M, Barone M, Leopold L, Friedman JM. Positional
cloning of the mouse obese gene and its human homologue. Nature1994;372:425–32.
[86] Campfield LA, Smith FJ, Guisez Y, Devos R, Burn P. Recombinant mouse OBprotein: evidence for a peripheral signal linking adiposity and central neuralnetworks. Science 1995;269:546–9.
[87] Farooqi IS, Jebb SA, Langmack G, Lawrence E, Cheetham CH, Prentice AM, et al.Effects of recombinant leptin therapy in a child with congenital leptindeficiency. N Engl J Med 1999;341:879–84.
[88] Halaas JL, Gajiwala KS, Maffei M, Cohen SL, Chait BT, Rabinowitz D, et al.Weight-reducing effects of the plasma protein encoded by the obese gene.Science 1995;269:543–6.
[89] Pelleymounter MA, Cullen MJ, Baker MB, Hecht R, Winters D, Boone T, et al.Effects of the obese gene product on body weight regulation in ob/ob mice.Science 1995;269:540–3.
[90] Cohen P, Miyazaki M, Socci ND, Hagge-Greenberg A, Liedtke W, Soukas AA,et al. Role for stearoyl-CoA desaturase-1 in leptin-mediated weight loss.Science 2002;297:240–3.
[91] Biddinger SB, Miyazaki M, Boucher J, Ntambi JM, Kahn CR. Leptin suppressesstearoyl-CoA desaturase 1 by mechanisms independent of insulin and sterolregulatory element-binding protein-1c. Diabetes 2006;55:2032–41.
[92] Flowers JB, Rabaglia ME, Schueler KL, Flowers MT, Lan H, Keller MP, et al. Lossof stearoyl-CoA desaturase-1 improves insulin sensitivity in lean micebut worsens diabetes in leptin-deficient obese mice. Diabetes 2007;56:1228–39.
[93] Lippiello PM, Holloway CT, Garfield SA, Holloway PW. The effects of estradiolon stearyl-CoA desaturase activity and microsomal membrane properties inrooster liver. J Biol Chem 1979;254:2004–9.
[94] Lee KN, Pariza MW, Ntambi JM. Differential expression of hepatic stearoyl-CoA desaturase gene 1 in male and female mice. Biochim Biophys Acta1996;1304:85–8.
[95] Warensjo E, Ohrvall M, Vessby B. Fatty acid composition and estimateddesaturase activities are associated with obesity and lifestyle variables inmen and women. Nutr Metab Cardiovasc Dis 2006;16:128–36.
[96] Stefan N, Peter A, Cegan A, Staiger H, Machann J, Schick F, et al. Low hepaticstearoyl-CoA desaturase 1 activity is associated with fatty liver and insulinresistance in obese humans. Diabetologia 2008;51:648–56.
[97] Enser M. The role of insulin in the regulation of stearic acid desaturaseactivity in liver and adipose tissue from obese–hyperglycaemic (ob/ob) andlean mice. Biochem J 1979;180:551–8.
[98] Legrand P, Hermier D. Hepatic delta 9 desaturation and plasma VLDL level ingenetically lean and fat chickens. Int J Obes Relat Metab Disord1992;16:289–94.
[99] Wahle KW, Radcliffe JD. Effect of a diet rich in sunflower oil on aspects of lipidmetabolism in the genetically-obese rat. Lipids 1977;12:135–9.
[100] Giltay EJ, Gooren LJ, Toorians AW, Katan MB, Zock PL. Docosahexaenoic acidconcentrations are higher in women than in men because of estrogeniceffects. Am J Clin Nutr 2004;80:1167–74.
[101] Chong MF, Fielding BA, Frayn KN. Metabolic interaction of dietary sugars andplasma lipids with a focus on mechanisms and de novo lipogenesis. Proc NutrSoc 2007;66:52–9.
[102] Fried SK, Rao SP. Sugars, hypertriglyceridemia, and cardiovascular disease.Am J Clin Nutr 2003;78:873S–80S.
[103] Parks EJ. Dietary carbohydrate’s effects on lipogenesis and the relationship oflipogenesis to blood insulin and glucose concentrations. Br J Nutr2002;87(Suppl. 2):S247–53.
[104] Stanhope KL, Havel PJ. Fructose consumption: potential mechanisms for itseffects to increase visceral adiposity and induce dyslipidemia and insulinresistance. Curr Opin Lipidol 2008;19:16–24.
[105] Strittmatter P, Spatz L, Corcoran D, Rogers MJ, Setlow B, Redline R.Purification and properties of rat liver microsomal stearyl coenzyme Adesaturase. Proc Natl Acad Sci USA 1974;71:4565–9.
[106] Thiede MA, Strittmatter P. The induction and characterization of rat liverstearyl-CoA desaturase mRNA. J Biol Chem 1985;260:14459–63.
[107] King IB, Lemaitre RN, Kestin M. Effect of a low-fat diet on fatty acidcomposition in red cells, plasma phospholipids, and cholesterol esters:investigation of a biomarker of total fat intake. Am J Clin Nutr2006;83:227–36.
[108] Kim E, Liu NC, Yu IC, Lin HY, Lee YF, Sparks JD, et al. Metformin inhibitsnuclear receptor TR4-mediated hepatic stearoyl-CoA desaturase 1 geneexpression with altered insulin sensitivity. Diabetes 2011;60:1493–503.
[109] Miyazaki M, Dobrzyn A, Man WC, Chu K, Sampath H, Kim HJ, et al. Stearoyl-CoA desaturase 1 gene expression is necessary for fructose-mediatedinduction of lipogenic gene expression by sterol regulatory element-binding protein-1c-dependent and -independent mechanisms. J Biol Chem2004;279:25164–71.
[110] Faeh D, Minehira K, Schwarz JM, Periasamy R, Park S, Tappy L. Effect offructose overfeeding and fish oil administration on hepatic de novolipogenesis and insulin sensitivity in healthy men. Diabetes2005;54:1907–13.
[111] Le KA, Faeh D, Stettler R, Debard C, Loizon E, Vidal H, et al. Effects of four-week high-fructose diet on gene expression in skeletal muscle of healthymen. Diabetes Metab 2008;34:82–5.
[112] Li ZZ, Berk M, McIntyre TM, Feldstein AE. Hepatic lipid partitioning and liverdamage in nonalcoholic fatty liver disease: role of stearoyl-CoA desaturase. JBiol Chem 2009;284:5637–44.
[113] Garg ML, Wierzbicki AA, Thomson AB, Clandinin MT. Dietary cholesterol and/or n-3 fatty acid modulate delta 9-desaturase activity in rat liver microsomes.Biochim Biophys Acta 1988;962:330–6.
[114] Sampath H, Miyazaki M, Dobrzyn A, Ntambi JM. Stearoyl-CoA desaturase-1mediates the pro-lipogenic effects of dietary saturated fat. J Biol Chem2007;282:2483–93.
[115] Dobrzyn P, Pyrkowska A, Jazurek M, Dobrzyn A. Increased availability ofendogenous and dietary oleic acid contributes to the upregulation of cardiacfatty acid oxidation. Mitochondrion 2011.
[116] Warensjo E, Riserus U, Gustafsson IB, Mohsen R, Cederholm T, Vessby B.Effects of saturated and unsaturated fatty acids on estimated desaturaseactivities during a controlled dietary intervention. Nutr Metab Cardiovasc Dis2008;18:683–90.
[117] Thorn K, Bergsten P. Fatty acid-induced oxidation and triglyceride formationis higher in insulin-producing MIN6 cells exposed to oleate compared topalmitate. J Cell Biochem 2010;111:497–507.
[118] Wang Y, Botolin D, Christian B, Busik J, Xu J, Jump DB. Tissue-specific,nutritional, and developmental regulation of rat fatty acid elongases. J LipidRes 2005;46:706–15.
[119] Kaur G, Sinclair AJ, Cameron-Smith D, Barr DP, Molero-Navajas JC,Konstantopoulos N. Docosapentaenoic acid (22:5n-3) down-regulates theexpression of genes involved in fat synthesis in liver cells. ProstaglandinsLeukot Essent Fatty Acids 2011;85:155–61.
[120] Flick PK, Chen J, Vagelos PR. Effect of dietary linoleate on synthesis anddegradation of fatty acid synthetase from rat liver. J Biol Chem1977;252:4242–9.
[121] Jeffcoat R, James AT. The control of stearoyl-CoA desaturase by dietarylinoleic acid. FEBS Lett 1978;85:114–8.
[122] Jeffcoat R, James AT. Interrelationship between the dietary regulation offatty acid synthesis and the fatty acyl-CoA desaturases. Lipids1977;12:469–74.
[123] Ntambi JM, Sessler AM, Takova T. A model cell line to study regulation ofstearoyl-CoA desaturase gene 1 expression by insulin and polyunsaturatedfatty acids. Biochem Biophys Res Commun 1996;220:990–5.
[124] Ramanadham S, Zhang S, Ma Z, Wohltmann M, Bohrer A, Hsu FF, et al. Delta6-, Stearoyl CoA-, and Delta5-desaturase enzymes are expressed in beta-cellsand are altered by increases in exogenous PUFA concentrations. BiochimBiophys Acta 2002;1580:40–56.
[125] Jones BH, Maher MA, Banz WJ, Zemel MB, Whelan J, Smith PJ, et al. Adiposetissue stearoyl-CoA desaturase mRNA is increased by obesity and decreasedby polyunsaturated fatty acids. Am J Physiol 1996;271:E44–9.
[126] Sessler AM, Kaur N, Palta JP, Ntambi JM. Regulation of stearoyl-CoAdesaturase 1 mRNA stability by polyunsaturated fatty acids in 3T3-L1adipocytes. J Biol Chem 1996;271:29854–8.
[127] Zulkifli RM, Parr T, Salter AM, Brameld JM. Regulation of ovine and porcinestearoyl coenzyme A desaturase gene promoters by fatty acids and sterols. JAnim Sci 2010;88:2565–75.
[128] Yoshikawa T, Shimano H, Yahagi N, Ide T, Amemiya-Kudo M, Matsuzaka T,et al. Polyunsaturated fatty acids suppress sterol regulatory element-bindingprotein 1c promoter activity by inhibition of liver X receptor (LXR) binding toLXR response elements. J Biol Chem 2002;277:1705–11.

40 L. Hodson, B.A. Fielding / Progress in Lipid Research 52 (2013) 15–42
[129] Bjermo H, Iggman D, Kullberg J, Dahlman I, Johansson L, Persson L, et al.Effects of n-6 PUFAs compared with SFAs on liver fat, lipoproteins, andinflammation in abdominal obesity: a randomized controlled trial. Am J ClinNutr 2012;95:1003–12.
[130] Choi Y, Park Y, Pariza MW, Ntambi JM. Regulation of stearoyl-CoA desaturaseactivity by the trans-10, cis-12 isomer of conjugated linoleic acid in HepG2cells. Biochem Biophys Res Commun 2001;284:689–93.
[131] Bretillon L, Chardigny JM, Gregoire S, Berdeaux O, Sebedio JL. Effects ofconjugated linoleic acid isomers on the hepatic microsomal desaturationactivities in vitro. Lipids 1999;34:965–9.
[132] Lee KN, Pariza MW, Ntambi JM. Conjugated linoleic acid decreases hepaticstearoyl-CoA desaturase mRNA expression. Biochem Biophys Res Commun1998;248:817–21.
[133] Park Y, Storkson JM, Ntambi JM, Cook ME, Sih CJ, Pariza MW. Inhibition ofhepatic stearoyl-CoA desaturase activity by trans-10, cis-12conjugated linoleic acid and its derivatives. Biochim Biophys Acta2000;1486:285–92.
[134] Thijssen MA, Malpuech-Brugere C, Gregoire S, Chardigny JM, Sebedio JL,Mensink RP. Effects of specific CLA isomers on plasma fatty acid profile andexpression of desaturases in humans. Lipids 2005;40:137–45.
[135] Calder PC. The role of marine omega-3 (n-3) fatty acids in inflammatoryprocesses, atherosclerosis and plaque stability. Mol Nutr Food Res2012;56:1073–80.
[136] Calder PC. Mechanisms of action of (n-3) fatty acids. J Nutr2012;142:592S–9S.
[137] Patterson E, Wall R, Fitzgerald GF, Ross RP, Stanton C. Health implications ofhigh dietary omega-6 polyunsaturated fatty acids. J Nutr Metab2012;2012:539426.
[138] Mann JI, Skeaff CM. Lipids. In: Mann J, Truswell AS, editors. Essentials ofhuman nutrition, vol. xxii. Oxford, New York: Oxford University Press; 2007.p. 599.
[139] Marcelo CL, Duell EA, Rhodes LM, Dunham WR. In vitro model of essentialfatty acid deficiency. J Invest Dermatol 1992;99:703–8.
[140] Nakamura MT, Nara TY. Structure, function, and dietary regulation of delta6,delta5, and delta9 desaturases. Annu Rev Nutr 2004;24:345–76.
[141] Landau JM, Sekowski A, Hamm MW. Dietary cholesterol and the activity ofstearoyl CoA desaturase in rats: evidence for an indirect regulatory effect.Biochim Biophys Acta 1997;1345:349–57.
[142] Sun Y, Hao M, Luo Y, Liang CP, Silver DL, Cheng C, et al. Stearoyl-CoAdesaturase inhibits ATP-binding cassette transporter A1-mediatedcholesterol efflux and modulates membrane domain structure. J Biol Chem2003;278:5813–20.
[143] Paton CM, Ntambi JM. Loss of stearoyl-CoA desaturase activity leads to freecholesterol synthesis through increased Xbp-1 splicing. Am J PhysiolEndocrinol Metab 2010;299:E1066–75.
[144] Marin MC, Pucciarelli HM, de Alaniz MJ. Liver desaturase activities and FAcomposition in monkeys. Effect of a low-protein diet. Lipids 2003;38:525–9.
[145] Turyn J, Stojek M, Swierczynski J. Up-regulation of stearoyl-CoA desaturase 1and elongase 6 genes expression in rat lipogenic tissues by chronic foodrestriction and chronic food restriction/refeeding. Mol Cell Biochem2010;345:181–8.
[146] Mainieri D, Summermatter S, Seydoux J, Montani JP, Rusconi S, Russell AP,et al. A role for skeletal muscle stearoyl-CoA desaturase 1 in control ofthermogenesis. FASEB J 2006;20:1751–3.
[147] Mangravite LM, Dawson K, Davis RR, Gregg JP, Krauss RM. Fatty aciddesaturase regulation in adipose tissue by dietary composition isindependent of weight loss and is correlated with the plasmatriacylglycerol response. Am J Clin Nutr 2007;86:759–67.
[148] Raju PK, Reiser R. Inhibition of fatty acyl desaturase by cyclopropene fattyacids. J Biol Chem 1967;242:379–84.
[149] Raju PK, Reiser R. Inhibition of stearoyl coenzyme A desaturase by sterculatein mouse liver microsomes. J Biol Chem 1972;247:3700–1.
[150] Raju PK, Reiser R. Hepatic stearoyl-CoA desaturase activity in mice asaffected by early postnatal dietary cyclopropene fatty acids. J Nutr 1973;103:904–7.
[151] Cunningham CC, Filus S, Bottenus RE, Spach PI. Effect of ethanol consumptionon the phospholipid composition of rat liver microsomes and mitochondria.Biochim Biophys Acta 1982;712:225–33.
[152] Tomita K, Azuma T, Kitamura N, Nishida J, Tamiya G, Oka A, et al. Pioglitazoneprevents alcohol-induced fatty liver in rats through up-regulation of c-Met.Gastroenterology 2004;126:873–85.
[153] Wada S, Yamazaki T, Kawano Y, Miura S, Ezaki O. Fish oil fed prior to ethanoladministration prevents acute ethanol-induced fatty liver in mice. J Hepatol2008;49:441–50.
[154] Umeki S, Shiojiri H, Nozawa Y. Chronic ethanol administration decreases fattyacyl-CoA desaturase activities in rat liver microsomes. FEBS Lett1984;169:274–8.
[155] Mozaffarian D, Cao H, King IB, Lemaitre RN, Song X, Siscovick DS, et al.Circulating palmitoleic acid and risk of metabolic abnormalities and new-onset diabetes. Am J Clin Nutr 2010;92:1350–8.
[156] Gurr MI, Harwood JL, Frayn KN. Lipid biochemistry, vol.xvi. Oxford: Blackwell; 2002. p. 320.
[157] Pond CM. The fats of life. Cambridge: Cambridge University Press; 1998. p. 337.[158] Cambien F, Warnet JM, Vernier V, Ducimetiere P, Jacqueson A, Flament C,
et al. An epidemiologic appraisal of the associations between the fatty acids
esterifying serum cholesterol and some cardiovascular risk factors in middle-aged men. Am J Epidemiol 1988;127:75–86.
[159] Crowe FL, Skeaff CM, Green TJ, Gray AR. Serum fatty acids as biomarkers of fatintake predict serum cholesterol concentrations in a population-based surveyof New Zealand adolescents and adults. Am J Clin Nutr 2006;83:887–94.
[160] Leng GC, Smith FB, Fowkes FG, Horrobin DF, Ells K, Morse-Fisher N, et al.Relationship between plasma essential fatty acids and smoking, serum lipids,blood pressure and haemostatic and rheological factors. ProstaglandinsLeukot Essent Fatty Acids 1994;51:101–8.
[161] Simon JA, Fong J, Bernert Jr JT, Browner WS. Relation of smoking and alcoholconsumption to serum fatty acids. Am J Epidemiol 1996;144:325–34.
[162] Qin X, Tian J, Zhang P, Fan Y, Chen L, Guan Y, et al. Laminar shear stress up-regulates the expression of stearoyl-CoA desaturase-1 in vascular endothelialcells. Cardiovasc Res 2007;74:506–14.
[163] Biddinger SB, Almind K, Miyazaki M, Kokkotou E, Ntambi JM, Kahn CR. Effectsof diet and genetic background on sterol regulatory element-binding protein-1c, stearoyl-CoA desaturase 1, and the development of the metabolicsyndrome. Diabetes 2005;54:1314–23.
[164] Dobrzyn A, Dobrzyn P, Lee SH, Miyazaki M, Cohen P, Asilmaz E, et al. Stearoyl-CoA desaturase-1 deficiency reduces ceramide synthesis by downregulatingserine palmitoyltransferase and increasing beta-oxidation in skeletal muscle.Am J Physiol Endocrinol Metab 2005;288:E599–607.
[165] Dobrzyn A, Dobrzyn P, Miyazaki M, Ntambi JM. Polyunsaturated fatty acidsdo not activate AMP-activated protein kinase in mouse tissues. BiochemBiophys Res Commun 2005;332:892–6.
[166] Dobrzyn A, Dobrzyn P, Miyazaki M, Sampath H, Chu K, Ntambi JM. Stearoyl-CoA desaturase 1 deficiency increases CTP: choline cytidylyltransferasetranslocation into the membrane and enhances phosphatidylcholinesynthesis in liver. J Biol Chem 2005;280:23356–62.
[167] Miyazaki M, Dobrzyn A, Sampath H, Lee SH, Man WC, Chu K, et al. Reducedadiposity and liver steatosis by stearoyl-CoA desaturase deficiency areindependent of peroxisome proliferator-activated receptor-alpha. J BiolChem 2004;279:35017–24.
[168] Miyazaki M, Sampath H, Liu X, Flowers MT, Chu K, Dobrzyn A, et al. Stearoyl-CoA desaturase-1 deficiency attenuates obesity and insulin resistance inleptin-resistant obese mice. Biochem Biophys Res Commun2009;380:818–22.
[169] Ntambi JM, Miyazaki M, Stoehr JP, Lan H, Kendziorski CM, Yandell BS, et al.Loss of stearoyl-CoA desaturase-1 function protects mice against adiposity.Proc Natl Acad Sci USA 2002;99:11482–6.
[170] Rahman SM, Dobrzyn A, Dobrzyn P, Lee SH, Miyazaki M, Ntambi JM. Stearoyl-CoA desaturase 1 deficiency elevates insulin-signaling components anddown-regulates protein-tyrosine phosphatase 1B in muscle. Proc Natl AcadSci USA 2003;100:11110–5.
[171] Rahman SM, Dobrzyn A, Lee SH, Dobrzyn P, Miyazaki M, Ntambi JM. Stearoyl-CoA desaturase 1 deficiency increases insulin signaling and glycogenaccumulation in brown adipose tissue. Am J Physiol Endocrinol Metab2005;288:E381–7.
[172] Cannon B, Nedergaard J. Nonshivering thermogenesis and its adequatemeasurement in metabolic studies. J Exp Biol 2011;214:242–53.
[173] Lee SH, Dobrzyn A, Dobrzyn P, Rahman SM, Miyazaki M, Ntambi JM. Lack ofstearoyl-CoA desaturase 1 upregulates basal thermogenesis but causeshypothermia in a cold environment. J Lipid Res 2004;45:1674–82.
[174] Flowers MT, Keller MP, Choi Y, Lan H, Kendziorski C, Ntambi JM, et al. Livergene expression analysis reveals endoplasmic reticulum stress and metabolicdysfunction in SCD1-deficient mice fed a very low-fat diet. Physiol Genomics2008;33:361–72.
[175] Liu X, Miyazaki M, Flowers MT, Sampath H, Zhao M, Chu K, et al. Loss ofStearoyl-CoA desaturase-1 attenuates adipocyte inflammation: effects ofadipocyte-derived oleate. Arterioscler Thromb Vasc Biol 2010;30:31–8.
[176] Dobrzyn P, Dobrzyn A, Miyazaki M, Cohen P, Asilmaz E, Hardie DG, et al.Stearoyl-CoA desaturase 1 deficiency increases fatty acid oxidation byactivating AMP-activated protein kinase in liver. Proc Natl Acad Sci USA2004;101:6409–14.
[177] Moreau C, Froment P, Tosca L, Moreau V, Dupont J. Expression and regulationof the SCD2 desaturase in the rat ovary. Biol Reprod 2006;74:75–87.
[178] Garbay B, Boiron-Sargueil F, Shy M, Chbihi T, Jiang H, Kamholz J, et al.Regulation of oleoyl-CoA synthesis in the peripheral nervous system:demonstration of a link with myelin synthesis. J Neurochem 1998;71:1719–26.
[179] Miyazaki M, Flowers MT, Sampath H, Chu K, Otzelberger C, Liu X, et al.Hepatic stearoyl-CoA desaturase-1 deficiency protects mice fromcarbohydrate-induced adiposity and hepatic steatosis. Cell Metab2007;6:484–96.
[180] Sampath H, Flowers MT, Liu X, Paton CM, Sullivan R, Chu K, et al. Skin-specificdeletion of stearoyl-CoA desaturase-1 alters skin lipid composition andprotects mice from high fat diet-induced obesity. J Biol Chem2009;284:19961–73.
[181] Flowers MT, Paton CM, O’Byrne SM, Schiesser K, Dawson JA, Blaner WS, et al.Metabolic changes in skin caused by Scd1 deficiency: a focus on retinolmetabolism. PLoS One 2011;6:e19734.
[182] Hyun CK, Kim ED, Flowers MT, Liu X, Kim E, Strable M, et al. Adipose-specificdeletion of stearoyl-CoA desaturase 1 up-regulates the glucose transporterGLUT1 in adipose tissue. Biochem Biophys Res Commun 2010;399:480–6.
[183] Flowers MT, Ade L, Strable MS, Ntambi JM. Combined deletion of SCD1 fromadipose tissue and liver does not protect mice from obesity. J Lipid Res2012;53:1646–53.

L. Hodson, B.A. Fielding / Progress in Lipid Research 52 (2013) 15–42 41
[184] Lindstrom P. The physiology of obese-hyperglycemic mice [ob/ob mice].ScientificWorldJournal 2007;7:666–85.
[185] Gates AH, Karasek M. Hereditary absence of sebaceous glands in the mouse.Science 1965;148:1471–3.
[186] Zheng Y, Eilertsen KJ, Ge L, Zhang L, Sundberg JP, Prouty SM, et al. Scd1 isexpressed in sebaceous glands and is disrupted in the asebia mouse. NatGenet 1999;23:268–70.
[187] Attie AD, Krauss RM, Gray-Keller MP, Brownlie A, Miyazaki M, Kastelein JJ,et al. Relationship between stearoyl-CoA desaturase activity and plasmatriglycerides in human and mouse hypertriglyceridemia. J Lipid Res2002;43:1899–907.
[188] Cohen P, Friedman JM. Leptin and the control of metabolism: role forstearoyl-CoA desaturase-1 (SCD-1). J Nutr 2004;134:2455S–63S.
[189] Fernandez C, Lindholm M, Krogh M, Lucas S, Larsson S, Osmark P, et al.Disturbed cholesterol homeostasis in hormone-sensitive lipase-null mice.Am J Physiol Endocrinol Metab 2008;295:E820–31.
[190] Fernandez C, Schuhmann K, Herzog R, Fielding B, Frayn K, Shevchenko A, et al.Altered desaturation and elongation of fatty acids in hormone-sensitivelipase null mice. PLoS One 2011;6:e21603.
[191] Peet DJ, Turley SD, Ma W, Janowski BA, Lobaccaro JM, Hammer RE, et al.Cholesterol and bile acid metabolism are impaired in mice lacking thenuclear oxysterol receptor LXR alpha. Cell 1998;93:693–704.
[192] Maeda K, Cao H, Kono K, Gorgun CZ, Furuhashi M, Uysal KT, et al. Adipocyte/macrophage fatty acid binding proteins control integrated metabolicresponses in obesity and diabetes. Cell Metab 2005;1:107–19.
[193] Cao H, Maeda K, Gorgun CZ, Kim HJ, Park SY, Shulman GI, et al. Regulation ofmetabolic responses by adipocyte/macrophage fatty acid-binding proteins inleptin-deficient mice. Diabetes 2006;55:1915–22.
[194] Kersten S, Desvergne B, Wahli W. Roles of PPARs in health and disease.Nature 2000;405:421–4.
[195] Liew CF, Groves CJ, Wiltshire S, Zeggini E, Frayling TM, Owen KR, et al.Analysis of the contribution to type 2 diabetes susceptibility of sequencevariation in the gene encoding stearoyl-CoA desaturase, a key regulator oflipid and carbohydrate metabolism. Diabetologia 2004;47:2168–75.
[196] Warensjo E, Ingelsson E, Lundmark P, Lannfelt L, Syvanen AC, Vessby B, et al.Polymorphisms in the SCD1 gene: associations with body fat distribution andinsulin sensitivity. Obesity (Silver Spring) 2007;15:1732–40.
[197] Paillard F, Catheline D, Duff FL, Bouriel M, Deugnier Y, Pouchard M, et al.Plasma palmitoleic acid, a product of stearoyl-coA desaturase activity, is anindependent marker of triglyceridemia and abdominal adiposity. Nutr MetabCardiovasc Dis 2008;18:436–40.
[198] Okada T, Furuhashi N, Kuromori Y, Miyashita M, Iwata F, Harada K. Plasmapalmitoleic acid content and obesity in children. Am J Clin Nutr2005;82:747–50.
[199] Virtue S, Vidal-Puig A. Adipose tissue expandability, lipotoxicity and theMetabolic Syndrome – an allostatic perspective. Biochim Biophys Acta2010;1801:338–49.
[200] Cnop M, Hannaert JC, Hoorens A, Eizirik DL, Pipeleers DG. Inverse relationshipbetween cytotoxicity of free fatty acids in pancreatic islet cells and cellulartriglyceride accumulation. Diabetes 2001;50:1771–7.
[201] de Vries JE, Vork MM, Roemen TH, de Jong YF, Cleutjens JP, van der Vusse GJ,et al. Saturated but not mono-unsaturated fatty acids induce apoptotic celldeath in neonatal rat ventricular myocytes. J Lipid Res 1997;38:1384–94.
[202] Hardy S, Langelier Y, Prentki M. Oleate activates phosphatidylinositol 3-kinase and promotes proliferation and reduces apoptosis of MDA-MB-231breast cancer cells, whereas palmitate has opposite effects. Cancer Res2000;60:6353–8.
[203] Listenberger LL, Han X, Lewis SE, Cases S, Farese Jr RV, Ory DS, et al.Triglyceride accumulation protects against fatty acid-induced lipotoxicity.Proc Natl Acad Sci USA 2003;100:3077–82.
[204] Listenberger LL, Ory DS, Schaffer JE. Palmitate-induced apoptosis can occurthrough a ceramide-independent pathway. J Biol Chem 2001;276:14890–5.
[205] Maedler K, Spinas GA, Dyntar D, Moritz W, Kaiser N, Donath MY. Distincteffects of saturated and monounsaturated fatty acids on beta-cell turnoverand function. Diabetes 2001;50:69–76.
[206] Paumen MB, Ishida Y, Muramatsu M, Yamamoto M, Honjo T. Inhibition ofcarnitine palmitoyltransferase I augments sphingolipid synthesis andpalmitate-induced apoptosis. J Biol Chem 1997;272:3324–9.
[207] Lee JN, Kim H, Yao H, Chen Y, Weng K, Ye J. Identification of Ubxd8 protein asa sensor for unsaturated fatty acids and regulator of triglyceride synthesis.Proc Natl Acad Sci USA 2010;107:21424–9.
[208] Gong J, Campos H, McGarvey S, Wu Z, Goldberg R, Baylin A. Adipose tissuepalmitoleic acid and obesity in humans: does it behave as a lipokine? Am JClin Nutr 2011;93:186–91.
[209] Hodson L, McQuaid SE, Humphreys SM, Milne R, Fielding BA, Frayn KN, et al.Greater dietary fat oxidation in obese compared with lean men: an adaptivemechanism to prevent liver fat accumulation? Am J Physiol Endocrinol Metab2010;299:E584–92.
[210] Vessby B, Ahren B, Warensjo E, Lindgarde F. Plasma lipid fatty acidcomposition, desaturase activities and insulin sensitivity in Amerindianwomen. Nutr Metab Cardiovasc Dis 2010.
[211] Kotronen A, Seppanen-Laakso T, Westerbacka J, Kiviluoto T, Arola J,Ruskeepaa AL, et al. Hepatic stearoyl-CoA desaturase (SCD)-1 activity anddiacylglycerol but not ceramide concentrations are increased in thenonalcoholic human fatty liver. Diabetes 2009;58:203–8.
[212] Petersson H, Arnlov J, Zethelius B, Riserus U. Serum fatty acid compositionand insulin resistance are independently associated with liver fat markers inelderly men. Diabetes Res Clin Pract 2010;87:379–84.
[213] Mar-Heyming R, Miyazaki M, Weissglas-Volkov D, Kolaitis NA, Sadaat N,Plaisier C, et al. Association of stearoyl-CoA desaturase 1 activity with familialcombined hyperlipidemia. Arterioscler Thromb Vasc Biol 2008;28:1193–9.
[214] Shiwaku K, Hashimoto M, Kitajima K, Nogi A, Anuurad E, Enkhmaa B, et al.Triglyceride levels are ethnic-specifically associated with an index ofstearoyl-CoA desaturase activity and n-3 PUFA levels in Asians. J Lipid Res2004;45:914–22.
[215] Pinnamaneni SK, Southgate RJ, Febbraio MA, Watt MJ. Stearoyl CoAdesaturase 1 is elevated in obesity but protects against fatty acid-inducedskeletal muscle insulin resistance in vitro. Diabetologia 2006;49:3027–37.
[216] Schenk S, Horowitz JF. Acute exercise increases triglyceride synthesis inskeletal muscle and prevents fatty acid-induced insulin resistance. J ClinInvest 2007;117:1690–8.
[217] Dobrzyn P, Pyrkowska A, Jazurek M, Szymanski K, Langfort J, Dobrzyn A.Endurance training-induced accumulation of muscle triglycerides is coupledto upregulation of stearoyl-CoA desaturase 1. J Appl Physiol2010;109:1653–61.
[218] Bergman BC, Perreault L, Hunerdosse DM, Koehler MC, Samek AM, Eckel RH.Increased intramuscular lipid synthesis and low saturation relate to insulinsensitivity in endurance-trained athletes. J Appl Physiol 2010;108:1134–41.
[219] Thamer C, Machann J, Bachmann O, Haap M, Dahl D, Wietek B, et al.Intramyocellular lipids: anthropometric determinants and relationships withmaximal aerobic capacity and insulin sensitivity. J Clin Endocrinol Metab2003;88:1785–91.
[220] Hulver MW, Berggren JR, Cortright RN, Dudek RW, Thompson RP, Pories WJ,et al. Skeletal muscle lipid metabolism with obesity. Am J Physiol EndocrinolMetab 2003;284:E741–7.
[221] Hulver MW, Berggren JR, Carper MJ, Miyazaki M, Ntambi JM, Hoffman EP,et al. Elevated stearoyl-CoA desaturase-1 expression in skeletal musclecontributes to abnormal fatty acid partitioning in obese humans. Cell Metab2005;2:251–61.
[222] Peter A, Weigert C, Staiger H, Machicao F, Schick F, Machann J, et al.Individual stearoyl-coa desaturase 1 expression modulates endoplasmicreticulum stress and inflammation in human myotubes and is associatedwith skeletal muscle lipid storage and insulin sensitivity in vivo. Diabetes2009;58:1757–65.
[223] Dobrzyn P, Dobrzyn A, Miyazaki M, Ntambi JM. Loss of stearoyl-CoAdesaturase 1 rescues cardiac function in obese leptin-deficient mice. J LipidRes 2010;51:2202–10.
[224] Peter A, Weigert C, Staiger H, Rittig K, Cegan A, Lutz P, et al. Induction ofstearoyl-CoA desaturase protects human arterial endothelial cells againstlipotoxicity. Am J Physiol Endocrinol Metab 2008;295:E339–49.
[225] Warensjo E, Sundstrom J, Vessby B, Cederholm T, Riserus U. Markers ofdietary fat quality and fatty acid desaturation as predictors of total andcardiovascular mortality: a population-based prospective study. Am J ClinNutr 2008;88:203–9.
[226] Busch AK, Gurisik E, Cordery DV, Sudlow M, Denyer GS, Laybutt DR, et al.Increased fatty acid desaturation and enhanced expression of stearoylcoenzyme A desaturase protects pancreatic beta-cells from lipoapoptosis.Diabetes 2005;54:2917–24.
[227] Thorn K, Hovsepyan M, Bergsten P. Reduced levels of SCD1 accentuatepalmitate-induced stress in insulin-producing beta-cells. Lipids Health Dis2010;9:108.
[228] Roberts R, Hodson L, Dennis AL, Neville MJ, Humphreys SM, Harnden KE, et al.Markers of de novo lipogenesis in adipose tissue: associations with smalladipocytes and insulin sensitivity in humans. Diabetologia 2009;52:882–90.
[229] Sjogren P, Sierra-Johnson J, Gertow K, Rosell M, Vessby B, de Faire U, et al.Fatty acid desaturases in human adipose tissue: relationships between geneexpression, desaturation indexes and insulin resistance. Diabetologia2008;51:328–35.
[230] Warensjo E, Riserus U, Vessby B. Fatty acid composition of serum lipidspredicts the development of the metabolic syndrome in men. Diabetologia2005;48:1999–2005.
[231] Warensjo E, Sundstrom J, Lind L, Vessby B. Factor analysis of fatty acids inserum lipids as a measure of dietary fat quality in relation to the metabolicsyndrome in men. Am J Clin Nutr 2006;84:442–8.
[232] Corpeleijn E, Feskens EJ, Jansen EH, Mensink M, Saris WH, de Bruin TW, et al.Improvements in glucose tolerance and insulin sensitivity after lifestyleintervention are related to changes in serum fatty acid profile and desaturaseactivities: the SLIM study. Diabetologia 2006;49:2392–401.
[233] Warensjo E, Rosell M, Hellenius ML, Vessby B, De Faire U, Riserus U.Associations between estimated fatty acid desaturase activities in serumlipids and adipose tissue in humans: links to obesity and insulin resistance.Lipids Health Dis 2009;8:37.
[234] Baer DJ, Judd JT, Clevidence BA, Tracy RP. Dietary fatty acids affect plasmamarkers of inflammation in healthy men fed controlled diets: a randomizedcrossover study. Am J Clin Nutr 2004;79:969–73.
[235] Calder PC. Does early exposure to long chain polyunsaturated fatty acidsprovide immune benefits? J Pediatr 2010;156:869–71.
[236] Petersson H, Basu S, Cederholm T, Riserus U. Serum fatty acid compositionand indices of stearoyl-CoA desaturase activity are associated with systemic
42 L. Hodson, B.A. Fielding / Progress in Lipid Research 52 (2013) 15–42
inflammation: longitudinal analyses in middle-aged men. Br J Nutr2008;99:1186–9.
[237] Petersson H, Lind L, Hulthe J, Elmgren A, Cederholm T, Riserus U.Relationships between serum fatty acid composition and multiple markersof inflammation and endothelial function in an elderly population.Atherosclerosis 2009;203:298–303.
[238] Melhus H, Riserus U, Warensjo E, Wernroth L, Jensevik K, Berglund L, et al. Ahigh activity index of stearoyl-CoA desaturase is associated with increasedrisk of fracture in men. Osteoporos Int 2008;19:929–34.
[239] Akune T, Ohba S, Kamekura S, Yamaguchi M, Chung UI, Kubota N, et al.PPARgamma insufficiency enhances osteogenesis through osteoblastformation from bone marrow progenitors. J Clin Invest 2004;113:846–55.
[240] Elefteriou F, Ahn JD, Takeda S, Starbuck M, Yang X, Liu X, et al. Leptinregulation of bone resorption by the sympathetic nervous system and CART.Nature 2005;434:514–20.
[241] Takeda S, Elefteriou F, Levasseur R, Liu X, Zhao L, Parker KL, et al. Leptinregulates bone formation via the sympathetic nervous system. Cell2002;111:305–17.
[242] Igal RA. Stearoyl-CoA desaturase-1: a novel key player in the mechanisms ofcell proliferation, programmed cell death and transformation to cancer.Carcinogenesis 2010;31:1509–15.
[243] Roongta UV, Pabalan JG, Wang X, Ryseck RP, Fargnoli J, Henley BJ, et al. Cancercell dependence on unsaturated fatty acids implicates stearoyl-CoAdesaturase as a target for cancer therapy. Mol Cancer Res 2011;9:1551–61.
[244] Scaglia N, Caviglia JM, Igal RA. High stearoyl-CoA desaturase protein andactivity levels in simian virus 40 transformed-human lung fibroblasts.Biochim Biophys Acta 2005;1687:141–51.
[245] Scaglia N, Igal RA. Stearoyl-CoA desaturase is involved in the control ofproliferation, anchorage-independent growth, and survival in humantransformed cells. J Biol Chem 2005;280:25339–49.
[246] Scaglia N, Igal RA. Inhibition of Stearoyl-CoA Desaturase 1 expression inhuman lung adenocarcinoma cells impairs tumorigenesis. Int J Oncol2008;33:839–50.
[247] Hess D, Chisholm JW, Igal RA. Inhibition of stearoylCoA desaturase activityblocks cell cycle progression and induces programmed cell death in lungcancer cells. PLoS One 2010;5:e11394.
[248] Chajes V, Joulin V, Clavel-Chapelon F. The fatty acid desaturation index ofblood lipids, as a biomarker of hepatic stearoyl-CoA desaturase expression, isa predictive factor of breast cancer risk. Curr Opin Lipidol 2011;22:6–10.
[249] Li J, Ding SF, Habib NA, Fermor BF, Wood CB, Gilmour RS. Partialcharacterization of a cDNA for human stearoyl-CoA desaturase and changesin its mRNA expression in some normal and malignant tissues. Int J Cancer1994;57:348–52.
[250] Yahagi N, Shimano H, Hasegawa K, Ohashi K, Matsuzaka T, Najima Y, et al. Co-ordinate activation of lipogenic enzymes in hepatocellular carcinoma. Eur JCancer 2005;41:1316–22.
[251] Moore S, Knudsen B, True LD, Hawley S, Etzioni R, Wade C, et al. Loss ofstearoyl-CoA desaturase expression is a frequent event in prostatecarcinoma. Int J Cancer 2005;114:563–71.
[252] Chajes V, Hulten K, Van Kappel AL, Winkvist A, Kaaks R, Hallmans G, et al.Fatty-acid composition in serum phospholipids and risk of breast cancer: anincident case-control study in Sweden. Int J Cancer 1999;83:585–90.
[253] Chajes V, Thiebaut AC, Rotival M, Gauthier E, Maillard V, Boutron-Ruault MC,et al. Association between serum trans-monounsaturated fatty acidsand breast cancer risk in the E3N-EPIC Study. Am J Epidemiol 2008;167:1312–20.
[254] Pala V, Krogh V, Muti P, Chajes V, Riboli E, Micheli A, et al. Erythrocytemembrane fatty acids and subsequent breast cancer: a prospective Italianstudy. J Natl Cancer Inst 2001;93:1088–95.
[255] Shannon J, King IB, Moshofsky R, Lampe JW, Gao DL, Ray RM, et al.Erythrocyte fatty acids and breast cancer risk: a case-control study inShanghai. China Am J Clin Nutr 2007;85:1090–7.
[256] Hess D, Igal RA. Genistein downregulates de novo lipid synthesis and impairscell proliferation in human lung cancer cells. Exp Biol Med (Maywood)2011;236:707–13.
[257] Minville-Walz M, Pierre AS, Pichon L, Bellenger S, Fevre C, Bellenger J, et al.Inhibition of stearoyl-CoA desaturase 1 expression induces CHOP-dependentcell death in human cancer cells. PLoS One 2010;5:e14363.
[258] Scaglia N, Chisholm JW, Igal RA. Inhibition of stearoylCoA desaturase-1inactivates acetyl-CoA carboxylase and impairs proliferation in cancer cells:role of AMPK. PLoS One 2009;4:e6812.
[259] Choi Y, Park Y, Storkson JM, Pariza MW, Ntambi JM. Inhibition of stearoyl-CoAdesaturase activity by the cis-9, trans-11 isomer and the trans-10, cis-12isomer of conjugated linoleic acid in MDA-MB-231 and MCF-7 human breastcancer cells. Biochem Biophys Res Commun 2002;294:785–90.
[260] Ramtohul YK, Black C, Chan CC, Crane S, Guay J, Guiral S, et al. SAR andoptimization of thiazole analogs as potent stearoyl-CoA desaturaseinhibitors. Bioorg Med Chem Lett 2010;20:1593–7.
[261] Oballa RM, Belair L, Black WC, Bleasby K, Chan CC, Desroches C, et al.Development of a liver-targeted stearoyl-CoA desaturase (SCD) inhibitor(MK-8245) to establish a therapeutic window for the treatment of diabetesand dyslipidemia. J Med Chem 2011;54:5082–96.
[262] Riserus U, Tan GD, Fielding BA, Neville MJ, Currie J, Savage DB, et al.Rosiglitazone increases indexes of stearoyl-CoA desaturase activity inhumans: link to insulin sensitization and the role of dominant-negativemutation in peroxisome proliferator-activated receptor-gamma. Diabetes2005;54:1379–84.
[263] Kawashima Y, Uy-Yu N, Kozuka H. Sex-related differences in the enhancingeffects of perfluoro-octanoic acid on stearoyl-CoA desaturase and itsinfluence on the acyl composition of phospholipid in rat liver. Comparisonwith clofibric acid and tiadenol. Biochem J 1989;263:897–904.
[264] Miller CW, Ntambi JM. Peroxisome proliferators induce mouse liver stearoyl-CoA desaturase 1 gene expression. Proc Natl Acad Sci USA 1996;93:9443–8.
[265] Oosterveer MH, Grefhorst A, van Dijk TH, Havinga R, Staels B, Kuipers F, et al.Fenofibrate simultaneously induces hepatic fatty acid oxidation, synthesis,and elongation in mice. J Biol Chem 2009;284:34036–44.
[266] Shiri-Sverdlov R, Wouters K, van Gorp PJ, Gijbels MJ, Noel B, Buffat L, et al.Early diet-induced non-alcoholic steatohepatitis in APOE2 knock-in mice andits prevention by fibrates. J Hepatol 2006;44:732–41.
[267] Kuda O, Stankova B, Tvrzicka E, Hensler M, Jelenik T, Rossmeisl M, et al.Prominent role of liver in elevated plasma palmitoleate levels in response torosiglitazone in mice fed high-fat diet. J Physiol Pharmacol 2009;60:135–40.
[268] Wong AK, Howie J, Petrie JR, Lang CC. AMP-activated protein kinase pathway:a potential therapeutic target in cardiometabolic disease. Clin Sci (Lond)2009;116:607–20.
[269] Jiang G, Li Z, Liu F, Ellsworth K, Dallas-Yang Q, Wu M, et al. Prevention ofobesity in mice by antisense oligonucleotide inhibitors of stearoyl-CoAdesaturase-1. J Clin Invest 2005;115:1030–8.
[270] Gutierrez-Juarez R, Pocai A, Mulas C, Ono H, Bhanot S, Monia BP, et al. Criticalrole of stearoyl-CoA desaturase-1 (SCD1) in the onset of diet-induced hepaticinsulin resistance. J Clin Invest 2006;116:1686–95.
[271] Brown JM, Chung S, Sawyer JK, Degirolamo C, Alger HM, Nguyen T, et al.Inhibition of stearoyl-coenzyme A desaturase 1 dissociates insulin resistanceand obesity from atherosclerosis. Circulation 2008;118:1467–75.
[272] Maguire LS, O’Sullivan SM, Galvin K, O’Connor TP, O’Brien NM. Fatty acidprofile, tocopherol, squalene and phytosterol content of walnuts, almonds,peanuts, hazelnuts and the macadamia nut. Int J Food Sci Nutr2004;55:171–8.
[273] Wu Y, Li R, Hildebrand DF. Biosynthesis and metabolic engineering ofpalmitoleate production, an important contributor to human health andsustainable industry. Prog Lipid Res 2012;51:340–9.
[274] Wilke MS, French MA, Goh YK, Ryan EA, Jones PJ, Clandinin MT. Synthesis ofspecific fatty acids contributes to VLDL-triacylglycerol composition inhumans with and without type 2 diabetes. Diabetologia 2009;52:1628–37.
[275] Hagenfeldt L, Wahren J, Pernow B, Raf L. Uptake of individual free fatty acidsby skeletal muscle and liver in man. J Clin Invest 1972;51:2324–30.
[276] Halliwell KJ, Fielding BA, Samra JS, Humphreys SM, Frayn KN. Release ofindividual fatty acids from human adipose tissue in vivo after an overnightfast. J Lipid Res 1996;37:1842–8.
[277] Westerbacka J, Kotronen A, Fielding BA, Wahren J, Hodson L, Perttila J, et al.Splanchnic balance of free fatty acids, endocannabinoids, and lipids insubjects with nonalcoholic fatty liver disease. Gastroenterology2010;139(1961–1971):e1.
[278] Connor WE, Lin DS, Colvis C. Differential mobilization of fatty acids fromadipose tissue. J Lipid Res 1996;37:290–8.
[279] Mamalakis G, Kafatos A, Manios Y, Kalogeropoulos N, Andrikopoulos N.Abdominal vs buttock adipose fat: relationships with children’s serum lipidlevels. Eur J Clin Nutr 2002;56:1081–6.
[280] Guo X, Li H, Xu H, Halim V, Zhang W, Wang H, et al. Palmitoleate induceshepatic steatosis but suppresses liver inflammatory response in mice. PLoSOne 2012;7:e39286.
[281] Fabbrini E, Magkos F, Su X, Abumrad NA, Nejedly N, Coughlin CC, et al. Insulinsensitivity is not associated with palmitoleate availability in obese humans. JLipid Res 2011;52:808–12.
[282] Stefan N, Kantartzis K, Celebi N, Staiger H, Machann J, Schick F, et al.Circulating palmitoleate strongly and independently predicts insulinsensitivity in humans. Diabetes Care 2010;33:405–7.
[283] Puri P, Wiest MM, Cheung O, Mirshahi F, Sargeant C, Min HK, et al. Theplasma lipidomic signature of nonalcoholic steatohepatitis. Hepatology2009;50:1827–38.
[284] Vessby B, Tengblad S, Lithell H. Insulin sensitivity is related to the fatty acidcomposition of serum lipids and skeletal muscle phospholipids in 70-year-old men. Diabetologia 1994;37:1044–50.
[285] Hodge AM, English DR, O’Dea K, Sinclair AJ, Makrides M, Gibson RA, et al.Plasma phospholipid and dietary fatty acids as predictors of type 2 diabetes:interpreting the role of linoleic acid. Am J Clin Nutr 2007;86:189–97.
[286] Nielsen S, Guo Z, Johnson CM, Hensrud DD, Jensen MD. Splanchnic lipolysis inhuman obesity. J Clin Invest 2004;113:1582–8.
[287] Iggman D, Arnlov J, Vessby B, Cederholm T, Sjogren P, Riserus U. Adiposetissue fatty acids and insulin sensitivity in elderly men. Diabetologia2010;53:850–7.
[288] Matsuzaka T, Shimano H, Yahagi N, Kato T, Atsumi A, Yamamoto T, et al.Crucial role of a long-chain fatty acid elongase, Elovl6, in obesity-inducedinsulin resistance. Nat Med 2007;13:1193–202.