steeping the organization’s tea: organizational context...
TRANSCRIPT
STEEPING THE ORGANIZATION’S TEA:
EXAMINING THE RELATIONSHIP BETWEEN EVALUATION USE,
ORGANIZATIONAL CONTEXT, AND EVALUATOR CHARACTERISTICS
by
MARISA ALLEN
Submitted in partial fulfillment of the requirements
For the degree of Doctor of Philosophy
Mandel School of Applied Social Sciences
CASE WESTERN RESERVE UNIVERSITY
May, 2010
CASE WESTERN RESERVE UNIVERSITY
SCHOOL OF GRADUATE STUDIES
We hereby approve the thesis/dissertation of
Marisa Allen
candidate for the Ph.D. in Social Welfare
degree *.
(signed) (chair of the committee)
Victor Groza, Ph.D.
Sue Pearlmutter, Ph.D.
Kathleen Farkas, Ph.D.
Robert Fischer, Ph.D.
_______________________________________ _______________________________________ (date) March 4, 2010
*We also certify that written approval has been obtained for any proprietary material contained therein.
Dedication
For my Dad who listened authentically as he sat in the chair by my bed
For my Mom who taught me to love learning
For Joe who deserves the party
And for Miles whose questions are better than mine.
i
TABLE OF CONTENTS
CHAPTER 1: Statement of the Problem .................................................................... 1
Introduction ........................................................................................................... 1 The Scope of Evaluation in the Social Services Field .......................................... 1 Statement of the Problem ...................................................................................... 3
Overview of Study ................................................................................................ 5 The Examination of Evaluation Use ..................................................................... 5 Types of Evaluation .............................................................................................. 8 Types of Evaluation Use ....................................................................................... 9
CHAPTER 2: Current Knowledge.............................................................................. 12
Introduction ........................................................................................................... 12 Conceptualization of Use ...................................................................................... 12 Literature Reviews on Evaluation Use ................................................................. 13
Evaluation Characteristics .................................................................................... 15 User Characteristics .............................................................................................. 20 Evaluator Characteristics ..................................................................................... 22 Debates on an Evaluators’ Influence .................................................................... 23
Organizational Context ......................................................................................... 24 Interaction and Strength of Factors Influencing Evaluation Use .......................... 25 Conceptual Research Focusing on Definition of Use ........................................... 26 Summary and Critique of Research on Evaluation Use........................................ 29 Current Study’s Contribution to the Literature ..................................................... 31 Review of Organizational Learning Theories ....................................................... 32 The Broad Scope of Organizational Learning Theories ....................................... 33 Early Conceptualizations of Organizational Learning ......................................... 34 Common Concepts Within Organizational Learning Theories ........................... 35 Characteristics of Learning Organizations ........................................................... 36 Organizational Learning Theory and Evaluation .................................................. 38 Knowledge Transfer Theories ............................................................................... 40 Application of Theories to Current Study ............................................................. 46 Conceptual Model, Research Questions, and Hypotheses .................................... 47
CHAPTER 3: Methodology ........................................................................................ 52
Introduction .......................................................................................................... 52 Research Questions, Hypotheses, and Supporting Rationale ............................... 52 Research Question One ......................................................................................... 52 Research Question Two ........................................................................................ 53 Research Question Three ...................................................................................... 54 Research Question Four ........................................................................................ 54 Research Question Five ........................................................................................ 55
ii
Summary of Research Questions and Hypotheses................................................ 56 Methodology and Survey Design.......................................................................... 57 Population ............................................................................................................. 57 Sample Size and Statistical Power ........................................................................ 57 Methodology ......................................................................................................... 58 Piloting Survey...................................................................................................... 59 Definition of Concepts .......................................................................................... 60 Data Preparation.................................................................................................... 61 Data Analysis ........................................................................................................ 61 Regression Model Building .................................................................................. 66
CHAPTER 4: Findings ............................................................................................... 67
Introduction ........................................................................................................... 67 Response Rate ....................................................................................................... 67 Exclusion of Cases ................................................................................................ 68 Sample Size ........................................................................................................... 69 Population ............................................................................................................. 69 Comparison of Sample and Population Characteristics ........................................ 69 Characteristics of Sample ..................................................................................... 71 Gender, Ethnicity, Age and Education ................................................................. 71 Primary Residence and Student Status ................................................................. 72 Description of Respondents’ Evaluation Work .................................................... 73 Measures ............................................................................................................... 79 Hypotheses and Data Analyses ............................................................................. 83 Hypothesis 1.......................................................................................................... 83 Hypothesis 2.......................................................................................................... 83 Hypothesis 3.......................................................................................................... 85 Hypothesis 4.......................................................................................................... 85 Hypothesis 5.......................................................................................................... 86 Hypothesis 6.......................................................................................................... 94 Hypothesis 7.......................................................................................................... 97 Summary of Findings ............................................................................................ 101
CHAPTER 5: Discussion ............................................................................................ 104
Introduction ........................................................................................................... 104 Discussion of Findings .......................................................................................... 104 Limitations ............................................................................................................ 108 Measuring Perception of Readiness for Organizational Learning ........................ 109
Skipped Item Distinction ...................................................................................... 110 Survey Fatigue ...................................................................................................... 110 Differing Definitions of Concepts ........................................................................ 110 Relevance to Social Work Practice ....................................................................... 111 Implications for Evaluation Practice ..................................................................... 113 Areas for future research ....................................................................................... 114
iii
Conclusion ............................................................................................................ 116 APPENDICES ............................................................................................................ 118
Appendix A Survey Instrument ............................................................................ 118 Appendix B Table of Characteristics of Learning Organizations in Vignettes .... 133 Appendix C Text of Email Invitation ................................................................... 135 Appendix D Questions for Pilot Survey Participants .......................................... 136
REFERENCES ........................................................................................................... 137
iv
LIST OF TABLES Table 1 Senge’s Five Basic Disciplines ................................................................. 35 Table 2 Learning Organization Building Blocks ................................................... 37 Table 3 Concepts from Cousins et al. (2004) Framework ..................................... 39 Table 4 Conceptual Model for Study ..................................................................... 49 Table 5 Research Questions and Hypotheses ........................................................ 56 Table 6 Definition of Concepts .............................................................................. 60 Table 7 Statistical Models ...................................................................................... 62 Table 8 Sample and Population Characteristics ..................................................... 70 Table 9 Primary Residence and Student Status ..................................................... 72 Table 10 Description of Sample/Evaluator Characteristics ..................................... 74 Table 11 Type of Evaluation Conducted ................................................................. 75 Table 12 Type of Organizations Where Evaluations Primarily Conducted ............. 76 Table 13 Current Areas of Evaluated-Related Work ............................................... 77 Table 14 Beliefs About Evaluation .......................................................................... 78 Table 15 Scale Creation and Reliability .................................................................. 79 Table 16 Evaluation Design Recommended for Each Organization ....................... 84 Table 17 Summary of Regression Analysis for Variables Predicting Level of
Recommended Process Evaluation (For Organization with Low Readiness of OL) ........................................ 87
Table 18 Summary of Regression Analysis for Variables Predicting Level of Recommended Process Evaluation (For Organization with High Readiness of OL) ...................................................................................... 89
Table 19 Summary of Regression Analysis for Variables Predicting Level of Recommended Outcome Evaluation (For Organization with Low Readiness of OL) ...................................................................................... 91
Table 20 Summary of Regression Analysis for Variables Predicting Level of Recommended Outcome Evaluation (For Organization with High Readiness of OL) ...................................................................................... 93
Table 21 Summary of Regression Analysis for Variables Predicting Ability to Discern Low Readiness for Organizational Learning (For Organization with High Level of OL) ............................................... 95
Table 22 Summary of Regression Analysis for Variables Predicting Ability to Discern High Readiness for Organizational Learning (For Organization with High Level of OL) ............................................... 96
Table 23 Summary of Regression Analysis for Variables Predicting Use Recommendations (For Organization with Low Level of OL) ................ 98
Table 24 Summary of Regression Analysis for Variables Predicting Use Recommendations (For Organization with High Level of OL) ................ 100
Table 25 Summary of Findings Hypotheses 1 to 7 .................................................. 101
v
LIST OF FIGURES Figure 1 Schematic Theory of Evaluation Influence adapted from
Mark and Henry (2004) ............................................................................ 28 Figure 2 Cousins et al. (2004) Conceptual Framework: Evaluation
as Organizational Learning ....................................................................... 39 Figure 3 Groups of Factors Influencing Use ........................................................... 48
vi
Acknowledgements
While completing a dissertation involves a lot of solitary work, I was never alone
in the process. The list of people to thank is numerous because I am so lucky to have a
community of family and friends who cheered me along this dissertation road. I want to
start by thanking my committee members Victor Groza, Chair; Kathleen Farkas; Robert
Fischer; and Sue Pearlmutter. Their contributions were numerous and their careful review
of my research created a better study. I want to give an extra special, triple thank you
with a cherry on top to my committee member/first Chair Sue Pearlmutter who stuck with
me and the dissertation process through thick and thin. How can I EVER begin to thank
you for what you gave? Your commitment to the process and to high standards was
inspiring.
Then to all the others who supported me along the way…Let’s start at the
beginning, to my fellow classmates who taught me much those first few years. Thank you
to the Center on Urban Poverty and Community Development for providing me with a
fellowship during my studies. Thank you to my Mom, Dad, Paul, and Shannon who joked
with me along the way and always kept me humble! Thank you to Milton and Carmen
Schwartz who have been so incredibly loving to me over many years and I am still taking
lessons from you on how to raise amazing children! To my Aunt Carol who understands
how to listen and always asked me “What can I do to be of support?” Carol gave the
greatest gift one can give! Thank you to Don who helped me find my first apartment in
Cleveland and serves as a great friend to Joe. To Lindsey, Pam, Roslyn, Louise and Brian
who always made me laugh until my stomach hurt and were good at helping me
procrastinate by going out for coconut cream pies! Thank you to the wonderful statistical
vii
expertise of Meeyoung Min who helped me carefully build and rebuild my regression
models until I found a good fit. Thank you to my professors Aloen Townsend and
Kathleen Wells whose words of wisdom are still golden trinkets in my weary head.
Thank you to David Kolb who helped me clarify my conceptual model and thoughts
about organizational learning. Thank you to Helen Menke who was always helpful and
kind to me and willingly hand delivered lots of required paperwork across campus. Thank
you to Coletta Reid who is a true mentor and friend who gave me ever-present, truly
compassionate support along the way. To my co-workers Debbie, Jan, Shelly and
Rebecca who were so supportive of me through the years. To all the incredible people
who helped me in various ways in the early days of motherhood, Renee Zisman, John and
Deborah Busemeyer, Josh and Sabrina Mann, Lisa Chun, Melynn Schuyler O-Neill, and
of course Jill Singer for all the rejuvenating tea times. To all the ways I was able to find
intellectual community when I was away from it. Thank you to Charlie Rose who asks
good questions and helped me connect with a community of learners on my rare lunch
breaks.
A special thank you and deep acknowledgement to all those who passed away in
the years I was completing my dissertation. To Arol Shack who always said she would be
at my defense, you were with me in your own way. Thank you to the Shack family and
their community of friends who provided me with the Arol Shack Dissertation Award. To
Helen Salyer, one of the many hidden intellectuals, who had a Ph.D. in many fields, and
who was always ahead of her time. I miss talking with you dearly.
To Dolly who gave the most powerful gift, renaming the dissertation to “the book
report” so I would laugh rather than grimace each time I talked about it. I will be making
viii
a shoe box diorama representing my dissertation results in your honor! Thank you to
Scott for actually talking with me on the phone and for staying committed to the world of
social justice. To Erin who taught me at a very young age to REALLY, REALLY look at
things. A gift I can never repay.
Thank you wholeheartedly to my three-year old son, Miles, who says the word
“dissertation” with the same ease he says the word “ball”. Your first three years on this
earth were also the years I finished my dissertation. Wow, what a beautiful, bumpy,
crazy, life-filled, overwhelming, touching, joyful, astoundingly miraculous time. I now
know it is possible to do statistics while breastfeeding, conduct research while exhausted,
and learn to be a mother and a researcher at the same time. Everything feels easy now.
And finally thank you to Joe, who was my foundation, my touchstone. To
paraphrase Margaret Mead, “One of the oldest human needs is to always have someone
leave the light on for you.” Joe,
Somehow, with the help of many, I persevered and completed this book report. I
always read the acknowledgements in dissertations and books with intense interest. I
think it is because I always want to understand the context in which things happen. It is
from my numerous questions about context that perhaps my own research was birthed.
Thank you to all who helped. I am deeply, deeply grateful.
you ALWAYS left the light on and, because you are a
wonderful, over the top caring soul, you brought me new coffee too. Thank you, thank
you.
ix
Steeping the Organization’s Tea:
Examining the Relationship Between Evaluation Use,
Organizational Context, and Evaluator Characteristics
Abstract
by
MARISA ALLEN
This study explored the ways in which the context of an organization affects the
design of an evaluation and its use. It also examined evaluator characteristics and their
relationship to the choice of evaluation design. Theories of organizational learning and
knowledge transfer were utilized to develop the study’s conceptual model. A review of
research on evaluation use in the non-profit sector was conducted along with a review of
theories of organizational learning and knowledge transfer. The study surveyed 393
evaluators who were members of the American Evaluation Association via a web-based
survey. Respondents answered a series of 47 mostly closed-ended questions about how
they would design an evaluation for two organizations described in the survey.
Findings indicated that evaluators design evaluations in distinct ways based on
whether or not an organization is ready for learning. In particular, evaluators
recommended high levels of process evaluation for an organization that was not ready for
learning and high levels of outcome evaluation for an organization that was ready for
x
learning. Evaluators also reported that process evaluation would be more useful for an
organization not ready for learning as compared to an organization that was ready for
learning. Also, the study found that the type of evaluation design chosen is based on
evaluators’ individual characteristics. Evaluator characteristics such as older age,
working in the for-profit sector, and working with social service agencies predicted
recommending high levels of process evaluation. Findings also indicated that evaluators
who were more experienced or who conducted social program evaluations were accurate
in discerning an organization’s readiness for learning. The findings provide evidence that
characteristics of the evaluator, characteristics of the evaluation, and qualities of the
organization, in conjunction with one another, are predictors of evaluation use. The study
builds on literature that has attempted to understand the ways in which organizational
context impacts evaluation. The study contributes to the understanding of factors that
predict and enhance the use of evaluation.
1
CHAPTER 1.
Statement of the Problem
Introduction
This study focuses on evaluation in the social service field. It contributes to the
understanding of factors that may enhance the use of evaluation. The study has several
implications for the ways in which evaluations are designed and the ways in which
evaluators assess organizational readiness for learning. This chapter describes the scope
of evaluation in the social services field, presents this study’s problem statement, and
discusses the history of studying evaluation use.
The Scope of Evaluation in the Social Services Field
Along with delivering an array of services, the vast majority of social service
programs in the United States engage in program evaluation activities. While evaluation
may be defined in several different ways, the classic text book on evaluation, Evaluation:
A Systematic Approach (Rossi, Freeman, & Lipsey, 1999), defines evaluation as “the use
of social research procedures to systematically investigate the effectiveness of social
programs that is adapted to their political organization and designed to inform social
action in ways that improve social conditions” (p. 20). In the social work field, evaluation
has become commonplace (Gabor, Unrau, & Grinnell, 1998). Gabor et al. write in
Evaluation for Social Workers that “we have entered a new era in which only the best
social service delivery programs—which can demonstrate they provide needed, useful,
and competent services for our clients—will survive” (p. 1). The authors conclude that
evaluation is a key to survival of social services programs and “evaluation has the status
of a minor deity” (p. 5). Data on the frequency of evaluation indicate that social service
2
programs are typically required by funders to evaluate their work. Researchers at the
Urban Institute found that approximately 80 percent of community, corporate, and
independent foundations conduct evaluations of the programs they fund to learn if grant
objectives were achieved and to learn about the outcomes of the funded work (Ostrower,
2004).
At the federal level, the United States Department of Health and Human Services
(DHHS) spends approximately $2.6 billion on research, demonstration, and evaluation
activities annually (Office of the Assistant Secretary for Planning and Evaluation
(ASPE), 2005). According to ASPE (2005), “evaluation is a core Federal program
management responsibility, along with strategic planning, policy and budget
development, and program operation” (p. 1). Also, programs funded by the Substance
Abuse and Mental Health Services Administration require that 15 percent of
organizations’ program budgets be used directly for the evaluation of programs.
Similarly, divisions of DHHS such as the Administration for Children and Families
require that 15 to 20 percent of their grantees’ budgets to be spent on evaluation (Office
of Planning, Research and Evaluation, 2003).
Large non-profit organizations such as the United Way also require funded
programs to engage in evaluation. Approximately 450 local United Ways require
outcome evaluation for all of the programs funded by the United Way (United Way of
America, 2005). Also, the United Way (United Way of America, 2003) examined the
extent to which other national-level health and human service agencies engaged in
evaluation. Organizations such as the American Red Cross, The American Cancer
Society, the National Head Start Association, and Catholic Charities USA reported
3
significant involvement in evaluation. Results indicated that 33 of the 52 organizations
surveyed reported being involved in outcome evaluation. Results also indicated that from
1998 to 2003 more agencies became involved in evaluation. The study concluded that
this increase “indicates that measuring program outcomes is becoming an accepted
practice and an expected activity for service providers” (p. vii).
Statement of the Problem
Although a large amount of resources are spent on evaluation of social service
programs, less is known about the usefulness of these evaluations. Specifically, little is
known about the effects of the act of an evaluation on the program, the ability of staff to
make decisions, and ultimately how evaluation is used for the betterment of social
programs. The use of evaluation to improve programs is a common reason for
organizations to conduct evaluations (Leviton & Hughes, 1981). While an evaluation
aims to be useful to the organization, staff, and others, it is not known what exact
qualities of the evaluation, characteristics of the evaluator, and other mechanisms foster
the usefulness of the evaluation. Evaluation can be viewed as an untested intervention
because the consequences of engaging in evaluation are largely unknown. While
evaluations are commonplace within the social welfare field, evaluation use is not well
documented. Failure to use evaluation is problematic because significant resources are
spent on a task which may or may not achieve its stated goal. While evaluation is
commonly done, lessons learned from the process are not necessarily translated into
programmatic changes or shared beyond the specific program. Thus, efforts may be
wasted on studying the program with no resulting changes to the program or learning
that can be used by other programs. The gleanings from an evaluation are not
4
incorporated into the day-to-day workings or practices of the organization and its staff,
nor does the evaluation go beyond the specific agency to inform other agencies engaged
in similar activities and programs.
While the purpose of evaluation is to help decision making in each program,
achieving this purpose is complicated by a variety of factors. Torres and Preskill (2001)
suggest that while research in the late 1970s and 1980s (Alkin, Daillak, & White, 1979;
Chemlinsky, 1987; Cousins & Leithwood, 1986; Weiss, 1980) informed the field about
issues related to evaluation use, this research “did not necessarily translate to
significantly enhancing use” (p. 388). Henry and Mark (2003) make the following
conclusion concerning evaluation:
Evaluation seems to be almost everywhere these days. We read about the findings of large-scale program evaluations in the newspaper, we receive report cards on our neighborhood schools, we allow ourselves to be interviewed for evaluations of conferences we attend. Yet we know remarkably little about how evaluation is being practiced, why it is being practiced, by whom and where it is being practiced, and to what effect.…The views you hear on the key issues in evaluation—almost certainly are not based on rigorous, systematic evidence. Why not? Because there is a serious shortage of rigorous, systematic evidence that can guide evaluation or that evaluators can use for self-reflection or for improving their next evaluation. (p. 69)
While today it is commonplace for organizations to engage in program evaluation, it is
not commonplace for evaluators to critique or evaluate the usefulness of their own work
to the organization or the community at large.
There has been less research on the extent to which evaluation is achieving its
goals and is useful. Conner (1998) concludes that “empirical work on use has been rare”
(p. 238). Weiss (1998), one the best known researchers on evaluation use, similarly
argues that while research on evaluation use has improved the new conceptualizations of
use it has not produced a coherent theory of evaluation use.
5
Leviton (2003) also concludes that there is a paucity of rigorous research about
evaluation use. When talking about research on evaluation use, she writes,
…the empirical work that is available suffers from a flawed standard of evidence. People’s self-report about use of information is frequently taken at face value, with no validation of measurement (in the context of a survey or interview format), or triangulation of information (in the context of qualitative study). A standard of evidence that many of us would never dream of applying to the conduct of evaluations, too often predominates in the study of evaluation use. (p. 526)
Thus, in order to contribute to the understanding of evaluation use in a rigorous
way, this study explored factors that impact evaluation use. This next section presents an
overview of the study.
Overview of Study While previous research (Alkin et al., 1979; Patton et al., 1977; Shula, 2000;
Weiss & Bucuvalas, 1977) has identified numerous factors that affect use (these factors
are reviewed in Chapter 2), this research examined a previously unexamined component
of this process. Specifically, this study examined the relationships between evaluator
characteristics and characteristics of the organization to understand how these factors
influence evaluation design and use. To place this research in the context of the history of
the study of evaluation use, I begin with a brief history of the evaluation field and its
examination of evaluation use.
The Examination of Evaluation Use
The evaluation discipline traces its roots to the 1960s, when the United States
government was funding large scale evaluations of many of its newly created social
programs associated with the “Great Society” (Weiss, 1992). Several large anti-poverty
programs were funded through federal legislation in the 1960s including the 1964
6
Economic Opportunity Act (Trattner, 1994). The evaluation discipline also refers to this
time period as “Donald Campbell’s Experimenting Society” when the sociologist Donald
Campbell developed the foundations of social science methodology and today’s
evaluation field (Caracelli, 2000). This time period also included the development of
many applied research programs in universities. Research and training in these settings
began to focus on social policy issues, specifically the evaluation of social programs
(Weiss, 1992). Social scientists felt that “rational decision making”, a popular phrase
during this time period, would happen after the evaluation of social programs and these
decisions would in turn improve social programs and eventually social conditions. While
the intent to improve social conditions and programs was widespread, congressional
members and others (Weiss, 1972) began to examine the underutilization of research
findings.
Research in the 1970s found that results from evaluations were not being utilized
(Caplan, Morrison, & Stambaugh, 1975; Weiss & Bucuvalas, 1977). In response to
criticism from United States congressional members that findings from evaluations were
not being used, evaluation researchers began trying to understand the specifics of
evaluation use (Preskill, 2000). In the early 1970s Weiss (1972) wrote what is considered
one of the most influential articles establishing the study of evaluation utilization. The
article called for research to study the use of evaluation. She wrote, “Better knowledge of
what kinds of evaluation have an impact on decision-making and under what conditions,
should help to encourage more effective development of evaluation practice” (p. 326). As
a result of all these concerns, research and theory development on how evaluation could
be used expanded in the late 1970s.
7
Thus, researchers such as Weiss and Patton concluded that evaluations of the
Great Society programs were not being “used” to inform policy decisions or in other
ways to improve programs or society. Wholey and Scanlon (1970) made similar
conclusions and suggested that “the recent literature is unanimous in announcing the
general failure of evaluation to affect decision making in a significant way” (p. 46). Out
of this context Patton (1978) championed efforts to encourage use of evaluation with the
publication of Utilization-Focused Evaluation. In his revised 3rd
Program evaluation is the systematic collection of information about the activities, characteristics, and outcomes of program to make judgments about the program, improve program effectiveness, and/or inform decisions about future programming. Utilization-focused program evaluation (as opposed to program evaluation in general) is evaluation done for and with specific, intended primary users for specific, intended uses. (p. 23)
edition of this book
(Patton, 1997), he argued that the focus of most evaluations should be “intended use by
intended users” (p. 20). Patton differentiated “utilization-focused evaluation” from other
types of evaluation work in the following manner:
Patton (1997) argues that evaluation use is enhanced by evaluators who are heavily
involved in the context of the program and are responsive to the particular needs of the
program.
While there was a good amount of research published on factors that encouraged
use in the 1970s there was less research in the 1980s in this area due to funding cuts for
many kinds of evaluation (Patton, 1997). During the Reagan administration in the 1980s
funding for many government programs and evaluation dropped dramatically and
concurrently there was less research conducted on the use of evaluation (Patton, 1997).
The 1990s included a resurgence of research about evaluation use. For example,
research by the Government Accounting Office (now the Government Accountability
8
Office – GAO) (G.A.O., 1995) found that evaluation information was not used by the
appropriate decision makers or congressional committee members even though the
evaluation projects were funded at high levels. Following the 1990s, the study of
evaluation use expanded into new areas. This new research (Henry, 2003; Henry &
Mark, 2003; Kirkhart, 2000; Mark & Henry, 2004) focused on understanding the concept
of evaluation use and Kirkhart (2000) introduced the term “evaluation influence”.
Research in the last ten years has focused on defining evaluation processes and
understanding the concept of evaluation use. The next section discusses the various types
and definitions of evaluation and evaluation use.
Types of Evaluation
“Evaluation” is a term that encompasses several types of social science inquiry.
One aspect of evaluation is assessing the extent to which a program achieved its goals.
While there are various ways in which the types of evaluation activities have been
organized, the two main types of evaluation are formative and summative. Formative
evaluation is an approach in which the focus is on examining the delivery of the program,
the quality of program implementation, the assessment of the organizational context, and
on various “inputs” into the program (Trochim, 1997). Often this approach is also called
process evaluation. Formative evaluation focuses on the process. In contrast, summative
evaluation examines the effects or outcomes of programs and aims to determine the
overall impact of an intervention (Trochim, 1997). The focus is on the outcomes of the
programs. Typically, social service programs engage in both formative and outcome
evaluation. Formative evaluation activities often include an evaluator documenting the
number of people who participated in a program and the kinds of activities in which they
9
participated. In contrast, outcome evaluation activities include an assessment of whether
or not the participants improved after participation in the program. For example, an
evaluator might measure the program participants’ level of substance use before and after
participation in a program. For many years, engaging in only process or formative
evaluations was the norm for social service agencies. In recent years, the trend has been
for more program funders to require programs to conduct outcome evaluations (United
Way of America, 2005).
Types of Evaluation Use
While there are two major kinds of evaluation, there are several different kinds of
evaluation “use”. During research generated during the 1970s, Leviton and Hughes
(1981) identified three major kinds of evaluation use: (1) instrumental, (2) conceptual,
and (3) symbolic (also known as political or persuasive). Researchers suggested that
evaluation use was a “multidimensional phenomenon best described by the interaction of
several dimensions, namely the instrumental, conceptual, and symbolic” (Shula &
Cousins, 1997, p. 196). Rich (1977) presented the first differentiation between
instrumental and conceptual use. Instrumental use refers to using findings from an
evaluation for direct action (Johnson, 1998). In instrumental use of evaluation,
evaluations are the impetus for immediate and specific program changes. Examples of
instrumental use include ending a program in which the evaluation results indicate the
program did not help clients or modifying the design of a program based on evaluation
findings. Conceptual use differs from instrumental use in that action is not expected but
the use of evaluation influences thinking. For example, the process of determining how to
measure program outcomes may deepen one’s understanding of how to design a program
10
(Patton, 2001). Conceptual use influences decision makers’ and stakeholders’ cognitive
processing. As a type of conceptual use, Weiss (1980) coined the term “decision
accretion”, meaning that over time thinking about past evaluations adds up and affects
decision making.
Symbolic (or political or persuasive) use of evaluation suggests that evaluation is
used for purposes that secure the legitimacy of political decisions (Knorr, 1977). Often
evaluation results are used to justify a course of action or bolster an argument. Examples
of this kind of evaluation include using evaluation reports to promote the passage of
legislation or using evaluation results to market the successes of a program. Johnson
(1998) suggests that symbolic use occurs when evaluation information supports decisions
already made or individuals use evaluation for their own self-interest.
It should be noted that a new typology of evaluation use, called “imposed use”
has been recently described by Weiss, Murphy-Graham, and Birkeland (2005). Their
study examined how a list a list of approved programs deemed “effective” impacted
schools districts’ use of the Drug Abuse Resistance Education program. This fourth type
of use is not discussed elsewhere in the literature on evaluation and thus there is not
consensus on whether it constitutes a fourth type of use.
While some research on evaluation use is focused on use of the results and reports
generated from an evaluation, other research (Owen & Lambert, 1995; Preskill,
Zuckerman, & Matthews, 2003; Torres, Preskill, & Pionek, 1996) evolved to ask
questions about the process of the evaluation and its effects on the organization. This
research on evaluation has focused on the factors that affect use of evaluation and
consider “use” as a learning process involving interdependent systems of participants,
11
evaluation, and context (Alkin, 1985; Conner, 1988; Cousins & Earl, 1992; Patton, 1997).
Researchers identified insights gleaned from the process of conducting an evaluation,
regardless of any report or findings being generated. The concept of process uses stems
from social constructivist learning theories. These models suggest that individuals
construct knowledge and create a shared concept of reality based in an association with
others. Theorists (Campbell, 2000; Lave & Wenger, 1991) suggest that the constructions
and interpretation of this knowledge is based on context and on individuals past
experiences. Preskill et al. (2003) write that “process use reflects constructivist learning
theory in that it focuses on how groups of people make meaning as they conduct an
evaluation. By encouraging dialogue and reflection, and by questioning assumptions,
values and beliefs, individuals come to more fully understand the evaluand1
Overview of Chapters 1 to 5
, the
organization, themselves, each other, and evaluation practice” (pp. 424-425).
Chapter 1 has presented a statement of the problem and a brief history of the
examination of evaluation use. Chapter 2 will present the current knowledge about
evaluation use and present the study’s hypotheses, research questions, and conceptual
model. Specifically, a discussion of theories of organizational learning and knowledge
transfer will be discussed in the next Chapter. Chapter 3 presents the methodology used
in this study. Chapter 4 presents the findings from this study and Chapter 5 presents
implications of this study for the Social Work field, study limitations, and areas for future
research.
1 Evaluand is a term used to refer to the organization being evaluated.
12
CHAPTER 2.
Current Knowledge
Introduction
This chapter begins with a review of research on evaluation use - that is, use in a
broad sense, meaning any kind of use. Specifically, this chapter discusses research
findings considered to be classic works in the study of evaluation use and then reviews
recent empirical research on evaluation use conducted between 1997 and 2009. Because
this study focuses on how evaluators approach evaluation use, this literature review
analyzes empirical research since 1997 that has examined how program evaluations are
used in the non-profit/governmental sector. This focus was chosen because several
literature reviews on evaluation use have been completed in the recent past. Second, this
chapter reviews the theories and models applied in the development of the conceptual
model for this study. The conceptual underpinnings of organizational learning and
models of knowledge transfer are presented. Then the conceptual model for this study is
presented. This conceptual model serves as the foundation for my research questions and
research design.
Conceptualization of Use
As discussed in Chapter 1, research on evaluation use (Patton et al., 1977; Rich,
1977; Weiss, 1980) identified several types of evaluation use. While there are several
ways in which use has been conceptualized (Henry & Mark, 2003; Kirkhart, 2000), this
study conceptualizes use as comprised of three types of use. These types of use include:
1. instrumental (use of results for decision making)
2. conceptual (changes in thinking, attitudes, or knowledge)
13
3. symbolic (use for legitimacy of political decisions/personal gain/bolstering
argument)
These three types of use can occur when an organization engages in the evaluation
process or accesses evaluation results. Because this study seeks to understand what
underlies use, this literature review focuses on factors that influence evaluation use.
Before presenting this study’s literature review, a summary of several important literature
reviews is included.
Literature Reviews on Evaluation Use
Literature reviews on evaluation use included five comprehensive reviews in the
1980s (Alkin, 1985; Beyer and Trice, 1982; Cousins and Leithwood, 1986; King and
Thompson, 1983; and Leviton and Hughes, 1981) and one completed in 1997, the most
recent (Shula & Cousins, 1997). To categorize the large number of factors that were
identified as impacting use, researchers began to group factors that influenced use into
larger categories. For example, Alkin (1985) identified three categories of factors that
impact use: 1) human factors such as evaluator and user characteristics; 2) contextual
factors such as the setting of the program; and 3) evaluation factors that refer to the actual
conduct of the evaluation.
Cousins and Leithwood (1986) reviewed 65 studies on use that were conducted
between 1971 and 1985 and identified 12 factors that contributed to evaluation use. They
then grouped the 12 factors into two major categories comprised of characteristics of the
evaluation implementation and characteristics of the setting in which the evaluation was
conducted. The characteristics of evaluation implementation included: 1) evaluation
quality; 2) credibility; 3) relevance; 4) communication quality; 5) findings from
14
evaluation; and 6) timeliness of evaluation. The characteristics of the setting or program
included: 1) information needs; 2) decision characteristics; 3) political climate; 4)
competing information; 5) personal characteristics; 6) commitment and/or responsiveness
to evaluation.
While literature reviews in the 1980s identified larger categories that influence
use, Shula and Cousins (1997) drew several conclusions about what was known about
evaluation use. Their observations included:
• The consideration of organizational context as important to understanding use
• The identification of process use as a common outcome of evaluation activity
• The expansion of the concept of use from an individual level to an organizational
level
• The expansion of the evaluator role to include roles such as facilitator and
educator
• The expansion of the understanding of the concept of evaluation misuse
While various researchers group factors that influence evaluation use into
differing categories, this chapter uses four categories that are similar to those described
by Alkin (1985). These categories are: (1) evaluation characteristics, 2) user
characteristics, 3) evaluator characteristics, and 4) organizational context. This
organization was chosen because it concisely classifies a large number of variables into
clear categories and others’ research can be easily organized into these categories. Also,
other researchers (Cousins, Goh, Clark, & Lee, 2004; Dickey, 1980; Shula & Cousins,
1997; Weiss, 1998) often cite Alkin’s work and use a similar organization of variables.
The four categories are defined as follows:
15
1) evaluation characteristics – the traits or the conduct of the actual study
2) user characteristics - the qualities, traits, and style of the person or persons who are
members of an organization that is being evaluated
3) evaluator characteristics – the qualities, traits, and style of a person or persons who
are conducting the evaluation
4) organizational context - the setting in which an evaluation takes place
Evaluation Characteristics
The study by Alkin et al. (1979) is one of the most frequently cited early studies on
evaluation use. Alkin et al. found that information from evaluations had to be relevant to
current decision making in order to be considered useful. They introduced the idea that
the timing of the evaluation was a determinant of use. Their series of case studies
documented the complexity of factors that influenced use and began to group individual
factors that influenced use into larger categories. Other research has focused on how the
specific content of the evaluation report or evaluation “product” impacts use. For
example, Weiss and Bucuvalas (1980) found that written recommendations for program
changes included in an evaluation report increase the usefulness of evaluation data for
programmatic decision making. Other studies specifically assessed the actual “product”
of evaluation. For example, the impact of the “readability” of evaluation reports was
assessed (Moran, 1987; Torres et al., 1996). Moran (1987) found that evaluations were
more useful to managers when data were presented in a form that was meaningful and
useful to policy makers, triangulation of methods was used to establish the validity of
results, recommendations from the evaluation were timely, and staff participated in the
interpretation of data.

16
More recent research by Torres et al. (1996) found through a survey of 246 members
of the American Evaluation Association that evaluators “use a relatively narrow range of
formats for communicating and reporting findings” (p. 4). They reported that evaluators
tend to use traditional methods (such as technical reports and presentations) to
communicate findings and external evaluators engage in these practices more frequently
than internal evaluators. They also found that a significant barrier to successful
communicating/reporting is insufficient time to devote to this task and that
organizational complexity creates barriers to communications. Successful elements for
communicating and reporting findings included the (1) format, (2) content, and (3) the
process of the communication and reporting. Helpful formats of evaluation reports
contained executive summaries, language tailored to the specific audience, and user-
friendly graphs and charts. Also, the content of useful communication and reporting
included providing both positive and negative findings and qualitative, contextual data.
Processes that were found to be useful included “focusing on early collaboration with
and involvement of stakeholders in the overall conduct of the evaluation, and especially
in interpreting findings” (p. 117).
Similarly, Patton (1997) concluded that evaluation reports are better used when
they present data in simple ways. He suggests that “Evaluation, if it is to be accessible to
and understandable by key stakeholders, must depart from the trends of the various social
science disciplines and return to simplicity as a virtue in data presentations. Certainly, an
evaluator can use sophisticated techniques to confirm the strength and meaningfulness of
rediscovered patterns, but the next step is to think creatively about how to translate those
findings into simple, straightforward, and understandable presentations” (p. 310).
17
Other researchers focused on the ways in which the conclusions of evaluations
might be more readily accepted if the conclusions supported previously held beliefs.
Leviton and Hughes (1981) found that “advocates of a program may become advocates
of evaluations that support their position. On the other hand, evaluations that run counter
to advocacy will be attacked” (p. 543). Similarly, Dickey (1980) found that the
evaluations validating program success were more likely to be rated as useful.
Many studies have assessed components of evaluations such as the impact of
research quality on use. The research in this area produced conflicting results (Cousins &
Leithwood, 1986). Some studies suggest that increased methodological sophistication
encourages use. Although some researchers (Siegel & Tuckel, 1985; Weiss & Bucuvalas,
1980) claimed that statistical rigor was a key in increasing use of results, other
researchers (Weeks, 1979) concluded that technical sophistication and statistical rigor
was a deterrent to use. Siegel and Tuckel compared the use of two different evaluation
reports of the same program and found that one report’s findings were not considered by
management because its methodology was called into question.
According to research by Cousins and Leithwood (1986) the quality of the
evaluation had the strongest relationship to evaluation use. The authors defined the
quality of the evaluation as “methodological sophistication, type of approach to the
evaluation problem, or the intensity of the evaluation activities” (p. 352). This finding is
similar to research by Weiss and Bucuvalas (1980) in which the quality of the research
accounted for the most variance in the likelihood of using research findings. Research
conducted by Oman and Chitwood (1984) found that evaluations that used advanced
statistical techniques and experimental designs had lower levels of acceptance compared
18
to evaluations that employed mixed methods (although they note that their sample of
studies using advanced statistical techniques was small). Cronbach’s well-known work
(Cronbach et al., 1980) suggests that the scientific quality of the evaluation is of less
importance to the social program than other qualities of the evaluation. He suggests that
the policy-oriented research should be comprehensible, correct, complete, and credible to
persons holding partisan views.
Recent research by Christie (2007) examined the likelihood that evaluation
information influenced decision makers’ actions. Using a simulation of a decision making
scenario, the findings indicated that participants were all influenced by large scale study
data, case study data, and anecdotal accounts. She also found that large-scale and case
study data were more influential than anecdotes for decision making. Notably, Christie
chose the term “evaluation influence” rather than “evaluation use”, indicating a possible
trend in the evaluation literature to use the word “influence”. The literature on evaluation
use may be expanding to include new definitions of use. The term “evaluation influence”
can be traced to Kirkhart (2000) who suggests that the word “use” be replaced with the
word “influence” which allows for a broader picture of all the consequences of
evaluation. (Kirkhart’s work is discussed in detail later in this chapter.) Some researchers
(Christie, 2007; Henry, 2003; Mark & Henry, 2004) have begun to use the term
evaluation influence while others continue to write about evaluation use
Other researchers (Fetterman, 2001) suggest that particular kinds of evaluation
approaches facilitate use. Fetterman defines empowerment evaluation as “the use of
evaluation concepts, techniques, and findings to foster improvement and self-
(Lawrenz,
Gullickson, & Toal, 2007; Leviton, 2003).
19
determination” (p. 4). This approach claims that teaching about the benefits of evaluation
and instilling self-determination in program staff and clients is a mechanism to increase
use of evaluation (Fetterman, 2001). Similarly, research by Mathison (1994) suggests that
participatory evaluation leads to benefits to the organization although she does not
specifically cite “evaluation use” as one of the results. She concludes that collaborative
partnerships between the evaluator and program result in long-term relationships that cost
less than an internal evaluator. She suggests that these partnerships increase the
likelihood of addressing systemic factors that impact the quality of services provided by
the organization.
Research by Compton et al. (2002) examined the process of building the capacity
of an organization (the American Cancer Society) to do evaluation through a particular
kind of evaluation approach. The authors suggest that this type of evaluation approach
called “evaluation capacity building” is “an intentional action system whose processes
are designed to achieve broader and deeper evaluation and the better use of evaluation”
(p. 47). This approach aims to make “evaluation and its uses routine and essential to the
organization’s work, including its goal setting, decision making, program planning, and
everyday management” (p. 47). In this retrospective case study, the authors describe
several principles that increase the likelihood that evaluation will be a common practice
within the organization and will encourage evaluation use. These principles include:
• Responding to organizational requests for evaluation services as well as seeing
how these requests may enhance the longer-term organizational change process
• Working with a shared understanding of the purposes of evaluation, the process,
and uses
20
• Adopting strategies that are responsive to the organization’s structures, cultures,
and every day practices
• Creating internal and external evaluation collaborations
• Participating in organizational decision making
• Evaluating the evaluation process
• Guiding the evaluation rather than controlling the project
In a similar fashion, King (2002), using a retrospective case study approach, describes the
process of evaluation capacity building. King discusses the process in the context of
working with a school district. She also describes conditions that encouraged evaluation
capacity building such as fostering staff commitment to program evaluation and its use.
She concludes that participatory evaluation approaches are effective ways to build
evaluation capacity.
User Characteristics
Other research has examined characteristics of users of evaluation that increase
use of evaluation. Some studies have found that participants in evaluation are more likely
to make changes or carry out decisions based on evaluation projects in which they had
input and participation. For example, participants who are involved in earlier phases of
the research react more favorably to evaluation results (Alkin et al., 1979; Flannigan,
1961; Rothman, 1980).
Research on educational leaders found that those who act with a degree of
autonomy often experience the latitude needed to take evaluation findings and improve
their program (Alkin et al., 1979). Evaluations that centered on the potential users of the
data and their particular request for information positively influenced use (Patton, 1997;
21
Patton et al., 1977; Weiss & Bucuvalas, 1977). Other studies found that administrator
commitment and support for the evaluation increased use (Patton et al., 1977; Rothman,
1980; Siegel & Tuckel, 1985). In a similar fashion, Alkin et al. also identified
characteristics of those who use evaluation that encourage use such as identity, interest in
evaluation, and professional style. Alkin et al. concluded that “if the evaluation addresses
a pressing concern of a potential user, then the evaluation information is more likely to
draw, and hold, the user’s attention” (p. 238).
Ongoing involvement of program staff in evaluation has been found to positively
influence use (Ayers, 1987; Greene, 1988; Patton, 1997; Weiss, 1998). Ayers found that
staff members rated their involvement in a collaborative approach to evaluation as
positive. Similarly Weiss concluded that, “The best way that we know to date of
encouraging use is through involving potential users in defining the study, helping to
interpret the results, and through reporting to them regularly while the study is in
progress” (p. 30).
Consideration of the needs of multiple stakeholders also increased use (Agarwala-
Rogers, 1977; Greene, 1988) Also, as discussed previously, the presence of a “personal
factor” is relevant for users of evaluation. Patton (1997) concludes that an evaluation user
who has a personal interest or cares about the results will use evaluation at high levels.
The personal factor can exist in an evaluator and/or in an evaluation user (Patton, 1997).
Patton defines the term as follows:
The personal factor is the presence of an identifiable individual or group of people who personally care about the evaluation and the findings it generates. Where such a person or group was present, evaluations were used; where the personal factor was absent, there was a correspondingly marked absence of evaluation impact. (p. 44)
22
The next section presents research on evaluator characteristics found to influence
evaluation use.
Evaluator Characteristics
Alkin et al. (1979) identified evaluator characteristics that positively correlate
with evaluation use such as rapport with program staff and other evaluation users,
political sensitivity, and credibility. They write “the way the evaluator defines his or her
task and goes about the evaluation will influence the utilization of the evaluation
information” (p. 239). Also research found that evaluations spearheaded by evaluators
who were perceived as having extensive experience, knowledge and methodological
expertise were found to have high use (Chemlinsky, 1987; Siegel & Tuckel, 1985).
Several studies found that ongoing, frequent, and effective communication between the
evaluator and the program staff increased use (Chemlinsky, 1987; Moran, 1987; Patton,
1997; Rothman, 1980; Weeks, 1979).
Cousins and Leithwood (1993) studied the interaction between the evaluator and
program staff and determined that it has a major impact on conceptual development,
learning, and decision making. In their study of school improvement, they conclude that
members of an organization “reconstruct the meaning they attribute to their work before
lasting change will occur” (p. 305). Their conceptual model suggests that the
“characteristics of the source of the information”, i.e. the characteristics of the evaluator,
influence evaluation use.
As discussed previously, Patton (1978) and others (Cronbach et al., 1980; Pflum
& Brown, 1984) found that the “personal factor” influenced evaluation use. The personal
factor also refers to a characteristic of an evaluator. Cronbach (1980) concluded that

23
“nothing makes a larger difference in the use of evaluations than the personal factor” (p.
15). Greene (1988) found that the following evaluator characteristics to encourage use 1)
the ability to be responsive, 2) the ability to listen well, 3) the ability to accept diverse
stakeholder views, 4) the ability to invoke trust and rapport, 5) the presence of technical
skills, and 6) the ability to serve as an impartial, credible outsider. Weiss (1998) also
suggests that evaluation use is encouraged by the evaluator and the program participants
have ongoing interactions or “sustained interactivity”.
Debates on an Evaluators’ Influence
It is important to note that two prominent researchers, Weiss (1988a, 1988b) and
Patton (1988a, 1988b), have differed on their views on the extent to which evaluators can
encourage evaluation use and had conceptual debates on this topic which were
documented in the literature (Patton, 1988a, 1988b; Weiss, 1988a, 1988b). Patton
(1988a), in his debate with Weiss, has argued that an evaluator’s intentional focus on
using evaluation positively impacts programs and decision making. In contrast, Weiss
(1988a) concludes that this approach has not increased the impact of evaluations on
decision making. While the debates between these two researchers are infamous in the
literature, scholars in the evaluation field (Smith & Chircop, 1989) have concluded that
Weiss and Patton were debating from two different contexts. Weiss studied evaluation
use in large policy arenas such as the United States Congress whereas Patton tended to
work with social programs that were smaller in nature. Thus, the ability of an evaluator to
encourage use may be dependent upon context and the characteristics of the organization.
24
Organizational Context
Examination of the ways in which organizational context influences evaluation
has become a new focus of recent research in the evaluation literature (Cousins et al.,
2004; Weiss, 1998). There was some early research by Greene (1988) and others (Siegel
& Tuckel, 1985) which began a discussion of the influence of organizational level
variables. Greene’s research concluded that organizations with a decentralized,
democratic organizational climate had greater use. She made her conclusions based on
two case studies using participatory evaluation approaches. Other researchers found that
politically astute organizations attending to internal and external political constraints
were more likely to report using evaluation (Chemlinsky, 1987; Patton et al., 1977;
Weiss, 1998). Shula and Cousins’ (1997) review of the literature on evaluation use
concluded that organizational context was one of the key factors that influenced use.
Their review noted that “evidence suggests that the more evaluators become schooled in
the structure, culture, and politics of their program and policy communities, the better
prepared they are to be strategic about the factors most likely to affect use” (para. 34).
Thompson (1994) concluded that evaluations are used more frequently when the
program is new or when the organizational context of the program is not highly
politicized. Rothman’s (1980) interviews with 24 staff members in whose departments’
programs had been evaluated, indicated that characteristics of the organization impacted
use. While he used the term “structural factors,” he described conditions that were clearly
characteristics of the organization. For example, he specifies that the organization’s
objectives must include an emphasis on collecting information for problem-solving and
that the organizational structure of a research unit facilitates use.
25
More recently, Torres and Preskill (Torres et al., 1996) found that organizations
that are “learning organizations” have a propensity to use evaluation at higher levels.
Also, exploratory research by Preskill et al. (2003) identified six organizational
characteristics that may affect process use. These characteristics include the 1) degree of
organizational stability; 2) support of previous evaluation work; 3) location and
ownership of the evaluation function; 4) external demands, constraints, threats; 5) extent
to which the organization’s culture supports ongoing learning; and 6) extent to which the
organization supports evaluation capacity.
Cousins et al. (2006) examined the extent to which schools use evaluation (in this
case, evaluation was defined broadly as evaluative inquiry) and found that schools that
use data more frequently tend to value data. The authors found that instrumental and
conceptual uses of evaluative inquiry occur in school settings in informal ways and
support decision making. Important factors that supported use included school leadership
and developing an appreciation for evaluation through experiencing its benefits.
Recently, Balthasar (2006) investigated how one aspect of institutional design
impacts use. He conducted 10 case studies of evaluations in various institutions within
the Swiss Federal Administration and concluded that having an external evaluator versus
an internal evaluation within an institution did not have an impact on the level of
evaluation use. He concluded that “the institutional distance between evaluators and
evaluees therefore appears to have no influence on the use of evaluations” (p. 367).
Interaction and Strength of Factors Influencing Evaluation Use
Alkin et al. (1979) also note that these factors discussed above can be described as
separate entities but they are highly interdependent and the interaction of these variables
26
impacts use. While it appears that a multitude of factors impacts evaluation use, it is not
easy to clearly measure how these factors interact to foster or impede evaluation use. The
complex interplay of these factors makes it difficult to accurately predict specific
outcomes (Alkin et al., 1979; Patton, 1997). Weiss (1998) concludes that it is the
interplay of many factors that results in high evaluation use.
Huberman (1995) also suggests that although a variety of factors and variables
that impact use have been identified, “no single variable produces very large effects, and
several others work well in certain settings but not in others” (para. 10). He writes that
although researchers have pinpointed many factors as “influential” in promoting use,
these factors are not consistent predictors of use.
Conceptual Research Focusing on Definition of Use
While much research over the years has focused on four main groups of factors
that affect use, recent research on evaluation use (Henry, 2003; Henry & Mark, 2003;
Kirkhart, 2000; Mark & Henry, 2004; Weiss et al., 2005) has focused on a discussion of
the concept of evaluation use. For example, Kirkhart (2000) proposes that the word use or
utilization be replaced with the term evaluation influence. She writes,
The term influence (the capacity or power of persons or things to produce effects on others by intangible or indirect means) is broader than use, creating a framework with which to examine effects that are multidirectional, incremental, unintentional, and noninstrumental, alongside those that are unidirectional, episodic, intended, and instrumental (which are well represented by the term use). (p. 7)
She presents an “integrated theory of evaluation influence” in which the three dimensions
of source of influence, intention, and time frame provide a way to organize factors that
impact an evaluation’s usefulness or “influence”. She explains that the source of
influence refers to the “active agent of change or the starting point of a generative process
27
of change” (p. 9). In Kirkhart’s characterization, these sources of influence include
influences from the process of conducting an evaluation and from the results of an
evaluation. “Intention” refers to the consideration of whether or not there is a purposeful
direction to a particular kind of influence. This “intention” alludes to intended and
unintended consequences of evaluation. Kirkhart writes, “Latent purposes and covert
evaluation agendas may also reflect intent, but these intentions may be more difficult to
identify. Unintended influences capture the unforeseen impacts of evaluation on
individuals and systems, often through unexpected pathways. Any given evaluation may
have intended influence only, or a mix of the two” (p. 14). Kirkhart’s third dimension of
“influence” is time. Specifically, she argues that time refers to the chronological or
developmental phases in which the influence of evaluation emerges. For example an
“end-of cycle” influence is an influence associated with the conclusion of an evaluation.
Also, work by Henry and Mark (2003) argues that the goal of evaluation should
not be use exclusively but it should serve social betterment. The authors suggest that “a
theory of evaluation influence should focus on the subset of evaluation consequences that
could plausibly lead toward or away from social betterment. Social betterment refers to
the improvement of social conditions” (p. 295). They view evaluation as an intervention
in itself, one in which “evaluation represents a change in or contribution to ongoing
processes that produce consequences, good, bad, neutral, mixed or indeterminate” (pp.
295-296). Henry and Mark developed a framework which describes the mechanisms
underlying evaluation’s influence. They built on the work of Kirkhart (2000) and Cousins
(2003) and delineate several change processes that may occur before, during or after an
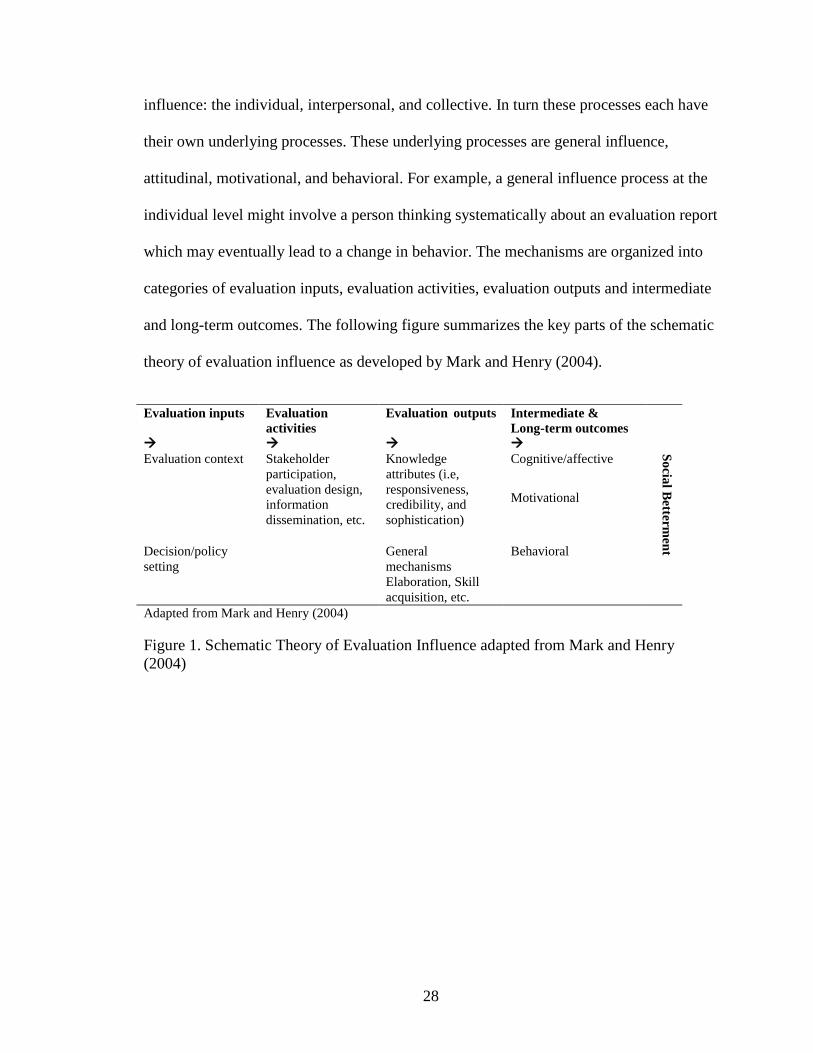
evaluation. They posit that there are three levels of analysis when examining evaluation
28
influence: the individual, interpersonal, and collective. In turn these processes each have
their own underlying processes. These underlying processes are general influence,
attitudinal, motivational, and behavioral. For example, a general influence process at the
individual level might involve a person thinking systematically about an evaluation report
which may eventually lead to a change in behavior. The mechanisms are organized into
categories of evaluation inputs, evaluation activities, evaluation outputs and intermediate
and long-term outcomes. The following figure summarizes the key parts of the schematic
theory of evaluation influence as developed by Mark and Henry (2004).
Evaluation inputs
Evaluation activities
Evaluation outputs
Intermediate & Long-term outcomes Social Betterm
ent
Evaluation context Stakeholder participation, evaluation design, information dissemination, etc.
Knowledge attributes (i.e, responsiveness, credibility, and sophistication)
Cognitive/affective
Motivational
Decision/policy setting
General mechanisms Elaboration, Skill acquisition, etc.
Behavioral
Adapted from Mark and Henry (2004)
Figure 1. Schematic Theory of Evaluation Influence adapted from Mark and Henry (2004)
29
Summary and Critique of Research on Evaluation Use
Research on evaluation use before 1997 contributed to our understanding of the
various factors that influenced evaluation use and helped identify several different kinds
of use. Henry and Mark (2003) refer to the time period of the late 1970s and early 1980s
as the “golden age” of research on evaluation use, when there was a lot of research on
use. Out of this golden age of research came the discovery of three types of evaluation
use (instrumental, conceptual and symbolic) and the identification of large categories of
factors that influence evaluation use (e.g., organizational level factors).
From 1997 to 2009 there have been 20 empirical studies that examined evaluation
use in organizations in the non-profit sector. Sixteen of the 20 studies were single or
multiple case studies or narratives based on observations of the evaluator(s) (Balthasar,
2006; Balthasar & Rieder, 2000; Boaz & Hayden, 2002; Chacon-Moscoso, Anguera-
Argilaga, Perez-Gil, & Holgado-Tello, 2002; Compton et al., 2002; Cousins et al., 2006;
Gibbs, Napp, Jolly, Westover, & Uhl, 2002; Gilliam et al., 2003; Katz, Sutherland, &
Earl, 2002; King, 2002; Lawrenz et al., 2007; Morabito, 2002; Preskill et al., 2003;
Robinson & Cousins, 2004; Weiss et al., 2005; Williams & Stern, 2002). Three studies
utilized survey research (Compton et al., 2002; Goh, Cousins, & Elliot, 2006; Preskill &
Caracelli, 1997; Torres, Preskill, & Pionek, 1997) with quantitative measures and one
study was a simulation study (Christie, 2007). The sixteen case studies were written from
the point of view of the evaluator(s). While research before 1997 employed a variety of
methods, the case study method has predominated the literature since 1997. This choice
reflects researchers’ attempts to describe the context of the evaluation and the complexity
of factors influencing use. While the case studies provide rich details about the evaluation
30
process, it is difficult to determine the strength of the factors influencing use and difficult
to determine the direction of the relationships between factors influencing use.
Knowledge about possible combinations of factors that increase evaluation use
appears to still be at an early stage of development based on the large number of
qualitative studies and a narrow range of methodologies. While research after 1997 has
built on the conceptions of use identified from previous research, the research does not
appear to build logically from these findings. For example, while early research (Alkin et
al., 1979; Moran, 1987) identified that staff participation increases evaluation use, later
research moved away from examining staff participation and did not explain it further.
Recent research (Balthasar & Reider, 2000; Chacon-Moscoso et al., 2002; King, 2002)
draws similar conclusions about staff participation influencing use but does build on
previous research and explain what kind of staff participation or what level of
participation increases use.
Also, early research by Greene (1988), Siegel and Tuckel (1985), and Rothman
(1980) drew conclusions based on reflective accounts and case studies done by the
author/evaluator(s). Current research employs similar methodologies (Cousins et al.,
2006; Preskill et al., 2003) although these two studies document their data collections and
analysis methods in a more thorough way than earlier studies. With the frequent use of
case study methodologies it is hard to follow pathways that build toward conclusions
about evaluation use. Standards for critiques of qualitative research suggest that there are
several criteria to judge the trustworthiness (or validity) of qualitative research
(Hammersley, 1992). In order to assess the plausibility and credibility of research,
Hammersley suggests that methods must be examined in detail. While many of the case
31
studies since 1997 described the situation in detail, they do not clearly delineate data
collection methods, case selection criteria, and data analyses methods. With the exception
of the studies by Cousins et al. (2006) and Goh et al. (2006) all the studies had small
sample sizes and it was difficult to make generalizations to other settings. Samples from
the recent case studies were non-random and relied on convenience. These studies’ use of
qualitative methods and small sample sizes are also an indication the exploratory nature
of the subject and the small amount of research in this area.
Today’s literature on evaluation use struggles with what to call use and how to
measure use. For example, some authors have expanded the definition to include
evaluation influence (Christie, 2007; Kirkhart, 2000; Mark & Henry, 2004). There still is
not a consensus in the literature about this topic. For example Morabito (2002) uses the
term “process influence” and others still prefer the term use (Lawrenz et al., 2007). As a
whole, research on evaluation use has defined use in various ways. Early research
focused on instrumental use while current research measures the “influence” of
evaluation in broad ways.
Current Study’s Contribution to the Literature
Shula and Cousins’ (1997) review of the literature on evaluation use concluded
that organizational context was one of the key factors that influenced use. Their review
noted that “evidence suggests that the more evaluators become schooled in the structure,
culture, and politics of their program and policy communities, the better prepared they
are to be strategic about the factors most likely to affect use (para. 34). Research since
1997 has begun to examine organizational context. Most current research on factors that
32
impact evaluation use approach “use” as a learning process in which there is an
interdependent system of participants, evaluation characteristics and context.
The current study recognizes that many of the concepts and components discussed
above are interrelated. There is some agreement among current thinkers (Cousins et al.,
2004; Patton, 1997; Preskill, 2000; Preskill et al., 2003; Weiss, 1998) that this is the case.
Patton (1997) concurs that use is best understood within an interdependent system. He
writes:
The question of how to enhance evaluation use is sufficiently complex that a piecemeal approach based on isolated prescriptions for practice is likely to have only a piecemeal impact. Overviews of research on evaluation use suggest that the problems of under use will not be solved by compiling and following a long list of evaluation axioms. It’s like trying to live your life according to Poor Richard’s Almanac. Real-world circumstances are too complex and unique to be routinely approached through the application of isolated pearls (or variables) of evaluation wisdom. (p. 20) Evaluation use is impacted by a variety of factors. This study focuses on the
interaction between some of these factors. While research in this area is new,
organizational factors appear to impact use. Because what happens within an organization
impacts evaluation use, theories that explain processes within an organization aid in
understanding evaluation use. Theories of organizational learning are appropriate to help
us understand the process of evaluation use because this set of theories examines
conditions that may predict learning and receptivity to evaluation use. In the following
section, theories of organizational learning are presented.
Review of Organizational Learning Theories
It is important to note that the topic of evaluation use has been researched in
several disciplines and each discipline tends to approach the investigation of evaluation
use differently. For example, evaluation use has been studied using theories of
33
organizational learning from the education and psychology fields (Agarwala-Rogers,
1977; Preskill, 2000; Preskill et al., 2003), using theories from sociology such as
knowledge transfer (Huberman, 1990, 1995; Landry, Amara, & Lamari, 2001), and using
agenda-setting theories from political science (Henry & Rog, 1998). A related field of
study (Huberman, 1990; Knorr, 1977; Landry et al., 2001) has examined the transfer of
research generated in academic settings to practitioners in the field.
Weiss (1998) writes about the association between evaluation and change, “use is
about change. Any theory of evaluation has to be a theory of change” (p. 31). When
examining evaluation use, several researchers (Cousins et al., 2004; Preskill, 2000;
Weiss, 1998) suggest that one has to understand the process of organizational change and
organizational learning. Similar to the work of Cousins and Preskill, this study
conceptualizes evaluation as a piece of the larger “organizational learning system”.
Evaluation is viewed as a means for organizations to increase their own organizational
learning. As Cousins et al. write
Through doing evaluation and developing the capacity to do it, organizations become more adroit in constructing shared representations of knowledge and structures, predisposed to generate new knowledge, inclined to capture and interpret external information, and apt to question basic assumptions about the organization, its goal, and strategies for achieving them. (p. 101)
Since evaluation is conceptualized as a piece of the large process of organizational
learning, this section presents an overview of organizational learning.
The Broad Scope of Organizational Learning Theories
Organizational learning (OL) is considered a psychosocial construct that refers to
the development among organizational members of shared mental understandings of the
organization and its operations (Cousins et al., 2004). Theories of organizational learning
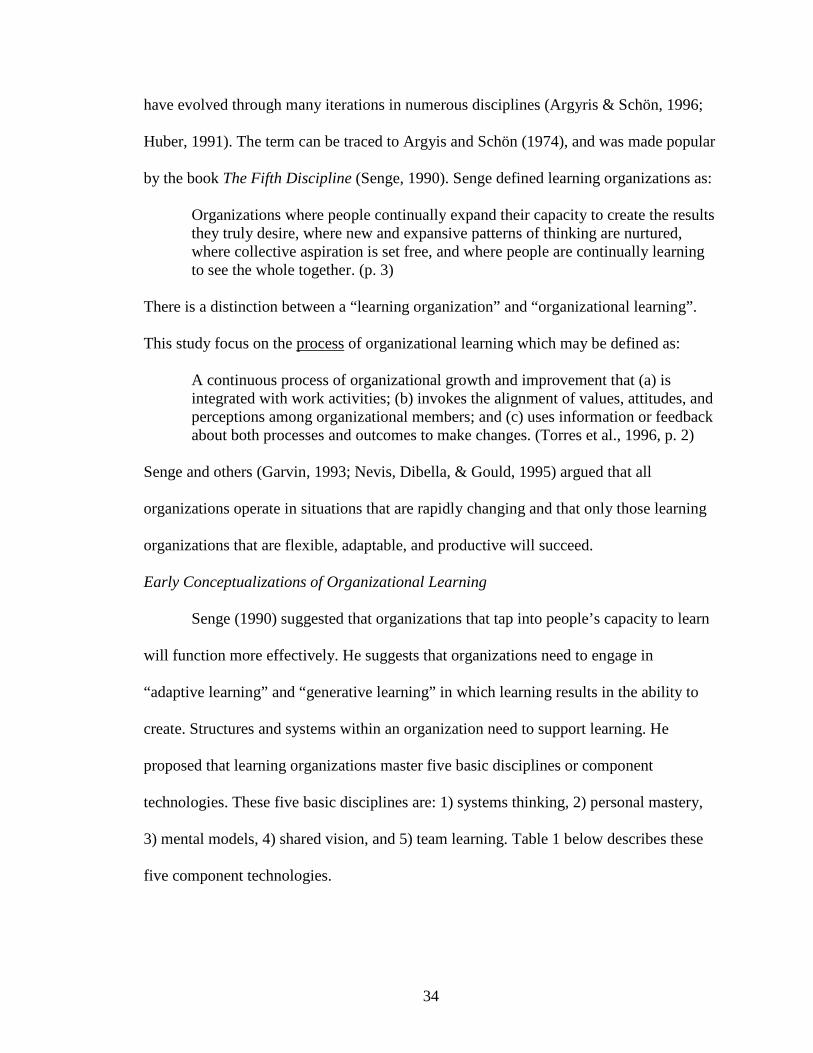
34
have evolved through many iterations in numerous disciplines (Argyris & Schön, 1996;
Huber, 1991). The term can be traced to Argyis and Schön (1974), and was made popular
by the book The Fifth Discipline (Senge, 1990). Senge defined learning organizations as:
Organizations where people continually expand their capacity to create the results they truly desire, where new and expansive patterns of thinking are nurtured, where collective aspiration is set free, and where people are continually learning to see the whole together. (p. 3)
There is a distinction between a “learning organization” and “organizational learning”.
This study focus on the process
A continuous process of organizational growth and improvement that (a) is integrated with work activities; (b) invokes the alignment of values, attitudes, and perceptions among organizational members; and (c) uses information or feedback about both processes and outcomes to make changes. (Torres et al., 1996, p. 2)
of organizational learning which may be defined as:
Senge and others (Garvin, 1993; Nevis, Dibella, & Gould, 1995) argued that all
organizations operate in situations that are rapidly changing and that only those learning
organizations that are flexible, adaptable, and productive will succeed.
Early Conceptualizations of Organizational Learning
Senge (1990) suggested that organizations that tap into people’s capacity to learn
will function more effectively. He suggests that organizations need to engage in
“adaptive learning” and “generative learning” in which learning results in the ability to
create. Structures and systems within an organization need to support learning. He
proposed that learning organizations master five basic disciplines or component
technologies. These five basic disciplines are: 1) systems thinking, 2) personal mastery,
3) mental models, 4) shared vision, and 5) team learning. Table 1 below describes these
five component technologies.
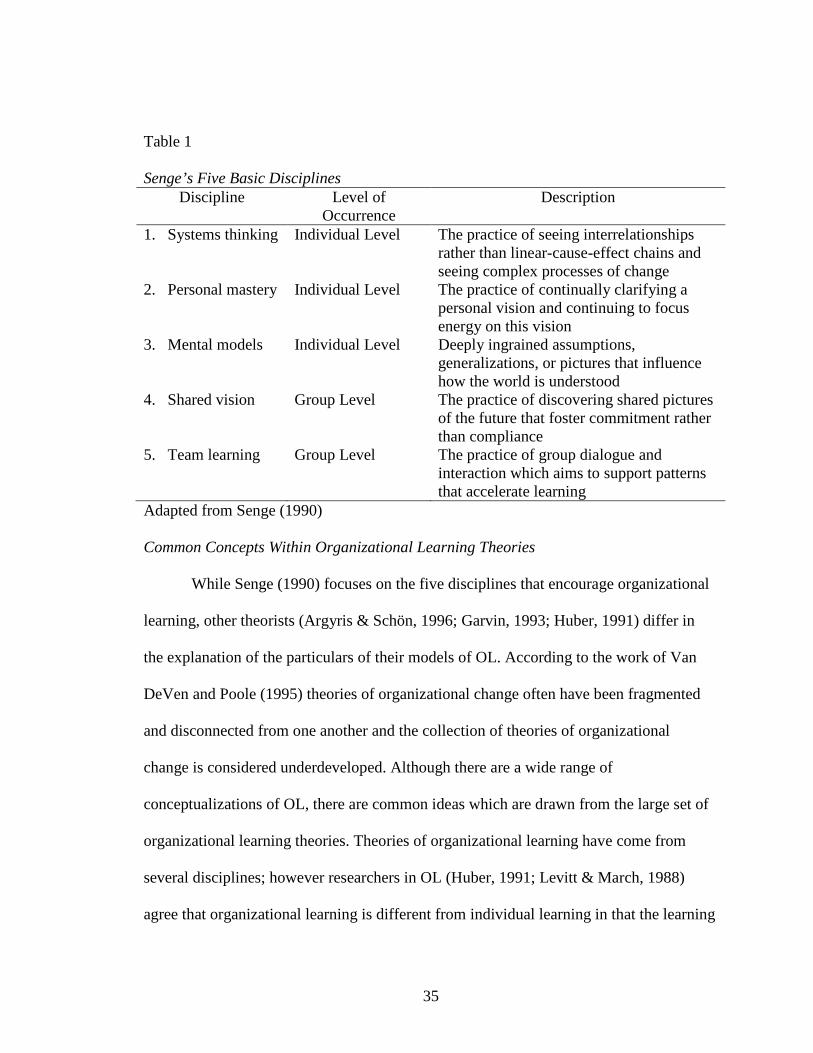
35
Table 1 Senge’s Five Basic Disciplines
Discipline
Level of Occurrence
Description
1. Systems thinking Individual Level The practice of seeing interrelationships rather than linear-cause-effect chains and seeing complex processes of change
2. Personal mastery Individual Level The practice of continually clarifying a personal vision and continuing to focus energy on this vision
3. Mental models Individual Level Deeply ingrained assumptions, generalizations, or pictures that influence how the world is understood
4. Shared vision Group Level The practice of discovering shared pictures of the future that foster commitment rather than compliance
5. Team learning Group Level The practice of group dialogue and interaction which aims to support patterns that accelerate learning
Adapted from Senge (1990) Common Concepts Within Organizational Learning Theories
While Senge (1990) focuses on the five disciplines that encourage organizational
learning, other theorists (Argyris & Schön, 1996; Garvin, 1993; Huber, 1991) differ in
the explanation of the particulars of their models of OL. According to the work of Van
DeVen and Poole (1995) theories of organizational change often have been fragmented
and disconnected from one another and the collection of theories of organizational
change is considered underdeveloped. Although there are a wide range of
conceptualizations of OL, there are common ideas which are drawn from the large set of
organizational learning theories. Theories of organizational learning have come from
several disciplines; however researchers in OL (Huber, 1991; Levitt & March, 1988)
agree that organizational learning is different from individual learning in that the learning
36
occurs collectively with others. These theories in general focus on the social processing
of knowledge. Most focus on explaining the exchange of individual knowledge with the
effect of creating a shared set of ideas within a group context. This shared knowledge is
then acted upon within an organizational setting (Honig, 2004). Most theorists agree that
organizational learning is a phenomenon in which the whole is greater than the sum of
the individual learning of its members and the process of learning is a group process
(Huber, 1991). A core component of OL is that members of an organization learn at the
individual level and this learning can evolve to “double-loop learning.” Argyis and Schön
(1978) suggest that “Double loop learning occurs when error is detected and corrected in
ways that involve the modification of an organization’s underlying norms, policies and
objectives” (p. 3). Often, the result of double loop learning is that individuals change
fundamental assumptions about the organization. The change in assumptions then leads
to questioning practices or understandings and then ultimately altering operations of the
organization.
Characteristics of Learning Organizations
While theorists such as Argyis and Schön (1996) focused on clarifying the
process of how double loop learning occurs, other researchers (Garvin, 1993; Goh &
Richards, 1997) focused on identifying specific characteristics of organizations that
promoted organizational learning. Goh and Richards identified organizational
characteristics and management practices that promote organizational learning. They
conclude from a review of the organizational learning literature that learning
organizations have five core strategic building blocks. These building blocks are
presented in Table 2 below.
37
Table 2 Learning Organization Building Blocks
Building Block
Description
1. Clarity of mission and vision
The degree to which employees have a clear vision/mission or the organization and understand how they can contribute to its success and achievement
2. Leadership The role of leaders in the organization with respect to helping employees learn and elicit behaviors that are consistent with an experimenting and changing culture
3. Experimentation The degree of freedom employees enjoy in the pursuit of new ways of getting the job done and freedom to take risks
4. Transfer of Knowledge
The systems that enable employees to learn from others, from past failures, and from other organizations
5. Teamwork and group problem-solving
The degree of teamwork possible in the organization to solve problems and generate new and innovate ideas
Adapted from Goh and Richards (1997) Goh and Richards (1997) suggest that organizations that work to support the creation of
these building blocks become learning organizations. While several researches have
concluded that organizations vary widely in their ability to learn (Fiol & Lyles, 1985;
Porras & Robertson, 1992; Senge, 1990), less is known about how to sustain high-levels
of ongoing learning (Garvin, 1993). The work of Cousins et al. (2004) draws from
theories of organization learning and concepts in evaluation and attempts to explain some
processes that may encourage sustained organizational learning. Because the current
study focuses on evaluation use, theories and models that focus on evaluation as a
contributor to organization learning are particularly relevant. The work of Cousins et al.
38
adapted the model of organizational leaning theory posited by Goh and Richards (1997)
and added concepts of evaluation.
Organizational Learning Theory and Evaluation
While there are several theorists within organizational learning, theories that
speak to the specifics of evaluation as a small part of organizational learning are new to
organizational learning literature. Work by Cousins et al. (2004) presents a conceptual
framework in which evaluation is a part of the organizational learning system. Their
framework is the only known theoretical work that has merged organizational learning
theory with concepts from evaluation. Their framework views “evaluation as an
organizational learning system” (p. 101). Specifically their work examines “the
conceptual interconnections and linkages among developments in the domains of
evaluation utilization, evaluation capacity building, and organizational learning” (p. 99).
Figure 2 below presents the primary concepts in their framework, the key variables of
interest (spheres), and the relationships between them (arrows).
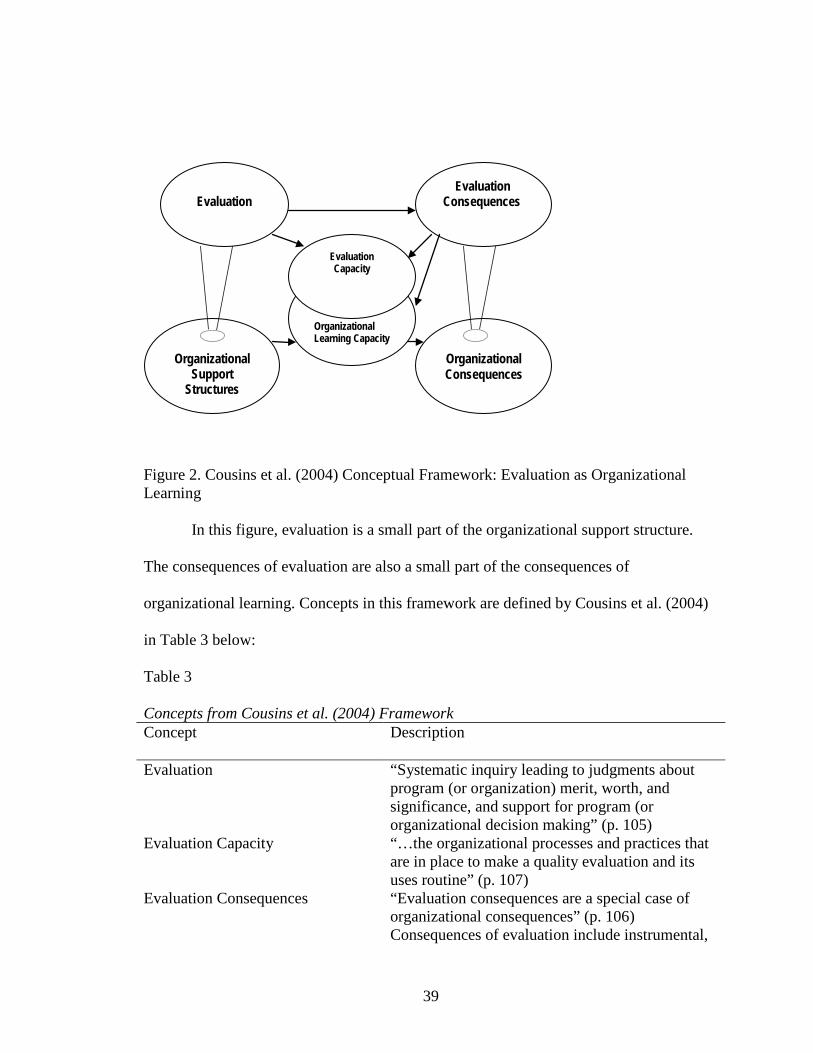
39
Figure 2. Cousins et al. (2004) Conceptual Framework: Evaluation as Organizational Learning
In this figure, evaluation is a small part of the organizational support structure.
The consequences of evaluation are also a small part of the consequences of
organizational learning. Concepts in this framework are defined by Cousins et al. (2004)
in Table 3 below:
Table 3 Concepts from Cousins et al. (2004) Framework Concept Description
Evaluation “Systematic inquiry leading to judgments about program (or organization) merit, worth, and significance, and support for program (or organizational decision making” (p. 105)
Evaluation Capacity “…the organizational processes and practices that are in place to make a quality evaluation and its uses routine” (p. 107)
Evaluation Consequences “Evaluation consequences are a special case of organizational consequences” (p. 106) Consequences of evaluation include instrumental,
Organizational Learning Capacity
Evaluation
Evaluation Capacity
Evaluation Consequences
Organizational
Support Structures
Organizational Consequences
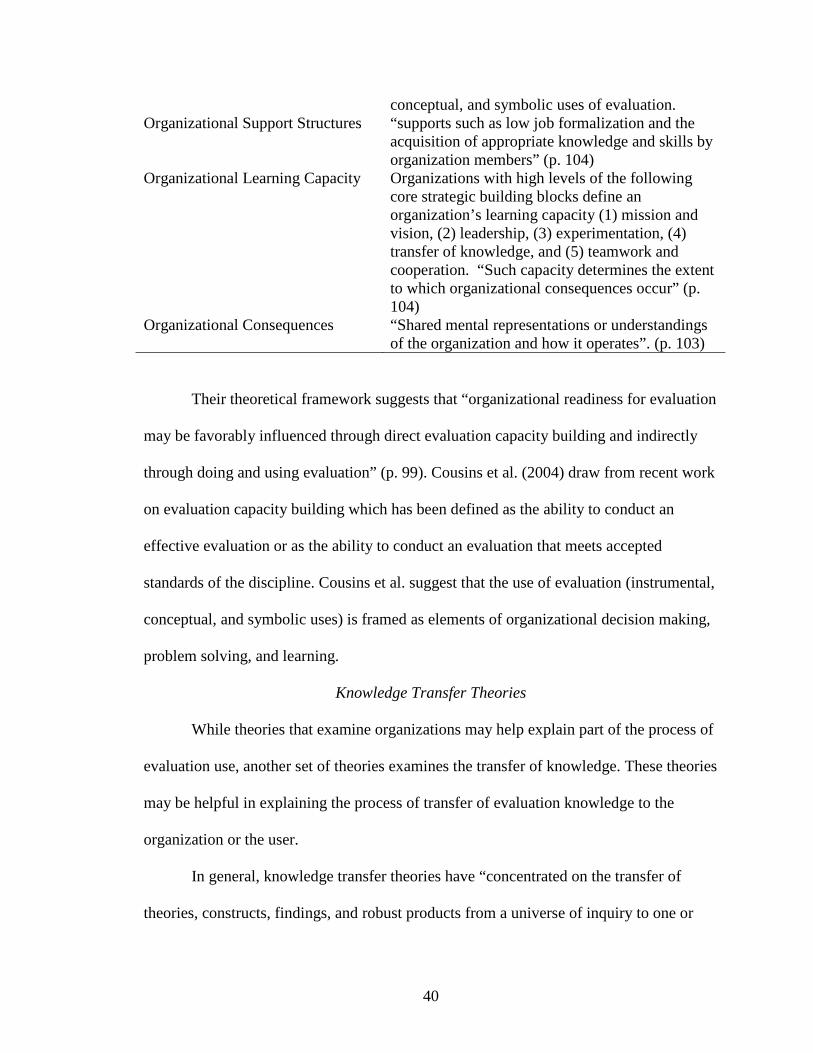
40
conceptual, and symbolic uses of evaluation. Organizational Support Structures “supports such as low job formalization and the
acquisition of appropriate knowledge and skills by organization members” (p. 104)
Organizational Learning Capacity Organizations with high levels of the following core strategic building blocks define an organization’s learning capacity (1) mission and vision, (2) leadership, (3) experimentation, (4) transfer of knowledge, and (5) teamwork and cooperation. “Such capacity determines the extent to which organizational consequences occur” (p. 104)
Organizational Consequences “Shared mental representations or understandings of the organization and how it operates”. (p. 103)
Their theoretical framework suggests that “organizational readiness for evaluation
may be favorably influenced through direct evaluation capacity building and indirectly
through doing and using evaluation” (p. 99). Cousins et al. (2004) draw from recent work
on evaluation capacity building which has been defined as the ability to conduct an
effective evaluation or as the ability to conduct an evaluation that meets accepted
standards of the discipline. Cousins et al. suggest that the use of evaluation (instrumental,
conceptual, and symbolic uses) is framed as elements of organizational decision making,
problem solving, and learning.
Knowledge Transfer Theories
While theories that examine organizations may help explain part of the process of
evaluation use, another set of theories examines the transfer of knowledge. These theories
may be helpful in explaining the process of transfer of evaluation knowledge to the
organization or the user.
In general, knowledge transfer theories have “concentrated on the transfer of
theories, constructs, findings, and robust products from a universe of inquiry to one or
41
more universes of practices” (Kramer, 2002, p. 2). “Knowledge transfer” has varied
meanings and has been studied in several different disciplines (Valente & Rogers, 1995).
Various disciplines use different terminology interchangeably. For example, the terms
“ideas” and “innovation” often replace the word “knowledge”. The terms which are
comparable with the term “transfer” include “dissemination”, and “diffusion”.
“Knowledge” as it is understood in the field of evaluation and in this study, can be
defined as any information learned from the process or results of the evaluation.
Research in the area of knowledge transfer grew initially from work in the 1930s
by Kurt Lewin (1935) and later from the work of Paul Lazarsfeld (1944). Both of these
theorists believed that a scientific body of knowledge could alleviate social problems.
Lewin (1935) was among the first to identify research-generated transactions between
different kinds of knowledge producers and users. From this early work grew research
about the dissemination and use of research. As discussed previously, there was a
resurgence of research about the use of research findings in the 1960s and 1970s (Weiss,
1972; Weiss & Bucuvalas, 1977) after large amounts of money were spent studying the
effects of anti-poverty programs. The theories reviewed for the current study were
selected because they 1) focus on the transfer of knowledge in an organizational or group
setting and 2) have been used to explain the transfer of research and/or evaluation to
organizational members.
One of the most well-known of these theories is the theory of diffusion of
innovation (Rogers, 1962). Diffusion of innovation explains the process by which an
innovation is communicated through certain channels over time among the members of a
social system (Rogers, 1962). Roger’s definition includes four main elements: 1)
42
innovation, 2) communication channels, 3) time, and 4) social system. According to
Rogers, innovation is an idea, a set of practices or objects that are perceived as new by an
individual or another unit of adoption. Communication channels are the means by which
messages get from one individual to another. Time is comprised of three factors 1) the
innovation-decision process, 2) the relative time in which an innovation is adopted by an
individual or organization, and 3) the rate of adoption of the innovation. Finally, Rogers
described the “social system” as a set of interrelated units that engage in collective
problem solving in order to accomplish a common goal. Rogers identifies characteristics
of organizations that encourage innovation. Specifically he suggests that leaders’
attitudes toward change, complexity, interconnectedness, organizational slack, and size
encourage innovation. In contrast, an organization that is heavily centralized and
formalized discourages innovation.
Theorists who later built on Rogers’ work concluded the following about
innovation
. . . the innovation journey is neither sequential or orderly, nor is it a matter of random trial and error; rather it is characterized as a nonlinear dynamic system. The system consists of a cycle of divergent and convergent activities that may be repeated over time and at different organizational levels if enabling and constraining conditions are present. (Van De Ven, Polley, Garud, & Venkataraman, 1999, p. 3)
Several other researchers (Huberman, 1990; Kramer, Cole, & Leithwood, 2004;
Landry et al., 2001) have examined the transfer of traditional research from academic
institutions to other arenas. While they focus on transferring a different kind of
knowledge, these models have relevance for the transfer of evaluation information to a
program. The difference is that evaluation knowledge is locally-developed and the
content of the knowledge is more audience-specific. Other researchers discussed
43
previously (Alkin et al., 1979; Cousins et al., 2006; Patton et al., 1977; Torres et al.,
1996; Weiss, 1972, 1998) have focused on the transfer of information to and from
evaluation to the social programs.
Huberman (1995) suggests that the person who transfers information to and from
the research world to a professional setting is the “intermediary”. He suggests that all
research knowledge is bargained and that social transactions within a particular setting
dictate the level of use. Most of his work examined the use of research in educational
settings. He concluded that
The determinants of whether and how a piece of research will be ‘used’ in a given school district depends entirely on the social transactions within that setting: where the uncertainties are, where the conflicts are, who had to lose and gain by the implications of the study, whose points of view are given greater weight and whose given lesser weight by the conclusions of the study. (para. 18)
There are “intermediaries” who act as linkage mechanisms between research and
professional settings. Huberman’s conceptual model also describes “dissemination
competence”. Dissemination competence involves engaging in tasks such as producing
different products for distinct audiences, ensuring repetition of important research ideas,
and having in-person contact within the user setting. He stresses that “interpersonal links”
are the key to research use and suggests that sustained interactivity between a researcher
and the professional in the field results in higher levels of use. He writes. “If it takes the
research team two years to get a hold of its study, conceptually speaking, why should we
assume that the reading of a single research report in a few days by a colleague or a
layperson will bring enlightenment?” (p. 25). He also suggests that reciprocal effects
exist between the researcher and professional. The researcher is also the recipient of
knowledge and the sustained interactivity is bidirectional.
44
Kramer et al. (2004) suggest a similar interplay of variables that promote
knowledge transfer. They write that
knowledge transfer is a flow of activity that cumulatively maps on, impinges on, impacts, influences, and moulds the research, the knowledge broker, the workplace parties, and the workplace. The process of the creation and use of knowledge was conceived as socially constructed, socially mediated, flexible, and ever changing. (p. 317)
Kramer’s other work (2002) and research by Oh (1997) suggest that knowledge transfer
results from the process of social construction and that meaning is negotiated and viewed
within a social context. Kramer et al. (2004) conclude that principles of “effective
knowledge transfer” have emerged from the research on knowledge transfer. Kramer et
al. conclude that there are different elements within the knowledge transfer process.
These include 1) the knowledge or innovation; 2) the organization that receives the
knowledge; 3) the collaboration between the research environment and the work; 4) the
evaluation of the knowledge utilization.
Theories of knowledge transfer have been grouped into larger categories by
Landry et al. (2001). Landry et al. use the term knowledge utilization but they are
referring to theories of knowledge transfer. Their review of models of knowledge
utilization concludes that “the literature on knowledge utilization focuses on four major
alternatives…a science push model, a demand pull model, a dissemination model and an
interaction model” (Landry et al., 2001). The science push model suggests that the
primary determinant of knowledge use is the supply of research findings. “In this model,
the researchers are the source of the ideas for directing research, and the users are simple
receptacles for the results of the research” (p. 334).
45
In contrast, the demand pull model suggests that users become the major source of
ideas for directing research. In this scenario “knowledge utilization is explained only by
the needs of the users; use of knowledge is increased when researchers focus their
projects on the needs of users, instead of focusing them only on the advancement of
scholarly knowledge” (p. 335). The dissemination model was developed in response to
the fact that even though a user might be receptive to knowledge, knowledge is not
always used. The dissemination model “explains knowledge utilization with the recourse
to two determinants: the types of research results and the dissemination effort” (p. 335).
Finally, the interaction model was developed to improve upon the weaknesses in
previous models. Landry et al. (2001) conclude the following about the interaction model
“It suggests that knowledge utilization depends on various disorderly interactions
occurring between researchers and users rather than on linear sequences beginning with
the needs of the researchers or the needs of the users” (p. 335). Other theorists in this area
(Oh, 1997) predict that sustained interactions between researcher and user result in more
use. As previously discussed, the work of Huberman (1987; Huberman, 1990, 1995)
draws from this model of social interaction and similarly concludes that sustained
interactivity is a key component of greater evaluation use.
Oh (1997) presents a model explaining the impact of research on policymaking.
In Oh’s model, individual background variables, organizational characteristics, decision
makers’ perceptions, and characteristics of information all interact to result in an impact
on policymaking. Oh suggests that the interaction of these variables impacts policy-
making decisions.
46
Application of Theories to Current Study
Theories of organizational learning and models of knowledge transfer point to
several variables of interest in the exploration of evaluation use. First, organizational
learning literature suggests that an organization learns in a way that is distinct from
individual learning and that some organizations are better at learning than others. The
empirical literature supports this claim and suggests that some organizations may be more
ready than others for learning and/or change. While there are a wide range of
organizational learning theories and models, one model that delineates more specific
variables of interest is the framework developed by Cousins et al. (2004). This model
which has been recently adapted to organizational behavior may help explicate the
process of evaluation use. Specifically, it suggests that some organizations will be more
ready to learn or change and thus may engage in evaluation use more frequently. While
this theory suggests an exploration of the context in which evaluation takes places,
models of knowledge transfer suggest an examination of the process of information
exchange from an intermediary to an organization. In the context of evaluation, an
evaluator serves as the intermediary between one environment and another environment.
Characteristics and perceptions of the intermediary may impact the knowledge transfer.
For example, Huberman (1995) suggests that the social interaction impacts the
knowledge transfer process.
While the research about evaluation use has investigated numerous factors that
impact use, it has not examined the ways in which evaluator characteristics and
organizational characteristics may interact and ultimately impact use. In addition, we
know little about the ways in which evaluators approach organizations at different levels
47
of readiness for organizational learning. Nor are there explanation of the ways in which
evaluators’ interactions with organizations impact evaluation design and the promotion of
evaluation use. This study contributes to the literature through its focus on some of these
unexamined variables that may impact use. Also, it measured empirically the extent and
strength of the relationship between these variables.
Conceptual Model, Research Questions, and Hypotheses
The literature on evaluation use points to four categories of factors that influence
evaluation use. This study examined the interaction between two of these categories.
Also, the theories reviewed may contribute to an understanding of how these variables
interact with one another. The models of knowledge transfer and readiness for
organizational learning suggested several variables of interest for this study in its
examination of evaluation use.
The study integrated concepts from these two models in order to examine the
relationship of organizational readiness for change and evaluator characteristics and the
ways in which this interplay impacts evaluation use. In this integrated model, the
evaluator perceives organizational readiness for change based on his/her particular
perceptions. These perceptions are based on a variety of factors including characteristics
of the evaluator and characteristics of the organization. These perceptions impact the
evaluator’s decisions about how to design an evaluation. These perceptions also impact
the evaluator’s recommendations about the uses to be made of an evaluation.
Figure 3 represents all of the factors that may impact evaluation use. The dark
black arrows represent relationships that this study examined. The lighter gray arrows are
relationships that impact evaluation use but were not explored. Because the study
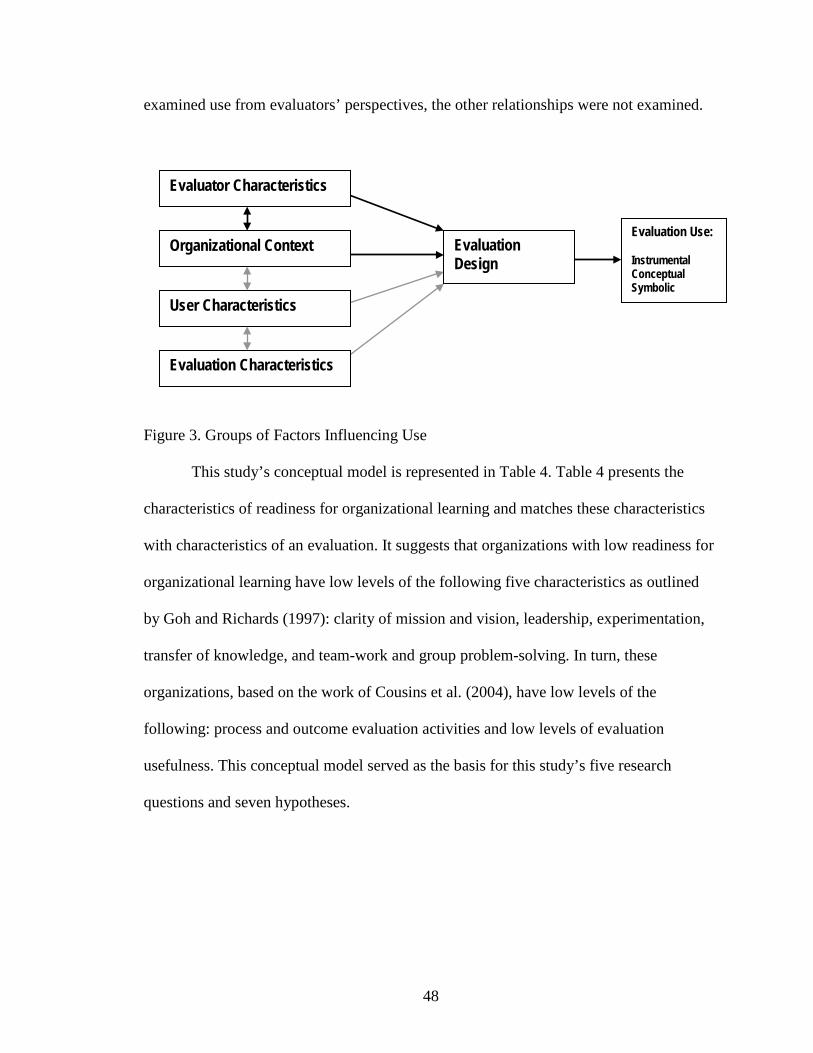
48
examined use from evaluators’ perspectives, the other relationships were not examined.
Figure 3. Groups of Factors Influencing Use
This study’s conceptual model is represented in Table 4. Table 4 presents the
characteristics of readiness for organizational learning and matches these characteristics
with characteristics of an evaluation. It suggests that organizations with low readiness for
organizational learning have low levels of the following five characteristics as outlined
by Goh and Richards (1997): clarity of mission and vision, leadership, experimentation,
transfer of knowledge, and team-work and group problem-solving. In turn, these
organizations, based on the work of Cousins et al. (2004), have low levels of the
following: process and outcome evaluation activities and low levels of evaluation
usefulness. This conceptual model served as the basis for this study’s five research
questions and seven hypotheses.
Evaluator Characteristics
Organizational Context
User Characteristics
Evaluation Characteristics
Evaluation Use: Instrumental Conceptual Symbolic
Evaluation Design
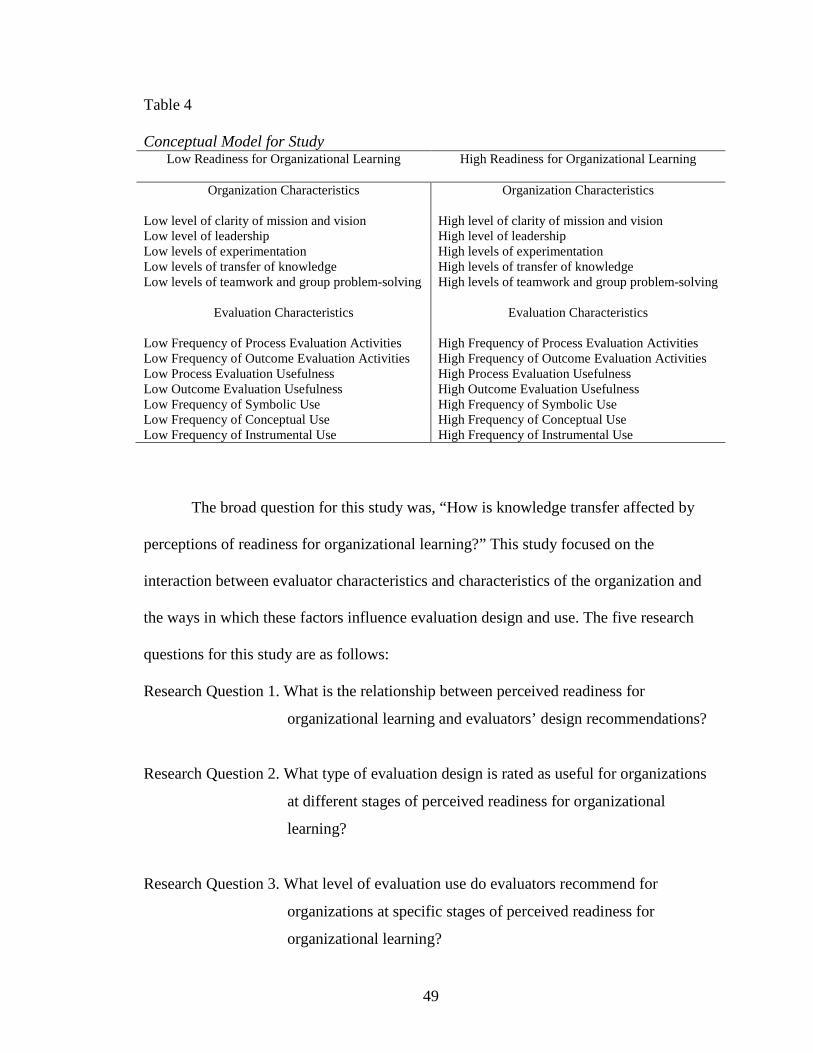
49
Table 4
Conceptual Model for Study Low Readiness for Organizational Learning High Readiness for Organizational Learning
Organization Characteristics Organization Characteristics
Low level of clarity of mission and vision High level of clarity of mission and vision Low level of leadership High level of leadership Low levels of experimentation High levels of experimentation Low levels of transfer of knowledge High levels of transfer of knowledge Low levels of teamwork and group problem-solving High levels of teamwork and group problem-solving
Evaluation Characteristics Evaluation Characteristics
Low Frequency of Process Evaluation Activities High Frequency of Process Evaluation Activities Low Frequency of Outcome Evaluation Activities High Frequency of Outcome Evaluation Activities Low Process Evaluation Usefulness High Process Evaluation Usefulness Low Outcome Evaluation Usefulness High Outcome Evaluation Usefulness Low Frequency of Symbolic Use High Frequency of Symbolic Use Low Frequency of Conceptual Use High Frequency of Conceptual Use Low Frequency of Instrumental Use High Frequency of Instrumental Use
The broad question for this study was, “How is knowledge transfer affected by
perceptions of readiness for organizational learning?” This study focused on the
interaction between evaluator characteristics and characteristics of the organization and
the ways in which these factors influence evaluation design and use. The five research
questions for this study are as follows:
Research Question 1. What is the relationship between perceived readiness for
organizational learning and evaluators’ design recommendations?
Research Question 2. What type of evaluation design is rated as useful for organizations
at different stages of perceived readiness for organizational
learning?
Research Question 3. What level of evaluation use do evaluators recommend for
organizations at specific stages of perceived readiness for
organizational learning?
50
Research Question 4. What are the characteristics of the evaluator that help one discern
readiness for organizational learning?
Research Question 5. What is the relationship between evaluator characteristics,
perceived readiness for organizational learning, and
recommendations for evaluation design and use?
The hypotheses based on these research questions were as follows:
H1. Evaluators will recommend high levels of process evaluation for organizations
perceived to have low levels of readiness for organizational learning.
H2. Evaluators will recommend high levels of outcome evaluation for organizations
perceived to have high levels of readiness for organizational learning.
H3. Evaluators will rate process evaluation as more useful for an organization with low
levels of readiness for organizational learning compared to an organization with
high levels of readiness for organizational learning
H4. Evaluators will rate outcome evaluation as more useful for an organization with
high levels of readiness for organizational learning as compared to an organization
with low levels of readiness for organizational learning.
H5. Evaluator characteristics are related to their perceptions of readiness for
organizational learning and their design recommendations
H6. Evaluator characteristics are related to their ability to accurately identify readiness
for organizational learning
H7. Evaluators match design and use recommendations based on an interplay between
their characteristics and readiness for organizational learning
51
Summary This chapter reviewed literature on evaluation use and the theories and models
applied in the development of the conceptual model for this study. The conceptual model
for this study was presented. This conceptual model served as the foundation for my
research questions and research design. Chapter 3 presents the rationale for each of the
seven hypotheses and the methods utilized in the testing of this study’s hypotheses. It
describes the research design and defines the concepts measured in this study.
52
CHAPTER 3.
Methodology
Introduction
This chapter presents the methods utilized in testing this study’s hypotheses. It
presents the study’s research questions and supporting rationale for each hypothesis. It
also describes the survey research design and definition of key concepts. The last section
of this chapter describes methods utilized for data preparation and analyses.
Research Questions, Hypotheses, and Supporting Rationale
This section presents each of the five research questions followed by the supporting
rationale and corresponding hypotheses.
Research Question One RQ1. What is the relationship between perceived readiness for organizational learning
and evaluators’ design recommendations?
RQ1. Rationale Organizational learning theory suggests that organizations differ in their ability to
learn and process information (Cousins et al., 2004; Garvin, 1993; Goh & Richards,
1997; Huber, 1991). Compton et al. (2002) found that evaluation activities that respond to
the organization’s structures, cultures, and every day practices increase evaluation use.
Therefore, evaluators may design an evaluation to match an organization’s particular
readiness for organizational learning.
Evaluations are typically comprised of various levels of process and outcome
evaluation activities. This rationale led to hypotheses one and two in this study. While
there is no literature available suggesting levels of process or outcome evaluation
53
activities that an evaluator would recommend, the hypotheses are directional based on
this study’s conceptual model. Thus, the following two hypotheses specify high or low
levels of process or outcome evaluation.
Hypotheses Based on Research Question One
H1. Evaluators will recommend high levels of process evaluation for organizations
perceived to have low levels of readiness for organizational learning.
H2. Evaluators will recommend high levels of outcome evaluation for organizations
perceived to have high levels of readiness for organizational learning.
Research Question Two
RQ2. What type of evaluation design is rated as useful for organizations at different
stages of perceived readiness for organizational learning?
RQ2. Rationale
Research (Compton et al., 2002; Cousins et al., 2006; Greene, 1988; Patton, 1997;
Preskill et al., 2003) suggests that particular types of evaluation activities lead to more
evaluation use. Other research (Balthasar, 2006; Cousins et al., 2006; Gibbs et al., 2002;
Goh et al., 2006) suggests that organizational level factors impact the ability of
organizations to use evaluation. Therefore, evaluators will rate process and outcome
evaluation activities as more useful based on an examination of organizational
characteristics. This rationale leads to hypotheses three and four.
Hypotheses Based on Research Question Two
H3. Evaluators will rate process evaluation as more useful for an organization with low
levels of readiness for organizational learning compared to an organization with
high levels of readiness for organizational learning
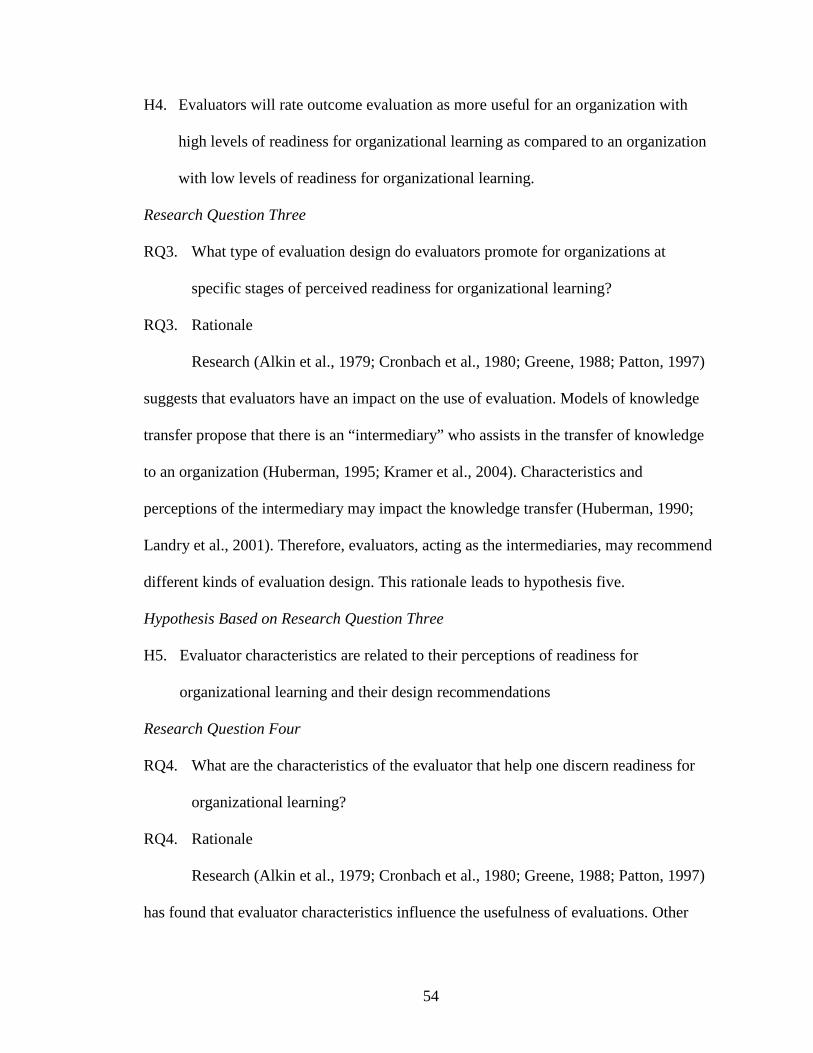
54
H4. Evaluators will rate outcome evaluation as more useful for an organization with
high levels of readiness for organizational learning as compared to an organization
with low levels of readiness for organizational learning.
Research Question Three RQ3. What type of evaluation design do evaluators promote for organizations at
specific stages of perceived readiness for organizational learning?
RQ3. Rationale
Research (Alkin et al., 1979; Cronbach et al., 1980; Greene, 1988; Patton, 1997)
suggests that evaluators have an impact on the use of evaluation. Models of knowledge
transfer propose that there is an “intermediary” who assists in the transfer of knowledge
to an organization (Huberman, 1995; Kramer et al., 2004). Characteristics and
perceptions of the intermediary may impact the knowledge transfer (Huberman, 1990;
Landry et al., 2001). Therefore, evaluators, acting as the intermediaries, may recommend
different kinds of evaluation design. This rationale leads to hypothesis five.
Hypothesis Based on Research Question Three
H5. Evaluator characteristics are related to their perceptions of readiness for
organizational learning and their design recommendations
Research Question Four
RQ4. What are the characteristics of the evaluator that help one discern readiness for
organizational learning?
RQ4. Rationale
Research (Alkin et al., 1979; Cronbach et al., 1980; Greene, 1988; Patton, 1997)
has found that evaluator characteristics influence the usefulness of evaluations. Other
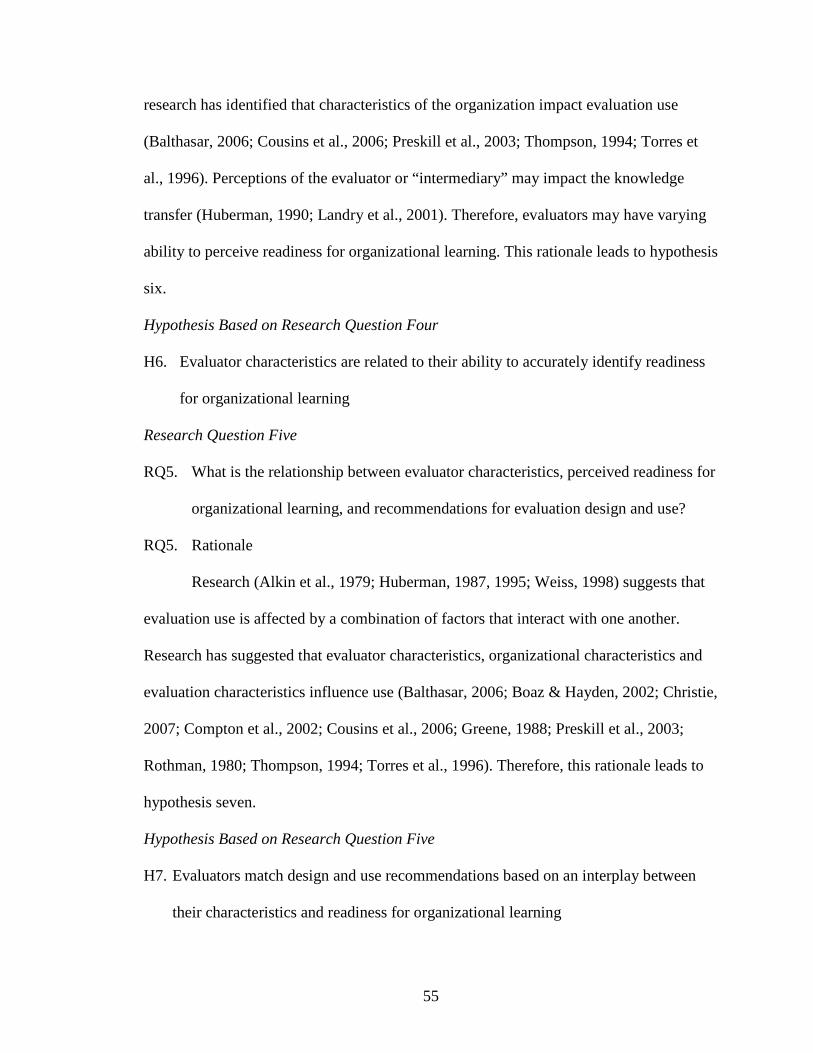
55
research has identified that characteristics of the organization impact evaluation use
(Balthasar, 2006; Cousins et al., 2006; Preskill et al., 2003; Thompson, 1994; Torres et
al., 1996). Perceptions of the evaluator or “intermediary” may impact the knowledge
transfer (Huberman, 1990; Landry et al., 2001). Therefore, evaluators may have varying
ability to perceive readiness for organizational learning. This rationale leads to hypothesis
six.
Hypothesis Based on Research Question Four
H6. Evaluator characteristics are related to their ability to accurately identify readiness
for organizational learning
Research Question Five
RQ5. What is the relationship between evaluator characteristics, perceived readiness for
organizational learning, and recommendations for evaluation design and use?
RQ5. Rationale
Research (Alkin et al., 1979; Huberman, 1987, 1995; Weiss, 1998) suggests that
evaluation use is affected by a combination of factors that interact with one another.
Research has suggested that evaluator characteristics, organizational characteristics and
evaluation characteristics influence use (Balthasar, 2006; Boaz & Hayden, 2002; Christie,
2007; Compton et al., 2002; Cousins et al., 2006; Greene, 1988; Preskill et al., 2003;
Rothman, 1980; Thompson, 1994; Torres et al., 1996). Therefore, this rationale leads to
hypothesis seven.
Hypothesis Based on Research Question Five
H7. Evaluators match design and use recommendations based on an interplay between
their characteristics and readiness for organizational learning
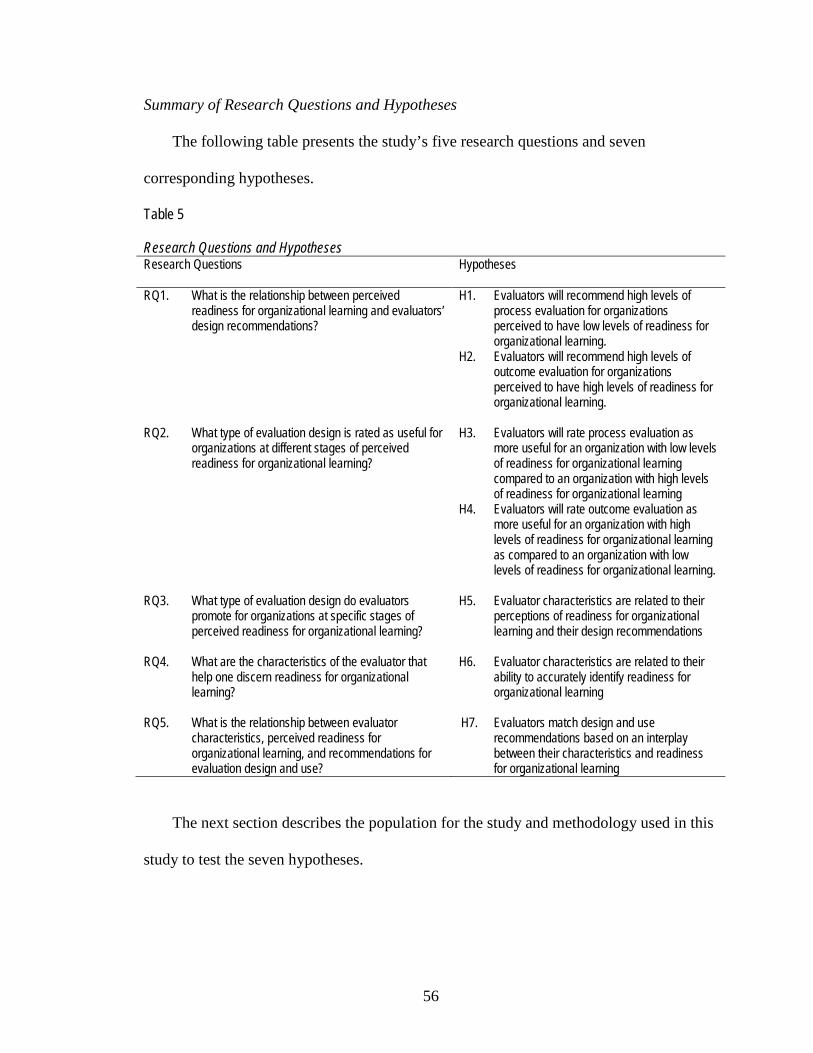
56
Summary of Research Questions and Hypotheses
The following table presents the study’s five research questions and seven
corresponding hypotheses.
Table 5
Research Questions and Hypotheses Research Questions
Hypotheses
RQ1. What is the relationship between perceived readiness for organizational learning and evaluators’ design recommendations?
H1. Evaluators will recommend high levels of process evaluation for organizations perceived to have low levels of readiness for organizational learning.
H2. Evaluators will recommend high levels of outcome evaluation for organizations perceived to have high levels of readiness for organizational learning.
RQ2. What type of evaluation design is rated as useful for
organizations at different stages of perceived readiness for organizational learning?
H3. Evaluators will rate process evaluation as more useful for an organization with low levels of readiness for organizational learning compared to an organization with high levels of readiness for organizational learning
H4. Evaluators will rate outcome evaluation as more useful for an organization with high levels of readiness for organizational learning as compared to an organization with low levels of readiness for organizational learning.
RQ3. What type of evaluation design do evaluators
promote for organizations at specific stages of perceived readiness for organizational learning?
H5. Evaluator characteristics are related to their perceptions of readiness for organizational learning and their design recommendations
RQ4. What are the characteristics of the evaluator that
help one discern readiness for organizational learning?
H6. Evaluator characteristics are related to their ability to accurately identify readiness for organizational learning
RQ5. What is the relationship between evaluator
characteristics, perceived readiness for organizational learning, and recommendations for evaluation design and use?
H7. Evaluators match design and use recommendations based on an interplay between their characteristics and readiness for organizational learning
The next section describes the population for the study and methodology used in this
study to test the seven hypotheses.
57
Methodology and Survey Design
Population
The population for the study was members of the American Evaluation
Association (AEA) who reside in the United States and are not students. The American
Evaluation Association “is an international professional association of evaluators devoted
to the application and exploration of program evaluation, personnel evaluation,
technology, and many other forms of evaluation” (American Evaluation Association,
2007, para. 1). Permission was secured from the AEA Executive Committee to survey a
sample of its approximately 5,000 members. The Case Western Reserve University
Institutional Review Board (IRB) reviewed this study’s research protocol in April 2008
and the protocol was deemed exempt from IRB oversight. A copy of the AEA member
database was secured in September of 2008. A random sample of members was generated
from this AEA member database.
Sample Size and Statistical Power
A power analysis was conducted using the software provided by Raosoft
(Raosoft, 2004). It was determined that as of September 2008 there were 3,268 AEA
members who were not students members and lived primarily in the United States (AEA
Database, 2008). With a population of 3,268 AEA members who met the inclusion
criteria specified, a confidence level of 95%, a margin of error of 5% and a response
distribution of 50%, the recommended sample size was 344 persons. Chapter 4 discusses
the response rate for this study.
58
Methodology
The web-based survey included written vignettes describing two different
organizations (See Appendix A for a copy of the survey instrument). The vignettes
described one organization that was ready to learn and another organization that was not
ready to learn. Appendix B describes characteristics of readiness for organizational
learning (OL) matched with the sentence of words in each vignette that describes this
particular characteristic. Survey respondents answered a series of questions about how
they would design an evaluation for each of the two organizations and how they would
suggest the evaluation be best used. Evaluators were asked questions about their
approach to evaluation and about their background characteristics. The survey posed a set
of questions about recommendations for evaluation design and for evaluation use after
each vignette was presented.
Respondents received an individual email invitation (Appendix C) that asked if
they would be willing to participate in a survey. The email invitation included an html
link to web-based survey. If respondents agreed to participate in the survey they clicked
on the link and began answering survey questions. Participation in the survey was
encouraged by offering each participant the opportunity to be entered into a drawing for
one of ten $50 gift certificates to Amazon.com, sending two email reminders one week
and three weeks after the initial email invitation, and keeping the web-based survey open
for four weeks to allow respondents time to complete the survey. All data collected on the
survey were anonymous and the email invitation and the website did not provide any
identifiers. If participants chose to be entered into the drawing, they entered their email
59
address in a separate website. This website stored their email address in a database that
was completely separate from their survey responses.
Software
In order to ensure that a potential respondent received an individual email and not
a “group email” the software World Merge was utilized. This software allowed email
invitations to be sent to each individual with only one respondent’s name visible per e-
mail and prevented the email from being caught in any spam filters that disallow
individuals from receiving group emails. The survey software Survey Monkey was
utilized for creation of the web-based survey and for storage of survey responses.
Piloting Survey
In order to test the use of the web-based survey and the e-mail invitation process,
eight evaluators were recruited to pilot the web-based survey. These evaluators piloted
the web-based survey and were interviewed individually over the phone about their
experience taking the survey. Questions asked to pilot participants are included in
Appendix D. For the pilot, the average length of time it took to complete the survey
ranged from 12 to 35 minutes with an average of 21 minutes (n = 8). Dissertation
committee members also piloted the web-based survey and gave written feedback about
the process of taking the survey and about the clarity of survey questions. Revisions were
made to the survey based on the feedback from eight pilot participants and four
committee members.
Definitions
The following section defines the concepts measured in this study.
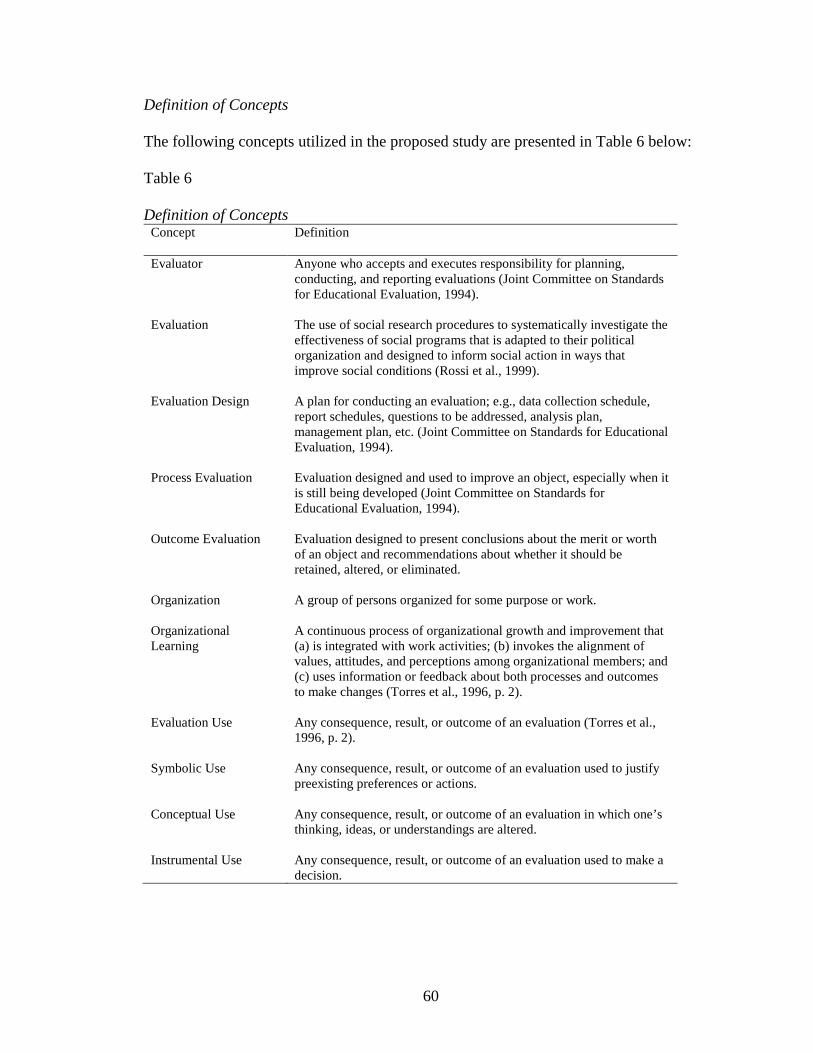
60
Definition of Concepts
The following concepts utilized in the proposed study are presented in Table 6 below:
Table 6 Definition of Concepts
Concept Definition
Evaluator Anyone who accepts and executes responsibility for planning, conducting, and reporting evaluations (Joint Committee on Standards for Educational Evaluation, 1994).
Evaluation The use of social research procedures to systematically investigate the effectiveness of social programs that is adapted to their political organization and designed to inform social action in ways that improve social conditions (Rossi et al., 1999).
Evaluation Design A plan for conducting an evaluation; e.g., data collection schedule, report schedules, questions to be addressed, analysis plan, management plan, etc. (Joint Committee on Standards for Educational Evaluation, 1994).
Process Evaluation Evaluation designed and used to improve an object, especially when it is still being developed (Joint Committee on Standards for Educational Evaluation, 1994).
Outcome Evaluation Evaluation designed to present conclusions about the merit or worth of an object and recommendations about whether it should be retained, altered, or eliminated.
Organization A group of persons organized for some purpose or work.
Organizational Learning
A continuous process of organizational growth and improvement that (a) is integrated with work activities; (b) invokes the alignment of values, attitudes, and perceptions among organizational members; and (c) uses information or feedback about both processes and outcomes to make changes (Torres et al., 1996, p. 2).
Evaluation Use Any consequence, result, or outcome of an evaluation (Torres et al., 1996, p. 2).
Symbolic Use Any consequence, result, or outcome of an evaluation used to justify preexisting preferences or actions.
Conceptual Use Any consequence, result, or outcome of an evaluation in which one’s thinking, ideas, or understandings are altered.
Instrumental Use Any consequence, result, or outcome of an evaluation used to make a decision.
61
Data Preparation
Survey data were downloaded from the survey website and into the software
program Statistical Package for the Social Sciences (SPSS). Data were first tested for
normality of distributions, multicollinearity, and heteroskedasticity and appropriate
resolutions were made for any problems identified. Scales from collapsing individual
survey items together were created and scale reliabilities assessed using Cronbach’s
alpha.
Descriptive analyses were used to describe the sample. Variables and scales used
in regression models were tested for multicollinearity and heteroskedasticity. All
individual variables used to test hypotheses were normally distributed with the exception
of one variable. The variable of number of hours of continuing education was skewed
(skewness = 3.99) and had extreme kurtosis (kurtosis = 24.33). In order to resolve this
problem the variable was transformed into ten categories based on the 10th
Data Analysis
percentile
ranking.
The following table presents the statistical models and corresponding statistical
tests and equations used to test hypotheses.
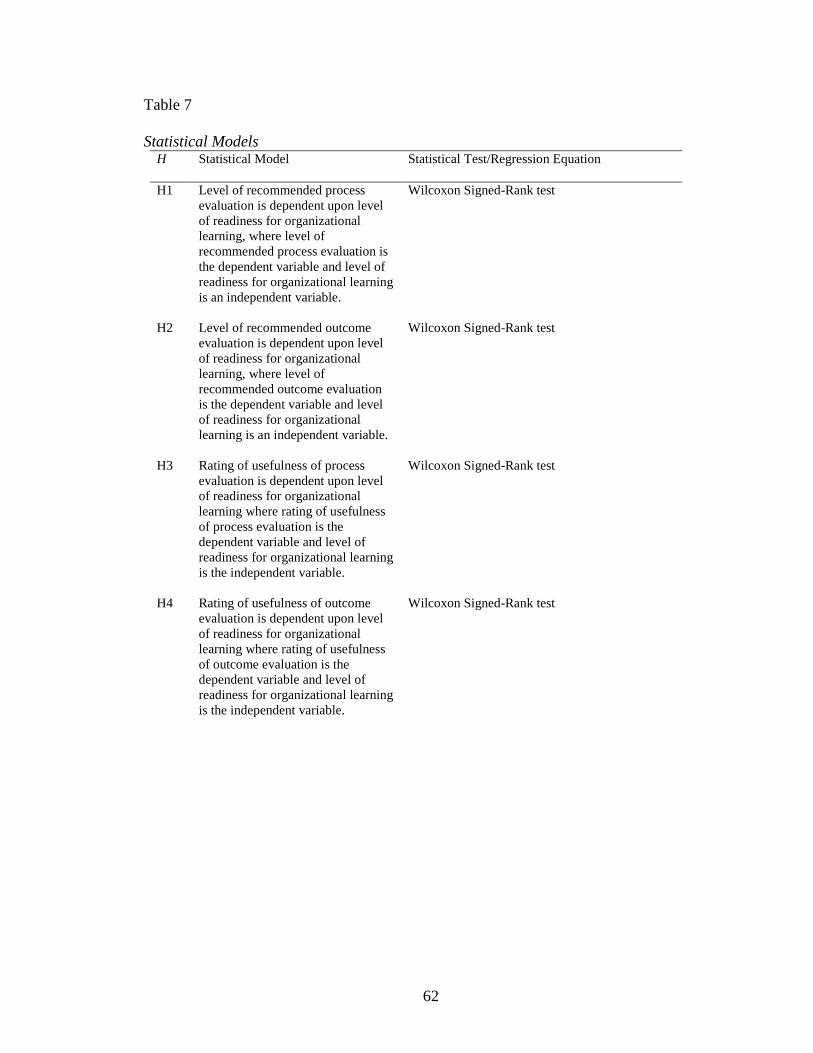
62
Table 7
Statistical Models H Statistical Model
Statistical Test/Regression Equation
H1 Level of recommended process evaluation is dependent upon level of readiness for organizational learning, where level of recommended process evaluation is the dependent variable and level of readiness for organizational learning is an independent variable.
Wilcoxon Signed-Rank test
H2 Level of recommended outcome evaluation is dependent upon level of readiness for organizational learning, where level of recommended outcome evaluation is the dependent variable and level of readiness for organizational learning is an independent variable.
Wilcoxon Signed-Rank test
H3 Rating of usefulness of process evaluation is dependent upon level of readiness for organizational learning where rating of usefulness of process evaluation is the dependent variable and level of readiness for organizational learning is the independent variable.
Wilcoxon Signed-Rank test
H4 Rating of usefulness of outcome evaluation is dependent upon level of readiness for organizational learning where rating of usefulness of outcome evaluation is the dependent variable and level of readiness for organizational learning is the independent variable.
Wilcoxon Signed-Rank test
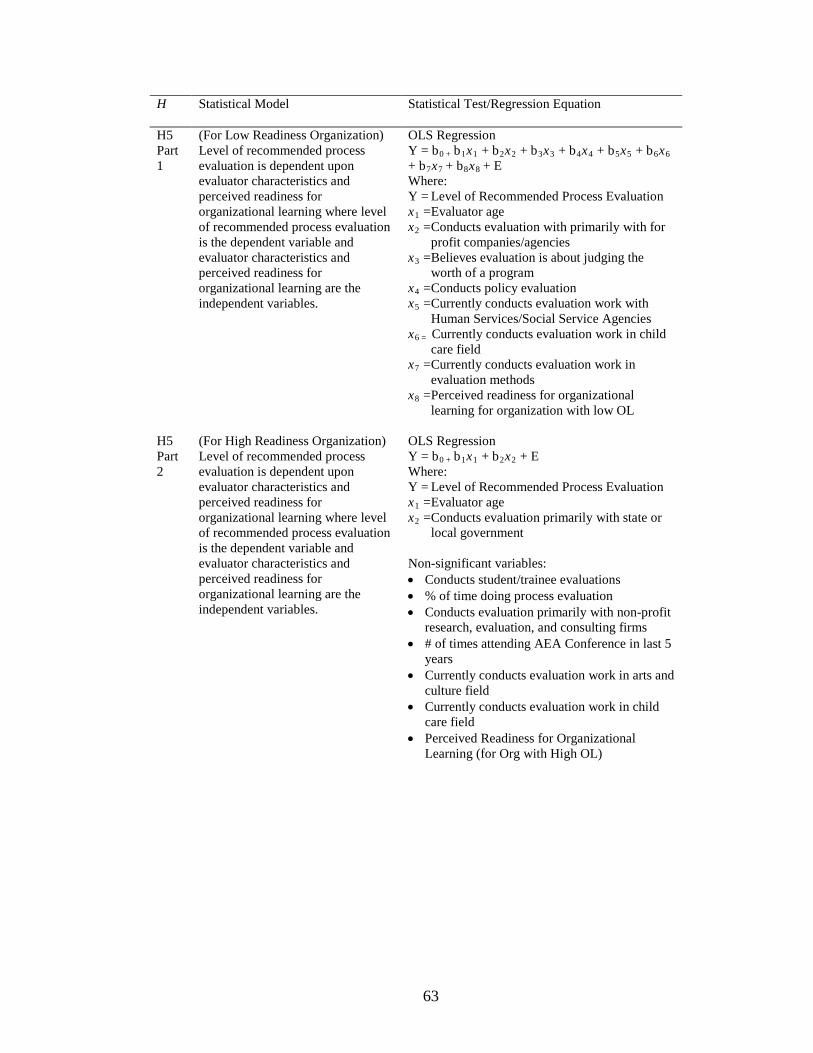
63
H Statistical Model
Statistical Test/Regression Equation
H5 Part 1
(For Low Readiness Organization) Level of recommended process evaluation is dependent upon evaluator characteristics and perceived readiness for organizational learning where level of recommended process evaluation is the dependent variable and evaluator characteristics and perceived readiness for organizational learning are the independent variables.
OLS Regression Y = b0 + b1x1 + b2x2 + b3x3 + b4x4 + b5x5 + b6x6 + b7x7 + b8x8 Where:
+ E
Y = Level of Recommended Process Evaluation x1x
= Evaluator age 2
x
= Conducts evaluation with primarily with for profit companies/agencies
3
x
= Believes evaluation is about judging the worth of a program
4x
= Conducts policy evaluation 5
x
= Currently conducts evaluation work with Human Services/Social Service Agencies
6 =
x
Currently conducts evaluation work in child care field
7
x
= Currently conducts evaluation work in evaluation methods
8
= Perceived readiness for organizational learning for organization with low OL
H5 Part 2
(For High Readiness Organization) Level of recommended process evaluation is dependent upon evaluator characteristics and perceived readiness for organizational learning where level of recommended process evaluation is the dependent variable and evaluator characteristics and perceived readiness for organizational learning are the independent variables.
OLS Regression Y = b0 + b1x1 + b2x2Where:
+ E
Y = Level of Recommended Process Evaluation x1x
= Evaluator age 2
= Conducts evaluation primarily with state or local government
Non-significant variables: • Conducts student/trainee evaluations • % of time doing process evaluation • Conducts evaluation primarily with non-profit
research, evaluation, and consulting firms • # of times attending AEA Conference in last 5
years • Currently conducts evaluation work in arts and
culture field • Currently conducts evaluation work in child
care field • Perceived Readiness for Organizational
Learning (for Org with High OL)
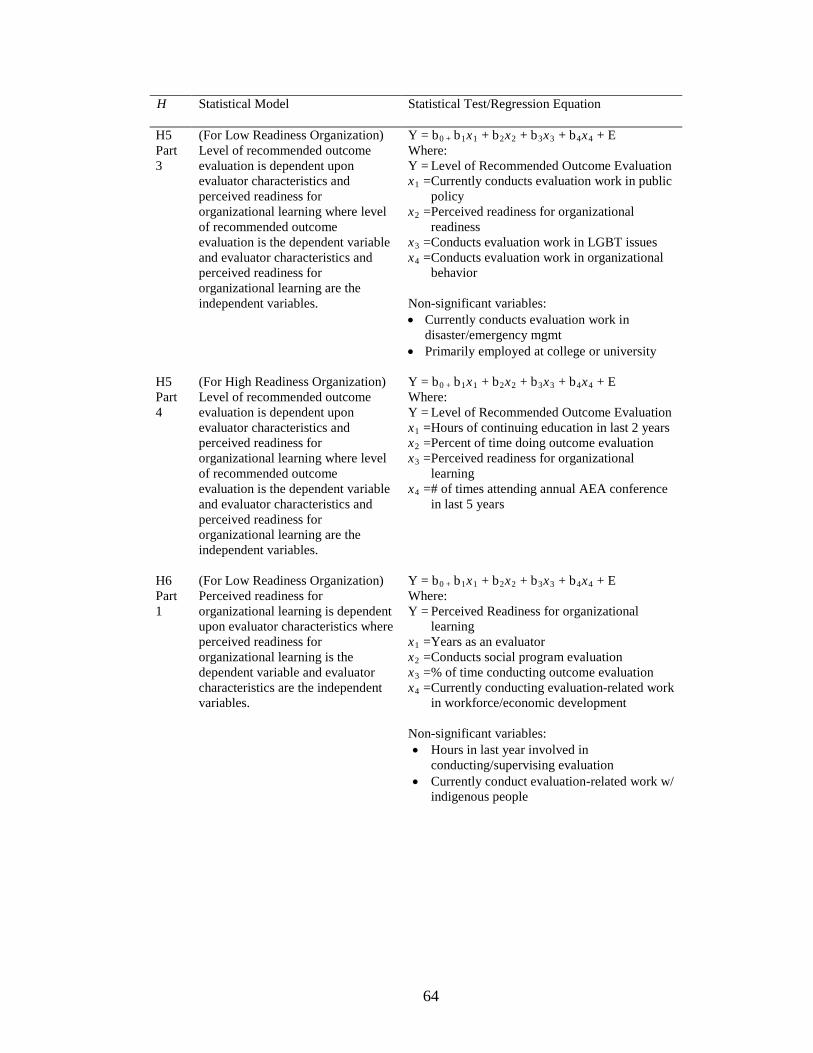
64
H Statistical Model
Statistical Test/Regression Equation
H5 Part 3
(For Low Readiness Organization) Level of recommended outcome evaluation is dependent upon evaluator characteristics and perceived readiness for organizational learning where level of recommended outcome evaluation is the dependent variable and evaluator characteristics and perceived readiness for organizational learning are the independent variables.
Y = b0 + b1x1 + b2x2 + b3x3 + b4x4Where:
+ E
Y = Level of Recommended Outcome Evaluation x1
x
= Currently conducts evaluation work in public policy
2
x
= Perceived readiness for organizational readiness
3x
= Conducts evaluation work in LGBT issues 4
= Conducts evaluation work in organizational behavior
Non-significant variables: • Currently conducts evaluation work in
disaster/emergency mgmt • Primarily employed at college or university
H5 Part 4
(For High Readiness Organization) Level of recommended outcome evaluation is dependent upon evaluator characteristics and perceived readiness for organizational learning where level of recommended outcome evaluation is the dependent variable and evaluator characteristics and perceived readiness for organizational learning are the independent variables.
Y = b0 + b1x1 + b2x2 + b3x3 + b4x4Where:
+ E
Y = Level of Recommended Outcome Evaluation x1x
= Hours of continuing education in last 2 years 2
x = Percent of time doing outcome evaluation
3
x
= Perceived readiness for organizational learning
4
= # of times attending annual AEA conference in last 5 years
H6 Part 1
(For Low Readiness Organization) Perceived readiness for organizational learning is dependent upon evaluator characteristics where perceived readiness for organizational learning is the dependent variable and evaluator characteristics are the independent variables.
Y = b0 + b1x1 + b2x2 + b3x3 + b4x4Where:
+ E
Y = Perceived Readiness for organizational learning
x1x
= Years as an evaluator 2
x = Conducts social program evaluation
3x
= % of time conducting outcome evaluation 4
= Currently conducting evaluation-related work in workforce/economic development
Non-significant variables: • Hours in last year involved in
conducting/supervising evaluation • Currently conduct evaluation-related work w/
indigenous people
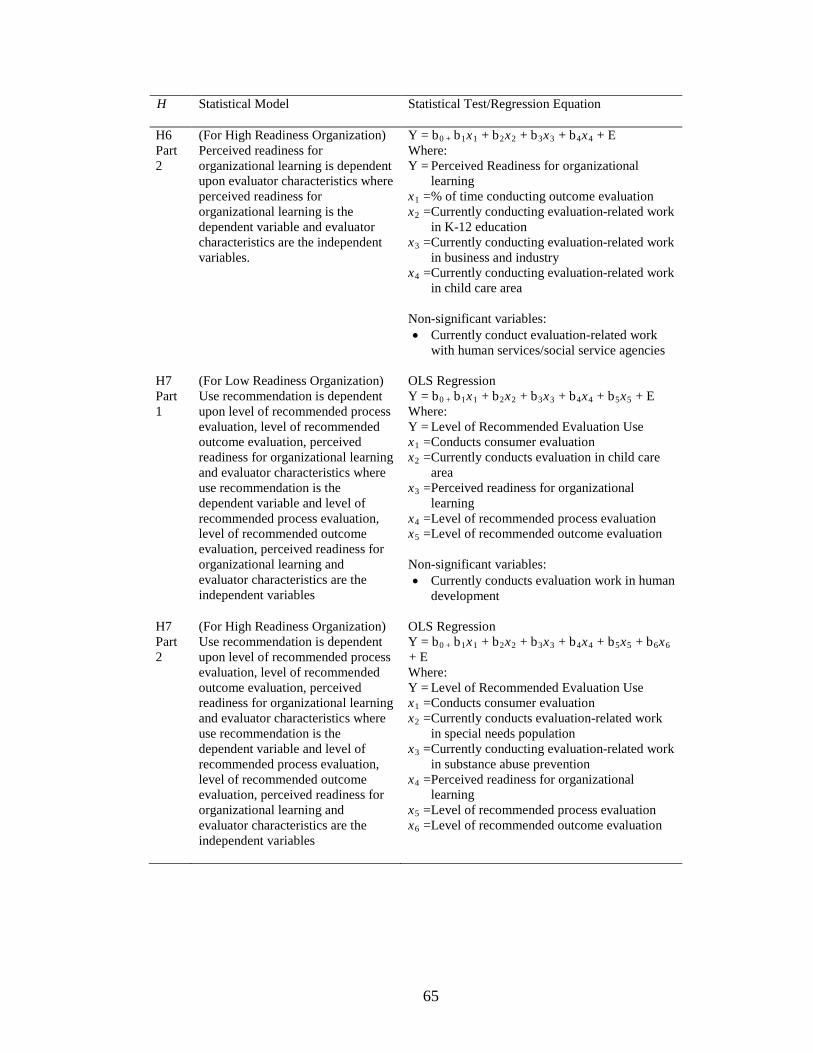
65
H Statistical Model
Statistical Test/Regression Equation
H6 Part 2
(For High Readiness Organization) Perceived readiness for organizational learning is dependent upon evaluator characteristics where perceived readiness for organizational learning is the dependent variable and evaluator characteristics are the independent variables.
Y = b0 + b1x1 + b2x2 + b3x3 + b4x4Where:
+ E
Y = Perceived Readiness for organizational learning
x1x
= % of time conducting outcome evaluation 2
x
= Currently conducting evaluation-related work in K-12 education
3
x
= Currently conducting evaluation-related work in business and industry
4
= Currently conducting evaluation-related work in child care area
Non-significant variables: • Currently conduct evaluation-related work
with human services/social service agencies
H7 Part 1
(For Low Readiness Organization) Use recommendation is dependent upon level of recommended process evaluation, level of recommended outcome evaluation, perceived readiness for organizational learning and evaluator characteristics where use recommendation is the dependent variable and level of recommended process evaluation, level of recommended outcome evaluation, perceived readiness for organizational learning and evaluator characteristics are the independent variables
OLS Regression Y = b0 + b1x1 + b2x2 + b3x3 + b4x4 + b5x5Where:
+ E
Y = Level of Recommended Evaluation Use x1x
= Conducts consumer evaluation 2
x
= Currently conducts evaluation in child care area
3
x
= Perceived readiness for organizational learning
4x
= Level of recommended process evaluation 5
= Level of recommended outcome evaluation
Non-significant variables: • Currently conducts evaluation work in human
development
H7 Part 2
(For High Readiness Organization) Use recommendation is dependent upon level of recommended process evaluation, level of recommended outcome evaluation, perceived readiness for organizational learning and evaluator characteristics where use recommendation is the dependent variable and level of recommended process evaluation, level of recommended outcome evaluation, perceived readiness for organizational learning and evaluator characteristics are the independent variables
OLS Regression Y = b0 + b1x1 + b2x2 + b3x3 + b4x4 + b5x5 + b6x6
Where: + E
Y = Level of Recommended Evaluation Use x1x
= Conducts consumer evaluation 2
x
= Currently conducts evaluation-related work in special needs population
3
x
= Currently conducting evaluation-related work in substance abuse prevention
4
x
= Perceived readiness for organizational learning
5x
= Level of recommended process evaluation 6
= Level of recommended outcome evaluation
66
Regression Model Building
In order to build the most parsimonious regression models, Pearson’s correlations
were examined for all independent variables and each criterion variable. To capture the
broadest possible covariates, all independent variables that had statistically significant
correlations at the level of p = <.1 were included in the first regression model. Variables
were then entered into the regression model using the technique of backward elimination
because this technique aids in the selection of the most important covariates. The
technique of backward elimination tends to be more inclusive than other methods for
stepwise entry into regression models (Neter, Kutner, Nachtsheim, & Wasserman, 1996).
In this study’s regression models, each procedure began with a model containing all the
independent variables of interest and then testing them one by one for statistical
significance, and deleting any variable that was not significant.
Summary
This chapter presented the rationale for each of the study’s seven hypotheses and
discussed the research methods utilized in this study. The specifics of the survey research
design were presented along with techniques employed for data preparation and analysis.
The next chapter presents the findings from this study.
67
CHAPTER 4.
Findings
Introduction
This chapter describes this study’s response rate, characteristics of the sample,
measure and scale creation, and presents the results of the data analysis used to test this
study’s hypotheses.
Response Rate
A total of 2,686 email invitations were sent to members of the American
Evaluation Association in January and February 2009. The first wave of email invitations
was sent out the week of January 5th, 2009. It consisted of 1,148 email invitations. For
this first wave of data collection, 101 respondents partially completed the survey and 149
respondents completed the survey fully. (The text of the email invitation is included in
Appendix C.) A second wave of email invitations was sent out the week of February 23rd
Data for the final response rate were calculated by combining numbers from the
first and second waves of data collection. There were a total of 2,686 email invitations
sent to potential respondents. Of these 2,686 invitations, 2% (53 emails) bounced back
and these 53 emails were replaced with an additional 53 valid email addresses. A total of
512 persons completed some portion of the survey. Thus, there was a 19% response rate
for the surveys. This response rate includes complete and uncompleted surveys.
,
2009. The second wave of email invitations consisted of 1,538 invitations. For the second
wave of data collection, 91 respondents partially completed the survey and 171
respondents completed the survey fully. The survey was kept open from January 5, 2009
to March 24, 2009. Respondents had four weeks to complete the survey.
68
The response rate may have been affected by three other web-based surveys that
targeted American Evaluation Association members during the three months preceding
this study’s survey. Other web-based surveys were disseminated in October, November,
and December 2008. These surveys included two research studies and one survey about
the AEA annual conference, which was sent to all AEA members who attended the
conference. Although the percentage of people who were invited to participate in this
study’s survey and other surveys could not be determined, these surveys drew from the
same AEA population. Evidence of the overlap in samples included an e-mail from one
respondent who indicated that he/she had received three requests to participate in three
different surveys in the last two months and had chosen not to participate in this study’s
survey.
Exclusion of Cases
Four cases were deleted from the analysis because they did not meet the criteria
to be included in the sample. These four respondents identified themselves as full-time
students and they had less than one year of experience as an evaluator. (It should be noted
that an initial inclusion criterion was having a non full-time student status. Upon further
review, it was determined that experience
Further analyses were conducted to determine which respondents had answered
only the questions on the survey that involved demographics (Questions 1 to 20). It was
determined that 115 respondents had responded only to the demographic questions and
rather than student status was the important
criterion for inclusion in the sample. Nine respondents identified themselves as full-time
students but each had at least one year or more of experience as an evaluator. Thus these
nine students were kept in the sample because they had qualifying experience.)
69
had failed to answer one or more questions about the vignettes. These 115 cases were
deleted from the sample because they did not answer any content questions related to this
study’s research questions.
Sample Size
The final sample consisted of 393 surveys (15% of sample). A total of 189
respondents (48%) completed Survey Version 1 in which the vignette describing the
organization (called ZIA Youth Services) with low levels of organizational learning was
presented first. A total of 204 respondents (52%) completed Survey Version 2 in which
the vignette describing the organization (called Milestone Youth Services) with high
levels of organizational learning was presented first. The next sections describe the
population for this study and present characteristics of the sample.
Population
The population for the study was current members of the American Evaluation
Association (AEA) who reside in the United States and are not student members. As of
September 2008, there were a total of 3,268 AEA members who met these criteria
(American Evaluation Association, 2008). While demographic data were not available for
this entire population, demographic characteristics in this study’s sample were compared
to published demographic characteristics for the population of AEA (Manning, Bachrach,
Tiedemann, McPherson, & Goodman, 2008). This next section describes the findings
from this comparison.
Comparison of Sample and Population Characteristics
The most recent data available for AEA membership composition is the American
Evaluation Association Internal Scan Report to the Membership (Manning, et al. 2008).
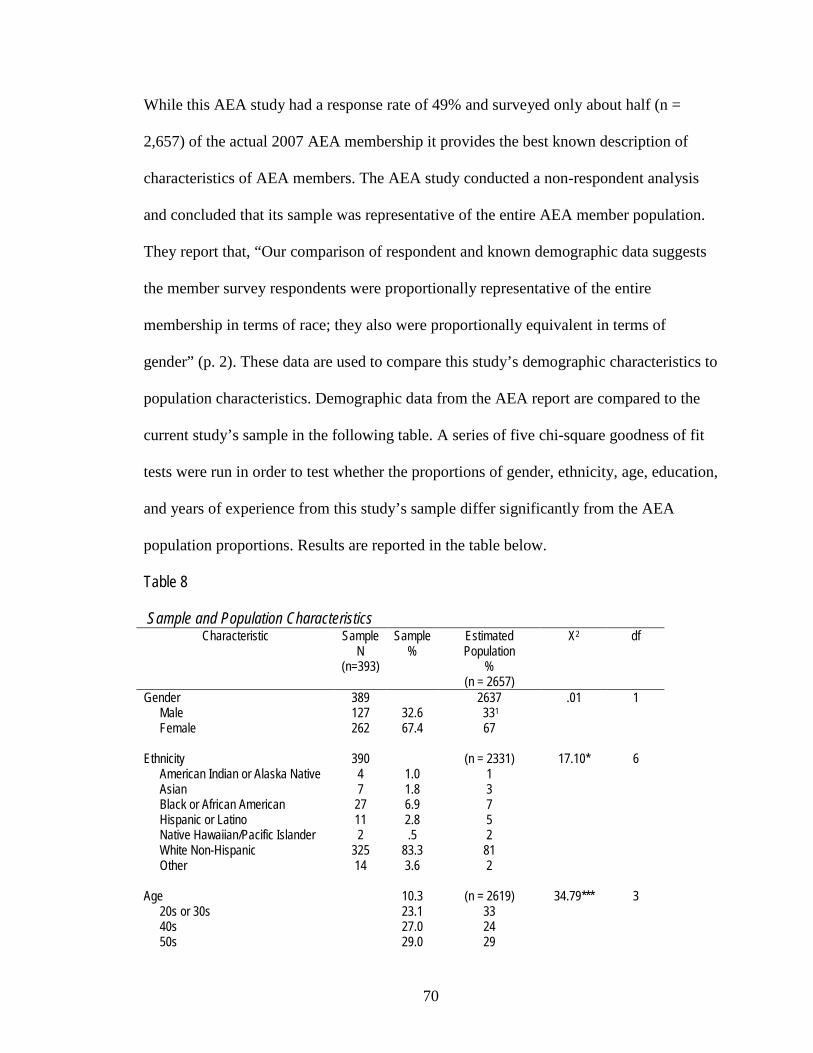
70
While this AEA study had a response rate of 49% and surveyed only about half (n =
2,657) of the actual 2007 AEA membership it provides the best known description of
characteristics of AEA members. The AEA study conducted a non-respondent analysis
and concluded that its sample was representative of the entire AEA member population.
They report that, “Our comparison of respondent and known demographic data suggests
the member survey respondents were proportionally representative of the entire
membership in terms of race; they also were proportionally equivalent in terms of
gender” (p. 2). These data are used to compare this study’s demographic characteristics to
population characteristics. Demographic data from the AEA report are compared to the
current study’s sample in the following table. A series of five chi-square goodness of fit
tests were run in order to test whether the proportions of gender, ethnicity, age, education,
and years of experience from this study’s sample differ significantly from the AEA
population proportions. Results are reported in the table below.
Table 8
Sample and Population Characteristics Characteristic Sample
N (n=393)
Sample %
Estimated Population
% (n = 2657)
X df 2
Gender Male Female
389 127 262
32.6 67.4
2637 331
.01
67
1
Ethnicity American Indian or Alaska Native
Asian Black or African American Hispanic or Latino Native Hawaiian/Pacific Islander White Non-Hispanic Other
390 4 7
27 11 2
325 14
1.0 1.8 6.9 2.8 .5
83.3 3.6
(n = 2331) 1 3 7 5 2
81 2
17.10* 6
Age 20s or 30s
40s 50s
10.3 23.1 27.0 29.0
(n = 2619) 33 24 29
34.79*** 3
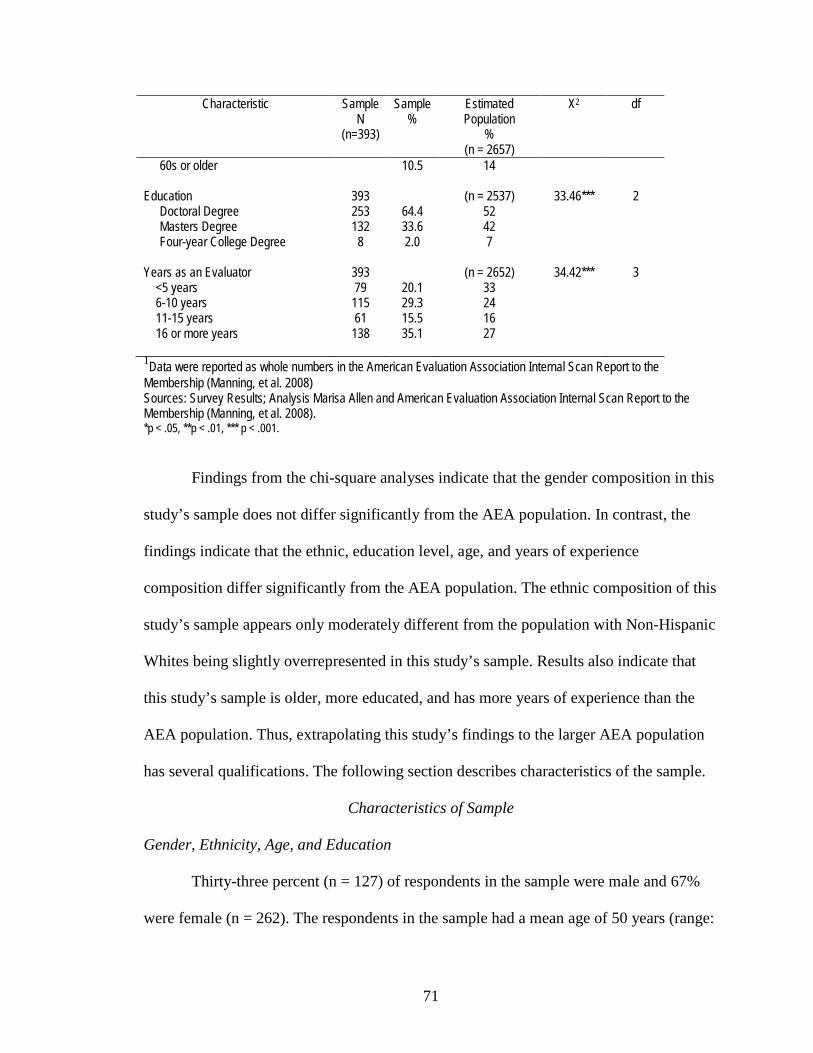
71
Characteristic Sample N
(n=393)
Sample %
Estimated Population
% (n = 2657)
X df 2
60s or older
10.5 14
Education Doctoral Degree
Masters Degree Four-year College Degree
393 253 132
8
64.4 33.6 2.0
(n = 2537) 52 42 7
33.46*** 2
Years as an Evaluator <5 years
6-10 years 11-15 years 16 or more years
393 79
115 61
138
20.1 29.3 15.5 35.1
(n = 2652) 33 24 16 27
34.42*** 3
1
Sources: Survey Results; Analysis Marisa Allen and American Evaluation Association Internal Scan Report to the Membership (Manning, et al. 2008).
Data were reported as whole numbers in the American Evaluation Association Internal Scan Report to the Membership (Manning, et al. 2008)
*p < .05, **p < .01, *** p < .001.
Findings from the chi-square analyses indicate that the gender composition in this
study’s sample does not differ significantly from the AEA population. In contrast, the
findings indicate that the ethnic, education level, age, and years of experience
composition differ significantly from the AEA population. The ethnic composition of this
study’s sample appears only moderately different from the population with Non-Hispanic
Whites being slightly overrepresented in this study’s sample. Results also indicate that
this study’s sample is older, more educated, and has more years of experience than the
AEA population. Thus, extrapolating this study’s findings to the larger AEA population
has several qualifications. The following section describes characteristics of the sample.
Characteristics of Sample
Gender, Ethnicity, Age, and Education
Thirty-three percent (n = 127) of respondents in the sample were male and 67%
were female (n = 262). The respondents in the sample had a mean age of 50 years (range:
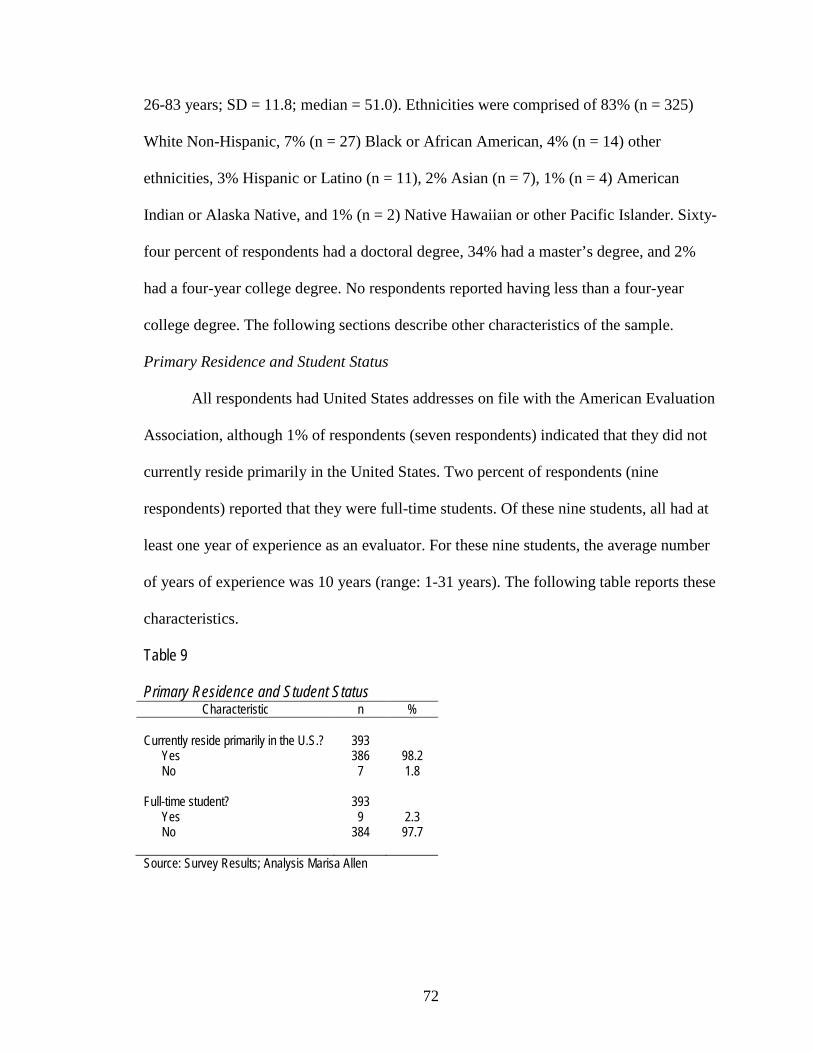
72
26-83 years; SD = 11.8; median = 51.0). Ethnicities were comprised of 83% (n = 325)
White Non-Hispanic, 7% (n = 27) Black or African American, 4% (n = 14) other
ethnicities, 3% Hispanic or Latino (n = 11), 2% Asian (n = 7), 1% (n = 4) American
Indian or Alaska Native, and 1% (n = 2) Native Hawaiian or other Pacific Islander. Sixty-
four percent of respondents had a doctoral degree, 34% had a master’s degree, and 2%
had a four-year college degree. No respondents reported having less than a four-year
college degree. The following sections describe other characteristics of the sample.
Primary Residence and Student Status
All respondents had United States addresses on file with the American Evaluation
Association, although 1% of respondents (seven respondents) indicated that they did not
currently reside primarily in the United States. Two percent of respondents (nine
respondents) reported that they were full-time students. Of these nine students, all had at
least one year of experience as an evaluator. For these nine students, the average number
of years of experience was 10 years (range: 1-31 years). The following table reports these
characteristics.
Table 9
Primary Residence and Student Status Characteristic n %
Currently reside primarily in the U.S.?
Yes No
393 386
7
98.2 1.8
Full-time student? Yes
No
393 9
384
2.3 97.7
Source: Survey Results; Analysis Marisa Allen
73
Description of Respondents’ Evaluation Work
The following section provides information on respondents’ experience in
evaluation, the nature of their employment, and describes other characteristics of
respondents’ evaluation work. The level of respondents’ continuing education and beliefs
about evaluation are also presented.
Years of experience. For the sample as a whole, respondents reported that they
had been an evaluator for a mean of 15 years (range: 0 to 43 years). Four respondents
reported that they had been an evaluator for zero years. These four respondents were
included in the analysis because they had been members of the AEA for one year or
more.
Primary employment. Respondents most commonly reported being primarily
employed by a college or university (32%, n = 124). The second most reported primary
employment included self-employment (17%, n = 68). Thirteen percent (n = 49) of
respondents were employed by for-profit research/evaluation/consulting firms and 10%
(n = 41) were employed by non-profit companies or agencies.
External and internal evaluation. Sixty-five percent (n = 251) of respondents
reported they worked primarily as an external evaluator. Thirty-five percent (n = 134)
reported that they worked primarily as an internal evaluator.
Level of evaluation work. The mean percent of work in the last month that
involved conducting/supervising evaluations was 59% (range: 0 to 100%). The mean
number of hours in the last year that respondents were involved in
conducting/supervising evaluations was 1038 hours (range: 0 to 3000). This level of work
(1038 hours) can be considered working about half the year on evaluation-related
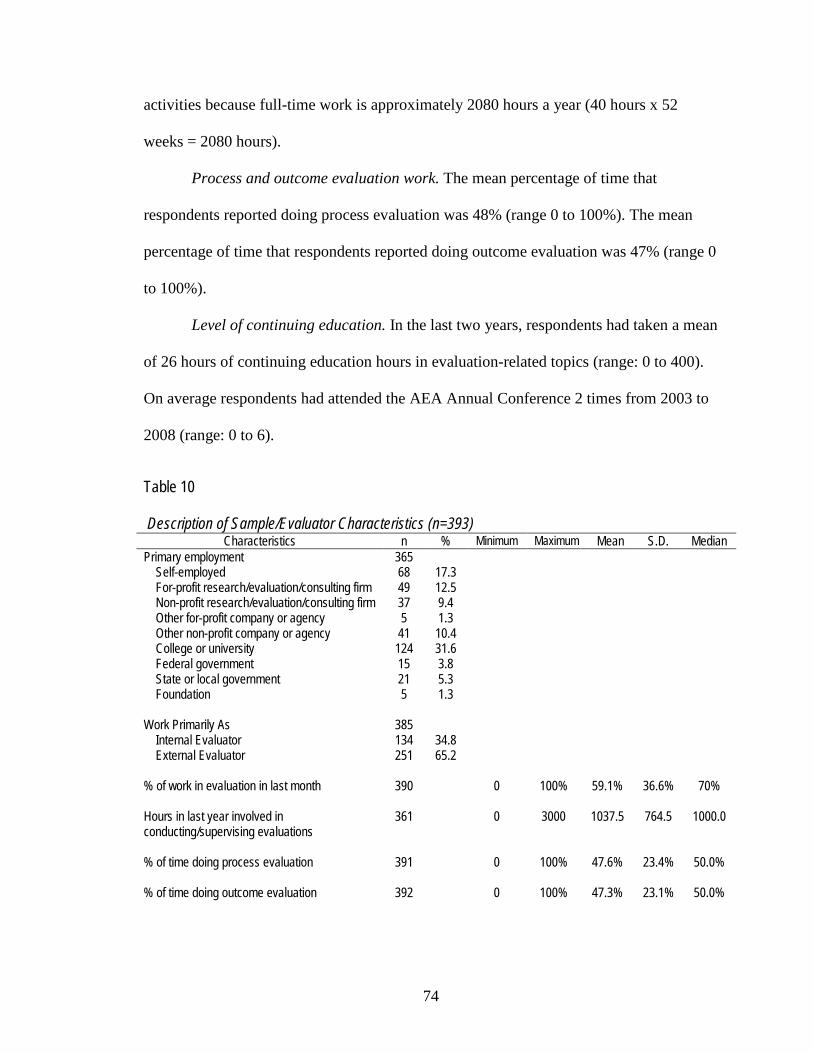
74
activities because full-time work is approximately 2080 hours a year (40 hours x 52
weeks = 2080 hours).
Process and outcome evaluation work. The mean percentage of time that
respondents reported doing process evaluation was 48% (range 0 to 100%). The mean
percentage of time that respondents reported doing outcome evaluation was 47% (range 0
to 100%).
Level of continuing education. In the last two years, respondents had taken a mean
of 26 hours of continuing education hours in evaluation-related topics (range: 0 to 400).
On average respondents had attended the AEA Annual Conference 2 times from 2003 to
2008 (range: 0 to 6).
Table 10 Description of Sample/Evaluator Characteristics (n=393)
Characteristics n % Minimum Maximum Mean S.D. Median Primary employment
Self-employed For-profit research/evaluation/consulting firm Non-profit research/evaluation/consulting firm Other for-profit company or agency Other non-profit company or agency College or university Federal government State or local government Foundation
365 68 49 37 5
41 124 15 21 5
17.3 12.5 9.4 1.3 10.4 31.6 3.8 5.3 1.3
Work Primarily As
Internal Evaluator External Evaluator
385 134 251
34.8 65.2
% of work in evaluation in last month
390
0
100%
59.1%
36.6%
70%
Hours in last year involved in conducting/supervising evaluations
361 0 3000 1037.5 764.5 1000.0
% of time doing process evaluation
391 0 100% 47.6% 23.4% 50.0%
% of time doing outcome evaluation
392 0 100% 47.3% 23.1% 50.0%
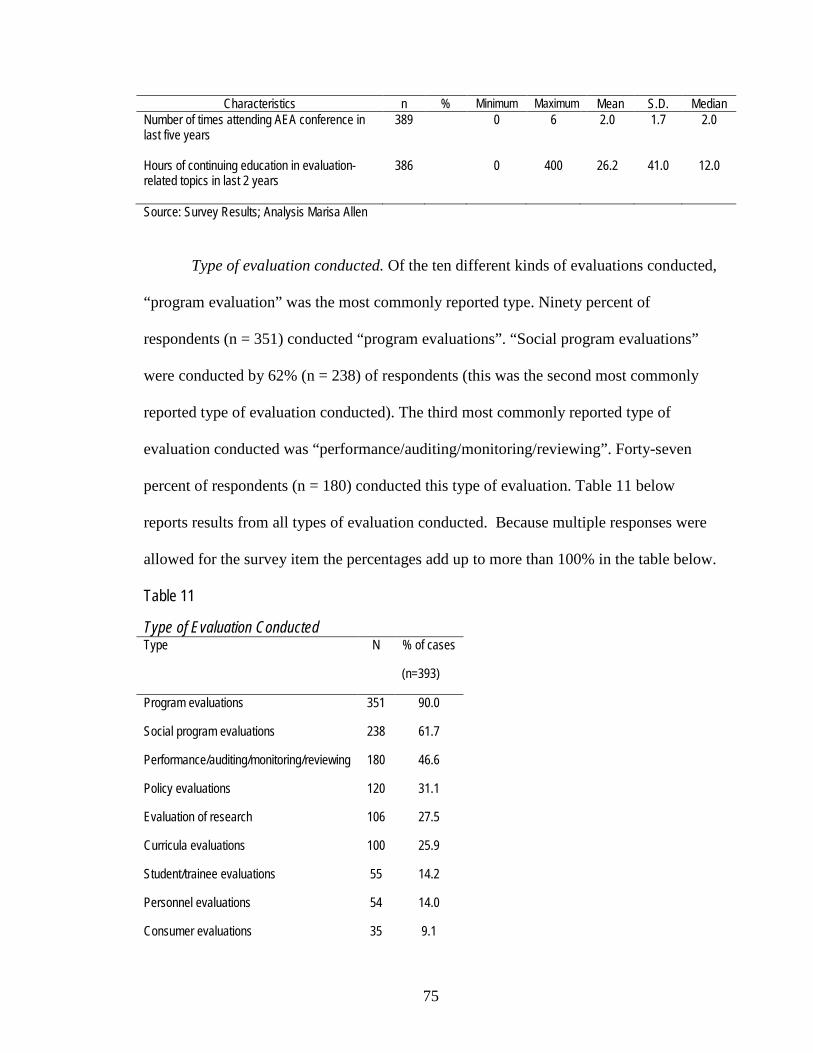
75
Characteristics n % Minimum Maximum Mean S.D. Median Number of times attending AEA conference in last five years
389 0 6 2.0 1.7 2.0
Hours of continuing education in evaluation-related topics in last 2 years
386 0 400 26.2 41.0 12.0
Source: Survey Results; Analysis Marisa Allen
Type of evaluation conducted. Of the ten different kinds of evaluations conducted,
“program evaluation” was the most commonly reported type. Ninety percent of
respondents (n = 351) conducted “program evaluations”. “Social program evaluations”
were conducted by 62% (n = 238) of respondents (this was the second most commonly
reported type of evaluation conducted). The third most commonly reported type of
evaluation conducted was “performance/auditing/monitoring/reviewing”. Forty-seven
percent of respondents (n = 180) conducted this type of evaluation. Table 11 below
reports results from all types of evaluation conducted. Because multiple responses were
allowed for the survey item the percentages add up to more than 100% in the table below.
Table 11
Type of Evaluation Conducted Type N % of cases
(n=393)
Program evaluations 351 90.0
Social program evaluations 238 61.7
Performance/auditing/monitoring/reviewing 180 46.6
Policy evaluations 120 31.1
Evaluation of research 106 27.5
Curricula evaluations 100 25.9
Student/trainee evaluations 55 14.2
Personnel evaluations 54 14.0
Consumer evaluations 35 9.1
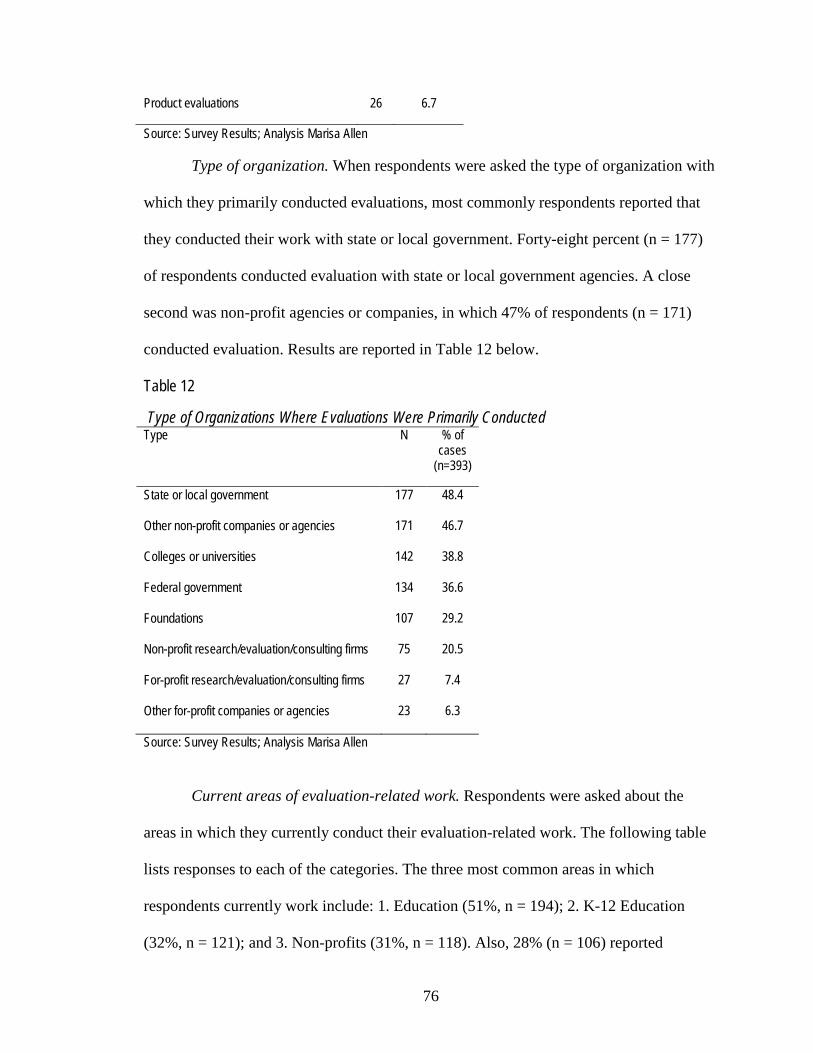
76
Source: Survey Results; Analysis Marisa Allen
Type of organization. When respondents were asked the type of organization with
which they primarily conducted evaluations, most commonly respondents reported that
they conducted their work with state or local government. Forty-eight percent (n = 177)
of respondents conducted evaluation with state or local government agencies. A close
second was non-profit agencies or companies, in which 47% of respondents (n = 171)
conducted evaluation. Results are reported in Table 12 below.
Table 12
Type of Organizations Where Evaluations Were Primarily Conducted Type N % of
cases (n=393)
State or local government 177 48.4
Other non-profit companies or agencies 171 46.7
Colleges or universities 142 38.8
Federal government 134 36.6
Foundations 107 29.2
Non-profit research/evaluation/consulting firms 75 20.5
For-profit research/evaluation/consulting firms 27 7.4
Other for-profit companies or agencies 23 6.3
Source: Survey Results; Analysis Marisa Allen
Current areas of evaluation-related work. Respondents were asked about the
areas in which they currently conduct their evaluation-related work. The following table
lists responses to each of the categories. The three most common areas in which
respondents currently work include: 1. Education (51%, n = 194); 2. K-12 Education
(32%, n = 121); and 3. Non-profits (31%, n = 118). Also, 28% (n = 106) reported
Product evaluations 26 6.7
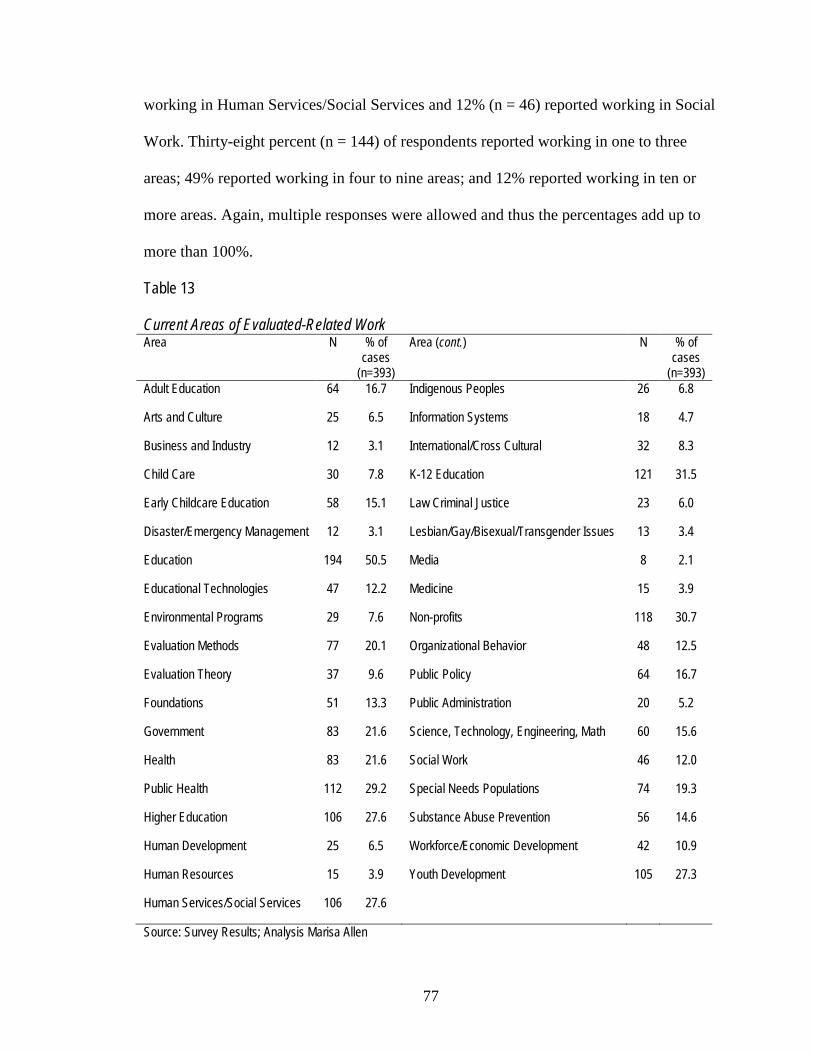
77
working in Human Services/Social Services and 12% (n = 46) reported working in Social
Work. Thirty-eight percent (n = 144) of respondents reported working in one to three
areas; 49% reported working in four to nine areas; and 12% reported working in ten or
more areas. Again, multiple responses were allowed and thus the percentages add up to
more than 100%.
Table 13 Current Areas of Evaluated-Related Work Area N % of
cases (n=393)
Area (cont.) N % of cases
(n=393) Adult Education 64 16.7 Indigenous Peoples 26 6.8
Arts and Culture 25 6.5 Information Systems 18 4.7
Business and Industry 12 3.1 International/Cross Cultural 32 8.3
Child Care 30 7.8 K-12 Education 121 31.5
Early Childcare Education 58 15.1 Law Criminal Justice 23 6.0
Disaster/Emergency Management 12 3.1 Lesbian/Gay/Bisexual/Transgender Issues 13 3.4
Education 194 50.5 Media 8 2.1
Educational Technologies 47 12.2 Medicine 15 3.9
Environmental Programs 29 7.6 Non-profits 118 30.7
Evaluation Methods 77 20.1 Organizational Behavior 48 12.5
Evaluation Theory 37 9.6 Public Policy 64 16.7
Foundations 51 13.3 Public Administration 20 5.2
Government 83 21.6 Science, Technology, Engineering, Math 60 15.6
Health 83 21.6 Social Work 46 12.0
Public Health 112 29.2 Special Needs Populations 74 19.3
Higher Education 106 27.6 Substance Abuse Prevention 56 14.6
Human Development 25 6.5 Workforce/Economic Development 42 10.9
Human Resources 15 3.9 Youth Development 105 27.3
Human Services/Social Services 106 27.6
Source: Survey Results; Analysis Marisa Allen
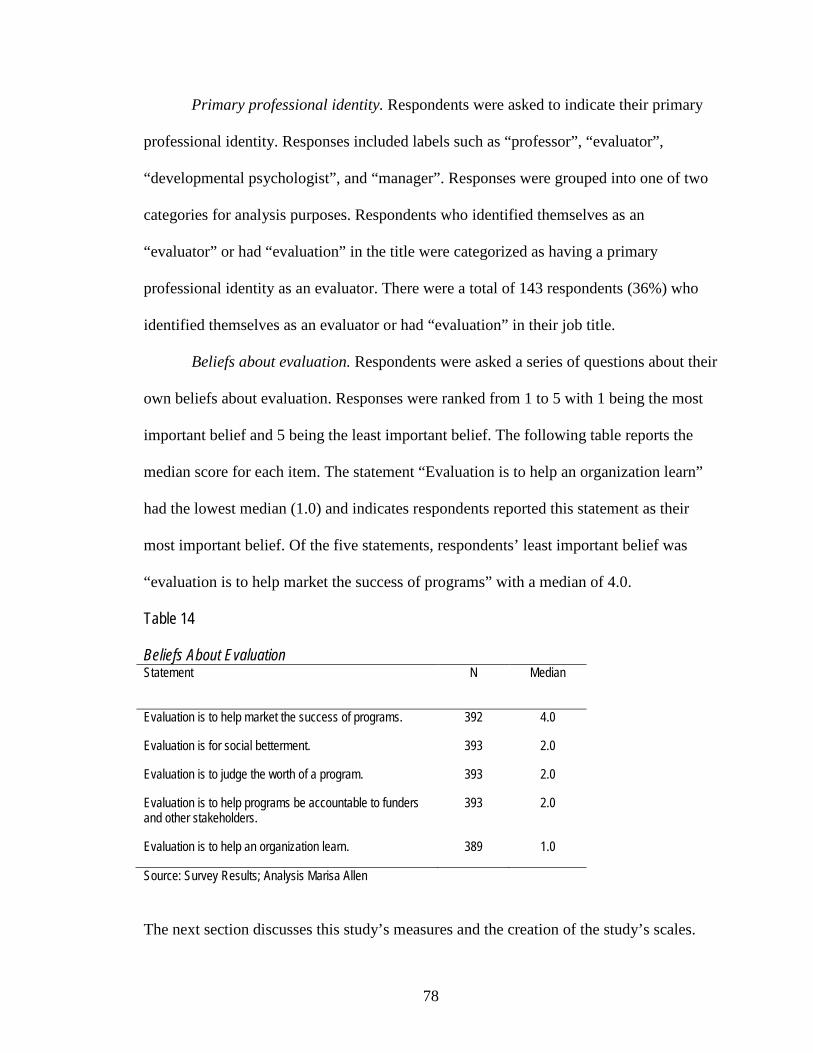
78
Primary professional identity. Respondents were asked to indicate their primary
professional identity. Responses included labels such as “professor”, “evaluator”,
“developmental psychologist”, and “manager”. Responses were grouped into one of two
categories for analysis purposes. Respondents who identified themselves as an
“evaluator” or had “evaluation” in the title were categorized as having a primary
professional identity as an evaluator. There were a total of 143 respondents (36%) who
identified themselves as an evaluator or had “evaluation” in their job title.
Beliefs about evaluation. Respondents were asked a series of questions about their
own beliefs about evaluation. Responses were ranked from 1 to 5 with 1 being the most
important belief and 5 being the least important belief. The following table reports the
median score for each item. The statement “Evaluation is to help an organization learn”
had the lowest median (1.0) and indicates respondents reported this statement as their
most important belief. Of the five statements, respondents’ least important belief was
“evaluation is to help market the success of programs” with a median of 4.0.
Table 14
Beliefs About Evaluation Statement N
Median
Evaluation is to help market the success of programs. 392 4.0
Evaluation is for social betterment. 393 2.0
Evaluation is to judge the worth of a program. 393 2.0
Evaluation is to help programs be accountable to funders and other stakeholders.
393 2.0
Evaluation is to help an organization learn. 389 1.0
Source: Survey Results; Analysis Marisa Allen
The next section discusses this study’s measures and the creation of the study’s scales.
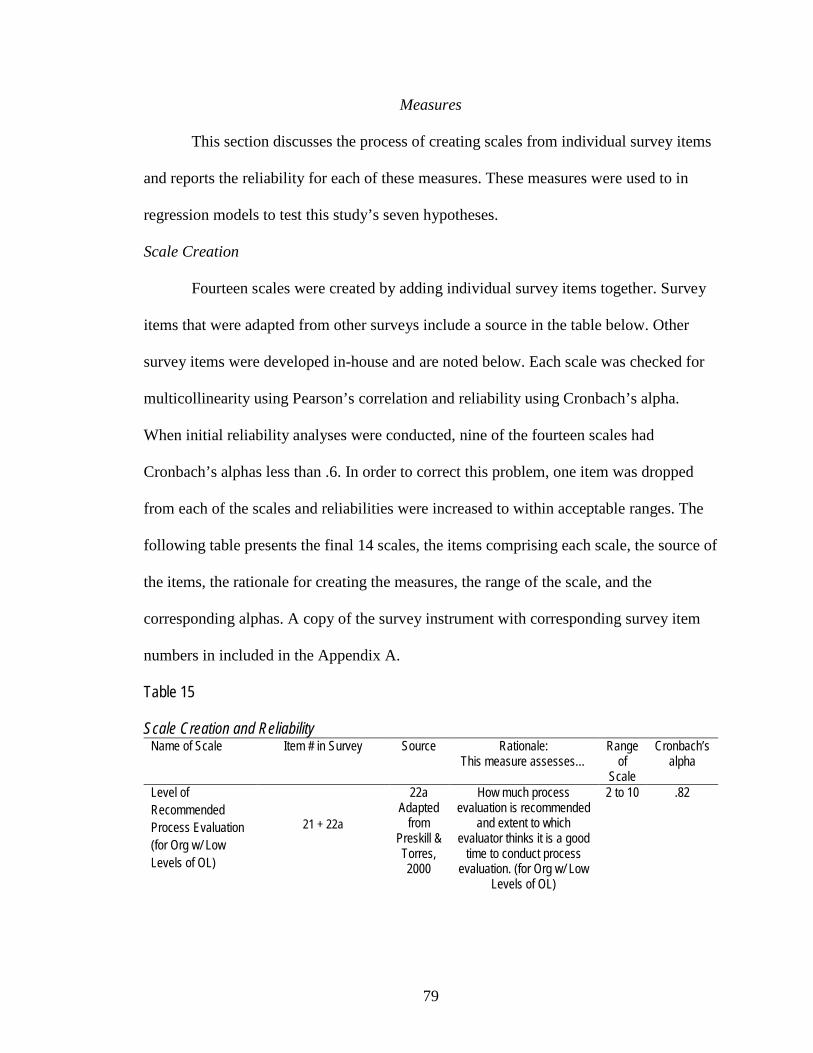
79
Measures
This section discusses the process of creating scales from individual survey items
and reports the reliability for each of these measures. These measures were used to in
regression models to test this study’s seven hypotheses.
Scale Creation
Fourteen scales were created by adding individual survey items together. Survey
items that were adapted from other surveys include a source in the table below. Other
survey items were developed in-house and are noted below. Each scale was checked for
multicollinearity using Pearson’s correlation and reliability using Cronbach’s alpha.
When initial reliability analyses were conducted, nine of the fourteen scales had
Cronbach’s alphas less than .6. In order to correct this problem, one item was dropped
from each of the scales and reliabilities were increased to within acceptable ranges. The
following table presents the final 14 scales, the items comprising each scale, the source of
the items, the rationale for creating the measures, the range of the scale, and the
corresponding alphas. A copy of the survey instrument with corresponding survey item
numbers in included in the Appendix A.
Table 15
Scale Creation and Reliability Name of Scale Item # in Survey Source Rationale:
This measure assesses… Range
of Scale
Cronbach’s alpha
Level of Recommended Process Evaluation (for Org w/ Low Levels of OL)
21 + 22a
22a Adapted
from Preskill & Torres, 2000
How much process evaluation is recommended
and extent to which evaluator thinks it is a good
time to conduct process evaluation. (for Org w/ Low
Levels of OL)
2 to 10 .82
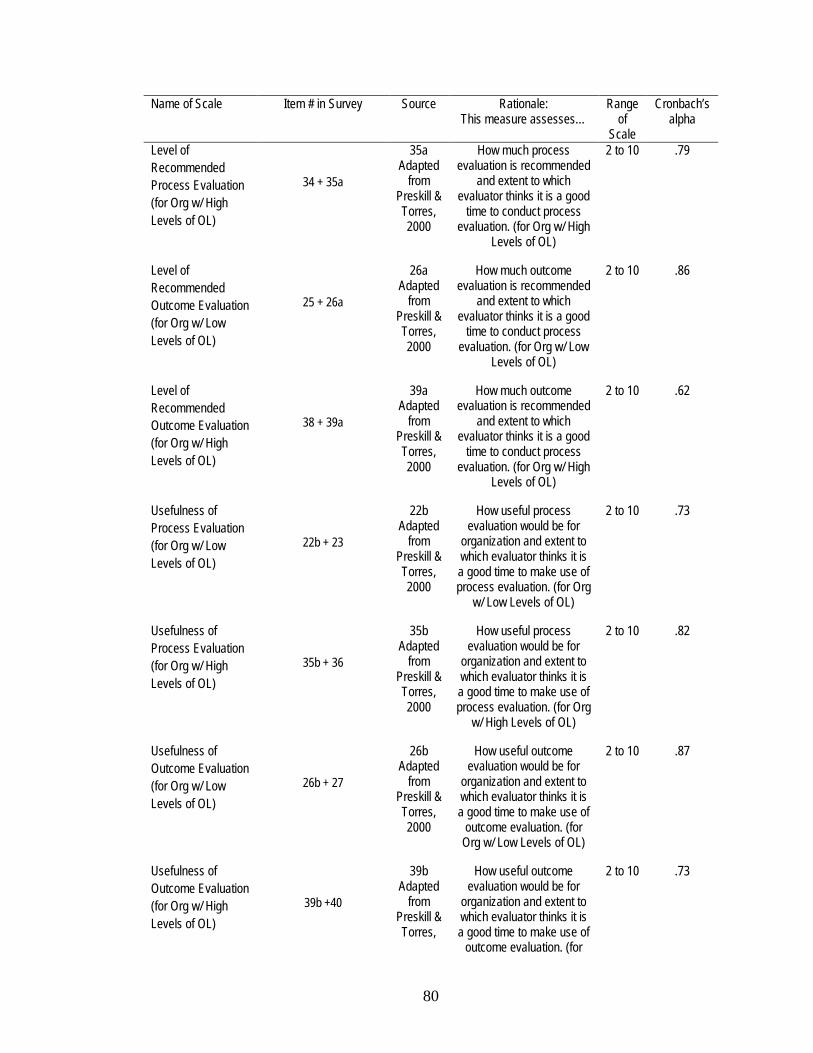
80
Name of Scale Item # in Survey Source Rationale: This measure assesses…
Range of
Scale
Cronbach’s alpha
Level of Recommended Process Evaluation (for Org w/ High Levels of OL)
34 + 35a
35a Adapted
from Preskill & Torres, 2000
How much process evaluation is recommended
and extent to which evaluator thinks it is a good
time to conduct process evaluation. (for Org w/ High
Levels of OL)
2 to 10 .79
Level of Recommended Outcome Evaluation (for Org w/ Low Levels of OL)
25 + 26a
26a Adapted
from Preskill & Torres, 2000
How much outcome evaluation is recommended
and extent to which evaluator thinks it is a good
time to conduct process evaluation. (for Org w/ Low
Levels of OL)
2 to 10 .86
Level of Recommended Outcome Evaluation (for Org w/ High Levels of OL)
38 + 39a
39a Adapted
from Preskill & Torres, 2000
How much outcome evaluation is recommended
and extent to which evaluator thinks it is a good
time to conduct process evaluation. (for Org w/ High
Levels of OL)
2 to 10 .62
Usefulness of Process Evaluation (for Org w/ Low Levels of OL)
22b + 23
22b Adapted
from Preskill & Torres, 2000
How useful process evaluation would be for
organization and extent to which evaluator thinks it is a good time to make use of process evaluation. (for Org
w/ Low Levels of OL)
2 to 10 .73
Usefulness of Process Evaluation (for Org w/ High Levels of OL)
35b + 36
35b Adapted
from Preskill & Torres, 2000
How useful process evaluation would be for
organization and extent to which evaluator thinks it is a good time to make use of process evaluation. (for Org
w/ High Levels of OL)
2 to 10 .82
Usefulness of Outcome Evaluation (for Org w/ Low Levels of OL)
26b + 27
26b Adapted
from Preskill & Torres, 2000
How useful outcome evaluation would be for
organization and extent to which evaluator thinks it is a good time to make use of
outcome evaluation. (for Org w/ Low Levels of OL)
2 to 10 .87
Usefulness of Outcome Evaluation (for Org w/ High Levels of OL)
39b +40
39b Adapted
from Preskill & Torres,
How useful outcome evaluation would be for
organization and extent to which evaluator thinks it is a good time to make use of
outcome evaluation. (for
2 to 10 .73
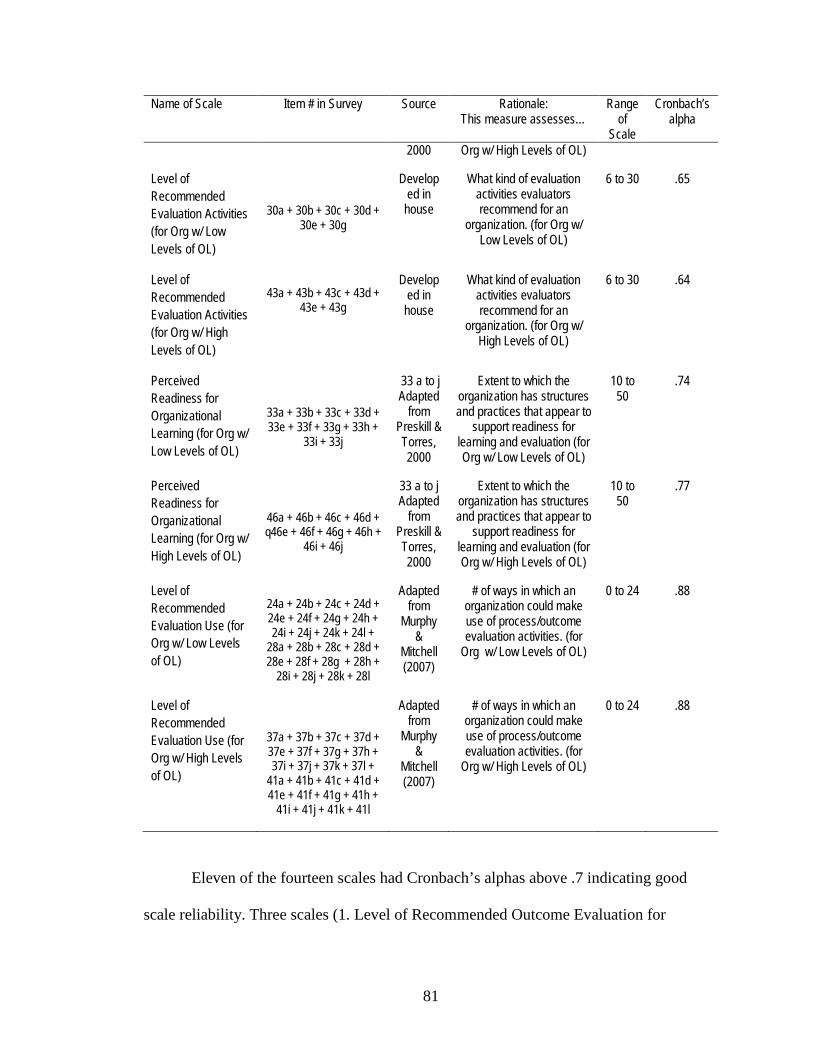
81
Name of Scale Item # in Survey Source Rationale: This measure assesses…
Range of
Scale
Cronbach’s alpha
2000 Org w/ High Levels of OL)
Level of Recommended Evaluation Activities (for Org w/ Low Levels of OL)
30a + 30b + 30c + 30d + 30e + 30g
Developed in
house
What kind of evaluation activities evaluators recommend for an
organization. (for Org w/ Low Levels of OL)
6 to 30 .65
Level of Recommended Evaluation Activities (for Org w/ High Levels of OL)
43a + 43b + 43c + 43d + 43e + 43g
Developed in
house
What kind of evaluation activities evaluators recommend for an
organization. (for Org w/ High Levels of OL)
6 to 30 .64
Perceived Readiness for Organizational Learning (for Org w/ Low Levels of OL)
33a + 33b + 33c + 33d + 33e + 33f + 33g + 33h +
33i + 33j
33 a to j Adapted
from Preskill & Torres, 2000
Extent to which the organization has structures and practices that appear to
support readiness for learning and evaluation (for Org w/ Low Levels of OL)
10 to 50
.74
Perceived Readiness for Organizational Learning (for Org w/ High Levels of OL)
46a + 46b + 46c + 46d + q46e + 46f + 46g + 46h +
46i + 46j
33 a to j Adapted
from Preskill & Torres, 2000
Extent to which the organization has structures and practices that appear to
support readiness for learning and evaluation (for Org w/ High Levels of OL)
10 to 50
.77
Level of Recommended Evaluation Use (for Org w/ Low Levels of OL)
24a + 24b + 24c + 24d + 24e + 24f + 24g + 24h + 24i + 24j + 24k + 24l +
28a + 28b + 28c + 28d + 28e + 28f + 28g + 28h +
28i + 28j + 28k + 28l
Adapted from
Murphy &
Mitchell (2007)
# of ways in which an organization could make use of process/outcome evaluation activities. (for
Org w/ Low Levels of OL)
0 to 24 .88
Level of Recommended Evaluation Use (for Org w/ High Levels of OL)
37a + 37b + 37c + 37d + 37e + 37f + 37g + 37h + 37i + 37j + 37k + 37l +
41a + 41b + 41c + 41d + 41e + 41f + 41g + 41h +
41i + 41j + 41k + 41l
Adapted from
Murphy &
Mitchell (2007)
# of ways in which an organization could make use of process/outcome evaluation activities. (for
Org w/ High Levels of OL)
0 to 24 .88
Eleven of the fourteen scales had Cronbach’s alphas above .7 indicating good
scale reliability. Three scales (1. Level of Recommended Outcome Evaluation for
82
Organization w/ High Levels of OL, 2. Level of Recommended Evaluation Activities for
Organization w/ Low Levels of OL, and 3. Level of Recommended Evaluation Activities
for Organization w/ High Levels of OL) had marginal reliability (Cronbach’s alphas
above .6). Although these scales were found to be marginally reliable, the scales are
within acceptable ranges of reliability.
Evaluator Discernment Measure Creation
Also in order to create a measure of how well an evaluator was able to discern
readiness for organizational leaning, two new measures were created based on the scales
of Perceived Readiness for Organizational Learning (for Organization w/ Low Levels of
OL) scale and the Perceived Readiness for Organizational Learning (for Organization w/
High Levels of OL). The first measure “Ability to Discern Low Readiness for
Organizational Learning” was created by subtracting each respondent’s score on the scale
of perceived readiness for organizational learning (for Organizations w/ Low Levels of
OL) from the ideal score of “10”. Thus, if a respondent rated the organization with low
levels of OL as a “15”, his ability to discern low readiness for organizational learning
would be a -5. Lower scores indicate inaccurate discernment.
The second measure “Ability to Discern High Readiness for Organizational
Learning” was created by subtracting each respondent’s score on the perceived readiness
for organizational learning (for Organization w/ High Levels of OL) from the ideal score
of “50”. In this case, if a respondent rated the organization with high levels of OL as a 40,
her ability to discern readiness for organizational learning would be 10. For this measure,
lower scores indicate accurate discernment.
83
In order to examine characteristics of evaluators who had high ability to discern
organizational readiness for learning, these measures were grouped into one of three
categories, low, medium, and high ability to discern. These categories were created by
grouping the third of respondents with the lowest scores into the low discernment group,
the next third lowest scores into the medium discernment group, and finally the highest
scores into the high discernment group.
Hypotheses and Data Analyses
This section presents the study’s hypotheses and data analyses utilized to test each
of the seven hypotheses.
Hypothesis 1
The first hypothesis stated the following, “Evaluators will recommend high levels
of process evaluation for organizations perceived to have low levels of readiness for
organizational learning”. A Wilcoxon Signed-Ranks test was conducted to evaluate
whether evaluators recommended higher levels of process evaluation for an organization
with low levels of readiness for organizational learning (OL) as compared to an
organization with high levels of readiness for OL. The results indicated a significant
difference, z = -12.38, p < .001. The mean for the organization with low readiness for
learning was 8.49 (SD = 1.75), while the mean for organization with high readiness for
learning was 6.14 (SD = 2.00). The matched-pairs rank biserial correlation coefficient, rc
Hypothesis 2
,
was .66. This hypothesis was supported.
The second hypothesis stated the following, “Evaluators will recommend high
levels of outcome evaluation for organizations perceived to have high levels of readiness
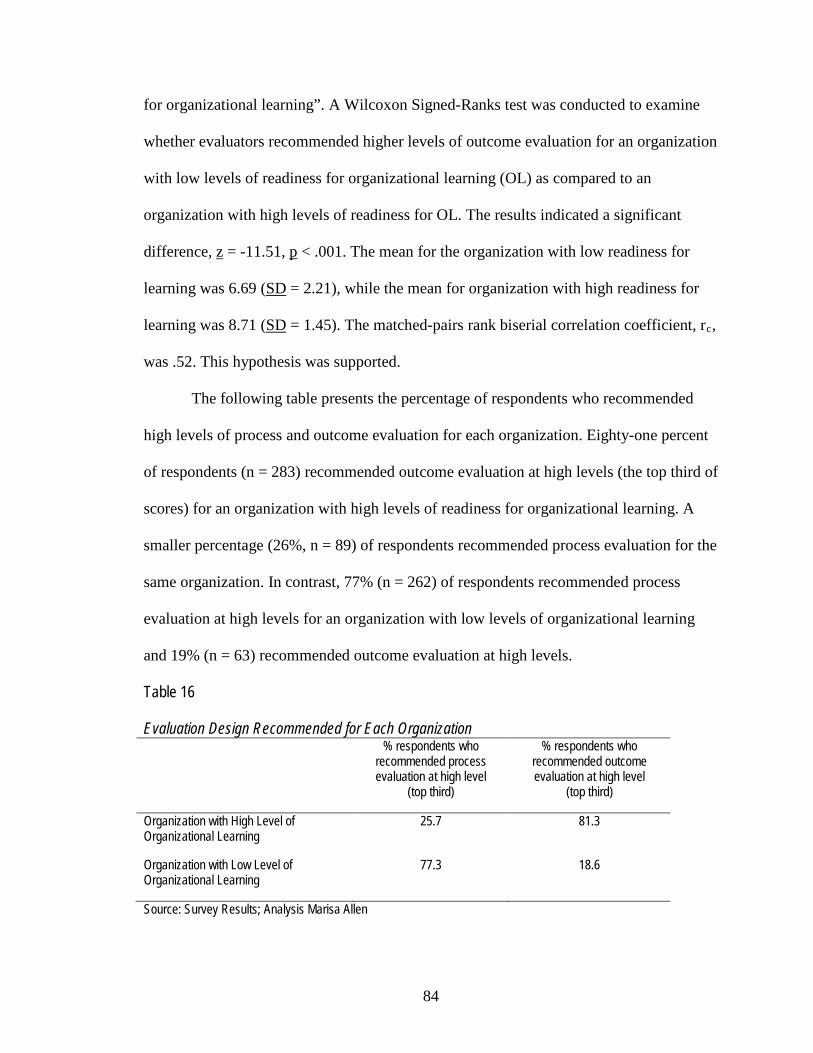
84
for organizational learning”. A Wilcoxon Signed-Ranks test was conducted to examine
whether evaluators recommended higher levels of outcome evaluation for an organization
with low levels of readiness for organizational learning (OL) as compared to an
organization with high levels of readiness for OL. The results indicated a significant
difference, z = -11.51, p < .001. The mean for the organization with low readiness for
learning was 6.69 (SD = 2.21), while the mean for organization with high readiness for
learning was 8.71 (SD = 1.45). The matched-pairs rank biserial correlation coefficient, rc
The following table presents the percentage of respondents who recommended
high levels of process and outcome evaluation for each organization. Eighty-one percent
of respondents (n = 283) recommended outcome evaluation at high levels (the top third of
scores) for an organization with high levels of readiness for organizational learning. A
smaller percentage (26%, n = 89) of respondents recommended process evaluation for the
same organization. In contrast, 77% (n = 262) of respondents recommended process
evaluation at high levels for an organization with low levels of organizational learning
and 19% (n = 63) recommended outcome evaluation at high levels.
,
was .52. This hypothesis was supported.
Table 16
Evaluation Design Recommended for Each Organization % respondents who
recommended process evaluation at high level
(top third)
% respondents who recommended outcome evaluation at high level
(top third)
Organization with High Level of Organizational Learning
25.7 81.3
Organization with Low Level of Organizational Learning
77.3 18.6
Source: Survey Results; Analysis Marisa Allen
85
Hypothesis 3
The third hypothesis stated the following, “Evaluators will rate process evaluation
as more useful for an organization with low levels of readiness for organizational
learning compared to an organization with high levels of readiness for organizational
learning”. A Wilcoxon Signed-Ranks test was conducted to examine whether evaluators
rated process evaluation as more useful for an organization with low levels of readiness
for organizational learning (OL) as compared to an organization with high levels of
readiness for OL. The results indicated a significant difference, z = -9.45, p < .001. The
mean for the organization with low readiness for learning was 8.50 (SD = 1.71), while the
mean for organization with high readiness for learning was 7.09 (SD = 1.99). The
matched-pairs rank biserial correlation coefficient, rc
Hypothesis 4
, was .45. This hypothesis was
supported.
The fourth hypothesis stated “Evaluators will rate outcome evaluation as more
useful for an organization with high levels of readiness for organizational learning as
compared to an organization with low levels of readiness for organizational learning.” A
Wilcoxon Signed-Ranks test was conducted to evaluate whether evaluators rated outcome
evaluation as more useful for an organization with low levels of readiness for
organizational learning (OL) as compared to an organization with high levels of readiness
for OL. The results indicated a significant difference, z = -11.71, p < .001. The mean for
the organization with low readiness for learning was 6.72 (SD = 2.28), while the mean for
organization with high readiness for learning was 8.99 (SD = 1.40). The matched-pairs
rank biserial correlation coefficient, rc, was .52. This hypothesis was supported.
86
Hypothesis 5
Part 1: Level of recommended process evaluation for organization with low
readiness for organizational learning. The fifth hypothesis stated that “evaluator
characteristics are related to their perceptions of readiness for organizational learning and
their design recommendations”. In order to examine this hypothesis for two different
organizations and for two different types of evaluation, this section is comprised of four
parts. The first part reports the findings for level of process evaluation for the
organization with low readiness for OL. Part 2 reports the findings for level of process
evaluation for the organization with high readiness for OL. Parts 3 and 4 report the
findings for level of outcome evaluation. First, a multiple regression analysis was
conducted to evaluate how well evaluator characteristics predict level of recommended
process evaluation for an organization with low readiness for OL. There were 10
variables identified as having a significant correlation (p = <.1) with the dependent
variable. These ten predictors and one measure of perceived readiness for organizational
learning were entered into the regression model. The technique of backward elimination
was utilized to create the final and most parsimonious model.
The final set of predictors was seven measures of evaluator characteristics and
one measure of perceived readiness for organizational learning. The criterion variable
was the level of recommended process evaluation for the organization with low levels of
OL. The linear combination of evaluator characteristics and perceived level of readiness
for organizational learning were significantly related to the level of recommended
process evaluation (F (8, 289) = 7.53, p < .001). The sample multiple correlation
coefficient was .42, indicating that approximately 17% of the variance in level of
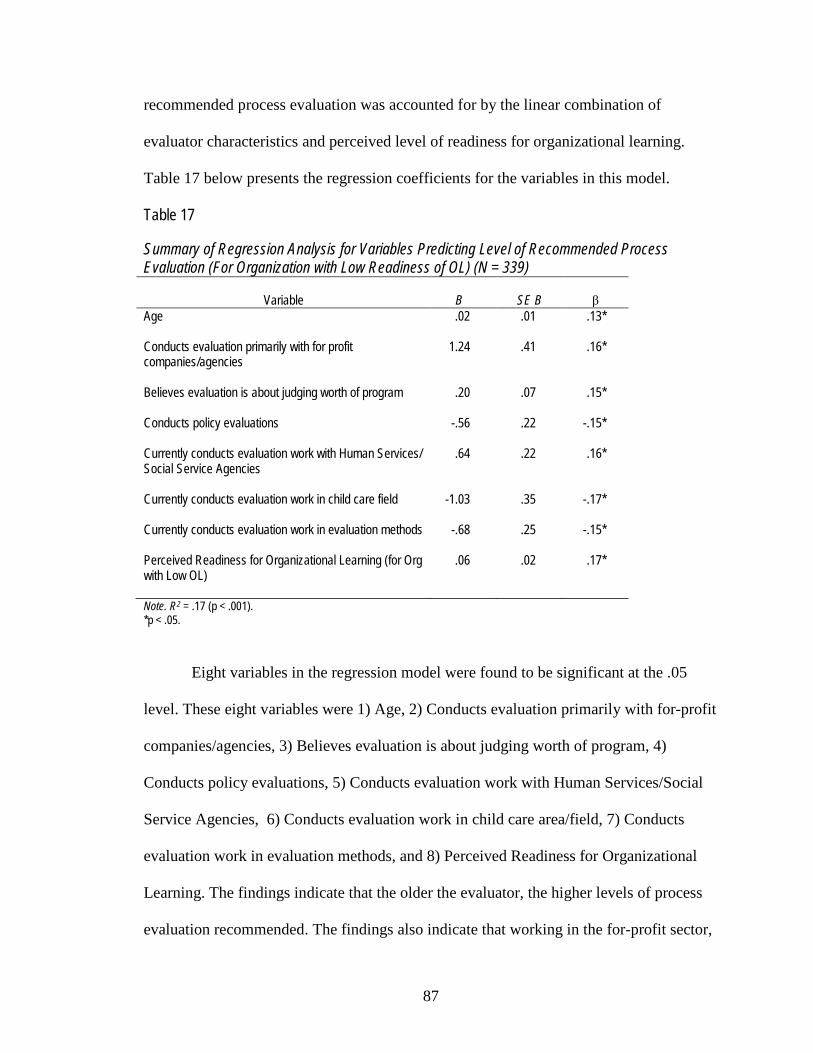
87
recommended process evaluation was accounted for by the linear combination of
evaluator characteristics and perceived level of readiness for organizational learning.
Table 17 below presents the regression coefficients for the variables in this model.
Table 17
Summary of Regression Analysis for Variables Predicting Level of Recommended Process Evaluation (For Organization with Low Readiness of OL) (N = 339)
Variable
B
SE B
β
Age
.02 .01 .13*
Conducts evaluation primarily with for profit companies/agencies
1.24 .41 .16*
Believes evaluation is about judging worth of program
.20 .07 .15*
Conducts policy evaluations
-.56 .22 -.15*
Currently conducts evaluation work with Human Services/ Social Service Agencies
.64 .22 .16*
Currently conducts evaluation work in child care field
-1.03 .35 -.17*
Currently conducts evaluation work in evaluation methods
-.68 .25 -.15*
Perceived Readiness for Organizational Learning (for Org with Low OL)
.06 .02 .17*
Note. R2
*p < .05. = .17 (p < .001).
Eight variables in the regression model were found to be significant at the .05
level. These eight variables were 1) Age, 2) Conducts evaluation primarily with for-profit
companies/agencies, 3) Believes evaluation is about judging worth of program, 4)
Conducts policy evaluations, 5) Conducts evaluation work with Human Services/Social
Service Agencies, 6) Conducts evaluation work in child care area/field, 7) Conducts
evaluation work in evaluation methods, and 8) Perceived Readiness for Organizational
Learning. The findings indicate that the older the evaluator, the higher levels of process
evaluation recommended. The findings also indicate that working in the for-profit sector,
88
believing evaluation is about judging the worth of a program, and currently working with
human services/social service agencies predicts high levels of recommended process
evaluation. Finally, the higher the levels of perceived readiness for organizational
learning, the higher the levels of process evaluation recommended.
In contrast, conducting policy evaluations, working in child care field, and
working in evaluation methods predicts low levels of recommended process evaluation.
Part 2: Level of recommended process evaluation for organization with high
readiness for organizational learning. In order to test Hypothesis 5 for an organization
with high levels of organizational learning, a similar process to that used in Part 1 was
used to construct a regression model.
A multiple regression analysis was conducted to evaluate how well evaluator
characteristics predict level of recommended process evaluation for an organization with
high readiness for OL. Again, in order to build a parsimonious regression model, Pearson
correlations were conducted for all evaluator characteristics and the criterion variable of
level of recommended process evaluation. Eight variables were identified as having a
significant correlation (p = <.1) with the dependent variable. These eight predictors and
one measure of perceived readiness for organizational learning were entered into the
regression model. The technique of backward elimination was utilized to create the final
and most parsimonious model.
The final set of predictors was eight measures of evaluator characteristics and one
measure of perceived readiness for organizational learning. The criterion variable was the
level of recommended process evaluation index for the organization with high levels of
OL. The linear combination of evaluator characteristics and perceived level of readiness
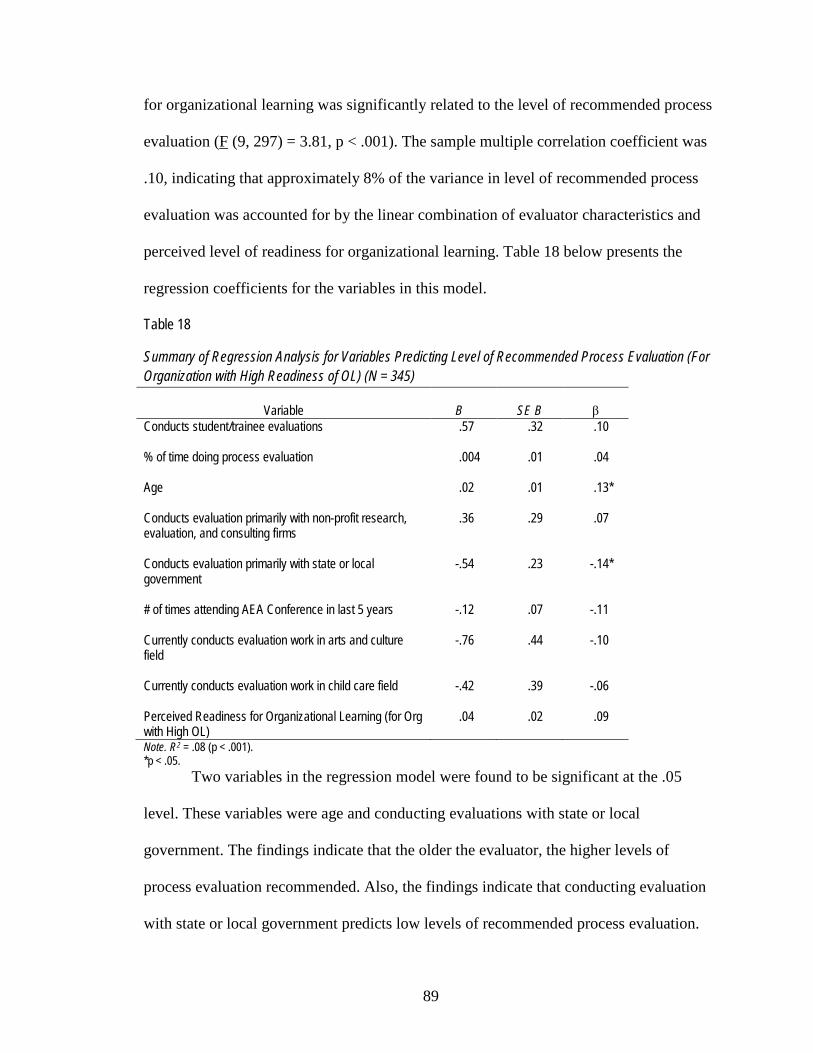
89
for organizational learning was significantly related to the level of recommended process
evaluation (F (9, 297) = 3.81, p < .001). The sample multiple correlation coefficient was
.10, indicating that approximately 8% of the variance in level of recommended process
evaluation was accounted for by the linear combination of evaluator characteristics and
perceived level of readiness for organizational learning. Table 18 below presents the
regression coefficients for the variables in this model.
Table 18
Summary of Regression Analysis for Variables Predicting Level of Recommended Process Evaluation (For Organization with High Readiness of OL) (N = 345)
Variable
B
SE B
β
Conducts student/trainee evaluations
.57 .32 .10
% of time doing process evaluation
.004 .01 .04
Age
.02 .01 .13*
Conducts evaluation primarily with non-profit research, evaluation, and consulting firms
.36 .29 .07
Conducts evaluation primarily with state or local government
-.54 .23 -.14*
# of times attending AEA Conference in last 5 years
-.12 .07 -.11
Currently conducts evaluation work in arts and culture field
-.76 .44 -.10
Currently conducts evaluation work in child care field
-.42 .39 -.06
Perceived Readiness for Organizational Learning (for Org with High OL)
.04 .02 .09
Note. R2
*p < .05. = .08 (p < .001).
Two variables in the regression model were found to be significant at the .05
level. These variables were age and conducting evaluations with state or local
government. The findings indicate that the older the evaluator, the higher levels of
process evaluation recommended. Also, the findings indicate that conducting evaluation
with state or local government predicts low levels of recommended process evaluation.
90
Comparing Results from Part 1 and Part 2. When the two regression models are
compared, the following conclusions can be made. Evaluator characteristics have more
predictive value in organizations with low levels of organizational learning. With the
exception of evaluator age, a different set of evaluator characteristics predicts level of
recommended process evaluation in the two different organizations. For example, results
in the organization with low levels of organizational learning indicate that working in the
for-profit sector, believing evaluation is about judging the worth of a program, and
currently working with human services/social service agencies predicts high levels of
recommended process evaluation. Also, the higher the levels of perceived readiness for
organizational learning, the higher the levels of process evaluation recommended. In
contrast, these particular characteristics were not related to level of recommended process
evaluation in the other organizational context. For example, in the organization with high
Part 3: Level of Recommended Outcome Evaluation for Organization with Low
Readiness for OL. This next section examines the extent to which evaluator
characteristics predict level of recommended
levels of organizational learning, the findings indicate that conducting evaluation with
state or local government predicts low levels of recommended process evaluation. Age
predicts high levels of recommended process evaluation in both organizational contexts;
the older you are, the more process evaluation you tend to recommend. Hypothesis 5 is
supported.
outcome evaluation. Another multiple
regression analysis was conducted to evaluate how well evaluator characteristics predict
level of recommended outcome evaluation for an organization with low readiness for OL.
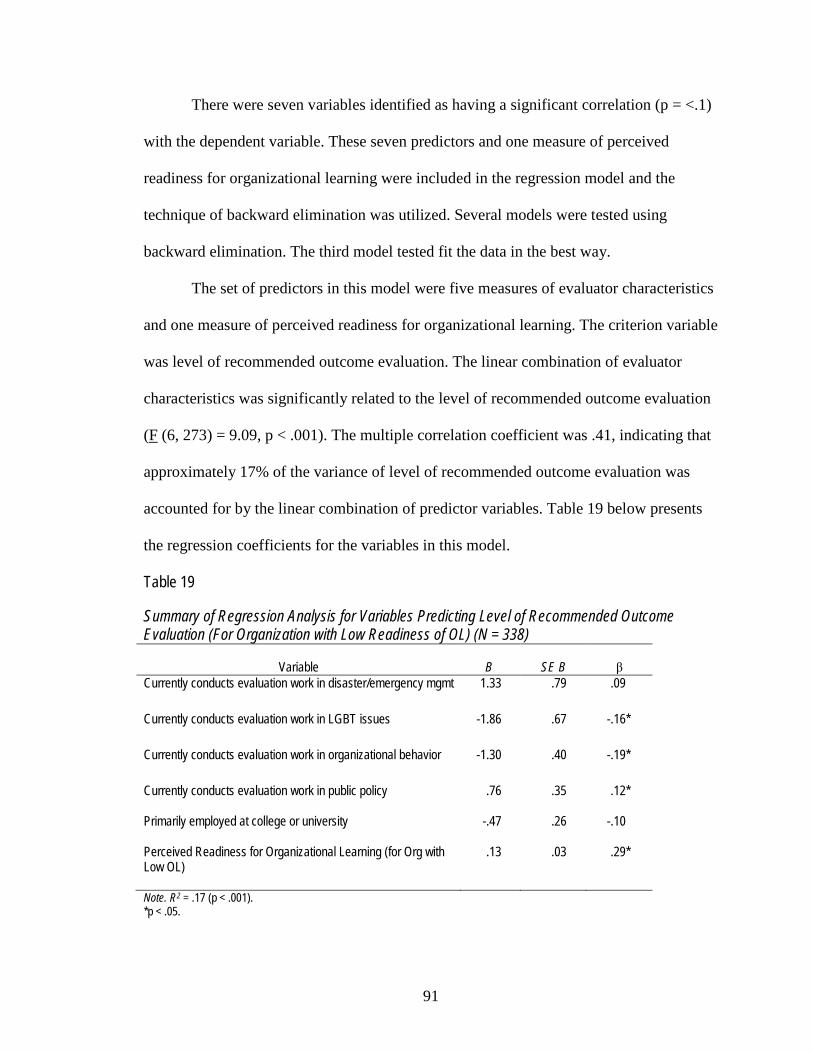
91
There were seven variables identified as having a significant correlation (p = <.1)
with the dependent variable. These seven predictors and one measure of perceived
readiness for organizational learning were included in the regression model and the
technique of backward elimination was utilized. Several models were tested using
backward elimination. The third model tested fit the data in the best way.
The set of predictors in this model were five measures of evaluator characteristics
and one measure of perceived readiness for organizational learning. The criterion variable
was level of recommended outcome evaluation. The linear combination of evaluator
characteristics was significantly related to the level of recommended outcome evaluation
(F (6, 273) = 9.09, p < .001). The multiple correlation coefficient was .41, indicating that
approximately 17% of the variance of level of recommended outcome evaluation was
accounted for by the linear combination of predictor variables. Table 19 below presents
the regression coefficients for the variables in this model.
Table 19
Summary of Regression Analysis for Variables Predicting Level of Recommended Outcome Evaluation (For Organization with Low Readiness of OL) (N = 338)
Variable
B
SE B
β
Currently conducts evaluation work in disaster/emergency mgmt
1.33 .79 .09
Currently conducts evaluation work in LGBT issues
-1.86 .67 -.16*
Currently conducts evaluation work in organizational behavior
-1.30 .40 -.19*
Currently conducts evaluation work in public policy
.76 .35 .12*
Primarily employed at college or university
-.47 .26 -.10
Perceived Readiness for Organizational Learning (for Org with Low OL)
.13 .03 .29*
Note. R2
*p < .05. = .17 (p < .001).
92
Four variables in the regression model were found to be significant at the .05 level. These
variables were conducting evaluation work on Lesbian, Gay, Bisexual, and Transgender
issues, organizational behavior, and public policy as well as perceived readiness for OL.
The findings indicate that conducting evaluation work related to Lesbian, Gay, Bisexual,
and Transgender issues and conducting evaluation work on organizational behavior
predicts low levels of recommended outcome evaluation. In contrast, conducting
evaluation work in public policy predicts high level of recommended outcome evaluation.
Finally, the higher the levels of perceived readiness for organizational learning the higher
the levels of recommended outcome evaluation.
Part 4: Level of Recommended Outcome Evaluation for Organization with High
Readiness for OL.
This next section examines the extent to which evaluator characteristics predict
level of recommended outcome
There were three variables identified as having a significant correlation (p = <.1)
with the dependent variable. These three predictors and one measure of perceived
readiness for organizational learning were included in the regression model and the
technique of backward elimination was utilized. Several models were tested using
backward elimination. The second model tested fit the data in the best way.
evaluation. Another multiple regression analysis was
conducted to evaluate how well evaluator characteristics predict level of recommended
outcome evaluation for an organization with high readiness for OL.
The set of predictors in this model were three measures of evaluator
characteristics and one measure of perceived readiness for organizational learning. The
criterion variable was level of recommended outcome evaluation for an organization with
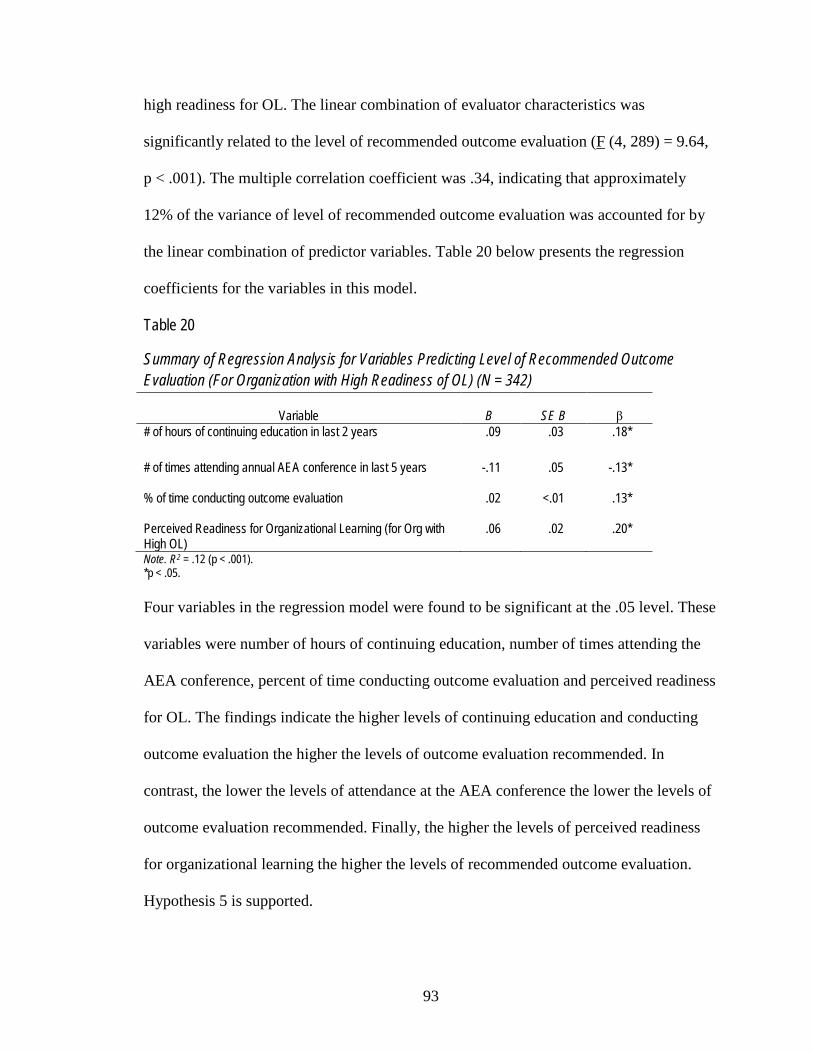
93
high readiness for OL. The linear combination of evaluator characteristics was
significantly related to the level of recommended outcome evaluation (F (4, 289) = 9.64,
p < .001). The multiple correlation coefficient was .34, indicating that approximately
12% of the variance of level of recommended outcome evaluation was accounted for by
the linear combination of predictor variables. Table 20 below presents the regression
coefficients for the variables in this model.
Table 20
Summary of Regression Analysis for Variables Predicting Level of Recommended Outcome Evaluation (For Organization with High Readiness of OL) (N = 342)
Variable
B
SE B
β
# of hours of continuing education in last 2 years
.09 .03 .18*
# of times attending annual AEA conference in last 5 years
-.11 .05 -.13*
% of time conducting outcome evaluation
.02 <.01 .13*
Perceived Readiness for Organizational Learning (for Org with High OL)
.06 .02 .20*
Note. R2
*p < .05. = .12 (p < .001).
Four variables in the regression model were found to be significant at the .05 level. These
variables were number of hours of continuing education, number of times attending the
AEA conference, percent of time conducting outcome evaluation and perceived readiness
for OL. The findings indicate the higher levels of continuing education and conducting
outcome evaluation the higher the levels of outcome evaluation recommended. In
contrast, the lower the levels of attendance at the AEA conference the lower the levels of
outcome evaluation recommended. Finally, the higher the levels of perceived readiness
for organizational learning the higher the levels of recommended outcome evaluation.
Hypothesis 5 is supported.
94
Hypothesis 6
Part 1. Hypothesis 6 stated that “Evaluator characteristics are related to the ability
to accurately identify readiness for organizational learning”. As discussed in the Measure
section above, respondents were grouped into one of three categories based on how they
scored questions assessing each organization’s readiness for OL. In order to assess
evaluator characteristics that predicted high levels of discernment, the 103 respondents
with the highest scores on the measure “Ability to Discern OL” were included in the
following regression model. Thus, this analysis examines only the 103 respondents who
were had the best discernment of readiness for OL.
A multiple regression analysis was conducted to evaluate how well evaluator
characteristics predict ability to discern low readiness for organizational learning.
Evaluator characteristics that had statistically significant (p<.1) correlation coefficients
were included in the first regression model. There were seven variables were that met
these criteria. These seven predictors were entered into the regression model.
The final regression model includes six measures of evaluator characteristics. The
criterion variable was ability to discern readiness for organizational learning for the
organization with low levels of OL. The linear combination of evaluator characteristics
was significantly related to the ability to discern readiness for organizational learning (F
(6, 89) = 5.03, p < .001). The sample multiple correlation coefficient was .50, indicating
that approximately 25% of the variance of ability to discern low readiness for
organizational learning was accounted for by the linear combination of evaluator
characteristics. Table 21 below presents the regression coefficients for the variables in
this model.
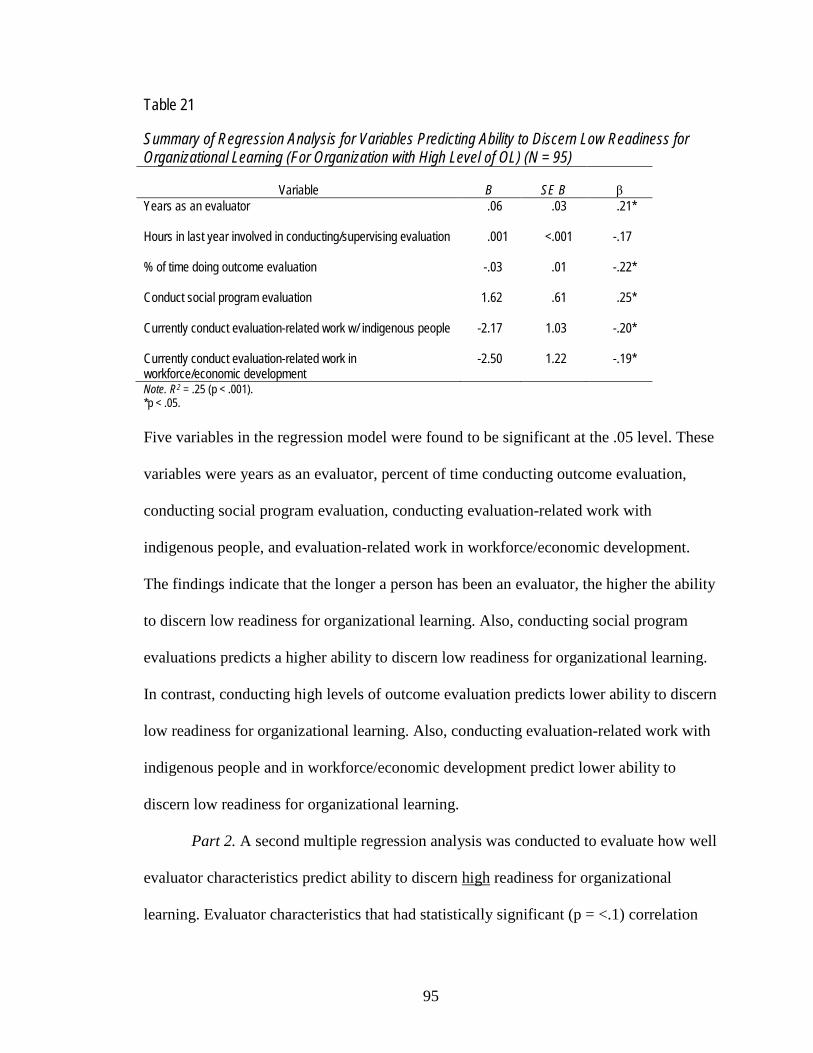
95
Table 21
Summary of Regression Analysis for Variables Predicting Ability to Discern Low Readiness for Organizational Learning (For Organization with High Level of OL) (N = 95)
Variable
B
SE B
β
Years as an evaluator .06 .03 .21*
Hours in last year involved in conducting/supervising evaluation
.001 <.001 -.17
% of time doing outcome evaluation
-.03 .01 -.22*
Conduct social program evaluation
1.62 .61 .25*
Currently conduct evaluation-related work w/ indigenous people
-2.17 1.03 -.20*
Currently conduct evaluation-related work in workforce/economic development
-2.50 1.22 -.19*
Note. R2
*p < .05. = .25 (p < .001).
Five variables in the regression model were found to be significant at the .05 level. These
variables were years as an evaluator, percent of time conducting outcome evaluation,
conducting social program evaluation, conducting evaluation-related work with
indigenous people, and evaluation-related work in workforce/economic development.
The findings indicate that the longer a person has been an evaluator, the higher the ability
to discern low readiness for organizational learning. Also, conducting social program
evaluations predicts a higher ability to discern low readiness for organizational learning.
In contrast, conducting high levels of outcome evaluation predicts lower ability to discern
low readiness for organizational learning. Also, conducting evaluation-related work with
indigenous people and in workforce/economic development predict lower ability to
discern low readiness for organizational learning.
Part 2. A second multiple regression analysis was conducted to evaluate how well
evaluator characteristics predict ability to discern high readiness for organizational
learning. Evaluator characteristics that had statistically significant (p = <.1) correlation
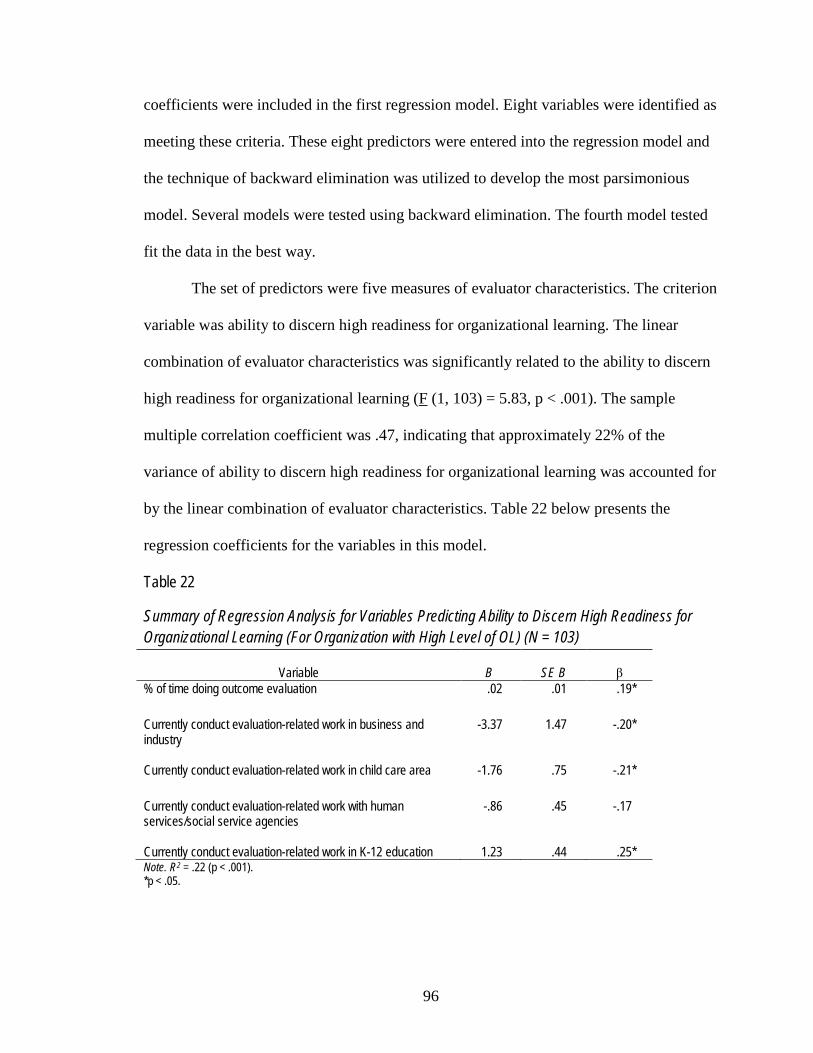
96
coefficients were included in the first regression model. Eight variables were identified as
meeting these criteria. These eight predictors were entered into the regression model and
the technique of backward elimination was utilized to develop the most parsimonious
model. Several models were tested using backward elimination. The fourth model tested
fit the data in the best way.
The set of predictors were five measures of evaluator characteristics. The criterion
variable was ability to discern high readiness for organizational learning. The linear
combination of evaluator characteristics was significantly related to the ability to discern
high readiness for organizational learning (F (1, 103) = 5.83, p < .001). The sample
multiple correlation coefficient was .47, indicating that approximately 22% of the
variance of ability to discern high readiness for organizational learning was accounted for
by the linear combination of evaluator characteristics. Table 22 below presents the
regression coefficients for the variables in this model.
Table 22
Summary of Regression Analysis for Variables Predicting Ability to Discern High Readiness for Organizational Learning (For Organization with High Level of OL) (N = 103)
Variable
B
SE B
β
% of time doing outcome evaluation
.02 .01 .19*
Currently conduct evaluation-related work in business and industry
-3.37 1.47 -.20*
Currently conduct evaluation-related work in child care area
-1.76 .75 -.21*
Currently conduct evaluation-related work with human services/social service agencies
-.86 .45 -.17
Currently conduct evaluation-related work in K-12 education 1.23 .44 .25* Note. R2
*p < .05. = .22 (p < .001).
97
Four variables in the regression model were found to be significant at the .05 level. The
findings indicate that conducting evaluation-related work in business and industry and in
the child care area predicts a higher ability to discern high readiness for organizational
learning. In contrast, higher levels of conducting outcome evaluation predict lower ability
to discern high readiness for organizational learning. Also, conducting evaluation-related
work in K-12 education predicts lower ability to discern high readiness for organizational
learning. Hypothesis 6 is supported.
Hypothesis 7.
Part 1: For organization with low levels of organizational learning. The seventh
hypothesis stated that “evaluators match design and use recommendations based on an
interplay between their characteristics and readiness for organizational learning”. In order
to test this hypothesis in different organizational contexts, this hypothesis was first
applied to the measures in the survey for an organization with low levels of
organizational learning. This section reports these findings.
A multiple regression analysis was conducted to evaluate how well evaluator
characteristics, readiness for organizational learning, level of recommended process
evaluation, and level of recommended outcome evaluation predict use recommendations
for an organization with low readiness for OL. Again, in order to build a parsimonious
regression model, Pearson correlations were conducted for all evaluator characteristics
and the criterion variable of use recommendations. Evaluator characteristics that had
statistically significant (p<.1) correlation coefficients were included in the regression
model. Nine variables were identified as meeting these criteria. These nine predictors, the
measure of perceived readiness for organizational learning, the measure of level of
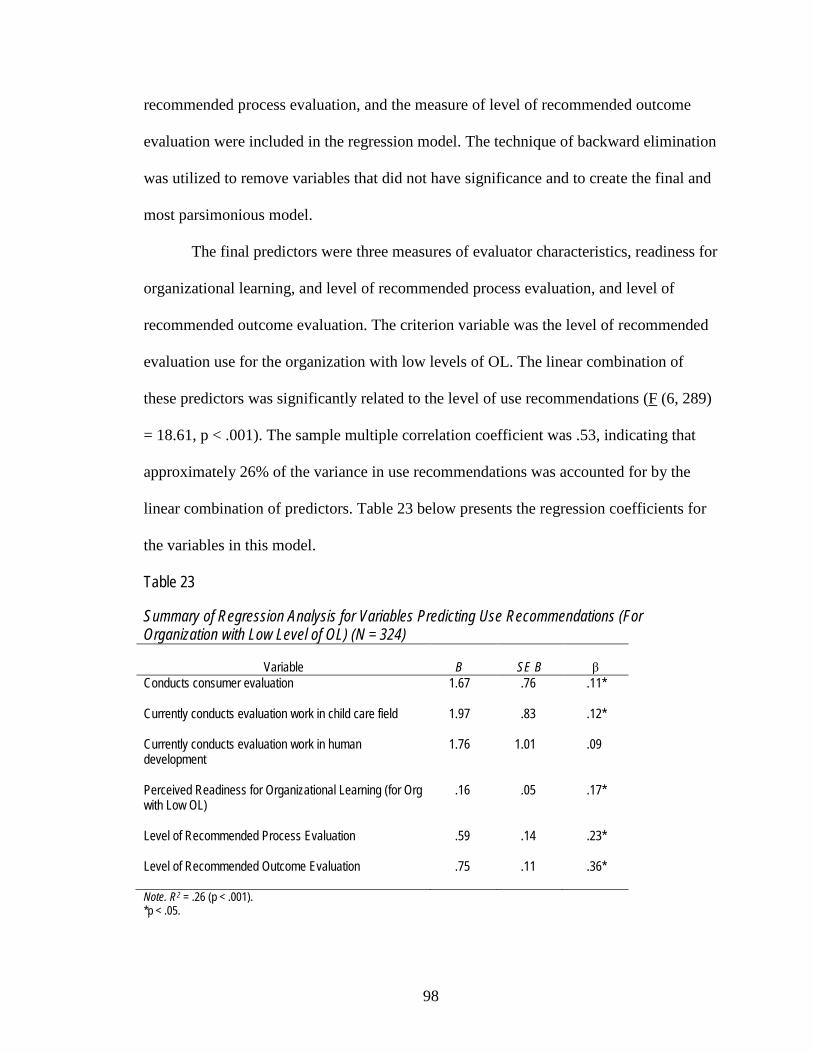
98
recommended process evaluation, and the measure of level of recommended outcome
evaluation were included in the regression model. The technique of backward elimination
was utilized to remove variables that did not have significance and to create the final and
most parsimonious model.
The final predictors were three measures of evaluator characteristics, readiness for
organizational learning, and level of recommended process evaluation, and level of
recommended outcome evaluation. The criterion variable was the level of recommended
evaluation use for the organization with low levels of OL. The linear combination of
these predictors was significantly related to the level of use recommendations (F (6, 289)
= 18.61, p < .001). The sample multiple correlation coefficient was .53, indicating that
approximately 26% of the variance in use recommendations was accounted for by the
linear combination of predictors. Table 23 below presents the regression coefficients for
the variables in this model.
Table 23
Summary of Regression Analysis for Variables Predicting Use Recommendations (For Organization with Low Level of OL) (N = 324)
Variable
B
SE B
β
Conducts consumer evaluation
1.67 .76 .11*
Currently conducts evaluation work in child care field
1.97 .83 .12*
Currently conducts evaluation work in human development
1.76 1.01 .09
Perceived Readiness for Organizational Learning (for Org with Low OL)
.16 .05 .17*
Level of Recommended Process Evaluation
.59 .14 .23*
Level of Recommended Outcome Evaluation .75 .11 .36*
Note. R2
*p < .05. = .26 (p < .001).
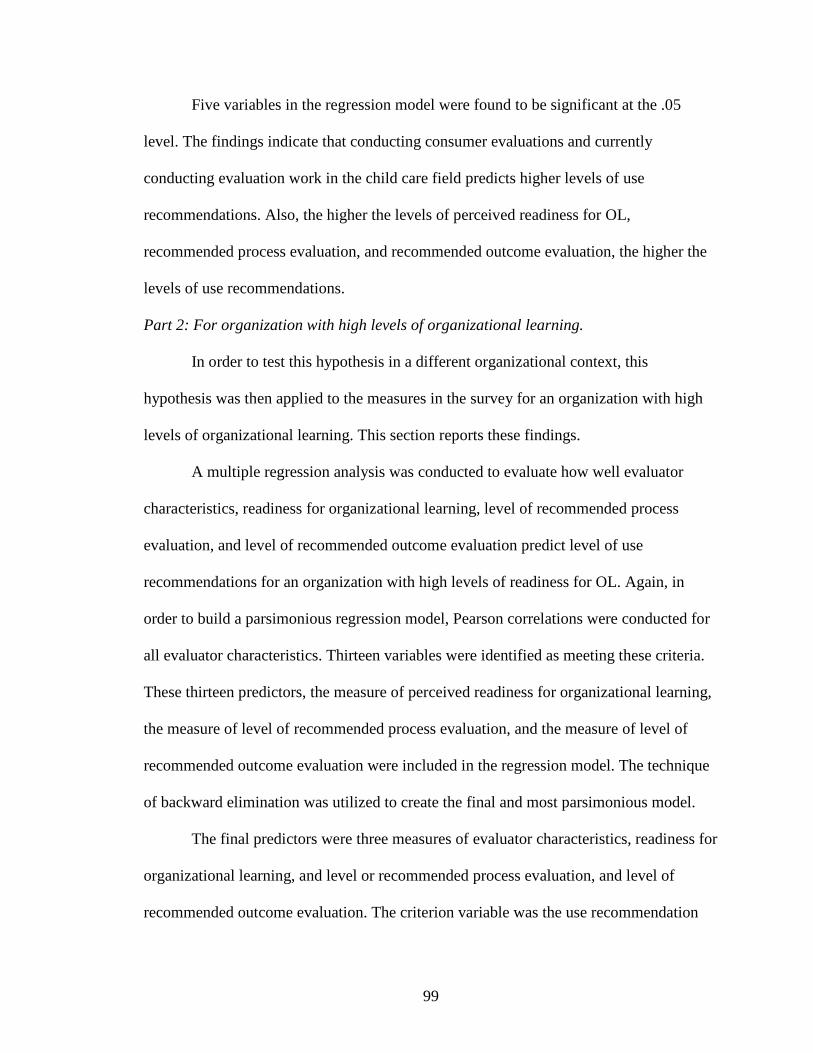
99
Five variables in the regression model were found to be significant at the .05
level. The findings indicate that conducting consumer evaluations and currently
conducting evaluation work in the child care field predicts higher levels of use
recommendations. Also, the higher the levels of perceived readiness for OL,
recommended process evaluation, and recommended outcome evaluation, the higher the
levels of use recommendations.
Part 2: For organization with high levels of organizational learning.
In order to test this hypothesis in a different organizational context, this
hypothesis was then applied to the measures in the survey for an organization with high
levels of organizational learning. This section reports these findings.
A multiple regression analysis was conducted to evaluate how well evaluator
characteristics, readiness for organizational learning, level of recommended process
evaluation, and level of recommended outcome evaluation predict level of use
recommendations for an organization with high levels of readiness for OL. Again, in
order to build a parsimonious regression model, Pearson correlations were conducted for
all evaluator characteristics. Thirteen variables were identified as meeting these criteria.
These thirteen predictors, the measure of perceived readiness for organizational learning,
the measure of level of recommended process evaluation, and the measure of level of
recommended outcome evaluation were included in the regression model. The technique
of backward elimination was utilized to create the final and most parsimonious model.
The final predictors were three measures of evaluator characteristics, readiness for
organizational learning, and level or recommended process evaluation, and level of
recommended outcome evaluation. The criterion variable was the use recommendation
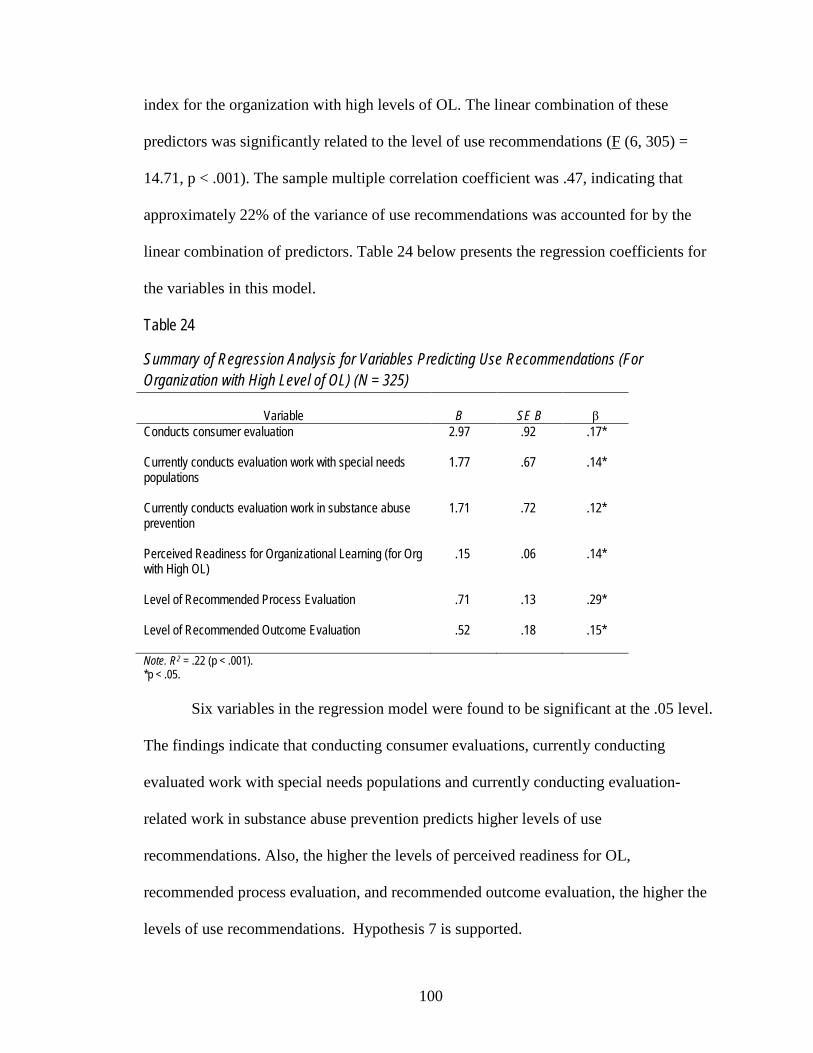
100
index for the organization with high levels of OL. The linear combination of these
predictors was significantly related to the level of use recommendations (F (6, 305) =
14.71, p < .001). The sample multiple correlation coefficient was .47, indicating that
approximately 22% of the variance of use recommendations was accounted for by the
linear combination of predictors. Table 24 below presents the regression coefficients for
the variables in this model.
Table 24
Summary of Regression Analysis for Variables Predicting Use Recommendations (For Organization with High Level of OL) (N = 325)
Variable
B
SE B
β
Conducts consumer evaluation
2.97 .92 .17*
Currently conducts evaluation work with special needs populations
1.77 .67 .14*
Currently conducts evaluation work in substance abuse prevention
1.71 .72 .12*
Perceived Readiness for Organizational Learning (for Org with High OL)
.15 .06 .14*
Level of Recommended Process Evaluation
.71 .13 .29*
Level of Recommended Outcome Evaluation .52 .18 .15*
Note. R2
*p < .05. = .22 (p < .001).
Six variables in the regression model were found to be significant at the .05 level.
The findings indicate that conducting consumer evaluations, currently conducting
evaluated work with special needs populations and currently conducting evaluation-
related work in substance abuse prevention predicts higher levels of use
recommendations. Also, the higher the levels of perceived readiness for OL,
recommended process evaluation, and recommended outcome evaluation, the higher the
levels of use recommendations. Hypothesis 7 is supported.
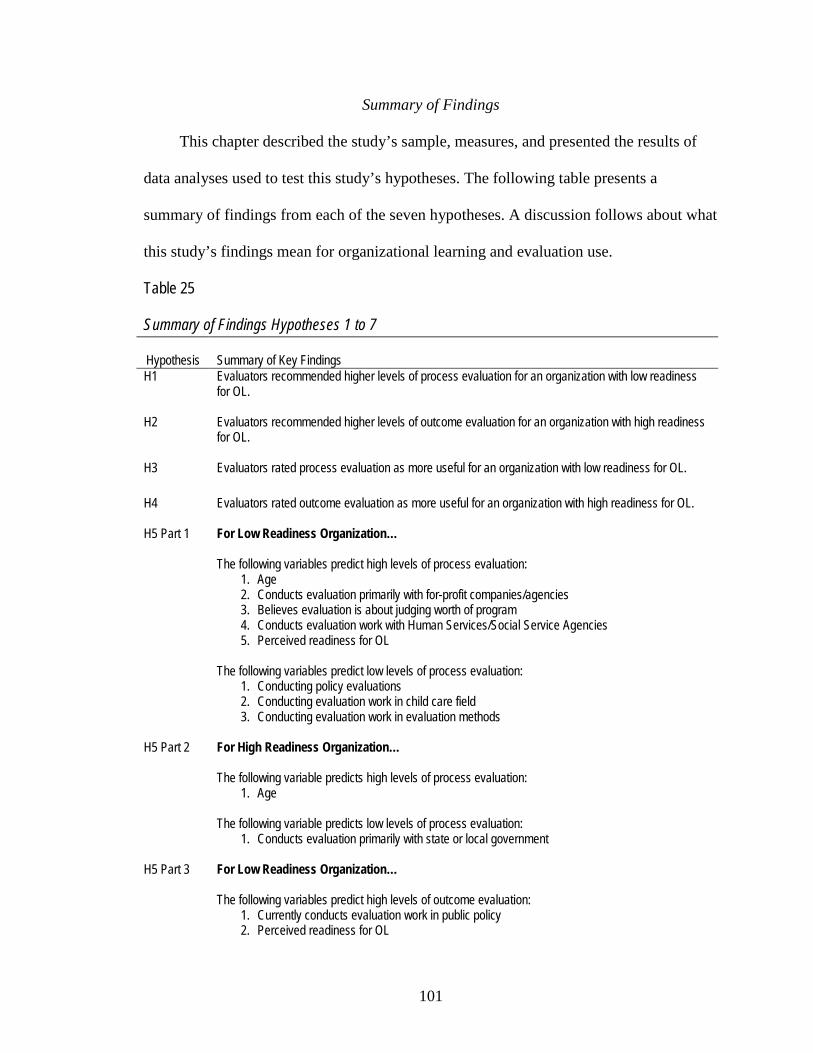
101
Summary of Findings
This chapter described the study’s sample, measures, and presented the results of
data analyses used to test this study’s hypotheses. The following table presents a
summary of findings from each of the seven hypotheses. A discussion follows about what
this study’s findings mean for organizational learning and evaluation use.
Table 25
Summary of Findings Hypotheses 1 to 7
Hypothesis
Summary of Key Findings H1 Evaluators recommended higher levels of process evaluation for an organization with low readiness
for OL.
H2 Evaluators recommended higher levels of outcome evaluation for an organization with high readiness for OL.
H3 Evaluators rated process evaluation as more useful for an organization with low readiness for OL.
H4 Evaluators rated outcome evaluation as more useful for an organization with high readiness for OL.
H5 Part 1 For Low Readiness Organization…
The following variables predict high levels of process evaluation:
1. Age 2. Conducts evaluation primarily with for-profit companies/agencies 3. Believes evaluation is about judging worth of program 4. Conducts evaluation work with Human Services/Social Service Agencies 5. Perceived readiness for OL
The following variables predict low levels of process evaluation:
1. Conducting policy evaluations 2. Conducting evaluation work in child care field 3. Conducting evaluation work in evaluation methods
H5 Part 2 For High Readiness Organization…
The following variable predicts high levels of process evaluation:
1. Age The following variable predicts low levels of process evaluation:
1. Conducts evaluation primarily with state or local government
H5 Part 3 For Low Readiness Organization… The following variables predict high levels of outcome evaluation:
1. Currently conducts evaluation work in public policy 2. Perceived readiness for OL
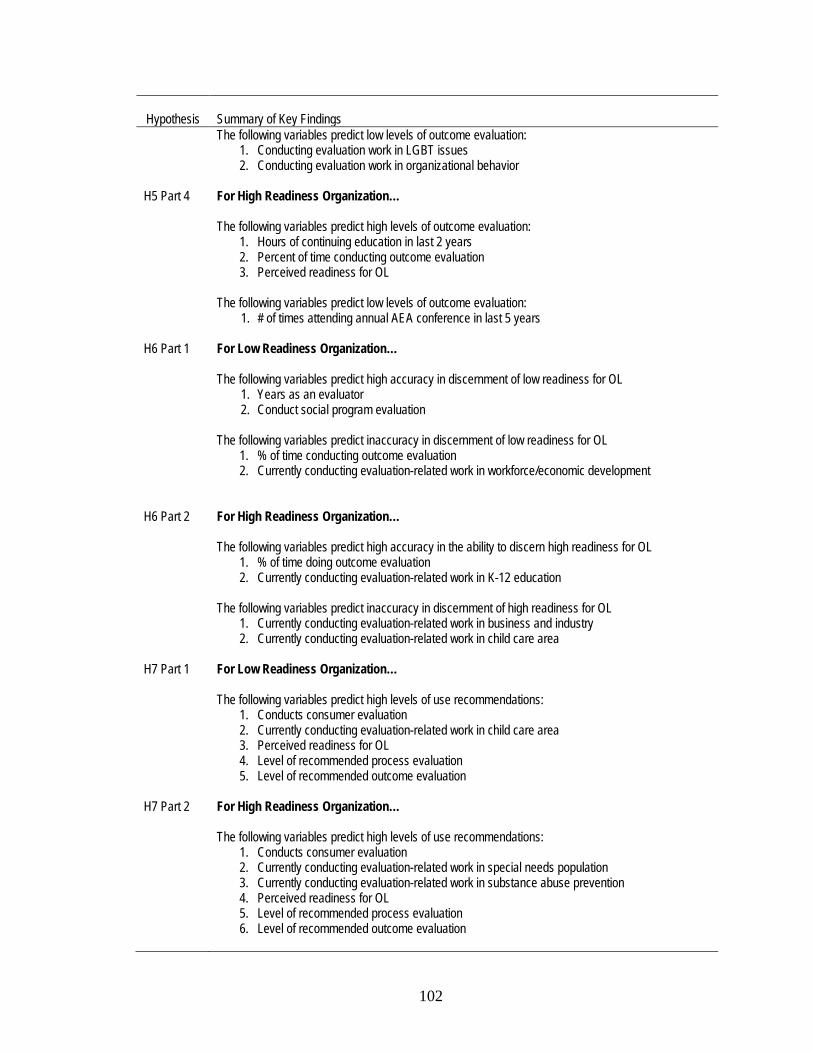
102
Hypothesis
Summary of Key Findings The following variables predict low levels of outcome evaluation:
1. Conducting evaluation work in LGBT issues 2. Conducting evaluation work in organizational behavior
H5 Part 4 For High Readiness Organization… The following variables predict high levels of outcome evaluation:
1. Hours of continuing education in last 2 years 2. Percent of time conducting outcome evaluation 3. Perceived readiness for OL
The following variables predict low levels of outcome evaluation:
1. # of times attending annual AEA conference in last 5 years
H6 Part 1 For Low Readiness Organization… The following variables predict high accuracy in discernment of low readiness for OL
1. Years as an evaluator 2. Conduct social program evaluation
The following variables predict inaccuracy in discernment of low readiness for OL 1. % of time conducting outcome evaluation 2. Currently conducting evaluation-related work in workforce/economic development
H6 Part 2 For High Readiness Organization… The following variables predict high accuracy in the ability to discern high readiness for OL
1. % of time doing outcome evaluation 2. Currently conducting evaluation-related work in K-12 education
The following variables predict inaccuracy in discernment of high readiness for OL 1. Currently conducting evaluation-related work in business and industry 2. Currently conducting evaluation-related work in child care area
H7 Part 1 For Low Readiness Organization…
The following variables predict high levels of use recommendations:
1. Conducts consumer evaluation 2. Currently conducting evaluation-related work in child care area 3. Perceived readiness for OL 4. Level of recommended process evaluation 5. Level of recommended outcome evaluation
H7 Part 2 For High Readiness Organization…
The following variables predict high levels of use recommendations:
1. Conducts consumer evaluation 2. Currently conducting evaluation-related work in special needs population 3. Currently conducting evaluation-related work in substance abuse prevention 4. Perceived readiness for OL 5. Level of recommended process evaluation 6. Level of recommended outcome evaluation
103
. As a whole what do these findings say about organizational learning and evaluation use?
The findings from this study indicate that there is a measurable relationship
between organizational learning and the way evaluators design evaluations. From these
results, it appears that evaluators believe that high levels of process evaluation are a
better match for organizations that are not ready to learn. In contrast, for organizations
that appear ready to learn, evaluators recommend high levels of outcome evaluation. Not
only do evaluators recommend high level of process evaluation for low readiness
organizations, but they believe that process evaluation is more useful
Results also indicated that evaluator characteristics have a relationship to
discernment of readiness for organizational learning. As discussed in Hypothesis 6 there
are several evaluator characteristics (e.g., years of experience, conducting social program
evaluation) that predict better ability to detect perceived readiness for organizational
learning.
for these kinds of
organizations. For organizations with high readiness for learning, evaluators believe
outcome evaluation is more useful.
Finally, results indicate that there are several categories of factors that impact
evaluation use. Hypothesis 7 explored the idea that evaluator characteristics, readiness for
organizational learning and evaluation design all have a relationship to evaluation use.
These relationships appear to be different when two distinct organizations are described.
Or better said, the organizational context appears to affect evaluator choices and
recommendations about evaluation use.
The final chapter presents the implications of these findings, discusses the
limitations of this study, and discusses areas for future research.
104
CHAPTER 5.
Discussion
Introduction
This final chapter discusses the findings in relationship to current literature, the
limitations of this research, the implications of the study’s findings, and presents areas for
future research. The next section discusses the study findings in the context of existing
literature.
Discussion of Findings
The first two hypotheses in this study focused on the relationship between the
evaluator and an organization. Results indicated that evaluators make different choices
about evaluation based on the characteristics of the organization. These findings add to
the understanding of the environment in which evaluation use may take place. In
particular, these findings provide evidence of the “interaction model” hypothesized in
knowledge transfer theories. Landry et al. (2001) argues that knowledge use happens in
an environment with bidirectional interactions between the researchers and the
organization (as opposed to a linear relationship where the researcher is the only source
of ideas and the organization is the receptacle for that research). This study provides
evidence that evaluators consider organizational characteristics as they make decisions
about their evaluation design.
Findings from Hypothesis 1 and 2 also support the ideas of organizational
learning theorists (Cousins et al., 2006; Cousins et al., 2004; Preskill & Caracelli, 1997;
Preskill et al., 2003) that organizational level variables play a role in understanding

105
evaluation and its use. This study supports ideas discussed in the case study conducted by
Compton et al. (2002). Compton concluded that evaluations need to be “sensitive and
responsive to the organization’s structures, cultures, and every day practices” (p. 54).
This study found in Hypotheses 3 and 4 that evaluators not only recommended
more outcome evaluation for learning organizations; they rated outcome evaluation as
more useful for these organizations. This idea is also consistent with organizational
learning theory which suggests that organizations differ in their ability to learn and
process information (Cousins et al., 2004; Garvin, 1993; Goh & Richards, 1997; Huber,
1991). This finding also is consistent with research that finds “learning organizations”
have a propensity to use evaluation at high levels (Torres et al., 1996).
Hypothesis 5 found that evaluator characteristics are predictors of the levels of
process and outcome evaluation evaluators recommend and the ways in which they
perceive readiness for organizational learning. This finding provides empirical evidence
for some of Patton’s ideas (Patton, 1988c). Patton suggests that evaluation design choices
stem partly from the preferences of the field in which the evaluator was trained and the
approach with which the evaluator feels most comfortable. This research is also
consistent with the work of Huberman (1990) and Landry et al. (2001) indicating that
characteristics and perception of the “intermediary” or “evaluator”, in our case, influence
the transfer of knowledge. While Huberman’s research focuses on the transfer of research
in academic settings to other educational settings, this study’s findings are consistent with
his ideas. The findings from Hypothesis 5 provide further evidence to support Landry’s
interaction model (2001). Characteristics such as age of the evaluator and whether or not
an evaluator had worked with social service agencies predicted the kind of evaluation

106
activities that were recommended. Specifically analyses indicated that older evaluators
recommended high levels of process evaluation. Also, an organization’s perceived
readiness for learning predicted the kinds of choices an evaluator made.
Hypothesis 6 tested the idea that some evaluators are more accurate than others at
discerning organizational readiness for learning. Results indicated that characteristics of
the evaluator predicted better discernment. For example, evaluators with more years of
experience and those who had conducted social program evaluation were better at
identifying an organization not ready for learning. Notably, the age of the evaluator did
not predict accurate discernment. Rather, experience predicted accurate discernment. The
more years of experience an evaluator had, the more accurate her or his discernment. This
finding identified another variable of interest in the determination of what may lead to
evaluation use. No other known study has examined evaluators’ varying ability to discern
organizational readiness for learning. While other research has identified a long list of
evaluator characteristics that may influence evaluation use, ability to discern readiness for
learning was not among them. Given that Patton (1997) argues that evaluation use is
enhanced by evaluators who are very knowledgeable about the context of the program
and are responsive to the particular needs of the organization, understanding an
organization’s level of readiness for learning may be another characteristic an evaluator
needs to facilitate evaluation use.
Hypothesis 7 supports the idea that evaluator characteristics and organizational
variables in combination with one another have a relationship to evaluation use. This
research looked at the combination of individual and organizational level variables that
predict use. It found that evaluator characteristics and characteristics of the organization
107
influence evaluation use recommendations. This finding supports the ideas of Weiss
(1998) that it is the interplay of many factors that results in high evaluation use. Also, this
research supports Alkin’s ideas (Alkin et al., 1979) that factors leading to use are
interdependent and it is the interaction of these variable that impact use. This study also
supports the ideas of Thompson (1994) that evaluation use may be higher when the
organizational context of the program is not highly chaotic and political (Thompson,
1994).
Also, this study supports conclusions from the infamous Weiss and Patton debates
(Smith & Chircop, 1989). Smith and Chircop (1989) concluded that Weiss and Patton’s
ideas about evaluation use were based on working as evaluators in two very different
organizational contexts. (Weiss worked primarily with large government agencies and
Patton worked primarily with smaller non-profit organizations.) The study supports these
ideas that the ability of an evaluator to encourage use is dependent on organizational
context.
It is important to note that there were several evaluator characteristics that were
not predictive of: 1) the type of evaluation design chosen, 2) ability to discern
organizational learning, or 3) level of use recommendations. Notably being an internal or
external evaluator did not predict evaluation design choices or use recommendations.
This study had a similar finding to that of Balthasar (2006) which concluded that having
an external versus internal evaluator did not impact the level of evaluation use.
Also, gender, level of current evaluation work, and level of continuing education
were other evaluator characteristics that did not influence 1) the type of evaluation design
108
chosen, 2) ability to discern organizational learning, or 3) level of use recommendations
in this study.
This study fits into the emerging literature (Balthasar, 2006; Compton et al., 2002;
Cousins et al., 2006; Cousins et al., 2004) that attempts to understand to what extent the
characteristics of an organization play a role in evaluation use. This study is distinct in
that it measured the effect of organizational context and evaluator characteristics in
conjunction with one another. It provides more understanding of the environment in
which evaluation and its use takes place. Specifically, this study points to an examination
of an organization’s readiness for learning and the particular characteristics of evaluators
as factors influencing evaluation use.
Limitations
The current study has several limitations. This study cannot corroborate responses
because the survey is a self-report and the validity of responses cannot be assessed.
Follow-up interviews or other means were not used to validate the responses of survey
participants. Also, web-based survey research tends to produce low response rates and
this study had a 19% response rate. This low response rate impacts the ability of this
study to make generalizations to the entire AEA population or have high external
validity.
Demographic characteristics of this sample differed from those of the population
of evaluators who are members of the American Evaluation Association. This also limits
generalizability of the study. This study’s sample was older, had more advanced degrees,
and was more experienced in evaluation than the known AEA population.
109
Survey items used in the study were not formally assessed for content, criterion-
related or construct validity. Content validity (or face validity) was strengthened by
having committee members and eight evaluators review the survey before dissemination.
It is not known if questions on the survey consistently and predictably measured the
concepts of interest. The study also used vignettes to describe two organizations as a
simulation of a real world experience. Thus, the study could not determine if evaluators
would make similar judgments in their own work as evaluators.
Measuring Perception
Measuring
of Readiness for Organizational Learning
perception of readiness for organizational learning presents significant
challenges. It is not known if survey respondents conceptualized the organizations in the
vignette in the same manner as the researcher in the conceptual model for this study. This
study’s conceptual model relied on respondents’ ability to detect that the two
organizations were distinct from one another. Although the eight pilot participants were
able to identify the differences in the two organizations described in the vignette, it is not
known to what extent survey respondents in the final sample were able to make this
distinction. Research often takes for granted that the researcher’s understanding of terms
is the same as those participating in research (Holstein & Gubrium, 1998). “In other
words, we assume that others experience the world basically the same way we do and that
we can therefore understand one another in our dealing in and with the world. We take
our subjectively for granted, overlooking its constitutive character” (p .140). Thus,
because follow-up interviews were not conducted with any survey respondents, it is not
known to what extent the meaning of the concepts in the survey was shared equally
among respondents.
110
Skipped Item Distinction
Also, the Survey Monkey software used for data collection limited the way in
which a skipped question or item was recorded. Thus, if a respondent skipped an entire
item that was a multiple response question, it could not be determined if the respondent
left the question blank or responded “no” to that particular item. Survey Monkey did not
distinguish between skipped questions and no responses for the questions in which
multiple responses were allowed. Thus, there were seven multiple-response items in the
survey (item numbers 10, 12, 15, 24, 28, 37 and 41) in which the respondent’s intention,
either to skip the entire question or to apply “no”, could not be determined accurately.
Survey Fatigue
Seventy-two respondents answered the first 20 questions about their
characteristics and then answered only the questions immediately following the first
vignette. Thus, 18% of the sample had responses to only one of the two vignettes. This
finding indicates that respondents left the survey because it was too long or because they
experienced an interruption and did not have time to finish the survey. It is not known to
what extent these respondents would have answered the second vignette differently from
other respondents. I designed the survey knowing that some respondents might stop
before completing both vignettes. Thus, there were two versions of the survey. These
surveys were identical but the order of the two vignettes was switched.
Differing Definitions of Concepts
During the dissemination of the survey, six respondents wrote emails or a note in
a field of the survey discussing how they may have had different definitions of process
and outcome evaluation than the survey. In the actual content of the survey, the term
111
process evaluation was defined as “evaluation designed and used to improve a program
or object, especially when it is still being developed” and outcome evaluation was
defined as “evaluation designed to present conclusions about the merit or worth of an
object and recommendations about whether it should be retained, altered, or eliminated”.
In general these respondents preferred the terms “formative” and “summative” evaluation
with formative being similar to process evaluation and summative being similar to
outcome evaluation. One respondent felt that process evaluation had a different meaning
than the survey described. The respondent felt that process evaluation could be done to
improve a process (formative evaluation) or to render a judgment as to the merit or worth
of a process (summative evaluation). In general, the comments suggested that these
respondents’ view of process and outcome evaluation were similar enough to the survey’s
definition so their responses were included in the analysis. However, these comments
suggest that some respondents may have answered survey questions based on a different
definition of process and outcome evaluation. This next section discusses the study’s
relevance to Social Work practice.
Relevance to Social Work Practice
The concept of evaluation closely parallels the ideals of evidence-based practice
in social work. Evidence-based practice (EBP) is a process given much attention in the
field today (Institute for the Advancement of Social Work Research, 2007). The National
Association of Social Workers defines this term as follows:
In social work, most agree that EBP is a process involving creating an answerable question based on a client or organizational need, locating the best available evidence to answer the question, evaluating the quality of the evidence as well as its applicability, applying the evidence, and evaluating the effectiveness and efficiency of the solution. EBP is a process in which the practitioner combines well-researched interventions with clinical experience, ethics, client preferences,
112
and culture to guide and inform the delivery of treatments and services. (National Association of Social Workers, 2010)
This definition is similar to the definition of evaluation. Evaluation is also a process that
involves answering a question to serve a client or organizational need. Also, evaluation is
defined as a piece of this EBP process. Program evaluation is a key part of this EBP
process according to the Institute for the Advancement of Social Work Research
(Institute for the Advancement of Social Work Research, 2007).
This study contributes to social work’s understanding of evidence-based practice
by explaining factors that increase use of information and evidence. Results from this
study can assist the profession in several ways:
• It could help individual practitioners recognize strategies for using evaluation in
their practice;
• It could provide an understanding of the ways in which program evaluation
contributes to the availability of evidence about the efficacy of an intervention;
• It could assist supervisors in the selection of the types of evaluation that would be
most likely to be used in their organizations;
• It could encourage program managers/administrators to select evaluators whose
recommendations for evaluation would have the best fit with their organization’s
needs; and
• It could challenge social work organizations to increase their recognition and
focus on becoming learning organizations.
Thus, this study adds to the social work fields understanding of how evidence is
translated from various arenas to the social worker or social program.
113
Implications for Evaluation Practice
This study’s findings imply that understanding the context of organizations may
serve as a means to increase evaluation use. While this research found that evaluators
make evaluation choices in part based on organizational contexts, it also found that
evaluators’ understanding of organizations is related to their own characteristics. Thus
there may be “blinders” that disallow evaluators from identifying how ready an
organization is to learn. For example, evaluators who spent a lot of time conducting
outcome evaluation did not accurately identify an organization that was not ready for
learning. Conceptually this finding makes sense. Evaluators who focus on measuring
outcomes typically are not measuring the processes internal to the organization. Thus,
they may not attend to the organizational environment.
The evaluation field needs to continue to identify the blinders that keep us from
identifying the particular readiness of an organization for learning and change. If we
cannot identify readiness for learning we may not tailor an evaluation appropriately and
evaluation use may be lessened. A common focus of evaluation is understanding how the
components of programs or systems lead to particular outcomes (Rossi, Freeman, &
Lipsey, 1999). This research points to the idea that evaluators need to have a broad view
of the organization and its program components.
This research found that evaluators do well at matching evaluation activities to an
organization’s readiness for learning. This implies that evaluators are sensitive to
organizational learning theory, which suggests that organizations are at varying levels of
readiness for learning and change. Evaluation and the context in which it operates is
becoming an increasingly important area for evaluators to understand. The 2009
114
American Evaluation Association Annual Conference theme “Context and Evaluation” is
evidence of the rising importance of context to the field.
This study has implications for the initial training and ongoing professional
strategies for assessing organizational readiness for learning and the ways in which one’s
characteristics impact perception and choice. For example, evaluators may explore the
idea that their own characteristics predict the kinds of evaluation designs chosen. Thus,
even if an organization may be better suited for high levels of process evaluation, an
evaluator who conducts a lot of policy evaluation may not recommend the appropriate
level of process evaluation. (This study found that conducting policy evaluation predicts
recommending low levels of process evaluation.) Evaluators need to be aware of both
the kinds of evaluation activities they recommend for different kinds of organizations and
the ways in which their choices and biases may impact evaluation use.
Finally, the results speak to the idea that readiness for organization learning is a
consistent predictor of evaluation use. The higher the readiness for organizational
learning in several regression models, the higher the levels of evaluation use. The idea
speaks to the way in which evaluators design their work. An emphasis on assessing
readiness for organizational learning and helping an organization increase its readiness
can be an important part of an evaluator’s work. Several tools have been developed for
evaluators to assess an organization’s readiness for learning including The Readiness for
Organizational Learning and Evaluation Instrument (Preskill & Torres, 2000).
Areas for future research
This study provides evidence that evaluation use happens based on an interplay of
several factors, although several questions need further examination. As discussed in
115
Chapter 1, the literature on factors that influence evaluation use can be grouped into four
main categories. This research examined small pieces of two of the four major areas,
namely evaluator and organizational characteristics. Further research is needed to
understand how all four areas of factors in conjunction with one another impact use.
Also, various qualitative research methodologies would be able to examine in
depth the definition of various concepts explored in this study. Comments from
respondents indicated that there were various definitions of the terms “process” and
“outcome” evaluation. Also, the meaning of the terms “evaluation use” and “evaluation
influence” could be explored via qualitative inquiries. The concepts in this study were not
understood in the same manner by all respondents and qualitative methodologies could
clarify the shared meanings of terms and the relationships between terms.
It also appears that research about evaluation use has not translated directly into
practice. There is a need for more research about implementation of evaluation practices
and how these might impact use. Other questions might examine:
1) In what ways do evaluators get their information when they want to increase
evaluation use?
2) What are evaluators’ current conceptualizations about organizational
learning? How does their thinking compare to other fields?
3) How are evaluators thinking about readiness for learning for individuals and
for organizations?
4) How do users think about readiness for learning and how it impacts evaluation
use?
116
5) Do social programs use evaluation differently than other types of
organizations?
6) To what extent do evaluators have to tailor evaluation activities to meet the
needs of organizations with varying levels of readiness for learning?
Implementation of ways to increase use has not been well documented. While the
case study method has been used to document evaluation use in recent years, other
methodologies have not been utilized. Also, recent studies on evaluation use (including
the current study) present the picture of “use” typically from one perspective (Balthasar,
2006; Christie, 2007; King, 2002; Morabito, 2002; Preskill et al., 2003). Often users’
perspectives or evaluators’ perspectives are presented. Studies could benefit from
triangulation of information and include designs that incorporate multiple perspectives.
Some research has documented specific cases of process use (Preskill et al.,
2003); however, specific types of evaluation use need their own line of research. For
example, an ongoing examination of the factors that predict and/or enhance symbolic,
conceptual, instrumental, and process use would be fruitful. Qualitative and quantitative
methodologies that can account for the myriad of factors influencing use can assist in
understanding the complex process of enhancing all kinds of evaluation influences and
use.
Conclusion
This study explored the ways in which the context of an organization affects the
design of an evaluation and its use. It examined evaluator characteristics and their
relationship to the choice of evaluation design. Findings indicated that evaluators design
evaluations in distinct ways based on whether or not an organization is ready for learning.
117
The type of evaluation design chosen was based on evaluators’ individual characteristics.
This study found that characteristics of the evaluator and qualities of the organization are
predictors of evaluation use. The study builds on literature (Cousins et al., 2004, 2006;
Mancini, Marek, Byrne, & Huebner, 2004) that has attempted to understand the ways in
which organizational context impacts evaluation. Finally, the study contributes to the
understanding of factors that predict and enhance the use of evaluation.
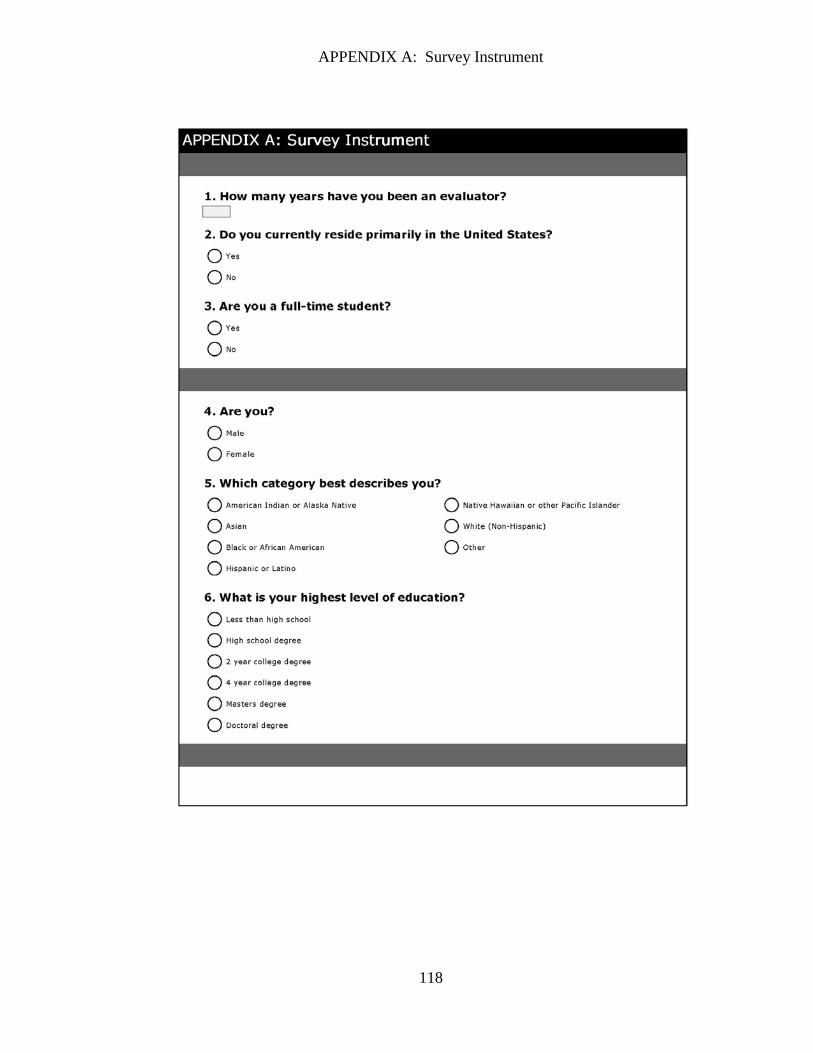
APPENDIX A: Survey Instrument
118

119
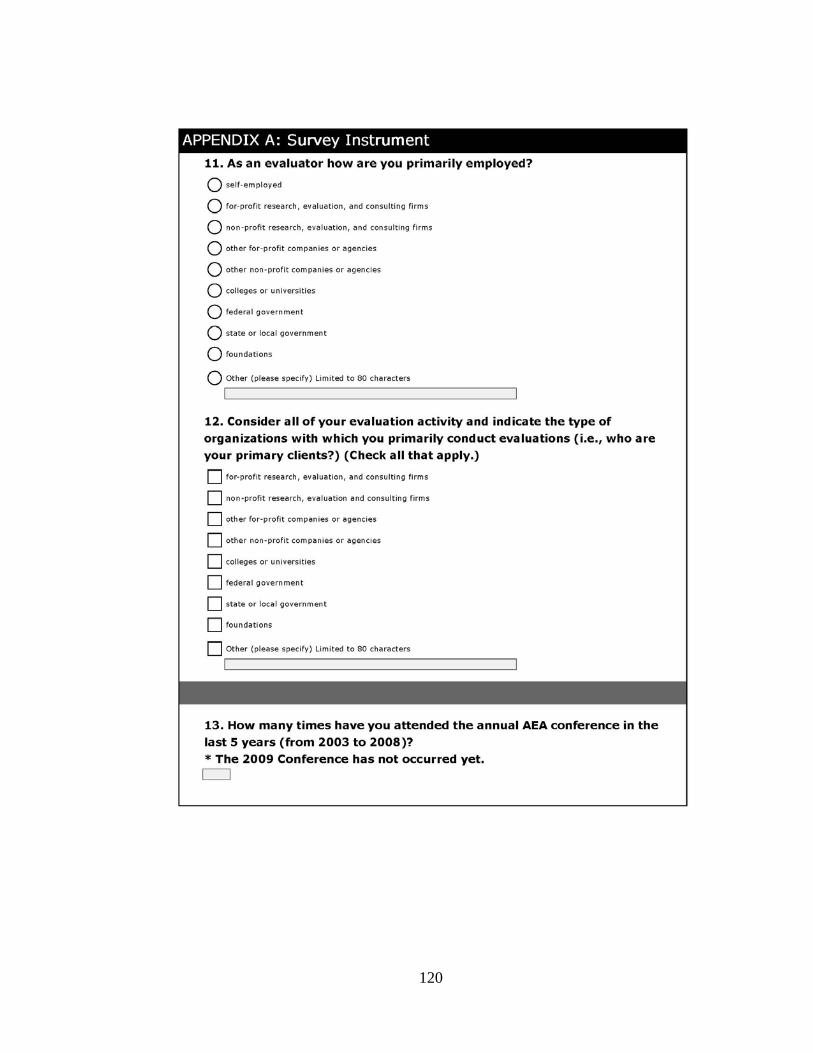
120
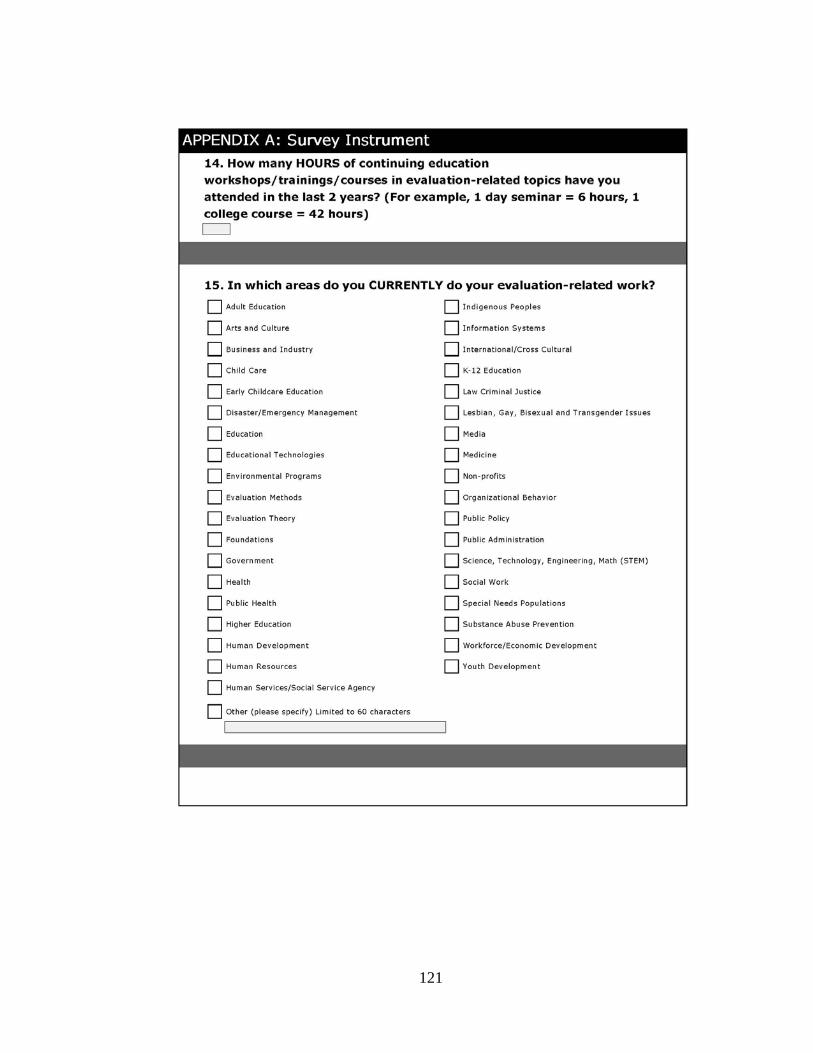
121
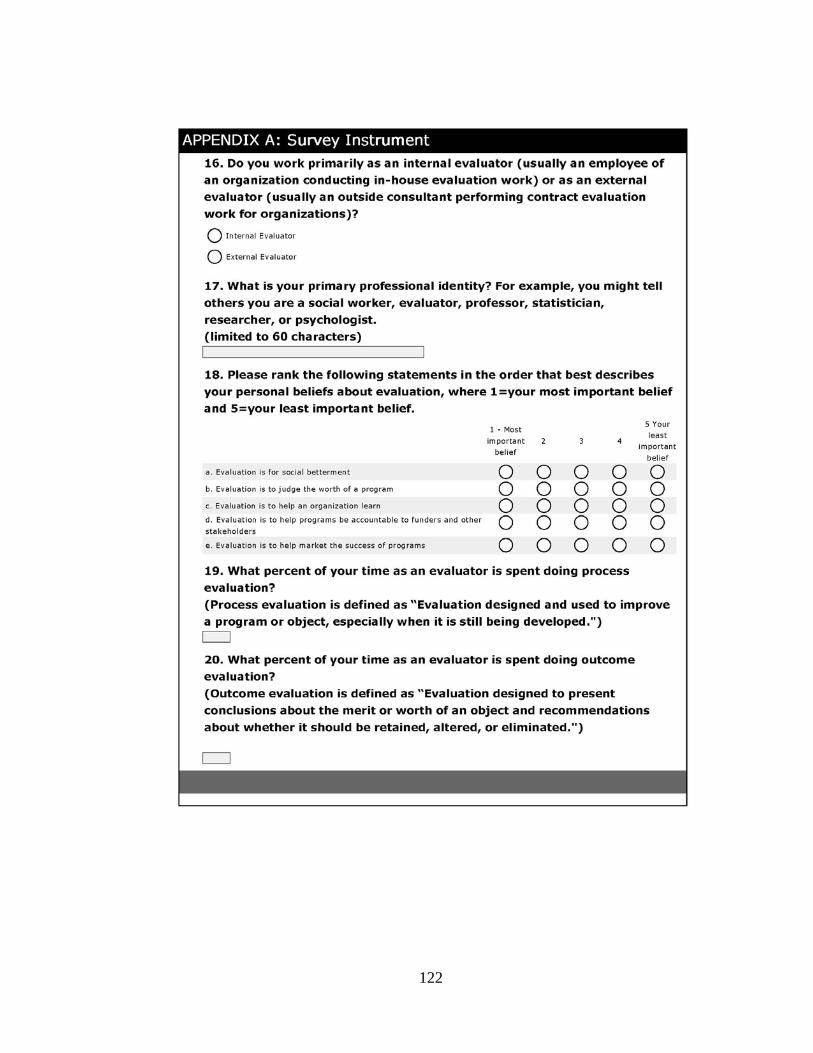
122
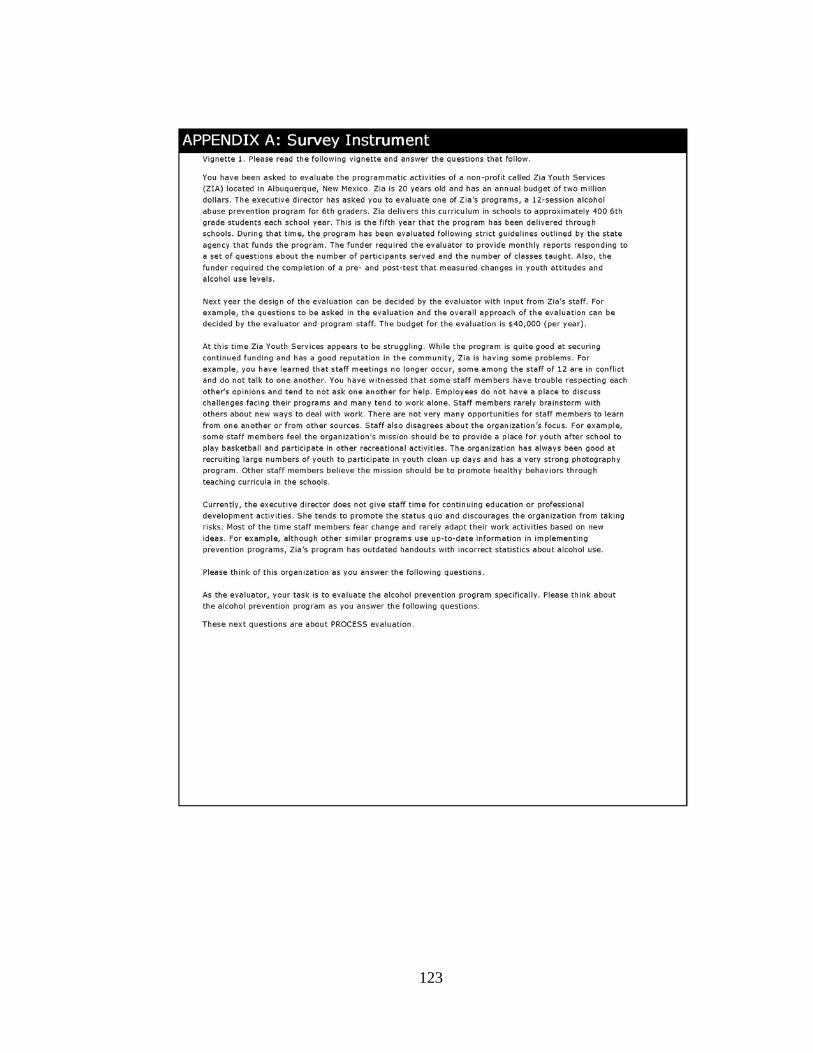
123
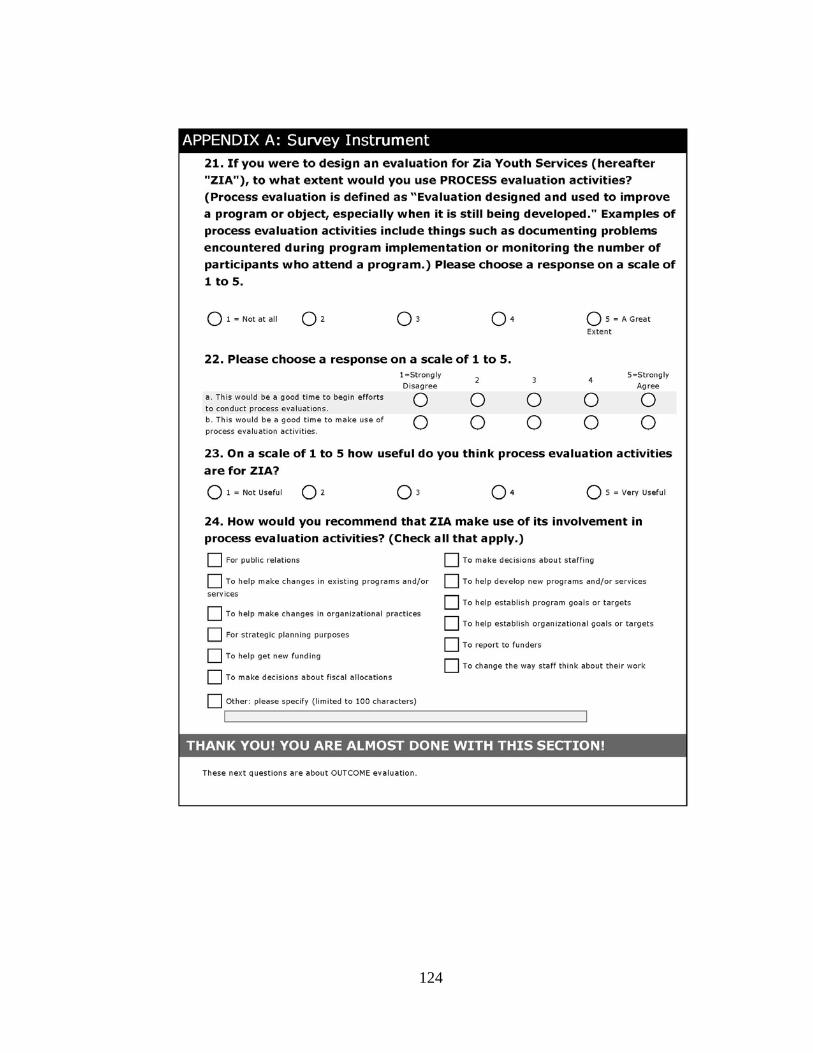
124
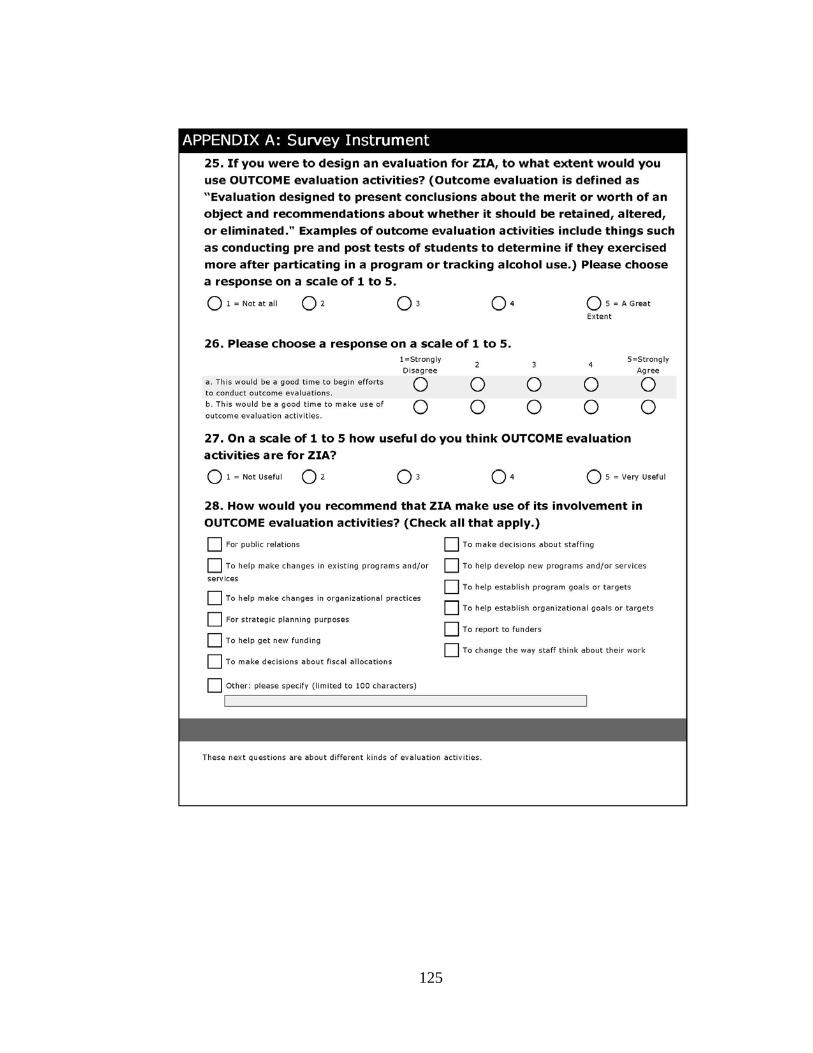
125
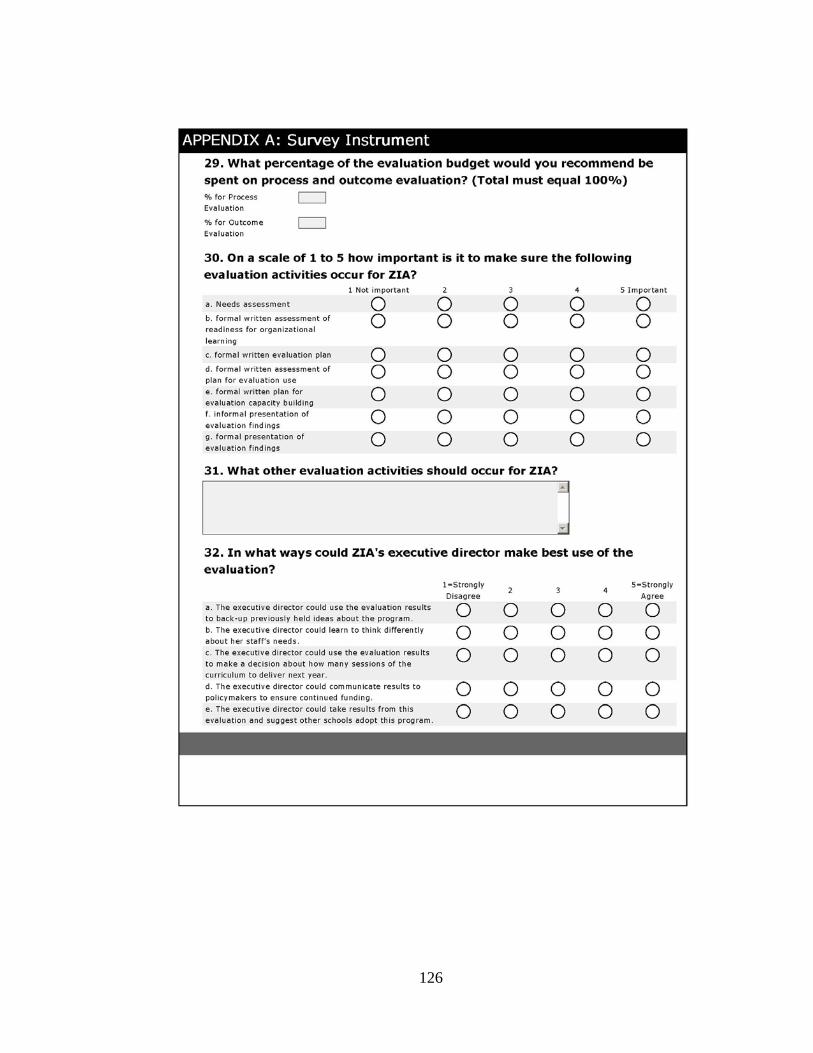
126
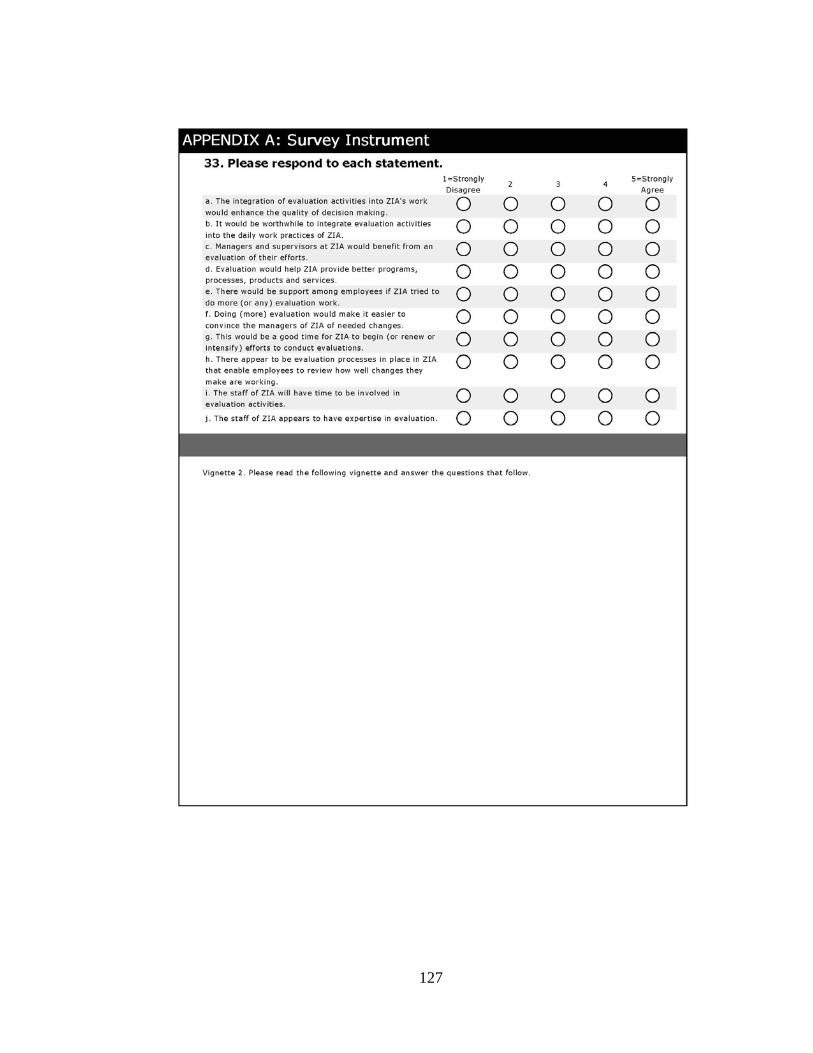
127
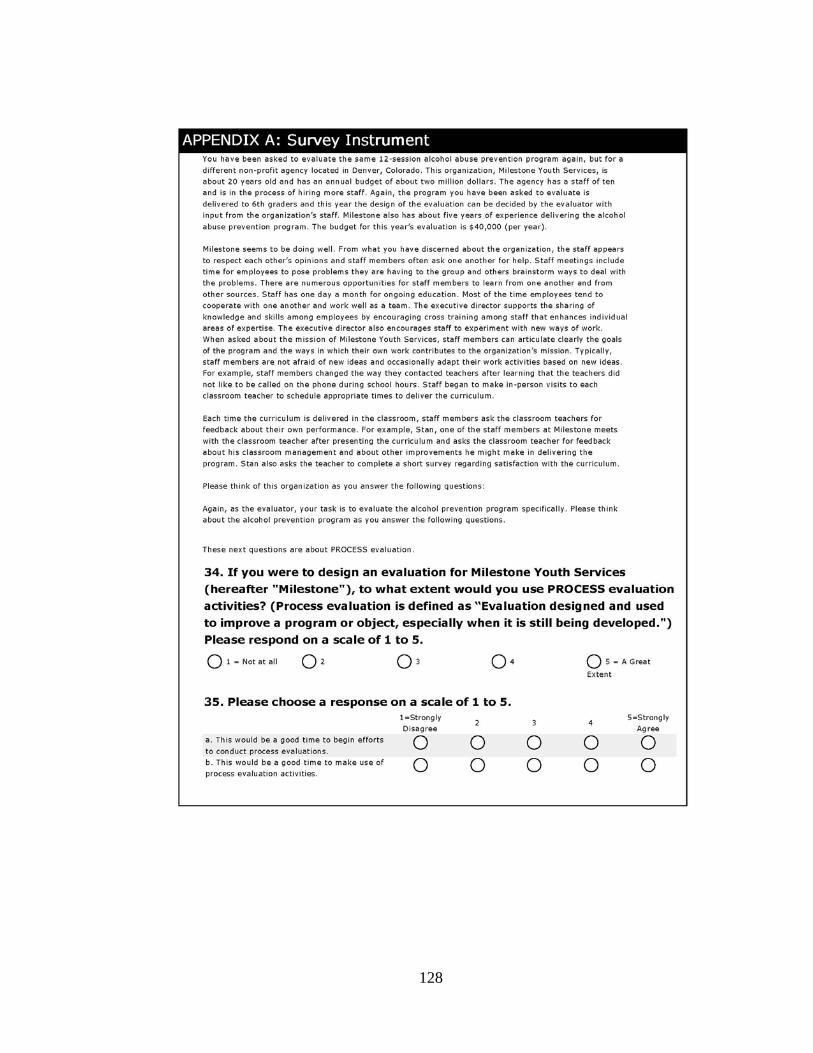
128
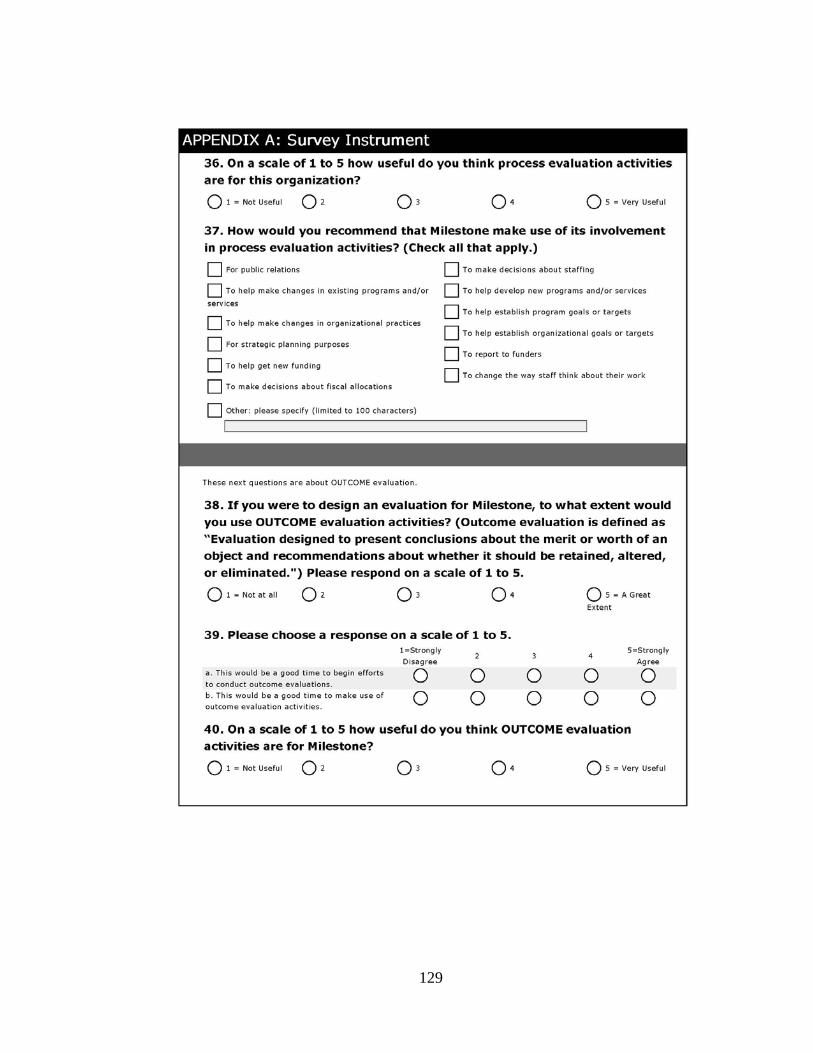
129
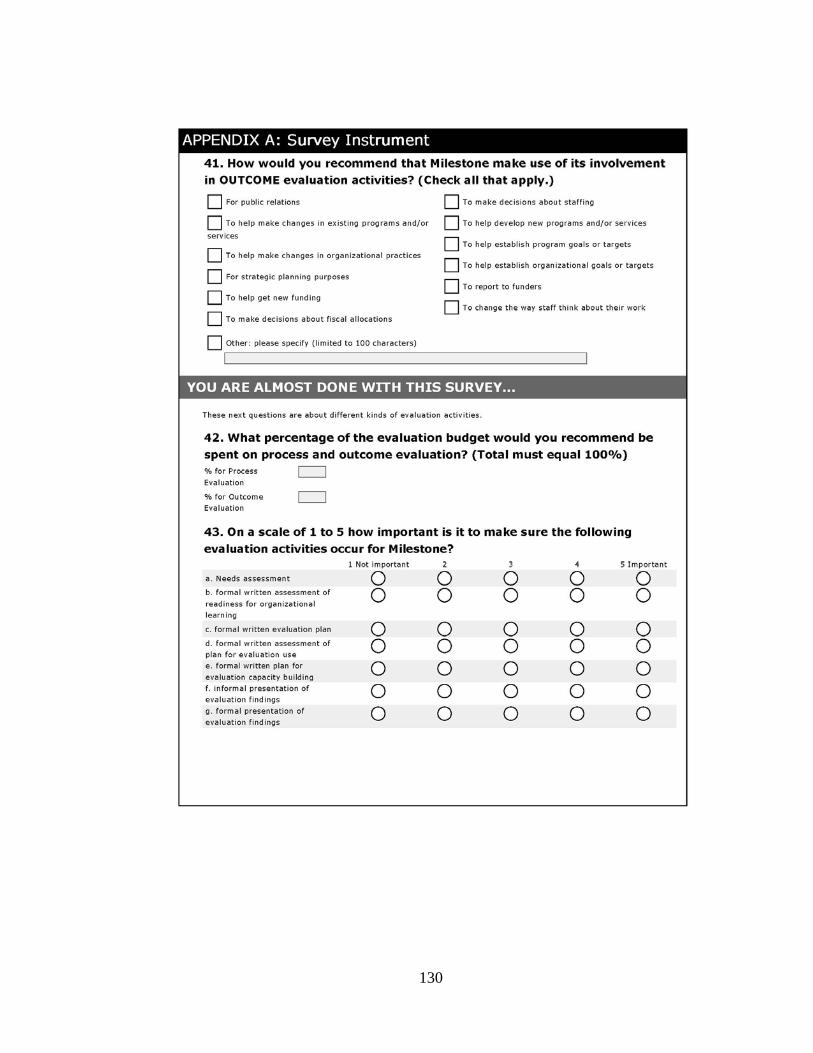
130
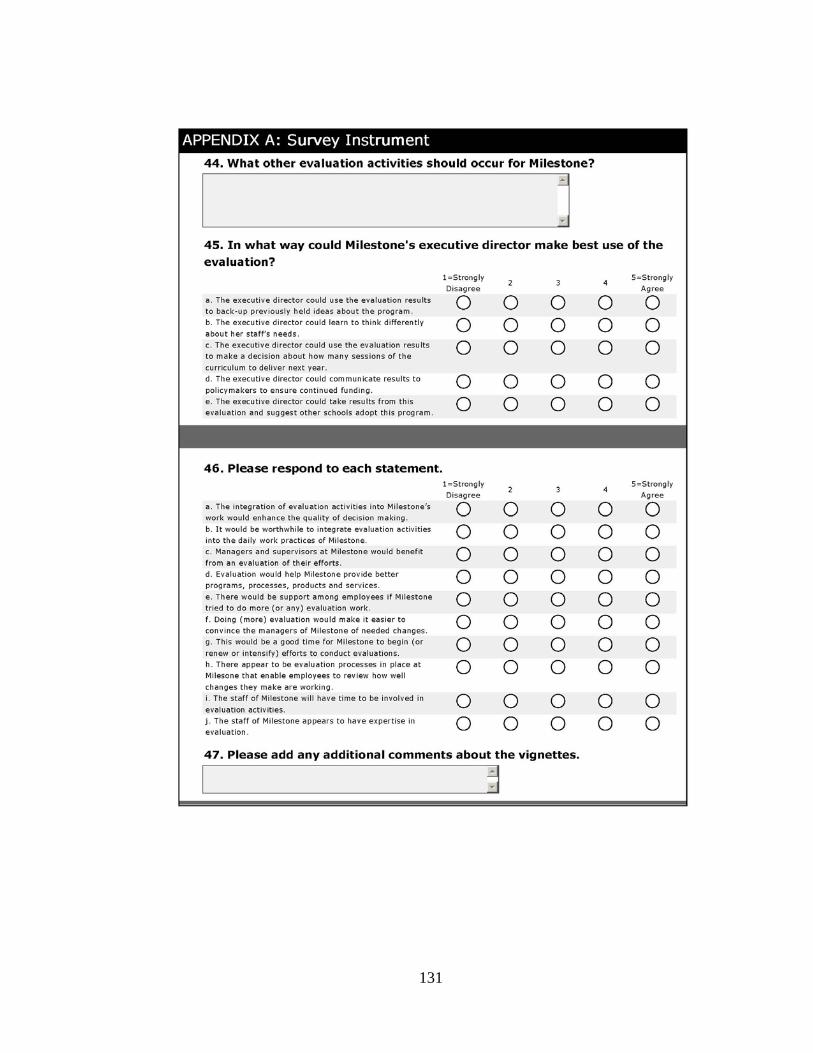
131
132
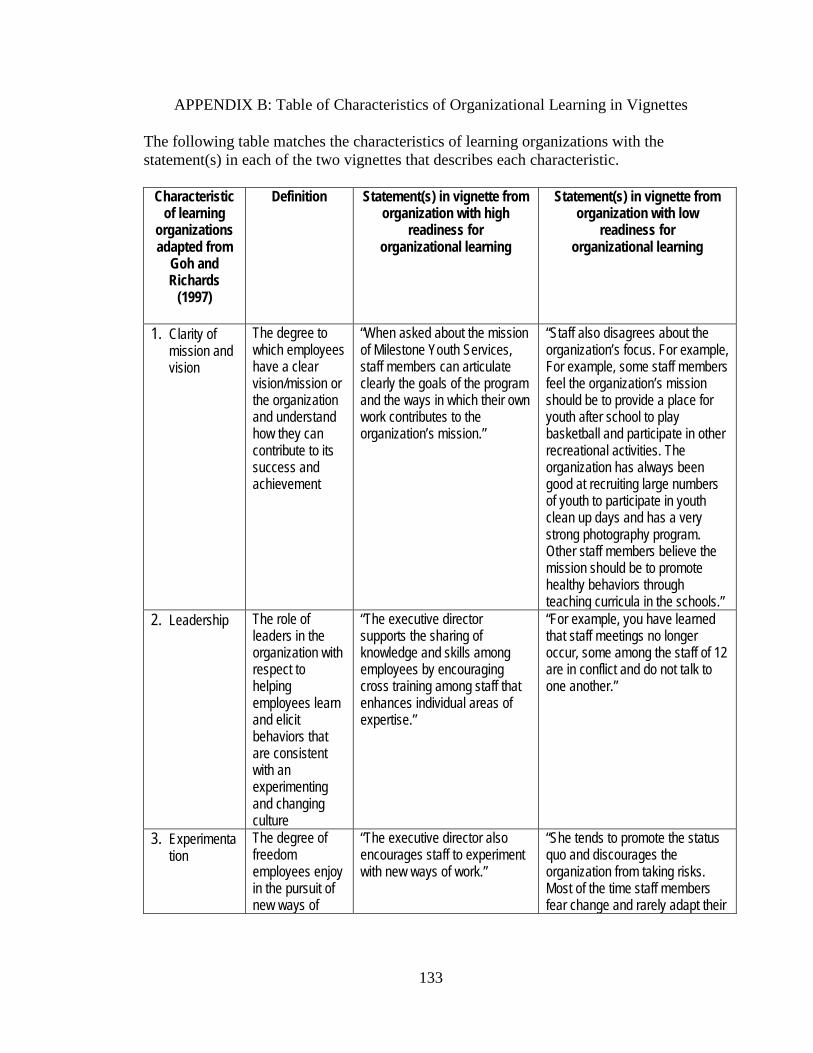
133
APPENDIX B: Table of Characteristics of Organizational Learning in Vignettes The following table matches the characteristics of learning organizations with the statement(s) in each of the two vignettes that describes each characteristic.
Characteristic of learning
organizations adapted from
Goh and Richards
(1997)
Definition Statement(s) in vignette from organization with high
readiness for organizational learning
Statement(s) in vignette from organization with low
readiness for organizational learning
1. Clarity of mission and vision
The degree to which employees have a clear vision/mission or the organization and understand how they can contribute to its success and achievement
“When asked about the mission of Milestone Youth Services, staff members can articulate clearly the goals of the program and the ways in which their own work contributes to the organization’s mission.”
“Staff also disagrees about the organization’s focus. For example, For example, some staff members feel the organization’s mission should be to provide a place for youth after school to play basketball and participate in other recreational activities. The organization has always been good at recruiting large numbers of youth to participate in youth clean up days and has a very strong photography program. Other staff members believe the mission should be to promote healthy behaviors through teaching curricula in the schools.”
2. Leadership The role of leaders in the organization with respect to helping employees learn and elicit behaviors that are consistent with an experimenting and changing culture
“The executive director supports the sharing of knowledge and skills among employees by encouraging cross training among staff that enhances individual areas of expertise.”
“For example, you have learned that staff meetings no longer occur, some among the staff of 12 are in conflict and do not talk to one another.”
3. Experimentation
The degree of freedom employees enjoy in the pursuit of new ways of
“The executive director also encourages staff to experiment with new ways of work.”
“She tends to promote the status quo and discourages the organization from taking risks. Most of the time staff members fear change and rarely adapt their
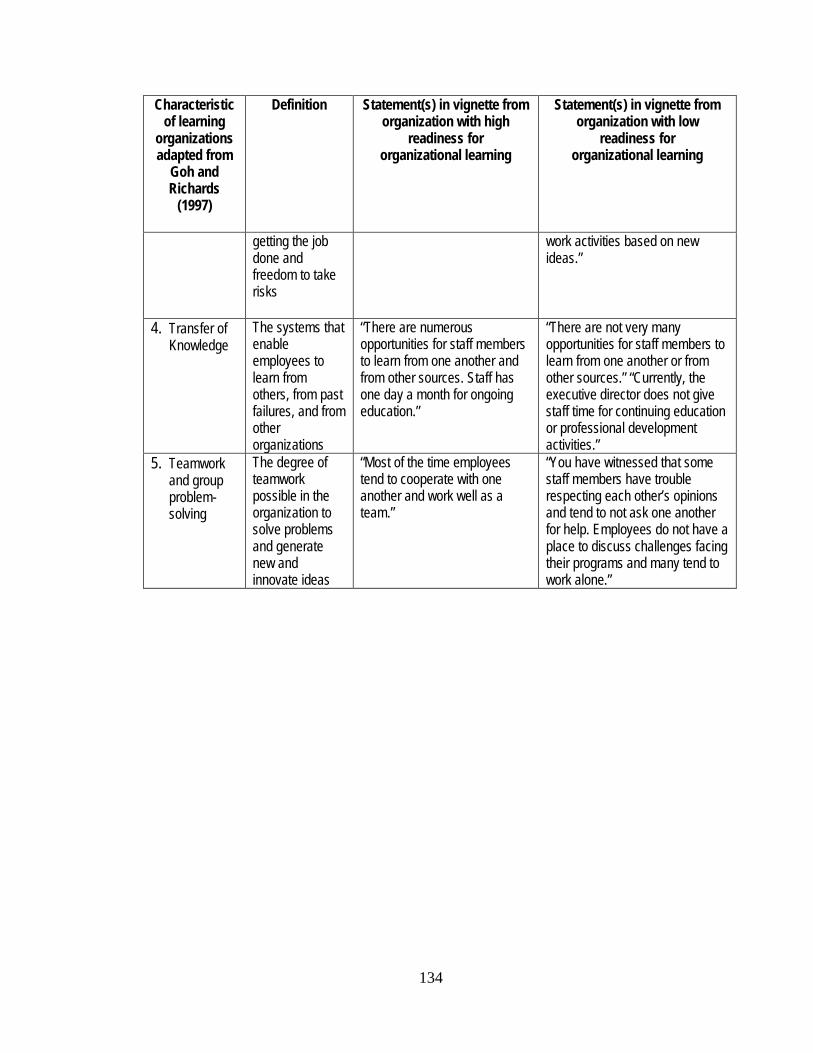
134
Characteristic of learning
organizations adapted from
Goh and Richards
(1997)
Definition Statement(s) in vignette from organization with high
readiness for organizational learning
Statement(s) in vignette from organization with low
readiness for organizational learning
getting the job done and freedom to take risks
work activities based on new ideas.”
4. Transfer of Knowledge
The systems that enable employees to learn from others, from past failures, and from other organizations
“There are numerous opportunities for staff members to learn from one another and from other sources. Staff has one day a month for ongoing education.”
“There are not very many opportunities for staff members to learn from one another or from other sources.” “Currently, the executive director does not give staff time for continuing education or professional development activities.”
5. Teamwork and group problem-solving
The degree of teamwork possible in the organization to solve problems and generate new and innovate ideas
“Most of the time employees tend to cooperate with one another and work well as a team.”
“You have witnessed that some staff members have trouble respecting each other’s opinions and tend to not ask one another for help. Employees do not have a place to discuss challenges facing their programs and many tend to work alone.”
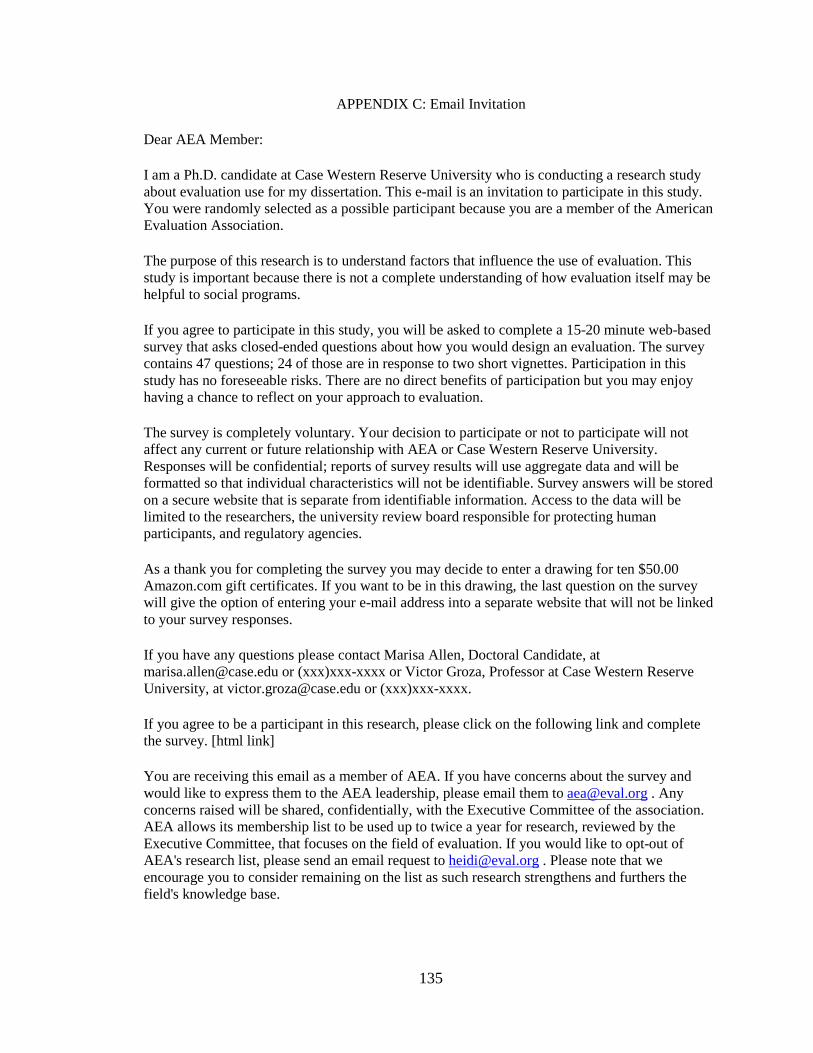
135
APPENDIX C: Email Invitation
Dear AEA Member:
I am a Ph.D. candidate at Case Western Reserve University who is conducting a research study about evaluation use for my dissertation. This e-mail is an invitation to participate in this study. You were randomly selected as a possible participant because you are a member of the American Evaluation Association.
The purpose of this research is to understand factors that influence the use of evaluation. This study is important because there is not a complete understanding of how evaluation itself may be helpful to social programs.
If you agree to participate in this study, you will be asked to complete a 15-20 minute web-based survey that asks closed-ended questions about how you would design an evaluation. The survey contains 47 questions; 24 of those are in response to two short vignettes. Participation in this study has no foreseeable risks. There are no direct benefits of participation but you may enjoy having a chance to reflect on your approach to evaluation.
The survey is completely voluntary. Your decision to participate or not to participate will not affect any current or future relationship with AEA or Case Western Reserve University. Responses will be confidential; reports of survey results will use aggregate data and will be formatted so that individual characteristics will not be identifiable. Survey answers will be stored on a secure website that is separate from identifiable information. Access to the data will be limited to the researchers, the university review board responsible for protecting human participants, and regulatory agencies.
As a thank you for completing the survey you may decide to enter a drawing for ten $50.00 Amazon.com gift certificates. If you want to be in this drawing, the last question on the survey will give the option of entering your e-mail address into a separate website that will not be linked to your survey responses.
If you have any questions please contact Marisa Allen, Doctoral Candidate, at [email protected] or (xxx)xxx-xxxx or Victor Groza, Professor at Case Western Reserve University, at [email protected] or (xxx)xxx-xxxx.
If you agree to be a participant in this research, please click on the following link and complete the survey. [html link]
You are receiving this email as a member of AEA. If you have concerns about the survey and would like to express them to the AEA leadership, please email them to [email protected] . Any concerns raised will be shared, confidentially, with the Executive Committee of the association. AEA allows its membership list to be used up to twice a year for research, reviewed by the Executive Committee, that focuses on the field of evaluation. If you would like to opt-out of AEA's research list, please send an email request to [email protected] . Please note that we encourage you to consider remaining on the list as such research strengthens and furthers the field's knowledge base.
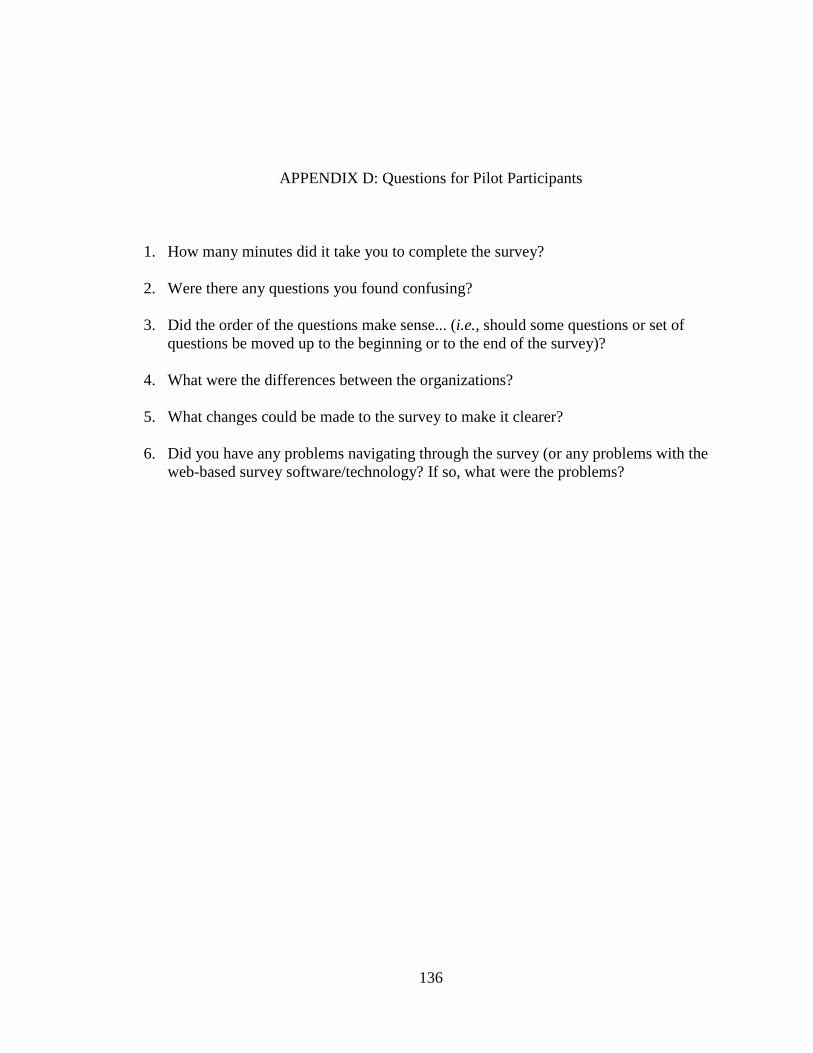
136
APPENDIX D: Questions for Pilot Participants 1. How many minutes did it take you to complete the survey? 2. Were there any questions you found confusing? 3. Did the order of the questions make sense... (i.e., should some questions or set of
questions be moved up to the beginning or to the end of the survey)? 4. What were the differences between the organizations? 5. What changes could be made to the survey to make it clearer? 6. Did you have any problems navigating through the survey (or any problems with the
web-based survey software/technology? If so, what were the problems?
137
References
Agarwala-Rogers, R. (Ed.). (1977). Why is evaluation research not utilized? (Vol. 2).
Beverly Hills, CA: Sage.
Alkin, M. C. (1985). A guide for evaluation decision makers. Beverly Hills, CA: Sage.
Alkin, M. C., Daillak, R., & White, P. (1979). Using evaluations: Does evaluation make
a difference? Beverly Hills: Sage.
American Evaluation Association. (2007). About us. from
http://www.eval.org/aboutus/organization/aboutus.asp
American Evaluation Association. (2008). American Evaluation Association member
database.
Argyris, C., & Schön, D. (1974). Theory in practice: Increasing professional
effectiveness. San Francisco: Jossey-Bass.
Argyris, C., & Schön, D. (1978). Organizational learning: A theory of action perspective.
Reading, MA: Addison Wesley.
Argyris, C., & Schön, D. (1996). Organizational learning ii: Theory, method and
practice. Reading, MA: Addison Wesley.
Ayers, T. D. (1987). Stakeholders as partners in evaluation: A stakeholder-collaborative
approach. Evaluation and Program Planning, 10, 263-271.
Balthasar, A. (2006). The effects of institutional design on the utilization of evaluation.
Evaluation, 12(3), 353-371.
Balthasar, A., & Rieder, S. (2000). Learning from evaluations. Evaluation, 6(3), 245-260.
138
Boaz, A., & Hayden, C. (2002). Pro-active evaluators: Enabling research to be useful,
usable and used. Evaluation, 8(4), 440-453.
Campbell, D. (2000). The socially constructed organization. London: H. Karnac Books
Ltd.
Caplan, N., Morrison, A., & Stambaugh, R. J. (1975). The use of social science
knowledge in policy decisions at the national level: A report to respondents. Ann
Arbor, MI: Institute for Social Research.
Caracelli, V. J. (2000). Evaluation use at the threshold of the twenty-first century. In V. J.
Caracelli & H. Preskill (Eds.), New directions in evaluation: The expanding scope
of evaluation use (Vol. 88). San Francisco: Jossey-Bass.
Chacon-Moscoso, S., Anguera-Argilaga, M. T., Perez-Gil, J. A., & Holgado-Tello, F. P.
(2002). A mutual catalytic model of formative evaluation: The interdependent
roles of evaluators and local programme practioners. Evaluation, 8, 413-432.
Chemlinsky, E. (1987). What have we learned about the politics of program evaluation?
Evaluation Practice, 8(1), 5-21.
Christie, C. A. (2007). Reported influence of evaluation data on decision makers' action.
American Journal of Evaluation, 28(1), 8-25.
Compton, D. W., Glover-Kudon, R., Smith, I. E., & Avery, M. (2002). Ongoing capacity
building in the American Cancer Society (acs) 1995-2001. New Directions in
Evaluation(93), 47-61.
Conner, R. F. (1988). Structuring knowledge production activities to facilitate knowledge
utilization: Thoughts on important utilization issues. Studies in Educational
Evaluation, 14.
139
Conner, R. F. (1998). Toward a social ecological view of evaluation use. American
Journal of Evaluation, 19(2), 237-241.
Cousins, J. B. (2003). Utilization effects of participatory evaluation. In T. Kelligan & D.
L. Stufflebeam (Eds.), International handbook of educational evaluation (pp.
245-266). Dordrecht: Kluwer Academic Press.
Cousins, J. B., & Earl, L. M. (1992). The case for participatory evaluation. Educational
Evaluation and Policy Analysis, 14.
Cousins, J. B., Goh, S. C., & Clark, S. (2006). Data use leads to data valuing: Evaluative
inquiry for school decision making. Leadership and Policy in Schools, 5, 155-
176.
Cousins, J. B., Goh, S. C., Clark, S., & Lee, L. (2004). Integrating evaluative inquiry into
the organizational culture: A review and synthesis of the knowledge base. The
Canadian Journal of Program Evaluation, 19(2), 99-141.
Cousins, J. B., & Leithwood, K. A. (1986). Current empirical research on evaluation
utilization. Review of Educational Research, 56(3), 331-364.
Cousins, J. B., & Leithwood, K. A. (1993). Enhancing knowledge utilization as a strategy
for school improvement. Knowledge: Creation, Diffusion, Utilization, 14(3), 305-
333.
Cronbach, L. J., Ambron, S. R., Dornbusch, S. M., Hess, R. D., Homik, R. C., Phillips D.
C., et al. (1980). Toward reform of program evaluation. San Francisco: Jossey-
Bass.
Dickey, B. (1980). Utilization of evaluation of small-scale innovative educational
projects. Educational Evaluation and Policy Analysis, 2(6), 65-77.
140
Fetterman, D. M. (2001). Foundations of empowerment evaluation. Thousand Oaks, CA:
Sage.
Fiol, C. M., & Lyles, M. A. (1985). Organizational learning. Academy of Management
Review, 10 (803-813).
Flannigan, J. C. (1961). Cases of the utilization of behavioral science research. In C. Y.
Glock (Ed.), Case studies in bringing behavioral science into use: Studies in the
utilization of behavioral science. Palo Alto: Stanford University, Institute for
Communications Research.
G.A.O. (1995). Program evaluation: Improving the flow of information to the congress
(Vol. PEMD-95-1): G.A.O.
Gabor, P. A., Unrua, Y. A., & Grinnell, R. M. (1998). Evaluation for social workers: A
quality improvement approach for the social services. Boston: Allyn & Bacon.
Garvin, D. (1993). Building learning organizations. Harvard Business Review, 78-91.
Gibbs, D., Napp, D., Jolly, D., Westover, B., & Uhl, G. (2002). Increasing evaluation
capacity within community-based HIV prevention programs. Evaluation and
Program Planning, 25, 261-269.
Gilliam, A., Barrington, T., Davis, D., Lacson, R., Uhl, G., & Phoenix, U. (2003).
Building evaluation capacity for HIV prevention programs. Evaluation and
Program Planning, 26, 133-142.
Goh, S. C., Cousins, J. B., & Elliot, C. (2006). Organizational learning capacity,
evaluative inquiry and readiness for change in schools: Views and perceptions of
educators. Journal of Educational Change, 7(4), 289 - 318.

141
Goh, S. C., & Richards, G. (1997). Benchmarking the learning capability of
organizations. European Management Journal, 15(5), 575-583.
Greene, J. C. (1988). Stakeholder participation and utilization in program evaluation.
Evaluation Review, 12(2), 91-116.
Hammersley, M. (1992). By what criteria should ethnographic research be judged? In M.
Hammersley (Ed.), What's wrong with ethnography? Methodological
explorations. London: Routledge.
Henry, G. (2003). Influential evaluations. American Journal of Evaluation, 24(4), 515-
524.
Henry, G., & Mark, M. (2003). Beyond use: Understanding evaluation's influence on
attitudes and actions. American Journal of Evaluation, 24(3), 293-314.
Henry, G., & Rog, D. J. (1998). A realist theory and analysis of utilization. New
Directions in Evaluation, 78 (Summer).
Holstein, J. A., & Gubrium, J. F. (1998). Phenomenology, ethnomethodology, and
interpretive practice. In N. K. Denzin & Y. S. Lincoln (Eds.), Strategies of
qualitative inquiry. Thousand Oaks: Sage.
Honig, M. I. (2004). Where's the "up" in bottom-up reform. Educational Policy, 18(4),
527-561.
Huber, G. P. (1991). Organizational learning: The contributing process and the
literatures. Organization Science, 2(1), 88-115.
Huberman, M. (1987). Steps toward an integrated model of research utilization.
Knowledge: Creation, Diffusion, Utilization, 8(4), 587-611.

142
Huberman, M. (1990). Linkage between researchers and practitioners: A qualitative
study. American Educational Research Journal, 27(2), 363-391.
Huberman, M. (1995). Research utilization: The state of the art. Knowledge and Policy,
7(4), 13-33.
Institute for the Advancement of Social Work Research. (2007). Partnerships to integrate
evidence-based mental health practices into social work education and research:
National Institute of Mental Health.
Johnson, R. B. (1998). Toward a theoretical model of evaluation utilization. Evaluation
and Program Planning, 21, 93-110.
Katz, S., Sutherland, S., & Earl, L. (2002). Developing an evaluation habit of mind. The
Canadian Journal of Program Evaluation, 17(2), 103-119.
King, J. A. (2002). Building the evaluation capacity of a school district. New Directions
in Evaluation, 93, 63-80.
Kirkhart, K. E. (2000). Reconceptualizing evaluation use: An integrated theory of
influence. In New directions in evaluation: The expanding scope of evaluation use
(Vol. 88, pp. 5-23). San Francisco: Jossey-Bass.
Knorr, G. (Ed.). (1977). Policy-makers' use of social science knowledge: Symbolic or
instrumental? Lexington, MA: Lexington Books.
Kramer, D. M. (2002). From knowledge transfer to knowledge transformation: A
manufacturing workplace intervention study. University of Toronto, Toronto.
Kramer, D. M., Cole, D. C., & Leithwood, K. A. (2004). Doing knowledge transfer:
Engaging management and labor with research on employee health and safety.
Bulletin of Science, Technology & Society, 24(4), 316-330.
143
Landry, R., Amara, N., & Lamari, M. (2001). Utilization of social science research
knowledge in Canada. Research Policy, 30, 333-349.
Lave, J., & Wenger, E. (1991). Situated learning: Legitimate peripheral participation.
Cambridge, UK: Cambridge University Press.
Lawrenz, F., Gullickson, A., & Toal, S. (2007). Dissemination: Handmaiden to
evaluation use. American Journal of Evaluation, 28(3), 275-289.
Lazarsfeld, P. (1944). The people’s choice. New York: Columbia University Press.
Leviton, L. C. (2003). Evaluation use: Advances, challenges and applications. American
Journal of Evaluation, 24(4), 525-535.
Leviton, L. C., & Hughes, E. F. X. (1981). Research on utilization of evaluation: A
review and synthesis. Evaluation Review, 5(4), 525-548.
Levitt, B., & March, J. (1988). Organizational learning. Annual Review of Sociology, 14,
319-340.
Lewin, K. (1935). A dynamic theory of personality. New York: McGraw-Hill.
Mancini, J. A., Marek, L. I., Byrne, R. A. W., & Huebner, A. J. (2004). Community-
based program research: Context, program readiness, and evaluation usefulness.
Journal of Community Practice, 12(1), 7-21.
Manning, C., Bachrach, E., Tiedemann, M., McPherson, M. E., & Goodman, I. F. (2008).
American Evaluation Association internal scan report to the membership:
Goodman Research Group, Inc.
Mark, M. M., & Henry, G. (2004). The mechanisms and outcomes of evaluation
influence. Evaluation, 10(1), 35-57.
144
Mathison, S. (1994). Rethinking the evaluator role: Partnerships between organizations
and evaluators. Evaluation and Program Planning, 17(3), 299-304.
Morabito, S. (2002). Evaluator roles and strategies for expanding evaluation process
influence. American Journal of Evaluation, 23(321-330).
Moran, T. K. (1987). Research and managerial strategies for integrating evaluation
research into agency decision making. Evaluation Review, 11(5), 612-630.
Murphy D., & Mitchell, R. (2007) Non-profit organizations, evaluation practices, and
organizational learning survey. Institute for Community-Based Research,
National Development and Research Institutes, Inc., North Carolina State
University.
National Association of Social Workers. (2010). Evidence based practice. Retrieved
January 2010, from
http://www.socialworkers.org/research/naswResearch/0108EvidenceBased
Neter, J., Kutner, M. H., Nachtsheim, C. J., & Wasserman, W. (1996). Applied linear
regression models (3rd ed.). Chicago: McGraw-Hill Companies, Inc.
Nevis, E. C., Dibella, A. J., & Gould, J. M. (1995). Understanding organizations as
learning systems. Sloan Management Review, 36(2), 73-85.
Office of Planning, Research, and Evaluation. (2003). The program manager’s guide to
evaluation. U.S. Department of Health and Human Services.
Office of the Assistant Secretary for Planning and Evaluation. (1994). The program
evaluation standards (2nd ed.). Thousand Oaks, CA: Sage.
145
Office of the Assistant Secretary for Planning and Evaluation. (2005). Performance
improvement: Evaluation activities of the U.S. Department of Health and Human
Services: Office of the Assistant Secretary for Planning and Evaluation.
Oh, C. H. (1997). Explaining the impact of policy information on policy-making.
Knowledge and policy: The international journal of knowledge transfer and
utilization, 10(3), 25-55.
Oman, R. C., & Chitwood, S. R. (1984). Management evaluation studies: Factors
affecting the acceptance of recommendations. Evaluation Review, 8(3), 283-305.
Ostrower, F. (2004). Attitudes and practices concerning effective philanthropy.
Washington, DC: The Urban Institute.
Owen, J. M., & Lambert, F. C. (1995). Roles for evaluation in learning organizations.
Evaluation, 1(2), 237-250.
Patton, M. Q. (1978). Utilization-focused evaluation. Beverly Hills, CA: Sage.
Patton, M. Q. (1988a). The evaluator's responsibility for utilization. Evaluation Practice,
9(2), 5-24.
Patton, M. Q. (1988b). How primary is your identity as an evaluator? Evaluation
Practice, 9(2), 87-92.
Patton, M. Q. (1997). Utilization-focused evaluation (3rd ed.). Thousand Oaks: Sage.
Patton, M. Q. (2001). Evaluation, knowledge management, best practices, and high
quality lessons learned. American Journal of Evaluation, 23(No. 3), 329-336.
Patton, M. Q. (Ed.). (1988c). Paradigms and pragmatism. New York: Prager.
Patton, M. Q., Grimes, P. S., Guthrie, K. M., Brennan, N. J., French, B. D., & Blyth, D.
A. (1977). In search of impact: An analysis of the utilization of federal health
146
evaluation research. In C. H. Weiss (Ed.), Using social research in public policy
making (pp. 141-164). Lexington, MA: D.C. Heath.
Pflum, G. D., & Brown, R. D. (1984). The effects of conflict, quality, and time on small
group information use and behavior in evaluative decision making situations.
Evaluation and Program Planning: An international journal, 7(1), 35-43.
Porras, J. I., & Robertson, P. J. (1992). Organizational development: Theory, practice,
and research. In M. D. Dunnette & L. M. Hough (Eds.), The handbook of
industrial/organizational psychology. Palo Alto, CA: Consulting Psychologists
Press.
Preskill, H. (2000). The learning dimension of evaluation use. In V. J. Caracelli & H.
Preskill (Eds.), New directions in evaluation: The expanding scope of evaluation
use (Vol. 88). San Francisco: Jossey-Bass.
Preskill, H., & Caracelli, V. J. (1997). Current and developing conceptions of use:
Evaluation use TIG survey results. Evaluation Practice, 18(3), 209-225.
Preskill, H., & Torres, R. T. (2000). The readiness for organizational learning and
evaluation instrument, version 4.0.
Preskill, H., Zuckerman, B., & Matthews, B. (2003). An exploratory study of process use:
Findings and implications for future research. American Journal of Evaluation,
24(No. 4), 423-442.
Raosoft. (2004). Sample size calculator. from http://www.raosoft.com/samplesize.html
Rich, R. F. (1977). Uses of social science information by federal bureaucrats: Knowledge
for action versus understanding. In C. H. Weiss (Ed.), Using social research in
public policy making (pp. 199-212). Lexington, MA: Heath.
147
Robinson, T. T., & Cousins, J. B. (2004). Internal participatory evaluation as an
organizational learning system: A longitudinal case study. Studies in Educational
Evaluation, 30, 1-22.
Rogers, E. M. (1962). Diffusion of innovations. New York: The Free Press.
Rossi, P. H., Freeman, H. E., & Lipsey, M. W. (1999). Evaluation: A systematic
approach (6th ed.). Newbury Park, CA: Sage.
Rothman, J. (1980). Using research in organizations: A guide to successful application.
Beverly Hills, CA: Sage.
Senge, P. M. (1990). The fifth discipline, the art and practice of the learning
organization. New York: Double Day.
Shula, L. M. (2000). Evaluative inquiry in university-school professional learning
partnerships. In New directions in evaluation: The expanding scope of evaluation
use (Vol. 88). San Francisco: Jossey-Bass.
Shula, L. M., & Cousins, J. B. (1997). Evaluation use: Theory, research, and practice
since 1986. Evaluation Practice, 18(3), 195-209.
Siegel, K., & Tuckel, P. (1985). The utilization on evaluation research. Evaluation
Review, 9(3), 307-328.
Smith, N. L., & Chircop, S. (1989). The Weiss-Patton debate: Illumination of the
fundamental concerns. American Journal of Evaluation, 10(5), 5-13.
Thompson, B. (1994). The revised program evaluation standards and their correlation
with the evaluation use literature. Journal of Experimental Education, 63(1), 54-
82.
148
Torres, R. T., & Preskill, H. (2001). Evaluation and organizational learning: Past, present,
and future. American Journal of Evaluation, 22(3), 387-395.
Torres, R. T., Preskill, H. S., & Pionek, M. E. (1996). Evaluation strategies for
communicating and reporting: Enhancing learning in organizations. Thousand
Oaks, CA: Sage.
Torres, R. T., Preskill, H. S., & Pionek, M. E. (1997). Communicating and reporting:
Practices and concerns of internal and external evaluators. Evaluation Practice,
18(2), 105-122.
Trattner, W. I. (1994). From poor law to welfare state: A history of social welfare in
America (5th ed.). New York: The Free Press.
Trochim, W. M. K. (1997). Knowledge base: An online research textbook: Introduction
to evaluation (Vol. Ithaca, New York): Cornell University.
United Way of America. (2003). Outcome measurement in national health and human
service and accrediting organizations: United Way of America.
United Way of America. (2005). Outcome measurement resources network. from
http://national.unitedway.org/outcomes/initiatives/local.cfm
Valente, T. W., & Rogers, E. M. (1995). The origins and development of the diffusion of
innovation paradigm as an example of scientific growth. Science
Communications, 16(3), 242-273.
Van De Ven, A., Polley, D. E., Garud, R., & Venkataraman, S. (1999). The innovation
journey. New York: Oxford University Press.
Van De Ven, A., & Poole, M. S. (1995). Explaining development and change in
organizations. Academy of Management Review, 20(3), 510-540.
149
Weeks, E. C. (1979). The managerial use of evaluation findings. In H. C. Schulberg & J.
M. Jerrell (Eds.), The evaluator and management (pp. 137-156). Beverly Hills,
CA: Sage.
Weiss, C. H. (1972). Utilization of evaluation: Toward a comparative study. In C. H.
Weiss (Ed.), Evaluating action programs. Boston: Allyn & Bacon.
Weiss, C. H. (1980). Knowledge creep and decision accretion. Knowledge: Creation,
Diffusion, Utilization, 1, 381-404.
Weiss, C. H. (1988a). Evaluation for decisions: Is anybody there? Does anybody care?
Evaluation Practice, 9(1), 5-19.
Weiss, C. H. (1988b). If program decisions hinged only on information: A response to
Patton. Evaluation Practice, 9(3), 15-28.
Weiss, C. H. (1992). Organizations for policy analysis: Helping government think.
London: Sage Publications.
Weiss, C. H. (1998). Have we learned anything new about the use of evaluation?
American Journal of Evaluation, 19(1), 21-33.
Weiss, C. H., & Bucuvalas, M. J. (1977). The challenge of social research to decision
making. In C. H. Weiss (Ed.), Using social research in public policy making.
Lexington, MA: Heath.
Weiss, C. H., & Bucuvalas, M. J. (1980). Social science research and decision-making.
New York: Columbia University Press.
Weiss, C. H., Murphy-Graham, E., & Birkeland, S. (2005). An alternative route to policy
influence: How evaluations affect D.A.R.E. American Journal of Evaluation,
26(1), 12-30.
150
Wholey, J. S., & Scanlon, J. W. (1970). Federal evaluation policy: Analyzing the effects
of public programs. Washington, DC: The Urban Institute.
Williams, K., & Stern, E. (2002). The use of evaluation in the commission services:
Technopolis France.