step by step guide to resistivity geophysics by step guide to resistivity... · step by step guide...
TRANSCRIPT

1
Step by Step Guide to Conducting a Geophysical
Resistivity Survey
Setting up the grid Before starting your survey, you need to set up of a grid of 20m² squares, marked by red grid pegs. If you are surveying an area smaller than 20m², set out a 20m² grid as best you can, and dummy log in the results for the areas you cannot survey. Alternatively you could set out a 10m² grid, although you need to remember to program the resistivity meter accordingly (hypotenuse 14.14m) 1) Set out your initial baseline. It is usually easiest to do this along the longest and straightest
field boundary, although in an ideal world you would set up your grid by the points of the compass, and have your baseline running W-E. Run a 50m tape from your first point (e.g. in the corner of the field).
2) To create your first grid square, take a 30m
tape and lay it at right angles to the baseline at 0m on the 50m tape, unravelling it to 20m on the tape. To find a perfect right angle, take a third tape to measure the hypotenuse (diagonal side of a right-angled triangle). Using Pythagoras’ theorem (a² + b² = c²), we know that the hypotenuse of a 20m² grid is 28.28m. Keeping your baseline fixed, use the hypotenuse to create an exact right-angled triangle with both sides of 20m². Mark your three points using red grid pegs.
3) Do the reverse to find the fourth point of your first grid
square, and mark it with a red grid peg. Now you have one square, continue in this vein until you have set out all the grid squares using a combination of Pythagoras, optical squares and sighting points. It is a good idea to lay out a few grid squares before starting your survey, since the survey moves quite fast once it has started.
4) Draw a plan of the location of your grid squares within the
field system and give each square a number according to the order in which you are going to survey them. Use a compass to add a north arrow to your plan, and if you have a GPS, key in your points.
N
0m 50m a 20m
20m b
c = 28.28m
The daffodil is not essential…
position of remote probes
Start here and walk up
20m
9 10 11 12 8 7 6 5
1 2 3 4
2
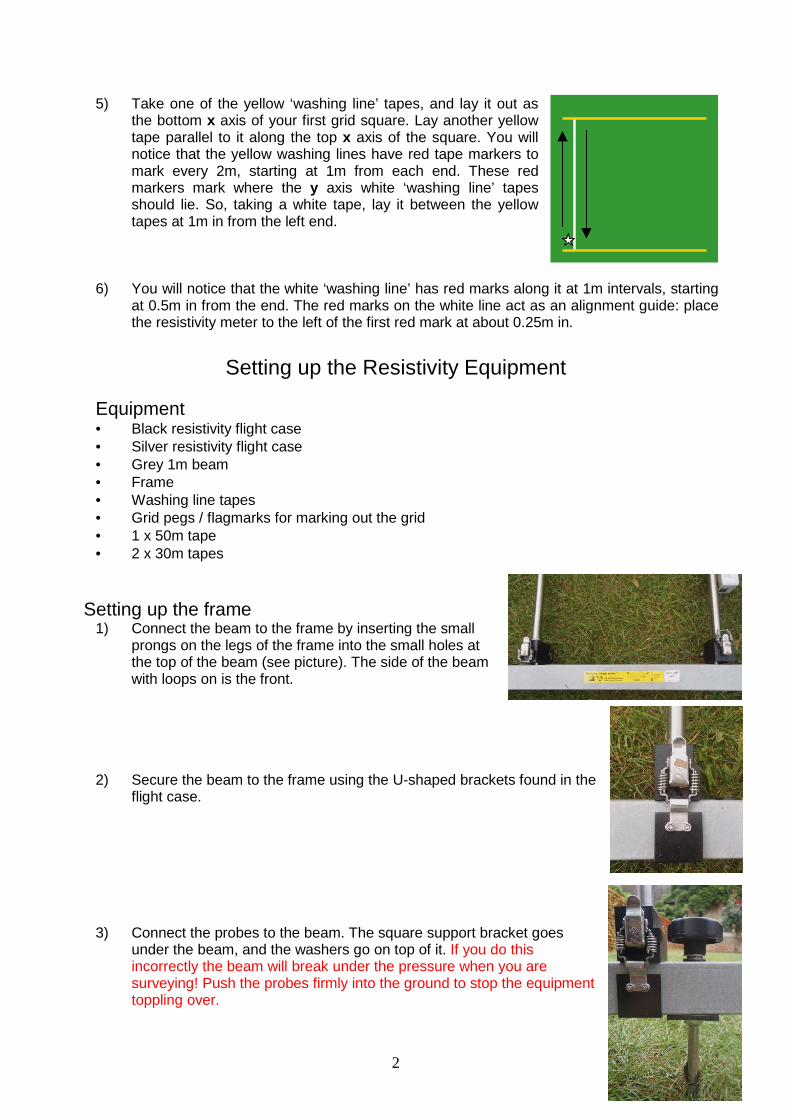
5) Take one of the yellow ‘washing line’ tapes, and lay it out as the bottom x axis of your first grid square. Lay another yellow tape parallel to it along the top x axis of the square. You will notice that the yellow washing lines have red tape markers to mark every 2m, starting at 1m from each end. These red markers mark where the y axis white ‘washing line’ tapes should lie. So, taking a white tape, lay it between the yellow tapes at 1m in from the left end.
6) You will notice that the white ‘washing line’ has red marks along it at 1m intervals, starting
at 0.5m in from the end. The red marks on the white line act as an alignment guide: place the resistivity meter to the left of the first red mark at about 0.25m in.
Setting up the Resistivity Equipment
Equipment • Black resistivity flight case • Silver resistivity flight case • Grey 1m beam • Frame • Washing line tapes • Grid pegs / flagmarks for marking out the grid • 1 x 50m tape • 2 x 30m tapes
Setting up the frame 1) Connect the beam to the frame by inserting the small
prongs on the legs of the frame into the small holes at the top of the beam (see picture). The side of the beam with loops on is the front.
2) Secure the beam to the frame using the U-shaped brackets found in the flight case.
3) Connect the probes to the beam. The square support bracket goes
under the beam, and the washers go on top of it. If you do this incorrectly the beam will break under the pressure when you are surveying! Push the probes firmly into the ground to stop the equipment toppling over.

3
4) Attach the resistivity meter to the top of the frame by screwing it on with the knobs underneath the bracket. Make sure you put it on the right way round: the back of the meter should be on the side of the frame with the electrics box on the right. This is a precarious, fiddly and irritating job so make sure you hold the data logger steady as you do this (not one-handed as in the picture!). Please note: this equipment is very expensive and sensitive so do not let it fall on the ground!
5) Find the black and green-ended wires in the flight case. Insert one end of the black-ended wire into the red socket in the electrics box on the frame. Insert the other end into the right probe immediately below it. Insert the green-ended wire into the black socket, thread it through the loops on the beam and into the left probe.
6) Connect the lead from electrical box into port labelled ‘mobile probes’ at the back of
the resistivity meter. NB: please note that, unlike the RM15, you do not need to use an AD1 adaptor to connect it to the computer. The frame is now set up. Push the probes into the ground to stop it falling over.
Setting up the remote probes
7) Find the black-socketed wire in the flight case with two orange wires coming out of it, with one black end and one red end on them. Insert the coloured ends into the remote probes (the L-shaped pointed pieces of metal). Connect the socket end of the wire into the cable drum.
8) Set up the cable drum and remote probes 15m away
(30 times probe separation e.g. 0.5m) from the nearest point of the grid square you will be surveying, so that when conducting the survey the remote probes will always be at least 15 metres away from the frame.
9) Completely unwind the cable from the reel, and
spread it out (to avoid creating an electromagnet).
Position the probes in the ground about 0.5 - 1m apart from each other, or stand with your feet apart and insert the probes into the ground.

4
Programming the RM85 Resistivity Meter
1) Charge up resistance meter overnight with switch turned to OFF. 2) Set up the frame and attach the RM85 resistance meter. Switch ON. Reading will
be: RPE x10 1mA.
The following only needs to be completed on the fir st day of the site (the settings will remain the same even when you switch off the m eter: 1) Dump data to your personal computer (if not already dumped).
2) If there is still data on the resistivity meter, yo u need to delete any data left on
the machine. Make sure you are in the ‘Enable Log’ mode (screen should read G* L* P*). Press and hold down on this key for FOUR beeps (any less and the memory won’t clear) :
3) Press to bring up main menu.
Select which reads ‘Measurement Resistance/Probe’. You can’t select anything, so press
4) Press Using the 6/left and 7/right keys, select the following: Grid Length – 20m. Then press
Menu 0
Finish Line
1
Image Line
2Delete 8
Dump End Menu.
Clear Memory 6

5
Sample Interval – 1m. Then press
Grid Width – 20m. Then press
Traverse Interval – 1m. Then press
Traverse Mode – Zig-zag. Press: to return to main menu.
5) Press Using the 6/left arrow, 7/right arrow and 8/down arrow keys, select the following: Gain – x10 Current – 1mA Frequency – 122.5Hz (default) UD Frequency – Off Press: to return to main menu. 6) Press Using the 6/left arrow and 7/right arrow keys, select the following: Auto-log Delay – 300ms Insertion Delay – 0ms Speed Boost – On Backlight – Off in daylight LCD Contrast – 6 Set Time/Date – No Mem. Protection – On Reset RM85 – N Dump Data First Test MPX Pcb – No Press: to return to main menu. 7) Press Using the 6/left arrow and 7/right arrow keys, select the following: Hardware – PA20 Interface – Adaptor/Direct Press to return to main menu. 8) Ignore Don’t change any settings on this option.
Dump End Menu.
Delete 8
Delete 8
Delete 8
Dummy Log
3
Dump End Menu.
Log 4
Dump End Menu.
Enable Log
5
Dump End Menu.
Clear Memory � 6

6
9) Press Using the 6/left arrow and 7/right arrow keys, select the following: Data Dump Port – RS232 Dump Baud Rate – 9600 Dump Header – Off Data Format – Fast ASC Dump Handshake – Off Press to return to main menu.
10) Press Using the 6/left arrow and 7/right arrow keys, select the following:
Battery Voltage – should show full charge Time and Date – should be roughly accurate (don’t worry if it isn’t) Max #Grids – 3432 View Data – No View GPS Status – No Memory Size – 1376256 Readings Press to return to main menu.
Press again to exit main menu.
Delete Line
7
Dump End Menu.
Delete 8
Dump End Menu.
Dump End Menu.
7
Conducting your Geophysical Survey
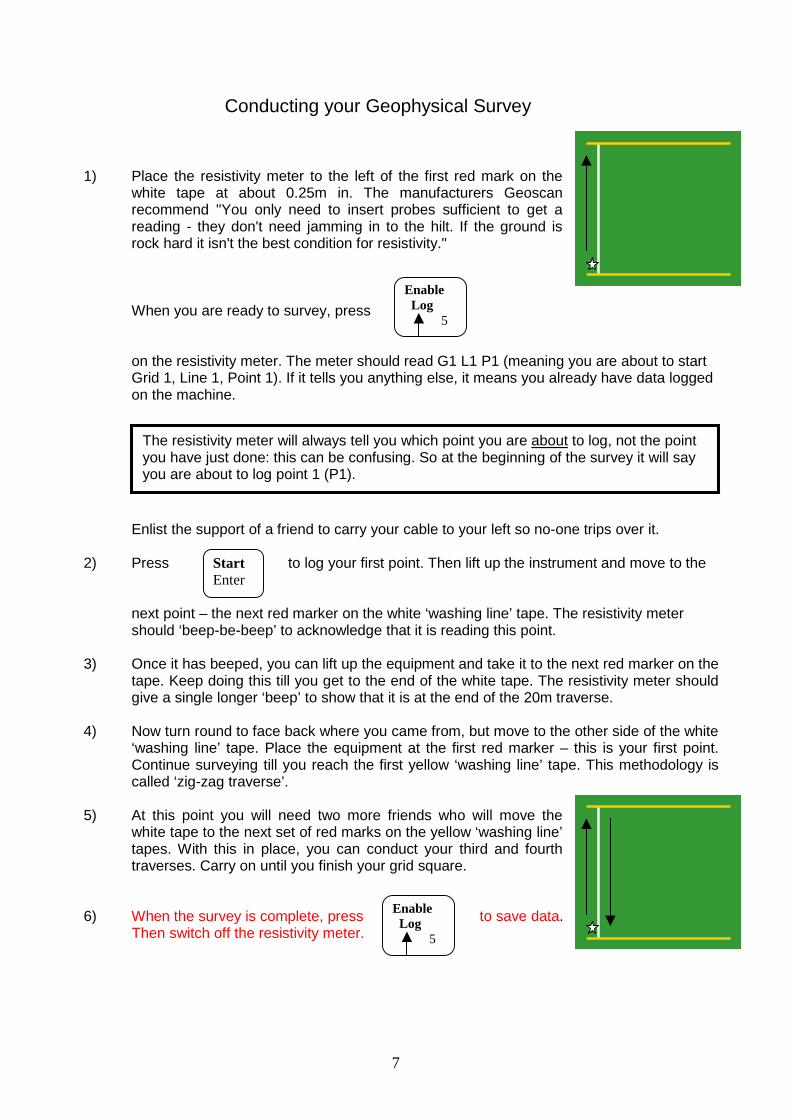
1) Place the resistivity meter to the left of the first red mark on the
white tape at about 0.25m in. The manufacturers Geoscan recommend "You only need to insert probes sufficient to get a reading - they don't need jamming in to the hilt. If the ground is rock hard it isn't the best condition for resistivity."
When you are ready to survey, press on the resistivity meter. The meter should read G1 L1 P1 (meaning you are about to start Grid 1, Line 1, Point 1). If it tells you anything else, it means you already have data logged on the machine. Enlist the support of a friend to carry your cable to your left so no-one trips over it.
2) Press to log your first point. Then lift up the instrument and move to the
next point – the next red marker on the white ‘washing line’ tape. The resistivity meter should ‘beep-be-beep’ to acknowledge that it is reading this point.
3) Once it has beeped, you can lift up the equipment and take it to the next red marker on the
tape. Keep doing this till you get to the end of the white tape. The resistivity meter should give a single longer ‘beep’ to show that it is at the end of the 20m traverse.
4) Now turn round to face back where you came from, but move to the other side of the white
‘washing line’ tape. Place the equipment at the first red marker – this is your first point. Continue surveying till you reach the first yellow ‘washing line’ tape. This methodology is called ‘zig-zag traverse’.
5) At this point you will need two more friends who will move the
white tape to the next set of red marks on the yellow ‘washing line’ tapes. With this in place, you can conduct your third and fourth traverses. Carry on until you finish your grid square.
6) When the survey is complete, press to save data. Then switch off the resistivity meter.
Enable Log 5
Enable Log 5
Start Enter
The resistivity meter will always tell you which point you are about to log, not the point you have just done: this can be confusing. So at the beginning of the survey it will say you are about to log point 1 (P1).

8
Troubleshooting Mistakes If you get a point wrong, press ‘Delete’ on the resistivity meter. If you get a whole line wrong, press and hold down on ‘Delete Line’ for FOUR beeps (any less and the memory won’t clear). You will probably have to press ‘Start/Enter’ to log your next point. Dummy Logging At some point during your survey you are likely to encounter a situation where you can’t log a point because there is a physical obstruction in the way, such as a tree or concrete surface. Instead of skipping out this point, press ‘Dummy Log’ on the resistivity meter so it recognises a missed reading, and it should give a warble in confirmation. Do this as many times as you have points you need to dummy log. Press ‘Start’ to continue surveying as normal. Regular Incomplete grid squares You will encounter a problem when you come across grid squares that are smaller than 20m². For example, if your field has dimensions of 28m x 60m, the first three 20m² squares are easy to do, but you will encounter a problem with each of the 8 x 20m grid squares. Following the dummy logging procedure, you could ‘Dummy Log’ each of the ‘blank’ points, but this would be very repetitive and time-consuming. Instead, when you reach the point where you can’t take any more readings, press ‘Finish Line’, which dummy logs all the remaining points in for you. Then press ‘Image Line’. The number of points you have just dummy logged in will be mirrored at the start of the next line, leaving you to finish the second line’s survey as per normal. NB: this will only work in squares with regular dimensions. If you are surveying a very oddly-shaped ‘grid’ such as a trapezoid or triangle, you will have to be more creative in how you use the ‘Dummy Log’ and ‘Finish Line’ and ‘Image Line’ features in order to attain an accurate reading of the survey area. One thing to bear in mind is that you make sure you are always starting the grid in the same direction. For example, if you walked north on the Line 1 traverse of Grid 1, you will need to ensure that you walk north on Line 1 of Grid 2. If you can’t survey Lines 1 to 3 of Grid 2 because there’s a bush in the way, make sure you start Line 4 heading south . And so on. If you don’t zigzag in the same way for every grid, the processed data will not be accurate. Moving the remote probes When you have done a few grid squares you will find that the lead will not reach to start and complete a new grid square. You now have to move the remote probes. Look at the most recent resistivity reading on the resistivity meter (e.g. 8 ohms). Then pick up the remote probes and reposition in their new location (about 15m away from the nearest grid square to be surveyed). Reposition the probes closer together or further apart until you get the same reading as the old location, e.g. 8 ohms. This ensures continuity and coherence in the final data set. Help! If you have no idea how to resolve your problem, phone Jemima on 01223 850542 or 07584 501612, or Jo on 01223 850541 and they will endeavour to help you!

9
Battery charging: Once you plug it in, you get an amber light, which then changes to red. The red light means the RM85 is charging, but note: the light doesn’t go out when fully charged. It needs to be charged for 12-16 hours, but no longer. Updated 16/1/14