step · web viewan economist wants to determine whether there is a linear relationship between...
TRANSCRIPT

LAB 4CORRELATION AND REGRESSION
CORRELATIONA correlation is a relationship between two variables. The data can be represented by the ordered pairs where x is the independent (or explanatory) variable and y is the dependent (or response) variable.
Lab 4: Correlation and Regression Page 1

Constructing a Scatter Plot
An economist wants to determine whether there is a linear relationship between a country’s gross domestic product (GDP) and carbon dioxide (CO2) emissions. The data are shown in the table at the left. Display the data in a scatter plot and determine whether there appears to be a positive or negative linear correlation or no linear correlation.
Step 1: Fill the data as follows in excel sheet.
Step 2: Select X and Y as shown in figure.
Lab 4: Correlation and Regression Page 2
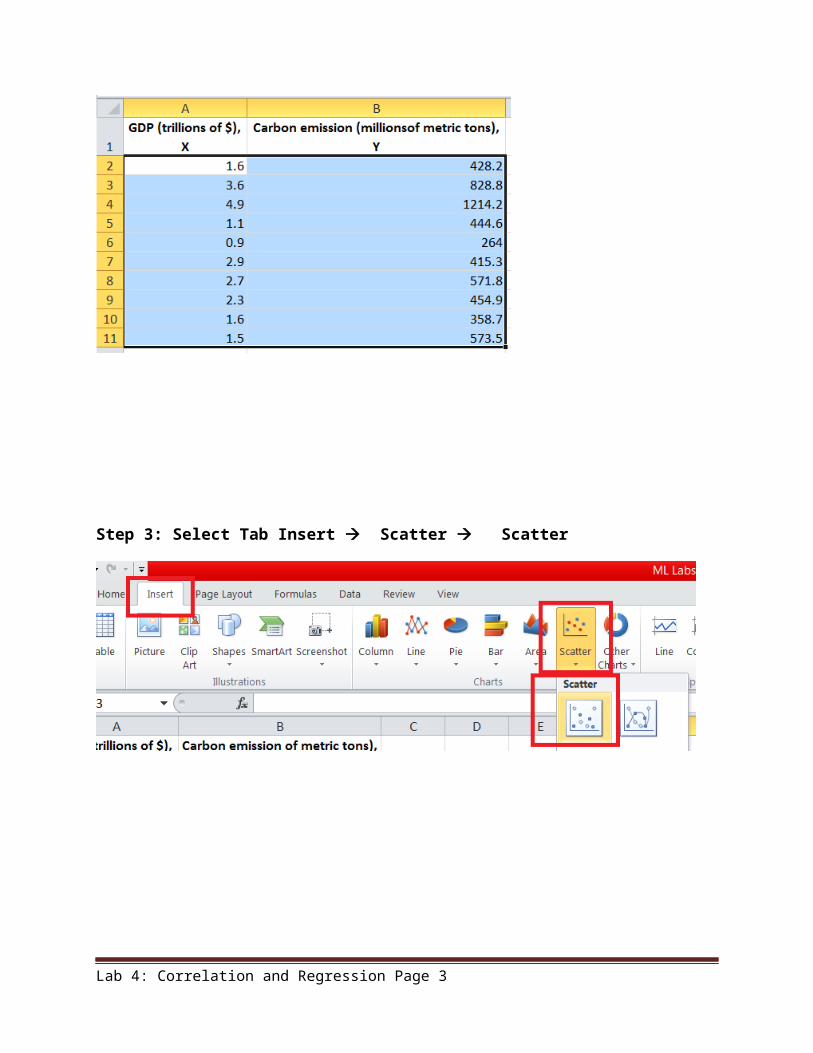
Step 3: Select Tab Insert Scatter Scatter
Scatter Plot shown in figure
SolutionThe scatter plot is shown at the right. From the scatter plot, it appears that there is a positive linear correlation between the variables.
InterpretationReading from left to right, as the gross domestic products increase, the carbon dioxide emissions tend to increase.
Lab 4: Correlation and Regression Page 3

CORRELATION COEFFICIENT
Interpreting correlation using a scatter plot can be subjective. A more precise way to measure the type and strength of a linear correlation between two variables is to calculate the correlation coefficient.
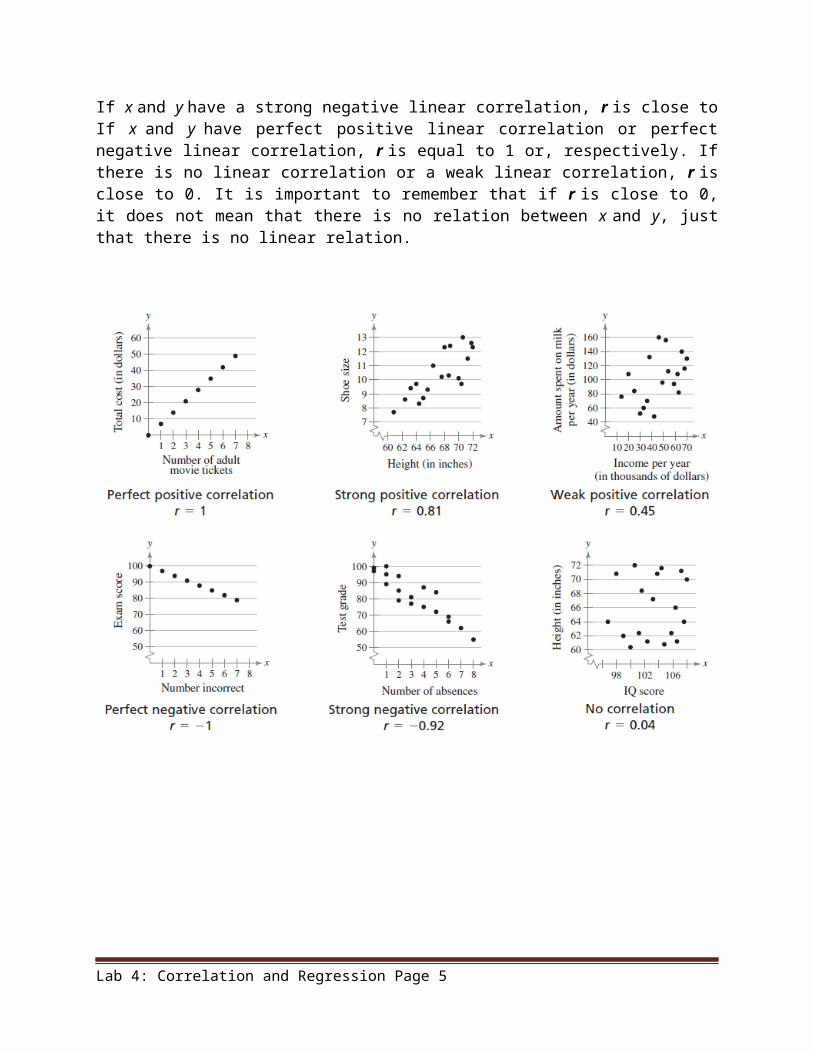
The range of the correlation coefficient is to 1, inclusive. If x and y have a strong positive linear correlation, r is close to 1. If x and y have a strong negative linear correlation, r is close to If x and y have perfect positive linear correlation or perfect negative linear correlation, r is equal to 1 or, respectively. If there is no linear correlation or a weak linear correlation, r is close to 0. It is important to remember that if r is close to 0, it does not mean that there is no relation between x and y, just that there is no linear relation.
Lab 4: Correlation and Regression Page 4
CORREL: To calculate a linear correlation between two variables.
REGRESSION
Lab 4: Correlation and Regression Page 5

A regression line, also called a line of best fit, is the line for which the sum of the squares of the residuals is a minimum.
How to Calculate Linear Regression
Step 1: Fill the data as follows in excel sheet.
Step 2: Select X and Y as shown in figure.
Lab 4: Correlation and Regression Page 6

Step 3: Select Tab Insert Scatter Scatter
Lab 4: Correlation and Regression Page 7

Scatter Plot shown in figure
Step 4: Right click any data point Add Trendlines.... as shown in figure.
Lab 4: Correlation and Regression Page 8

Step 5: Select from Trendline Options and
Check
as shown in figure.
Lab 4: Correlation and Regression Page 9

MULTIPLE REGRESSION
Lab 4: Correlation and Regression Page 10

Finding A Multiple Regression Equation
A researcher wants to determine how employee salaries at a certain company are related to the length of employment, previous experience, and education. The researcher selects eight employees from the company and obtains the following data.
Step 1: Select the "Data" tab, then click "Data Analysis" in the "Analysis" grouping (most likely at or near the far right of Data tab options). And Select Regression then click OK button as shown in figure.
Step 2: Input the dependent (Y) data by first placing the cursor in the "Input Y-Range" field, then highlighting the column of data in the workbook.
Step 3: The independent variables are entered by first placing the cursor in the "Input X-Range" field, then highlighting multiple columns in the workbook.
Lab 4: Correlation and Regression Page 11

NOTE: The independent variable data columns MUST be adjacent one another for the input to occur properly.
If you are using labels (which should, again, be in the first row of each column), click the box next to "Labels".
The default confidence level is 95%. If you wish to change this value, click the box next to "Confidence Level" and modify the adjacent value.
Under "Output Options", add a name in the "New Worksheet Ply" field. Select the desired options in the "Residuals" category. Graphical residual outputs are created
by with the "Residual Plots" and "Line Fit Plots" options.
Lab 4: Correlation and Regression Page 12

The regression equation is:y = 48,541 + 355.67x1 + 105.25x2 + 396.588x3
Lab 4: Correlation and Regression Page 13