sterilization, monetary policy, and global financial
TRANSCRIPT
NBER WORKING PAPER SERIES
STERILIZATION, MONETARY POLICY, AND GLOBAL FINANCIAL INTEGRATION
Joshua AizenmanReuven Glick
Working Paper 13902http://www.nber.org/papers/w13902
NATIONAL BUREAU OF ECONOMIC RESEARCH1050 Massachusetts Avenue
Cambridge, MA 02138March 2008
We thank Michael Hutchinson, Menzie Chinn, an anonymous referee, and participants at the Reviewof International Economics - Santa Cruz Center for International Economics conference on "GlobalLiquidity," held at the University of California at Santa Cruz on April 11-12, 2008 for useful comments.We also thank Michael Simmons and Andrew Cohn for research assistance. The views expressed belowdo not represent those of the Federal Reserve Bank of San Francisco or the Board of Governors ofthe Federal Reserve System, or the National Bureau of Economic Research.
NBER working papers are circulated for discussion and comment purposes. They have not been peer-reviewed or been subject to the review by the NBER Board of Directors that accompanies officialNBER publications.
© 2008 by Joshua Aizenman and Reuven Glick. All rights reserved. Short sections of text, not to exceedtwo paragraphs, may be quoted without explicit permission provided that full credit, including © notice,is given to the source.
Sterilization, Monetary Policy, and Global Financial IntegrationJoshua Aizenman and Reuven GlickNBER Working Paper No. 13902March 2008, September 2008JEL No. F15,F21,F31
ABSTRACT
This paper investigates the changing pattern and efficacy of sterilization within emerging market countriesas they liberalize markets and integrate with the world economy. We estimate the marginal propensityto sterilize foreign asset accumulation associated with net balance of payments inflows, across countriesand over time. We find that the extent of sterilization of foreign reserve inflows has risen in recentyears to varying degrees in Asia as well as in Latin America, consistent with greater concerns aboutthe potential inflationary impact of reserve inflows. We also find that sterilization depends on the compositionof balance of payments inflows.
Joshua AizenmanDepartment of Economics; E21156 High St.University of California, Santa CruzSanta Cruz, CA 95064and [email protected]
Reuven GlickEconomic Research DepartmentFederal Reserve Bank of San Francisco101 Market StreetSan Francisco, CA [email protected]
2
1. Introduction
In the late 1980s and early 1990s, emerging market countries embraced growing financial
liberalization and openness. However, by also trying to maintain some degree of both exchange
rate stability and monetary independence, many of these countries experienced severe financial
crises. In the aftermath of these crises, many emerging markets have adopted a policy
configuration involving greater, though still managed, exchange rate flexibility, together with
ongoing financial integration and some degree of domestic monetary independence. Hoarding of
international reserves has become a key ingredient enhancing the stability of this new pattern.
Concerns about the cost of maintaining monetary stability with this new policy mix suggest the
need to support hoarding international reserves with more aggressive sterilization.
Apprehensions about the opportunity costs of accumulating reserves and the fiscal and
distortionary financial costs of sterilization, in turn, have raised questions about the long-run
viability of this new policy mix, particularly the efficacy of sterilization.
Recent literature has analyzed vary aspects of recent developments, such as the nature
and extent of greater exchange rate flexibility, monetary autonomy, and financial integration by
emerging market countries (e.g. Fischer 2001, Aizenman and Lee 2008). In this paper we focus
on concerns about the extent of sterilization by estimating the marginal propensity to sterilize
foreign asset accumulation over time for selected countries in Asia and Latin America.
Our results confirm that the greater accumulation of foreign reserves in recent years has
been associated with a greater intensity of sterilization by developing countries in Asia as well as
in Latin America. In particular, we show that there has been a significant increase in the
coefficient of sterilization in recent years. Thus the policies of hoarding international reserves
and sterilizing the potential inflationary impact have complemented each other during recent
years. In addition, we find that sterilization of foreign direct investment (FDI) inflows typically
3
is less than that for current account surpluses and for non-FDI inflows, suggesting that
misgivings about monetary instability depend on the composition of balance of payments
inflows.
We also discuss the benefits and costs of sterilization. For many countries the costs of
sterilization appear to be less than the perceived benefits associated with monetary stability and
reserve accumulation. However, we also present evidence suggesting that the relative benefits to
China and other countries have fallen in recent quarters. This implies limits to the sustainability
of the new policy configuration in the near term.
Finally, we outline a model (presented in an appendix) explaining how the ability to
sterilize depends on imperfect substitutability of assets in a world where the costs of trading
assets varies systematically across agents (due to possible scale effects) and across asset classes
(due to varying liquidity and risk characteristics). We show that policies fostering greater
domestic financial repression reduce the costs of sterilization, suggesting that the extent to which
a country may sterilize depends on the degree to which it is willing to tolerate financial
repression and other economic distortions.
2. The Trilemma
A major lesson of the past decade or so has been the downside risk of combining
international financial integration with soft exchange rate pegs. Each of the major international
financial market-related crises since 1994 -- Mexico, in 1994, Thailand, Indonesia, and Korea in
1997, Russia and Brazil in 1998, and Argentina and Turkey in 2000—has in some way involved
a fixed or pegged exchange rate regime. At the same time, countries that did not have pegged
rates—among them, Israel, Mexico, and South Africa in 1998—avoided crises of the type that
afflicted emerging market countries with pegged rates.1 As a result, more emerging market
countries have adopted a policy mix of managed exchange rates, while still trying to maintain

4
some degree of domestic monetary control together with growing financial integration. They
have accomplished this with a policy combination of massive reserve hoarding and sterilization.
A useful perspective for understanding the changing configuration of monetary policy by
developing countries is provided by applying the framework of the impossible trinity dilemma –
the Trilemma. The Trilemma states that a country simultaneously may choose any two, but not
all, of the following three goals: monetary independence, exchange rate stability and financial
integration (see Obstfeld, Shambaugh, and Taylor, 2005 for further discussion and references
dealing with the Trilemma).
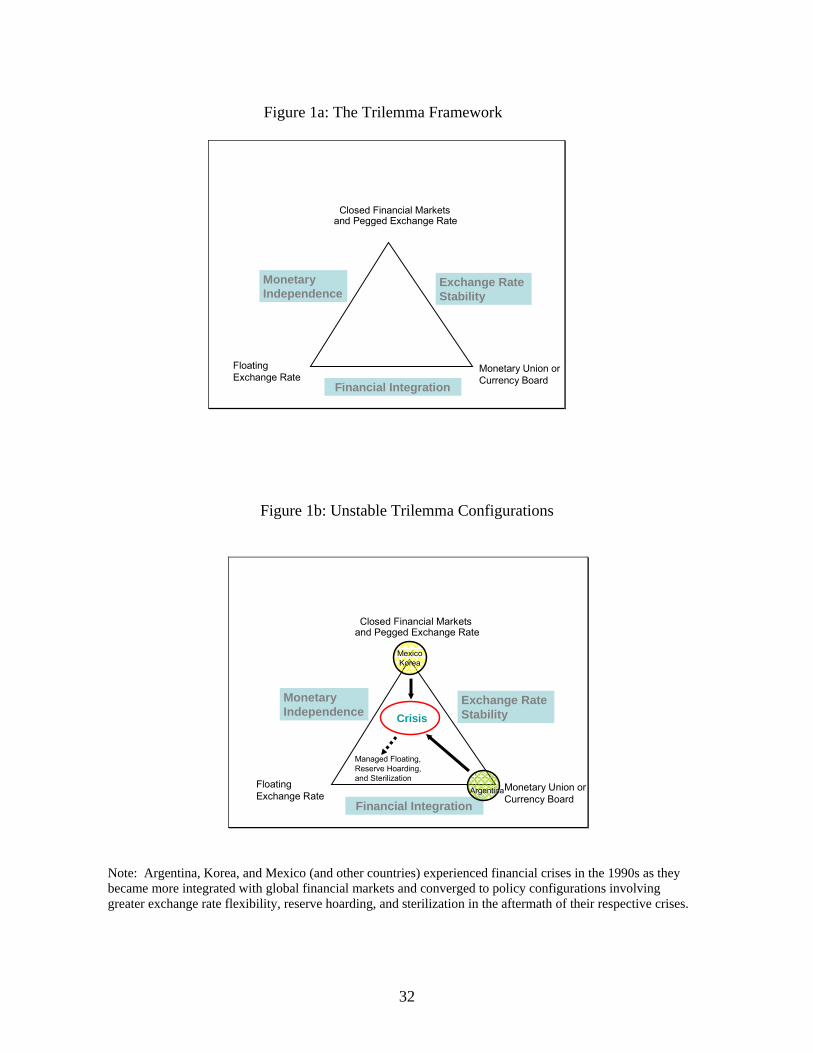
Figure 1a illustrates the Trilemma problem. In terms of the triangle depicted in the figure,
each of the three sides -- monetary independence, exchange rate stability, and financial
integration -- has an attraction, but it is not possible to be simultaneously on all three sides of the
triangle and thus attain all three goals. At the top vertex – labeled “closed capital markets” -- a
country can have monetary policy control and a fixed exchange rate, but not financial
integration. This was the preferred policy choice of most developing countries in the mid to late
1980s, as they maintained a combination of exchange rate stability and monetary independence,
with relatively closed capital accounts.
As depicted in Figure 1b, in the late 1980s and early 1990s countries such as Mexico,
Korea, and several other Asian economies, embraced growing financial liberalization and
openness. However, as they opened more financially, they found that the goals of greater
financial integration, exchange rate stability, and monetary independence were simultaneously
unattainable. The inconsistent policy goals resulted in severe financial crises, in Mexico during
1994-5 and in East Asia during 1997-8.2 These crises confirmed the tradeoffs associated with the
Trilemma: a country opting for greater financial integration must give up exchange rate stability
if it wishes to preserve a degree of monetary independence. Failure to do so induced crises, after
5
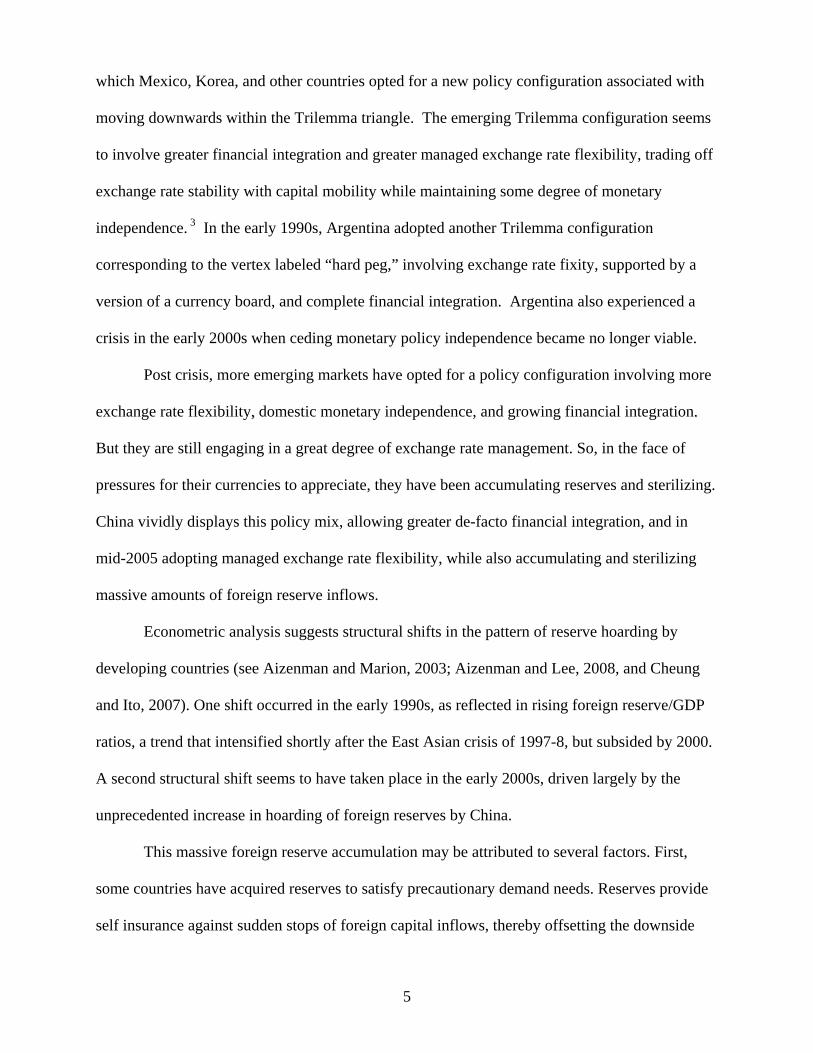
which Mexico, Korea, and other countries opted for a new policy configuration associated with
moving downwards within the Trilemma triangle. The emerging Trilemma configuration seems
to involve greater financial integration and greater managed exchange rate flexibility, trading off
exchange rate stability with capital mobility while maintaining some degree of monetary
independence. 3 In the early 1990s, Argentina adopted another Trilemma configuration
corresponding to the vertex labeled “hard peg,” involving exchange rate fixity, supported by a
version of a currency board, and complete financial integration. Argentina also experienced a
crisis in the early 2000s when ceding monetary policy independence became no longer viable.
Post crisis, more emerging markets have opted for a policy configuration involving more
exchange rate flexibility,, domestic monetary independence, and growing financial integration..
But they are still engaging in a great degree of exchange rate management. So, in the face of
pressures for their currencies to appreciate, they have been accumulating reserves and sterilizing.
China vividly displays this policy mix, allowing greater de-facto financial integration, and in
mid-2005 adopting managed exchange rate flexibility, while also accumulating and sterilizing
massive amounts of foreign reserve inflows.
Econometric analysis suggests structural shifts in the pattern of reserve hoarding by
developing countries (see Aizenman and Marion, 2003; Aizenman and Lee, 2008, and Cheung
and Ito, 2007). One shift occurred in the early 1990s, as reflected in rising foreign reserve/GDP
ratios, a trend that intensified shortly after the East Asian crisis of 1997-8, but subsided by 2000.
A second structural shift seems to have taken place in the early 2000s, driven largely by the
unprecedented increase in hoarding of foreign reserves by China.
This massive foreign reserve accumulation may be attributed to several factors. First,
some countries have acquired reserves to satisfy precautionary demand needs. Reserves provide
self insurance against sudden stops of foreign capital inflows, thereby offsetting the downside

6
risk of greater financial integration. Secondly, reserves may be used to cushion the effects of
terms of trade shocks on a country’s real exchange rate and its exports, smoothing the adjustment
of the current account. In addition, they allow countries to avoid relying on the IMF, World
Bank, and other international financial organizations, etc. for implicit insurance. Lastly, reserve
accumulation may occur as a byproduct of managing exchange rates to promote exports by
undervaluing domestic currency.4
3. Reserve Accumulation and Sterilization Response
Reserve accumulation has monetary implications. When a central bank purchases foreign
reserve assets, it must decide whether to fund it by increasing the reserve money base, which is
potentially inflationary, or by reducing its net domestic assets, which sterilizes the impact on the
domestic reserve money base. Central banks may offset the effects of reserve accumulation on
the monetary base in a number of ways, including selling market instruments, such as
government bonds or central bank bills or by using swaps or repurchase operations. With
foreign exchange swaps, the central bank typically agrees to buy foreign exchange forward,
while with repurchase operations (“repos”) the central bank sells securities with an agreement to
buy them back in the future. When markets are thin, some authorities rely on non-market
instruments, such as transferring the deposits of government and public financial institutions
from the commercial banking system to the central bank or selling foreign exchange reserves to
the government (perhaps to allow it to reduce external sovereign debt).5
Some Plots
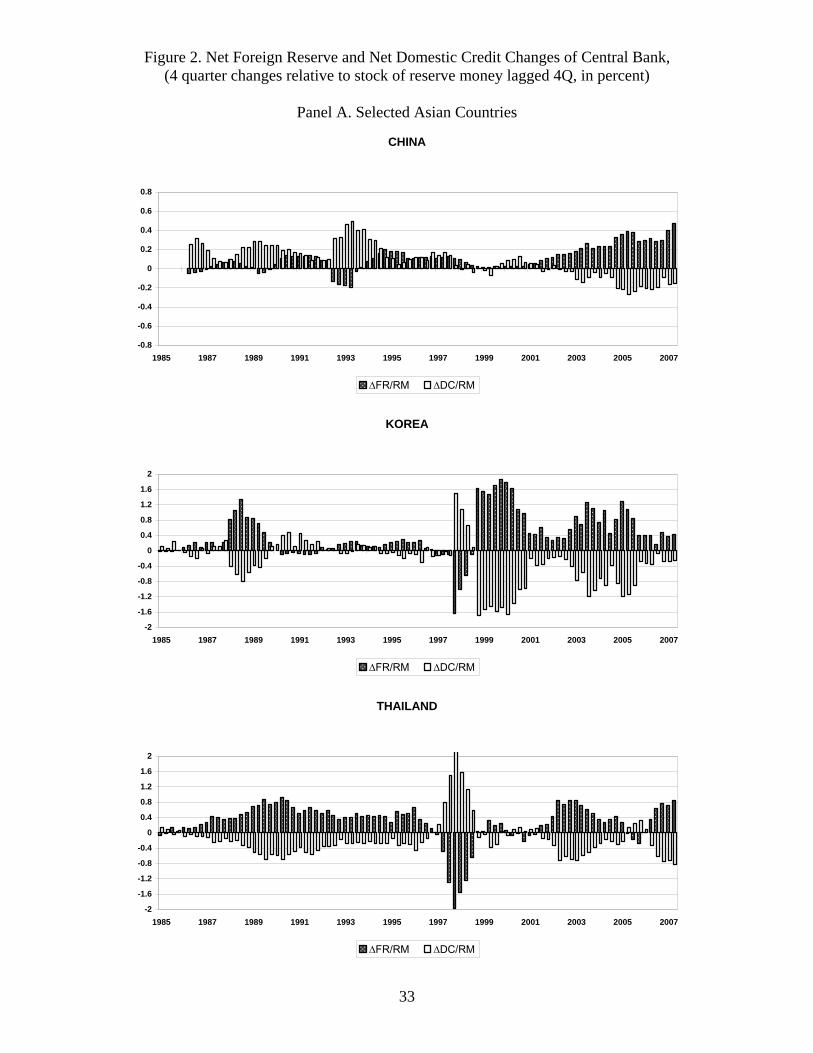
Figure 2 plots 4-quarter changes in central bank net foreign reserve assets (FR) and in net
domestic credit assets (DC), each scaled by the reserve money stock (RM) at the end of the
period four quarters earlier, for selected Asian countries.6 Net foreign reserves are defined by
7
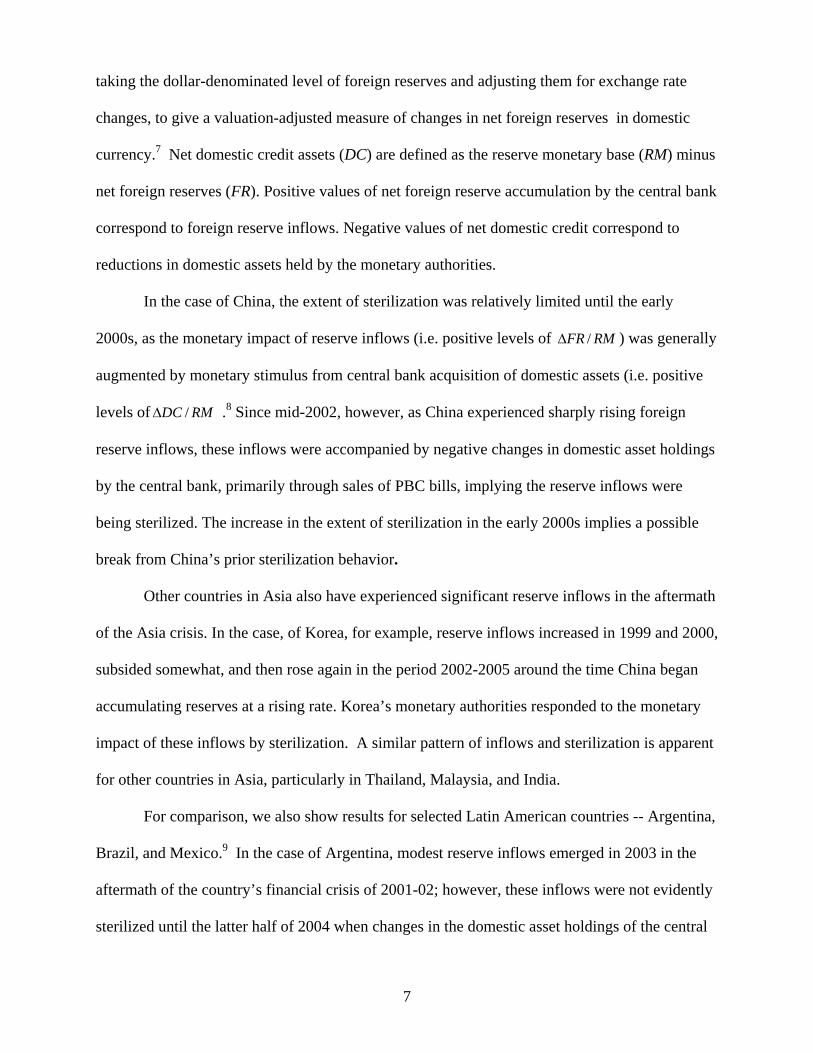
taking the dollar-denominated level of foreign reserves and adjusting them for exchange rate
changes, to give a valuation-adjusted measure of changes in net foreign reserves in domestic
currency.7 Net domestic credit assets (DC) are defined as the reserve monetary base (RM) minus
net foreign reserves (FR). Positive values of net foreign reserve accumulation by the central bank
correspond to foreign reserve inflows. Negative values of net domestic credit correspond to
reductions in domestic assets held by the monetary authorities.
In the case of China, the extent of sterilization was relatively limited until the early
2000s, as the monetary impact of reserve inflows (i.e. positive levels of /FR RMΔ ) was generally
augmented by monetary stimulus from central bank acquisition of domestic assets (i.e. positive
levels of /DC RMΔ .8 Since mid-2002, however, as China experienced sharply rising foreign
reserve inflows, these inflows were accompanied by negative changes in domestic asset holdings
by the central bank, primarily through sales of PBC bills, implying the reserve inflows were
being sterilized. The increase in the extent of sterilization in the early 2000s implies a possible
break from China’s prior sterilization behavior.
Other countries in Asia also have experienced significant reserve inflows in the aftermath
of the Asia crisis. In the case, of Korea, for example, reserve inflows increased in 1999 and 2000,
subsided somewhat, and then rose again in the period 2002-2005 around the time China began
accumulating reserves at a rising rate. Korea’s monetary authorities responded to the monetary
impact of these inflows by sterilization. A similar pattern of inflows and sterilization is apparent
for other countries in Asia, particularly in Thailand, Malaysia, and India.
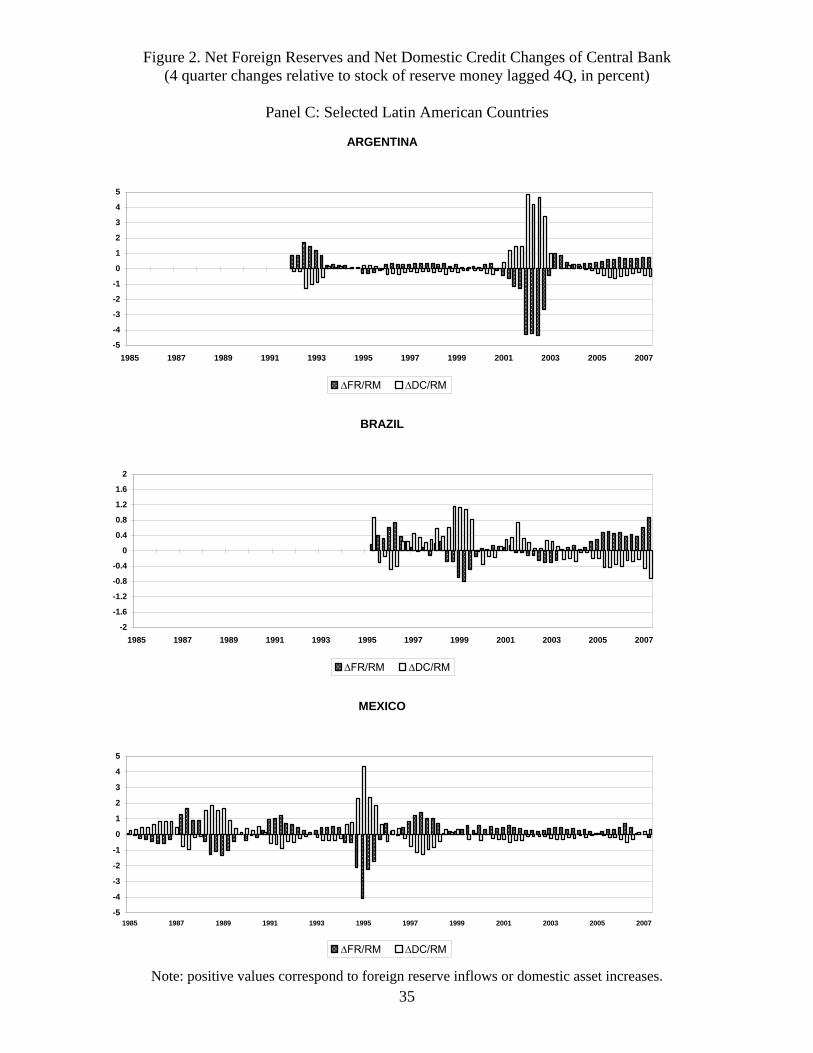
For comparison, we also show results for selected Latin American countries -- Argentina,
Brazil, and Mexico.9 In the case of Argentina, modest reserve inflows emerged in 2003 in the
aftermath of the country’s financial crisis of 2001-02; however, these inflows were not evidently
sterilized until the latter half of 2004 when changes in the domestic asset holdings of the central
8
bank turned negative. In Brazil, reserve inflows began increasing in the latter half of 2004,
accompanied by sterilization. A similar pattern of reserve inflows and offsetting declines in
central bank domestic assets occurred in Mexico in 1996 in the aftermath of its 1994-95 peso
crisis.
Estimation of Sterilization Response
We now turn to quantitatively estimating changes in the degree of sterilization. Our
specification is very simple. We estimate the extent of sterilization by a simple regression of the
monetary authorities' change in net domestic assets on the change in net foreign assets held on its
balance sheet , where change is measured over four quarters, and scaled by the level of the
reserve money stock four quarters ago. We also include the four-quarter growth rate of nominal
GDP on the right-hand side to control for other explanatory variables, Z, that might influence the
demand for money:10
4 4/ /DC RM FR RM Zα β− −Δ = + Δ + (1)
We estimate the sterilization coefficient, β , with OLS using 40-quarter rolling samples.11 In
these circumstances, a unitary coefficient, i.e. β = -1, on the variable /FR RMΔ represents full
monetary sterilization of reserve changes, while β = 0 implies no sterilization. A value of the
sterilization coefficient between these levels, -1 < β < 0, indicates partial sterilization.
In our base specification Z is defined as the rate of nominal GDP growth. Presuming a
stable demand for money, a rudimentary version of the monetary approach to the balance of
payments implies that expansion of DC by the central bank at the growth rate of GDP would
meet the increase in the demand for money, without the need to hoard foreign reserves. Thus
full sterilization ( β = -1) implies that the central bank allows domestic credit to accommodate
fully higher demand for money due to GDP growth, but prevents any domestic credit expansion
due to hoarding foreign reserves. A value of sterilization less than -1 may represent tighter
9
monetary policy, potentially due to greater concerns about inflation. In this case hoarding a unit
of foreign reserves reduces domestic assets held by the central bank by more than one unit,
thereby reducing the monetary base. Similarly, a value of sterilization above zero may indicate
expansionary monetary policy, potentially due to concerns about a credit crunch or exposure to a
systemic crisis.12
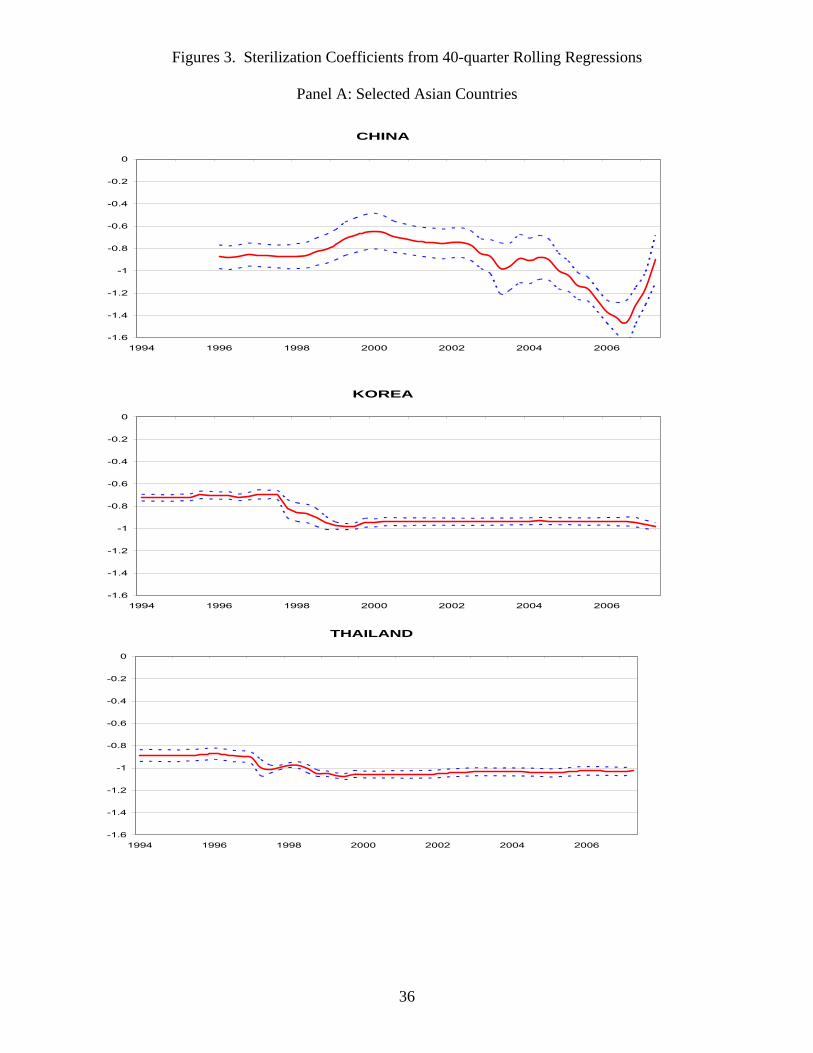
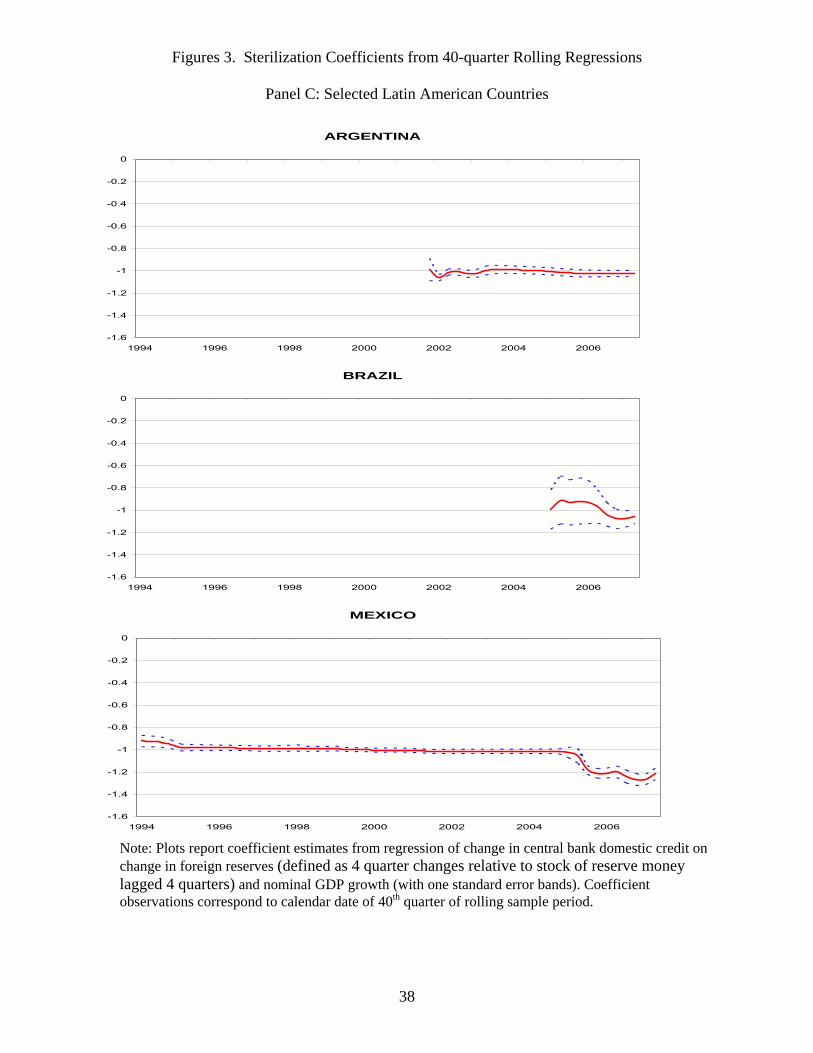
Figure 3 plots sterilization coefficients from rolling regressions based on estimation of
our benchmark specification. Coefficient observations correspond to the calendar date of the 40th
quarter in each rolling sample.13
In the case of China, observe that the sterilization coefficient began rising (in absolute
value) from roughly 0.6 in 2000, a trend that accelerated in the latter half of 2002 and continued
into 2006 when it peaked at almost 1.5, suggesting the presence of a break in behavior.14 The
plot also indicates a reversal of China’s sterilization behavior beginning in the fourth quarter of
2006. This evident decline in China’s degree of sterilization can be attributed to two possibilities.
First, China’s foreign reserve accumulation in recent periods may be overstated to the extent that
the reported figures have not been adjusted to take account of swaps and shifts of foreign reserve
assets to China’s nascent sovereign wealth fund.15 Second, China may indeed have reached
limits to the extent of its ability to sterilize its massive reserve inflows.
In Korea a break in sterilization behavior is evident after the financial crisis of 1997-98,
with the sterilization coefficient increasing from 0.9 to more than 1.0 by 1999. Increases in
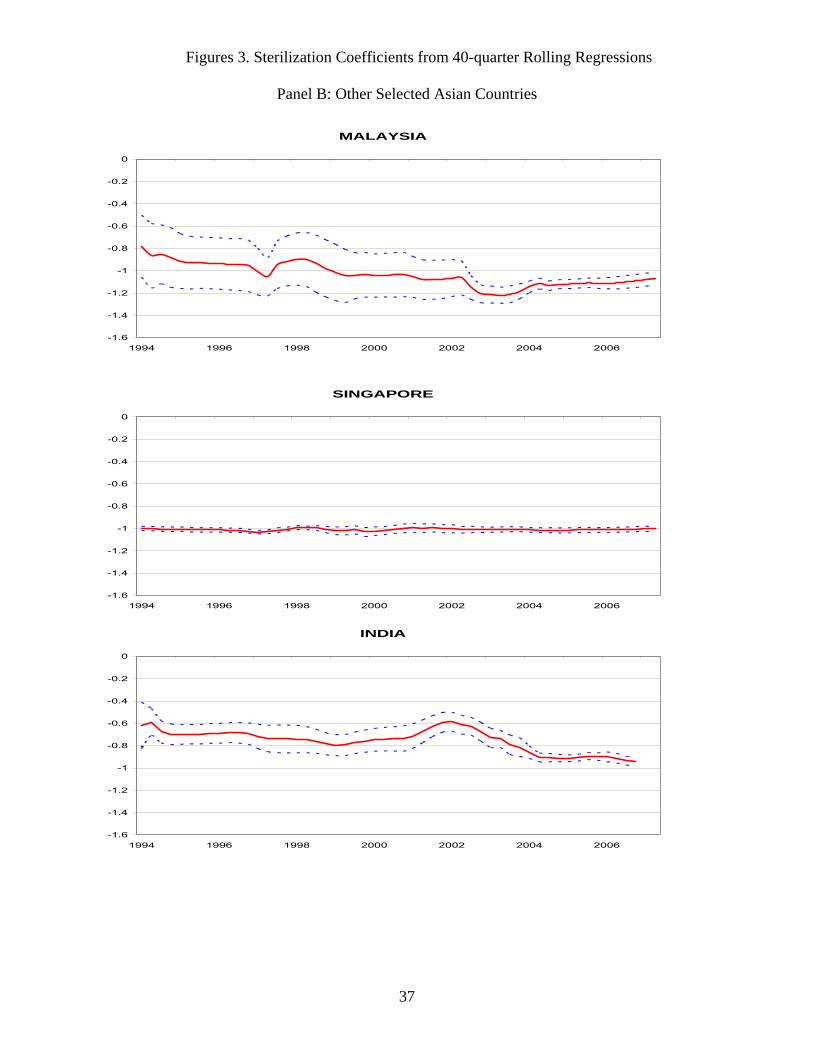
sterilization, though to lesser extent, are observable in Thailand and Malaysia, while no change is
evident in the case of Singapore. In the case of India, a modest increase in sterilization appears to
have occurred in the mid 1990s after its financial crisis of 1991, followed by a further increase
after 2002.

10
For comparison we also present rolling regression results for our three Latin America
countries. As before, the sample ranges are limited to the period after the stabilization of
monetary policy in 1991 in Argentina and 1994 in Brazil; in both cases some increases in
sterilization in observable over the period.16 In the case of Mexico, sterilization increased
modestly in 1996 and later around 2005.
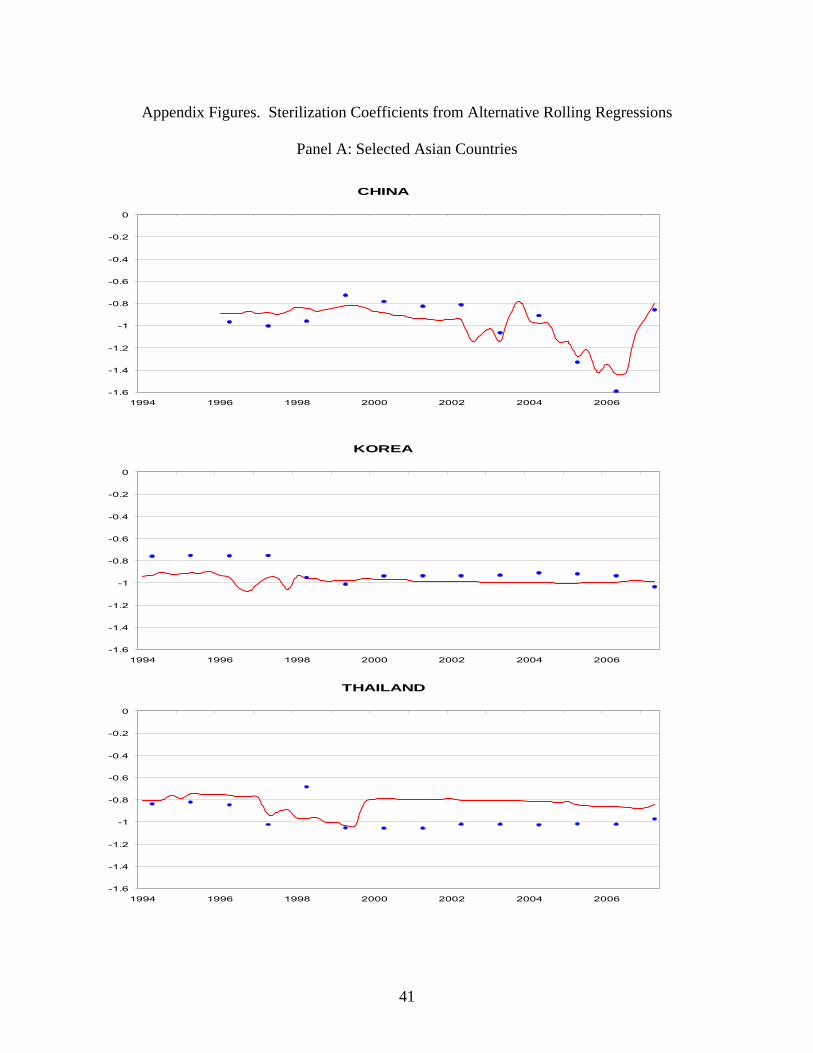
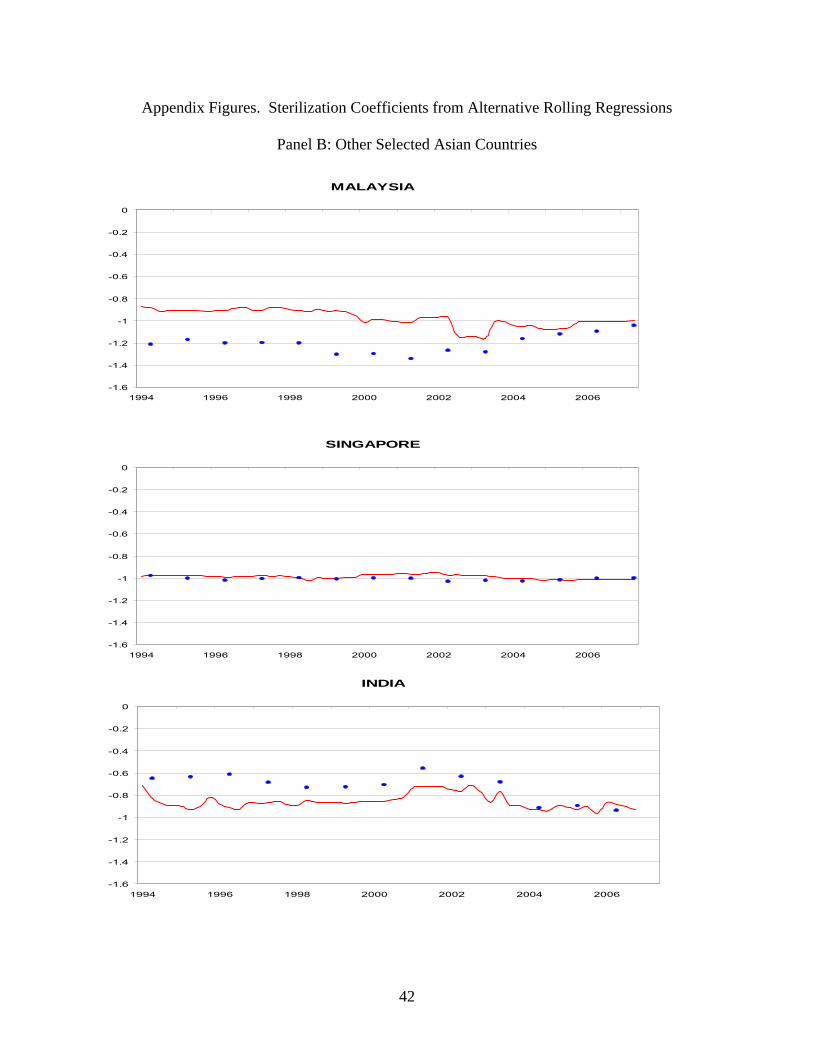
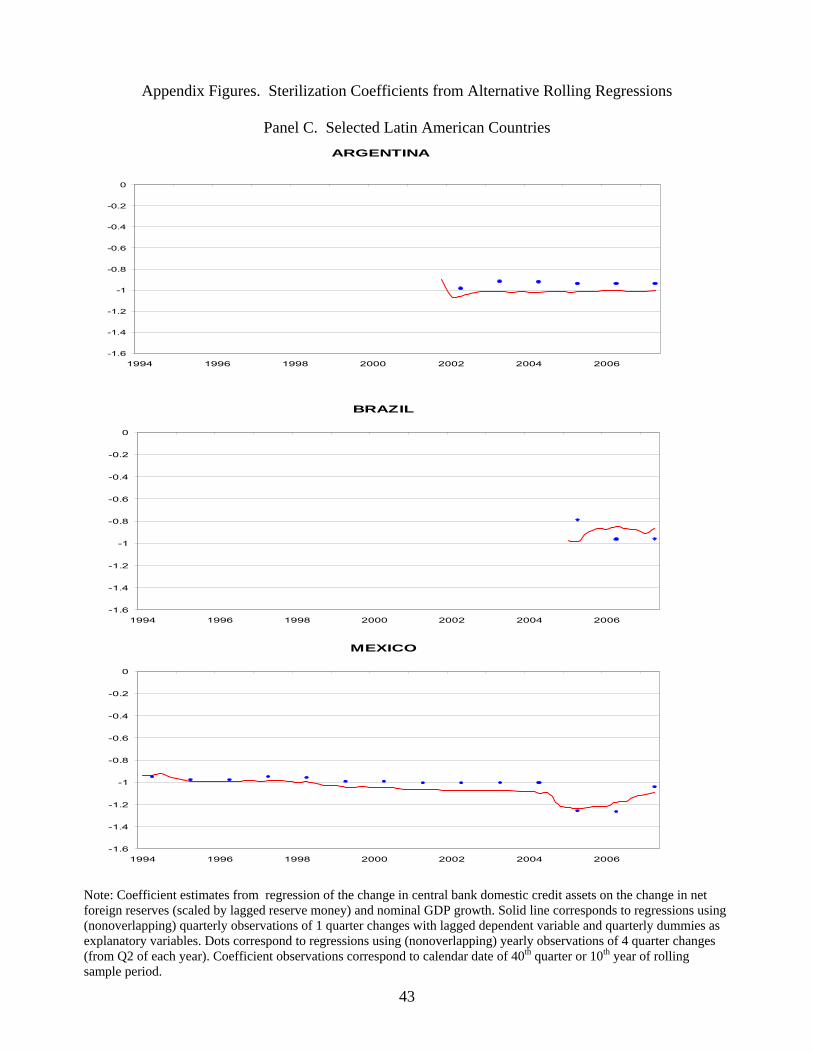
In the Appendix Figures, we examine the sensitivity of our results to alternative
regression specifications. Specifically, we plot rolling regression coefficients based on (i)
nonoverlapping quarterly observations of 1 quarter changes, and (ii) nonoverlapping annual
observations of 4 quarter changes.17 Our general finding that sterilization has increased appears
reasonably robust.18
The rolling regressions suggest that sterilization increased in many countries in our
sample after the Asia crisis or at the time that China began sterilizing significantly in 2002. To
assess the extent to which countries are converging towards similar sterilization patterns, we
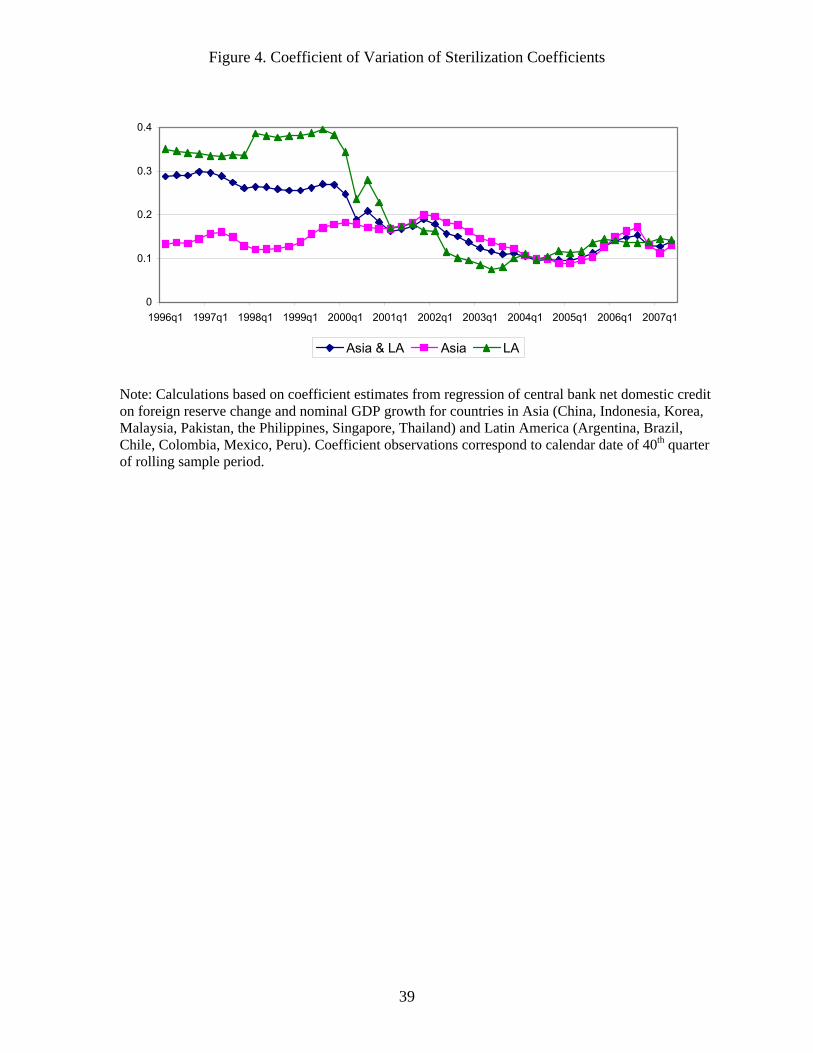
make a cross-country comparison of sterilization behavior over time. Figure 4 reports the
coefficient of variation of the sterilization coefficients for countries in Asia and Latin America as
well as the two regions pooled together. We augment the sample of countries: in Asia, to our
original sample of China, Korea, Thailand, Malaysia, Singapore, and India, we add Indonesia,
Pakistan, and the Philippines; in Latin America, to our original sample of Argentina, Brazil, and
Mexico, we add Chile, Colombia, and Peru.19 Observe that the coefficient of variation declined
substantially in Asia over the period 2000 – 2005, after which it began to rise somewhat.20 In
Latin America, the coefficient of variation fell, beginning in 2000. These results suggest the
timing of the increase in the extent of sterilization across countries may have a common
component.
11
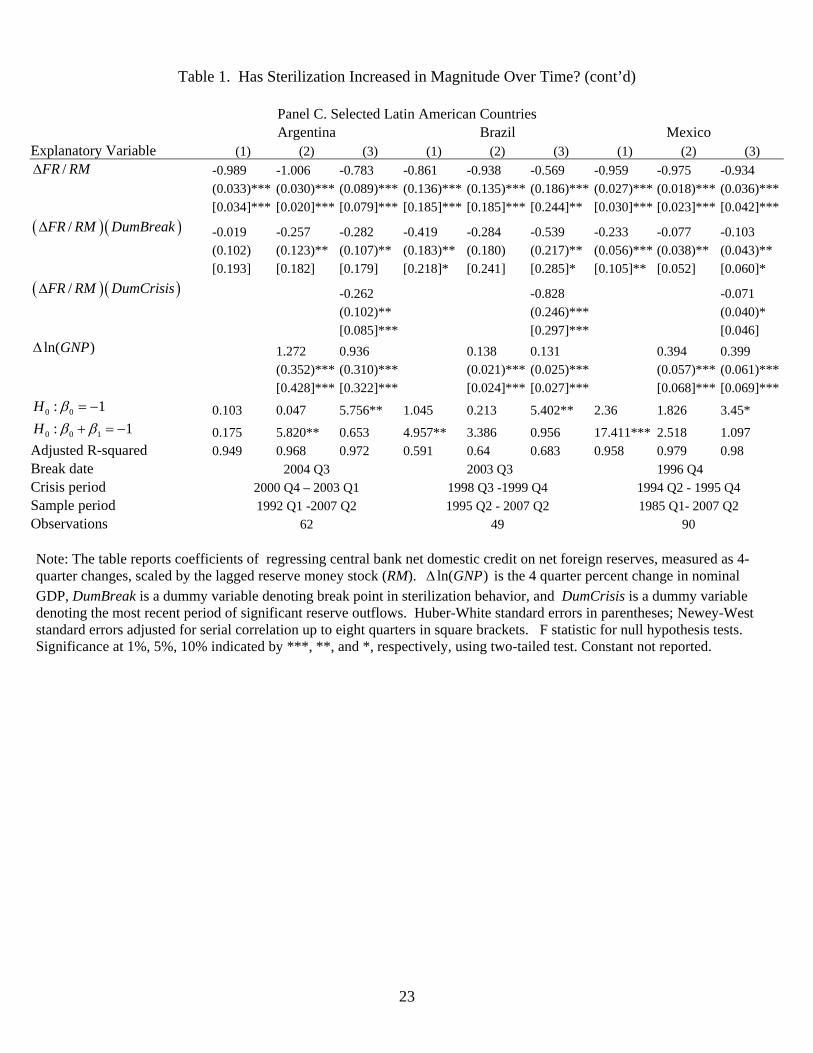
Formal regressions assessing the significance of breaks in sterilization behavior are
reported in Table 1a. There we estimate equation (1) for the full sample period by also including
a term interacting /FR RMΔ with a dummy variable DumBreak, defined with a value of unity for
all periods beginning with each country’s designated break date. We identified break dates for
each country by the first observation after the 1997-98 Asia crisis (after the 1994-95 peso crisis
in the case of Mexico) in which reserve inflows were positive and net domestic assets were
reduced for at least two quarters in a row.21 A variant regression, reported in column (3),
controls separately for sterilization behavior during a country’s most recent period of significant
foreign reserve outflows, denoted by DumCrisis. We report both Huber-White standard errors (in
parentheses) and Newey-West standard errors (in square brackets). The Newey-West errors
adjust for serial correlation of up to eight quarters, a possible concern because of our use of
overlapping quarterly observations of 4 quarter changes.22 The break date and crisis periods for
each country are reported at the bottom of Table 1. Our methodology identifies a break date of
2002 Q2 for China, 1998 Q4 for Korea, Thailand, Malaysia, and Singapore, and 2000 Q4 for
India. The break dates for Argentina, Brazil, and Mexico are 2004 Q3, 2003 Q3, and 1996 Q4,
respectively. 23
Observe that the coefficients on the net foreign reserve inflow variable and on the
interactive term are always negative for all countries, implying the inflows were sterilized by
reduction of central bank domestic assets and that this sterilization increased (i.e., the change in
domestic asset holdings is more negative) after the break date. The coefficient on the interaction
term is significant at 10 percent (using a two-tailed test) in all cases (except Malaysia). This
supports the observation drawn from the rolling regression plots that sterilization behavior has
intensified in recent years for emerging countries in Asia as well as in Latin America. Also note
12
that the coefficient on nominal GDP growth is positive, implying that the central bank supplies
liquidity to the economy by increasing its claims in response to greater economic activity.24
To address concern about the effects of serial correlation induced by our use of
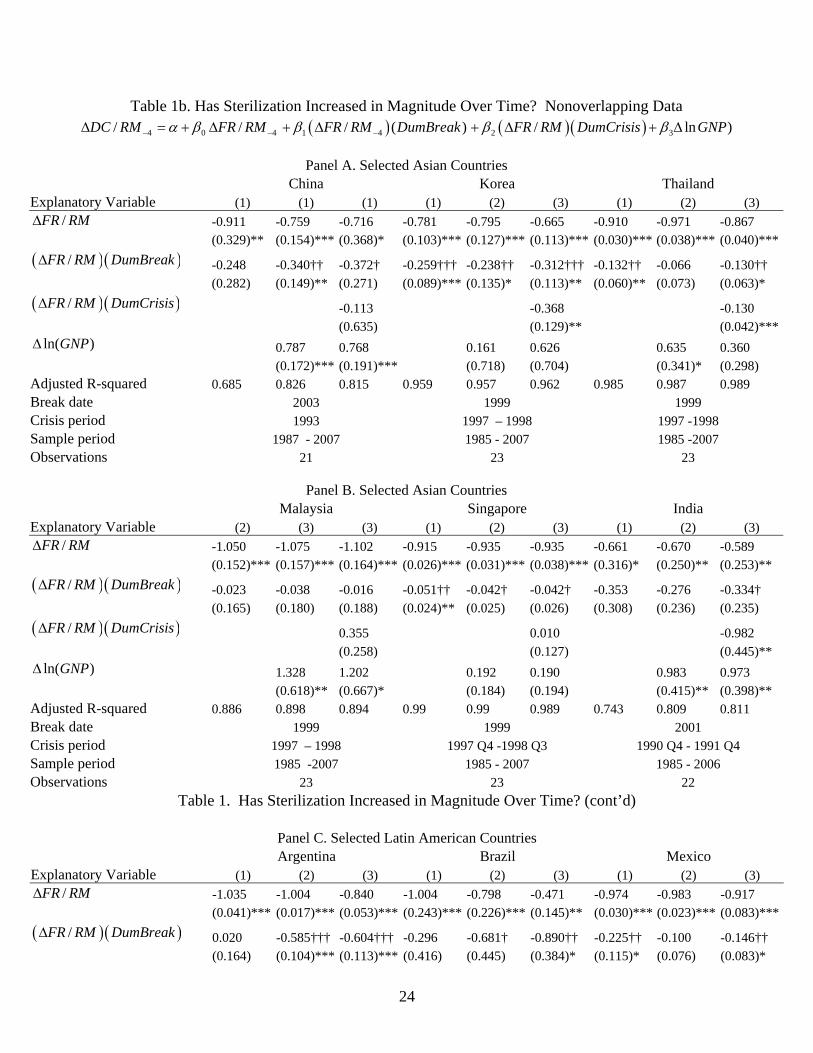
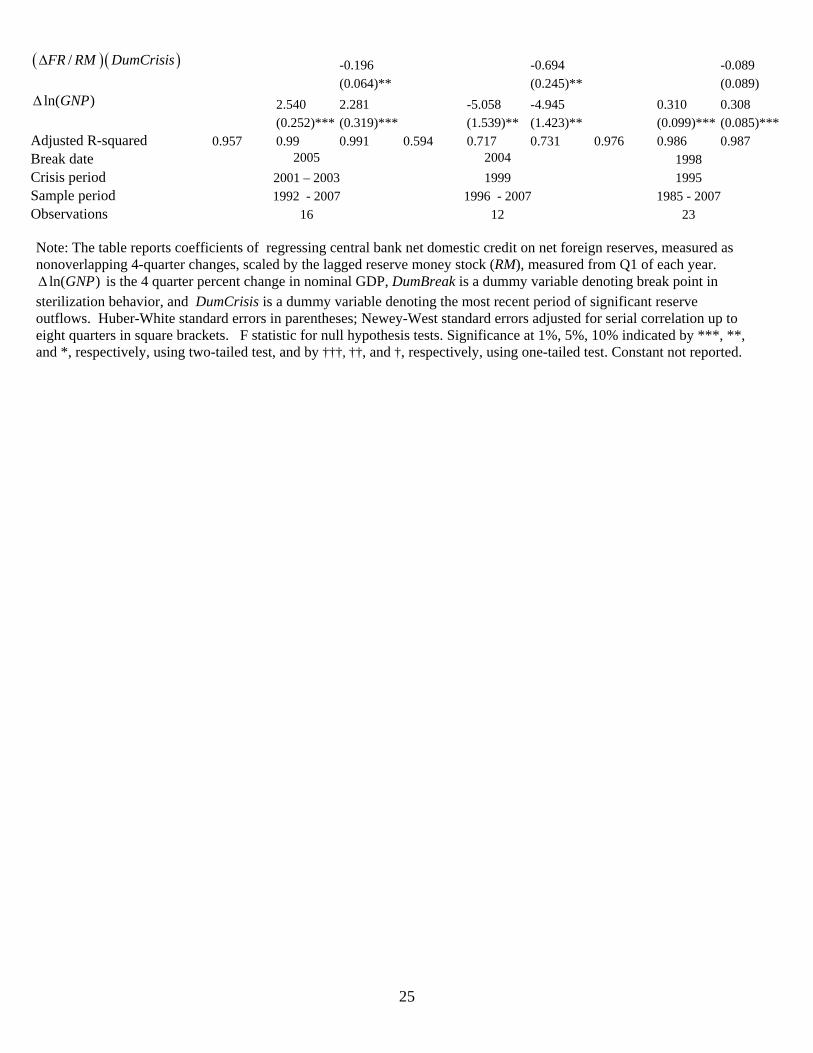
overlapping four-quarter changes, in Table 1b we report results based on nonoverlapping annual
observations of four quarter changes. 25 Because of the severe reduction in degrees of freedom
by using nonoverlapping data and a possible loss of power in detecting breaks, we report
significance levels for the interaction terms based on 2-tailed tests of the null that sterilization
behavior (as before) as well one-tailed tests of the null that sterilization behavior has increased
(i.e., the coefficient is more negative) after the break. Reassuringly, our results are essentially
unchanged. All countries show evidence of increased sterilization over time, generally with
statistical significance.26
Sterilization and Inflation
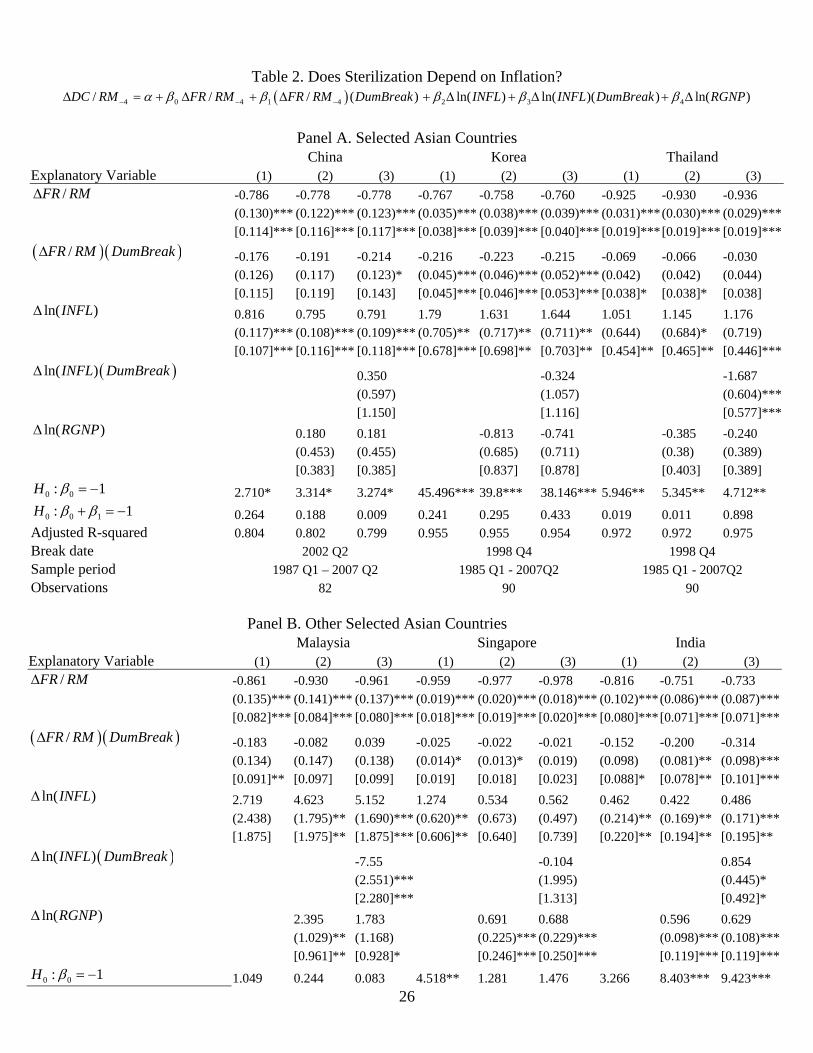
Table 2 separates out the effects of inflation from real GDP changes on the central bank’s
management of its domestic asset holdings. It also examines the extent to which the response to
inflation has changed over time and whether any changes in this response has affected the
sterilization of foreign reserve inflows.
Columns (1) and (2) of Table 3 report the separate effects of inflation without and with
real GDP as an explanatory variable. Observe that the coefficients on inflation and real GDP
growth are generally positive and significant, consistent with the positive sign on nominal GDP
observed earlier (the exceptions are the negative coefficients on real GDP for Korea and
Thailand, though they are not significant). Note also that the magnitude of the coefficient of net
foreign assets interacted with our break dummies are smaller (in absolute value) and in some
cases less significant than those reported in Table 1. Column (3) augments the regression in
column (2) by including an interaction variable involving the inflation rate with the break date

13
dummies. For several countries – notably Korea, Thailand, Malaysia, Singapore, Argentina, and
Brazil -- the coefficient on this variable is negative, suggesting an increase in anti-inflation
monetary management by the central bank in recent years (though the coefficient is not
significant for Korea and Singapore). Note also that we still find an increase in the sterilization
response in most countries, as indicated by a negative coefficient on the interactive variable with
foreign reserve inflows (the exceptions are Malaysia, Argentina, and Brazil).27 Thus, our result
that developing countries have increased their degree of sterilization in recent years appears to be
robust to allowing for any direct response to inflation pressures.
Sterilization and the Composition of Balance of Payments Inflows
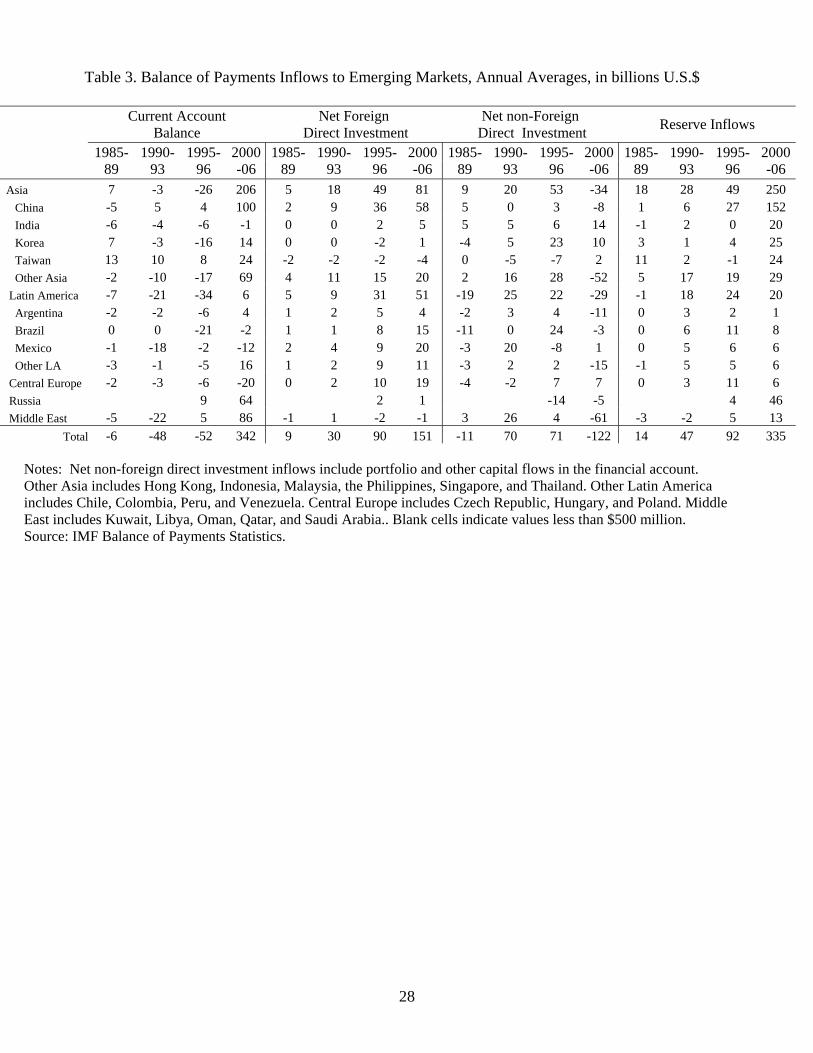
Table 3 shows the evolution of current account balances, direct investment inflows, and
other capital inflows, as well as reserve accumulation for emerging market countries as a whole,
several regional groupings, and selected individual countries. The figures reported are annual
averages of flows for subperiods before and after recent major financial crises, specifically the
Mexican crisis of 1994-95 and the Asian and Russian crises of 1997-99.
Observe that the magnitude of reserve accumulation in Asia has steadily increased over
time, consistent with our earlier observations based on central bank balance sheet data.28 Observe
also that in the most recent period, 2000-2006, these inflows primarily have reflected current
account surpluses, rather than large capital inflows. This is the opposite of the pattern seen in the
late 1980s and 1990s, when most regions of the world experienced current account deficits and
large capital inflows. Observe also that average direct foreign investment inflows have risen
steadily for all emerging market regions over time. In contrast, average portfolio and other
capital inflows ceased or declined dramatically after the Asia and Russian crises for almost all
emerging markets.29
14
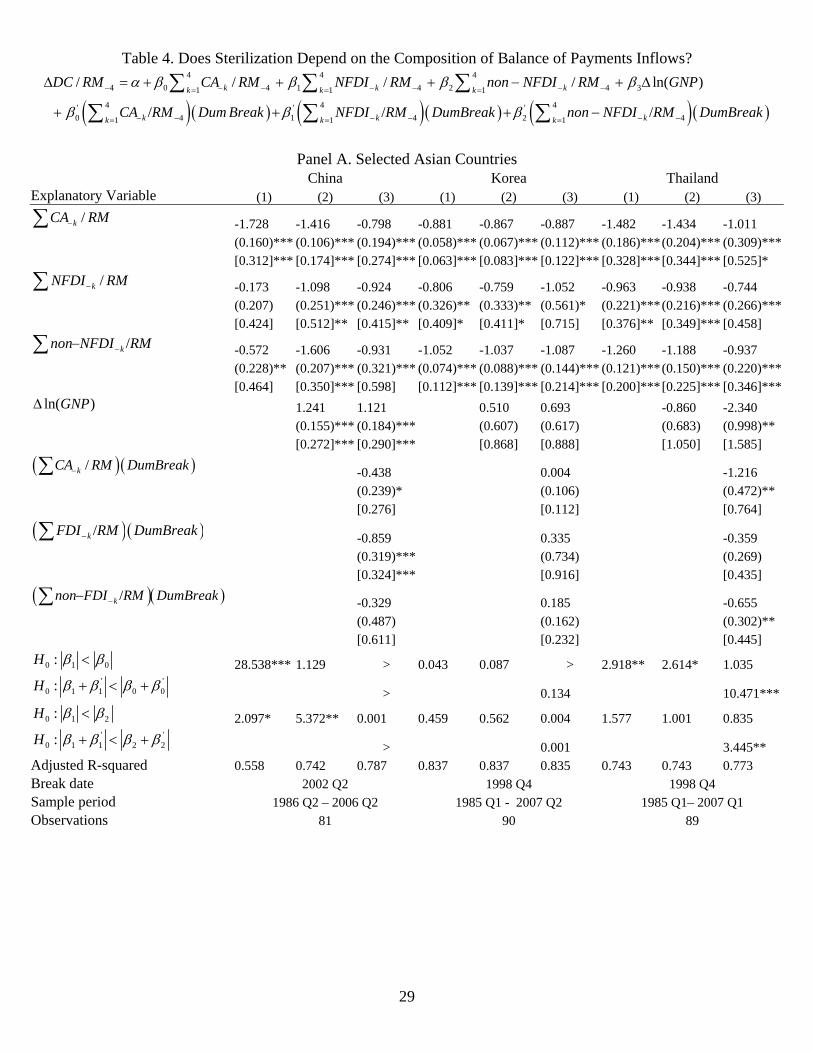
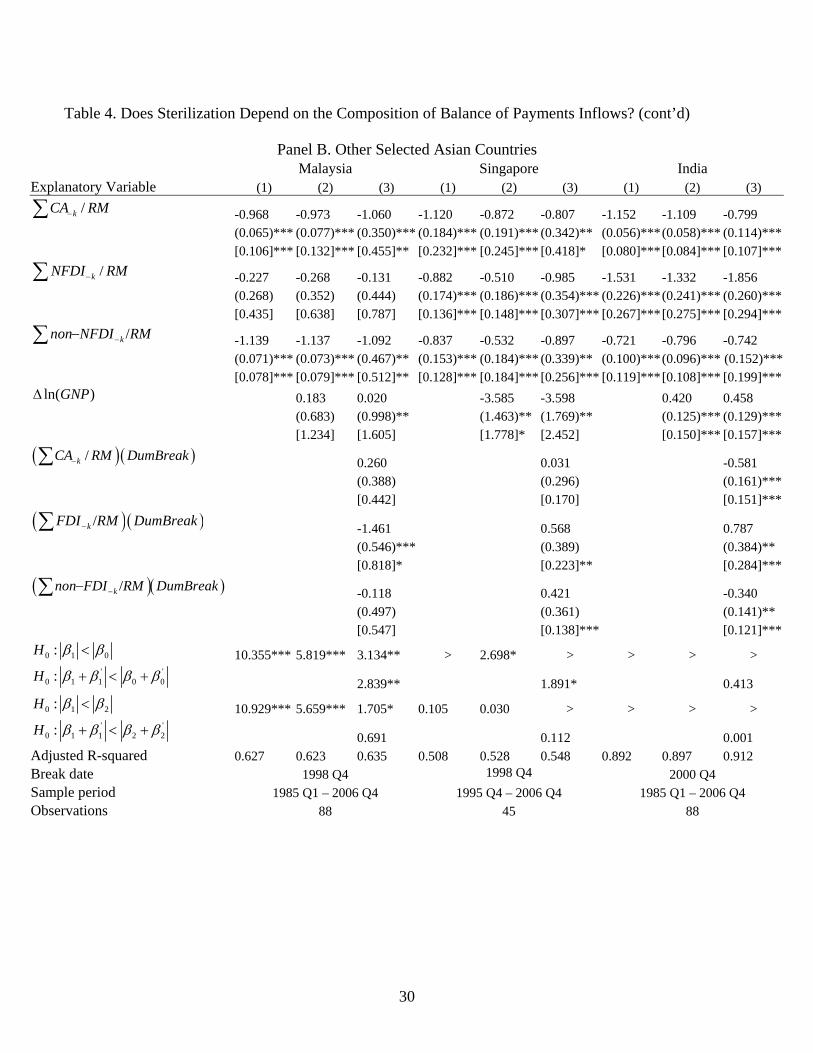
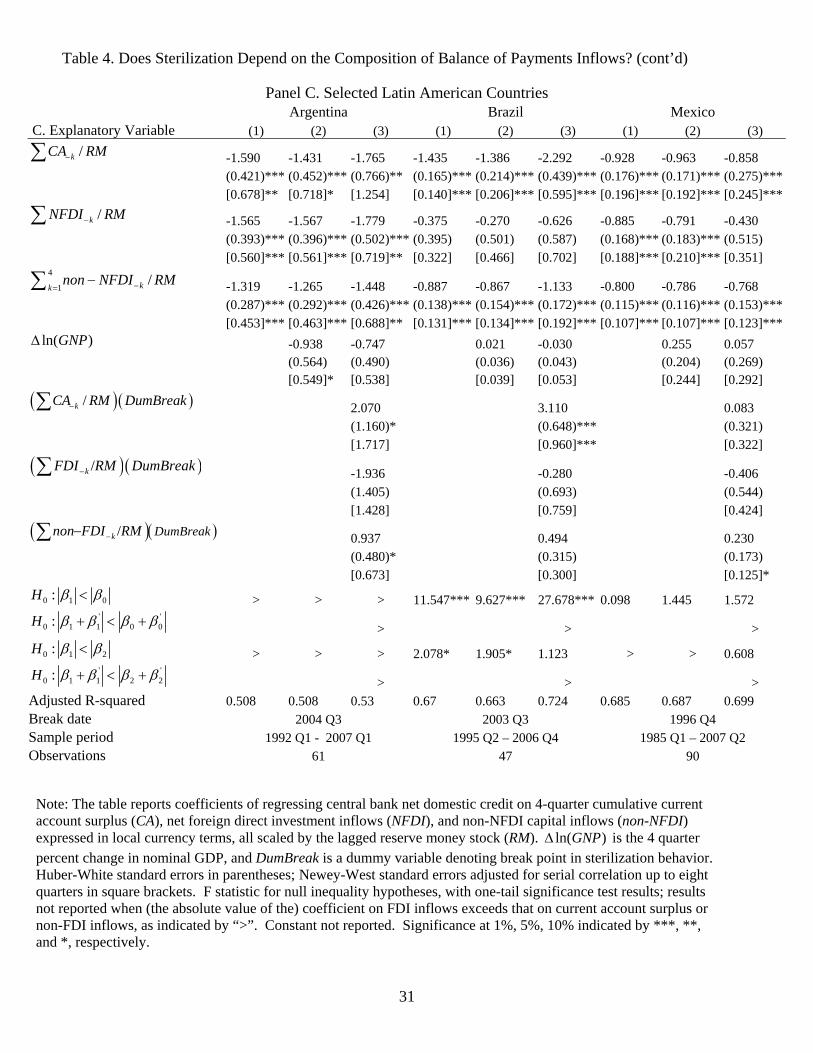
Does the sterilization response to reserve inflows vary according to the source of inflows,
i.e., does the extent to which the central bank manage its domestic asset holdings depend on
whether reserve inflows are associated with “cold” money flows” like FDI, or “hot” money
inflows associated with other components of the balance of payments? Table 4 reports the results
of estimating the sterilization response of the central bank to whether reserve inflows come from
current account surpluses, foreign direct investment inflows, or non-FDI capital inflows.30 We
also investigate whether these responses have varied at the same time as the break dates in
sterilization behavior identified earlier. Consistent with our prior regression analysis, we
measure variables in 4 quarter change terms, scaled by the lagged reserve money stock.31
As shown in column (2) of Table 4, the sterilization response to foreign direct investment
is lower (in absolute magnitude, i.e. 1 0 1 2,β β β β< < ) in several countries, including China,
Korea, Thailand, Malaysia, and Singapore, as well as Brazil and Mexico (the latter in the case of
the response relative to the current account). These differences are significant in China (relative
to non-FDI inflows), Thailand (relative to the current account surplus), Malaysia, Singapore
(relative to the current account), and Brazil. Column (3) of Table 4 interacts the individual
balance of payments components with our break date dummies to detect whether there is more or
less sensitivity to these components in recent years. Consistent with our findings in Table 3, we
find greater sensitivity (i.e. more negative coefficient values) in the cases of China, Thailand,
Malaysia (though not to the current account balance in Malaysia), and India (though not in
response to FDI flows, where the response fell significantly).
Summarizing our empirical evidence on sterilization: The extent of sterilization of
foreign reserve inflows has risen in recent years to varying degrees in Asia as well as in Latin
America. This is consistent with greater concerns about the potential inflationary impact of
reserve inflows. Sterilization depends on the composition of balance of payments inflows, i.e.,
15
for some countries the response to foreign direct investment inflows is less than that to the
current account surplus or non-FDI inflows. This is consistent with the view that these countries
are less concerned about the monetary impact of direct investment flows.
4. Costs, Benefits, and Sustainability of Sterilization Policy
Growing financial integration is an unavoidable outcome of deeper trade integration by
developing countries. A byproduct of growing financial integration is greater exposure to
financial instability. Concerns about financial and monetary instability have increased the
complementarily between the extent of reserve hoarding and sterilization: The extent to which
individual countries may continue to accumulate reserves and sterilize and the stability of this
policy mix depends on the associated benefits and costs.
While providing useful services, international reserve management is subject to serious
limitations. First, there are direct opportunity costs of reserves associated with the marginal
productivity of public capital and/or the cost of external borrowing. Second, sterilization has
fiscal costs associated with the difference between, on the one hand, the return paid on central
bank liabilities issued to sterilize domestic liquidity (or the opportunity cost from foregone
returns on domestic assets, such as government bonds, sold to the private sector) and, on the
other hand, the return earned on foreign reserve assets.
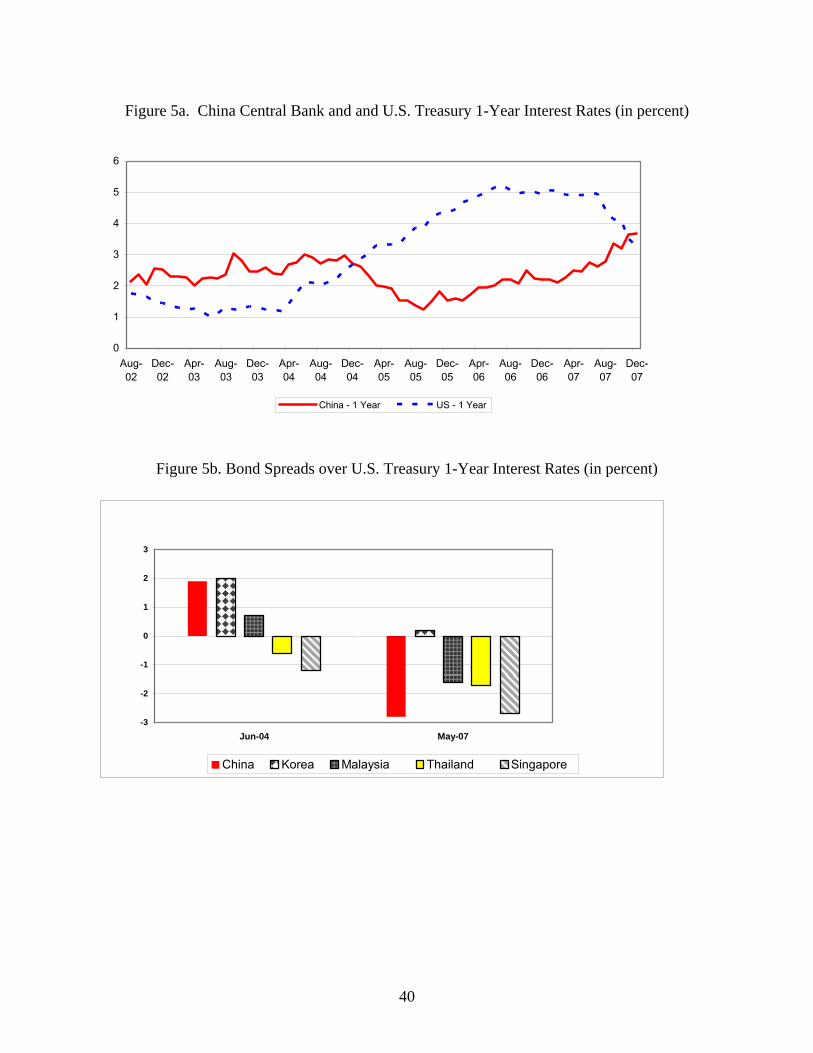
Figure 5a plots a proxy for the fiscal costs of sterilization in the case of China, given by
the difference between the 1-year People’s Bank of China and U.S. Treasury bill rates (the
spread is the vertical difference between the two plotted lines). 32 Observe that the interest rate
spread was positive, but shrinking in 2003 and 2004, and actually turned negative in 2005,
implying China then was earning money on balance from its sterilization operations. The
narrowing of this differential in recent quarters (it actually turned positive again in December
2007, however, implies that China’s sterilization costs have been rising. Figure 5b plots change
16
in interest rate spreads for five Asian countries between June 2004 and May 2007, showing that
sterilization costs increased in all these countries.
Sterilization and hoarding international reserves also involve macro and micro moral
hazard costs. The macro moral hazard arises when reserve hoarding encourages opportunistic
spending in regimes characterized by political instability and limited monitoring (see Aizenman
and Marion (2004), who show that countries characterized by greater political instability and
polarization opt to hold less international reserves). Micro moral hazard arises when reserve
hoarding subsidizes risk taking. (Levy-Yeyati (2005) calls for liquid reserve requirement on
banks, and an ex-ante suspension-of-convertibility clause.) Lastly, reserve accumulation and
sterilization can encourage financial sector distortions. For example, greater use of non-market
instruments (e.g. reserve requirements, direct credit controls) can hinder the development of
corporate bond market and alter the behavior of banks. Also it may hinder financial development
by segmenting the public debt market through the issuance of central bank liabilities instead of
Treasury securities.33
This discussion suggests that the extent to which a country may continue to sterilize
depends also on the degree to which it is willing to tolerate financial repression and other
distortions to its economy. In the appendix we outline a model explaining how the ability to
sterilize depends on imperfect substitutability of assets in a world where the costs of trading
assets varies systematically across agents (due to possible scale effects) and across asset classes
(due to varying liquidity and risk characteristics). Within this framework we show that policies
fostering greater domestic financial repression also reduce the costs of sterilization. This
suggests that countries able and willing to engage in greater financial sterilization will be able to
sustain the policy configuration of reserve hoarding and sterilizing for a longer period of time.34
17
The stability of the current policy mix is further complicated by the extent to which each
country’s cost-benefit calculation depends on the actions of other countries. Countries following
export-oriented growth strategies may choose to engage in competitive reserve accumulation to
improve and maintain their competitiveness in exporting to industrial countries. Thus, for
example, as long as China and its East Asian neighbors are trying to maintain competitiveness in
exporting to the United States, - and limits to sterilization. Those countries with lower costs of
sterilization, due for example to greater willingness to distort their financial systems, might end
up hoarding increasingly large amounts of international reserves, winning the hoarding game at
least in the short run. Arguably, this interpretation explains China’s unprecedented increase in
foreign reserves from 2002, now amounting to almost 50 percent of GDP and well above the
levels of other East Asia countries (see Aizenman and Lee, 2008). Yet, this outcome may be
fragile if it induces a country to accumulate to levels where the costs of sterilization exceed the
benefit. These observations are consistent with the World Economic Outlook (2007), finding
that resisting nominal exchange rate appreciation through sterilized intervention is likely to be
ineffective when the influx of capital is persistent and large. Indeed, China’s recently rising
costs of sterilization may account for its recent decline in sterilization and increasing inflation
rate.
Our finding of significant changes in the degree of sterilization by many emerging market
countries is consistent with a new Trilemma configuration, in which emerging market countries
engage in foreign reserve accumulation while at the same time seeking to preserve some degree
of monetary autonomy. Fuller investigation of the changing nature and degree of exchange rate
flexibility, financial integration, and monetary autonomy among emerging market countries is
left for further research.
18
References
Aizenman, Joshua and Reuven Glick, "Pegged Exchange Rate Regimes, A Trap?" Journal of
Money, Credit,and Banking 40 (2008): 817-835.
Aizenman, Joshua and Jae-woo Lee, “Financial versus Monetary Mercantilism – Long-run View
of Large International Reserves Hoarding,” World Economy 31 (2008): 593-611.
Aizenman Joshua and Nancy Marion, “International Reserves Holdings with Sovereign Risk and
Costly Tax Collection,” Economic Journal 114 (2004): 569-591.
______, “The High Demand for International Reserves in the Far East: What's Going On?”
Journal of the Japanese and International Economies (17) 2003: 370-400.
Cavoli, Tony and Ramkishen Rajan, “The Capital Inflows Problem in Selected Asian Economies
in the 1990s Revisited: The Role Of Monetary Sterilization,” National University Of
Singapore, Singapore Centre for Applied and Policy Economics, December, 2005.
Cheung, Yin-Wong and Hiro Ito, “Hoarding of International Reserves: A Comparison of the
Asian and Latin American Experiences,” in R.S. Rajan, S. Thangavelu and R.A.
Parinduri, eds., Monetary, Exchange Rate, and Financial Issues and Policies in Asia,
Singapore: World Scientific Press, forthcoming.
Cochrane, John , “Production-Based Asset Pricing and the Link Between Stock Returns and
Economic Fluctuation,” Journal of Finance 46 (1991): 209-237.
Edwards, Sebastian and Eduardo Levy-Yeyati, “Flexible Exchange Rates as Shock Absorbers,”
European Economic Review 49, (2005): 2079-2105
Eichengreen, Barry, “Kicking the Habit: Moving from Pegged Rates to Greater Exchange Rate
Flexibility,” Economic Journal 109 (1999): 1-14.
Fischer, Stanley, “Exchange Rate Regimes: Is the Bipolar View Correct?” The Journal of
Economic Perspectives 15 (2001): 3-24.
19
Frankel, Jeffrey, “No Single Currency Regime is Right for all Countries or at all Times,” NBER
Working Paper 7338, September, (1999).
Giovannini, Alberto and Martha De-Melo, “Government Revenue from Financial Repression,”
American Economic Review 83 (1993): 953-963.
Glick, Reuven and Michael M. Hutchison, “Foreign Reserve and Money Dynamics with Asset
Portfolio Adjustment: International Evidence,” Journal of International Financial
Markets, Institutions and Money 10 (2000), 229–247.
Levy-Yevati., Eduardo, “Liquidity Insurance in a Financially Dollarized Economy,” NBER
Working Paper 12345, 2000.
Mohanty, M.S. and Philip Turner, (2006) “Foreign Exchange Reserve Accumulation in
Emerging Markets: What are the Domestic Implications? BIS Quarterly Review,
September 2006.
Obstfeld, Maury and Kenneth Rogoff, “The Mirage of Fixed Exchange Rates,” Journal
of Economic Perspectives, 9 (1995): 73-96.
Obstfeld, Maury, Jay Shambaugh and Alan M. Taylor, ”The Trilemma in History: Tradeoffs
Among Exchange Rates, Monetary Policies, and Capital Mobility,“ Review of Economics
and Statistics 3 (2005): 423-438.
Ouyang, Alice, Ramkishen Rajan, and Thomas Willett, “China as a Reserve Sink: The Evidence
from Offset and Sterilization Coefficients,” Hong Kong Institute for Monetary Research
Working Paper 2007-10, October, 2007.
World Economic Outlook, “Managing Large Capital Inflows,” Chapter 3, International
Monetary Fund, October 2007.
20
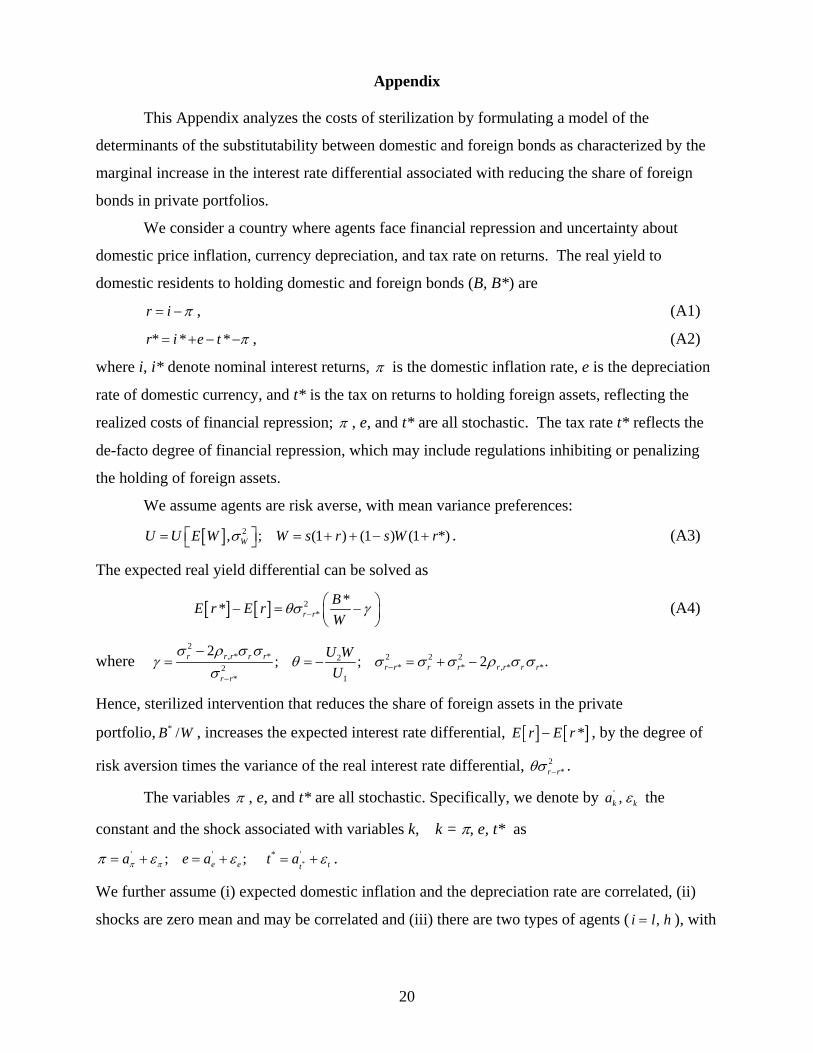
Appendix
This Appendix analyzes the costs of sterilization by formulating a model of the
determinants of the substitutability between domestic and foreign bonds as characterized by the
marginal increase in the interest rate differential associated with reducing the share of foreign
bonds in private portfolios.
We consider a country where agents face financial repression and uncertainty about
domestic price inflation, currency depreciation, and tax rate on returns. The real yield to
domestic residents to holding domestic and foreign bonds (B, B*) are
r i π= − , (A1)
* * *r i e t π= + − − , (A2)
where i, i* denote nominal interest returns, π is the domestic inflation rate, e is the depreciation
rate of domestic currency, and t* is the tax on returns to holding foreign assets, reflecting the
realized costs of financial repression; π , e, and t* are all stochastic. The tax rate t* reflects the
de-facto degree of financial repression, which may include regulations inhibiting or penalizing
the holding of foreign assets.
We assume agents are risk averse, with mean variance preferences:
[ ] 2, ; (1 ) (1 ) (1 *)WU U E W W s r s W rσ⎡ ⎤= = + + − +⎣ ⎦ . (A3)
The expected real yield differential can be solved as
[ ] [ ] 2*
** r rBE r E rW
θσ γ−⎛ ⎞− = −⎜ ⎟⎝ ⎠
(A4)
where 2
, * * 2 2 22* * , * *2
1*
2; ; 2 .r r r r r
r r r r r r r rr r
U WU
σ ρ σ σγ θ σ σ σ ρ σ σ
σ −−
−= = − = + −
Hence, sterilized intervention that reduces the share of foreign assets in the private
portfolio, * /B W , increases the expected interest rate differential, [ ] [ ]*E r E r− , by the degree of
risk aversion times the variance of the real interest rate differential, 2*r rθσ − .
The variables π , e, and t* are all stochastic. Specifically, we denote by ' ,k ka ε the
constant and the shock associated with variables k, k = π, e, t* as ' '; ;e ea e aπ ππ ε ε= + = + *
* 'tt
t a ε= + .
We further assume (i) expected domestic inflation and the depreciation rate are correlated, (ii)
shocks are zero mean and may be correlated and (iii) there are two types of agents ( ,i l h= ), with
21
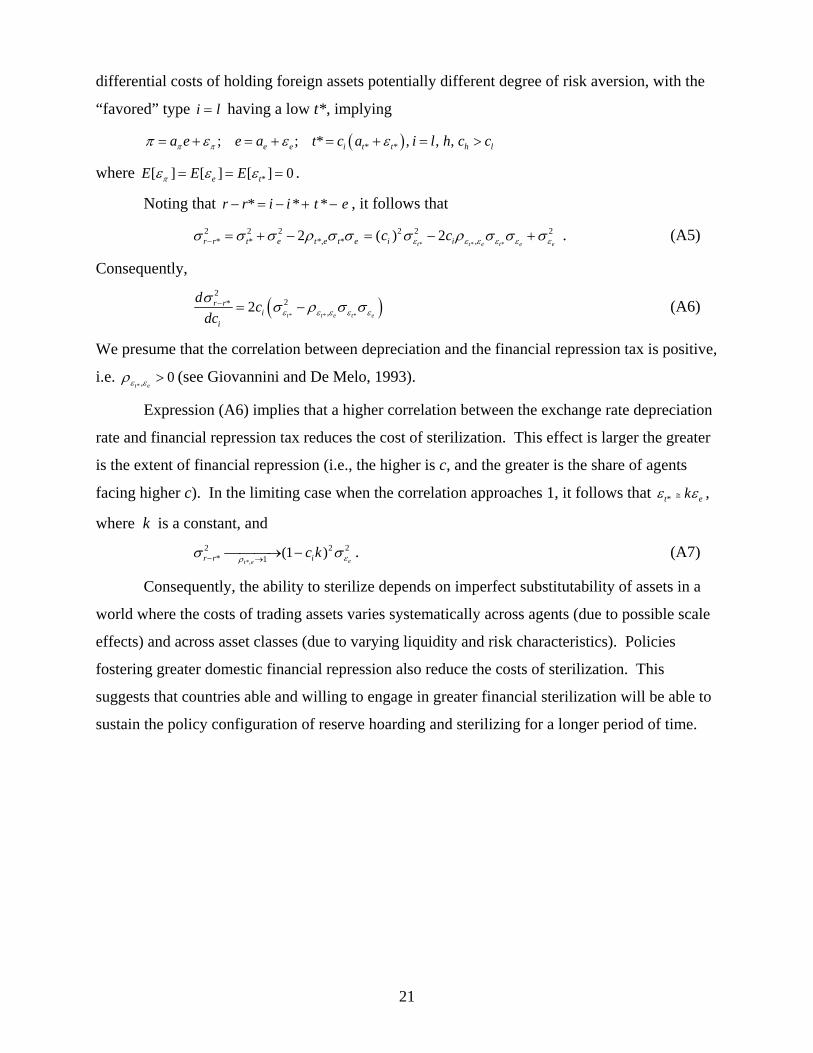
differential costs of holding foreign assets potentially different degree of risk aversion, with the
“favored” type i l= having a low t*, implying
( )* *; ; * , , ,e e i t t h la e e a t c a i l h c cπ ππ ε ε ε= + = + = + = >
where *[ ] [ ] [ ] 0e tE E Eπε ε ε= = = .
Noting that * * *r r i i t e− = − + − , it follows that
* * *
2 2 2 2 2 2* * *, * ,2 ( ) 2
t t e t e er r t e t e t e i ic cε ε ε ε ε εσ σ σ ρ σ σ σ ρ σ σ σ− = + − = − + . (A5)
Consequently,
( )* * *
22*
,2t t e t e
r ri
i
d cdc ε ε ε ε εσ
σ ρ σ σ− = − (A6)
We presume that the correlation between depreciation and the financial repression tax is positive,
i.e. * , 0
t eε ερ > (see Giovannini and De Melo, 1993).
Expression (A6) implies that a higher correlation between the exchange rate depreciation
rate and financial repression tax reduces the cost of sterilization. This effect is larger the greater
is the extent of financial repression (i.e., the higher is c, and the greater is the share of agents
facing higher c). In the limiting case when the correlation approaches 1, it follows that *t ekε ε≅ ,
where k is a constant, and
*,
2 2 2* 1 (1 )
et er r ic k ερσ σ− →⎯⎯⎯→ − . (A7)
Consequently, the ability to sterilize depends on imperfect substitutability of assets in a
world where the costs of trading assets varies systematically across agents (due to possible scale
effects) and across asset classes (due to varying liquidity and risk characteristics). Policies
fostering greater domestic financial repression also reduce the costs of sterilization. This
suggests that countries able and willing to engage in greater financial sterilization will be able to
sustain the policy configuration of reserve hoarding and sterilizing for a longer period of time.
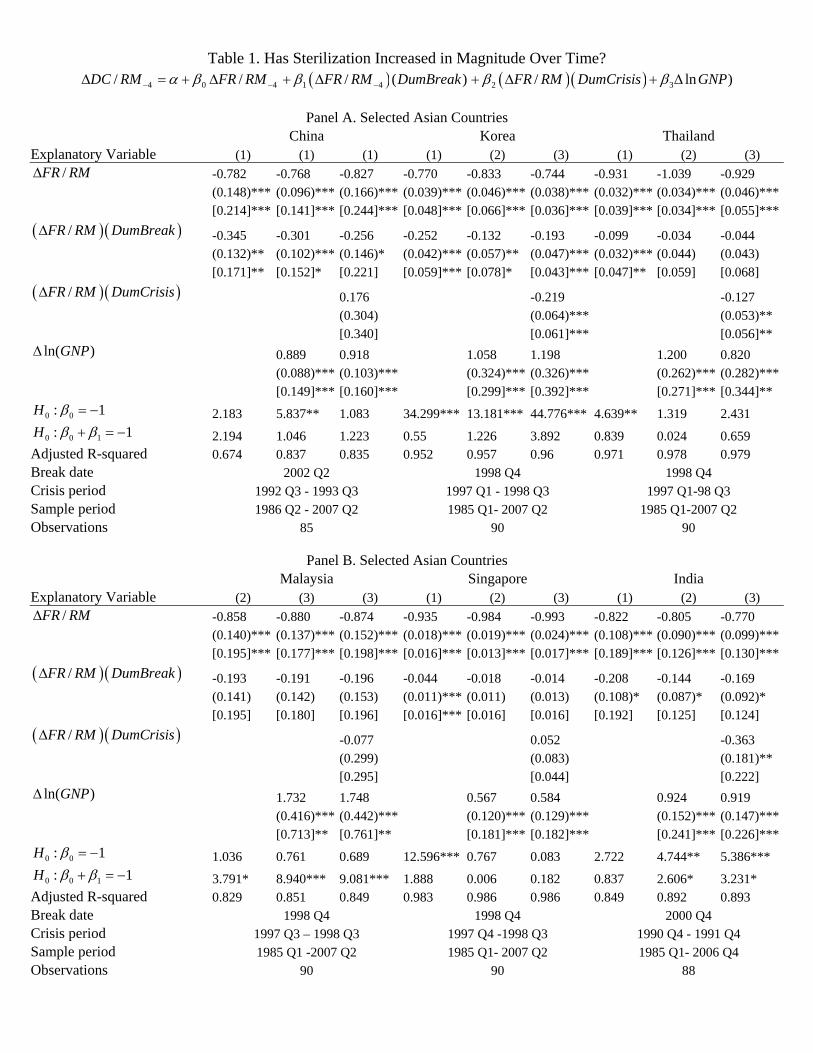
Table 1. Has Sterilization Increased in Magnitude Over Time? ( ) ( )( )4 0 4 1 4 2 3/ / / ( ) / ln )DC RM FR RM FR RM DumBreak FR RM DumCrisis GNPα β β β β− − −Δ = + Δ + Δ + Δ + Δ
Panel A. Selected Asian Countries
China Korea Thailand Explanatory Variable (1) (1) (1) (1) (2) (3) (1) (2) (3)
/FR RMΔ -0.782 -0.768 -0.827 -0.770 -0.833 -0.744 -0.931 -1.039 -0.929 (0.148)*** (0.096)*** (0.166)*** (0.039)*** (0.046)*** (0.038)*** (0.032)*** (0.034)*** (0.046)*** [0.214]*** [0.141]*** [0.244]*** [0.048]*** [0.066]*** [0.036]*** [0.039]*** [0.034]*** [0.055]***( )( )/FR RM DumBreakΔ -0.345 -0.301 -0.256 -0.252 -0.132 -0.193 -0.099 -0.034 -0.044 (0.132)** (0.102)*** (0.146)* (0.042)*** (0.057)** (0.047)*** (0.032)*** (0.044) (0.043) [0.171]** [0.152]* [0.221] [0.059]*** [0.078]* [0.043]*** [0.047]** [0.059] [0.068] ( )( )/FR RM DumCrisisΔ 0.176 -0.219 -0.127 (0.304) (0.064)*** (0.053)** [0.340] [0.061]*** [0.056]**
ln( )GNPΔ 0.889 0.918 1.058 1.198 1.200 0.820 (0.088)*** (0.103)*** (0.324)*** (0.326)*** (0.262)*** (0.282)*** [0.149]*** [0.160]*** [0.299]*** [0.392]*** [0.271]*** [0.344]**
0 0: 1H β = − 2.183 5.837** 1.083 34.299*** 13.181*** 44.776*** 4.639** 1.319 2.431
0 0 1: 1H β β+ = − 2.194 1.046 1.223 0.55 1.226 3.892 0.839 0.024 0.659 Adjusted R-squared 0.674 0.837 0.835 0.952 0.957 0.96 0.971 0.978 0.979 Break date 2002 Q2 1998 Q4 1998 Q4 Crisis period 1992 Q3 - 1993 Q3 1997 Q1 - 1998 Q3 1997 Q1-98 Q3 Sample period 1986 Q2 - 2007 Q2 1985 Q1- 2007 Q2 1985 Q1-2007 Q2 Observations 85 90 90
Panel B. Selected Asian Countries Malaysia Singapore India Explanatory Variable (2) (3) (3) (1) (2) (3) (1) (2) (3)
/FR RMΔ -0.858 -0.880 -0.874 -0.935 -0.984 -0.993 -0.822 -0.805 -0.770 (0.140)*** (0.137)*** (0.152)*** (0.018)*** (0.019)*** (0.024)*** (0.108)*** (0.090)*** (0.099)*** [0.195]*** [0.177]*** [0.198]*** [0.016]*** [0.013]*** [0.017]*** [0.189]*** [0.126]*** [0.130]***( )( )/FR RM DumBreakΔ -0.193 -0.191 -0.196 -0.044 -0.018 -0.014 -0.208 -0.144 -0.169 (0.141) (0.142) (0.153) (0.011)*** (0.011) (0.013) (0.108)* (0.087)* (0.092)* [0.195] [0.180] [0.196] [0.016]*** [0.016] [0.016] [0.192] [0.125] [0.124] ( )( )/FR RM DumCrisisΔ -0.077 0.052 -0.363 (0.299) (0.083) (0.181)** [0.295] [0.044] [0.222]
ln( )GNPΔ 1.732 1.748 0.567 0.584 0.924 0.919 (0.416)*** (0.442)*** (0.120)*** (0.129)*** (0.152)*** (0.147)*** [0.713]** [0.761]** [0.181]*** [0.182]*** [0.241]*** [0.226]***
0 0: 1H β = − 1.036 0.761 0.689 12.596*** 0.767 0.083 2.722 4.744** 5.386***
0 0 1: 1H β β+ = − 3.791* 8.940*** 9.081*** 1.888 0.006 0.182 0.837 2.606* 3.231* Adjusted R-squared 0.829 0.851 0.849 0.983 0.986 0.986 0.849 0.892 0.893 Break date 1998 Q4 1998 Q4 2000 Q4 Crisis period 1997 Q3 – 1998 Q3 1997 Q4 -1998 Q3 1990 Q4 - 1991 Q4 Sample period 1985 Q1 -2007 Q2 1985 Q1- 2007 Q2 1985 Q1- 2006 Q4 Observations 90 90 88
23
Table 1. Has Sterilization Increased in Magnitude Over Time? (cont’d)
Panel C. Selected Latin American Countries
Argentina Brazil Mexico Explanatory Variable (1) (2) (3) (1) (2) (3) (1) (2) (3)
/FR RMΔ -0.989 -1.006 -0.783 -0.861 -0.938 -0.569 -0.959 -0.975 -0.934 (0.033)*** (0.030)*** (0.089)*** (0.136)*** (0.135)*** (0.186)*** (0.027)*** (0.018)*** (0.036)*** [0.034]*** [0.020]*** [0.079]*** [0.185]*** [0.185]*** [0.244]** [0.030]*** [0.023]*** [0.042]***( )( )/FR RM DumBreakΔ -0.019 -0.257 -0.282 -0.419 -0.284 -0.539 -0.233 -0.077 -0.103 (0.102) (0.123)** (0.107)** (0.183)** (0.180) (0.217)** (0.056)*** (0.038)** (0.043)** [0.193] [0.182] [0.179] [0.218]* [0.241] [0.285]* [0.105]** [0.052] [0.060]* ( )( )/FR RM DumCrisisΔ -0.262 -0.828 -0.071 (0.102)** (0.246)*** (0.040)* [0.085]*** [0.297]*** [0.046]
ln( )GNPΔ 1.272 0.936 0.138 0.131 0.394 0.399 (0.352)*** (0.310)*** (0.021)*** (0.025)*** (0.057)*** (0.061)*** [0.428]*** [0.322]*** [0.024]*** [0.027]*** [0.068]*** [0.069]***
0 0: 1H β = − 0.103 0.047 5.756** 1.045 0.213 5.402** 2.36 1.826 3.45*
0 0 1: 1H β β+ = − 0.175 5.820** 0.653 4.957** 3.386 0.956 17.411*** 2.518 1.097 Adjusted R-squared 0.949 0.968 0.972 0.591 0.64 0.683 0.958 0.979 0.98 Break date 2004 Q3 2003 Q3 1996 Q4 Crisis period 2000 Q4 – 2003 Q1 1998 Q3 -1999 Q4 1994 Q2 - 1995 Q4 Sample period 1992 Q1 -2007 Q2 1995 Q2 - 2007 Q2 1985 Q1- 2007 Q2 Observations 62 49 90
Note: The table reports coefficients of regressing central bank net domestic credit on net foreign reserves, measured as 4-quarter changes, scaled by the lagged reserve money stock (RM). ln( )GNPΔ is the 4 quarter percent change in nominal GDP, DumBreak is a dummy variable denoting break point in sterilization behavior, and DumCrisis is a dummy variable denoting the most recent period of significant reserve outflows. Huber-White standard errors in parentheses; Newey-West standard errors adjusted for serial correlation up to eight quarters in square brackets. F statistic for null hypothesis tests. Significance at 1%, 5%, 10% indicated by ***, **, and *, respectively, using two-tailed test. Constant not reported.
24
Table 1. Has Sterilization Increased in Magnitude Over Time? (cont’d)
Panel C. Selected Latin American Countries Argentina Brazil Mexico Explanatory Variable (1) (2) (3) (1) (2) (3) (1) (2) (3)
/FR RMΔ -1.035 -1.004 -0.840 -1.004 -0.798 -0.471 -0.974 -0.983 -0.917 (0.041)*** (0.017)*** (0.053)*** (0.243)*** (0.226)*** (0.145)** (0.030)*** (0.023)*** (0.083)***( )( )/FR RM DumBreakΔ 0.020 -0.585††† -0.604††† -0.296 -0.681† -0.890†† -0.225†† -0.100 -0.146†† (0.164) (0.104)*** (0.113)*** (0.416) (0.445) (0.384)* (0.115)* (0.076) (0.083)*
Table 1b. Has Sterilization Increased in Magnitude Over Time? Nonoverlapping Data ( ) ( )( )4 0 4 1 4 2 3/ / / ( ) / ln )DC RM FR RM FR RM DumBreak FR RM DumCrisis GNPα β β β β− − −Δ = + Δ + Δ + Δ + Δ
Panel A. Selected Asian Countries
China Korea Thailand Explanatory Variable (1) (1) (1) (1) (2) (3) (1) (2) (3)
/FR RMΔ -0.911 -0.759 -0.716 -0.781 -0.795 -0.665 -0.910 -0.971 -0.867 (0.329)** (0.154)*** (0.368)* (0.103)*** (0.127)*** (0.113)*** (0.030)*** (0.038)*** (0.040)***( )( )/FR RM DumBreakΔ -0.248 -0.340†† -0.372† -0.259††† -0.238†† -0.312††† -0.132†† -0.066 -0.130†† (0.282) (0.149)** (0.271) (0.089)*** (0.135)* (0.113)** (0.060)** (0.073) (0.063)* ( )( )/FR RM DumCrisisΔ -0.113 -0.368 -0.130 (0.635) (0.129)** (0.042)***
ln( )GNPΔ 0.787 0.768 0.161 0.626 0.635 0.360 (0.172)*** (0.191)*** (0.718) (0.704) (0.341)* (0.298) Adjusted R-squared 0.685 0.826 0.815 0.959 0.957 0.962 0.985 0.987 0.989 Break date 2003 1999 1999 Crisis period 1993 1997 – 1998 1997 -1998 Sample period 1987 - 2007 1985 - 2007 1985 -2007 Observations 21 23 23
Panel B. Selected Asian Countries Malaysia Singapore India Explanatory Variable (2) (3) (3) (1) (2) (3) (1) (2) (3)
/FR RMΔ -1.050 -1.075 -1.102 -0.915 -0.935 -0.935 -0.661 -0.670 -0.589 (0.152)*** (0.157)*** (0.164)*** (0.026)*** (0.031)*** (0.038)*** (0.316)* (0.250)** (0.253)** ( )( )/FR RM DumBreakΔ -0.023 -0.038 -0.016 -0.051†† -0.042† -0.042† -0.353 -0.276 -0.334† (0.165) (0.180) (0.188) (0.024)** (0.025) (0.026) (0.308) (0.236) (0.235) ( )( )/FR RM DumCrisisΔ 0.355 0.010 -0.982 (0.258) (0.127) (0.445)**
ln( )GNPΔ 1.328 1.202 0.192 0.190 0.983 0.973 (0.618)** (0.667)* (0.184) (0.194) (0.415)** (0.398)** Adjusted R-squared 0.886 0.898 0.894 0.99 0.99 0.989 0.743 0.809 0.811 Break date 1999 1999 2001 Crisis period 1997 – 1998 1997 Q4 -1998 Q3 1990 Q4 - 1991 Q4 Sample period 1985 -2007 1985 - 2007 1985 - 2006 Observations 23 23 22
25
( )( )/FR RM DumCrisisΔ -0.196 -0.694 -0.089 (0.064)** (0.245)** (0.089)
ln( )GNPΔ 2.540 2.281 -5.058 -4.945 0.310 0.308 (0.252)*** (0.319)*** (1.539)** (1.423)** (0.099)*** (0.085)***Adjusted R-squared 0.957 0.99 0.991 0.594 0.717 0.731 0.976 0.986 0.987 Break date 2005 2004 1998 Crisis period 2001 – 2003 1999 1995 Sample period 1992 - 2007 1996 - 2007 1985 - 2007 Observations 16 12 23 Note: The table reports coefficients of regressing central bank net domestic credit on net foreign reserves, measured as nonoverlapping 4-quarter changes, scaled by the lagged reserve money stock (RM), measured from Q1 of each year.
ln( )GNPΔ is the 4 quarter percent change in nominal GDP, DumBreak is a dummy variable denoting break point in sterilization behavior, and DumCrisis is a dummy variable denoting the most recent period of significant reserve outflows. Huber-White standard errors in parentheses; Newey-West standard errors adjusted for serial correlation up to eight quarters in square brackets. F statistic for null hypothesis tests. Significance at 1%, 5%, 10% indicated by ***, **, and *, respectively, using two-tailed test, and by †††, ††, and †, respectively, using one-tailed test. Constant not reported.
26
Table 2. Does Sterilization Depend on Inflation?
( )4 0 4 1 4 2 3 4/ / / ( ) ln( ) ln( )( ) ln( )DC RM FR RM FR RM DumBreak INFL INFL DumBreak RGNPα β β β β β− − −Δ = + Δ + Δ + Δ + Δ + Δ
Panel A. Selected Asian Countries China Korea Thailand Explanatory Variable (1) (2) (3) (1) (2) (3) (1) (2) (3)
/FR RMΔ -0.786 -0.778 -0.778 -0.767 -0.758 -0.760 -0.925 -0.930 -0.936 (0.130)*** (0.122)*** (0.123)*** (0.035)*** (0.038)*** (0.039)*** (0.031)***(0.030)*** (0.029)*** [0.114]*** [0.116]*** [0.117]*** [0.038]*** [0.039]*** [0.040]*** [0.019]***[0.019]*** [0.019]***( )( )/FR RM DumBreakΔ -0.176 -0.191 -0.214 -0.216 -0.223 -0.215 -0.069 -0.066 -0.030 (0.126) (0.117) (0.123)* (0.045)*** (0.046)*** (0.052)*** (0.042) (0.042) (0.044) [0.115] [0.119] [0.143] [0.045]*** [0.046]*** [0.053]*** [0.038]* [0.038]* [0.038]
ln( )INFLΔ 0.816 0.795 0.791 1.79 1.631 1.644 1.051 1.145 1.176 (0.117)*** (0.108)*** (0.109)*** (0.705)** (0.717)** (0.711)** (0.644) (0.684)* (0.719) [0.107]*** [0.116]*** [0.118]*** [0.678]*** [0.698]** [0.703]** [0.454]** [0.465]** [0.446]***
( )ln( )INFL DumBreakΔ 0.350 -0.324 -1.687 (0.597) (1.057) (0.604)*** [1.150] [1.116] [0.577]***
ln( )RGNPΔ 0.180 0.181 -0.813 -0.741 -0.385 -0.240 (0.453) (0.455) (0.685) (0.711) (0.38) (0.389) [0.383] [0.385] [0.837] [0.878] [0.403] [0.389]
0 0: 1H β = − 2.710* 3.314* 3.274* 45.496*** 39.8*** 38.146*** 5.946** 5.345** 4.712**
0 0 1: 1H β β+ = − 0.264 0.188 0.009 0.241 0.295 0.433 0.019 0.011 0.898 Adjusted R-squared 0.804 0.802 0.799 0.955 0.955 0.954 0.972 0.972 0.975 Break date 2002 Q2 1998 Q4 1998 Q4 Sample period 1987 Q1 – 2007 Q2 1985 Q1 - 2007Q2 1985 Q1 - 2007Q2 Observations 82 90 90
Panel B. Other Selected Asian Countries Malaysia Singapore India Explanatory Variable (1) (2) (3) (1) (2) (3) (1) (2) (3)
/FR RMΔ -0.861 -0.930 -0.961 -0.959 -0.977 -0.978 -0.816 -0.751 -0.733 (0.135)*** (0.141)*** (0.137)*** (0.019)*** (0.020)*** (0.018)*** (0.102)***(0.086)*** (0.087)*** [0.082]*** [0.084]*** [0.080]*** [0.018]*** [0.019]*** [0.020]*** [0.080]***[0.071]*** [0.071]***( )( )/FR RM DumBreakΔ -0.183 -0.082 0.039 -0.025 -0.022 -0.021 -0.152 -0.200 -0.314 (0.134) (0.147) (0.138) (0.014)* (0.013)* (0.019) (0.098) (0.081)** (0.098)*** [0.091]** [0.097] [0.099] [0.019] [0.018] [0.023] [0.088]* [0.078]** [0.101]***
ln( )INFLΔ 2.719 4.623 5.152 1.274 0.534 0.562 0.462 0.422 0.486 (2.438) (1.795)** (1.690)*** (0.620)** (0.673) (0.497) (0.214)** (0.169)** (0.171)*** [1.875] [1.975]** [1.875]*** [0.606]** [0.640] [0.739] [0.220]** [0.194]** [0.195]**
( )ln( )INFL DumBreakΔ -7.55 -0.104 0.854 (2.551)*** (1.995) (0.445)* [2.280]*** [1.313] [0.492]*
ln( )RGNPΔ 2.395 1.783 0.691 0.688 0.596 0.629 (1.029)** (1.168) (0.225)*** (0.229)*** (0.098)*** (0.108)*** [0.961]** [0.928]* [0.246]*** [0.250]*** [0.119]*** [0.119]***
0 0: 1H β = − 1.049 0.244 0.083 4.518** 1.281 1.476 3.266 8.403*** 9.423***

27
0 0 1: 1H β β+ = − 3.406* 0.175 5.859** 1.256 0.001 0.003 0.545 1.397 0.696 Adjusted R-squared 0.831 0.840 0.857 0.984 0.985 0.985 0.855 0.888 0.890 Break date 1998 Q4 1998 Q4 2000 Q4 Sample period 1985 Q1 - 2007Q2 1985 Q1 – 2007 Q2 1985 Q1 – 2006 Q4 Observations 90 90 88
Panel C. Selected Latin American Countries Argentina Brazil Mexico Explanatory Variable (1) (2) (3) (1) (2) (3) (1) (2) (3)
/FR RMΔ -0.956 -1.032 -1.04 -0.932 -0.69 -0.736 -0.975 -0.975 -0.976 (0.040)*** (0.054)*** (0.055)*** (0.164)*** (0.165)*** (0.171)*** (0.019)*** (0.019)*** (0.019)*** [0.026]*** [0.042]*** [0.041]*** [0.167]*** [0.167]*** [0.164]*** [0.017]*** [0.017]*** [0.016]***( )( )/FR RM DumBreakΔ -0.145 -0.262 0.837 -0.285 -0.130 0.044 -0.067 -0.059 -0.174 (0.097) (0.113)** (0.345)** (0.246) (0.216) (0.227) (0.040)* (0.050) (0.063)*** [0.125] [0.131]* [0.679] [0.281] [0.258] [0.268] [0.048] [0.050] [0.064]***
ln( )INFLΔ 1.713 1.377 1.352 0.603 1.077 1.017 0.561 0.566 0.582 (0.275)*** (0.334)*** (0.338)*** (0.875) (0.904) -0.838) (0.079)*** (0.081)*** (0.081)*** [0.329]*** [0.350]*** [0.345]*** [0.524] [0.494]** [0.481]** [0.055]*** [0.056]*** [0.054]***
( )ln( )INFL DumBreakΔ -7.488 -2.448 0.862 (2.415)*** (0.937)** (0.399)** [4.540] [1.309]* [0.313]***
ln( )RGNPΔ 2.184 2.434 -13.796 -11.265 0.208 0.456 (1.031)** (1.052)** (3.838)*** (4.258)** (0.488) (0.448) [0.958]** [0.956]** [4.124]*** [4.233]** [0.368] [0.365]
0 0: 1H β = − 1.201 0.343 0.534 0.172 3.525 2.398 1.677 1.785 1.594
0 0 1: 1H β β+ = − 1.366 5.071** 5.570** 2.152 1.857 4.740* 1.471 0.567 6.293** Adjusted R-squared 0.965 0.967 0.968 0.593 0.669 0.686 0.981 0.980 0.982 Breakdate 2004 Q3 2003 Q3 1996 Q4 Sample period 1992 Q1 – 2007 Q2 1995 Q2 – 2007 Q2 1985 Q1 – 2007 Q2 Observations 62 49 90
Note: The table reports coefficients of regressing central bank net domestic credit on foreign reserves, measured as 4 quarter changes, scaled by lagged reserve money stock (RM). ln( )INFLΔ is the 4 quarter percent change in the CPI,
ln( )RGNPΔ is the 4 quarter change in real GDP, and DumBreak is a dummy variable denoting break point in sterilization behavior. Constant not reported. Huber-White standard errors in parentheses; Newey-West standard errors adjusted for serial correlation up to eight quarters in square brackets. Significance at 1%, 5%, 10% indicated by ***, **, and *, respectively.
28
Table 3. Balance of Payments Inflows to Emerging Markets, Annual Averages, in billions U.S.$
Current Account
Balance Net Foreign
Direct Investment Net non-Foreign
Direct Investment Reserve Inflows
1985-
89 1990-
93 1995-
96 2000 -06
1985-89
1990-93
1995-96
2000-06
1985-89
1990-93
1995-96
2000 -06
1985-89
1990-93
1995-96
2000-06
Asia 7 -3 -26 206 5 18 49 81 9 20 53 -34 18 28 49 250 China -5 5 4 100 2 9 36 58 5 0 3 -8 1 6 27 152 India -6 -4 -6 -1 0 0 2 5 5 5 6 14 -1 2 0 20 Korea 7 -3 -16 14 0 0 -2 1 -4 5 23 10 3 1 4 25 Taiwan 13 10 8 24 -2 -2 -2 -4 0 -5 -7 2 11 2 -1 24 Other Asia -2 -10 -17 69 4 11 15 20 2 16 28 -52 5 17 19 29 Latin America -7 -21 -34 6 5 9 31 51 -19 25 22 -29 -1 18 24 20 Argentina -2 -2 -6 4 1 2 5 4 -2 3 4 -11 0 3 2 1 Brazil 0 0 -21 -2 1 1 8 15 -11 0 24 -3 0 6 11 8 Mexico -1 -18 -2 -12 2 4 9 20 -3 20 -8 1 0 5 6 6 Other LA -3 -1 -5 16 1 2 9 11 -3 2 2 -15 -1 5 5 6 Central Europe -2 -3 -6 -20 0 2 10 19 -4 -2 7 7 0 3 11 6 Russia 9 64 2 1 -14 -5 4 46 Middle East -5 -22 5 86 -1 1 -2 -1 3 26 4 -61 -3 -2 5 13
Total -6 -48 -52 342 9 30 90 151 -11 70 71 -122 14 47 92 335
Notes: Net non-foreign direct investment inflows include portfolio and other capital flows in the financial account. Other Asia includes Hong Kong, Indonesia, Malaysia, the Philippines, Singapore, and Thailand. Other Latin America includes Chile, Colombia, Peru, and Venezuela. Central Europe includes Czech Republic, Hungary, and Poland. Middle East includes Kuwait, Libya, Oman, Qatar, and Saudi Arabia.. Blank cells indicate values less than $500 million. Source: IMF Balance of Payments Statistics.
29
Table 4. Does Sterilization Depend on the Composition of Balance of Payments Inflows?
( )( ) ( )( ) ( )( )
4 4 44 0 4 1 4 2 4 31 1 1
4 4 4' ' '0 4 1 4 2 41 1 1
/ / / / ln( )
/ / /
k k kk k k
k k kk k k
DC RM CA RM NFDI RM non NFDI RM GNP
CA RM Dum Break NFDI RM DumBreak non NFDI RM DumBreak
α β β β β
β β β
− − − − − − −= = =
− − − − − −= = =
Δ = + + + − + Δ
+ + + −
∑ ∑ ∑∑ ∑ ∑
Panel A. Selected Asian Countries
China Korea Thailand Explanatory Variable (1) (2) (3) (1) (2) (3) (1) (2) (3)
/kCA RM−∑ -1.728 -1.416 -0.798 -0.881 -0.867 -0.887 -1.482 -1.434 -1.011 (0.160)*** (0.106)*** (0.194)*** (0.058)*** (0.067)*** (0.112)*** (0.186)***(0.204)*** (0.309)*** [0.312]*** [0.174]*** [0.274]*** [0.063]*** [0.083]*** [0.122]*** [0.328]***[0.344]*** [0.525]*
/kNFDI RM−∑ -0.173 -1.098 -0.924 -0.806 -0.759 -1.052 -0.963 -0.938 -0.744 (0.207) (0.251)*** (0.246)*** (0.326)** (0.333)** (0.561)* (0.221)***(0.216)*** (0.266)*** [0.424] [0.512]** [0.415]** [0.409]* [0.411]* [0.715] [0.376]** [0.349]*** [0.458]
/knon NFDI RM−−∑ -0.572 -1.606 -0.931 -1.052 -1.037 -1.087 -1.260 -1.188 -0.937 (0.228)** (0.207)*** (0.321)*** (0.074)*** (0.088)*** (0.144)*** (0.121)***(0.150)*** (0.220)*** [0.464] [0.350]*** [0.598] [0.112]*** [0.139]*** [0.214]*** [0.200]***[0.225]*** [0.346]***
ln( )GNPΔ 1.241 1.121 0.510 0.693 -0.860 -2.340 (0.155)*** (0.184)*** (0.607) (0.617) (0.683) (0.998)** [0.272]*** [0.290]*** [0.868] [0.888] [1.050] [1.585]
( )( )/kCA RM DumBreak−∑ -0.438 0.004 -1.216 (0.239)* (0.106) (0.472)** [0.276] [0.112] [0.764]
( )( )/kFDI RM DumBreak−∑ -0.859 0.335 -0.359 (0.319)*** (0.734) (0.269) [0.324]*** [0.916] [0.435]
( )( )/knon FDI RM DumBreak−−∑ -0.329 0.185 -0.655 (0.487) (0.162) (0.302)** [0.611] [0.232] [0.445]
0 1 0:H β β< 28.538*** 1.129 > 0.043 0.087 > 2.918** 2.614* 1.035 ' '
0 1 1 0 0:H β β β β+ < + > 0.134 10.471***
0 1 2:H β β< 2.097* 5.372** 0.001 0.459 0.562 0.004 1.577 1.001 0.835 ' '
0 1 1 2 2:H β β β β+ < + > 0.001 3.445** Adjusted R-squared 0.558 0.742 0.787 0.837 0.837 0.835 0.743 0.743 0.773 Break date 2002 Q2 1998 Q4 1998 Q4 Sample period 1986 Q2 – 2006 Q2 1985 Q1 - 2007 Q2 1985 Q1– 2007 Q1 Observations 81 90 89
30
Table 4. Does Sterilization Depend on the Composition of Balance of Payments Inflows? (cont’d)
Panel B. Other Selected Asian Countries
Malaysia Singapore India Explanatory Variable (1) (2) (3) (1) (2) (3) (1) (2) (3)
/kCA RM−∑ -0.968 -0.973 -1.060 -1.120 -0.872 -0.807 -1.152 -1.109 -0.799 (0.065)*** (0.077)*** (0.350)*** (0.184)*** (0.191)*** (0.342)** (0.056)***(0.058)*** (0.114)*** [0.106]*** [0.132]*** [0.455]** [0.232]*** [0.245]*** [0.418]* [0.080]***[0.084]*** [0.107]***
/kNFDI RM−∑ -0.227 -0.268 -0.131 -0.882 -0.510 -0.985 -1.531 -1.332 -1.856 (0.268) (0.352) (0.444) (0.174)*** (0.186)*** (0.354)*** (0.226)***(0.241)*** (0.260)*** [0.435] [0.638] [0.787] [0.136]*** [0.148]*** [0.307]*** [0.267]***[0.275]*** [0.294]***
/knon NFDI RM−−∑ -1.139 -1.137 -1.092 -0.837 -0.532 -0.897 -0.721 -0.796 -0.742 (0.071)*** (0.073)*** (0.467)** (0.153)*** (0.184)*** (0.339)** (0.100)***(0.096)*** (0.152)*** [0.078]*** [0.079]*** [0.512]** [0.128]*** [0.184]*** [0.256]*** [0.119]***[0.108]*** [0.199]***
ln( )GNPΔ 0.183 0.020 -3.585 -3.598 0.420 0.458 (0.683) (0.998)** (1.463)** (1.769)** (0.125)*** (0.129)*** [1.234] [1.605] [1.778]* [2.452] [0.150]*** [0.157]***
( )( )/kCA RM DumBreak−∑ 0.260 0.031 -0.581 (0.388) (0.296) (0.161)*** [0.442] [0.170] [0.151]***
( )( )/kFDI RM DumBreak−∑ -1.461 0.568 0.787 (0.546)*** (0.389) (0.384)** [0.818]* [0.223]** [0.284]***
( )( )/knon FDI RM DumBreak−−∑ -0.118 0.421 -0.340 (0.497) (0.361) (0.141)** [0.547] [0.138]*** [0.121]***
0 1 0:H β β< 10.355*** 5.819*** 3.134** > 2.698* > > > > ' '
0 1 1 0 0:H β β β β+ < + 2.839** 1.891* 0.413
0 1 2:H β β< 10.929*** 5.659*** 1.705* 0.105 0.030 > > > > ' '
0 1 1 2 2:H β β β β+ < + 0.691 0.112 0.001 Adjusted R-squared 0.627 0.623 0.635 0.508 0.528 0.548 0.892 0.897 0.912 Break date 1998 Q4 1998 Q4 2000 Q4 Sample period 1985 Q1 – 2006 Q4 1995 Q4 – 2006 Q4 1985 Q1 – 2006 Q4 Observations 88 45 88
31
Table 4. Does Sterilization Depend on the Composition of Balance of Payments Inflows? (cont’d)
Panel C. Selected Latin American Countries Argentina Brazil Mexico C. Explanatory Variable (1) (2) (3) (1) (2) (3) (1) (2) (3)
/kCA RM−∑ -1.590 -1.431 -1.765 -1.435 -1.386 -2.292 -0.928 -0.963 -0.858 (0.421)*** (0.452)*** (0.766)** (0.165)*** (0.214)*** (0.439)*** (0.176)*** (0.171)*** (0.275)*** [0.678]** [0.718]* [1.254] [0.140]*** [0.206]*** [0.595]*** [0.196]*** [0.192]*** [0.245]***
/kNFDI RM−∑ -1.565 -1.567 -1.779 -0.375 -0.270 -0.626 -0.885 -0.791 -0.430 (0.393)*** (0.396)*** (0.502)*** (0.395) (0.501) (0.587) (0.168)*** (0.183)*** (0.515) [0.560]*** [0.561]*** [0.719]** [0.322] [0.466] [0.702] [0.188]*** [0.210]*** [0.351]
4
1/kk
non NFDI RM−=−∑ -1.319 -1.265 -1.448 -0.887 -0.867 -1.133 -0.800 -0.786 -0.768
(0.287)*** (0.292)*** (0.426)*** (0.138)*** (0.154)*** (0.172)*** (0.115)*** (0.116)*** (0.153)*** [0.453]*** [0.463]*** [0.688]** [0.131]*** [0.134]*** [0.192]*** [0.107]*** [0.107]*** [0.123]***
ln( )GNPΔ -0.938 -0.747 0.021 -0.030 0.255 0.057 (0.564) (0.490) (0.036) (0.043) (0.204) (0.269) [0.549]* [0.538] [0.039] [0.053] [0.244] [0.292]
( )( )/kCA RM DumBreak−∑ 2.070 3.110 0.083 (1.160)* (0.648)*** (0.321) [1.717] [0.960]*** [0.322]
( )( )/kFDI RM DumBreak−∑ -1.936 -0.280 -0.406 (1.405) (0.693) (0.544) [1.428] [0.759] [0.424]
( )( )/k DumBreaknon FDI RM−−∑ 0.937 0.494 0.230 (0.480)* (0.315) (0.173) [0.673] [0.300] [0.125]*
0 1 0:H β β< > > > 11.547*** 9.627*** 27.678*** 0.098 1.445 1.572 ' '
0 1 1 0 0:H β β β β+ < + > > >
0 1 2:H β β< > > > 2.078* 1.905* 1.123 > > 0.608 ' '
0 1 1 2 2:H β β β β+ < + > > > Adjusted R-squared 0.508 0.508 0.53 0.67 0.663 0.724 0.685 0.687 0.699 Break date 2004 Q3 2003 Q3 1996 Q4 Sample period 1992 Q1 - 2007 Q1 1995 Q2 – 2006 Q4 1985 Q1 – 2007 Q2 Observations 61 47 90
Note: The table reports coefficients of regressing central bank net domestic credit on 4-quarter cumulative current account surplus (CA), net foreign direct investment inflows (NFDI), and non-NFDI capital inflows (non-NFDI) expressed in local currency terms, all scaled by the lagged reserve money stock (RM). ln( )GNPΔ is the 4 quarter percent change in nominal GDP, and DumBreak is a dummy variable denoting break point in sterilization behavior. Huber-White standard errors in parentheses; Newey-West standard errors adjusted for serial correlation up to eight quarters in square brackets. F statistic for null inequality hypotheses, with one-tail significance test results; results not reported when (the absolute value of the) coefficient on FDI inflows exceeds that on current account surplus or non-FDI inflows, as indicated by “>”. Constant not reported. Significance at 1%, 5%, 10% indicated by ***, **, and *, respectively.
32
Figure 1a: The Trilemma Framework
Monetary Independence
Exchange Rate Stability
Financial Integration
Floating Exchange Rate
Monetary Union or Currency Board
Closed Financial Marketsand Pegged Exchange Rate
Figure 1b: Unstable Trilemma Configurations
Monetary Independence
Exchange Rate Stability
Financial Integration
Floating Exchange Rate
Monetary Union or Currency Board
Closed Financial Marketsand Pegged Exchange Rate
Crisis
ArgentinaArgentina
MexicoMexicoKoreaKorea
Managed Floating, Reserve Hoarding, and Sterilization
Note: Argentina, Korea, and Mexico (and other countries) experienced financial crises in the 1990s as they became more integrated with global financial markets and converged to policy configurations involving greater exchange rate flexibility, reserve hoarding, and sterilization in the aftermath of their respective crises.
33
Figure 2. Net Foreign Reserve and Net Domestic Credit Changes of Central Bank, (4 quarter changes relative to stock of reserve money lagged 4Q, in percent)
Panel A. Selected Asian Countries
CHINA
-0.8
-0.6
-0.4
-0.2
0
0.2
0.4
0.6
0.8
1985 1987 1989 1991 1993 1995 1997 1999 2001 2003 2005 2007
∆FR/RM ∆DC/RM
KOREA
-2
-1.6
-1.2
-0.8
-0.4
0
0.4
0.8
1.2
1.6
2
1985 1987 1989 1991 1993 1995 1997 1999 2001 2003 2005 2007
∆FR/RM ∆DC/RM
THAILAND
-2
-1.6
-1.2
-0.8
-0.4
0
0.4
0.8
1.2
1.6
2
1985 1987 1989 1991 1993 1995 1997 1999 2001 2003 2005 2007
∆FR/RM ∆DC/RM

34
Figure 2. Net Foreign Reserves and Net Domestic Credit Changes of Central Bank, (4 quarter changes relative to stock of reserve money lagged 4Q, in percent)
Panel B: Other Selected Asian Countries
MALAYSIA
-2
-1.6
-1.2
-0.8
-0.4
0
0.4
0.8
1.2
1.6
2
1985 1987 1989 1991 1993 1995 1997 1999 2001 2003 2005 2007
∆FR/RM ∆DC/RM
SINGAPORE
-2
-1.6
-1.2
-0.8
-0.4
0
0.4
0.8
1.2
1.6
2
1985 1987 1989 1991 1993 1995 1997 1999 2001 2003 2005 2007
∆FR/RM ∆DC/RM
INDIA
-0.8
-0.6
-0.4
-0.2
0
0.2
0.4
0.6
0.8
1985 1987 1989 1991 1993 1995 1997 1999 2001 2003 2005 2007
∆FR/RM ∆DC/RM
Note: positive values correspond to foreign reserve inflows or domestic credit increases.
35
Figure 2. Net Foreign Reserves and Net Domestic Credit Changes of Central Bank (4 quarter changes relative to stock of reserve money lagged 4Q, in percent)
Panel C: Selected Latin American Countries
ARGENTINA
-5
-4
-3
-2
-1
0
1
2
3
4
5
1985 1987 1989 1991 1993 1995 1997 1999 2001 2003 2005 2007
∆FR/RM ∆DC/RM
BRAZIL
-2
-1.6
-1.2
-0.8
-0.4
0
0.4
0.8
1.2
1.6
2
1985 1987 1989 1991 1993 1995 1997 1999 2001 2003 2005 2007
∆FR/RM ∆DC/RM
MEXICO
-5
-4
-3
-2
-1
0
1
2
3
4
5
1985 1987 1989 1991 1993 1995 1997 1999 2001 2003 2005 2007
∆FR/RM ∆DC/RM
Note: positive values correspond to foreign reserve inflows or domestic asset increases.
36
Figures 3. Sterilization Coefficients from 40-quarter Rolling Regressions
Panel A: Selected Asian Countries
CHINA
-1.6
-1.4
-1.2
-1
-0.8
-0.6
-0.4
-0.2
0
1994 1996 1998 2000 2002 2004 2006
KOREA
-1.6
-1.4
-1.2
-1
-0.8
-0.6
-0.4
-0.2
0
1994 1996 1998 2000 2002 2004 2006 THAILAND
-1.6
-1.4
-1.2
-1
-0.8
-0.6
-0.4
-0.2
0
1994 1996 1998 2000 2002 2004 2006
37
Figures 3. Sterilization Coefficients from 40-quarter Rolling Regressions
Panel B: Other Selected Asian Countries
MALAYSIA
-1.6
-1.4
-1.2
-1
-0.8
-0.6
-0.4
-0.2
0
1994 1996 1998 2000 2002 2004 2006
SINGAPORE
-1.6
-1.4
-1.2
-1
-0.8
-0.6
-0.4
-0.2
0
1994 1996 1998 2000 2002 2004 2006 INDIA
-1.6
-1.4
-1.2
-1
-0.8
-0.6
-0.4
-0.2
0
1994 1996 1998 2000 2002 2004 2006
38
Figures 3. Sterilization Coefficients from 40-quarter Rolling Regressions
Panel C: Selected Latin American Countries
ARGENTINA
-1.6
-1.4
-1.2
-1
-0.8
-0.6
-0.4
-0.2
0
1994 1996 1998 2000 2002 2004 2006 BRAZIL
-1.6
-1.4
-1.2
-1
-0.8
-0.6
-0.4
-0.2
0
1994 1996 1998 2000 2002 2004 2006 MEXICO
-1.6
-1.4
-1.2
-1
-0.8
-0.6
-0.4
-0.2
0
1994 1996 1998 2000 2002 2004 2006 Note: Plots report coefficient estimates from regression of change in central bank domestic credit on change in foreign reserves (defined as 4 quarter changes relative to stock of reserve money lagged 4 quarters) and nominal GDP growth (with one standard error bands). Coefficient observations correspond to calendar date of 40th quarter of rolling sample period.
39
Figure 4. Coefficient of Variation of Sterilization Coefficients
0
0.1
0.2
0.3
0.4
1996q1 1997q1 1998q1 1999q1 2000q1 2001q1 2002q1 2003q1 2004q1 2005q1 2006q1 2007q1
Asia & LA Asia LA
Note: Calculations based on coefficient estimates from regression of central bank net domestic credit on foreign reserve change and nominal GDP growth for countries in Asia (China, Indonesia, Korea, Malaysia, Pakistan, the Philippines, Singapore, Thailand) and Latin America (Argentina, Brazil, Chile, Colombia, Mexico, Peru). Coefficient observations correspond to calendar date of 40th quarter of rolling sample period.
40
Figure 5a. China Central Bank and and U.S. Treasury 1-Year Interest Rates (in percent)
0
1
2
3
4
5
6
Aug-02
Dec-02
Apr-03
Aug-03
Dec-03
Apr-04
Aug-04
Dec-04
Apr-05
Aug-05
Dec-05
Apr-06
Aug-06
Dec-06
Apr-07
Aug-07
Dec-07
China - 1 Year US - 1 Year
Figure 5b. Bond Spreads over U.S. Treasury 1-Year Interest Rates (in percent)
-3
-2
-1
0
1
2
3
Jun-04 May-07
China Korea Malaysia Thailand Singapore
41
Appendix Figures. Sterilization Coefficients from Alternative Rolling Regressions
Panel A: Selected Asian Countries
CHINA
-1.6
-1.4
-1.2
-1
-0.8
-0.6
-0.4
-0.2
0
1994 1996 1998 2000 2002 2004 2006
KOREA
-1.6
-1.4
-1.2
-1
-0.8
-0.6
-0.4
-0.2
0
1994 1996 1998 2000 2002 2004 2006 THAILAND
-1.6
-1.4
-1.2
-1
-0.8
-0.6
-0.4
-0.2
0
1994 1996 1998 2000 2002 2004 2006
42
Appendix Figures. Sterilization Coefficients from Alternative Rolling Regressions
Panel B: Other Selected Asian Countries
MALAYSIA
-1.6
-1.4
-1.2
-1
-0.8
-0.6
-0.4
-0.2
0
1994 1996 1998 2000 2002 2004 2006
SINGAPORE
-1.6
-1.4
-1.2
-1
-0.8
-0.6
-0.4
-0.2
0
1994 1996 1998 2000 2002 2004 2006 INDIA
-1.6
-1.4
-1.2
-1
-0.8
-0.6
-0.4
-0.2
0
1994 1996 1998 2000 2002 2004 2006
43
Appendix Figures. Sterilization Coefficients from Alternative Rolling Regressions
Panel C. Selected Latin American Countries ARGENTINA
-1.6
-1.4
-1.2
-1
-0.8
-0.6
-0.4
-0.2
0
1994 1996 1998 2000 2002 2004 2006
BRAZIL
-1.6
-1.4
-1.2
-1
-0.8
-0.6
-0.4
-0.2
0
1994 1996 1998 2000 2002 2004 2006 MEXICO
-1.6
-1.4
-1.2
-1
-0.8
-0.6
-0.4
-0.2
0
1994 1996 1998 2000 2002 2004 2006
Note: Coefficient estimates from regression of the change in central bank domestic credit assets on the change in net foreign reserves (scaled by lagged reserve money) and nominal GDP growth. Solid line corresponds to regressions using (nonoverlapping) quarterly observations of 1 quarter changes with lagged dependent variable and quarterly dummies as explanatory variables. Dots correspond to regressions using (nonoverlapping) yearly observations of 4 quarter changes (from Q2 of each year). Coefficient observations correspond to calendar date of 40th quarter or 10th year of rolling sample period.
44
1 This message has been communicated in well-known papers by Obstfeld and Rogoff (1995) and
Fischer (2001). Related papers have raised the possibility that a pegged exchange rate can create
a “trap” in an era of greater financial integration, whereby the regime initially confers gains in
anti-inflation credibility, but ultimately results in an exit from the peg occasioned by a big
enough adverse real shock that creates large welfare losses to the economy (see Eichengreen,
2001; Frankel, 1999; Edwards and Levy-Yeyati, 2005; Aizenman and Glick, 2008). 2 The list of countries with similar experiences is much longer (e.g., Russia, Brazil, and others).
Our reference here to Mexico and East Asia is mostly due to the timing of their crises, each
being the first in its respective region to experience a “sudden stop” episode, triggered by the
sharp reversal of short-term financial flows (“hot money”). 3 Note that exchange rate stability may remain a desirable policy goal. A heavily managed float
allows countries to stabilize their exchange rate, while retaining the option of exchange rate
adjustment in the presence of large shocks without undergoing a balance of payment crisis.
Similarly, countries may opt for a stable exchange rate, though at the cost of less monetary
independence (see the experiences of Estonia, Hong Kong, and other countries). Hence, in line
with the Trilemma, the trend towards greater financial integration by developing countries
implies that countries must trade off the benefits of financial integration against the costs of
reduced monetary autonomy and/or more flexible exchange rates. 4 For these reasons, even countries that maintained fixed exchange rates, such as China until
mid-2005, opted to support their pegs by accumulating sizable amounts of foreign reserves. 5 Monetary authorities also may seek to sterilize the effects of reserve inflows, not just on the
reserve money base, but also on the broader money supply by, for example, increasing
compulsory reserve requirements on bank deposits. China, for example, has raised reserve
requirements significantly in recent years. 6 Using four-quarter changes helps to smooth the data by eliminating much of the quarter to
quarter noise. 7 Specifically, we define ( ) ( )/ $ -1 1( ) $ - $ - - t LC t t t t tFR S FR FR FL FL −Δ = , where $FR denotes foreign
reserves in dollars (IMF line 1l.d), / $LCS is the local currency price of the dollar , FL denotes
financial liabilities of the central bank (IMF line 16c), , and " Δ " is the change operator.
Accordingly, we define DC RM FRΔ = Δ − Δ . 8 The exception is the period 1993 when China sterilized the effects of foreign reserve outflows
by expanding the reserve money stock by increasing domestic asset holdings.
45
9 The sample period for Argentina and Brazil begins 4 quarters after the implementation of their
monetary reforms – 1992 Q1 for Argentina and 1995 Q2 for Brazil. 10 We imputed quarterly GDP growth for some countries in our sample from a moving average
of the prior year, current, and following year observations. 11 We begin with the sample period 1984 Q2 to 1994 Q1, roll to 1984 Q3 – 1994 Q2, etc., ending
with 1997 Q3 - 2007 Q2, depending on data availability. 12 Note that the sterilization coefficient is only one parameter determining the stance of monetary
policy. Fuller understanding of monetary policy requires information about changes in private
and public banks’ reserve requirements, discount window operations, etc. 13 The figures report one standard error bands, using Newey-West errors adjusted for serial
correlation of up to 3 quarters. Regression results for the full sample and tests of the null
hypotheses that the sterilization coefficient differs from 0 or -1 are presented in tables below. 14 Central bank balance sheet data for China is available only from 1985 Q3, implying that the
first 4-quarter change observation begins in 1986 Q2, and the first 40-quarter rolling sample
period is 1986 Q2 – 1996 Q1. 15 China’s sovereign wealth fund, the China Investment Corporation, was not formally
established until the latter half of 2007 with an initial capitalization of $200 billion out of
China’s total reserve holdings of more than $1.3 trillion. But there are indications of central bank
asset shifts to its predecessor institution, Huijins Investment, and to some Chinese commercial
banks before then. Netting these amounts against reported foreign reserve holdings would reduce
the magnitude of foreign reserve inflows and raise the implied level of central bank domestic
assets, resulting in a lower estimated degree of sterilization. 16 For Argentina, monetary policy was initially stabilized with the adoption of its currency board
in 1991 Q1, implying that the first 4-quarter change observation begins in 1992 Q1, and the first
40-quarter rolling sample period is 1992 Q1 – 2001 Q4. For Brazil, the first 40-quarter rolling
sample is 1995 Q2 - 2005 Q1. 17 In the first specification we also include a lagged dependent variable as well as 3 quarterly
dummies as explanatory variables. See Mohanty and Turner (2006) who employ a similar
specification; also see Glick and Hutchison (2003) who use an unconstrained vector error
correction approach to estimate sterilization dynamics. 18 The results for Malaysia using nonoverlapping 4-quarter changes are an apparent exception. 19 We only include Argentina and Brazil in the sample only ten years after the implementation of
their monetary reforms, 2002 Q1 for Argentina and 2005 Q2 for Brazil.
46
20 In addition to the decline in sterilization in recent quarters noted above in the case of China,
sterilization in the Philippines has declined notably as well. 21 We are aware of the potential biases inherent in using prior knowledge to pick break dates. For
this reason we deliberately avoided choosing break dates based on the inflection points of our
rolling regression plots. We do not feel that our general conclusions would be affected by use of
more sophisticated time series approaches to identifying breaks. 22 Assuming a possible moving average error length of twice the number of overlapping quarters
accounts for possible serial correlation not just from the overlap, but from other sources as well
(e.g. see Cochrane (1991). 23It should be noted that we do not take account of possible simultaneity bias because net foreign
reserve changes may respond to domestic monetary policy, particularly when the central bank
intervenes and affects the exchange rate. However, prior work seeking to control for the possible
endogeneity of the explanatory variables in sterilization regressions through instrumental
estimation has not found much effect on coefficient magnitudes and their standard errors as
compared to OLS (e.g., Ouyang, Rajan, and Willett 2007). 24 The inclusion of nominal GDP renders the break term insignificant in the cases of Thailand
and Singapore. 25 Recall that in our Appendix figures we plotted rolling regression coefficients based on samples
of nonoverlapping quarterly observations. We do not use these samples as a robustness check
here as the quarterly changes introduce excessive noise into the data. 26 Note that comparison of column (3) in Tables 1a and 1b indicates that evidence of a
break is now somewhat less significant for India and Mexico, but more significant for Thailand.
We detect no serial correlation in the residuals for any of the regressions reported in Table 1b. 27 The increase in sterilization was significant for both Argentina and Brazil in Table 1, where
we controlled for other determinants of domestic monetary policy with nominal GDP, but did not
allow for any break in the response to this variable. Evidently, allowing a break in the response
to inflation, as in column (3) in Table 3, soaks up the effect of a break in sterilization behavior.
The result in Table 3 for Argentina is particularly problematic as the coefficient on the
interactive term with reserve inflows is significant and positive; in this case the coefficient on the
interactive inflation term is unusually large (in absolute value) as well as significant. 28 Note that the figures reported here are changes expressed in dollar terms, as compared to
changes in terms of local currency reported in earlier tables and charts.
47
29 Hong Kong and Singapore had net portfolio outflows during 2000-06, offsetting the net capital
inflows to other smaller East Asian countries, including Malaysia, the Philippines, Indonesia, and
Thailand. 30 If the central bank is insensitive to any concerns about the relative magnitudes of different
components of the balance of payments one would expect that the relevant regression
coefficients would be insignificant. The discussion about the risks of growing exposure to “hot
money suggests that the central bank may indeed adjust its policies to reflect greater concern
about “hot money” rather than about FDI flows. 31 The quarterly data on dollar-denominated balance of payments flows are converted into local
currency terms using the average local currency price of the dollar for each quarter. 32 Note that this proxy ignores the adverse valuation effects from continued appreciation of the
yuan and other Asian currencies. 33 Sterilization operations of in this form also have costs. For example, reserve requirements act
like a tax on banks which reduces financial intermediation and imposes a form of repression on
the financial system. 34 Our discussion points out that the costs of sterilization are the sum of direct opportunity costs
and indirect costs associated with financial repression in the form of capital controls and higher
reserve requirements imposed on the banking system. As the focus of our paper is on the
positive aspects of recent sterilization trends, we do not attempt to estimate the overall costs of
sterilization. Nevertheless, our discussion is consistent with the impact of changes in the direct
opportunity costs of holding reserves on patterns of sterilization. Further investigation of these
issues is left for future research.