steve kellenberg, edaw
TRANSCRIPT

Optimization Approach for Sustainable Communities
EDAW / AECOM Sustainability
Copyright © 2008 EDAW, Inc. Patent pending. All rights reserved. Sustainable Systems Integrated Model, SSIMTM and the
SSIMTM logo are trademarks of EDAW, Inc.

Integrated Whole Systems Thinkingg y g
• Ecological Resources
• Energygy
• Transportation
• Green Building
W t• Water
• Socio / Cultural
• Economic

Stage One:Stage One:Community Framework OptimizationOptimization

Regional Planning Applications

Existing Community Planning
Smart growth target areas

Typical Place Types

Community Framework Comparison
Using Automated Models and Integrated Technologies
Scheme 1 Scheme 3Scheme 2

Access to Transit
Scheme 1 Scheme 2 Scheme 3
Access to Transit
13% 92% 40%Coverage Percentage

Key Sustainability Indicators
1 2 31 2 3

Preferred Concept Selection
Simulations for Public Outreach

Stage Two:Primary System OptimizationPrimary System Optimization

Existing community Infill community Greenfield community
Variables:• %Bldg Stock Penetration
Variables:• % Redevelopment/Infill
Variables:• % Efficiency Improvementg
• % Efficiency Improvement• Yrs Time Horizon
• % Efficiency Improvement• Yrs Time Horizon
• Yrs Time Horizon
SSIM Optimization SSIM Optimization SSIM Optimization
Land Area Composite Calculations
Land Area Composite Calculations
Land Area Composite Calculations
SSIM Optimization SSIM Optimization SSIM Optimization
Total Study Area Composite Results

WaterBalance EkoBlox Ecological
Landscape SIF SSIM Decentralized Energy
SatelliteEco-cityPrimary Systems Optimization
Thematic Performance Sub-ModelsPrimary Systems Modeled
• On-site Urban Form• Residential Building Energy• Non-Residential Energy
Water
Energy –Buildings Green
Buildings • Transportation • Public Realm Energy• Water
Renewable Energy
Buildings
Ecology & Ecosystem Services
• Urban Heat Island Effect• Ecology• Freestanding Renewables
.
Energy -Public Realm Social / Cultural g
• Distributed Generation• Socio-Cultural
Transportation
t o o l k i t

Building Energyg gy
• Building Shell
• Fenestration
• HVAC efficiency
• Water heating
A li• Appliances
• Lighting
• Passive design
• Bldg orientation
• On-building Photo Voltaics
GHG reduction
2-20%0%

Example Outputs – Residential Energyp p gy

Domestic Water Reduction
• Land Use
• Landscape palettesp p
• Building Fixtures
• Treated sewage effluent reuse
St t• Stormwater reuse
• Rainwater capture
• Gray water reuse
H20 reductionH20 reduction
30-65%

Example Outputs - Waterp p

Urban / Community Formy
Cores and Centers• Central Town Center• Multiple District CoresDensity• Compact Design• Higher density in coresDiversity of Land Use• Broad range of housing• Jobs/housing balance• Local service provision
GHG reduction
2-25%5%

Local Transportationp
Measures:• Local Transit
Bi l / d i f ili i• Bicycle/pedestrian facilities • Neighborhood Electric Vehicles (NEV’s)• Travel demand management (TDM)
Housing / Employment Linkage Measures• On-site jobs/housing balance• Employer proximity subsidyEmployer proximity subsidy• ‘Google bus’
500,000,000
600,000,000
700,000,000
800,000,000
al)
Internal MeasuresExternal TransitWorkforce Housing
100,000,000
200,000,000
300,000,000
400,000,000
VMT
(Ann
ua
GHG reduction
3-20%0
Baseline Good Better Best
Scenarios
3 0%

20
Reductions Due to Transportation Measures
Level 1 Target @ 10 % Reduction
Level 2 Target @ 25 % Reduction
Level 3 Target @ 40 % Reduction

Public Realm EnergyPublic Realm Energy
Street Lighting– Fixture spacing and foot candles– Dark sky concepts– LED options
Parking Lots / Industrial Areas– Foot candle requirements– LED options– Photopic vs. Scotopic Lightsp p g
Open Space and Parks– Lighting levels– PV on structures
GHG reduction
1-5%

Energy and GHG Offsets: Renewable & Distributed Energygy
On-Building Renewables• Photo Voltaic panels• Photo Voltaic panels• Thermal hot water
Distributed Energy • Photo Voltaic plants• Wind turbine plants• CHP*• BioMass*• BioGas*• GeoThermal*
GHG reduction
3-12%

Urban Heat Island
• Micro-Climate Engineering• Building Shading from tree plantings• Micro-water humidity and cooling• Materials selection
• Community Landscape• Increased public realm planting• Integration with bio-diversity concepts• Materials selection
Urban Heat Island CO2: 10% Reduction Potential
GHG reduction
U b H t I l d CO 30% R d ti P t ti l
GHG reduction
3-5%Urban Heat Island CO2: 30% Reduction Potential

Ecosystem Servicesy
• Biodiversity Enhancement• Carbon Sequestration• Local Food Production
GHG reduction
5-15%5-15%

Relative GHG Reduction by System

Stage Three:Master Program SynthesisMaster Program Synthesis

building energy - Mature Districts(1)RESIDENTIAL NEIGHBORHOODSResidential One Very Low SFD Good Better BestResidential Two Good Better Best
Program A Program CProgram B
Residential Two Low SFD Good Better Best
Residential Three Medium SFD Good Better Best
Residential Four Urban Medium / High Good Better Best
Residential Five Good Better BestResidential Five Urban High Good Better Best
BUSINESS DISTRICTSBusiness One Heavy Industrial Good Better BestBusiness Two Light Industrial Good Better BestBusiness Three Logistics/Distribution Good Better BestBusiness Four Low Office Good Better BestBusiness Five Medium Office Good Better BestBusiness Six High Office Good Better BestRETAIL DISTRICTS
Retail One Regional Retail Good Better Best
Retail Two Community Retail Good Better Best
Retail Three Neighborhood Retail Baseline Baseline Baseline
MXD DISTRICTS
District One Mix A Good Better Best
District Two Mix B Good Better Best
Di t i t Th Mi C G d B tt B tDistrict Three Mix C Good Better Best
District Four Mix D Good Better Best
MASTER PROGRAM RESULTS
Total Building Energy Reduction 10.6% 17.8% 31.6%
Total Storm Water Reduction 1.5% 30.5% 38.0%
Total Pollutant Reduction 0.0% 36.3% 53.2%
City Total Cost 0.5% 3.0% 4.8%
Residential Owner Cost 2.1% 5.6% 9.0%
Commercial Owner Cost 5.6% 29.7% 37.5%

vmt - Mature Districts (1) RESIDENTIAL NEIGHBORHOODS
Residential One Very Low SFD Good Good Best
Program A Program CProgram BResidential One Very Low SFD Good Good Best
Residential Two Low SFD Good Better Best
Residential Three Medium SFD Good Better Best
Residential Four Urban Medium / High Good Better Best
BUSINESS DISTRICTS
Business One Heavy Industrial Baseline Baseline Baseline
Business Two Light Industrial Baseline Good Good
Business Three Logistics/Distribution Baseline Good Good
Business Four Low Office Baseline Good Good
Business Five Medium Office Good Best Best
Business Six High Office Baseline Baseline BestRETAIL DISTRICTS
Retail One Regional Retail Baseline Good Better
Retail Two Community Retail Good Better Best
Retail Three Neighborhood Retail Baseline Baseline BaselineRetail Three Neighborhood Retail Baseline Baseline Baseline
MXD DISTRICTS
District One Mix A Good Better Best
District Two Mix B Baseline Best Best
District Three Mix C Good Better Best
District Four Mix D Baseline Baseline Baseline
MASTER PROGRAM RESULTS
Total VMT Reduction 12.6% 27.9% 41.2%
Total Storm Water Reduction 10.6% 17.8% 31.6%
Total Pollutant Reduction 1.5% 30.5% 38.0%
City Total Cost 0.0% 36.3% 53.2%
Residential Owner Cost 0.5% 3.0% 4.8%
Commercial Owner Cost 2.1% 5.6% 9.0%

Key Sustainability Indicators

Comparative Reduction in GHG EmissionsComparative Reduction in GHG Emissions
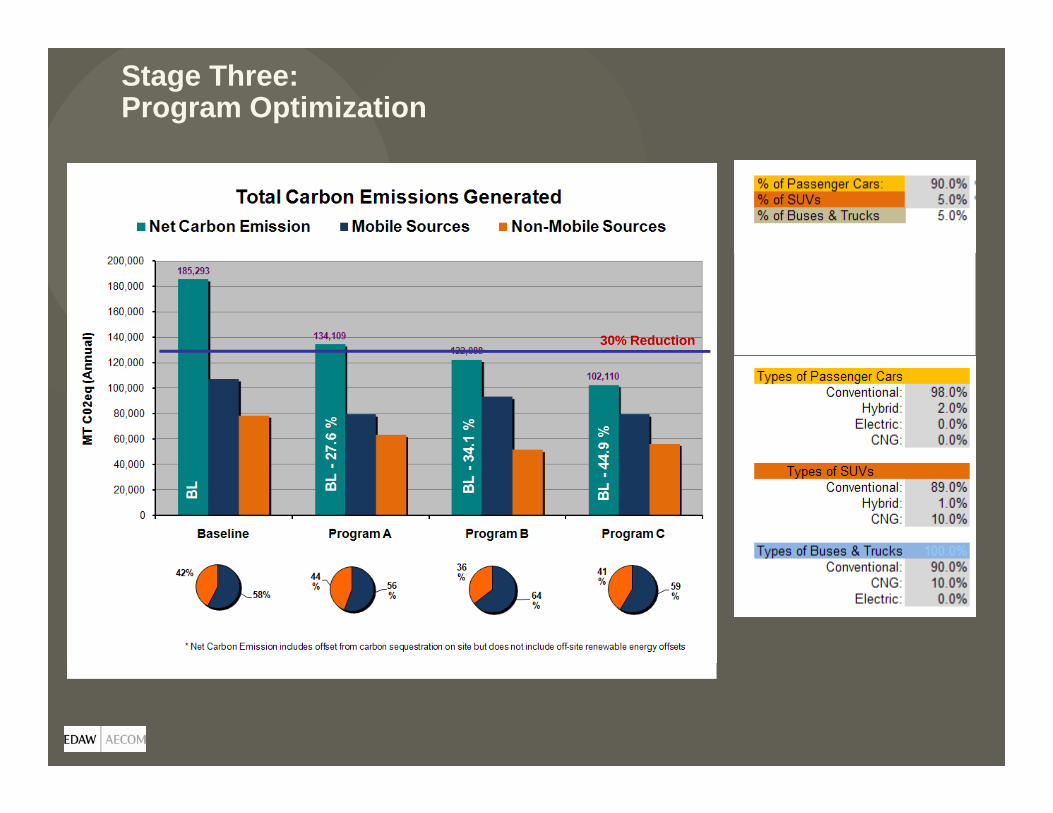
Stage Three: Program Optimization
30% Reduction

Stage Three: Carbon Footprint Targeting
Multiple Options
AB32Target
S l
Wind Farm
Solar Farm
Forestry (Sequestration)

Cost Impact on Individual Building Types


Integrated Whole Systems Thinking

Optimization Approach for Sustainable Communities
EDAW / AECOM Sustainability
Copyright © 2008 EDAW, Inc. Patent pending. All rights reserved. Sustainable Systems Integrated Model, SSIMTM and the
SSIMTM logo are trademarks of EDAW, Inc.