steven apfelbaum - wetlands: sinking carbon and keeping it out of the atmosphere
TRANSCRIPT
Primer
Wetlands and Climate

Wetland Degradation and Loss
•Artificial drainage of wetlands and hydric soils
•Mechanical disturbance from agriculture
•Altered hydrology
•Inorganic fertilizers and composting
•Filling/dredging
•Land Development and Agricultural
•Global losses of 50%: and over 90% in many countries (Dugan 1993).
Varying in USA from 9% loss in New Hampshire to over 90% loss in California
(Dahl 1990).

Changes in Wetland Areas 1800 to 2006 (x 10^3 km^2) (From Bridgham et al 2006).
Peatlands Freshwater
mineral
Tidal
marsh
Mangrove Mudflat Totals
Canada--
Now1136 159 .44 0 6 1301
Canada-
historic1150 359 1.3 0 7 1517
USA--Now 225 868 21.4 3 9 1127
USA-Historic 243 1308 23.4 4 10 1597
Mexico-Now 10 21 0 5 ND 36
Mexico-
Historic45 45 0 8 ND 53
North
America--Now1372 1047 22 8 15 2463
North
America--
Historic
1407 1706 25 12 17 3167
CHANGE -2.5% -39% -12% -33% -12% -22%
Global-Now 3443 2315 22 181 ND 5961
Global-
Historic4000 5000 29 278 ND 9307
CHANGE -14% -54% -24% -35% -12% -36%

DEGRADATION OF WETLANDS

Wetlands and Climate Change
(C-Sequestration minus CH4-Emissions)
•Wetlands are the most productive ecosystem in the world (Whittaker and Likens
1973).
• Largest carbon pools of Stored C on earth (Eswaran, van Den berg, and Reich
1993).

Wetland Net Carbon Balance
CanadaAlaska
Other U.S.Mexico
N.A.Global
Ne
t C
Ba
lan
ce
(T
g C
yr-1
)
-150
-100
-50
0
50
100
Peatland
FWMS
Estuarine
Note: Positive number = net flux into wetland, negative number = net flux from wetland
(Bridgham et. al. 2006)

Wetland Soil Carbon Pools (Pg) and Fluxes (Tg yr-1) (From Bridgham et al 2006).
Peatlands Freshwater mineral Tidal Marsh Mangrove Mudflats Totals
North
America—Now
Carbon Pool Size (Pg) 177 36 .44 .19 .28 215
Sequestration
(Tg yr^-1)
29 17.7 4.8 2.1 3.3 57.2
Net Carbon Balance
(Pg)
17 22.3 4.8 2.1 3.3 49.2
Change in FLUX from
Historic
(Tg yr^-1)
-19.6 -11 -0.53 -1.0 -0.48 -32.7
% CHANGE in acreage -2.5% -39% -12% -33% -12% -22%
Global-Now
Carbon POOL Size (Pg) 462 46 .43 4.9 ND 513
Sequestration
(Tg yr^-1)
55 39 4.6 38 nd 137
Net Carbon Balance
(Pg)
-150 39 4.6 38 nd -68
Change in FLUX from
Historic
(Tg yr^-1)
-221 -45 -.69 -20 nd -287
%CHANGE in acreage -14% -54% -24% -35% -12% -36%

Potential for Wetland Restoration
and Climate Mitigation
Midwest Agriculture/Great Lakes
Arctic, Boreal Peatlands
Coastal Freshwater, Brackish, Salt Water
Estuarine

Wetland Soil Carbon Pools (Pg) and Fluxes (Tg yr-1), and Annual Sequestration
(TC/ ha and TCo2e-ha) (Calculated using Bridgham et al 2006).
Peatlands Freshwater mineral Tidal Marsh Mangrove Mudflats Totals
North America—Now
( km^2)
1372000 1047000 22000 8000 15000 2463000
Carbon Pool Size (Pg) 177 36 .44 .19 .28 215
Total Sequestration
(Tg yr^-1)
29 17.7 4.8 2.1 3.3 57.2
Sequestration rate in
Tg/yr /km^2
47312 59152 4583 3809 4545 43059
Sequestration rate
Ton of C/ha per year
4.39 5.36 .41 .34 .41 3.9
Tons oc Co2e/ha-yr 16.06 19.61 1.5 1.2 1.5 14.27
Global-Now
(km^2)
3443000 2315000 22000 181000 ND 5961000
Carbon POOL Size (Pg) 462 46 .43 4.9 ND 513
Total Sequestration
(Tg yr^-1)
55 39 4.6 38 ND 137
Sequestration rate in
Tg/yr /km^2
62,600 59358 4782 4763 ND 43510
Sequestration rate
Ton of C/ha per year
5.67 5.38 .43 .43 ND 3.9
Tons oc Co2e/ha-yr 20.7 19.7 1.6 1.6 ND 14.27
Pocosin Wetlands, Coastal North
Carolina
• Must re-saturate peat substrates to reduce annual
oxidation and GHG release and to prevent wildfires.

(from Richardson 1981, 1983))

Peatlands (Wetlands)
• Peatlands occupy 3% of the global terrestrial
surface yet contain 16-33% of the earths soil
carbon pool (Gorham 1991).

How much carbon was emitted? (Peat Fire, June –Sept 2008).
Mickler and Welch 2012
9.9 Tg C on the 16,814
burned hectares: > total USA vehicle
emissions for 2008
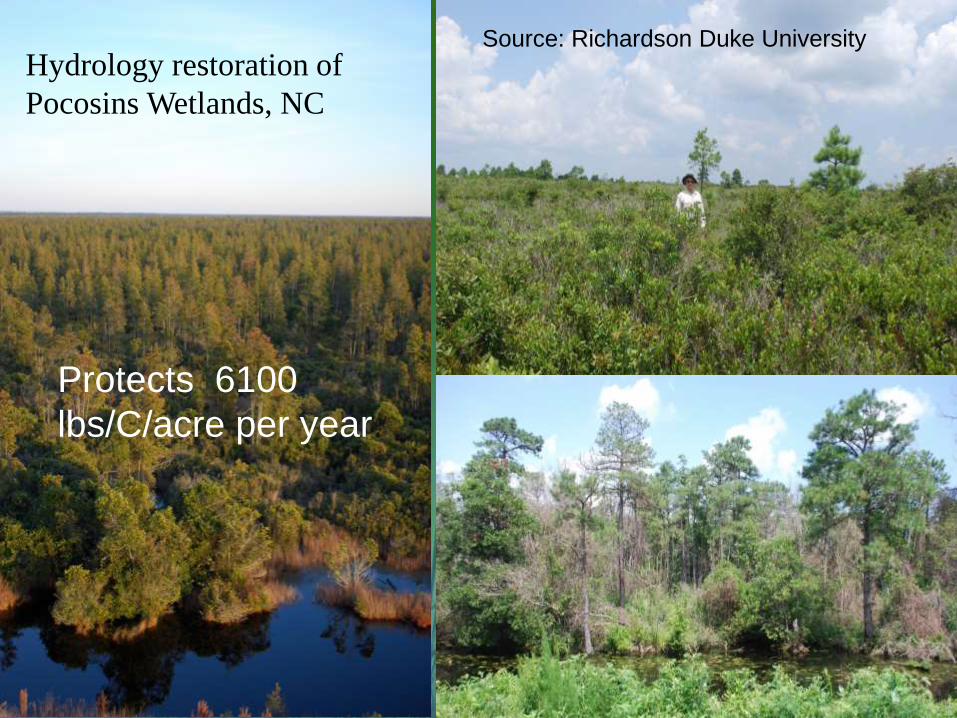
Hydrology restoration of
Pocosins Wetlands, NC
Source: Richardson Duke University
Protects 6100
lbs/C/acre per year

Fair Oaks Farm, Indiana
Indiana Chapter
•7300 acres of drained landscape, 5000 of wetland being restored
•Restoration of native plant communities, rare habitats, and rare species
•Measured and predicted carbon improvements:
•Sequester 7-12 tons of C/acre-yr, or ~50,000 tons/C-yr or 183,000
TCO2equ/yr. •Add the reduction in 2-5 tons of C02eq/acre/ yr from dewatering effects.

Newton County, Indiana

Fair Oaks FarmRestoration plans
Junk.shp
Soil/Vegetation Relationship
WATEREMERGENT
SEDGEWET MESIC/ SEDGE
MESIC/ WET MESICSAVANNA
Management Units
D
B
C
N
O
E FG H
I
J
K
L
M
Soil/Vegetation RelationshipWATEREMERGENTSEDGEWET MESIC/ SEDGEMESIC/ WET MESICSAVANNA
#Y
#Y#Y
#Y
#Y
#Y
#Y
#Y
#Y
#Y
#Y
#Y
#Y
#Y
#Y
#Y
#Y
#Y
#Y
#Y
#Y
#Y
#Y
#Y
#Y
#Y
#Y
%U#Y
#Y
#Y
#Y #Y
#Y
#Y
#Y
#Y
#Y
#Y
#Y
#Y
#Y#Y
#Y
#Y
#Y
#Y
#Y
#Y
#Y
#Y
#Y #Y
#Y #Y
#Y
#Y
#Y
#Y
%U
#Y#Y#Y
#Y
#Y
#Y#Y
#Y #Y #Y#Y
#Y
#Y
D
B
C
N
O
E FG H
I
J
K
L
M
Drainage SystemDistrict Main DitchRegional MainField DrainLocal Feeder
Drainage SystemAbandon
Proposed Control Structures
%U Major Controls#Y Minor Controls
0 1000 2000 Feet N

Restoration of hydrology, seeding and
wildlife habitat
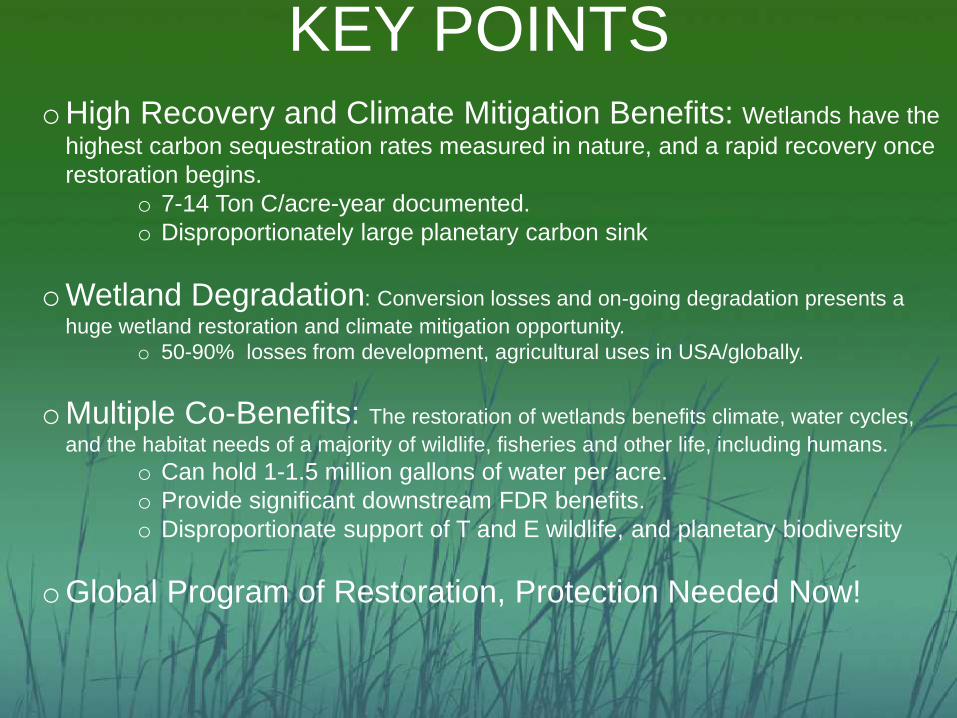
KEY POINTSoHigh Recovery and Climate Mitigation Benefits: Wetlands have the
highest carbon sequestration rates measured in nature, and a rapid recovery once
restoration begins.
o 7-14 Ton C/acre-year documented.
o Disproportionately large planetary carbon sink
oWetland Degradation: Conversion losses and on-going degradation presents a
huge wetland restoration and climate mitigation opportunity.
o 50-90% losses from development, agricultural uses in USA/globally.
oMultiple Co-Benefits: The restoration of wetlands benefits climate, water cycles,
and the habitat needs of a majority of wildlife, fisheries and other life, including humans.
o Can hold 1-1.5 million gallons of water per acre.
o Provide significant downstream FDR benefits.
o Disproportionate support of T and E wildlife, and planetary biodiversity
oGlobal Program of Restoration, Protection Needed Now!


Wetlands and Methane Emissions• Wetlands emit 15-40% (92-237 x 10^12 g CH4/yr) of
the global total Methane emission.
– Some evidence that global warming since 1990’s may have resulted
in increased CH4 from wetlands.
– Not certain how increased atmospheric C02 impacts wetlands: some
studies suggest higher wetland productivity occurs, and Co2 update
may balance with Ch4 emissions.
–