steven e. koonin chief scientist, bp...
TRANSCRIPT
Energy trends and technologies in the coming decadesSteven E. Koonin
Chief Scientist, BP plc
GUIRR
February 19, 2007
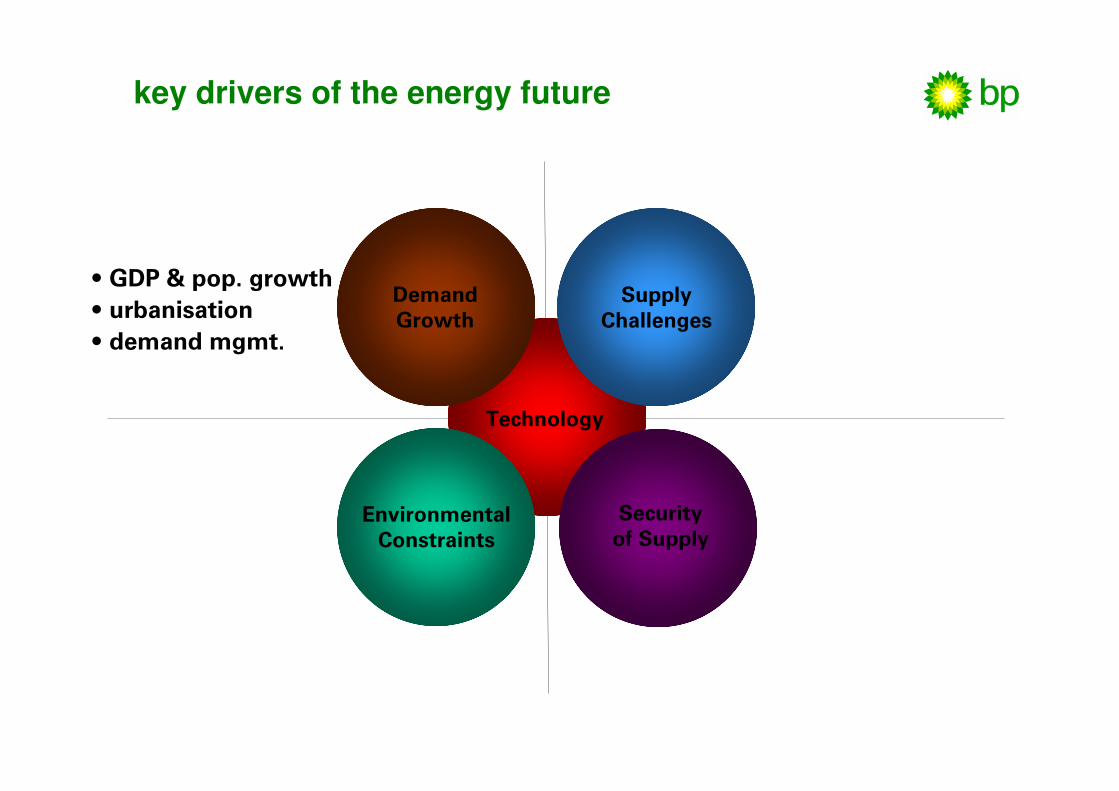
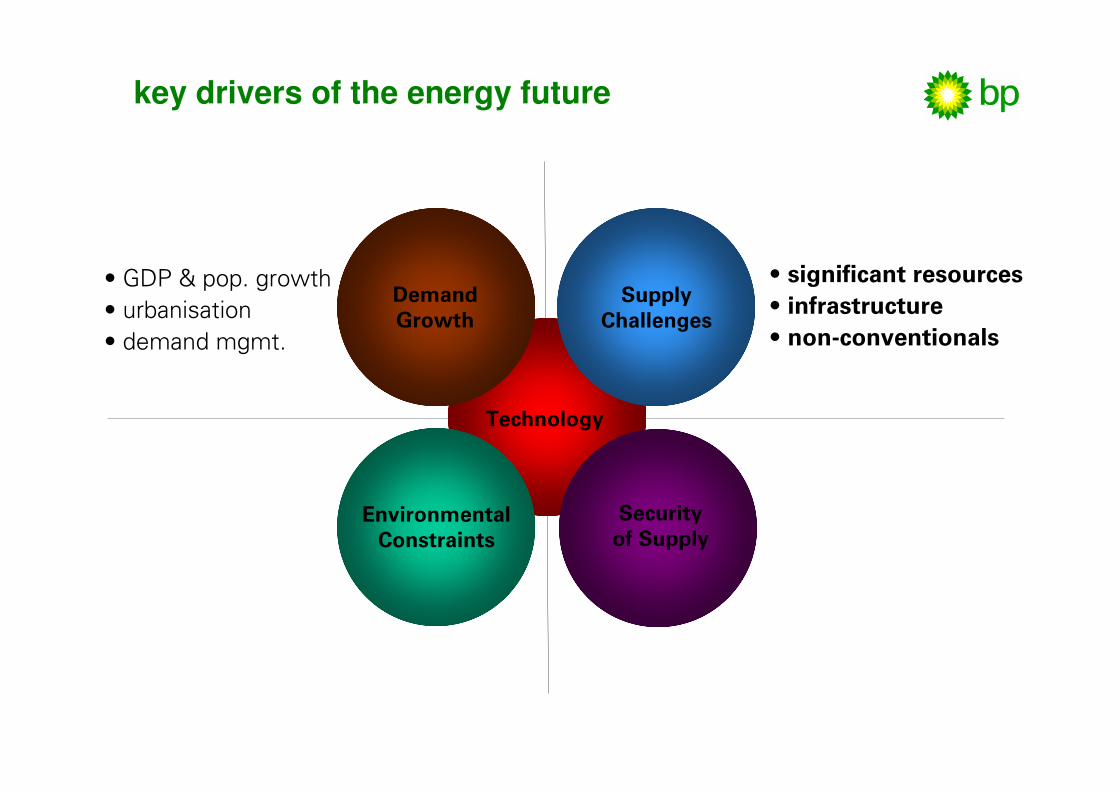
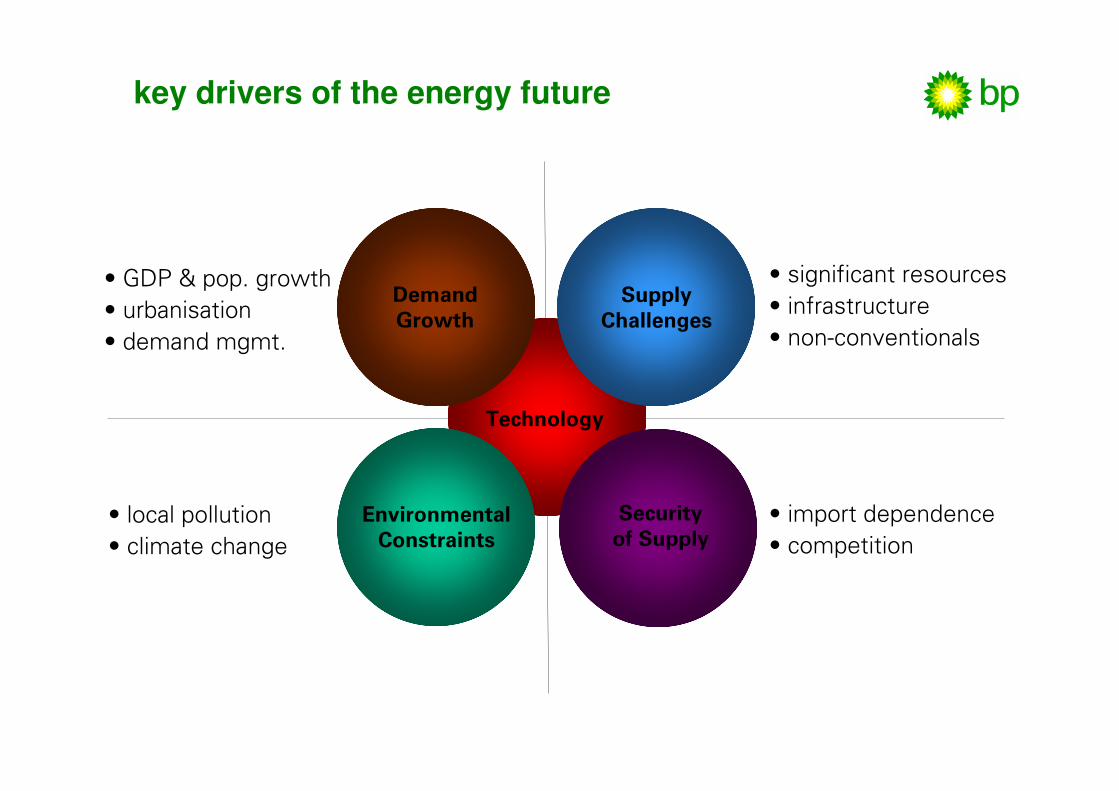
Technology
Demand Growth
• GDP & pop. growth
• urbanisation
• demand mgmt.
Security of Supply
Environmental Constraints
Supply Challenges
key drivers of the energy future

0
50
100
150
200
250
300
350
400
0 5,000 10,000 15,000 20,000 25,000 30,000 35,000 40,000
GDP per capita (PPP, $2000)
Prim
ary
Energ
y p
er capita (G
J)
Source:�UN�and�DOE�EIA
Russia�data�1992-2004�only
energy�use�grows�with�economic�development
US
Australia
Russia
BrazilChina
India
S.�Korea
Mexico
Ireland
Greece
France
UKJapan
Malaysia
energy demand and GDP per capita (1980-2004)
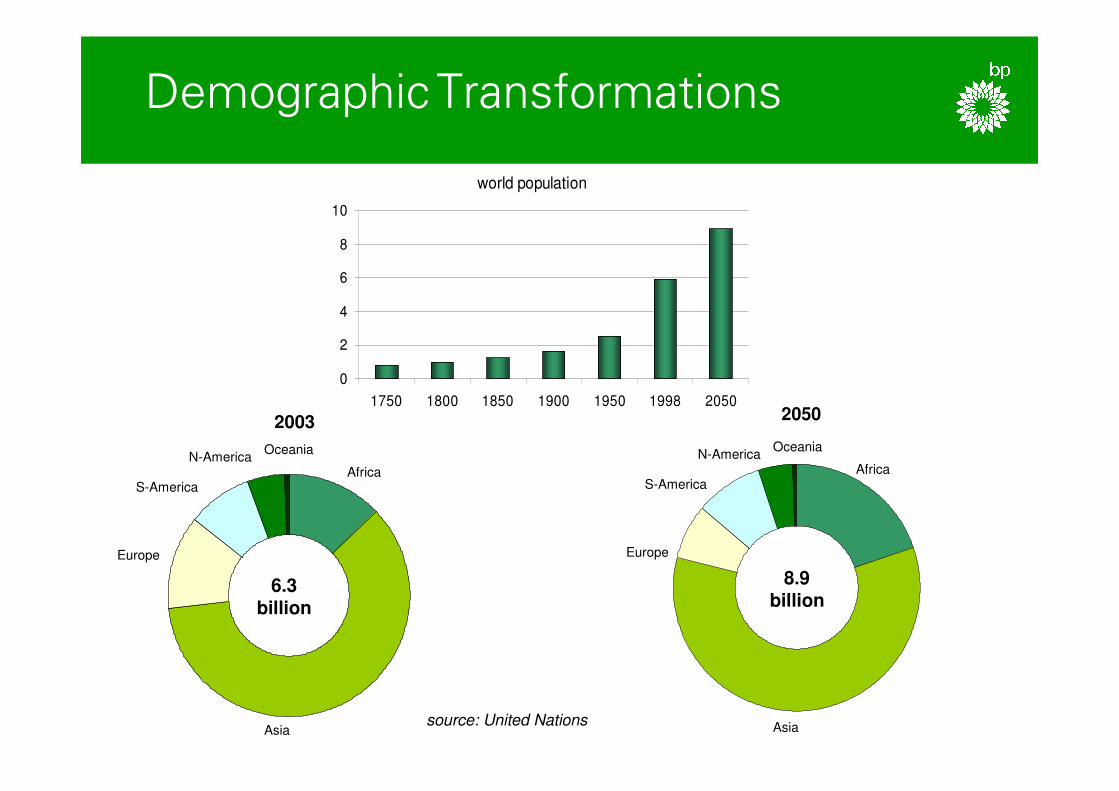
DemographicTransformations
world population
0
2
4
6
8
10
1750 1800 1850 1900 1950 1998 2050
2003 2050
source: United Nations
6.3billion
8.9billion
Oceania
AfricaN-America
S-America
Europe
Asia
Oceania
AfricaN-America
S-America
Europe
Asia
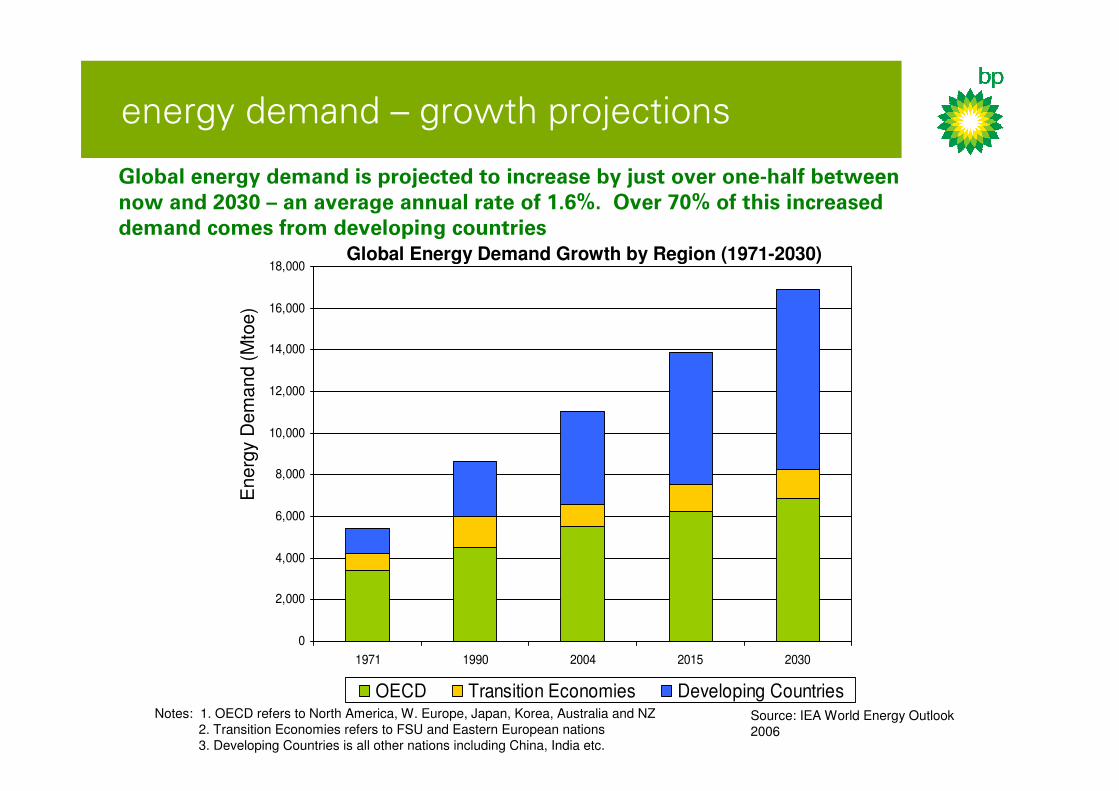
energy�demand�– growth�projections
Source: IEA World Energy Outlook 2006
Notes: 1. OECD refers to North America, W. Europe, Japan, Korea, Australia and NZ2. Transition Economies refers to FSU and Eastern European nations3. Developing Countries is all other nations including China, India etc.
Global Energy Demand Growth by Region (1971-2030)
0
2,000
4,000
6,000
8,000
10,000
12,000
14,000
16,000
18,000
1971 1990 2004 2015 2030
OECD Transition Economies Developing Countries
Energ
y D
em
and (
Mto
e)
Global energy demand is projected to increase by just over one-half between now and 2030 – an average annual rate of 1.6%. Over 70% of this increased demand comes from developing countries
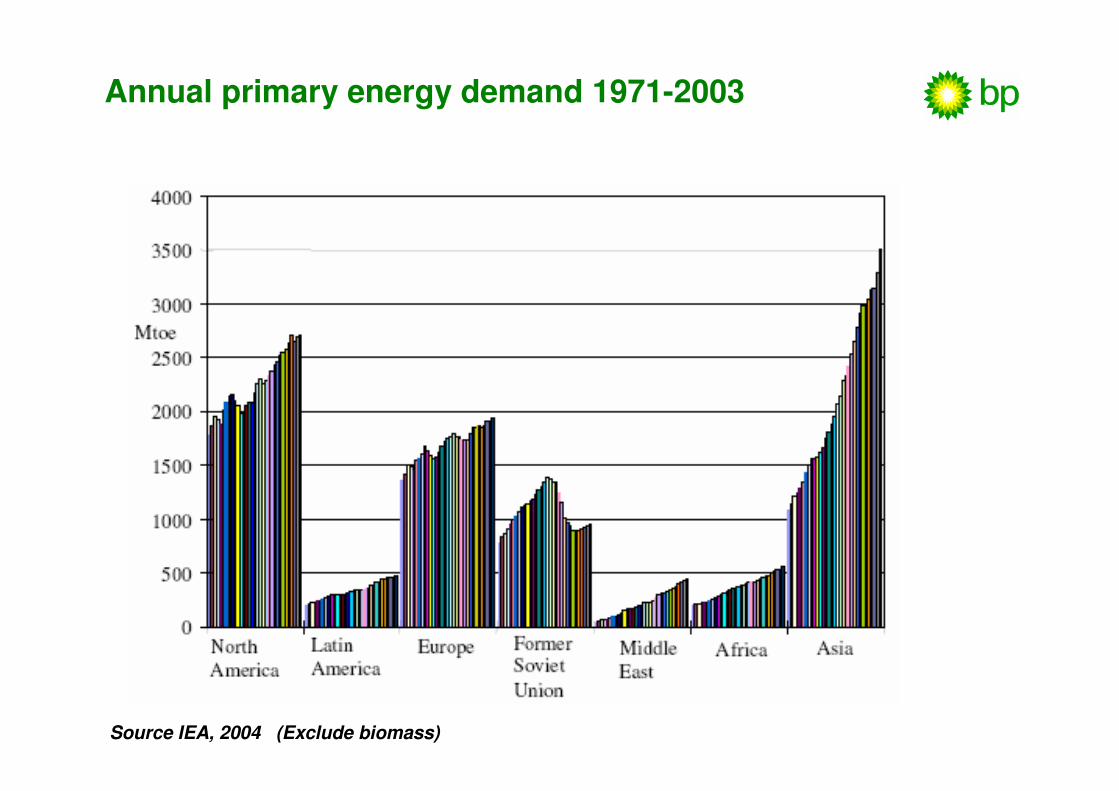
Annual primary energy demand 1971-2003
Source IEA, 2004 (Exclude biomass)
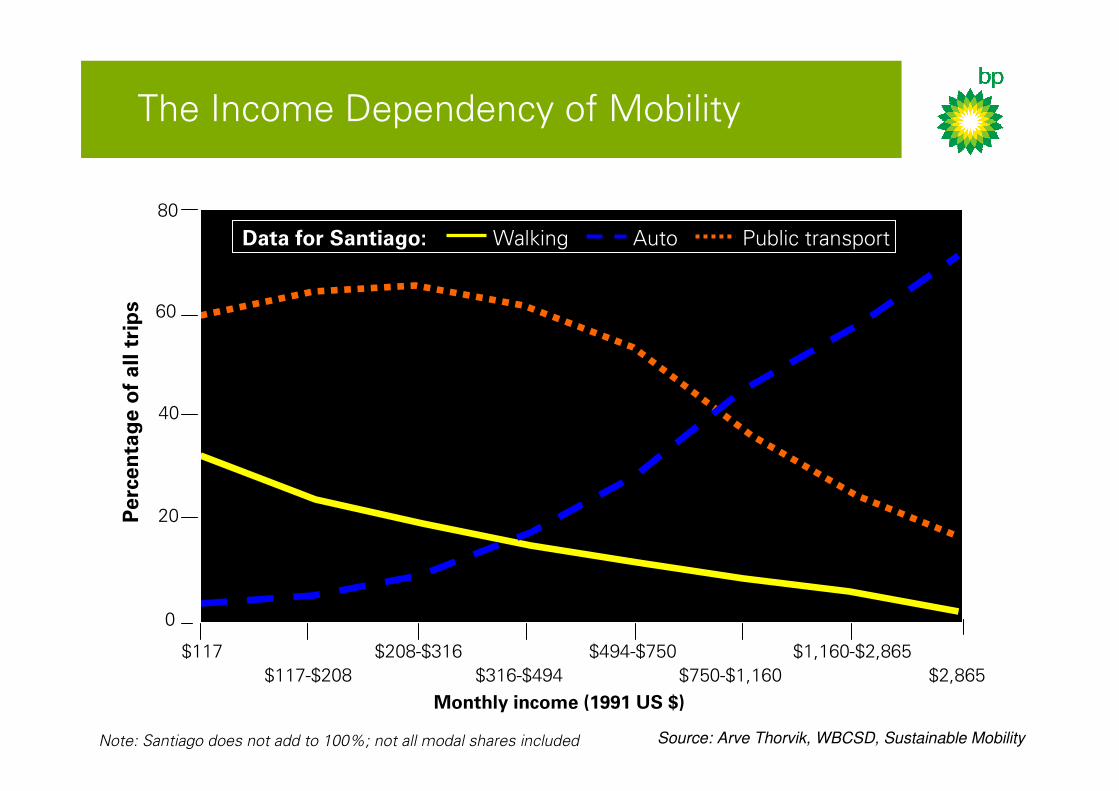
The�Income�Dependency�of�Mobility
Walking Auto Public�transport
$117
$117-$208
$208-$316
$316-$494
$494-$750
$750-$1,160
$1,160-$2,865
$2,865
Monthly income (1991 US $)
0
20
40
60
80
Perc
enta
ge o
f all t
rips
Note: Santiago does not add to 100%; not all modal shares included
Data for Santiago:
Source: Arve Thorvik, WBCSD, Sustainable Mobility
0
10
20
30
40
50
60
70
80
90
100
110
120
130
1971 2002 2030
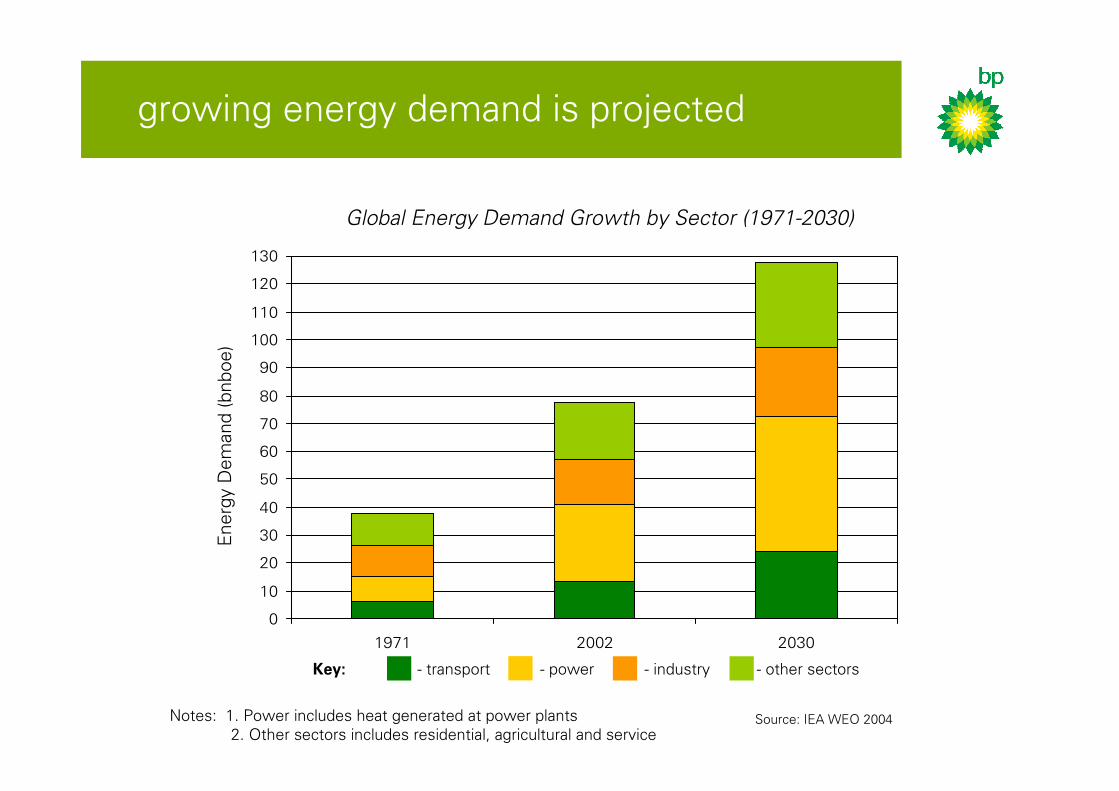
Source:�IEA�WEO�2004Notes:��1.�Power�includes�heat�generated�at�power�plants
2.�Other�sectors�includes�residential,�agricultural�and�service
Global Energy Demand Growth by Sector (1971-2030)E
nerg
y�D
em
and�(bnboe)
growing�energy�demand�is�projected
Key: - industry- transport - power - other�sectors
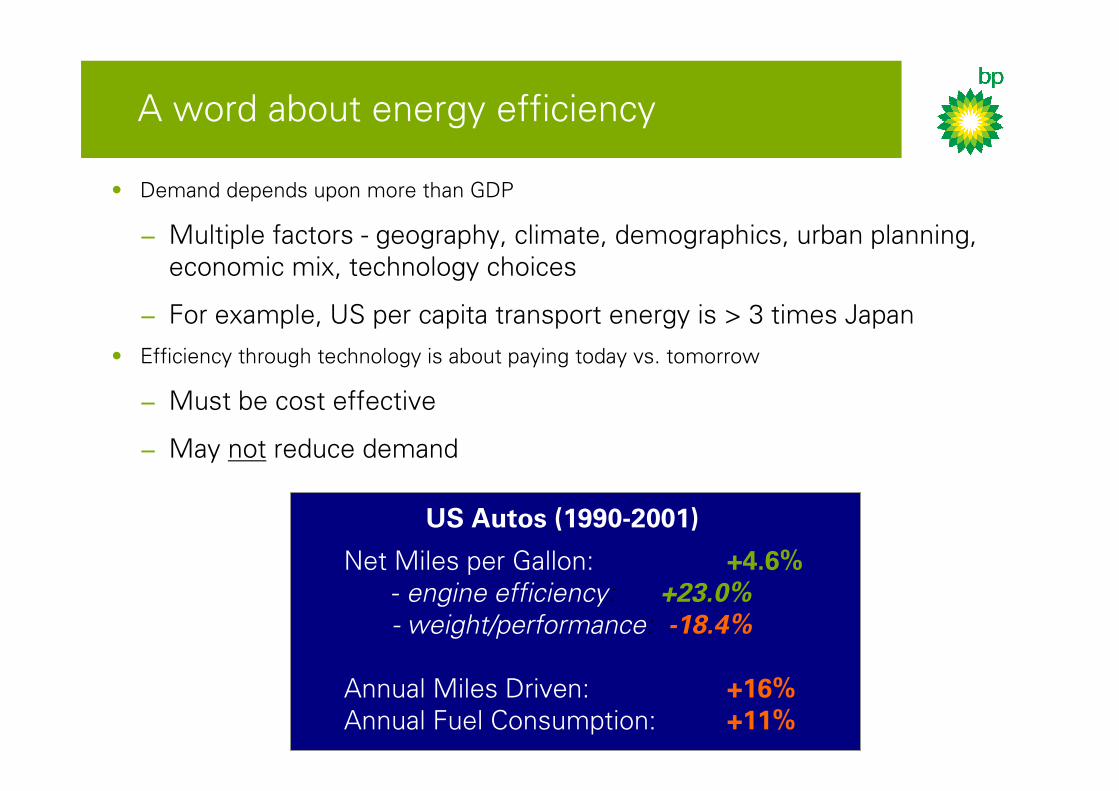
A�word�about�energy�efficiency
• Demand�depends�upon�more�than�GDP
− Multiple�factors�- geography,�climate,�demographics,�urban�planning,�
economic�mix,�technology�choices
− For�example,�US�per�capita�transport�energy�is�>�3�times�Japan�
• Efficiency�through�technology�is�about�paying�today�vs.�tomorrow
− Must�be�cost�effective
− May�not reduce�demand
US Autos (1990-2001)
Net�Miles�per�Gallon:� +4.6%- engine efficiency: +23.0%
- weight/performance: -18.4%
Annual�Miles�Driven:� +16%Annual�Fuel�Consumption: +11%
Technology
Demand Growth
• GDP�&�pop.�growth
• urbanisation
• demand�mgmt.
Security of Supply
Environmental Constraints
Supply Challenges
• significant resources
• infrastructure
• non-conventionals
key drivers of the energy future
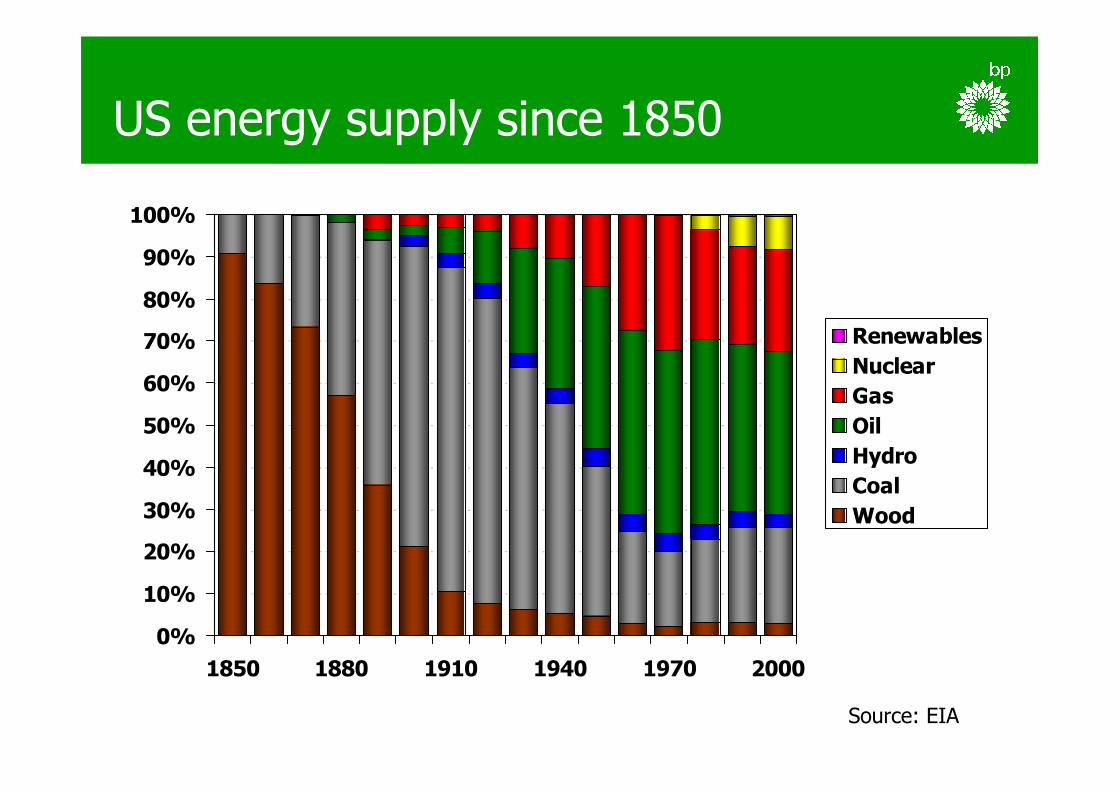
US energy supply since 1850
0%
10%
20%
30%
40%
50%
60%
70%
80%
90%
100%
1850 1880 1910 1940 1970 2000
Renewables
Nuclear
Gas
Oil
Hydro
Coal
Wood
Source: EIA

2002�US�energy�(Net�primary�consumption�=�103�Exajoules)
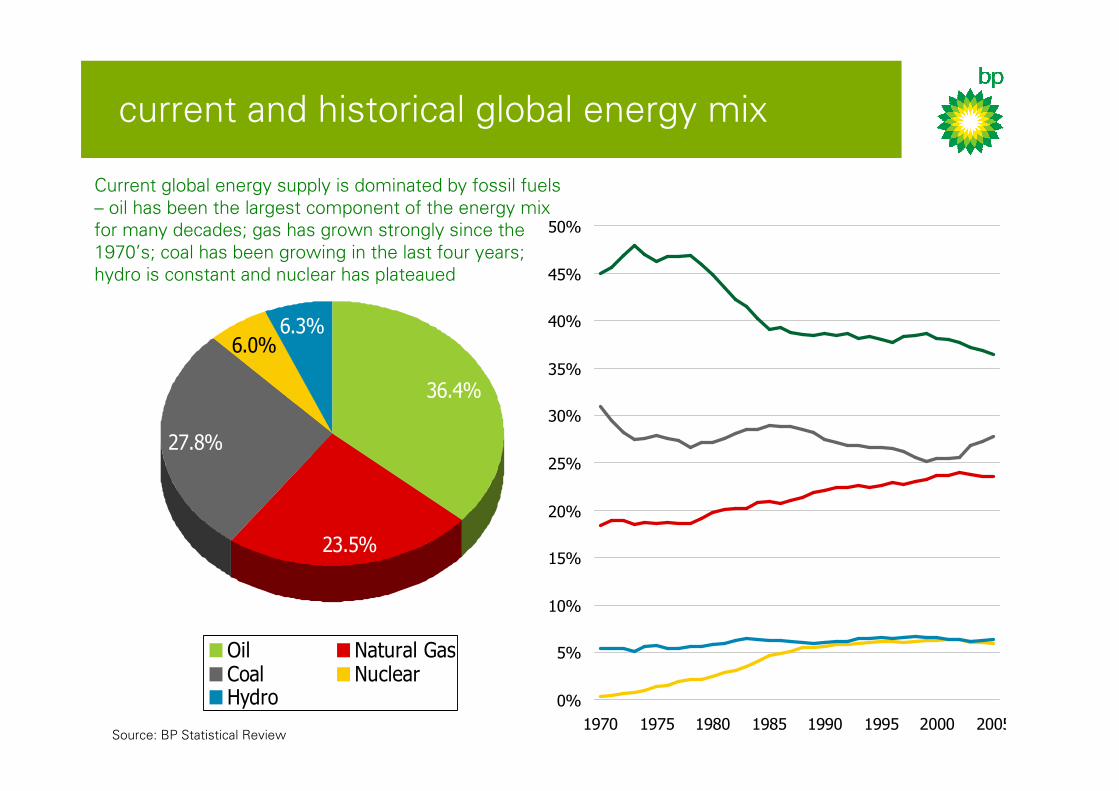
current�and�historical�global�energy�mix
0%
5%
10%
15%
20%
25%
30%
35%
40%
45%
50%
1970 1975 1980 1985 1990 1995 2000 2005
36.4%
23.5%
27.8%
6.3%6.0%
Oil Natural GasCoal NuclearHydro
Source:�BP�Statistical�Review
Current�global�energy�supply�is�dominated�by�fossil�fuels�
– oil�has�been�the�largest�component�of�the�energy�mix�
for�many�decades;�gas�has�grown�strongly�since�the�
1970’s;�coal�has�been�growing�in�the�last�four�years;�
hydro�is�constant�and�nuclear�has�plateaued
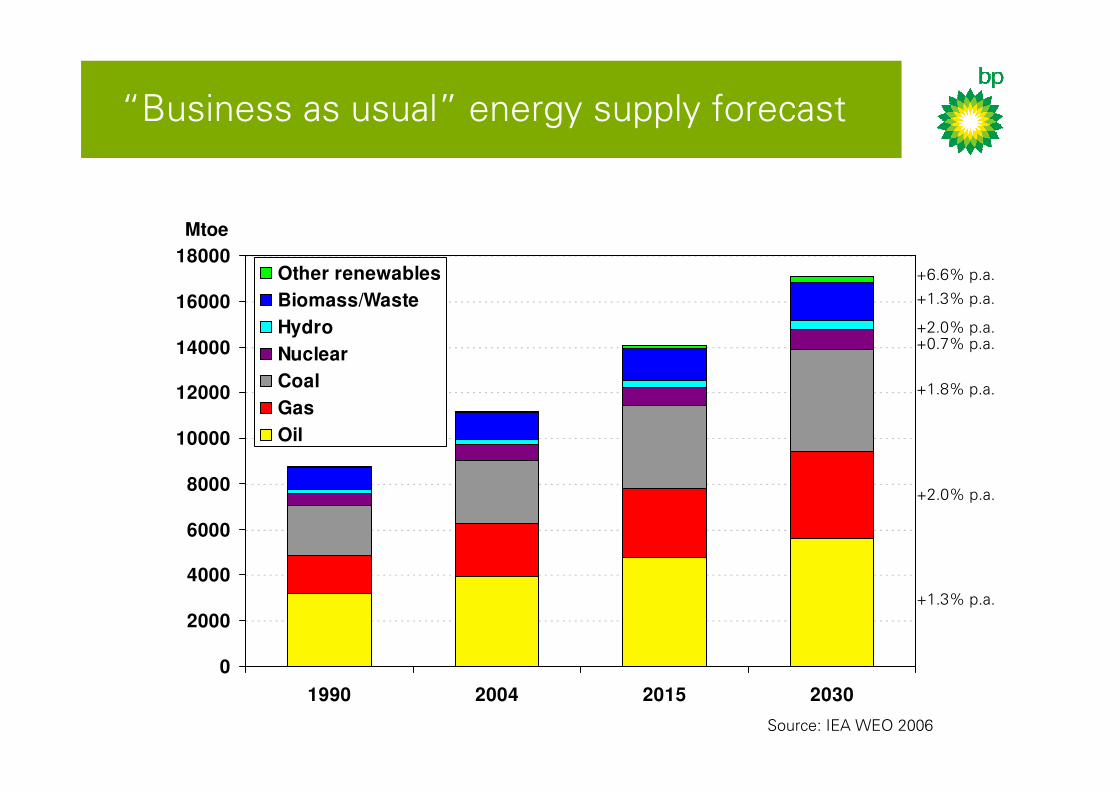
“Business�as�usual” energy�supply�forecast
0
2000
4000
6000
8000
10000
12000
14000
16000
18000
1990 2004 2015 2030
Other renewables
Biomass/Waste
Hydro
Nuclear
Coal
Gas
Oil
Mtoe
Source:�IEA�WEO�2006
+1.3%�p.a.
+2.0%�p.a.
+1.8%�p.a.
+0.7%�p.a.+2.0%�p.a.
+1.3%�p.a.
+6.6%�p.a.
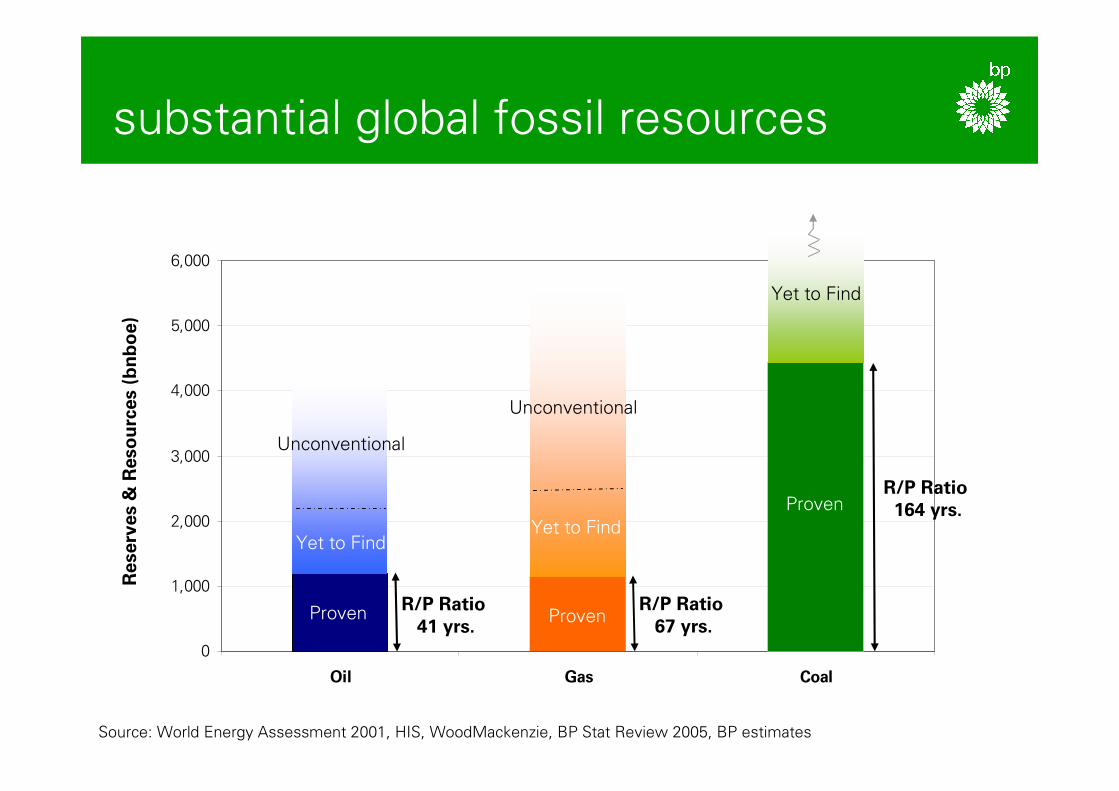
0
1,000
2,000
3,000
4,000
5,000
6,000
Oil Gas Coal
substantial�global�fossil�resources
R/P Ratio 41 yrs.
R/P Ratio 67 yrs.
R/P Ratio 164 yrs.
Proven Proven
Proven
Yet�to�FindYet�to�Find
Yet�to�Find
Source:�World�Energy�Assessment�2001,�HIS,�WoodMackenzie,�BP�Stat�Review�2005,�BP�estimates
Unconventional
Unconventional
Reserv
es &
Resourc
es (bnboe)
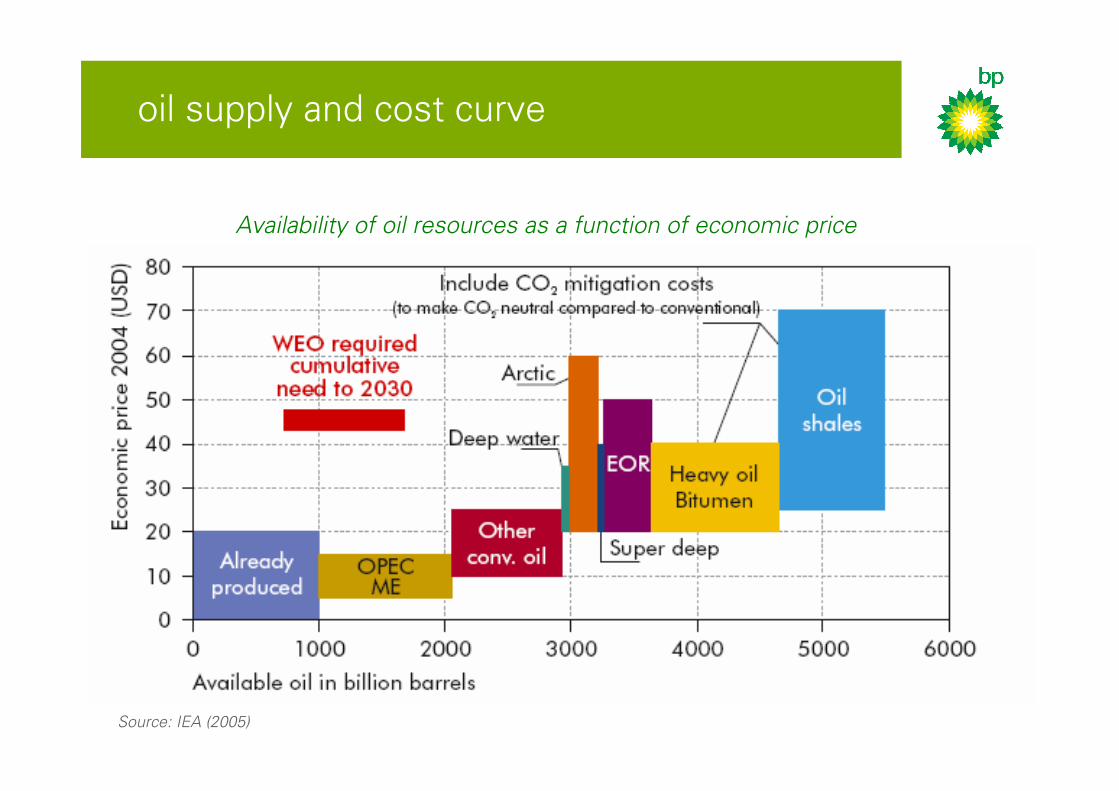
oil�supply�and�cost�curve
Availability of oil resources as a function of economic price
Source: IEA (2005)

Technology
Demand Growth
• GDP�&�pop.�growth
• urbanisation
• demand�mgmt.
Security of Supply
• import dependence
• competition
Environmental Constraints
Supply Challenges
• significant�resources
• infrastructure
• non-conventionals
key�drivers�of�the�energy�future
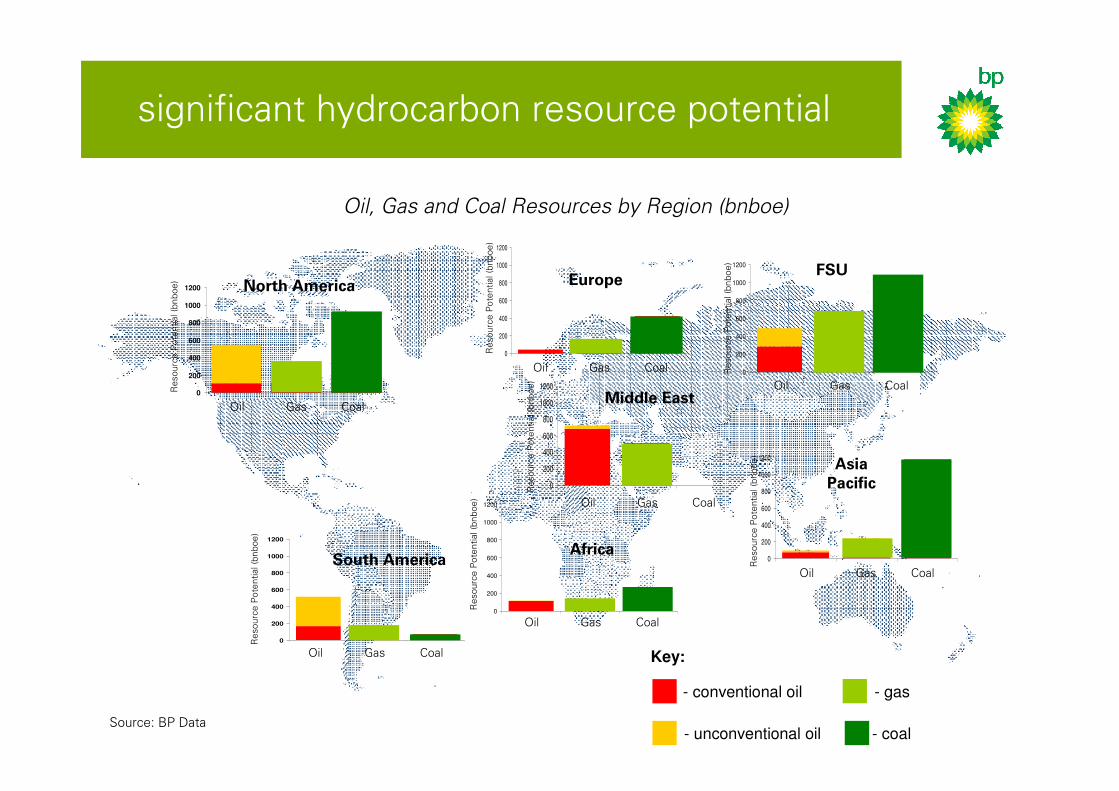
Source:�BP�Data
significant�hydrocarbon�resource�potential
0
200
400
600
800
1000
1200
South America
0
200
400
600
800
1000
1200 North America
Oil Gas Coal
Oil Gas Coal
Resourc
e�P
ote
ntial�(b
nboe
)
0
200
400
600
800
1000
1200
Africa
Oil Gas Coal
Resourc
e�P
ote
ntial�(b
nboe
)
Resourc
e�P
ote
ntial�(b
nboe
)
0
200
400
600
800
1000
1200FSU
Oil Gas Coal
Resourc
e�P
ote
ntial�(b
nboe
)
Gas Europe
0
200
400
600
800
1000
1200
Resourc
e�P
ote
ntial�(b
nboe
)
Oil Gas Coal
0
200
400
600
800
1000
1200
Middle East
Oil Gas Coal
Resourc
e�P
ote
ntial�(b
nboe
)
0
200
400
600
800
1000
1200Asia
Pacific
Oil Gas Coal
Resourc
e�P
ote
ntial�(b
nboe
)
Key:
- unconventional oil
- conventional oil - gas
- coal
Oil, Gas and Coal Resources by Region (bnboe)
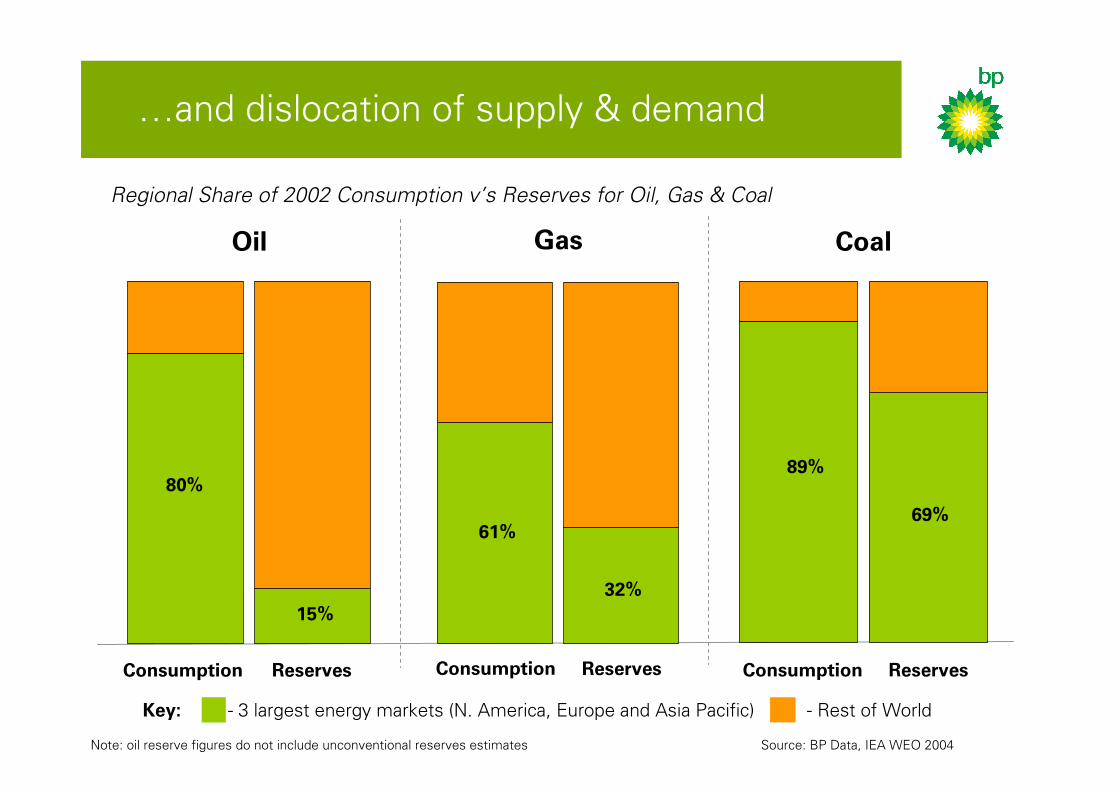
…and�dislocation�of�supply�&�demand
Regional Share of 2002 Consumption v’s Reserves for Oil, Gas & Coal
- Rest�of�World- 3�largest�energy�markets�(N.�America,�Europe�and�Asia�Pacific)Key:
Note:�oil�reserve�figures�do�not�include�unconventional�reserves estimates�� Source:�BP�Data,�IEA�WEO�2004
Oil
80%
15%
Consumption Reserves
Gas
61%
32%
Consumption Reserves
Coal
89%
69%
Consumption Reserves

energy�security�- import�dependence
-20
-15
-10
-5
0
5
10
15
1991 1993 1995 1997 1999 2001 2003
US
Iraq
ME�OPEC�(excl�Iraq)
Other�Dev.�
China
FSU
Importers
Exporters -150
-100
-50
0
50
100
150
200
250
1993 1995 1997 1999 2001 2003
EU
US
Asian�LNG(Japan,�Korea�Taiwan)
Russia�ex�FSU
Other�Europe�pipeline
�Pacific/ME�LNG
Canada
Atlantic�LNG
Importers
Exporters
bcmMb/dOil Natural gas
Import dependence is rising in all the key markets; oil and gas production is also shifting increasingly away from OECD countries to non-OECD

Technology
Demand Growth
• GDP�&�pop.�growth
• urbanisation
• demand�mgmt.
Security of Supply
• import�dependence
• competition
Environmental Constraints
• local pollution
• climate change
Supply Challenges
• significant�resources
• infrastructure
• non-conventionals
key drivers of the energy future
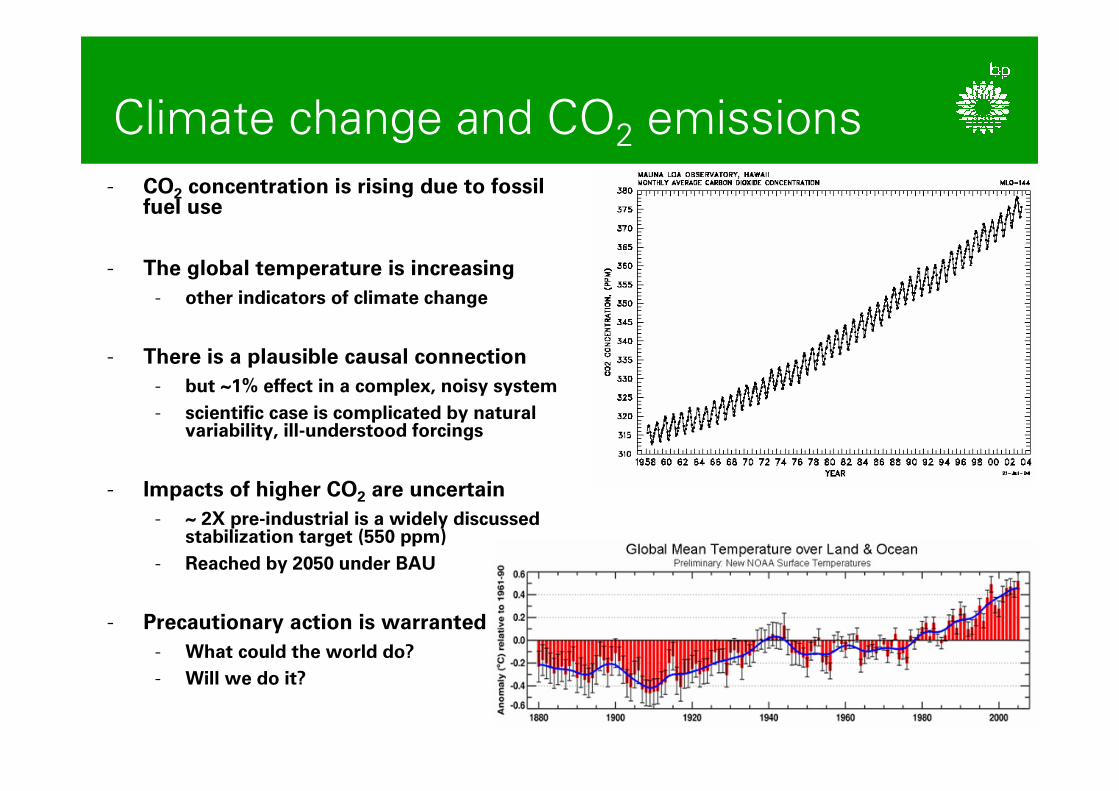
Climate�change�and�CO2 emissions
- CO2 concentration is rising due to fossil fuel use
- The global temperature is increasing
- other indicators of climate change
- There is a plausible causal connection
- but ~1% effect in a complex, noisy system
- scientific case is complicated by natural variability, ill-understood forcings
- Impacts of higher CO2 are uncertain
- ~ 2X pre-industrial is a widely discussed stabilization target (550 ppm)
- Reached by 2050 under BAU
- Precautionary action is warranted
- What could the world do?
- Will we do it?
Salient�facts�about�CO2 science
• The earth absorbs anthropogenic CO2 at a limited rate
– Emissions would have to drop to about half of their current value by the end of this century to stabilize atmospheric concentration at 550 ppm
– This in the face of a doubling of energy demand in the next 50 years (1.5% per year emissions growth)
• The lifetime of CO2 in the atmosphere is ~ 1000 years
– The atmosphere will accumulate emissions during the 21st
Century
– Near-term emissions growth can be offset by greater long-term reductions
– Modest emissions reductions only delay the growth of concentration (20% emissions reduction buys 15 years)

Some�stabilization�scenarios
Emissions Concentration
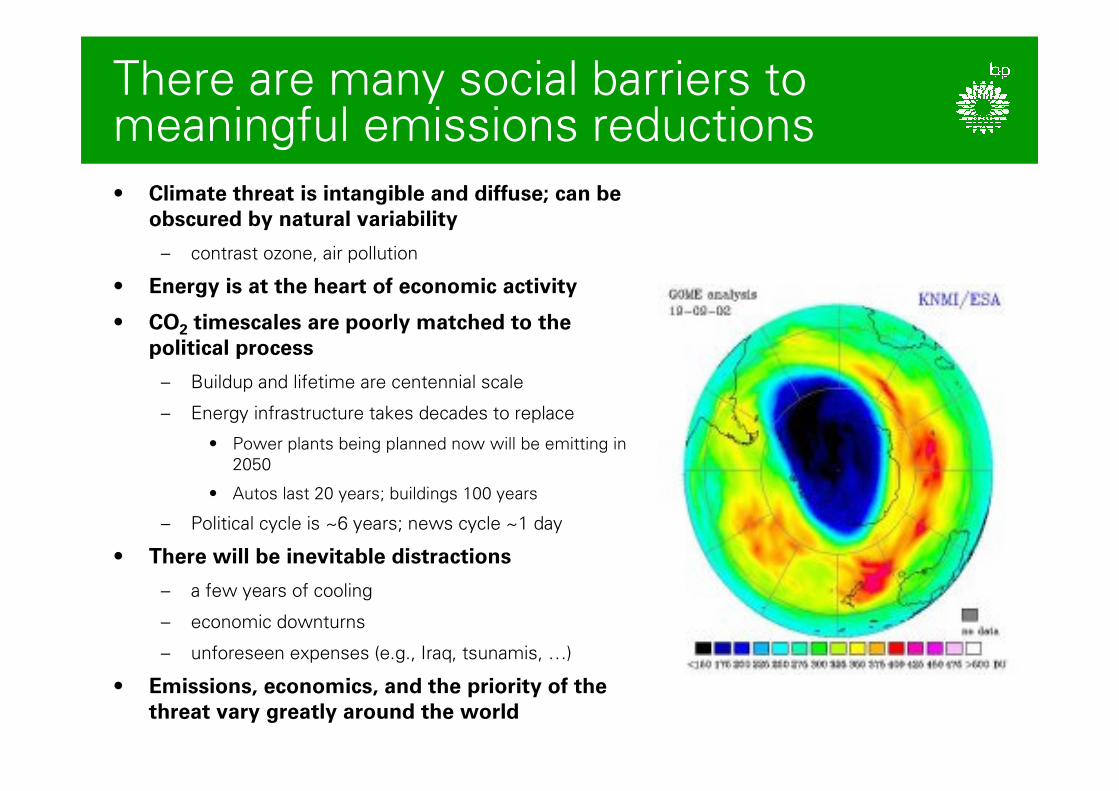
There�are�many�social�barriers�to�meaningful�emissions�reductions
• Climate threat is intangible and diffuse; can be obscured by natural variability
– contrast�ozone,�air�pollution
• Energy is at the heart of economic activity
• CO2 timescales are poorly matched to the political process
– Buildup and�lifetime�are�centennial�scale
– Energy�infrastructure�takes�decades�to�replace
• Power�plants�being�planned�now�will�be�emitting�in�
2050
• Autos�last�20�years;�buildings�100�years
– Political�cycle�is�~6�years;�news�cycle�~1�day
• There will be inevitable distractions
– a�few�years�of�cooling
– economic�downturns
– unforeseen�expenses�(e.g.,�Iraq,�tsunamis,�…)
• Emissions, economics, and the priority of the threat vary greatly around the world
0
5
10
15
20
25
0 5,000 10,000 15,000 20,000 25,000 30,000 35,000 40,000
GDP per capita (PPP, $2000)
CO
2 e
mis
sio
ns p
er capita (tC
O 2)
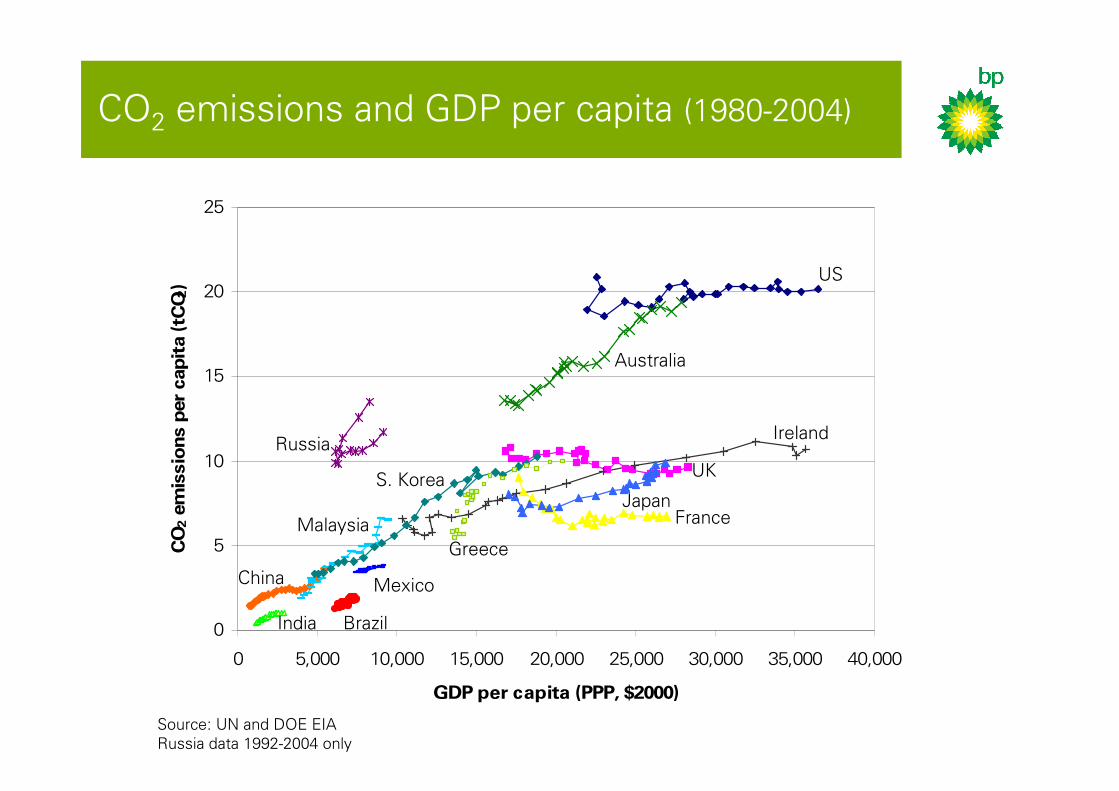
CO2 emissions�and�GDP�per�capita�(1980-2004)
US
Australia
Russia
Brazil
China
India
S.�Korea
Mexico
Ireland
Greece
France
UK
Japan
Malaysia
Source:�UN�and�DOE�EIA
Russia�data�1992-2004�only
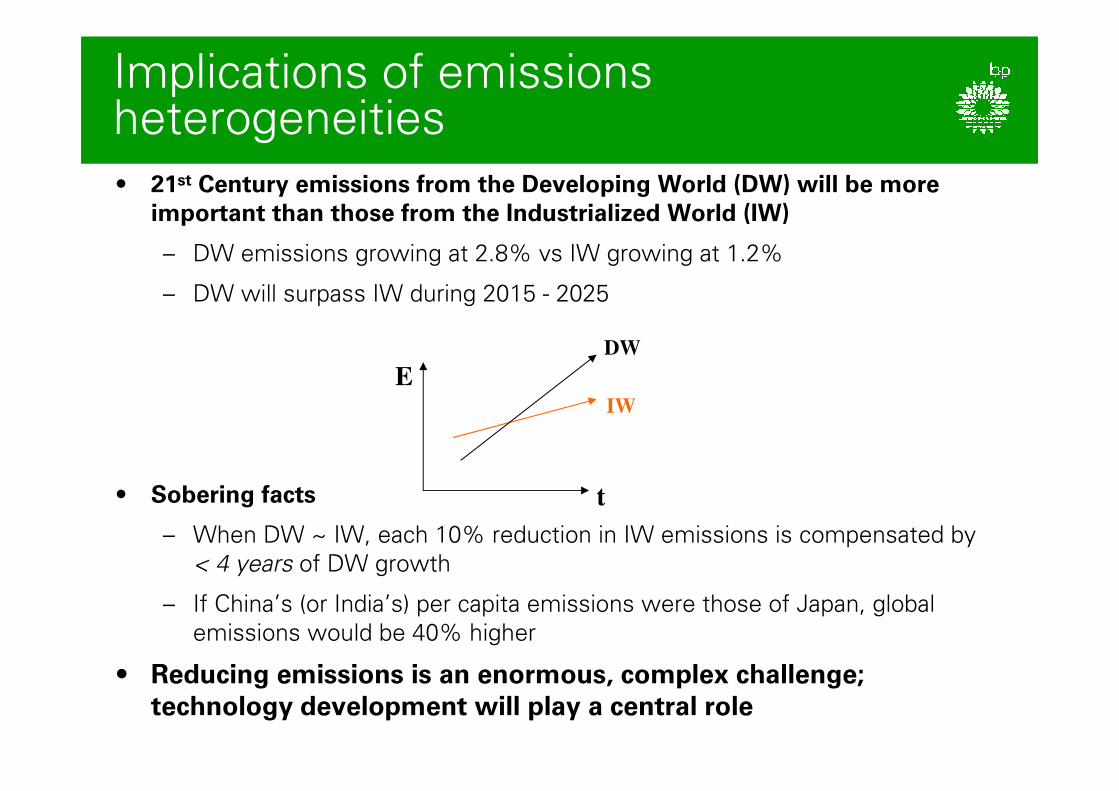
Implications�of�emissions�heterogeneities
• 21st Century emissions from the Developing World (DW) will be more important than those from the Industrialized World (IW)
– DW�emissions�growing�at�2.8%�vs IW�growing�at�1.2%
– DW�will�surpass�IW�during�2015�- 2025
• Sobering facts
– When�DW�~�IW,�each�10%�reduction�in�IW�emissions�is�compensated�by�
< 4 years of�DW�growth
– If�China’s�(or�India’s)�per�capita�emissions�were�those�of�Japan,�global�
emissions�would�be�40%�higher
• Reducing emissions is an enormous, complex challenge; technology development will play a central role
t
E
DW
IW
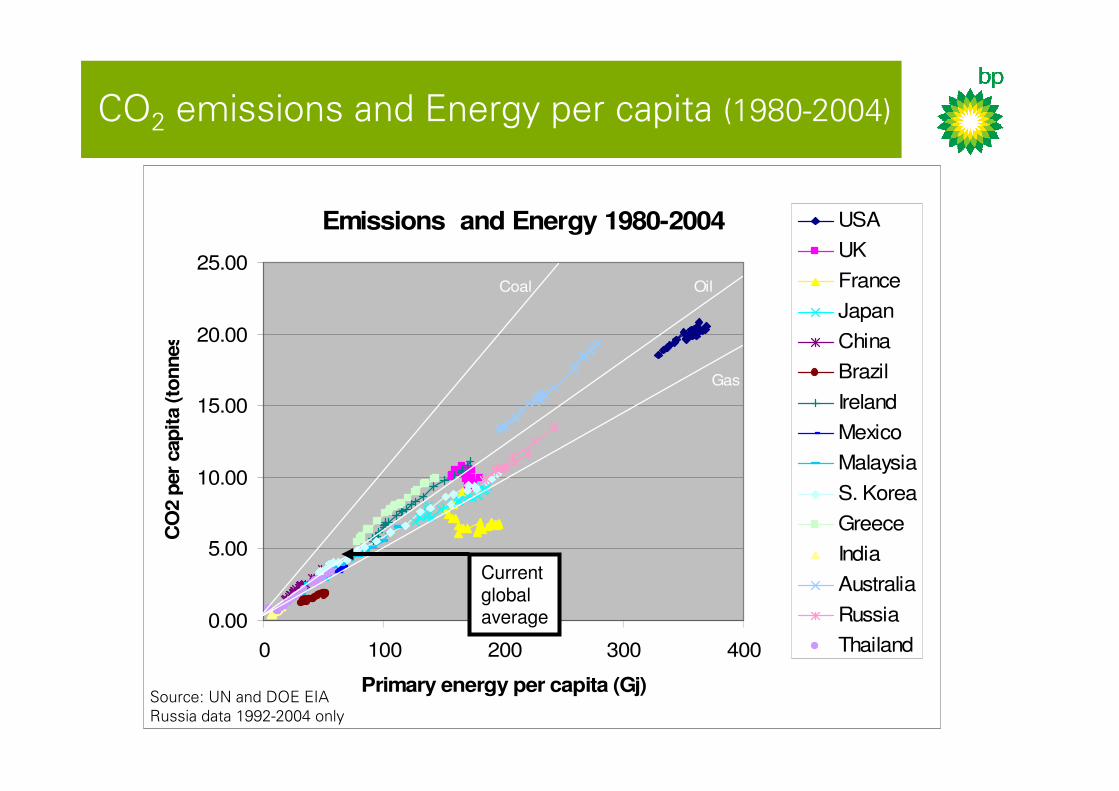
Emissions and Energy 1980-2004
0.00
5.00
10.00
15.00
20.00
25.00
0 100 200 300 400
Primary energy per capita (Gj)
CO
2 p
er
capit
a (
tonnes)
USA
UK
France
Japan
China
Brazil
Ireland
Mexico
Malaysia
S. Korea
Greece
India
Australia
Russia
Thailand
Coal Oil
Gas
Current global average
CO2 emissions�and�Energy�per�capita�(1980-2004)
Source:�UN�and�DOE�EIA
Russia�data�1992-2004�only
Technology
Demand Growth
• GDP�&�pop.�growth
• urbanisation
• demand�mgmt.
Security of Supply
• import�dependence
• competition
Environmental Constraints
• local�pollution
• climate�change
Supply Challenges
• significant�resources
• infrastructure
• non-conventionals
key drivers of the energy future
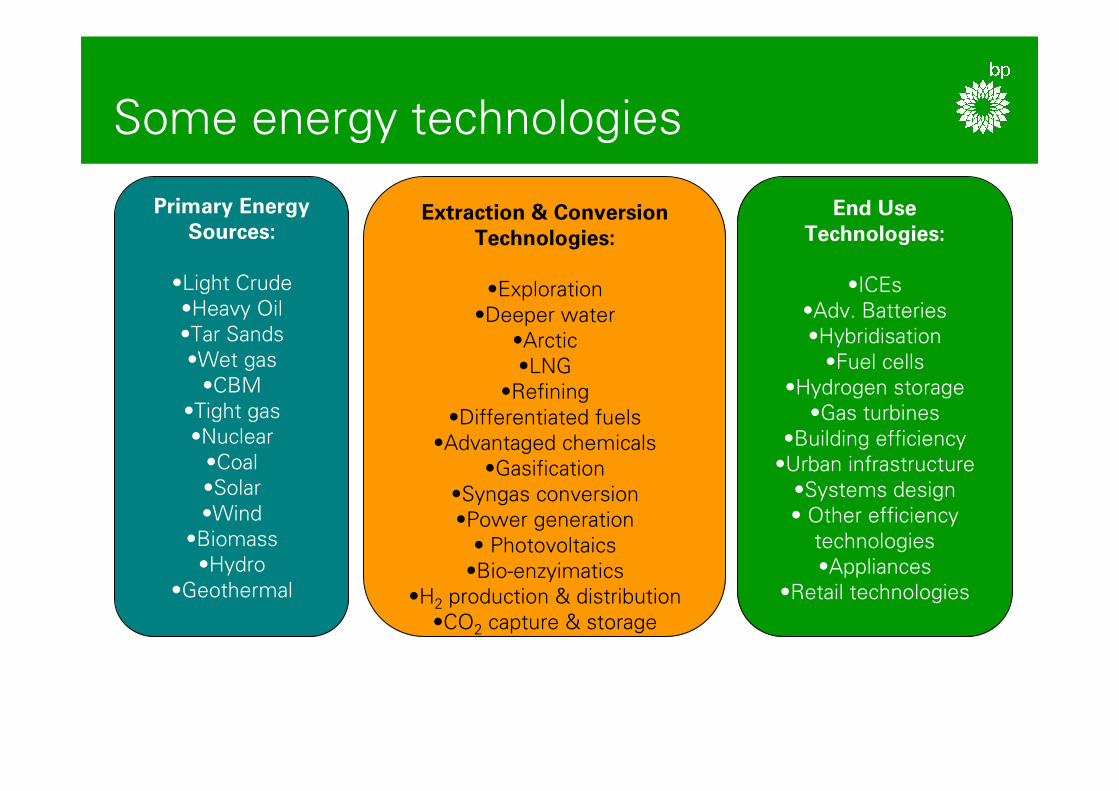
Some�energy�technologies
Primary Energy Sources:
•Light�Crude
•Heavy�Oil
•Tar�Sands
•Wet�gas
•CBM
•Tight�gas
•Nuclear
•Coal
•Solar
•Wind
•Biomass
•Hydro
•Geothermal
Extraction & Conversion Technologies:
•Exploration
•Deeper�water
•Arctic
•LNG
•Refining
•Differentiated�fuels
•Advantaged�chemicals
•Gasification
•Syngas�conversion
•Power�generation
• Photovoltaics
•Bio-enzyimatics
•H2 production�&�distribution
•CO2 capture�&�storage
End Use Technologies:
•ICEs
•Adv.�Batteries
•Hybridisation
•Fuel�cells
•Hydrogen�storage
•Gas�turbines
•Building�efficiency
•Urban�infrastructure
•Systems�design
• Other�efficiency�
technologies
•Appliances
•Retail�technologies

evaluating�energy�technology�options
• Current�technology status and�plausible�technical headroom
• Budgets for�the�three�E’s:
− Economic (cost�relative�to�other�options)
− Energy (output�how�many�times�greater�than�input)
− Emissions (pollution�and�CO2;�operations�and�capital)
• Materiality (at�least�1TW�=�5%�of�2050�BAU�energy�demand)
• Other costs - reliability,�intermittency�etc.
• Social�and�political�acceptability
But we also must know what problem we are trying to solve

Concern relating to Threat of Climate Change
Concern
over
Futu
re
Availabilit
y o
f O
il a
nd G
as
High
High
Low
Low
Adv. Biofuels
Carbon Free H2 for
Transport
CTL
GTL
Heavy Oil
EnhancedRecovery
Ultra Deep Water
Arctic
Capture�&�
Storage
Capture�&�
Storage
CNG
Hybrids
C&S
Vehicle Efficiency (e.g. light
weighting)
- supply�side�options
- demand�side�options
Key:Dieselisation
Conv. Biofuels
two�key�energy�considerations�– security�&�climate

The�fungibility of�carbon
Primary Energy Conversion Technology Products
Reforming
Coal
Natural�
Gas
Biomass
Extra�
Heavy�
Oil
Markets
SyngasConversion
- FT
- Oxygenates
- Chemicals
Gasification
Enzymatic/Biological�Conversion
PowerGeneration
Electricity
Fuels
Chemicals
Refining Processes- coking
- hydro-treating
- novel�thermal�processes
CO2 Capture
CO2 for EOR/Storage

what�carbon�“beyond�petroleum”?
Fuel Fossil Agriculture Biomass
0
100
200
300
400
500
600
700G
asol
ine
Die
sel
Coa
lNat
ural
gas
Oth
er p
etro
leum
NG
LsCor
nPap
er
SoyW
oodpu
lpW
heat
Edible fa
ts/o
ilsM
eat/P
oultr
yCot
ton
Biom
ass to
day
Biom
ass po
tent
ial
An
nu
al U
S C
arb
on
(M
t C
)
↑↑
15% of 15% of
Transportation FuelsTransportation Fuels
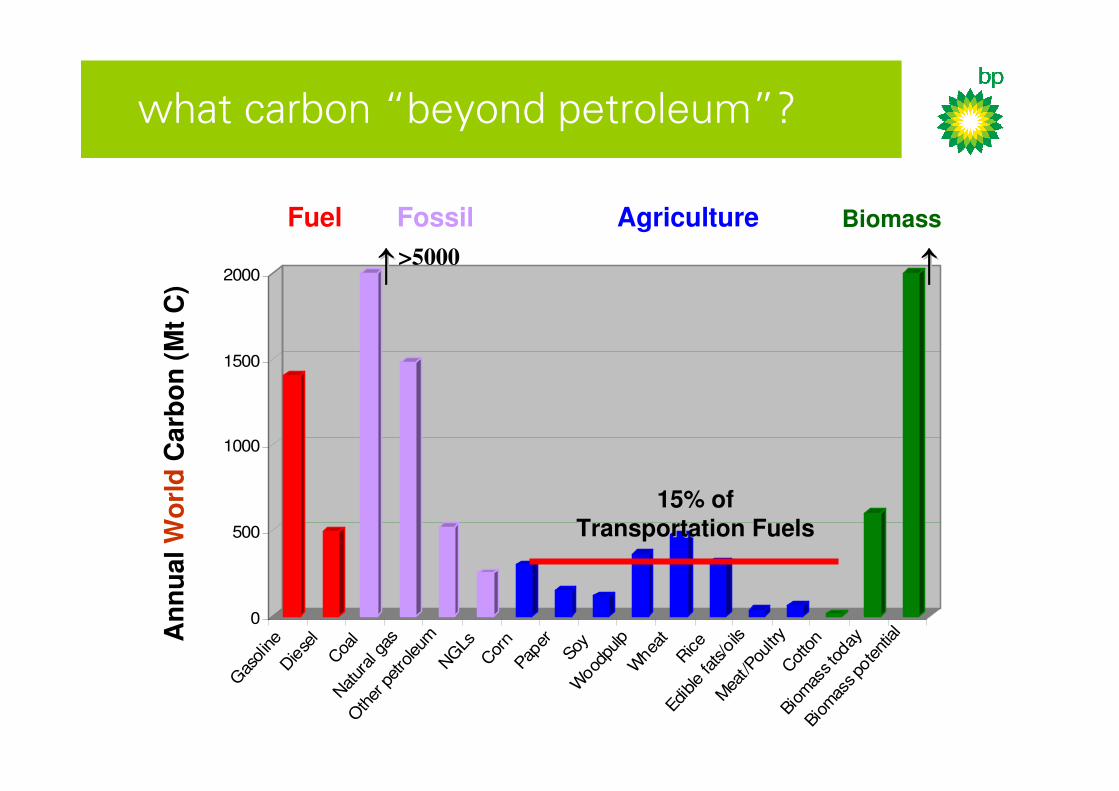
what�carbon�“beyond�petroleum”?
Fuel Fossil Agriculture Biomass
0
500
1000
1500
2000
Gas
oline
Diese
lCoa
lNat
ural g
as
Other
petro
leum
NG
LsCor
nPa
per
Soy
Woo
dpulp
Whe
atRice
Edible fa
ts/o
ilsMea
t/Pou
ltry
Cot
ton
Biom
ass to
day
Biom
ass po
tentialAn
nu
al W
orl
dC
arb
on
(M
t C
)
↑↑
15% of 15% of
Transportation FuelsTransportation Fuels
↑↑>5000

Evaluating�power�optionsC
oncern
over
Futu
re
Availabilit
y o
f O
il a
nd G
as
High
High
Low
Low
Hydro
Nuclear
Solar
Wind
Biomass
power sector
Coal
Gas CCGT
Geothermal
Hydrogen Power
Unconventional Gas
- power�generation�options
- supply�option
Key:
Concern relating to Threat of Climate Change
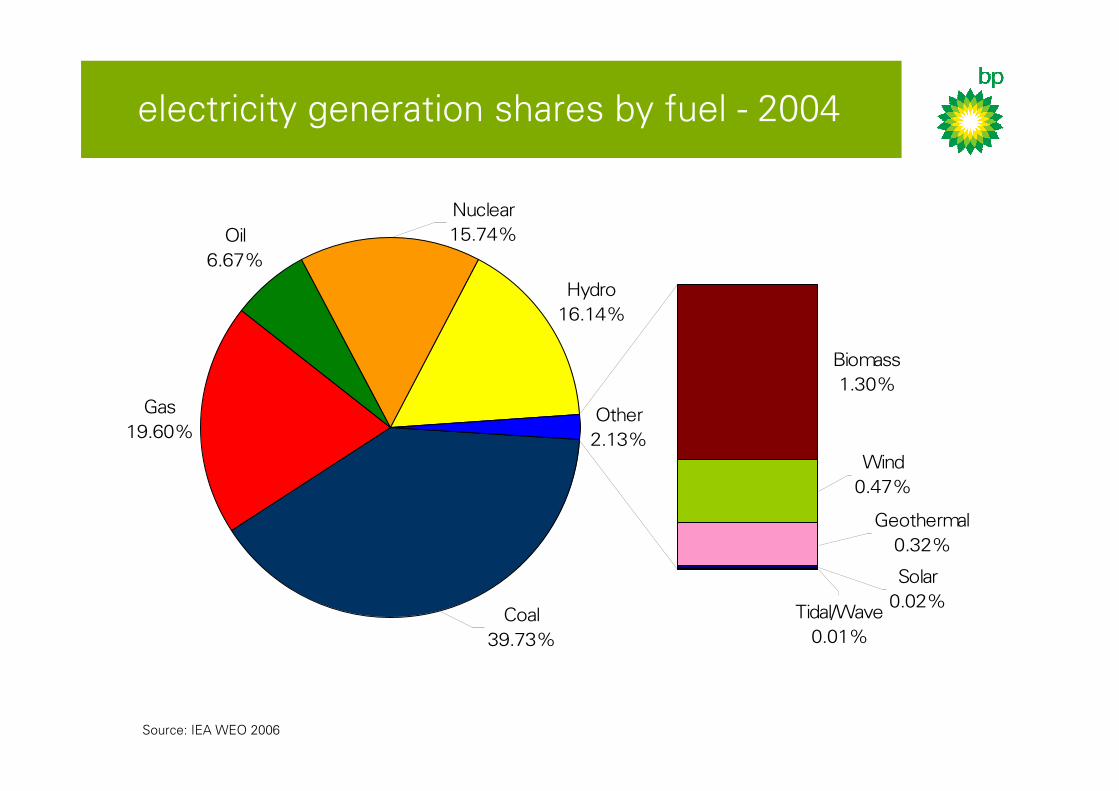
Source:�IEA�WEO�2006
Gas
19.60%
Oil
6.67%
Hydro
16.14%
Biomass
1.30%
Other
2.13%
Coal
39.73%
Nuclear
15.74%
Geothermal
0.32%
Wind
0.47%
Solar
0.02%Tidal/Wave
0.01%
electricity�generation�shares�by�fuel�- 2004�

0
25
50
75
100
125
150
175
200
225
CC
GT, gas
$4/m
mbtu
Coal $40/t
onne
Hydro
gen P
ow
er
Gas, $4/m
mbtu
Hydro
gen P
ow
er
Coal $40/t
onne
Nucle
ar
Onshore
Win
d
Offshore
Win
d
Bio
mass
Gasific
ation
Wave /
Tid
al
Sola
r (R
eta
il C
ost)
levelised�costs�of�electricity�generation
Low/Zero�carbon�energy�source Renewable�energy�sourceFossil�energy�source
Source: BP Estimates, Navigant Consulting
Cost
of Ele
ctr
icit
y G
enera
tion
9%
IR
R ($/M
Wh)
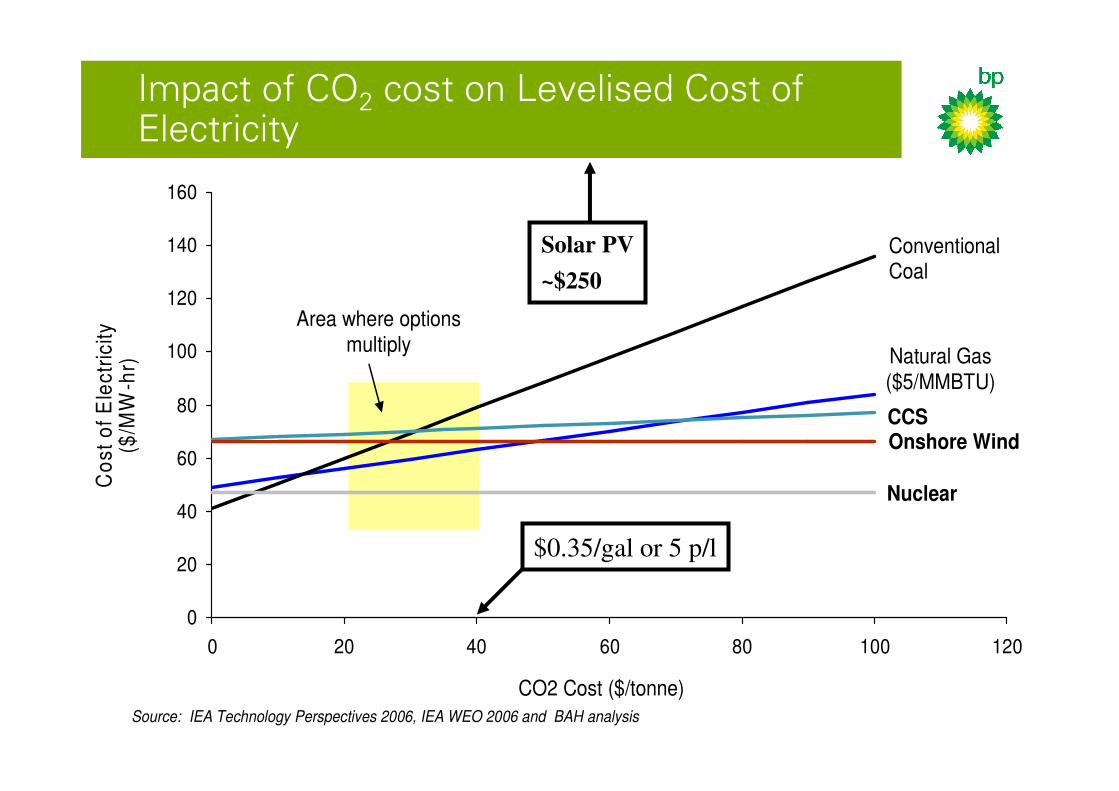
Impact�of�CO2 cost�on�Levelised Cost�of�Electricity
0
20
40
60
80
100
120
140
160
0 20 40 60 80 100 120
CO2 Cost ($/tonne)
Source: IEA Technology Perspectives 2006, IEA WEO 2006 and BAH analysis
Notes: 1) Add solar 2) $40/tonne CO2 cost or tax is $0.35/gallon of gasoline or $0.09 (or 5p)/litre
Co
st
of
Ele
ctr
icit
y($
/MW
-hr)
Conventional Coal
Natural Gas ($5/MMBTU)
CCS
Nuclear
Onshore Wind
Area where options multiply
$0.35/gal or 5 p/l
Solar PV
~$250
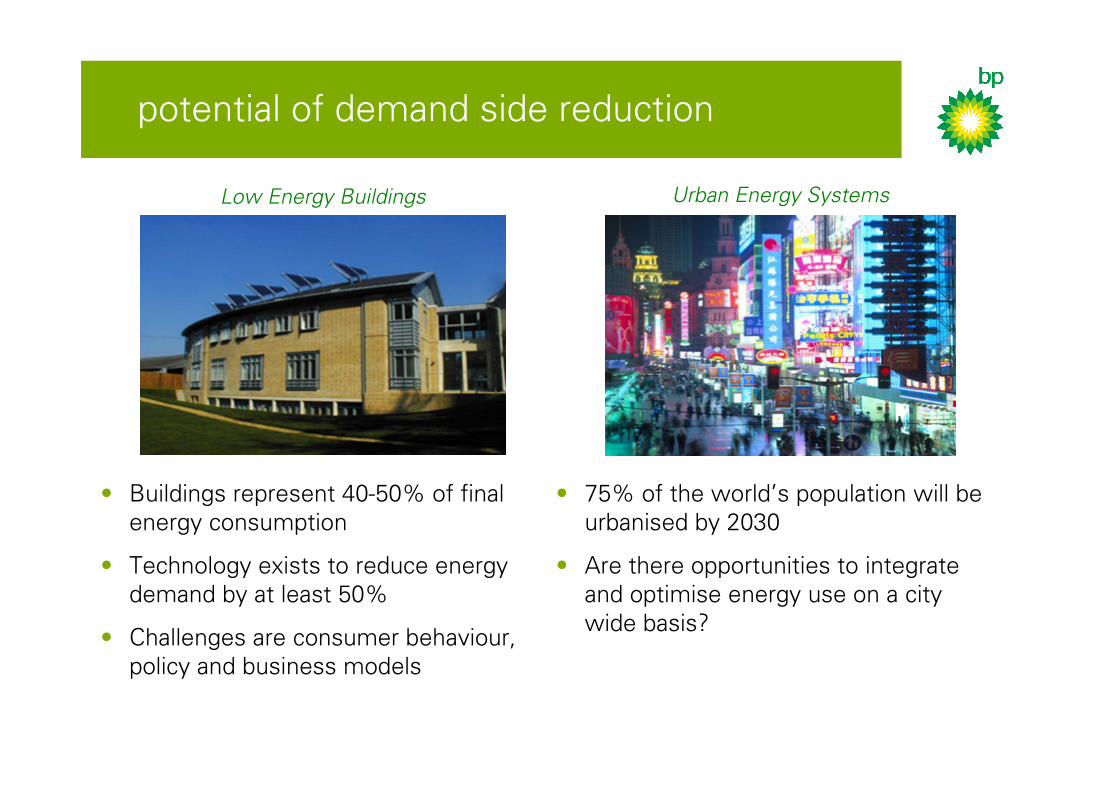
potential�of�demand�side�reduction
Low Energy Buildings
• Buildings�represent�40-50%�of�final�
energy�consumption
• Technology�exists�to�reduce�energy�
demand�by�at�least�50%�
• Challenges�are�consumer�behaviour,�
policy�and�business�models
Urban Energy Systems
• 75%�of�the�world’s�population�will�be�
urbanised�by�2030�
• Are�there�opportunities�to�integrate�
and�optimise�energy�use�on�a�city�
wide�basis?
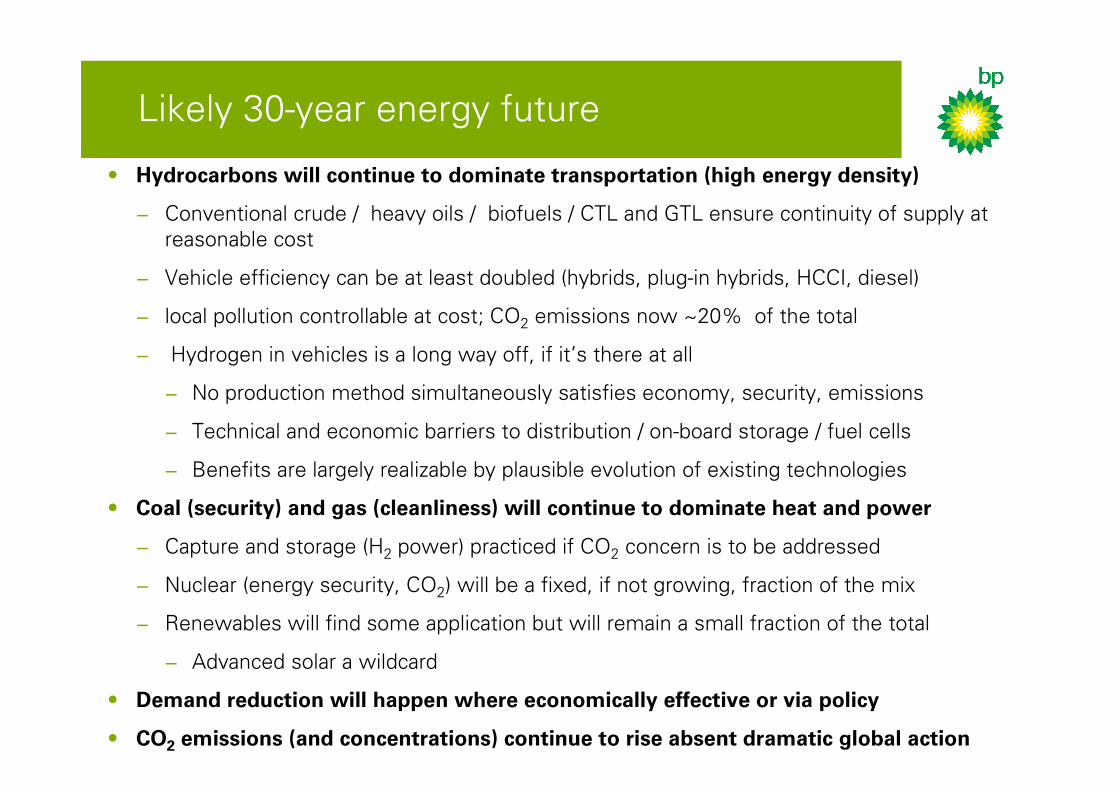
Likely�30-year�energy�future
• Hydrocarbons will continue to dominate transportation (high energy density)
− Conventional�crude�/��heavy�oils�/��biofuels /�CTL�and�GTL�ensure�continuity�of�supply�at�
reasonable�cost
− Vehicle�efficiency�can�be�at�least�doubled�(hybrids,�plug-in�hybrids,�HCCI,�diesel)
− local�pollution�controllable�at�cost;�CO2 emissions�now�~20%��of�the�total
− Hydrogen�in�vehicles�is�a�long�way�off,�if�it’s�there�at�all
− No�production�method�simultaneously�satisfies�economy,�security, emissions
− Technical�and�economic�barriers�to�distribution�/�on-board�storage�/�fuel�cells
− Benefits�are�largely�realizable�by�plausible�evolution�of�existing�technologies
• Coal (security) and gas (cleanliness) will continue to dominate heat and power
− Capture�and�storage�(H2 power)�practiced�if�CO2 concern�is�to�be�addressed
− Nuclear�(energy�security,�CO2)�will�be�a�fixed,�if�not�growing,�fraction�of�the�mix
− Renewables will�find�some�application�but�will�remain�a�small�fraction�of�the�total
− Advanced�solar�a�wildcard
• Demand reduction will happen where economically effective or via policy
• CO2 emissions (and concentrations) continue to rise absent dramatic global action
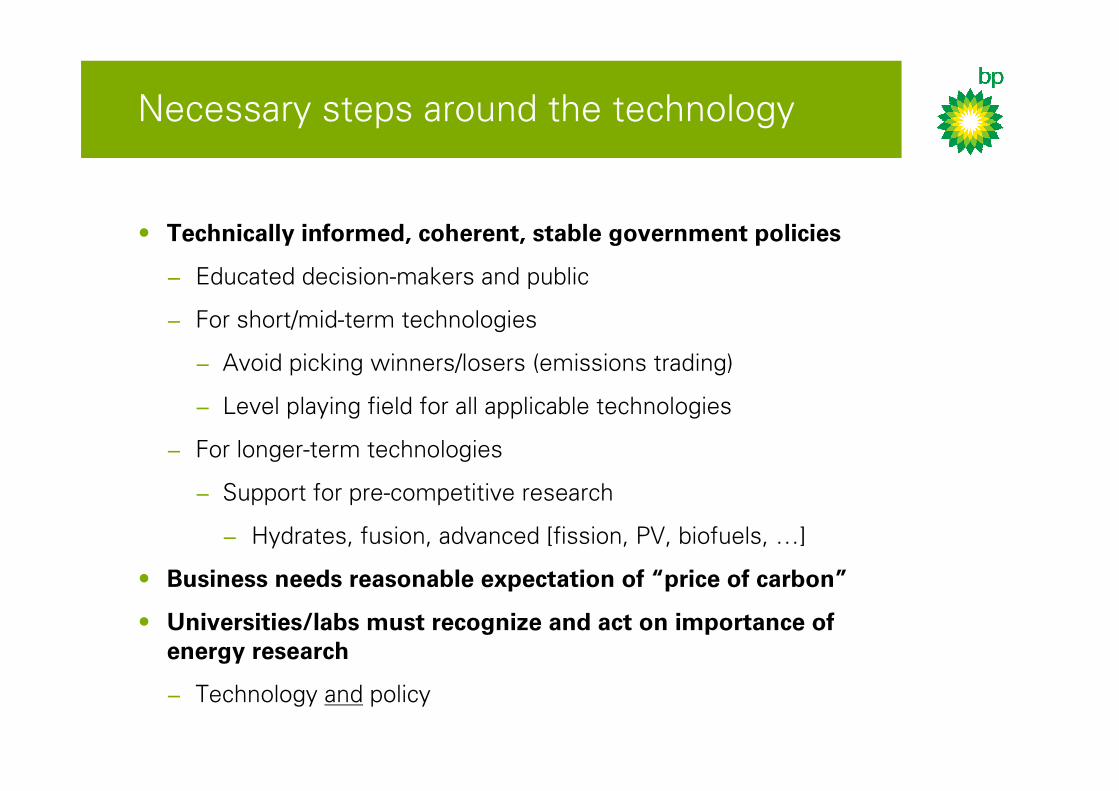
Necessary�steps�around�the�technology
• Technically informed, coherent, stable government policies
− Educated�decision-makers�and�public
− For�short/mid-term�technologies�
− Avoid�picking�winners/losers�(emissions�trading)
− Level�playing�field�for�all�applicable�technologies
− For�longer-term�technologies�
− Support�for�pre-competitive�research
− Hydrates,�fusion,�advanced�[fission,�PV,�biofuels,�…]
• Business needs reasonable expectation of “price of carbon”
• Universities/labs must recognize and act on importance of energy research
− Technology�and policy

Questions/Comments/Discussion
