stimulus 2
DESCRIPTION
stimulusTRANSCRIPT
7/17/2019 Stimulus 2
http://slidepdf.com/reader/full/stimulus-2 1/39
“Politics, Promises, and Partisanship?An Analysis of President Obama’s Economic Stimulus Plan
at the Congressional District e!el"#
$ichard S% ConleyAssociate Professor
Department of Political Science&ni!ersity of 'lorida()* Anderson +all
aines!ille, ' )(-../)0(1 (2)3()40
rconley5ufl%edu
# Paper prepared for the conference “6he Obama Presidency7 A Preliminary Assessment," .83(9 :o!ember (9.9, &ni!ersity of Southern ;ississippi < ulf Coast Campus%
7/17/2019 Stimulus 2
http://slidepdf.com/reader/full/stimulus-2 2/39
A=S6$AC6
6his research focuses on President Obama’s signature economic plan adopted in'ebruary (998>the American $eco!ery and $ein!estment Act /A$$A1% &sing data a!ailable
from $eco!ery%go!, the analysis refines prior efforts to test the thesis that partisanship has playeda central role in the distribution of funds across congressional districts by distinguishing beteentotal spending on infrastructure and non3infrastructure programs as of the end of the second@uarter of (9.9% 'urther, this research eamines not only political and demographic factorsrelati!e to the locus of stimulus fund ependitures but also the epected and actual employmentimpact of A$$A by district% 6he analysis pro!ides little e!idence for the partisan theory ofstimulus spending% $ather, the results accentuate the demographic characteristics of the districtsthat ha!e thus far recei!ed stimulus money and putati!ely benefitted from the most Bobs, in someays counter to hat the hite +ouse may ha!e intended due to the compleities of fiscalfederalism%
7/17/2019 Stimulus 2
http://slidepdf.com/reader/full/stimulus-2 3/39
On .) 'ebruary (998 the Democratic maBority of the ne ...th Congress passed the
American $eco!ery and $ein!estment Act /A$$A1>the largest spending measure e!er adopted
in the history of the $epublic% Democrats on Capitol +ill numbered the bill +ouse $esolution
/+%$%1 . to underscore their commitment, and reinforce President =arac Obama’s promise, to
act epeditiously to stimulate a sagging economy folloing the (994 elections% 242 billion in
tapayer funds ere allocated o!er .- @uarters /* years1 to bolster ailing state and local
go!ernments and put the unemployed bac to or% +ouse Speaer :ancy Pelosi /D3CA1
contended that “ith a mi of ta cuts for middle income families and American businesses,
combined ith targeted in!estments in energy independence, infrastructure, health care, and
education," the stimulus pacage had been “carefully targeted to ha!e the most Fbang for the
buc’ in creating Bobs and spurring economic long3term groth%" 6he Speaer asserted
optimistically that the bill ould create or “sa!e" o!er ) million Bobs%.
hen he signed the bill on .2 'ebruary (998 President Obama posited that his
administration ould “ensure that e!ery dollar spent in this historic legislation is spent isely
and for its intended purpose%" 6he president pledged to hold the federal go!ernment to “ne
standards of transparency and accountability" by appointing Gice President Hoe =iden to o!ersee
the economic reco!ery effort and transmit data and information to the public% Pi!otally, the
president asserted that the legislation included no “earmars" directed at special or congressional
constituencies%(
A$$A dre not a single $epublican !ote in the +ouse of $epresentati!es and only three
rand Old Party /OP1 !otes of *9 in the Senate% $epublicans criticiIed programs in the bill
that they argued ould ha!e no positi!e impact on the economy>Bust the in!erse>and painted
the pacage as a Democratic boondoggle% 6he OP lambasted a host of proBects, including the
7/17/2019 Stimulus 2
http://slidepdf.com/reader/full/stimulus-2 4/39
millions of dollars appropriated to the :ational Endoment for the Arts, to community groups
ith ties to Obama /ACO$:1, and for rebates to consumers for the purchase of such things as
analog3to3digital tele!ision con!erters% 'urther, federal and congressional sources pro!ided OP
leaders ammunition to challenge the economic isdom of the massi!e spending bill% 6he
'ederal $eser!e noted that the appropriated funds nearly e@ualed the entire national money
supply in current circulation% One report by the non3partisan Congressional =udget Office
/C=O1 proBected that after (9.* the bill’s impact ould loer the ross Domestic Product
/DP1 to 9 or potentially 3( percent annually by adding significantly to an already burgeoning
deficit% And the Census =ureau estimated that the true cost of the bill ould amount to more
than . trillion ith interest, costing each household in America 8,*.4%) +ouse ;inority
eader Hohn =oehner /$3O+1 said the OP regarded the bill as “a lot of asteful ashington
spending, padding the bureaucracy and doing nothing to help create Bobs and preser!e Bobs%"*
'or his part, Senate ;inority eader ;itch ;cConnell /$3JK1 denounced Obama and
congressional Democrats for the stimulus pacage as part of an allegedly “audacious effort to
EuropeaniIe the country" and to “pass hat appears to be a thirty3year ish list of the more
liberal elements of their party%"0
6hree issues ha!e dominated the debate about A$$A since data on the distribution of
funds and the bill’s putati!e Bob impacts ere made a!ailable to the public% 6he first concerns
the le!els of transparency and accountability for the dollars spent for stimulus proBects% 'rom its
inception $eco!ery%go!, the official ebsite that details the allocation of funds, as idely
criticiIed for inaccurate and erroneous figures% As information from the ebsite became
a!ailable in 'all (998 media in!estigations re!ealed money spent in congressional districts that
did not eist>from :e ;eico’s “.)th, )0th, and *9th" districts and South Carolina’s “(0th
(
7/17/2019 Stimulus 2
http://slidepdf.com/reader/full/stimulus-2 5/39
district," to the “.0th" congressional district in AriIona and se!en non3eistent districts in
California, including district 88%- 6he group atchdog%org disco!ered that -%* billion had
allegedly been spent in **9 of these “phantom" congressional districts% Ln a different tist, the
o!ernment Accountability Office /AO1 unco!ered *,999 line items for hich no money had
been spent but 09,999 full3time Bobs had allegedly been created%2 hile inputting errors ere
largely responsible for the faulty data, media reports on the inaccuracies did little to inspire
confidence in the general public about either the efficacy of the stimulus pacage or
go!ernmental o!ersight%
6he second issue centers on the accuracy of the Bobs reported to ha!e been created or
“sa!ed" by A$$A in the nation’s *)0 congressional districts% Ln 'ebruary (998 the hite +ouse
had published a report,4 based on an earlier analysis by Christina $omer of the Council of
Economic Ad!isors and Hared =ernstein of the Office of the Gice President3Elect,8 that pro!ided
a district3by3district forecast modeled by population, employment, and the industrial composition
of the state% Analysis of the figures shoed that the a!erage congressional district ould benefit
from Bust o!er 2,899 Bobs to be sa!ed or created% As the 'ort ayne, Lndiana, News Sentinel
noted, hoe!er, the alleged Bob benefits in most states ere remarably uniform>typically
ranging from -,099 to Bust o!er 8,999%.9 6he early reporting on Bob impacts appeared
contradictory% Detractors of A$$A, such as $epresentati!e Him Hordan /$3O+1, pointed out that
by :o!ember (998 only se!eral hundred Bobs ere reported to ha!e been created or sa!ed in his
district, not se!eral thousand%.. Ket in other cases, as in 6eas, the nearly (9,999 Bobs stateide
appeared to ha!e been seriously o!erstated%.(
6he interaction of to factors as liely at the root of the problem% 'irst, $eco!ery%org
offers no uniform definition of hat constitutes a created or “sa!ed" Bob% Second, recipients self3
)
7/17/2019 Stimulus 2
http://slidepdf.com/reader/full/stimulus-2 6/39
report the data, and ha!e little guidance on ho to report Bobs figures% As a result, as se!eral
USA Today in!estigations found, not only did many recipients fail to complete the reporting
forms correctly but many grossly o!erestimated the number of Bobs affected by stimulus money%.)
Such errors compelled Earl De!aney, chair of the $eco!ery Accountability and 6ransparency
=oard, to @uestion the accuracy of claims by the hite +ouse in :o!ember (998 that -*9,999
Bobs had been sa!ed or created nationide since A$$A had been passed%.*
6he final and most political issue has been critics’ indictment that the stimulus pacage
as a !eiled partisan instrument by the hite +ouse, +ouse Speaer :ancy Pelosi, and Senate
;aBority eader +arry $eid to direct spending toard Democratic districts and aid party
incumbents for reelection in (9.9 and beyond% Ln December (998 scholars at the ;ercatus
Center of eorge ;ason &ni!ersity analyIed data on $eco!ery%go! and contended that by the
fourth @uarter of (998, Democratic districts had recei!ed .%48 times more stimulus money than
$epublican districts%.0 6he ;ercatus study instantly spared contro!ersy, pro!iding
conser!ati!es ith fodder to condemn the bill in media circles%
Lronically, only a fe print media analyses unco!ered a fundamental fla in the ;ercatus
study% Congressional districts representing state capitol districts had recei!ed highly
disproportionate sums of stimulus money because transfer payments for statewide programs
in!ol!ing transportation, education, etc%>for hich no specific geographic or district benefit
could be identified>had been attributed to the state capitol member’s district%.- :ot
surprisingly, the big “inners" ere Democratic members representing Albany, Austin,
Sacramento, and 6allahassee>the capitols of the most populous states in the nation% 6he
;ercatus Center updated its data analysis through Spring (9.9 and attempted to account for
stateide funds reported in state capitol congressional districts%.2 &sing findings from a ne
*
7/17/2019 Stimulus 2
http://slidepdf.com/reader/full/stimulus-2 7/39
regression analysis, one of the authors of the study, Geroni@ue de $ugy, testified before the
+ouse Committee on 6ransportation and Lnfrastructure on (- ;arch (9.9 and posited that
Democrats ere still more hea!ily fa!ored to recei!e stimulus funds>this time by a factor of
.%0)%
6his author’s re3analysis of the data from the regression analysis presented to the +ouse
Committee, a!ailable on the ;ercatus ebsite, re!ealed se!eral flas>including significant
heterosedasticity /non3constant !ariance1 in the dependent !ariable /the log of total spending by
congressional district1, significant colinearity beteen se!eral !ariables in the regression model
/log of income and district po!erty rate1, and an incorrect interpretation of the coeffecients based
on the natural log transformation of stimulus spending /hich is no longer linear in nature1%
6hese serious methodological issues in the ;ercatus study call into considerable @uestion the
accuracy of the measurements and the interpretations used to Bustify the partisan thesis%
6he obBecti!e of this chapter is to pro!ide a fresh and obBecti!e analysis of the
President’s signature economic plan ith a focus on stimulus spending at the congressional
district le!el% 6he analysis refines prior efforts to test the partisan thesis by distinguishing
beteen total spending on infrastructure and non3infrastructure programs% 'urther, this research
mo!es beyond the ;ercatus study to eamine political and demographic factors relati!e to the
epected and actual employment impact of A$$A by district%
6he chapter commences ith a brief re!ie of the politics and economics of
go!ernmental stimulus choices, and epectations for A$$A according to “old" and “ne"
Jeynesian models% 6he second section re!ies the methodology utiliIed to analyIe district3le!el
spending through the second @uarter of (9.9, as reported in the state summaries from
$eco!ery%go!% 6he third section presents the results of the analysis, and underscores !ery little
0
7/17/2019 Stimulus 2
http://slidepdf.com/reader/full/stimulus-2 8/39
support for the partisan theory of stimulus spending% $ather, the results accentuate the
demographic characteristics of the districts that ha!e thus far recei!ed stimulus money and
putati!ely benefitted from the most Bobs, in some ays counter to hat the hite +ouse may
ha!e intended due to the compleities of fiscal federalism% 6he final section emphasiIes the
implications of the findings for President Obama’s and congressional Democrats’ attempt to
re!i!e the &S economy in ad!ance of the mid3term election results of :o!ember (9.9%
The Political Economy of Governmental Stimulus: Monetary and Fiscal Policy Options and
the American Recovery and Reinvestment Act of 2!
o!ernmental strategies to counter cyclical economic donturns fall into se!eral
categories, none of hich is mutually eclusi!e7 ;onetary policy and fiscal policy /taing andMor
spending1% ;onetary policy>the supply of money and regulation of interest rates>is controlled
by the 'ederal $eser!e =an /'ed1% As Elmendorf and 'urman contend, “Economists belie!e
that monetary policy should play the lead role in stabiliIing the economy because of the 'ederal
$eser!e’s ability to act @uicly and effecti!ely to adBust interest rates, using its technical
epertise and political insulation to balance competing priorities%".4 oering the federal funds
andMor discount rates enables bans to lend more money, and can put more cash into the hands of
consumers ho pay less for interest on loans such as credit cards, automobiles, and mortgages%
hile the 'ed must balance concerns about inflation, such a strategy is designed to stimulate a
sluggish economy through enhanced consumer spending and li@uidity a!ailable to businesses for
in!estment and hiring% i!en that approimately to3thirds of the &S economy depends on
consumer spending, and small3to3medium businesses create the greatest share of ne
employment opportunities, the benefits of @uic monetary policy action cannot be
underestimated%
-
7/17/2019 Stimulus 2
http://slidepdf.com/reader/full/stimulus-2 9/39
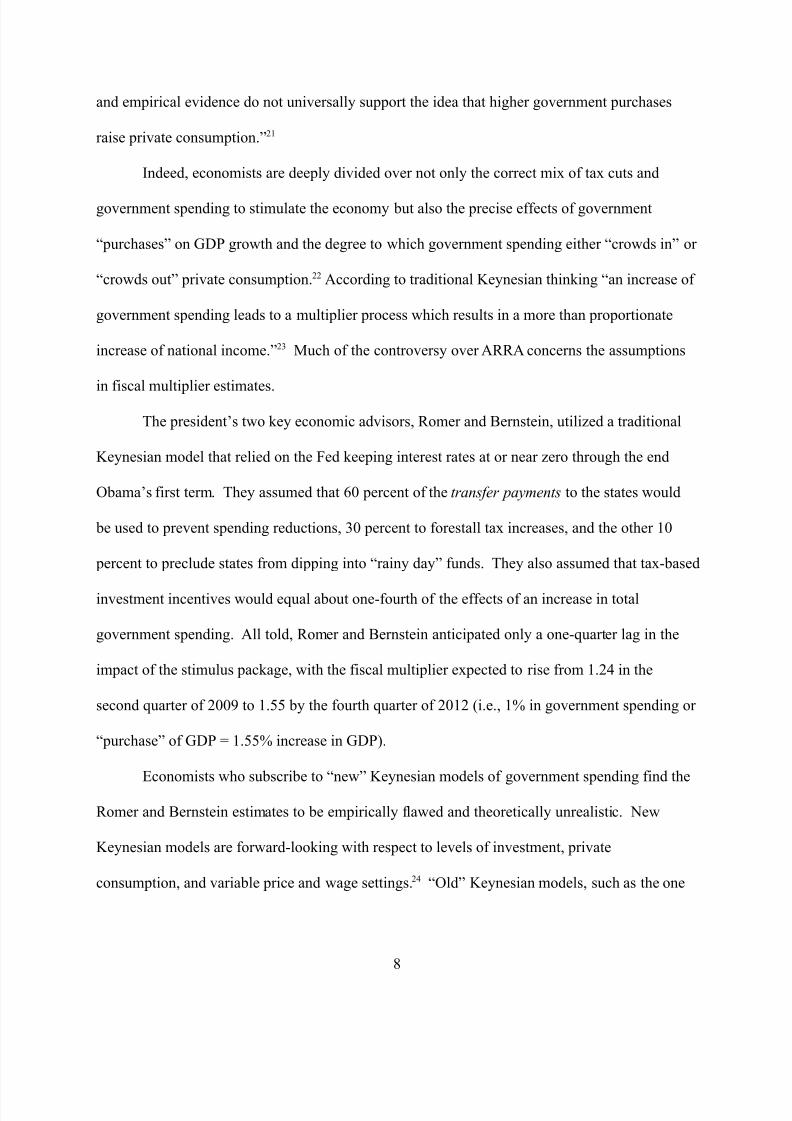
hen President Obama too office in Hanuary (998 there as little margin for the
'ederal $eser!e to maneu!er, hoe!er much he and hite +ouse ad!isors may ha!e ished that
'ed chief =en =ernane could utiliIe monetary policy to Bump start the faltering economy% As
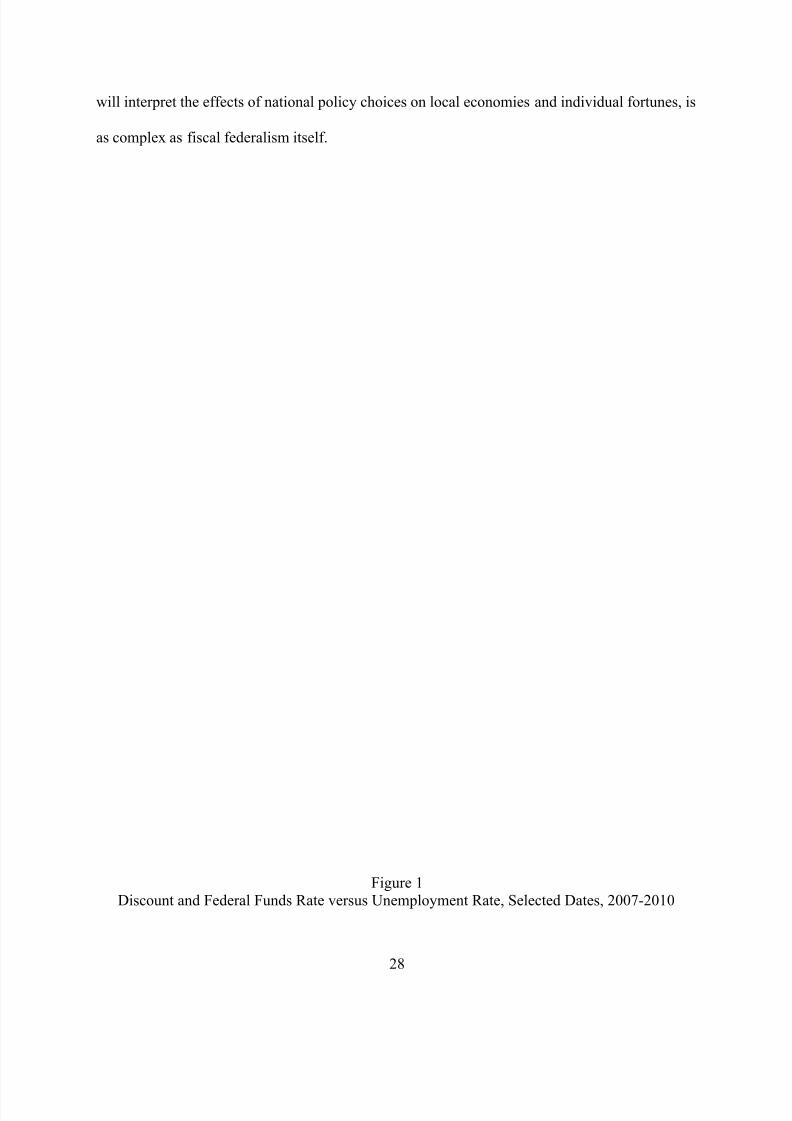
'igure . shos, the 'ed had steadily mo!ed interest rates donard since (992 to ard off a
recession% hen the bottom fell out of financial marets and the housing bubble burst ith the
sub3prime mortgage crisis in September (994, the 'ed mo!ed e!en more decisi!ely>tice in
October (994>to cut the federal funds rate by half and the discount rate by a third o!er the prior
month% =y mid3December (994 the federal funds rate stood at %09 percent, and the discount rate
at beteen 93%(0 percent /first y3ais1, yet unemployment had risen dramatically and as
approaching 4 percent /second y3ais1%
N'igure .
ith interest rates near Iero the stimulus choice for Obama and the Democratic maBority
in the ...th Congress as beteen some type of ta decrease andMor enhanced go!ernmental
spending% 6he alternati!es ere perhaps less ad!antageous as a countercyclical tool compared to
monetary policy, as fiscal policy lag effects tend to be greater%.8 :onetheless, the o!erriding
obBecti!e for President Obama’s economic team as to spur pri!ate consumption and the
demand for labor as a means to combat unemployment as @uicly as possible% Some economists
suggested that the Iero floor in interest rates to hich the 'ed seemed to be approaching
pro!ided a particularly uni@ue opportunity for the “fiscal multipliers">the net payoff in DP
from increased go!ernment spending in a stimulus pacage>to be @uite large%(9 6he irony, as
Da!ig and eeper contend, is that “the consumption response to an increase in go!ernment
spending is the linchpin in the transmission mechanism for fiscal stimulus" but “economic theory
2
7/17/2019 Stimulus 2
http://slidepdf.com/reader/full/stimulus-2 10/39
and empirical e!idence do not uni!ersally support the idea that higher go!ernment purchases
raise pri!ate consumption%"(.
Lndeed, economists are deeply di!ided o!er not only the correct mi of ta cuts and
go!ernment spending to stimulate the economy but also the precise effects of go!ernment
“purchases" on DP groth and the degree to hich go!ernment spending either “crods in" or
“crods out" pri!ate consumption%(( According to traditional Jeynesian thining “an increase of
go!ernment spending leads to a multiplier process hich results in a more than proportionate
increase of national income%"() ;uch of the contro!ersy o!er A$$A concerns the assumptions
in fiscal multiplier estimates%
6he president’s to ey economic ad!isors, $omer and =ernstein, utiliIed a traditional
Jeynesian model that relied on the 'ed eeping interest rates at or near Iero through the end
Obama’s first term% 6hey assumed that -9 percent of the transfer payments to the states ould
be used to pre!ent spending reductions, )9 percent to forestall ta increases, and the other .9
percent to preclude states from dipping into “rainy day" funds% 6hey also assumed that ta3based
in!estment incenti!es ould e@ual about one3fourth of the effects of an increase in total
go!ernment spending% All told, $omer and =ernstein anticipated only a one3@uarter lag in the
impact of the stimulus pacage, ith the fiscal multiplier epected to rise from .%(* in the
second @uarter of (998 to .%00 by the fourth @uarter of (9.( /i%e%, . in go!ernment spending or
“purchase" of DP Q .%00 increase in DP1%
Economists ho subscribe to “ne" Jeynesian models of go!ernment spending find the
$omer and =ernstein estimates to be empirically flaed and theoretically unrealistic% :e
Jeynesian models are forard3looing ith respect to le!els of in!estment, pri!ate
consumption, and !ariable price and age settings%(* “Old" Jeynesian models, such as the one
4
7/17/2019 Stimulus 2
http://slidepdf.com/reader/full/stimulus-2 11/39
employed by the Obama hite +ouse from the 'ederal $eser!e =oard and a pri!ate firm, do not
necessarily “tae into account ho households and firms adBust their spending decisions as their
epectations of future go!ernment policy change%"(0 6he $omer3=ernstein model forecasts a
near3continuous, positi!e rate of return in go!ernment spending relati!e to DP% :e Jeynesian
models postulate that households and firms ill presume higher taes in the future to finance the
debt from short3run go!ernment deficit spending, and ill adBust their beha!ior accordingly as
time mo!es forard%(- :ot surprisingly, ne Jeynesian models predict a long-term decline in
consumption and investment that exceeds the benefit of government spending in ARRA %(2 As
&ni!ersity of Chicago economist Eugene 'ama contends, “the additional go!ernment debt means
that eisting current resources Bust mo!e from one use to another, from pri!ate in!estment to
go!ernment in!estment or from in!estment to consumption, ith no effect on total current
resources in the system or on total employment%"(4
President Obama and congressional Democrats eplicitly rebuffed such arguments by
touting the potential benefits of “sho!el ready" proBects aimed at reno!ating the nation’s
declining infrastructure and spurring employment rapidly% A significant amount of A$$A funds
ould be allocated to states for highay and bridge repairs and other construction proBects% As
ith stimulus spending more generally, it is not shocing that economists disagree on the
potential net effect of public capital for infrastructure proBects as ell% Da!id Aschauer’s seminal
or prompted a number of economists to argue that public in!estment led to significant
increases in producti!ity and a net positi!e effect on the economy%(8 =y contrast, critics charge
that infrastructure proBects furnish less than marginal benefits and are little more than “subterfuge
for por3barrel politics%")9 'urther, the compleities of fiscal federalism>in particular the
typically “long process of planning, bidding, contracting, construction and e!aluation" and
8
7/17/2019 Stimulus 2
http://slidepdf.com/reader/full/stimulus-2 12/39
coordination beteen federal, state, and local go!ernments “can mae the economic benefits
from go!ernment in!estment difficult to synchroniIe ith the business cycle%").
6he analysis that follos in the sections belo cannot resol!e economists’ debate about
“old" or “ne" Jeynesian models, or the impact on DP from go!ernment spending% :or does
this study purport to do so% $ather, the foregoing discussion pro!ides a critical bacdrop to this
research, hich focuses sharply on the political and demographic characteristics of the
congressional districts in which the stimulus money has been spent, on which types of programs
/infrastructure and “other" programs1 allocated funds ha!e thus far been spent, and on the
expected and actual Bobs reported to ha!e been created or sa!ed by A$$A as of the end of Hune
(9.9%
"ata and Method
Jey to this study>and in particular to the test of the hypothesis that funds ha!e been
allocated in a partisan fashion>is a grasp of the potential obfuscation of the stimulus pacage’s
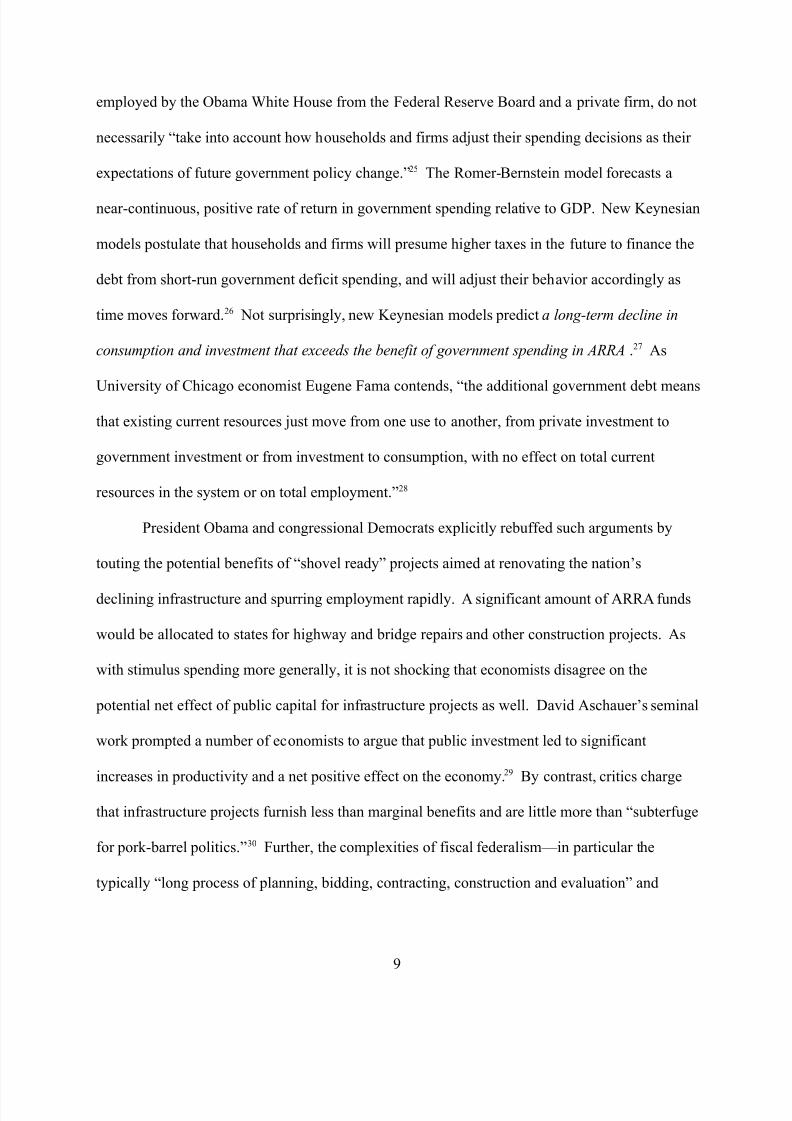
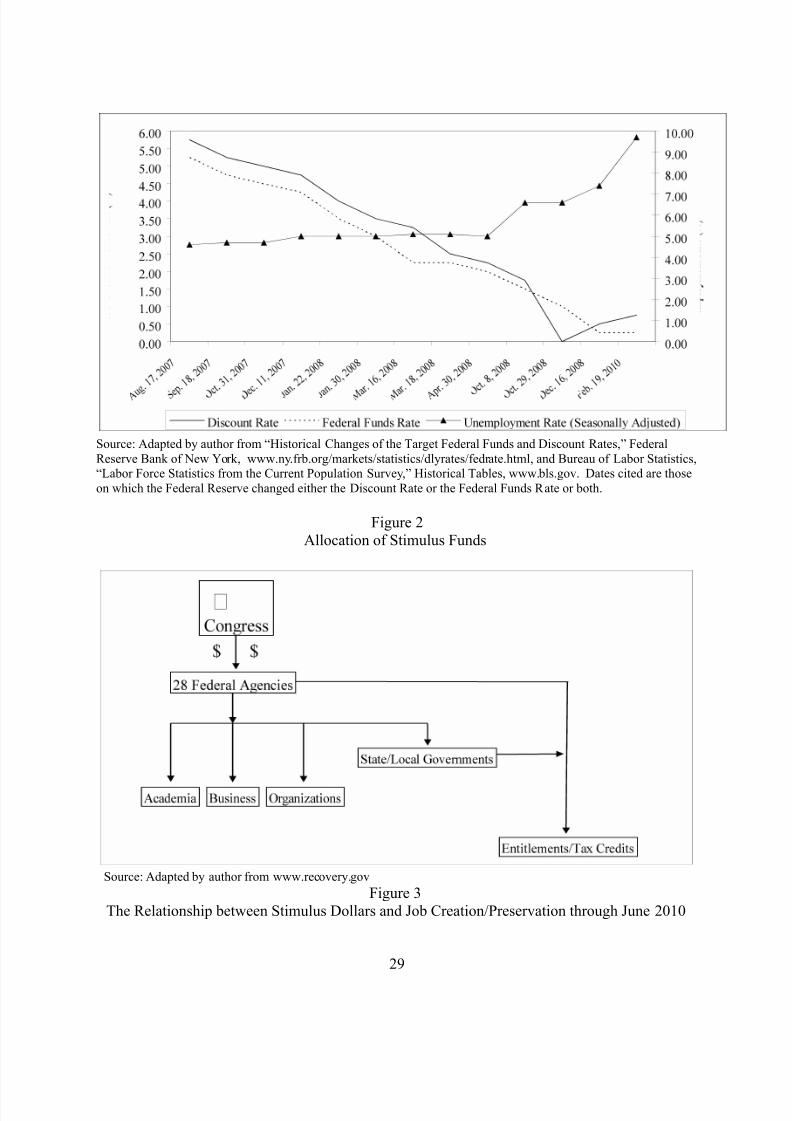
results by congressional district due to the compleities of fiscal federalism% 'igure ( reproduces
the “flo chart" on $eco!ery%org to trace the allocation of funds% Congress appropriated the
stimulus funds to some (4 federal departments and agencies /e%g%, the Departments of +ealth and
+uman Ser!ices, abor, 6ransportation, etc%1% 6hese agencies then aard payments, grants, and
contracts to uni!ersities, businesses, and other organiIations in addition to direct transfers to state
and local go!ernments% =oth federal and stateMlocal go!ernments may also utiliIe the funds to
pay for programs directed at indi!iduals entitled to certain state, federal, or shared programmatic
benefits /e%g%, elfare programs1 or ta credits% 6racing the money to particular geographic
constituencies is not alays an easy tas%
N'igure (
.9
7/17/2019 Stimulus 2
http://slidepdf.com/reader/full/stimulus-2 13/39
As noted earlier, the ay in hich recipients of funds self3report on $eco!ery%go!
matters% Programs ith stateide benefit, for hich no single congressional district may be
identified, are reported for the member or members ho represent the state capitol%
Conse@uently, the first set of analyses in this study comprises t3tests by party of the total amount
of funding for all districts and ith state capitol districts included and ecluded% 63tests of the
allocation of infrastructure funds through the second @uarter of (9.9 by party affiliation are also
performed to eamine potential partisan bias in a straightforard fashion%
6he second set of in@uiries constitutes a series of regression analyses ith types of
stimulus spending and predictedMactual employment effects as the dependent !ariables% 6he unit
of analysis is the congressional district /nQ*)0R the District of Columbia as ecluded1% 6he
dependent !ariables include the natural log transformation of .1 stimulus spending on
infrastructureR (1 stimulus spending on all “other" programsR )1 the Bobs predicted to be sa!ed or
created in the hite +ouse memo of 'ebruary (998R and, *1 the reported Bobs sa!ed or created as
of the second @uarter of (9.9% Although not alays sufficient to handle outliers, the natural log
transformation of each of the dependent !ariables is necessary to minimiIe the e!ident non3
constant !ariance in the models that may distort results of the eplanatory !ariables% $obust
regression, a form of eighted least s@uares, is utiliIed in those models for hich outliers
continue to present potential difficulties in the distribution of the data despite the log
transformation%
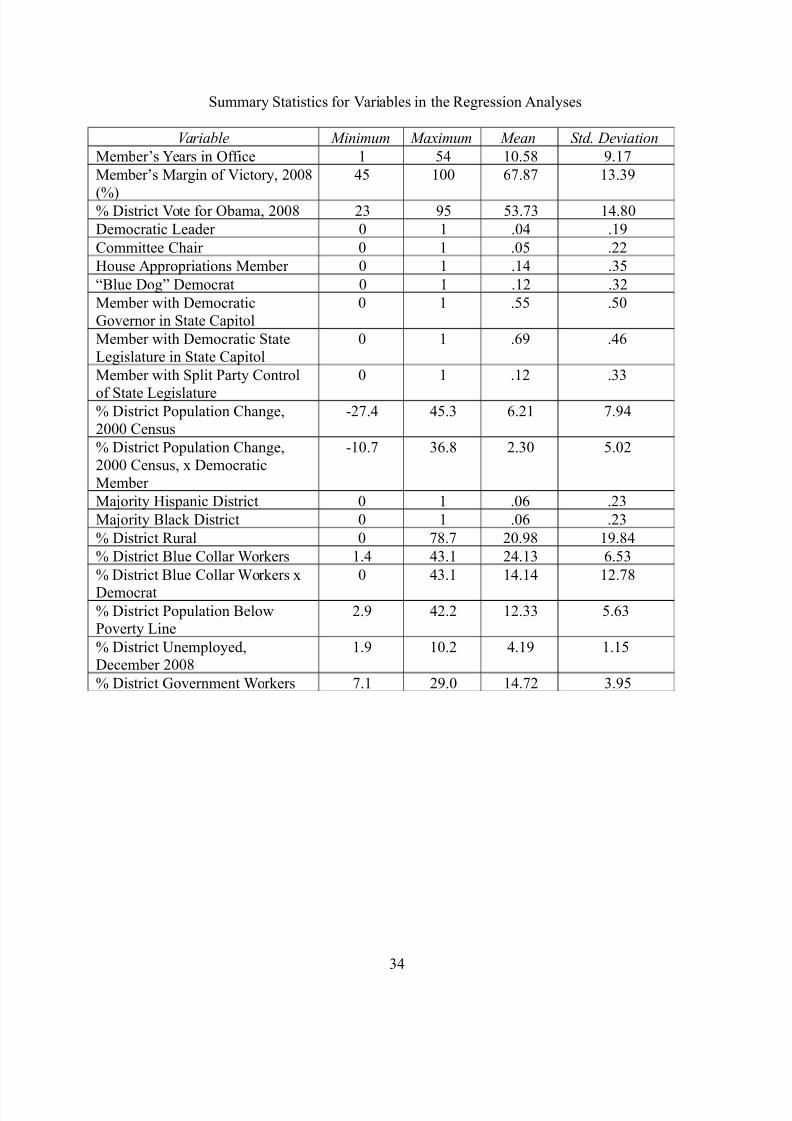
6he independent !ariables in the model include electoral, institutional, demographic, and
economic characteristics for each member and his or her district hile also attempting to account
for elements of the federal system% 6he summary statistics for the !ariables are in Appendi .%
6hey are as follos7
..
7/17/2019 Stimulus 2
http://slidepdf.com/reader/full/stimulus-2 14/39
Electoral variables 6he member’s percent of the district !ote in (994 is included in the
models to test hether safe or marginal districts recei!ed more or less funds% 6he percent district
!ote for Obama is also included in the models to test hether the magnitude of his electoral
popularity had any impact on the distribution of funds%
!nstitutional variables% 6he member’s years of ser!ice in the +ouse gauges the impact of
seniority in the distribution of funds% Dummy !ariables ere added to the models to test hether
Democratic leaders /maBority leader, members of the hip system1, Democratic committee
chairs, and members of the Appropriations Committee recei!ed a disproportionate le!el of
benefits from the stimulus bill% A dummy !ariable for the 0( “blue dog" Democrats as also
added to e!aluate hether these more conser!ati!e members of the Democratic caucus, some of
hom opposed A$$A, recei!ed more benefits as a means of bringing them bac into the party
fold%
"ederalism variables% Dummy !ariables for members from states ith a Democratic
go!ernor, a Democratic3controlled state legislature, and a “split" legislature /one house
Democratic, the other $epublican1 ere included in the models to assess hether members from
such states recei!ed a greater share of funds or Bobs created% 6he !ariables are a proy for
elements of fiscal federalism that are difficult to capture%
#emographic and economic variables 6he models account for a range of district
characteristics from Census data for each member% 6he continuous !ariables comprise the
percent change in population in the district hen redistricting occurred in (99(, the percent blue
collar orers in each district, the percent of the district li!ing belo the federal po!erty line, the
percent of orers unemployed as reported by Census data in December (994, and the percent
go!ernment orers in each district% Lt is reasonable to epect that the districts hardest hit by the
.(
7/17/2019 Stimulus 2
http://slidepdf.com/reader/full/stimulus-2 15/39
recession>those ith chronic po!erty le!els, high numbers of blue collar orers, and those
most immediately affected by the economic donturn>ould recei!e the greatest benefits if
A$$A ored as the hite +ouse and Congress anticipated% 6he !ariable for the percent
go!ernment orers in each district is a proy to test hether allocated funds and Bobs created or
“sa!ed" ere targeted toards the public sector% 'inally, dummy !ariables for maBority +ispanic
and maBority African American districts>to of the most important core supporting groups for
Obama and the Democrats>ere included in the model% 6enty3one of (* maBority +ispanic
and (( of (* maBority blac districts, respecti!ely, had Democratic members in the ...th
Congress% 6hese to dummy !ariables eamine hether such districts benefitted
disproportionately from the stimulus bill%
Interpreting the Log Transformed Regression Coefficients
$egression analysis of log transformed dependent !ariables necessitates a particular
attention to the ay in hich the impact of the eplanatory !ariables is interpreted% =y taing
the natural log of the dependent !ariables, the intercept in the model is the geometric mean, not
the arithmetic mean and the distribution of the outcome !ariable is no longer linear% hile
ordinary least s@uares regression remains appropriate as a tool for analysis, the result is that the
impact of a one3unit increase in an eplanatory !ariable /or dummy !ariable1 on the outcome
!ariable is the in!erse of the log function, or eponentiation of the coefficient here ln Q
(%2.4(4% 6aing ep/1 yields the percent change in the outcome !ariable gi!en a one3unit
increase in the independent !ariable, holding all other !ariables constant% )( 6o facilitate the
interpretation of the models, the percent changes for the independent !ariables, deri!ed from
regression and robust regression models, relati!e to categories of spending and predictedMactual
Bob impacts are reported in 6ables ( and ) instead of the regression coefficients, per se% 6he
.)
7/17/2019 Stimulus 2
http://slidepdf.com/reader/full/stimulus-2 16/39
statistical significance of each eplanatory !ariable is also reported in 6ables ( and ), as ell as
the $ ( goodness3of3fit statistic%))
Analysis
Lt is remarable that to3date, scholarly analyses of stimulus spending ha!e used comple
statistical approaches, such as regression, to test the partisan hypothesis% A much more
straightforard statistical approach that re@uires less difficulty or sophistication in the
interpretation of results is a simple t3test of spending in Democratic and $epublican districts%
=ut any such test must control for the ay in hich stateide programmatic spending is
reported, and the distortion such reporting may engender%
;embers from state capitol districts, regardless of party identification, recei!e a
disproportionate amount of funds because spending for stateide programs is reported in their
geographic constituency% $eco!ery%go! reported that the fifth district of California /Sacramento1
recei!ed the most funds>Bust o!er - billion as of the end of Hune (9.9% ;ore than ( billion
as reported for members from districts representing Springfield /Lllinois1, ansing, Albany,
Austin, and 6allahassee% Lt is intuiti!e that states ith larger populations ould recei!e a greater
share of the stimulus pie hen transfer payments are concerned% Part of the rationale of the
stimulus as to bolster state and local go!ernments, and per capita spending should reflect state
population% Lndeed, the simple correlation beteen total spending among state capitol districts
/nQ*-1 and state population is r Q %42%
6he problem in statistical terms for any t3test of the partisan thesis is that most other
districts reported the receipt of far less funds at the end of Hune (9.9, hich creates significant
heterosedasticity or non3constant !ariance across the *)0 districts in the analysis% 'or eample,
:e Kor’s ninth district /parts of Tueens and =roolyn1 reported less than $% million in total
.*
7/17/2019 Stimulus 2
http://slidepdf.com/reader/full/stimulus-2 17/39
spending% ;ore than half of all congressional districts reported 02 million or less in total
spending% hen spending in these districts is contrasted ith the billions reported in state
capitols, the effect on the data distribution is palpable%
N6ables .a, .b, .c
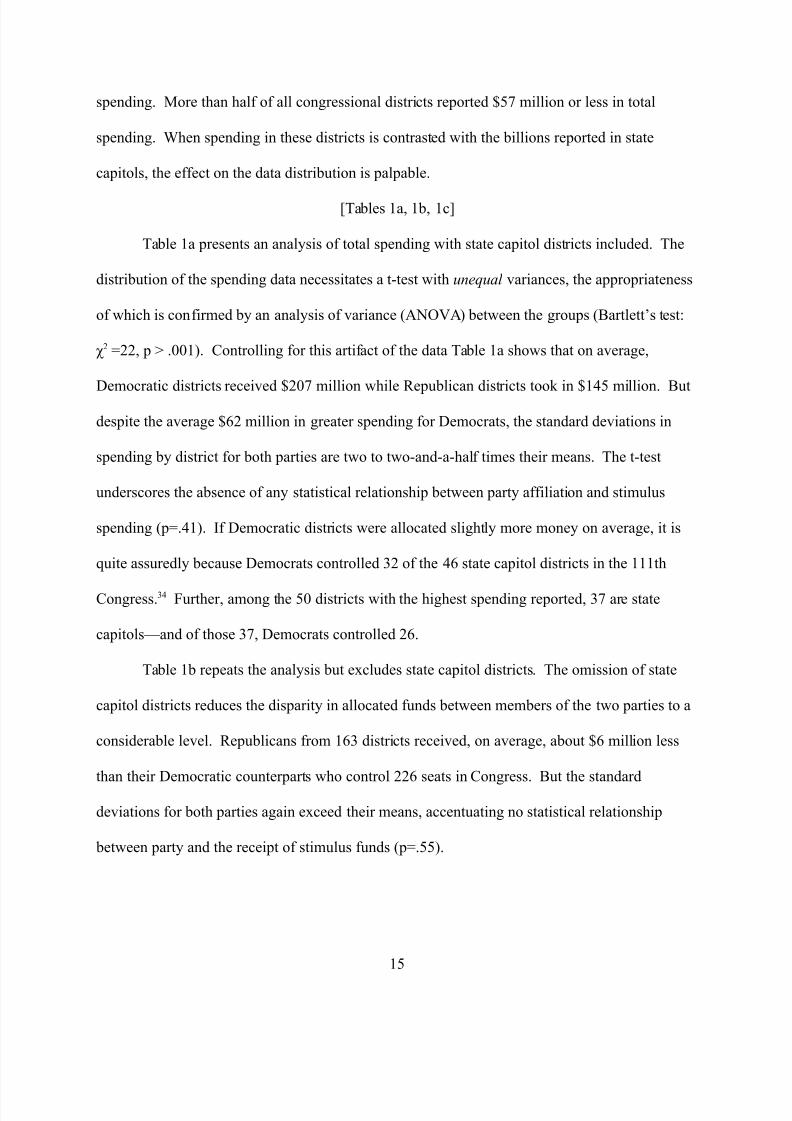
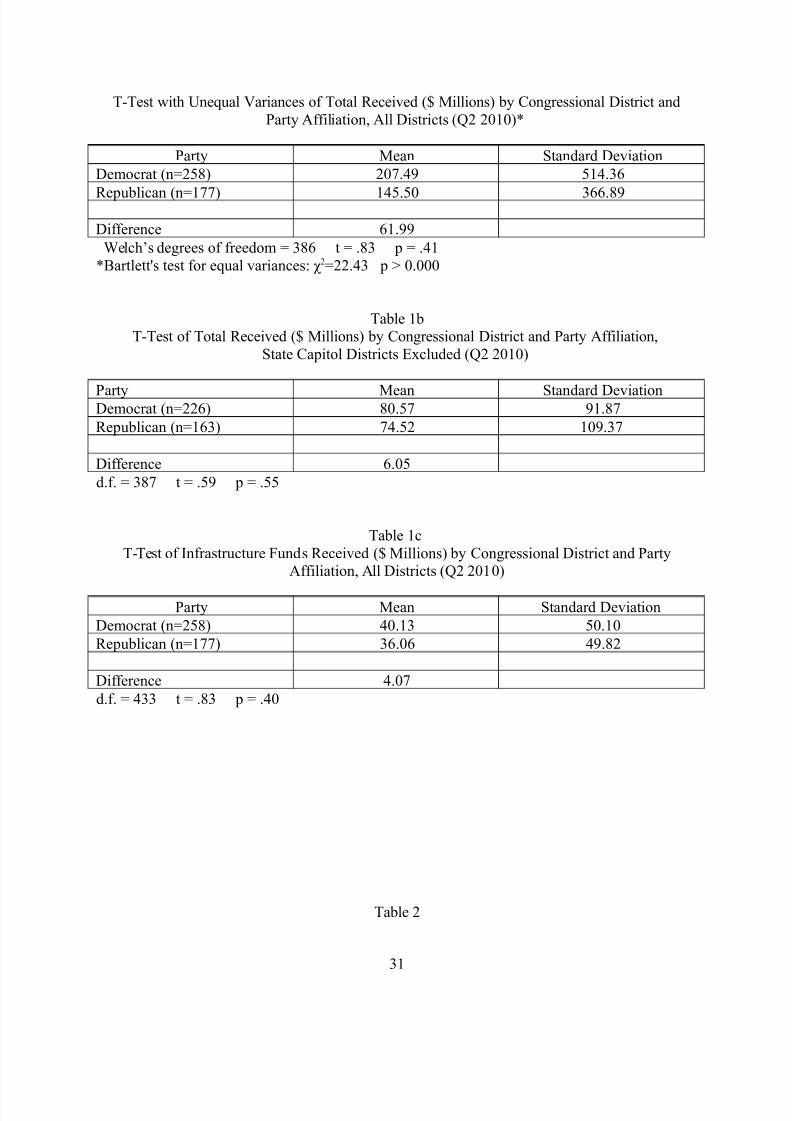
6able .a presents an analysis of total spending ith state capitol districts included% 6he
distribution of the spending data necessitates a t3test ith une&ual !ariances, the appropriateness
of hich is confirmed by an analysis of !ariance /A:OGA1 beteen the groups /=artlett’s test7
U ( Q((, p V %99.1% Controlling for this artifact of the data 6able .a shos that on a!erage,
Democratic districts recei!ed (92 million hile $epublican districts too in .*0 million% =ut
despite the a!erage -( million in greater spending for Democrats, the standard de!iations in
spending by district for both parties are to to to3and3a3half times their means% 6he t3test
underscores the absence of any statistical relationship beteen party affiliation and stimulus
spending /pQ%*.1% Lf Democratic districts ere allocated slightly more money on a!erage, it is
@uite assuredly because Democrats controlled )( of the *- state capitol districts in the ...th
Congress%)* 'urther, among the 09 districts ith the highest spending reported, )2 are state
capitols>and of those )2, Democrats controlled (-%
6able .b repeats the analysis but ecludes state capitol districts% 6he omission of state
capitol districts reduces the disparity in allocated funds beteen members of the to parties to a
considerable le!el% $epublicans from .-) districts recei!ed, on a!erage, about - million less
than their Democratic counterparts ho control ((- seats in Congress% =ut the standard
de!iations for both parties again eceed their means, accentuating no statistical relationship
beteen party and the receipt of stimulus funds /pQ%001%
.0
7/17/2019 Stimulus 2
http://slidepdf.com/reader/full/stimulus-2 18/39
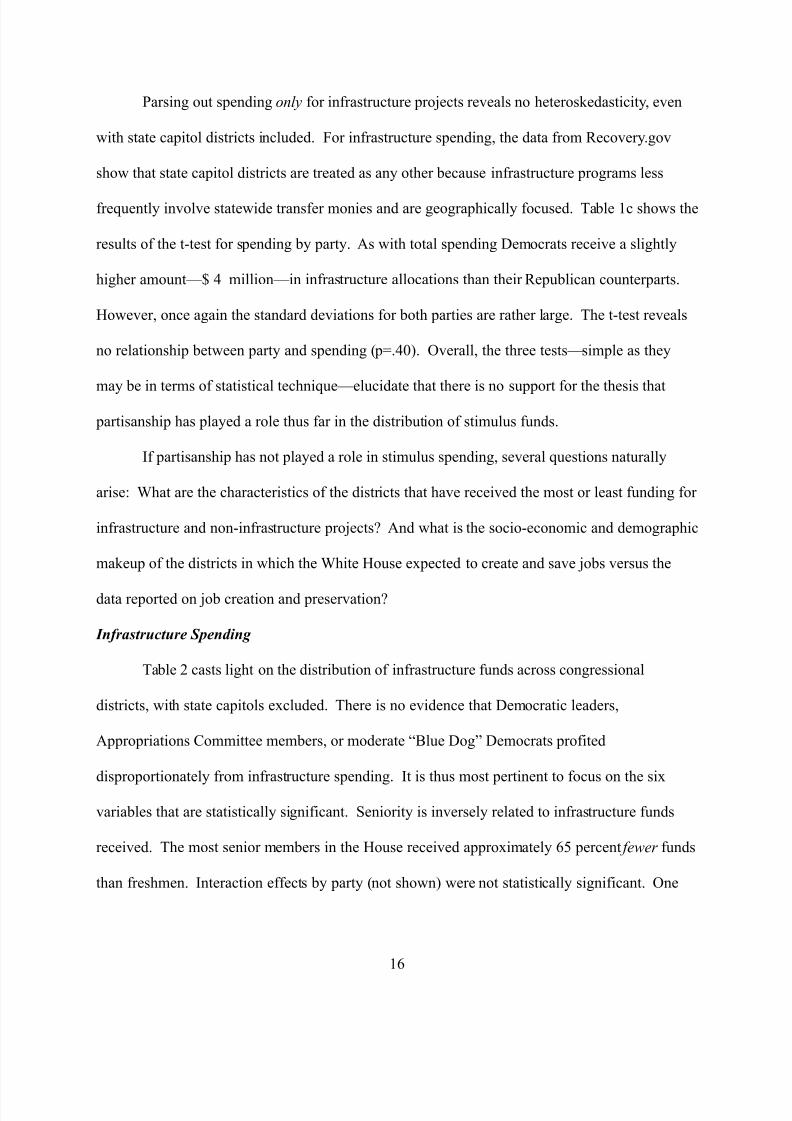
Parsing out spending only for infrastructure proBects re!eals no heterosedasticity, e!en
ith state capitol districts included% 'or infrastructure spending, the data from $eco!ery%go!
sho that state capitol districts are treated as any other because infrastructure programs less
fre@uently in!ol!e stateide transfer monies and are geographically focused% 6able .c shos the
results of the t3test for spending by party% As ith total spending Democrats recei!e a slightly
higher amount> * million>in infrastructure allocations than their $epublican counterparts%
+oe!er, once again the standard de!iations for both parties are rather large% 6he t3test re!eals
no relationship beteen party and spending /pQ%*91% O!erall, the three tests>simple as they
may be in terms of statistical techni@ue>elucidate that there is no support for the thesis that
partisanship has played a role thus far in the distribution of stimulus funds%
Lf partisanship has not played a role in stimulus spending, se!eral @uestions naturally
arise7 hat are the characteristics of the districts that ha!e recei!ed the most or least funding for
infrastructure and non3infrastructure proBects? And hat is the socio3economic and demographic
maeup of the districts in hich the hite +ouse epected to create and sa!e Bobs !ersus the
data reported on Bob creation and preser!ation?
Infrastructure Spending
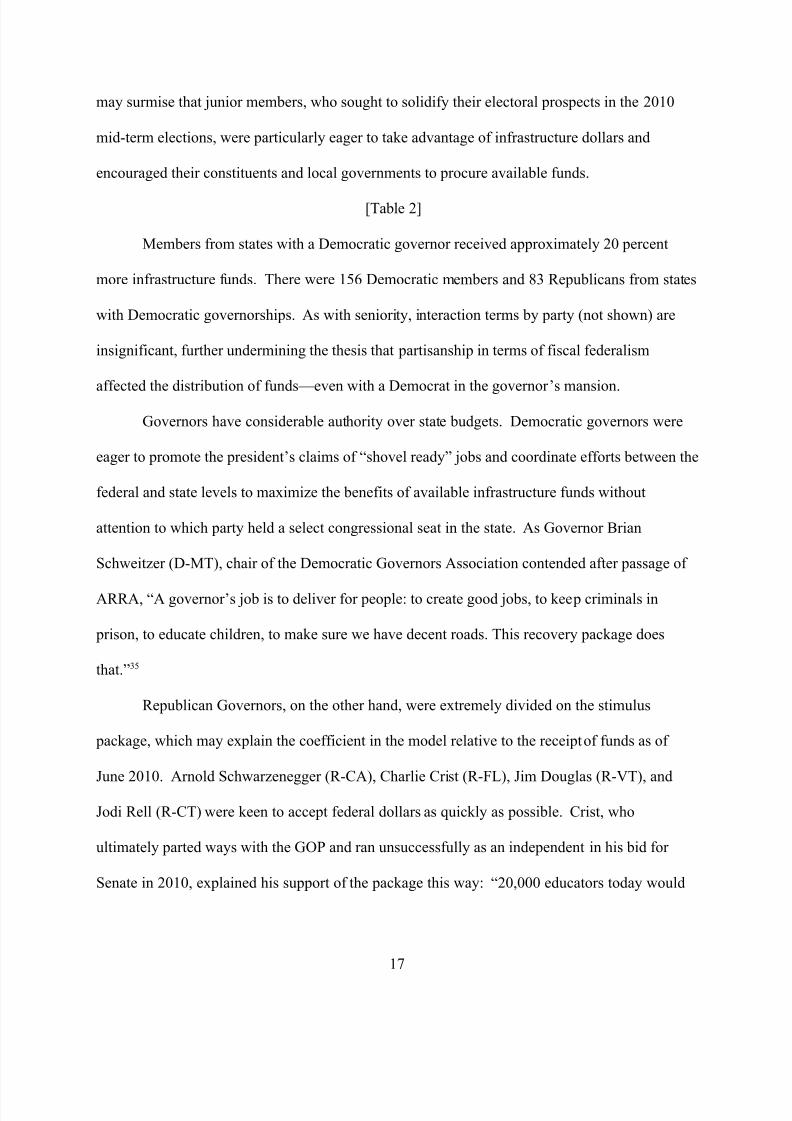
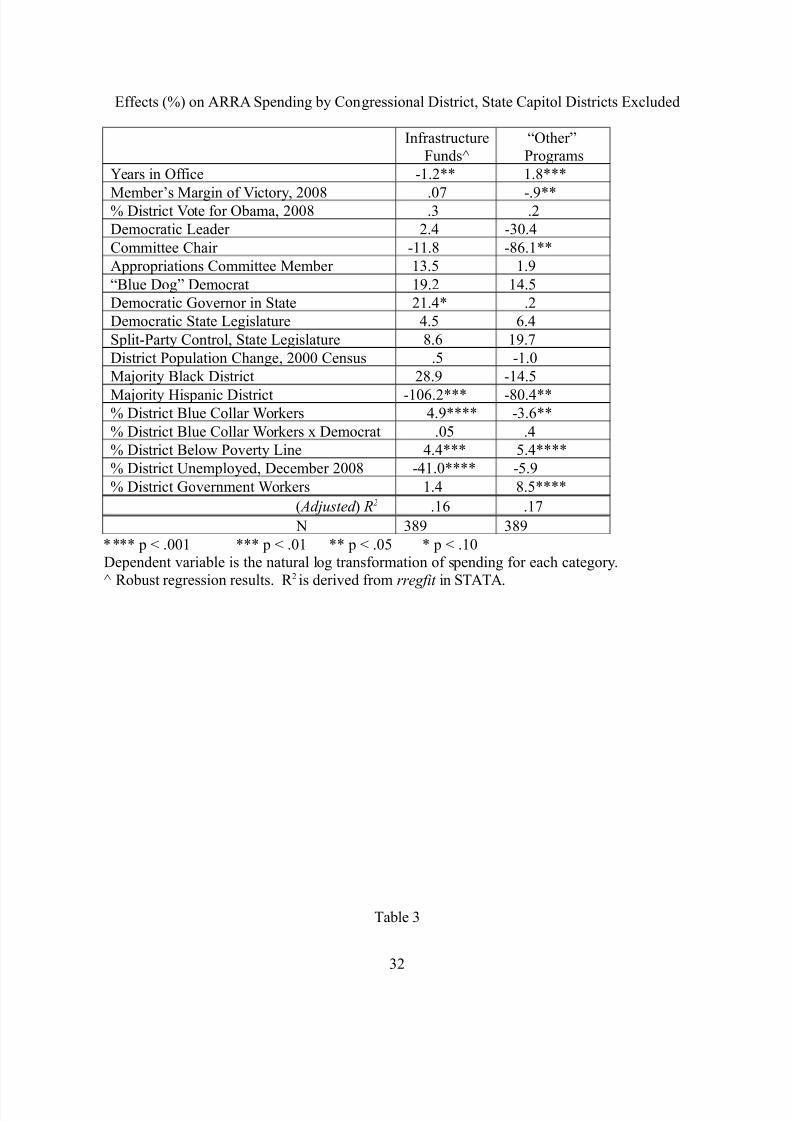
6able ( casts light on the distribution of infrastructure funds across congressional
districts, ith state capitols ecluded% 6here is no e!idence that Democratic leaders,
Appropriations Committee members, or moderate “=lue Dog" Democrats profited
disproportionately from infrastructure spending% Lt is thus most pertinent to focus on the si
!ariables that are statistically significant% Seniority is in!ersely related to infrastructure funds
recei!ed% 6he most senior members in the +ouse recei!ed approimately -0 percent fewer funds
than freshmen% Lnteraction effects by party /not shon1 ere not statistically significant% One
.-
7/17/2019 Stimulus 2
http://slidepdf.com/reader/full/stimulus-2 19/39
may surmise that Bunior members, ho sought to solidify their electoral prospects in the (9.9
mid3term elections, ere particularly eager to tae ad!antage of infrastructure dollars and
encouraged their constituents and local go!ernments to procure a!ailable funds%
N6able (
;embers from states ith a Democratic go!ernor recei!ed approimately (9 percent
more infrastructure funds% 6here ere .0- Democratic members and 4) $epublicans from states
ith Democratic go!ernorships% As ith seniority, interaction terms by party /not shon1 are
insignificant, further undermining the thesis that partisanship in terms of fiscal federalism
affected the distribution of funds>e!en ith a Democrat in the go!ernor’s mansion%
o!ernors ha!e considerable authority o!er state budgets% Democratic go!ernors ere
eager to promote the president’s claims of “sho!el ready" Bobs and coordinate efforts beteen the
federal and state le!els to maimiIe the benefits of a!ailable infrastructure funds ithout
attention to hich party held a select congressional seat in the state% As o!ernor =rian
ScheitIer /D3;61, chair of the Democratic o!ernors Association contended after passage of
A$$A, “A go!ernor’s Bob is to deli!er for people7 to create good Bobs, to eep criminals in
prison, to educate children, to mae sure e ha!e decent roads% 6his reco!ery pacage does
that%")0
$epublican o!ernors, on the other hand, ere etremely di!ided on the stimulus
pacage, hich may eplain the coefficient in the model relati!e to the receipt of funds as of
Hune (9.9% Arnold ScharIenegger /$3CA1, Charlie Crist /$3'1, Him Douglas /$3G61, and
Hodi $ell /$3C61 ere een to accept federal dollars as @uicly as possible% Crist, ho
ultimately parted ays ith the OP and ran unsuccessfully as an independent in his bid for
Senate in (9.9, eplained his support of the pacage this ay7 “(9,999 educators today ould
.2
7/17/2019 Stimulus 2
http://slidepdf.com/reader/full/stimulus-2 20/39
be out a Bob if e hadn’t utiliIed the $eco!ery Act moneys% Another -9,999 of my fello
'loridians ould be out of or today ithout the opportunity to be able to utiliIe those moneys
in a responsible ay%")-
Other $epublican o!ernors sought to cut bac the flo of stimulus funds or reBected
them outright>hich had a palpable impact on the ultimate timing of the receipt of funds in
congressional districts% $ic Perry /$36W1 opposed some 000 million in federal unemployment
benefits because of re@uirements he contended ould raise unemployment insurance on pri!ate
businesses%)2 $epublicans including +aley =arbour of ;ississippi, ;ar Sanford of South
Carolina, and =obby Hindal of ouisiana also reBected portions of the stimulus, creating
significant conflict beteen their state go!ernments and mayorsMlocalities and, in Sanford’s case,
a maBor shodon ith the state legislature that forced him to accept funds%)4
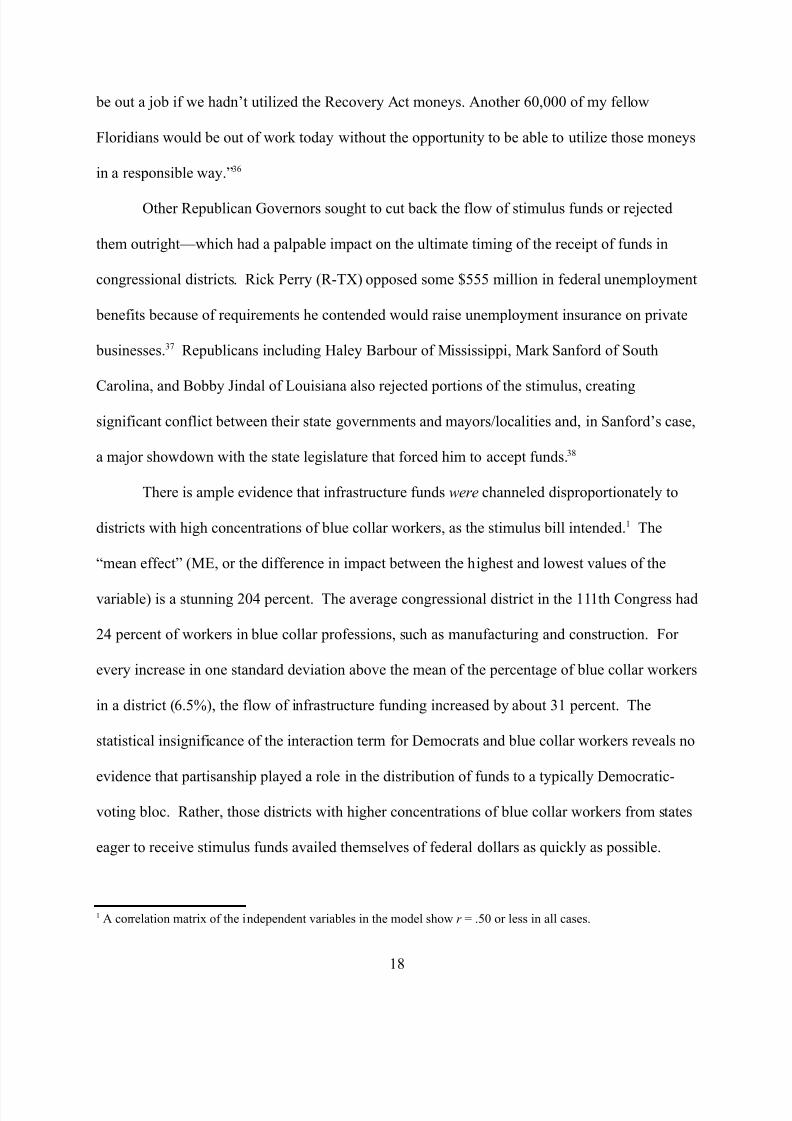
6here is ample e!idence that infrastructure funds were channeled disproportionately to
districts ith high concentrations of blue collar orers, as the stimulus bill intended%. 6he
“mean effect" /;E, or the difference in impact beteen the highest and loest !alues of the
!ariable1 is a stunning (9* percent% 6he a!erage congressional district in the ...th Congress had
(* percent of orers in blue collar professions, such as manufacturing and construction% 'or
e!ery increase in one standard de!iation abo!e the mean of the percentage of blue collar orers
in a district /-%01, the flo of infrastructure funding increased by about ). percent% 6he
statistical insignificance of the interaction term for Democrats and blue collar orers re!eals no
e!idence that partisanship played a role in the distribution of funds to a typically Democratic3
!oting bloc% $ather, those districts ith higher concentrations of blue collar orers from states
eager to recei!e stimulus funds a!ailed themsel!es of federal dollars as @uicly as possible%
. A correlation matri of the independent !ariables in the model sho r Q %09 or less in all cases%
.4
7/17/2019 Stimulus 2
http://slidepdf.com/reader/full/stimulus-2 21/39
Ket the model shos contradictory indicators relati!e to the po!erty le!el of the district
and the district unemployment rate as measured by the CensusM=ureau of abor Statistics in
December (994% 6he po!erty rate is a longer3term metric of relati!e ealth in each district% 6he
model underscores that for each increase of one percent in the district population belo the
po!erty le!el infrastructure spending increases by *%* percent /;EQ.2)1% 'or the a!erage
district /ecluding state capitols1 the po!erty rate as .(%) percent% 'or each increase in one
standard de!iation abo!e the mean po!erty rate /0%-1 districts recei!ed approimately (0
percent more funds%
=y contrast, districts that suffered the most rapid short3term unemployment increases as
of December (994 recei!ed fewer funds than those ith long3term po!erty% 6he a!erage district
unemployment rate stood at *%( percent in December (994% 'or each increase in one standard
de!iation abo!e the mean /.%(1, the amount of infrastructure funds procured fell by a stunning
*8 percent% Of the ten districts ith unemployment reported beteen 2 and .9%( percent, half
ere in the “rust belt" here manufacturing and construction employment dropped off
dramatically7 ;ichigan, Lllinois, and Pennsyl!ania%
6he data highlight a central parado in infrastructure stimulus, and a particular
conundrum for Democrats% Lf !oters in the (9.9 mid3term elections ere frustrated ith the
pace of infrastructure spending and Bob creation, it as because the funds ere distributed in
greater measure to those districts suffering from long3term po!erty, but not those that endured the
most sudden effects of Bob losses in the immediate aftermath of the financial crisis that shoo
all Street in 'all (994% 6he net sub3section that analyIes the locus of Bobs created and sa!ed
reconfirms the !ital point about the slo pace of Bob creation largely due to the compleities of
fiscal federalism and the ability of state and local agencies to procure stimulus funds%
.8
7/17/2019 Stimulus 2
http://slidepdf.com/reader/full/stimulus-2 22/39
Stimulus Spending for Non-Infrastructure Programs
6he second column in 6able ( pro!ides a district analysis of spending for programs
unrelated to infrastructure proBects% 6hese programs typically in!ol!ed funding for !arious
programs such as education, research and de!elopment, etc% Of the si statistically significant
!ariables, to contradict spending for infrastructure% Districts of members from both parties
ith greater seniority recei!ed more stimulus dollars in this category /;EQ82%(1% And
members from more marginal electoral districts also procured more stimulus funding through
Hune (9.9, though the substanti!e effect is relati!ely loer /;EQ3*8%01% As a member’s share
of the district !ote in the (994 dropped from 0- to 0. percent, spending for “other" programs
increased by *%0 percent%
hat is most telling from the analysis of district receipts of non3infrastructure programs
is the substanti!e significance of the percent district go!ernment orers /federal, state, local1 in
the member’s district /;EQ.4-1% A one3standard de!iation /*%91 increase in the percent of
go!ernment orers o!er the mean /.*%21 yields a net increase in funding of )* percent%
Lnteraction terms /not shon1 by party sho no statistical significance or substanti!e impact%
6he data clearly con!ey that part of the story of district3le!el procurement of non3
infrastructure funds relates to “go!ernment capacity%" Districts ith state and local go!ernments
ith greater epertise and bureaucratic capability ere better able to maneu!er through the
comple process of fiscal federalism% And it should not be surprising that members ith greater
seniority ere able to lend their savoir-faire to the comple grant and contract procurement
stages% Similarly, members from marginal districts had strong electoral incenti!es to ensure that
their constituents maimiIed stimulus funds as they looed to +ouse elections in :o!ember
(9.9%
(9
7/17/2019 Stimulus 2
http://slidepdf.com/reader/full/stimulus-2 23/39
Lt is also telling that the substanti!e significance of non3infrastructure funds is greater for
districts ith higher po!erty le!els /;EQ(091% 6he lion’s share of non3infrastructure spending
as of Hune (9.9 as allocated to districts ith long3term po!erty>a fact that is highly consistent
ith the epressed purpose of elements of the stimulus pacage proposed by President Obama
and passed by the Democratic Congress% =ut receipt of those funds as largely contingent upon
the sill le!el of state and local agencies to procure the funds by charting their path through the
difficulties of federal red3tape% ;aBority +ispanic districts ere particularly at a disad!antage on
infrastructure and non3infrastructure fund procurement alie /;EQ3.9- and 349,
respecti!ely1% 6here is certainly no e!idence that Democrats circum!ented this ey !oting bloc
of their party in the allocation of funds% $ather, half of all maBority +ispanic districts had feer
than .) percent district go!ernment orers% Lt is the ability of such districts to tae full
ad!antage of the stimulus dollars a!ailable that is in @uestion%
Saving and Creating Jobs: !pectations versus Realit"
As noted earlier hite +ouse economic ad!isors undertoo a study in Hanuary (998 in
hich they predicted the anticipated Bob benefits of A$$A by congressional district%
&nfortunately, the hite +ouse did not mae a!ailable to the public the !ariables employed in
the forecast model /population, employment, and the industrial composition1 hen the study as
published in 'ebruary (998% ;oreo!er, the model focused on the predicted number of Bobs to be
created and sa!ed after all stimulus spending had been appropriated>a four3year long process to
last through (9.(% 'inally, the forecast did not pro!ide a “staggered" estimation of Bob creation
by @uarter, nor did the forecast account for lags in appropriations or Bob creation, or the
compleities of fiscal federalism%
N6able )
(.
7/17/2019 Stimulus 2
http://slidepdf.com/reader/full/stimulus-2 24/39
:onetheless it is possible to analyIe the political and socioeconomic characteristics of the
districts in hich the hite +ouse epected the greatest Bob groth and Butapose those
epectations ith the reality of the Bobs reported to ha!e been created or sa!ed through Hune
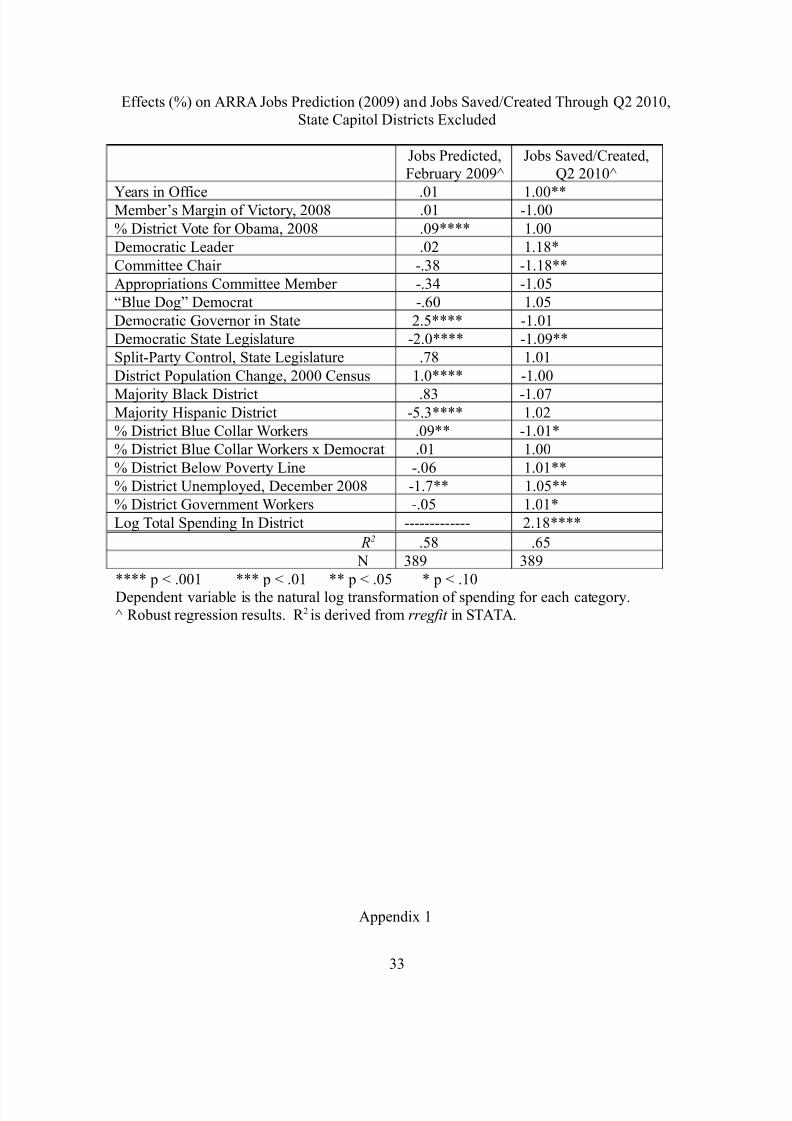
(9.9% Column . in 6able ) employs the same model as that for infrastructure and other
programmatic spending in order to ferret out the potential predictors of Bob grothMpreser!ation
/natural log1 from the hite +ouse district3by3district forecast through (9.(% Column ( shos
the results of the model for the natural log of the actual number of Bobs sa!ed and created
through the end of the second @uarter of (9.9, and differs only inasmuch as spending in the
district /through Hune (9.91 is included as a control !ariable%
Column . shos that only a fe !ariables are statistically significant, though the
eplained !ariance is a respectable 04 percent% 6he only political !ariable that maes logical
sense in the model is the district3le!el !ote for Obama in (994, but the substanti!e effect is @uite
small /;EQ-%01% 'or a one standard de!iation /.*%41 increase in the district !ote for Obama
o!er the mean /0)%21, epected Bob groth is augmented by Bust .%) percent% 6he proy
!ariables for fiscal federalism are contradictory% ;embers from districts in states ith
Democratic go!ernors are forecast to profit from an additional (%0 percent in Bob groth, but the
effect is all but canceled out by the negati!e correlation ith a Democratic state legislature% 6he
model does highlight that the hite +ouse forecast a slightly higher number of Bobs in
traditionally blue collar districts /;EQ)%201% =ut the model also accentuates that the stimulus
ould not necessarily help those districts ith the highest unemployment rates as of the end of
December (994 /;EQ3.*%.1% Lt is notable that the !ariable for po!erty is not statistically
significant, nor is the !ariable for the district percent of go!ernment orers% Ob!iously the
((
7/17/2019 Stimulus 2
http://slidepdf.com/reader/full/stimulus-2 25/39
hite +ouse epected a largely uniform increase in Bob groth across all congressional districts
>consistent ith the criticism that the forecast by district !aried too little to be trustorthy%
6he !ariable ith the greatest substanti!e significance, hoe!er, is population change
/;EQ2(%21% A one standard de!iation /2%8*1 increase abo!e the a!erage of the district
change in population from .8893(999 /-%(1 raises the epected le!el of Bob
creationMpreser!ation by nearly eight percent% 6enty3eight districts had population groth in
ecess of (9 percent% :ot surprisingly most /281 ere in “sunbelt" states including AriIona
/metro Phoeni1, California /southern1, 'lorida /central1, eorgia /metro Atlanta1, 6eas, and
:e!ada% Lt is in these fast3groing, technologically inno!ati!e areas of the country that the
hite +ouse epected Bob groth to be spurred by the president’s “green" agenda and
prioritiIation of infrastructure proBects%
=y contrast, sity3eight districts in the ...th Congress had negati!e population groth in
the decade prior% 6hese districts ere predicted to sa!e or create beteen one and (2 percent
fewer Bobs% Hust o!er half ere located in the ersthile industrial heartland of the country
spanning from :e Kor and Pennsyl!ania to Ohio, Lllinois, and ;ichigan% 6he model suggests,
at a minimum, that the hite +ouse anticipated that districts in these states ould be least
capable of taing full ad!antage of the stimulus bill>perhaps as a reflection of their state’s
inability to alter industrial capacity to meet the challenges of manufacturing “eco3friendly"
products, producing Bobs in en!ironmental sciences, procuring grants and contracts at the local
le!el, etc%
6he penultimate @uestion is ho hite +ouse epectations correspond to the Bobs
created and sa!ed through Hune (9.9 in ad!ance of the mid3term elections% Column ( of 6able )
casts significant light on the locus of Bob groth% 6he focus is on the nine statistically significant
()
7/17/2019 Stimulus 2
http://slidepdf.com/reader/full/stimulus-2 26/39
!ariables% Consistent ith the analysis of funds procured by districts in 6able (, the data sho
that Bob creationMpreser!ation as greatest in the districts of the most senior members% 6he mean
effect of 0) percent is the greatest for all of the statistically significant !ariables% Lt is reasonable
to conclude that as their time in office increased members ere better able to help district
businesses and go!ernments maneu!er through the grants and contracting process for stimulus
funds% Ln a similar !ein, members of the Democratic leadership ere somehat better placed to
procure funds, but the mean effect is small /.%.41%
hat is most telling in the analysis in Column ( is that the second greatest effect is for
the percent blue collar orers in members’ districts>and the !ariable is negatively related to
Bob groth /;EQ3*(1% 6he effect is particularly disconcerting gi!en that stimulus funds, as
6able ( shoed, floed more freely to blue collar districts% :e!ertheless, at least through Hune
(9.9 districts ith higher concentrations of construction and manufacturing Bobs did not see a
large turnaround in Bob groth in their industries% 6here is some e!idence that districts ith the
highest unemployment as of December (994 sa some increase, but the mean effect is @uite
small /8%81% Ln real terms, this amounts to under '( )obs per district %
6he fate of predominantly blue collar districts must be Butaposed ith the !ariables for
po!erty and the percent district orers employed by go!ernment% 6hose districts ith long
term po!erty realiIed a larger net increase in Bobs /;EQ)81% Similarly, districts ith a higher
proportion of go!ernment orers netted a larger percentage of Bobs /;EQ((1% O!erall, the
data accentuate precisely hat o!ernor Crist of 'lorida argued7 6he greatest, immediate
impact of the stimulus pacage on Bob creationMpreser!ation as to sa!e go!ernment Bobs and
shore up the most economically !ulnerable through federal andMor shared programs for
unemployment, elfare, education, etc%
(*
7/17/2019 Stimulus 2
http://slidepdf.com/reader/full/stimulus-2 27/39
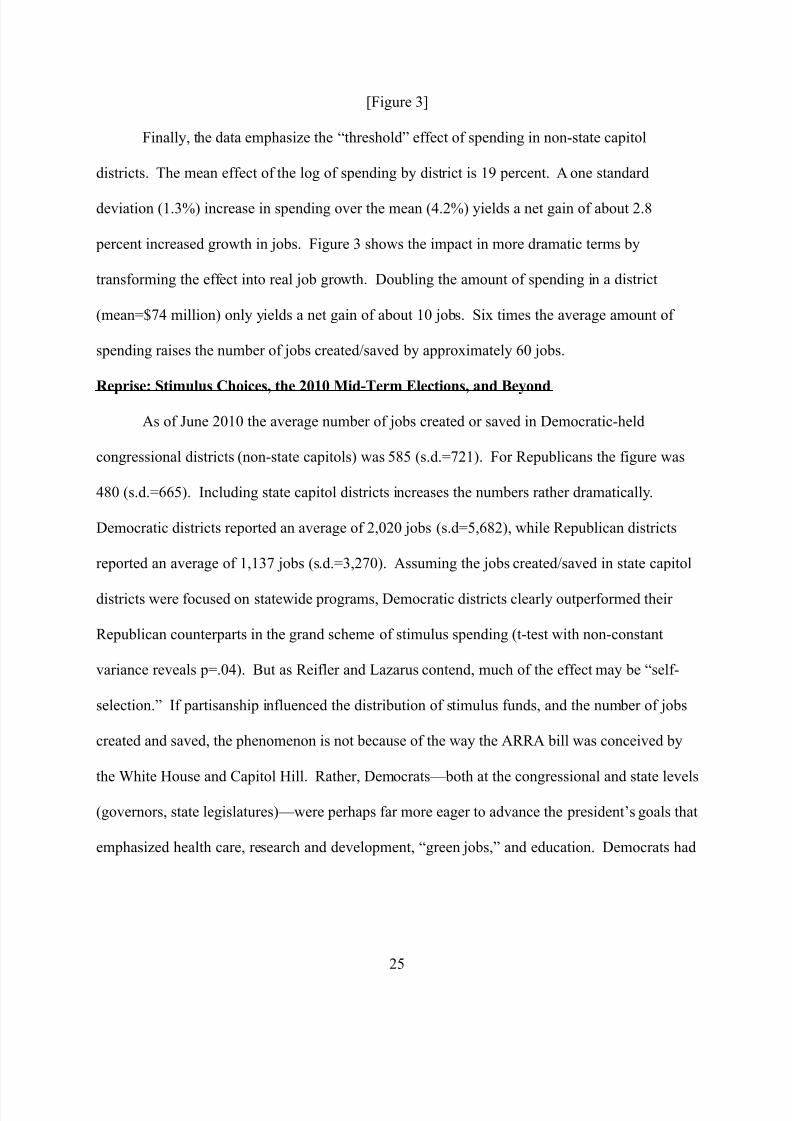
N'igure )
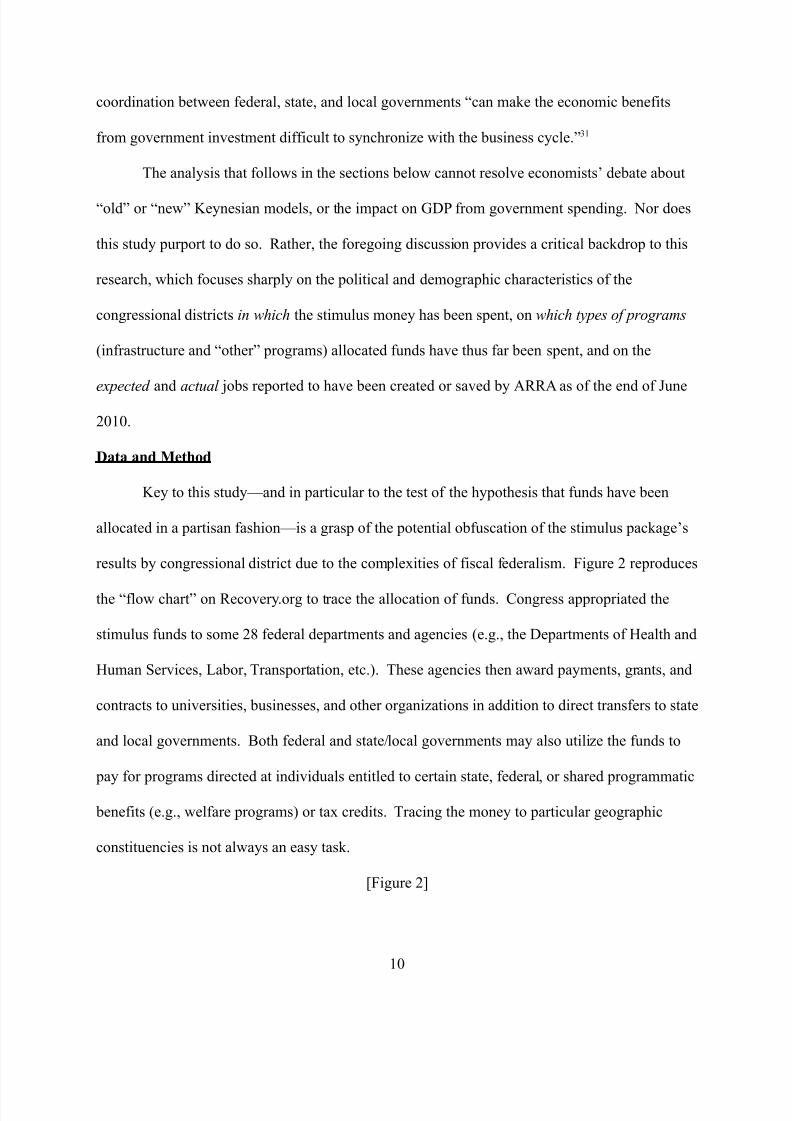
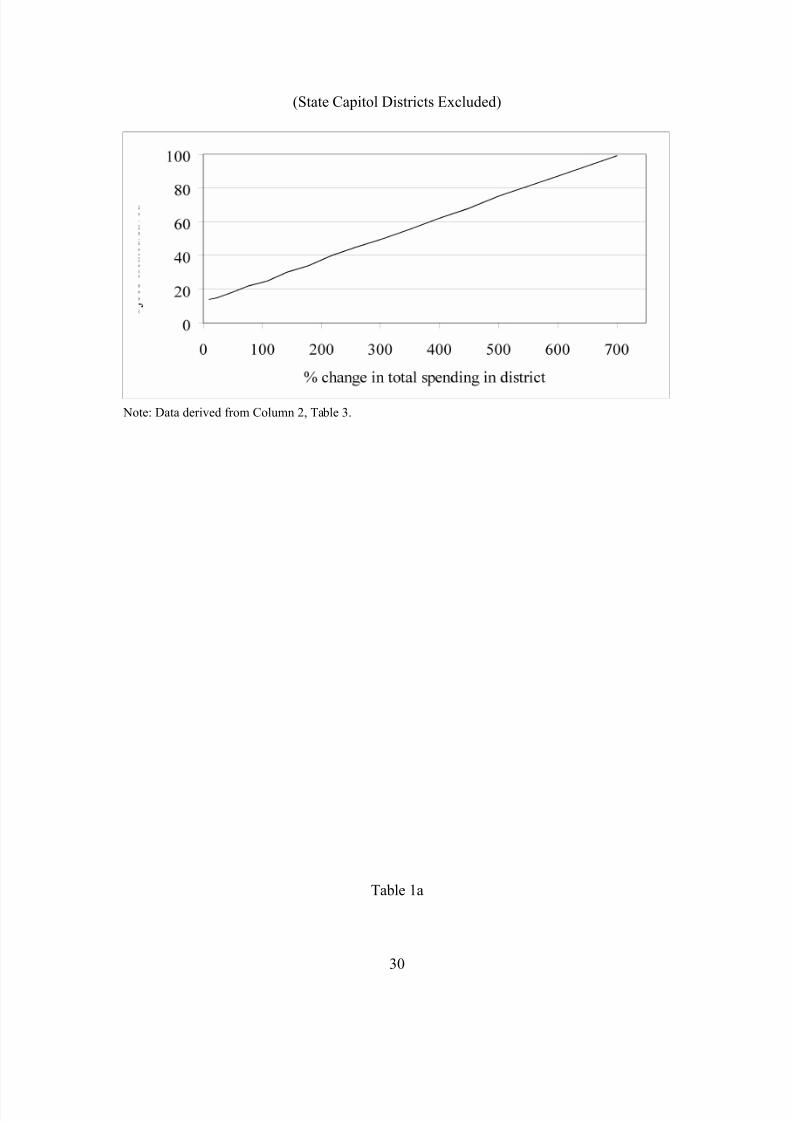
'inally, the data emphasiIe the “threshold" effect of spending in non3state capitol
districts% 6he mean effect of the log of spending by district is .8 percent% A one standard
de!iation /.%)1 increase in spending o!er the mean /*%(1 yields a net gain of about (%4
percent increased groth in Bobs% 'igure ) shos the impact in more dramatic terms by
transforming the effect into real Bob groth% Doubling the amount of spending in a district
/meanQ2* million1 only yields a net gain of about .9 Bobs% Si times the a!erage amount of
spending raises the number of Bobs createdMsa!ed by approimately -9 Bobs%
Reprise: Stimulus #hoices$ the 2% Mid&Term Elections$ and 'eyond
As of Hune (9.9 the a!erage number of Bobs created or sa!ed in Democratic3held
congressional districts /non3state capitols1 as 040 /s%d%Q2(.1% 'or $epublicans the figure as
*49 /s%d%Q--01% Lncluding state capitol districts increases the numbers rather dramatically%
Democratic districts reported an a!erage of (,9(9 Bobs /s%dQ0,-4(1, hile $epublican districts
reported an a!erage of .,.)2 Bobs /s%d%Q),(291% Assuming the Bobs createdMsa!ed in state capitol
districts ere focused on stateide programs, Democratic districts clearly outperformed their
$epublican counterparts in the grand scheme of stimulus spending /t3test ith non3constant
!ariance re!eals pQ%9*1% =ut as $eifler and aIarus contend, much of the effect may be “self3
selection%" Lf partisanship influenced the distribution of stimulus funds, and the number of Bobs
created and sa!ed, the phenomenon is not because of the ay the A$$A bill as concei!ed by
the hite +ouse and Capitol +ill% $ather, Democrats>both at the congressional and state le!els
/go!ernors, state legislatures1>ere perhaps far more eager to ad!ance the president’s goals that
emphasiIed health care, research and de!elopment, “green Bobs," and education% Democrats had
(0
7/17/2019 Stimulus 2
http://slidepdf.com/reader/full/stimulus-2 28/39
stronger incenti!es to capitaliIe more !igorously on the a!ailability of federal monies than
$epublicans%)8
6o the chagrin of congressional Democrats, many !oters in the mid3term elections of
(9.9 apparently failed to grasp the real or percei!ed benefits of the stimulus pacage at the state
and local le!els%*9 6his analysis places into sharp relief se!eral paradoes% 'irst, Bob
creationMpreser!ation in specific congressional constituencies appeared !ery ea !is3X3!is the
monthly Bob losses nationide, hich continuously ranged beteen *99,9993099,999 per month
from late (994 through early (9.9>a figure that e@uates to an a!erage of approimately .,999
Bobs per month for e!ery congressional district on a national scale% 6he creation of *99 or 099
Bobs in a particular district !ia the stimulus pacage by Hune (9.9 seemed insignificant to the
unemployed, many of hom simply ga!e up searching for gainful employment%
Second, the largest share of Bobs created or sa!ed by A$$A as not geographically
concentrated% 6he Bobs ere scattered across the states largely in terms of go!ernment programs
from education to elfare>Bobs for hich state agencies had significant difficulties reporting a
precise geographic impact% Lndeed, of the approimately 2((,999 Bobs reported to ha!e been
created or sa!ed by the stimulus pacage as of Hune (9.9, 0.(,999 ere located in state capitol
districts% 6he data con!ey in no uncertain terms the difficulties in!ol!ed in accounting for the
local effect of federal dollars doled out to the states for general transfer payments%
Galid arguments that the economy could ha!e been plunged further into recession without
the funds allocated for stateide or federalMstate shared programs seemed to fall on deaf ears
!oters% President Obama’s admission prior to the (9.9 elections that “there’s no such thing as
sho!el3ready proBects"*. may be interpreted much more as a brief treatise on the perils of
allocating /and tracing1 bloc grants through the labyrinthine federal system than a mea culpa
(-
7/17/2019 Stimulus 2
http://slidepdf.com/reader/full/stimulus-2 29/39
on the ays in hich stimulus dollars failed to shore up state and local go!ernments% =ut his
self3criticiIing comments did nothing to instill confidence in his signature economic plan%
Lndubitably, Obama’s comments solidified for many in the OP that the stimulus as asteful
and did not ha!e the intended effect of putting people bac to or @uicly% 6o the etent that
unemployed orers and a more generally disillusioned electorate !oted against Democrats, the
data per se from $eco!ery%go! suggest one source of maBor discontent%
Lronically, it may be +ouse $epublicans elected to the ..(th Congress ho face a
potentially perilous gambit% ;any in the ne caucus, particularly “6ea Party" members of the
OP, ha!e !oed to de3fund the approimately to3thirds of stimulus dollars that ha!e not yet
been appropriated% At the same time state go!ernments, and to a lesser degree, local
go!ernments ha!e made longer3term economic calculations and commitments contingent upon
the continuing flo of federal funds to solidify stateide programs% $epublicans ris the rath
of angry !oters in (9.( if education programs, unemployment benefits, and elfare are cut%
Such go!ernmental benefits may not be directly traceable to any single congressional district, but
are bound to affect !oting choices of indi!iduals% Of course, hether such $epublican efforts in
the +ouse materialiIe and sur!i!e the peculiarities of Senate rules or Obama’s !eto poer
remains an open @uestion%
hat is more certain is that the situation of di!ided go!ernment in the ..(th Congress
ill render retrospecti!e Budgments about the state of the economy difficult in ad!ance of the
(9.( presidential and congressional elections% Democrats no contemplate a second stimulus,
hile $epublicans pledge to de3fund the eisting program% 6he @uestion as to hich party !oters
ill assign blame or credit for dismantling or etending the stimulus spending, and ho !oters
(2
7/17/2019 Stimulus 2
http://slidepdf.com/reader/full/stimulus-2 30/39
ill interpret the effects of national policy choices on local economies and indi!idual fortunes, is
as comple as fiscal federalism itself%
'igure .Discount and 'ederal 'unds $ate !ersus &nemployment $ate, Selected Dates, (9923(9.9
(4
7/17/2019 Stimulus 2
http://slidepdf.com/reader/full/stimulus-2 31/39
Source7 Adapted by author from “+istorical Changes of the 6arget 'ederal 'unds and Discount $ates," 'ederal$eser!e =an of :e Kor, %ny%frb%orgMmaretsMstatisticsMdlyratesMfedrate%html, and =ureau of abor Statistics,“abor 'orce Statistics from the Current Population Sur!ey," +istorical 6ables, %bls%go!% Dates cited are thoseon hich the 'ederal $eser!e changed either the Discount $ate or the 'ederal 'unds $ate or both%
'igure (Allocation of Stimulus 'unds
Source7 Adapted by author from %reco!ery%go!
'igure )6he $elationship beteen Stimulus Dollars and Hob CreationMPreser!ation through Hune (9.9
(8
7/17/2019 Stimulus 2
http://slidepdf.com/reader/full/stimulus-2 32/39
/State Capitol Districts Ecluded1
:ote7 Data deri!ed from Column (, 6able )%
6able .a
)9
7/17/2019 Stimulus 2
http://slidepdf.com/reader/full/stimulus-2 33/39
636est ith &ne@ual Gariances of 6otal $ecei!ed / ;illions1 by Congressional District andParty Affiliation, All Districts /T( (9.91#
Party ;ean Standard De!iation
Democrat /nQ(041 (92%*8 0.*%)-
$epublican /nQ.221 .*0%09 )--%48
Difference -.%88
elch’s degrees of freedom Q )4- t Q %4) p Q %*.#=artlettYs test for e@ual !ariances7 U (Q((%*) p V 9%999
6able .b636est of 6otal $ecei!ed / ;illions1 by Congressional District and Party Affiliation,
State Capitol Districts Ecluded /T( (9.91
Party ;ean Standard De!iationDemocrat /nQ((-1 49%02 8.%42
$epublican /nQ.-)1 2*%0( .98%)2
Difference -%90
d%f% Q )42 t Q %08 p Q %00
6able .c636est of Lnfrastructure 'unds $ecei!ed / ;illions1 by Congressional District and Party
Affiliation, All Districts /T( (9.91
Party ;ean Standard De!iation
Democrat /nQ(041 *9%.) 09%.9
$epublican /nQ.221 )-%9- *8%4(
Difference *%92
d%f% Q *)) t Q %4) p Q %*9
6able (
).
7/17/2019 Stimulus 2
http://slidepdf.com/reader/full/stimulus-2 34/39
Effects /1 on A$$A Spending by Congressional District, State Capitol Districts Ecluded
Lnfrastructure'undsZ
“Other"Programs
Kears in Office 3.%(## .%4###
;ember’s ;argin of Gictory, (994 %92 3%8## District Gote for Obama, (994 %) %(
Democratic eader (%* 3)9%*
Committee Chair 3..%4 34-%.##
Appropriations Committee ;ember .)%0 .%8
“=lue Dog" Democrat .8%( .*%0
Democratic o!ernor in State (.%*# %(
Democratic State egislature *%0 -%*
Split3Party Control, State egislature 4%- .8%2
District Population Change, (999 Census %0 3.%9
;aBority =lac District (4%8 3.*%0
;aBority +ispanic District 3.9-%(### 349%*## District =lue Collar orers *%8#### 3)%-##
District =lue Collar orers Democrat %90 %*
District =elo Po!erty ine *%*### 0%*####
District &nemployed, December (994 3*.%9#### 30%8
District o!ernment orers .%* 4%0####
/ Ad)usted 1 R' %.- %.2
: )48 )48
#### p [ %99. ### p [ %9. ## p [ %90 # p [ %.9 Dependent !ariable is the natural log transformation of spending for each category%Z $obust regression results% $ ( is deri!ed from rregfit in S6A6A%
6able )
)(
7/17/2019 Stimulus 2
http://slidepdf.com/reader/full/stimulus-2 35/39
Effects /1 on A$$A Hobs Prediction /(9981 and Hobs Sa!edMCreated 6hrough T( (9.9,State Capitol Districts Ecluded
Hobs Predicted,'ebruary (998Z
Hobs Sa!edMCreated,T( (9.9Z
Kears in Office %9. .%99##;ember’s ;argin of Gictory, (994 %9. 3.%99
District Gote for Obama, (994 %98#### .%99
Democratic eader %9( .%.4#
Committee Chair 3%)4 3.%.4##
Appropriations Committee ;ember 3%)* 3.%90
“=lue Dog" Democrat 3%-9 .%90
Democratic o!ernor in State (%0#### 3.%9.
Democratic State egislature 3(%9#### 3.%98##
Split3Party Control, State egislature %24 .%9.
District Population Change, (999 Census .%9#### 3.%99
;aBority =lac District %4) 3.%92;aBority +ispanic District 30%)#### .%9(
District =lue Collar orers %98## 3.%9.#
District =lue Collar orers Democrat %9. .%99
District =elo Po!erty ine 3%9- .%9.##
District &nemployed, December (994 3.%2## .%90##
District o!ernment orers 3%90 .%9.#
og 6otal Spending Ln District 3333333333333 (%.4####
R' %04 %-0
: )48 )48
#### p [ %99. ### p [ %9. ## p [ %90 # p [ %.9 Dependent !ariable is the natural log transformation of spending for each category%
Z $obust regression results% $ ( is deri!ed from rregfit in S6A6A%
Appendi .
))
7/17/2019 Stimulus 2
http://slidepdf.com/reader/full/stimulus-2 36/39
Summary Statistics for Gariables in the $egression Analyses
*ariable +inimum +aximum +ean Std #eviation
;ember’s Kears in Office . 0* .9%04 8%.2
;ember’s ;argin of Gictory, (994
/1
*0 .99 -2%42 .)%)8
District Gote for Obama, (994 () 80 0)%2) .*%49
Democratic eader 9 . %9* %.8
Committee Chair 9 . %90 %((
+ouse Appropriations ;ember 9 . %.* %)0
“=lue Dog" Democrat 9 . %.( %)(
;ember ith Democratico!ernor in State Capitol
9 . %00 %09
;ember ith Democratic Stateegislature in State Capitol
9 . %-8 %*-
;ember ith Split Party Control
of State egislature
9 . %.( %))
District Population Change,(999 Census
3(2%* *0%) -%(. 2%8*
District Population Change,(999 Census, Democratic;ember
3.9%2 )-%4 (%)9 0%9(
;aBority +ispanic District 9 . %9- %()
;aBority =lac District 9 . %9- %()
District $ural 9 24%2 (9%84 .8%4*
District =lue Collar orers .%* *)%. (*%.) -%0)
District =lue Collar orers
Democrat
9 *)%. .*%.* .(%24
District Population =eloPo!erty ine
(%8 *(%( .(%)) 0%-)
District &nemployed,December (994
.%8 .9%( *%.8 .%.0
District o!ernment orers 2%. (8%9 .*%2( )%80
)*
7/17/2019 Stimulus 2
http://slidepdf.com/reader/full/stimulus-2 37/39
.(OTES
American $eco!ery and $ein!estment Act7 Tuestions and Ansers, $ebutting Critics>Part .% Office of Speaer :ancyPelosi, .) 'ebruary (998, p% .%http7MM%maBorityleader%go!Mdoc&ploadsMEconomic$eco!eryTApart.'L:A%pdf, accessed )9 September (9.9%
( President =arac Obama, “Statement on Signing the American $eco!ery and $ein!estment Act of (998," .2 'ebruary(998% http7MM%presidency%ucsb%eduMsMinde%php?pidQ4024(, accessed )9 September (9.9%
) egislati!e Digest, +%$% . Conference $eport% http7MM%gop%go!MbillM...M.Mhr.conferencereport, accessed )9 September (9.9%
* Tuoted from an inter!ie ith :=C’s +eet the ,ress in Peter allsten, “$epublicans Step &p Criticism of Obama," os
Angeles Times, (- Hanuary (998% http7MMarticles%latimes%comM(998MBanM(-MnationMna3stimulus(-, accessed )9 September(9.9%
0 Tuoted in Susan 'erechio, “;cConnell Says Obama, Democrats trying to FEuropeaniIe’ America," .ashington Examiner ,.) ;arch (998% http7MM%ashingtoneaminer%comMpoliticsM;cConnell3says3President3=arac3Obama3Democrats3trying3to3EuropeaniIe3America3*.(98.92%html, accessed )9 September (9.9%
- Jate :ash, “Other States’ eb Sites Also Sho Phantom Districts," Santa "e New +exican, .8 :o!ember (998, p% A2R
“Stimulus 'raud," !nvestor/s 0usiness #aily, .4 :o!ember (998, p% A.9R “Stimulus Site $eports Hobs in :oneistentDistricts," The Augusta 1hronicle /eorgia1, .4 :o!ember (998, p% A.(%
2 Caroline =aum, “Lnflated Hob Count 'luns Science 6est," Tulsa .orld , (8 :o!ember (998, p% )R Ed O’Jeefe, “Hob3Counting +elp Ls :eededR AO Calls for Clearer uidance for $eporting &se of Stimulus 'unds," .ashington ,ost , .8 :o!ember (998, p% A(0%
4 http7MM%hitehouse%go!MassetsMdocumentsM$eco!ery\Act\congressional\district\Bobs\(3.2%pdf
8 http7MM%politico%comMpdfMPP;..-\obamadoc%pdf
.9 =ob Caylor, “Stimulus =enefits are &niform7 :umber of Hobs Created, Sa!ed Similar by State," News Sentinel , .4'ebruary (998%
.. “President’s On :umbers Sho Stimulus +as 'ailed to Put Americans =ac to or," States News Service, - :o!ember (998%
.( 6om =enning, “'ederal Dollars Are at or, =ut here? Errors on eb Site ;ae Lt Difficult to 6rac Stimulus;oney," #allas +orning News, .8 :o!ember (998, p% .(A%
.) regory Jorte, “$eco!ery%go! a ;odel for 6ransparencyR Site 6racs o!ernment Spending," USA Today, (4 September(9.9, p% ..A%
.* ;ichael Cooper, “Stimulus atchdog Say hite +ouse Hobs :umbers ;ay :ot =e Accurate," New 2or3 Times, (9 :o!ember (998, p% .4%
.0 http7MMmercatus%orgMpublicationMstimulusfacts
.- ene yons, “'acts Are +ard to 'ind," Ar3ansas #emocrat-4a5ette, 4 April (9.9R Angie Drobnic +olan, “$eco!ery%go!Assigns Stateide Education Hobs to One Congressional District," St ,etersburg Times, (* :o!ember (998R Steart ;%Poell, “Stimulus Dollars Out 6here, Somehere7 eb Site to Lnform Public is ;isleading about ocal AllocationsStimulus," The 6ouston 1hronicle, (0 October (998%
.2 http7MMmercatus%orgMpublicationMstimulus3facts3.
.4 Douglas % Elmendorf and Hason 'urman, “Lf, hen, +o7 A Primer on 'iscal Stimulus," The 0roo3ings !nstitution /6he+amilton ProBect1, re!ised edition, Hanuary (994, p% *%http7MM%brooings%eduM]MmediaMfilesMrcMpapersM(994M9..9\fiscal\stimulus\elmendorf\furmanM9..9\fiscal\stimulus\elm
7/17/2019 Stimulus 2
http://slidepdf.com/reader/full/stimulus-2 38/39
endorf\furman%pdf
.8 Hohn =% 6aylor, “$eassessing Discretionary 'iscal Policy," 7ournal of Economic ,erspectives .* /(99917 (2%
(9 arence H% Christian, ;artin Eichenbaum, and Sergio% $ebelo, “hen is the o!ernment Spending ;ultiplier arge?" :=E$ oring Paper .0)8*, (998%
(. 6roy Da!ig and Eric ;% eeper, “;onetary3fiscal Policy Lnteractions and 'iscal Stimulus," European Economic Review,
forthcoming (9.9, doi7.9%.9.-MB%euroecore!%(9.9%9*%99*7 .%
(( 'or se!eral helpful re!ies, see Galerie A% $amey, “Ldentifying o!ernment Spending Shocs7 Lt’s All in the 6iming," :=E$ oring Paper .0*-*, (998R Hane % ra!elle, “6a Cuts and Economic Stimulus7 +o Effecti!e Are theAlternati!es?" C$S $eport for Congress, ( April (99(, Congressional $esearch Ser!ice, ibrary of Congress%
() =B^rn !an $oye and Dennis esselbaum, “Estimating the Lmpact of 'iscal Stimulus Pacages," in +% Jlodt and +%emment, editors, The 1risis and 0eyond /Jiel, ermany7 Lnstitute for the orld Economy1, p% *0%
(* H%=% 6aylor, +acroeconomic ,olicy in a .orld Economy8 "rom Econometric #esign to ,ractical 9peration /:e Kor7%% :orton, .88)1%
(0 Hohn '% Cogan, 6obias Ci, Hohn =% 6aylor, and Goler ieland, “:e Jeynesian !ersus Old Jeynesian o!ernment
Spending ;ultipliers," 7ournal of Economic #ynamics : 1ontrol )* /(9.917 (4)%
(- '% Smets and $% outers, “Shocs and 'rictions in &S =usiness Cycles7 A =ayesian DSE Approach," American
Economic Review 82 /(99217 09-3-9-%
(2 Hohn '% Cogan et al%, “:e Jeynesian !ersus Old Jeynesian o!ernment Spending ;ultipliers%"
(4 Eugene '% 'ama, “=ailouts and Stimulus Plans," http7MM%dimensional%comMfamafrenchM(998M9.Mbailouts3and3stimulus3 plans%html, accessed 4 October (9.9%
(8 Da!id A% Aschauer, “Ls Public Ependiture Producti!e?" 7ournal of +onetary Economics () /.84817 .223(99% 'or athorough re!ie, see Alicia ;unnell, “Policy atch7 Lnfrastructure Ln!estment and Economic roth," The 7ournal of
Economic ,erspectives - /.88(17 .48384%
)9 % ;ar Crain and isa J% Oaley, “6he Politics of Lnfrastructure," 7ournal of aw and Economics )4 /.88*17 (%
). Eric ;% eeper, 6odd =% aler, and Shu3Chun S% Kang, “o!ernment Ln!estment and 'iscal Stimulus in the Short andong $uns," 1enter for Applied Economics and ,olicy Research ;1AE,R<, .8 Hune (998% http7MM%indiana%eduM]caepr
)( 'or details and an eplanation, see the &CA Academic 6echnology Ser!ices eb site athttp7MM%ats%ucla%eduMstatMmult\pgMfagMgeneralMlog\transformed\regression%htm
)) 6he full regression models are a!ailable from the author upon re@uest% 6he data are a!ailable for donload athttp7MM%clas%ufl%eduMusersMrconley
)* States ith at3large representati!es /Alasa, Delaare, ;ontana, Germont, and yoming1 ere not coded as “state capitoldistricts" in the analysis% Ln some cases /e%g%, =oston, ;assachusetts, Phoeni, AriIona, and Springfield, Lllinois1 more than
one district comprises the capitol region, and as coded accordingly%
)0 $obert Pear and H% Da!id oodman, “o!ernors’ 'ight o!er Stimulus ;ay Define %O%P%," New 2or3 Times, 'ebruary (),(998 /:e Kor 6imes on the eb1%
)- http7MMpolitifact%comMfloridaMstatementsM(9.9MoctM(8Mcharlie3cristMcharlie3crist3claims3reco!ery3act3stimulus3sa!ed3tM
)2 Hason Embry and Jate Aleander, “Perry Shuns Stimulus Cash," Austin-American Statesman, ;arch .), (998, p% A.%
)4 Sheila =yrd, “Stimulus =attles =reing in the South," +obile Register /Alabama1, 'ebruary (2, (998, p% A.%
7/17/2019 Stimulus 2
http://slidepdf.com/reader/full/stimulus-2 39/39
)8 Hason $eifler and Heffrey aIarus, “Partisanship and Policy Priorities in the Distribution of Economic Stimulus 'unds,"Social Science $esearch :etor oring Paper, September ., (9.9, http7MMssrn%comMabstractQ.-29.-.%
*9 “Stimulus Spending ooms in Elections," http7MM%theorldlin%comMnesMlocalMarticle\0aba)--(39)f9304)-3a-ad3-ed-2-aa(8a-%html
*. Peter =aer, “Education of a President," New 2or3 Times +aga5ine, October .(, (9.9%http7MM%nytimes%comM(9.9M.9M.2MmagaIineM.2obama3t%html?\rQ._scpQ(_s@Qsho!el(9ready(9_stQcse