stm imaging of three-metal-center molecules: …lent/pdf/nd/stm3fewasio2012.pdf · stm imaging of...
TRANSCRIPT

STM Imaging of Three-Metal-Center Molecules: Comparison ofExperiment and Theory For Two Mixed-Valence Oxidation StatesNatalie A. Wasio,† Rebecca C. Quardokus,† Ryan P. Forrest,† Steven A. Corcelli,† Yuhui Lu,‡
Craig S. Lent,§ Frederic Justaud,∥ Claude Lapinte,∥ and S. Alex Kandel*,†
†Department of Chemistry and Biochemistry, University of Notre Dame, Notre Dame, Indiana 46556, United States‡Department of Chemistry, Louisiana College, Pineville, Louisiana 71360, United States§Department of Engineering, University of Notre Dame, Notre Dame, Indiana 46556, United States∥UMR CNRS 6226 Institut des Sciences Chimiques de Rennes, Universite de Rennes I, 35042 Rennes Cedex, France
ABSTRACT: The molecu le {Cp*(dppe)Fe(CC−)}3(1,3,5-C6H3) (Fe3) was adsorbed on a single-crystalgold surface and studied using ultrahigh-vacuum scanningtunneling microscopy (STM). Both the singly oxidized Fe3+
and doubly oxidized Fe32+ are mixed-valence ions, andlocalization of the charge at specific metal centers wasobserved as the appearance of pronounced asymmetry inSTM images. Switching the tip−sample bias voltage demonstrates that this asymmetry is electronic in nature. The nature ofintramolecular structure and the degree of asymmetry produced in STM images varies according to the state of the scanning tip.Constrained density functional theory was used to simulate STM images for the neutral molecule and for both mixed-valencespecies, and simulated images agreed closely with observed results. In particular, changing the number of molecular electronicstates contributing to contrast in the STM image produced a good match to the variation in structures measured experimentally.
■ INTRODUCTION
Molecules with mixed-valence oxidation states are compellingtargets of study. These molecules provide important modelsystems for intramolecular charge transfer,1,2 and theirelectronic and optical properties are of potential use inmaterials and devices.3,4 Our own interest in mixed-valencemolecules stems from the possibility of exploiting their charge-transfer properties to create molecular components usable inelectronic devices based upon the quantum cellular automata(QCA) architecture.5−12
Previous reports from our laboratory have describedscanning tunneling microscopy (STM) imaging of mixed-valence molecules, and compared the STM images to theresults of electronic-structure calculations.13,14 Most recently,we showed that a geometry difference in a central benzenelinker determined the degree of localization observed for singlemolecules. For two dinuclear organometallic molecules withidentical Cp*Fe(dppe) metal−ligand systems, the metacompound showed localization of intramolecular charge thatappeared as a bias-dependent “bright-dim” contrast in STMimages, while the para-Fe2 compound showed delocalizedcharge and symmetric STM images.15
In this manuscript, we present STM images and constraineddensity-functional (CDFT) calculations of the trimetallicmolecule Fe3, based on the same Cp*Fe(dppe) unit linkedto the central benzene at the 1, 3, and 5 positions. A model ofFe3 is shown in Figure 1a,b. Like the meta-Fe2 moleculestudied previously, we do not expect the π-electron system ofthe benzene to effectively couple the metal nuclei. Con-
sequently, this molecule is a mixed-valence species in both the+1 and +2 charge states when studied in solution. Theincreased complexity of this molecule, and the correspondinglygreater range of experimental images that can be acquired,provides a more stringent test of the theoretical models used.We present a detailed comparison between experiment andtheory in this manuscript.
■ EXPERIMENTAL AND THEORETICAL METHODS
Neutral Fe3 and mixed-valence Fe3+ and Fe32+ were preparedand deposited in a similar manner as previously reported.Briefly, Fe3 was dissolved in tetrahydrofuran (THF), andstoichiometric quantities of FcPF6 were added to produce thedesired mixed-valence state or mixture of states. Solution wasinjected directly onto a vacuum-sputtered and annealedAu(111)-on-mica sample, and solvent was allowed to evaporateat room temperature. This preparation method has theadvantages of being suitable to deposit virtually any molecule,and it does not break down the Fe3 species, which are bothheat- and air-sensitive.16,17
We varied the extent of oxidation considerably over thecourse of many experiments, although for any given sample, thevery small quantities of Fe3 used made the preparation ofspecific oxidation states somewhat imprecise. However, wewere able to compare samples with neutral Fe3 to those
Received: November 12, 2012Revised: November 16, 2012Published: November 16, 2012
Article
pubs.acs.org/JPCC
© 2012 American Chemical Society 25486 dx.doi.org/10.1021/jp311203u | J. Phys. Chem. C 2012, 116, 25486−25492

containing both Fe3 and Fe3+, and both of the previous twosamples containing Fe3+ and Fe32+. By noting the similaritiesand differences between molecular features in these samples, webuild up a reasonable degree of certainty that our samples docontain the oxidized species we are interested in studying.STM images were acquired at 77 K with an ultrahigh-vacuum
low-temperature STM (Omicron Nanotechnology LT-STM)using mechanically cut Pt/Ir tips. All images were acquired inconstant-current mode at a current of 10 pA, in order tominimize the interaction of the tip with surface-adsorbedmolecules. Other than image flattening to correct for surfacetilt, all data presented are raw STM data, with no filtering orpostprocessing performed.Electronic structure calculations were performed using
NWCHEM.18 Density functional theory (DFT) was used forcalculations performed on neutral Fe3. For mixed-valencesystems such as Fe3+ and Fe32+, traditional DFT has beenshown to be inadequate because it most often delocalizes thecharge.19 For this reason, the calculations performed on Fe3+
and Fe32+ instead used CDFT.20 CDFT overcomes thedelocalization problem by calculating the electron densitysubject to a charge constraint applied to a set of atoms.21−23
The B3LYP exchange-correlation functional was utilized forall DFT and CDFT calculations with the 6-311G(d, p) basis setfor C, H, and P atoms and the LANL2TZ(f) effective corepotential basis set for Fe atoms. Calculations were performedon the full Fe3 molecule with atomic positions taken directly
from published X-ray crystallographic data24 as well as an Fe3molecule with simplified ligands. The ligands were simplified inaccordance with previous studies which replaced all dppe andCp* ligands with pairs of PH3 and Cp ligands respectively.14,15
For the CDFT calculations positive unit charges wereconstrained to entire Cp*Fe(dppe)(CC−) or simplifiedCpFe(PH3)2(CC−) moieties.
■ RESULTS AND DISCUSSION
Neutral Fe3. Figure 1c,d shows STM images of neutral Fe3on Au(111): the sample imaged in panel a was prepared usingFe3 only, while the image in panel b was selected from a samplewhere Fe3+ (discussed in the following section) was alsocoadsorbed, though not imaged here. Molecular features consistof three bright, symmetric lobes concentrated around the iron-ligand centers. This is consistent with Fe3 molecules thatadsorb with the plane of the molecule mostly flat on thesurface, and, as all iron atoms are in the +2 oxidation state, eachFe3 molecule appears symmetric in these STM images. 3-foldsymmetry was observed for all neutral Fe3 molecules acrossmultiple experiments, regardless of the state of the STM tip.Rather more variation was observed in the relative order ofsurfaces prepared, with some experiments producing looselyaggregated, disordered Fe3 molecules with a range ofintermolecular spacings, and others (panel d of Figure 1)showing closer packing and increased order. This is presumablydue to the complex and variable nature of the solvent-drying
Figure 1. Structural formula (a) and model (b) of Fe3: {Cp*(dppe)Fe(CC−)}3(1,3,5-C6H3). The lower panels show STM images of neutral Fe3,(c) 106 Å × 94 Å, coadsorbed with solvent in relative disorder, imaged at +2 V bias; and (d) more closely packed, 91 Å × 74 Å, −1 V bias.
The Journal of Physical Chemistry C Article
dx.doi.org/10.1021/jp311203u | J. Phys. Chem. C 2012, 116, 25486−2549225487

process in vacuum. In almost all images, we observe smaller anddimmer structures that can be attributed to solvent moleculesor to the FcPF6 oxidant, coadsorbed along with Fe3 species. Wehave run a number of control experiments depositing solutionswith different components absent or present, in order toconfirm these assignments.14−16
Mixed-Valence Fe3+ and Fe32+. According to the Robin−Day classification, Fe3 is considered a Class II mixed-valencecomplex; that is, intramolecular electron transfer between metalcenters is slow.25 Potentially, charge localized within a mixed-valence complex will appear as an asymmetric electron densityin an STM image. This was observed for the Class II meta-Fe2compound, which shares with Fe3 the 1,3-substituted geometryaround the central benzene.15
Figure 2 shows samples with mixed-valence species, preparedto be an equal mixture of singly oxidized Fe3+ and doublyoxidized Fe32+. Images were acquired at both positive andnegative junction bias to allow for a more sensitive probe ofelectronic structure.26,27 At positive sample biases, electronstunnel from the tip to the sample, and image contrast isinfluenced more significantly by unoccupied molecule-surfaceelectronic states; conversely, negative sample biases inducetunneling from the sample to the tip and reveal occupiedmolecule-surface electronic states.A variety of molecular features appear in these images.
Features circled in green appear asymmetric in the positive-bias
image (Figure 2a), with two of the three lobes in the featuresignificantly dimmer than the third. (We note that the differentorientation of these features implies that the asymmetry doesnot result from the microstructure of the STM tip.) In thenegative-bias image (Figure 2b), these features appear largelysymmetric. The opposite behavior is seen for the featurescircled in orange, which are largely symmetric at positive biasvoltages, and appear as asymmetric, bright−dim−dim featuresat negative bias. Most molecular features were similar to theorange-circled or green-circled features in their appearance andbias-voltage dependence, although a minority of observedstructures (viz., the molecule in the lower middle-left of thefigure) appeared dissimilar to either. This may be the result ofminor impurities in the sample, differences in adsorptiongeometry, or comproportionation to produce other Fe3oxidation states.Assigning features in STM images to molecules must be
done cautiously. Qualitatively, we expect an Fe3+ molecule toshow an enhancement in empty electronic states and acorresponding depletion in filled electronic states, bothappearing on only one of its three lobes. The green-circledfeatures match this empty-state behavior (a), but appearrelatively symmetric with respect to filled states (b), and weassign these features as Fe3+. The orange-circled features areFe32+, and while they appear relatively symmetric in empty-state density, they show depletion in two of three lobes in the
Figure 2. Images of samples containing an equal mixture of Fe3+ and Fe32+, acquired at positive sample bias (panels a, c, and e) and negative samplebias (panels b, d, and f). Intramolecular contrast depends on the state of the tip for both Fe3+ (green and blue) and Fe32+ (orange and purple).Panels a and b were acquired at ±2 V and are 145 Å × 111 Å; panels c−f were acquired at ±1 V and are 42 Å × 38 Å.
The Journal of Physical Chemistry C Article
dx.doi.org/10.1021/jp311203u | J. Phys. Chem. C 2012, 116, 25486−2549225488

filled-state image. The sensitivity of STM images to variationsin molecular electronic-state density will be discussed in moredetail when comparing to theoretical calculations in thediscussion.We find that from experiment to experiment, the bias-
dependent contrast in images of Fe3+ and Fe32+ changes. Thisis demonstrated in Figure 2c−f, which shows additional imagesof these molecules, recorded under similar conditions but ondifferent samples and different days. In these images, weobserve Fe3+ molecules where contrast is sharp in filled states,but empty-state features appear nearly symmetric (blue circles),as well as Fe2+ features showing high asymmetry in empty stateimages (purple circles.) Some molecular mobility obscures theFe32+ features in Figure 2f, though they appear significantlymore symmetric than the molecular features at positive bias. Itis not uncommon for the state of the STM tip to affect thecontrast observed in STM images, an effect that has beenattributed to the tip electronic state density determining whichsurface states contribute to tunneling.28,29 We note thatgenerally, features identified with green circles for Fe3+ are
paired with orange-circled Fe32+ (as in Figure 2a,b); and bluecircles with purple circles. However, we have observed a green-purple pairing, which indicates that the contrast mechanismmay be a more complex function of the state of the tip.
Calculated STM Images. There are a number of differentmethods for using electronic-structure calculations to simulateSTM images.21−23,30−34 For all of these techniques, however,there is a trade-off between accuracy and expense, as exactcomputation of the result of an STM experiment requires a fullquantum-mechanical treatment of the combined molecule-surface-tip system. For large molecules, such as the one studiedhere, this calculation is prohibitively complex given currentcomputational resources. Our approach here is to disregardboth the surface and the STM tip, and thus limit the electronic-structure calculation to the molecule in vacuum.35 We note thatthis is necessarily less general and less rigorous than anapproach that includes the sample and tip in the calcu-lation,34,36−44 and will discuss below what can still be gainedfrom a comparison between experiment and theory.
Figure 3. (a) Comparison of simulated STM images for neutral Fe3, using simplified ligands but optimized geometry, or full ligands but single-pointgeometry. (b) Calculated STM images for mixed-valence Fe3+, broken down into contributions from individual electronic states, from LUMOthrough LUMO+3.
The Journal of Physical Chemistry C Article
dx.doi.org/10.1021/jp311203u | J. Phys. Chem. C 2012, 116, 25486−2549225489
The probability distributions that are the result of NWChemcalculations are integrated over space to predict the tunnelingcurrent resulting from placing the STM tip at any given
location. This integration is weighted, with the largestcontribution to the tunneling current arising from the electrondensity in the vicinity of the tip, falling off exponentially with
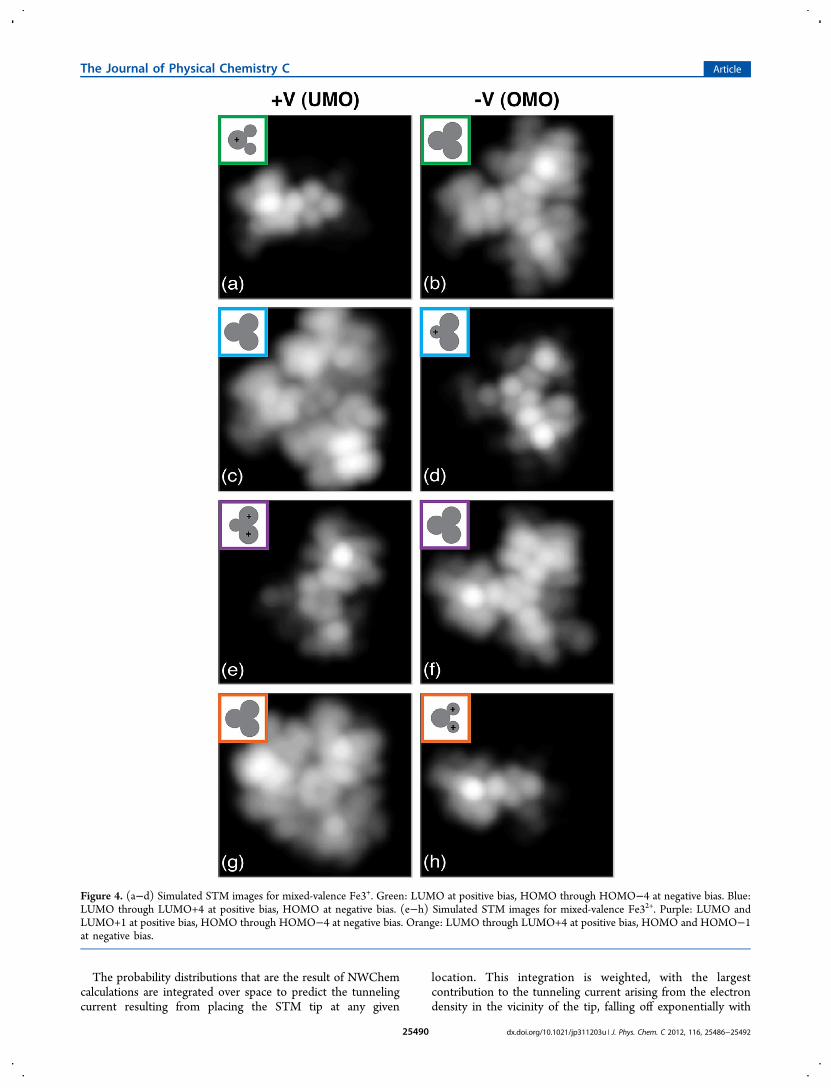
Figure 4. (a−d) Simulated STM images for mixed-valence Fe3+. Green: LUMO at positive bias, HOMO through HOMO−4 at negative bias. Blue:LUMO through LUMO+4 at positive bias, HOMO at negative bias. (e−h) Simulated STM images for mixed-valence Fe32+. Purple: LUMO andLUMO+1 at positive bias, HOMO through HOMO−4 at negative bias. Orange: LUMO through LUMO+4 at positive bias, HOMO and HOMO−1at negative bias.
The Journal of Physical Chemistry C Article
dx.doi.org/10.1021/jp311203u | J. Phys. Chem. C 2012, 116, 25486−2549225490

distance. The decay constant of the exponential is an adjustableparameter. In the limit of short decay, this procedure maps outa surface of constant electron state density, while the long-decay limit projects the electron density onto two dimensions.Both of these limiting cases are established methods to simulateSTM images. By selecting a decay length intermediate betweenthese two limits, we aim for a more physically reasonablemethod for converting electron density distributions totunneling current and, from there, STM images.Figure 3a shows simulated STM images for neutral Fe3. The
first simulation used a fully optimized molecular geometry, butsimplified the diphenylphosphino ligands to pairs of PH3moieties. In contrast, a second simulation uses the full ligands,but did not employ a geometry optimization; instead, atomicpositions were taken from published X-ray crystallographic dataand used as-is. Because the geometry likely changessubstantially on surface adsorption, there is no reason tothink that a geometry optimized for the molecule in vacuumwould be any more accurate than the experimental solid-stategeometry.While the image generated using the full dppe ligands shows
intramolecular structure that is more complex, the two imagesare qualitatively similar in their overall symmetry and in thecontrast between the center of the molecule and the outerlobes. In previous studies, we opted for simplified ligands toreduce computation time,14,15 and Figure 3a bears out thereasonableness of that approach. In this manuscript, we opt touse the full ligands, without the computationally expensive stepof optimizing the molecular geometry.Experimental images of Fe3+ and Fe32+ show a pronounced
dependence on the sign of the tip−sample bias voltage;furthermore, the contrast evident in positive-bias and negative-bias images appears to change in some fashion with the state ofthe STM tip. To investigate this further, we construct imagesconsidering each calculated electronic state of Fe3+ independ-ently. These empty-state images for Fe3+ are shown in Figure3b. The asymmetry for the lowest unoccupied molecular orbital(LUMO), shown in panel (a), is qualitatively what one wouldexpect: the metal−ligand system that is constrained to have onefewer electron shows up brightly compared to the other twoiron centers. However, the experiment will be sensitive not onlyto the molecular LUMO, but also higher-lying empty stateswithin the range of the bias voltage (1−2 V) applied betweenthe tip and sample. Integration over multiple states will tend toproduce images with more symmetric molecular features.As we have already discussed, the contrast of Fe3+ and Fe32+
changes according to the state of the STM tip, with two distinctfeatures observed for each molecule. In general terms, eachmixed-valence molecule shows asymmetry in its intramolecularcontrast only at one tip−sample bias polarity: i.e., in Figure 2,both the Fe3+ (green) and Fe32+ (purple) features areasymmetric at positive bias and symmetric at negative bias.Figure 4 presents simulated images for Fe3+ and Fe32+ to whichthe experimental data can be compared. The best match for thegreen-and-purple coded images comes when the simulationassumes that only the LUMO contributes to positive-biasimages, but that states ranging from the highest occupiedmolecular orbital (HOMO) to the HOMO−3 are importantwhen imaging at negative bias. The other features observed forFe3+ and Fe32+ in Figure 2 are matched very well by thesimulations colored blue and orange in Figure 4, which werecalculated assuming that multiple electronic states (LUMOthrough LUMO+3) contribute at positive bias, while only the
HOMO (and, for Figure 4h, the HOMO−1) are imaged atnegative bias. The qualitative fit for both Fe3+ and Fe32+
between Figure 2 and Figure 4 is excellent.On a purely phenomenological basis, then, the experimental
differences in tip contrast are explained by a shift in the Fermilevel of the STM tip.45−47 For example, a shift upward in the tipFermi level would increase the number of unoccupied statesimaged at positive bias, but narrow the number of occupiedstates imaged at negative bias. This is consistent with the shiftfrom blue-coded to green-coded features for Fe3+, or fromorange to purple for Fe32+. A shift in the Fermi level of the tiprelative to the sample could be either apparent or actual.Asymmetry in the tip density of states near the Fermi levelcould produce an apparent effect: if the tip microstructuredetermines whether the tip has a relatively greater number offilled or empty states, this could appear experimentally as aFermi level shifted higher or lower.45 Alternately, variations inthe tip’s chemical composition could result in an actual Fermilevel shift. An additional possibility is that it is the sample Fermilevel that is shifting relative to the tip. Fe3+ and Fe32+ aretypically imaged coadsorbed with, and potentially on top of,solvent molecules. Changing surface conditions could affect theadsorption environment, and in that way be responsible for thecontrast differences observed.Overall, qualitative agreement is quite strong between the
experimentally observed images of Fe3+ and Fe32+ and theimages simulated using electronic-structure calculations of themolecules in vacuum. Agreement between experiment andcalculation is excellent for this molecule as a neutral species andfor two cationic oxidation states, and a similar approachproduced good agreement for the previously observed Fe2species.14,15 It is noteworthy, and perhaps surprising, that asimplified calculation that ignores the effect of the surface andSTM tip can nonetheless appear qualitatively correct. We donot expect that this approach would work similarly well forother molecules, for which a more general treatment would benecessary.34,36−44 For Fe3, we suggest that a number of factorsmay be responsible for the in-vacuum calculation producinggood results. First among these is the effect of the relativelybulky dppe ligands, which will tend to insulate the iron centersfrom the surface; previous experiments have shown that thepresence of an intentionally adsorbed insulating layer mayresult in STM images that more closely resemble molecularfrontier orbitals, and the ligands may serendipitously be playinga similar role. This effect could be magnified by the tendencyfor STM image contrast to depend strongly on the metalcenters and much more weakly on the specifics of the ligandgeometry, which would additionally explain why moderatechanges in geometry on adsorption would not invalidate thecomparison between experiment and a gas-phase calculation.In conclusion, CDFT is effective for calculating STM images
of mixed-valence molecules, and it reproduces relativelycomplex tip-dependent variation in intramolecular structurefor the Fe3 mixed-valence system. Both Fe3+ and Fe32+ ions areobserved via STM to be asymmetric in their electronicstructure, with stable, localized electronic state densityconsistent with their assignment as class II mixed-valencemolecules.
■ AUTHOR INFORMATION
Corresponding Author*E-mail: [email protected].
The Journal of Physical Chemistry C Article
dx.doi.org/10.1021/jp311203u | J. Phys. Chem. C 2012, 116, 25486−2549225491

NotesThe authors declare no competing financial interest.
■ ACKNOWLEDGMENTS
This work was supported by the National Science Foundationunder NSF CHE-0848415 and NSF CHE-1124762.
■ REFERENCES(1) Weyland, T.; Costuas, K.; Toupet, L.; Halet, J. F.; Lapinte, C.Organometallics 2000, 19, 4228−4239.(2) Costuas, K.; Rigaut, S. Dalton Trans. 2011, 40, 5643−5658.(3) Weyland, T.; Ledoux, I.; Brasselet, S.; Zyss, J.; Lapinte, C.Organometallics 2000, 19, 5235−5237.(4) Ghazala, S. I.; Paul, F.; Toupet, L.; Roisnel, T.; Hapiot, P.;Lapinte, C. J. Am. Chem. Soc. 2006, 128, 2463−2476.(5) Arima, V.; Iurlo, M.; Zoli, L.; Kumar, S.; Piacenza, M.; Della Sala,F.; Matino, F.; Maruccio, G.; Rinaldi, R.; Paolucci, F.; et al. Nanoscale2012, 4, 813−823.(6) Braun-Sand, S.; Wiest, O. J. Phys. Chem. A 2003, 107, 285−291.(7) Tokunaga, K. Phys. Chem. Chem. Phys. 2009, 11, 1474−1483.(8) Qi, H.; Sharma, S.; Li, Z.; Snider, G.; Orlov, A.; Lent, C.; Fehlner,T. J. Am. Chem. Soc. 2003, 125, 15250−15259.(9) Li, Z.; Beatty, A.; Fehlner, T. Inorg. Chem 2003, 42, 5707−5714.(10) Tokunaga, K. Materials 2010, 3, 4277−4290.(11) Qi, H.; Gupta, A.; Noll, B.; Snider, G.; Lu, Y.; Lent, C.; Fehlner,T. J. Am. Chem. Soc. 2005, 127, 15218−15227.(12) Lu, Y.; Lent, C. S. Nanotechnology 2008, 19, 1−11.(13) Guo, S.; Kandel, S. A. J. Phys. Chem. Lett. 2010, 1, 420−424.(14) Lu, Y. H.; Quardokus, R.; Lent, C. S.; Justaud, F.; Lapinte, C.;Kandel, S. A. J. Am. Chem. Soc. 2010, 132, 13519−13524.(15) Quardokus, R. C.; Lu, Y. H.; Wasio, N. A.; Lent, C. S.; Justaud,F.; Lapinte, C.; Kandel, S. A. J. Am. Chem. Soc. 2012, 134, 1710−1714.(16) Guo, S.; Kandel, S. A. J. Chem. Phys. 2008, 128, 014702.(17) Grill, L.; Stass, I.; Rieder, K. H.; Moresco, F. Surf. Sci. 2006, 600,L143−L147.(18) Valiev, M.; Bylaska, E. J.; Govind, N.; Kowalski, K.; Straatsma,T. P.; Van Dam, H. J. J.; Wang, D.; Nieplocha, J.; Apra, E.; Windus, T.L.; et al. Comput. Phys. Commun. 2010, 181, 1477−1489.(19) Cohen, A. J.; Mori-Sanchez, P.; Yang, W. T. Science 2008, 321,792−794.(20) Kaduk, B.; Kowalczyk, T.; Van Voorhis, T. Chem. Rev. 2012,112, 321−370.(21) Wu, Q.; Van Voorhis, T. Phys. Rev. A 2005, 72, 024502.(22) Wu, Q.; Van Voorhis, T. J. Phys. Chem. A 2006, 110, 9212−9218.(23) Wu, Q.; Van Voorhis, T. J. Chem. Theory Comput. 2006, 2, 765−774.(24) Weyland, T.; Lapinte, C.; Frapper, G.; Calhorda, M.; Halet, J.;Toupet, L. Organometallics 1997, 16, 2024−2031.(25) Robin, M.; Day, P. Adv. Inorg. Chem. Radiochem. 1967, 10, 247−422.(26) Comanici, K.; Buchner, F.; Flechtner, K.; Lukasczyk, T.;Gottfried, J.; Steinrueck, H.; Marbach, H. Langmuir 2008, 24, 1897−1901.(27) Nieminen, J.; Lahti, S.; Paavilainen, S.; Morgenstern, K. Phys.Rev. B 2002, 66, 165421.(28) Sautet, P. Chem. Rev. 1997, 97, 1097−1116.(29) Hofer, W.; Redinger, J. Philos. Mag. B 1998, 78, 519−525.(30) Bardeen, J. Phys. Rev. Lett. 1961, 6, 57−59.(31) Cerda, J.; Van Hove, M.; Sautet, P.; Salmeron, M. Phys. Rev. B1997, 56, 15885−15899.(32) Krajci, M.; Hafner, J. Phys. Rev. B 2011, 84, 115410.(33) Blanco, J. M.; Flores, F.; Perez, R. Prog. Surf. Sci. 2006, 81, 403−443.(34) Villagomez, C.; Zambelli, T.; Gauthier, S.; Gourdon, A.;Stojkovic, S.; Joachim, C. Surf. Sci. 2009, 603, 1526−1532.
(35) Pascual, J.; Gomez-Herrero, J.; Rogero, C.; Baro, A.; Sanchez-Portal, D.; Artacho, E.; Ordejon, P.; Soler, J. Chem. Phys. Lett. 2000,321, 78−82.(36) Bellec, A.; Ample, F.; Riedel, D.; Dujardin, G.; Joachim, C. NanoLett. 2009, 9, 144−147.(37) Cheng, Z.; Du, S.; Jiang, N.; Zhang, Y.; Guo, W.; Hofer, W.;Gao, H.-J. Surf. Sci. 2011, 605, 415−418.(38) Guillermet, O.; Gauthier, S.; Joachim, C.; de Mendoza, P.;Lauterbach, T.; Echavarren, A. Chem. Phys. Lett. 2011, 511, 482−485.(39) Guo, Q.; Huang, M.; Qin, Z.; Cao, G. Ultramicroscopy 2012,118, 17−20.(40) Kasaya, K.; Tabata, H.; Kawai, T. Surf. Sci. 1998, 406, 302−311.(41) Korventausta, A.; Paavilainen, S.; Niemi, E.; Nieminen, J. Surf.Sci. 2009, 603, 437−444.(42) Soe, W.; Manzano, C.; De Sarkar, A.; Chandrasekhar, N.;Joachim, C. Phys. Rev. Lett. 2009, 102, 107102.(43) Makoudi, Y.; Palmino, F.; Duverger, E.; Arab, M.; Cherioux, F.;Ramseyer, C.; Therrien, B.; Tschan, M. J. L.; Suess-Fink, G. Phys. Rev.Lett. 2008, 100, 076405.(44) Repp, J.; Meyer, G.; Stojkovic, S.; Gourdon, A.; Joachim, C.Phys. Rev. Lett. 2005, 94, 026803.(45) Pelz, J. Phys. Rev. B 1991, 43, 6746−6749.(46) Passoni, M.; Donati, F.; Bassi, A. L.; Casari, C. S.; Bottani, C. E.Phys. Rev. B 2009, 79, 045404.(47) Kwapinski, T.; Jalochowski, M. Surf. Sci. 2010, 604, 1752−1756.
The Journal of Physical Chemistry C Article
dx.doi.org/10.1021/jp311203u | J. Phys. Chem. C 2012, 116, 25486−2549225492