stochastic time series of daily precipitation for the ... · pdf filestochastic time series of...
TRANSCRIPT

Martin Köchy
Stochastic time series of daily precipitation for the interior of Israel
U n i v e r s i t ä t P o t s d a m
Postprints der Universität PotsdamMathematisch-Naturwissenschaftliche Reihe ; 29
fi rst published in:Israel Journal of Earth Science - 55 (2006), 2, p. 103-109ISSN: 0021-2164DOI: 10.1560/IJES_55_2_103
Postprint published at the institutional repository of Potsdam University:In: Postprints der Universität Potsdam : Mathematisch-Naturwissenschaftliche Reihe ; 29http://opus.kobv.de/ubp/volltexte/2007/1315/http://nbn-resolving.de/urn:nbn:de:kobv:517-opus-13155

1
Stochastic time series of daily precipitation for the 1
interior of Israel 2
(Short contribution) 3
4
Martin Köchy 5
Research group Plant ecology and nature conservation 6
Maulbeerallee 3 7
Potsdam University 8
Postfach 60 15 53 9
14415 Potsdam 10
GERMANY 11
12
Telephone: +49-331-977 1974 13
Telefax: +49-331-977 1948 14
E-mail: [email protected] 15
16
Running head: Stochastic time series of precipitation 17
18
Published in Israel Journal of Earth Science 55:103-109, doi: 10.1560/IJES_55_2_103 available at http://www.sciencefromisrael.com/

2
Abstract 18
This contribution describes a generator of stochastic time series of daily 19
precipitation for the interior of Israel from c. 90 to 900 mm mean annual 20
precipitation (MAP) as a tool for studies of daily rain variability. The probability of 21
rainfall on a given day of the year is described by a regular Gaussian peak curve 22
function. The amount of rain is drawn randomly from an exponential distribution 23
whose mean is the daily mean rain amount (averaged across years for each day of 24
the year) described by a flattened Gaussian peak curve. Parameters for the curves 25
have been calculated from monthly aggregated, long-term rain records from seven 26
meteorological stations. Parameters for arbitrary points on the MAP gradient are 27
calculated from a regression equation with MAP as the only independent variable. 28
The simple structure of the generator allows it to produce time series with daily rain 29
patterns that are projected under climate change scenarios and simultaneously 30
control MAP. Increasing within-year variability of daily precipitation amounts also 31
increases among-year variability of MAP as predicted by global circulation models. 32
Thus, the time series incorporate important characteristics for climate change 33
research and represent a flexible tool for simulations of daily vegetation or surface 34
hydrology dynamics. 35
36

3
Introduction 36
Projections of the effect of climate change on crops, natural vegetation, and 37
surface hydrological processes usually rely on simulations of future climates. In 38
arid to Mediterranean climates like Israel's, changes in precipitation may be more 39
important than changes in temperature. Global circulation models generally project 40
an increase in extreme precipitation events and greater variability both within and 41
among years (Easterling et al., 2000). This is supported by changes in historic 42
regional climate records (e.g. Ben-Gai et al., 1998; Alpert et al., 2002). Changes in 43
the distribution of daily rain patterns have significant direct impacts on hydrological 44
and ecological processes (Weltzin et al., 2003; Loik et al., 2004) including runoff, 45
erosion, groundwater recharge, vegetation productivity, decomposition, and 46
ecosystem stability with repercussions for the socio-economic framework of 47
millions of humans (Milliman et al., 1992). Global and regional projections of 48
climate change and its impact on the environment still include some uncertainty 49
(Watson et al., 1997). Projections of climate change for Israel are still more 50
uncertain than those for other countries because of Israel's small size compared to 51
the grid cell size of most current global circulation models (Pe'er and Safriel, 2000). 52
The uncertainty of the extent of climate change in Israel is surpassed by that of 53
projections of socioeconomic changes (Milliman et al., 1992; Pe'er and Safriel, 54
2000), although a comprehensive multi-disciplinary project is underway to remedy 55
this situation (Hoff et al., 2006). For simulations of future changes in hydrology and 56
ecology modellers prefer stochastic time series of precipitation to static time slices 57

4
for incorporating and assessing the variability of climate on environmental 58
processes (Srikanthan and McMahon, 2001). Only two generators of stochastic 59
time series for Israel have been described so far. These are specific to the Tel-Aviv 60
area (Gabriel and Neuman, 1962) and the Arava (Barzilay et al., 2000). Other, 61
more general generators of stochastic time series (Srikanthan and McMahon, 62
2001) require the calibration of many parameters (e.g. 48, Wilks, 1992) and are 63
therefore not easily adapted to other regions or to include changes in rain intensity 64
or frequency as observed in the past (Alpert et al., 2002) or projected by global 65
circulation models (Easterling et al., 2000). Here I present ReGen, a generator of 66
stochastic time series of daily precipitation for sites in the interior of Israel with 90 67
to 900 mm mean annual precipitation. Additionally, the generator allows the 68
manipulation of daily rain patterns (intensity and frequency) as projected by global 69
circulation models. 70
Methods 71
The ReGen simulator produces stochastic time series of daily precipitation for 72
locations along a transect from the northern edge of the Negev desert to the 73
Galilee mountains in Israel (90 to 900 mm mean annual precipitation, elevation 300 74
– 500 m). The distribution of rainy days in the region is unimodal as a first 75
approximation (Goldreich 1995). The time series are generated by a so-called two-76
part model (Srikanthan and McMahon 2001). The first part is a regular bell-shaped 77
seasonal function (Gaussian peak curve). It determines the daily probability, pd, 78
that a given day of the year is a rainy day as 79

5
pd = amplitude · exp[ –(day – location)shape ⁄ (2 · width²)], 80
where shape = 2, and day 1 = August 1 (Fig. 1a). Counting the days from August 1 81
centres the distributions conveniently and corresponds to the traditional “rainfall 82
year” (Goldreich, 1995). The curve becomes periodic by the function day := (day + 83
182 – location) mod 365 – 182 + day. I specified a minimum probability threshold 84
of 0.05 for rainfall to avoid unrealistic rain events in summer. The second part of 85
the model is a similar bell-shaped seasonal function with shape = 4 to produce a 86
flattened curve (Fig. 1b). This function determines the daily mean rain amount 87
DMRd, i.e., the rain amount for a given day of the year averaged across years. The 88
rain amount for a specific rainy day is drawn randomly from an exponential 89
distribution whose mean corresponds to DMRd. The distribution has the advantage 90
of requiring only one parameter, but it under-represents the frequency of rain 91
categories <5 mm. This decreases the length of rain spells according to their 92
definition as consecutive rains with >0.1 mm rain (e.g., Paz and Kutiel, 2003), but it 93
has few consequences for the practical application of ReGen because the volumes 94
involved are so small. The three parameters (except shape) of each of the two 95
Gaussian peak curves were determined by nonlinear regression of monthly 96
aggregated long-term data from seven meteorological stations along a MAP 97
gradient in the interior of Israel (Tab. 1). I excluded from the data days with rain 98
<0.5 mm and set rain amount = 0 for months with ≤2 rainy days summed across 99
years. The historic precipitation records of the seven stations along the MAP 100
gradient showed no significant autocorrelation (Durbin-Watson test). Therefore, I 101
did not introduce any annual autocorrelation in the stochastic time series either. 102

6
The non-linear regressions of p and DMR explained ≥89% of the monthly variation 103
at each station. 104
For generating stochastic time series of daily precipitation for arbitrary values of 105
MAP between 90 and 900 mm, I calculated regressions of each parameter of the 106
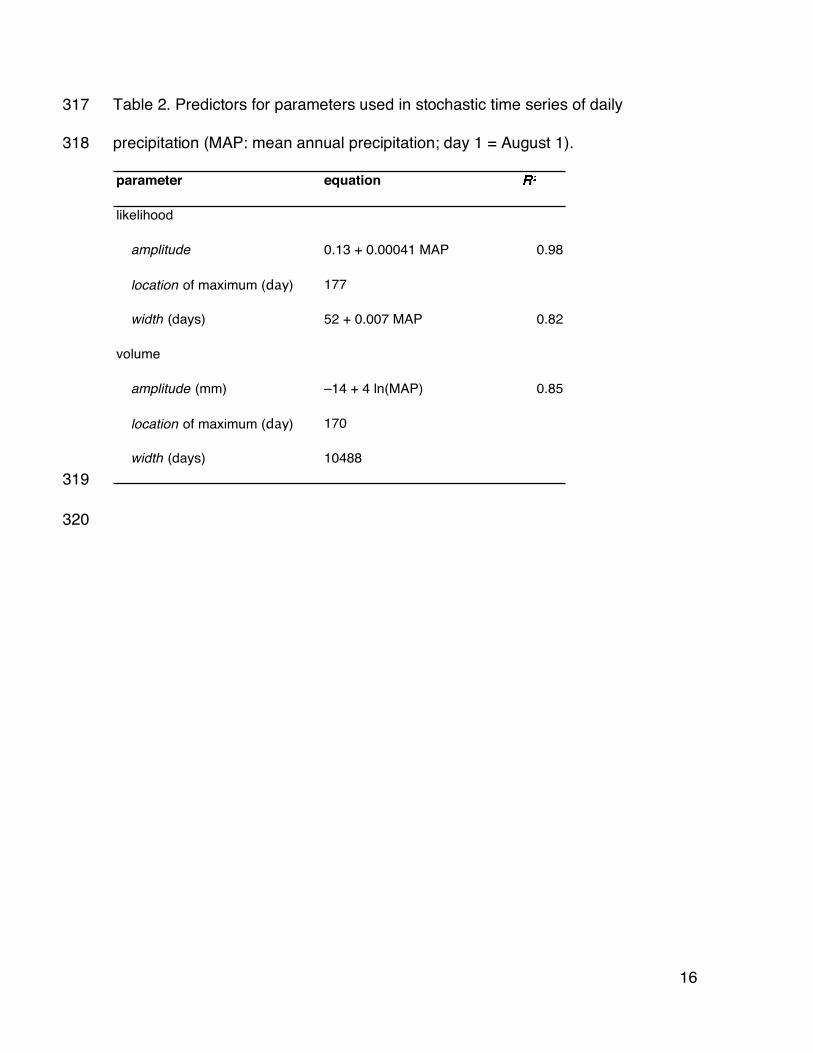
two Gaussian peak curves (except shape) on MAP. Amplitude and width of 107
precipitation likelihood and amplitude of DMR could be predicted well by MAP 108
(Tab. 2). For the other three (location of the maximum of precipitation likelihood, 109
location of the maximum of daily mean amount, and width of daily mean amount) 110
the slope of the regression was not significantly different from zero so I used their 111
means. The model structure allows the mid-season date to be changed without 112
affecting MAP by adjusting the location parameters (Fig. 1). Adjusting the width 113
parameters changes the average length of the rainy season. Increasing the 114
amplitude parameters increases rain frequency and intensity. 115
Manipulation of daily rain pattern 116
In order to study the shift in daily rain amount distribution to more rainstorms, the 117
amplitude of DMR can be adjusted by up to ±30% (∆DMR) in ReGen. For 118
comparison, the RegCM3 global circulation model with a resolution of 0.5° × 0.5° 119
projects for the pessimistic A2 climate change scenario an average increase in 120
DMR of 3% for Israel North of the Negev desert while it projects an average 121
increase in DMR of 29% (derived from Giorgi et al., 2004a, b) for the optimistic B2 122
scenario. In order to keep MAP the same, a change of DMR is compensated for by 123
decreasing the amplitude of daily mean rain probability (p) using the empirically 124

7
derived equation p* = p · [1–C+1.33· C2–(0.61+1.57· p) · C3), where C is the relative 125
change in DMR (∆DMR/100). Thus, increasing DMR reduces the frequency of days 126
with light rain and lengthens the intervals between them. On the other hand, it 127
increases the frequency of rainstorms and shortens the intervals between them. 128
Statistical analyses 129
I compared MAP, mean number of days with ≥5, ≥15, and ≥25 mm precipitation, 130
and intervals between days ≥5, ≥15, and ≥25 mm precipitation between simulated 131
(30 yr) and observed time series using 95% confidence intervals (CI). These 132
comparisons comprised the seven stations used to calculate the regression 133
parameters and ten other stations (Tab. 1). Further, I used 95%-CIs to compare the 134
effect of increasing DMR by –20, –10, 0, +10, and +20% on the mean number of 135
days with ≥5, ≥15, and ≥25 mm precipitation and mean intervals between them at 136
five points (100, 300, 450, 600, and 800 mm) on the MAP gradient. Finally, I used 137
a multiple regression to compare the effect of change of DMR on the coefficient of 138
variation (CV) of annual rain amount along the MAP gradient. 139
Results and Discussion 140
The rain pattern of a single 30-yr stochastic time series, with only the mean 141
annual precipitation of each climate station as input to ReGen, was compared to 142
historic climate records. MAP and mean number of days with daily rain amounts 143
≥5, ≥15, and ≥25 mm did not differ significantly between simulated and observed 144
time series for most stations (Figs. 2, 3). In the same way, intervals between days 145

8
with rain amounts ≥5, ≥15, and ≥25 mm were similar in simulated and observed 146
time series in most cases (data not shown). Although ReGen was parameterized 147
with data from meteorological stations in the interior of Israel, its time series also 148
reproduced the characteristics of historic data from stations outside of this area 149
well (Figs. 2, 3). ReGen is also capable of reproducing the "median dates of 150
accumulated percentage of the annual rainfall" and thus the "median rainy season 151
length" using the approach of Paz and Kutiel (2003), albeit with a shift of the 152
median dates by up to one week which is imposed by the fixed location 153
parameters. 154
The CV of simulated MAP (19%) was significantly smaller than that of observed 155
time series (33%). The lower CV in simulations was due to a more normal 156
distribution of annual precipitation values than observed in nature (Ben-Gai et al., 157
1998). Thus, the time series do not include years with extreme annual precipitation 158
amounts. This can be easily amended in long-term simulations by specifying an 159
annually variable MAP input to ReGen according to observed or projected 160
distributions of annual rain amounts (Ben-Gai et al., 1998). 161
Increasing DMR decreased strongly the average number of days with ≥5 mm of 162
rain, increased markedly the number of days with ≥15 mm, and increased slightly 163
days with ≥ 25 mm of rain (Fig. 4a). Correspondingly, the median interval between 164
days with ≥5 mm rain increased, but the interval between days with ≥15 and ≥25 165
mm of rain decreased (Fig. 4b). Thus, heavy rainfalls contributed more and light 166
rainfall less to annual precipitation than under current conditions (Fig. 5) as 167
intended by the manipulation of the daily rain pattern. This is in line with 168

9
observations of shifts of rain distribution in the Mediterranean (Alpert et al., 2002). 169
Increasing DMR also had an effect on annual rain characteristics. It increased the 170
CV of annual precipitation (AP), independent of MAP, by 10% (CVAP = 29 – 0.018 171
· MAP + 0.1 · ∆DMR; Ra2 = 0.72, F2,22 = 32; the interaction between the two 172
variables was not significant). Thus, the model confirms observations and 173
simulations that the frequency of extreme events within a year is linked to the 174
frequency of extreme years on the decadal time scale (Easterling et al., 2000). 175
The time series produced by ReGen are based on a unimodal distribution of 176
rainy days because the original data were aggregated by months which smoothes 177
the secondary and tertiary peaks of the actual multimodal distribution (Goldreich, 178
1995; Osetinsky and Alpert, 2006). Although the periodicity of the synoptic systems 179
causing the higher-level peaks and their average dates are known (Osetinsky and 180
Alpert, 2006), their relative contribution to the total precipitation volume and relative 181
temporal shift among each other has yet to be determined along the aridity 182
gradient. In addition, the more faithful reproduction of actual rain patterns would 183
reduce the flexibility and generality of the ReGen model. 184
In summary, ReGen can generate daily time series with quasi-realistic 185
characteristics based on a single input variable, MAP. The algorithm can be 186
applied to a large part of Israel without modification. Changes in daily rainfall 187
frequency distribution as projected by global circulation models are incorporated 188
through one additional input variable. Thus, ReGen is a flexible tool for studying the 189
effect of daily rain patterns on the environment in Israel under current and under 190
climate change conditions. 191

10
Acknowledgements 192
I thank P. Alpert, S.O. Krichak, M. Dayan, and I. Osetinsky for processing the 193
RegCM3 data. Precipitation data was obtained from the Israel Meteorological 194
Service and the Royal Netherlands Meteorological Institute (KNMI). P. Suppan and 195
two anonymous reviewers critically commented on early versions of the 196
manuscript. This contribution is part of the GLOWA Jordan River project funded by 197
BMBF, the German Federal Ministry of Education and Research, contract 198
01LW0306(A). The author alone is responsible for the content of this publication. 199
References 200
Alpert, P., Ben-Gai, T., Baharad, A., Benjamini, Y., Yekutielli, D., Colacino, M. 201 2002. The paradoxical increase of Mediterranean extreme daily rainfall in 202 spite of decrease in total values. Geophysical Research Letters 29: 31.1-31.4. 203
Barzilay, E., Enzel, Y., Amit, R. Hassan, M. A., Slaymaker, O., Berkowicz, S. M., 204 eds. 2000. Constructing synthetic time series of rainfall events for a hyperarid 205 environment, southern Arava, Israel. IAHS Publication 261. International 206 Association of Hydrological Sciences. 207
Ben-Gai, T., Bitan, A., Manes, A., Alpert, P., Rubin, S. 1998. Spatial and temporal 208 changes in rainfall frequency distribution patterns in Israel. Theoretical and 209 Applied Climatology 61: 177-190. 210
Easterling, D. R., Meehl, G. A., Parmesan, C., Changnon, S. A., Karl, T. R., 211 Mearns, L. O. 2000. Climate extremes:observations, modelling, and impacts. 212 Science 289: 2068-2074. 213
Gabriel, K. R., Neuman, J. 1962. A Markov chain model for daily rainfall at Tel Aviv. 214 Quarterly Journal of the Royal Meteorological Society 88: 90-95. 215
11
Giorgi, F., Bi, X., Pal, J. 2004a. Mean, interannual variability and trends in a 216 regional climate change experiment over Europe. II: climate change scenarios 217 (2071-2100). Climate Dynamics 23: 839-858. 218
Giorgi, F., Bi, X., Pal, J. S. 2004b. Mean, interannual variability and trends in a 219 regional climate change experiment over Europe. I. Present-day climate 220 (1961-1990). Climate Dynamics 22: 733-756. 221
Goldreich, Y. 1995. Temporal variations of rainfall in Israel. Climate Research 5: 222 167-179. 223
Hoff, H., Küchmeister, H., Tielbörger, K. 2006. The GLOWA Jordan River Project – 224 Integrated Research for Sustainable Water Management. Beck, M. B., 225 Speers, A. eds. 2nd IWA Leading-Edge Conference on Sustainability in 226 Water-Limited Environments, Sydney, Australia, November 2004. IWA Water 227 and Environment Management Series Vol. 10. London: IWA Publishing; pp. 228 73-80. 229
Loik, M. E., Breshears, D. D., Lauenroth, W. K., Belnap, J. 2004. A multi-scale 230 perspective of water pulses in dryland ecosystems: climatology and 231 ecohydrology of the western USA. Oecologia 141: 269-281. 232
Milliman, J. D., Jeftić, L., Sestini, G. 1992. The Mediterranean Sea and climate 233 change — An overview. Jeftic, L., Milliman, J. D., Sestini, G. eds. Climatic 234 change and the Mediterranean. Vol. 1. London: E. Arnold; pp. 1-14. 235
Osetinsky, I., Alpert, P. 2006. Calendaricities and multimodality in the Eastern 236 Mediterranean cyclonic activity. Natural Hazards and Earth System Sciences 237 6: 587-596. 238
Paz, S., Kutiel, H. 2003. Rainfall regime uncertainty (RRU) in an Eastern 239 Mediterranean region — A methodological approach. Israel Journal of Earth 240 Sciences 52: 47-63. 241
Pe'er, G., Safriel, U. N. 2000. Climate change: Israel national report under the 242 United Nations Framework Convention on Climate Change: Impact, 243 vulnerability and adaptation. http://www.bgu.ac.il/BIDR/rio/Global91-244 editedfinal.html (viewed 2004-11-04). 245

12
Srikanthan, R., McMahon, T. A. 2001. Stochastic generation of annual, monthly 246 and daily climate data: A review. Hydrology and Earth System Sciences 5: 247 653-670. 248
Watson, R. T., Zimyowera, M. C., Moss, R. H., Dokken, D. J., eds. 1997. The 249 regional impacts of climate change: an assessment of vulnerability. Summary 250 for policymakers. Cambridge: Cambridge University Press. 251
Weltzin, J. F., Loik, M. E., Schwinning, S., Williams, D. G., Fay, P. A., Haddad, B. 252 M. 2003. Assessing the response of terrestrial ecosystems to potential 253 changes in precipitation. Bioscience 53: 941-952. 254
Wilks, D. S. 1992. Adapting stochastic weather generation algorithms for climate 255 change studies. Climatic Change 22: 67-84. 256
257
258

13
Appendix 258 Script for use with the statistical program R (R Development Core Team. 2005. 259
R: A language and environment for statistical computing. R Foundation for 260 Statistical Computing, Vienna, Austria. ISBN 3-900051-07-0, URL http://www.R-261 project.org.). Code for c++ can be obtained from the author. 262
263 # Gauss peak curve function for calculating daily precipitation 264 # probability and mean rain volume 265 # numbering of days begins with August 1 = 1 266 gauss <- function (day, amplitude, location, width, shape=2) 267 { day = (day + 182 - location) %% 365 + location - 182 268 G = amplitude*exp(-(day-location)^shape/(2*width^2)) 269 return(G) 270 } 271 272 # Calculation of parameters based on mean annual precipitation 273 # and change of daily mean rain (relCh) 274 rmp<-function (MAP, relCh=0) 275 { H = 0.13 + 0.00041 * MAP # rain occurance 276 H = H*(1-relCh +1.33*relCh^2-(0.61+1.57*H)*relCh^3) 277 X = 177 278 W = 52 + 0.007 * MAP 279 h = -14 + 4 * log(MAP) # rain volume 280 h = h * (1+relCh) 281 x = 170 282 w = 10488 283 return(data.frame(RH=H,RX=X,RW=W,Vh=h,Vx=x,Vw=w) 284 } 285 286 ############# Production of stochastic time series ############### 287 # Parameters can be entered directly or as 'scenario' calculated # 288 # by function 'rmp' # 289 290 ReGen<-function (years, amplitudeR=0, locationR=0, widthR=0, amplitudeV=0, 291 locationV=0, widthV=0, scenario=0) 292 { DM = matrix(rep(1:365, years),nrow=years, byrow=T) 293 if(sum(scenario)>0) 294 { amplitudeR=as.numeric(scenario[1]) 295 locationR=as.numeric(scenario[2]) 296 widthR=as.numeric(scenario[3]) 297 amplitudeV=as.numeric(scenario[4]) 298 locationV=as.numeric(scenario[5]) 299 widthV=as.numeric(scenario[6]) 300 } 301 302 # probability of a rainy day 303

14
G<-gauss(DM, amplitudeR, locationR, widthR) 304 RT<-ifelse(runif(DM)<G & G>0.05, 1, 0) 305 # daily mean rain volume: 306 RV<- gauss(DM, amplitudeV, locationV, widthV, 4) 307 # actual rain volume: 308 R<- RT * rexp(DM, 1/RV) 309 return(R) 310 } 311
312

15
Tables 312 313
Table 1. Details of climate stations from which data were used for the derivation of 314
model parameters and for validation (Figs. 2, 3). 315
Station MAP (mm)
Longitude (° E)
Latitude (° N)
Years
parameterization Beer Sheva 196 34.78 31.23 1957–2000 Bet Guvrin 395 34.90 31.62 1950–2000 Bet Meir 626 35.03 31.80 1977–2000 Elon 813 35.22 33.05 1974–2000 HarKnaan 717 35.50 32.97 1949–1998 Rosh Zurim 567 34.79 30.87 1983–2000 Sede Boqer 90 35.45 33.07 1952–2000 validation Dorot 371 34.63 31.50 1950–2000 Haifa Bay 561 35.03 32.80 1987–1999 Jerusalem 591 35.22 31.77 1967–1999 Kebutzat Kinneret 400 35.61 33.17 1949–2001 Kefar Blum 506 35.57 33.25 1949–2001 Kefar Giladi 767 34.72 31.27 1949–2001 Nahal Hatzerim 170 35.12 31.80 1967–1999 Qiryat Anavim 692 34.82 32.12 1950–2000 Qiryat Shaul 549 35.13 31.66 1949–2000 Yiron 739 35.57 32.72 1949-2001 316
317
16
Table 2. Predictors for parameters used in stochastic time series of daily 317
precipitation (MAP: mean annual precipitation; day 1 = August 1). 318
parameter equation
likelihood
amplitude 0.13 + 0.00041 MAP 0.98
location of maximum (day) 177
width (days) 52 + 0.007 MAP 0.82
volume
amplitude (mm) –14 + 4 ln(MAP) 0.85
location of maximum (day) 170
width (days) 10488
319
320

17
Figures 320
Fig. 1. Gaussian peak curves for the daily probability of rainy days (a) and the 321
daily mean rain amount (b) of a site with 450 mm MAP. b = [8 · (shape – 1) / 322
shape]–0.5 323
Fig. 2. Deviation of simulated from observed mean annual precipitation (∆MAP, 324
dashes with vertical bars indicating the mean ± 95%-confidence interval). Thin, 325
continuous lines connect the 95%-confidence intervals of observed MAP. 326
Fig. 3. Comparison of rain pattern in exemplary 30-yr time-series (outline 327
symbols) generated by the ReGen model (Tab. 2) with that of historic rain data 328
(filled symbols; Tab. 1). Error bars indicate 95%-confidence intervals. Thresholds: 329
squares: 5 mm, diamonds: 15 mm, circles: 25 mm. 330
Fig. 4. Effect of changing the amplitude of daily mean precipitation on rain 331
pattern in single 150-yr stochastic time series. a) mean annual number of days with 332
total rain amount ≥5 mm (squares), ≥15 mm (diamonds), and ≥25 mm (circles) and 333
20% higher amplitude (dotted), 20% lower amplitude (dashed), and unchanged 334
(continuous line). b) mean of annual median intervals between days with ≥5, ≥15, 335
and ≥25 rain amount on a logarithmic scale (symbols as in left panel). Error bars 336
indicate 95%-confidence intervals (CI). CIs in the left panel are ≤ symbol size. 337
Fig. 5. Exemplary effect of changing daily mean rain amount by +20% (dashed 338
line), 0% (continuous line), or –20% (dotted line) on the relative contribution of daily 339
amount categories (averaged across 30 years) to annual precipitation for 450 mm 340
MAP. 341

18
342 Fig. 1. Gaussian peak curves for the daily probability of rainy days (a) and the daily mean rain 343
amount (b) of a site with 450 mm MAP. b = [8 · (shape – 1) / shape]0.5 344
345 Fig. 2. Deviation of simulated (30 yr) from observed mean annual precipitation (∆MAP, dashes with 346
vertical bars indicating the mean ± 95%-confidence interval) for stations in Tab. 1. Thin, continuous 347
lines connect the 95%-confidence intervals of observed MAP. 348
349

19
350 Fig. 3. Comparison of rain pattern in exemplary 30-yr time-series (outline symbols) generated by the 351
ReGen model (Tab. 2) with that of historic rain data (filled symbols; Tab. 1). Error bars indicate 352
95%-confidence intervals. Thresholds: squares: 5 mm, diamonds: 15 mm, circles: 25 mm. 353
354
355 Fig. 4. Effect of changing the amplitude of daily mean precipitation on rain pattern in single 150-yr 356
stochastic time series. a) mean annual number of days with total rain amount ≥5 mm (squares), ≥15 357
mm (diamonds), and ≥25 mm (circles) and 20% higher amplitude (dotted), 20% lower amplitude 358
(dashed), and unchanged amplitude (continuous line). b) mean of annual median intervals between 359
days with ≥5, ≥15, and ≥25 rain amount on a logarithmic scale (symbols as in left panel). Error bars 360
indicate 95%-confidence intervals (CI). CIs in the left panel are ≤ symbol size. 361
362

20
363 Fig. 5. Exemplary effect of changing daily mean rain amount by +20% (dashed line), 0% 364
(continuous line), or –20% (dotted line) on the relative contribution of daily amount categories 365
(averaged across 30 years) to annual precipitation for 450 mm MAP. 366