stock assessment and fishery evaluation … 1996/225(usa).pdfsummary by the plan team for the...
TRANSCRIPT
STOCK ASSESSMENT AND FISHERY EVALUATION FOR THE GROUNDFISH RESOURCES
OF THE GULF OF ALASKA AS PROJECTED 1997
Compiled by
The Plan Team for the Groundfish Fisheries of the Gulf of Alaska
Submitted to the
NORTH PACIFIC ANADROMOUS FISH COMMISSION
by the
United States of America
September 1996
THIS PAPER MAY BE CITED IN THE FOLLOvVING MANNER:
NPFMC 1997. Stock Assessment and Fishery Evaluation Report for the Groundfish Resources of the Gulf of Alaska As Projected for 1997. 31p. (Document submitted to the Annual Meeting of the NP AFC, Seattle, October, 1996.) North Pacific Fishery Management Council, 605 W 4th Avenue, Suite 306, Anchorage, AK 99501.

Stock Assessment and Fishery Evaluation Report for the Groundfish Resources of the Gulf of Alaska
As Projected for 1997
ABSTRACT
This is a preliminary assessment report of the status of individual groundfish stocks managed by the United States in the Gulf of Alaska for 1997. The historical catch statistics, estimates of maximum sustainable yields, acceptable biological catches (ABCs), and total allowable catches (TACs) are reported for each stock. The abundance of Pacific cod and arrowtooth flounder is above target stock size. The abundance of pollock, Pacific ocean perch and sablefish is below target stock size. The relative abundance of deep-water flatfish, shallow water flatfish, flathead sole, demersal shelf rockfish, northern rockfish, pelagic shelf rockfish, other slope rockfish, and thornyheads and Atka mackerel not well known. The sum of the preliminary 1997 ABCs for the groundfish complex is 550,000 t, up from 475,000 t in 1966.

Stock Assessment and Fishery Evaluation Report for the Groundfish Resources
of the Gulf of Alaska as Projected for 1997
Table of Contents
SUl\1l\1ARY ..................................................................... 1
Introduction ............................................................... 1 Background Information ..................................................... 3 Overview of "Stock Assessment Section" . . . . . . . . . . . . . . . . . . . . . . . . . . . . . . . . . . . . . . . . 6 Ecosystetn Considerations . . . . . . . . . . . . . . . . . . . . . . . . . . . . . . . . . . . . . . . . . . . . . . . . . . . . 26 Overview of Appendices ..................................................... 34
STOCK ASSESSMENT SECTION Page
l. 2. 3. 4. 5. 6. 7. 8. 9. 10.
Walleye pollock .................................................... . Pacific cod ........................................................ . Flatfish ........................................................... . Arrowtooth ........................................................ . Sable:fish .......................................................... . Slope rockfish ...................................................... . Pelagic shelf rockfish ................... . . . . . . . . . . . . . . ............... . Demersal shelf rockfish ............................... ; .............. . Thornyhead rockfish ................................................. . Atka mackerel ...................................................... .
37 93
127 151 177 201 203 221 235 237
APPENDIX A Pacific Halibut Stock Assessment . . . . . .. .. . .. . .. . . .. . . . . . . .. . . .. . . . . . . . . 265
APPENDIX B Halibut Prohibited Species Catch Limits . . . . . . . . . . . . . . . . . . . . . . . . . . . . . . . . . . 267
APPENDIX C Pacific Halibut Discard Mortality Rates (not updated) ....................... 281
APPENDIX D Echo Integration-Trawl Survey Results for Pollock in the Gulf of Alaska during 1996 .... . . . . . . . . . . . . . . . . . . . . . . . . . . . . . . . . . . . 283
APPENDIX E Definitions of Common Acronyms ...................................... 295
APPENDIX F Schedule of Federal Register Actions .................................... 295
APPENDIX G 1996 Federal Ground:fish Closures off Alaska ............................. 293
FISHERY EVALUATION SECTION .................................. Bound Separately
SUMMARY
by The Plan Team for the Groundfish Fisheries of the Gulf of Alaska
INTRODUCTION
The Guidelines/or Fishery Management Plans (602 Guidelines) published by the National Marine Rsheries Service (N1vfFS) require that a stock assessment and fishery evaluation (SAFE) report be prepared and reviewed annually for each fishery management plan (FMP). The SAFE reports are intended to summarize the best available scientific information concerning the past, present, and possible future condition of the stocks and fisheries under federal management.
The SAFE reports for the groundfish fisheries managed by the North Pacific Rshery Management Council (Council) are compiled by the respective Plan Teams from chapters contributed by scientists at NMFS' Alaska Rsheries Science Center (AFSC) and the Alaska Department offish and Game. These SAFE reports include separate stock assessment and fishery evaluation sections. The stock assessment section includes recommended acceptable biological catch (ABC) levels for each stock and stock complex managed under the FMP. The ABC recommendations, together with social and economic factors, are considered by the Council in determining total allowable catches (TACs) and other management strategies for the fisheries.
The Plan Team for the Gulf of Alaska Groundfish Rshery Management Plan met in Seattle on September 26 -30, 1996 to review the status of stocks of sixteen species or species groups that are managed under the FMP. The Plan Team review was based on presentations by Alaska Department of Fish and Game, and NMFS Alaska Fisheries Science Center scientists, results from the NMFS 1993 Gulf of Alaska trawl surveys, and the 1996 Shelikof Strait hydroacotl:>'tic survey. Members of the Plan Team who compiled the SAFE report were Sandra Lowe, (chair), Jane DiCosimo (plan coordinator), Kaja Brlx, Lew Haldorsen, Jeff Fujioka, Jim Hastie, Jim Ianelli, Jon Heifetz, Farron Wallace, Victoria O'Connell, Bill Bechtol, Vivian Mendenhall, and John Sease.
The FMPs for the groundfish fisheries managed by the Council require that drafts of the SAFE reports be produced each year in time for the September and December Council meetings. Since critical stock assessment data often do not become available until after the September draft has been completed, many chapters undergo substantial revision in preparation for the December Council meeting.
The FMP recognizes single species and species complex management strategies. Single species management is recommended for stocks that are easily targeted by the harvesting sector, and for which minimal mixing of other species occurs in the targeted catch. In the Gulf of Alaska, Pacific cod, pollock, sablefish, Pacific ocean perch, thornyhead rockfish, flathead sole, rex sole. arrowtooth flounder and Atka mackerel have been managed as single species. Beginning this year. a separate stock assessment chapter for arrowtooth flounder has been preparedOther groundfish species that are usually caught in groups have been managed as complex assemblages. For example. shomaker and rougheye rockfish, other slope rockfish, pelagic shelf rockfish, demersal shelf rockfish, northern rockfish, deepwater flatfish, shallow water flatfish, and other groundfish have been managed as complexes. The FMP, however, authorizes splitting species, or groups of species, from the complexes for purposes of promoting the goals and objectives of the FMP. Atka mackerel was split out from "other species" beginning in 1994. To prevent localized depletion of nearshore pelagic shelf rockfish in the central Gulf. allow controlled development of the nearshore jig fishery in the eastern and western Gulf, and prevent preemption of the dusky rockfish fishery by the neashore jig fishery, the Plan Team is recommending a plan amendment to separate the Pelagic Shelf Rockfish assemblage into a nearshore component (black and blue rockfish) and an offshore component (dusky, widow, and yellowtail rockfish).

2
Fishermen do not always catch species in a complex in proportion to the species composition. i.e., certain segments of the complex may be more easily harvested than others, or they may be more valuable. Consequently, the implicit risk in species complex management is that one or more oi'the species in the complex may be overharvested or underharvested. Recognition of this risk is important Alternative management strategies can be imposed to limit the risk including removing a species from a complex and managing as a single species, or reducing the quota of the complex to protect the more vulnerable species. The Plan Team gave close scrutiny to the species composition of the catch from the species complex management units and made recommendations for adjustments as required.
Except where the State of Alaska manages separate groundfish harvests quotas specified in 5 Alaska Administrative Code (AAC) 28.160, all groundfish catches in waters of the State of Alaska, including internal waters, are managed against T AC specifications. The exceptions pertain to guideline harvest ranges for sablefish and demersal shelf rockfish in the inside subdistricts of the southeast subdistrict as defined at 5 AAC 28.105 Description of Districts, Subdistricts, and Sections.
NEW lNFORMATION
Since the 1996 Stock Assessment and Fishery Evaluation Report (SAFE) was issued (NPFMC 1995), the following new information has become available:
1. Pollock: a) the 1996 Shelikof Strait hydroacoustic biomass estimate; b) length/frequency data from the 1996 hydro acoustic survey; c) age composition data from the 1995 fishery; d) updated estimates of discard and catch for 1995 and 1996, and e) results of a sensitivity analysis exploring several assumptions about the emphasis applied to survey biomass estimates and the catchability of the bottom trawl survey.
2. Sablefish:-a) updated catch data for 1995 and 1996; b) results from an age-structured model.
3. Pacific coo: a) updated length frequency data; b) new model configuration identical to EBS Pacific cod assessment model.
4. Flatfish: a) updated catch information; b) F ~ reference fishing mortality rates.
5. Arrowtooth: full assessment based on the stock synthesis modeL
6. Slope rockfish: updated catch information.
7. pela~c shelf rock:fi~h: a) updated catch information; b) expanded discussion on the black rockfish fishery; c) possible computations of ABC and OFL for other species, excluding dusky rockfish.
8. ThQroYheads: a) updated catch information by target fisheries; b) 1995 domestic longline survey data; c) length compositions from the.1995 and 1996 fisheries.
9. Demersal shelf rockfish: a) updated catch information; b) 1995 fishery age information.
10. Atka mackerel: updated catch information.
11. Groundfish. ~enerallv: a) updated harvest and discard data from the NMFS Observer Program Office for 1995 and 1996 through August 1996.

3
BACKGROUND INFORMATION
Management Areas and Species
The Gulf of Alaska (GOA) management area lies within the 2oo-mile U.S. Exclusive Economic Zone (EEZ) of the United States (Figure 1). Four categories of finfishes and invertebrates have been designated for management purposes. They are prohibited species, target species, other species and non-specified species. Fish species or complexes included in each category are listed below.
Target Species Other Species Prohibited Species --~
Pollock Octopus Pacific halibut Pacific cod Squid Pacific hening Flounders Sculpins Pacific salmon Rockfishes Sharks Steelhead trout Sablefish Skates King crab Atka mackerel Eulachon Tanner crab
Smelts Capelin
All other species of fish and invertebrates taken incidentally that are not managed by other FMPs and are associated with groundfish fisheries are designated as "non-specified species" and catch records need not be kept. A species or species group from within the target species category may be split out and assigned an appropriate harvest level. Similarly, species in the target species category may be combined and a single harvest level assigned to the new aggregate species group. The harvest level for demersal shelf rockfish in the Eastern Regulatory Area is-specified by the Council each year. However, management of this fishery is deferred to the State of Alaska with Council oversight.
This SAFE report describes stock status of target species only.
Biological Reference Points
A number of biological reference points are used in this SAFE. Among these are the fishing mortality rate (F) and stock biomass level (B) associated with MSY (FMSY and BMSy respectively). Also used are the fishing mortality rates which reduce the level of spawning biomass per recruit to some percentage P of the pristine level (F~, and the fishing mortality rate which reduces the slope of the yield per recruit curve (plotted against F) to 10% of the slope at the origin (FoJ. The fishing mortality rate used to compute ABC is designated F ABC' and the fishing mortality rate used to compute the overfishing level (OFL) is designated FoR..'
Definition of Acceptable Biological Catch and the Overfishing Level
Amendment 44 to the GOA Groundfish FMP, approved by the Council in June of this year and currently awaiting fmal secretarial approval by the Secretarial of Commerce, defines ABC and OFL for the GOA groundfish fisheries. The new definitions are shown below, where the fishing mortality rate is denoted F, stock biomass (or spawning stock biomass, as appropriate) is denoted B, and the F and B levels corresponding to MSY are denoted FMSY and BMSy respectively. The revised definition replaces the Plan Team's previous policy statements for defining overfishing and creating a buffer between ABC and OFL.
4
,-
Acceptable Biological Catch is a preliminary description of the acceptable harvest (or range of harvests) for a given stock or stock complex. Its derivationfocuses on the status and dynamics of the stock. environmental conditions. other ecological factors. and prevailing technological characteristics of the fishery. The fishing mortality rate used to calculate ABC is capped as described under" Overfishing" below.
Overfishing is defined as any amount of fishing in excess of a prescribed maximum allowable rate. This maximum allowable rate is prescribed through a set of six tiers which are listed below in descending order of preference.. corresponding to descending order of information availability. The Council's Scientific and Statistical Committee (SSC) will have final authority for determining whether a given item of information is "reliable" for the purpose of this definition. and may use either objective or subjective criteria in making such determinations. For tier (1), a "pdf' refers to a probability density function. For tiers (1-3), the coefficient a is set at a default value of 0.05, with the understanding that the SSC may establish a different value for a specific stock or stock complex as merited by the best available scientific information. For tiers (2-4), a designation of the form "Fx% It refers to the F associated with an equilibrium level of spawning per recruit (SPR) equal to X% of the equilibrium level of spawning per recruit in the absence of any fishing. If reliable information sufficient to characterize the entire maturity schedule of a species is not available, the SSC may choose to view SPR calculations based on a knife-edge maturity assumption as reliable. For tier (3), the term B4O% refers to the long-term average biomass that would be expected under average recruitment and F=F 40%'

5
1) Information available: Reliable point estimates of B and Busy and reliable pdf ofF MSY' 1a) Stock status: BIBMSY > 1
F on = J..I.A , the arithmetic mean of the pdf
F ABC $ J..I.H' the harmonic mean of the pdf 1b) Stockstatus: a <BIBMSY $ 1
FoF!. = J..I.A X (BIBMSY - a)/(l - a) F ABC $ J..I.H x (BIB MSY - a)/(l - a)
1 c) Stock status: BIBMSY $ a FOFL=O FABc=O
2) Information available: Reliable point estimates of B, BMSY ,F MSY' FJO%, andF40% •
2a) Stock status: BIBMSY > 1 FOFL =FMSYx (FJO%IF4O'h) FABC $ FAISY
2b) Stock status: a <BIBMSY $ 1 Fon = F MSY x (FJO'hIF40%) x (BIB MSY - a)/(l - a) FABC $ F MSY x (BIB MSY - a)/( 1 - a)
2c) Stock status: BIBMSY $ a FOFL =0 FABc=O
J) Information available: Reliable point estimates of B, B40%, F30%, andF4o%·
Ja) St~ck status: BIB40% > 1
Fon =FJO'h FABC $ F4O'h
Jb) Stockstatus: a<BIB40'h:;; 1
F OF!. = FJO'h x (BIB 4O'h - a)/( 1 - a) F ABC::; F4O'h X (BIB40'h - a)/(l - a)
Jc) Stock status: BIB40% $ a Fon=O FABc=O
4) Information available: Reliable point estimates of B, FJO'h. and F4O'h . Fon =FJO'h FABC :;; F4O'h
5) Information available: Reliable point estimates of B and natural mortality rate M. Fon=M FABC ,; 0.75 x M
6) Information available: Reliable catch history from 1978 through 1995. OFL = the average catch from 1978 through 1995, unless an alternative value is established
by the SSC on the basis of the best available scientific information ABC :,; 0.75 x OFL

6
OVERVIEW OF STOCK ASSESSMENTS
The current status of individual groundfish stocks managed under the FMP are summarized in this section. The abundance of Pacific cod and arrowtooth flounder is above target stock size. The abundance of pollock, Pacific ocean perch and sablefish is below target stock size. The relative abundance of deep-water flatfish, shallow-water flatfish, flathead sole, demersal shelf rockfish, northern rockfish, pelagic shelf rockfish, other slope rockfish, and thomyheads and Atka mackerel is unknown.
Tables 1 and 2 provide a summary of the current status of the groundfish stocks, including estimated maximum sustainable yields, catch statistics, ABCs, and TACs for 1996, and recommendations for ABCs for 1997. Fishing mortality rates used to set these specifications are listed in Table 3. ABCs and TACs are specified for each of the Gulf of Alaska regulatory areas illustrated in Figure 1. Table 4 provides historical groundfish catches in the GOA, 1956-1996.
The sum of the preliminary 1997 ABCs for target species is 549,960 rnt, which is within the FMP-approved optimum yield (Oy) of 116,000-800,000 mt for the Gulf of Alaska. The Team notes that because of halibut bycatch mortality considerations in the high-biomass flatfish fisheries, an overall OY for 1996 will be considerably under this upper limit For perspective, in 1996 the sum of the TACs was 260,207 mt, and the sum of the ABCs was 475,170 mt
POLLOCK
1995 1996 1997
~ 65,300 54,810 78.110
1 ABC for Western/Central and Eastern areas 2 1996 Westem/Centt:ll catch through August to, 1996
CATCH 69,900 24,5902
Relative to the 1996 SAFE. new sources of information include: a) the 1996 Shelikof Strait hydroacoustic biomass estimate; b) length-frequency data from the 1996 hydroacoustic survey; c) age composition data from the 1995 fisheries; d) updated estimates of discard and catch for 1995 and 1996; and e) results of a sensitivity analysis exploring several assumptions about the emphasis applied to survey biomass estimates and the catchability of the bottom trawl survey.
The 1996 hydro acoustic survey used the same equipment as in 1994 and 1995, but with improved detectability of pollock in low density situations. and improved measurements from the near-bottom region. The 1996 ShelikofStrait biomass estimate based on the new system is 747,500 mt (similar to the estimate of 725,200 mt from the 1995 survey). These values were adjusted in the stock assessment to be comparable to estimates from the old system in order to provide a time series of a relative abundance index.
The Plan Team noted that the model has captured the trend in observed Shelikof Strait hydroacoustic biomass. estimates from 1988 to 1994. However, from 1994 to 1995 the observed biomass increased in Shelikof Strait while the model showed a decline in predicted biomass and estimated a lower than observed abundance level. In 1996, the model followed the observed trend. but again estimated a lower than observed abundance. A reason for this discrepancy may be that the stock synthesis model estimates a decreasing selectivity of the hydroacoustic

7
survey for older fish. This is consistent with the tendency for older fish to be near the bottom during the spawning period. The hydroacoustic survey cannot discriminate between fish and the bottom in the last half meter above the bottom. Hydroacoustic surveys during the spawning season also found large fish outside of Shelikof Strait SlJ&:,cresting that some of the older fish may not have been available for sampling in the Strait The model would underestimate the hydro acoustic biomass if: a) a larger fraction of the older pollock were off bottom in 1995 and 1996; or b) the fraction of the older fish spawning in Shelikof Strait was larger than expected in 1995 and 1996. However. because the hydro acoustic estimate of the biomass in Shelikof Strait has an associated variance. some discrepancy between the assessment model and the survey estimate is expected. The sensitivity analysis explored the impact of constraining the hydro acoustic survey selectivity to be asymptotic. The findings of a reduced fit to all data components except the hydroacoustic length compositions suggested that the hydroacoustic survey selectivity should not be constrained to be asymptotic.
Length frequency data from the 1990 to 1996 hydroacoustic surveys showed the progression of the strong 1988 year class through the population. In the 1995 and 1996 surveys. evidence of a strong 1994 year class was apparent In 1996.82.2% of the population numbers were 16-25 cm (age 2.1994 year class). Age 1 «16 cm) pollock of the 1995 year class represented 1.3 % of the population numbers. .
The biomass estimate for the Western/Central area from the 1993 bottom trawl survey was 760.800 mt, similar in magnitude to previous survey biomass levels. (The 1996 biomass estimate has not been incorporated). The age compositions from the 1993 bottom trawl survey and the 1995 fishery revealed strong 1988 and 1989 year classes. Tae 1989 year class in the Bering Sea has been shown to be strong. The presence of the strong 1989 year class found in the Shumagin, Cbirikof and Kodiak areas suggests that widespread mixing of pollock stocks may occur between the Bering Sea and the Gulf of Alaska. Alternatively. 1989 oceanic conditions may have favored recruitment in the Western Gulf of Alaska more than the Central area.
The Team evaluated and concurred with the stock synthesis model configuration chosen by the assessment scientists based on the sensitivity analysis of several model assumptions. The current model in the assessment is similar to last year, except for a reduction in the number of length categories used, and inclusion of the 1984 biomass estimate. These changes had little impact on the relative fit of the model to the various data sources.
Estimates of various :fishing mortality rates based on biological reference points were determined from a dynamic pool model and an age-structured model. The estimated FO•I , F3Q<J" Fm; and F4O'J, full-selection fishing mortality rates were 0.64,0.48.0.41. and 0.34, respectively. The 1997 age 3+ biomass was estimated at 862,000 mt from the current stock synthesis analysis. Additionally, the B4O% female spawner biomass was estimated at 525,900 mt, higher than the 1997 female spawner biomass projected to be 451,000 mt.
The assessment included an exploration of the long term productive potential of the pollock stock with a stochastic age structured simulation and different recruitment scenarios. The risk associated with a given fishing strategy was measured by monitoring the frequency that the spawner biomass fell below an estimated threshold level in the simulation. The tradeoffs between increased yield and the risk of falling below the threshold were evaluated and the :fishing moitality rate selected from this simulation was 0.32 (full selection value). The fishing mortality rate associated with this method (which was 0.30 in last year's assessment) was used to estimate the 1996 ABC. Under the new NPFMC ABC/OFL guidelines, the F ABC for pollock cannot exceed the F 4O'J, fishing monality rate adjusted by the ratio of current biomass to B4O%. The F ABC (F ~%adjus,.J fishing monality rate is 0.29 and is associated with a yield of 74, 100 mt for the Western/Central Gulf and is the recommended 1997 W/C Gulf ABC.
The Plan Team recommended that the ABC be apportioned according to the biomass distribution from the 1993 bottom trawl survey: 49.0% in the Shuma.::,cin area (36,310 mt), 24.7% in the Chirikof area (18,300 mt), and

8
263% in the Kodiak area (19.490 mt). The Team noted that relative to the 1990 distribution in which most of the biomass was found in the Kodiak area, the current distribution has increased in Shumagin. possibly due to the presence of Bering Sea fish. However, tmtil the degree and re~arity of mixing can be determined. the Te3Dl felt it most appropriate to apportion ABC according to the most recent distribution of survey biomass. This distribution will be updated with 1996 trawl survey results.
The overfishing mortality rate (0.41) is the F30$ rate adjusted by the ratio of current biomass to B4O$' and corresponds to a harvest of 102,200 mt for the Western and Central Gulf of Alaska. Therefore, pollock are not considered overfished at the ABC level.
The Team has no new information to set an ABC for the Eastern Gulf. Lack of adequate age composition data has precluded any age-structured analysis similar to that conducted for the W/C areas. However, analysis of Eastern Gulf length frequency data show that recruitment patterns appear similar to that observed in the W /C Gulf. Thus, the Team agreed that it would be appropriate to apply the ratio ofW/C ABC to 1993 W/C survey biomass to the Eastern Gulf 1993 biomass estimate. The recommended Eastern Gulf ABC is 4,010 mt. Similarly calculated, the overfishing level for the Eastern Gulf is 5,530 mt.
The Plan Team expressed interest in further exploration and incorporation of results from the predation model (presented as an appendix to the 1995 assessment). in light of initial indications of a higher natural mortality. particularly on younger fish. The Team concurred with the authors on the preliminary nature of these types of simulations and the need. for at least one additional year of data. The Plan Team has also requested for the November Plan Team meeting. that the authors provide an alternative estimate of B 40$ female spawner biomass using the median value of the upper quartile of recruitment values to represent the strong 1994 year class. The Plan Team was concerned with the impact of using the estimated level of the 1994 year class in the average recruitment to estimate B4O$'
PACIFIC COD
Y.w 1995 1996 1997
.ABC 69,200 65,000 52,000
~ 68,073
66,8752
1 Biomass values for 1995 and 1996 are from previous years' assessments 2 Through August 10, 1996.
The main issues addressed in the latest Pacific cod assessment include an evaluation of survey catchability and measures to make the model used on the Eastern Bering Sea (BBS) stock nearly identical to that used in the Gulf. This resulted in adding some simplifications to the Bering Sea model and some complexity to the Gulf model. The authors anticipate that the aSsessment results will be influenced by the addition of data from the 1996 Gulf triennial survey assessment (1996 data may be ready for analysis before the November Team meetings).
The primary differences between EBS and Gulf model estimates were in estimates of natural mortality (with EBS being slightly more than half of the Gulf estimate) and in survey selectivity. The Team recogllized that the use of different survey gear in these areas may explain the differences in estimated survey selectivity. However, the difference in natural mortality rate estimates raised some concern. In particular, the Team questioned whether the estimated difference is due to distinctive stock characteristics or other causes such as migration or estimation difficulties. The Team recognized that better data would be required to address these questions.

9
For recommnding an ABC, there was consensus that the Team was uncomfortable with the maximum value allowed under the Council's guidelines (i.e., F 4()<{, rate applied to the biomass estimate). This value (95,400 t) represents a substantial increase over recent catches in the face of continuing stock decline. Last year the team selected an ABC value for 1996 related to the degree of uncertainty in the current stock level by choosing the lower 95 % confidence bOlmd. The data required to compute the same this year were not yet available. However, applying the proportional decrease in exploitable biomass between last year and this year to the 1996 ABC gives a 1997 ABC value of 52,000 mt. Several Team members expressed concern over using the lower 95% confidence bound and suggested another method using the future projected catch (at F 40\\;) as a "cap" on ABC recommendations. This value was close to 52,000 mt, lending additional support to the Team's recommendation. The overfishing level of 134,000 mt based on the F30% harvest guideline was supported by the Team. The breakdown of ABC to Western, Central, and Eastern Gulf regions would be 15,080, 34,320 and 2,600, respectively. ~
FLATFISH
1225Eisb~ ARC CATCH Deep water 14,590 2,213 Rex sole 11,210 4,021 Shallow water 52,270 5,430 Flathead sole 28.720 2...l.8l TOTAL 106,860 13,845
1226 Eisbeo: ARC CAICHl Deep water 14,590 1,972 Rex sole 11.210 5.144 Shallow water 52.270 7,027 Flathead sole 28.720 2...3.Q5. TOTAL 106.860 16,448
1297 Fisbeo: ARC Deep water 22,160 Rex sole 8,970 Shallow water 60.730 Flathead sole 31.750 TOTAL 123,610
1 Through August 10. 1996
In the current SAFE document. arrowtooth flounder has been removed from the flatfish category and are now included in a separate chapter. The remaining flatfish group; Subdivided into deep water flatfishes, rex sole. shallow Water flatfishes, and flathead sole; continue to be included in the flatfish chapter of the SAFE. The 1997 exploitable biomass for each category is based on abundance estimated from the 1993 triennial trawl survey. For 1997, ABCs for each category have been calculated based on F4()<{" rather than on F35% as used in 1996 calculations. The fishing mortality rates determined from those calculations were applied to the exploitable biomass estimates from the 1993 triennial survey to determine ABCs for the four species or groups managed under the flatfish category.
10
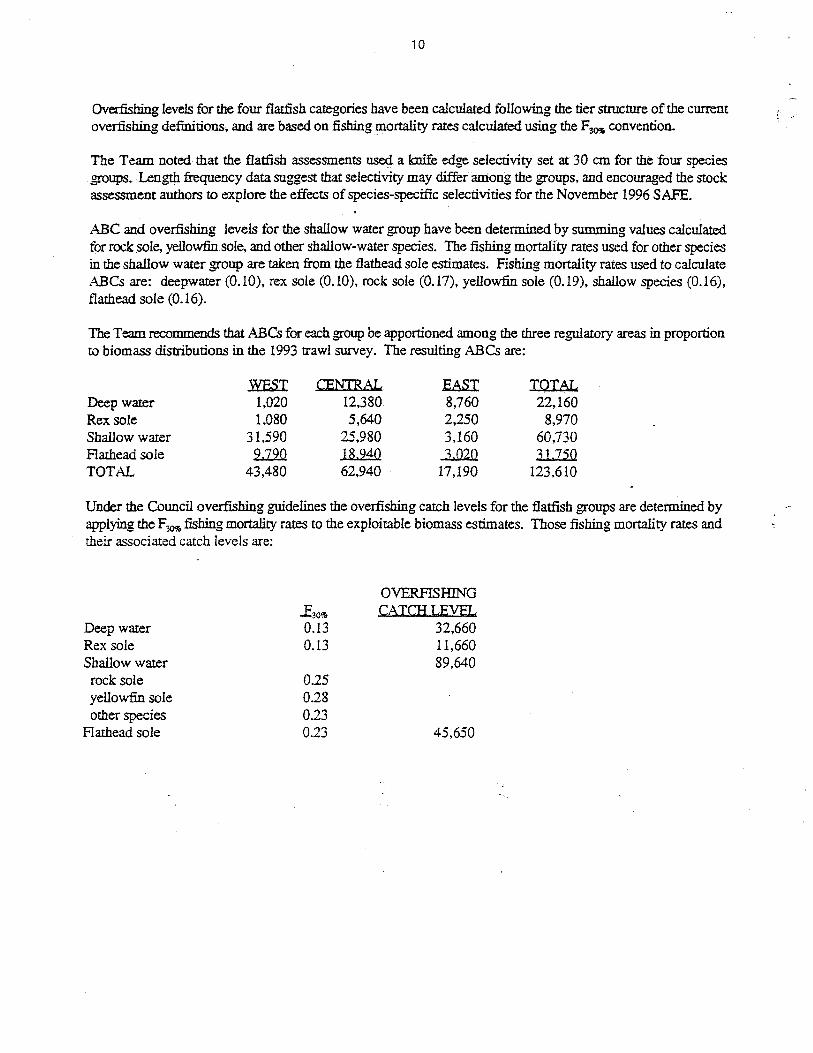
Overfishing levels for the four flatfish categories have been calculated following the tier structure of the current overfishing definitions, and are based on fishing mortality rates calculated using the F3Q<;t, convention.
The Team noted that the flatfish assessments used a knife edge selectivity set at 30 em for the four species groups. Length frequency data suggest that selectivity may differ among the groups, and encouraged the stock assessment authors to explore the effects of species-specific selectivities for the November 1996 SAFE.
ABC and overfishing levels for the shallow water group have been determined by summing values calculated for rock sole, yellowfin sole, and other shallow-water species. The fishing mortality rates used for other species in the shallow water group are taken from the flathead sole estimates. Fishing mortality rates used to calculate ABCs are: deepwater (0.10), rex sole (0.10), rock sole (0.17), yellowfin sole (0.19), shallow species (0.16), flathead sole (0.16).
The Team recommends that ABCs for each group be apportioned among the three regulatory areas in proportion to biomass distributions in the 1993 trawl survey. The resulting ABCs are:
MS.T CENTRAL EASI IQI8L Deep water 1,020 12,380 8,760 22,160 Rex sole 1,080 5,640 2,250 8,970 Shallow water 31.590 25,980 3,160 60,730 Flathead sole 2..1.2!l 18,940 ..3..Q2.Q 11.150 TOTAL 43,480 62,940 17,190 123,610
Under the Council overfishing guidelines the overfishing catch levels for the flatfish groups are determined by applying the Fm;. fishing mortality rates to the exploitable biomass estimates, Those fishing mortality rates and their associated catch levels are:
OVERFISHING
.£3090 CAICHLEVEL Deep water 0.13 32,660 Rex sole 0,13 11,660 Shallow water 89,640
rock sole 0.25 yellowfin sole 0,28 other species 0.23
Flathead sole 0.23 45,650
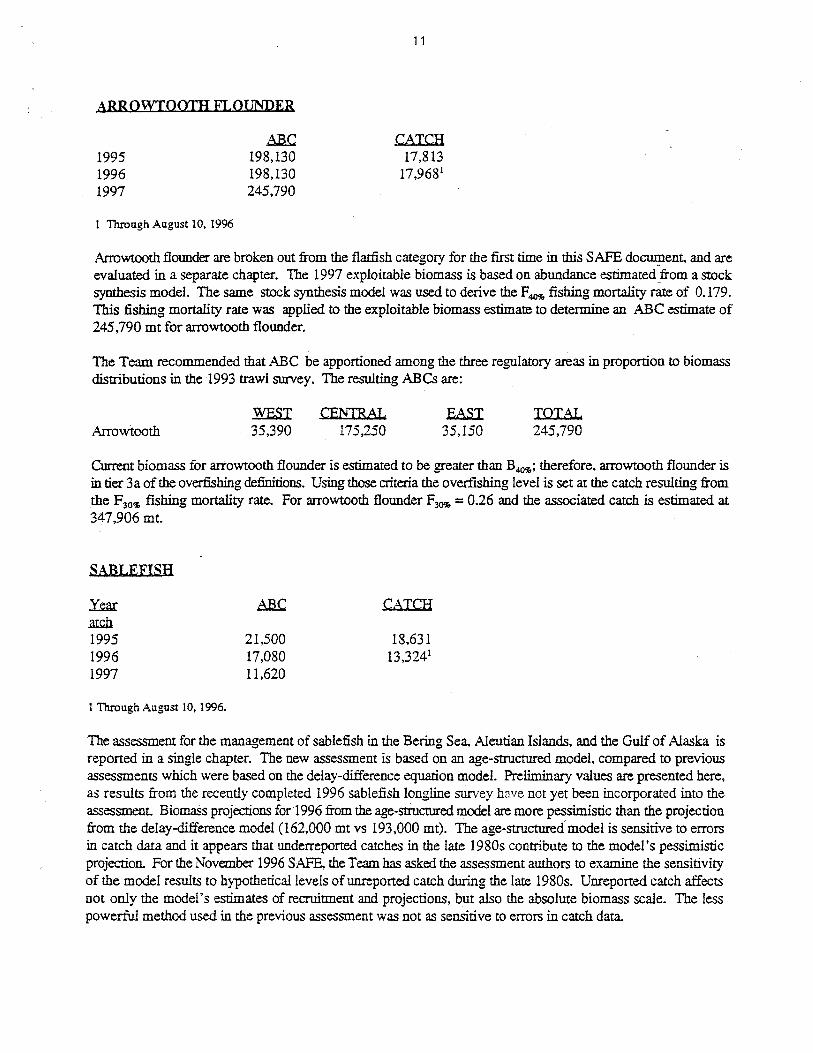
ARROWTOOTH FLOUNDER
1995 1996 1997
1 Through August 10, 1996
ABC 198,130 198,130 245,790
11
CATCH 17,813
17,9681
Arrowtooth flounder are broken out from the flatfish category for the first time in this SAFE docu.rp.ent. and are evaluated in a separate chapter. The 1997 exploitable biomass is based on abundance estimated _from a stock synthesis model. The same stock synthesis model was used to derive the F4Q<.\7 fishing mortality rate of 0.179. This fishing mortality rate was applied to the exploitable biomass estimate to determine an ABC estimate of 245,790 mt for arrowtooth flounder.
The Team recommended that ABC be apportioned among the three regulatory areas in proportion to biomass distributions in the 1993 trawl survey. The resulting ABCs are:
Arrowtooth :£iESI 35,390
CENTRAL 175,250
EAS.I 35,150
TOTAL 245,790
Current biomass for arrowtooth flounder is estimated to be greater than B4Q<.\7; therefore, arrowtooth flounder is in tier 3a of the overfishing definitions. Using those criteria the overfishing level is set at the catch resulting from the F 30$ fishing mortality rate. For arrowtooth flounder F3O'fr = 0.26 and the associated catch is estimated at 347,906 mt.
SABLEFISH
.Y!:ar atctl 1995 1996 1997
1 Through August 10, 1996.
21,500 17,080 11,620
CATCH
18,631 13,3241
The assessment for the management of sablefish in the Bering Sea, Aleutian Islands, and the Gulf of Alaska is reponed in a single chapter. The new assessment is based on an age-structured model, compared to previous assessments which were based on the delay-difference equation model. Preliminary values are presented here, as results from the recently completed 1996 sablefish Iongline sUrvey have not yet been incorporated into the assessment. Biomass projections for 1996 from the age-structured model are more pessimistic than the projection from the delay-difference model (162,000 mt vs 193,000 mt). The age-structured model is sensitive to errors in catch data and it appears that underreported catches in the late 1980s contribute to the model's pessimistic projection. For the November 1996 SAFE, the Team has asked the assessment authors to examine the sensitivity of the model results to hypothetical levels of unreported catch during the late 1980s. Unreported catch affects not only the model's estimates of recruitment and projections, but also the absolute biomass scale. The less powerful method used in the previous assessment was not as sensitive to errors in catch data.

12
The ABC's and OFL's for the 1997 fishery in the Gulf of Alaska, Bering Sea, and Aleutian Islands are based on the new ABC and OFL definitions utilizing F 4O'Ir or F30% fishing mortality rates respectively, adjusted by the ratio of current biomass (B96) to B 4O'Ir' F ABC (which is the adjusted F 4O'Ir rate) is estimated at 0.086 from the age· structured model, lower than the previously used Fm. adjusted rate of 0.122 from the delay·difference model. FOFL is the F30% adjusted rate estimated at 0.130 from the age·structured model. This is lower than last year's FOFL rate of 0.153, which was F30% (no adjustment) estimated from the delay.difference model.
The combination of the lower projected biomass estimate from the age-structured model and new fishing mortality rates result in significantly lower ABC and OFL recommendations relative to last year's assessment. The preliminary ABC for the combined regions is 13,300 mt, with an apportionment of 11,620 mt to the Gulf of Alaska, and 790 mt and 890 mt to the Bering Sea and Aleutian Islands, respectively. The reduction in ABC may seem overly pessimistic, considering that the estimated population trend is somewhat steeper than the trend of survey points since 1990. However, the survey, which covers most of the prime habitat along the slope and deep gulleys, only partially covers marginal habitat and could be underestimating the rate of total stock decline if concentrations in marginal habitat decline at a greater rate. The greater rate of decline in the marginal areas covered by the survey, such as the Gulf of Alaska gulleys and the Bering Sea and Aleutian Islands slope (Tables 5.5 and 5.6 in the Sablefish chapter) compared to the Gulf of Alaska slope indicate this could be happening. The fishery, which targets effort in prime habitat, may also continue to experience high catch rates as the stock contracts from marginal areas. The survey may confirm the pessimistic trend in the population, and confirm a need for a lower ABC. If the survey indicates a stable population and problems with misreported catch data are reconciled, the reduction in the ABC may be mediated.
Recruitment estimates for the 1992 and 1993 year classes are the lowest observed. Estimates of these year classes are relatively uncertain because they depend on only 1·2 years of data and these year classes are only partially recruited. Recruitment estimates from the 1982 to 1993 year classes were averaged to project biomass for 1996. For November, the Plan Team req1le>led that the authors examine the effect of projecting biomass with and without the 1992 and 1993 year classes included in the average.
The reference fishing rates calculated for this year's assessment are slightly higher than previous assessments because the growth information has changed. New growth information is available which in addition to the Gulf of Alaska also covers the eastern Bering Sea and Aleutian Islands regions. The maximum length is less from this information, especially for females, primarily because the new growth information also includes the eastern Bering Sea and Aleutian Islands where there are fewer large fish compared to the Gulf of Alaska. The effect of the smaller maximum length on the per recruit calculations is to increase the reference fishing rates.
The apportionment of the Gulf of Alaska ABC would be 13,40, 18, and 29 percent to the Western. Central. West Yakutat, and East Yakutat/Southeast areas, respectively. Thus, apportionment of the 11,620 mt ABC is recommended 1,500 mt in the Western Area, 4,690 mt in the Central Area, 2,060 mt in the West Yakutat Area, and 3,370 mt in the East Yakutat/Southeast Area.
An overfishiIig level obtailled by applying an F30%J<iiustod rate. would be 17,210 mt, 1,170 mt, and 1,320 mt respectively for the Gulf of Alaska, Bering Sea, and Aleutian Islands, respectively.
With the advent of the ITQ fisheries. the Team noted the possibility of the longline survey results being affected by fishing operations just prior to and during station sampling. Because of the importance of the' survey index in determining ABC and understanding the dynamics of the sablefish stock, the sablefish longline fleet was asked to avoid the survey areas for a few days before the area was to be sampled. In 1995 the survey encountered little longline activity in the western and central Gulf. Somewhat more activity was observed in the eastern Gulf. in the Cape Spencer/Cross Sound area and the area off of Sitka. The survey also encountered trawl activity targeting

13
fish on the slope in early July in the Cbirikof area. For the most part. cooperation was good in 1995. and improved in 1996. In 1996, the longline survey schedule was modified to provide more opportunity for activity that could avoid the survey. The survey ~tarted earlier and was halfway through the central Gulf before the July trawl opening, providing more area that had already been surveyed and need not be avoided. There was little interaction with fisheries in the Central Gulf. It was hoped that by the time the survey reached the West Yakutat area. the area would have been closed and allowed to rest after a short rockfish opening, or fishing activity would be avoided directly prior to the survey. However, the rockfish fishery did not close until the end of July and trawlers topping off on sablefish were observed in the survey area shortly before sampling. survey scientists will examine observer reports of fishing in the area to determine if a valid adjustment of survey results can be obtained. The survey reached the Sitka area before the traditional salmon troll closure to attempt to avoid activity by trollerl1ongliners.
SLOfE ROCKFISH AB.C CAlCRl
1995 Pacific ocean perch 6.530 4,819 shortrakerfrougheye 1,910 1.866 northern rockfish 5,270 3,889 other slope species 1.J.illl ..2QQ TOTAL 20,810 11,534
1996 Pacific ocean perch 8,060 8,301 shortrakerfrougheye 1,910 1,489 northern rockfish 5,270 3,420 other slope species 1J.OO ~ TOTAL 22,340 14,050
1997 Pacific ocean perch 11,780 shortrakerfrougheye 1,740 northern rockfish 5.270 other slope species .i..8.6.Q TOTAL 24,650
1/ Catch through August 10. 1996.
PAClElC QCEAN f?eB.Cl:i.
The assessment for Pacific ocean perch is updated to include the updated catch for the 1995 and 1996 fisheries. As in last year's assessment, an estimate of the abundance and age structure of the population in 1992 based on the stock synthesis model is projected to the current year using natural and fishing mortality and average recruittnent to· determine current stock condition. Current exploitable biomass is estimated to be 181.886 mt and the estimate of current female spawning biomass is estimated to be 131,896 mt. Changes in these estimates compared to last year's assessment are mostly due to natural and fishing mortality and fish growth as computed in the projections.
The Plan Team agreed with the methodology used by the authors to determine preliminary ABC, OFL, and T AC. ID last year' s assessment the optimal F 44% rate adjusted by the ratio of current female spawning biomass to target spawning biomass level of 150,000 mt was used by the authors to determine their ABC recommendation. The

14
current F 44~ rate is estimated to be 0.078. The optimal F and target biomass were based on an analysis of spawner recruit data generated. by the stock synthesis modeL In this analysis, the F 44~ value was slightly greater than the maxi-min F value for monetary yield and slightly less than the maxi-min F value for bioI~gica1 yield. The maximin value was defined as the F value that maximizes the minimum yield over a range of plausible stock recruitment relationships. This methodology applied to the current population results in an adjusted F 44~ rate of 0.069. If the F44~ rate is used as an estimate ofFMSY• then the adjUSted F44~ rate will slightly exceed the new defmitions for ABC in tier 2b. Based on this new definition F ABC must be less than or equal to 0.068 which results in a recommended preliminary ABC of 11,780 mt. The OFL level for Pacific ocean perch is based on the new definition in tier 2b. This results in an F OF!.. of 0.103 and a preliminary OFL of 17,630 mt.
The Plan Team and the authors concurred with the method of apportionment used for the past two years. The method weights prior surveys based on the relative proportion of variability attributed to survey error. It was assumed that survey error contributes 2/3 of the total variability in predicting the distribution of biomass. Thus, the weight of a prior survey should be 2/3 the weight of the preceding survey. This results in weighting of 4:6:9 for the 1987, 90, and 93 surveys, respectively. Using area apportionments of 18.1 % for the Western area, 47.9% for the Central area, and 34.0% for the Eastern area results in recommended ABCs of 2,130 mt for the Western area, 5,640 mt for the Central area, and 4,010 mt for the Eastern area. Apportioning OFL by area results in OFLs of3,190 for the Western area, 8,450 the Central area, and 5,990 mt in the Eastern area.
The TAC for Pacific ocean perch is determined from the rebuilding plan in the GOA FMP. The plan recommends the use of the fishing mortality rate halfway between the optimum fishing mortality rate and the fishing mortality rate estimated to be sufficient to supply unavoidable bycatch of Pacific ocean perch in the Gulf of Alaska based on 1992 bycatch rates. The fishing rate from this computation corresponds to the F 55\'\', rate. This rate is adjusted downward by the ratio of current female spawning biomass to target female spawning biomass. The authors and the Team used the currently adjusted F55~ rate to compute a TAC consistent with the rebuilding plan. The adjusted FS5% rate of 0.047 results in a rebuilding plan TACfor Pacific ocean perch for the 1997 fishery ofS,l30 mt \\<ith apportionments of 1,470 for the Western area, 3,900 in the Central area, and 2,760 in the Eastern area.
SHOFrTRAKERlROUGHEYE
The recommended ABC for shortraker and rougheye rockfish in 1997 is different from that recommended for 1996 because of new ABC and OFL definitions. Applying the new definitions for ABC and OFL based on tier 5 for shortraker rockfish results in an ABC of 533 mt (Le., F ABC ~ 0.75 M) and OFL of 711 mt. Applying tier 4 to rougheye rockfish results in the same ABC (1,203 mt) and OFL (2,214 mt) as in 1996 because F ABC =M= 0.025 which is less thanF4Q%=.032. Thus the combined ABC for shortraker and rougheye rockfish is 1,740 mt. ABC for the shortraker/rougheye component of the assemblage is apponioned by area based on the 1987, 1989, and 1993 survey biomass estimates. This results in ABC's of 160 mt for the Western area, 1,100 mt for the Central area, and 480 for the Eastern area.
An F3Q$ value of 0.046 was calculated for rough eye rockfish, which if applied to the rougheye rockfish biomass estimate of 48,123 mtresults in an overfishing level of.2,214 mt. An F3O'J. for shomaker has not been computed because of a lack of growth data, therefore F=M=O.03 was applied to the biomass estimate of 23 ,689 mt to give an overfishing catch limit of 711 mt. The two overfishing levels were summed to obtain an OFL for shortraker and rougheye of 2,925 mt.

15
NORTHERN ROCKFISH
The recommended ABC in 1997 for northern rockfish is the same as in 1996, and is based on a harvest rate set equal to natural mortality M .(0.06). Applying the new definitions for ABC and OFL based on tier 4 to northern rockfish results in the same ABC and OFL as in 1996 because F ABc=M= 0.060 which is less than F 4()<K,=O.075. Applying this harvest rate to the estimated exploitable biomass of 87,845 mt based on the average of the 1987, 1990, and 1993 trawl surveys results in an ABC of 5,271 mt for northern rockfish. Distributing this ABC based on averages of the 1987, 1990, and 1993 trawl surveys results in ABCs of 641 mt in the Western area, 4,613 mt in the Central area, and 17 mt in the Eastern area. The OFL for northern rockfish is based on F30% and is equal to 9,926 mt.
OTHER SLOPE ROCKFISH
As in past assessments the recommended ABC for other slope rockfish is based on a harvest rate set equal to natural mortality M applied to the average 1987, 1990 and 1993 trawl survey estimates of exploitable biomass for each species and then summing to obtain an ABC for the assemblage. Applying the new definitions for ABC and OFL based on tier 4 to sharpcbin rockfish results in the same ABC (2,160 mt) as in 1996 for sharpcbin rockfish because F ABc=M= 0.050 which is less than F 4()<K,=O.055. As in 1996, OFL of 3,458 mt for sharpcbin rockfish is based on F30% = .080. Applying tier 5 to the other species of other slope rockfish (Le., FA • .Be s; 0.75 M) results in an ABC of 3,700 mt and the same OFL as in 1996 (i.e., F=M). Thus the combined ABC for other slope rockfish is 5,860 mt (150 mt, 960 mt, and 4,750 mt for the Western, Central, and Eastern areas, respectively) and OFL is 8,365 mt. .
PELAGIC SHELF ROCKFISH
.YEAR 1995 1996 1997
1/Through August 10, 1996.
.ABC 5,190 5,190 5,190
CATCH 2,891
2.1191
In previous assessments. determination of exploitable biomass and ABC for pelagic shelf rockfish was primarily based on results of triennial trawl surveys in the Gulf of Alaska. Because data from the 1996 survey are not available for this preliminary SAFE report. the values of current exploitable biomass and recommended ABC for 1997 remain the same as in 1996. The current exploitable biomass for pelagic shelf rockfish, estimated to be 57,644 mt Gulfwide, was calculated as the averaged data from the 1987, 1990 and 1993 trawl surveys. Similar to previous assessments, ABC was calculated using an F=M strategy in which the annual exploitation rate. was Set equal to the natural mortality rate of 0.09 for dusky rockfish. Applying this rate to the exploitable biomass yields a recommended Gulfwide ABC of 5,190 mt for pelagic shelf rockfish. Because this F ABC is less than F 4()<K, of 0.10, the F=M strategy adheres to the new definition of ABC for a "tier 4" assessment. Using an average of the percent biomass distribution by area from the 1987, 1990, and 1993 surveys, t,he recommended Gulfwide ABC was geographically apportioned for 1997 as: 910 mt in the Western Area, 3,200 mt in the Central area, and 1,080 mt in the Eastern area. Under the new overfisbing definitions. OFL was calculated as F30% of 0.15 and equals 8.704 mt Gulfwide. Results of the 1996 triennial trawl survey may be available for inclusion in the final SAFE repon in November, and revised estimates of exploitable biomass and new recommended ABC's will be computed at that time.

16
The Plan Team and the authors continue to recommend a repanitioning of the pelagic shelf rockfish complex. , , The cm:rent ABC and T AC are derived almost entirely from dusky rockfish catches in the trawl surveys because black rockfish and other assemblage species are not adequately sampled by trawls. Although the TAC for pelagic shelf rockfish has not been taken since this assemblage was established. localized over-exploitation of black rockfish and other shallow water species remains a concern. The EA/RIR for GOA Amendment 46 will examine different options for assemblage partitioning and state and federal management authority.
DEMERSAL SHELF ROCKFISH
YEAB. 1995 1996 1997
AB..C 580 950 950
CATCH 282
3451
IThrough August to, 1996. Does not include estimated unreported mortality.
Exploitable biomass and ABC for demersal shelf rockfish (DSR) are based on results of the 1994 and 1995 line transect submersible survey of yeUoweye rockfish in the Eastern Gulf of Alaska. No survey was conducted in 1996. Line transects were conducted in the East Yakutat subdistrict and the Central Southeast Outside area in 1995. Several changes were made in survey design in 1995. Most importantly, a front mounted video camera was used to observe the transect line, ensuring that the assumption of 100% detectibility along the line was met. The traIisect line was defined as the 3 foot section covered by the front mounted video but not seen by the observer. Increased estimates of density in the 1995 survey data are largely due to this change and do not reflect an actual increase in density. Also there was a technical problem in estimating line length in 1995 due to problems with the submersible's tracking syStem. Consequently, line length was estimated based on an average velocity and time on line. The 1994 density estimates from Northern Southeast Outside and Southern Southeast Outside areas were re-analyzed using this method for estimating line length. Although the authors feel this estimation is defensible. there is unknown error associated with line length. Because of the uncertainty regarding estimation of line length the authors' recommendation that the ABC be set based on the lower 90% confidence limit for the biomass estimate as was done for the 1996 SAFE.
The authors addressed concerns about the high level of unreported DSR mortality associated with the halibut fishery and the uncertainty in accounting for this mortality. Anecdotal information from commercial fishermen suggest that the 10% bycatch provision for DSR taken during directed halibut fishing operations is inadequate and that for some trips the bycatch level may be much higher than 10%. Many fishermen do not land or report overages because they would be in violation of directed fishing standards. Although this information is anecdotal, the Team feels that it may be appropriate to either raise the bycatch rate or allow landing of overages to be surrendered without penalty to promote reporting of true mortality.
TbeTeam agrees with the authors' recon:u:nendation to continue using the lower 90% a for setting biomass until difficulties with line length estimation is resolved and new survey data is collected. Under this approach the Southeast Outside subdistrict exploitable yelloweye biomass estimate is 42.552 mt Using the new definitions for over:fishing and ABC, and adjusting for the 10% of other species landed in the assemblage, the recommended ABC is 950 mt. The F ABC was set at F=M=O.02, more conservative than the F40% rate of 0.023. Overfishing is defined as F30%=O.037 resulting in an overfishing level of 1,574 mt.

THORNYHEADS
Year 1995 1996 1997
ABC 1,900 1,560 1,560
1 Through August 10, 1996
Catch 1,113 94tt
17
No changes to the thornyhead assessment were made. The author anticipated that the assessment would be updated when the triennial survey information becomes available. The Team noted that the Bering Sea Team recommended that a more formal analysis be done for thornyheads in the Aleutian IslandslEastern Bering Sea regions, possibly as a combined Alaska-wide stock analysis. The Team felt that some stock separation work using may fit in well with current genetics analyses of other rockfish species at the NMFS Auke Bay Lab and they recommended that the collection and analysi of the necessary samples for such work be pursued. The Team recommended that the population of thorny heads in Alaska should not be treated as a single stock until there is evidence that suggests otherwise.
ATKA MACKEREL
1995 1996 1997
AllC 3,240 3,240 6,480
1 Catch through Augu~t 10, 1996
There was no directed fishery for Atka mackerel in 1995 in the Gulf of Alaska; consequently, there was no new information on fishery catch-at-age or length-frequencies to incorporate into this assessment. Since the 1996 GOA bottom trawl survey estimate was not yet available, the best available estimate of Atka mackerel abundance in the GOA is from the 1993 survey: 21,600 mt. The 1996 survey estimate will be used to compute ABC prior to the November 1996 Plan Team meeting if available. Previous surveys in 1984, 1987, and 1990 yielded biomass estimates of36,000 mt, 33,000 mt, and 32,100 mt, respectively. The 1993 survey was preceded by the 1992 fishery, which removed approximately 14,000 mt.
The Plan Team used the natural mortality rate ofM=O.30 to calculate the 1997 ABC. The authors recommended using the rate of Ml2, which the SSC used to compute the ABC in 1994-1996. This conservative rate was advocated because there is no evidence of recruitment into this population, Atka mackerel in the GOA may be particularly sensitive to fishing pressure, and Atka mackerel is an important prey species for Steller sea lions. The overfishing level for GOA Atka mackerel, 9,800 mt, was based on the F30% (=0.454) rate in terms of spawning biomass per recruit.
18
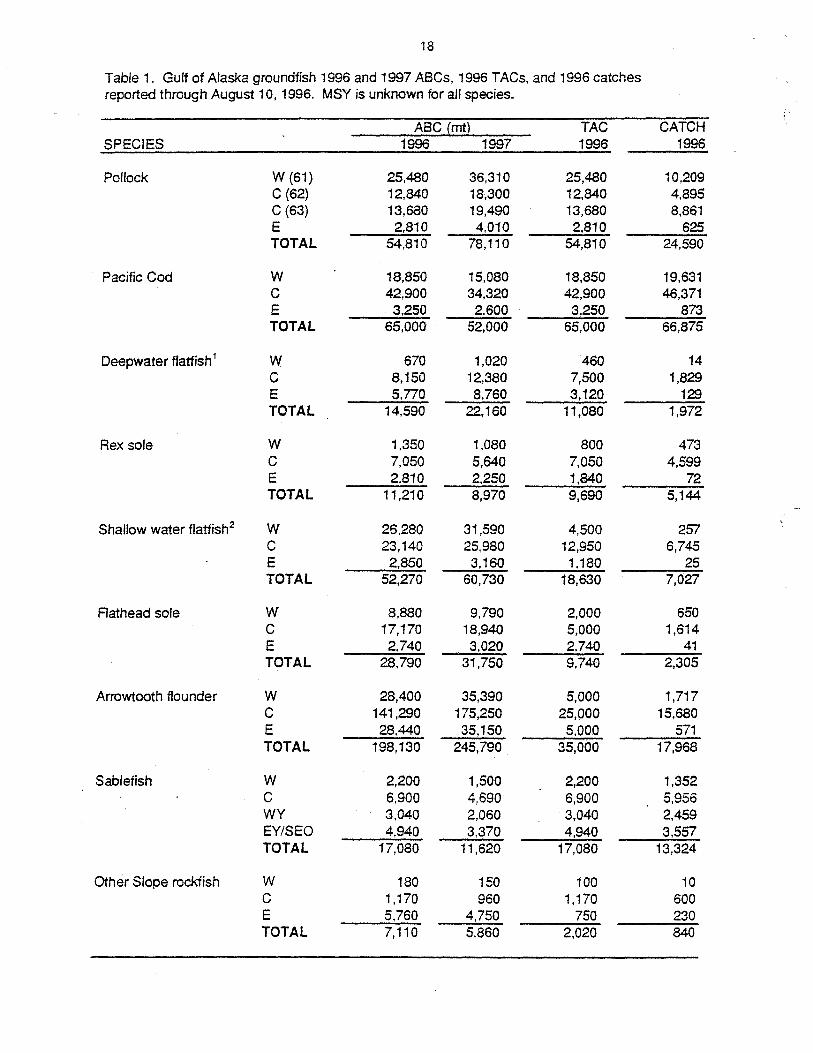
Table 1. Gulf of Alaska groundfish 1996 and 1997 A8Cs, 1996 TACs, and 1996 catches reported through August 10, 1996. MSY is unknown for all species.
A8C (rnt~ TAC CATCH SPECIES 1996 1997 1996 1996
Pollock W (61) 25,480 36,310 25,480 10,209 C (62) 12,840 18,300 12,840 4,895 C (63) 13,680 19,490 13,680 8,861 E 2.810 4,010 2.810 625 TOTAL 54,810 78,110 54,810 24,590
Pacific Cod W 18,850 15,080 18,850 19,631 C 42,900 34,320 42,900 46,371 E 3,250 2.600 3,250 873 TOTAL 65,000 52,000 65,000 66,875
Deepwater flatfish 1 W 670 1,020 460 14 C 8,150 12,380 7,500 1,829 E 5,770 8.760 3,120 129 TOTAL 14,590 22,160 11,080 1,972
Rex sole W 1,350 1,080 800 473 C 7,050 5,640 7,050 4,599 E 2.810 2.250 1,840 72 TOTAL 11,210 8,970 9,690 5,144
Shallow water flatfish2 W 26,280 31,590 4,500 257 C 23,140 25,980 12,950 6,745 E 2,850 3,160 1,180 25 TOTAL 52,270 60,730 18,630 7,027
Aathead sole W 8,880 9,790 2,000 650 C 17,170 18,940 5,000 1,614 E 2,740 3.020 2,740 41 TOTAL 28,790 31,750 9,740 2,305
Arrowtooth flounder W 28,400 ·35,390 5,000 1,717 C 141,290 175,250 25,000 15,680 E 28,440 35,150 5,000 571 TOTAL 198,130 245,790 35,000 17,968
Sablefish W 2,200 1,500 2,200 1,352 C 6,900 4,690 6,900 5,956 WY 3,040 2,060 3,040 2,459 EY/SEO 4.940 3.370 4,940 3,557 TOTAL 17,080 11,620 17,080 13,324
Other Slope rockfish W 180 150 100 10 C 1,170 960 1,170 600 E 5,760 4,750 750 230 TOTAL 7,110 5,860 2,020 840

19
(Table 1 continued) ABC {mt~ TAC CATCH
SPECIES 1996 1997 1996 1996
Northern rockfish W 640 640 640 113 C 4,610 4,610 4,610 3,283 E 20 20 20 24 TOTAL 5,270 5,270 5,270 3,420
Pacific ocean perch W 1,460 2,130 1,260 892 C 3,860 5,640 3,333 5,170 E 2,740 4,010 2.366 2.239 TOTAL 8,060 11,780 6,959 8,301
Shortraker/rougheye W 170 160 170 104 C 1,210 1,100 1,210 908 E 530 480 530 477 TOTAL 1,910 1,740 1,910 1,489
Pelagic shelf rockfish W 910 910 910 98 C 3,200 3,200 3,200 1,771 E 1,080 1,080 1,080 250 TOTAL 5,190 5,190 5,190 2,119
Demersal shelf rockfish SEO 950 950 950 345
Atka mackerel GW 3,240 6,480 W 2,310 1,343 C 925 10 E 5 0 TOTAL 3,240 6,480 3,240 1,353
Thomyhead rockfish GW 1,560 1,560 1,248 941
Other Species GW NA NA 12.390 3.314
TOTAL 475,170 549,960 260,207 160,982
11 Shelikof Strait pollock is included within the W/C ABC range. 2J "Shallow water flatfish" means rock sale, yeilowfin sale, butter sale, starry flounder, and other flatfish not specifically defined. NOTE: ABCs and TACs are rounded to nearest 10, except for Pacific ocean perch. GW means Gulfwide. Catch data source: NMFS Blend Reports. Redbanded rockfish was removed from DSR and combined with other slope rockfish beginning in 1995.

20
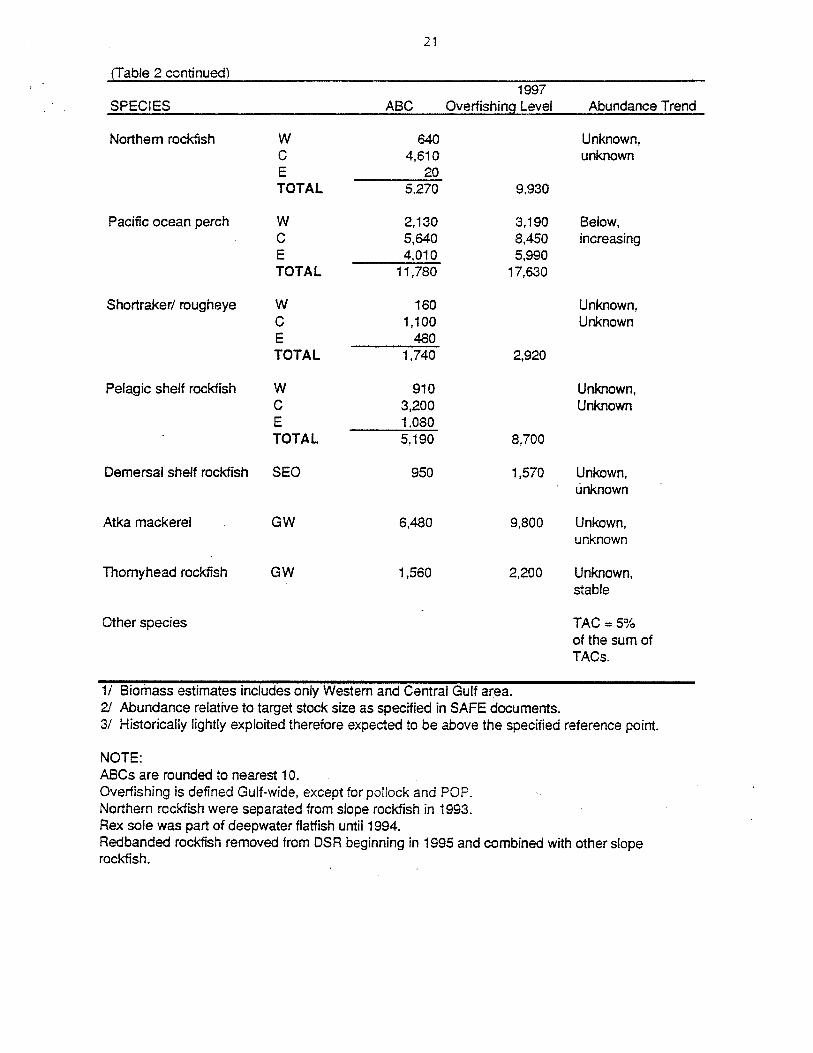
Table 2. Gulf of Alaska exploitable biomasses, 1997 ABCs, and estimated trends and abundance for Western, Central, Eastern, Gulfwide, West Yakutat, and Southeast Outside regulatory areas.
r 1997
SPECIES ABC Overfishing level Abundance2 Trend
Pollock W (61) 36,310 Below C (62) 18,300 102,200 declining C (63) 19,490 E 4.010 5,530 TOTAL 78,110 107,730
Pacific Cod W 15,080 Above C 34,320 declining E 2,600 TOTAL 52,000 134,000
Deepwater flatfish 1 W 1,020 Unknown, C 12,380 Unknown E 8,760 TOTAL 22,160 32,660
Rex sole W 1,080 Unknown, 3
C 5,640 Stable E 2,250 TOTAL 8,970 11,660
Shallow water flatfish3 W 31,590 Unknown,3 C 25,980 increasing E 3,160 TOTAL 60,730 89,640
Flathead sole W 9,790 Unknown,3 C 18,940 stable E 3,020 TOTAL 31,750 45,650
Arrowtooth flounder W 35,390 Above, C 175,250 stable E 35,150 TOTAL 245,790 347,910
Sab/efish W 1,500 low, C 4,690 declining WYK 2,060 EY/SEO 3.370 TOTAL 11,620 17,210
Other Slope rockfish W 150 Unknown, C 960 unknown E 4.750 TOTAL 5,860 8,370
21
(Table 2 continued) 1997
SPECIES ABC Overfishing Level Abundance Trend
Northern rockfish W 640 Unknown, C 4,610 unknown E 20 TOTAL 5,270 9,930
Pacific ocean perch W 2,130 3,190 Below, C 5,640 8,450 increasing E 4,010 5,990 TOTAL 11,780 17,630
Shortrakerl rougheye W 160 Unknown, C 1,100 Unknown E 480 TOTAL 1,740 2,920
Pelagic shelf rockfish W 910 Unknown, C 3,200 Unknown E 1.080 TOTAL 5,190 8,700
Demersal shelf rockfish SE~ 950 1,570 Unkown, unknown
Atka mackerel GW 6,480 9,800 Unkown, unknown
Thomyheadrockfish GW 1,560 2,200 Unknown, stable
Other species TAC=5% of the sum of TACs.
1/ Biomass estimates includes only Western and Central Gulf area. 21 Abundance relative to target stock size as specified in SAFE documents. 31 Historically lightly exploited therefore expected to be above the specified reference point.
NOTE: ABCs are rounded to nearest 10. Overfishing is defined Gulf-wide, except for pollock and POP. Northern rockfish were separated from slope rockfish in 1993. Rex sole was part of deepwater flatfish until 1994. Redbanded rockfish removed from DSR beginning in 1995 and combined with other slope rockfish.
22
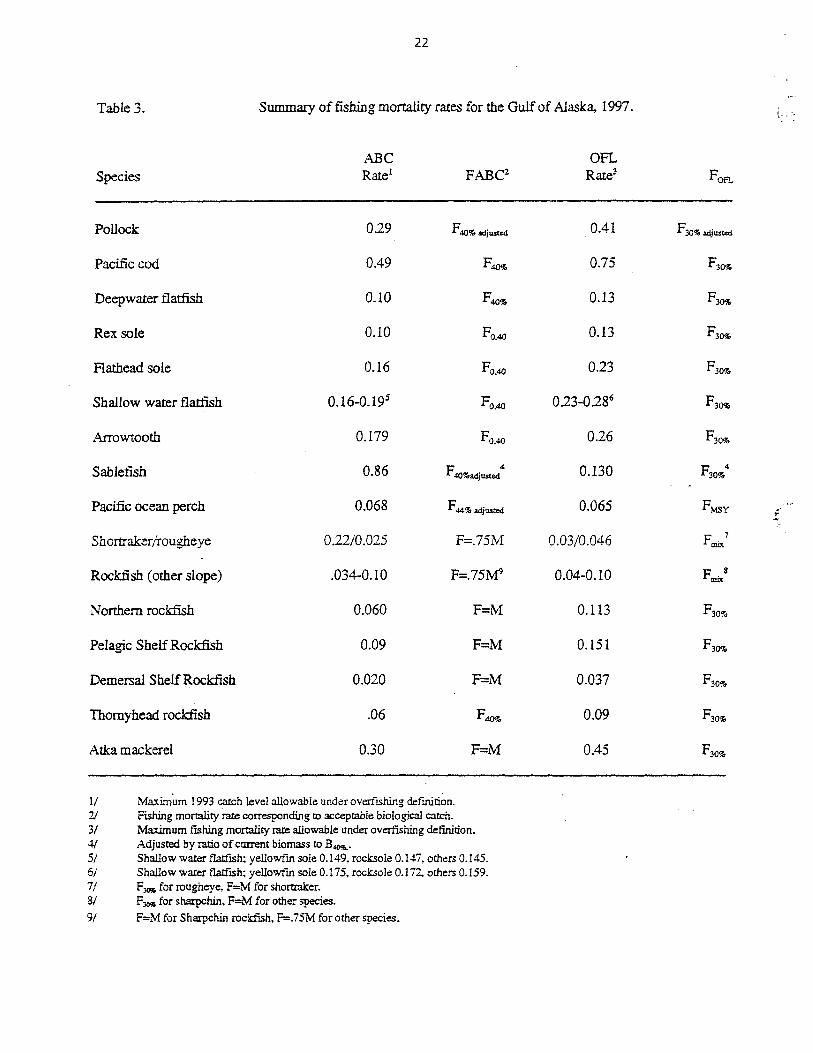
Table 3. Summary of fishing mortality rates for the Gulf of Alaska. 1997. t< :.
ABC OFL Species Rate 1 FABC2 Rate3 FOFL
Pollock 029 F 40% adjusted 0.41 F30% adjusted
Pacific cod 0.49 F4O\t, 0.75 F30%
Deepwater flatfish 0.10 F4O\t, 0.13 F30%
Rex sole 0.10 FO.40 0.13 F30%
Flathead sole 0.16 FO.40 0.23 F30%
Shallow water flatfish 0.16-0.195 FO.40 023-0.286 F30%
Arrowtooth 0.179 FO•40 0.26 F30%
Sablefish 0.86 F 4O%adjusted 4 0.130 F30%4
Pacific ocean perch 0.068 F 44% adjWlted 0.065 FMSy f"
Shonrakerfrougheye 0.22/0.025 F=.75M 0.03/0.046 Fmix 7
Rockfish (other slope) .034-0.10 F=.75~ 0.04-0.10 Fmix 8
Northern rockfish 0.060 F=M 0.113 F30%
Pelagic Shelf Rockfish 0.09 F=M 0.151 F30%
Demersal Shelf Rockfish 0.020 F=M 0.037 F30%
Thornyhead rockfish .06 F4O\t, 0.09 F30%
Atka mackerel 0.30 F=M 0.45 F30%
1/ Maxim~m 1993 catch level allowable under overflshing defuUti~n. 21 Fishing mortality rate corresponding to acceptable biological catch. 3/ Maximum flshing mortality rate allowable under overfishing definition. 4/ Adjusted by ratio of current biomass to B4K.' 5/ Shallow water fiatflSh; yellowfm sole 0.149, rocksole 0.147, others 0.145. 6/ Shallow water flatfish; yellowfm sole 0.175, rocksole 0.172. others 0.159. 7/ FlO'Ko for rougheye, F=M for shortrak:er. 8/ FlO'Ko for sharpchin, F=M for other species.
9/ F=M for Sharpchin rockfish. F=.75M for other species.

Table 4. Groundfish landings (metric tons) in the Gulf of Alaska. 1956-1996.
23 Slope
Pacific Flat Sable Rock Year Pollock Cod Fish FlSh Fish"
1956 1.391 1957 - 2,759 1958 . 797 1959 1,101 1960 2,142 1961 897 16.000 1962 . 731 65,000 1963 2,809 136,300 1964 1.126 196 1.028 2,457 243.385 1965 2,749 599 4,727 3,458 348,598 1966 8,932 1,376 4,937 5,178 200,749 1967 6.276 2,225 4,552 6,143 120,010 1968 6,164 1,046 3,393 15,049 100,170 1969 17,553 1,335 2,630 19,376 72,439 1970 9,343 1,805 3,772 25,145 44,918 1971 9,458 523 2,370 25,630 77,777 1972 34,081 3,513 8,954 37,502 74,718 1973 36,836 5,963 20,013 28.693 52,973 1974 61,880 5,182 9.766 28,335 47,980 1975 59,512 6,745 5,532 26,095 44,131 1976 86,527 6,764 6,089 27,733 46,968 1977 112,089 2,267 16,722 17,140 23,453 1978 90,822 12.190 15,198 8,866 8,176 1979 98,508 14,904 13,928 10,350 9,921 1980 110,100 35,345 15,846 8,543 12,471 1981 139,168 36,131 14,864 9,917 12.184 1982 168.693 29,465 9,278 8,556 7,991 1983 215,567 36,540 12.662 9,002 7,405 1984' 307,400 23,896 6,914 10.230 4,452 1985 284,823 14,428 3,078 12,479 1,087 1986 93,567 25,012 2,551 21,614 2,981 1987 69,536 32.939 9,925 26.325 4,981 1988 65,625 33,802 10,275 29,903 13,779 1989 78,220 43,293 11.111 29,842 19,002 1990 90,490 72,517 15,411 25,701 21.114 1991 107,500 76,997 20,068 19,580 13,994 1992 93,904 80,100 28,009 20,451 16,910 1993 108,591 55,994 37,853 22,671 14,240 1994 110,891 47,985 29,958 21,338 11.266 1995 73,248 69,053 32,273 18,631 15.023 199611 24.590 66.875 34.416 13,324 14.050
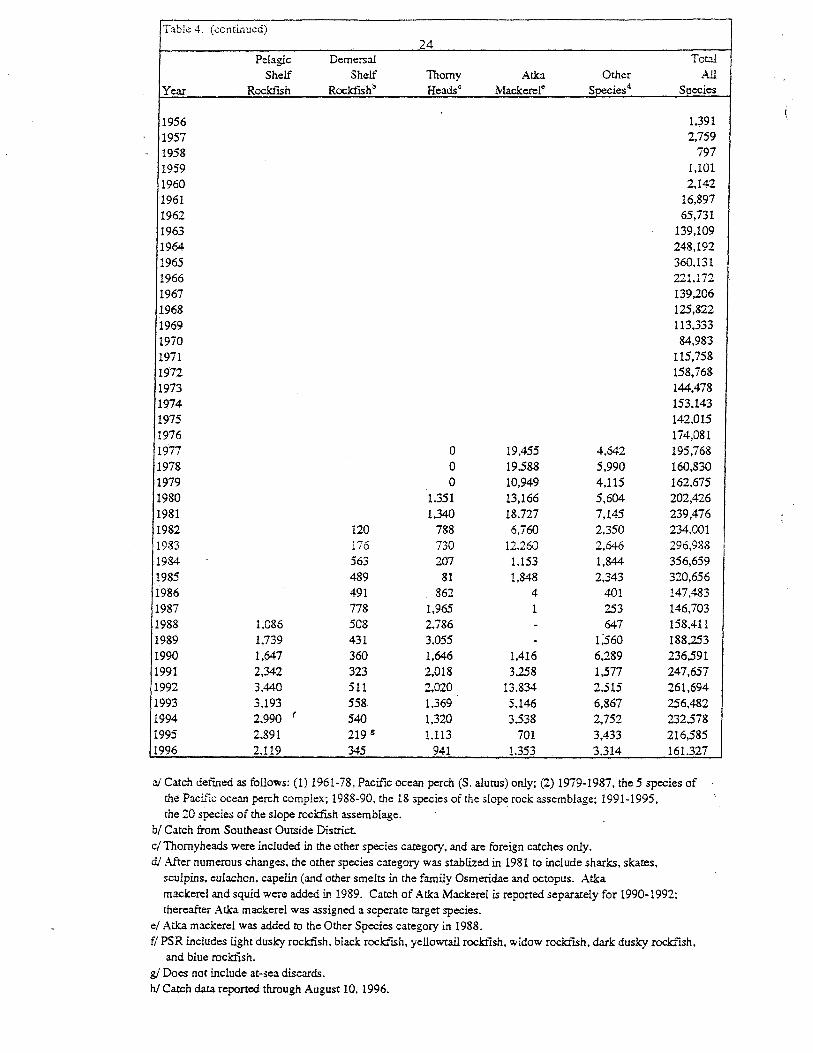
Table 4. (continued) 24
Pelagic Demersal Total Shelf Shelf Thorny Atka Other All
Year Rockf'lSh Rockfishb Heads" Mackerel" S~eciesd Soecies
1956 1.391 1957 2,759
1958 797 1959 1,101 1960 2,142 1961 16,897 1962 65,731 1963 139,109 1964- 248,192 1965 360.131 1966 221.172 1967 139,206 1968 125,822 1969 113,333 1970 84,983 1971 115,758 1972 158,768 1973 144,478 1974 153,143 1975 142,015 1976 174,081 19i7 0 19,455 4,642 195,768 1978 0 19,588 5,990 160,830 1979 0 10,949 4,115 162,675 1980 1,351 13,166 5,604 202,426 1981 1,340 18,727 7,145 239,476 1982 120 788 6.760 2,350 234,001 1983 176 730 12.260 2,646 296.988 1984 563 207 1.153 1,844 356,659 1985 489 81 1.848 2,343 320,656 1986 491 862 4 401 147,483 1987 778 1,965 1 253 146,703 1988 1,086 508 2,786 - 647 158.411 1989 1,739 431 3,055 - Ij60 188,253 1990 1,647 360 1.646 1.416 6,289 236.591 1991 2,342 323 2,018 3.258 1,577 247,657 1992 3,440 511 2.020 13.834 2,515 261,694 1993 3,193 558 1.369 5,146 6,867 256,482 1994 2,990 f 540 1,320 3.538 2.752 232,578 1995 2.891 219 g 1.113 701 3,433 216,585 1996 2.119 345 941 1.353 3.314 161.327
aI Catch defmed as follows: (1) 1961-78, Pacific ocean perch (S. alurus) only; (2) 1979-1987, the 5 species of the Pacific ocean perch complex; 1988-90, the 18 species of the slope rock assemblage; 1991-1995, the 20 species of the slope rockf'lSh assemblage.
bl Catch from Southeast Outside District. cl Thornyheads were included in the other species category, and are foreign catches only. dI After numerous changes, the other species category was stablized in 1981 to include sharks, skates,
sculpins, eulachon. capelin (and other smelts in the family Osmeridae and octopus. Atka mackerel and squid were added in 1989. Catch of Atka Mackerel is reported separately for 1990-1992; thereafter Atka mackerel was assigned a seperate target species.
el Atka mackerel was added to the Other Species category in 1988. fl PSR includes light dusky rockfish. black rockf'lSh, yellowtail roclcrish, widow rockf'lSh. dark dusky rockfish,
and blue rocldish. g/ Does not include at-sea discards. hi Catch data reported through August 10. 1996.

25
Figure 1.
1995 REPORTING AREAS OF THE GULF OF ALASKA -----....
690 .
(GOA Outside tOO U.S. EEZ)
170-W 159'W lS4iN 14i-W 140-W 10194
26
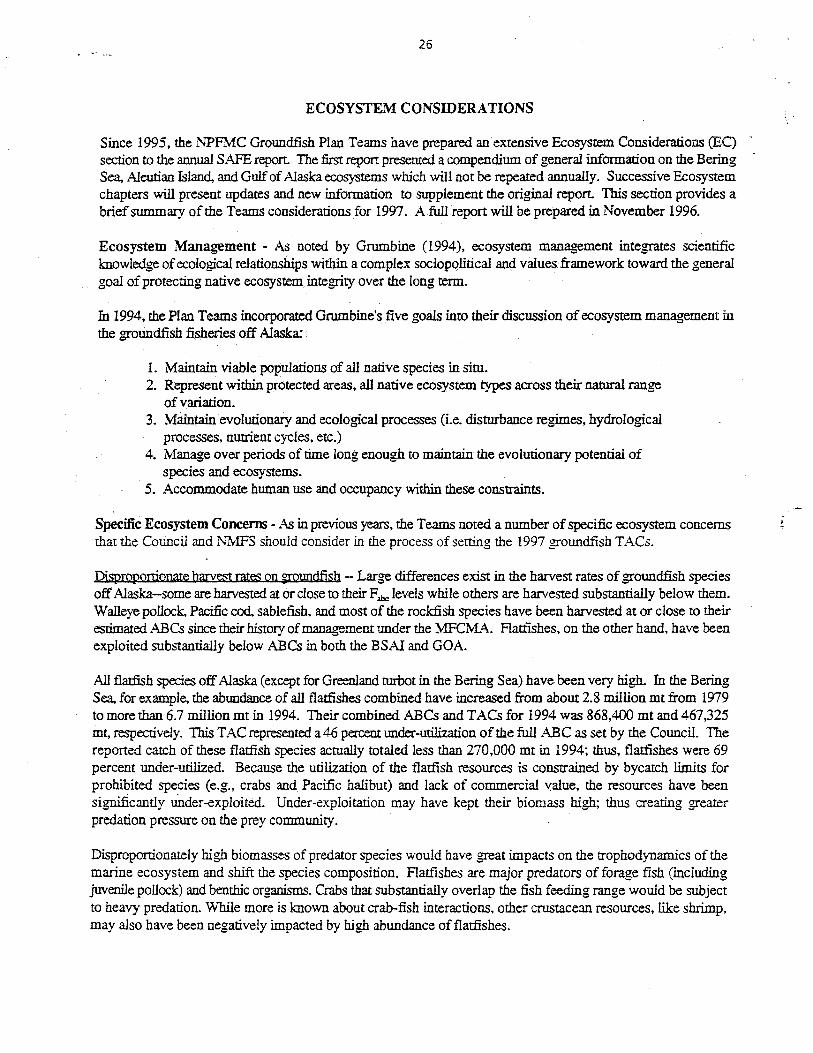
ECOSYSTEM CONSIDERATIONS
Since 1995, the NPFMC Groundfish Plan Teams have prepared an·extensive Ecosystem Considerations (EC) section to the annual SAFE report The first report presented a compendium of general information on the Bering Sea, Aleutian Island, and Gulf of Alaska ecosystems which will not be repeated annually. Successive Ecosystem chapters will present updates and new information to supplement the original report This section provides a brief summary of the Teams considerations for 1997. A full report will be prepared in November 1996.
Ecosystem Management - As noted by Grumbine (1994), ecosystem management integrates scientific knowledge of ecological relationships within a complex sociopolitical and values framework toward the general goal of protecting native ecosystem integrity over the long term.
In 1994, the Plan Teams incorporated Grumbine's five goals into their discussion of ecosystem management in the groundfish fisheries off Alaska:
L Maintain viable populations of all native species in situ. 2. Represent within protected areas, all native ecosystem types across their natural range
of variation. 3. Maintain evolutionary and ecological processes (i.e. disturbance regimes, hydrological
processes, nUtrient cycles, etc.) 4. Manage over periods of time long enough to maintain the evolutionary potential of
species and ecosystems. 5. Accommodate human use and occupancy within these constraints.
Specific Ecosystem Concerns - As in previous years, the Teams noted a number of specific ecosystem concerns that the Council and ~1v1FS should consider in the process of setting the 1997 groundfish TACs.
Disproportionate harvest rates on ~mmdfish - Large differences exist in the harvest rates of groundfish species off Alaska-some are harvested at or close to their F abc: levels while others are harvested substantially below them. Walleye pollock. Pacific cod, sablefish. and most of the rockfish species have been harvested at or close to their estimated ABCs since their history of management under the MFCMA. Flatfishes, on the other hand, have been exploited substantially below ABCs in both the BSAI and GOA.
AIl flatfish species off Alaska (except for Greenland turbot in the Bering Sea) have been very high. In the Bering Sea, for example. the abundance of all flatfishes combined have increased from about 2.8 million mt from 1979 to more than 6.7 million mt in 1994. Their combined ABCs and TACs for 1994 was 868,400 mt and 467,325 mt, respectively. This TAC represented a46 percent under-utilization of the full ABC as set by the Council. The reported catch of these flatfish species actually totaled less than 270,000 mt in 1994; thus, flatfishes were 69 percent under-utilized. Because the utilization of the flatfish resources is constrained by bycatch limits for prohibited species (e.g., crabs and Pacific halibut) and lack of commercial value. the resources have been signi:ficantly u'nder-exploited. Under-exploitation may have kept their biomass high; thus creating greater predation pressure on the prey community.
Disproportionately high biomasses of predator species would have great impacts on the trophodynamics of the marine ecosystem and shift the species composition. Flatfishes are major predators of forage fish (including juvenile pollock) and benthic organisms. Crabs that substantially overlap the fish feeding range would be subject to heavy predation. While more is known about crab-fish interactions. other crustacean resources, like shrimp, may also have been negatively impacted by high abundance of flatfishes.
. >
27
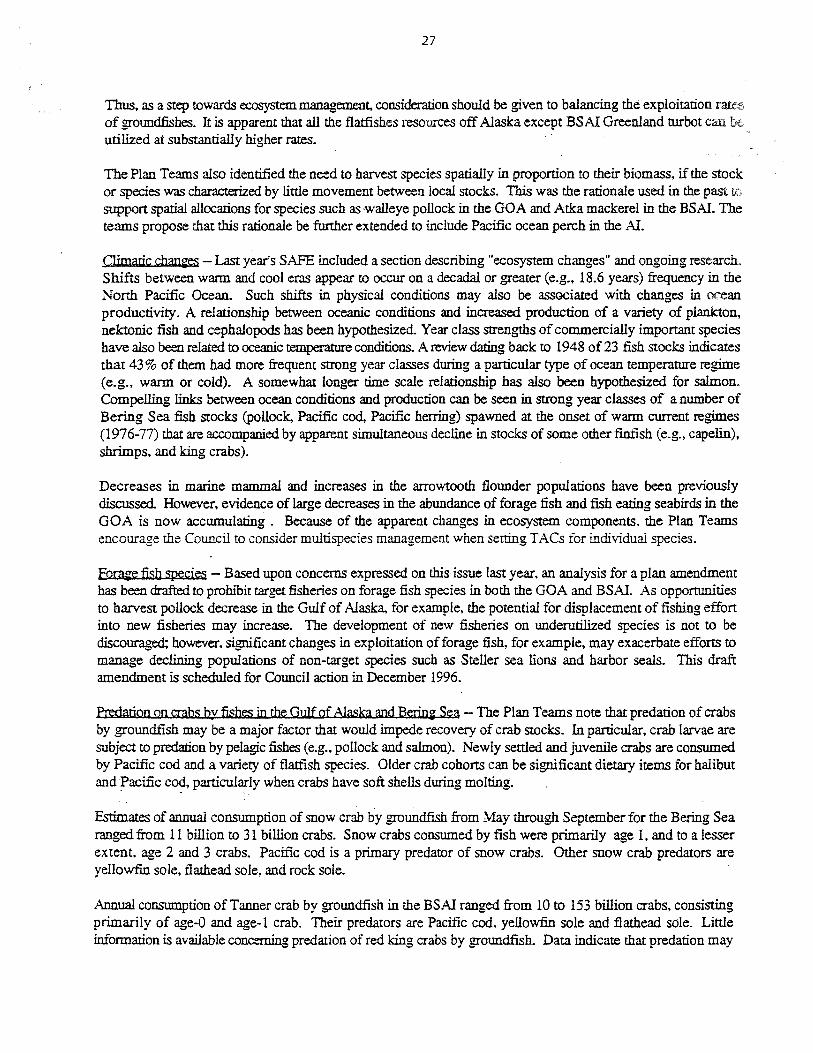
Thus, as a step towards ecosystem management, consideration should be given to balancing the exploitation rat~ of groundfishes. It is apparent that all the flatfishes resources off Alaska except BSAI Greenland turbot can utilized at substantially higher rates.
The Plan Teams also identified the need to harvest species spatially in proportion to their biomass, if the stock or species was characterized by little movement between local stocks. This was the rationale used in the past support spatial allocations for species such as walleye pollock in the GOA and Atka mackerel in the BSAI. The teams propose that this rationale be further extended to include Pacific ocean perch in the AI.
Climatic chan~es - Last year's SAFE included a section describing "ecosystem changes" and ongoing research. Shifts between warm and cool eras appear to occur on a decadaI or greater (e.g., 18.6 years) frequency in the North Pacific Ocean. Such shifts in physical conditions may also be associated with changes in ocean productivity. A relationship between oceanic conditions and increased production of a variety of plankton, nektonic fish and cephalopods has been hypothesized. Year class strengths of commercially important species have also been related to oceanic temperature conditions. A review daring back to 1948 of 23 fish stocks indicates that 43 % of them had more frequent strong year classes during a particular type of ocean temperature regime (e.g., warm or cold). A somewhat longer time scale relationship has also been hypothesized for salmon. Compelling links between ocean conditions and production can be seen in strong year classes of a number of Bering Sea fish stocks (pollock, Pacific cod, Pacific herring) spawned at the onset of warm current regimes (1976-77) that are accompanied by apparent simultaneous decline in stocks of some other finfish (e.g., capelin), shrimps, and king crabs).
Decreases in marine mammal and increases in the arrowtooth flounder populations have been previously discussed. However, evidence of large decreases in the abundance of forage fish and fish eating seabirds in the GOA is now accumulating. Because of the apparent changes in ecosystem components, the Plan Teams encourage the Council to consider multispecies management when setting T ACs for individual species.
forage fish species - Based upon concerns expressed on this issue last year, an analysis for a plan amendment has been drafted to prohibit target fisheries on forage fish species in both the GOA and BSAI. As opportunities to harvest pollock decrease in the Gulf of Alaska, for example, the potential for displacement of fishing effort into new fisheries may increase. The development of new fisheries on underutilized species is not to be discouraged.; however, significant changes in exploitation of forage fish, for example, may exacerbate efforts to manage declining populations of non-target species such as Steller sea lions and harbor seals. This draft amendment is scheduled for Council action in December 1996.
Predation on crabs bv fishes in the Gulf of Alaska and Berin~ Sea - The Plan Teams note that predation of crabs by groundfish may be a major factor that would impede recovery of crab stocks. In particular, crab larvae are subject to predation by pelagic fishes (e.g., pollock and salmon). Newly settled and juvenile crabs are consumed by Pacific cod and a variety of flatfish species. Older crab cohorts can be significant dietary items for halibut and~acific cod, particularly when crabs have soft shells during molting.
Estimates of annual consumption of snow crab by groundfish from May through September for the Bering Sea ranged from 11 billion to 31 billion crabs. Snow crabs consumed by fish were primarily age 1, and to a lesser extent, age 2 and 3 crabs. Pacific cod is a primary predator of snow crabs. Other snow crab predators are yellowfin sole, flathead sole, and rock sole.
Annual consumption of Tanner crab by groundfish in the BSAI ranged from 10 to 153 billion crabs, consisting primarily of age-O and age-l crab. Their predators are Pacific cod. yellowfin sole and flathead sole. Little information is available conc.."'ming predation of red king crabs by groundfish. Data indicate that predation may

28
be low, but this may be due to sampling during summer months when king crabs have hard shells that may make them less vulnerable to predation.
Predation on larvae, juvenile, and adult crabs by groundfish is also likely to be a contributing factor in the continued low populations of GOA Tanner, Dungeness, and king crabs.
SteUer sea lions - The Plan Teams identified several fishery concerns relevant to the continuing decline of Steller sea lions in the BSAI and GOA. One was diet diversity of sea lions. Discussion included within this report suggests that sea lions need a variety of prey available, perhaps as a buffer to significant changes in abundance of any single prey. The need to maintain a variety of prey for sea lions was the rationale for the BSAI Plan Team proposing that the AI pollock fishery be constrained as a bycatch only fishery.
Atka mackerel in the Gulf of Alaska and the Aleutian Islands area is the primary summer prey for sea lions in the area. As the sea lion population is continuing to decline, the Council should consider sea lion concerns when setting a TAC for Atka mackerel for the Gulf of Alaska and Aleutian Islands.
Fmally, the Plan Teams noted that a variety of near shore and pelagic areas have been identified as important foraging habitat for a variety of marine mammal and seabird species. Three of these are of particular concern-SteUer sea lions (threatened under the ESA), red-legged kittiwakes (a candidate species for threatened status), and northern fur seals (depleted under the MMP A). As the Council considers the BSAI pollock allocation this year, concerns for the health of the populations of these and other species' for.:tging habitats should also be considered.
Species listed under the ESA - There is a listing of the species that are designated as threatened or endangered under the ESA in a later section oftrus report. In addition to listing species under the ESA, the critical habitat of a species must be designated concurrent with its listing to the "maximum extent prudent and determinable." In compliance with this requirement of the ESA, NMFS has designated critical habitats for the SteUer sea lion on August 27, 1993. These critical habitats include all rookeries, major haul-outs, and specific aquatic foraging habitats of the BSAI and GOA. The designation of these critical habitats continues for the 1996 fishing year.
Federal agencies are also required to initiate Section 7 (ESA) consultations with NMFS or USFWS for their actions (e.g., FMPs, regulatory measures, annual specifications of T ACs) and make a determination as to whether the action mayor may not affect endangered or threatened species. There were two such consultations made with the USFWS dated 3 July 1989 and 7 February 1995. The biological opinions of these consultations concluded that the groundfish fisheries of the BSAI and GOA would not jeopardize the existence of the endangered and threatened species of seabirds under the ESA.
NMFS requested an increase in the legal take of short-tailed albatross from two birds per year to four birds after twO birds were taken in the Bering Sea sablefish fixed gear fishery in 1995. Fishery interactions between killer whales and short-tailed albatross prompted the Council to approve a regulatory amendment to allow the use of pot Ionglines ill the Bering Sea sabIefish fishery in the 1996 IFQ fishery.
PBR's under the MMPA - The 1994 reauthorization of the MMPA provided for a long-term regime for managing marine mammal takes in commercial fisheries, replacing the Interim Exemption Program that had provided a general exemption on the MMP A take prohibition since 1988 for Alaska's groundfish fisheries. The cornerstone of the new regime is the calculation of Potential Biological Removals (PBRs) for each marine mammal stock. A list of the PBRs for all the marine mammal stocks off Alaska is contained in Table 5. The PBRs, the level of human caused mortality, and the overall status of the marine mammal stock are to be used to prioritize management of marine mammal/fisheries interactions.
i :
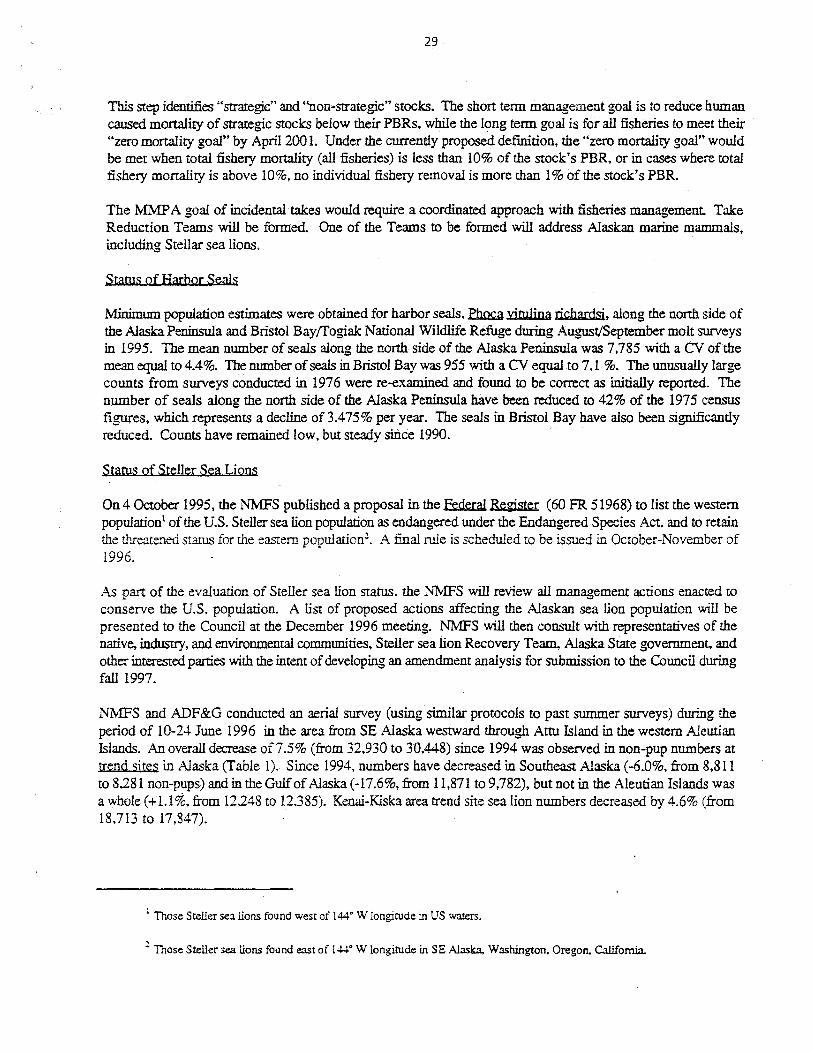
29
This step identifies "strategic" and "non-strategic" stocks. The short tenn management goal is to reduce human caused mortality of strategic stocks below their PBRs, while the long tenn goal is for all fisheries to meet their . "zero mortality goal" by April 200 1. Under the currently proposed definition, the "zero mortality goal" would be met when total fishery mortality (all fisheries) is less than 10% of the stock's PBR, or in cases where total fishery mortality is above 10%, no individual fishery removal is more than 1 % of the stock's PBR.
The MMP A goal of incidental takes would require a coordinated approach with fisheries management Take Reduction Teams will be fonned. One of the Teams to be fonned will address Alaskan marine mammals, including Stellar sea lions.
Status of Harbor Seals
Minimum population estimates were obtained for harbor seals, ~ vitulina richardsi, along the north side of the Alaska Peninsula and Bristol Bay/fogiak National Wildlife Refuge during August/September molt surveys in 1995. The mean number of seals along the north side of the Alaska Peninsula was 7,785 with a CV of the mean equal to 4.4%. The number of seals in Bristol Bay was 955 with a CV equal to 7.1 %. The unusually large counts from surveys conducted in 1976 were re-examined and found to be correct as initially reported. The number of seals along the north side of the Alaska Peninsula have been reduced to 42% of the 1975 census figures, which represents a decline of 3.475% per year. The seals in Bristol Bay have also been significantly reduced. Counts have remained low, but steady since 1990.
Status of SteUer Sea Lions
On 4 October 1995, the NMFS published a proposal in the Federal Re~ster (60 FR 51968) to list the western populationl of the U.S. Steller sea lion population as endangered under the Endangered Species Act, and to retain the threatened status far the eastern papulatian2
• A final rule is scheduled to be issued in October-November of 1996.
As part of the evaluation of Steller sea lion status, the NMFS will review all management actions enacted to conserve the U.S. population. A list of proposed actions affecting the Alaskan sea lion population will be presented to the Council at the December 1996 meeting. NMFS will then consult with representatives of the native, industry, and environmental communities, Steller sea lion Recovery Team, Alaska State government, and other interested parties with the intent of developing an amendment analysis for submission to the Council during fall 1997.
NMFS and ADF&G conducted an aerial survey (using similar protocols to past summer surveys) during the period of 10-24 June 1996 in the area from SE Alaska westward through Attu Island in the western Aleutian Islands. An overall decrease af7.5% (from 32,930 to 30,448) since 1994 was observed in non-pup numbers at trend sites in Alaska (Table 1). Since 1994, numbers have decreased in Southeast Alaska (-6.0%, from 8,811 to 8,281 non-pups) and in the Gulf of Alaska (-17.6%, from 11,871 to 9,782), but not in the Aleutian Islands was a whole (+1.1 %, from 12,248 to 12,385). Kenai-Kiska area trend site sea lion numbers decreased by 4.6% (from 18,713 to 17,847).
1 Those Steller sea lions found west of 144° W longitude in US waters.
2 Those Steller sea lions found east of 144' W longitude in SE Alaska. Washington, Oregon, California.
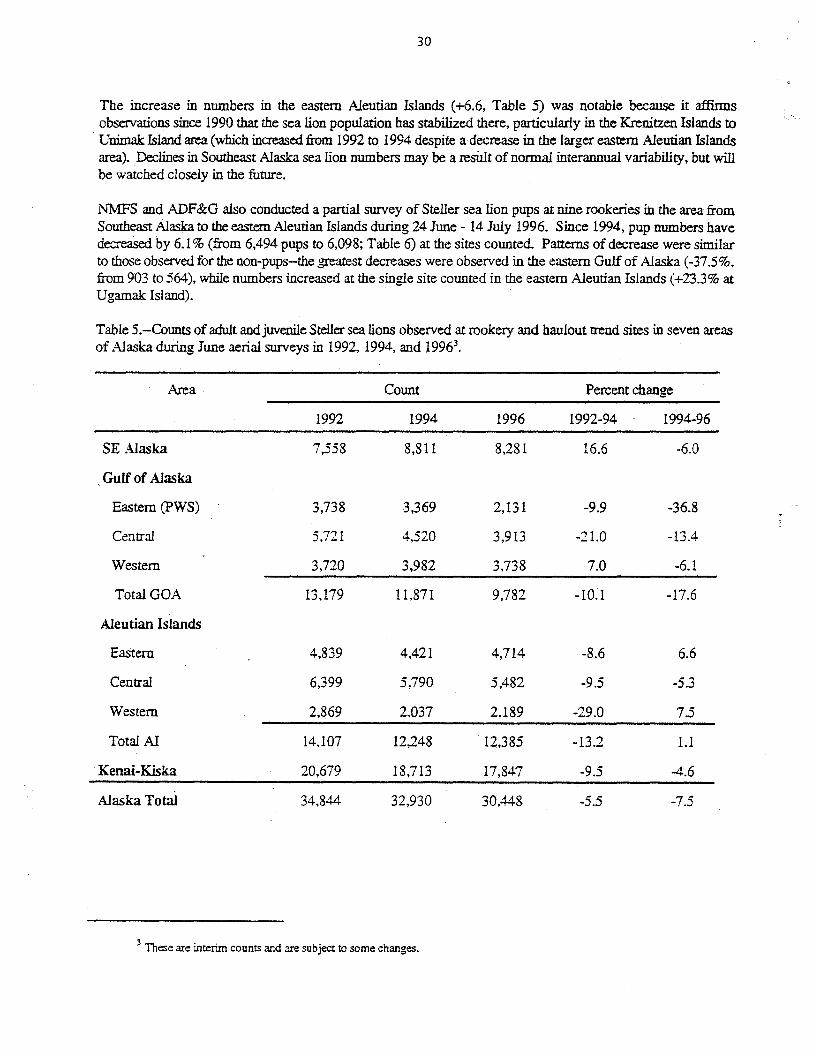
30
The increase in numbers in the eastern Aleutian Islands (+6.6, Table 5) was notable because it affinns observations since 1990 that the sea lion population has stabilized there, particularly in the Krenitzen Islands to Unimak: Island area (which increased from 1992 to 1994 despite a decrease in the larger eastern Aleutian Islands area). Declines in Southeast Alaska sea lion numbers may be a resUlt of normal interannual variability, but will be watched closely in the future.
NMFS and ADF&G also conducted a partial survey of Steller sea lion pups at nine rookeries in the area from Southeast Alaska to the eastern Aleutian Islands during 24 June - 14 July 1996. Since 1994, pup numbers have decreased by 6.1 % (from 6,494 pups to 6,098; Table 6) at the sites counted. Patterns of decrease were similar to those observed for the non-pups-the greatest decreases were observed in the eastern Gulf of Alaska (-37.5 %, from 903 to 564), while numbers increased at the single site counted in the eastern Aleutian Islands (+23.3% at Ugamak Island).
Table 5.-Counts of adult andjuvenile Steller sea lions observed at rookery and haulout trend sites in seven areas of Alaska during June aerial surveys in 1992, 1994, and 19963•
Area
SE Alaska
Gulf of Alaska
Eastern (PWS)
Central
Western
Total GOA
Aleutian Islands
Eastern
Central
Western
Total AI
Kenai-Kiska
Alaska Total
1992
7,558
3,738
5,721
3,720
13,179
4,839
6,399
2,869
14.107
20,679
34,844
Count
1994
8,811
3,369
4,520
3,982
11,871
4,421
5,790
2,037
12,248
18,713
32,930
3 These are interim counts and are subject to some changes.
Percent change
1996 1992-94 1994-96
8,281 16.6 -6.0
2,131 -9.9 -36.8
3,913 -21.0 -13.4
3,738 7.0 -6.1
9,782 -10.1 -17.6
4,714 -8.6 6.6
5,482 -9.5 -5.3
2,189 -29.0 7.5
12,385 -13.2 1.1
17,847 -9.5 -4.6
30,448 -5.5 -7.5

31
Table 6.-Counts of live Steller sea lion pups observed at rookeries in Alaska during June-July 1994 and 1996.
Count of live pups Rookery
1994 I 1996 Percent change
SE AJaska
Forrester Complex 2,757 2,764 0.3%
Hazy Island 862 768 -10.9%
White Sisters 151 182 20.5%
Eastern GOA
Seal Rocks 598 332 -44.5%
Fish Island 305 232 -23.9%
Central GOA
Outer 1. 119 114 -4.2%
Marmot!. 804 632 -21.4%
Western GOA
Atkins I. 324 366 13.0%
Eastern Aleutian I.
Ugamak !. 574 708 23.3%
Total 6,494 6,098 -6.1%
Status of Seabirds
Seabirds have been studied in the Bering Sea and Gulf of Alaska since 1976. The location, species composition, and approximate size of breeding colonies are stored in a database at USFWS in Anchorage (Figure 2), There are approximately 22 million breeding seabirds at 470 colonies in the BS/AI and 6-7 million at 1,000 colonies in the GOA (see attached map). In addition, up to 50 million sheaIWaters (Puffinus spp.) and 3 albatross species Diomedia spp.) feed in AJaskan waters, but breed elsewhere.
Population trends and productivity are monitored every 1 to 3 years at approximately 6 colonies in each area The species monitored are common and thick-billed murres, CUria ~ and Il.1um.Yia) red-legged and black-legged kittiwake!E.i.ssil breyjrostris and R. tridactyla), northern fulmar, (Fulrnams glacialis), tufted puffin, fork-tailed and Leach's storm-petrel (Oceanodroma ~ and .Q.leucorrhorhoa), and red-faced and pelagic cormorant CPhalacrncorax D and f.. penicillarus). Declines in kittiwake and murre populations have been recorded in the PribilofIslands and St Matthew Island. Kittiwake nesting success there has been low over the past 15 years, in
32
association with inadequate food resources. The red-legged kittiwake, whose principal breeding colony in the world is on St. George Island, has been reduced by 50% since 1976. This species has been proposed for listing as threatened. In contrast. monitored populations in the AI area generally have been stable or have increased. .
Declines have been documented for common murres throughout most of the Gulf of Alaska (the Semidi Islands excepted). Declines equaled or exceeded those found in areas affected by the Exxon Valdez oil spill. Declines at specific colonies ranged from 39% to 96% since 1989 (piatt and Anderson, in press). They also note large (>50%) declines in the GOA in either breeding success or adult populations for black-legged kittiwakes, marbled and Kittlitz's murrelets, cormorants, and horned puffins.
SUIVeys of populations on the water have been done in one area, Prince William Sound (PWS) in the early 1970's and since the Exxon Valdez oil spill. Species of particular concern there, due to population declines that probably began before the oil spill, are the marbled and Kittlitz' s murrelet CBrachyrampbus marrooratus and B. breyirostris) and pigeon guillemot CCe,pphus columba'>. The cooperative APEX project is examining bird/forage fish relationships in PWS.
The short-tailed albatross is endangered. Its breeding population (in Japan) is less than 400 birds. Four shorttailed albatross are known to have been caught in long-line gear since 1983, 2 of them in 1995. The observed incidental take is limited to 1 bird; consultation with NMFS was re-opened in 1995. USFWS plans to do simulation modeling of the short-tailed albatross population in order to evaluate the effect of incidental take.
The principal seabird species taken incidentally in groundfish gear include murres and shearwaters in trawls and northern fulmars and albatrosses on long lines. Take of species other than the short-tailed albatross is currently considered to be lower than levels that would concern biologists. Caveats include: (1) data have so far been provided to USFWS only for 1993, (2) driftnet fisheries are not being monitored.
There potentially is indirect competition between groundfish fisheries and seabirds. Seabirds eat small fish and large pelagic invertebrates. Seabird prey on schooling fish up to 15 em in length. Kittiwakes and northern fulmars take fish at the surface; murres, cormorants, and puffins dive and pursue fish underwater. Although seabirds take fish opportunistically, and most species also consume invertebrates. they rely on forage fish when rearing their young. The birds require dense schools within for~oing range of the breeding colony (foraging range is 3 to 100 km, depending on species). For kittiwakes and fuimars, the schools also must be at the surface. In most pacts of the North Pacific, at a given place and time, only a single suitable species of forage fish usually is available. Age 0 and 1 poUock are a major prey of seabirds. However, years of good breeding success, especially for kittiwakes, usually depend on aVailability of sand lance or capeIin, which have a higher energy content and form dense schools near shore.

F 2 Alaska Seabird Colony Catalog Igurc us Fish & Wildlife Service
BREEDING POPULATION
• 62,500 CHUKCHI. SEA BEAUFORT SEA
• 125,000
• 250,000
• 500,000
• 1,000,000 ST LAWRENCE •
ISLAND
II w w
2,000,000 - 3,548,130 I • ~~ ., * ESTIMATE UNAVAILABLE BERING SEA
PRIBILOF ISlANDS
GULF OF ALASKA
\. L~' .• I " __
ALEUTIAN ISLANDS Km I
MAP DATE··22 AUG 1998 o 200 400 600 800