stock assessment of cod in the southern gulf of st ... assessment of cod in the southern gulf of st....
TRANSCRIPT

Stock assessment of cod in the southern Gulf of St. Lawrence: Science response to issues raised by members of the fishing industry, October 2008
D.P. Swain, H.P. Benoît, G.A. Chouinard, T.R. Hurlbut, R. Morin,
L. Savoie and T. Surette
Fisheries and Oceans Canada Science Branch, Gulf Region 343 avenue université, P.O. Box 5030 Moncton, NB E1C 9B6
2012
Canadian Manuscript Report of Fisheries and Aquatic Sciences 2992
Candian Manuscript Report of Fisheries and Aquatic Science 2992
2012
STOCK ASSESSMENT OF COD IN THE SOUTHERN GULF OF ST. LAWRENCE: SCIENCE RESPONSE TO ISSUES RAISED BY MEMBERS OF THE FISHING INDUSTRY,
OCTOBER 2008
by
D.P. Swain, H.P. Benoît, G.A. Chouinard, T.R. Hurlbut, R. Morin, L. Savoie and T. Surette
Fisheries and Oceans Canada Science Branch, Gulf Region
343 avenue université, P.O. Box 5030 Moncton, NB E1C 9B6

ii
© Her Majesty the Queen in Right of Canada, 2012.
Cat. No. Fs 97-4/2992E ISSN 0706-6473
Correct citation for this publication:
Swain, D.P., Benoît, H.P., Chouinard, G.A., Hurlbut, T.R., Morin, R., Savoie, L. and Surette, T. 2012. Stock assessment of cod in the southern Gulf of St. Lawrence: Science response to issues raised by members of the fishing industry, October 2008. Can. Manuscr. Rep. Fish. Aquat. Sci. no. 2992: iv + 73p.

ii
TABLE OF CONTENTS
ABSTRACT ...................................................................................................................................iii
RÉSUMÉ........................................................................................................................................ iv
1.0 INTRODUCTION..................................................................................................................... 1
2.0 Background Information ........................................................................................................... 2
2.1 How the southern Gulf cod stock is assessed................................................................ 2
2.2 Indices of relative abundance........................................................................................ 2
2.3 Scientific surveys compared with commercial fisheries ............................................... 3
3.0 September RV Survey of the Southern Gulf ............................................................................. 3
3.1 Standardized fishing procedures and gear..................................................................... 3
3.2 Comparative fishing experiments.................................................................................. 4
3.3 Trawl mensuration......................................................................................................... 5
3.4 Survey coverage and timing.......................................................................................... 5
3.5 Comparison with the August sentinel trawl survey ...................................................... 6
3.6 Reliability of cod abundance indices from the September RV survey ......................... 7
3.7 Conclusions ................................................................................................................... 8
4.0 SCIENCE RESPONSE TO SPECIFIC ISSUES RAISED BY CERTAIN MEMBERS OF THE FISHING INDUSTRY ......................................................................................... 9
4.1 Methodological differences observed between DFO regions ....................................... 9
4.2 Disputed elements ....................................................................................................... 16
5.0 ACKNOWLEDGEMENTS .................................................................................................... 36
6.0 REFERENCES........................................................................................................................ 37
7.0 FIGURES ................................................................................................................................ 39
ANNEX 1. ..................................................................................................................................... 57

iii
ABSTRACT
In October 2008, certain members of the fishing industry tabled a report criticising the DFO Science program used to assess the status of the southern Gulf of St. Lawrence cod stock. The industry report focussed on perceived methodological differences between the stock assessments of cod in the southern and northern Gulf. The main criticisms raised by industry were related to the trawl used in the annual research vessel (RV) survey of the southern Gulf and the design of the RV survey. This report provides general background information on stock assessment methods, an evaluation of the RV survey of the southern Gulf, and specific responses to each of the Science issues raised in the industry report. The same standard methods are used to assess the status of the cod stocks in the northern and southern Gulf. The September RV survey of the southern Gulf is conducted using internationally accepted standard scientific protocols designed to produce unbiased indices of relative abundance of fish populations. Standardized abundance indices for cod and other species are available back to 1971, adjusted as necessary for any changes in survey vessel, gear or protocol. Coverage by the survey of the habitat occupied by southern Gulf cod in summer and early fall is very good. The survey is conducted at a time of year when cod are dispersed, a condition expected to produce more precise indices with fewer “year effects”. Results of the survey are very similar to those of a sentinel survey conducted by commercial fishers using commercial fishing vessels and a modern commercial groundfish trawl. The survey produces very reliable indices of relative abundance for cod, based on its exceptional ability to track year-classes of cod. Other criticisms raised in the industry report (e.g., related to the Sentinel program and the end-of-season telephone questionnaire) are also addressed.

iv
RÉSUMÉ
En octobre 2008, un rapport provenant de certains membres de l’industrie de la pêche fut soumis au Ministère des Pêches et Océans, critiquant son programme scientifique pour l’évaluation du stock de morue du sud du Golfe du Saint Laurent. Le rapport de l’industrie était focalisé sur des différences méthodologiques perçues par l’industrie entre les évaluations pour les stocks de morue du sud et du nord du Golfe. Les critiques principales soulevées par l’industrie étaient reliées au chalut employé dans le cadre du relevé annuel par navire de recherche (NR) dans le sud du Golfe, ainsi que l’approche méthodologique employée. Le présent rapport fourni une description des méthodes d’analyse pour l’évaluation de stock, une évaluation du relevé par NR du sud du Golfe, ainsi que des réponses détaillées pour chaque préoccupation soulevée par l’industrie dans leur rapport. Des méthodes identiques sont employées dans le cadre des évaluations des stocks de morue du sud et nord du Golfe. Le relevé de septembre par NR du sud du Golfe suit des normes internationales visant à produire des indices non-biaisés d’abondance relative des populations de poissons. Des indices d’abondance standardisés, débutant en 1971, sont disponibles pour la morue ainsi que plusieurs autres espèces de poissons. Ces indices sont ajustés au besoin afin de corriger des effets reliés aux changements de navire, engin de pêche ou protocole de pêche. Le relevé couvre très bien l’habitat occupé par la morue du sud du Golfe en été et en début d’automne. Le relevé à lieu à un temps de l’année durant lequel la morue a une répartition spatiale répandue, ce qui est propice à générer des indices d’abondance plus précis et pour lesquels il y a moins souvent « d’effets année ». Le relevé par NS produit des résultats très similaires à ceux obtenus dans le cadre d’un relevé sentinelle entrepris par des pêcheurs commerciaux employant des navires et un chalut utilisés dans la pêche commerciale. Le relevé par NR génère de très fiables indices d’abondance relative pour la morue, étant donné le fait que ce relevé suit de manière exceptionnelle les cohortes (classes d’âge) de morue. D’autres préoccupations soulevées dans le rapport de l’industrie sont aussi adressées dans le présent rapport, par exemple des critiques reliées au programme sentinelle et à un sondage par téléphone de fin de saison.

1
1.0 INTRODUCTION
Like most other cod stocks in the Northwest Atlantic, the cod stock in the southern Gulf of St. Lawrence collapsed in the late 1980s and early 1990s. Twenty years later, this stock shows no signs of recovery. Recent assessments of this stock indicate that spawning stock biomass is well below the limit reference point, the level at which the stock is considered to have suffered serious harm to its productivity (e.g., Chouinard et al. 2008, DFO 2008). At its current low level of productivity, this population is no longer viable and is expected to continue to decline even in the absence of fishing (Swain and Chouinard 2008). Following the collapse of this stock in the early 1990s, some members of the fishing industry questioned the reliability of the science advice. The concerns of fishermen focused on the reliability of the annual research vessel (RV) survey of the southern Gulf. One element of the Department of Fisheries and Oceans (DFO) response to those concerns was to host a workshop between industry and science on the September RV survey of the southern Gulf. The workshop, held in 1999, was chaired by Dr. Jeffrey Hutchings, Department of Biology, Dalhousie University, Halifax, NS. The report of this workshop is included here as Annex 1. In his recommendations, the Chair noted that the strengths of the survey include: (1) high precision, (2) an “impressive” ability to track strong and weak year-classes, (3) the survey has exceedingly good coverage of the southern Gulf, notably for cod and plaice, (4) the survey is conducted at a time of year when groundfish are most widely distributed (i.e., not aggregated), and (5) the time series of standardized catch rates for groundfish extends back to 1971. The Chair also noted that any decision to change the survey gear should not be taken lightly because any significant change in survey gear or procedures increases the uncertainty associated with comparisons of catch rates between newer and older surveys. Regarding suggestions to change the survey gear to the Campelen trawl (because of its increased ability to catch small juvenile groundfish), the Chair noted that the “present DFO survey” is already able to reliably track year-classes of cod and plaice as early as age 2. The Chair recommended that the September RV survey be continued “as currently conducted by the DFO”. In recent years, certain members of the fishing industry have again questioned the Science advice on southern Gulf cod. These fishermen disagree with the sampling methods used by the DFO and argue that the southern Gulf cod stock is in better condition than indicated by the scientific advice. In response, DFO organized a second Industry – Science workshop, held from October 14-15, 2008, to discuss the concerns of some industry members regarding the methods used to assess the status of the southern Gulf cod stock (DFO 2009). In this report, we present: (1) background information on the goals and methods used in stock assessment and how these differ from the goals and methods used in a commercial fishery, (2) an evaluation of the September RV survey of the southern Gulf, with an emphasis on its abundance indices for cod, and (3) specific responses to each of the science issues raised by certain members of the fishing industry (DFO 2009, Annex 8).

2.0 BACKGROUND INFORMATION
2.1 How the southern Gulf cod stock is assessed
The southern Gulf cod stock is assessed using a population modeling method known as Sequential Population Analysis (SPA). This is a standard method used around the world to conduct age-structured stock assessments of fish populations. The approach is essentially an accounting exercise following cohorts or year-classes of fish. The fish in a year-class at the beginning of a year can be divided into three groups: 1) fish that will be caught in the fishery, 2) fish that will die of natural causes, and 3) fish that will survive to the next year. Catches are monitored and sampled to obtain estimates of the fish caught each year for each year-class. The number of fish that die of natural causes can be calculated using an estimate of the natural mortality rate. Given an estimate of the number of surviving fish left in the water at the beginning of the most recent year, these numbers can be added up following year-classes backwards in time, to obtain estimates of the abundance at each age in each year (Fig. 1). To obtain estimates of the number of survivors at each age left in the water in the most recent year, the SPA is “calibrated”. This involves finding the estimates of survivors at age that result in the best match between the time trends in abundance indices (e.g., survey catch rates) and estimated population abundance at age. Calibration of SPA does not require indices of absolute abundance. Instead, it uses indices of relative abundance, comparing changes in abundance indices and changes in estimated population abundance. For example, if the abundance index for 5-year-old cod doubled between year 1 and year 2, calibration would look for survivor estimates that resulted in a doubling of the abundance of 5-year-old cod between years 1 and 2.
2.2 Indices of relative abundance
The annual RV survey of the southern Gulf provides abundance indices for cod and a number of other species (Benoît et. al. 2003; Benoît and Swain 2008). Various sentinel survey programs provide additional indices (Poirier and Currie 2007; Chouinard et al. 2008). As described above, survey catch rates are used as indices of relative abundance. The purpose of relative indices is not to estimate total or absolute abundance. Instead, the purpose is to track changes in abundance. To achieve this purpose, the fishing gear and methods used in surveys do not need to be the most efficient possible. Instead, the same standardized gear and methods need to be used each year. Consider the following example: Suppose two different gears are available. Gear 1 is five times as efficient as gear 2. Suppose a survey was conducted in two years using gear 1, and catch rates were 100 fish/tow in year 1 and 50 fish/tow in year 2. The conclusion would be that abundance in year 1 was twice that in year 2. Suppose that gear 2 was used instead, resulting in catch rates of 20 fish/tow in year 1 and 10 fish/tow in year 2. The conclusion would be the same, i.e. that abundance in year 1 was twice that in year 2. Both surveys would result in exactly the same estimates of population abundance using SPA despite
2
having different fishing efficiencies.
2.3 Scientific surveys compared with commercial fisheries
The goals of scientific surveys and commercial fisheries are very different, resulting in different fishing strategies and methods. The goal of a commercial fishery is to maximize catch rates and minimize expenses (in order to maximize profits) (Hilborn and Walters 1992). Thus, commercial fishing operations generally incorporate technological improvements (e.g., more efficient gears) as they become available. Commercial fish harvesters also attempt to target fish aggregations. For this reason, fishery catch rates can remain high even at low stock abundance. An example is the winter trawl fishery on northern cod, in which catch rates remained very high (even increasing) as the stock collapsed (Rose and Kulka 1999). The goal of a scientific survey is to obtain representative samples of fish populations and to track changes in relative abundance. In order to achieve these goals, surveys need to fish in a consistent manner over time, using standardized procedures and gear. In order to obtain unbiased estimates of relative abundance, surveys also need to select fishing locations at random with respect to fish distributions, sampling in areas where fish are rare as well as areas where they are abundant (see example in Fig. 2; Hilborn and Walters 1992).
3.0 SEPTEMBER RV SURVEY OF THE SOUTHERN GULF A bottom-trawl survey of the southern Gulf has been conducted each September since 1971. The survey follows a stratified random design, with stratification based on depth and geographic area (Fig. 3). This means that the survey area is divided into regions or “strata”, and fishing locations are selected at random within each stratum. The same 24 strata have been fished since 1971, with 3 additional inshore strata added in 1984. To maintain consistency over the entire time series, abundance indices for cod are based only on the 24 strata fished since 1971 (though abundance trends are similar including the additional inshore strata; Fig. 4).
3.1 Standardized fishing procedures and gear
The survey uses the same standardized fishing procedures and gear each year. The target fishing procedure is a 30-minute tow at a speed of 3.5 knots. Two different gears have been used in the 41-year history of the survey; the Yankee 36 otter trawl from 1971 to 1985 and the Western IIA otter trawl from 1985 to the present. Both of these gears were commercially successful groundfish trawls that were in use in the 1960s and 1970s (Carrothers 1988). The Western IIA trawl is also currently used in RV surveys of the Scotian Shelf, Bay of Fundy and Georges Bank, and in groundfish surveys conducted by the Pacific Region of DFO.
3

Although the goal is to use the same vessel each year, it has occasionally been necessary to change research vessels. The following vessels have been used over the history of this survey: the E.E. Prince (1971-1985), the Lady Hammond (1985-1991), the Alfred Needler (1992-2002, 2004 and 2005), the Wilfred Templeman (2003), and the Teleost (2004 to present). With the exception of the unplanned change to the Wilfred Templeman for the 2003 survey, each time the vessel or gear changed, comparative fishing experiments were conducted to calibrate the fishing efficiency of the new vessel and/or gear to that of the old vessel and/or gear. Because the change to the Wilfred Templeman was not calibrated (and because survey coverage was incomplete in 2003), the 2003 survey results are not included in the cod abundance indices used to calibrate the SPA. In addition to the change in gear and vessel in 1985, there was a change in fishing procedure from day-only (0700-1900) fishing before 1985 to fishing 24-hr per day since 1985. Effects of this change in fishing procedure were examined using: (1) statistical models controlling for spatial variation (stratum effects) and time of day and (2) a comparative fishing experiment in which the same sites were fished in day and night (Benoît and Swain 2003a). Based on the results of these analyses, corrections for diel differences in catchability are applied when necessary when analyzing the RV survey data (Benoît and Swain 2003b). No diel differences were found for cod.
3.2 Comparative fishing experiments
Comparative fishing experiments were conducted between the E.E.Prince using a Yankee 36 trawl and the Lady Hammond using a Western IIA trawl in September 1985, between the Lady Hammond and the Alfred Needler (both using a Western IIA trawl) in August 1992, and between the Alfred Needler and the Teleost (both using a Western IIA trawl) in September 2004 and 2005. Experiments consisted of paired tows with the two vessels fishing side-by-side at the same sites and same times. In each experiment, these paired tows were conducted throughout the southern Gulf over a broad range of depths (Fig. 5). Cod were caught in 56 of the tow pairs in the 1985 experiment, in 62 of the tow pairs in the 1992 experiment and in 82 of the tow pairs in the 2004-2005 experiment. Using the results of these comparative fishing experiments, standardized time series of relative abundance have been constructed for cod and other species, adjusting for changes in fishing efficiency as necessary to account for effects of changes in research vessel, gear or survey protocol (Nielsen 1994; Benoît and Swain 2003b; Benoît 2006). Age-aggregated, standardized time series of relative abundance and biomass of cod are shown in Figure 6. In these time series, catch rates by the E.E. Prince using a Yankee 36 trawl and by the Lady Hammond using a Western IIA trawl are adjusted to be equivalent to those by the Alfred Needler using a Western IIA trawl. Based on the comparative fishing in 2004 and 2005, it was concluded that no adjustments were required to account for the change from the Alfred Needler to the Teleost (both using a Western IIA trawl; Benoît 2006). Though comparative fishing experiments can yield calibration coefficients to address differences in fishing efficiency between vessels or fishing gear, these coefficients are
4
subject to estimation error. Consequently, even calibrated changes in vessels/gear introduce some uncertainty in time series of relative abundance. The amount of uncertainty is often proportional to the magnitude of the difference in fishing efficiency for which a correction is applied. Differences in fishing efficiency can be considerably greater when changing fishing gear compared to changing only the research vessel. For example, the recent change in vessel from the Alfred Needler to the Teleost was also accompanied by a gear change in the northern Gulf survey but not in the southern Gulf survey; the additional change to a new trawl in the northern Gulf led to larger calibration coefficients for most fish species (Benoît 2006; Bourdages et al., 2007). Because of the potential for added uncertainty, it is therefore advisable to avoid unnecessary changes in survey vessel or gear. In principle, a suitable trawl design can be used in perpetuity, but vessels eventually break down and are difficult to replace with an identical model.
3.3 Trawl mensuration
Since 1991, trawl geometry during survey tows has been monitored using Scanmar sensors. Examples of these measurements are shown in Figure 7. These measurements indicate that the survey trawl is behaving normally during survey tows. In particular, the current geometry when fishing is comparable to the nominal geometry based on measurements in the late 1970s and early 1980s. Based on these earlier measurements, the nominal wingspread for the Western IIA trawl is reported as 41 feet or 12.5 m (Hurlbut and Clay 1990). Wingspread and door spread measured during the surveys increase with depth (Fig. 7), as is normal for otter trawls. At depths between 30 and 100 m (comprising most of the southern Gulf), the mean wingspread is near the nominal value of 12.5 m.
3.4 Survey coverage and timing
The seasonal distribution of southern Gulf cod is outlined in Figure 8. Southern Gulf cod overwinter along the south slope of the Laurentian Channel in the Cabot Strait area. Cod migrate into the southern Gulf in April, spawn and then disperse throughout the Magdalen Shallows for the feeding season in summer and early fall. The cod then migrate back to the overwintering grounds in late fall. Cod are aggregated during the overwintering, migration and spawning periods but are dispersed during the feeding season, which occurs from summer to early fall. Because cod are not aggregated during the feeding season, summer and early fall are generally poor times of year to commercially fish for cod. For the same reason though, these are ideal times of year to conduct scientific surveys for cod. Because the cod are dispersed (i.e., not aggregated), surveys conducted at these times are expected to produce more reliable abundance indices, with fewer “year effects” (i.e., fluctuations related to sampling error rather than changes in abundance) and greater precision (see example in Figure 9). Coverage of cod habitat in the southern Gulf by the September RV survey includes essentially all the habitat used by cod in the southern Gulf in September, extending from
5

inshore areas with depths less than 20 m to depths of 350 m or more along the slope of the Laurentian Channel. Cod densities are generally very low at the shallowest and deepest depths sampled, indicating that few cod occur outside of the range of depths sampled (Fig. 10). While coverage of the southern Gulf by the September survey is very good, the overwintering grounds in 4Vn are not covered by this survey (Fig’s. 8 and 11). Historically, the fall migration to the overwintering grounds in 4Vn occurred well after the September survey, in November and early December. However, the fall migration has occurred earlier in recent years (Comeau et al. 2002), though there are no indications that it has occurred as early as September. The September survey was extended into 4Vn in 1994, 1995 and 2006 to verify that the bulk of the southern Gulf stock remains in the 4T area in September. Results of these surveys indicated that less than 3% of the southern Gulf stock occurred outside of the standard survey area in 4Vn in September in these years (Swain et al. 2001; Swain et al. 2007). The September survey also does not cover the portion of NAFO division 4T in the St. Lawrence estuary (Fig. 11). This area is, however, covered by the August RV survey of the northern Gulf. Cod catch rates in the August RV survey in the estuary portion of 4T are very low (nearly all 0 cod/tow, Fig. 12). Cod catch rates in the August survey in the deep waters of the Laurentian Channel outside of the southern Gulf survey area are also very low (mostly 0 cod/tow, Fig. 12). In 2008, coverage in the estuary by the August RV survey was extended to depths less than 100 fathoms (Fig. 13). Some small cod (likely age 1) were caught in the 50-100 fathom depth zone along the Quebec north shore; these fish may be associated with the northern Gulf cod stock. Some larger cod (mode 40 cm) were caught in the 50-100 fathom zone along the Gaspé coast; these fish may be associated with the southern Gulf stock. This zone along the Gaspé coast is very small relative to the 4T survey area (Fig. 13) and catch rates in it are not very high. The effect of including this zone on the index is expected to be small, and comparable to that of including or excluding strata 401 and 403 (Fig. 4). These results indicate that very few southern Gulf cod occur outside of the southern Gulf survey area in summer and early fall.
3.5 Comparison with the August sentinel trawl survey
A sentinel trawl survey of the southern Gulf has been conducted each August since 2003. This survey uses the same stratified random design as the September RV survey. A similar sentinel trawl survey of the northern Gulf is conducted in July, also using a stratified random design. Both surveys use the same gear, the Star Balloon 300, a modern commercial groundfish trawl (note: a restraining cable is used to limit wingspread in the July survey but not in the August survey). This gear was chosen in consultation with the fishing industry. The survey is conducted by commercial fishermen using commercial fishing vessels.
6

Mean catch rates are compared between the September RV survey and the August sentinel survey in Figure 14. The two surveys show similar biomass trends. Mean catch rates (kg/tow) by the Western IIA in the September survey tend to be slightly higher than those by the Star Balloon 300 in the August survey. The two surveys also indicate very similar size distributions of cod (Fig. 15). The RV survey catches more 0+ cod than the Sentinel survey, reflecting the finer mesh liner used in the RV survey. Other small differences in size composition between the two surveys are consistent with the growth of cod from August to September. The spatial distribution of cod catches is also similar between the two surveys (Fig. 16). The main difference, increased concentration of cod in the Shediac Valley and north of PEI in September, is consistent with minor seasonal movement of cod between August and September. These comparisons between the September RV survey and the August sentinel survey (conducted by commercial fishermen using commercial fishing vessels and a modern commercial fishing groundfish trawl) do not indicate any problems with the September RV survey. In particular, performance in catching cod appears to be similar between the Western IIA trawl, as fished on the September RV survey, and a modern groundfish trawl, fished by commercial fishermen on commercial fishing vessels.
3.6 Reliability of cod abundance indices from the September RV survey
The reliability of abundance indices from a survey can be assessed by examining the ability of the survey to “track” year-classes or cohorts of fish. If a year-class is estimated to be strong at one age in one year, it should be estimated to be strong at the next age in the next year. This ability to track year-classes can be measured by the correlation between survey catch rates at one age in one year and the catch rates at the next age in the next year. A correlation coefficient (R) of 1 indicates a perfect correspondence; a coefficient of 0 indicates no correspondence. For a survey with reliable abundance indices, a high positive correlation would be expected between catch rates at one age in one year and catch rates at the next age in the next year. As the difference between the ages compared increases one would expect the correlation to decrease if different year-classes experienced different mortality schedules (e.g. one year-class experienced high mortality rates and another did not). Catch rates of age-6 cod in one year are compared to catch rates of age-7 cod in the next year for the September RV survey (Fig. 17). There is a high positive correlation (R=0.9) between the two sets of data, as is expected for reliable abundance indices. Figure 18 summarizes within year-class correlations (like that in Figure 17) over a wider range of ages for time steps from 1 to 10 years. For all ages examined (2-11 years), catch rates show a strong positive correlation (R>0.7) with catch rates of the same year-class one
7

year later. As might be expected, correlations decrease as the age difference in the comparison increases. However, correlations remain strongly positive with age differences of 2 (mostly R>0.7) or 3 (mostly R>0.6) years, and significantly positive up to 8 years later. Figure 19 compares these correlations between the September RV survey and 11 other surveys (7 other RV surveys from the Northwest Atlantic, 2 sentinel surveys, and 2 sets of cod indices from the Northeast Atlantic). These comparisons indicate that the September RV survey performs considerably better than most of these other surveys in terms of ability to track year-classes. Only survey 5 shows a comparable number of strong positive correlations. The strength of the correlations in these figures will depend partly on the amount of contrast in the data. Contrast will be greater for stocks that have undergone greater fluctuations in abundance over the history of the survey. An index of the amount of contrast in the data is the maximum catch rate for a particular age divided by the minimum catch rate for that age. Based on this measure, contrast is lowest for surveys 4 and 6, partly explaining their poor performance in tracking year-classes. Likewise, contrast was highest for surveys 5 and 7, contributing to the strong performance of survey 5. Contrast in the September RV data was less than that for six of the other surveys in Figure 19 and similar to that of three of the surveys. Thus, the strong performance of the September RV survey relative to other surveys is not an artifact of unusually high contrast in its catch rates.
3.7 Conclusions
The September RV survey is conducted using standard scientific protocols designed to produce unbiased indices of relative abundance of fish populations. The survey provides a standardized time series of relative abundance indices for cod which have been adjusted, as necessary, to account for changes in survey vessel, gear or procedure. Coverage by the survey of the habitat occupied by southern Gulf cod in summer and early fall is very good. The survey is conducted at a time of year when cod are dispersed, a condition expected to produce more precise indices with fewer “year effects”. Reliable indices of relative abundance do not require that fishing efficiency be as high as possible, rather they require that fishing efficiency be standardized to the same level each year. Nonetheless, comparisons between the September RV survey and the August sentinel survey indicate that the RV survey trawl (the Western IIA) as fished by the current research vessel (the Teleost) has a fishing efficiency for cod that is similar to that of a modern commercial groundfish trawl fished by commercial fishermen using commercial fishing vessels. The survey produces very reliable indices of relative abundance for cod, based on its exceptional ability to track year-classes of cod.
8

4.0 SCIENCE RESPONSE TO SPECIFIC ISSUES RAISED BY CERTAIN MEMBERS OF THE FISHING INDUSTRY
In 2008, DFO provided funding to a group of industry members (Association des capitaines propriétaires de la Gaspésie (ACPG)) to assist them in preparing a document representing industry opinion, and specifically identifying the points of contention regarding the methodology used by Science to estimate cod stock abundance in the southern Gulf of St. Lawrence. The funding was also to assist them in their consultation of industry members who have a direct interest in the southern Gulf of St. Lawrence Atlantic cod stock. The survey of opinions and the resulting document would serve as the basis for the discussions at a meeting between the industry group and DFO Science to review the methodology used to estimate cod stock abundance and the scientific assessment of the stock in light of the criticisms presented by certain industry groups. In their report, the industry group (referred to as the Coalition; DFO 2009) structured their criticisms and concerns into eleven points summarized in Table 1 (p. 5-6) of Annex 8 of DFO (2009) and the ten themes presented in Annex 8 of DFO (2009). The following sections provide a response to the issues and recommendations raised by the Coalition. The first section addresses specifically the points raised by the Coalition regarding the differences in the assessment framework used in the southern Gulf (4T) (DFO Gulf Region) versus the northern Gulf (4RS3Pn) (DFO Quebec Region). The second section addresses the disputed elements organized into ten themes in the Coalition report, if they are deemed to be relevant science questions.
4.1 Methodological differences observed between DFO regions
The Coalition report claims that the differences in the perception of stock status of Atlantic cod between the southern Gulf stock and the northern Gulf stock are the result of a number of differences in assessment methods used. The points of contention were presented in the body of the Coalition report and summarized in a table in the said report. The following section addresses the issues raised by the Coalition and as presented in their report on this point of differences in assessment methods used by the two DFO regions (DFO 2009; Annex 8). Industry Issue
Science Response
4.1.1. “The divergence in opinions between scientists and industry regarding the assessment of the cod biomass in Division 4T is in part due to the use of different methods in the northern (3Pn, 4RS) and southern (4T) Gulf divisions. This inconsistency in the way the stock
The same stock assessment method is used in both divisions: sequential population analysis calibrated with RV and sentinel survey indices of relative abundance.
9

Industry Issue
Science Response
assessment method is applied by scientists employed by the same department (DFO) – the managers responsible for the resource – raises legitimate questions.” (DFO 2009 Annex 8, p.4). 4.1.2. “The type of trawl used by scientists to sample fish in the northern division (3Pn, 4RS) of the Gulf of St. Lawrence does not have the same performance factor as the trawl used for Division 4T in the southern Gulf of St. Lawrence. The performance gap between the trawls used in the northern Gulf and those used in the southern Gulf is so wide and produces differences in productivity that are so great that it is logically unreasonable to use this information to measure the health of fish stocks.” (DFO 2009 Annex 8, p.4).
The relative fishing efficiency of the Western IIA and Campelen trawls has not been measured. Survey catch rates are used as indices of relative abundance in the assessment, so differences in fishing efficiency do not affect the abundance estimated by SPA. Differences in productivity between the two stocks are not a result of the different survey trawls used in the two areas; instead they reflect biological differences between the two stocks. TACs were also greater for the northern Gulf stock than the southern Gulf stock in 1997 and 1999-2002, when the URI trawl was used in the northern Gulf survey. Based on comparative fishing in 1990, the URI trawl is less efficient than the Western IIA at catching commercial-sized cod (D. P. Swain, unpublished analyses). Whenever the survey trawl is changed experiments need to be conducted to estimate the calibration factors required to adjust catch rates by the old gear to be equivalent to those by the new gear. These calibration factors can be quite complicated (e.g., length-dependent) and are always estimated with uncertainty. Thus, any change in gear adds uncertainty to the time series, and the decision whether to change gear needs to be carefully considered.
4.1.3. Table 1: Methodological differences between the northern and southern Gulf assessments Issue: Trawl used for the survey
o 4RS3Pn – Campelen o 4T – Western IIa o Why use different trawls? Catches in
the northern division, where the Campelen trawl is used, have been 3 to 5 times larger.
The August survey of the northern Gulf used the URI shrimp trawl from 1990 to 2003. There were some problems associated with the use of this trawl and a decision was thus taken to change to the Campelen trawl.
10

Industry Issue
Science Response The September survey of the southern Gulf has used the Western IIA groundfish trawl since 1985. Indices of relative abundance obtained with this trawl, including the indices for cod, were considered very reliable and it was judged that there was no need to change trawls (which would add uncertainty to the time series). The Western IIA trawl also continues to be used by the Maritimes Region of DFO for surveys of the Scotian Shelf, Bay of Fundy and Georges Bank. On the Pacific Coast, DFO and the fishing industry chose the Western IIA trawl for a collaborative coastwide survey program initiated in 2003.
Survey catch rates are used as indices of relative abundance, so a change in gear does not result in a change in perceived stock status (if calibration coefficients are well estimated). The higher TACs in the northern division are not related to the survey gear. TACs were also higher for the northern Gulf stock before 2004 when the URI trawl was used in the north (Based on comparative fishing in 1990, the URI trawl is less efficient than the Western IIA at catching commercial-sized cod). Differences in TACs between the southern and northern Gulf stocks are due to differences in productivity, which are due to differences in biology between the two stocks, not the gear used to survey them.
4.1.4. Table 1: Methodological differences between the northern and southern Gulf assessments Issue: Geographic area covered by the
survey o 4RS3Pn – Covers the entire range of
the stock o 4T – Does not cover the estuary o Coverage stops at Rivière-au-
Renard, but should stop at Bic. The
As described in section 3.4 of this report, survey coverage of the habitat used by southern Gulf cod in summer and early fall is exceptionally good. The survey does not cover the estuary portion of 4T, but this area is not an important habitat for cod. The August RV survey does cover the estuary and catches very few cod there (catch rates there are almost all zero – see Figure 12). The August survey did catch some cod in
11

Industry Issue
Science Response the 50-100 fathom zone along the Gaspé coast in 2008; however, the area of this zone is very small compared to the southern Gulf survey area, and based on catch rates in the 2008 survey, the amount of cod in this zone is very small compared to that in the southern Gulf survey area.
MLI survey covers the entire estuary but Moncton DFO cannot use these data to calculate cod abundance in Division 4T because a different trawl is used. MLI data show the estuary to be a major cod recruitment area.
As noted above, MLI data indicate that there are very few cod in the estuary portion of 4T. Some recent MLI data have provided indications of cod recruitment in the 4S region north of the estuary. However, these juvenile cod are associated with the northern Gulf stock, not the southern Gulf stock. Likewise, juvenile cod caught in the estuary along the Quebec north shore in the 2008 August survey are likely associated with the northern Gulf stock. The northern Gulf survey provides abundance indices for deepwater species such as turbot and redfish, so it is important for this survey to cover these deep waters. Waters over 200 fathoms deep are not important habitat for southern Gulf cod in summer and early fall. Catch rates of cod at depths greater than 300 m in the September survey are very low, generally zero (e.g., Figure 10). Cod catch rates in the northern Gulf survey in the deep waters of the Laurentian Channel outside of the southern Gulf survey area are also very low (mostly 0 cod/tow, Figure 12).
4.1.5. Table 1: Methodological differences between the northern and southern Gulf assessments Issue: Water depth covered by the
survey o 4RS3Pn – The survey covers strata
below 200 fathoms. o 4T – Does not cover strata below
200 fathoms o Fishers have reported the presence
of cod in water over 200 fathoms deep.
A fisherman reported to us that cod appeared to move into deep water in the Laurentian Channel rather than into 4Vn late in the fall of 2006; however, this was during the migration to the overwintering ground, well after the period covered by the September survey.
12

Industry Issue
Science Response
4.1.6. Table 1: Methodological differences between the northern and southern Gulf assessments Issue: Fish fences
o 4RS3Pn –A fish fence has been set between 3Pn and 3PS
o 4T – There are no fish fences. o Why the difference?
This statement in the Industry’s report presumably refers to the line of hydroacoustic sensors temporarily set in the 3P area to detect the movement of acoustically tagged cod between 3Ps and 3Pn. The purpose of this work is not to estimate abundance or biomass of the northern Gulf stock, but rather to examine mixing with the 3Ps stock. This work addressed a concern that northern Gulf cod may be caught in fisheries for 3Ps cod. Similar work has been done in the 4Vn area to examine possible mixing between the southern Gulf stock and the resident 4Vn stock. Fishers were involved in designing the program in the southern Gulf and have been the key active participants in the program since its inception. From the beginning, industry members have participated in regular meetings to discuss the organization and status of the program and participated in a workshop to review the program in 2001 which led to some changes (DFO 2003). At-sea observers are used to ensure consistency in data collection and adherence to protocols.
4.1.7. Table 1: Methodological differences between the northern and southern Gulf assessments Issue: Sentinel fishery
o 4RS3Pn –Fishers have participated in the program since 1995. They have been trained and do the work. Their fixed gear determines where they fish.
o 4T – Fishers are involved on a contract basis. The work is done by the observers.
o Costs could be reduced by having this work done by fishers.
The fishing locations in the fixed-gear program were chosen by industry. A seasonal and annual consistency in the location of fished sites is important for calculating standardized catch rates. For the same reasons as in the RV survey, allowing fishers to target cod aggregations in the Sentinel longline projects would likely result in an index that does not track abundance.
4.1.8. Table 1: Methodological differences between the northern and southern Gulf assessments
As in any reputable opinion survey, the respondents to the annual telephone survey of groundfish harvesters in the southern
13

Industry Issue
Science Response
Issue: End-of-season survey o 4RS3Pn –Survey is administered by
fishers’ associations o 4T – Survey is administered by
Moncton DFO o Why not have the southern Gulf
fishers involved in administering the survey?
Gulf are assured that their responses are strictly confidential and will not be disclosed in any way that could identify them. This confidentiality is imperative in order to maintain the scientific integrity and impartiality of this survey. Divulging the names of the fishers contacted without obtaining their consent could contravene Canada’s Privacy Act. It is therefore necessary that the survey be conducted by people that are not directly associated with the fishing industry. Furthermore, administration of the survey by fishers’ associations would not be tractable in 4T, where there are a large number of associations as opposed to 4RS3Pn where there are only two associations. Fishers are involved in scientific work through fixed and mobile gear sentinel programs. Participation of fish harvesters in stock assessment meetings increased greatly in the 1990s and 2000s. A telephone survey was instituted in 1995 to solicit the opinion of fishers on the status of the groundfish species they fish and their perceptions concerning impacts of predators and environmental change (e.g., Hurlbut and Daigle 2000).
4.1.9. Table 1: Methodological differences between the northern and southern Gulf assessments Issue: Communications
o 4RS3Pn –Personal communications between scientists and fishers are generally good.
o 4T – There is a very strong feeling of suspicion on the part of the fishers.
o In the past, scientists conducted their work aboard fishing vessels, which helped develop ties. Today, scientists work in isolation and may never meet a fisher. DFO should adopt an institutional communication policy to enable the industry to participate in the scientific research and management process.
Throughout the late 1980s and early 1990s, DFO science staff from the Gulf Fisheries Centre held regular meetings (“Science Workshops”) with the groundfish industry from the southern Gulf to describe results from the latest RV survey and ongoing research on groundfish. Unfortunately, attendance at these meetings was highly variable and they ceased to be effective. From 1993 to 2000, two to three commercial groundfish fishermen from the southern Gulf were hired each year to assist Gulf Region Science staff on the annual (Sept.) RV survey of the southern Gulf of
14

Industry Issue
Science Response
St. Lawrence. This was done primarily to encourage collaboration and communication between DFO Science and groundfish fishermen from the southern Gulf, and to build their trust in this survey. A telephone opinion survey is conducted to obtain the view of fish harvesters on the abundance of groundfish species including cod. This survey is considered by Science to be the best approach to capture the perspective of fish harvesters. The results of this survey are reported extensively in the stock assessment research document and are described in the Science Advisory Report, including indices of cod abundance based on the opinions of fish harvesters. The list of fishers to contact for this survey is based on the list of purchase slips received from the fishery, so all fishers interviewed declared fish sales in the year of the survey.
4.1.10. Table 1: Methodological differences between the northern and southern Gulf assessments Issue: Consideration of fishers’
knowledge by scientists o 4RS3Pn –There are regular informal
discussions between individual fishers and scientists monitoring the cod stock. There is no systematic, scientific approach. The industry is drafting the section entitled Additional points of view from stakeholders to be published in Science Advisory Report (See SAR 2008/003).
o 4T – Scientists refuse to consider the knowledge held by fishers. Some of the fishers interviewed for the end-of season survey do not fish.
o An expert recruited by the Coalition will be speaking on this theme.
Each year that the telephone survey has been conducted there have been respondents who have said that they did not fish for groundfish in the year of the survey even though there were purchase slips that indicated that groundfish were sold and presumably caught by their fishing vessels. It is possible that these occurrences represent the sale of groundfish that were caught in lobster traps or other ‘non-traditional’ groundfish gear, or, that they represent cases where groundfish were caught and landed by harvesters other than the registered owners of the vessels in question (eg. a vessel owner loaned his vessel to another fisherman). Regardless, anytime that a harvester has indicated that they did not fish for groundfish in the year of the survey the interviewer has not proceeded to ask any further questions and the questionnaire is coded as “partially
15

Industry Issue
Science Response
completed”. Only the questionnaires that were “completed in full” are used in the subsequent analyses.
4.2 Disputed elements
In their report, the industry raised a number of issues that they termed ‘Disputed Elements’. These elements were organized in ten ‘Themes’. Of these themes, seven addressed, at least in part, aspects of the science involved in assessing the status of Atlantic cod in the southern Gulf. The other three themes addressed aspects that are pertinent to fisheries management (Theme 8 – cod predation management; Theme 9 – integrated research management; Theme 10 – development of selective fishing gear). In the section that follows, a response is provided only to those elements that are pertinent to the assessment science. 4.2.1 Theme I: Trawls used for the annual survey Disputed element: Western II-A trawl used by DFO for the annual cod survey in the southern gulf Industry Issue
Science Response
4.2.1-1. The fishers greatly doubt the effectiveness of the Western II-A trawl used to measure groundfish abundance in surveys conducted in the southern Gulf division. This trawl, an old design (± 1965), must normally be used with a 500-hp vessel and 1.25 X 2.50-m otter boards weighing 400 kg. In fact, the surveys are conducted by vessels 4 to 8 times more powerful, the CCGS Wilfred Templeman (2,000 hp) and the CCGS Teleost (4,000 hp). The industry believes that this trawl is undersized for the power of the vessels used by DFO and consequently, that its effectiveness is doubtful, despite the fact that monitoring devices are used. These devices provide information about certain parameters but cannot be used to confirm whether the gear
All evidence indicates that the September RV survey using the Western IIA trawl is very effective at measuring the relative abundance of cod (see section 3.0). A reliable index of relative abundance does not require the use of the most efficient gear possible; instead, it requires that fishing efficiency be standardized to the same level each year. Nonetheless, comparison with the August sentinel survey indicates that the fishing efficiency for cod of the Western IIA trawl, as fished by the Teleost, is comparable to that of a modern commercial groundfish trawl fished by commercial fishermen using commercial fishing vessels. The September survey would not be able to track year-classes of cod as effectively as it does if the “system cannot effectively
16

4.2.1 Theme I: Trawls used for the annual survey Disputed element: Western II-A trawl used by DFO for the annual cod survey in the southern gulf Industry Issue
Science Response
is properly deployed. We have had the system used for the surveys (trawl, otter boards, rigging) analysed by experienced fishers and experts in fishing techniques. All agree that this system cannot effectively measure cod abundance in the southern Gulf.
measure cod [relative] abundance”. The industry has not presented any evidence here that indicates that the September survey cannot effectively measure the relative abundance of cod.
Recommendation 1: Use trawls and vessels for the surveys that are comparable to those used by the industry.
DFO already conducts a survey of the southern Gulf using trawls and vessels comparable to those currently used by the industry (the August sentinel survey). Results of this survey are similar to those of the September RV survey.
4.2.1-2. Given the above, the industry has serious questions regarding how well modern trawl design principles are taken into account by the scientists. It seems as if scientists consider trawls to be merely tools (or simple tools) while in fact they are highly complex systems whose proper operation requires a thorough knowledge of hydrodynamics on the part of the user and those who analyse catch data.
This criticism overlooks the key point that the RV survey aims to produce a reliable index of relative abundance. A reliable relative index does not require the use of the most efficient “modern trawl” available. The Western IIA is a groundfish trawl that was successfully used in commercial fisheries in the 1970s. The exceptional ability of the survey to track year-classes of cod and the comparable results between the September RV and August sentinel surveys indicate that it is being fished effectively during the RV survey.
Recommendation 2: Scientists must be aware of and better trained in fishing techniques.
Fishing on surveys is conducted by the ship’s crew, in particular the Fishing Master and Bosun. These individuals have extensive fishing experience. The goal on a survey used to track relative abundance is to fish using the same standardized methods and gear each year. DFO scientists and ships’ crew received training on survey trawl standardization and monitoring at the Marine Institute (St. John’s) in 2007. It is
17

4.2.1 Theme I: Trawls used for the annual survey Disputed element: Western II-A trawl used by DFO for the annual cod survey in the southern gulf Industry Issue
Science Response agreed that it would be desirable to periodically update this training.
4.2.1-3. The industry observes that DFO uses a different trawl to conduct surveys in the northern Gulf division. Since the goal is to measure the abundance of the same species in two adjacent fishing divisions, why use two different trawls?
As described above (section 4.1.2 and 4.1.3), the August survey of the northern Gulf used the URI shrimp trawl from 1990 to 2003. There were some problems associated with the use of this trawl and a decision was thus taken to change to the Campelen trawl. The September survey has used the Western IIA trawl since 1985. There were no problems with the use of this trawl. Thus, no gear change was made in order to avoid the increase in uncertainty in the time series of relative abundance that results whenever a gear change is made. See section 4.1 for further details.
Recommendation 3: Use the same trawl in the northern and southern Gulf.
Changing gear adds uncertainty to the time series of relative abundance. Thus, changes should be made only if there is an important reason to do so. The Western IIA trawl currently used in the RV survey of the southern Gulf produces reliable results, and there is no plan to change gears in this survey at this time. Likewise, the Campelen trawl is producing good results in the RV survey in the northern Gulf, and there is no plan to change gears in that survey. See response to point 3 in section 4.1 for further details.
4.2.1-4. The industry has doubts about the skills of the crews on the vessels DFO uses for surveys in the southern Gulf.
The same crews conduct surveys of the northern and southern Gulf. The crew members conducting the fishing operations (e.g., Fishing Masters and Bosuns) have extensive fishing experience, including experience as commercial fishers.
18

4.2.1 Theme I: Trawls used for the annual survey Disputed element: Western II-A trawl used by DFO for the annual cod survey in the southern gulf Industry Issue
Science Response
Recommendation 4: DFO should hire highly skilled fisheries technicians to advise scientists and make sure the surveys are conducted with adapted material that is used in compliance with internationally recognized standards.
The main issue in a relative abundance survey is to standardize fishing procedures and gear. Work on maintaining survey standardization is on-going. It is agreed that it would be desirable to maintain expertise within DFO in fishing technology to ensure standardization.
4.2.1-.5 The fishers observe that DFO has lost its expertise in fishing techniques. Canada has lost considerable ground in the area of selective fishing gear research and development.
This issue is not relevant to the stock assessment of southern Gulf cod.
4.2.2. Theme II: Annual survey Disputed element: Annual survey Industry Issue
Science Response
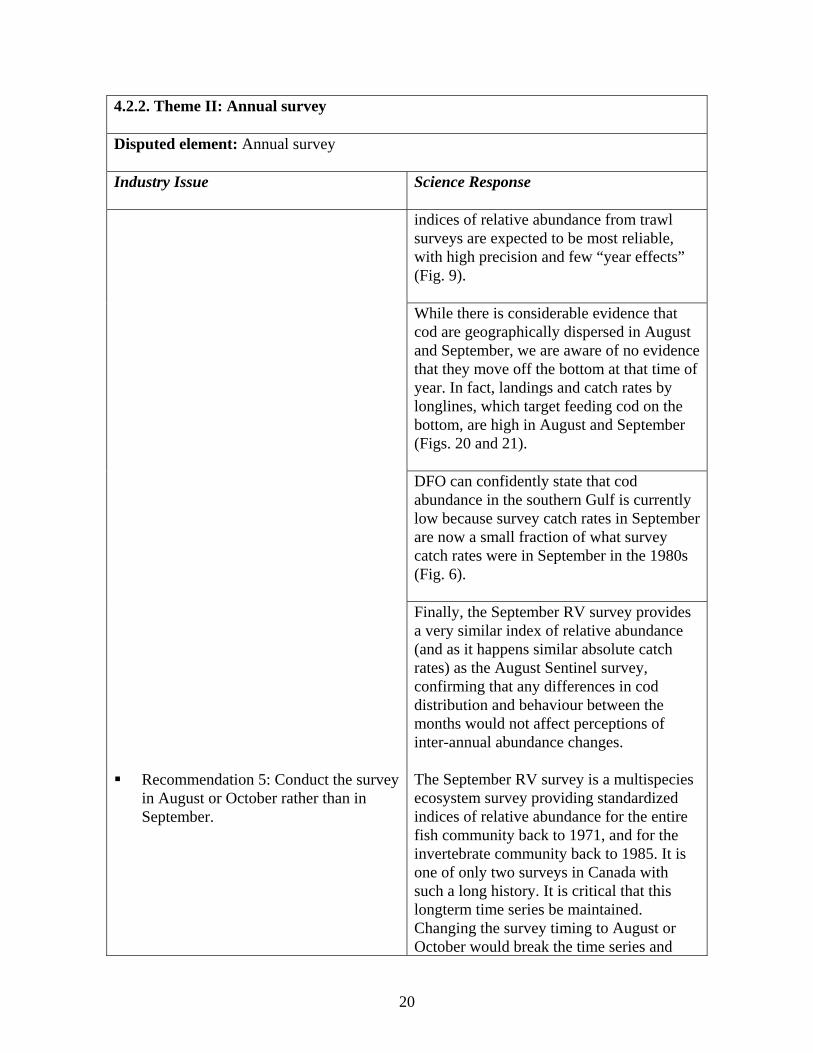
4.2.2-1 Number and timing of surveys. The annual survey is conducted in September at a time when fishers have never historically caught much cod. At that time of the year, the cod are preparing to migrate and appear to be widely dispersed in the water column. This explains why little cod is caught during the DFO survey. In contrast, historically, catches have generally been good in August and October, the months before and after the DFO survey. The industry wonders how DFO can seriously state that there is little cod in the division if the survey is conducted during the period when cod is dispersed and if, in addition, it conducts only one survey per year.
Historically, mobile gear landings and catch rates were low in summer, particularly during August and September (Figs. 20a and 21a). This is expected because cod are geographically dispersed throughout the southern Gulf during the feeding season in August and September. Thus, it is not possible for fish harvesters to target dense aggregations of cod at this time of year, so fishery catch rates tend to be low, and there is thus relatively little effort in the mobile-gear fishery and low landings for this gear sector at this time of year. For the same reason (i.e., the cod are not aggregated), this is an ideal time of year to conduct a survey. When fish are not highly aggregated,
19
4.2.2. Theme II: Annual survey Disputed element: Annual survey Industry Issue
Science Response indices of relative abundance from trawl surveys are expected to be most reliable, with high precision and few “year effects” (Fig. 9). While there is considerable evidence that cod are geographically dispersed in August and September, we are aware of no evidence that they move off the bottom at that time of year. In fact, landings and catch rates by longlines, which target feeding cod on the bottom, are high in August and September (Figs. 20 and 21). DFO can confidently state that cod abundance in the southern Gulf is currently low because survey catch rates in September are now a small fraction of what survey catch rates were in September in the 1980s (Fig. 6).
Finally, the September RV survey provides a very similar index of relative abundance (and as it happens similar absolute catch rates) as the August Sentinel survey, confirming that any differences in cod distribution and behaviour between the months would not affect perceptions of inter-annual abundance changes.
Recommendation 5: Conduct the survey in August or October rather than in September.
The September RV survey is a multispecies ecosystem survey providing standardized indices of relative abundance for the entire fish community back to 1971, and for the invertebrate community back to 1985. It is one of only two surveys in Canada with such a long history. It is critical that this longterm time series be maintained. Changing the survey timing to August or October would break the time series and
20

4.2.2. Theme II: Annual survey Disputed element: Annual survey Industry Issue
Science Response must not be done. Furthermore, there is no good reason to make this change, because September is an optimal time to conduct the survey and a second survey (Sentinel) is already conducted in August. Furthermore, in October, cod and other demersal species may be beginning their annual migrations to their overwintering grounds. Sampling the population when it is aggregated and moving is likely to result in increased sampling error and a higher frequency of ‘year effects’.
Recommendation 6: Examine historic September landings.
See Figure 20 in this report.
DFO no longer conducts a single survey per year. A second survey is now conducted in August, using commercial fishing boats operated by commercial fishermen. Results are very comparable between the August sentinel survey and the September RV survey (Figs. 14 to 16). Spring (April 15-May 30) would not be a good time of year to conduct a third survey. At this time of year, cod are migrating from their overwintering grounds in 4Vn to their spawning grounds in the southern Gulf. Because the cod are undergoing large-scale migrations, it would be difficult to sample the population reliably. The cod are also aggregated at this time of year, which would result in abundance indices with low precision and high inter-annual variability (“year effects”).
4.2.2-2. The industry believes that a single survey per year is not enough to correctly measure cod abundance. In Iceland, for example, over 300 sea days are allocated to assess cod abundance. Using large vessels instead of fishing boats is much more expensive. The industry believes this to be a waste of resources and that for the same amount, more surveys could be done using more experienced crews if fishing boats were used. The industry is asking DFO to conduct a second survey in the spring because the fishers active in this division (crabbers, shrimpers and lobster fishers) have noticed that cod is quite abundant all summer long throughout the southern Gulf.
Furthermore, the spring would not be a good time of year to conduct a synoptic survey of the southern Gulf because it would conflict
21

4.2.2. Theme II: Annual survey Disputed element: Annual survey Industry Issue
Science Response
substantially with fixed gear fisheries (e.g., snow crab and lobster).
Recommendation 7: Finance a spring survey (± April 15 to May 30) for 3 years and then review its usefulness.
A second survey has already been initiated (the August sentinel survey) and produces results very comparable to the September survey. Spring would be a poor season to survey the stock, for the reasons described above. Finally, it would not be possible to conduct a survey in May given the amount of fixed snow crab fishing gear that is in the water over much of the southern Gulf during that period.
Recommendation 8: Conduct surveys with fishing vessels rather than research vessels.
This is already done in the August sentinel survey. Results are very similar to those produced by the RV survey. A major change to the design of the RV survey (e.g., a change from using a single research vessel to using multiple fishing vessels) would compromise the integrity of this 41-year time series of standardized ecosystem monitoring and must not be done.
4.2.2-3. Current survey coverage. At present, the survey does not cover the St. Lawrence estuary (coverage stops at Rivière-au-Renard). The fishers state that there are a lot of small cod in the estuary. The survey does not cover the strata below 200 fathoms.
The August RV survey does cover the estuary and finds very few cod there (Fig. 12). The August RV survey has recently found indications of good incoming recruitment (small cod) in 4S north of the estuary, but these small cod are associated with the northern Gulf stock, not the southern Gulf stock. In 2008, the August RV survey caught some small cod in the estuary in the 50-100 fathom zone along the Quebec north shore; these fish are likely associated with the northern Gulf stock. In 2008, the August RV survey caught some larger cod in the estuary, in the 50-100 fathom zone along the Gaspé coast; these fish may be associated with the southern
22
4.2.2. Theme II: Annual survey Disputed element: Annual survey Industry Issue
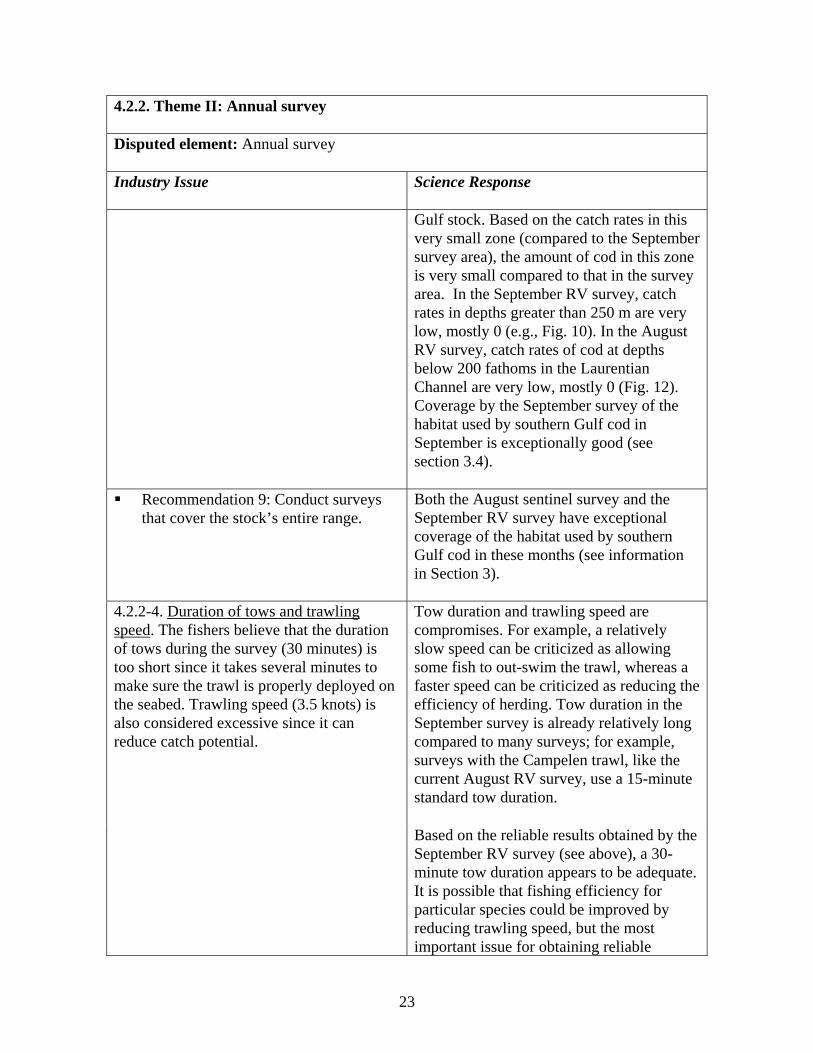
Science Response Gulf stock. Based on the catch rates in this very small zone (compared to the September survey area), the amount of cod in this zone is very small compared to that in the survey area. In the September RV survey, catch rates in depths greater than 250 m are very low, mostly 0 (e.g., Fig. 10). In the August RV survey, catch rates of cod at depths below 200 fathoms in the Laurentian Channel are very low, mostly 0 (Fig. 12). Coverage by the September survey of the habitat used by southern Gulf cod in September is exceptionally good (see section 3.4).
Recommendation 9: Conduct surveys that cover the stock’s entire range.
Both the August sentinel survey and the September RV survey have exceptional coverage of the habitat used by southern Gulf cod in these months (see information in Section 3). Tow duration and trawling speed are compromises. For example, a relatively slow speed can be criticized as allowing some fish to out-swim the trawl, whereas a faster speed can be criticized as reducing the efficiency of herding. Tow duration in the September survey is already relatively long compared to many surveys; for example, surveys with the Campelen trawl, like the current August RV survey, use a 15-minute standard tow duration.
4.2.2-4. Duration of tows and trawling speed. The fishers believe that the duration of tows during the survey (30 minutes) is too short since it takes several minutes to make sure the trawl is properly deployed on the seabed. Trawling speed (3.5 knots) is also considered excessive since it can reduce catch potential.
Based on the reliable results obtained by the September RV survey (see above), a 30-minute tow duration appears to be adequate. It is possible that fishing efficiency for particular species could be improved by reducing trawling speed, but the most important issue for obtaining reliable
23

4.2.2. Theme II: Annual survey Disputed element: Annual survey Industry Issue
Science Response
indices of relative abundance is to maintain constant fishing efficiency from year to year.
Recommendation 10: Thoroughly review the trawling procedures used for the survey.
Reliable indices of relative abundance require that the same standardized fishing efficiency be maintained each year. It is not necessary that this be the highest possible fishing efficiency. A change of gear or fishing procedures would require extensive testing using comparative fishing experiments. Without this, catch rates using the new procedures would not be comparable to catch rates from previous years, and the standardized time series would be broken. Changes in fishing efficiency associated with a change in fishing procedure such as trawling speed would likely be very complicated, e.g. species- and size-dependent. Even if the new and old fishing procedures could be calibrated, considerable uncertainty would be added to the time series because of uncertainties in the estimated calibration coefficients.
4.2.2-5. Small cod. The DFO survey cannot catch small cod. Small cod are very abundant (particularly in areas with eel grass) but are not sampled by the surveys.
The September RV survey provides reliable indices of relative abundance for cod aged 2 years and older. Thus, it provides a reliable index of recruitment for this stock a full 2-3 years before a year-class is important in the fishery. However, it is agreed that it does not sample younger cod, in particular young-of-the-year cod, well.
Recommendation 11: Set up a small cod survey focused on recruitment and ask fishers to indicate where and when small cod can be found.
The September RV survey already provides a reliable index of recruitment (at age 2) for this stock. Research on earlier life-history stages (e.g., recently settled 0+ cod) could provide useful ecological information. In
24

4.2.2. Theme II: Annual survey Disputed element: Annual survey Industry Issue
Science Response other areas (e.g., Newfoundland), research on these early stages has used methods such as beach seining. A program of research on early life history stages of southern Gulf cod would require additional resources (both operating budgets and personnel). It would not affect the assessment of stock status.
4.2.3. Theme III: Cod abundance and TAC Disputed elements: An improved reading of cod abundance, and TAC establishment Industry Issue
Science Response
4.2.3-1 The scientists underestimate cod abundance.
Indeed, closures are frequent in fishing divisions because accidental cod catches are deemed to be too large.
At times of the year when cod are aggregated, fishery catch rates in the vicinity of these aggregations can be high even though population abundance is low.
Recreational fishing is not accounted for.
An estimate of the recreational catch is included in the stock assessment. For 2007, the estimate was 3.5 t. The estimated biomass of the stock (ages 3+) at the start of 2008 was about 49,000 t. This would result in a recreational exploitation rate of 0.007% compared to a commercial exploitation rate of 4.0%.
Predation by seals is poorly understood.
Agreed, but this does not affect the estimate of stock abundance.
Crabbers are active in the division for two months per year and catch cod.
Bycatch of cod in the snow crab fishery is reported anecdotally by observers to be very low, but no statistics are recorded. Any unaccounted catch mortality would
25

4.2.3. Theme III: Cod abundance and TAC Disputed elements: An improved reading of cod abundance, and TAC establishment Industry Issue
Science Response contribute to the natural mortality estimated by the population model.
Recommendation 12: Compare 4T indices to the stocks in 3Ps, 3Pn, 4S, etc.
We are unsure what the issue is to be addressed here. The 4T RV indices are compared to those for most other Northwest Atlantic stocks (including 3Pn 4RS) in terms of their ability to track year-classes in Figure 19.
Recommendation 13: Examine the difference in catches by fixed gear and mobile gear.
The issue to address here requires clarification.
No data have been collected by observers on cod catches in the snow crab fishery, though observers report anecdotally, that these catches are very low. The cod catches on the snow crab survey have been examined in terms of their distribution. The geographic distribution of cod and other marine species is remarkably similar in most years between the snow crab survey and the September RV survey (H. Benoît, unpublished analyses). However, further use of these data is limited because length frequencies are not measured on the snow crab survey. Furthermore, the snow crab survey is not synoptic, in some years taking well over two or three months to complete, resulting in an enhanced risk of producing a biased index of abundance if fish are moving on geographic scales that are much larger than the average distance between tows.
Recommendation 14: Examine data gathered by observers on cod catches: a) by crabbers; b) during the crab survey; c) during the lobster survey.
The catches of cod in the summer survey of the Northumberland Strait (the “lobster survey”) are quite low as this survey covers
26

4.2.3. Theme III: Cod abundance and TAC Disputed elements: An improved reading of cod abundance, and TAC establishment Industry Issue
Science Response
an area that is currently not important cod habitat. Nonetheless, in that area of the survey that does catch cod (area covered by stratum 421, Fig. 3), catch rates are down markedly since 2001-2002 (M. Hanson, DFO-Moncton, personal communication).
4.2.3-5. Cod tagging. Despite its undisputed usefulness, no cod tagging is done in Division 4T.
Conventional tagging studies require a substantial fishery to recover the tagged fish. At the current exploitation rate (0.05 for cod aged 7+), very few tagged fish would be recovered. Tagging studies using acoustic tags could provide useful information on fish movements (see below).
Recommendation 15: Set up a tagging program for Division 4T cod.
A conventional tagging program would not be appropriate right now given the low level of the fishery. An acoustic tagging program could be useful if additional resources were available for this to provide information on habitat use, including migration timing, and potential interactions with other organisms such as seals in the case of two-way tags. Acoustic tagging would not be useful for estimating cod abundance or mortality rates.
4.2.3-6. Fish fences. It is generally admitted that in winter the cod are concentrated at the entrance to the Gulf in divisions 4Vn, 3Pn and 3Ps, and that they return to the Gulf around mid-April. This migration can be an opportunity to measure the stock’s abundance if fish fences are established in strategic places.
It is assumed that “fish fences” refer to lines of acoustic receivers anchored to the seabed. If such a line is deployed, acoustic tagging of cod could provide information on migration timing. However, this approach cannot be used to measure cod abundance. Estimating abundance or certain vital rates (e.g., mortality) requires information on the catch rates of both tagged and untagged fish; “fish fences” count only tagged individuals.
Recommendation 16: Install fish fences between Cape Breton and Cape Rae to
A line of hydroacoustic receivers could monitor the movement of acoustically
27

4.2.3. Theme III: Cod abundance and TAC Disputed elements: An improved reading of cod abundance, and TAC establishment Industry Issue
Science Response
count the cod that move from 4T to 4Vn.
tagged cod. However, it would not provide a count of the total number of cod or produce a measure of total cod abundance; both untagged and recaptured tagged cod need to be counted in order to use a tagging program to estimate abundance.
4.2.3-7. Total allowable catch (TAC). Although the biomass in Division 4T is larger, the TAC for this division is 5000 t lower than for 4RS3Pn. The industry must be involved in establishing TACs.
The appropriate TAC depends on productivity as well as biomass. Productivity of the 4RS3Pn stock is currently greater than that of the 4T stock. Currently, the 4T stock has no surplus production. In fact, productivity is so low that the stock cannot even maintain itself and will decline even without a fishery. The main factor in this low productivity is high M (adult natural mortality). No fishery is sustainable at the current level of productivity of the 4T stock.
Recommendation 17: DFO should reconsider its position on the TAC for 4T.
The TAC decision is not made by Science.
Recommendation 18: Revise the rules governing how TACs are established.
The TAC is not established by Science.
4.2.4. Theme IV: Sentinel Fishery Disputed elements: Sentinel fishery program. Industry Issue
Science Response
4.2.4-1. The sentinel fishery program is one of the means used by the scientists to measure, notably, cod abundance.
The program has been modified over The sentinel survey program was developed
28

4.2.4. Theme IV: Sentinel Fishery Disputed elements: Sentinel fishery program. Industry Issue
Science Response
the years and the fishers’ degree of participation in designing the program has fallen in Division 4T. At present, all the work is done by observers and fishers are not consulted when the protocol is drawn up.
in consultation with the fishing industry. For example, the fishing locations in the fixed-gear program were chosen by Industry. Fishing operations are conducted by fishers and sampling of the catch is conducted by observers. In order to maintain a consistent program, protocols do not change from year to year.
Fishermen in the southern Gulf of St. Lawrence routinely assist the observers in collecting data, either by sorting the catch by species, recording data on sheets or helping take measurements. The protocols have been discussed with the fishermen.
Tows are performed in areas where the fishers know there has never been any cod.
In the longline sentinel program, fishing sites were chosen by fishermen. The mobile sentinel program has been designed along the lines of a scientific survey. As described above, in order to obtain unbiased indices of relative abundance in trawl surveys, it is important for fishing locations to be selected at random with respect to fish distribution. If only areas of high cod density are sampled, abundance indices are likely to be biased, underestimating both increases and decreases in abundance (see Figure 2). As noted, these “free tows” were not used when calculating abundance indices for northern Gulf cod, so there is no difference between the two programs here in terms of stock assessment.
4.2.4-2. “Free tows”. In the northern division, there was a time when fishers were authorized to perform « free tows » outside the mandatory areas indicated in the protocol. It is important to mention here that the scientists did not take the “free tows” into account when calculating abundance.
Because the “free tows” presumably target concentrations of cod, mean catch rates in these tows are not expected to change in proportion to changes in stock abundance (see Figure 2). Thus, it is appropriate to not
29
4.2.4. Theme IV: Sentinel Fishery Disputed elements: Sentinel fishery program. Industry Issue
Science Response
include them when calculating the abundance indices.
30

4.2.4. Theme IV: Sentinel Fishery Disputed elements: Sentinel fishery program. Industry Issue
Science Response
4.2.4-3. Review of the sentinel program. The industry believes this program no longer meets expectations and no longer reaches its abundance measurement objectives. First of all, it must be said that active cod fishers are not consulted regarding the protocols, and their knowledge of fishing grounds, durations, suitable periods, etc. is absolutely not taken into consideration.
The fishing industry participated in the design of this program. The protocols remain the same from year to year (as is required to produce consistent indices of abundance). Nine members from the fishing industry in the southern Gulf of St. Lawrence participated in a major review of the program in 2001 (DFO 2003). Members of the fishing industry have regularly participated in smaller annual or multi-annual reviews of the program.
Recommendation 19: Thoroughly review the sentinel fishery program, replace useless tows and allow “free tows” and include the related catch when calculating abundance.
“Free tows” can no longer be allowed following the Larocque decision (federal court, Larocque v. Canada [Minister of Fisheries and Oceans], 2005). Even if they were allowed, it would not be appropriate to include them in the calculation of abundance indices, as described above. Also, as described above, it is important to sample both high and low quality habitat in order to obtain unbiased indices of relative abundance.
4.2.5. Theme V. Landing statistics Disputed elements: Use of landing statistics to assess cod stocks The issues raised in this theme are all management issues. Science does not interpret the landings as a measure of stock abundance, and recognizes that any failure to catch a quota depends on factors in addition to fish abundance, e.g., management measures, weather and economic factors.
31
4.2.6. Theme VI. End-of-season opinion survey Disputed elements: End-of-season survey Industry Issue
Science Response
4.2.6-1. Since 1997, the opinions of fishers regarding the state of the resource have been obtained through a telephone survey of active fishers.
The end-of-season opinion survey in the southern Gulf has actually been conducted since 1995 (Hurlbut 1997).
According to the scientists, this survey serves to obtain a performance index for vessels involved in the cod fishery and not an abundance index.
The telephone survey is not used to obtain a performance index for vessels. It is used instead to obtain the opinions of fishers on the abundance of various groundfish species, including cod.
We have tried in vain to obtain from DFO the list of fishers consulted in 2007 to verify certain problems reported by some associations.
Like any reputable survey, participation is confidential. Thus, it would be inappropriate to release the identity of participants. Divulging the names of the fishers contacted without obtaining their consent would contravene Canada’s Privacy Act.
It appears that some of the fishers consulted during this survey no longer fish.
As previously mentioned, the list of fishers to be contacted during this survey is based on the list of purchase slips that were received and processed by the end of the fishing season (Each purchase slip represents the sale of groundfish). Each year, the first question of the survey asks whether the respondent fished for groundfish that year. Every year that this survey has been conducted there have been respondents who have said that they did not fish for groundfish even though there were purchase slips that indicated that groundfish were sold and presumably caught by their fishing vessels (based on the registration numbers). It is possible that these occurrences represent the sale of groundfish that were caught in lobster traps or other ‘non-traditional’ groundfish gear, or, that they represent cases where groundfish were caught and landed by harvesters other than
32

4.2.6. Theme VI. End-of-season opinion survey Disputed elements: End-of-season survey Industry Issue
Science Response the registered owners of the vessels in question (e.g., a vessel owner loaned his vessel to another fisherman). Anytime that a harvester has indicated that they did not fish for groundfish in the year of the survey the interviewer has not proceeded to ask any further questions relating to groundfish. This survey follows standard survey procedures and has been reviewed by the Social Survey Methods Division of Statistics Canada (Halifax, N.S.). In accordance with Statistics Canada guidelines, respondents to the survey must be assured that their responses are strictly confidential. It would be difficult to ensure confidentiality to southern Gulf fishermen if the telephone survey was administered by people with direct links to the industry, particularly given that contrary to the northern Gulf, there are numerous fisher’s associations in the southern Gulf that each represent only small subsets of the population of fishers.
4.2.6-2. Due to the lack of transparency, the industry has serious doubts as to the effectiveness of this survey. We observe that in the northern Gulf, the survey of fixed gear cod fishers is administered by fishers’ associations (FFAW, RLNSFA) while in the southern Gulf, DFO conducts the survey. It is legitimate to wonder why southern Gulf associations have not been involved in this issue.
The telephone interviews for this survey are conducted by a contractor (not a DFO employee), from their residence. Having the interviews conducted by an independent contractor should be viewed as adding transparency to this survey. However, the only legitimate manner to fully ensure transparency would be to have the telephone survey conducted by an independent and competent third party (e.g., Statistics Canada). This would likely add considerable cost to this survey.
33

4.2.6. Theme VI. End-of-season opinion survey Disputed elements: End-of-season survey Industry Issue
Science Response
Recommendation 22: Review the survey and have the southern Gulf industry administer it.
Administration of the survey by fishers’ associations would not be tractable in 4T, where there are a large number of associations as opposed to 4RS3Pn where there are only two associations. Overall though, aside from expressing frustration at their inability to obtain the list of fishers consulted in 2007, the Industry has not articulated why they perceive a lack of transparency with respect to this survey or why they doubt its effectiveness.
4.2.7. Theme VII. Fisher local ecological knowledge Disputed elements: Consideration by scientists of fishers’ local ecological knowledge Industry Issue
Science Response
Recommendations provided by Industry can be summarized as follows:
Enhancing DFO’s involvement in social science research is perhaps a desirable goal, particularly as it relates to ensuring the vitality of fishing communities, but does not generally appear to be germane to the stock assessment process. Social science research might provide information that would help fishery scientists to better understand activities that are relevant to stock assessments (the distribution of fishing effort, the targeting of species, etc).
DFO should finance social studies research aimed at understanding fishers and fishing communities
Science staff in the Gulf Region have had collaborations with social scientists in the past. We collaborated with Dr. Anthony Davis, anthropologist at St. F-X University,
34

4.2.7. Theme VII. Fisher local ecological knowledge Disputed elements: Consideration by scientists of fishers’ local ecological knowledge Industry Issue
Science Response
on a project to develop an ecosystem model for St. George’s Bay, NS. Unfortunately, the project failed to reach its full potential when external funding ended in 2000. There are presently two main forums aimed at gathering and documenting industry views on stock status: the annual telephone questionnaire and Industry representation at the Regional Assessment Process (RAP) meetings. An additional third forum, the Gulf Groundfish Advisory Committee meeting, is held annually to solicit Industry views for incorporation in fishery management plans. There have been additional initiatives developed to include fisher knowledge in the past, such as the development of TAC decision rules for 4T cod, and some ongoing, such as the Southern Gulf of St. Lawrence Coastal and Oceans Research Network. While Industry views are documented by DFO Science, it is presently unclear how local ecological knowledge can be formally incorporated in stock assessments beyond noting the industry view of stock status.
DFO should establish mechanisms to ensure that fisher knowledge is incorporated into fishery research and management.
Considerable validation concerning the precision and accuracy of local ecological knowledge would be required before it could be used to provide independent indices of abundance. Commensurate validation of traditional research survey methods used to assess stock status has been summarized in this report and has a rich history worldwide.
35

4.2.7. Theme VII. Fisher local ecological knowledge Disputed elements: Consideration by scientists of fishers’ local ecological knowledge Industry Issue
Science Response It is recognized that fishers can provide important knowledge on fish behaviour, habitat use, stock structure and changes in fishing practices (e.g., Neis et al. 1999). Industry has contributed to research on southern Gulf cod by proposing hypotheses that later became topics of research (e.g., changes in cod migration, seal predation, etc.).
DFO science staff need training to enhance their understanding of fishing communities
DFO Science does not refute the difficulty associated with maintaining productive ties with industry and of communicating effectively. There is also a role here for association representatives to provide leadership at the community level and to foster mutual respect and a positive attitude towards communication and learning. The FRCC previously held that function with respect to groundfish, in general. They held consultations with the industry and reported directly to the minister on important issues arising from their consultations. The FRCC could renew its previous role with respect to southern Gulf cod.
5.0 ACKNOWLEDGEMENTS
We thank Hugo Bourdages, Johanne Gauthier and Alain Fréchet for providing information from the August survey of the northern Gulf of St. Lawrence and on the stock assessment program for cod in the northern Gulf. We also extend our appreciation to Gérald Chaput for his constructive and thorough review of a previous draft of this document.
36

6.0 REFERENCES
Benoît, H.P. 2006. Standardizing the southern Gulf of St. Lawrence bottom trawl survey
time series: Results of the 2004-2005 comparative fishing experiments and other recommendations for the analysis of the survey data. DFO Can. Sci. Advis. Sec. Res. Doc. 2006/008.
Benoît, H. P., Abgrall, M.-J. and Swain, D. P. 2003. An assessment of the general status of
marine and diadromous fish species in the southern Gulf of St. Lawrence based on annual bottom trawl surveys (1971-2002). Can. Tech. Rep. Fish. Aquat. Sci. 2472. 183 p.
Benoît, H. P. and Swain, D. P. 2003a. Accounting for length and depth-dependent diel
variation in catchability of fish and invertebrates in an annual bottom-trawl survey. ICES J. Mar. Sci. 60: 1297-1316.
Benoît, H. P. and Swain, D. P. 2003b. Standardizing the southern Gulf of St. Lawrence
bottom-trawl survey time series: adjusting for changes in research vessel, gear and survey protocol. Can. Tech. Rep. Fish. Aquat. Sci. 2505. 95 p.
Benoît, H.P., and Swain, D.P. 2008. Impacts of environmental change and direct and
indirect harvesting effects on the dynamics of a marine fish community. Can. J. Fish. Aquat. Sci. 65: 2088-2104.
Bourdages, H., Savard, L., Archambault, D., and Valois, S. 2007. Results from the August
2004 and 2005 comparative fishing experiments in the northern Gulf of St. lawrence between the CCGS Alfred Needler and the CCGS Teleost. Can. Tech. Rep. Fish. Aquat. Sci. 2750. XX p.
Carrothers, P .J .G. 1988. Scotia-Fundy groundfish survey trawls. Can. Tech. Rep. Fish.
Aquat. Sci. 1609. XX p. Chouinard, G. A., Savoie, L., Swain, D. P., Hurlbut, T., and Daigle, D. 2008. Assessment
of the southern Gulf of St. Lawrence cod stock, February 2008. DFO Can. Sci. Advis. Sec. Res. Doc. 2008/045.
Chouinard, G.A., and Sinclair, A.F. 1989. Assessment of the 4T and 4Vn (Jan. - Apr.) cod
stock for 1989. CAFSAC Research document; 89/51; CSCPCA Document de recherche, 89/51: 50.
Comeau, L. A., Campana, S. E., Chouinard, G. A. 2002. Timing of Atlantic cod (Gadus
morhua L.) seasonal migrations in the southern Gulf of St Lawrence: interannual variability and proximate control. ICES J. Mar. Sci. 59:333-351.
DFO. 2003. Workshop on the Groundfish Sentinel Program, November 07 – 09, 2001,
37

Moncton, N. B. DFO Can. Sci. Advis. Sec. Proceed. Ser. 2002/003. DFO. 2008. Assessment of cod in the southern Gulf of St. Lawrence. DFO Can. Sci. Advis.
Sec. Advis. Rep. 2008/004. DFO. 2009. Workshop for Industry–DFO Reconciliation on Scientific Monitoring of the
Southern Gulf of St. Lawrence Cod Stock; October 15-16, 2008. DFO Can. Sci. Advis. Sec. Proceed. Ser. 2008/025.
Hurlbut, T. 1997. Results of the 1995 End of Season Survey of Groundfish Fishers from
the Southern Gulf of St. Lawrence. Man. Rep. Fish. Aquat. Sci. No. 2434E: 35p. Hurlbut, T. and Clay, D. 1990. Protocols for research vessel cruises within the Gulf Region
(demersal fish) (1970-1987). Can. Manuscr. Rep. Fish. Aquat. Sci. 2082. XX p. Hurlbut, T., and Daigle, D. 2000. Results of the 1998 end of season survey of groundfish
harvesters from the Southern Gulf of St. Lawrence. Can. Manuscr. Rep. Fish. Aquat. Sci. 2517E. XX p.
Neis, B., Schneider, D. C., Felt, L., Haedrich, R. L., Fischer, J. and Hutchings, J. A. 1999.
Fisheries assessment: what can be learned from interviewing resource users? Can. J. Fish. Aquat. Sci. 56: 1949-1963.
Nielsen, G. A. 1994. Comparison of the fishing efficiency of research vessels used in the
sGSL groundfish surveys from 1971 to 1992. Can. Tech. Rep. Fish. Aquat. Sci. 1952. XXp.
Poirier, G. A., and Currie, L. 2007 Results from the August 2006 sentinel mobile survey of
the southern Gulf of St. Lawrence. DFO Can. Sci. Advis. Sec. Res. Doc. 2007/008. Rose, G. A., and Kulka, D. W. 1999. Hyperaggregation of fish and fisheries: how catch-
per-unit-effort increased as the northern cod (Gadus morhua) declined. Can. J. Fish. Aquat. Sci. 56(suppl. 1): 118-127.
Swain, D. P. and Chouinard, G. A. 2008. Predicted extirpation of the dominant demersal
fish in a large marine ecosystem: Atlantic cod (Gadus morhua) in the southern Gulf of St. Lawrence. Can. J. Fish. Aquat. Sci. 65:2315-2319.
Swain, D. P., Currie, L. G., Chouinard, G. A., Poirier, G. A., Savoie, L., Hurlbut, T., and
Daigle, D. 2007. Assessment of the southern Gulf of St. Lawrence cod stock, March 2007. DFO Can. Sci. Advis. Sec. Res Doc. 2007/033.
Swain, D. P., Frank, K. T., and Maillet, G. 2001. Delineating stocks of Atlantic cod (Gadus
morhua) in the Gulf of St. Lawrence and Cabot Strait areas using vertebral number. ICES J. Mar. Sci. 58: 253-269.
38
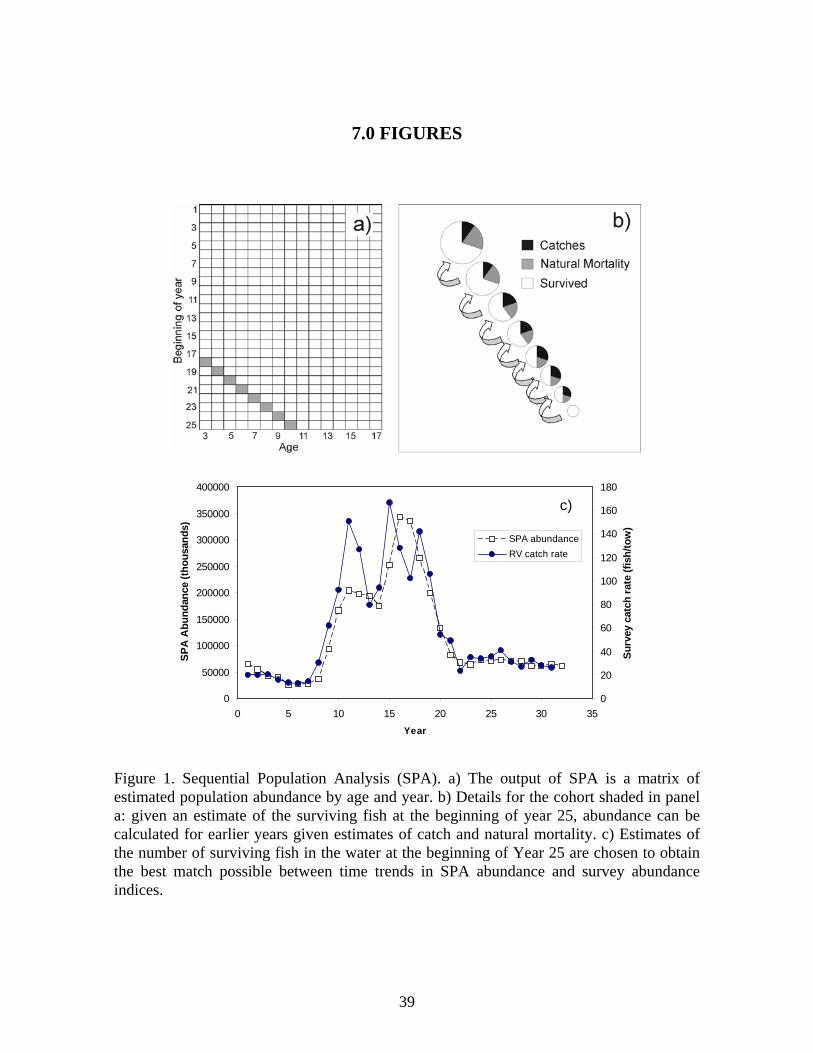
7.0 FIGURES
0
50000
100000
150000
200000
250000
300000
350000
400000
0 5 10 15 20 25 30 35
Year
SP
A A
bu
nd
ance
(th
ou
san
ds)
0
20
40
60
80
100
120
140
160
180
Su
rvey
cat
ch r
ate
(fis
h/t
ow
)
SPA abundance
RV catch rate
c)
Figure 1. Sequential Population Analysis (SPA). a) The output of SPA is a matrix of estimated population abundance by age and year. b) Details for the cohort shaded in panel a: given an estimate of the surviving fish at the beginning of year 25, abundance can be calculated for earlier years given estimates of catch and natural mortality. c) Estimates of the number of surviving fish in the water at the beginning of Year 25 are chosen to obtain the best match possible between time trends in SPA abundance and survey abundance indices.
39

1. High abundance – 20,000 fish – distribution spread out over all habitats
A. High Quality 12,000 fish 120 fish/km2
B. Medium Quality 6,000 fish 60 fish/km2
C. Low Quality 2,000 fish 20 fish/km2
• Fish in A only: average density = 120 fish/km2
• Fish (equally) in all 3 areas: average density = 67 fish/km2
2. Low abundance – 10,000 fish – distribution contracted into best habitat
A. High Quality 10,000 fish 100 fish/km2
B. Medium Quality 0 fish 0 fish/km2
C. Low Quality 0 fish 0 fish/km2
• Fish in A only: average density = 100 fish/km2
• Fish (equally) in all 3 areas: average density = 33 fish/km2
Figure 2. Effect of sampling strategy on perceived change in abundance. Fish distribution contracts into optimal habitat as abundance declines. Catch rates underestimate the decline in abundance if fishing is restricted to high quality habitats where fish densities are highest. Catch rates accurately reflect the change in abundance if fishing is distributed over all habitats.
40

66° 65° 64° 63° 62° 61° 60°
46°
47°
48°
49°
46°
47°
48°
49°
66° 65° 64° 63° 62° 61° 60°
Gaspé
N.B.
N.S. / N.E.
CapeBreton /Cap
Breton
415
416
417
419
418
420
421
422
424
423
425
426
427
428
429431
432
433402
403
434
435
436
437
439
438BradelleBank /Banc
Bradelle
OrphanBank /
Banc deL'Orphelin
ShediacValley /
Vallee deShediac
Laurentian Channel /Chenal Laurentian
Chaleur Bay /Baie des Chaleurs
Baie St. GeorgesSt. Georges Bay /
C. B. Trough /Cuvette du
C.B.
401
P.E.I. / I.-P.E.
North. Strait /Détroit de North.
Magdalen Shallows / Petits FondsMadeliniens
Magdalen I. /I. - Madeleine
200 m
66° 65° 64° 63° 62° 61° 60°
46°
47°
48°
49°
46°
47°
48°
49°
66° 65° 64° 63° 62° 61° 60°
TEL-2007-749Sept. 2007Stations
Figure 3. Stratification scheme for the September RV survey (bottom) and an example of the sampling sites in a survey (top, 2007 survey).
41

0
50
100
150
200
250
300
1970 1975 1980 1985 1990 1995 2000 2005
year
kg/to
w (
+/-
SE
)
strata 415-439
strata 401,403,415-439
0
50
100
150
200
250
0 50 100 150 200 250
Kg/tow (strat 415-439)
Kg
/tow
(st
rat 4
01
,40
3, 4
15
-43
9)
a)
b)
Figure 4. Cod (0+) biomass indices from the September RV survey, including or excluding strata 401 and 403 (first sampled in 1984). Panel a shows the indices and panel b their correlation (R2=0.9975).
42

66° 65° 64° 63° 62° 61° 60°
46°
47°
48°
49°
46°
47°
48°
49°
66° 65° 64° 63° 62° 61° 60°
66° 65° 64° 63° 62° 61° 60°
46°
47°
48°
49°
46°
47°
48°
49°
66° 65° 64° 63° 62° 61° 60°
200m
100m
50m
66° 65° 64° 63° 62° 61° 60°
46°
47°
48°
49°
46°
47°
48°
49°
66° 65° 64° 63° 62° 61° 60°
66° 65° 64° 63° 62° 61° 60°
46°
47°
48°
49°
46°
47°
48°
49°
66° 65° 64° 63° 62° 61° 60°
200m
100m
50m
Figure 5. Location of fishing sets in the 1985 (o) and 1992 (+) comparative fishing experiments (upper panel) and in the 2004 (+) and 2005 (o) experiments (lower panel).
43

0
50
100
150
200
250
300
350
400
450
1970 1975 1980 1985 1990 1995 2000 2005 2010
Mea
n n
um
ber
per
to
w
E.E.PrinceLady HammondAlfred NeedlerW. TemplemanTeleost3+
0
50
100
150
200
250
300
350
1970 1975 1980 1985 1990 1995 2000 2005 2010
Mea
n w
eig
ht
(kg
) p
er t
ow
Year
Figure 6. Standardized age-aggregated (0+) abundance (upper panel) and biomass (lower panel) indices for cod in the southern Gulf of St. Lawrence. Indices are standardized to be equivalent to catch rates by the Alfred Needler using a Western IIA trawl (except for the 2003 point). Standardized abundance indices for 3+ cod are also shown in the upper panel.
44

0
5
10
15
20
0 100 200 300 400
Depth (m)
Win
gsp
rea
d (
m)
T678
N178
0
10
20
30
40
50
60
70
80
90
100
0 100 200 300 400
Depth (m)
Do
or
spre
ad
(m
)
T678
N846
Figure 7. Wingspread and door spread for tows during three September RV surveys of the southern Gulf of St. Lawrence. The median value is plotted for each tow.
45

Figure 8. Seasonal distribution of cod in the southern Gulf of St. Lawrence stock.
46
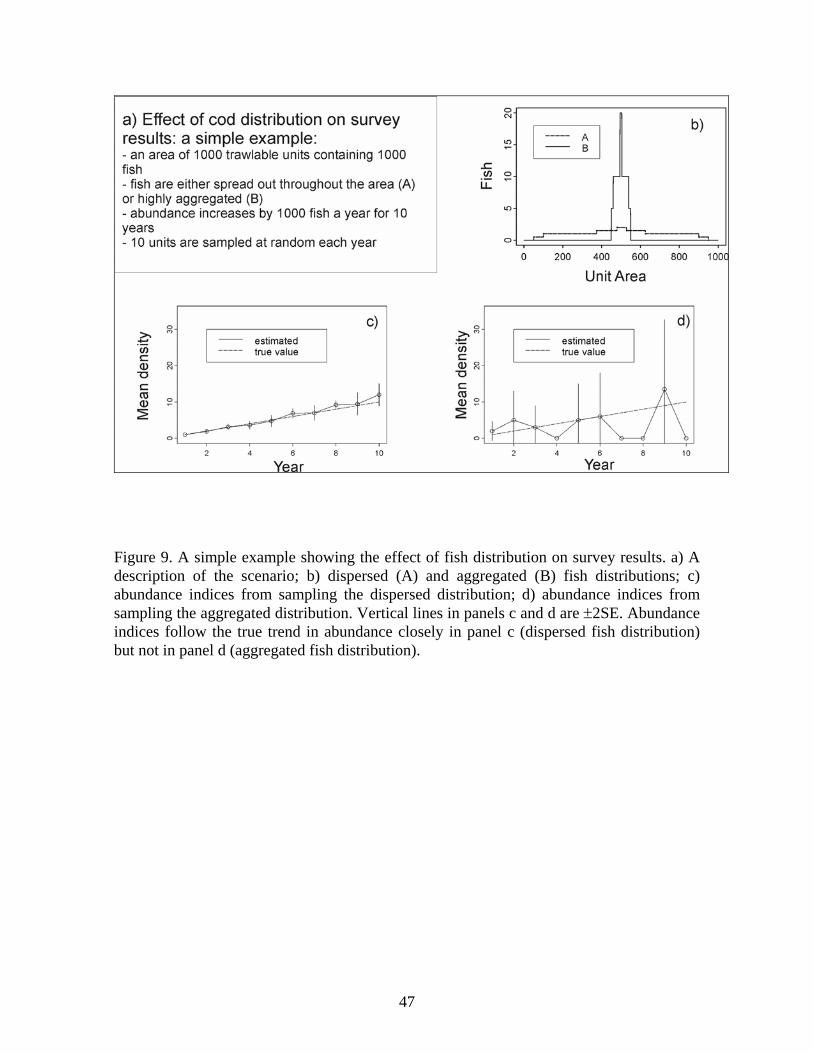
Figure 9. A simple example showing the effect of fish distribution on survey results. a) A description of the scenario; b) dispersed (A) and aggregated (B) fish distributions; c) abundance indices from sampling the dispersed distribution; d) abundance indices from sampling the aggregated distribution. Vertical lines in panels c and d are 2SE. Abundance indices follow the true trend in abundance closely in panel c (dispersed fish distribution) but not in panel d (aggregated fish distribution).
47

0.5
5
10
20+
0
Kg/Trait
Figure 10. Distribution of cod in the 2006 September RV survey of the southern Gulf of St. Lawrence. Circle size is proportional to cod catch rate (kg/tow). The 200-m depth contour is shown. Note that catch rates are zero in the shallowest and deepest waters sampled.
Figure 11. NAFO areas in the Gulf of St. Lawrence and Cabot Strait regions.
48

-68 -66 -64 -62 -60 -58 -56
47
49
51
2005
47
49
51
2002
-68 -66 -64 -62 -60 -58 -56
47
49
51
1999
-70 -68 -66 -64 -62 -60 -58 -56
47
49
51
1996
47
49
51
1993
-70 -68 -66 -64 -62 -60 -58 -56
47
49
51
1990
0 5 25 50 100 > 100kg / trait
kg / tow
Figure 12. Catch rates of cod in August RV surveys of the northern Gulf of St. Lawrence.
49

-68 -66 -64 -62 -60 -58 -56
47
49
51
2008
0 5 25 50 100 > 100kg / trait
kg / tow
70° 68° 66° 64° 62° 60°
46°
48°
a)
b)
c)
Figure 13. Cod in the St. Lawrence estuary: a) cod catches in the 2008 August RV survey. b) strata in the estuary in the August RV survey showing shallow strata (<100 fathoms added in 2008); c) comparison of the area of the 50-100 fathom zone in the estuary (medium shading) with the area covered by the 4T survey.
50

0
50
100
150
200
250
300
350
1970 1975 1980 1985 1990 1995 2000 2005 2010
Me
an
we
igh
t (kg
) p
er
tow
September RV
August Sentinel
Figure 14. Mean catch rates of cod (kg/tow) in August sentinel and September RV surveys of the southern Gulf of St. Lawrence. Vertical lines are +/- 2 SE of the mean RV catch rates.
51

0
0.05
0.1
0.15
0.2
0 10 20 30 40 50 60 70 80
Length (cm) - Longueur (cm)
Pro
po
rtio
n
RV Sentinel
Figure 15. Length composition of cod catches in the 2006 August sentinel and September RV surveys of the southern Gulf of St. Lawrence. 2006 August sentinel survey 2006 September RV survey
Figure 16. Spatial distribution of cod catches in the 2006 August sentinel and September RV surveys of the southern Gulf of St. Lawrence.
52

0.0
5.0
10.0
15.0
20.0
25.0
30.0
35.0
0 20 40 60
Catch rate at age 6
Ca
tch
ra
te a
t ag
e 7
80
R=0.90
a)
-0.5
0.0
0.5
1.0
1.5
2.0
2.5
3.0
3.5
4.0
0 1 2 3 4 5
Log catch rate at age 6
Lo
g c
atc
h r
ate
at a
ge
7
R=0.90
b)
Figure 17. Correlation between catch rates of age-6 cod in one year and age-7 cod in the next year for the September RV survey of the southern Gulf of St. Lawrence. Catch rates are untransformed in panel a and log10 transformed in panel b.
53

Figure 18. Correlations between cod catch rates in the September RV survey at age i in year t versus catch rates at age i+j in year t+j. Colour coding gives the value of the correlation coefficient. Catch rates are ln-transformed. The arrow points to the cell for the correlation shown in Figure 17. “x” denotes a non-significant correlation.
54

Figure 19. Comparison of ability to track year-classes of cod between the September RV survey (RV4T) and other surveys. Other surveys include seven other RV surveys in the Northwest Atlantic, two Sentinel surveys and two RV survey indices from the Northeast Atlantic. Colour coding gives the value of the correlation coefficient between cod catch rates at age i in year t versus catch rates at age i+j in year t+j. Catch rates are ln-transformed. “x” denotes a non-significant (positive) correlation. White cells indicate a negative correlation.
55

a) Mobile 1988-1992
0.00
0.05
0.10
0.15
0.20
0.25
1 2 3 4 5 6 7 8 9 10 11 12
Month
Pro
por
tion
of L
and
ing
s
b) Mobile 1999-2002
0.00
0.05
0.10
0.15
0.20
0.25
0.30
1 2 3 4 5 6 7 8 9 10 11 12
Month
Pro
por
tion
of L
and
ing
sc) Longline 1988-1992
0.00
0.02
0.04
0.06
0.08
0.10
0.12
0.14
0.16
0.18
0.20
1 2 3 4 5 6 7 8 9 10 11 12
Month
Pro
po
rtio
n o
f La
nd
ing
s
d) Longline 1999-2002
0.00
0.05
0.10
0.15
0.20
0.25
0.30
0.35
0.40
1 2 3 4 5 6 7 8 9 10 11 12
Month
Pro
por
tion
of L
and
ing
s
Figure 20. Proportion of landings of southern Gulf cod by month for mobile gears (trawls and seines) in 1988-1992 (a) and 1999-2002 (b) and by longlines in 1988-1992 (c) and 1999-2002 (d).
56

a) otter trawls 1966-1988
-0.8
-0.6
-0.4
-0.2
0.0
0.2
0.4
0.6
0.8
1.0
0 2 4 6 8 10 12
Month
Effe
ct o
n lo
g c
atc
h r
ate
s
b) longlines 1995-2007
3.5
3.6
3.7
3.8
3.9
4.0
4.1
4.2
0 2 4 6 8 10 12
Month
lsm
ea
n lo
g c
atc
h r
ate
s
Figure 21. Effect of month on catch rates of southern Gulf cod. a) the commercial otter trawl fishery, 1966-1988, from Chouinard and Sinclair (1989), b) sentinel longline catch rates, 1995-2007, from the multiplicative model in Chouinard et al. (2008). Error bars are 1SE.
57

ANNEX I. Report of the 1999 Workshop on the September Bottom-Trawl Surveys Conducted by the Department of Fisheries and Oceans in the Southern Gulf of St. Lawrence.
58

1
Report of the Workshop on the September Bottom-Trawl Surveys Conducted by the Department of Fisheries & Oceans in the
Southern Gulf of St. Lawrence
Jeffrey A. Hutchings (Editor) Department of Biology Dalhousie University Halifax, Nova Scotia
B3H 4J1
St. Francis Xavier University Antigonish, Nova Scotia
July 1999

TABLE OF CONTENTS
PREFACE ................................................................................................. 2 INTRODUCTION ..................................................................................... 2 SCIENCE PRESENTATION AND DISCUSSION ................................. 4 Absolute vs. Relative Abundance ................................................. 4 Survey Characteristics ................................................................... 5 Reliability of Survey Results ......................................................... 7 Differences Between Survey and Fishery Catch Rates ............... 8 COAST GUARD PRESENTATION AND DISCUSSION ..................... 10 ISSUES ...................................................................................................... 13 RECOMMENDATIONS ........................................................................... 14 REFERENCES .......................................................................................... 17 APPENDIX 1: List of Participants ......................................................... 18
2

Preface This report summarizes the presentations, discussions, issues, and recommendations resulting from a workshop hosted by the Department of Fisheries & Oceans (Gulf Fisheries Centre) in the Student Council Chambers, St. Francis Xavier University, Antigonish, Nova Scotia, on July 8, 1999. The workshop was attended by 24 individuals, including 11 fishermen, 3 representatives of the FRCC, and 3 university faculty. The workshop was chaired by Dr. Jeffrey Hutchings, Department of Biology, Dalhousie University, Halifax, NS. Rapporteurs for the workshop were Dr. Jim Williams, Department of Biology, St. Francis Xavier University, Antigonish, NS, and Mr. Dave Gillis, Department of Fisheries & Tourism, Government of Prince Edward Island, and member of the FRCC. These proceedings are based on written notes taken during the workshop by the Rapporteurs and by the Chair. It was the responsibility of the Chair to write and to edit this report. Every effort was made to have these proceedings reflect the tenor and substance of the workshop. The Chair accepts full responsibility for any shortcomings in this regard. Members of the scientific staff at the Gulf Fisheries Centre, Moncton, NB, are to be thanked for hosting the workshop. Attendance and active participation by fishermen, DFO scientific staff, Canadian Coast Guard staff, FRCC representatives, and university faculty throughout the workshop is gratefully acknowledged. Introduction The purpose of the workshop was to address concerns raised by fishermen regarding the September bottom-trawl surveys conducted by the Department of Fisheries & Oceans (DFO) in the southern Gulf of St. Lawrence (NAFO Division 4T). These standardized surveys have been conducted annually since 1971. Groundfish have been sampled by a Western IIA bottom trawl since 1985, most recently (1992-present) by the CCGS Alfred Needler. The primary purpose of the survey is to obtain indices of relative abundance for the major groundfish species in the southern Gulf, including Atlantic cod, Gadus morhua, American plaice, Hippoglossoides platessoides, white hake, Urophycis tenuis, winter flounder, Pseudopleuronectes americanus, and witch flounder, Glyptocephalus cynoglossus. The 1998 survey results are presented by Chouinard et al. (1998). The concerns of fishermen were most recently expressed at the industry consultations held by the Fisheries Resource Conservation Council (FRCC) in Port Hawksbury, NS, on April 9, 1999. Although most of these concerns were expressed verbally, two of the briefs presented to the FRCC made explicit mention of the research surveys. For completeness, those parts of the briefs in question that refer to the research surveys are repeated here:
3
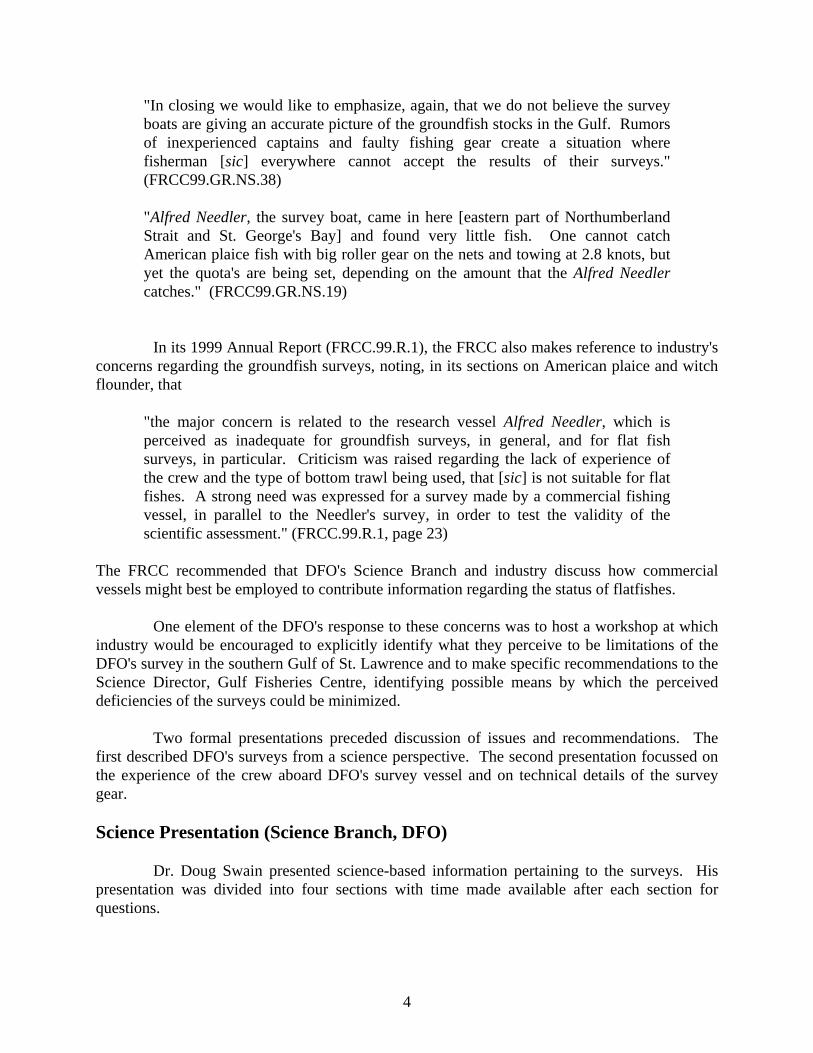
"In closing we would like to emphasize, again, that we do not believe the survey boats are giving an accurate picture of the groundfish stocks in the Gulf. Rumors of inexperienced captains and faulty fishing gear create a situation where fisherman [sic] everywhere cannot accept the results of their surveys." (FRCC99.GR.NS.38)
"Alfred Needler, the survey boat, came in here [eastern part of Northumberland Strait and St. George's Bay] and found very little fish. One cannot catch American plaice fish with big roller gear on the nets and towing at 2.8 knots, but yet the quota's are being set, depending on the amount that the Alfred Needler catches." (FRCC99.GR.NS.19)
In its 1999 Annual Report (FRCC.99.R.1), the FRCC also makes reference to industry's concerns regarding the groundfish surveys, noting, in its sections on American plaice and witch flounder, that
"the major concern is related to the research vessel Alfred Needler, which is perceived as inadequate for groundfish surveys, in general, and for flat fish surveys, in particular. Criticism was raised regarding the lack of experience of the crew and the type of bottom trawl being used, that [sic] is not suitable for flat fishes. A strong need was expressed for a survey made by a commercial fishing vessel, in parallel to the Needler's survey, in order to test the validity of the scientific assessment." (FRCC.99.R.1, page 23)
The FRCC recommended that DFO's Science Branch and industry discuss how commercial vessels might best be employed to contribute information regarding the status of flatfishes. One element of the DFO's response to these concerns was to host a workshop at which industry would be encouraged to explicitly identify what they perceive to be limitations of the DFO's survey in the southern Gulf of St. Lawrence and to make specific recommendations to the Science Director, Gulf Fisheries Centre, identifying possible means by which the perceived deficiencies of the surveys could be minimized. Two formal presentations preceded discussion of issues and recommendations. The first described DFO's surveys from a science perspective. The second presentation focussed on the experience of the crew aboard DFO's survey vessel and on technical details of the survey gear. Science Presentation (Science Branch, DFO) Dr. Doug Swain presented science-based information pertaining to the surveys. His presentation was divided into four sections with time made available after each section for questions.
4

A. Absolute vs. Relative Abundance A.1 Summary of the Main Points of the Presentation 1. To estimate absolute abundance from the surveys, one requires information on the availability of fish to the survey gear, the efficiency with which fish available to the gear are actually captured by the gear (i.e., fishing efficiency, or catchability), and the area of bottom swept by each tow. The first two of these factors are not known and the third is not well estimated and varies by an unknown amount among tows. However, this is not important given that the surveys are intended to provide relative, not absolute, estimates of abundance. In other words, it is not important that the survey is unable to determine the total amount of groundfish in the southern Gulf every year. What is important, however, is that the survey be able to reliably monitor annual changes in groundfish abundance and biomass. The survey is used to determine whether a fish species in the present year has increased in abundance relative to last year, decreased in abundance, or stayed roughly the same. 2. The term "minimum trawlable biomass" should not be used in Stock Status Reports. The survey results should be presented as catch rates only. 3. Surveys require that fishing efficiency be equal from one year to the next. The level of fishing efficiency is not important when the objective is to reliably estimate annual trends, or yearly changes, in abundance. A.2 Summary of Discussion Participants asked how fishing efficiency -- within and among years -- might be affected by factors such as tides, wind, currents, direction of tow, amount of catch, bottom type, date of ice-out, and depth. The response was that some things seem to be closely tied to the environment, and might vary in timing with, for example, early ice-out. On the other hand, some things seem tied to the calendar, and occur within a few days regardless of environmental conditions. Doug also touched on the logistics of reserving boat time, and the constraint this placed on the timing and the extent of the groundfish survey. In general, fishermen were critical of the fact that the groundfish survey was conducted at the same time each year, and felt that this introduced year-to-year variability in fishing efficiency. There was also a query about extensive seismic activity that took place just prior to the 1998 September survey, and some concern expressed that those in DFO responsible for the survey had been unaware of the seismic activity. B. Survey Characteristics B.1 Summary of the Main Points of the Presentation 1. The survey reliably samples all depths (as shallow as 20 m) and areas inhabited by cod and plaice in the southern Gulf of St. Lawrence.
5
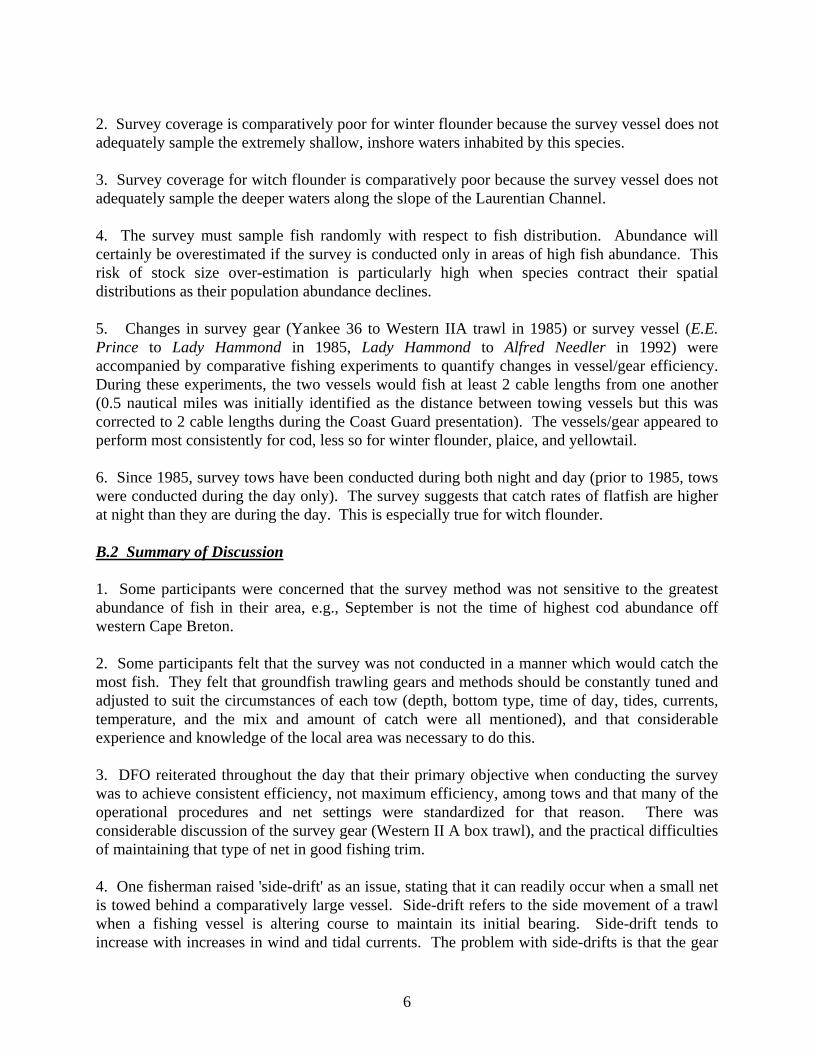
2. Survey coverage is comparatively poor for winter flounder because the survey vessel does not adequately sample the extremely shallow, inshore waters inhabited by this species. 3. Survey coverage for witch flounder is comparatively poor because the survey vessel does not adequately sample the deeper waters along the slope of the Laurentian Channel. 4. The survey must sample fish randomly with respect to fish distribution. Abundance will certainly be overestimated if the survey is conducted only in areas of high fish abundance. This risk of stock size over-estimation is particularly high when species contract their spatial distributions as their population abundance declines. 5. Changes in survey gear (Yankee 36 to Western IIA trawl in 1985) or survey vessel (E.E. Prince to Lady Hammond in 1985, Lady Hammond to Alfred Needler in 1992) were accompanied by comparative fishing experiments to quantify changes in vessel/gear efficiency. During these experiments, the two vessels would fish at least 2 cable lengths from one another (0.5 nautical miles was initially identified as the distance between towing vessels but this was corrected to 2 cable lengths during the Coast Guard presentation). The vessels/gear appeared to perform most consistently for cod, less so for winter flounder, plaice, and yellowtail. 6. Since 1985, survey tows have been conducted during both night and day (prior to 1985, tows were conducted during the day only). The survey suggests that catch rates of flatfish are higher at night than they are during the day. This is especially true for witch flounder. B.2 Summary of Discussion 1. Some participants were concerned that the survey method was not sensitive to the greatest abundance of fish in their area, e.g., September is not the time of highest cod abundance off western Cape Breton. 2. Some participants felt that the survey was not conducted in a manner which would catch the most fish. They felt that groundfish trawling gears and methods should be constantly tuned and adjusted to suit the circumstances of each tow (depth, bottom type, time of day, tides, currents, temperature, and the mix and amount of catch were all mentioned), and that considerable experience and knowledge of the local area was necessary to do this. 3. DFO reiterated throughout the day that their primary objective when conducting the survey was to achieve consistent efficiency, not maximum efficiency, among tows and that many of the operational procedures and net settings were standardized for that reason. There was considerable discussion of the survey gear (Western II A box trawl), and the practical difficulties of maintaining that type of net in good fishing trim. 4. One fisherman raised 'side-drift' as an issue, stating that it can readily occur when a small net is towed behind a comparatively large vessel. Side-drift refers to the side movement of a trawl when a fishing vessel is altering course to maintain its initial bearing. Side-drift tends to increase with increases in wind and tidal currents. The problem with side-drifts is that the gear
6

is no longer being towed directly behind the fishing vessel which means that the gear is not operating properly. There was disagreement regarding the ability of SCANMAR to reliably detect side-drifts. 5. There was some discussion about how tows were monitored. DFO responded that in recent years they have had SCANMAR sensors on every tow. At this point, questions arose regarding criteria for discarding a tow if the SCANMAR technology malfunctioned. DFO acknowledged that if SCANMAR batteries went down during a tow, the tow would still be used in their estimation of survey catch rates. Fishermen responded that without SCANMAR, the tows should not be used, particularly given the sensitivity of the Western IIA trawl. 6. Participants questioned DFO's protocol for undertaking comparative fishing experiments, arguing that it would be difficult to get truly comparable results. DFO explained that a large number of such tows (60 to 70) were done for that very reason, over a diversity of sites. One fisherman asked if it would be more appropriate to switch nets regularly during the trials. DFO explained that this would be impractical, and that since the trials focussed on specific vessel/gear combinations, trials should be done with the same combination throughout the comparative fishing experiments. 7. One fisherman asked how the fishing efficiency of new vessels and new gear changed with age and size of fish. DFO explained that the size of fish caught varied more with changes to survey gear than to changes in survey vessel. Due to significant differences in size selectivity between gears, it is not always possible to develop size-based conversions between different nets. 8. DFO explained that more flatfish are caught at night than during day (a similar day-night difference in flatfish catch rates has been documented observed in other DFO surveys elsewhere in the Northwest Atlantic). For several species (e.g., yellowtail flounder and witch flounder), conversion factors have been developed to correct for these day/night differences. Several participants argued that their catch rates for flatfish were always greater during the day, especially on soft bottom, and this suggested to them that the survey gear was not working properly, i.e., DFO's lower catch rates during the day suggested to some fishermen that the ground warps were not making sufficient contact, if any, with the bottom. They pointed out that the ground warps do most of the herding and fishing for flatfish, and if DFO is obtaining somewhat higher catch rates at night, then perhaps only the box of the trawl is actually fishing. If this is true, fishermen argued, it would result in an under-estimation of flounder numbers. 9. One fisherman noted that bottom type (e.g., mud versus hard bottom) might explain some of the observed differences in flatfish catch rate between day and might. 10. One fisherman noted that all 18 points of the Western IIA trawl need to be working at the same time for the gear to operate properly. 11. It was noted by several fishermen that the speed of the survey vessel (3.5 knots) is too fast to sample flatfish reliably.
7

C. Reliability of Survey Results C.1 Summary of the Main Points of the Presentation 1. The southern Gulf survey may be the most reliable survey for Atlantic cod and American plaice in the Northwest Atlantic. The coefficients of variation of the survey (i.e., a measure of the precision of the survey estimates of abundance) have averaged 13% for plaice (approx. 7% in recent years) and 17% for cod. By comparison, coefficients of variation as high as 30 and 40% have been estimated for other DFO surveys in the Northwest Atlantic. 2. An important measure of the reliability of the survey is its ability to track year classes through time. For example, if the abundance of cod at age 3 is high one year, a reliable survey will document a high catch rate of cod at age 4 the following year, a high catch rate of cod at age 5 two years later, and so on. The southern Gulf surveys have a very high capability of tracking length and age modes of cod and plaice over time. 3. A statistical model of year-class strength suggests that there is no large unexplained variance in the survey results. C.2 Summary of Discussion Several participants remarked that survey-based catch rates, and therefore TACs (Total Allowable Catches), declined at approximately the same time (1992) that the Needler was first used as the survey vessel. However, DFO noted that survey catch rates for cod recorded aboard the Lady Hammond had already been declining sharply by 1992. D. Differences Between Survey and Fishery Catch Rates D.1 Summary of the Main Points of the Presentation 1. Commercial fishery catch rates can increase over time because of increased fishing efficiency. 2. Commercial fishery catch rates may have increased in the eastern part of the southern Gulf (e.g., St. George's Bay) not because of increases in overall stock abundance but because of an increased "compression" of cod and flatfish distribution in the easternmost parts of their range. 3. Catch rates of plaice in the eastern part of their range have not changed significantly since the early 1980s. By contrast, catch rates of plaice in the western Gulf are very low in recent years compared to the catch rates observed in the early 1980s. 4. Commercial fishery catch rates in recent years may reflect an absence of competition for fish by other fishermen, rather than an increase in fish abundance.
8

9

D.2 Summary of Discussion 1. There was considerable frustration among participants that the survey is not reflecting what they report seeing in their own catches and by-catches. In particular, fishermen questioned the conclusion that catch rates in the eastern part of the Gulf have been stable in recent years. DFO suggested that a more refined analysis of survey catch rates in the eastern Gulf, of an area more comparable to the actual fishing grounds currently used, might be more appropriate (although there some concern about low data volume). 2. One fisherman felt that TAGS had affected the commercial catch rates in the western Gulf more than in the east, where he felt more TAGS-eligible fishers had continued to 'scratch around' for the plaice and other resources open to fishing. Another fisherman noted that plaice was historically a mixed fishery (with cod) rather than a directed one, and that commercial catch rates in the past might be unduly low because of the fact that many of the larger ITQ (Individual Transferable Quota) vessels would not gear up to chase a small amount of plaice under those circumstances. 3. Fishermen raised several other factors which they felt could be affecting the distribution of fish in the southern Gulf, including pollution from the St. Lawrence River and low oxygen levels in the western reaches of the Gulf. DFO explained that tissue samples were taken occasionally from fish during the survey for specialized studies. Oxygen was not felt to be a problem outside of the bottom of the Laurentian Channel. 4. One fisherman felt that distributional shifts could concentrate a lot of the cod resource in a relatively small area, like the north shore shoals off PEI, making cod less available to the survey. 5. Responding to the observation that fishery technology had increased several-fold since the early 1970s (when the survey began), several fishermen vigorously countered that DFO had changed survey vessels three times, and survey gear twice, during the same time interval. Nonetheless, there was agreement amongst some fishermen that recent increases in commercial catch rates could be attributed to increases in gear technology. 6. Several fishermen questioned whether the skipper and crew aboard the survey vessel were sufficiently experienced to properly handle the survey fishing gear. Some fishermen felt that DFO skippers in the past did the little things necessary to catch fish, whereas present-day skippers lacked such experience. 7. Considerable dissatisfaction with the Western IIA trawl was expressed by several fishermen who argued that this gear was not robust, was unduly sensitive to changes in local water conditions (e.g., tides, wind, currents), and was difficult to fish properly. 8. Fisherman asked how the results of the surveys were used in the setting of TACs. DFO responded that, to their knowledge, the absolute amount of fish caught during the survey had no bearing on TACs recommended by the FRCC. The 3 members of the FRCC who attended the workshop (Osborne Burke, Frank Hennessey, Dave Gillis) confirmed that the TAC
10

recommendations made by the FRCC were based on annual trends in survey catch rates and that the absolute amount of fish caught during the survey had no bearing on the TACs. 9. One fisherman asked why the survey gear appeared to work better in deeper water than in shallow water. This apparent increase in gear efficiency with depth did not make sense to him. Coast Guard Presentation (Canadian Coast Guard) Mr. Alan Johnson of the Coast Guard (CG), second mate aboard the Alfred Needler, provided a comprehensive overview of the experience of the crew who undertake the DFO surveys and the technical details of the survey gear and the deployment of that gear. Summary of Main Points of Presentation 1. The fishing experience of the crew of the Alfred Needler was summarized as follows: Fishing Experience of the Crew of the Alfred Needler Rank A Crew B Crew C/O 25+ years 2+ years 1/O 25+ 30+ 2/O 20+ 18+ Bosun 20+ 20+ Twinehands 30+ 30+ " 20+ 30+ " 20+ 30+ " 15+ 20+ " 15+ 10+ " 12+ 10+ " 2+? 2+? " 2+? 2+? 2. During her first year of service (1978), the Lady Hammond used an Engel 145 trawl (she never used a Yankee 36 trawl). The decision to replace the Engel 145 with the Western IIA was made because of difficulties experienced during haulback related to the comparatively small size of the Lady Hammond's trawl deck (see Carrothers, 1988, for more information). 3. The crew aboard the survey vessel take extreme care to ensure that the survey gear fishes in exactly the same fashion, within reason, from one tow to the next and from one year to the next. As Alan put it, the job of the crew is:
"to make the trawl the same for every tow...We're not there to catch as much fish as we can. We're there to make sure the gear fishes the same [way] every time."
11

4. The Commanding Officers (C/Os) aboard the survey vessels do not play an important role in the actual fishing of the bottom trawl. The most important crew members in this regard are the first and second mates. 5. The trawl is inspected for damage or distortion after every tow and repaired if necessary. Summary of Discussion 1. Participants raised concerns regarding the level of experience of the crew on the Alfred Needler, arguing that the crew did not have sufficient training and/or experience at commercial bottom-trawling for cod and flatfish to operate the vessel and gear in a manner which would either catch the most fish or produce the most consistent results. CG reiterated throughout the discussion that their mission was not to maximize catch, but to operate the gear and conduct the survey in a consistent manner from one year to the next. DFO pointed out that much of the 'experience' element of commercial fishing crews, especially captains, related to their ability to locate and to fish localized concentrations. However, these were not criteria important to the proper conduct of the survey, and would, if acted upon, actually create problems with the data. 2. Several participants expressed concern about the introduction of inexperienced Coast Guard crews onto the Needler during the DFO-CG amalgamation period. CG acknowledged that for two years there were more inexperienced (at fishing) personnel onboard than DFO would have chosen to have, however, there was no option at the time. CG felt that these placements did not affect results and is comfortable with the situation now. 3. One participant felt that crews would at least need good local knowledge of the bottom and conditions in the area in order to sample effectively. CG acknowledged that this information was important and that while the Needler crew might not be familiar with every local feature, they were compiling a Gulf-wide information base by logging their observations and experiences during successive surveys. CG also noted that they have to be familiar with a much wider range of grounds than commercial captains because of the necessity of the survey to fish non-commercial grounds as well as commercial grounds. 4. In response to one question, CG explained that commercial fishermen normally worked on the survey. They were free to move about the survey vessel and were encouraged to visit the deck and wheelhouse and to provide any advice they wished. CG noted that while there used to be some resistance to this by some crew members, the current attitude was much more open. CG felt that these fishermen came away from the survey with a much better appreciation for the effort and results. 5. Other participants were less concerned with the crews' ability, focussing instead on what they felt was an unduly restrictive scientific protocol for operating the survey gear. 6. Participants reiterated their concern of the choice of net used during the survey. They contended that the Western IIA box trawl was difficult to maintain in good configuration and that this was one of the primary reasons why commercial fishermen had discontinued use of this
12

gear. 7. Participants asked whether SCANMAR technology was always used during the survey tows. CG explained that SCANMAR was installed for all sets but that things like battery failure did occur from time to time. DFO indicated these sets would be used so long as there was no other reason to feel there was a problem with the set. 8. One participant inquired about the procedures used to repair trawl damage, and whether these modifications could influence catches. CG explained that while minor tears would be mended, more serious damage often resulted in replacement of either parts of the trawl or the trawl in its entirety. He felt certain that such whole-gear replacements were much more readily done on the survey vessel than in the commercial fleet. 9. One participant noted that the use of heavy doors would promote good bottom contact when working in various depths, but might also cause the headrope of the net to lower, affecting catches. CG responded that testing had been done to determine the best overall configuration and procedure (i.e., speed at 3 ½ knots) for this vessel / gear combination, and that these standards were followed faithfully to ensure consistent sampling. Others noted that the standard speed of 3 ½ knots was too fast to sample flatfish reliably. Issues Fishermen clearly distrust the research survey. Although the reasons for this distrust are varied, they ultimately stem from the discrepancy that exists between fishermens' perception of the health of groundfish stocks in the south-eastern Gulf of St. Lawrence and the perception of the status of groundfish stocks throughout the southern Gulf as reflected by DFO's survey. Fishermen believe that groundfish stocks have increased considerably since the early 1990s. In part, this is based on the observations of those who, despite increasing their mesh sizes from 130 mm to 155 mm, have recently observed an increase in catch rates when they had been expecting a decline. The DFO acknowledges that survey catch rates for cod in the eastern half of the southern Gulf have increased somewhat since the early 1990s and are not dissimilar to catch rates observed in the 1980s. However, DFO also notes that catch rates for cod in the western half of the southern Gulf were two to four times lower in 1998 than those observed in the 1980s. As a consequence of this difference in perception of the status of groundfish stocks, fishermen expressed little faith in the ability of the DFO’s surveys to provide reliable information on the southern Gulf of St. Lawrence groundfish stocks. As revealed by questions that arose as a consequence of the two formal presentations, specific concerns centred upon (i) the survey vessel Alfred Needler, (ii) the Western IIA bottom trawl survey gear, (iii) the groundfish bottom-trawling experience of the crew aboard the Alfred Needler, (iv) the fishing efficiency of the present survey gear, and (v) the ability of the surveys to reliably sample all major groundfish species, i.e., Atlantic cod, American plaice, white hake, winter flounder, and
13

witch flounder. On a related point, fishermen also noted the difficulty of fishing effectively when fishing alone, i.e., in the absence of other vessels. They spoke about how even the most seasoned of fishermen prefer to fish near other boats so that they can detect problems, by catch comparisons, that may not have been obvious otherwise. DFO repeated their contention that the survey was not intended to emulate commercial catches. Fishermen felt it would be prudent for DFO to replace the Western IIA trawl with gear more commonly used in the commercial fishery. Recommendations Preamble Although aided considerably by the reporting skills of the workshop's Rapporteurs, the Chair accepts full responsibility for the final identification, rationale, and wording of the recommendations that follow. The recommendations are intended to fulfil two primary objectives: (1) to identify specific actions that would address perceived weaknesses in DFO’s survey, and (2) to increase the knowledge base upon which the status of southern Gulf of St. Lawrence groundfish is assessed. Recommendation 1: That the September bottom-trawl survey in the southern Gulf of St. Lawrence, as currently conducted by the DFO, be continued. The deficiencies of DFO’s survey -- detailed earlier in the report and addressed in part by Recommendation 2 -- do not outweigh its benefits. The strengths of the survey include very low within-year coefficients of variation (indicative of high precision) coupled with an impressive ability to track strong and weak year-classes, or cohorts, through time. Additional strengths include the facts that, notably for cod and plaice, (1) the survey has exceedingly good coverage of the southern Gulf, (2) the survey is conducted at a time of year when groundfish are most widely distributed (i.e., not aggregated), and (3) the time series of standardized catch rates for groundfish extends back to 1971. On balance, these strengths of the survey are sufficient to warrant continuance of the research survey protocol as presently conducted by the DFO. It should be acknowledged that any decision to replace the survey vessel or the survey gear should not be taken lightly. With every significant change in the means by which the survey is conducted, there is a corresponding increase in the uncertainty associated with any comparison of catch rates between the newer and older surveys. In addition, any scientific benefits associated with intermittent use of a new type of survey gear (e.g., the Campelen trawl used in the Newfoundland surveys), within the time frame presently allotted for the survey, are unlikely to outweigh either the logistic costs associated with the deployment of the different gear or the time that would be expended by scientific staff to
14

analyse the data obtained therefrom. The primary argument in favour of the Campelen trawl -- its increased ability to catch small, juvenile groundfish -- must be tempered by the observation that the present DFO survey in the southern Gulf is able to reliably track both strong and weak year-classes of cod and plaice as early as age 2. An additional consideration is the likelihood that conversion of the DFO survey gear to the Campelen trawl, because of extraordinarily different size-, age-, and species-selectivities, would probably negate the entire 28-year-old survey time series of groundfish catch rates for the southern Gulf. Recommendation 2: That industry surveys complement DFO’s survey in the southern Gulf of St. Lawrence. There are several reasons for recommending industry surveys. These include a widespread lack of confidence among fishermen in DFO’s survey (e.g., catch rates of American plaice in the Magdalen Shallows) and the inability of DFO’s survey to reliably sample winter flounder in nearshore waters and witch flounder in the deep waters along the slope of the Laurentian Channel. It is reasonable to assume that industry-conducted surveys should be able to address the technical, experience-related, and logistic concerns of DFO's survey raised by fishermen during the workshop. It is recommended that industry surveys include one or more of the following: (1) a random-stratified, bottom-trawl survey conducted throughout the southern Gulf, preferably during a month other than September; (2) an inshore, random-stratified, bottom-trawl survey for winter flounder; (3) an offshore, random-stratified, bottom-trawl survey for witch flounder; and (4) a random-stratified, bottom-trawl survey of flatfish in the Magdalen Shallows, preferably during a month other than September. Compared to the data that can be obtained from the proposed industry surveys, the suggested addition of a single commercial vessel fishing along-side the Alfred Needler during DFO's September survey would provide little information on the status of groundfish stocks. Recommendation 3: That the FRCC communicate clearly and unambiguously in its annual reports the basis for the TAC recommendations the Council makes to the Minister of Fisheries & Oceans. It became very clear, as the workshop progressed, that the lack of understanding of the means by which survey results are used in establishing TACs significantly inhibited meaningful discussion of the strengths and weaknesses of DFO's southern Gulf survey. The FRCC needs to communicate to industry that its TAC recommendations depend significantly on trends in survey catch rates, and that the absolute levels of survey catch rates are not used to recommend TACs.
15

This reliance on trends in survey catch rates underscores the necessity of having the survey conducted in as consistent a manner as possible from one tow to the next and from one year to the next.
16

17
Recommendation 4: That DFO scientific staff examine whether the eastward shift in groundfish distribution evident in the early 1990s has continued in recent years, with the proviso that such a study might be hampered by a comparatively small number of research survey tows. Recommendation 5: That DFO scientific staff examine more closely the hypothesis that flatfish catch rates differ between day and night, incorporating the effect that bottom substrate (e.g., mud, hard bottom) might have on such catch rates. Recommendation 6: That DFO scientific staff evaluate the degree to which the speed at which the survey tows are conducted (3.5 knots) affects the ability of the survey gear to reliably sample flatfish. Recommendation 7: That potential negative effects of seismic activity in the southern Gulf (most recently northeast of the Magdalen Islands in August, 1998) on groundfish mortality, reproduction, and distribution be examined. References Carrothers, P.J.G. 1988. Scotia-Fundy groundfish survey trawls. Canadian Technical
Report of Fisheries and Aquatic Sciences 1609: iv + 27 p. Chouinard, G.A., Poirier, G.A., Swain, D.P., Hurlbut, T., and R. Morin. 1998. Preliminary
results from the September 1998 groundfish survey in the southern Gulf of St. Lawrence. Canadian Stock Assessment Secretariat Research Document 98/142.
FRCC99.GR.NS.19. Brief received by the FRCC from Gerald MacEachern, Director,
Gulf Groundfish Federation, April 9, 1999, Port Hawksbury, NS. FRCC99.GR.NS.38. Brief received by the FRCC from Clifford Aucoin, Northern Cape
Breton Fishing Vessel Association, April 9, 1999, Port Hawksbury, NS. FRCC.99.R.1. 1999 Conservation requirements for the Gulf of St. Lawrence groundfish
stocks and cod stocks in divisions 2GH and 3Ps. Fisheries Resource Conservation Council, Ottawa, ON.

18
Appendix 1 List of Workshop Participants. Name Affiliation Address Tel FAX Ernest Ehler Fisherman Bayfield NS 386-2530 Robert Melong Fisherman Havre Boucher NS 234-2290 Osborne Burke Fisherman & FRCC Ingonish NS 285-2276 285-2099 Dave Morse Coast Guard, DFO Dartmouth NS 426-5114 426-3607 John MacInnes Fisherman Port Hood NS 787-3221 787-2080 Alan Johnson Coast Guard, DFO Wallace NS 257-2464 Janice Fennell Science, DFO St. Peters, NS 535-2209 535-2209 Linda Currie Science, DFO Gulf Fish. Centre, Moncton 851-6145 851-2620 Clifford Aucoin Fisherman NCBFVA, Cheticamp NS 224-3589 224-3000 Gloria Poirier Science, DFO Gulf. Fish. Centre, Moncton 851-2035 851-2620 Rod Morin Science, DFO Gulf. Fish. Centre, Moncton 851-2073 851-2620 Jeff Hutchings Dalhousie University (Biology
Dept) Halifax NS 494-2687 494-3736
Dave Gillis PEI Fish. & Tourism & FRCC Charlottetown, PEI 368-5261 368-5542 Frank Hennessey PEI Groundfish Assoc & FRCC 687-3256 687-1343 Tom Hurlbut Science, DFO Gulf Fish. Centre, Moncton 851-6216 851-2620 Ghislain Chouinard Science, DFO Gulf Fish. Centre, Moncton 851-6220 851-2620 Doug Swain Science, DFO Gulf Fish. Centre, Moncton 851-6237 851-2620 Jim Williams St. Francis Xavier (Biology Dept) Antigonish 867-3320 Nell den Heyer St. Francis Xavier (ISAR) Antigonish NS 867-3905 Percy Haines Fisherman 926-2229 Austen Boudreau Fisherman Bayfield, NS 386-2179 Ronald Boyd Fisherman Antigonish NS 863-6961 Boyd MacPherson Fisherman Antigonish NS 863-4574 Henry Van Bommel Fisherman Heatherton NS 386-2561