stock market performance of jewish firms during the third reich · 2019-12-11 · stock market...
TRANSCRIPT

Stock Market Performance of Jewish Firms
During the Third Reich∗
Jens Ihlow† Jens Carsten Jackwerth‡
December 9, 2019
Abstract
We study the effect of discrimination against Jewish managers and owners on their firms’
stock during the Third Reich. The stock of firms with Jewish managers underperformed by
around 5% annually, with abnormal performance persisting on average for three years until
firm “Aryanization.” Firms with Jewish owners perform much like firms without any Jewish
involvement. We identify harassment of Jewish-managed firms as the leading cause for the
discount. Alternative explanations, such as brain drain and Jewish stigma, seem less relevant.
We find that discriminating against a minority can have a negative effect on an entire economy.
JEL classification: G12, G14, N24
Keywords: Third Reich, Hitler, Jewish Firms, Discrimination, Aryanization, Abnormal Perfor-
mance
∗We thank Gunter Franke, Rik Frehen, Benjamin Golez, Stephan Maurer, and seminar participants at the uni-
versities of Konstanz, St. Gallen, Strasbourg, and Zurich for helpful comments and suggestions. We also thank
Hans-Joachim Voth for sharing data on firm characteristics.†Jens Ihlow is from the University of Konstanz, PO Box 134, 78457 Konstanz, Germany, Tel.: +49-(0)7531-88-4326,
Fax: +49-(0)7531-88-3120, [email protected]‡Corresponding author: Jens Jackwerth is from the University of Konstanz, PO Box 134, 78457 Konstanz, Germany,
Tel.: +49-(0)7531-88-2196, Fax: +49-(0)7531-88-3120, [email protected]
1

1 Introduction
Discrimination is a blight on many aspects of society. Over the centuries its targets have
been minorities, women, and various underprivileged groups. We investigate in detail the most
notorious and lethal discrimination in history: the persecution of Jews during the Third Reich
in Germany. Here, we let the stock market performance of firms with Jewish managers and
owners compared to non-Jewish firms document the extent of the discrimination.
The appointment of Adolf Hitler as chancellor of Germany in January 1933 had severe conse-
quences for Jewish companies. Firms were pressured to oust Jewish managers (Vorstande) and
Jewish board members (Aufsichtsratsmitglieder), and Jewish owners were compelled to forfeit
their stock certificates. This enforced exclusion of Jewish people from the German economy
is known as “Aryanization.” Although the “Aryanization” of the German economy is a well-
studied topic in general, little is known about its effect on Jewish firms’ stock prices in particular
and the German stock market in general.
To investigate how “Aryanization” affects Jewish firms’ performance, we hand-collect novel
data on weekly stock returns for all 123 Jewish and 1,375 non-Jewish firms listed on the Berlin
stock exchange between December 1923 and December 1940. We then can quantify the dis-
crimination that Jewish firms experienced around their “Aryanization.” Jewish-managed firms,
those with a Jewish manager or board member, underperformed by 4.79% per year between
Hitler’s appointment as chancellor and the firms’ “Aryanization” – a period lasting on aver-
age three years. This large and statistically significant abnormal performance suggests that
investors repeatedly lowered their expectations about future performance, as they recognized
the increasing discrimination against Jewish-managed firms. Abnormal returns of Jewish-owned
firms, those with a Jewish blockholder, however, are statistically insignificant.
We investigate channels through which discrimination of Jewish-managed firms can affect
abnormal returns. As we control for systematic risk and industry sector, we show that the
discount is not due to any concentration of Jewish-managed firms in poorly performing industries
or in particularly risky stocks.
We develop and test three general hypotheses. The harassment hypothesis explains the
abnormal performance through lower cash flows attributable to harassment of Jewish-managed
firms. Examples are the blocking of store entrances by Nazi brown shirts, the suspension of
government contracts with Jewish-managed firms, and the relaxation of customer obligation to
pay bills. Investors observing this harassment would expect lower future cash flows, which result
2

in lower stock prices. The harassment hypothesis also predicts the pattern of discounts. There
are no discounts before Hitler’s appointment or after the firms’ “Aryanization,” but discounts
are statistically significant between those two events, and are concentrated in the years just after
Hitler’s appointment. As the discounts last over several years, investors gradually lowered their
cash flow predictions as the full extent of Nazi harassment became clear over time. Overall, the
harassment hypothesis can explain our findings best.
The brain drain hypothesis argues that Jewish managers were more skilled than their non-
Jewish replacements, and a loss in skilled management translated into reduced stock prices.
Huber et al. (2019) suggest this hypothesis and document that Jewish managers were indeed
better connected and better educated than their non-Jewish counterparts. The brain drain
hypothesis predicts persistent positive abnormal returns for Jewish-managed firms until the
Jewish manager was replaced by a non-Jewish manager. Around the “Aryanization,” abnormal
returns revert to zero and stay at that level as the firm loses human capital. We cannot observe
such an abnormal return pattern in the data.
The brain drain hypothesis further suggests that abnormal returns are a function of the
Jewish manager’s skill. Hence, firms with a presumably higher-skilled Jewish chief executive
officer should experience, on average, more positive abnormal returns than firms with a less-
skilled Jewish manager. However, we find that firms with Jewish managers in high positions
experience the same abnormal returns as other Jewish-managed firms. We conclude that the
brain drain hypothesis does not fit our findings well.
Finally, the Jewish stigma hypothesis suggests that investors who did not want to be per-
ceived as supporting Jews sold their stocks of Jewish-managed firms. This selling pressure after
Hitler’s appointment caused a decline in stock prices, which resulted in negative abnormal re-
turns. After that, if the Jewish-managed firms’ cash flows do not suffer, the remaining investors
should earn positive abnormal returns until a new equilibrium is reached. After the “Aryani-
zation,” the removal of stigma should increase the demand for such firms again, and we should
temporarily observe positive abnormal returns. We cannot observe such a pattern. Moreover,
the stigma would predict divestment of Jewish-managed firms’ stock and simultaneous invest-
ment into non-Jewish stock, yet we cannot find evidence of such reallocation. We conclude that
the Jewish stigma hypothesis does not fit our findings well.
We quantify the total loss in value of Jewish firms during the Third Reich to be 225 million
Reichsmark ; this represents some 0.4% of the German gross national product in 1933 (54.8
3

billion Reichsmark) and 4% of the 6 billion Reichsmark of taxable assets that Jews owned in
1938. This number is substantially lower than the 1.04 billion Reichsmark that Huber et al.
(2019) estimate.
Although the Third Reich is a well-studied topic in general, quantitative research remains
scarce. A noteworthy exception is the study on brain drain by Huber et al. (2019), who use
semiannual stock prices and a large database of managers.
Our paper also relates to the literature on discrimination. Card et al. (2016) and Blau
and Kahn (2017) use wage differences to analyze discrimination against women. Chatterji and
Seamans (2012) discuss race discrimination in connection with credit card issuance. Mayda
et al. (2018) observe that for-profit firms are more discriminated against in H1-B visa policy
changes than colleges, universities, and non-profit research institutions. We contribute to this
literature by showing that firms that are the subject of discrimination experience significant
negative abnormal returns. Even if the discrimination ends, the lost value cannot be regained
but stock returns can measure the severity of discrimination.
We contribute to the study of asset pricing during the Third Reich. Ferguson and Voth
(2008) measure the returns of 115 firms (of 751 firms) that were politically connected to the
National Socialist German Workers’ Party (NSDAP). An investigation of monthly stock returns
of firms listed on the Berlin stock exchange around Hitler’s appointment as chancellor indi-
cates that connected firms outperform unconnected firms by 5% to 8% between January and
March 1933. The authors also control for “Jewishness” when measuring a firm’s performance,
but find only a statistically insignificant Jewish underperformance. By significantly expand-
ing the sample period, using weekly returns, and controlling for systematic risk, we show in
our sample that discrimination toward Jewish-managed firms leads to a statistically significant
underperformance of discriminated firms.
Scherner (2008) uses accounting reports, key performance indicators, and market develop-
ments to analyze interactions between big business and the Nazi regime during Hitler’s strive
for autarky and rearmament. He concludes that firms’ investment behavior was based on eco-
nomic reasoning rather than rare enforcement by the regime. Our findings, however, suggest
that the regime intervened in firm employment policy, which resulted in underperformance of
the affected firms’ stock.
Other studies of “Aryanizations” are mainly descriptive. James (2001), Lorentz (2002),
and Herbst and Weihe (2004) investigate large German bank participation in “Aryanizations.”
4

Stallbaumer (1999) examines the involvement of the Friedrich Flick holding. Other big Ger-
man firms such as Krupp and I.G. Farben were also heavily engaged in “Aryanizations.” We
contribute to this literature by showing that there are no abnormal returns after that period.
Value in Jewish-managed firms was destroyed before the “Aryanizations” and did not reappear
thereafter.
We also relate our study of individual stock returns to research into the impact of events
during the Third Reich on stock indices and bond yields. Choudhry (2010) studies structural
breaks in returns of the Dow Jones Industrial Average stock index between January 1939 and
December 1945. He finds that important events identified by historians are reflected in the
index. This finding contrasts with Hudson and Urquhart (2015), who can find only events
that negatively affected the British war effort in the FT 30, a predecessor of the FTSE 100,
between January 1939 and December 1945. Events positively affecting the war effort remained
insignificant.
We first provide some historical background and describe our data. Section 3 details the
methodology and presents our main findings. Section 4 develops and tests explanations for our
findings, and Section 5 discusses the robustness of our findings. The last section concludes.
2 Historical Background and Data
Adolf Hitler did not seize power unexpectedly. In November 1923 he had attempted to gain
power through a putsch in Munich. The putsch was unsuccessful, and Hitler, among others,
was imprisoned. From then on, the National Socialist German Workers’ Party (NSDAP) tried
to gain power through elections. In 1930, the party won 18% of the national vote to hold
the second-highest number of seats in parliament. This marked the first major success for the
Nazi party. The NSDAP reached a record membership of 800,000 by 1931. During that time,
Germany was suffering from the aftermath of the Great Depression and was ruled by unstable
minority governments.
During the spring of 1932, President Paul von Hindenburg appointed another minority gov-
ernment, headed by Franz von Papen. In the next national elections during the summer of
1932, the NSDAP gained 37% of the votes and the highest number of seats in the Reichstag.
Only because Hitler insisted on becoming chancellor did the NSDAP not form a government.
In the November 1932 elections, the NSDAP gained only 33% of all votes but remained
the largest party by far. Representatives of industry, finance, and agriculture requested that
5
Hindenburg appoint Hitler chancellor, but Hindenburg appointed General Kurt von Schleicher.
Only after von Schleicher was forced to resign, and many influential people argued for Hitler’s
chancellorship, did Hindenburg finally appoint Hitler on January 30, 1933 (Schulz, 1992).
2.1 Jewish Firms During the Third Reich
In 1933, approximately 525,000 Jews lived in Germany, representing less than 1% of the German
population. In the years following, 250,000 to 300,000 German Jews fled the country or were
imprisoned in concentration camps. The number of German Jews in the population declined to
350,000 (0.5%) in 1938. Although Jews only represented a small part of the population, they
were of economic importance. Dippel (1996) estimates that Jews possessed taxable assets worth
about 6 billion Reichsmark in 1938. Total taxable assets of all Germans were about 53 billion
Reichsmark in 1935 (Herrmann, 1961). Thus, Jews owned roughly 11% of all taxable assets.
The antisemitic propaganda of the Nazis began as early as 1920, as the National Socialist
German Workers’ Party (NSDAP) wanted to exclude all Jews from the German economy in their
25-point program (Schuman, 1934). They started implementing this plan by discriminating
against Jewish firms immediately after Hitler’s appointment. Jewish businesses were boycotted
(Hecht, 2003; Adena et al., 2015), government contracts were suspended or not renewed, and
firms were pressured to oust their Jewish managers (Stallbaumer, 1999). The unconscionability
law was reinterpreted so that doing business with Jews was deemed unconscionable (Ruthers,
2012), and contracts with Jews could thus not be enforced, much the same as for contracts with
prostitutes or gamblers. The Nazi regime passed laws that banned Jews from certain professions
such as medicine, law, or education.1
A decree forced Jews to register their assets by July 31, 1938, if the total value exceeded 5,000
Reichsmark (Verordnung uber die Anmeldung des Vermogens von Juden). The decree excluding
Jews from German economic life (Verordnung zur Ausschaltung der Juden aus dem deutschen
Wirtschaftsleben) and the decree on the use of Jewish assets (Verordnung uber den Einsatz des
judischen Vermogens) forced Jews to sell or liquidate their businesses by January 1, 1939. Only
a few Jews were spared because they produced important goods. Every sale had to be approved
by the government, which ensured that the Reich was the main beneficiary. Stock and bond
certificates had to be deposited with a bank and were not accessible thereafter. Real estate and
valuables had to be sold, too. Jews were often compensated with German government bonds
1Different professions were affected at various dates: doctors, lawyers, and editors in 1933; tax consultants, veteri-narians, and teachers in 1936.
6

(which they could not sell). Banks arranging the sale of large businesses took a commission of
2%, earning them millions (Kwiet, 1988; Barkai, 1989; Stallbaumer, 1999). This forced exclusion
of Jews from the German economy is characterized as “Aryanization,” it took place between
February 1933 and December 1938.2
A prominent example of “Aryanization” of a Jewish firm is Leonard Tietz AG, a chain of
department stores selling to the middle class. The Tietz family held the majority of shares.
Immediately after January 30, 1933, SA officers (the Nazi party’s paramilitary) stood in front
of Tietz department stores, stopping people from entering and buying there. In the spring of
1933, Tietz needed to extend a loan with the Dresdner Bank or go bankrupt. The bank would
agree to extend the loan only if Tietz resigned. Soon after, the whole Tietz family was forced
to sell their shares in the firm to a consortium formed by Dresdner Bank, Deutsche Bank, and
Commerzbank. The formerly Jewish firm was renamed Westdeutsche Kaufhof AG at the next
shareholders’ meeting, and the new management started a public relations campaign to commu-
nicate that the firm was now “free of Jews.” Today the department store is known as GALERIA
Kaufhof (see Busch-Petersen, 2010, for a detailed account). This example demonstrates that
some firms were historically recognized as Jewish and that large German banks participated in
the “Aryanizations” (James, 2001; Lorentz, 2002; Herbst and Weihe, 2004; Ferguson and Voth,
2008).
We use two classifications for Jewish firms, Jewish-managed and Jewish-owned. Our defi-
nition of Jewish-managed firms coincides with the first two categories in Mosse (1987). A firm
is identified as Jewish-managed if a founder is of Jewish extraction and has a leading position
in the firm; if a manager (Vorstand) is of Jewish extraction; or if a member of the supervisory
board (Aufsichtsrat) is of Jewish extraction. Here, the terminology “of Jewish extraction” is
understood in the sense of the Nazis’ Nuremberg race laws of 1935, not in the sense of reli-
gious affiliation. We classify a firm as Jewish-owned if a blockholder is of Jewish extraction.
With this twofold definition of Jewish firms, a firm can be simultaneously Jewish-managed and
Jewish-owned.3
We obtain owner and manager information from the Handbuch der deutschen Akteinge-
2Historians use the decree on the use of Jewish assets (Verordnung uber den Einsatz des judischen Vermogens) tomark the end of the “Aryanizations,” but some firms were “Aryanized” after December 1938. For example, in oursample, Anhaltische Kohlewerke Halle, was “Aryanized” in 1939. Rosenthal Porzellan was “Aryanized” only in 1941.
3According to Ferguson and Voth (2008), firms were recognized as Jewish by Jews and non-Jews. We show thatJewish-sounding firms, which use frequent Jewish surnames in their firm names but are in fact non-Jewish, performedas well as other non-Jewish firms. This finding suggests that investors were able to identify Jewish firms much as wedefine Jewishness (see Section 5.4 for more details).
7

sellschaften, an annual catalog providing information on all German joint-stock firms that was
publicly available to investors at the time. It lists, among other things, a firm’s managers (Vor-
stand), supervisory board members (Aufsichtsrat), blockholders, and firm sector and market
capitalization. To find out about the Jewishness of managers, board members, and blockholders,
we use the Yad Vashem database, which lists Holocaust victims, and the Deutsche Biographie,
which gives biographies of important deceased people who lived within the German-speaking
area.4
We also need to know the “Aryanization” date. A formerly Jewish-managed firm is defined
to be “manager Aryanized” as soon as neither founders, nor managers, nor board members
are of Jewish extraction. Analogously, we define a formerly Jewish-owned firm to be “owner
Aryanized” as soon as no blockholder is of Jewish extraction. Typically, we can only obtain the
“Aryanization” year, but not the exact date. Therefore, we use the end of the “Aryanization”
year as the cutoff between a firm being Jewish and having been “Aryanized.” The cutoff is
too imprecise for a classic event study, so we instead estimate abnormal performance using a
one-factor sector model with time-varying abnormal performances. We classify the remaining
firms as non-Jewish.
2.2 Stock Returns and Descriptive Statistics
For the period from December 1923 through December 1940, we collect weekly stock prices
and dividends for firms traded on the Berlin stock exchange. The start date is determined by
introduction of the temporary Rentenmark in November 1923, which ended the hyperinflation
of the early 1920s.5 We stopped collecting data after 1940, as most “Aryanizations” were
concluded by then (on average in 1936).
As the war went on, listings on the Berlin stock exchange dropped, and in 1940 only 476
firms were left of 663 firms in 1933. Berlin was the largest and most important German stock
exchange during the first half of the twentieth century (Fohlin, 1999). In 1937, 72% of all
German joint stock firms were listed on the Berlin stock exchange. Simultaneously, 64% of
the firms listed in Berlin were listed on at least one additional exchange, and there was little
difference in stock prices between exchanges (Lehmann-Hasemeyer and Burhop, 2014).
During our sample period, the Berlin stock exchange closed between July 1931 and March
1932 because of a banking and currency crisis resulting from the aftermath of the Great Depres-
4See: https://www.deutsche-biographie.de/5The Reichsmark became the new legal currency in August 1924 and its value was pegged to the Rentenmark.
8

sion (Schnabel, 2009; Burhop, 2011).6 The Gesetz uber den Wertpapierhandel also reorganized
the German stock market. Starting in December 1934, the original 23 stock exchanges were
subsequently reduced to 9. Berlin remained the most important stock exchange (Lehmann-
Hasemeyer and Burhop, 2014), and we see no obvious changes in the listings on that exchange
around that date.
We hand-collect prices from the newspaper Berliner Borsenzeitung. The newspaper pub-
lished daily stock prices, dividends, (reverse) stock splits, and German government bond prices.
We collect Wednesday prices, or, whenever they were not available, the latest quoted price
within the preceding six days.7 We believe this period to be an ideal setting for our investi-
gation, as insider trading was allowed at the time (Standen, 1995; Bhattacharya and Daouk,
2002). Following Leland (1992), informed insider trading should make prices efficient, as even
private news is rapidly reflected in the stock price. Further, total costs and taxes on trades were
below 1% (Ronge, 2002). We thus expect our prices to accurately reflect the value of firms and
the extent of discrimination by the Nazis against Jewish firms.
We calculate net returns for firm i in week t from weekly stock prices (pi,t) and dividends
(divi,t), using ri,t = (pi,t + divi,t)/pi,t−1 − 1. Information on stock splits is available only from
July 1934 on. Therefore, we treat net returns prior to July 1934 that exceed 95% as stock splits
and those lower than -45% as reverse stock splits. Additionally, we winsorize each firm’s returns
at the 0.5% and the 99.5% level. These steps do not have any particular effect on our results.8
[Table 1 about here]
Table 1 reports descriptive statistics for the Berlin stock exchange between December 1923
and December 1940. There are 1,498 firms in the raw data set, but for some of these firms
we have very few stock prices. Thus, we include only firms with at least ten stock prices.
This filtering leaves us with 1,343 firms. Next, we need a firm’s sector to account for potential
differences between sectors. We exclude firms for which we have no information on sector. The
filter mostly affects firms that were listed in Berlin before 1932. Thus, firms that were listed
6Our results are robust to excluding six weeks before and after the crisis from the sample.7Collecting stock prices more frequently adds little value because of sporadic trading. Ferguson and Voth (2008)
encounter the same problem. While they use only monthly returns, we believe that for this study weekly returns are thebest trade-off between losing information through data aggregation and suffering from too many missing observations.
8In our sample, some firms offered subscription rights while issuing new stocks. We cannot adjust stock prices forsubscription rights as we do not have the necessary information. Not adjusting may result in an abnormal performanceof some -1% to -2% per year (Stehle and Hartmond, 1991), but there is no evidence that subscription rights differedacross Jewish and non-Jewish firms. The results in Huber et al. (2019) remain almost identical after adjusting forsubscription rights.
9

during the period of interest (the “Aryanizations” of 1933–1938) are hardly affected.9 We are
left with 979 firms, including 57 Jewish firms for which we cannot find an “Aryanization” date.10
We drop these 57 firms, and proceed using 922 firms, 109 Jewish (with an “Aryanization” date)
and 813 non-Jewish. This is conservative econometrically, as any misclassification of Jewish
firms as non-Jewish would make it harder for us to find significant discounts.
Jewish and non-Jewish firms have similar return distributions in terms of mean, standard
deviation, skewness, kurtosis, and minimal and maximal returns. Differences in means and
standard deviations are insignificant. There are 567 return observations for the average Jewish
firm and only 449 return observations for the average non-Jewish firm. The difference arises
from the fact that Jewish firms were more active in sectors in which firms tend to have more
observations. There are similar numbers of missing observations for Jewish and non-Jewish
firms, which is reflected in the mean percentage of price quotations while the firm was listed
(81.49% and 77.47%, respectively). Both groups have a very low mean AR(1) coefficient, which
suggests little autocorrelation in the return time series.
[Figure 1 about here]
Plotting Jewish and non-Jewish firm stocks reveals that Jewish firm stocks underperform
after Hitler’s appointment and up until the firms’ “Aryanization,” on average at the end of
1936. Figure 1 shows a one Reichsmark investment in equally weighted portfolios of Jewish
(light gray, solid line) and non-Jewish (dark gray, dashed line) firm stocks during three different
periods. The graphs account for stock splits and assume dividend reinvestment.
Between December 1923 and Hitler’s appointment in January 1933 (Panel A), both firm
groups perform rather similarly. The plot also shows the recovery of Germany’s economy in
the mid-1920s after the end of the hyperinflation in November 1923 and the Great Depression
of the early 1930s. The gap in the graph indicates the banking crisis during which the Berlin
stock exchange stopped trading.
After the Nazis took power, Jewish firms consistently underperformed non-Jewish firms until
the end of 1936, the year in which Jewish firms were “Aryanized” on average (Panel B). Panel
C shows that both groups of stocks performed almost identically thereafter.
9As a robustness check, we include these firms as a separate sector (“Unclassified”). Results remain virtually thesame.
10Our results remain virtually the same when we include the 57 Jewish firms with imputed median “managerAryanization” and “owner Aryanization” years (1935 and 1937, respectively).
10
Our primary objective is to investigate the temporary underperformance of Jewish firms
shown in Panel B.
[Table 2 about here]
We create a sector-dependent benchmark to account for co-movement of a firm’s stock and
its sector. The Handbuch der deutschen Aktiengesellschaften lists 24 sectors, some with only
five firms. We combine sectors with the highest pairwise correlation of the sector indices to
reduce the number to 11. This procedure ensures a sufficient number of firms in every sector
(Table 2, Column labeled All). The smallest sector (Insurance) now has 43 firms. There were
more Jewish firms than others in Mining (20% vs. 6% for non-Jewish firms) and Electricity,
Rubber, Commerce (17% vs. 7%). Jewish firms were underrepresented in Insurance (2% vs.
6%) and Transportation (5% vs. 9%). Other differences were minor, such as in Banking (7%
and 9% for Jewish and non-Jewish firms, respectively).
We compute sector returns as returns of an equal-weighted portfolio of all sector firms. We
use the yield of German government bonds with an approximate time to maturity of five years
to obtain the risk-free rate, as those bonds have the fewest missing observations in our sample.
We use the risk-free rate of the previous week whenever an observation is missing. The risk-free
rate has an annualized mean of 6.40%.
[Table 3 about here]
Table 3 shows the distribution of Jewish firm “Aryanization” years (Column 1). Columns 2
and 3 depict the distributions of “manager Aryanizations” and “owner Aryanizations,” respec-
tively. While “manager Aryanizations” cluster at the beginning (1933) and the end (1938) of
“Aryanizations,” most Jewish-owned firms were “Aryanized” in 1938 via the decree on the use
of Jewish assets (Verordnung uber den Einsatz des judischen Vermogens). The total number of
“manager Aryanizations” and “owner Aryanizations” add up to 123 instead of the 109 “Aryan-
izations” in Column 1. The difference indicates that 14 firms had both Jewish managers and
Jewish owners.
3 Methodology and Results
We want to investigate whether discrimination against Jewish firms during the Third Reich
affected their stock market performance.
11
3.1 Model of Stock Returns
We start by comparing the excess returns of Jewish and non-Jewish firms using a one-factor
model, where the factor for each firm is the average excess return of its sector portfolio. We
model a general intercept α for all firms and an additional Jewish intercept αJ for then-current
or former Jewish firms (i.e., the Jewish indicator variable Ji,t is one). For more precise estimates,
we allow only one intercept for all firms and another one for all Jewish firms. In this setup, the
baseline α measures the abnormal return for non-Jewish firms and αJ the additional abnormal
return for the Jewish firms on which we focus the analysis. The total Jewish abnormal return
is thus α+ αJ .
The regression is:
ri,t − rf,t = (α+ αJJi,t) + βi (rs,t − rf,t) + ui,t, (1)
where, during week t, ri,t is the return of firm i, rf,t is the risk-free rate, rs,t is the equal-weighted
return of the firm’s sector, and ui,t is the error term. We estimate the coefficients α, αJ , and βi
using ordinary least squares. We use clustered standard errors at the weekly level to account
for potential firm heterogeneity. Note that all returns are annualized throughout the study.
To further address probable variation in the intensity of Jewish firm discrimination over
time, we split intercepts, slope parameters, and indicator variables into three subperiods. Our
first subperiod starts with the the beginning of our sample in December 1923 and ends with
Hitler’s appointment as chancellor of Germany on January 30, 1933. We refer to these years of
the Weimar Republic as Weimar.
Our second subperiod extends from Hitler’s appointment to the end of each firm’s “Aryan-
ization” year and is firm-specific. Such firm-specific cutoffs permit a more precise analysis of
Jewish firm performance before and after their “Aryanization.”11 For non-Jewish firms, we em-
ploy a placebo test and randomly assign “Aryanization” years by drawing from the distribution
of Jewish firms’ “Aryanization” years, which is on average 1936. We refer to this subperiod as
Pre-Aryanization.
Our third subperiod is again firm-specific and includes the weeks after the firm’s (placebo)
“Aryanization” year until the end of our sample in December 1940. We refer to the third
subperiod as Post-Aryanization throughout. The complete regression is:
11Firm-specific cutoffs are econometrically potentially an issue, but the results stay the same if we use the medianor mode “Aryanization” year (1936 and 1938, respectively) for all firms.
12

ri,t − rf,t =∑
p∈{Weimar,Pre-Aryanization,Post-Aryanization}
(αp + αp
JJpi,t
)+ βpi (rs,t − rf,t) + ui,t, (2)
where Jpi,t is an indicator variable taking a value of one if firm i is (formerly) Jewish. The
superscript p indicates the subperiod and corresponds to Weimar, Pre-Aryanization, or Post-
Aryanization. The intercepts αp and αpJ and the slope parameters βpi depend now on the
subperiods, too.
3.2 Stock Returns for Jewish and Non-Jewish Firms
For non-Jewish firms, the average abnormal return α in Table 4 during Weimar is slightly
negative and statistically insignificant. During Pre-Aryanization and Post-Aryanization, the
abnormal return is close to zero and insignificant. We note that the weighted abnormal return
across all firms and all subperiods needs to be zero as the sector portfolios include all firms.12
[Table 4 about here]
For Jewish firms, during Weimar, we expect little discrimination, and the Jewish abnormal
return αWeimarJ should be zero. Indeed, the coefficient of 0.51% is statistically insignificant.
With the increasing discrimination against Jewish firms after Hitler’s rise to power and up
until their “Aryanization,” we expect a negative Jewish abnormal return αPre-AryanizationJ . As
expected, we can strongly reject a zero coefficient and find a discount of 4.08% (significant
at the 5% level). Finally, we expect the discount αPost-AryanizationJ to revert to zero after the
“Aryanization” of formerly Jewish firms. The abnormal return is 0.53% and insignificant. We
conclude that Jewish firms suffered significant discounts after Hitler’s appointment as chancellor
and before their “Aryanization.”
Next, we analyze the firm-specific betas, and find that they change over our three subperiods.
Between Weimar and Pre-Aryanization, the difference in betas is significant at the 5% level for
28% of betas and between Pre- and Post-Aryanization for 8% of betas. Thus, we allow betas
to change between subperiods in all subsequent regressions.
To see whether investors were able to identify Jewish firms, we analyze the abnormal returns
of non-Jewish firms that could be incorrectly perceived as Jewish because of their “Jewish
12This does not hold for log returns, as the log of average returns is not equal to the average of log returns. Wethus use net returns.
13

sounding” names. These are firms with frequently used Jewish surnames in their firm name.
These firms did not experience any specifically mandated discriminating actions. Thus, their
abnormal returns should be zero. Indeed, Jewish sounding firms performed just like other non-
Jewish firms in all three subperiods. This finding suggests that investors were able to distinguish
between actual Jewish firms and Jewish sounding firms. We describe these results in more detail
later.
3.3 Results for Jewish-Managed and Jewish-Owned Firms
Jewish-managed and Jewish-owned firms experienced different types of discrimination. Jewish-
managed firms mostly suffered actions aimed directly at the firm, such as boycotts and the
suspension of contracts. Jewish-owned firms, however, typically encountered indirect discrimi-
nation, as most of the actions targeted the Jewish owners themselves, such as the decree on the
use of Jewish assets. Moreover, the public might have found Jewish ownership hard to detect.
Thus, we analyze if Jewish-managed firms performed differently from Jewish-owned firms.
In our regressions, we replace the single indicator variable for Jewish firms with two indicator
variables, one for Jewish-managed and another for Jewish-owned firms. The new equation is:
ri,t − rf,t =∑
p∈{Weimar,Pre-Aryanization,Post-Aryanization}
(αp + αp
JMJMpi,t + αp
JOJOpi,t
)+ βpi (rs,t − rf,t) + ui,t, (3)
where JMpi,t is an indicator variable taking a value of one if firm i is (formerly) Jewish-managed
and JOpi,t is an indicator variable taking a value of one if firm i is (formerly) Jewish-owned. We
estimate the coefficients βpi , αp, αpJM , and αp
JO using ordinary least squares. The remaining
variables are defined in a manner analogous to those in Equation (2), and we cluster standard
errors at the weekly level.
[Table 5 about here]
The average “Aryanization” years of Jewish-managed and Jewish-owned firms are 1935 and
1937, respectively. The results in Table 5, Regression (3), reveal discrimination as Jewish-
managed firms suffered a negative abnormal return of 4.79% during Pre-Aryanization, statis-
tically significant at the 5% level. Abnormal returns are low and insignificant during Weimar
and after firm “Aryanization.” The results suggest that Jewish-managed firms underperformed
after Hitler’s appointment but only until the firms’ Jewish managers were forcibly removed.
14

We cannot find any significant discounts for Jewish-owned firms. The abnormal return
during Pre-Aryanization is -1.96% but insignificant. Abnormal returns are low and insignificant
during Weimar and after firm “Aryanization.” Hence, in all three subperiods, we cannot reject
the null hypothesis that the stock of Jewish-owned firms performed similarly to the stock of
non-Jewish firms. This finding suggests that the effect of discrimination focused more on Jewish-
managed firms and less on Jewish-owned firms. Further, if the seizure of Jewish investors’ stock
happened over the counter and possibly at a discount, market prices might not reflect the
transaction.
The average abnormal return of non-Jewish firms is almost identical to that in Table 4,
Regression (2). The small difference arises from the fact that some Jewish firms are both Jewish-
managed and Jewish-owned; these firms are weighted slightly differently in Regressions (2) and
(3).13
4 Explanations for the Underperformance
of Jewish Firms’ Stock
We can easily rule out two possible explanations for the underperformance of Jewish-managed
firms’ stock. First, discounts were not driven by any concentration of Jewish-managed firms in
poorly performing sectors, as we control for sector in the regressions. Similarly, discounts did
not occur because Jewish-managed firms were riskier than non-Jewish firms, as we control for
systematic risk through firm-specific betas. Additionally, the comparative statistics on Jewish
and non-Jewish firm stock returns are similar, and differences are statistically insignificant.
We next test three hypotheses that could explain the discounts, namely, harassment, brain
drain, and Jewish stigma by comparing their predicted abnormal return patterns with the
empirical patterns. We collect the predictions in Figure 2.
[Figure 2 about here]
The harassment hypothesis would explain the discounts through lower cash flows due to
harassment of Jewish-managed firms. Before Hitler’s appointment, there was much less harass-
ment than during the Third Reich, so we do not expect any differences in abnormal returns
between Jewish and non-Jewish firms during Weimar ; see Figure 2, Panel A.
13In untabulated results, we separately group together firms that are simultaneously Jewish-managed and Jewish-owned. These results provide no further insights.
15

After Hitler’s appointment, harassment intensified radically. Nazi brown shirts blocked some
department store entrances of Jewish-managed and Jewish-owned firms, stopping customers.
The widespread harassment forced investors to reduce their expectations of future cash flows,
resulting in lower stock prices and negative abnormal returns; see Pre-Aryanization in Panel
A. Note that persistent discounts during the earlier part of Pre-Aryanization require a pattern
of investors repeatedly lowering cash flow expectations. They do so if they are repeatedly
surprised by how much worse the harassment could become. As the change in harassment
intensity becomes more predictable, the negative abnormal returns should slowly disappear; see
the later part of Pre-Aryanization in Panel A.
After “Aryanization,” harassment should stop as there would no longer be any Jewish firms.
If the loss in cash flow has been permanent (customers never returned), then there will be no
reversal of the discounts during Post-Aryanization. If the loss in cash flows reverts (customers
return after the brown shirts are gone), we would see temporary positive abnormal returns. We
depict the former case in Panel A.
The brain drain hypothesis argues that Jewish managers were more skillful than their non-
Jewish counterparts. Huber et al. (2019) make this point and document that Jewish managers
were better connected and more educated than non-Jewish managers. Then, Jewish-managed
firms should outperform non-Jewish firms, have higher cash flows, and exhibit higher stock
prices. Thus, we expect positive abnormal returns while the Jewish manager is with the firm,
i.e., during Weimar and the earlier part of Pre-Aryanization (Figure 2, Panel B).
Around the replacement of the probably more highly skilled Jewish manager by a potentially
less-skilled non-Jewish manager, we expect the positive abnormal returns to revert to zero as the
firm loses its advantage over competitors. If investors anticipate the replacement, the decline
in positive abnormal returns should start during the later part of Pre-Aryanization.
During Post-Aryanization, abnormal returns should be zero as the new non-Jewish manager
only has an average skill level and cannot consistently create positive abnormal returns; see
Post-Aryanization in Panel B.
According to the Jewish stigma hypothesis, investors sell stocks of Jewish-managed firms
as they do not want (or do not want to be seen) to own such ostracized firms. Before Hitler’s
appointment, Jewish stigma should be low, and we should not observe any abnormal returns
during Weimar (Figure 2, Panel C).
After Hitler’s appointment, Jewish stigma builds up. Declining demand for shares of Jewish-
16

managed firms depresses prices, and we should observe negative abnormal returns. See the
beginning of Pre-Aryanization in Panel C. After that, the situation is similar to the case of
so-called vice stocks, where firms are stigmatized because of what they produce, e.g., tobacco
or weapons. As long as the cash flows of such companies do not suffer, the remaining investors
should experience positive abnormal returns. See the middle part of Pre-Aryanization in Panel
C. The positive abnormal returns persist until a new equilibrium is reached, and abnormal
returns return to zero, as shown in the later part of Pre-Aryanization in Panel C. The speed
of attaining the equilibrium depends on the demand of the remaining investors willing to buy
Jewish-managed firms’ stock.
Once the stigma is eliminated, which would be after “Aryanization,” stock prices should
increase due to increased demand for the stock. The price increase creates positive abnormal
returns for the then-current investors and persists until a new equilibrium is reached (see the
earlier part of Post-Aryanization). In the new equilibrium, abnormal returns should be zero
again, as depicted in the later part of Post-Aryanization in Panel C.
4.1 Weimar
Our finding of no abnormal return during Weimar matches the harassment and the Jewish
stigma hypotheses but not the brain drain hypothesis. The brain drain hypothesis predicts
positive abnormal returns, as shown in Figure 2, Panel B, although such abnormal performance
may be hard to detect in the data if the skill differential were only small.
4.2 Pre-Aryanization
Figure 2 reveals distinct abnormal return patterns for each of our hypotheses during the early
and late parts of Pre-Aryanization. Thus, we define Early-Pre-Aryanization to start in February
1933 after Hitler’s appointment and through end in December 1934. Late-Pre-Aryanization is
the remainder of Pre-Aryanization, i.e., January 1935 through the end of each firm’s “Aryani-
zation” year.14 The new regression is:
14Note that firms with “Aryanization” years before 1935 appear only in Early-Pre-Aryanization and not in Late-Pre-Aryanization, as the weeks after the “Aryanization” year are associated with Post-Aryanization. Thus, Late-Pre-Aryanization only contains the later part of Jewish-managed firms that are “Aryanized” after 1934.
17
ri,t − rf,t =∑
p∈{Weimar,Early-Pre-Aryanization,Late-Pre-Aryanization,Post-Aryanization}
(αp + αp
JMJMpi,t + αp
JOJOpi,t
)+ βpi (rs,t − rf,t) + ui,t, (4)
where the subperiods Early- and Late-Pre-Aryanization are defined as above. We estimate
the coefficients βpi , αp, αpJM , and αp
JO using ordinary least squares. The remaining variables’
definitions are analogous to those in Equation (3), and we cluster standard errors at the weekly
level.
[Table 6 about here]
For Jewish-managed firms, the abnormal return of Early-Pre-Aryanization is strongly neg-
ative at 8.05% and statistically significant at the 10% level, as seen in Table 6. The abnormal
return during Late-Pre-Aryanization is only -1.12% and statistically insignificant. The abnor-
mal returns during Weimar and Post-Aryanization are close to zero and insignificant, much
like the main results in Table 5. This finding suggests that discounts are concentrated during
the first two years after Hitler’s appointment – also for firms that are “Aryanized” after 1934.
For Jewish-owned and non-Jewish firms, the more detailed analysis does not provide any
new insights. The abnormal return of Jewish-owned firms during Early-Pre-Aryanization is
negative (-6.65%) but statistically insignificant. The abnormal returns in the other subperiods
are all close to zero and insignificant. As expected, the abnormal returns of non-Jewish firms
in all subperiods are close to zero and insignificant.
The observed abnormal performance of Jewish-managed firms is consistent with the ha-
rassment hypothesis (see Figure 2, Panel A). The predicted negative abnormal return during
Early-Pre-Aryanization shows up in a negative and significant coefficient. The insignificant
estimate for Late-Pre-Aryanization is consistent with a reversion of abnormal returns to zero.
The pattern is inconsistent with the brain drain hypothesis, as the predicted estimate for
Early-Pre-Aryanization is positive, not negative (see Figure 2, Panel B). Nor is the pattern fully
consistent with the Jewish stigma hypothesis. Negative and positive abnormal returns should
broadly average to some value close to zero during Early-Pre-Aryanization (see Figure 2, Panel
C). If the positive abnormal returns during the second half of Early-Pre-Aryanization, however,
are small (with little demand from investors willing to buy Jewish-managed firms’ stock), initial
negative abnormal returns could dominate estimation of the coefficient.
18
4.3 Post-Aryanization
Figure 2, Panel C, reveals distinctively different abnormal return patterns for the stigma hy-
pothesis during the early and late parts of Post-Aryanization. Thus, we define Early-Post-
Aryanization as the first two years after firms’ “Aryanization.” Late-Post-Aryanization is the
next stage of Post-Aryanization, i.e., the third year after “Aryanization” through December
1940. The regression is:
ri,t − rf,t =∑
p∈{Weimar,Pre-Aryanization,
Early-Post-Aryanization,Late-Post-Aryanization}
(αp + αp
JMJMpi,t + αp
JOJOpi,t
)+ βpi (rs,t − rf,t) + ui,t, (5)
where subperiods Early- and Late-Post-Aryanization are defined as above. We estimate the
coefficients βpi , αp, αpJM , and αp
JO using ordinary least squares. Other variables are defined
analogously to those in Equation (3), and we cluster standard errors at the weekly level.
[Table 7 about here]
Abnormal returns of Jewish-managed firms during Early-Post-Aryanization are negative
and insignificant; see Table 7. During Late-Post-Aryanization, the coefficient is positive but
again insignificant. These findings do not suggest a reversal of negative abnormal returns.
Jewish-owned firms have a small positive abnormal return of 0.55%, which is insignificant, in
the two years after “Aryanizations.” During Late-Post-Aryanization, the intercept is negative
and also insignificant. As expected, abnormal returns of non-Jewish firms during Early- and
Late-Pre-Aryanization are close to zero and insignificant.
The findings of no abnormal returns for Jewish-managed firms during all of Post-Aryan-
ization are in line with the harassment and brain drain hypotheses (see Figure 2, Panels A
and B). The Jewish stigma hypothesis contradicts our finding, as it predicts a positive and
significant estimate during Early-Post-Aryanization (see Figure 2, Panel C). We should note
that the positive abnormal returns might not show up in the data if prices increased only by a
little or slowly.
4.4 Jewish Managers in Very Important Positions
The brain drain hypothesis suggests that a Jewish manager who occupies a very important
position (VIP) adds more abnormal return to a Jewish-managed firm than an ordinary manager.
19

We define a VIP manager as a member of the executive board or as chairperson of the supervisory
board. Jewish VIP-managed firms are defined as “Aryanized” as soon as the VIP manager leaves
the firm or moves to a non-VIP position, such as an ordinary seat on the supervisory board. The
remaining Jewish-managed firms are defined as “Aryanized” as soon as no non-chair member
of the supervisory board is Jewish.
Jewish VIP-managed firms should experience the same pattern as depicted in Figure 2,
Panel B. The VIP manager should create even higher cash flows for the firm, however, resulting
in more positive abnormal returns. Abnormal returns of Jewish VIP-managed firms should
revert to zero in the same way as they did for other Jewish-managed firms during Late-Pre-
Aryanization (see Figure 2, Panel B). The harassment and stigma hypotheses’ predictions by
contrast are not affected by a manager’s VIP status.
We add an indicator variable for Jewish VIP-managed firms to regression (3). The regression
equation becomes:
ri,t − rf,t =∑
p∈{Weimar,Pre-Aryanization,Post-Aryanization}
(αp + αp
JMJMpi,t + αp
V IPV IPpi,t + αp
JOJOpi,t
)
+ βpi (rs,t − rf,t) + ui,t, (6)
where V IP pi,t is an indicator variable taking a value of one if firm i is (formerly) Jewish-managed
with a VIP manager. We estimate the coefficients βi, αp, αp
JM , αpV IP , and αp
JO using OLS.
The coefficient αpV IP measures the additional abnormal return that Jewish VIP-managed firms
experience over non-VIP Jewish-managed firms. Other variables are defined as in Equation (3),
and we cluster standard errors at the weekly level.
[Table 8 about here]
We report the results in Table 8. Compared to the base results of Table 5, Regression (3), the
abnormal return of all Jewish-managed firms during Weimar becomes more negative (-2.00%)
but remains statistically insignificant. The average abnormal return during Pre-Aryanization
also becomes more negative (-6.06%) and is statistically significant at the 10% level. The coeffi-
cient for Post-Aryanization remains the same – slightly negative and statistically insignificant.
For Jewish VIP-managed firms, coefficients are positive but insignificant during Weimar and
Pre-Aryanization (2.98% and 2.37%, respectively). During Post-Aryanization, the coefficient is
slightly negative at -0.86% and again statistically insignificant. Thus, we cannot reject the null
20

hypothesis of no additional abnormal returns for VIP-managed Jewish firms during any of our
three subperiods. This finding further invalidates the brain drain hypothesis. The coefficients
of non-Jewish and Jewish-owned firms remain virtually the same, as expected.
4.5 Divesting Jewish Firms’ Stock
If the Jewish stigma hypothesis holds, investors should sell their shares of Jewish-managed firms
as a stigma develops during Early-Pre-Aryanization. Investors would replace shares of Jewish-
managed firms with shares of non-Jewish firms. Such replacement would simultaneously cause
negative shocks in Jewish-managed firm stock and positive shocks in non-Jewish firm stock.
The firm-specific shocks are captured by the residuals in our one-factor model (Equation 4).
Thus, residuals of Jewish-managed and non-Jewish firms should be negatively correlated during
Early-Pre-Aryanization.
To capture the average correlation between the residuals of Jewish-managed and non-Jewish
firms, we form an equal-weighted portfolio of Jewish-managed firm residuals and an equally
weighted portfolio of non-Jewish firm residuals. We measure both portfolios’ correlation during
Weimar, Early-Pre-Aryanization, Late-Pre-Aryanization, and Post-Aryanization. Note that
any firm’s residuals are negatively correlated with the residuals of the remaining firms of the
same sector by construction because our model computes sector returns from all sector firms. To
determine if divestitures affect correlations of residuals beyond their default negative correlation,
we bootstrap the distribution of correlation coefficients.
We do so by randomly sorting firms into three groups whose sizes correspond to the sizes of
the original Jewish-managed, Jewish-owned, and non-Jewish groups, respectively. For each sort,
we rerun Regression (4) from Section 4.2, obtain for the three groups their average residuals,
and compute the correlation between them. We repeat these steps a thousand times, generating
a bootstrapped distribution of correlation coefficients.
[Table 9 about here]
Table 9 reports the correlation between Jewish-managed and non-Jewish firms’ average resid-
uals during Weimar, Early-Pre-Aryanization, Late-Pre-Aryanization, Post-Aryanization, and
the whole sample (Total) in Column Correlation. As expected, all correlations are negative and
range from -0.72 to -0.63. For each period, correlation coefficients lie between the 5th and the
95th percentiles. In a two-sided test, we cannot reject the null hypothesis that the residuals of
21

Jewish-managed and non-Jewish firms are correlated only to the extent mechanically induced
by the sector averages. Untabulated correlations between Jewish-owned and non-Jewish firms
range from -0.57 to -0.39 and also lie between the 5th and the 95th percentiles.
This finding contradicts the portfolio replacement story and does not support the Jewish
stigma hypothesis. The harassment and the brain drain hypotheses do not predict a significantly
more negative correlation of residuals compared with the baseline negative correlation.
A related suggestion is that non-Jewish close competitors ought to gain from the travails of
Jewish firms. We identify such close competitors as non-Jewish firms that share the first two
digits of the U.S. Standard Industrial Classification categories. Untabulated results turn out to
be insignificant throughout. Non-Jewish close competitors do not seem to have gained from the
discrimination against Jewish firms.
4.6 Collecting the Evidence
Which hypothesis fares best? We provide a quick overview in Table 10, where we mark test
results consistent with a hypothesis’ prediction with a check mark and inconsistent results with
a cross-out.
[Table 10 about here]
The harassment hypothesis passes all five of our tests. The predicted abnormal return
pattern in Figure 2, Panel A, matches the observed pattern in all three subperiods (Rows T1–
T3). Further, Jewish VIP-managed firms are predicted to perform like other Jewish-managed
firms (Row T4), and the correlation of residuals should not be affected by stock replacements
(Row T5).
The brain drain hypothesis matches the abnormal return pattern only during Post-Aryani-
zation (Row T3) and the divestment test (Row T5). The predicted pattern of abnormal returns
depicted in Figure 2, Panel B, does not match the observed pattern during Weimar and Pre-
Aryanization (Rows T2 and T3, respectively). Further, the brain drain hypothesis predicts
that VIP-managed firms will experience stronger abnormal returns than other Jewish-managed
firms, which we cannot find in the data (Row T4). Overall, the brain drain hypothesis passes
only two of five tests.
The Jewish stigma hypothesis does not fare any better, as it also passes only two of five
tests. During Weimar, the result of no abnormal returns matches the hypothesis’ prediction in
22

Figure 2, Panel C (Row T1), but the pattern does not match during Pre- and Post-Aryanization
(Rows T2 and T3, respectively). The stigma hypothesis predicts no differences between VIP-
managed and other Jewish-managed firms, which is in line with our finding (Row T4). Yet
simultaneous selling of Jewish firms’ shares and reinvestment into non-Jewish shares should lead
to a correlation of residuals that is more negative than the correlation mechanically induced by
the sector averages. We cannot find such a significantly more negative correlation (Row T5).
To sum this up, the harassment hypothesis predicts all our findings and seems to be the
most suitable explanation. The brain drain and stigma hypotheses seem to be less relevant.
5 Robustness
Next we analyze the sensitivity of our results to our choice of factor model, subperiods, winsoriz-
ing, filtering, and consideration of Jewish-sounding firms. To save space, we report estimates for
only Regression (3), i.e., Jewish-managed and Jewish-owned firms are investigated separately
during the three subperiods Weimar, Pre-Aryanization, and Post-Aryanization. Changes in the
other regressions are very similar.
5.1 Factor Model Choice
When investigating our finding’s dependence on the choice of the factor in our model, we
find that our main result of negative abnormal returns for Jewish-managed firms during Pre-
Aryanization holds.
[Table 11 about here]
First, we replace the sector-specific factor by one equal-weighted market index, see Table 11,
Regression (3a). Then, we exclude a firm from its sector portfolio (Regression 3b), and finally,
we use the value-weighted market index of Ronge (2002) (Regression 3b). In all three cases,
Jewish-managed firm discounts become stronger during Pre-Aryanization. For the regression
with only one market factor, the abnormal return becomes more significant (now at the 1%
level). For non-Jewish firms, we find high positive and statistically significant abnormal returns
during Pre- and Post-Aryanization, when excluding firm i from the sector and using the value-
weighted index.
The abnormal returns of Jewish-owned firms during Pre-Aryanization intensify (-6.01%) and
become significant at the 5% level. Such a significant underperformance of Jewish-owned firms
23

would further support the harassment hypothesis, as the discount could be explained by investors
updating their expectations for Jewish-owned firms. The brain drain hypothesis cannot explain
this finding, as Jewish-owned firms were not forced to dismiss their (non-Jewish) managers.
The stigma hypothesis would again predict sharp initial discounts followed by positive abnormal
returns in Pre-Aryanization and positive abnormal returns in Post-Aryanization, which we do
not see.
Other changes are relatively small, and coefficients remain insignificant. Overall, our main
findings hold.
5.2 Firm-Specific Subperiods
Firm-specific cutoffs between Pre- and Post-Aryanization periods are econometrically fraught,
as test statistics might be biased. Instead, we subsequently use for all firms the mode and
median “Aryanization” year – 1938 and 1936, respectively. Thus, subperiods are of identical
lengths for all firms, and test statistics are well-specified.
[Table 12 about here]
We report the results in Table 12, Regressions (3d) and (3e), respectively. In both cases,
the abnormal return of non-Jewish firms during Pre-Aryanization increases to roughly half
a percent and becomes significant at the 10% level. The negative abnormal performance of
Jewish-managed firms remains almost unchanged and remains significant at the 5% level. The
remaining estimates remain close to zero and insignificant. Overall, changing the cutoff barely
affects the estimates, and our main result still holds.
5.3 Winsorizing and Filtering
Our hand-collected data are susceptible to erroneous stock prices. These errors may originate
from copying or from the Berliner Borsenzeitung itself. To improve data quality in our main
runs, we winsorize each firm’s stock return distribution at the 0.5% and the 99.5% level.
[Table 13 about here]
Stronger winsorizing, for example, at 1.0% and 99.0% or even 2.5% and 97.5%, barely affects
our results (see Table 13, Regressions 3f and 3g, respectively). As expected, the abnormal
performance of Jewish-managed firms during Pre-Aryanization becomes less negative, yet the
estimate stays significant at the 5% level.
24

We report results from returns without winsorizing in Regression (3h). The discount of
Jewish-managed firms during Pre-Aryanization is slightly lower and significant only at the 10%
level. The abnormal return of Jewish-managed firms during Weimar increases to 3.04% but
remains insignificant. The other estimates remain close to zero. Overall, our main finding still
holds.
[Table 14 about here]
To reduce data noise in our main results, we exclude all firms with fewer than ten observa-
tions. To analyze the sensitivity of our results to this filter, we first increase the threshold to
200 observations (Table 14, Regression 3i). Our results stay virtually the same.
Next, we include firms for which we could not identify the sector. We collect these firms
in a twelfth sector called “Unclassified” (Table 14, Regression 3j). The abnormal return of
non-Jewish firms during Weimar drops to -0.41% and becomes significant at the 10% level.
The abnormal performance of Jewish-managed firms during Pre-Aryanization stays the same.
Other estimates remain similar and insignificant. Our main finding holds.
As we require Jewish firm “Aryanization” years for firm-specific cutoffs between Pre- and
Post-Aryanization, we are forced to drop 57 Jewish firms for which we could not find “Aryaniza-
tion” dates. We include these firms and use the median “Aryanization” years of Jewish-managed
and Jewish-owned firms (Table 14, Regression 3k). The abnormal return of Jewish-managed
firms intensifies to -5.24% and becomes significant at the 1% level. Other estimates remain very
similar and insignificant. We find that our main result still holds.
In another run, we include only firms with stock prices available for more than 80% of all
the weeks they are listed on the Berlin stock exchange (Table 14, Regression 3l). The abnormal
return of non-Jewish firms during Pre-Aryanization increases to 0.84% and becomes significant
at the 10% level. Other estimates are similar to the base model results. Overall, our main result
holds.
Next, government bond yields might not reflect the appropriate risk-free rate. We increase
the risk-free rate in all periods by two percentage points and observe only negligible differences
in the estimates (Table 14, Regression 3m). Similarly, for a two percentage point decline (Table
14, Regression 3n) estimates barely change.
[Table 15 about here]
As we have stock split information only from July 1934 on, we assume that very large
negative (positive) returns before this date are caused by (reverse) stock splits. We repeat our
25

analysis without this assumption (Table 15, Regression 3o). Again, the results remain virtually
the same.
Stocks with very low prices are more strongly affected by discretization, i.e., steps of 0.25
Reichsmark, than stocks with high stock prices. Thus, stocks with low prices are characterized
by relatively high variance. We exclude all observations for which the stock price is below 5
Reichsmark. This threshold corresponds to the 0.5th percentile of the distribution of all stock
prices. We find that our results stay virtually the same (Table 15, Regression 3p).
We exclude six weeks preceding and following the banking crisis of 1931, when return vari-
ances were relatively high. We find that results stay virtually the same (Table 15, Regression 3q).
In 1934, firms were forced to cap their dividends at 6% of their nominal capital. Any
additional earnings a firm wanted to pay out to investors had to be invested into German
government bonds (Ronge, 2002). To see whether Jewish firm underperformance might be
driven by the dividend cap, we repeat our analysis on the subsample of firms that paid dividends
of 6% or less in 1933 and thus were probably not affected by the cap. The subsample consists
of 875 non-Jewish firms and 94 Jewish firms of which 69 were Jewish-managed and 38 Jewish-
owned. Comparing these numbers to the total sample, we find that roughly 14% of Jewish firms
were affected by the dividend cap compared with some 11% of non-Jewish firms. The average
“Aryanization” years of Jewish-managed and Jewish-owned firms remain at 1935 and 1937,
respectively. The abnormal return of Jewish-managed firms during Pre-Aryanization intensifies
to -5.35% and remains significant at the 5% level (see Table 15, Regression 3r). Other estimates
barely change, and our finding stays virtually the same.
5.4 Results for Non-Jewish Firms with Jewish-Sounding Names
We conjecture that investors were able to differentiate between Jewish firms, i.e., firms with
Jewish managers or Jewish owners, and Jewish-sounding firms. The latter group of non-Jewish
firms includes frequently used Jewish surnames in their firm name. These firms should not have
experienced any discrimination. Examples are Byk-Guldenwerke Chemische Fabrik AG, whose
Jewish founder, Heinrich Byk, had left the firm in 1914, and Gritzner-Kayser Aktiengesellschaft,
which had no Jewish affiliation. In our data, we identify 33 of the non-Jewish firms with Jewish-
sounding names.15 We analyze these firms as a new group of firms in Equation (2), and call
15The list of typical Jewish surnames is available at https://www.familyeducation.com/baby-names/
browse-origin/surname/jewish. We excluded surnames that coincide with other generic firm names like Deutscheor Berliner.
26
them “Jewish-sounding.” The complete regression is now:
ri,t − rf,t =∑
p∈{Weimar,Pre-Aryanization,Post-Aryanization}
(αp + αp
JJpi,t + αp
JSJSpi,t
)+ βpi (rs,t − rf,t) + ui,t, (7)
where JSpi,t is an indicator variable taking a value of one if the non-Jewish firm i has a Jewish-
sounding name. We estimate the coefficients αp, αpJ , αp
JS , and βpi using ordinary least squares.
Other variables are defined analogously as for Equation (2), and we cluster standard errors at
the weekly level.
[Table 16 about here]
If investors were able to differentiate between Jewish firms and Jewish-sounding firms, the
stock of Jewish-sounding firms should perform just like the stock of other non-Jewish firms. We
find that Jewish-sounding firms have negative abnormal returns during all three subperiods,
but all estimates are statistically insignificant (see Table 16). Thus, we cannot reject the null
hypothesis that firms with Jewish-sounding names perform like other non-Jewish firms.
6 Total Economic Loss
To quantify the economic impact of “Aryanizing” the German economy, we estimate the total
loss of firm value incurred by Jewish firms due to discrimination. We compute the estimated
loss as the part of the change in a firm’s market value that can be attributed to the abnormal
return of Jewish firms as follows:
Total market value change for Jewish-managed firmsp =∑t∈p
i∈JM
αpJMJM
pi,tMVi,t, (8)
where p indicates the subperiods (Weimar, Pre-Aryanization, and Post-Aryanization); αpJM is
the estimated average weekly discount of Jewish-managed firms obtained from Table 5; JMpi,t is
an indicator variable taking a value of one if firm i was then or formerly Jewish-managed during
subperiod p; and MVi,t is the market value of firm i during week t. The formula for computing
the total loss for Jewish-owned firms is similar to Equation (8).
We have information on market capitalization for only 50 Jewish-managed and 27 Jewish-
owned firms. Thus, we assume that Jewish-managed firms, for which we do not have any market
27
capitalization, have a market capitalization equal to the average observed market capitalization
of Jewish-managed firms. For the Jewish-managed firms that we had to exclude from our sample
because of missing “Aryanization” dates, we additionally assume that they experience the same
abnormal returns as other Jewish-managed firms and that they were “Aryanized” in the average
“Aryanization” year. We treat Jewish-owned firms similarly.
[Table 17 about here]
Jewish-managed firms’ market capitalizations drop in the subperiods Weimar, Pre-Aryan-
ization, and Post-Aryanization (Table 17). The decline is strongest during Pre-Aryanization
(RM 155.57 million), which accounts for the lion’s share of the total RM 164.34 million decline
between February 1933 and December 1940, i.e., after Hitler’s appointment. Jewish-owned
firms experience a loss only during Pre-Aryanization ,of RM 63.39 million. During Weimar and
Post-Aryanization, the change in market value of Jewish-owned firms is positive but small (RM
22.66 million and RM 2.66 million, respectively).
The total loss for Jewish firms between February 1933 and December 1940 amounts to
RM 225.07 million or roughly Euro 4.5 billion today. This figure corresponds to 0.4% of the
German gross national product, which was RM 54.8 billion in 1933 (Rath, 2009), or 3.75% of
the approximately RM 6 billion taxable assets that Jews owned in 1938 (Dippel, 1996). Our
number is substantially lower than the 1.04 billion Reichsmark estimated by Huber et al. (2019).
7 Conclusion
We investigate the most notorious and lethal example of discrimination in history – the persecu-
tion of Jews during the Third Reich. We measure the economic effect of discrimination against
firms with Jewish managers and firms with Jewish owners using weekly hand-collected stock
prices between December 1923 and December 1940. Using a one-factor sector model to estimate
firms’ abnormal returns, we find that firms with Jewish managers significantly underperformed
non-Jewish firms by around 5% annually after Hitler’s appointment as Chancellor of Germany
in January 1933. The abnormal performance persisted until all Jewish managers were ousted, a
firm’s so-called Aryanization. Discrimination against Jewish owners by contrast is not reflected
in stock performance.
The most likely explanation for the negative abnormal returns is harassment. This harass-
ment induced investors to update their expectations about a firm’s future performance. Our
28

results do not support alternative explanations for the underperformance, such as brain drain
and Jewish stigma.
We can quantify the loss of value for Jewish firms between February 1933 and December
1940. The total loss amounts to 0.4% of the German gross national product in 1933 and some
4% of taxable assets that Jewish people owned in 1938.
Our findings show that the adverse effects of discrimination extend beyond the objects of
discrimination. Unrelated bystanders, including investors, employees, and other stakeholders,
can suffer too, even if they do not belong to the discriminated-against minority. Ultimately,
discrimination can affect an economy as a whole.
29
References
Adena, M., Petrova, M., Enikolopov, R., Zhuravskaya, E., Santarosa, V., 2015. Radio and the
rise of the Nazis in prewar Germany. Quarterly Journal of Economics 130, 1885–1939.
Barkai, A., 1989. Die deutschen Unternehmer und die Judenpolitik im Dritten Reich. Geschichte
und Gesellschaft. Zeitschrift fur Historische Sozialwissenschaft 15, 227–247.
Bhattacharya, U., Daouk, H., 2002. The world price of insider trading. Journal of Finance 57,
75–108.
Blau, F. D., Kahn, L. M., 2017. The gender wage gap: Extent, trends, and explanations. Journal
of Economic Literature 55, 789–865.
Burhop, C., 2011. The historiography of the 1931 crisis in Germany. Jahrbuch fur Wirtschafts-
geschichte 52, 9–27.
Busch-Petersen, N., 2010. Leonhard Tietz (1849–1914). Fuhrmannssohn und Warenhauskonig.
Von der Warthe an den Rhein. Hentrich & Hentrich, Berlin.
Card, D., Cardoso, A. R., Kline, P., 2016. Bargaining, sorting, and the gender wage gap:
Quantifying the impact of firms on the relative pay of women. Quarterly Journal of Economics
131, 633–686.
Chatterji, A. K., Seamans, R. C., 2012. Entrepreneurial finance, credit cards, and race. Journal
of Financial Economics 106, 182–195.
Choudhry, T., 2010. World War II events and the Dow Jones Industrial Index. Journal of
Banking & Finance 34, 1022–1031.
Dippel, J. V. H., 1996. Bound upon a Wheel of Fire: Why so many German Jews Made the
Tragic Decision to Remain in Nazi Germany. Basic Books, New York.
Ferguson, T., Voth, H.-J., 2008. Betting on Hitler – The value of political connections in Nazi
Germany. Quarterly Journal of Economics 123, 101–137.
Fohlin, C., 1999. The rise of interlocking directorates in imperial Germany. Economic History
Review 52, 307–333.
30

Hecht, C., 2003. Deutsche Juden und Antisemitismus in der Weimarer Republik. Verlag J.H.W.
Dietz Nachf., Bonn.
Herbst, L., Weihe, T., 2004. Die Commerzbank und die Juden 1933-1945. C.H. Beck Verlag,
Munich.
Herrmann, K. A., 1961. Vermogensstatistik. In: Handworterbuch der Sozialwissenschaften zu-
gleich Neuauflage des Handworterbuchs der Staatswissenschaften, G. Fischer, Stuttgart, pp.
Volume 9, 148–153.
Huber, K., Lindenthal, V., Waldinger, F., 2019. Discrimination, managers, and firm perfor-
mance: Evidance from “Aryanizations” in Nazi Germany. Working paper, Centre for Eco-
nomic Policy Research.
Hudson, R., Urquhart, A., 2015. War and stock markets: The effect of World War Two on the
British stock market. International Review of Financial Analysis 40, 166–177.
James, H., 2001. Die Deutsche Bank und die ”Arisierung”. C.H. Beck Verlag, Munich.
Kwiet, K., 1988. Nach dem Pogrom. Stufen der Ausgrenzung. In: Benz, W. (ed.), Die Juden in
Deutschland 1933-1945. Leben unter nationalsozialistischer Herrschaft , C. H. Beck, Munich,
pp. 545–659.
Lehmann-Hasemeyer, S., Burhop, C., 2014. Die Geografie der deutschen Borsen im Wandel.
Bankhistorisches Archiv 40, 23–37.
Leland, H. E., 1992. Insider trading: Should it be prohibited? Journal of Political Economy 100
859–887.
Lorentz, B., 2002. Die Commerzbank und die ”Arisierung” im Altreich. Ein Vergleich der Net-
zwerkstrukturen und Handlungsspielraume von Großbanken in der NS-Zeit. Vierteljahrshefte
fur Zeitgeschichte 50, 237–268.
Mayda, A. M., Ortega, F., Peri, G., Shih, K., Sparber, C., 2018. The effect of the H-1B quota
on the employment and selection of foreign-born labor. European Economic Review 108,
105–128.
Mosse, W. E., 1987. The German-Jewish Economic Elite, 1820-1935. Oxford University Press,
Oxford.
31
Rath, N., 2009. Rezessionen in historischer Betrachtung. Wirtschaft und Statistik pp. 203–208.
Ronge, U., 2002. Die langfristige Rendite deutscher Standardaktien: Konstruktion eines his-
torischen Aktienindex ab Ultimo 1870 bis Ultimo 1959. Europaische Hochschulschriften 5:
Volks- und Betriebswirtschaft, Lang, Frankfurt am Main.
Ruthers, B., 2012. Die unbegrenzte Auslegung: zum Wandel der Privatrechtsordnung im Na-
tionalsozialismus. Mohr Siebeck, Tubingen, 7th ed.
Scherner, J., 2008. Die Logik der Industriepolitik im Dritten Reich. Die Investitionen in
die Autarkie- und Rustungsindustrie und ihre staatliche Forderung. Franz Steiner Verlag,
Stuttgart.
Schnabel, I., 2009. The role of liquidity and implicit guarantees in the German twin crisis of
1931. Journal of International Money and Finance 28, 1–25.
Schulz, G., 1992. Zwischen Demokratie und Diktatur: Von Bruning zu Hitler. Walter De
Gruyter, Berlin.
Schuman, F. L., 1934. Political theory of German fascism. American Political Science Review
28, 210–232.
Stallbaumer, L. M., 1999. Big business and the persecution of the Jews: The Flick concern and
the “Aryanization” of Jewish property before the war. Holocaust and Genocide Studies 13,
1–27.
Standen, D. J., 1995. Insider trading reforms sweep across Germany: Bracing for the cold winds
of change. Harvard International Law Journal 36, 177.
Stehle, R., Hartmond, A., 1991. Durchschnittsrenditen deutscher Aktien 1954-1988. Kredit und
Kapital 3, 371–411.
32
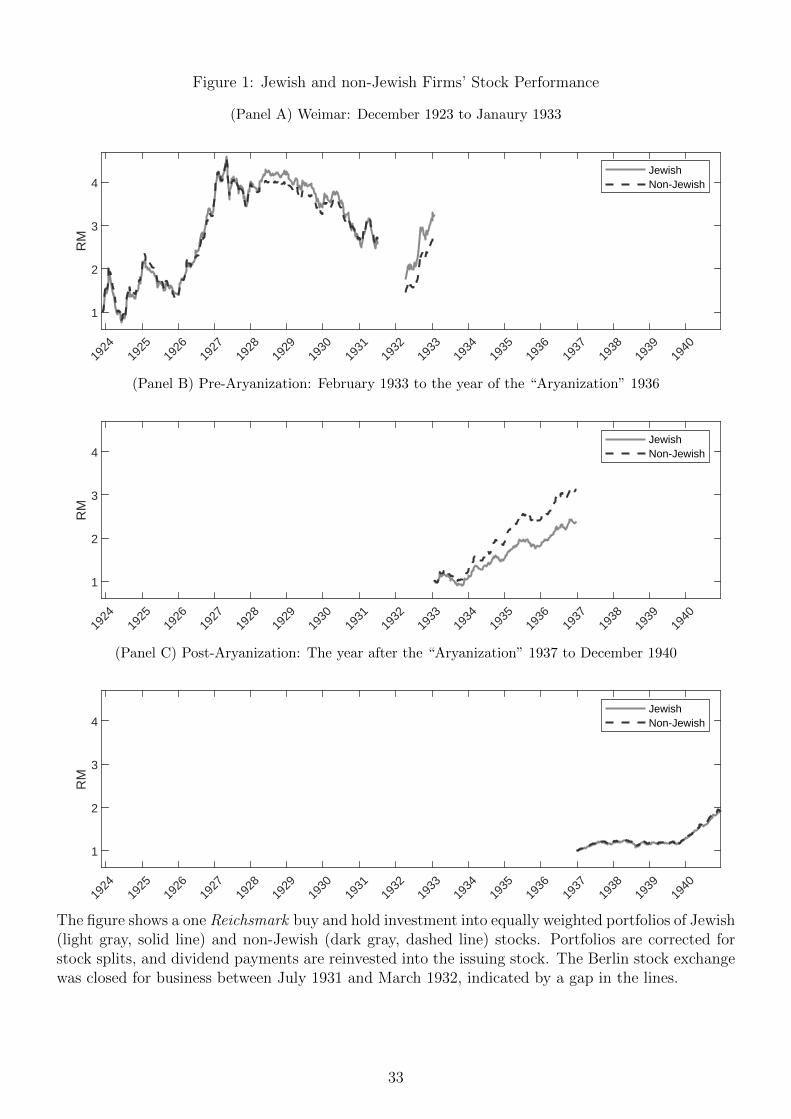
Figure 1: Jewish and non-Jewish Firms’ Stock Performance
(Panel A) Weimar: December 1923 to Janaury 1933
1924
1925
1926
1927
1928
1929
1930
1931
1932
1933
1934
1935
1936
1937
1938
1939
1940
1
2
3
4
RM
JewishNon-Jewish
(Panel B) Pre-Aryanization: February 1933 to the year of the “Aryanization” 1936
1924
1925
1926
1927
1928
1929
1930
1931
1932
1933
1934
1935
1936
1937
1938
1939
1940
1
2
3
4
RM
JewishNon-Jewish
(Panel C) Post-Aryanization: The year after the “Aryanization” 1937 to December 1940
1924
1925
1926
1927
1928
1929
1930
1931
1932
1933
1934
1935
1936
1937
1938
1939
1940
1
2
3
4
RM
JewishNon-Jewish
The figure shows a one Reichsmark buy and hold investment into equally weighted portfolios of Jewish(light gray, solid line) and non-Jewish (dark gray, dashed line) stocks. Portfolios are corrected forstock splits, and dividend payments are reinvested into the issuing stock. The Berlin stock exchangewas closed for business between July 1931 and March 1932, indicated by a gap in the lines.
33

Figure 2: Abnormal Return Pattern Predictions
(Panel A) Harassment Hypothesis
0
Abn
orm
al R
etur
n
(Panel B) Brain Drain Hypothesis
0
Abn
orm
al R
etur
n
(Panel C) Jewish Stigma Hypothesis
0
Abn
orm
al R
etur
n
The figure shows the predicted abnormal return patterns of the harassment, the brain drain, and theJewish stigma hypotheses. We split the time line into three periods, namely, December 1923 throughJanuary 1933 (Weimar), February 1933 through the year of the “Aryanization” (Pre-Aryanization),and the year after the “Aryanization” through December 1940 (Post-Aryanization). In all panels,the first light gray, dashed vertical line corresponds to Hitler’s appointment, the second to “Aryani-zations.”
34

Table 1: Descriptive Statistics
Jewish Firms Non-Jewish Firms
Number of Firms 109 813Mean Number of Returns 566.75 448.72Mean Percentage of
Quotations While Listed81.49% 77.47%
Mean Weekly Net Return 0.39% 0.38%Mean Weekly Net Return – annualized 22.43% 21.80%Mean Standard Deviation 5.47% 6.57%Mean Standard Deviation – annualized 39.44% 47.38%Mean Skewness 1.17 1.20Mean Kurtosis 9.58 9.89Mean Minimum -16.85% -19.22%Mean Maximum 27.14% 31.59%Mean AR(1) Coefficient -0.01 -0.01
We report numbers for Jewish and non-Jewish firms. We report for all groups of firms equallyweighted cross-sectional averages of: number of firms, number of observed returns, mean percentageof quotations while listed, mean weekly net return, annualized mean weekly net return, standarddeviation, annualized standard deviation, and skewness, kurtosis, minimum, maximum, and AR(1)coefficient for weekly net returns. The sample period is December 1923 through December 1940.
35

Table 2: Sector Distribution
Sector All Jewish Firms Non-Jewish Firms
Banks 8.89% 7.34% 9.10%Construction, Stone, Gas, Water, Ice 11.39% 9.17% 11.69%Mining 7.81% 20.18% 6.15%Metal, Machinery, Printing 17.68% 11.93% 18.45%Electricity, Rubber, Commerce 7.92% 16.51% 6.77%Textiles, Movies, Theater, Plantations 8.68% 6.42% 8.98%Chemistry, Leather, Timber 6.07% 7.34% 5.90%Paper, Others 8.35% 8.26% 8.36%Insurance 5.86% 1.83% 6.40%Transportation 8.35% 4.59% 8.86%Breweries, Nutrition 9.00% 6.42% 9.35%
Total 922 109 813
The table presents the relative distribution of All, Jewish, and non-Jewish firms within 11 sectors.The sample period is December 1923 through December 1940.
36

Table 3: Distribution of “Aryanization” Years
Year “Aryanizations”“ManagerAryanizations”
“OwnerAryanizations”
1933 26 24 41934 5 5 11935 15 10 61936 10 12 31937 10 7 41938 38 19 231939 2 1 11940 1 1 01941 1 0 11942 1 0 1
Total 109 79 44
The table shows the distribution of 109 Jewish firms’ “Aryanization” years, consisting of 79 “managerAryanizations” and 44 “owner Aryanizations.” Fourteen firms had Jewish managers and Jewishowners. These firms appear in Columns 2 and 3 but are counted only once in Column 1. The sampleperiod is December 1923 through December 1940.
37

Table 4: Abnormal Performance: Non-Jewish and Jewish Firms
Group Subperiod Regression (2)
Non-Jewish Weimar -0.40%(α) (-1.40)
Pre-Aryanization 0.20%(0.41)
Post-Aryanization 0.21%(0.53)
Jewish Weimar 0.51%(αJ) (0.25)
Pre-Aryanization -4.08%**(-2.49)
Post-Aryanization 0.53%(0.39)
The table shows the annualized abnormal return of non-Jewish and Jewish firms, estimated as eachgroup’s mean abnormal return according to a one-factor sector model. The abnormal return of Jewishfirms is estimated as the additional abnormal return to non-Jewish firms. We split the time-varyingabnormal return into three periods: December 1923 through January 1933 (Weimar), February 1933through the year of the “Aryanization” (Pre-Aryanization), and the year after the “Aryanization”through December 1940 (Post-Aryanization). The average “Aryanization” year is 1936. We useclustered standard errors at the weekly level and report t-statistics in parentheses. ***, **, and *denote statistical significance at the 1%, 5%, and 10% level, respectively.
38
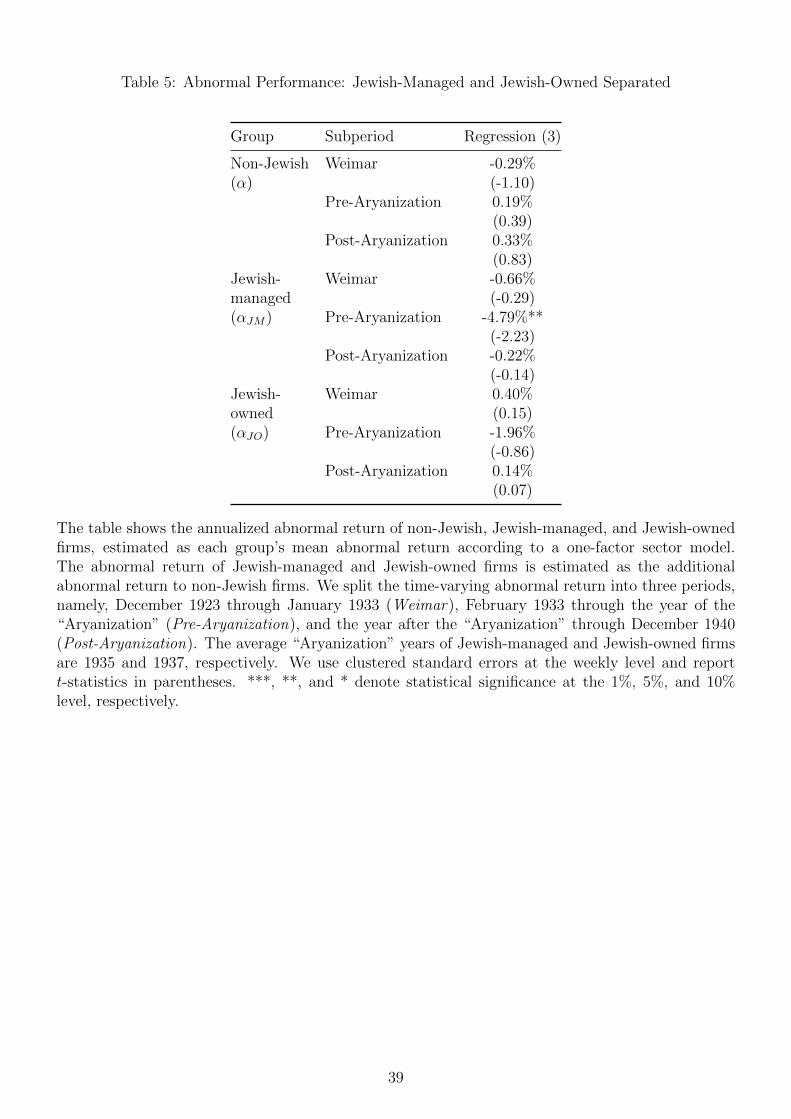
Table 5: Abnormal Performance: Jewish-Managed and Jewish-Owned Separated
Group Subperiod Regression (3)
Non-Jewish Weimar -0.29%(α) (-1.10)
Pre-Aryanization 0.19%(0.39)
Post-Aryanization 0.33%(0.83)
Jewish- Weimar -0.66%managed (-0.29)(αJM) Pre-Aryanization -4.79%**
(-2.23)Post-Aryanization -0.22%
(-0.14)Jewish- Weimar 0.40%owned (0.15)(αJO) Pre-Aryanization -1.96%
(-0.86)Post-Aryanization 0.14%
(0.07)
The table shows the annualized abnormal return of non-Jewish, Jewish-managed, and Jewish-ownedfirms, estimated as each group’s mean abnormal return according to a one-factor sector model.The abnormal return of Jewish-managed and Jewish-owned firms is estimated as the additionalabnormal return to non-Jewish firms. We split the time-varying abnormal return into three periods,namely, December 1923 through January 1933 (Weimar), February 1933 through the year of the“Aryanization” (Pre-Aryanization), and the year after the “Aryanization” through December 1940(Post-Aryanization). The average “Aryanization” years of Jewish-managed and Jewish-owned firmsare 1935 and 1937, respectively. We use clustered standard errors at the weekly level and reportt-statistics in parentheses. ***, **, and * denote statistical significance at the 1%, 5%, and 10%level, respectively.
39

Table 6: Abnormal Performance: Pattern during Pre-Aryanization
Group Subperiod Regression (4)
Non-Jewish Weimar -0.29%(α) (-1.09)
Early-Pre-Aryanization 1.08%(1.24)
Late-Pre-Aryanization -0.67%(-1.33)
Post-Aryanization 0.37%(0.91)
Jewish- Weimar -0.66%managed (-0.29)(αJM) Early-Pre-Aryanization -8.05%*
(-1.96)Late-Pre-Aryanization -1.12%
(-0.58)Post-Aryanization -0.46%
(-0.30)Jewish- Weimar 0.40%owned (0.15)(αJO) Early-Pre-Aryanization -6.65%
(-1.36)Late-Pre-Aryanization 0.38%
(0.18)Post-Aryanization 0.15%
(0.07)
The table shows the annualized abnormal return of non-Jewish, Jewish-managed, and Jewish-ownedfirms, estimated as each group’s mean abnormal return according to a one-factor sector model.The abnormal return of Jewish-managed and Jewish-owned firms is estimated as the additionalabnormal return to non-Jewish firms. We split the time-varying abnormal return into four periods,namely, December 1923 through January 1933 (Weimar), February 1933 through the end of 1935(Early-Pre-Aryanization), the beginning of 1936 through the year of the “Aryanization” (Late-Pre-Aryanization), and the year after the “Aryanization” through December 1940 (Post-Aryanization).Firms “Aryanized” before 1936 do not appear in Late-Pre-Aryanization. The average “Aryanization”years of Jewish-managed and Jewish-owned firms are 1935 and 1937, respectively. We use clusteredstandard errors at the weekly level and report t-statistics in parentheses. ***, **, and * denotestatistical significance at the 1%, 5%, and 10% level, respectively.
40

Table 7: Abnormal Performance: Pattern during Post-Aryanizatoin
Group Subperiod Regression (5)
Non-Jewish Weimar -0.29%(α) (-1.09)
Pre-Aryanization 0.19%(0.39)
Early-Post-Aryanization 0.48%(0.62)
Late-Post-Aryanization 0.18%(0.32)
Jewish- Weimar -0.66%managed (-0.29)(αJM) Pre-Aryanization -4.80%**
(-2.23)Early-Post-Aryanization -2.21%
(-0.92)Late-Post-Aryanization 2.10%
(1.15)Jewish- Weimar 0.40%owned (0.15)(αJO) Pre-Aryanization -1.95%
(-0.85)Early-Post-Aryanization 0.55%
(0.19)Late-Post-Aryanization -2.16%
(-0.66)
The table shows the annualized abnormal return of non-Jewish, Jewish-managed, and Jewish-ownedfirms, estimated as each group’s mean abnormal return according to a one-factor sector model. Theabnormal return of Jewish-managed and Jewish-owned firms is estimated as the additional abnormalreturn to non-Jewish firms. We split the time-varying abnormal return into four periods, namely,December 1923 through January 1933 (Weimar), February 1933 through the year of the “Aryani-zation” (Pre-Aryanization), the first two years after “Aryanization” (Early-Post-Aryanization), andthe third year after the “Aryanization” through December 1940 (Late-Post-Aryanization). The aver-age “Aryanization” years of Jewish-managed and Jewish-owned firms are 1935 and 1937, respectively.We use clustered standard errors at the weekly level and report t-statistics in parentheses. ***, **,and * denote statistical significance at the 1%, 5%, and 10% level, respectively.
41

Table 8: Abnormal Performance: Jewish Managers in Very Important Positions
Group Subperiod Regression (6)
Non-Jewish Weimar -0.28%(α) (-1.05)
Pre-Aryanization 0.20%(0.42)
Post-Aryanization 0.32%(0.80)
Jewish- Weimar -2.00%managed (-0.80)(αJM) Pre-Aryanization -6.06%*
(-1.74)Post-Aryanization 0.23%
(0.10)Jewish- Weimar 2.98%VIP (0.89)(αV IP ) Pre-Aryanization 2.37%
(0.56)Post-Aryanization -0.86%
(-0.33)Jewish- Weimar 0.08%owned (0.03)(αJO) Pre-Aryanization -2.11%
(-0.91)Post-Aryanization 0.29%
(0.14)
The table shows the annualized abnormal return of non-Jewish, Jewish-managed, Jewish VIP-managed, and Jewish-owned firms, estimated as each group’s mean abnormal return according to aone-factor sector model. The abnormal return of Jewish-managed and Jewish-owned firms is esti-mated as the additional abnormal return to non-Jewish firms. The abnormal return of Jewish VIP-managed firms is estimated as the additional abnormal return to Jewish-managed and non-Jewishfirms. We split the time-varying abnormal return into three periods, namely, December 1923 throughJanuary 1933 (Weimar), February 1933 through the year of the “Aryanization” (Pre-Aryanization),and the year after the “Aryanization” through December 1940 (Post-Aryanization). The average“Aryanization” years of Jewish-managed and Jewish-owned firms are 1935 and 1937, respectively.We use clustered standard errors at the weekly level and report t-statistics in parentheses. ***, **,and * denote statistical significance at the 1%, 5%, and 10% level, respectively.
42
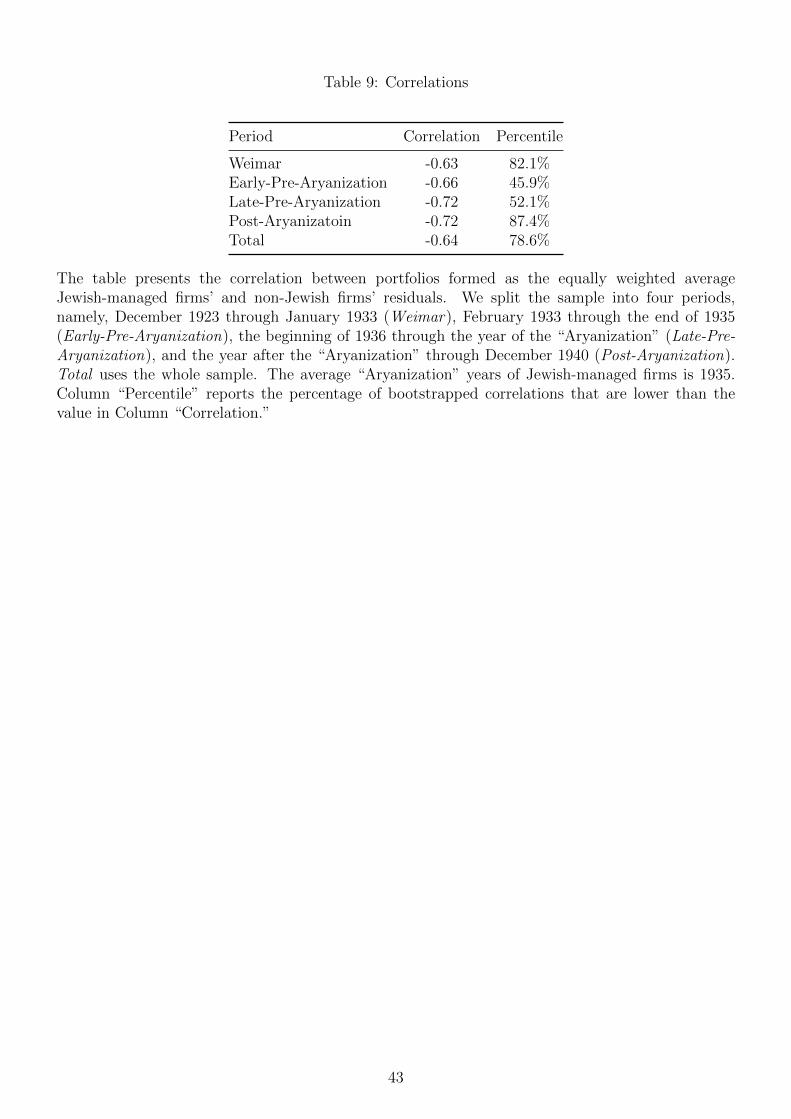
Table 9: Correlations
Period Correlation Percentile
Weimar -0.63 82.1%Early-Pre-Aryanization -0.66 45.9%Late-Pre-Aryanization -0.72 52.1%Post-Aryanizatoin -0.72 87.4%Total -0.64 78.6%
The table presents the correlation between portfolios formed as the equally weighted averageJewish-managed firms’ and non-Jewish firms’ residuals. We split the sample into four periods,namely, December 1923 through January 1933 (Weimar), February 1933 through the end of 1935(Early-Pre-Aryanization), the beginning of 1936 through the year of the “Aryanization” (Late-Pre-Aryanization), and the year after the “Aryanization” through December 1940 (Post-Aryanization).Total uses the whole sample. The average “Aryanization” years of Jewish-managed firms is 1935.Column “Percentile” reports the percentage of bootstrapped correlations that are lower than thevalue in Column “Correlation.”
43

Table 10: Overview of Hypotheses and Tests
Test
Hypothesis Harassment:permanent damage due to ha-rassment ⇒ lower cash flows;long term
Brain drain:Jewish manager leaves firm and isreplaced by non-Jewish managerwith less experience, fewer univer-sity degrees, and fewer connections;long term
Jewish stigma:investors exit stocks to not beperceived as supporting Jew-ish firms;short term
T1 No discount in Weimar 3 7 3
T2 Discount in Pre-Ary 3 7 7
T3 No discount in Post-Ary 3 3 7
T4 VIP Manager 3 7 3
T5 Divestment 3 3 7
The table shows the results of various tests for the harassment, brain drain, and Jewish stigma hypotheses. Test results supporting the hypothesisare indicated by a check mark (3). Contradicting results are indicated by a cross-out (7). Tests T1–T3 analyze the observed discount pattern.T4 investigates if firms with Jewish managers in very important positions experience greater discounts than other Jewish-managed firms. T5measures the correlation of Jewish-managed and non-Jewish firms’ abnormal returns.
44

Table 11: Robustness: Factor Model Choice
Group Subperiod Regression (3) Regression (3a) Regression (3b) Regression (3c)
BaseModel
OneMarketFactor
SectorExcludesFirm i
Value-Weighted
Index
Non-Jewish Weimar -0.29% -0.30% 0.29% 13.97%(α) (-1.10) (-0.94) (0.59) (1.41)
Pre-Aryanization 0.19% 0.56% 2.38%*** 18.45%***(0.39) (1.06) (2.93) (2.97)
Post-Aryanization 0.33% 0.53% 2.58%*** 15.71%***(0.83) (1.25) (4.49) (4.41)
Jewish- Weimar -0.66% -0.34% -0.77% -0.18%managed (-0.29) (-0.14) (-0.33) (-0.06)(αJM) Pre-Aryanization -4.79%** -6.18%*** -5.75%** -7.03%**
(-2.23) (-2.65) (-2.56) (-2.40)Post-Aryanization -0.22% -0.91% -0.53% -0.09%
(-0.14) (-0.57) (-0.33) (-0.05)Jewish- Weimar 0.40% -1.31% 0.22% -0.11%owned (0.15) (-0.43) (0.08) (-0.04)(αJO) Pre-Aryanization -1.96% -3.86% -2.56% -6.01%**
(-0.86) (-1.52) (-1.07) (-2.06)Post-Aryanization 0.14% 0.01% -0.28% -2.78%
(0.07) (0.00) (-0.13) (-1.08)
The table shows the annualized abnormal return of non-Jewish, Jewish-managed, and Jewish-owned firms, estimated as each group’s meanabnormal return according to a one-factor sector model. The abnormal return of Jewish-managed and Jewish-owned firms is estimated as thedifference to non-Jewish firms’ abnormal return. We split the time-varying abnormal return into three periods, namely, December 1923 throughJanuary 1933 (Weimar), February 1933 through the year of the “Aryanization” (Pre-Aryanization), and the year after the “Aryanization”through December 1940 (Post-Aryanization). The average “Aryanization” years of Jewish-managed and Jewish-owned firms are 1935 and 1937,respectively. We subsequently replace the equally weighted sector-specific returns by one equally weighted market return (3a); exclude a firmfrom its sector portfolio (3b); and use the value-weighted blue-chip index of Ronge (2002) (3c). We use clustered standard errors at the weeklylevel and report t-statistics in parentheses. ***, **, and * denote statistical significance at the 1%, 5%, and 10% level, respectively.
45

Table 12: Robustness: Calendar Time Cutoffs
Group Subperiod Regression (3) Regression (3d) Regression (3e)
BaseModel
ModeAryanization
Year
MedianAryanization
Year
Non-Jewish Weimar -0.29% -0.29% -0.29%(α) (-1.10) (-1.10) (-1.10)
Pre-Aryanization 0.19% 0.44%* 0.54%*(0.39) (1.80) (1.82)
Post-Aryanization 0.33% -0.10% 0.07%(0.83) (-0.43) (0.33)
Jewish- Weimar -0.66% -0.66% -0.66%managed (-0.29) (-0.29) (-0.29)(αJM) Pre-Aryanization -4.79%** -4.90%** -4.79%**
(-2.23) (-2.32) (-2.24)Post-Aryanization -0.22% -0.01% -0.14%
(-0.14) (0.00) (-0.09)Jewish- Weimar 0.40% 0.40% 0.40%owned (0.15) (0.15) (0.15)(αJO) Pre-Aryanization -1.96% -2.28% -1.91%
(-0.86) (-1.01) (-0.85)Post-Aryanization 0.14% 0.14% -0.92%
(0.07) (0.07) (-0.44)
The table shows the annualized abnormal return of non-Jewish, Jewish-managed, and Jewish-ownedfirms, estimated as each group’s mean abnormal return according to a one-factor sector model.The abnormal return of Jewish-managed and Jewish-owned firms is estimated as the difference tonon-Jewish firms’ abnormal return. We split the time-varying abnormal return into three periods,namely, December 1923 through January 1933 (Weimar), February 1933 through the year of the“Aryanization” (Pre-Aryanization), and the year after the “Aryanization” through December 1940(Post-Aryanization). The average “Aryanization” years of Jewish-managed and Jewish-owned firmsare 1935 and 1937, respectively. We use the mode (3d) and median (3e) of all “Aryanization” yearsas the cutoff between Pre- and Post-Aryanization. These are 1938 and 1936, respectively. We useclustered standard errors at the weekly level and report t-statistics in parentheses. ***, **, and *denote statistical significance at the 1%, 5%, and 10% level, respectively.
46
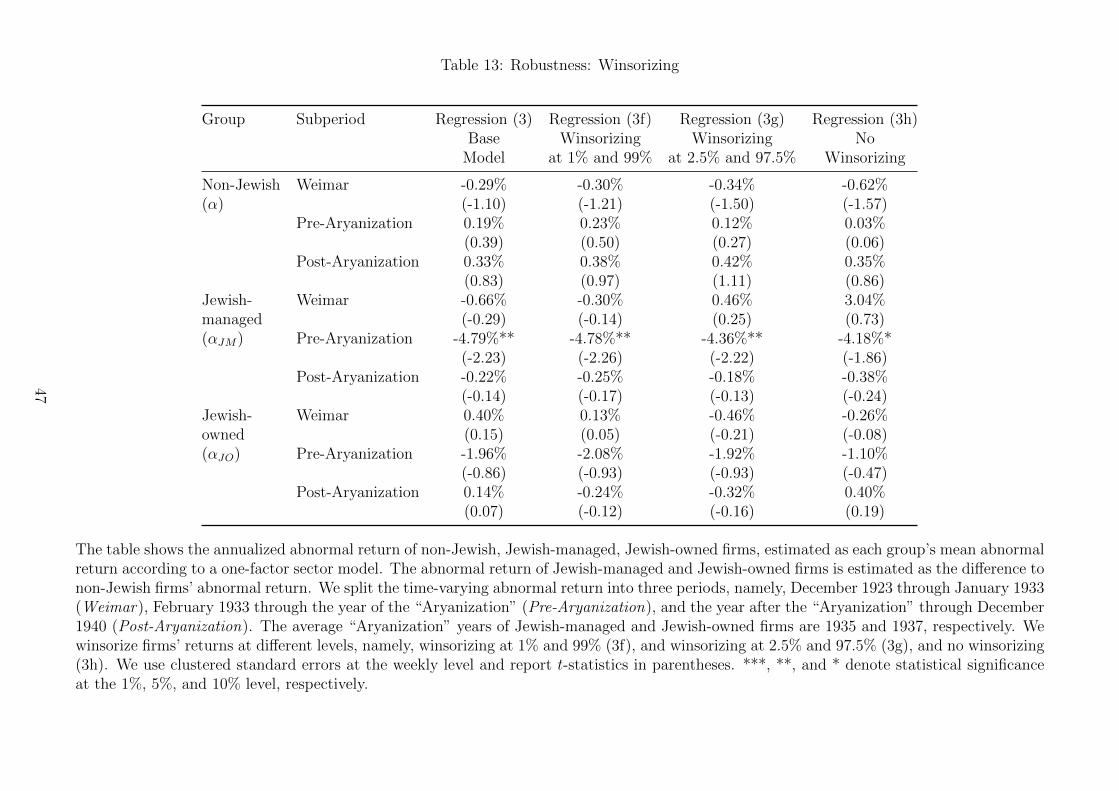
Table 13: Robustness: Winsorizing
Group Subperiod Regression (3) Regression (3f) Regression (3g) Regression (3h)Base
ModelWinsorizing
at 1% and 99%Winsorizing
at 2.5% and 97.5%No
Winsorizing
Non-Jewish Weimar -0.29% -0.30% -0.34% -0.62%(α) (-1.10) (-1.21) (-1.50) (-1.57)
Pre-Aryanization 0.19% 0.23% 0.12% 0.03%(0.39) (0.50) (0.27) (0.06)
Post-Aryanization 0.33% 0.38% 0.42% 0.35%(0.83) (0.97) (1.11) (0.86)
Jewish- Weimar -0.66% -0.30% 0.46% 3.04%managed (-0.29) (-0.14) (0.25) (0.73)(αJM) Pre-Aryanization -4.79%** -4.78%** -4.36%** -4.18%*
(-2.23) (-2.26) (-2.22) (-1.86)Post-Aryanization -0.22% -0.25% -0.18% -0.38%
(-0.14) (-0.17) (-0.13) (-0.24)Jewish- Weimar 0.40% 0.13% -0.46% -0.26%owned (0.15) (0.05) (-0.21) (-0.08)(αJO) Pre-Aryanization -1.96% -2.08% -1.92% -1.10%
(-0.86) (-0.93) (-0.93) (-0.47)Post-Aryanization 0.14% -0.24% -0.32% 0.40%
(0.07) (-0.12) (-0.16) (0.19)
The table shows the annualized abnormal return of non-Jewish, Jewish-managed, Jewish-owned firms, estimated as each group’s mean abnormalreturn according to a one-factor sector model. The abnormal return of Jewish-managed and Jewish-owned firms is estimated as the difference tonon-Jewish firms’ abnormal return. We split the time-varying abnormal return into three periods, namely, December 1923 through January 1933(Weimar), February 1933 through the year of the “Aryanization” (Pre-Aryanization), and the year after the “Aryanization” through December1940 (Post-Aryanization). The average “Aryanization” years of Jewish-managed and Jewish-owned firms are 1935 and 1937, respectively. Wewinsorize firms’ returns at different levels, namely, winsorizing at 1% and 99% (3f), and winsorizing at 2.5% and 97.5% (3g), and no winsorizing(3h). We use clustered standard errors at the weekly level and report t-statistics in parentheses. ***, **, and * denote statistical significanceat the 1%, 5%, and 10% level, respectively.
47

Table 14: Robustness: Data Filtering
Group Subperiod Regression (3) Regression (3i) Regression (3j) Regression (3k) Regression (3l) Regression (3m) Regression (3n)
BaseModel
Minimum200 Observations
Include Firmswithout Sector
Include allJewish Firms
Minimum80% PriceQuotation
rf + 0.02 rf − 0.02
Non-Jewish Weimar -0.29% -0.15% -0.41%* -0.44% -0.25% -0.32% -0.26%(α) (-1.10) (-0.56) (-1.74) (-1.31) (-0.80) (-1.19) (-1.00)
Pre-Aryanization 0.19% 0.18% 0.20% 0.53% 0.84%* 0.16% 0.22%(0.39) (0.37) (0.42) (1.16) (1.67) (0.33) (0.45)
Post-Aryanization 0.33% 0.31% 0.42% 0.28% -0.01% 0.32% 0.34%(0.83) (0.76) (1.07) (0.73) (-0.03) (0.82) (0.84)
Jewish- Weimar -0.66% -1.25% -0.53% 0.04% 0.43% -0.71% -0.62%managed (-0.29) (-0.55) (-0.24) (0.02) (0.16) (-0.31) (-0.27)(αJM) Pre-Aryanization -4.79%** -4.62%** -4.79%** -5.24%*** -4.78%** -4.86%** -4.73%**
(-2.23) (-2.17) (-2.23) (-2.60) (-2.19) (-2.26) (-2.19)Post-Aryanization -0.22% -0.23% -0.46% -0.72% -1.50% -0.13% -0.32%
(-0.14) (-0.15) (-0.30) (-0.59) (-0.95) (-0.08) (-0.20)Jewish- Weimar 0.40% -0.12% 1.28% 1.62% 0.23% 0.47% 0.32%owned (0.15) (-0.05) (0.46) (0.73) (0.08) (0.18) (0.12)(αJO) Pre-Aryanization -1.96% -2.02% -1.95% -1.11% -0.84% -2.01% -1.91%
(-0.86) (-0.93) (-0.86) (-0.60) (-0.33) (-0.88) (-0.84)Post-Aryanization 0.14% -0.21% -0.77% 0.42% 2.16% 0.20% 0.08%
(0.07) (-0.09) (-0.37) (0.24) (0.94) (0.10) (0.04)
The table shows the annualized abnormal return of non-Jewish, Jewish-managed, and Jewish-owned firms, estimated as each group’s meanabnormal return according to a one-factor sector model. The abnormal return of Jewish-managed and Jewish-owned firms is estimated as thedifference to non-Jewish firms’ abnormal return. We split the time-varying abnormal return into three periods, namely, December 1923 throughJanuary 1933 (Weimar), February 1933 through the year of the “Aryanization” (Pre-Aryanization), and the year after the “Aryanization”through December 1940 (Post-Aryanization). The average “Aryanization” years of Jewish-managed and Jewish-owned firms are 1935 and 1937,respectively. We subsequently exclude firms with fewer than 200 observations (3i); include firms that we could not associate with a sector(3j); include Jewish firms without an “Aryanization” date and use the median “Aryanzation” year (3k); exclude firms with fewer than 80%price quotations while listed (3l); and increase and reduce the risk-free interest rate by 2 percentage points (3m and 3n, respectively). We useclustered standard errors at the weekly level and report t-statistics in parentheses. ***, **, and * denote statistical significance at the 1%, 5%,and 10% level, respectively.
48
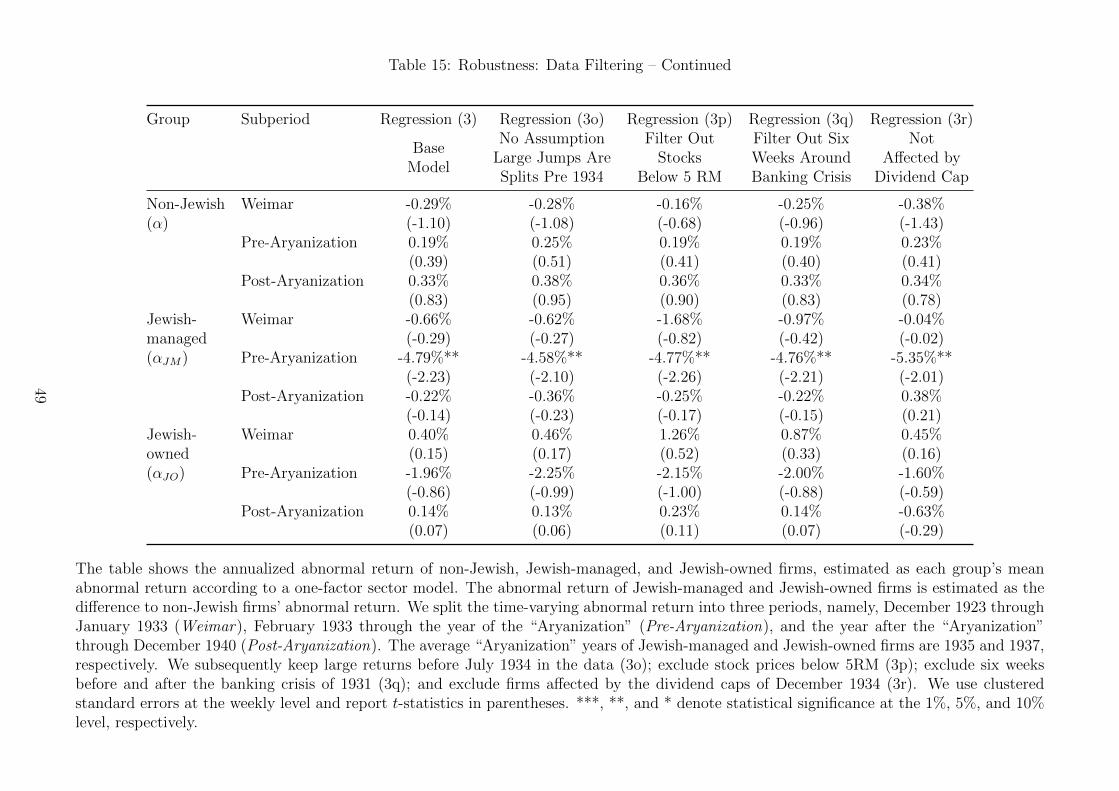
Table 15: Robustness: Data Filtering – Continued
Group Subperiod Regression (3) Regression (3o) Regression (3p) Regression (3q) Regression (3r)
BaseModel
No AssumptionLarge Jumps AreSplits Pre 1934
Filter OutStocks
Below 5 RM
Filter Out SixWeeks AroundBanking Crisis
NotAffected by
Dividend Cap
Non-Jewish Weimar -0.29% -0.28% -0.16% -0.25% -0.38%(α) (-1.10) (-1.08) (-0.68) (-0.96) (-1.43)
Pre-Aryanization 0.19% 0.25% 0.19% 0.19% 0.23%(0.39) (0.51) (0.41) (0.40) (0.41)
Post-Aryanization 0.33% 0.38% 0.36% 0.33% 0.34%(0.83) (0.95) (0.90) (0.83) (0.78)
Jewish- Weimar -0.66% -0.62% -1.68% -0.97% -0.04%managed (-0.29) (-0.27) (-0.82) (-0.42) (-0.02)(αJM) Pre-Aryanization -4.79%** -4.58%** -4.77%** -4.76%** -5.35%**
(-2.23) (-2.10) (-2.26) (-2.21) (-2.01)Post-Aryanization -0.22% -0.36% -0.25% -0.22% 0.38%
(-0.14) (-0.23) (-0.17) (-0.15) (0.21)Jewish- Weimar 0.40% 0.46% 1.26% 0.87% 0.45%owned (0.15) (0.17) (0.52) (0.33) (0.16)(αJO) Pre-Aryanization -1.96% -2.25% -2.15% -2.00% -1.60%
(-0.86) (-0.99) (-1.00) (-0.88) (-0.59)Post-Aryanization 0.14% 0.13% 0.23% 0.14% -0.63%
(0.07) (0.06) (0.11) (0.07) (-0.29)
The table shows the annualized abnormal return of non-Jewish, Jewish-managed, and Jewish-owned firms, estimated as each group’s meanabnormal return according to a one-factor sector model. The abnormal return of Jewish-managed and Jewish-owned firms is estimated as thedifference to non-Jewish firms’ abnormal return. We split the time-varying abnormal return into three periods, namely, December 1923 throughJanuary 1933 (Weimar), February 1933 through the year of the “Aryanization” (Pre-Aryanization), and the year after the “Aryanization”through December 1940 (Post-Aryanization). The average “Aryanization” years of Jewish-managed and Jewish-owned firms are 1935 and 1937,respectively. We subsequently keep large returns before July 1934 in the data (3o); exclude stock prices below 5RM (3p); exclude six weeksbefore and after the banking crisis of 1931 (3q); and exclude firms affected by the dividend caps of December 1934 (3r). We use clusteredstandard errors at the weekly level and report t-statistics in parentheses. ***, **, and * denote statistical significance at the 1%, 5%, and 10%level, respectively.
49

Table 16: Abnormal Performance: Jewish vs. Jewish Sounding
Group Subperiod Regression (7)
Non-Jewish Weimar -0.31%(α) (-0.94)
Pre-Aryanization 0.38%(0.67)
Post-Aryanization 0.23%(0.51)
Jewish Weimar 0.42%(αJ) (0.20)
Pre-Aryanization -4.25%**(-2.52)
Post-Aryanization 0.51%(0.37)
Jewish- Weimar -1.97%sounding (-0.61)(αJS) Pre-Aryanization -3.27%
(-0.87)Post-Aryanization -0.22%
(-0.08)
The table shows the annualized abnormal return of non-Jewish, Jewish, and Jewish-sounding firms,estimated as each group’s mean abnormal return according to a one-factor sector model. The abnor-mal return of Jewish and Jewish-sounding firms is estimated as the additional abnormal return tonon-Jewish firms. We split the time-varying abnormal return into three periods, namely, December1923 through January 1933 (Weimar), February 1933 through the year of the “Aryanization” (Pre-Aryanization), and the year after the “Aryanization” through December 1940 (Post-Aryanization).The average “Aryanization” years of Jewish and Jewish-sounding firms are both 1936. We use clus-tered standard errors at the weekly level and report t-statistics in parentheses. ***, **, and * denotestatistical significance at the 1%, 5%, and 10% level, respectively.
50
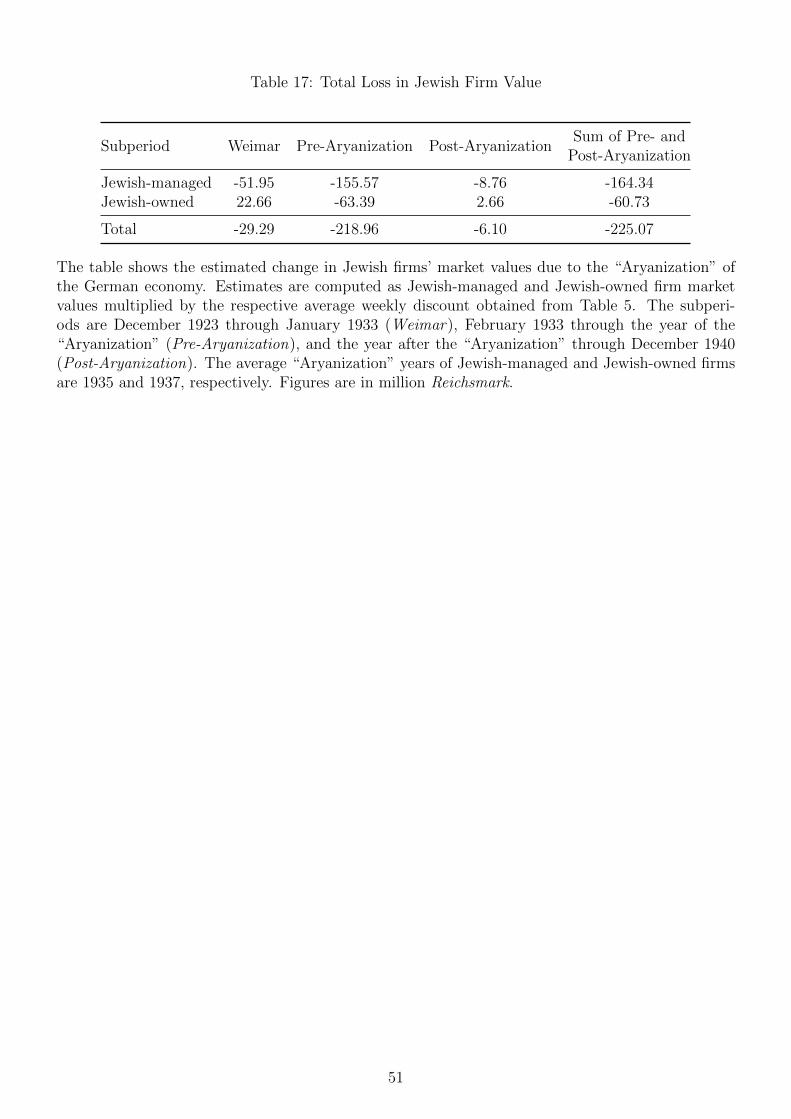
Table 17: Total Loss in Jewish Firm Value
Subperiod Weimar Pre-Aryanization Post-AryanizationSum of Pre- and
Post-Aryanization
Jewish-managed -51.95 -155.57 -8.76 -164.34Jewish-owned 22.66 -63.39 2.66 -60.73
Total -29.29 -218.96 -6.10 -225.07
The table shows the estimated change in Jewish firms’ market values due to the “Aryanization” ofthe German economy. Estimates are computed as Jewish-managed and Jewish-owned firm marketvalues multiplied by the respective average weekly discount obtained from Table 5. The subperi-ods are December 1923 through January 1933 (Weimar), February 1933 through the year of the“Aryanization” (Pre-Aryanization), and the year after the “Aryanization” through December 1940(Post-Aryanization). The average “Aryanization” years of Jewish-managed and Jewish-owned firmsare 1935 and 1937, respectively. Figures are in million Reichsmark.
51