stock pitch: noble corporation (ne) international equities division yale student investment group...
TRANSCRIPT

Stock Pitch:Noble Corporation (NE)
International Equities DivisionYale Student Investment Group
October 27, 2010


Overview
1. The Politics of Drilling 2. Background: Oil Markets & Volatility3. Comparative Analysis4. Valuation (DCF estimates)5. Recent News/Developments
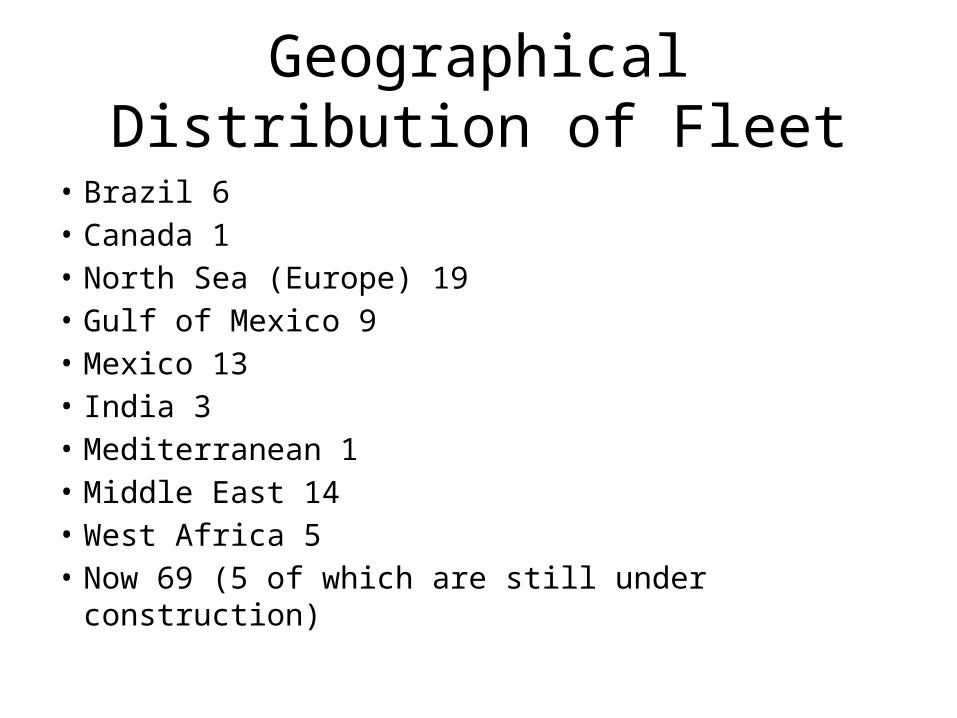
Geographical Distribution of Fleet
• Brazil 6• Canada 1• North Sea (Europe) 19• Gulf of Mexico 9• Mexico 13• India 3• Mediterranean 1• Middle East 14• West Africa 5• Now 69 (5 of which are still under construction)

The Politics of Drilling:US Operations in the Gulf of Mexico
• Obama lifted ban on deepwater oil exploration in October 2010• New permit process:
– New certification process was released in 2005– Standards recently updated again.– Possible change to 24/7 monitoring w/inspectors onboard or wireless monitoring
• Future US drilling policy unclear will depend on the election– Congress banned new offshore drilling in 1981– August 2008 Bush called to restart drilling– Still pending in Congress since Democrats strongly oppose Republican support (“Drill,
baby, drill”)– Also, Republicans are calling for new oil refineries to be built in the US– No new refineries have been built since 1976 because of costly EPA regulations
• Outlook: there’s a lot of backlash and emphasis on shifting to a different energy source, but in the immediate future it’s likely that drilling will continue at the same level or increase

The Politics of Drilling:Middle East & Asia
• Middle East: Still recovering economically oil crucial part of the recovery– Iraq’s 2011 budget focuses on increasing oil exports and prices.– Recent IMF report predicts an increase in Middle Eastern oil exports
and prices– Iran will be 2011 OPEC president (term 1 year) US concerns that Iran
will not be impartial or objective in oil exports and prices.• Asia: China replaced EU as Iran’s number one trading partner.
Iran is their third largest oil supplier China is helping block and prevent sanctions on Iran.
• Outlook: Middle East is politically unstable. Oil prices will continue to rise (both due to economic and political pressures). Concerns about a deteriorating US relationship with Iran.

The Politics of Drilling:Europe
• Increased political pressure to buy less oil from the Middle East (especially Iran).
• Agreement between US/Britain to prevent Iranian planes from refueling in most of Europe caused Iran to announce that it will temporarily stop refueling British planes.
• Outlook: EU action reflects the issues already discussed about US and Middle East oil policy.

Conclusions
• Concerns about BP will cause increased inspections and stringent certification processes but drilling will continue.
• Much depends on the election. It looks likely that Republicans will regain Congress and try to relax regulation.
• Middle East: situation is politically volatile (especially with Iran). This could cause oil prices to spike or the supply to be cut off or reduced.

Historical View of Oil
• Before 1970, oil prices stayed constant around $20 per barrel• Sharp peaks in oil prices during the 1979 energy crisis and in
early 2008 (shown on the graphs)• Both peaks followed by drops back to cheaper oil prices as
consumer habits caught up with the oil prices• Increase in price of oil due to several factors:
– Supply and demand– Oil policies– International politics– Strength of the US dollar
• Recent decrease in price of oil due to decreased consumer oil consumption after recession
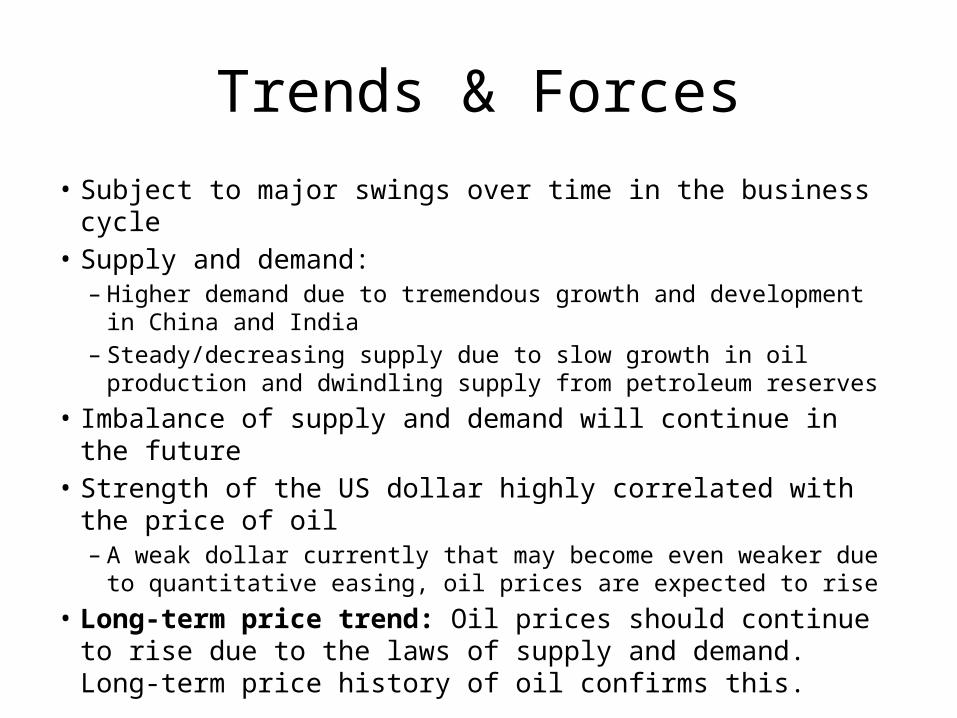
Trends & Forces
• Subject to major swings over time in the business cycle• Supply and demand:
– Higher demand due to tremendous growth and development in China and India
– Steady/decreasing supply due to slow growth in oil production and dwindling supply from petroleum reserves
• Imbalance of supply and demand will continue in the future• Strength of the US dollar highly correlated with the price of
oil– A weak dollar currently that may become even weaker due to
quantitative easing, oil prices are expected to rise• Long-term price trend: Oil prices should continue to rise due
to the laws of supply and demand. Long-term price history of oil confirms this.

Short-Term Price Prediction
• Any reasons to believe oil prices will move down in the short-term are pretty temporary and likely short-lived
• As the global economy continues to recover, the US economy will becomes stronger and will purchase more oil. Before the recession, oil prices were well over $100.


Balance Sheet
• Current Ratio: 3.9• Quick Ratio: 3.6• 8,903,502,000 Total Assets• 1,635,130,000 Total Liabilities• 1,083,112,000 in Cash & Cash Equivalents• Conclusion: Balance sheet is healthy, very
liquid

“Staying Power”
• 87 Year History• Geographically diversified• 2nd largest fleet in the world• Barriers to entry• Very liquid and has cash, flexibility for strategic
opportunities• 27.5% Return on Average Equity

Comparative Analysis
• Key Competitors:– Transocean Ltd.– Nabors Industries Ltd.– Diamond Offshore Drilling Inc.– ENSCO PLC (ESV)– Pride International Inc (PDE)

Comparative Analysis

P/E Ratio
• NE: 7.94• Peers: 50.07
• NE has a lower P/E ratio, which can mean lower growth expectations or a less expensive stock.
• NE is trading at a significant discount to its peers• Current share price * (Average P/E Ratio / (NE’s
P/E ratio) = expected share price = $34.25 * (25.03/7.94) = $107.97

P/B Ratio
• NE: 1.25• Peers: 2.58
• NE has a lower P/B ratio, which makes a stock more attractive to investors looking for stocks with lower price per dollar of equity on the balance sheet.
• Once again, NE is trading at a significant discount to its peers
• Current share price * (Average P/B ratio) / (NE’s P/B ratio) = expected share price = $34.25 * (1.36/1.25) =$37.26

Projected Earnings
• NE: 8.03 • Peers: 22.63
• NE has a lower price-to-projected earnings ratio than its peers, which can mean lower growth expectations or lower future growth expectations
• NE is trading at a significant discount to its peers• Current share price * (Average P/PE Ratio / (NE’s P/PE
ratio) = expected share price = $34.25 * (10.12/8.03) = $43.16

Market Cap/EBITDA
• Market Capitalization = $8,890,000,000 (8.89 bil)
• EBITDA = $2,419.06• Market Cap/EBITDA = 3,674,981.19• Current share price * (Average Market
Cap/EBITDA ratio) / (NE’s Market Cap/EBITDA ratio) = expected share price = $34.25*(5,710,938.00/3,674,981) = $53.22

DCF Valuation:Scenario 1 (“Best Case”)
• DCF Value = $67– 97% increase from current price
• Assumptions:– Analyst Consensus Growth Rates: -50% this year, 35%
next year, 10% next 5 years, 3% thereafter– WACC = 9%– All expenses constant at average percent for last 5
years* Note: NE has had 36.60% annual earnings growth per
year for the past 5 years.

DCF Valuation:Scenario 2 (“Middle of the Road”)
• DCF Value = $49– 42% increase from current price
• Assumptions:– 25% worse than Analyst Consensus Growth Rates:
-54% this year, 25% next year, 7.5% next 5 years, 2.25% thereafter
– WACC = 9%– All expenses constant at average percent for last 5
years

DCF Valuation:Scenario 3 (“Middle of the Road”)
• DCF Value = $37– 7% increase from current price
• Assumptions:– 50% worse than Analyst Consensus Growth Rates:
-57% this year, 17% next year, 5% next 5 years, 1.5% thereafter
– WACC = 9%– All expenses constant at average percent for last 5
years

DCF Valuation:Scenario 4 (“Worst Case”)
• Assuming a strong correlation between earnings and oil prices (historically somewhat true, but sales have increased each of the past 5 years, including oil’s big drop during the crisis)
• DCF Value = $34– 0% change from current price
• Assumptions:– Oil price stays constant at $65/barrel (05-07)– -40% growth rate this year to reach 2006 level earnings– 0% growth rate every year afterwards– WACC= 9%– All expenses constant at average percent for last 5 years

Recent News & Developments
1. Q3 Conference Call (10/21/10)2. Acquisition of Frontier Drilling Resources3. Rig contract negotiations (w/Shell &
Anadarko)4. Offshore Drilling Moratorium5. Recent Upgrades

Q3 Conference Call
• Qtrly earnings: Numbers were just below expectations but guidance/outlook was positive
• Utilization for Noble jack-up fleet is better than average at around 77%
• Concern: fleet upgrades needed to meet new blowout preventer standards
• Upside: Pemex loosening age restrictions on rigs, Petrobras looking to drill

Quarterly Earnings (cont.)
Sep. ‘10
EPS Est (Consensus) 0.35
EPS Actual 0.34
Surprise -2.90%
Revenue $86 Mil
*Note: Compared to revenue of $426 million, or $1.63 per share for the third quarter of 2009*Analysts’ earnings estimates throughout Q3 were revised downward from about 93 cents to reflect the BP oil spill

Acquisition of Frontier Drilling Resources
• Completed this quarter, was bought in June 2010
• Acquired 6 new floating drilling units– Diversification: mid-water presence, Arctic
• Long-term debt increase by $3 bil• Positive cash flow expected from acquisition in
2011• Took advantage of Frontier’s distress after the
BP oil spill
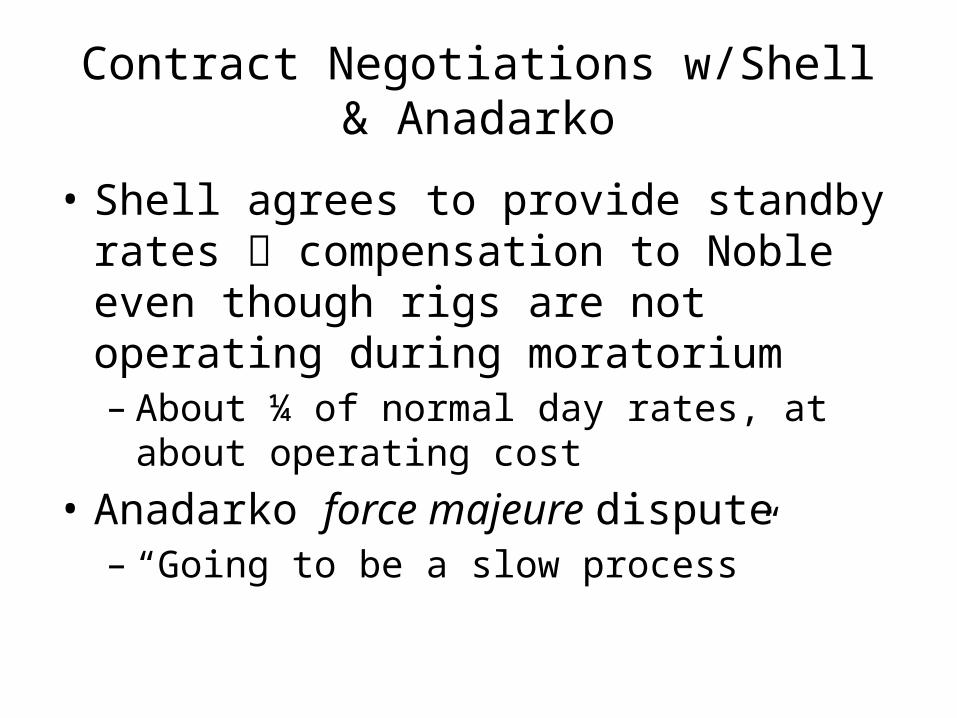
Contract Negotiations w/Shell & Anadarko
• Shell agrees to provide standby rates compensation to Noble even though rigs are not operating during moratorium– About ¼ of normal day rates, at about operating
cost• Anadarko force majeure dispute– “Going to be a slow process”

Offshore Drilling Moratorium
• Bureau of Ocean Energy Management (BOEM) still imposing de facto moratorium via permit process
• Just 2 rigs have received the new BOEM permits this last month
• Could be influenced by political winds from upcoming elections
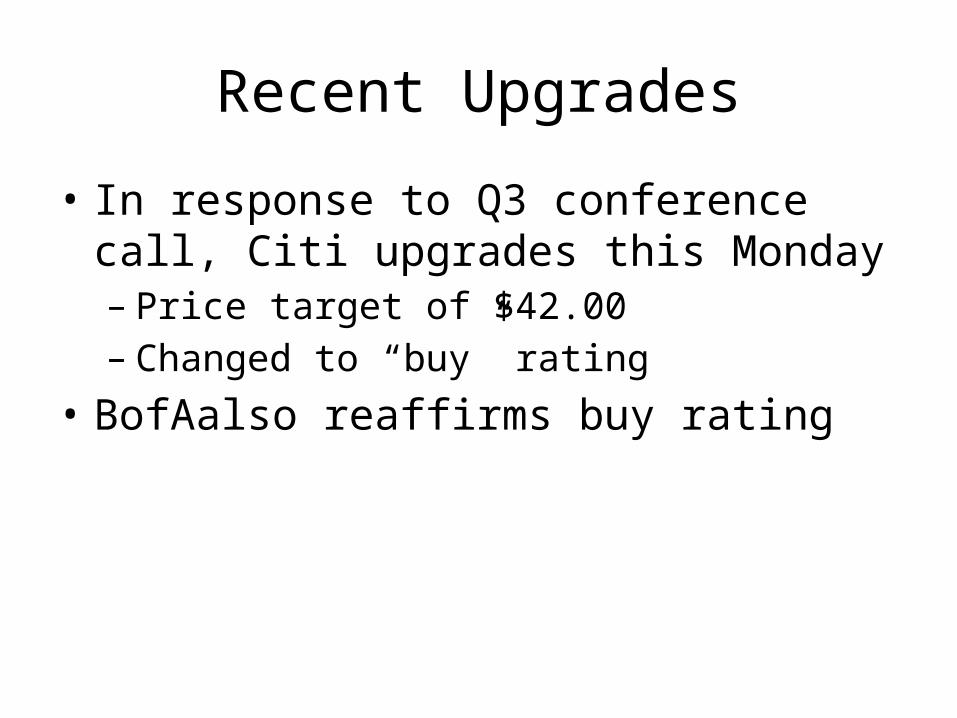
Recent Upgrades
• In response to Q3 conference call, Citi upgrades this Monday– Price target of $42.00– Changed to “buy” rating
• BofAalso reaffirms buy rating
Conclusion - BUY
• Extremely cheap and undervalued compared to peers on the basis of P/E, P/PE, P/B, and EBITDA
• Discounted Cash Flow projections show the stock is worth between 0-90% more than its current share price. This implies 90% potential upside for little to no potential downside.
• Pristine balance sheet• Global macro trends in oil and politics on balance favor
more offshore drilling in the long run.• Recent news confirms positive expectations about NE