stock return momentum and investor fund choice · stock return momentum and investor fund choice...
TRANSCRIPT
Stock Return Momentum and Investor Fund Choice
TRAVIS SAPP and ASHISH TIWARI*
Journal of Investment Management, forthcoming
Keywords: Mutual fund selection; stock return momentum; investor behavior; determinants of fund cash flows; exploiting momentum at the fund level
______________ * Travis Sapp is at Iowa State University. Tel. (515) 294-2717. email: [email protected]. Ashish Tiwari is at the Tippie College of Business at the University of Iowa. Tel. (319) 353-2185. email: [email protected].

PRACTITIONER’S DIGEST
Recent research by Gruber (1996) and Zheng (1999) finds that investors are able to predict mutual fund performance and invest accordingly. This phenomenon has been dubbed the “smart money” effect. We show that the smart money effect is explained by stock return momentum at the one year horizon. This finding then begs the question of what exactly investors seem to be chasing —momentum styles or recent large returns? Further evidence suggests investors do not select funds based on a momentum investing style, but rather simply chase funds that were recent winners. Thus, our finding that a common factor in stock returns explains the smart money effect offers no affirmation of investor fund selection ability. We also investigate the profitability of a pure momentum style strategy that invests solely in no-load equity mutual funds. We show that a quarterly fund selection strategy of investing in the top decile portfolio of no-load funds ranked by their historical momentum exposure yields an annualized 3-factor alpha of 3.72% over the period 1973-2000.
1
Investors as a group devote a considerable amount of resources when making the decision to invest in a
mutual fund. There are numerous firms such as Morningstar and Lipper that publish mutual fund
performance statistics, and fund rankings are widely available in mass circulation media outlets such as
the Wall Street Journal and Money magazine, to name a few. In view of the importance of the fund
selection decision to investors, a natural question that arises is: “How smart are investors in terms of their
mutual fund choices?”
Aside from simply grading investor behavior, the answer to this question also has an important
bearing on our understanding of the value added by active management. Beginning with Jensen (1968), a
large number of studies have shown that the average actively managed fund fails to outperform the
relevant benchmarks after expenses. To many, the implication of this is obvious: if investors are no more
likely to pick a “good” fund than a “poor” fund, then the safer course is to invest in a passive index fund.
Recent studies by Gruber (1996) and Zheng (1999) suggest that investors do have selection
ability, in that the short-term performance of funds that experience net cash inflow appears to be
significantly better than the short-term performance of funds that experience net cash outflow. One
possible explanation for this finding is that sophisticated investors have the ability to identify superior
fund managers and invest accordingly. An important implication of such an interpretation is that the smart
money effect would then provide a rationale for the significant growth in the actively managed fund
industry, as argued by Gruber. If investors are truly “smart” and display selection ability, then the case for
investing in actively managed funds may be stronger than previously believed.
However, this is not the only plausible explanation for the smart money effect. In particular, we
note that in benchmarking fund performance neither of the above mentioned studies by Gruber or Zheng
accounts for the well-known stock return momentum phenomenon first identified by Jegadeesh and
Titman (1993). Importantly, Carhart (1997) shows that momentum is a significant common factor in
explaining stock returns. Furthermore, he shows that persistence in mutual fund performance is explained
by stock return momentum.1 In light of Carhart’s findings, a question that arises naturally is whether the
smart money effect is really due to fund-specific information as suggested by Gruber (1996) and Zheng
2
(1999), or whether it can be explained by exposure to momentum. Specifically, suppose that fund
investors merely chase past fund performance. Then funds that happen to have a high concentration of
recent winner stocks would, on average, receive more investor cash while also benefiting more than other
funds from the effects of return momentum. This, in turn, could lead to the finding of a smart money
effect, despite the absence of any ability on the part of investors to select superior fund managers.
We first explore the above question by investigating whether the smart money effect is in fact an
artifact of stock return momentum. If investors are indeed able to identify superior managers, then new
cash flows should continue to earn positive abnormal returns even after controlling for the effect of
mechanical styles such as momentum strategies. We test this using the complete universe of diversified
U.S. equity mutual funds for the period 1970 to 2000 in the CRSP Survivor-Bias Free U.S. Mutual Fund
Database. Following Gruber and Zheng, we form two new-money portfolios at the beginning of each
quarter. The first portfolio includes all funds that realize positive net cash flow during the last quarter, and
the second portfolio includes all funds that realize negative net cash flow. We then examine the
subsequent performance of each portfolio using the Carhart (1997) benchmark model that includes the
three Fama-French (1993) factors and a momentum factor.
When the performance benchmark model does not account for exposure to momentum, we find
that there is evidence of an apparent smart money effect. A strategy that mimics investor fund flows by
being long in the (cash flow-weighted) positive cash flow portfolio and short in the negative cash flow
portfolio yields a statistically and economically significant annual alpha of 2.09% during 1970-2000.
However, when the performance benchmark includes a momentum factor, the adjusted excess return
(alpha) on the flow of money is essentially zero. Furthermore, after we control for a portfolio’s
momentum exposure, the return earned by the flow of money into funds is unable to outperform the return
on the average dollar invested in the fund universe. Hence, stock return momentum fully explains the
smart money effect.
Our finding that a common factor in stock returns, namely momentum, explains the smart money
effect lends no credence to the claim that investors are able to identify superior fund managers. Moreover,
3
our finding that momentum accounts for the smart money effect raises a new question: Are investors then
chasing funds with momentum styles, or are they just naively chasing funds with large past returns? If
investors chase funds with momentum styles in an effort to exploit return momentum, then the smart
money effect may be due to a group of sophisticated fund investors taking advantage of cheap momentum
strategies. In other words, the preference for a particular style among investors may lead them to
implement a mechanical fund selection rule. An alternate explanation could be that instead of choosing
funds based on fund investing style, investors naively chase recent winners and incidentally benefit from
the existence of the momentum effect. It is important to distinguish between these two possible
explanations since the former yet provides a rationale for the growth in actively managed mutual funds,
potentially solving a prominent puzzle in finance, while the latter leaves this puzzle unexplained.
We address this question by exploring the determinants of cash flows to funds within a cross-
sectional regression framework. We find that cash flows to funds are strongly correlated with recent
returns, but not to fund momentum loadings. This suggests that fund investors appear to chase recent
large returns rather than choosing funds based on a momentum investing style.
Our evidence demonstrates that investors do not follow a deliberate strategy of selectively
investing in momentum funds. Rather they appear to naively chase recent winner funds, and, in the
process, they unwittingly benefit from the momentum effect in the short term. This leads mechanically to
the observed apparent selection ability among fund investors. Hence, our results show that a common
factor in stock returns, rather than selection ability, or “smartness,” on the part of mutual fund investors,
accounts for the apparent favorable performance of new money portfolios documented in the literature.
Since Gruber’s (1996) explanation for the puzzling growth in actively managed mutual funds rests upon
sophisticated investors being able to identify superior managers and invest accordingly, an important
implication of our findings is that the puzzle noted by Gruber still begs an answer.
Although we have shown that investors do not deliberately pursue a momentum strategy, a
question of interest in view of our findings is: What is the performance profile achieved by an investor
who is aware of the stock return momentum phenomenon and in fact deliberately pursues a strategy of
4
investing in momentum style funds? We find that a strategy of investing in the top decile of all funds
ranked by their momentum exposures at the start of each quarter from 1973 to 2000 would have generated
an annual 3-factor alpha of 4.46 percent. Clearly, from a practical standpoint, a viable momentum chasing
strategy that requires quarterly updating would need to avoid investing in load funds. Hence, we also
examine the performance of such a strategy when restricted to no-load funds. A strategy of investing in
only the top momentum decile portfolio of no-load funds would have generated an annual 3-factor alpha
of 3.72 percent over the period 1973-2000. Importantly, such a strategy would be feasible as it involves
taking only long positions in no-load funds that are identified based on their historical momentum
exposures. A key implication of this result is that at least some investors could have systematically
exploited the momentum phenomenon by investing in momentum style funds. This finding is notable in
view of previous studies which suggest that, despite the robustness of the stock return momentum
phenomenon, it may be difficult to implement profitable momentum strategies at the individual security
level due to the transactions costs involved.2 The apparent profitability of such a strategy is, of course,
subject to the usual caveat that it may not be repeatable in future periods, especially if fund investors
begin to systematically exploit the momentum phenomenon at the fund level.
1. Data
Our sample uses data from the CRSP mutual fund database and includes all domestic common
stock funds that exist at any time during the period 1970 to 2000 for which quarterly total net asset (TNA)
values are available. We exclude international funds, sector funds, specialized funds, and balanced funds,
because these funds may have risk characteristics that are not spanned by the factors driving the returns of
most other mutual funds. The final sample contains 5,882 fund-entities comprising 29,981 fund-years.
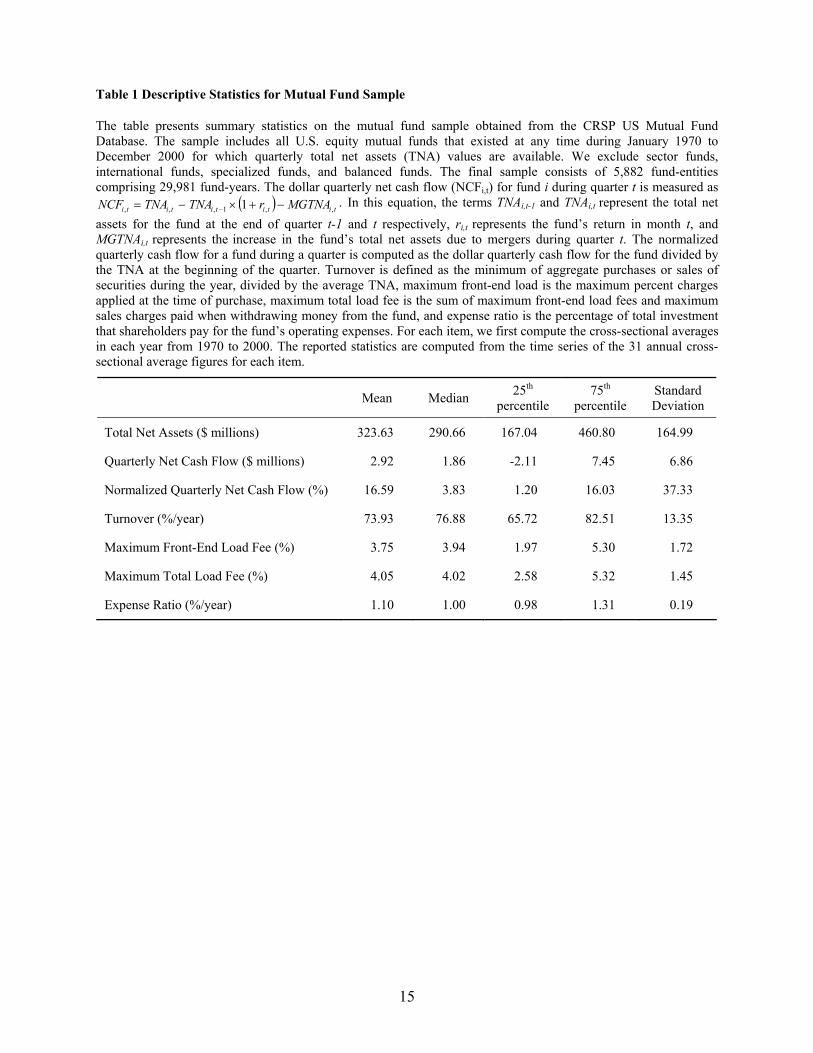
Table 1 presents descriptive statistics for the mutual fund sample. The average fund size
measured by TNA is $324 million. However, the sample is somewhat skewed by larger funds, since the
median fund size is only $291 million. The average quarterly new cash flow (described below) into funds
is a positive $2.9 million. If we normalize cash flow by the prior quarter TNA, the average quarterly net
5
cash flow is 16.6% of fund assets. We also note that the average fund had an annual portfolio turnover
rate of 74% and an expense ratio of 1.10%.
[ Insert Table 1 about here ]
2. Measurement of cash flows and performance
We analyze the fund selection ability of fund investors by examining the performance of new-
money portfolios formed on the basis of fund net cash flow. At the beginning of each quarter, we group
the mutual funds into one of two portfolios. The positive cash flow portfolio includes all funds that
realized positive net cash flow during the previous quarter, and the negative cash flow portfolio includes
all funds that realized negative net cash flow during the previous quarter. The net cash flow to fund i
during quarter t is measured as follows:
( ) titititi MGTNArTNATNA ,,1,, 1 −+×− − . (1)
Here TNAi,t refers to the total net assets at the end of quarter t, tir , is the fund’s return for quarter t, and
MGTNAi,t is the increase in the total net assets due to mergers during quarter t. For some of the analysis,
we employ the normalized cash flow, defined as the quarterly net cash flow divided by the TNA at the
beginning of the quarter. We compute monthly returns for the positive and negative new-money
portfolios under two alternative weighting schemes. First, we compute cash-flow-weighted returns for
each portfolio using the cash flows realized during the previous quarter by the funds within the portfolio.
Additionally, we compute equally-weighted returns for each new-money portfolio. For purposes of
comparison, we also report the returns on a TNA-weighted portfolio of all funds in the sample.
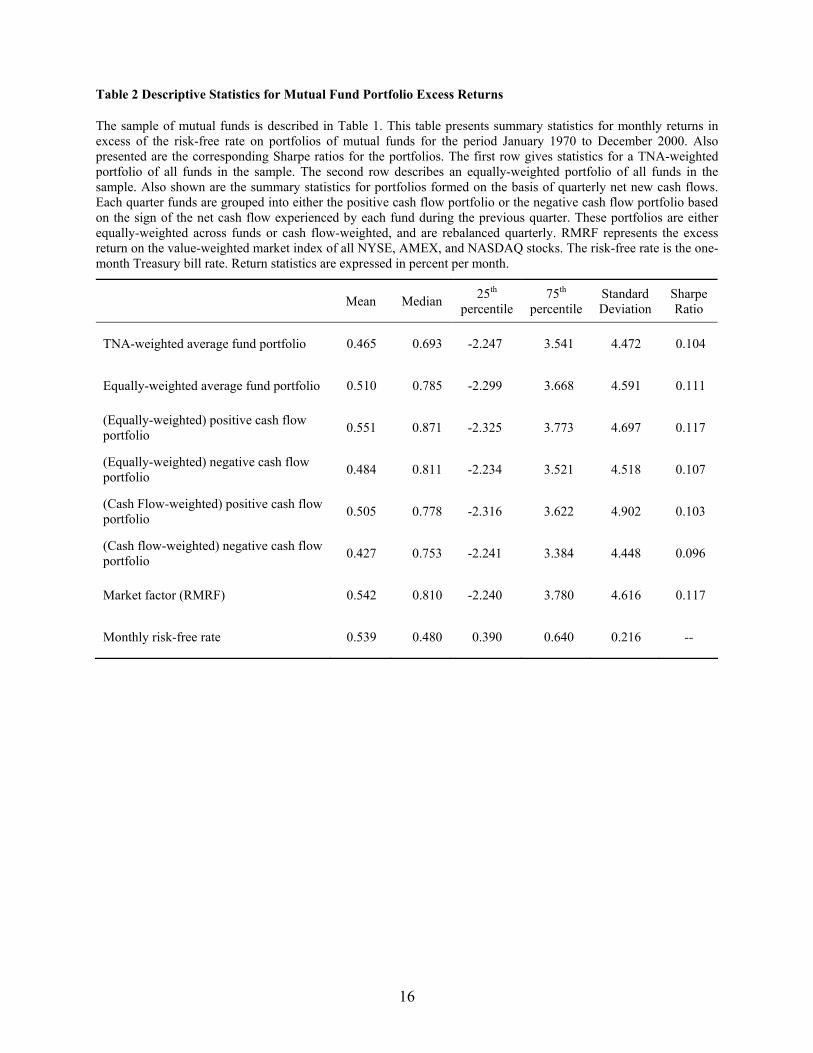
Table 2 reports the descriptive statistics for the new-money portfolios. The table presents the
mean monthly returns in excess of the one-month T-bill yield (as well as the median and the 25th and 75th
percentiles), the standard deviation, and the Sharpe ratio for the positive cash flow and the negative cash
flow portfolios. Summary statistics are presented for both the equally-weighted and cash flow-weighted
new-money portfolios. For comparison, the table also shows the corresponding statistics for a TNA-
weighted portfolio as well as an equally-weighted portfolio of all funds in the sample. We note that the
6
positive cash flow portfolios have a higher average return and a higher Sharpe ratio compared to the
negative cash flow portfolios. For example, a comparison of the cash flow-weighted portfolios reveals
that the positive cash flow portfolio has a mean excess return of 0.51%, compared to a mean excess return
of 0.43% for the negative cash flow portfolio. The average excess return on the market portfolio of stocks
for the same period was 0.54%.
[ Insert Table 2 about here ]
Performance of the positive and the negative cash flow portfolios is evaluated using a four-factor
model as in Carhart (1997). Specifically, the benchmarking model is given by:
pttptptptpptp eUMDHMLSMBRMRFr +++++= ,4,3,2,1, ββββα . (2)
Here, rp,t is the monthly return on a portfolio of funds in excess of the one month T-bill return; RMRF is
the excess return on a value-weighted market portfolio; and SMB, HML, and UMD are returns on zero-
investment factor-mimicking portfolios for size, book-to-market, and one-year momentum in stock
returns. Pioneering work by Carhart (1997) has shown that the four-factor model, which includes a
momentum factor, is superior to both the CAPM and the Fama-French three-factor model in explaining
the cross-sectional variation in fund returns. The model represented by Equation (2) may be interpreted as
a performance attribution model. We test for fund selection ability on the part of investors by examining
the difference between the alphas of the positive and the negative cash flow portfolios. In order to provide
a comparison to previous studies that have not incorporated a momentum factor in the performance
benchmark, we also report alphas based on a three-factor model that excludes the momentum factor.
3. Performance of new money portfolios
We begin our analysis by examining whether investors are able to earn superior returns based on
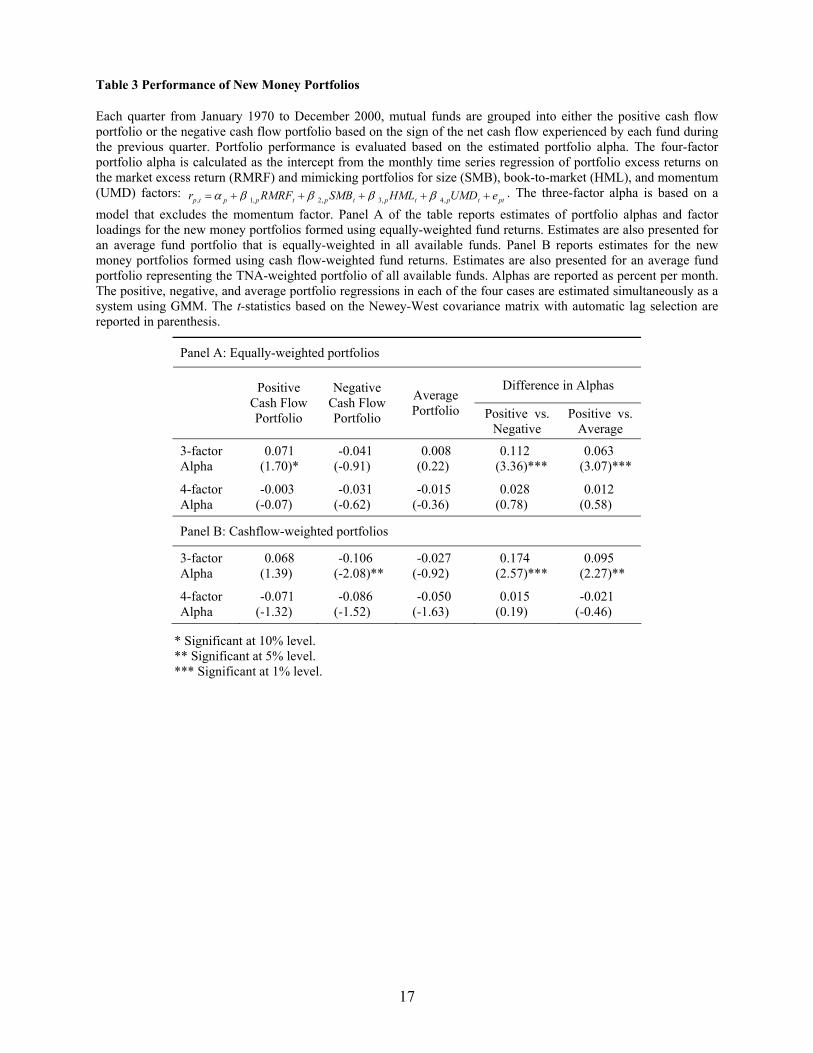
their investment decisions. Panel A of Table 3 presents results for equally-weighted new money
portfolios. The first three columns of Panel A report alphas from the three-factor model for the positive
cash flow, negative cash flow, and average portfolios, respectively. We note that the results are similar in
spirit to those reported by Zheng (1999). The positive cash flow portfolio has a statistically significant
alpha of 7.1 basis points per month (85.2 basis points annually). This contrasts with the insignificant
7
three-factor alpha of 0.8 basis points (9.6 basis points annually) earned by the average dollar invested in
mutual funds over this time period. The negative cash flow portfolio has an insignificant alpha of –4.1
basis points per month. It is further instructive to look at the difference in alphas between a trading
strategy that is long in the positive cash flow portfolio and short in the negative cash flow portfolio. While
not implementable in practice, such a comparison highlights the extent to which aggregate mutual fund
cash flows appear able to predict future performance. When we take the difference between the positive
cash flow and negative cash flow portfolio alphas we get 11.2 basis points per month, or 134.4 basis
points annually, which is significant at the 1% level. Hence, judging from the placement of their new cash
investors appear to have fund selection ability —the so-called smart money effect.
[ Insert Table 3 about here ]
However, notice from the first column under the heading “Four-factor model” in Panel A that
when we control for return momentum, the alpha for the positive cash flow portfolio shrinks to an
insignificant –0.3 basis points per month. The corresponding four-factor alpha for the average fund
portfolio equals an insignificant –1.5 basis points. Similarly, the negative cash flow portfolio’s four-factor
alpha continues to be insignificant at –3.1 basis points per month. Though not shown in the table, we find
that the slope coefficient on the momentum factor is positive for the positive cash portfolio, and the
momentum loading on the negative cash portfolio is negative. Finally, note that the difference in alphas
between the positive cash flow and negative cash flow portfolios is essentially zero after accounting for
momentum. In summary, the results for the equally-weighted new money portfolios show that the
abnormal performance obtained under the three-factor benchmark disappears after accounting for
momentum.
The performance of cash flow-weighted new money portfolios is reported in Panel B of Table 3.
Unlike an equal-weighting scheme, a cash flow-weighting scheme has the benefit of placing greater
emphasis on funds experiencing the largest absolute cash flows. Again we find evidence in support of the
smart money effect when we do not control for momentum. A hypothetical strategy of going long in the
positive cash flow portfolio and short in the negative cash flow portfolio yields a statistically and

8
economically significant three-factor alpha of 17.4 basis points per month, or 2.09% annually. However,
once we control for return momentum, the gain to this strategy shrinks to an insignificant 1.5 basis points
per month. Overall, the results for the cash flow-weighted portfolios confirm the previous findings for the
equally-weighted portfolios. The smart money effect is completely explained by return momentum.
4. What do investors chase?
Our results indicate that, consistent with previous studies, there is evidence of a smart money
effect based on a three-factor model. We further show, however, that once we account for return
momentum in our performance benchmark, the apparent difference in performance is eliminated in every
case. The lack of positive alphas after controlling for momentum suggests that investors do not identify
fund managers with superior ability. How then do we interpret the cash flow decisions of investors? There
are two potential interpretations of the role of momentum in explaining the performance of the new
money portfolios, each with competing implications for the selection ability of fund investors.
The first interpretation is that investors are aware of the momentum effect and, therefore,
purposely seek out actively managed funds that consistently follow momentum strategies. Since the
inclusion of a momentum factor in the performance benchmark adjusts for this type of investment style,
the apparent excess returns disappear. According to this story, even though investors are unable to
identify managers with superior ability, they are smart in the sense of being able to identify managers who
follow momentum investing styles. Hence, investors choose to invest in actively managed funds in order
to have access to cheap momentum strategies, rather than because they have the ability to identify
superior managers.
An alternative interpretation of the role of the momentum factor in adjusting for new money
portfolio returns is that the combination of return momentum and the fact that investors naively chase
funds with recent high returns leads mechanically to the observed selection ability documented in Gruber
(1996) and Zheng (1999). According to this story, funds with high recent returns happen by chance to
contain winner stocks that continue to perform well. This, in fact, is the conclusion reached by Carhart
(1997). If investors naively chase recent winner funds, whatever causes the momentum effect also causes
9
fund investors to have apparent selection ability relative to a three-factor model. However, the four-factor
alphas of the new money portfolios are insignificantly different from zero because the inclusion of a
momentum factor in the performance benchmark model removes the mechanical effects of momentum in
stock returns. Under this interpretation, investors do not even have selection ability based on investment
style, and Gruber’s query as to why investors put money in actively managed funds remains unanswered.
In the analysis that follows, we distinguish between these two possible interpretations of the role of
momentum in explaining the smart money effect.
5. Explaining investor behavior
If investors are in fact identifying momentum styles, then we would expect fund momentum
loadings to have significant explanatory power for fund cash flows. However, if investors are merely
chasing recent large returns without any ability to identify fund styles, we would expect lagged fund
returns to be the primary determinant of fund cash flows.3 We examine the explanatory power of both
momentum factor loading and lagged fund return for fund cash flows through a set of cross-sectional
regressions.
Based on previous studies, we would expect that several other factors may also influence net cash
flows to funds (see, for example, Chevalier and Ellison (1997), Sirri and Tufano (1998), and Jain and Wu
(2000)). We therefore control for characteristics such as fund size, portfolio turnover, load fees charged
by the fund, and the expense ratio of the fund. We use a fund’s quarterly net cash flow expressed as a
percentage of prior quarter TNA as the dependent variable in our cross-sectional regression framework.
The explanatory variables include the prior quarter return for a fund, the logarithm of TNA at the end of
the prior quarter, the normalized cash flow from the prior quarter, fund asset turnover, fund expenses, and
the maximum load fees charged by the fund. We also include as a regressor the fund’s momentum factor
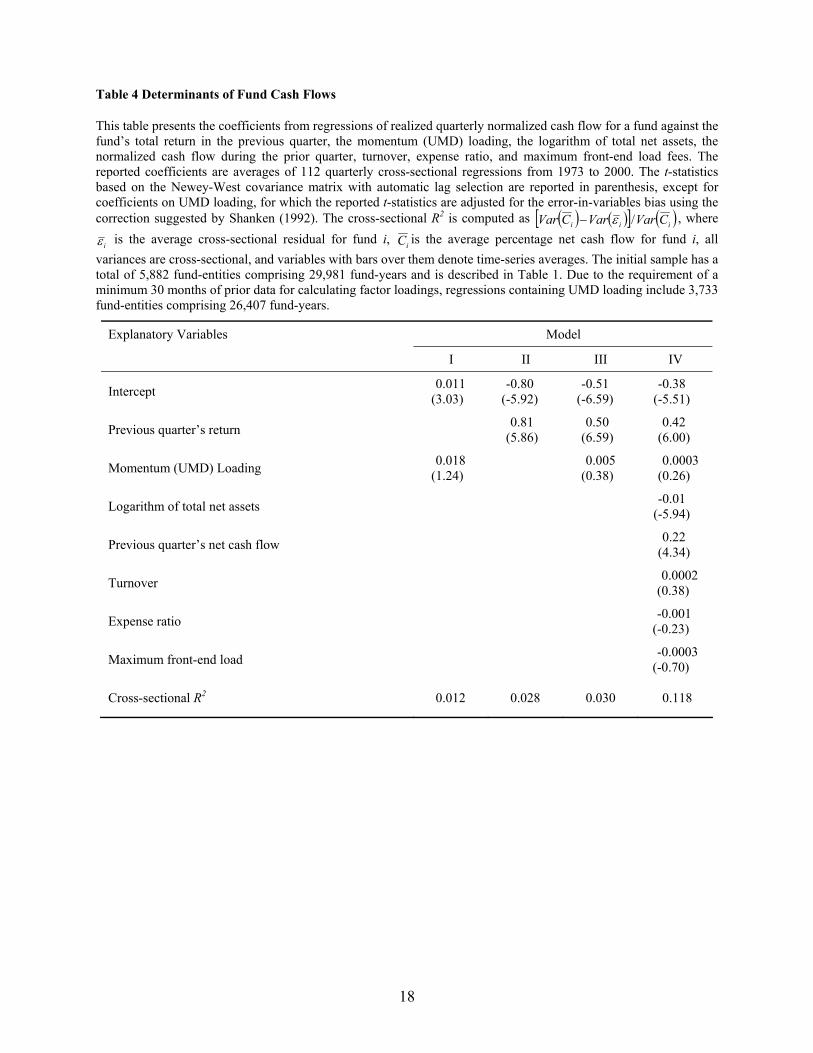
(UMD) loading from a four-factor model estimated over the prior 36 months of fund returns. The reported
coefficient estimates in Table 4 are time-series averages of 112 quarterly cross-sectional regression
estimates over the period from January 1973 to December 2000. We also report a cross-sectional R2
statistic as a goodness of fit measure.
10
[ Insert Table 4 about here ]
The first column of Table 4 presents results for the model in which momentum loading is the sole
explanatory variable. Results from this model show that although the UMD loading is positively related
to cash flows, it is not a significant predictor. Therefore, investors do not appear to be chasing pure
momentum styles with their new money. Model II has only prior quarter return as an explanatory
variable, and we see that cash flows are significantly positively correlated with the fund’s prior quarter
return, confirming the findings of previous studies. Model III employs both the UMD loading and prior
quarter return of the fund as explanatory variables, and the prior quarter return continues to be
significantly positively related to cash flows. This again suggests that cash flows are primarily influenced
by recent returns rather than by fund momentum exposure. Model IV shows estimates in the presence of
all of the control variables, where the coefficient on prior quarter net cash flow is positive and highly
significant, suggesting that cash flows tend to be persistent. Results from Model IV also confirm that the
past performance of the fund has significant explanatory power for net cash flows, even after controlling
for a number of other fund characteristics, whereas momentum factor loading does not. Finally, we note
that the marginal impact of fund turnover, expenses, and load fees on net cash flow is insignificant.
In summary, the evidence from Table 4 shows that cash flows to funds are consistently positively
related to the fund’s near-term performance, but not to fund momentum loadings. These findings suggest
that investors are primarily chasing recent large returns rather than identifying momentum style funds.
Together with our earlier findings, this suggests that a combination of momentum and investors naively
chasing funds with recent high returns leads mechanically to the observed selection ability documented in
Gruber (1996) and Zheng (1999).
6. Exploiting momentum
We have shown that investors appear to chase recent large returns as opposed to deliberately
chasing momentum styles. This raises an interesting question — namely, how profitable would it be to
implement a focused strategy of chasing funds with high momentum exposure? We test this by ranking
all funds each quarter into deciles based on their momentum (UMD) factor loadings and measuring the
11
monthly performance of the top momentum decile over the sample period. By re-balancing quarterly, we
are allowing that managers may implement momentum styles inconsistently (or even unintentionally),
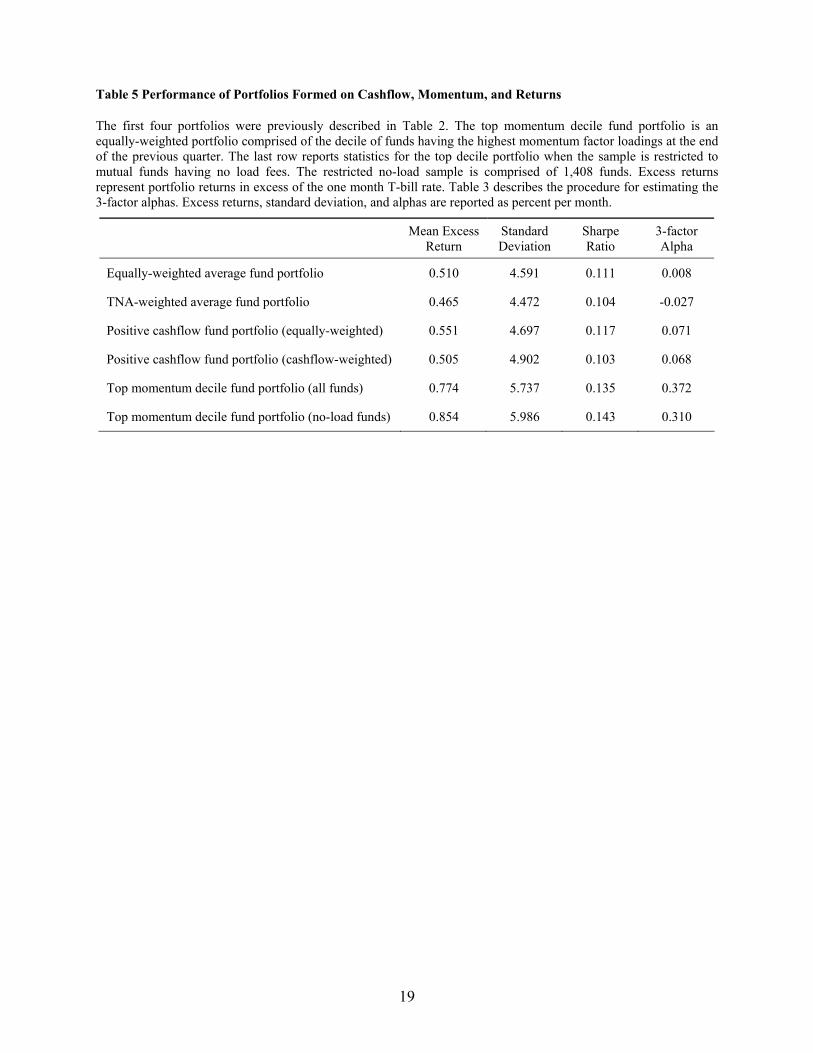
and thus insure that we are always holding the funds with the greatest momentum exposure. The mean
excess return, standard deviation, Sharpe ratio, and three-factor alpha for this strategy, as well as for
several other portfolios studied previously in this paper, are reported in Table 5.
When considering all equity funds, results show that the top momentum decile fund portfolio has
a monthly excess return of 77.4 basis points and a Sharpe ratio of 0.135, both of which compare quite
favorably to either the equal-weighted or TNA-weighted average of all funds. These numbers are also
higher than those of either of the positive cash flow portfolios representing actual investor behavior. Note,
too, that chasing momentum exposure is clearly riskier in terms of raw standard deviation. Perhaps the
most interesting statistic, however, is the monthly alpha of 37.2 basis points (4.46% annually) generated
by this strategy.
These figures are impressive, but largely hypothetical. In order for a strategy of chasing fund
momentum exposure to be truly feasible, the transactions costs would have to be minimal. We feel that
quarterly rebalancing is not problematic, but load fees would be a potential obstacle to implementing such
a strategy in practice. Therefore, we also report results when the sample is restricted to no-load mutual
funds. The monthly alpha is now 31.0 basis points (3.72% annually) which remains economically
significant. So it appears that at least some investors could have systematically exploited the momentum
phenomenon by investing in momentum style funds. This finding is notable in view of previous studies
which suggest that, despite the robustness of the stock return momentum phenomenon, it may be difficult
to implement profitable momentum strategies at the individual security level due to the transactions costs
involved.
7. Conclusion
Two recent studies by Gruber (1996) and Zheng (1999) examine whether mutual fund investors
have the ability to predict future fund performance and invest accordingly. Both studies find evidence of a
“smart money” effect —investors appear to invest in funds that subsequently perform better than funds
12
from which investors divest. These studies suggest that investors as a group possess fund selection ability.
Furthermore, Gruber claims that the finding that investors can select actively managed funds that
subsequently generate superior performance solves a prominent puzzle in the investments literature —
namely “Why do investors put money in actively managed funds when their performance on average has
been inferior to passive benchmarks?” However, neither the Gruber nor the Zheng study controls for
return momentum when benchmarking returns or specifically investigates the link between the smart
money effect and return momentum. We address this omission and show that the smart money effect is an
artifact of stock return momentum.
When we assess performance with a three-factor benchmark model that does not control for
momentum exposure, we find some evidence of a smart money effect: a hypothetical strategy of investing
in the positive cash flow portfolio and short-selling the negative cash flow portfolio appears to yield
significant alpha-gains. However, when we control for stock return momentum, the smart money effect
disappears. This suggests that investors do not identify fund managers with superior ability. We then
examine whether investors appear to be actively identifying momentum-style funds or naively chasing
large recent returns. Evidence on fund net cash flows from a cross-sectional regression analysis indicates
that investors are simply responding to large recent returns, not identifying momentum-style funds.
Finally, having established that investors do not pursue funds with a momentum investing style,
for purposes of comparison we examine the profitability of deliberately pursuing such a strategy.
Focusing strictly on funds that do not charge load fees, we find that such a strategy is quite profitable.
Specifically, a quarterly fund selection strategy of investing in the top decile portfolio of funds ranked by
their historical momentum exposure yields an annualized 3-factor alpha of 3.72% over the period 1973-
2000. It remains to be seen, of course, whether such gains would persist in future periods or whether they
would be diminished, especially if investors began to systematically exploit the momentum phenomenon
at the fund level.

13
Acknowledgments This article is based in part on the authors’ paper, “Does Stock Return Momentum Explain the “Smart
Money” Effect?” Journal of Finance, December, 2004. We are grateful to an anonymous referee for
helpful comments.
14
References
Carhart, Mark, 1997, On persistence in mutual fund performance, Journal of Finance 52, 57-82. Chevalier, Judith, and Glenn Ellison, 1997, Risk taking by mutual funds as a response to incentives,
Journal of Political Economy 105, 1167-1200. Elton, Edwin, Martin Gruber, and Christopher Blake, 1996, The persistence of risk-adjusted mutual fund
performance, Journal of Business 69, 133-157. Fama, Eugene, and Kenneth French, 1993, Common risk factors in the return on bonds and stocks,
Journal of Financial Economics 33, 3-53. Goetzmann, William, and Roger Ibbotson, 1994, Do winners repeat? Patterns in mutual fund
performance, Journal of Portfolio Management 20, Winter, 9-18. Grinblatt, Mark, and Sheridan Titman, 1992, The persistence of mutual fund performance, Journal of
Finance 47, 1977-1984. Gruber, Martin, 1996, Another puzzle: The growth in actively managed mutual funds, Journal of Finance
51, 783-810. Hendricks, Darryll, Jayendu Patel, and Richard Zeckhauser, 1993, Hot hands in mutual funds: Short-run
persistence of relative performance, 1974-1988, Journal of Finance 48, 93-130. Jain, Prem and Joanna Wu, 2000, Truth in mutual fund advertising: Evidence on future performance and
fund flows, Journal of Finance 55, 937-958. Jegadeesh, Narasimhan, and Sheridan Titman, 1993, Returns to buying winners and selling losers:
Implications for stock market efficiency, Journal of Finance 48, 65-91. Jensen, Michael, 1968, The performance of mutual funds in the period 1945-1964, Journal of Finance 23,
389-416. Lesmond, David A., Michael J. Schill, and Chunsheng Zhou, 2004, The illusory nature of momentum
profits, Journal of Financial Economics 71, 349-380. Sirri, Erik, and Peter Tufano, 1998, Costly search and mutual fund flows, Journal of Finance 53, 1589-
1622. Shanken, Jay, 1992, On the estimation of beta-pricing models, Review of Financial Studies 5, 1-33. Zheng, Lu, 1999, Is money smart? A study of mutual fund investors’ fund selection ability, Journal of
Finance 54, 901-933.
15
Table 1 Descriptive Statistics for Mutual Fund Sample
The table presents summary statistics on the mutual fund sample obtained from the CRSP US Mutual Fund Database. The sample includes all U.S. equity mutual funds that existed at any time during January 1970 to December 2000 for which quarterly total net assets (TNA) values are available. We exclude sector funds, international funds, specialized funds, and balanced funds. The final sample consists of 5,882 fund-entities comprising 29,981 fund-years. The dollar quarterly net cash flow (NCFi,t) for fund i during quarter t is measured as
( ) tititititi MGTNArTNATNANCF ,,1,,, 1 −+×−= −. In this equation, the terms TNAi,t-1 and TNAi,t represent the total net
assets for the fund at the end of quarter t-1 and t respectively, ri,t represents the fund’s return in month t, and MGTNAi,t represents the increase in the fund’s total net assets due to mergers during quarter t. The normalized quarterly cash flow for a fund during a quarter is computed as the dollar quarterly cash flow for the fund divided by the TNA at the beginning of the quarter. Turnover is defined as the minimum of aggregate purchases or sales of securities during the year, divided by the average TNA, maximum front-end load is the maximum percent charges applied at the time of purchase, maximum total load fee is the sum of maximum front-end load fees and maximum sales charges paid when withdrawing money from the fund, and expense ratio is the percentage of total investment that shareholders pay for the fund’s operating expenses. For each item, we first compute the cross-sectional averages in each year from 1970 to 2000. The reported statistics are computed from the time series of the 31 annual cross-sectional average figures for each item.
Mean Median 25th percentile
75th percentile
Standard Deviation
Total Net Assets ($ millions) 323.63 290.66 167.04 460.80 164.99
Quarterly Net Cash Flow ($ millions) 2.92 1.86 -2.11 7.45 6.86
Normalized Quarterly Net Cash Flow (%) 16.59 3.83 1.20 16.03 37.33
Turnover (%/year) 73.93 76.88 65.72 82.51 13.35
Maximum Front-End Load Fee (%) 3.75 3.94 1.97 5.30 1.72
Maximum Total Load Fee (%) 4.05 4.02 2.58 5.32 1.45
Expense Ratio (%/year) 1.10 1.00 0.98 1.31 0.19
16
Table 2 Descriptive Statistics for Mutual Fund Portfolio Excess Returns
The sample of mutual funds is described in Table 1. This table presents summary statistics for monthly returns in excess of the risk-free rate on portfolios of mutual funds for the period January 1970 to December 2000. Also presented are the corresponding Sharpe ratios for the portfolios. The first row gives statistics for a TNA-weighted portfolio of all funds in the sample. The second row describes an equally-weighted portfolio of all funds in the sample. Also shown are the summary statistics for portfolios formed on the basis of quarterly net new cash flows. Each quarter funds are grouped into either the positive cash flow portfolio or the negative cash flow portfolio based on the sign of the net cash flow experienced by each fund during the previous quarter. These portfolios are either equally-weighted across funds or cash flow-weighted, and are rebalanced quarterly. RMRF represents the excess return on the value-weighted market index of all NYSE, AMEX, and NASDAQ stocks. The risk-free rate is the one-month Treasury bill rate. Return statistics are expressed in percent per month.
Mean Median 25th
percentile 75th
percentile Standard Deviation
Sharpe Ratio
TNA-weighted average fund portfolio 0.465 0.693 -2.247 3.541 4.472 0.104
Equally-weighted average fund portfolio 0.510 0.785 -2.299 3.668 4.591 0.111
(Equally-weighted) positive cash flow portfolio 0.551 0.871 -2.325 3.773 4.697 0.117
(Equally-weighted) negative cash flow portfolio 0.484 0.811 -2.234 3.521 4.518 0.107
(Cash Flow-weighted) positive cash flow portfolio 0.505 0.778 -2.316 3.622 4.902 0.103
(Cash flow-weighted) negative cash flow portfolio 0.427 0.753 -2.241 3.384 4.448 0.096
Market factor (RMRF) 0.542 0.810 -2.240 3.780 4.616 0.117
Monthly risk-free rate 0.539 0.480 0.390 0.640 0.216 --
17
Table 3 Performance of New Money Portfolios
Each quarter from January 1970 to December 2000, mutual funds are grouped into either the positive cash flow portfolio or the negative cash flow portfolio based on the sign of the net cash flow experienced by each fund during the previous quarter. Portfolio performance is evaluated based on the estimated portfolio alpha. The four-factor portfolio alpha is calculated as the intercept from the monthly time series regression of portfolio excess returns on the market excess return (RMRF) and mimicking portfolios for size (SMB), book-to-market (HML), and momentum (UMD) factors:
pttptptptpptp eUMDHMLSMBRMRFr +++++= ,4,3,2,1, ββββα . The three-factor alpha is based on a model that excludes the momentum factor. Panel A of the table reports estimates of portfolio alphas and factor loadings for the new money portfolios formed using equally-weighted fund returns. Estimates are also presented for an average fund portfolio that is equally-weighted in all available funds. Panel B reports estimates for the new money portfolios formed using cash flow-weighted fund returns. Estimates are also presented for an average fund portfolio representing the TNA-weighted portfolio of all available funds. Alphas are reported as percent per month. The positive, negative, and average portfolio regressions in each of the four cases are estimated simultaneously as a system using GMM. The t-statistics based on the Newey-West covariance matrix with automatic lag selection are reported in parenthesis.
Panel A: Equally-weighted portfolios
Difference in Alphas
Positive Cash Flow Portfolio
Negative Cash Flow Portfolio
Average Portfolio Positive vs.
Negative Positive vs.
Average
3-factor Alpha
0.071 (1.70)*
-0.041 (-0.91)
0.008 (0.22)
0.112 (3.36)***
0.063 (3.07)***
4-factor Alpha
-0.003 (-0.07)
-0.031 (-0.62)
-0.015 (-0.36)
0.028 (0.78)
0.012 (0.58)
Panel B: Cashflow-weighted portfolios
3-factor Alpha
0.068 (1.39)
-0.106 (-2.08)**
-0.027 (-0.92)
0.174 (2.57)***
0.095 (2.27)**
4-factor Alpha
-0.071 (-1.32)
-0.086 (-1.52)
-0.050 (-1.63)
0.015 (0.19)
-0.021 (-0.46)
* Significant at 10% level. ** Significant at 5% level. *** Significant at 1% level.
18
Table 4 Determinants of Fund Cash Flows
This table presents the coefficients from regressions of realized quarterly normalized cash flow for a fund against the fund’s total return in the previous quarter, the momentum (UMD) loading, the logarithm of total net assets, the normalized cash flow during the prior quarter, turnover, expense ratio, and maximum front-end load fees. The reported coefficients are averages of 112 quarterly cross-sectional regressions from 1973 to 2000. The t-statistics based on the Newey-West covariance matrix with automatic lag selection are reported in parenthesis, except for coefficients on UMD loading, for which the reported t-statistics are adjusted for the error-in-variables bias using the correction suggested by Shanken (1992). The cross-sectional R2 is computed as ( ) ( )[ ] ( )iii CVarVarCVar /ε− , where
iε is the average cross-sectional residual for fund i, iC is the average percentage net cash flow for fund i, all variances are cross-sectional, and variables with bars over them denote time-series averages. The initial sample has a total of 5,882 fund-entities comprising 29,981 fund-years and is described in Table 1. Due to the requirement of a minimum 30 months of prior data for calculating factor loadings, regressions containing UMD loading include 3,733 fund-entities comprising 26,407 fund-years.
Explanatory Variables Model
I II III IV
Intercept 0.011 (3.03)
-0.80 (-5.92)
-0.51 (-6.59)
-0.38 (-5.51)
Previous quarter’s return 0.81 (5.86)
0.50 (6.59)
0.42 (6.00)
Momentum (UMD) Loading 0.018 (1.24) 0.005
(0.38) 0.0003
(0.26)
Logarithm of total net assets -0.01 (-5.94)
Previous quarter’s net cash flow 0.22 (4.34)
Turnover 0.0002 (0.38)
Expense ratio -0.001 (-0.23)
Maximum front-end load -0.0003 (-0.70)
Cross-sectional R2 0.012 0.028 0.030 0.118
19
Table 5 Performance of Portfolios Formed on Cashflow, Momentum, and Returns
The first four portfolios were previously described in Table 2. The top momentum decile fund portfolio is an equally-weighted portfolio comprised of the decile of funds having the highest momentum factor loadings at the end of the previous quarter. The last row reports statistics for the top decile portfolio when the sample is restricted to mutual funds having no load fees. The restricted no-load sample is comprised of 1,408 funds. Excess returns represent portfolio returns in excess of the one month T-bill rate. Table 3 describes the procedure for estimating the 3-factor alphas. Excess returns, standard deviation, and alphas are reported as percent per month.
Mean Excess Return
Standard Deviation
Sharpe Ratio
3-factor Alpha
Equally-weighted average fund portfolio 0.510 4.591 0.111 0.008
TNA-weighted average fund portfolio 0.465 4.472 0.104 -0.027
Positive cashflow fund portfolio (equally-weighted) 0.551 4.697 0.117 0.071
Positive cashflow fund portfolio (cashflow-weighted) 0.505 4.902 0.103 0.068
Top momentum decile fund portfolio (all funds) 0.774 5.737 0.135 0.372
Top momentum decile fund portfolio (no-load funds) 0.854 5.986 0.143 0.310

20
Notes 1 A number of earlier studies such as Grinblatt and Titman (1992); Hendricks, Patel, and Zeckhauser
(1993); Goetzmann and Ibbotson (1994); Brown and Goetzmann (1995); and Elton, Gruber, and Blake
(1996) find performance persistence over short-term horizons of one to three years.
2 For example, Lesmond, Schill, and Zhou (2004, p.349) note that “…stocks that generate large
momentum returns are precisely those stocks with high trading costs. We conclude that the magnitude of
the abnormal returns associated with these trading strategies creates an illusion of profit opportunity
when, in fact, none exists.”
3 The positive correlation between past fund performance and subsequent cash flows is well documented
in the literature. We confirm this stylized fact in our sample, where the Spearman rank correlation
between percentage cash flows and prior quarter return deciles is 0.99.