stock returns and investor sentiment: textual analysis and
TRANSCRIPT

Economics Faculty Working Papers Series Economics
2019
Stock Returns and Investor Sentiment: TextualAnalysis and Social MediaZachary McGurkCanisius College, [email protected]
Adam NowakWest Virginia University, [email protected]
Joshua C. HallWest Virginia University, [email protected]
Follow this and additional works at: https://researchrepository.wvu.edu/econ_working-papers
Part of the Computer Sciences Commons, and the Finance and Financial ManagementCommons
This Working Paper is brought to you for free and open access by the Economics at The Research Repository @ WVU. It has been accepted forinclusion in Economics Faculty Working Papers Series by an authorized administrator of The Research Repository @ WVU. For more information,please contact [email protected].
Digital Commons CitationMcGurk, Zachary; Nowak, Adam; and Hall, Joshua C., "Stock Returns and Investor Sentiment: Textual Analysis and Social Media"(2019). Economics Faculty Working Papers Series. 37.https://researchrepository.wvu.edu/econ_working-papers/37

Stock Returns and Investor Sentiment: TextualAnalysis and Social Media
Zachary McGurkDepartment of Economics & Finance, Canisus College
Buffalo, NY United [email protected]
Adam NowakJohn Chambers College of Business and Economics, West Virginia University
Morgantown, WV 26506, United [email protected]
Joshua C. HallJohn Chambers College of Business and Economics, West Virginia University
Morgantown, WV 26506, United [email protected](Corresponding author)
Abstract
The behavioral finance literature has found that investor sentiment has pre-dictive ability for equity returns. This differs from standard finance theory,which provides no role for investor sentiment. We examine the relationshipbetween investor sentiment and stock returns by employing textual analysis onsocial media posts. We find that our investor sentiment measure has a positiveand significant effect on abnormal stock returns. These findings are consis-tent across a number of different models and specifications, providing furtherevidence against non-behavioral theories.
JEL-Classification: G12, G13, G14
Keywords: Investor sentiment, supervised learning, stock returns, social media, suffi-cient reduction, predictive regression
1

1 Introduction
As described in Malkiel and Fama (1970), the Efficient Market Hypothesis (EMH)predicts asset prices fully reflect all available information. Rational investors in re-sponse choose asset portfolios which diversify away idiosyncratic risk. As such assetprices are only a function of market fundamentals. When asset prices are mispricedthrough the actions of irrational investors, rational investors are able to use arbitrageto correct asset prices.
In contrast to the EMH, behavioral finance theory suggests that the feelings ofirrational investors (Investor Sentiment) drive a portion of asset prices. Due to thespecific characteristics of some assets (small, hard to value, limited information, etc.),arbitrage by rational investors becomes costly and asset prices are perpetually mis-priced.1 Recent empirical studies have found Investor Sentiment to be related to stockreturns.2
While the empirical finance literature has found Investor Sentiment to be a validpredictor of the cross section and time series of stock returns, studies differ how theInvestor Sentiment measure is estimated. As noted by Baker and Wurgler (2006,2007) Investor Sentiment is difficult to directly measure. As a result, the literaturehas relied on proxies developed from market/investor surveys, data mining methods,and textual analysis from annual reports, commercial media, and social media.
Due to data limitations, the market/investor survey and data mining methodsliterature focus on the impact of investor sentiment on returns over monthly or largertime horizons. While most of these studies show a relationship between asset returnsand investor sentiment, these studies may not capture the full impact of investorsentiment. If asset markets are partially efficient (i.e. investor sentiment does notdetermine a portion of stocks), and information is randomly dispersed, then marketsshould be the least efficient in the very short run.
Another critique of this literature is that these investor sentiment measures showoverall market sentiment rather than asset specific sentiment. Baker and Wurgler(2006) discusses that due to imperfect information about smaller firms, any newinformation causes investors to engage in irrational speculative trading. Market sen-timent may not necessarily capture this speculative feeling in smaller firms.
While much of the textual analysis literature has been able to account for thepreceding critiques, the estimation methods used may be not be able to fully cap-ture investor sentiment. A portion of the previous literature has relied on dictionary
1See, for example, Baker and Wurgler (2006, 2007)2See Nardo et al. (2016), Bukovina (2016) and Zhou (2018) for a review of the recent literature.
1

based methods in determining Investor Sentiment (Loughran and McDonald, 2011;Chen et al., 2014; Jiang et al., 2019). To estimate sentiment, these studies pre-definea dictionary of positive and negative finance words and determine overall investorsentiment as the net positive word counts. The limitation of this approach is thatthere may be important missing terms which show sentiment. This method also giveseach word equal weight in determining sentiment and does not account for sentimentshown in multi-word phrases.3
Other studies have utilized machine learning methods to estimate investor sen-timent (Bartov et al., 2018; Ranco et al., 2015; Yang et al., 2015; Sun et al., 2016;Renault, 2017; Behrendt and Schmidt, 2018). These studies provide an improvementon dictionary-based methods as the created investor sentiment indexes allow for dif-ferent weighting of textual terms. These papers focus on the extreme short run (5 to30-minute intervals) impact of investor sentiment on returns and given data limita-tions are unable to create equity specific investor sentiment.4
Given the limitations of the previous literature, we propose a new method for es-timating Twitter based stock specific investor sentiment index utilizing as developedin Taddy (2013a). This method differs in that estimates of sentiment do not relyon a predefined dictionary, and individual words are not assumed to be related thesame sentiment information. Further, given the data rich environment of Twitter,we are able to create equity specific investor sentiment indexes. In this method, atraining set of posts by individual users on Twitter (tweets) are determined to eitherconvey positive, neutral, or negative sentiment. These are then used to predict thesentiment information from all remaining tweets. For comparison, we also developa dictionary based investor sentiment utilizing a similar method as Loughran andMcDonald (2011).
We further utilize our investor sentiment index to test the empirical validity ofEMH and Behavioral Finance theories. We specifically determine the relationshipbetween our investor sentiment measures (negative, neutral, and positive sentiment)and cross-section abnormal stock returns. For robustness, we test if this relationshipis similar across firm size. Finally, we determine if investor sentiment is useful inforecasting abnormal returns at the market level and by firm size.
The social media platform Twitter is used by over 320 million users who expressopinions and thoughts on a number of different subject matters including equity
3Loughran and McDonald (2011) include a method for weighting individual words, however, thisis based on word frequency rather than perceived sentiment information.
4Bloomberg and Thompson Reuters have created commercial equity specific textual analysisbased investor sentiment measures. These measures are proprietary and as such estimation methodsare unknown. These measure are used by Sun et al. (2016) and Behrendt and Schmidt (2018).
2

prices.5 Further, Twitter is unique in that an individual can reference specific stocksby affixing a ‘$’ before the stock symbol in a tweet. This allows all Twitter usersto search for tweets discussing a particular stock. This allows researchers to collecttweets supplied by individuals specific to a stock. Anecdotal evidence has shownindividual Twitter posts (tweets) to influence specific stock returns. On January 10,2011, Business Insider reported hip hop artist, 50-Cent (Curtis Jackson), tweeted
HNHI is the stock symbol for TVG there launching 15 different products.they are no joke get in now.
The article goes on to state (Weisenthal, 2011, no page number):
In the three months to the end of September, the company was operatingat a loss with cash of just $198,000 and a deficit of $3.3m. Then, onNovember 23, it said it would offer 180m shares to the public at a priceof just 17 cents... trading under the stock name HNHI was worth just 4cents each. Spurred by the tweet, the stock took off. It hit nearly 50 centson Monday, before closing at 39 cents.
By the end of the month, the stock was up to $1.68. This price increase was relativelyshort lived. In early May, 50-cent terminated his relationship with this company, andthe stock dropped in value to $0.1.
Overall, we find a relationship between abnormal stock returns and our estimatedinvestor sentiment indexes. We find an increase in positive sentiment is related toan increase in abnormal returns while also finding that estimated negative estimatedsentiment had a limited relationship with abnormal returns. These results are consis-tent across firm size. Using out-of-sample forecasting tests, we find investor sentimentis able to produce marginally more accurate forecasts compared to a constant onlymodel. Gains in forecast accuracy, however, is limited to around one percent. Ourresults indicate that individuals on Twitter are relaying stale information as opposedto providing novel insights.
The remainder of the paper proceeds as follows. Section 2 details the relevantliterature on investor sentiment and textual analysis, Section 3 describes the method-ology and data, Section 4 details the cross sectional analysis, Section 5 provides adiscussion on forecasting method utilized and forecasting results, and Section 6 con-cludes.
5Source: Twitter 2018 Annual Report.
3

2 Literature Review
The empirical finance literature has overwhelmingly shown a relationship betweeninvestor sentiment and cross-sectional stock returns. Since Baker and Wurgler (2006,2007), the primary focus of the literature has been to determine an appropriate proxyfor investor sentiment. Specifically, the literature has focused on three potentialsources of investor sentiment proxies: investor and consumer surveys, methods sim-ilar to Baker and Wurgler (2006) such as Huang et al. (2015), and textual analysisfrom traditional and social media.
The investor sentiment proxies derived from surveys and using methods similar toBaker and Wurgler (2006) and Huang et al. (2015) have generally found that investorsentiment is related to cross section and future returns (Lee et al., 2002; Brown andCliff, 2004; Lemmon and Portniaguina, 2006; Smales, 2017; Shen et al., 2017). Smales(2017) finds that the Chicago Board Options Exchange Volatility Index (VIX) per-forms empirically well compared to survey measures. Baker and Wurgler (2006) andHuang et al. (2015) find the same for stock returns. Chung et al. (2012) using a Bakerand Wurgler (2006) style investor sentiment index, finds that sentiment is unable toforecast returns during recessions. In a related work, Shen et al. (2017) find that thedifference in returns from portfolios sorted by macroeconomic risk are related to theBaker and Wurgler (2006) investor sentiment index. Aboody et al. (2018) suggestovernight returns may be an appropriate proxy for investor sentiment and find thathigh overnight returns predict returns.
More recently, studies have focused on the impact of investor sentiment in inter-national financial markets. Utilizing consumer confidence as a measure of investorsentiment, Schmeling (2009) finds that sentiment can forecast market returns for 18industrialized countries. Baker et al. (2012) show that global investor sentiment isable to predict market returns for six developed countries. Frijns et al. (2017) showthat US investor sentiment (as measured by the American Association of IndividualInvestors Investor sentiment survey) is related to market returns for several developedcountries. Seok et al. (2018) find a high frequency firm specific investor sentimentindex utilizing a Baker and Wurgler (2006) method for the Korean stock market canpredict future returns in the Korean stock market. Xu and Zhou (2018) utilizing aninvestor sentiment based on Huang et al. (2015) find market investor sentiment canpredict future returns in the Chinese A-share market.
The use of surveys and methods similar to Baker and Wurgler (2006) and Huanget al. (2015) as a measure of investor sentiment has remained controversial. Da et al.(2015) note that the investor sentiment surveys are generally unreliable given thereis little incentive for survey takers to respond or respond truthfully.
4

The investor sentiment proxies created using surveys and methods similar to Bakerand Wurgler (2006); Huang et al. (2015) are at best available weekly but often lessfrequently. Further, these measures proxy for overall market sentiment. If a portionof the market is efficient, then it is likely the shorter the time horizon the larger theimpact of investor sentiment on the cross section of stock returns. With longer timehorizons, rational investors may be able use arbitrage to counter the mispricing causedby irrational investors. In contrast, with the amount and frequency of informationavailable on an ongoing basis, internet and social media derived indexes can producehigher frequency and stock specific measures of investor sentiment.
While overall market-level investor sentiment is likely driving the systemic mispric-ing of assets, equity-specific investor sentiment is likely to play a role in idiosyncraticmispricing. Further, as discussed in Baker and Wurgler (2007), investor sentiment islikely to have a different impact on pricing based on asset characteristics, leading to“safe” assets being undervalued during periods of positive sentiment and overvaluedduring periods of negative sentiment.
We argue that while market sentiment plays a role in explaining the overall mis-pricing of assets, stock-specific sentiment is likely to be informative. Avery andChevalier (1999) provides three potential sources of sentiment bias in sports bettingmarkets: so-called expert opinions, a hot-handed bias, and a bias toward prestigiousteams. Avery and Chevalier (1999) further note these sources have their equivalentin asset markets. These sources may lead retail investors to speculate about specificfirms regardless of their overall feeling toward asset markets.
With the frequency and availability of firm specific information provided in tra-ditional and social media, textual analysis provides an avenue for further study ofinvestor sentiment. Two procedures have been used in the textual analysis litera-ture. Both of these treat the text as a collection of exchangeable tokens, a tokenbeing either a word or a phrase. The first approach is the so-called bag-of-wordsapproach that requires the researcher to specify a dictionary of positive and negativetokens (Loughran and McDonald, 2011, 2014; Chen et al., 2014; Heston and Sinha,2017; Renault, 2017; Jiang et al., 2019). The second approach, which we refer to asthe tokenization approach, does not require the researcher to explicitly specify anyprior beliefs regarding the positivity or negativity of individual tokens but rather usesmanually labeled text to identify relevant tokens (Taddy, 2013b,a; Mitra and Gilbert,2014; Ranco et al., 2015; Oliveira et al., 2016; Renault, 2017).
The literature has primarily relied on two distinct word lists to develop dictionar-ies using the bag-of-words approach: Harvard IV-4 word lists,6 and the Loughran andMcDonald (2011) finance specific word list. The Harvard IV-4 word list was create to
6 http://www.wjh.harvard.edu/ inquirer/homecat.htm
5

determine the tone of texts for the sociology and psychology literature. This dictio-nary is further divided into several different categories with the negative and positiveword lists getting the largest use in the finance literature.
Loughran and McDonald (2011) argue that the Harvard IV-4 word list is not ap-plicable to finance texts and can lead to the misidentification of sentiment. Loughranand McDonald (2011) argue that the Harvard IV-4 word list does not include a num-ber of key finance specific tokens. Further, certain tokens are misclassified as negativewhen used in a finance context. In fact, Loughran and McDonald (2011) find thataround 74 percent of the negative tokens found in the Harvard IV-4 word list arenot deemed negative in a finance context. To address these critiques, Loughran andMcDonald (2011) create a finance specific word list to accurately identify the toneof 10-K filings. Loughran and McDonald (2011) find sentiment of 10-K filings usingtheir finance specific dictionaries are more correlated with equity returns compared tosentiment of 10-K filings using the Harvard IV-4 word list. Chen et al. (2014) utilizethe Loughran and McDonald (2011) dictionary to create an equity specific investorsentiment index from posts and comments from Seeking Alpha (a crowd-sourced fi-nancial market media source). Chen et al. (2014) find their investor sentiment indexis able to predict stock returns up to three months ahead. Jiang et al. (2019) utilizethe Loughran and McDonald (2011) dictionary to create a manager sentiment indexfrom annual and quarterly filing, and conference calls. Overall Jiang et al. (2019)find that manager sentiment is able to predict stock returns using out-sample fore-cast evaluation.
The bag-of-words method, while being thoroughly used in the literature, has sev-eral limitations. First, the bag-of-words method relies on the researcher to correctlyidentify an appropriate dictionary prior to determining the tone of a text. Loughranand McDonald (2016) note that the use of the Loughran and McDonald (2011) financespecific dictionary for use in anything but determining the tone of 10k filings can beproblematic and modification must be done to identify sentiment from other forms ofmedia. Creating a finance specific dictionary or modifying the Loughran and McDon-ald (2011) dictionary using only one word tokens (unigrams) that are applicable tospecific media is a doable task. Attempting to do this for dictionaries utilizing multi-word tokens (n-grams) may be improbable, as tens of thousands tokens would needto be identified. This dictionary would not just include tokens and their antonyms(e.g., Sell and Don’t Sell), but other tokens that may not found in unigrams (e.g.,Death Cross). While not directly using the bag-of-words approach, Yang et al. (2015)provides a limited solution to this by modifying estimated sentiment from a tweetwhen a token with a negative connotation precedes another token in their dictionary.
Even given these critiques, bag-of-words methods may be harder to implementwhen estimating sentiment from social media. Loughran and McDonald (2016) state
6

that given the specific vocabulary used in social media (e.g., slang, and sarcasm),correctly identifying tone is much more difficult compared to SEC filings. Second,a majority of the bag-of-words literature has relied on counts of positive and nega-tive tokens in text or other methods of equal weighting of tokens in a dictionary todetermine sentiment.7 This implies that each token provides the same amount of sen-timent information. It is likely that some tokens present greater negative or positivesentiment than others. Loughran and McDonald (2011) suggests weighting tokensby frequency to account for the differences in document size. Further, when longertexts are written by fewer authors, bag-of-words estimated sentiment without tokenweighting may lead to an incorrect identification of sentiment due to the number ofwords. Specifically, authors may differ in how they express their emotions (overtlyor minimally) through text and as such estimated sentiment may be biased by thenumber of tokens.8
An advantage of using posts from Twitter to estimate sentiment is that our sam-ple contains posts from many users. This reduces the likelihood that our estimationsuffers from small sample bias caused by users expressing their emotions differently.Further, as the number of possible characters are limited to 140 during our sampleperiod, this weighting method is likely not necessary to infer sentiment from Twitter.9
The tokenization approach provides a solution to many of the above critiques.Specifically, the tokenization approach does not require an author to predefine a dic-tionary. Further, methods like the Multinomial Inverse Regression (MNIR), developedin Taddy (2013b), allow for each token to be weighted by the sentiment informationthat it provides. As described in Loughran and McDonald (2016), the inverse regres-sion method can be viewed a method for “identifying and weighting sentiment words.”
In the context of creating an investor sentiment index, the standard procedure forimplementing the tokenization approach is to create a training set where a sample oftext is manually labeled as either positive, neutral, or negative.10 From this scoredset of texts, the researcher can: 1) identify which tokens are associated with positive,neutral or negative texts, 2) estimate weights that indicate the relative positivity ornegativity associated with each token, and 3) use the predicted values to create sen-timent scores for each document.
A number of studies utilize a similar tokenization method, Naıve Bayesian classi-
7See Loughran and McDonald (2016) for an extended discussion of alternative weighting schemes.8We thank the anonymous reviewer for providing an additional critique of the bag-of-words ap-
proach without token weighting9In 2017, Twitter increased character limits to 280. As the twitter data used in study is from
prior to this change, all tweets are limited to 140 characters.10Alternative approaches can be taken that would allow for continuous classifications.
7

fiers, to identify investor sentiment from social media. Bartov et al. (2018) use both atokenization and bag-of-words approach to develop equity specific investor sentimentindex from Twitter. Bartov et al. (2018) finds their Twitter sentiment can predicta stock’s return prior to earnings announcements. With the tokenization approach,individual tweets are weighted by their estimated probability of being negative, pos-itive, or neutral and by the number of followers of the Twitter user. Ranco et al.(2015) creates an investor sentiment index for 30 stocks in the DJIA using Twitterand tests if large tweet increases relate to future abnormal returns. Ranco et al.(2015) find estimated negative and positive sentiment Granger cause abnormal re-turns. Yang et al. (2015) estimate a twitter sentiment index using only tweets fromuser considered “influencers.” The general idea is that influencers are the ones whoare showing market sentiment while other users are simply trying to find informationto trade on. The investor sentiment index is created by using the “comprehensivedictionary” (SentiWordNet). While the SentiWordNet dictionary is derived using amachine learning method, it was not created for a specifically for use in finance andits use may be suspect when applied to a finance-based application. Yang et al. (2015)find past sentiment is related to current market returns.
Several recent studies have focused on determining the role of investor sentimentin determining and predicting intraday returns. Oliveira et al. (2016) and Renault(2017) utilize both a tokenization and bag-of-words approach to create an investorsentiment index using posts from StockTwit.11 This social media platform is unique inthat users can pre-label their tweets as either “Bullish” (demonstrating negative sen-timent) or “Bearish” (demonstrating positive sentiment). This allows the researcherto forgo manually labeling a training set. This study shows the StockTwit derivedinvestor sentiment indexes can forecast intraday S&P 500 EFT returns. Sun et al.(2016) find that changes in the Thomson Reuters sentiment index predict marketreturns with a larger impact on the last two hours of trading. In a similar study,Behrendt and Schmidt (2018) utilizes the Bloomberg News and Social Sentiment in-dex to determine if changes in this index can predict intraday stock returns. Thisstudy finds that while the investor sentiment measure is statistically significant it isnot economically significant. As discussed in Renault (2017), utilizing these measuresof investor sentiment are hard to judge given that they are proprietary and such arenot “transparent, or replicable.”
Given their short time horizons (30 minutes for Sun et al. (2016) and Renault(2017) and five minutes for Behrendt and Schmidt (2018)), these studies are unableto create stock specific investor sentiment indexes. It is further likely the estimatedinvestor sentiment measures are biased toward sentiment information on larger andwell known firms. If the theory presented in Baker and Wurgler (2006) and Baker and
11StockTwit is social media platform where by users primarily discuss topics relating to financialmarkets.
8

Wurgler (2007) is correct, the impact of investor sentiment may be under estimated.
The tokenization approach requires an indicator variable for each token. As such,the number of variables can grow large for even a modest number of observationswhich necessitates the need for dimension reduction. Given this, we estimate ourTwitter based investor sentiment utilizing MNIR for two specific reasons. First,MNIR is a dimension reduction method that links token frequencies to class labels.Exploiting this linkage contrasts with principal components analysis, which wouldnot use information in labels but only information contained in the covariance matrixof indicator variables. Second, MNIR uses sparsity-inducing priors in which manycoefficients are set equal to 0. By doing so, the MNIR selects a set of empiricallyrelevant tokens. This proves incredibly beneficial for the bag-of-words approach asresults from MNIR can be used to build dictionaries or validate existing dictionaries.The sparse solution of MNIR contrasts with principal components analysis where fac-tors are estimated as linear of combinations of all tokens. As noted in the literature,interpreting such loadings can be incredibly difficult.
To gauge investor sentiment, we aggregate information from 2.5 million tweetsthat explicitly reference a stock symbol. Each tweet contains character data thatmust be processed into a numeric variable that measures sentiment.
3 Methodology and Data
The goal of any textual analysis is to accurately score a given body of text. The fol-lowing section details the procedures we use to score the individual tweets and createa stock specific investor sentiment index. We specifically create two sets of investorsentiment indexes employing both the tokenization approach of Taddy (2013b) andbag-of-words approach.
3.1 Tokenization Approach
Each tweet contains 140 characters or less. Each tweet can be indexed by date, t,and company, j. On each date, there are i = 1, ..., Njt tweets that discuss companyj. To refer to a specific stock, Twitter users include $ and the stocks ticker symbol.For instance, when discussing Exxon (Ticker symbol: XOM) and Haliburton (Tickersymbol: HAL) an individual will use $HAL in the tweet. A figurative example ofstandard tweet in our sample is provide below.
sold $XOM shares and bought $HAL shares (1)
9

In the following discussion, we abstract from ijt subscripts and instead use n =1, ..., N when referring to any of the N tweets. Each tweet, xn, contains tokens thatdescribe sentiment regarding company j. That is, we can describe xn as a set of Wn
tokens. When the tokens are partitioned by unigrams, xn is written as:
xn = {w1n, w
2n, ..., w
Wnn } (2)
Following the previous example, we have:
xn = {sold, $XOM, shares, and, bought, $HAL, shares} (3)
Similar to the literature, we employ the following procedures to process each tweetand retain only possible token information.12
• Convert all text to lowercase characters.
• Remove all stop words. Stop words are common words that do not directlyindicate sentiment including prepositions, articles, pronouns, etc.13
• Remaining words are stemmed to retain a root form of the word. For example,buying, bought, buy are converted to buy.
• Convert the stock symbol of the reference company to COMPANY and all otherstock symbols in the tweet to OTHERCOMPANY. By doing so, we can properlyassociate the sentiment with the stock.
• Drop all numbers from the tweet.14
Following the above procedure, if the reference company is Haliburton, the exampletweet, would now read:
xn = {sold, OTHERCOMPANY, shares, bought, COMPANY, shares} (4)
From the example tweet, it is clear that the user has a positive outlook on Halibur-ton and a negative outlook on Exxon. The example tweet highlights the importanceof word ordering in determining sentiment from tweets. For instance, if we were toswitch sold and bought it would appear as if the individual is bearish on Exxon andbullish on Haliburton. Using the bag-of-words approach, it is likely that this tweet
12We utilize the MNIR method to first obtain a set of tweets relevant information. Furtherinformation on this method can be provided upon request.
13Because the tweets frequently indicate the direction of the stock (up or down), we modify a listof stop words from the SnowballC package in R to retain finance-specific words.
14In unreported results, we found our quantitative results were not substantially impacted by thisprocedure. However, the list of significant tokens is impacted by this procedure, as expected.
10

would be scored as neutral.
Word order is further important when a negator precedes a word that expresseseither positive or negative sentiment. For example, if a tweet read “Do not SellHaliburton,” partitioning the tweet by unigram would not account for the positivesentiment expressed from “not Sell.”
A simple way to control for ordering is to use two word phrases, bigrams, as thetokens.15 By partitioning the example tweet into bigrams, xn becomes:
xn = {sold.OTHERCOMPANY,OTHERCOMPANY.shares,
shares.bought, bought.COMPANY,COMPANY.shares} (5)
3.2 Multinomial Distribution
We use a collection of k = 1, ..., K unique tokens collected from the N tweets. The Wn
tokens in xn are represented as draws from a multinomial distribution with unknowntoken probabilities. In other words, we draw Wn tokens from K possible tokens, whereeach token is drawn with probability qnk. When using the multinomial distribution,we assume the tokens in xn are exchangeable.
For each token, define the indicator variable zkn = 1 if token k is in the set xnand zkn = 0 otherwise. Associated with these indicator variables is the vector zn, theK×1 vector of these indicator variables. We assume each tweet can be classified intoone of 3 distinct, unordered categories: positive, negative or neutral. Without lossof generality, define the class of each tweet as yn ∈ {1, 2, 3}. In what follows, it willbe useful to keep track of yn by defining the 3× 1 vector vn where the yn element isequal to 1, and all other elements are equal to 0.
This classification scheme is not exhaustive. There exist an innumerable numberof ways to classify each tweet based on various criteria. It should be emphasized that,although the categories appear to have an inherent ordering, the procedure used inthis study does not require such an ordering. Further, we only classify tweets into thepositive and negative categories. Because of this, the neutral category might also bethought of as a neither category.
Conditional on yn and Wn, we assume that xn is drawn from a multinomial dis-tribution. Using notation similar to Taddy (2013b), the vector of token counts, zn, isdistributed as a multinomial random variable zn ∼MN(qn,Wn) where:
15We use the convention where different words in a bigram are separated by “.”
11

qnk =eηnk∑l eηnl
ηnk = αk + vnψk + εnk
(6)
In Equation 6 conditional on yn, qnk indicates the probability that token k will be inxn. αk is a token specific parameter. When token k appears more frequently acrossall classes, αk will be large. ψk is a 3× 1 vector of parameters specific to token k thatindicates the class-specific relative frequency of token k. The product vnψk is the ynelement of ψk; the yth element of ψk will be positive whenever token k appears morefrequently in tweets of class y compared to other classes. The term εij is an i.i.d.error term.
Given the parameters ψk, we can summarize all relevant information in xn usingthe linear combination sTn = W−1
n Ψ′zn where Ψ′ = [ψ1, ..., ψK ]. Taddy (2013b) showsthat this linear combination is a sufficient reduction where by the distribution of yngiven the 3 × 1 vector sTn is independent of the distribution of yn given the entireK × 1 vector zn. For the purposes at hand, sTn can be interpreted as a measure ofsentiment. As such, six investor sentiment indexes are created; positive, neutral, andnegative for both unigrams and bigrams.
In a regression context, sTn can be used as an explanatory variable in a parsimo-nious regression in lieu of using the potentially thousands of regressors in zTn . At itscore, the above procedure is a method to reduce the dimension of the token vectorzn.
As mentioned above, the total number of unique tokens can be quite large. Anymodel with a large number of parameters runs the risk of over-fitting. In our estima-tion, we experimented with various token sets and settled on a modest cutoff usingonly the 3,000 most frequent tokens when estimating the model. In unreported re-sults, the coefficient estimates were robust to token sets as large as 5,000. To preventthis, Taddy (2013b) uses a Laplace prior for the ψk and selects the vector Ψ as thevector which maximizes the posterior likelihood given the priors. Due to Laplace pri-ors being used, the resulting Ψ is sparse with many elements equal to 0. In this sense,the procedure is both variable selection and coefficient estimation. From a predictivestandpoint, only tokens with non-zero coefficients in Ψ are relevant when predictingthe class of the tweet.
3.3 Supervised Learning
To estimate Equation 6, it is necessary to use a training set of tweets labeled as eithernegative, neutral or positive. Taddy (2013b) uses restaurant ratings labeled by mul-tiple users. Taddy (2013a) in measuring political sentiment towards presidential use
12

both emoticons and the Amazon Mechanical Turk service to read and score tweets.16
Labeling tweets that reference stocks is not as straightforward as labeling tweetsthat reference political candidates. Most tweets manifest a clear sentiment. Exam-ples include $XOM looks like a buy and bearish on $XOM. However, due to esotericfinance vocabulary, it is possible that a randomly selected individual will miss sub-tleties associated with payoffs that can lead to an incorrect labeling. Such instancesfrequently occur when discussing options contracts. For example, bought May putsand bought May calls should be classified as negative and positive, respectively, al-though this distinction is not apparent to an individual without an understanding offinance terminology. Taddy (2013a) takes several steps to pre-screen the workers toensure the fidelity of their labeling scheme. However, due to cost considerations, weconcluded that using the Amazon Mechanical Turk service was not viable option.
Instead, we manually label a random sample of 3000 tweets as a training set.Similar to the arbitrary notions expressed in Baker and Wurgler (2006) regarding themeasurement of sentiment, it is possible that our categories and labeling procedureare also arbitrary and subjective. To mitigate such problems, we undertook severalsteps to produce results that were both objective and thorough. First, a minimumobservation period of 30 seconds was required before scoring was allowed to ensure asufficient amount of time was spent analyzing the tweet. Second, a repeated samplingprocedure was performed to ensure consistent labeling by author. Third, some tweetswere scored by each author to mitigate any individual bias. Any tweets that werehad multiple labels by the same individual or across individuals were discarded. Thisresulted in a collection of 2919 labeled tweets or an error rate of approximately 2.7%.An examination of these discarded tweets may indicate human error and not anydiscrepancy in the perceived sentiment of the tweet. The training set is then used toestimate sTijt, the estimated sentiment of the tweet.
Table 1 shows the largest coefficients estimated for the unigram and bigram meth-ods for both positive and negative sentiment. Panel A shows the coefficients of thetokens most related to positive sentiment. For both unigrams and bigrams the tokens,“buy” and “long” are estimated to be highly related with positive sentiment. Surpris-ingly, the tokens “green” and “biotechmoney” are found to have a strong relationshipwith positive sentiment. These are non-finance specific token which may be pickingup positive sentiment towards the biotech and environmental industry. Panel B showsthe estimated coefficients of the tokens for negative sentiment. Unlike the positivesentiment, these tokens are primarily finance words or phrases which correspond tonegative sentiment. Tokens like “short,” “sell,” “downgrades,” and “weak” all seemto indicate negative feelings towards assets.
16See https://www.mturk.com/ for information on the Amazon Mechanical Turk service.
13

Table 2 provides a list of the ten most negative and most positive tweets based onsTijt. The original tweet is shown where the reference stock symbol has been removedand replaced with COMPANY. For many of these tweets, the user is primarily statingtheir position (long or short) with respect to a specific asset.
3.4 Bag-of-Words Approach
While the focus of this study is to develop an investor sentiment index using the tok-enization approach of Taddy (2013b), we utilize the bag-of-words method to create acomparable index. Following the critique of Loughran and McDonald (2016), we cre-ate a Twitter finance dictionary of positive and negative unigrams we believe Twitterusers would use when referring to stocks. This dictionary is built using unigram countsfrom the labeled data from the procedure above. We further divide our dictionaryinto a Positive Word List (PWL) and Negative Word List (NWL). The PWL is a listof words or phrases that might indicate the Twitter user is positive about the stock.The NWL is likewise a list of words or phrases that might indicate negative sentiment.
While the literature has primarily used either the Harvard IV-4 word list or aunmodified Loughran and McDonald (2011) finance, we argue this would be inap-propriate in determining sentiment from Twitter given the relatively small characterlimit and informal language used on social media. Loughran and McDonald (2016)states “The use of slang, emoji, and sarcasm, and the constantly changing vocabularyon social media makes the accurate classification of tone difficult.” With this in mind,a dictionary containing a large number of tokens would likely perform as well as asmaller dictionary. Further utilizing a larger dictionary may lead to overfitting. Assuch we favor a dictionary with fewer tokens. Our Twitter finance dictionary is givenin Table 3, with the list of positive and negative unigrams. These tokens can indicateeither a company fundamentals, trading positions, or technical indicators.
PWL and NWL are shown as mathematical sets below:
PWL = (PWL1, PWL2, ...) = (bought, bullish, breakout, ...) (7)
NWL = (NWL1, NWL2, ...) = (old, bearish, dismal, ...) (8)
Using PWL and NWL, three measures of sentiment are estimated. First, positivesentiment is the total count of positive words in each tweet. Positive sentiment for agiven tweet is written as:
PsBn = #(xn ∩ PWL) (9)
14

Here, #(X) is the number of words in the set X. Second, negative sentiment isthe total count of negative words in each tweet. Third, overall sentiment is estimatedpositive sentiment subtracted by negative sentiment. Negative sentiment for a giventweet is written as:
NsBn = #(xn ∩NWL) (10)
We determine overall sentiment of each tweet by counting the total number ofwords in PWL minus the total number of words in NWL. The sentiment for a giventweet is written as:
sBn = #(xn ∩ PWL)−#(xn ∩NWL) (11)
If there are more positive words than negative words in xn, then sBn > 0 and vice-versa.
Differences and similarities between the bag-of-words approach and the tokeniza-tion approach can be found by comparing sBn and sTn . Each measure of sentiment is alinear combination of the vector zn. However, for the bag-of-words approach, positivetokens are given a weight +1 and negative tokens are given a −1. In the tokenizationapproach, tokens are assigned weights based on the strength of their association withnegative and positive tweets. Of course, it is possible to estimate weights for tokensin the dictionary using Equation 6 or by specifying weights ex-ante. However, we findthat the words in the dictionary are almost always selected when using a much largerset of tokens.
For comparison between bag-of-words and the tokenization approach, we also esti-mate the 5 most negative and positive tweets for sBn , found in Table 4. By comparingTable 2 and Table 4, the tokenization approach anecdotally seems able to more accu-rately determine the correct tone of tweets. For example, the bag-of-words approachseems to mislabels the 2nd most positive tweet as positive. This tweet is more likelydisplaying negative sentiment. The tweet reads:
Nervous abt buying COMPANY... (12)
which implies the investor is unsure the price of that stock will increase.
3.5 Timing and Stock Returns
Currently, the New York Stock Exchange (NYSE) is open for trading business daysbetween 9:30 AM and 4:00 PM EST; in contrast social media users can post content24 hours a day/7 days a week. The focus of our analysis is determining if information
15

from social media can explain variation in abnormal stock returns. If the standard24 hour convention is used to estimate daily sentiment, a portion of tweets wouldbe posted after the market has closed. Thus possibly causing any relationship foundbetween investor sentiment and abnormal returns to spurious. Because of this, isnecessary to be precise when indicating the start and end of a period. We use twobreakpoints in order to split the 24 hour day into three segments. The two breakpointsindicate the opening and closing of the NYSE. The day is then split up into threeperiods defined by:
• Pre-Market: 00:00:00-09:29:59
• Market: 09:30:00-15:59:59
• Post-Market: 14:00:00-23:59:59
We regress abnormal returns on the sentiment calculated within each time seg-ment. That is, we regress abnormal return on pre-market sentiment, market senti-ment and post-market sentiment. We are interested in whether or not sentiment iscorrelated with current abnormal stock returns. Using our three investor sentimentindexes created using the tokenization approach we estimate the following equation:
ARjt = α + γ1Negativejt + γ2Neutraljt + γ3Positivejt + ujt (13)
Following Sprenger et al. (2014b,a), ARjt is the abnormal return of the securitycalculated as the raw return of the stock j at time t minus the return on the S&P 500at time t. Negativeijt, Neutralijt, and Positiveijt represent all of the elements in sTijt.Negativejt is estimated as the average negative sentiment for each stock j at day tcalculated by summing the individual Negativeijt across all i = 1, ..., Njt and dividingby Njt. Neutralijt is estimated as the average neutral sentiment for each stock j atday t calculated by summing the individual Neutralijt across all i = 1, ..., Njt and di-viding by Njt. Positivejt is estimated as the average positive sentiment for each stockj at day t calculated by summing the individual Positivejt across all i = 1, ..., Njt
and dividing by Njt.
Using the investor sentiment index created with the bag-of-words approach, weestimate the following equation:
ARjt = α + β1Dictionaryjt + ujt (14)
As in Equation 13, ARjt is the abnormal return of the security calculated as the rawreturn of the stock j at time t minus the return on the S&P 500 at time t. Dictionaryjtis the estimated average net positive sentiment for each stock j at day t calculatedby summing the individual Dictionaryijt across all i = 1, ..., Njt and dividing by Njt
using the bag-of-words approach.
16

3.6 Data and Descriptive Statistics
The Twitter data was collected using the TwitteR package in R beginning August20, 2012, and ending June 12, 2013. Data was collected daily by searching Twitterfor tweets discussing stocks in the Russell 5000. The search program allowed us tosearch for the 5,000 most recent tweets from the past seven days for any number ofstocks. At the start of the data collection, Twitter allowed for an unlimited numberof searches. However, by mid-2013, Twitter limit the number of downloads, and datacollection was effectively terminated. Over this period, we collected 3,941,149 uniquetweets over 296 days discussing 4,972 unique stocks.
Figure 1 shows the movement of cumulative positive bigram investor sentimentand the S&P 500 index. There seems to be a relationship, albeit a weak one, be-tween the S&P 500 index and cumulative sentiment. From September to November,both the S&P 500 index and cumulative sentiment measure have a downward trend.Starting in mid-November, the S&P 500 index again started to increase and followedthis pattern until May 2013. While cumulative sentiment continues to decline un-til mid-March where it increases until the end of our sample. Even though thesetwo measures do not seem to follow each other during the mid-November to March,there seems to be a relationship. The period between mid-November and March alsosaw a number of external events which likely had a negative impact on the market,specifically the shutdown of the US federal government. Investors may have been lessoptimistic as a result.
Table 5 shows descriptive statistics for the investor sentiment measures, returns,and firm characteristics. The number of total observations is 116,649. This countsfor the total number of sentiment measures for each firm (which were tweeted about)on average for each day. This relates to on average 23 days per firm and 792 tweetsfor each firm. This also corresponds to around 13,314 tweets about firms per day.
The bag-of-words investor sentiment measure, Dictionary, has a mean of 1.9 whichcorresponds to an average positive sentiment during this period. While descriptivestatistics are presented for the all tokenization approach investor sentiment measures,as the literature notes these values are relatively difficult to interpret. We do findthat unigram means are higher in absolute terms than bigram means. Further, thestandard deviations for all bigrams are lower than for unigrams. This may be causedby bigrams providing a more precise and accurate estimate of investor sentiment.
Firm characteristics include Trade Volume, Price, Return, Book Value and MarketValue. The mean daily Return is 0.4 percent with a minimum and maximum -49.6and 49.4 percent.17 Market value is calculated by multiplying total shares by price.
17To limit the effect of outliers, we only include daily Returns in between -50 and 50 percent.
17

Market value is shown in millions. The mean market value is about 15 billion witha standard deviation of 39 billion. As our sample covers approximately 99 percent ofUS issued stocks, the range of market value is relatively large. The smallest firm has amarket value of 18 thousand and the largest 499 billion. In comparison, Book Value isrelatively smaller with mean value of 7 billion and a range from -8 billion to 237 billion.
4 Cross-Sectional Results
Using ordinary least squares (OLS), we estimate Equation 13 for both the unigramand bigram investor sentiment measures. Table 6 and Table 7 show the cross sectionalmarket level results using the estimated sentiment from the tokenization approach.Table 8 shows the OLS results for Equation 14 using sentiment estimated from thebag-of-words approach.
We overall find strong empirical evidence that our estimated investor sentimentindexes are related to abnormal returns. These results are consistent with much ofthe previous literature and provides additional evidence against the efficient markethypothesis in favor of behavioral finance theory.
Table 6 shows the cross sectional results utilizing the unigram sentiment mea-sures. We find that higher Negative, Neutral, and Positive sentiment are in generalrelated to higher abnormal returns. The coefficient for the positive unigram measureis significant for all timings, while the Negative and Neutral sentiment measures aresignificant for all but the Pre-Market timing. The results here are similar to the re-sults found for the bigram sentiment measures, found in Table 7. Both the coefficientsfor the positive and neutral bigram measures are significant for at least three of thetimings. In contrast to the unigram results, the coefficient of the negative bigrammeasure is only significant for Pre-Market and Post-Market timing although only atthe 10% significance level.
In a surprising result, we find the coefficients for negative unigram sentiment sta-tistically significant and positive. This result implies that with an increase in negativesentiment (more negative sentiment) is related to higher abnormal returns. These re-sults are in contrast to the negative bigram results which find that the coefficientestimates are positive and significant at the 10 % level but only for the pre-marketand post-market timing. Given the critiques of unigram estimates as compared tobigram or other n-gram estimates, as described in Section 2, the negative unigrammeasure may not be correctly measuring negative sentiment. Anecdotally, as shownin Table 1, the token “profits” is found to have a large impact on unigram negativesentiment. The inclusion of the token “profits” by itself may not be expressing neg-ative sentiment unless an additional token like “lower” was previously included. In
18

fact, for the bigram estimates, “profits COMPANY” is found to have no impact onestimated negative sentiment.18
Table 8 shows the estimated results utilizing the bag-of-words approach. We findthe estimated coefficient of dictionary sentiment to be positive and significant forall timings except Pre-Market. Specifically, we find the more net positive estimatedsentiment is related to higher abnormal returns.
While all investor sentiment estimates perform relatively well for at the All, Mar-ket, and Post-Market timing, these measures generally perform poorly for Pre-Markettiming. Specifically, we find only the coefficients of the Positive bigram and unigrammeasures are significant at the 1 % level for the Pre-Market timing. As such higherpositive sentiment prior to the opening of the market are related to higher abnormalreturns during that day.
These results are general consistent with the previous literature (Bartov et al.,2018; Ranco et al., 2015; Oliveira et al., 2016; Renault, 2017), which finds that socialmedia based investor sentiment is related to a cross section of stock returns. To thebest of our knowledge, our study is the only once which is able to differentiate theimpact of negative and positive sentiment on returns. Our results, from the bigram in-vestor sentiment estimates, highlight positive sentiment maybe more important thannegative sentiment in determining the cross section of abnormal returns.
4.1 Robustness By Size
Baker and Wurgler (2006, 2007) detail that due to limited information, smaller andless-known stocks are particularly influenced by investor sentiment. The idea is thatany information released about these stocks will cause investors to speculate anddrive abnormal returns. This would imply the relationship between abnormal returnsand investor sentiment should be stronger for smaller firms. To test this, we dividethe sample by decile market capitalization and estimate Equation 13 for both theunigram and bigram investor sentiment measures and Equation 14 for the Dictionarysentiment measure.19 The decile level results for unigram sentiment is found in Tables9 and 10. While the decile level results for bigram sentiment is found in Tables 11and 12. Finally, decile level results for the bag-of-words sentiment are found in Tables13 and 14. For brevity only results from the All timing is shown.
Overall, while we find evidence that investor sentiment is related to abnormal
18Bigram and Unigram coefficient estimates are available upon request.19As a note, due to the change in the daily value of market capitalization, some stocks would be
part of a different decile at different dates.
19

returns for larger firms, we do not find similar evidence for lower deciles. Very fewinvestor sentiment measures are significantly related to abnormal returns for the firstfour deciles. These results does not necessarily provide empirical evidence against thetheory that smaller firms are disproportionally affected by investor sentiment (Bakerand Wurgler, 2006, 2007), as sample sizes are relatively small. Fewer tweets areavailable for smaller firms, so individual tweets have larger weight. A few extremelypositive or negative tweets can determine this relationship. Further, many smallerfirms have zero tweets for a number of days. This results in small sample sizes forthe first four deciles, ranging from around 200 to 3300.
Another interesting result is that the magnitude of all estimated coefficients de-crease as size increases. This implies that abnormal returns for medium sized firmsare more affected by changes in investor sentiment compared to larger firms. It maybe that medium sized firms are large enough that Twitter users are actively tweetingabout those stocks but small enough that the impact of their tweets on speculation isheightened. These results are similar to Seok et al. (2018), who find a similar decreasein coefficients with higher deciles. Smales (2017) does not find this pattern when com-paring small and large cap portfolios. Ni et al. (2015) and Yang and Zhou (2016) findthe impact of investor sentiment is consistent across firm size for the Chinese stockmarket. Clearly, this remains an area where more empirical research is needed.
Similar to the market level results, the negative unigram measure performs bet-ter across all deciles compared to the negative bigram measure. Again, it is likelythat the negative unigram measure is not fully measuring negative sentiment. Thecoefficient for the negative bigram measure is only found to be significant for secondand tenth decile but with different signs. This provides further empirical evidence ofnegative sentiment having limited impact on abnormal returns.
For both the bigram and unigram, positive sentiment performs relatively well,with significant coefficients across most deciles. All significant coefficients estimatesare positive. The dictionary results are relatively inconsistent across deciles. Withpositive and significant coefficients for only the second, fifth, sixth, ninth and tenthdecile. These results are consistent with the market level results. As such we findhigher positive sentiment relating to higher abnormal returns.
5 Forecasting
While we find results similar to the previous literature that investor sentiment is animportant determinant of a cross section of abnormal returns. Another aim of thispaper has been to determine if our investor sentiment measure can produce more ac-curate forecasts of returns. To do this, we employ both in-sample and out-of-sample
20

analysis to determine the marginal gain in forecast accuracy from the inclusion ofinvestor sentiment measures.
The forecasting literature has found investor sentiment useful in forecasting re-turns. Yang et al. (2015) estimate a model with just returns and one lag of sentimentat the daily level and finds the twitter-based investor sentiment measure is able toforecast several market indexes.
In intraday forecasting analysis, Sun et al. (2016) and Renault (2017) estimate amodel with lags of intraday change in sentiment. Sun et al. (2016) determine if thelag of the change investor sentiment can predict the returns from half hour returnsfrom the S&P 500 ETF. Sun et al. (2016) find the change in investor sentiment isable to predict returns up to six hours ahead. Renault (2017) utilizes a model in-cluding the change from the previous day sentiment to the first half hour of investorsentiment and half hour lags for the 11, 12, and 13 half hours in the trading day.Renault (2017) finds that only a few measures are able to predict returns of the S&P500 ETF. For robustness a forecasting model including lag returns is estimated anddoes not improve forecast accuracy over other models.
Jiang et al. (2019) determine if current manager sentiment is able to predict cu-mulative returns from 1, 3, 6, 9, 12, 24, and 26 months ahead. All sentiment measuresperform relatively well with the biggest gain being 9 months ahead. Xu and Zhou(2018) estimate a model with the lag of investor sentiment and current values of FamaFrench 3 factors. Lagged sentiment is able to more accurately forecast the returnsfor a number of size weighted portfolios. Heston and Sinha (2017) use lags of news,positive and negative sentiment to forecast returns. Positive and negative sentimentis able to forecast returns under a number of weekly forecast horizons.
Following the literature (Yang et al., 2015; Sun et al., 2016; Heston and Sinha,2017; Renault, 2017; Jiang et al., 2019), we estimate the following forecasting modelutilizing the unigram and bigram investor sentiment indexes:20
ARj,t+1 = α + γ1Negativej,t + γ2Neutralj,t + γ3Positivej,t + uj,t+1 (15)
Where Negative, Neutral, and Positive are the current value of the estimated investorsentiment indexes. AR represents that the future value of the abnormal return.
For the bag-of-words estimated index we estimate the following forecasting model:21
20Alternative model specifications including additional variables are also estimated. Results arerelatively similar to the results from Equation 15. These are available upon request. Due to datalimitations, we only use a one day forecast horizon.
21We would like to thank the anonymous reviewer for noting non-linear forecasting models, as
21

ARj,t+1 = α + γ1Dictionaryj,t + uj,t+1 (16)
where Dictionary represents the current value of the investor sentiment estimatedthrough the bag-of-words approach and AR represents abnormal returns.
The out-of-sample analysis is a forecasting technique where the sample is splitinto two portions by time. The first portion is used to estimate the parameters. Theestimated parameters are then used to forecast the second portion. The out-of-sampleanalysis allows the researcher to determine how well the model forecasts in the past.To estimate forecast accuracy the ratio of the mean squared forecast errors (MSFE)between a constant only model and estimated Equation 15 or Equation 16 is taken.When the MSFE ratio is less than one, we can say that Equation 15 or Equation 16produces a more accurate forecast.
In contrast, in-sample analysis takes advantage of the full data set to estimatethe relationship over the whole period. A F-test or t-test is used to determine if theadditional investor sentiment measures can provide added predictability.
There has been considerable debate in the literature regarding which method(in-sample or out-of-sample) is superior in determining the relatively forecast abilityof empirical models. In general, this literature has focused on the cases when theresults from in-sample and out-of-sample differ (Inoue and Kilian, 2005; Clark andMcCracken, 2005; Clark, 2004). These theoretical works show conflicting evidence,with Clark and McCracken (2005) and Clark (2004) finding evidence in favor of out-of-sample analysis and Inoue and Kilian (2005) finding evidence in favor of in-sampleanalysis. We only focus on results which match in-sample and out-of-sample.
5.1 Forecasting Results
Tables 15 show the market level in-sample and out-of-sample forecasting results forthe one day ahead forecast. For the in-sample analysis, t-test and F-test are usedto determine added forecast accuracy over a constant only model. For out-of-sampleanalysis, the MSFE ratio is shown. For out-of-sample analysis, a sample split date ofFebruary 3, 2013 is used. This relates to a split sample ratio of around 0.9. Giventhe limited difference in timing only the all sample timing results are shown.
employed in Bekiros et al. (2016), would likely produce larger gains in forecast accuracy comparedto a linear model for both approaches. Including a non-linear forecasting model in our paper doesnot allow for a direct comparison between our tokenization approach and the previous literature sowe do not pursue it here. However, this is an excellent idea for future papers.
22

Overall, we find that twitter-based investor sentiment can improve forecast ac-curacy. We find the models containing the unigram and bigram investor sentimentmeasures are jointly significant using F-tests on the in-sample analysis. The Dic-tionary measure is not significant. In out-of-sample analysis, all three models areable to produce more accurate forecasts compared to a constant only model. Outof all of these models, the bigram investor sentiment produces the largest gain inout-of-sample forecast accuracy of 1.1 percent. Unigram investor sentiment improvesforecast accuracy by 1.0 percent.
For the unigram model, the in-sample t-test shows that all three sentiment mea-sures are individually able to forecast abnormal returns. This contrasts with thebigram model, where only Negative and Neutral sentiment are found to be able toforecast abnormal returns.
The in-sample and out-of-sample results only match for both the unigram andbigram model. This gives some evidence that investor sentiment can predict futureabnormal returns. Given the large volatility of stock returns/abnormal market re-turns, these results do not imply that the unigram and bigram model can producerelatively accurate daily forecasts. It does mean that it can produce more accurateforecasts compared to a model with a constant. Overall, we find evidence that notonly is investor sentiment an important determinant of abnormal returns, it is alsoable to predict abnormal returns.
5.2 Forecasting by Market Capitalization
Continuing with the idea that smaller firms may be asymmetrically effected by in-vestor sentiment provided by Baker and Wurgler (2006), we determine how well ourinvestor sentiment measures can forecast abnormal returns by market capitalizationdeciles. We again use in-sample and out-of-sample analysis and focus on the matchingresults.
Tables 16-19 show the results from the supervised methods, while Tables 20-21shows the results for the bag-of-words method.22 Overall, unlike the market levelresults we are unable to find relative gains in forecast accuracy from models includinginvestor sentiment compared to a constant only model.
The unigram models are found in Tables 16 and 17. Using in-sample analysis,we find that the coefficients on the unigram investor sentiment measures are jointlysignificant for the second, fourth, and seven deciles. Using out-of-sample analysis, we
22Results for the first decile are excluded due to data limitations.
23

find improved forecast accuracy only for the fourth and seventh decile.
The bigram model results, found in Tables 18 and 19, differ in that we do notfind any of the models producing more accurate forecasts, either in-sample or out-of-sample. We find the coefficients on all investor sentiment measures being jointlysignificant for the second, third, and fourth deciles, while in our out-of-sample anal-ysis, we only find an improvement in forecast accuracy of 0.01 percent for the fifthdecile.
The bag-of-words results, found in Tables 20 and 21, show the coefficient of thedictionary measure is significant for third through fifth and tenth deciles, using in-sample testing. The out-of-sample MSFE ratio are below one for only the third, fifth,and tenth decile, showing an increase in forecast accuracy. The out-of-sample gainsin forecast accuracy range from 0.1-0.4%, with the largest gains for the 3rd decile.
The most interesting part of these results are that each investor sentiment measurediffers in which decile it produces significant results and by gains in forecast accu-racy. The gains may seem rather small, but due to this being daily forecasts, theseare substantial over monthly or quarterly horizons. While not being able to producerelatively better results compared to for cross sectional or market level forecastingresults, we find evidence of the bag-of-words approach producing the most accurateforecast for decile abnormal returns compared to other measures.
6 Conclusion
Standard finance theory predicts abnormal returns should not be a function of anyvariable. This result breaks down when investors do not have perfect information andact irrationally. There has been little empirical evidence that these assumptions hold.The behavioral finance has explained mis-pricing of assets through investor sentiment.We overall find evidence of investor sentiment playing a role in determining the crosssection of abnormal stock returns.
We estimate a daily, firm-specific, investor sentiment measure. We improve uponthe bag-of-words method, which gives equal weight to each word, by using supervisedsentiment measures. We find that overall investor sentiment is driving overall crosssection of abnormal returns with both methods. This relationship is strongest for thesmallest, and therefore, least known firms. We take this as being additional evidencefor small firms being particularly vulnerable to investor sentiment.
We also find limited evidence that investor sentiment can produce more accurateforecasts compared to a constant only model. Increases in forecast accuracy for the
24

overall market may be relatively small but over longer time horizons these may besubstantial. Further gains are found depending on the size. With the increased use ofsocial media, more information on the individual feeling of investors will become avail-able. This should allow future researchers to understand the long run implications ofindividual firm investor sentiment. With complete Twitter data, future research cantest the role of each of the sources of investor sentiment (Avery and Chevalier, 1999)on abnormal returns. Specifically, the number of followers or re-tweets may be usefulin determining the effect of expert opinion caused investor sentiment on abnormalreturns. Future research should also look to employ non-linear forecasting modelssuch as employed in Bekiros et al. (2016).
References
Aboody, D., Even-Tov, O., Lehavy, R., and Trueman, B. (2018). Overnight returnsand firm-specific investor sentiment. Journal of Financial and Quantitative Anal-ysis, 53(2):485–505.
Avery, C. and Chevalier, J. (1999). Identifying investor sentiment from price paths:The case of football betting. Journal of Business, 72(4):493–520.
Baker, M. and Wurgler, J. (2006). Investor sentiment and the cross-section of stockreturns. The Journal of Finance, 61(4):1645–1680.
Baker, M. and Wurgler, J. (2007). Investor sentiment in the stock market. Journalof Economic Perspectives, 21(2):129–152.
Baker, M., Wurgler, J., and Yuan, Y. (2012). Global, local, and contagious investorsentiment. Journal of Financial Economics, 104(2):272–287.
Bartov, E., Faurel, L., and Mohanram, P. S. (2018). Can twitter help predict firm-level earnings and stock returns? Accounting Review, 93(3):25–57.
Behrendt, S. and Schmidt, A. (2018). The Twitter myth revisited: Intraday investorsentiment, Twitter activity and individual-level stock return volatility. Journal ofBanking & Finance, 96:355–367.
Bekiros, S., Gupta, R., and Kyei, C. (2016). A non-linear approach for predictingstock returns and volatility with the use of investor sentiment indices. AppliedEconomics, 48(31):2895–2898.
Brown, G. W. and Cliff, M. T. (2004). Investor sentiment and the near-term stockmarket. Journal of Empirical Finance, 11(1):1–27.
25

Bukovina, J. (2016). Social media big data and capital markets – an overview. Journalof Behavioral and Experimental Finance, 11:18–26.
Chen, H., De, P., Hu, Y. J., and Hwang, B.-H. (2014). Wisdom of crowds: The valueof stock opinions transmitted through social media. Review of Financial Studies,27(5):1367–1403.
Chung, S.-L., Hung, C.-H., and Yeh, C.-Y. (2012). When does investor sentimentpredict stock returns? Journal of Empirical Finance, 19(2):217–240.
Clark, T. E. (2004). Can out-of-sample forecast comparisons help prevent overfitting?Journal of Forecasting, 23(2):115–139.
Clark, T. E. and McCracken, M. W. (2005). The power of tests of predictive abilityin the presence of structural breaks. Journal of Econometrics, 124(1):1–31.
Da, Z., Engelberg, J., and Gao, P. (2015). The sum of all FEARS investor sentimentand asset prices. Review of Financial Studies, 28(1):1–32.
Frijns, B., Verschoor, W. F., and Zwinkels, R. C. (2017). Excess stock return co-movements and the role of investor sentiment. Journal of International FinancialMarkets, Institutions and Money, 49:74–87.
Heston, S. L. and Sinha, N. R. (2017). News vs sentiment: Predicting stock returnsfrom news stories. Financial Analysts Journal, 73(3):67–83.
Huang, D., Jiang, F., Tu, J., and Zhou, G. (2015). Investor sentiment aligned: Apowerful predictor of stock returns. The Review of Financial Studies, 28(3):791–837.
Inoue, A. and Kilian, L. (2005). In-sample or out-of-sample tests of predictability:Which one should we use? Econometric Reviews, 23(4):371–402.
Jiang, F., Lee, J., Martin, X., and Zhou, G. (2019). Manager sentiment and stockreturns. Journal of Financial Economics, 132(1):126–149.
Lee, W. Y., Jiang, C. X., and Indro, D. C. (2002). Stock market volatility, ex-cess returns, and the role of investor sentiment. Journal of Banking & Finance,26(12):2277–2299.
Lemmon, M. and Portniaguina, E. (2006). Consumer confidence and asset prices:Some empirical evidence. The Review of Financial Studies, 19(4):1499–1529.
Loughran, T. and McDonald, B. (2011). When is a liability not a liability? Textualanalysis, dictionaries, and 10-ks. The Journal of Finance, 66(1):35–65.
26
Loughran, T. and McDonald, B. (2014). Measuring readability in financial disclosures.The Journal of Finance, 69(4):1643–1671.
Loughran, T. and McDonald, B. (2016). Textual analysis in accounting and finance:A survey. Journal of Accounting Research, 54(4):1187–1230.
Malkiel, B. G. and Fama, E. F. (1970). Efficient capital markets: A review of theoryand empirical work. The Journal of Finance, 25(2):383–417.
Mitra, T. and Gilbert, E. (2014). The language that gets people to give: Phrasesthat predict success on Kickstarter. In Proceedings of the 17th ACM conference onComputer supported cooperative work & social computing, pages 49–61. ACM.
Nardo, M., Petracco-Giudici, M., and Naltsidis, M. (2016). Walking down WallStreet with a tablet: A survey of stock market predictions using the web. Journalof Economic Surveys, 30(2):356–369.
Ni, Z.-X., Wang, D.-Z., and Xue, W.-J. (2015). Investor sentiment and its nonlineareffect on stock returns – new evidence from the Chinese stock market based onpanel quantile regression model. Economic Modelling, 50:266–274.
Oliveira, N., Cortez, P., and Areal, N. (2016). Stock market sentiment lexicon acquisi-tion using microblogging data and statistical measures. Decision Support Systems,85:62–73.
Ranco, G., Aleksovski, D., Caldarelli, G., Grcar, M., and Mozetic, I. (2015). Theeffects of Twitter sentiment on stock price returns. PloS one, 10(9):e0138441.
Renault, T. (2017). Intraday online investor sentiment and return patterns in the USstock market. Journal of Banking & Finance, 84:25–40.
Schmeling, M. (2009). Investor sentiment and stock returns: Some internationalevidence. Journal of Empirical Finance, 16(3):394–408.
Seok, S. I., Cho, H., and Ryu, D. (2018). Firm-specific investor sentiment and dailystock returns. The North American Journal of Economics and Finance.
Shen, J., Yu, J., and Zhao, S. (2017). Investor sentiment and economic forces. Journalof Monetary Economics, 86:1–21.
Smales, L. A. (2017). The importance of fear: Investor sentiment and stock marketreturns. Applied Economics, 49(34):3395–3421.
Sprenger, T. O., Sandner, P. G., Tumasjan, A., and Welpe, I. M. (2014a). Newsor noise? Using Twitter to identify and understand company-specific news flow.Journal of Business Finance & Accounting, 41(7-8):791–830.
27

Sprenger, T. O., Tumasjan, A., Sandner, P. G., and Welpe, I. M. (2014b). Tweetsand trades: The information content of stock microblogs. European FinancialManagement, 20(5):926–957.
Sun, L., Najand, M., and Shen, J. (2016). Stock return predictability and investorsentiment: A high-frequency perspective. Journal of Banking & Finance, 73:147–164.
Taddy, M. (2013a). Measuring political sentiment on Twitter: Factor optimal designfor multinomial inverse regression. Technometrics, 55(4):415–425.
Taddy, M. (2013b). Multinomial inverse regression for text analysis. Journal of theAmerican Statistical Association, 108(503):755–770.
Weisenthal, J. (2011). 50 Cent’s tweets make a staggering $50 million in one day.Business Insider, 10 January.
Xu, H.-C. and Zhou, W.-X. (2018). A weekly sentiment index and the cross-sectionof stock returns. Finance Research Letters, 27:135–139.
Yang, C. and Zhou, L. (2016). Individual stock crowded trades, individual stockinvestor sentiment and excess returns. The North American Journal of Economicsand Finance, 38:39–53.
Yang, S. Y., Mo, S. Y. K., and Liu, A. (2015). Twitter financial community sentimentand its predictive relationship to stock market movement. Quantitative Finance,15(10):1637–1656.
Zhou, G. (2018). Measuring investor sentiment. Annual Review of Financial Eco-nomics, 10:239–259.
28

Figure 1: SP-500 and Cumulative Sentiment Movement
Note: Figure 1 shows the cumulative positive bigram sentiment measure against theSP-500 Returns for 2012-2013.
29

Table 1: Estimated Token Coefficients
Panel A: Positive
Unigram Bigramhighs 1.1 buy COMPANY 1.3buy 1 long COMPANY 1.1long 1 biotechmoney COMPANY 1added 0.9 look OTHERCOMPANY 1positive 0.8 special dividend 1green 0.7 call options 0.9strong 0.7 eye COMPANY 0.9dividend 0.6 look COMPANY 0.9breaking 0.5 looks good 0.9
Panel B:Negative
Unigram Bigramlower 0.7 morning COMPANY 1.4weak 0.7 taking COMPANY 1.4profits 0.8 downgrades COMPANY 1.5seeing 0.7 sell half 1.5bearish 1.3 PRICE puts 1.8short 1.4 short term 1.8downgrades 1.5 sell COMPANY 1.9sell 1.5 short COMPANY 1.9shorted 1.7 drops COMPANY 2
Note: Table 1 shows the largest estimated token coeffi-cients using the tokenization approach. Panel A showsthe largest estimated coefficients of tokens both unigramand bigram predicting positive sentiment. Panel B showsthe largest estimated coefficients of tokens both unigramand bigram predicting negative sentiment. A larger esti-mated coefficient relates to a higher estimated probabilitythe tweet is classified as positive or negative. Estimatesof token coefficients for predicting neutral sentiment arenot shown for brevity.
30

Table 2: Examples of Labeled Positive and Negative Tweets: SupervisedMethod
Panel A: Positive Tweets
1: rt @reddogt3live: nice to see the treasure for trash trade inching higher.still long some COMPANY as it still has upside room. entries and exits matter2: rt @redacre: COMPANY upgraded by mizuho securities from neutral tobuy @chasingthealpha see? #pumpers - COMPANY was a screaming buy at$25 ; below3: bought COMPANY $92.5 jan calls...looks like its about to break4: pr: special dividend declaration alert for COMPANY (expect long).5: bought COMPANY at $3.55 and then again at $2.74. sitting over $9 now.#letitride6: rt @sciencetrader: things i like with good long term charts that are highbut have room to run: $xlb, $itb, $xhb, COMPANY, $vz, $oih, $lmt, $wfm,($amzn needs time)7: bought some COMPANY and $vvus today8: paper bought 5000 COMPANY jan 2014 40 calls for $.889: bought COMPANY jan 2014 95 calls for 1.33 #optionsaction10: @jimcramer hi j, bought COMPANY jan 600 calls in oct. when stock wasat 610. down now, time decay a worry, do i ride to the end?
Panel B: Negative Tweets
1: i am still short COMPANY and $pkx. getting tough to stay short as themajor averages and sector indexes are oversold near term.2: sold some COMPANY march 85 calls for $0.733: sold COMPANY stock at 628.50 for +6.00 – hedge now removed. 20 smatest ; rejection was the trigger.4: good time to reset the portfolio...sold COMPANY and $csco holdings...timeto find the next investments #retirement #dividends5: sold all COMPANY for $1.5k profit. what an amazing move today.6: sold those COMPANY jan calls, +16.66%, ffiv, -5.2%.7: sold COMPANY at $4.87 from $4.80 entry. small gain8: sold my COMPANY mar $5 calls at $1.2 (from $1.4) - no need to be a heroholding thru briefing docs tomorrow9: thinking of shorting COMPANY ... just keeps going down10: sold more COMPANY +60%
Note: Table 2 provides a snapshot of the ten most negative and most positivetweets estimated using the bigram tokenization approach. Note prior to scoring,tweets have been processed using the steps described in Section 3.1.
31

Table 3: Finance Dictionary
Panel A: Positive Dictionary
buy, buying, bought, long, bull, bullish , good, acceptable, excellent, excep-tional, favorable, great, positive, awesome
Panel B: Negative Dictionary
added, sell, selling, sold, short, bear, bearish, bad, atrocious, awful, crummy,dreadful, lousy, poor, rough, sad, unacceptable, blah, bummer, downer, gare,gross, imperfect, inferior, junky, abominable, amiss, crappy, cruddy, dissatis-factory, erroneous, fallacious, faulty, godawful, inadequate, substandard, un-satisfactory, shitty
Note: Table 3 shows positive and negative finance dictionary used in estimatingthe bag-of-words investor sentiment measure.
32

Table 4: Examples of Labeled Positive and Negative Tweets: bag-of-words
Panel A: Positive Tweets
1: @JEFFREYJKEITH no mans land when in doubt buy time. I’m going longcover me . Jan 600/700 bull call spread at 52.5 COMPANY2: Nervous abt buying COMPANY at 545ish then buy deep money long datedcalls. Too expensive? Then buy call spread (lower cost+limit prof)3: Very tempted to buy some COMPANY... havent bought a non-financiallong time. Other than $YNGFF.yuck4: Not 2 long ago, everyone was saying COMPANY was a buy at $550 andchange; goin to $600, then $1,000.00 millions of people bought . They lost.5: Everyone has been saying buy COMPANY and shit, well based on mycharting skills, and bearish look on $GOOG now is time to long COMPANY430.58
Panel B: Negative Tweets
1: sold $tza jul $11 ns contracts for 1.04, basis .84. added to COMPANY julshort $6 puts by selling .65. added to $wlt, sold $cprx2: also added to COMPANY am & sold 1/2 at 6.38 for (avg breakeven) &pondered last 15 mins before selling other 1/2 now at 6.52 for nice gain.3: @tlmontana @mwonder74 i had sold my COMPANY shares & replaces themw/ short puts over $34. i think dips buyable. sell otm puts.4: path as i did with COMPANY .. best way sell to open, sold jan $5 calls for$0.25 ... will keep premium or short it at $5 on opex5: positions. added to $npcuf. holding $exel, exel nov calls, small $ziop &$ttnp. short $osir. sold COMPANY on bounce; will re-enter after nce.
Note: Table 4 shows provides a snapshot of the most negative and most positivetweets based on the bag-of-words method. Note prior to scoring, tweets havebeen processed using the steps described in Section 3.1.
33
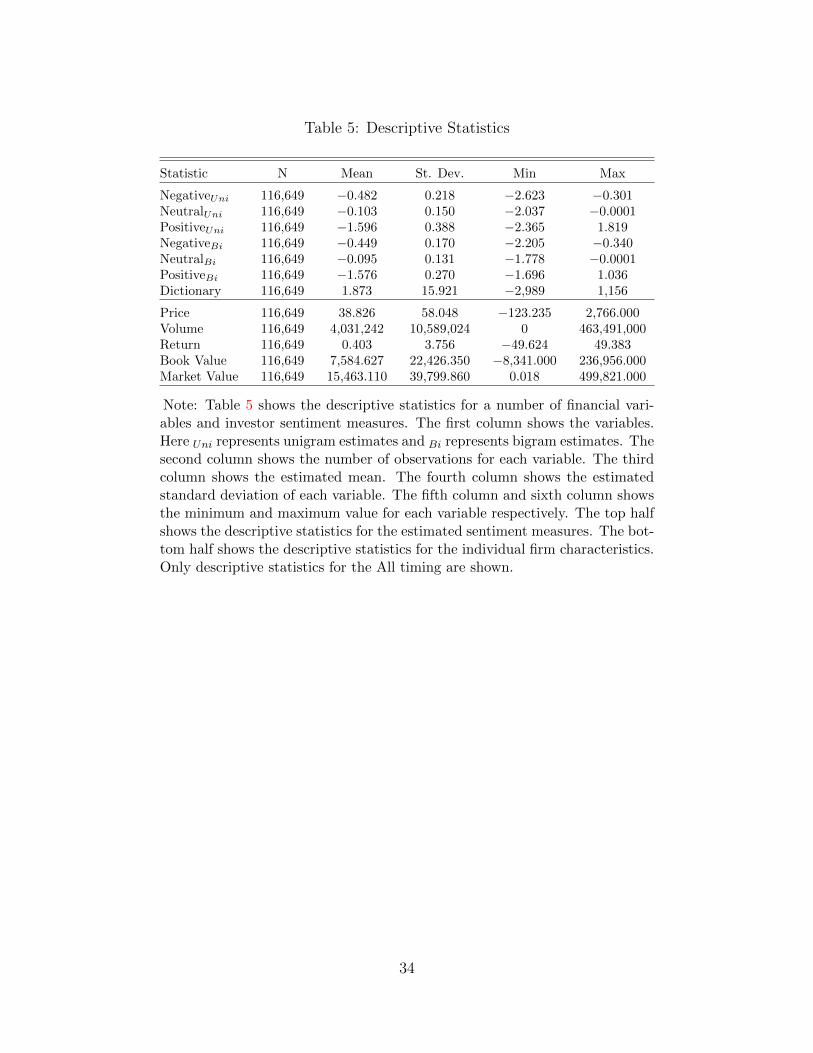
Table 5: Descriptive Statistics
Statistic N Mean St. Dev. Min Max
NegativeUni 116,649 −0.482 0.218 −2.623 −0.301NeutralUni 116,649 −0.103 0.150 −2.037 −0.0001PositiveUni 116,649 −1.596 0.388 −2.365 1.819NegativeBi 116,649 −0.449 0.170 −2.205 −0.340NeutralBi 116,649 −0.095 0.131 −1.778 −0.0001PositiveBi 116,649 −1.576 0.270 −1.696 1.036Dictionary 116,649 1.873 15.921 −2,989 1,156
Price 116,649 38.826 58.048 −123.235 2,766.000Volume 116,649 4,031,242 10,589,024 0 463,491,000Return 116,649 0.403 3.756 −49.624 49.383Book Value 116,649 7,584.627 22,426.350 −8,341.000 236,956.000Market Value 116,649 15,463.110 39,799.860 0.018 499,821.000
Note: Table 5 shows the descriptive statistics for a number of financial vari-ables and investor sentiment measures. The first column shows the variables.Here Uni represents unigram estimates and Bi represents bigram estimates. Thesecond column shows the number of observations for each variable. The thirdcolumn shows the estimated mean. The fourth column shows the estimatedstandard deviation of each variable. The fifth column and sixth column showsthe minimum and maximum value for each variable respectively. The top halfshows the descriptive statistics for the estimated sentiment measures. The bot-tom half shows the descriptive statistics for the individual firm characteristics.Only descriptive statistics for the All timing are shown.
34

Table 6: Cross Sectional Results - Tokenization Approach: UnigramSentiment
Dependent variable: Abnormal Returns
All Pre-Market Market Post-Market
Negative 0.691∗∗∗ 0.191 0.624∗∗∗ 0.822∗∗∗
(0.071) (0.127) (0.108) (0.090)Neutral 0.684∗∗∗ −0.109 0.483∗∗∗ 0.682∗∗∗
(0.079) (0.134) (0.116) (0.105)Positive 0.621∗∗∗ 0.254∗∗∗ 0.546∗∗∗ 0.641∗∗∗
(0.038) (0.067) (0.057) (0.049)
Observations 116,649 34,342 62,740 76,778R2 0.003 0.001 0.002 0.003F Statistic 111.363∗∗∗ 6.526∗∗∗ 36.217∗∗∗ 74.722∗∗∗
Note: Table 6 shows the cross sectional results from unigram estimatedsentiment. Specifically, OLS is used to estimate Equation 13. All,Pre-Market, Market, and Post-Market represent results using the tim-ing conventions described in Section 3.5. Negative represents estimatednegative sentiment using the tokenization approach. Neutral representsestimated neutral sentiment using the tokenization approach. Positiverepresents estimated positive sentiment using the tokenization approach.Estimated coefficient for each are shown. Standard errors are presentedin parenthesis. Constant term is omitted for brevity. *** denotes 1%significance level, ** denotes 5% significance level and * denotes the 10%significance level.
35

Table 7: Cross Sectional Results - Tokenization Approach: BigramSentiment
Dependent variable: Abnormal Returns
All Pre-Market Market Post-Market
Negative 0.120 0.326∗ 0.115 0.168∗
(0.080) (0.168) (0.116) (0.099)Neutral 0.797∗∗∗ −0.215 0.582∗∗∗ 0.794∗∗∗
(0.088) (0.152) (0.127) (0.116)Positive 0.308∗∗∗ 0.326∗∗∗ 0.360∗∗∗ 0.177∗∗∗
(0.048) (0.104) (0.067) (0.064)
Observations 116,649 34,342 62,740 76,778R2 0.001 0.0004 0.001 0.001F Statistic 40.246∗∗∗ 4.036∗∗∗ 15.983∗∗∗ 21.486∗∗∗
Note: Table 7 shows the cross sectional results from bigram estimatedsentiment. Specifically, OLS is used to estimate Equation 13. All,Pre-Market, Market, and Post-Market represent results using the tim-ing conventions described in Section 3.5. Negative represents estimatednegative sentiment using the tokenization approach. Neutral representsestimated neutral sentiment using the tokenization approach. Posi-tive represents estimated positive sentiment using the tokenization ap-proach. Estimated coefficient for each are shown. Standard errors arepresented in parenthesis. Constant term is omitted for brevity. ***denotes 1% significance level, ** denotes 5% significance level and *denotes the 10% significance level.
36

Table 8: Cross Sectional Results - Bag-of-Words Approach
Dependent variable: Abnormal Returns
All Pre-Market Market Post-Market
Dictionary 0.003∗∗∗ 0.001 0.005∗∗∗ 0.006∗∗∗
(0.001) (0.002) (0.002) (0.001)
Observations 116,649 34,342 62,740 76,778R2 0.0002 0.00001 0.0001 0.0003F Statistic 20.224∗∗∗ 0.348 8.979∗∗∗ 19.407∗∗∗
Note: Table 8 shows the cross sectional results from bag-of-wordsapproach. Specifically, OLS is used to estimate Equation 14. All, Pre-Market, Market, and Post-Market represent results using the timingconventions described in Section 3.5. Dictionary represents the es-timated net positive sentiment measure using the bag-of-words ap-proach. Estimated coefficients for Dictionary are shown. Standard er-rors are presented in parenthesis. Constant term is omitted for brevity.*** denotes 1% significance level, ** denotes 5% significance level and* denotes the 10% significance level.
37

Table 9: Cross Sectional Results by Market Capitalization Decile(1-5) - Tokenization Approach: Unigram Sentiment
Dependent variable: Abnormal Returns
Decile (1) (2) (3) (4) (5)
Negative 2.805 −0.008 −0.028 1.129 2.296∗∗∗
(5.922) (2.280) (1.668) (0.820) (0.582)Neutral 5.953 3.595 8.125∗∗∗ 6.352∗∗∗ 1.997∗∗∗
(6.613) (3.197) (2.721) (1.203) (0.640)Positive 3.591 −0.501 1.851∗∗ 1.484∗∗∗ 1.874∗∗∗
(3.336) (1.270) (0.897) (0.451) (0.329)
Observations 222 1,335 1,494 3,241 5,849R2 0.009 0.002 0.009 0.013 0.007F Statistic 0.624 0.906 4.360∗∗∗ 13.937∗∗∗ 14.562∗∗∗
Note: Table 9 shows the cross sectional results by market capitaliza-tion decile (1-5) from unigram estimated sentiment. Specifically, OLSis used to estimate Equation 13. Only the All timing conventions de-scribed in Section 3.5 is shown. Negative represents estimated neg-ative sentiment using the tokenization approach. Neutral representsestimated neutral sentiment using the tokenization approach. Pos-itive represents estimated positive sentiment using the tokenizationapproach. Estimated coefficient for each are shown. Standard errorsare presented in parenthesis. Constant term is omitted for brevity.*** denotes 1% significance level, ** denotes 5% significance leveland * denotes the 10% significance level.
38

Table 10: Cross Sectional Results by Market Capitalization Decile(6-10) - Tokenization Approach: Unigram Sentiment
Dependent variable: Abnormal Returns
Decile (6) (7) (8) (9) (10)
Negative 0.535 0.657∗∗ 0.636∗∗∗ 0.573∗∗∗ 0.444∗∗∗
(0.360) (0.262) (0.181) (0.126) (0.059)Neutral 1.340∗∗∗ 1.171∗∗∗ 0.688∗∗∗ 0.465∗∗∗ 0.235∗∗∗
(0.362) (0.271) (0.196) (0.131) (0.063)Positive 0.502∗∗ 0.737∗∗∗ 0.679∗∗∗ 0.555∗∗∗ 0.452∗∗∗
(0.205) (0.149) (0.106) (0.073) (0.036)
Observations 8,681 12,692 17,917 22,961 42,257R2 0.002 0.003 0.003 0.003 0.004F Statistic 7.061∗∗∗ 13.975∗∗∗ 17.256∗∗∗ 22.447∗∗∗ 57.793∗∗∗
Note: Table 10 shows the cross sectional results by market capitaliza-tion decile (6-10) from unigram estimated sentiment. Specifically, OLSis used to estimate Equation 13. Only the All timing conventions de-scribed in Section 3.5 is shown. Negative represents estimated negativesentiment using the tokenization approach. Neutral represents estimatedneutral sentiment using the tokenization approach. Positive representsestimated positive sentiment using the tokenization approach. Estimatedcoefficient for each are shown. Standard errors are presented in paren-thesis. Constant term is omitted for brevity. *** denotes 1% significancelevel, ** denotes 5% significance level and * denotes the 10% significancelevel.
39

Table 11: Cross Sectional Results by Market CapitalizationDecile (1-5) - Tokenization Approach: Bigram Sentiment
Dependent variable: Abnormal Returns
Decile (1) (2) (3) (4) (5)
Negative 9.135 −4.975∗ −1.338 −1.250 0.434(7.829) (2.755) (1.664) (0.821) (0.612)
Neutral 7.769 5.056 10.305∗∗∗ 7.676∗∗∗ 2.699∗∗∗
(7.202) (3.503) (2.904) (1.345) (0.685)Positive 4.283 −0.978 0.984 0.914∗ 1.312∗∗∗
(3.499) (1.460) (0.846) (0.478) (0.351)
Observations 222 1,335 1,494 3,241 5,849R2 0.014 0.003 0.009 0.011 0.005F Statistic 1.069 1.426 4.512∗∗∗ 11.804∗∗∗ 9.676∗∗∗
Note: Table 11 shows the cross sectional results by market capitaliza-tion decile (1-5) from bigram estimated sentiment. Specifically, OLSis used to estimate Equation 13. Only the All timing conventionsdescribed in Section 3.5 is shown. Negative represents estimated neg-ative sentiment using the tokenization approach. Neutral representsestimated neutral sentiment using the tokenization approach. Pos-itive represents estimated positive sentiment using the tokenizationapproach. Estimated coefficient for each are shown. Standard errorsare presented in parenthesis. Constant term is omitted for brevity.*** denotes 1% significance level, ** denotes 5% significance leveland * denotes the 10% significance level.
40

Table 12: Cross Sectional Results by Market CapitalizationDecile (6-10) - Tokenization Approach: Bigram Sentiment
Dependent variable: Abnormal Returns
Decile (6) (7) (8) (9) (10)
Negative −0.323 −0.049 0.312 0.156 0.152∗∗
(0.367) (0.281) (0.193) (0.137) (0.065)Neutral 1.420∗∗∗ 1.144∗∗∗ 0.743∗∗∗ 0.534∗∗∗ 0.260∗∗∗
(0.402) (0.298) (0.212) (0.148) (0.072)Positive 0.094 0.302∗ 0.353∗∗∗ 0.274∗∗∗ 0.231∗∗∗
(0.217) (0.160) (0.109) (0.076) (0.039)
Observations 8,681 12,692 17,917 22,961 42,257R2 0.001 0.001 0.001 0.001 0.001F Statistic 4.214∗∗∗ 5.983∗∗∗ 8.024∗∗∗ 8.501∗∗∗ 15.553∗∗∗
Note: Table 12 shows the cross sectional results by market capitaliza-tion decile (6-10) from bigram estimated sentiment. Specifically, OLSis used to estimate Equation 13. Only the All timing conventionsdescribed in Section 3.5 is shown. Negative represents estimated neg-ative sentiment using the tokenization approach. Neutral representsestimated neutral sentiment using the tokenization approach. Pos-itive represents estimated positive sentiment using the tokenizationapproach. Estimated coefficient for each are shown. Standard errorsare presented in parenthesis. Constant term is omitted for brevity.*** denotes 1% significance level, ** denotes 5% significance leveland * denotes the 10% significance level.
41

Table 13: Cross Sectional Results by Market CapitalizationDecile (1-5) - Bag-of-Words Approach
Dependent variable: Abnormal Returns
Decile (1) (2) (3) (4) (5)
Dictionary 0.164 0.146∗∗∗ 0.024 0.027 0.046∗∗∗
(0.183) (0.052) (0.048) (0.019) (0.010)
Observations 222 1,335 1,494 3,241 5,849R2 0.004 0.006 0.0002 0.001 0.003F Statistic 0.803 7.774∗∗∗ 0.260 2.050 19.278∗∗∗
Note: Table 13 shows the cross sectional results by market cap-italization decile (1-5) from bag-of-words approach. Specifically,OLS is used to estimate Equation 14. Only the All timing conven-tions described in Section 3.5 is shown. Dictionary represents theestimated net positive sentiment measure using the bag-of-wordsapproach. Estimated coefficients for Dictionary are shown. Stan-dard errors are presented in parenthesis. Constant term is omittedfor brevity. *** denotes 1% significance level, ** denotes 5% sig-nificance level and * denotes the 10% significance level.
42

Table 14: Cross Sectional Results by Market CapitalizationDecile (6-10) - Bag-of-Words Approach
Dependent variable: Abnormal Returns
Decile (6) (7) (8) (9) (10)
Dictionary 0.008∗∗ −0.002 0.0001 0.009∗∗∗ 0.003∗∗∗
(0.004) (0.006) (0.001) (0.002) (0.0005)
Observations 8,681 12,692 17,917 22,961 42,257R2 0.001 0.00001 0.00000 0.001 0.001F Statistic 4.358∗∗ 0.158 0.003 27.601∗∗∗ 57.497∗∗∗
Note: Table 14 shows the cross sectional results by market capital-ization decile (6-10) from bag-of-words approach. Specifically, OLSis used to estimate Equation 14. Only the All timing conventions de-scribed in Section 3.5 is shown. Dictionary represents the estimatednet positive sentiment measure using the bag-of-words approach. Es-timated coefficients for Dictionary are shown. Standard errors arepresented in parenthesis. Constant term is omitted for brevity. ***denotes 1% significance level, ** denotes 5% significance level and *denotes the 10% significance level.
43
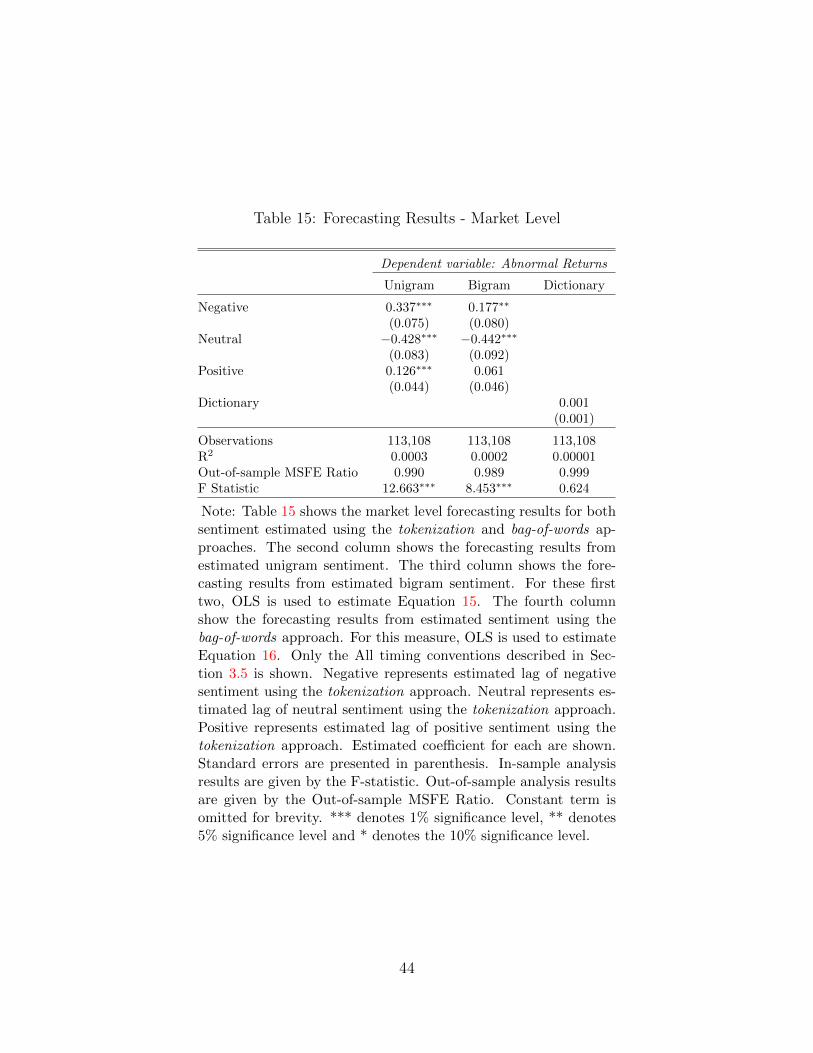
Table 15: Forecasting Results - Market Level
Dependent variable: Abnormal Returns
Unigram Bigram Dictionary
Negative 0.337∗∗∗ 0.177∗∗
(0.075) (0.080)Neutral −0.428∗∗∗ −0.442∗∗∗
(0.083) (0.092)Positive 0.126∗∗∗ 0.061
(0.044) (0.046)Dictionary 0.001
(0.001)
Observations 113,108 113,108 113,108R2 0.0003 0.0002 0.00001Out-of-sample MSFE Ratio 0.990 0.989 0.999F Statistic 12.663∗∗∗ 8.453∗∗∗ 0.624
Note: Table 15 shows the market level forecasting results for bothsentiment estimated using the tokenization and bag-of-words ap-proaches. The second column shows the forecasting results fromestimated unigram sentiment. The third column shows the fore-casting results from estimated bigram sentiment. For these firsttwo, OLS is used to estimate Equation 15. The fourth columnshow the forecasting results from estimated sentiment using thebag-of-words approach. For this measure, OLS is used to estimateEquation 16. Only the All timing conventions described in Sec-tion 3.5 is shown. Negative represents estimated lag of negativesentiment using the tokenization approach. Neutral represents es-timated lag of neutral sentiment using the tokenization approach.Positive represents estimated lag of positive sentiment using thetokenization approach. Estimated coefficient for each are shown.Standard errors are presented in parenthesis. In-sample analysisresults are given by the F-statistic. Out-of-sample analysis resultsare given by the Out-of-sample MSFE Ratio. Constant term isomitted for brevity. *** denotes 1% significance level, ** denotes5% significance level and * denotes the 10% significance level.
44

Table 16: Forecasting by Market Capitalization Decile (2-5) - Tokeniza-tion Approach: Unigram Sentiment
Dependent variable: Abnormal Returns
Decile (2) (3) (4) (5)
Negative 5.190∗∗ 2.377 1.840∗∗ 0.626(2.33) (1.775) (0.824) (0.602)
Neutral −8.538∗∗ 0.31 −4.302∗∗∗ −1.338∗
(4.209) (3.359) (1.469) (0.702)Positive 2.386∗ 2.235∗∗ 0.323 0.081
(1.275) (0.942) (0.449) (0.342)
Observations 1,246 1,362 3,074 5,521R2 0.006 0.004 0.003 0.001Out-of-sample MSFE Ratio 1.006 1.003 0.999 1.000F Statistic 2.512∗ 1.975 3.345∗∗ 1.276
Note: Table 16 shows the forecasting results by market capitalization decile(2-5) from unigram estimated sentiment. Note the first decile results arenot shown due to data limitations. Here OLS is used to estimate Equation15. Only the All timing conventions described in Section 3.5 is shown. Neg-ative represents estimated lag of negative sentiment using the tokenizationapproach. Neutral represents estimated lag of neutral sentiment using the to-kenization approach. Positive represents estimated lag of positive sentimentusing the tokenization approach. Estimated coefficient for each are shown.Standard errors are presented in parenthesis. In-sample analysis results aregiven by the F-statistic. Out-of-sample analysis results are given by the Out-of-sample MSFE Ratio. Constant term is omitted for brevity. *** denotes1% significance level, ** denotes 5% significance level and * denotes the 10%significance level.
45

Table 17: Forecasting by Market Capitalization Decile (6-10) - TokenizationApproach: Unigram Sentiment
Dependent variable: Abnormal Returns
Decile (6) (7) (8) (9) (10)
Negative 0.793∗∗ 0.226 0.305∗ 0.137 0.032(0.366) (0.27) (0.183) (0.129) (0.061)
Neutral −0.084 −0.572∗ −0.512∗∗ −0.231∗ −0.137∗∗
(0.386) (0.294) (0.208) (0.14) (0.068)Positive 0.315 0.197 0.034 0.052 0.04
(0.21) (0.154) (0.108) (0.075) (0.037)
Observations 8,259 12,083 17,304 22,084 40,942R2 0.001 0.001 0.0004 0.0002 0.0002Out-of-sample MSFE Ratio 1.002 0.999 1.000 1.000 1.000F Statistic 1.634 2.181∗ 2.433∗ 1.106 2.339∗
Note: Table 17 shows the forecasting results by market capitalization decile (6-10)from unigram estimated sentiment. Here OLS is used to estimate Equation 15.Only the All timing conventions described in Section 3.5 is shown. Negative rep-resents estimated lag of negative sentiment using the tokenization approach. Neu-tral represents estimated lag of neutral sentiment using the tokenization approach.Positive represents estimated lag of positive sentiment using the tokenization ap-proach. Estimated coefficient for each are shown. Standard errors are presented inparenthesis. In-sample analysis results are given by the F-statistic. Out-of-sampleanalysis results are given by the Out-of-sample MSFE Ratio. Constant term isomitted for brevity. *** denotes 1% significance level, ** denotes 5% significancelevel and * denotes the 10% significance level.
46

Table 18: Forecasting by Market Capitalization Decile (2-5) - To-kenization Approach: Bigram Sentiment
Dependent variable: Abnormal Returns
Decile (2) (3) (4) (5)
Negative 6.405∗∗ 0.974 0.381 0.252(2.736) (1.805) (0.826) (0.633)
Neutral −8.359∗ 1.047 −4.328∗∗∗ −1.073(4.345) (3.449) (1.537) (0.750)
Positive 1.995 2.182∗∗ 0.075 −0.109(1.426) (0.905) (0.471) (0.364)
Observations 1,246 1,362 3,074 5,521R2 0.006 0.005 0.003 0.0004Out-of-sample MSFE Ratio 1.006 1.013 1.012 0.999F Statistic 2.364∗ 2.164∗ 2.984∗∗ 0.707
Note: Table 18 shows the forecasting results by market capitalizationdecile (2-5) from bigram estimated sentiment. Note the first decileresults are not shown due to data limitations. Here OLS is used toestimate Equation 15. Only the All timing conventions described inSection 3.5 is shown. Negative represents estimated lag of negative sen-timent using the tokenization approach. Neutral represents estimatedlag of neutral sentiment using the tokenization approach. Positive rep-resents estimated lag of positive sentiment using the tokenization ap-proach. Estimated coefficient for each are shown. Standard errors arepresented in parenthesis. In-sample analysis results are given by the F-statistic. Out-of-sample analysis results are given by the Out-of-sampleMSFE Ratio. Constant term is omitted for brevity. *** denotes 1%significance level, ** denotes 5% significance level and * denotes the10% significance level.
47

Table 19: Forecasting by Market Capitalization Decile (6-10) - TokenizationApproach: Bigram Sentiment
Dependent variable: Abnormal Returns
Decile (6) (7) (8) (9) (10)
Negative −0.172 0.064 0.237 0.093 0.061(0.372) (0.29) (0.195) (0.139) (0.066)
Neutral −0.146 −0.537∗ −0.519∗∗ −0.282∗ −0.114(0.43) (0.319) (0.223) (0.156) (0.078)
Positive −0.057 0.072 −0.015 −0.0002 0.034(0.222) (0.165) (0.111) (0.077) (0.040)
Observations 8,259 12,083 17,304 22,084 40,942R2 0.0001 0.0003 0.0003 0.0001 0.0001Out-of-sample MSFE Ratio 1.002 1.000 1.000 1.000 1.000F Statistic 0.167 1.202 1.938 1.098 0.979
Note: Table 19 shows the forecasting results by market capitalization decile(6-10) from bigram estimated sentiment. Here OLS is used to estimate Equa-tion 15. Only the All timing conventions described in Section 3.5 is shown.Negative represents estimated lag of negative sentiment using the tokenizationapproach. Neutral represents estimated lag of neutral sentiment using the tok-enization approach. Positive represents estimated lag of positive sentiment usingthe tokenization approach. Estimated coefficient for each are shown. Standarderrors are presented in parenthesis. In-sample analysis results are given by theF-statistic. Out-of-sample analysis results are given by the Out-of-sample MSFERatio. Constant term is omitted for brevity. *** denotes 1% significance level,** denotes 5% significance level and * denotes the 10% significance level.
48

Table 20: Forecasting Results by Market Capitalization Decile (2-5) -Bag-of-Words Approach
Dependent variable: Abnormal Returns
Decile (2) (3) (4) (5)
Dictionary −0.030 0.105∗∗ 0.042∗∗ −0.028∗∗∗
(0.051) (0.048) (0.018) (0.010)
Observations 1,246 1,362 3,074 5,521R2 0.0003 0.004 0.002 0.001Out-of-sample MSFE Ratio 1.002 0.996 1.002 0.999F Statistic 0.355 4.834∗∗ 5.295∗∗ 7.430∗∗∗
Note: Table 20 shows the forecasting results by market capitalization decile(2-5) from the bag-of-words approach. Note results from the first decile areomitted due to data limitations. Here OLS is used to estimate Equation16. Only the All timing conventions described in Section 3.5 is shown.Dictionary represents the estimated lag of net positive sentiment measureusing the bag-of-words approach. Estimated coefficient for Dictionary areshown. Standard errors are presented in parenthesis. In-sample analysisresults are given by the F-statistic. Out-of-sample analysis results are givenby the Out-of-sample MSFE Ratio. Constant term is omitted for brevity.*** denotes 1% significance level, ** denotes 5% significance level and *denotes the 10% significance level.
49

Table 21: Forecasting Results by Market Capitalization Decile (6-10) - Bag-of-Words Approach
Dependent variable: Abnormal Returns
Decile (6) (7) (8) (9) (10)
Dictionary 0.005 −0.002 0.001 0.001 0.001∗∗
(0.004) (0.006) (0.001) (0.002) (0.0005)
Observations 8,259 12,083 17,304 22,084 40,942R2 0.0002 0.00001 0.00003 0.00003 0.0002Out-of-sample MSFE Ratio 1.000 1.000 1.0190 1.000 0.999F Statistic 1.436 0.136 0.564 0.640 6.256∗∗
Note: Table 21 shows the forecasting results by market capitalization decile (6-10)from the bag-of-words approach. Here OLS is used to estimate Equation 16. Onlythe All timing conventions described in Section 3.5 is shown. Dictionary representsthe estimated lag of net positive sentiment measure using the bag-of-words approach.Estimated coefficient for Dictionary are shown. Standard errors are presented inparenthesis. In-sample analysis results are given by the F-statistic. Out-of-sampleanalysis results are given by the Out-of-sample MSFE Ratio. Constant term is omit-ted for brevity. *** denotes 1% significance level, ** denotes 5% significance leveland * denotes the 10% significance level.
50