stockfetcher · chande momentum oscillator (cmo) ... stockfetcher is a web-based stock screening...
TRANSCRIPT

TECHNICAL STOCK SCREENING
AND ANALYSIS USING
STOCKFETCHER
User Guide and Reference Manual
(Release 2.0)

StockFetcher Usage Guide
ii
Table of Contents
Page PREFACE ........................................................................................................VI
What’s Inside ................................................................................................................ vii Document Conventions................................................................................................. vii Comments and Suggestions ......................................................................................... viii
CHAPTER 1. SCREENING ON STOCKFETCHER ............................................... 1 Description through Implementation .............................................................................. 2 Convenience vs. Control ................................................................................................. 2 Verify Syntax .................................................................................................................. 3 Trading Stocks ................................................................................................................ 3 Basic Elements of a StockFetcher Screen....................................................................... 3 Building Your First Screen ............................................................................................. 4
CHAPTER 2. ACTIONS ..................................................................................... 7 Above / Below / Between ............................................................................................... 8 Approaching from above/below ................................................................................... 12 Converging/Diverging .................................................................................................. 13 Crossed Above/Below .................................................................................................. 14 Dropped/Gained............................................................................................................ 18 Increasing/Decreasing for the last…............................................................................. 20 Near............................................................................................................................... 21 Record Highs and Lows................................................................................................ 22 Slope of ......................................................................................................................... 25 Touching ....................................................................................................................... 28
CHAPTER 3. INDICATORS AND MEASURES................................................... 29 Absolute Price Oscillator (APO) .................................................................................. 30 Absolute Volume Oscillator (AVO) ............................................................................. 31 Acceleration Bands ....................................................................................................... 32 Aroon Up/Down/Oscillator........................................................................................... 33 Average True Range ..................................................................................................... 35 Average Volume ........................................................................................................... 36 Bollinger Bands (upper, lower, median)....................................................................... 37 Bollinger Oscillator....................................................................................................... 38 Bollinger %B ................................................................................................................ 39 Bollinger Width ............................................................................................................ 40 Center of Gravity .......................................................................................................... 41 Chaikin’s Money Flow ................................................................................................. 42 Chaikin's Volatility ....................................................................................................... 43 Chande Momentum Oscillator (CMO) ......................................................................... 44 Chandelier Exit ............................................................................................................. 45 Close-to-open Gap ........................................................................................................ 46

Contents
iii
Commodity Channel Index (CCI)................................................................................. 47 Comparative Relative Strength ..................................................................................... 48 Day Change / Absolute Day Change ............................................................................ 49 Day Position.................................................................................................................. 50 Day Range / Average Day Range / Day Point Range................................................... 51 Detrended Price Oscillator (DPO) ................................................................................ 52 Directional Movement Indicators +DI, -DI, ADX........................................................ 53 Donchian Channels (Upper/Lower/Middle) ................................................................. 54 ERSI.............................................................................................................................. 55 Ease of Movement (EMV)............................................................................................ 56 Ergodic Candlestick Oscillator (ECO).......................................................................... 57 Fibonacci Retracement Lines........................................................................................ 58 Force Index ................................................................................................................... 60 Inertia ............................................................................................................................ 61 Intraday Intensity .......................................................................................................... 62 Intraday Momentum Index (IMI).................................................................................. 63 Inverse Fisher Transform (IFT) .................................................................................... 64 Historical Volatility ...................................................................................................... 65 KST............................................................................................................................... 66 Keltner Channels........................................................................................................... 67 Linear Regression Channels ......................................................................................... 68 Linear Regression Indicator.......................................................................................... 69 Linear Regression Slope ............................................................................................... 70 MACD (Moving Average Convergence Divergence) .................................................. 71 MACD (Volume Weighted) ......................................................................................... 72 Mass Index .................................................................................................................... 73 Momentum.................................................................................................................... 74 Money Flow Index........................................................................................................ 75 Moving Average (Displaced)........................................................................................ 76 Moving Average (Exponential) .................................................................................... 77 Moving Average (Simple) ............................................................................................ 78 Moving Average (Volume Weighted) .......................................................................... 79 Moving Average Envelopes.......................................................................................... 80 Negative Volume Index (NVI) ..................................................................................... 81 Positive Volume Index (PVI)........................................................................................ 82 On Balance Volume(OBV)........................................................................................... 83 Open, High, Low, Close ............................................................................................... 84 Optionable..................................................................................................................... 85 P/E Ratio ....................................................................................................................... 86 Parabolic SAR............................................................................................................... 87 Percent Price Oscillator (PPO)...................................................................................... 88 Percent Volume Oscillator (PPO)................................................................................. 89 Pivot Points ................................................................................................................... 90 Price and Volume Trend (PVT).................................................................................... 91 Projection Bands (Upper/Lower) .................................................................................. 92 Projection Oscillator ..................................................................................................... 93

StockFetcher Usage Guide
iv
QStick ........................................................................................................................... 94 Relative Strength Indicator (RSI) ................................................................................. 95 Relative Volatility Index (RVI) .................................................................................... 96 Smoothed Rate of Change ............................................................................................ 97 Standard Deviation........................................................................................................ 98 StochRSI ....................................................................................................................... 99 Stochastic Momentum Index (SMI)............................................................................ 100 Stochastics, Double..................................................................................................... 101 Stochastics, Fast/Slow/Full ......................................................................................... 102 T3 Moving Average (T3)............................................................................................ 104 TD Range Expansion Index (TDREI)......................................................................... 105 TRIX Oscillator .......................................................................................................... 106 True Strength Index (TSI)........................................................................................... 107 Ultimate Oscillator...................................................................................................... 108 Volume........................................................................................................................ 109 Volume Rate of Change.............................................................................................. 110 Williams %R............................................................................................................... 111
CHAPTER 4. PRICE PATTERNS ................................................................... 112 Candlestick Patterns.................................................................................................... 113 Cup and Handle........................................................................................................... 115 Double-Bottom ........................................................................................................... 116 Double-Top ................................................................................................................. 118 Triangles (Ascending/Descending/Symmetric/Diverging)......................................... 119
CHAPTER 5. MODIFYING MEASURES.......................................................... 122 Absolute Value(ABS) ................................................................................................. 123 Count........................................................................................................................... 124 Custom Moving Average (CMA) ............................................................................... 126 Custom Exponential Moving Average (CEMA) ........................................................ 127 Days (Weeks/Months) Ago......................................................................................... 128 Logarithm (LOG)........................................................................................................ 131 Maximum(MAX)........................................................................................................ 132 Minimum(MIN) .......................................................................................................... 133 Sign ............................................................................................................................. 134 Single Symbol Indicator Comparison(IND) ............................................................... 135 Sum ............................................................................................................................. 136 Plus/Minus/Multiply/Divide ....................................................................................... 137 User-Defined Variables set{…} .................................................................................. 138 Weekly ........................................................................................................................ 140
CHAPTER 6. CHART CUSTOMIZATION ....................................................... 141 Chart-Display.............................................................................................................. 142 Chart-Scale.................................................................................................................. 143 Chart-Size ................................................................................................................... 144 Chart-Time.................................................................................................................. 145 Chart-type ................................................................................................................... 146 Comparison Chart ....................................................................................................... 148 Draw............................................................................................................................ 149

Contents
v
Draw On...................................................................................................................... 151 Primary-plot-size......................................................................................................... 152
CHAPTER 7. ENHANCING FILTER RESULTS ............................................... 153 Add Column................................................................................................................ 154 Apply to Watch List.................................................................................................... 156 Date Offset .................................................................................................................. 157 Sort Column................................................................................................................ 158
APPENDIX A – REFERENCE ........................................................................ 159 APPENDIX B – EXERCISE SOLUTIONS ........................................................ 161 APPENDIX C - INDEX................................................................................... 164

StockFetcher Usage Guide
vi
Preface StockFetcher is a web-based stock screening product developed by Vestyl Software, L.L.C. Using powerful underlying stock screening technology, StockFetcher provides straightforward methods for creating effective stock screens. This book has been assembled to serve as a usage guide and reference manual to help create stock screens using StockFetcher’s text-based screening language. As StockFetcher is a web-based product, the actual presentation and navigation of the product is constantly being refined and remodeled to provide the most effective and useful interface. That said, this book is not intended to serve as a “site usage guide”, but more as a technical reference demonstrating how to get the most out of the StockFetcher technology.

Preface
vii
What’s Inside This book is designed to serve as a technology usage guide for building effective stock screens. We have broken the technology down to what we feel are the most effective logical groupings. Chapter 1: Introduction to Screening on StockFetcher. This introduction outlines the motivation behind StockFetcher and describes the fundamental steps for building and testing your own screens on StockFetcher. Chapter 2: Stock Screen Building Blocks. Before enumerating all of the measures, indicators and patterns available, this section describes the basic verbs or actions that may be used to construct stock screens. Understanding the building blocks is key to creating screens that do what you want. Chapter 3: Indicators and Measures. This chapter provides important usage, description and examples for all of the indicators and measures found on StockFetcher. Chapter 4: Predefined Price Patterns. Usage and examples for classic price-based patterns such as double-bottom, cup and handle are provided in this chapter. Chapter 5: Modifying Measures. Not only is there a wide array of measures and indicators available on StockFetcher, there are also several ways to customize these results. The phrases for modifications are described here, including reference to values from past days as well as basic mathematical operations. The phrases for modifications such as referring to values from past days as well as basic mathematical operations are described here. Chapter 6: Chart Customization. Once the stock screen has been created, the analysis continues. A major component of this analysis involves chart interpretation. This chapter provides how-to’s on creating more effective charts on StockFetcher. Chapter 7: Enhancing Filter Results. In addition to customizing charts, the actual data returned by a filter may be modified. Here you can learn about adding columns as well as taking advantage of back-testing on StockFetcher. Document Conventions To help differentiate descriptions from examples, a few formatting conventions are used in this book. Most important of these conventions is the format used for stock screen examples. All of the specific filter examples are found inside indented boxes, such as:
Show stocks where the close is between 10 and 50 and average volume(10) is above 50000
Text such as the above can be entered directly into the stock filter text-boxes found on StockFetcher. Additionally, any text using the Courier font, but not inside the outlined box indicates usage or syntax lines. These sections represent a word or phrase that may be used as part of a filter. For

StockFetcher Usage Guide
viii
example, moving average(10) is a sample measure that may be used as a component within a stock filter. Finally, italics inside a shaded text box are used to provide author notes as well as any asides that might provide additional tips or hints for a particular section. For example:
A StockFetcher membership makes a great gift that keeps on giving! Additionally, we have provided illustrations and exercises to enhance the content in this book. Comments and Suggestions Just as the technical support staff at StockFetcher enjoys comments, suggestions and bug reports, please let us know if you find any errors or have any suggestions in this book. You can contact us via email at: [email protected] We will do our best to update this book with the latest additions, fixes and features available on StockFetcher!

1
Chapter 1. Screening on StockFetcher StockFetcher’s number one goal is finding the stocks with the attributes you are interested in. Through a series of four simple steps, you’ll be on your way to finding exactly the stocks you are looking for.
1. Define your approach. 2. Identify each “piece” of your approach. 3. Build the screen one piece at a time. 4. Verify the results and charts.
StockFetcher is loaded with technical indicators and measures, and more are added each month. Viewing each of these measures through a chart definitely has merit and is possible with StockFetcher; however, the true power of StockFetcher is realized when combining these measures with simple phrases to create effective stock screens. The focus of this usage guide is to provide details, examples, and justification for the different phrases available for constructing screening approaches. The actual examples may or may not have technical analysis merit and certainly do not delve into all of the available measures. But, the examples in this book are intended provide descriptions and models for building stock screening approaches on StockFetcher. As indicated, this guide is intended to serve as an aid in learning the StockFetcher screening syntax; however, some aspects are less related to screening syntax than they are to site customization. These include chart preferences that may have little to do with technical stock screening, but instead will determine the size of a chart, how much time is covered in a plot or how the actual price values are drawn. Ultimately, all of this information is useful in fully tailoring the StockFetcher environment to provide the easiest and most effective stock screening service available.
StockFetcher Usage Guide
2
Description through Implementation The StockFetcher team has worked hard to provide straightforward and logical building blocks for designing stock screens. With StockFetcher, the basic tools are expressed as English phrases. These basic phrases can be used in screening for nearly any conceivable pattern or action. Assembling these phrases has proved to be a great medium for progressing from the description of a well-known pattern or documented theoretical approach, to designing a functional and automatic stock screen to discover the matches! At first glance, employing a small dictionary of simple phrases to create complex screens may seem like pounding steel nails with a cartoon hammer. It may look good on paper, but could not possibly work, right? Wrong, don’t be fooled by the simple, sentence-based approach. By no means is the StockFetcher syntax lacking in the power and flexibility touted by other screening packages. In fact, with over 60 customizable technical indicators and screen phrases, almost any screen is possible.
Note: If you can’t find or build the stock screen you’re looking for, send us feedback at [email protected] and we’ll do our best to help out!
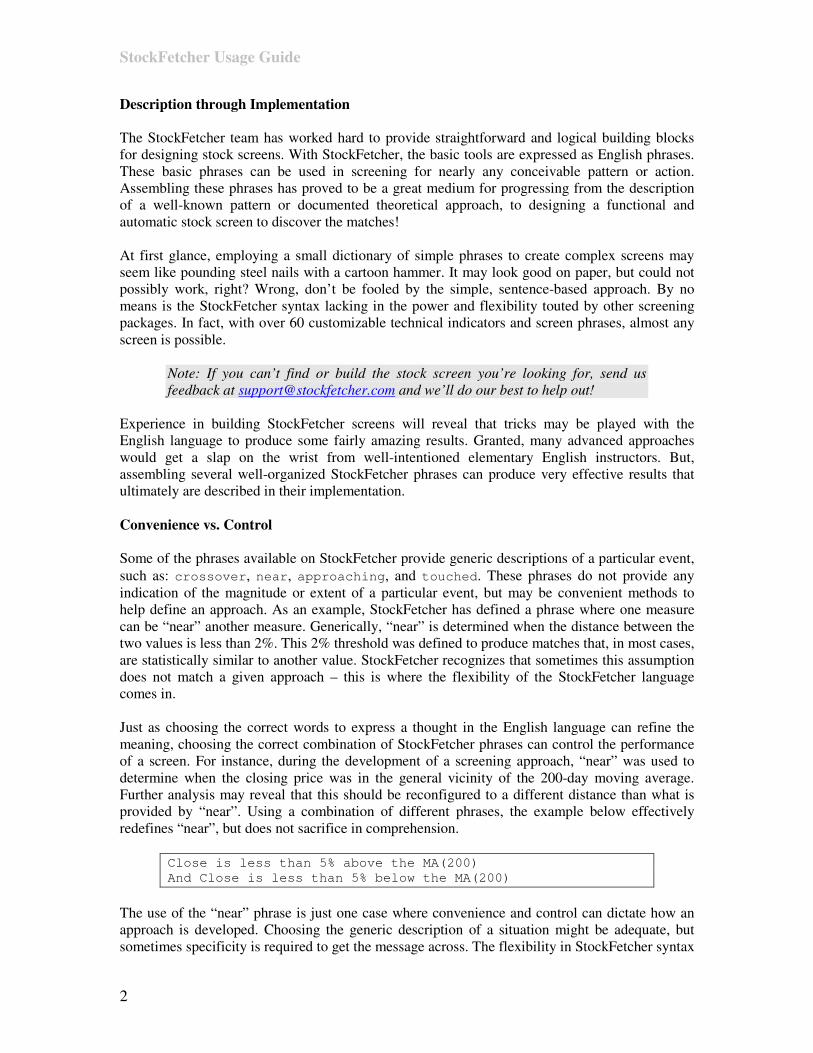
Experience in building StockFetcher screens will reveal that tricks may be played with the English language to produce some fairly amazing results. Granted, many advanced approaches would get a slap on the wrist from well-intentioned elementary English instructors. But, assembling several well-organized StockFetcher phrases can produce very effective results that ultimately are described in their implementation. Convenience vs. Control Some of the phrases available on StockFetcher provide generic descriptions of a particular event, such as: crossover, near, approaching, and touched. These phrases do not provide any indication of the magnitude or extent of a particular event, but may be convenient methods to help define an approach. As an example, StockFetcher has defined a phrase where one measure can be “near” another measure. Generically, “near” is determined when the distance between the two values is less than 2%. This 2% threshold was defined to produce matches that, in most cases, are statistically similar to another value. StockFetcher recognizes that sometimes this assumption does not match a given approach – this is where the flexibility of the StockFetcher language comes in. Just as choosing the correct words to express a thought in the English language can refine the meaning, choosing the correct combination of StockFetcher phrases can control the performance of a screen. For instance, during the development of a screening approach, “near” was used to determine when the closing price was in the general vicinity of the 200-day moving average. Further analysis may reveal that this should be reconfigured to a different distance than what is provided by “near”. Using a combination of different phrases, the example below effectively redefines “near”, but does not sacrifice in comprehension.
Close is less than 5% above the MA(200) And Close is less than 5% below the MA(200)
The use of the “near” phrase is just one case where convenience and control can dictate how an approach is developed. Choosing the generic description of a situation might be adequate, but sometimes specificity is required to get the message across. The flexibility in StockFetcher syntax
Chapter 1. Screening on StockFetcher
3
means that nearly any given approach has several wordings that may produce similar if not identical results. Verify Syntax StockFetcher’s screening in some respects is very similar to a search engine. A search engine will return what it believes are the best matches for the phrase you entered. If the phrase doesn’t make sense to the search engine, the results may not resemble the intent of the query. The same applies to StockFetcher -- if StockFetcher doesn’t understand the input phrase, then the results may not be exactly what you are looking for. For this reason, it is important to understand not only how to assemble a stock screen, but how to test and verify each component. StockFetcher won’t show errors in your syntax, therefore creating well-formed filters and building the filter in stages is important. As a rule of thumb on StockFetcher, start simple and verify each stage of your filter. Trading Stocks Trading stocks always involves risk. Results from any stock screen, no matter how advanced or historically valid, should only be used as a small piece of the trading decision. Fundamental information such as news and earnings, not necessarily provided by StockFetcher should always be an important part of the investing process. Stocks and the stock market are unpredictable, technical stock screening serves to provide statistical suggestions for what may or may not happen. Basic Elements of a StockFetcher Screen The following chapters will detail all of the components and building blocks that are available on StockFetcher; however, understanding the basic intent of the blocks is critical. To start with we introduce the idea of “actions” or “verbs.” These are words or phrases that will describe what action you are looking for. These include: above, below, crossed above, increasing for the last, touched and near. These actions allow you to describe the pattern or movement. Next, most of the actions will join two measures or a measure and a value. There are numerous indicators and measures available on StockFetcher. Understanding each measure and how it works is a study in itself; however, taking advantage of these measures on StockFetcher is easy. Nearly all of the measures on StockFetcher are customizable by using parenthesis “(“,”)” and one or more numeric parameters. Taking advantage of these customizations is critical to matching a measure to your approach. For example, a Moving Average(10) is much different than a Moving Average(100). After defining the action and finding the measures you are interested in, there are many more modifications and customizations that may be needed for an approach. For example, the phrase days ago can be used to reference past measure values, or adding the phrase weekly in front of a measure can change a measure from using daily values to weekly price values. These additional modifications are also vital in further defining an approach. Finally, you have created your screen and are evaluating the results. At this point, chart analysis is critical. StockFetcher provides numerous ways to customize charts to help this analysis. These

StockFetcher Usage Guide
4
chart customizations can range from larger charts, expanded time-frames, and additional measures to help visual analysis or to further refine a screen. Understanding how all of these components of a StockFetcher stock screen work together is essential to retrieving the stocks that fit the trading or investing approach you are interested in. Building Your First Screen Now take a look at the steps used to create a stock screen on StockFetcher. What is more important than the actions and measures used in the example below are the steps used to create the stock screen. Step 1: Define the Approach Knowing what you are looking for is an important first step. Your approach may be taken from personal study or from external research. In this example, we are going to look for a classic bullish candlestick pattern occurring after a bullish moving average crossover.
A candlestick is a way of describing the appearance of the open, high, low and close prices of a stock. If the stock closing price is above the open, the candle’s body is empty (or a “White” candle.) If the stock closed below the opening price, the body is filled (or a “Black” candle.)
A candlestick pattern describes a relation or pattern of 2 or more candlesticks.
The candlestick pattern used in this example is the “Bullish Engulfing” pattern. “Bullish Engulfing” occurs when the most recent day is an “up” day that completely contains the previous day. Additionally, the previous day had a close below the open.
A moving average crossover is also included in this approach to help detect a potential rebound from a downturn. To find this case, we will use 10 and 150 day moving averages. Specifically, the approach will look for cases where the 10-day average crosses above the 150-day average.
At first glance, it may appear that creation of this screen is a very difficult task. The key, as with any screen on StockFetcher, is to first break the screen into the smallest logical elements.
Step 2: Create the Candlestick pattern

Chapter 1. Screening on StockFetcher
5
Candlestick patterns are simple price based patterns that take into account where the specific price components are with respect to the current day and previous days. To learn more about the candlestick patterns see the section Candlestick Patterns in Chapter 4. While StockFetcher has many pre-built candlestick patterns, this example will build the pattern from scratch. First, define the close above the open in the most recent trading day.
Close above open
Ok, that was easy. Now add the next requirement that the previous day was a down day.
Close above open And Close 1 day ago was below the open 1 day ago
Notice the use of “and” to break up the phrasing along with the “1 day ago” to refer to past values.
Ok, the last requirement of this pattern is that the most recent day completely “engulfs” the previous day.
Close above open And Close 1 day ago was below the open 1 day ago And High is above high 1 day ago And Low is below low 1 day ago
That completes the definition of the “Bullish Engulfing” pattern. Step 3: Create the moving average crossover The second part of this approach required that there was a recent moving average crossover. This can be accomplished by the addition of the last line:
Close above open And Close 1 day ago was below the open 1 day ago And High is above high 1 day ago And Low is below low 1 day ago And MA(10) crossed above the MA(150)
Now, for this approach the detection of the candlestick pattern occurring on the most recent day is more important than the crossover occurring on the most recent day. To allow more results, we allow the crossover to occur within the last week.
Close above open And Close 1 day ago was below the open 1 day ago And High is above high 1 day ago And Low is below low 1 day ago And MA(10) crossed above the MA(150) within the last 1 week
Step 4: Price and Volume Restrictions
StockFetcher Usage Guide
6
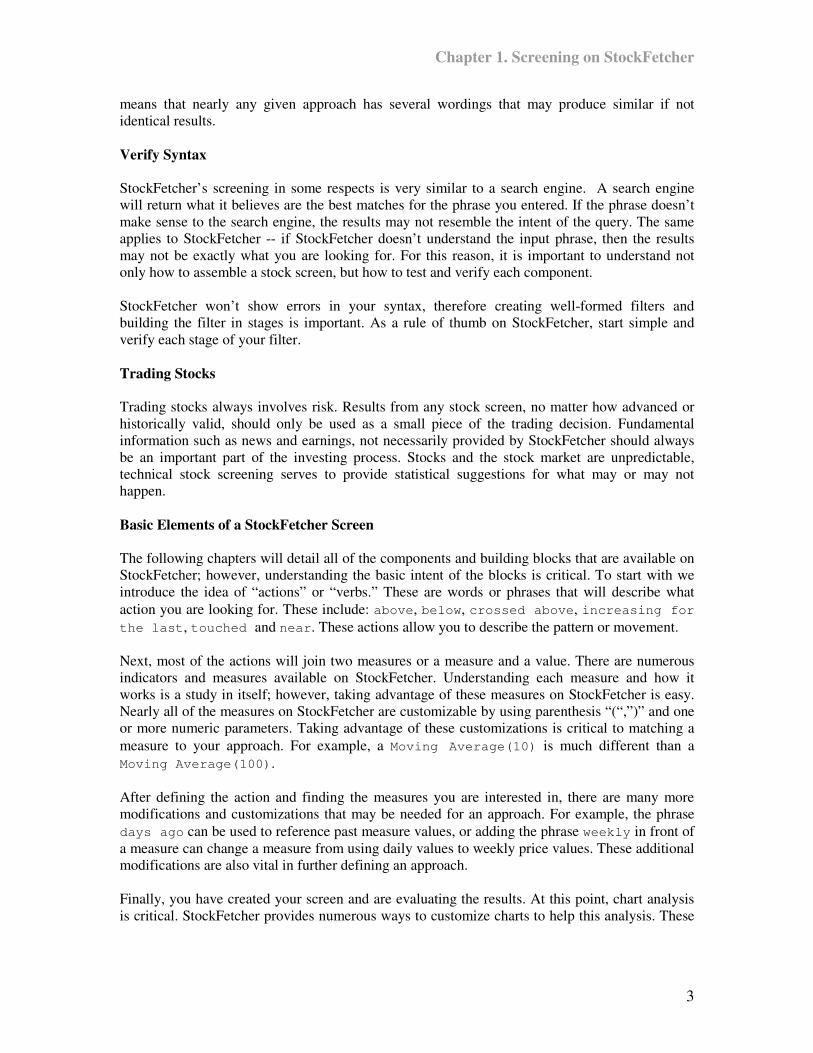
In many cases for an approach to yield results that are reasonably active, and thus a bit more controlled, basic price and volume restrictions are added to the example.
Close above open And Close 1 day ago was below the open 1 day ago And High is above high 1 day ago And Low is below low 1 day ago And MA(10) crossed above the MA(150) within the last 1 week And Price is between 3 and 100 And Average Volume(10) is above 50000
Step 5: Customizing Resulting Charts At this point, the example does exactly what the description of the approach required. To facilitate follow-on analysis, we add some additional measures along with changing the time-frame of the default charts:
Close above open And Close 1 day ago was below the open 1 day ago And High is above high 1 day ago And Low is below low 1 day ago And MA(10) crossed above the MA(150) within the last 1 week And Price is between 3 and 100 And Average Volume(10) is above 50000 And draw RSI(14) And draw Bollinger Bands(20) And chart-length is 4 months
There is more discussion of chart customization in Chapter 6.

7
Chapter 2. Actions Technical stock screens have two critical components: measures and actions. Measures are typically values based on fundamental price and/or volume information. When it comes to stock screening, measures and indicators are not helpful unless there is some way to connect and use the measures. Applying these measures in useful ways is handled through verbs or action phrases on StockFetcher. Action phrases can describe simple characteristics, such as one value is above another value, or maybe a measure is between two other measures. Actions can also describe more complex patterns such as two measures crossing each other, or values diverging. Once you master the action phrases on StockFetcher, more time can be spent on analyzing the effectiveness of particular measures or situations. This chapter will introduce all of the actions that are available on StockFetcher. There are many fewer action phrases in comparison to the number of measures; however, this lower number of components is not a limiting factor. Combined with the measures and indicators, nearly any pattern, action, or location can be described with the phrases in this chapter.

StockFetcher Usage Guide
8
Above / Below / Between† Above, below, and between are three of the most basic and often used of the StockFetcher phrases. Don’t let their basic nature undermine their utility. Nearly all stock actions and patterns can be detected with the right combination of these phrases. Not only can these phrases be used to provide basic screening requirements, they can also be combined with other phrases to find crossovers, custom candlestick patterns as well as trends. The above or below keywords permit basic screening comparisons between an indicator and value, or indicator and indicator. The most fundamental use of these phrases is to provide price-based or volume-based restrictions on screening results. For example:
price is above 5 and average volume(10) is above 50000
StockFetcher always assumes “above” means “greater than or equal to” and “below” means “less than or equal to.”
Continuing with the example above, a specific price range can be created by combining an above phrase with a below phrase. This combination effectively creates a between scenario and can work not only with defined values, as the example below shows, but also with indicators.
price is above 5 and price is below 25 and average volume(10) is above 50000
This phrasing is not limited to an indicator and a value; comparisons between two indicators can also be made. For example, the statement below detects the position of two separate measures.
Moving Average(50) is above Moving Average(20)
Above or Below for the Last … Further enhancing the ability of above or below is the addition of the phrase for the last … This powerful extension provides the functionality to find cases where a particular position or movement has been sustained for a particular period of time. Although the phrase for the last ... is typically not used in basic price-based or volume-based criteria, it is used extensively in many popular trending approaches. To illustrate the benefits of this extension, take for example the common approach of the RSI reaching values below 30 indicating an oversold level. Using the basic above and below terminology, the filter described here will find all of the cases that are currently at oversold levels.
RSI(15) is below 30
† Because above and below can be used to build a between phrase, between is a convenience phrase – it does not provide any additional features. All of the examples in this section will focus on use of above and below.

Chapter 2. Actions
9
While the above filter is a powerful and simple phrase, not much information is provided about the RSI specifically. What direction is it moving? How long has it been below 30? Knowing that this measure has been below 30 for the last week lets you know that the oversold condition has been present for at least one week.
RSI(15) has been below 30 for the last 5 days
Combining above and below with the days ago phrase allows for even more control of your analysis. Continuing with the example, suppose we modify the example approach to find cases where the RSI remained at oversold levels for a week and then crossed above 30.
RSI(15) 1 day ago had been below 30 for the last 5 days and the RSI(15) is above 30
This simple, two-sentence approach discovers stocks that are potentially emerging from an extended stay at oversold levels. The chart below illustrates a match from the approach above.
More than / Less than Sometimes just identifying that a measure is above or below another measure or value does not provide enough information. It may be necessary to know how far above or below the measure is in relation to one another. For example, knowing that the close is above the moving average is useful, but knowing that the close is more than 20% above the moving average can provide even more insight. In both the above and below case, quantifying how far above or below can prove to be a useful feature. For example:

StockFetcher Usage Guide
10
Close is more than 15% above the MA(50) And Close is less than 20% above the MA(50)
Specifying the proximity of two measures opens the door for cases where an event is imminent or just about to happen. Take for example a crossover. Typically once a crossover occurs, a support or resistance level for the particular measure has been breached. This may prove to be too late for some approaches, so detecting cases where a support or resistance case is about to occur can be very helpful. Using the more than or less than phrasing can help find cases where these levels are about to be tested. Below we analyze the position of the closing value with respect to a popular resistance pattern.
Close is less than 0.5% below the upper ascending triangle(65)
The filter above generates candidates about to break through the upper bound of the 65-day symmetric triangle pattern. The upper bound on an ascending triangle indicates resistance level that the price has been unable to break through. Detecting cases where the close is about to test this level provides potential opportunities for the support to be upheld, or for the breakout to finally occur. In a few situations price or value thresholds are desired rather than percentages. In these cases, replace the % or percent with points. For example, to find stocks where the most recent close is at least one dollar higher than the open, the following phrase will work:
Close is more than 1 point above the open
Additional Examples
the MA(10) is above the MA(50) the close is < lower Bollinger band(20)
the high is above the high 1 day ago and the low is below the low 1 day ago
Synonyms
>,<, greater than, less than

Chapter 2. Actions
11
Exercises
1) Continuing with the RSI example above, add an additional requirement that the RSI was above 30 prior to remaining below 30 for the 5 days.
2) Using above and below, describe the candlestick pattern in the following diagram:

StockFetcher Usage Guide
12
Approaching from above/below Watching a measure or indicator approach a specific threshold can be a very important component in the set-up phase of many approaches. For instance, a common strategy dictates that a 15-day RSI measure below 30 is an oversold situation. To look for these cases the simple filter below may be used:
Show stocks where the RSI(15) is below 30
Now suppose an approach requires that the RSI has not quite crossed 30 yet, but is heading in that direction. Using the “approaching” keyword on StockFetcher, it is possible to detect these cases. For example:
Show stocks where the RSI(15) is approaching 30 from above
This filter will help detect those stocks that are beginning to approach the condition where they may be considered “oversold”.

Chapter 2. Actions
13
Converging/Diverging Stock analysis can often involve comparing the movement of two different measures and whether or not these measures are moving in towards or away from each other. A common example of this involves Bollinger Band analysis. When prices are stabilizing, it is often said that the bands are converging or squeezing together. In periods of more volatility, these bands begin to widen and diverge. StockFetcher has a convenient pair of phrases converging and diverging that help to find these situations. For example, below is a stock filter that shows Bollinger Bands that have been tightening over the last two weeks:
Show stocks where the upper Bollinger band(20) is converging towards the lower Bollinger band(20) over the last 2 weeks
StockFetcher Usage Guide
14
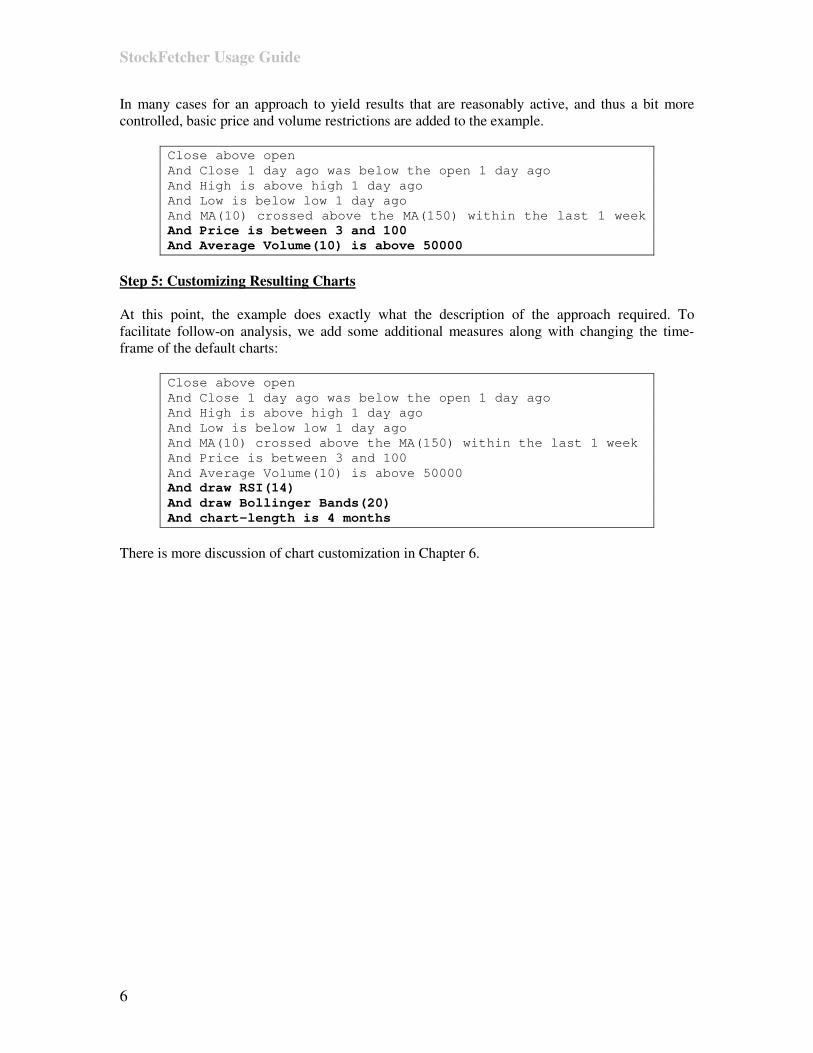
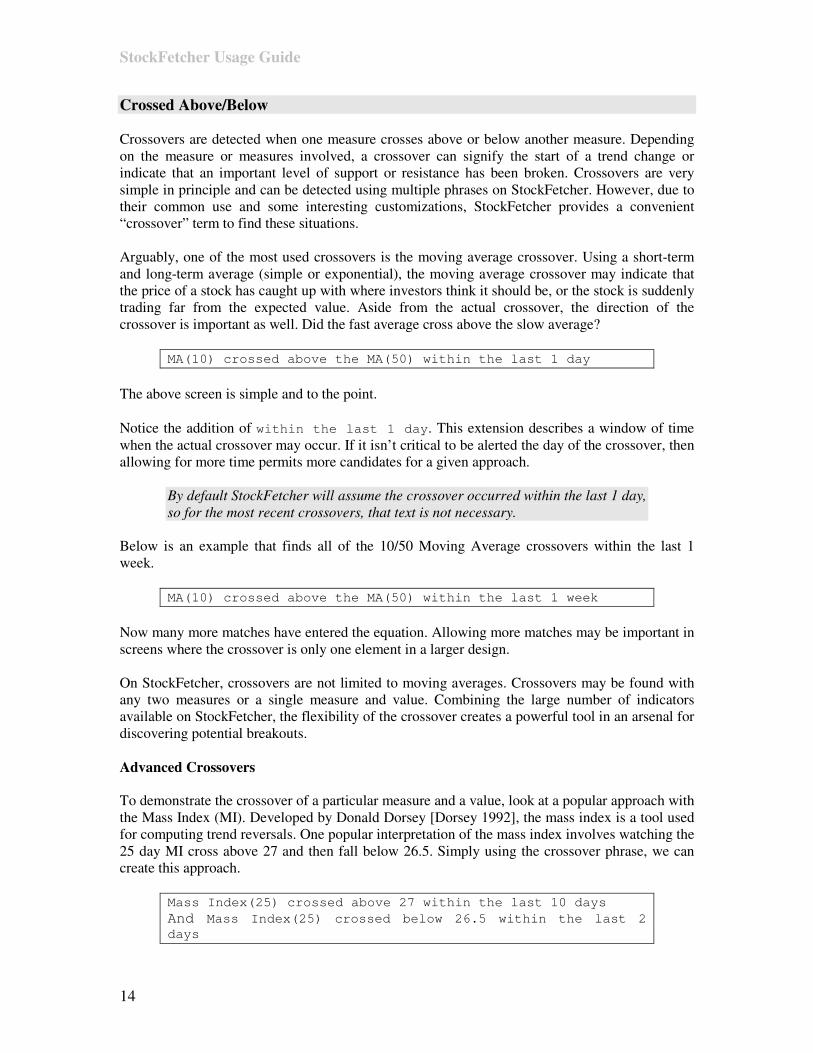
Crossed Above/Below Crossovers are detected when one measure crosses above or below another measure. Depending on the measure or measures involved, a crossover can signify the start of a trend change or indicate that an important level of support or resistance has been broken. Crossovers are very simple in principle and can be detected using multiple phrases on StockFetcher. However, due to their common use and some interesting customizations, StockFetcher provides a convenient “crossover” term to find these situations. Arguably, one of the most used crossovers is the moving average crossover. Using a short-term and long-term average (simple or exponential), the moving average crossover may indicate that the price of a stock has caught up with where investors think it should be, or the stock is suddenly trading far from the expected value. Aside from the actual crossover, the direction of the crossover is important as well. Did the fast average cross above the slow average?
MA(10) crossed above the MA(50) within the last 1 day
The above screen is simple and to the point. Notice the addition of within the last 1 day. This extension describes a window of time when the actual crossover may occur. If it isn’t critical to be alerted the day of the crossover, then allowing for more time permits more candidates for a given approach.
By default StockFetcher will assume the crossover occurred within the last 1 day, so for the most recent crossovers, that text is not necessary.
Below is an example that finds all of the 10/50 Moving Average crossovers within the last 1 week.
MA(10) crossed above the MA(50) within the last 1 week
Now many more matches have entered the equation. Allowing more matches may be important in screens where the crossover is only one element in a larger design. On StockFetcher, crossovers are not limited to moving averages. Crossovers may be found with any two measures or a single measure and value. Combining the large number of indicators available on StockFetcher, the flexibility of the crossover creates a powerful tool in an arsenal for discovering potential breakouts. Advanced Crossovers To demonstrate the crossover of a particular measure and a value, look at a popular approach with the Mass Index (MI). Developed by Donald Dorsey [Dorsey 1992], the mass index is a tool used for computing trend reversals. One popular interpretation of the mass index involves watching the 25 day MI cross above 27 and then fall below 26.5. Simply using the crossover phrase, we can create this approach.
Mass Index(25) crossed above 27 within the last 10 days And Mass Index(25) crossed below 26.5 within the last 2 days

Chapter 2. Actions
15
Above is another short example that demonstrates the power of the crossover keyword. As indicated, the mass index detects trend reversals; nothing about the example tells us what trend was just reversed. To help solve that problem, we add a simple oversold stochastic measure:
Mass Index(25) crossed above 27 within the last 10 days And Mass Index(25) crossed below 26.5 within the last 2 days And Slow Stochastic Fast(39) %K crossed above 50 within the last 5 days
Below is a chart illustrating the filter above.

StockFetcher Usage Guide
16
Multiple Crossovers In combination with the days ago phrase, it is possible to detect specific crossovers from a couple of days ago, but also makes it possible to find multiple crossovers. Because a crossover may indicate a break in resistance, it is possible that a crossover may produce a false hit. Knowing that a crossover wasn’t supported can provide good cases where a stock may resume a previous trend. As an example, below is an approach that finds stocks whose 25-day moving average broke above the 200-day moving average, only to fall back a couple of days later:
show stocks where the MA(25) 5 days ago crossed above the MA(200) 5 days ago within the last 5 days and MA(25) crossed below the MA(200) within the last 5 days
See Chapter 5 for details on the days ago phrase.

Chapter 2. Actions
17
Exercises: Create StockFetcher statements that satisfy the following requirements:
1) Find stocks where the MACD fast line has just passed below 0 2) Find cases where the MACD fast line is above 0 and just passed above the
MACD slow line. 3) Detect cases where the price crossed above both the 10-day and 50-day
exponential moving averages.

StockFetcher Usage Guide
18
Dropped/Gained Dropped or gained computes the change in price of a particular measure over a given period of time. Additionally, the change may be computed as a percent change or an actual point change. In the most basic case, dropped or gained can be used to generate a screen based on a price change from one day to the next.
Close dropped more than 10% over the last 1 day
Notice the last portion of the example above specifies a number of days for the drop to occur.
Now, instead of the simple price change from one day to the next, suppose the change over the last week is desired.
Close gained more than 15% over the last 1 week
In the example above, activity during the internal portion of the week is irrelevant because the screen focuses on the first and last values of the week to compute the percent change. Combining the screen above with a phrase using the keyword increasing creates a screen that looks for a 5 day consecutive increase of at least 15%.
Close gained more than 15% over the last 1 week and Close has been increasing for 5 days
The previous example still may be too limiting. Suppose the goal is to find cases where stocks have gained 15% over the last 1 week, but maybe there was a drop or two during the week, with the price never dipping below the starting day, nor exceeding the final day. The next example provides just that case:
Close gained more than 15% over the last 1 week And close 1 week low is above close 1 week ago And close 4 day high 1 day ago is below close
The above is a bit more complicated, but the results should provide stocks with 15% gains, where the low is on the first day and the high is on the last day. Point vs. Percent Changes Alluded to above, the dropped or gained phrasing is not limited to percent changes. Actual point changes can be employed by using points. Specifying points can be very useful especially when the measure is centered at zero and the actual percent change is not as important. The Commodity Channel Index (CCI) is a good example of an oscillator centered at 0.
Show stocks where the CCI(14) gained more than 100 points over the last 1 day
As the previous example shows, the dropped or gained keyword is not limited to percent, nor is it limited to just price values. Any measure or indicator’s gain or loss can be screened using
Chapter 2. Actions
19
these keywords. Additionally, simple combinations involving increasing or decreasing may uncover strong trends. Exercises
1) Create a stock screen that finds stocks where the volume has doubled in the last week
2) Using the solution from the first exercise., limit the results to cases where the volume increase was consecutive
3) Combining both the dropped and gained keywords, find stocks that dropped more than 25% last month, only to regain the 25% this month.
StockFetcher Usage Guide
20
Increasing/Decreasing for the last… The keywords increasing and decreasing are used to find prices or measures with consecutive day changes. Depending on the measure, an approach may look for two to three days of consecutive gains or losses, while other longer-term values might look for multi-week or even month-long moves. On StockFetcher, nearly any time-frame may be specified for consecutive day changes. Take the basic consecutive day losing price approach.
Close has been decreasing for 3 days
The screen above looks for stocks that just completed three straight days of losses. Nothing in this filter specifies how much each daily loss is; it simply looks for three successive days of lower closing values. As with other action phrases on StockFetcher, the increasing or decreasing phrases are not limited to daily price values. In fact, this particular phrase is especially useful when looking at increasing momentum or volatility. Below is an example that uses the momentum indicator:
Momentum(14) has been increasing for 2 weeks
Because the momentum measure is not normalized, screening based on consecutive day changes is very effective. Additionally, longer term consecutive momentum is useful when it comes to longer term moving averages. A 200-day exponential moving average will be fairly immune to single day dips and rises. Watching the 200-day EMA for several weeks of gains is helpful in determining the strength of the current price trend.
EMA(200) has been increasing for 3 weeks
Now, suppose the next goal is to find cases where this strong trend has been broken. By simply adding an offset to the phrase above, along with a decreasing phrase the screen provides potential trend reversal candidates.
EMA(200) 1 week ago had been increasing for 3 weeks and EMA(200) has been decreasing for 1 week
Exercises:
1) Use increasing and decreasing in a stock screen to discover Bollinger band squeezes
2) Reverse exercise 1 to find Bollinger Band breakouts 3) Create a screen to find cases where the price and MA(50) are diverging for 1
week

Chapter 2. Actions
21
Near Near is a convenient phrase that generically defines two measures or values to be close in proximity. StockFetcher defines two measures to be “near” each other when the distance between the two values is less than 2%. This 2% threshold is a generic assumption; however, near is easily applied and often used in the initial stages of developing a StockFetcher phrase. Take for example, a filter that has one component where the price needs to be near the lower Bollinger Band.
Show stocks where the low is near the lower Bollinger band(20)
On a first pass, this will provide many examples where the daily low is within 2% of the lower Bollinger band. After further development, more control of the exact proximity may be necessary. At that point, phrases such as more than or less than may be used.
Show stocks where the low is less than 5% above the lower Bollinger(20) band and The low is less than 2% below the lower Bollinger(20) band
Clearly this second example provides more control of the proximity of the daily low with respect to the measure; however, the phrase near was helpful in the initial stages of designing the approach. Exercises
1) Create a screen to find cases where the 14-day RSI is near overbought levels at 80
2) Refine exercise 1 to find cases where the 14-day RSI is near 80 from above.

StockFetcher Usage Guide
22
Record Highs and Lows Inspecting recent price extremes is an effective first pass for many screening approaches. Knowing that a stock is trading at less than one-half the value it held one year ago can speak volumes. In many approaches just the ratio of price to one year high can select or eliminate stocks. Recent trading ranges are also critical in judging breakouts or bounces against resistance. Suppose a stock is trading just below a six-month high. If it has bounced off that range for a period of time something must be up when it finally breaks through that limit. On StockFetcher, the ability to detect stocks reaching records is just one component of using the multi-day high and low. First to get accustomed to the StockFetcher’s syntax for detecting multi-day highs or lows, the example below detects stocks reaching a new one year high.
Close reached a new 1 year high
Notice that the keyword close is used. Substitute high for close to find cases where the matches had the highest traded price over the last year.
High reached a new 1 year high
Additionally, the record value is not limited to only the past year; any range from 2 days to 2 years can be used. Recent Record Values Another powerful feature about finding record highs and lows is the ability to specify a range of dates for when the record occurred. While the actual date when the high or low occurred may not be important,just knowing that the candidates recently reached this value is what may be important. For example:
MA(10) reached a new 18 month low within the last 1 week
The phrase above increases the number of stocks that might be fed to follow-on analysis or screening logic.
Notice the previous example discovers the record value for a moving average. On StockFetcher, any measure or indicator’s multi-day high or low may be found – it is not limited strictly to price-based values.
Using Record Highs and Lows as a Measure As described above, discovering stocks recently reaching a new high or low is just one aspect of this key phrase. Another use, and arguably more powerful, is the ability to actually refer to the record high or low as a specific measure. Take the case where a stock is approaching, but not yet exceeding a record high.
Close has been increasing for 5 days
Chapter 2. Actions
23
And close has been below the close 6 month high for the last 4 weeks
This example illustrates the notion that the matches are approaching their recent six month high, but are yet to exceed it. The six month high has been established as a measure and the closing value is compared to that value. These record values can also be used as input to the basic mathematical operations available on StockFetcher. The advanced example below enhances the results of the previous screen by showing the width of the recent range of the stochastic oscillator.
Close has been increasing for 5 days And close has been below the close 6 month high for the last 4 weeks And add column fast stochastic(15) fast %k 1 week high minus the fast stochastic(15) fast %k 1 week low {sto15diff}
See Chapter 7 for more details on the add column phrase
Highs and Lows as Boundaries Record high and low values for a measure can be used to create boundaries for the given measure. For example consider an approach that discovers stocks that have been trading in a narrow, horizontal range. Below is an example that accomplishes both of these requirements:
High 6 week high is less than 10% above the low 6 week low and Day Range 6 week high is less than 2%
This is another simple example of the use of record high and low values that provides powerful results. None of the matches for the phrase above have traded outside a 10% range for the last 6 weeks, and there wasn’t a particular day where the trading range was more than 2% the stock value. Highs and Lows on Charts Not only can the high and low values be used in the stock screens, any resulting charts will plot the high and low values. The previous example is a great case of how the record high and low values can provide visually important information. Below is a chart showing the narrow range defined by the previous example.

StockFetcher Usage Guide
24
The previous approach certainly finds candidates trading in a narrow range, but suppose the goal is to find cases where suddenly this range has been broken. By using an offset to the example above, along with a couple of new requirements, a new approach can be created.
High 6 week high 1 day ago is less than 10% above the low 6 week low 1 day ago and Day Range 6 week high 1 day ago is less than 4% and Day Range is above 6% and Volume is more than 50% above the average volume(10) 1 day ago
Exercises
1) Create a screen that finds stocks that reached a new six month high. 2) Find stocks that reached a one year high within the last day. 3) Show stocks where the RSI(14) is at a new six week low. 4) Find stocks where the close has reached a new 52-week high each of the last 3
days. 5) Create a screen to select stocks where the MACD histogram reached a new 14
week low. 6) Create a screen that finds stocks that reached a new six month high yesterday, but
dropped more than 10% today.

Chapter 2. Actions
25
Slope of Specifying that a measure or indicator is at or near a particular value is a very important aspect of stock screening. However, understanding how the fast or slow the measure got to that value can be just as important. Capturing the rate of movement is handled through the slope of function. Before using the slope of function, it helps to understand exactly what values are returned. StockFetcher first computes a linear slope of the input values. Once the linear slope is computed, the raw slope value is normalized to make sure that it is possible to compare the slope across all values, regardless of the input. Once normalized, the values returned by the slope of function can be positive or negative depending how the measure has moved over the specified period. Values below zero indicate that the measure has been trending down, while values above 0 indicate an up-trend. Additionally, a slope value which is above 1.0 indicates that, during the specified period, the value of the measure has effectively doubled, or moved sharply.
Note: the actual measure may not have doubled, but the line created from the linear slope has at least doubled.
As an example, we look at stocks where the closing prices have a 50 day slope over 1. Essentially, this returns matches with a sharp increase of the closing prices over the last 50 days.
Show stocks where the 50 day slope of the close is above 1.0

StockFetcher Usage Guide
26
The example above also demonstrates the syntax used for the slope of feature. The time period can be varied to match the trend length you are interested in. For example, the filter below looks for the same slope as the previous example, but in a much shorter period of time.
Show stocks where the 10 day slope of the close is above 1.0
Slope of any measure The previous examples demonstrated the slope feature using only closing prices; however, any measure may be used as input to the slope of feature. As an example of how this is helpful, we start with a filter which looks for cases where the Fast Stochastic oscillator is below 30.
Show stocks where the Fast Stochastic(15,3) Fast %K is below 30
Now, suppose we want to add a requirement that the Fast Stochastic value quickly dropped to below 30. This would require looking for a negative slope.
Show stocks where the Fast Stochastic(15,3) Fast %K is below 30 and the 15 day slope of the Fast Stochastic(15,3) Fast %K is below -0.75

Chapter 2. Actions
27
Flat slope So far the examples have been focused on finding sharp up or down trends. The slope may also be used to find cases where a measure has not trended in one direction or the values have been moving horizontally. Slope values near 0 indicate the particular measure has not made a decisive trend up or down.
Note, a slope near zero does not mean the measures have not moved up or down, rather the starting value is very close to the ending value.
For example:
Show stocks where the 35 day slope of CCI(14) is between -0.001 and 0.001
Exercises
1) Create a screen to find sharply increasing Bollinger Bands 2) Expand the first screen to show stocks that are quickly approaching the bottom
Bollinger Band.
StockFetcher Usage Guide
28
Touching Touching is a keyword specifically used for price-based measures. On StockFetcher, when a filter indicates that the price is “touching” another measure, this means that some component of the price resides above the measure and the remainder of the price is below the measure. For example:
Show stocks where the price is touching the upper Bollinger band
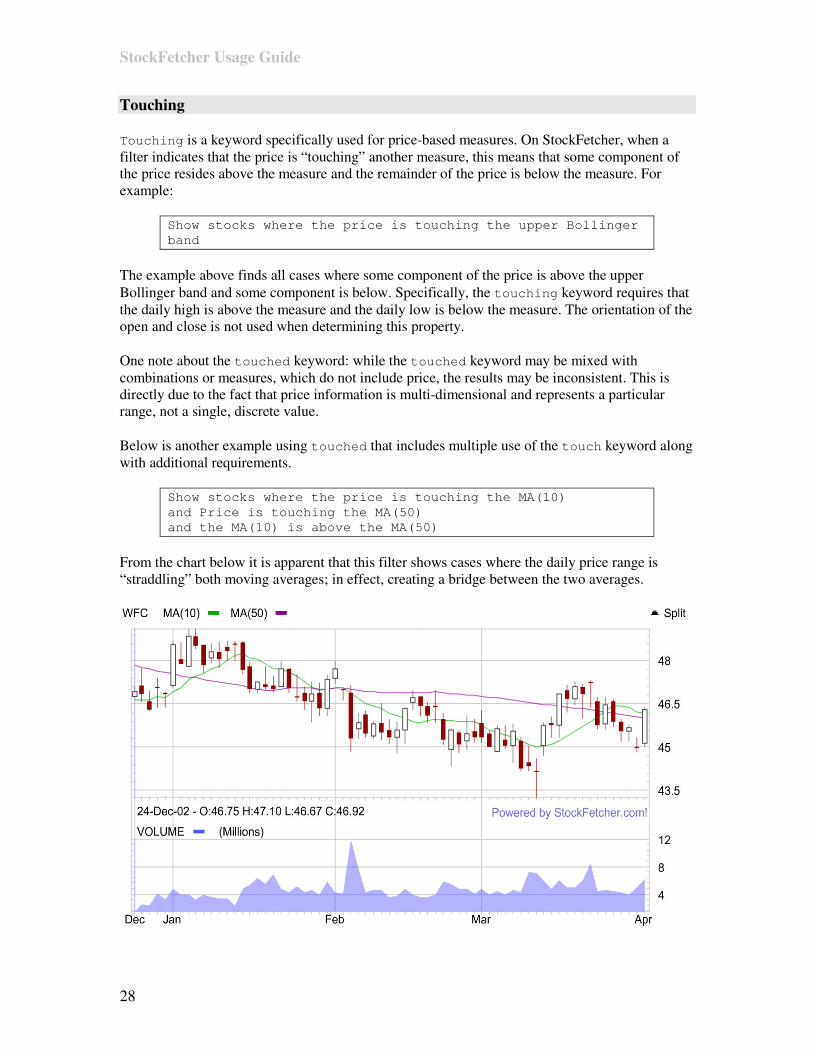
The example above finds all cases where some component of the price is above the upper Bollinger band and some component is below. Specifically, the touching keyword requires that the daily high is above the measure and the daily low is below the measure. The orientation of the open and close is not used when determining this property. One note about the touched keyword: while the touched keyword may be mixed with combinations or measures, which do not include price, the results may be inconsistent. This is directly due to the fact that price information is multi-dimensional and represents a particular range, not a single, discrete value. Below is another example using touched that includes multiple use of the touch keyword along with additional requirements.
Show stocks where the price is touching the MA(10) and Price is touching the MA(50) and the MA(10) is above the MA(50)
From the chart below it is apparent that this filter shows cases where the daily price range is “straddling” both moving averages; in effect, creating a bridge between the two averages.

29
Chapter 3. Indicators and Measures StockFetcher contains dozens of indicators and measures. These measures vary from fundamental price values and daily ranges to more complex statistical values. The following chapter is designed to provide a reference guide for the indicators and measures. Short descriptions have been provided along with syntax rules and several examples. Nearly all of the indicators and measures can be customized on StockFetcher.

StockFetcher Usage Guide
30
Absolute Price Oscillator (APO) Parameters
Period1 (length of the first moving average) Period2 (length of the second moving average)
Usage
Absolute Price Oscillator(Period1,Period2) APO(Period2,Period2)
Description The Absolute Price Oscillator (APO) is the exact same measure as the Percent Price Oscillator (PPO); however, the resulting values are not converted to percentages. The APO is computed by taking the difference between two moving averages. The two parameters used for the APO indicate the period, or number of days, used for each moving average. Examples
show stocks where the APO(10,50) crossed above 0 within the last 1 day show stocks where the APO(10,100) has been increasing for 10 days
See Also Detrended Price Oscillator(DPO), Percent Price Oscillator(PPO)

31
Absolute Volume Oscillator (AVO) Parameters
Period1 (length of the first moving average) Period2 (length of the second moving average)
Usage
Absolute Volume Oscillator(Period1,Period2) AVO(Period2,Period2)
Description The Absolute Volume Oscillator (AVO) computes the difference between two average volume measures. Unlike the Percent Volume Oscillator(PVO) the AVO does not convert the difference to a percent or normalize the results. Examples
show stocks where the AVO(10,50) crossed above 0 within the last 1 day show stocks where the AVO(10,100) has been increasing for 10 days

StockFetcher Usage Guide
32
Acceleration Bands Parameters
Period
Usage
Upper Acceleration Band(period) Lower Acceleration Band(period) Middle Acceleration Band(period)
Description Developed by Price Headley, the Acceleration bands are based on the average trading range for each day. The values are plotted equidistant from an n-day simple moving average which serves as the center or middle band. The author indicates that successive days exceeding one of the bands tends to indicate an entry point. Examples
Show stocks where high crossed below the lower acceleration band(20) Show stocks where close 1 day ago crossed above the Upper Acceleration Band(20) 1 day ago and close is above Upper Acceleration Band(20)
Chapter 3. Indicators and Measures
33
Aroon Up/Down/Oscillator Parameters
Period Usage
Aroon Up(Period) Aroon Down(Period) Aroon Oscillator(Period)
Description The Aroon Up and Down (developed by T. Chande [Chande 1995]) are based on the time since the closing price reached a new high or low. Suppose you are interested in the "Aroon Up(10)". This measure would find the location of the highest closing value within the last 10 days. The value returned would be the location of the highest close as a percent of the timeframe. So, suppose the highest closing value for a given stock occurred 6 days ago. The Aroon Up(10) for that stock would be 40, ((10 - 6)/10) * 100. Next, assume that the stock still didn't make a new closing high on the following day. The Aroon Up(10) now drops to 30, ((10-7)/10) * 100. The key to the Aroon system is that typically if a stock is not making new highs (as the example above indicates) then it is probably making new lows. The Aroon Down(10) is computed in the same way as the Aroon Up, except the Aroon Down will use the location of the lowest closing value. Determining how to interpret these values for a screening approach is an entirely different issue. In one case, you may be interested in situations where both the Aroon Up and Down are moving in the same direction, or in parallel. This would indicate that neither new highs nor new lows are being made -- likely a consolidation pattern.
show stocks where the Aroon Up(10) has been decreasing for 5 day and the Aroon Down(10) has been decreasing for 5 days
Another approach would be to look for extreme values of the Aroon Up and/orAroon Down. Suppose, the Aroon Up(20) has been above 70 for the last 2 weeks. This means that the stock is consistently making new 20-day highs, an indication of a strong up-trend.
show stocks where the Aroon Up(20) has been above 70 for the last 2 weeks
Finally, the Aroon Oscillator simply takes the difference between the two values. Valid ranges for the Aroon Up and Aroon Down are 0-100 and for the Aroon Oscillator the valid range is -100 to 100. Examples
show stocks where the Aroon Up(25) crossed below 50 within the last 1 day

StockFetcher Usage Guide
34
show stocks where the Aroon Down(25) is below 30
show stocks where the Aroon Oscillator(25) crossed above 0 within the last 1 day
Chapter 3. Indicators and Measures
35
Average True Range Parameters
Period Usage
Average True Range(Period) ATR(Period)
Description Using the relationships between the high and low of a day compared with the previous close, the Average True Range is a measure of volatility developed by Welles Wilder [Wilder 1978]. Typically used to identify oversold and overbought conditions, a low average true range indicates a stock that lacks volatility, while high average true range indicates potential sell-offs of a stock. Examples
Average True Range(14) has been increasing for 5 days
ATR(14) has been increasing for 3 days lag 2 days and the ATR(14) has been decreasing for 2 days

StockFetcher Usage Guide
36
Average Volume Parameters
Period Usage
Average Volume(Period) Avgvol(Period)
Description A simple moving average of the shares traded (volume) of a stock over a given number of days. Examples
Average Volume(10) is between 500000 and 1000000

Chapter 3. Indicators and Measures
37
Bollinger Bands (upper, lower, median) Parameters
Period StdDevs (Number of standard deviations)
Usage
Upper Bollinger Band(Period,StdDevs) Lower Bollinger Band(Period,StdDevs) Median Bollinger Line(Period,StdDevs)
Description Pioneered by John Bollinger [Bollinger 1992], Bollinger Bands are statistical measures of relative highs and lows for a stock. The band positions are generated from a specified number of standard deviations from a moving average. The upper and lower bands form an envelope around the price of the stock, illustrating statistical price points of support and resistance. Popular interpretations of the Bollinger Bands involve detecting current price movement relative to the bands. For example, some approaches watch for prices touching or moving along a particular band. Additionally, converging or diverging bands may indicate compression or decompression with the stock price. Including the upper and lower Bollinger Bands, there is a third line commonly displayed which is the median line. This is an n-period moving average that is used to form the center of the Bollinger Channel. The standard deviation parameter is used to control how far the upper and lower bands are positioned from the upper channel. Typically this value defaults to 2, indicating that the extreme high or low for the stock is 2 standard deviations from the center channel. Examples
Price crossed below the lower Bollinger Band(20)
Price is below the upper Bollinger(20,2.0) and price is above the upper Bollinger(20,1.5)
Price is near the median Bollinger line(20)
See Also Bollinger Oscillator, Bollinger Width, Keltner Channels, Moving Average Envelopes

StockFetcher Usage Guide
38
Bollinger Oscillator Parameters
Period StdDevs (Number of standard deviations)
Usage
Bollinger Width Oscillator(Period,StdDevs) Bollinger Oscillator(Period,StdDevs)
Description The Bollinger Width Oscillator is a simple extension of the Bollinger Bands [Bollinger 1992] using the closing price. Essentially the Bollinger Width Oscillator computes the position of the closing price relative to the width of the Bollinger Bands. This oscillator ranges from -100 to 100. Where a value above 100 indicates the closing price is above the upper band and a value of -100 would indicate the price is below the lower band. Similarly, a value at 0 indicates the price is centered on the median Bollinger Band (or moving average.) Examples
Bollinger Oscillator(20) is above 100 and draw Bollinger Bands(20)
Bollinger Oscillator(20) crossed above -100 and draw Bollinger Bands(20)
See Also Bollinger Bands, Bollinger Width

Chapter 3. Indicators and Measures
39
Bollinger %B Parameters
Period StdDevs (Number of standard deviations)
Usage
Bollinger %B(Period,StdDevs)
Description Examples
See Also Bollinger Bands, Bollinger Width, Bollinger Oscillator

StockFetcher Usage Guide
40
Bollinger Width Parameters
Period StdDevs (Number of standard deviations)
Usage
Bollinger Width(Period,StdDevs) Description The Bollinger Width returns the width of the upper and lower Bollinger Band [Bollinger 1992] divided by the n-day average price. In other words, a Bollinger width near 0 indicates the upper and lower Bollinger Bands are very close together while a value near 1 indicates wide bands. Examples
show stocks where the Bollinger width(20) is between 0 and 0.15 and draw Bollinger(20)
show stocks where the Bollinger width(20) has reached a new 6 month low and draw Bollinger(20)
show stocks where the Bollinger width(30) has reached a new 1 year high and draw Bollinger(30)

Chapter 3. Indicators and Measures
41
Center of Gravity Parameters
Period PeriodEMA – Period for the smoothed COG signal.
Usage
Center of Gravity(Period, PeriodEMA) COG(Period, PeriodEMA) COG(10) COG(10,2)
Description Developed by John F. Ehlers [Ehlers 2002], the Center of Gravity (COG) is an oscillator used to detect price turning points. The COG is computed by taking the sum of the closing values, weighted by the offset in time of the closing price; divided by the non-weighted sum of the closing values. This value is then multiplied by -1 and normalized, resulting in an oscillator centered at 0. The second parameter to the COG on StockFetcher provides a period of days for a smoothed version of the raw COG signal. An exponential moving average (EMA) of the COG is plotted with the primary signal. Examples
COG(10,2) has been decreasing for 4 days
COG(10,2) crossed below 0 within the last 5 days and COG(10,2) has been decreasing for 10 days
StockFetcher Usage Guide
42
Chaikin’s Money Flow Parameters
Period Usage
Chaikin’s Money Flow(Period) CMF(Period)
Description The Chaikin Money Flow indicator (developed by Marc Chaikin [Narcouzi 2000]) determines how much money is moving in and out of a stock based on the number of shares traded and the position of the closing price within the daily range. As a stock continues to close near the high of the day, the CMF will increase, indicating potential strength in the stock. Closing values near the low of the day represent continuing weakness in the stock. Examples
Show stocks where Chaikin’s Money Flow(21) reached a new 3 month high
Show stocks where CMF(14) has been increasing for 5 days

Chapter 3. Indicators and Measures
43
Chaikin's Volatility Parameters
Period1 (days used for EMA) Period2
Usage
Chaikins Volatility(Period1, Period2) Description Typical of most volatility measures, Chaikin's Volatility [Chaikin ???] measures the separation between the high and low price of a stock. Specifically, Chaikin's Volatility uses the difference between current day average of the high and low and the average of the high and low, divided by the average high and low separation. Interpretations of this indicator involve watching for high volatility to indicate market peaks with low volatility, possibly indicating a market bottom. Examples
Chaikins Volatility(10,10) has been increasing for 5 days
Chaikins Volatility(10,10) has been decreasing for 3 days

StockFetcher Usage Guide
44
Chande Momentum Oscillator (CMO) Parameters
Period AvgPeriod – Period used for the smoothed CMO values.
Usage
Chande Momentum Oscillator(Period, AvgPeriod) CMO(Period, AvgPeriod) Average CMO(Period, AvgPeriod)
Description Used as both an oversold/overbought measure and as a trend indicator, the Chande Momentum Oscillator (CMO) was developed by Tushar Chande and Stanley Kroll [Chande and Kroll 1994]. The CMO is calculated by first subtracting the sums of up and down days. This difference is then divided by the sum of all absolute changes during the given period. With a high number of “up” days during the period, the value of the CMO will increase. Values above 50 typically indicate an overbought condition while values below -50 tend to signify oversold levels. In addition to the raw CMO values, you can also specify the period for a smoothed version of the CMO signal. The second parameter to the CMO indicates the period for this smoothed signal. Often crossovers between the two values indicate trigger points. Examples
Show stocks where the CMO(20) is above 50
Show stocks where the CMO(20,9) is below -50 and CMO(20,9) crossed below Average CMO(20,9)

Chapter 3. Indicators and Measures
45
Chandelier Exit Parameters
Period Position
Usage
Chandelier Exit(22,2.5) Description The Chandelier Exit (developed by Chuck LeBeau) is a volatility measure using the ATR to help set stop limits. The exit is computed by finding the highest value over the period and then subtracting a multiple of the ATR for that period. On StockFetcher, the position parameter is the ATR multiplier used to find the actual stop position. Examples
show stocks where close is between 10 and 50 and draw Chandelier Exit(22,2.5)
show stocks where close crossed below Chandelier Exit(22,2.5)

StockFetcher Usage Guide
46
Close-to-open Gap Parameters
none Usage
Close-to-open Gap Description The Close-to-open gap is a simple measure of a stock's opening price relative the previous close. Resulting values are the difference between the open and previous close represented as a percent of the closing price. Examples
Close-to-open gap is above 0

Chapter 3. Indicators and Measures
47
Commodity Channel Index (CCI) Parameters
Period Usage
CCI(Period) Description The Commodity Channel Index, developed by Donald Lambert [Lambert 1980], is a measure of a stock's price in relation to its current average. Increasing values of the CCI indicates the stock is trading much higher than its recent average, while low values indicate the stock trading below the recent average. CCI values below -100 can be interpreted as an oversold situation, while values above +100 are seen as potential overbought conditions. Examples
CCI(14) is below -100
CCI(14) is above 100 and CCI(14) has been decreasing for 2 days

StockFetcher Usage Guide
48
Comparative Relative Strength Parameters
Symbol – Stock or index to compare. Period – Length of time for comparison
Usage
Comparative Relative Strength(Symbol, Period) Description The comparative relative strength performs a simple calculation of how a stock performed, over the specified period of time, with a given input stock. This measure is often used to find stocks that are underperforming or outperforming a given index, but can also be used to compare against individual stocks.
It should be noted that this measure is not a pattern matching routine. That is, it simply looks to see the price change from beginning to end, not what happened in the middle.
All values above 1.0 indicate that a stock has outperformed the input stock, where any value below 1.0 indicates underperformance. Examples
Show stocks where the comparative relative strength(^IXIC,30) is above 1.25
Show stocks where the comparative relative strength(IBM,60) is below 0.75

Chapter 3. Indicators and Measures
49
Day Change / Absolute Day Change Parameters
none Usage
Day Change Absolute Day Change
Description This is a simple measure of the difference (in percent) of the most recent closing prices of a stock. The absolute day change disregards the sign of the change, so the results indicate the magnitude of the change. Examples
Day Change is above 10 percent
Absolute Day Change is above 10 percent
Day Change 10 week high is above 20 percent
Absolute Day Change 5 day low is above 5 percent

StockFetcher Usage Guide
50
Day Position Parameters
Position (Value from 0 to 1 indicating position) Period
Usage
Day Position(Position,Period) Day Pos(Position,Period)
Description The Day Position is a basic measure that computes a value that is a percentage of the day range. In other words, if the position parameter is 0.5, the Day Position will be Low + ((High - Low) * 0.5). Any value from 0 to 1 may be used to locate a position within the daily range. In addition to computing this value over a single day, an optional second parameter may be specified. The second parameter is used in creating an average day position. The average day position will find the highest high and lowest low over the given number of days and then perform the same computation as above. Examples
Close is above Day Position(0.50)
Open is below the Day Position(0.25,5)
Chapter 3. Indicators and Measures
51
Day Range / Average Day Range / Day Point Range Parameters
Period
Usage
Day Range Average Day Range(Period) Day Point Range
Description The Day Range returns the difference between the high and low prices of the day, represented as a percent of the closing value. For example, suppose a stock closed at 10, the high was 11 and the low was 9. The difference between the high and low is 2. Represented as a percent, the day range is 20%. The average day range computes a simple average of the day range over a given number of days. This value is also represented as a percent of the closing price. Finally, the day point range is the actual price difference between the high and low of the day. The day point range is not converted to a percent. Examples
show stocks where the day range is above 10%
show stocks where the average day range(10) has been increasing for 2 days
show stocks where the day point range is above 1.00

StockFetcher Usage Guide
52
Detrended Price Oscillator (DPO) Parameters
Period Usage
Detrended Price Oscillator(Period) DPO(Period)
Description The Detrended Price Oscillator (DPO) computes the difference between the current closing value of a stock and a specified moving average. The basic idea behind the DPO is to detect cycles in stocks as opposed to trends. Examples
show stocks where the DPO(20) crossed below 0 within the last 1 day
show stocks where the DPO(50) has been increasing for 5 days
See Also Absolute Price Oscillator, Percent Price Oscillator

Chapter 3. Indicators and Measures
53
Directional Movement Indicators +DI, -DI, ADX Parameters
Period Usage
+DI(Period) -DI(Period) ADX(Period) DI(Period) Difference
Description The Directional Movement indicators are actually used as a system to detect trends within a stock, typically used for determining entry and exit points. Developed by Welles Wilder [Wilder 1978], a buy signal is determined by the +DI rising above the -DI; afterwards, once the +DI falls below the -DI, then a sell signal is generated. Additional interpretations involve using crossover of the +DI and -DI to verify the buy or sell signal. The DI Difference measure subtracts the -DI(n) from the +DI(n). This can be used to find trends in the difference between the +DI and -DI, as well as discovering convergence or divergence between the two values. Examples
+DI(14) crossed above the -DI(14)
-DI(14) crossed below the +DI(14)
ADX(14) increasing for 4 days
DI(14) Difference has been increasing for 5 days and the DI(14) Difference is above 0

StockFetcher Usage Guide
54
Donchian Channels (Upper/Lower/Middle) Parameters
Period – Number of days used to compute channels Lag – Offset used in computing the high and low for the channels
Usage
Upper Donchian Band(Period, Lag) Lower Donchian Band(Period, Lag) Middle Donchian Band(Period, Lag)
Description Donchian Channels, created by Richard Donchian [Donchian ???], are envelopes around the price based on the highest and lowest prices during the given number of days. The center band is computed by taking the average of the upper and lower band. These bands can be used to find potential areas of support and resistance based on recent price activity. StockFetcher allows a second parameter to the Donchian Channels that indicates a lag or offset used in the computation. This lag is used to offset the period of time for finding the highest and lowest values. For example if “5” is used as the lag parameter and “20” is used as the period, then the highest and lowest values are discovered from the 20 days of history which started 5 days in the past. When lag is used, it is possible to have recent price values which exceed the upper or lower band. Without lag, the Donchian Channels will always contain all of the prices within the specified period. Examples
Show stocks where the close crossed above the middle Donchian Band(20,0)
Show stocks where the low is above the upper Donchian Band(15,10)

Chapter 3. Indicators and Measures
55
ERSI Parameters
RSI Period EMA Period
Usage
ERSI(15,7) Description The ERSI uses the values from an exponential moving average (EMA) as input to the RSI computation. On StockFetcher, the first parameter of the ERSI represents the period used for the RSI computation and the second parameter is the period of the EMA used as input. By using EMA values as input, the ERSI will be less volatile than the standard RSI. Examples
Show stocks where the ERSI(15,7) is below 30

StockFetcher Usage Guide
56
Ease of Movement (EMV) Parameters
Period MAPeriod – Period used for smoothed version of EMV.
Usage
Ease of Movement(Period, MAPeriod) EMV(Period, MAPeriod) Average Ease of Movement(Period, MAPeriod) Avg EMV(Period, MAPeriod)
Description Developed by R.W. Arms, Jr. [Arms 1993], the ease of movement indicator combines both price and volume to gauge the ability of a stock’s price to move. This is achieved by combining price changes along with the volume involved in the price changes. The EMV is an oscillator centered at zero. When near zero, the EMV indicates that either the price is not moving or heavy volume is necessary to make significant price changes. Values above 0 tend to indicate the price is increasing on lighter than average volume, low EMV values indicate dropping prices on slow volume. Examples
Show stocks where the EMV(14,9) reached a new 52 week low
Show stocks where the EMV(14,9) is above 0 and the EMV(14,9) crossed above the Average EMV(14,9)

Chapter 3. Indicators and Measures
57
Ergodic Candlestick Oscillator (ECO) Parameters
Period1 – period used for averaging the day change and day range
Period2 – Period for the EMA Usage
ECO(10,5) Description Developed by William Blau, the Ergodic Candlestick Oscillator examines the average ratio of the day change versus the day's trading range. An n-day EMA of the close to open change is divided by an n-day EMA of the difference between the high and low. This ratio is then smoothed by a m-day EMA. There are two parameters used with the ECO on StockFetcher. The first indicates the period used for averaging the day change and day range. The second period specifies the period for the EMA used on the ratio of the day change and range. The basic idea behind this measure is that in cases where the stock is making positive net changes on large trading ranges, the ECO values will be positive. In cases where the stock is trading lower each day, the ECO will be negative. Examples
show stocks where the ECO(5,5) reached a new 6 week low and ECO(5,5) is below 0

StockFetcher Usage Guide
58
Fibonacci Retracement Lines Parameters
Period MinDays (minimum length of pattern) Label (toggle the labels displayed on resulting charts)
Usage
Fibonacci Down(Period, MinDays, Label) Fibonacci Up(Period MinDays, Label)
Description The Fibonacci retracements are ranges computed from the high and low prices over a given period of time. The actual lines that are drawn are specific percent retracements from the given high or low. Investors primarily look at 3 different lines (0.382, 0.50, 0.618), which are based on the formula for the Fibonacci sequence. The Fibonacci retracement lines can be based on a relative low or high price. The actual target values are computed by taking a percent change from the relative low or high price. By specifying Fibonacci Down on StockFetcher, you are referring to the retracement lines drawn after a recent swing low. All of the values will be relative to how much the stock has recovered from the recent low. For the Fibonacci Up, the values are based upon a recent run-up in the stock price. Again, the actual values refer to the amount the stock has moved to return to the recent low. Below is an example of the Fibonacci Down screen: [Fibonacci chart] The actual values returned by StockFetcher are computed from the most recent close in reference to the recent high or low. In the example above, the value returned by the screen would be near 0.382 (the most recent close is very near the 0.382 Fibonacci band.)
When specifying the Fibonacci Up, the values returned will be reversed from the Fibonacci Down. So a filter scanning for crossed above in the Fibonacci Up case will actually result in a downward price move.
StockFetcher permits several parameters with the Fibonacci retracements. Period - The first parameter is the length of time used to look for the up-trend or down-trend. So, a value of 65 will search over the last 3 months to look for the trend. MinDays - The second parameter is the minimum number of days for the trend to occur. For example, if you specify 15 days here, that means the distance between the high and low must be at least 15 days. Label - Finally, by setting the third or last parameter to 0, you can eliminate the labels that are seen on the charts; this may help to clear up your chart if needed.

Chapter 3. Indicators and Measures
59
Examples
show stocks where the Fibonacci Down(65,10) is near 0.618
show stocks where the Fibonacci Up(135,20) is near 0.50
show stocks where the Fibonacci Down(65,10) crossed above 0.382 and Fibonacci Down(65,10) is below 0.50

StockFetcher Usage Guide
60
Force Index Parameters
Period
Usage
Force Index(Period) FI(Period)
Description The Force Index, developed by Alexander Elder [Elder 1993], is a trend indicator that attempts to determine the current buying and selling activity in a stock. Values above 0 indicate a current buying trend, while values below 0 indicate a sell-off. The Force Index is computed from both the change in closing prices along with the number of shares traded. Popular interpretations of the Force Index involve 2 or 13-day Force Index values, along with price divergences or positive or negative trends. Examples
show stocks where the FI(2) 3 days ago was below 0 and the FI(2) has been decreasing for 3 days
show stocks where the FI(13) has been increasing for 4 days and the EMA(25) has been decreasing for 4 days

Chapter 3. Indicators and Measures
61
Inertia Parameters
RS Period Standard Deviation Period Linear Regression Indicator Period
Usage
Intraday Intensity(RS Period, Standard Deviation Period, Linear Regression Period) Description Developed by Donald Dorsey [[[REF]]], the Inertia measure is an extension of the Relative Volatility Index (RVI). Inertia uses output from the RVI as the input to the formula for the linear regression indicator. Each point of the Inertia measure is the n-day linear regression value of the RVI. The basic idea behind this measure is that the Inertia will indicate how much weight the stock is carrying in it's current direction of motion. Three parameters are used with the Inertia measure on StockFetcher. The first two are the input parameters for the RVI measure. The third period is the number of days used in computing the linear regression of the RVI measure. As with the RVI and RSI the Inertia results range between 0 and 100. Examples
Inertia(14,10,20) is above 50 and Inertia(14,10,20) has reached a new 6 week high

StockFetcher Usage Guide
62
Intraday Intensity Parameters
Period
Usage
Intraday Intensity(Period) Description The Intraday Intensity computes the position of the closing price with respect to the high and low of the day. This value is then weighted by the daily volume for each day within the period. Examples
Intraday intensity(21) has been increasing for 5 days
Intraday intensity(21) crossed above 0

Chapter 3. Indicators and Measures
63
Intraday Momentum Index (IMI) Parameters
Period
Usage
IMI(Period) Description The Intraday Momentum Index (IMI) is the same formula as the Relative Strength Index (RSI), except intraday differences are used as input. In otherwords, while the RSI uses the day-to-day change as input, the IMI uses the difference between the high and low values for the day. The IMI was designed by Tushar Chande. The only parameter used with the IMI on StockFetcher is the period. The period is used within the RSI-based formula. Additionally, the results from the IMI measure are scaled between 0 and 100. Examples
show stocks where the IMI(14) is below 30
show stocks where the IMI(14) is above 70 and the IMI(14) crossed below the CMA(IMI(14),5)

StockFetcher Usage Guide
64
Inverse Fisher Transform (IFT) Parameters
RSIPeriod Weighted MA Period
Usage
Inverse Fisher Transform(RSIPeriod, Weighted MA Period) Inverse Fisher(RSIPeriod, Weighted MA Period) IFT(RSIPeriod, Weighted MA Period)
Description Developed by John Ehlers, the RSI-based inverse Fisher Transform is used to help clearly define trigger points. First, a specified length RSI is computed and adjusted so that the values are centered around zero. The inverse transform is then applied to these values. The inverse transform is effectively:
e^(2x) - 1 ---------- e^(2x) + 1
The author then recommends smoothing this value using a weighted moving average. StockFetcher smoothes this value using a weighted simple moving average of the length specified in the second parameter. Resulting values range between 1.0 and -1.0 with bullish triggers occurring at crossovers of -0.5 and bearish triggers of 0.5. Examples
show stocks where IFT(5,9) crossed above -0.5 and IFT(5,9) 1 day ago had been below -0.5 for the last 2 weeks
show stocks where IFT(5,9) crossed below 0.5 and IFT(5,9) 1 day ago had been above 0.5 for the last 2 weeks and IFT(5,9) 2 week high is above 0.950

Chapter 3. Indicators and Measures
65
Historical Volatility Parameters Period (number of days used to compute the measure) TradingPeriod (1=days, 7=weeks) Usage Historical Volatility(Period, TradingPeriod) Description Historical volatility uses the standard deviation of a stock’s price to measure the volatility of the stock. Additionally, historical volatility is often expressed in daily, weekly or monthly terms. Examples
Show stocks where the Historical Volatility(100,1) is below 10

StockFetcher Usage Guide
66
KST Parameters
none Usage
KST Daily SMA KST Monthly SMA KST Intermediate SMA KST Intermediate EMA KST Long EMA KST Weekly EMA
Description The KST system is a set of momentum indicators developed by Martin Pring [Pring 1992]. Each individual KST option is composed of the sum of four smoothed rate of change values, with different options for the smoothing as well as the rate of change parameters. Using the different KST lengths, these momentum indicators are useful for determining potential entry and exit points. Examples
KST Daily SMA is above 0
KST Monthly SMA has been increasing for 3 days
KST Long EMA has been decreasing for 2 days
KST Weekly EMA crossed below 0

Chapter 3. Indicators and Measures
67
Keltner Channels Parameters
Period Usage
Upper Keltner Band(Period) Lower Keltner Band(Period) Center Keltner Band(Period)
Description Originally described in Perry Kaufman's book: The New Commodity Trading System and Method [Kaufman 1987] and designed by Chester W. Keltner, the Keltner Channels provide a Bollinger Band-like envelope around the price. These bands are then used to determine potential support and resistance levels for the price of the stock. Examples
Close is above the Upper Keltner Band(10)
Close is below the Lower Keltner Band(10)
Low crossed above the Upper Keltner Band(10) within the last 1 day

StockFetcher Usage Guide
68
Linear Regression Channels Parameters
Period Width (value from 0 to 1 representing the width of the channel)
Usage
Center Linear Regression Line(Period, Width) Top Linear Regression Line(Period, Width) Bottom Linear Regression Line(Period, Width)
Description The Linear Regression is built by computing a least-squares line over the specified last number of days. This line represents an expectation of where the price should be. To create the linear regression channels, we use the popular method of finding the point furthest from the least squares line and create two channels of equal width from that point. StockFetcher allows you to customize the width of the channel through a scaling factor, accessed via the second parameter of this measure. By entering a scaling factor of 0.50, a channel of half the normal width is created. Examples
Price is near the center linear regression line(45)
High is more than 1 percent above the top linear regression line(60,1.25)
MA(50) crossed above the center linear regression line(50) within the last 1 day
Chapter 3. Indicators and Measures
69
Linear Regression Indicator Parameters
Period Usage
Linear Regression(Period) Indicator LRI(Period)
Description The Linear Regression Indicator uses the end points of successive linear regression lines to create a "moving average"-like measure. The period specifies how many days are used to compute the linear regression. Examples
Linear Regression(10) Indicator crossed above the EMA(10)
lri(10) reached a new 1 year high

StockFetcher Usage Guide
70
Linear Regression Slope Parameters
Period Usage
Linear Regression(Period) Slope LRS(Period)
Description The Linear Regression Slope indicator computes and returns the slope of the linear regression line. The period is the number of days that are specified to compute the linear regression. The linear regression slope can be used to determine when there is possibly a change in trend. Any linear regression slope below 0 indicates that the price of the stock over the specified period has been in a downturn. Conversely, values above 0 indicate a stock in an up-trend. Examples
linear regression(10) slope reached a new 6 month high
linear regression(10) slope crossed below 0 within the last 1 day

Chapter 3. Indicators and Measures
71
MACD (Moving Average Convergence Divergence) Parameters
FastPeriod (Period of Fast EMA) SlowPeriod (Period of Slow EMA) AvgPeriod (Period used in compute EMA of difference)
Usage
MACD Slow Line(FastPeriod, SlowPeriod, AvgPeriod) MACD Fast Line(FastPeriod, SlowPeriod, AvgPeriod) MACD Histogram(FastPeriod, SlowPeriod, AvgPeriod)
Description Originally developed by Gerald Appel [Appel 1979], the MACD is a momentum oscillator employing two exponential moving averages. To create the MACD, the difference of the two moving averages is plotted as the primary plot. A secondary plot-line is generated which is a moving average of the initial, or primary plot. The secondary plot-line is a slow version of the primary value, and typically buy or sell signals are generated when a crossover between these two lines occur. A third bar chart is often displayed with the MACD that is the difference between the first two lines. This histogram provides insight into the magnitude of separation between the two lines. Examples
MACD Fast Line(12,26) crossed above the MACD Slow Line(12,26)
MACD Fast Line(12,26) crossed below the MACD Slow Line(12,26) and the MACD Histogram(12,26) has been increasing for 2 days

StockFetcher Usage Guide
72
MACD (Volume Weighted) Parameters
FastPeriod (Period of Fast EMA) SlowPeriod (Period of Slow EMA) AvgPeriod (Period used in compute EMA of difference)
Usage
VWMACD Fast Line(FastPeriod, SlowPeriod, AvgPeriod) VWMACD Slow Line(FastPeriod, SlowPeriod, AvgPeriod) VWMACD Histogram(FastPeriod, SlowPeriod, AvgPeriod)
Description The volume weighted MACD is computed in the exact same fashion as the standard MACD (Moving average convergence/divergence) [Appel 1979] except the Volume Weighted MACD uses volume weighted moving averages as opposed to exponential moving averages. To generate the signal (or fast line), the difference is computed between the fast and slow moving average. The slow line is then computed by taking an n-day exponential moving average of the raw signal. Finally, the VWMACD Histogram is the difference between the fast and slow lines. Examples
VWMACD Fast Line(12,26,9) crossed above the VWMACD Slow Line(12,26,9)]
VWMACD Histogram(12,26,9) has been increasing for 15 days
VWMACD Slow line(12,26,9) crossed above 0 within the last 1 day

Chapter 3. Indicators and Measures
73
Mass Index Parameters
Period EMAPeriod (Period used to create an EMA of the raw signal)
Usage
Mass Index(Period, EMAPeriod)
Description Developed by Donald Dorsey [Dorsey 1992] , the Mass Index is used to discover trend reversals. The Mass Index analyzes the distances between the high and low prices and as the range changes, the Mass Index follows accordingly. Combined with a short-term moving average, "bulges" of the Mass Index are used to determine possible reversals. One popular approach for detecting reversals involves the Mass Index(25) rising above 27 and then falling below 26.5. Examples
Mass Index(25) crossed below 26.5
Mass Index(25) crossed below 26.5 and the Mass Index(25) has been decreasing for 3 days

StockFetcher Usage Guide
74
Momentum Parameters
Period
Usage
Momentum(Period) Description The standard Momentum measure is computed by finding the rate of change of the price and representing that information as a ratio. This is also considered a price velocity measure. Examples
show stocks where the momentum(12) has reached a new 6 month high
show stocks where the momentum(24) has been increasing for 4 days

Chapter 3. Indicators and Measures
75
Money Flow Index Parameters
Period Usage
Money Flow Index(Period) MFI(Period)
Description The Money Flow Index (MFI) [TAS&C 1994] uses both the price and volume to represent the amount of cash that is flowing in and out of a stock. Scaled from 0 to 100, typical oversold levels are considered to be at or below an MFI of 20, while values above 80 may indicate an overbought condition. Additionally, since the MFI takes volume into account, the direction of the MFI is often compared with the price movement. Examples
Show stocks where the MFI(15) is below 20
Show stocks where the MFI(14) has been increasing for 4 days and the close has been decreasing for 4 days

StockFetcher Usage Guide
76
Moving Average (Displaced) Parameters
Period Displacement (Number of days to displace the average)
Usage
DMA(Period, +/- Displacement) Description The Displaced Moving Average (DMA) is a simple moving average shifted forward or backward in time by a specified number of days. The two parameters associated with the DMA include the length of the moving average along with the number of days this average should be shifted. A positive displacement number indicates that the moving average values are projected forward, while a negative displacement indicates the values are moved backwards in time. Examples
show stocks where the MA(50) crossed above the DMA(50,-5)
show stocks where the DMA(50,10) has been increasing for 5 days and the MA(50) has been decreasing for 5 days

Chapter 3. Indicators and Measures
77
Moving Average (Exponential) Parameters
Period Usage
EMA(Period) Description Similar to the Simple Moving Average (SMA), the Exponential Moving Average (EMA) computes the average share price of a stock; however, instead of computing a simple average, the exponential moving average uses previous EMA values along with a smoothing factor to compute the average price. Examples
EMA(15) crossed below EMA(50)
Price crossed above the EMA(10) and the EMA(10) is below the EMA(50)

StockFetcher Usage Guide
78
Moving Average (Simple) Parameters
Period Usage
Moving Average(Period) MA(Period)
Description The Simple Moving Average (SMA or MA) uses the specified number of days to compute the average share price for a given stock. This measure is typically used to indicate the position of a stock relative to its recent history. Examples
MA(10) crossed above MA(50)
Price crossed below the MA(30)

Chapter 3. Indicators and Measures
79
Moving Average (Volume Weighted) Parameters
Period Usage
Volume Weighted Moving Average(Period) VMA(Period)
Description The Volume Weighted Moving Average takes a standard, simple moving average and employs the daily volume as a weighting mechanism. The end effect from introducing the volume is a moving average that responds to combination of both spikes and lulls in trading activity and price levels. Examples
VMA(50) is more than 5 percent below the MA(50)
VMA(50) has been increasing for 5 days
VMA(20) crossed above the MA(20) within the last 1 day

StockFetcher Usage Guide
80
Moving Average Envelopes Parameters
UPeriod (Days used for upper envelope band) UOffset (Percent offset for the upper band) LPeriod (Days used for lower envelope band) LOffset (Percent offset for the lower band)
Usage
Upper EMA Envelope(UPeriod, UOffset, LPeriod, LOffset) Lower EMA Envelope(UPeriod, UOffset, LPeriod, LOffset) Upper SMA Envelope(UPeriod, UOffset, LPeriod, LOffset) Lower SMA Envelope(UPeriod, UOffset, LPeriod, LOffset)
Description Similar to Bollinger bands, the Moving Average Envelopes produce upper and lower bounds, assisting in gauging the current activity of a stock. Moving average envelopes on StockFetcher may be created using either exponential moving averages or simple moving averages. Additionally, the width of the envelopes may be fully customized. The first parameter of the envelopes is the period of the moving average and the second parameter indicates the offset (as a percent) from the moving average for each band. StockFetcher also allows for further customization of the envelopes by specifying the period and offsets for both the upper and lower bands. If used, the third and fourth parameters specify the period and offset used for the lower band. Examples
show stocks where the close is above the upper EMA envelope(25,6.0)
show stocks where the high is below the MA(20) and low is above the lower MA envelope(25,3.0)

Chapter 3. Indicators and Measures
81
Negative Volume Index (NVI) Parameters
none Usage
Negative Volume Index NVI
Description Examples

StockFetcher Usage Guide
82
Positive Volume Index (PVI) Parameters
none Usage
Positive Volume Index PVI
Description Examples

Chapter 3. Indicators and Measures
83
On Balance Volume(OBV) Parameters
none Usage
OBV Description On Balance Volume [Granville 1976] uses volume on up and down days as a momentum indicator for a stock. A cumulative momentum indicator, the On Balance Volume adds the daily volume on a day where the stock closes up and subtracts the daily volume on days when the stock closes down. Because the OBV is not normalized from one stock to another, typical interpretations analyze the slope to determine potential momentum changes. Examples
OBV has been increasing for 3 days
OBV has been decreasing for 5 days lag 2 and OBV has been increasing for 2 days

StockFetcher Usage Guide
84
Open, High, Low, Close Parameters
none Description
Represents the basic daily price components of a stock. Examples
Close is between 15 and 40
High is above 50
Open is above close
Low is between 12 and 21
Chapter 3. Indicators and Measures
85
Optionable Parameters
none
Usage
stock is optionable stock is not optionable
Description This action word is a fundamental parameter indicating whether or not a given ticker symbol is listed as an optionable stock on the Chicago Board of Exchange. This does not necessarily return the ticker symbol that is used on the CBOE, but the actual stock ticker symbol. Examples
Select stocks between 10 and 50 and stocks are optionable
Select stocks above 25 and stocks are not optionable

StockFetcher Usage Guide
86
P/E Ratio Parameters
none
Usage PE Ratio
Description Fundamental measure based on the price to earnings ratio of the company. The P/E Ratio may not be available for all stocks carried on StockFetcher. Examples
MA(10) crossed above MA(50) within the last 2 days and PE Ratio below 20
High is above the upper bollinger band(20) and PE Ratio is above 50

Chapter 3. Indicators and Measures
87
Parabolic SAR Parameters MinStep – Minimum step size used (default 0.02). MaxStep – Maximum step size used (default 0.20). Usage
Parabolic SAR Parabolic SAR(MinStep, MaxStep)
Description Typically used to determine stop points for trades, the Parabolic SAR [Wilder 1978] forms a band either above or below the current price of a stock, depending on cumulative price movement. The Parabolic SAR was not designed to be used as a method for discovering entry points, but rather the SAR is intended as a method of trailing the stock and setting exit or stop points. Examples
price between 10 and 50 and the Parabolic SAR has been increasing for 5 days
Parabolic SAR has been decreasing for 7 days

StockFetcher Usage Guide
88
Percent Price Oscillator (PPO) Parameters
Period1 Period2
Usage
Percent Price Oscillator(Period1, Period2) PPO(Period1, Period2)
Description The Percent Price Oscillator (PPO) is computed by taking the difference between two specified moving averages. Typical use for the PPO is to detect potential trends in stocks. Examples
show stocks where the PPO(10,50) crossed above 0 within the last 1 day
show stocks where the PPO(10,100) has been increasing for 10 days

Chapter 3. Indicators and Measures
89
Percent Volume Oscillator (PPO) Parameters
Period1 Period2
Usage
Percent Volume Oscillator(Period1, Period2) PVO(Period1, Period2)
Description The Percent Volume Oscillator (PVO) computes the difference between two average volume measures. This difference is then converted to a percent by dividing the result by the value from the second average volume specified. Examples
show stocks where the PVO(10,50) crossed above 0 within the last 1 day
show stocks where the PVO(10,100) has been increasing for 10 days

StockFetcher Usage Guide
90
Pivot Points Parameters none Usage
PP R1 S1 R2 S2
Description These are standard support and resistance pivot point values. Below are the formulas used: PP = (High + Low + Close) / 3.0 S1 = 2 * PP - High R1 = 2 * PP - Low S2 = PP - (High - Low) R2 = PP + (High - Low) When referring to these values, use the days ago syntax to calculate current position based on a previous value. Examples
show stocks where the High is above the R2 1 day ago
show stocks where the close is more than 10% above the R1 1 day ago
show stocks where the High 1 day ago is above the R2 2 days ago

Chapter 3. Indicators and Measures
91
Price and Volume Trend (PVT) Parameters
Period
Usage
PVT Average PVT(Period)
Description Similar to On-Balance-Volume(OBV) the Price and Volume Trend (PVT) uses the volume to indicate possible trend changes. The PVT differs from the OBV in that the change in price is used to scale the volume. The PVT also includes an optional average line that is an n-day EMA of the PVT signal. This can be used to find cases where the raw PVT has crossed above a particular average, possibly signaling a change in trend. Examples
Show stocks where the PVT has reached a new 6 month high
Show stocks where the PVT has been decreasing for 5 days
Show stocks where the PVT(20) crossed above the Average PVT(20) within the last 1 day
See Also On-Balance Volume (OBV)
StockFetcher Usage Guide
92
Projection Bands (Upper/Lower) Parameters
Period Usage
Upper Projection Band(Period) Lower Projection Band(Period)
Description Similar in purpose to Bollinger bands, the Projection Bands, developed by M. Widner [Widner 1995], use the slope of the linear regression line along with recent highs and lows to establish price boundaries. Due to the algorithm, the price will never cross the upper or lower band, but a move towards the upper band may indicate a negative correction coming, while a move near the lower may present a bullish opportunity. Examples
show stocks where the close is less than 0.1% below the upper projection band(14)
show stocks where the close is less than 1% above the lower projection band(14) and the close has been increasing for 1 day

Chapter 3. Indicators and Measures
93
Projection Oscillator Parameters
Period Usage
Projection Oscillator(Period) Description The Projection Oscillator developed by M. Widner [Widner 1995] measures the distance of the closing value within the current Projection Bands. When the close is near or approaching 0, that translates to a close that is near the lower projection band. A value near or approaching 100 indicates the close is approaching the upper projection band. The projection oscillator is useful to screen for stocks that are moving close to either the upper or lower projection band. The valid range for this measure is 0-100. Examples
show stocks where the projection oscillator(14) crossed below 20 within the last 1 day and draw the projection bands(14)
show stocks where the projection oscillator(14) crossed above 80 within the last 1 day and low is above the linear regression indicator(14) and draw projection bands(14)

StockFetcher Usage Guide
94
QStick Parameters
Period EMA Period
Usage
QStick(Period) QStick(Period, EMA Period) QStick EMA(Period, EMA Period)
Description Developed by Tushar Chande, the QStick indicator measures an average of the distance between the open and close over a given period. By measuring the open and close, the QStick provides insight into the price candlesticks over the given period and whether a majority are filled or unfilled. Along with the raw QStick measure is a smoothed version of the signal. StockFetcher uses an EMA of the QStick as this smoothed value. Two parameters are used with the QStick. The first parameter is the period of time used to compute average of the difference between the open and close. The second parameter is the period used for the smoothing EMA of the raw QStick signal. Examples
show stocks where the QStick(12) crossed above 0
show stocks where the QStick(12,25) EMA reached a new 6 week high
show stocks where the 20 day slope of the QStick(8) is above 0 and the 20 day slope of the close is below 0

Chapter 3. Indicators and Measures
95
Relative Strength Indicator (RSI) Parameters
Period Usage
RSI(Period) Smoothed RSI(Period) ERSI(RSIPeriod, EMAPeriod)
Description Developed by J.Welles Wilder in 1978 [Wilder 1978], the RSI is an oscillator that is used to track the momentum of the stock price. Unlike other relative strength measures, the RSI compares the price of the stock relative to the actual stock, not against other stocks or indices. The basic premise of the RSI is that an advancing stock will trend close to the high of the day, while a declining stock will trend toward the low. Common interpretations of the RSI use values below 30 as buy signals and values above 70 as sell, or overbought signals. The smoothed RSI is a variation where a smoothing or slowing factor is applied to the RSI removing some of the "jaggedness" of the original signal. The ERSI uses the values from an exponential moving average (EMA) as input to the RSI computation. On StockFetcher, the first parameter of the ERSI represents the period used for the RSI computation and the second parameter is the period of the EMA used as input. By using EMA values as input, the ERSI will be less volatile than the standard RSI. Examples
find stocks where the RSI(15) is below 30
find stocks where the RSI(15) 2 days ago had been decreasing for 3 days and the RSI(15)
has been increasing for the last 2 days and the RSI(15) is below 40
show stocks where the ERSI(15,9) crossed below 30

StockFetcher Usage Guide
96
Relative Volatility Index (RVI) Parameters
RS Period Standard Deviation Period
Usage
RVI(RS Period, Standard Deviation Period) Description Developed by Donald Dorsey [Technical Analysis of Stocks and Commodities; June 1993], the Relative Volatility Index (RVI) is a spin-off of the Relative Strength Index (RSI) except it is used to measure volatility. The RVI takes advantage of the RSI calculation, but for input uses an n-day standard deviation of the closing prices, instead of a net day-to-day change. As the RSI uses the net change based on "up" and "down" days, the RVI adds the standard deviation for each "up" and "down" day. On StockFetcher, the first parameter to the RVI is the period used in the RSI-like computation. The second parameter is the number of days used to compute the standard deviation. The resulting values, as with the RSI, range from 0 to 100. Examples
RVI(14,10) crossed above 40
RVI(14,10) crossed below 60 and RVI(14,10) 1 day ago was above 60 for the last 5 days
Chapter 3. Indicators and Measures
97
Smoothed Rate of Change Parameters
EMAPeriod (Period of the exponential moving average) ROCPeriod (Period of the rate of change)
Usage
Smoothed Rate of Change(EMAPeriod, ROCPeriod) SmROC(EMAPeriod, ROCPeriod)
Description Developed by Fred G. Schutzman [Schutzman 1991], the smoothed rate of change is different from the typical rate of change by using an EMA as opposed to closing values for computing the rate of change. By using the Exponential Moving Average (EMA), as opposed to price, the resulting Rate of Change signal does not succumb to rapid changes triggered by the price. Examples
Smoothed Rate of Change crossed above 100 within the last 1 day
SmROC(13,21) has been decreasing for 10 days
SmROC(13,21) has reached a new 26 week high

StockFetcher Usage Guide
98
Standard Deviation Parameters Period (Number of days used to compute the standard deviation) MAPeriod (smoothing factor for average of standard deviation) Usage Standard Deviation(Period, MAPeriod) Average Standard Deviation(Period, MAPeriod) Normalized Standard Deviation(Period, MAPeriod) Average Normalized Standard Deviation(Period, MAPeriod) Description The standard deviation is a statistical measure that quantifies the amount of variation between a set of values. The standard deviation outlined in this section uses the common formula with price information as the input. Thus, this measure will attempt to provide results indicating how much, on average, the price of the stock is varying over the given period of time. In addition to the basic standard deviation, StockFetcher has a normalized version that attempts to provide results conforming to the same range of values. The normalized values are computed by dividing the standard deviation by the n-day moving average. The first parameter to both of these measures specifies the number of days (or weeks) used to compute the standard deviation. The second parameter is used to create a simple moving average of the raw standard deviation value. Both of these measures are drawn in the same plot and can be used to detect cases where the recent standard deviation has moved away from the mean. Examples
Show stocks where the standard deviation(15) has reached a 6 week high
Show stocks where the standard deviation(20,10) crossed above the average standard deviation(20,10)
Show stocks where the normalize standard deviation(25) is above 0.05

Chapter 3. Indicators and Measures
99
StochRSI Parameters
Period (Period for computing the stochastic value) RSIPeriod (Days used for the RSI)
Usage
StochRSI(Period, RSIPeriod) Description The StochRSI is an oscillator similar in computation to the stochastic measure, except instead of price values as input, the StochRSI uses RSI values. The StochRSI computes the current position of the RSI relative to the high and low RSI values over a specified number of days. The intent of this measure, designed by Tushard Chande and Stanley Kroll [Chande and Kroll 1994], is to provide further information about the overbought/oversold nature of the RSI. The StochRSI ranges between 0.0 and 1.0. Values above 0.8 are generally seen to identify overbought levels and values below 0.2 are considered to indicate oversold conditions. Examples
show stocks where the StochRSI(14,14) is below 0.2 and draw RSI(14)
show stocks where the StochRSI(14,14) crossed below 0.50

StockFetcher Usage Guide
100
Stochastic Momentum Index (SMI) Parameters
KPeriod (Number of days used to compute raw %K, or fast line) DPeriod (Smoothing period applied to the raw %K line) MAPeriod (Additional smoothing period)
Usage
Stochastic Momentum(KPeriod, DPeriod, MAPeriod) SMI(KPeriod, DPeriod, MAPeriod)
Description The Stochastic Momentum Index, developed by William Blau [Blau 1993] varies slightly from the standard stochastic measure in that the closing values are compared with the average of the extreme highs and lows, as opposed to the high value. The three periods used in this measure are the period of the %K line, the period of the %D line and then a smoothing period. See the definition of Stochastics on the following page for more information about how the %K and %D lines are derived. Examples
Stochastic Momentum(5,3,1) crossed above 0 within the last 1 day
SMI(25,13,2) crossed reached a new 5 week high

Chapter 3. Indicators and Measures
101
Stochastics, Double Parameters
Period (Period for the stochastic computation.) EMAPeriod (Period of the EMA used in the smotthing process.)
Usage
Double Stochastic(Period, EMAPeriod) Description A variation of the standard stochastic oscillator, the double stochastic is computed through a two step process. First, the standard stochastic oscillator is computed (see Stochastics, Fast/Slow/Full). Then, an n-day exponential moving average (EMA) of the stochastic oscillator is fed back into the stochastic computation. Finally, one more EMA is taken of the resulting values. Examples
Show stocks where the Double Stochastic(10,3) is below 20

StockFetcher Usage Guide
102
Stochastics, Fast/Slow/Full Parameters
KPeriod (Number of days for the %K or fast line) DPeriod (Smoothing period for creating slow %D line) FSPeriod (Additional %K smoothing used in Full Stochastic)
Usage
Fast Stochastic(KPeriod, DPeriod) Fast %K Fast Stochastic(KPeriod, DPeriod) Slow %D Slow Stochastic(KPeriod, DPeriod) Fast %K Slow Stochastic(KPeriod, DPeriod) Slow %D Stochastic(KPeriod, DPeriod, FSPeriod) %D Stochastic(KPeriod, DPeriod, FSPeriod) %K
Description A popular oscillator for detecting oversold/overbought conditions, the Fast and Slow Stochastics uses recent extreme highs and lows, over the specified last days, in relation to the most recent close to determine these conditions. The Stochastic Oscillator was developed by George Lane as documented in Steve Achelis’ Technical Analysis from A to Z. [Achelis 2001]. The two components of either the Fast Stochastic or the Slow Stochastic are the %K and the %D. The %K, or fast signal, examines the difference between the most recent close and the extreme low versus the difference between the extreme high and low over the specified period. The %D, or slow line, is a moving average of the %K line. The difference between the Fast Stochastic and the Slow Stochastic depends on a slowing factor. The slowing factor, usually 3, is applied to the %K to smooth, or slow down, the signal down. StockFetcher also provides a version of the Stochastic Oscillator where you can specify the additional smoothing that is applied to initial %K. As indicated above, the “Fast Stochastic” does not use additional smoothing, while the “Slow Stochastic” uses a 3-period smoothing. With the Full Stochastic, the %K smoothing is controlled by an third parameter. Common buy interpretations of the stochastic oscillator involves watching when one of the lines falls below 20 and then rises above that value. Another popular method involves buying when the faster %K line rises above the slower %D and then selling on the next crossover (%K falls back below the %D.) Examples
Slow Stochastic(10) Fast %K is below 20
Fast Stochastic(10) Fast %K crossed above the Fast Stochastic(10) Slow %D

Chapter 3. Indicators and Measures
103
Fast Stochastic(10) Fast %K has been decreasing for 3 days lag 2 days and Fast
Stochastic(10) Fast %K has been increasing for 2 days and the Fast Stochastic Fast %K is below 20.
Stochastic(10,5,3) %K crossed above Stochastic(10,5,3) %D

StockFetcher Usage Guide
104
T3 Moving Average (T3) Parameters
Period Damping Coefficient
Usage
T3(period, damping coefficient) Description Developed by Tim Tillson the T3 moving average is a smoothing technique that is intended to produce more effective and accurate signals. The T3 computes 6 successive EMA's on the closing values for a stock and uses those EMA's in the following formula ('a' is the damping coefficient or second parameter.) -a^3 * EMA6 + (3a^2 + 3a^3) * EMA5 + (-6a^2 - 3a - 3a^3) * EMA4 + (1 + 3a + a^3 + 3a^2) * EMA3 . Examples
show stocks where close has been above T3(5,0.7) for the last 2 days

Chapter 3. Indicators and Measures
105
TD Range Expansion Index (TDREI) Parameters
Period Usage
TDREI(Period) Description The TD Range Expansion Index (TDREI), developed by Thomas DeMark [DeMark 1997], is an oversold/overbought measure that uses successive high and low values from several past days in the computation. The computation uses a complex set of look-backs to generate the actual index from high, low and closing values. The actual computation of this measure is not included here. Examples
Show stocks where the TDREI(5) is below 20
Show stocks where the TDREI(12) crossed above 70

StockFetcher Usage Guide
106
TRIX Oscillator Parameters
Period EMAPeriod
Usage
TRIX(Period, EMAPeriod) TRIX EMA(Period, EMAPeriod) TRIX Histogram(Period, EMAPeriod)
Description The TRIX is an oscillator developed by Jack Hutson [Hutson 1984] that uses a triple-smoothed EMA to produce a resulting signal that is fairly tolerant to recent volatile price moves. This ability to ignore recent volatility produces a trend oscillator that can assist in following current trends. The construction of the TRIX requires a single period. Essentially, 3 successive EMA's are computed from this period. In addition to the primary TRIX signal, a smoothed signal is presented along with the TRIX that further reduces volatility. This smoothing is an n-day EMA of the raw TRIX value. Finally, StockFetcher also provides a TRIX Histogram, which, similar to the MACD Histogram, measures the difference between the TRIX signal and the smoothed, or slower, EMA of the TRIX. Examples
Show stocks where the TRIX(30,9) crossed above 0 within the last 1 day
Show stocks where the TRIX(30,9) crossed above the TRIX EMA(30,9) within the last 1 day
Show stocks where the TRIX Histogram(30,9) has reached a new 52 week low and the TRIX(30,9) is below 0

Chapter 3. Indicators and Measures
107
True Strength Index (TSI) Parameters
Period Smoothing Period Smoothing Signal Period
Usage
TSI(Period, Smoothing Period) Smoothed TSI(Period, Smoothing Period, Smoothing Signal Period) TSI Histogram(Period, Smoothing Period, Smoothing Signal Period)
Description The TSI is a momentum indicator devloped by William Blau. The TSI first creates a double EMA of the difference between the daily closing values. This value is divided by the double-smoothed absolute difference of the daily closing values. The raw signal is accompanied by a smoothed version and a histogram illustrating the difference between the two values. Examples
TSI(25,13,9) crossed above Smoothed TSI(25,13,9)
TSI Histogram(25,13,9) is above 0 and TSI(25,13,9) is below 0
StockFetcher Usage Guide
108
Ultimate Oscillator Parameters
FastPeriod MediumPeriod SlowPeriod
Usage
Ultimate Oscillator(FastPeriod, MediumPeriod, SlowPeriod) UO(FastPeriod, MediumPeriod, SlowPeriod)
Description Developed by Larry Williams [Williams 1985], this oscillator uses three separate oscillators to provide a comparison of a stocks price with its smoothed price. Examples
Ultimate Oscillator crossed below 30 within the last 2 days
Ultimate Oscillator(7,14,28) has been decreasing for 5 days
UO(7,14,28) has been decreasing for 5 days and UO(7,14,28) crossed below 30 within the last 2 days

Chapter 3. Indicators and Measures
109
Volume Parameters
none Description Number of shares traded for a given stock on a particular day. Examples
Volume has been increasing for 3 days

StockFetcher Usage Guide
110
Volume Rate of Change Parameters
Period Usage
Volume Rate of Change(Period) Volume ROC(Period) VROC(Period)
Description Identical to the price-based rate of change, the Volume Rate of Change computes the percent change in the volume from one day to the next. This measure also supports an optional period that is used for a smoothed version of the rate of change. Examples
Show stocks where the volume ROC has been increasing for 4 days
Show stocks where the volume rate of change has reached a new 1 year high

Chapter 3. Indicators and Measures
111
Williams %R Parameters
Period Usage
Williams %R(Period) Description The Williams %R, developed by Larry Williams and described in Steve Achelis’ Technical Analysis from A to Z [Achelis 2001], is an oversold/overbought oscillator which ranges between -100% and 0%. The Williams %R is computed by dividing the difference of the high over the last n periods and the most recent close by the difference of the extreme high and lows. Common interpretations of the Williams %R involve oversold signals generated below -80% and overbought signals generated above -20%. Examples
Williams %R(14) below -80
Williams %R(14) decreasing for 3 days lag 2 days and Williams %R(14) increasing for 2 days and Williams %R(14) below -70

StockFetcher Usage Guide
112
Chapter 4. Price Patterns The previous chapter described many statistical measures, nearly all of them derived from the four basic daily price components (open, high, low, close) Another component of stock analysis involves the detection of price-based patterns. A price-based pattern is simply a well defined shape that may conform to a stock’s price value. Historically, these price patterns are detected by visually scanning stock charts and manually drawing trend-lines on the charts. There is no doubt that this is a powerful and successful way to detect the patterns. StockFetcher has taken the approach of detecting some of these patterns automatically. Essentially, we have studied the properties that describe these patterns and developed detection algorithms to automatically discover potential matches. Further increasing the power of the automatic price pattern detection is the ability to add any of the additional StockFetcher screening technology. Mixing a classic price-based pattern with statistical measures to verify or eliminate false hits can create some very powerful screening approaches.

Chapter 4. Price Patterns
113
Candlestick Patterns Usage Pattern is <predefined candlestick pattern> Description Japanese candlestick pattern analysis judges potential price movement based on analysis of a small number of days. The candlestick plot type is a popular short-term plotting style. Including all 4 price values, the candle stick has 4 main characteristics.
- the tail, which ends at the lowest value of the day. - the body, representing the range covered by the open and close. - the head, ending at the high of the day. - the body color. A shaded body indicates a close below the open while a clear or white
body indicates an increase in the price from open to close. Using the characteristics above, there are several well-known candlestick patterns used to judge the potential direction of a stock. To take advantage of these candlestick patterns, simply enter the text pattern is followed by one of the predefined patterns. For example:
Show stocks where pattern is Three Line Strike
The following chart shows a typical match for the filter above.

StockFetcher Usage Guide
114
It is beyond the scope of this book to detail the intent and background of each candlestick pattern, but we will list the well-known patterns covered by StockFetcher
Bullish Upside Tasuki Gap Bullish Side-by-Side White Lines Bullish Separating Lines Bullish Three Line Strike Bullish Upside Gap Three Methods Bullish Harami Cross Bullish Three Outside Down Bullish Three Inside Up Bullish Homing Pigeon Bullish Harami Bullish Morning Doji Star Bullish Tri-Star Bullish Meeting Lines Bullish Unique Three Rivers Bullish Abandoned Baby Bullish Matching Low Bullish Engulfing Bullish Concealing Baby Swallow Bullish Three White Soldiers Bullish Kicking Bearish Upside Tasuki Gap Bearish Side-by-Side White Lines Bearish In Neck Bearish Separating Lines Bearish Three Line Strike Bearish Downside Gap Three Methods Bearish Thrusting Bearish On Neck Bearish Harami Cross Bearish Three Outside Up Bearish Three Inside Down Bearish Harami Bearish Evening Doji Star Bearish Tri-Star Bearish Meeding Lines Bearish Advance Block Bearish Identical Three Crows Bearish Abandoned Baby Bearish Two Crows Bearish Engulfing Bearish Dark Cloud Cover Bearish Three Black Crows Bearish Kicking Bearish Deliberation Hanging Man

Chapter 4. Price Patterns
115
Cup and Handle Usage
Pattern is cup and handle Description The cup and handle pattern is longer-term pattern (typically 50-200 days in length) which is designed to resemble a cup shape. The main characteristics of the cup and handle are:
1. a price run-up to build up the left side of the cup. 2. a sharp decline in price to form the inside wall of the cup. 3. a longer basing pattern which forms the bottom or base of the cup. 4. a sharp price increase which builds the right lip of the cup. 5. a trailing price pattern creating the handle, which completes the pattern.
The chart below shows a typical cup and handle pattern found on StockFetcher.
Example
Show stocks where pattern is cup and handle

StockFetcher Usage Guide
116
Double-Bottom Parameters
Days [more details] Usage
Pattern is double-bottom Pattern is incomplete double-bottom
Description This pattern phrase attempts to discover stocks that are nearing or have recently completed a double-bottom. To meet the requirements of this pattern, the following conditions must be met:
1. a stock is in a recent downtrend 2. retracement of more than 10% of the low after the downtrend. 3. return to within 3% of the lower resistance 4. retest of the upper resistance 5. increase of volume on the retest of upper resistance.
Below is a chart demonstrating these qualifications:
The incomplete double-bottom pattern does not require the final test of the resistance (4 and 5 from above are not required.) The pattern is matched once the stock has retested the previous low.
Please note the - (hyphen) in double-bottom. This is required to produce correct results.
Examples

Chapter 4. Price Patterns
117
show stocks where pattern is double-bottom and price is above 3
show stocks where pattern is incomplete double-bottom(2)

StockFetcher Usage Guide
118
Double-Top Parameters
Days [more details] Usage
Pattern is double-top Pattern is incomplete double-top
Description This pattern works in the same fashion as the double-bottom. In fact, the requirements for the double-top are primarily the opposite of the double-bottom. Instead of forming two troughs, the double-top results in two peaks followed by a retest of an original low.
As with the double-bottom, the double-top has an “incomplete” form where the final retest of the low is not required.
Please note the - (hyphen) in double-top. This is required to produce correct results.
Examples
show stocks where pattern is double-top and price is above 3
show stocks where pattern is incomplete double-top(2)
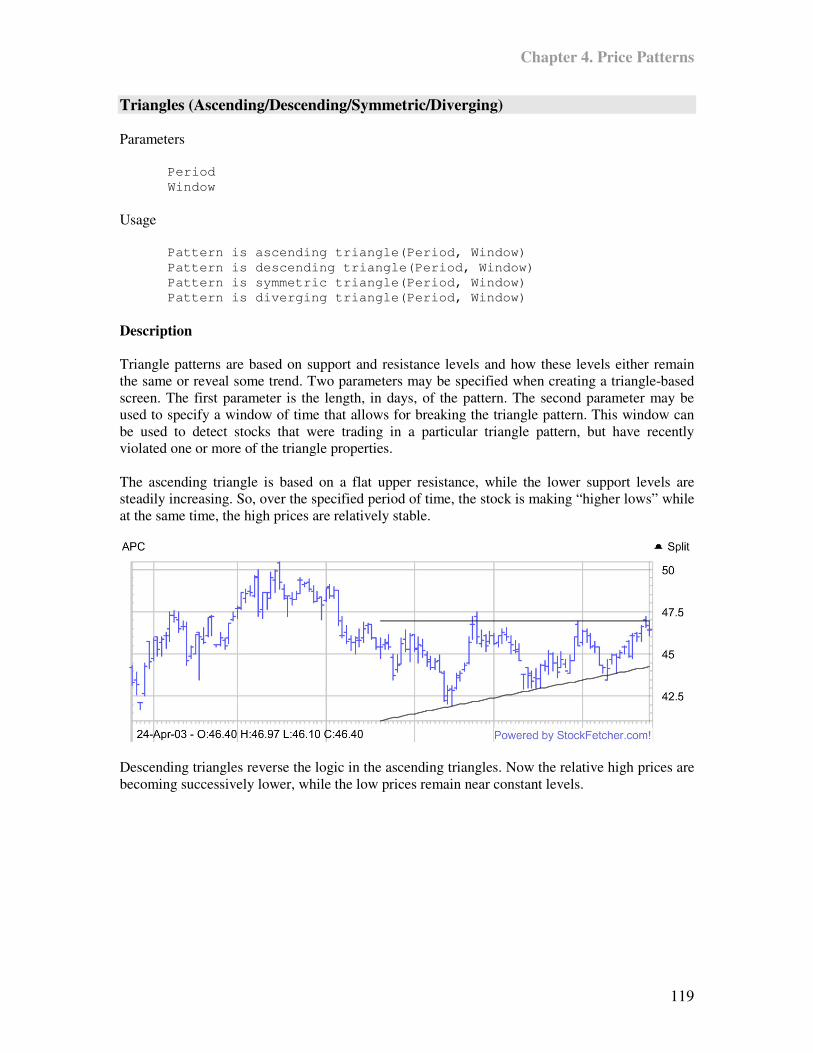
Chapter 4. Price Patterns
119
Triangles (Ascending/Descending/Symmetric/Diverging) Parameters Period Window Usage Pattern is ascending triangle(Period, Window) Pattern is descending triangle(Period, Window) Pattern is symmetric triangle(Period, Window) Pattern is diverging triangle(Period, Window) Description Triangle patterns are based on support and resistance levels and how these levels either remain the same or reveal some trend. Two parameters may be specified when creating a triangle-based screen. The first parameter is the length, in days, of the pattern. The second parameter may be used to specify a window of time that allows for breaking the triangle pattern. This window can be used to detect stocks that were trading in a particular triangle pattern, but have recently violated one or more of the triangle properties. The ascending triangle is based on a flat upper resistance, while the lower support levels are steadily increasing. So, over the specified period of time, the stock is making “higher lows” while at the same time, the high prices are relatively stable.
Descending triangles reverse the logic in the ascending triangles. Now the relative high prices are becoming successively lower, while the low prices remain near constant levels.

StockFetcher Usage Guide
120
Symmetric triangles employ the notion that while the stock is making lower highs, it is also making higher lows. This creates the case where both the resistance and support are converging towards each other.
Diverging triangles are essentially the opposite of the symmetric triangle. To match this pattern stocks need to be creating higher highs, while at the same time making lower lows. This pattern results in stocks that are increasing in volatility.
Examples
show stocks where pattern is ascending triangle
Chapter 4. Price Patterns
121
show stocks where pattern is descending triangle(45)
show stocks where pattern is symmetric triangle(55,10)
show stocks where the close is above the upper ascending triangle(55)
show stocks where the close is below the lower descending triangle(55)

StockFetcher Usage Guide
122
Chapter 5. Modifying measures Knowing what measures you need in a screening approach is typically the first step in developing that approach. Actually retrieving the values to make a successful approach can be an entirely different problem. Through the StockFetcher syntax, there is a set of phrases that allow you to customize and modify the values returned by a particular measure. Probably the most important of these modifications is the ability to refer to a past value of a particular measure. Other important modifications involve fundamental mathematical operations as well as converting from daily price data to weekly data. This chapter on modifying measures will describe and demonstrate how to make the customizations described above. Each of the phrases described in this section can be applied to any indicator or measure, creating a very powerful tool when developing stock screens.

Chapter 5. Modifying Measures
123
Absolute Value(ABS) Parameters
Indicator (the indicator to apply the absolute value) Usage
ABS(Indicator) Description The Absolute Value (ABS) returns the absolute value of the given indicator (i.e. removes the sign of the value). Examples
Abs(close minus open) is above 2.0

StockFetcher Usage Guide
124
Count Parameters
Indicator (the indicator to apply the count to) Length – (number of days)
Usage
Count(Indicator, Length) Description The count feature allows you to return the number of incidences of a single event over a given period of time. Knowing whether or not a measure has crossed another measure 1 time or 10 times in the last 20 days helps paint a more descriptive picture of the behavior of the two measures… As a basic example, suppose you are interested in stocks that have set multiple 1 year highs over the last 30 days. The following example returns stocks that have created more than 10 new highs over the last 30 days.
Show stocks where the count(high reached a new 1 year high,30) is above 10
Current Limitations: Only a single indicator is allowed within Count. In other words, phrases joined with the “and” statement are not allowed. There is a limit of 100 days for accumulating the counts. This restriction is based on performance considerations. Additional Examples: Cases where the MA(10) has not crossed below the MA(50) in the last 60 trading days.
Show stocks where the count(MA(10) crossed below MA(50), 60) is below 1
The CCI(14) has spent exactly 20 of the last 90 trading days below -100:
show stocks where the count(CCI(14) below -100,90) equals 20

Chapter 5. Modifying Measures
125
Display a column which shows the number of times the high has crossed above the upper Bollinger Band in the last 15 days. (You can sort on the resulting column.)
show stocks where the close is between 4 and 100 and draw Bollinger(20) and add column count(high crossed above the upper Bollinger Band(20), 15)
*** Advanced example *** Find stocks where the RSI(14) has spent more than 75% of the time either above 70 or below 30 within the last 45 days.
set{var1, count(rsi(14) is below 30, 45)} set{var2, count(rsi(14) is above 70, 45)} set{sum1, var1 + var2} set{ratio2, sum1 / 45} show stocks where ratio2 is above 0.75 and draw rsi(14) and draw rsi(14) line at 30 and draw rsi(14) line at 70

StockFetcher Usage Guide
126
Custom Moving Average (CMA) Parameters
Indicator (the indicator to apply the count to) days – (number of days)
Usage
CMA(Indicator, days) Description This indicator creates a custom moving average for most StockFetcher indicators. The moving average is based on the simple moving average formula. Examples Create a 20 day moving average of a stock’s daily high:
Show stocks where the close is above CMA(high,20)
Create a moving average crossover based on the close and open price:
set{sum1,close + open} set{avg,sum1 / 2.0} show stocks where CMA(avg,10) crossed above the CMA(avg,50)]
Create a custom average for the CCI indicator:
Show stocks where the CCI(14) crossed above CMA(CCI(14),21)
Find stocks where the upper Bollinger Band crossed below the 5 day average of the upper Bollinger band:
show stocks where the Upper Bollinger Band(20) crossed below the CMA(Upper Bollinger Band(20),5)
Chapter 5. Modifying Measures
127
Custom Exponential Moving Average (CEMA) Parameters
Indicator (the indicator to apply the count to) days – (number of days)
Usage
CEMA(Indicator, days) Description This indicator creates a Custom Exponential Moving Average (CEMA) for most StockFetcher indicators. The usage is the same as the Custom Moving Average indicator. Example Find stocks where the upper Bollinger Band crossed below the 5 day exponential moving average of the upper Bollinger band:
show stocks where the Upper Bollinger Band(20) crossed below the CEMA(Upper Bollinger Band(20),5)

StockFetcher Usage Guide
128
Days (Weeks/Months) Ago Nearly all screening approaches require the ability to specify a value or values from the past. This could include a single price, a volume change, the position of an oscillator, or the entire range of an indicator from some specified offset. Through the construction of phrases using days/weeks/months ago, StockFetcher permits access to nearly any value in the past. While this feature is not limited to price values from only one or two days ago, it is just that ability that allows for creating classic and custom candlestick patterns. The first example shows an outside reversal, using the offset phrasing.
High is above high 1 day ago and Low is below low 1 day ago and Close is above Open and Close 1 day ago is below Open 1 day ago
The example demonstrates a very straightforward and logical way to refer to specific values from just 1 day ago. Notice that any time an offset is required it must immediately follow the measure it refers to. The offset is not carried through to any specific value. While this property may result in longer phrases, it allows complete control of a screening approach. For another example using the offset, suppose a trading approach requires that the MACD histogram had been increasing for 5 successive days up until the last couple of days.
MACD Histogram(12,26,9) 2 days ago had been increasing for 5 days and MACD Histogram(12,26,9) has been decreasing for 2 days
By simply changing the offset of the MACD Histogram reference, in conjunction with the increasing and decreasing keywords, the approach above discovers a local maximum. No pattern is safe from being detected using the “days ago” phrasing on StockFetcher! The offset phrasing also helps in avoiding a critical flaw that affects many approaches where a measure crosses a simple moving average. In this case, an example screen detecting a spike in daily shares traded is used. Suppose the approach looks for a 50% increase in the shares traded versus the 10-day average of shares.
Volume is more than 50% above the average volume(10)
The approach above works and will return valid match, but the approach is flawed and does not return all of the symbols possible. The mistake is that the 10-day average volume includes the unusual volume spike. With StockFetcher, it is very easy to solve this problem:
Volume is more than 50% above the average volume(10) 1 day ago
Advanced Examples The true power of the “… days ago” key phrase can be seen when it comes to defining specific patterns with a particular measure or a stocks price. For example, take the case where the price of a stock dips below the lower Bollinger Band, remains in that position for a couple of days and has

Chapter 5. Modifying Measures
129
just started to leave the band. This entire pattern may be described using combinations of the offset pattern.
High 5 days ago crossed below the lower Bollinger(20) and High1 day ago had been below the lower Bollinger(20) for 4 days and Low is above the lower Bollinger(20)
The screen above defines an exact pattern than can easily be verified from the charts. Exercises
1) Build a screen to find the candle stick pattern: Morning Star. The Morning Star is a pattern with a large black body (down day) followed by a small white body. This white candle gaps below the black body. The next candlestick is a white body that closes 50% or more into the black body. This candlestick pattern identifies a potential bottom reversal pattern
To build the screen, let’s work through it step-by-step adding to the phrases as we go. Step 1: Define the pattern 2 days ago (the large black candle)
close 2 days ago is more than 3 percent below the open 2 days ago
Note: the percent should be adjusted to your own specifications Step 2: A doji that gaps below the black body.
close 2 days ago is more than 3 percent below the open 2 days ago and Open 1 day ago is below the close 2 days ago
Step 2-a: Define the white body
close 2 days ago is more than 3 percent below the open 2 days ago and Open 1 day ago is below the close 2 days ago and Open 1 day ago is above the close 1 day ago

StockFetcher Usage Guide
130
Step 3: The last candlestick is a white body that closes 50% or more into the black body.
close 2 days ago is more than 3 percent below the open 2 days ago and Open 1 day ago is below the close 2 days ago and Open 1 day ago is above the close 1 day ago and Close is above open and close is above Day Position(.50) 2 days ago

Chapter 5. Modifying Measures
131
Logarithm (LOG) Parameters
Indicator (indicator to return the log)
Usage
LOG(Indicator) Description The Logarithm function returns the natural log of the input measure/indicator. Examples
Show stocks where log(RSI(14)) reached a new 6 week high Set{logclose, log(close)}

StockFetcher Usage Guide
132
Maximum(MAX) Parameters
Indicator1 (First indicator to compare) Indicator2 (Second indicator to compare)
Usage
Max(Indicator1, Indicator2) Description The maximum returns the maximum of two values (or indicator results) Examples
Show stocks where Max(RSI(14), Smoothed RSI(14)) is above 60 Show stocks where close is between 10 and 20 and draw Max(open,close) on plot price
Chapter 5. Modifying Measures
133
Minimum(MIN) Parameters
Indicator1 (First indicator to compare) Indicator2 (Second indicator to compare)
Usage
Min(Indicator1, Indicator2) Description The minimum returns the minimum of two values (or indicator results) Examples
Show stocks where MIN(RSI(14), Smoothed RSI(14)) is above 60 Show stocks where close is between 10 and 20 and draw Min(open,close) on plot price

StockFetcher Usage Guide
134
Sign Parameters
Indicator (expression for sign to evaluate)
Usage
Sign(Indicator) Description This indicator returns the sign (1 or -1) of the input measure. Examples
Show stocks where sign(MACD Fast Line) equals 1

Chapter 5. Modifying Measures
135
Single Symbol Indicator Comparison(IND) Parameters
Symbol – The symbol to compare other stocks to Indicator – The indicator used in the comparison
Usage
Ind(symbol, indicator) Description This indicator will compare all the stocks in the screen against a single input symbol. In otherwords, you could use this feature to find all stocks whose Stochastic values were below that for the Nasdaq Composite. Examples Show stocks where the daily volume is above Microsoft’s:
show stocks where volume is above ind(MSFT,volume)
Find cases where the price divergence has reached a new low when compared to the Nasdaq Composite:
set{diff,close / ind(^IXIC,close)} show stocks where diff reached a new 1 year low and compare with ^IXIC

StockFetcher Usage Guide
136
Sum Parameters
Indicator – Indicator to sum Length – Period over which to sum
Usage
Sum(indicator, length) Description This indicator returns the sum of a measure over a specified length/period. Examples
Set{diff, close – close 1 day ago} Set{product, diff * volume} Show stocks where sum(product,10) crossed above 0

Chapter 5. Modifying Measures
137
Plus/Minus/Multiply/Divide StockFetcher allows for basic mathematical operations using two measures. While these operations appear limited in purpose, the ability to create new ratios and differences from existing measures can be very powerful. For example, suppose the ratio of the price with respect to a moving average is needed for analysis. Below is a filter that takes advantage of mathematical operations to find this value:
Show stocks where the MA(10) divided by price is above 1.25
While the example above may seem fairly simple, it provides the ability to quickly find stocks whose 10-day moving average is more than 25% above the price. Granted, this same phrasing could be achieved using the phrase:
Show stocks where the MA(10) is more than 25% above the close
This demonstrates how easy it is to incorporate the mathematical operations.

StockFetcher Usage Guide
138
User-Defined Variables set{…} StockFetcher user-defined variables are advanced methods for creating screens. Through the user-defined variables, you can create complex expressions and formulas to assist in your screening needs. The basic example below finds stocks trading in the top 90% of their current day range:
set{range,high - low} set{closepos,close - low} set{ratio,closepos / range} Show stocks where the ratio is above 0.90
Syntax The user-defined variables have two purposes. First, provide shortened names for indicators or measures used in a filter. Second, create complex arithmetic operations that would normally require nesting. The actual format of the set{...} command is:
set{variable,measure} set{variable,measure [+-*/] measure}
Note that the syntax above only allows for binary and unary operations.
Additionally, you can substitute previously defined variables for any of the measures indicated above. Below is an example which discovers stocks whose open to close change is more than 90% of the total trading range (creating a large white candle body):
set{var1,close - open} set{var2,high - low} set{var3,var1 / var2} set{var4,var3 * 100} show stocks where var4 is above 90 and var2 is above 0.50
Tips First, remember that the user-defined variable is an advanced feature that you may not even need to use. Typically, the user-defined variables are necessary when you have a particular computation that you need. For common screening tasks, other readily available filtering syntax should likely do the trick for you. Next, the user-defined variables are not aliases for screening logic. That is, they can not be used to store actual filtering logic. Below is a table which shows operations that are perfect for the user-defined variables, as well as logic that should not be used in the user-defined variables.
Correct Incorrect close multiplied by 100 MA(10) crossed above the MA(50) RSI(14) minus RSI(14) 1 day ago RSI(14) is below 30

Chapter 5. Modifying Measures
139
high minus Upper Bollinger Band(20) high is above close
Notice that each of the incorrect cases execute some sort of screening action. Additional Examples Find stocks that closed in the lower 1/3 of the 52 week trading range:
set{hi52w, high 52 week high} set{lo52w, low 52 week low} set{range, hi52w - lo52w} set{cpos, close - lo52w} set{pos, cpos / range} show stocks where pos is below 0.33 and draw high 52 week high and draw low 52 week low
Find stocks where the 5 week trading range is less than 1/2 of the 10 week trading range:
set{hh5, high 5 week high} set{ll5, low 5 week low} set{range5, hh5 - ll5} set{hh10, high 10 week high} set{ll10, low 10 week low} set{range10, hh10 - ll10} set{range_ratio,range5 / range10} set{range_percent, range_ratio * 100} show stocks where range_percent is below 50
Exercises
1) Create a screen using, user-defined variables, that shows stocks where the RSI(14) dropped more than 20 points.
2) Using the set{…} notation find stocks trading in the top third of the channel created by the Upper and Lower Bollinger Bands.
StockFetcher Usage Guide
140
Weekly By default, all of the measures on StockFetcher are computed using daily data. This means that an MA(10) would use 10 days of price information to compute one moving average value. On StockFetcher, it is possible to switch from daily information to weekly by simply adding the keyword weekly in front of any measure. The following example is a filter using a couple of weekly moving averages.
Show stocks where the weekly MA(10) crossed above the weekly MA(50)
Now, when the phrase weekly MA(10) is used, ten weekly price points are used to compute a single value. On StockFetcher, the weekly price and volume components are computed as follows:
- weekly close: the last daily close for the week - weekly open: the first daily open for the week - weekly high: the highest traded price during the week - weekly low: the lowest trading price during the week - weekly volume: the sum of all shares traded during the week
Using the definitions above, a weekly MA(10) would then be computed using weekly closing values from the previous ten weeks. Below is another example using a weekly measure on StockFetcher:
show stocks where the weekly MACD(12,26,9) fast line crossed above the weekly MACD(12,26,9) slow line
The example above computes a MACD crossover using weekly, as opposed to daily, values. Once a weekly measure is used in a StockFetcher filter or as a chart setting, a new measure will be included on the daily plot for any stocks. It is possible to mix daily and weekly measures on a daily chart. To force StockFetcher’s charts to draw weekly measures and values exclusively, use the chart-display is weekly phrase (for more information see section on chart-display in Chapter 6.)

141
Chapter 6. Chart Customization The first part of stock screening involves configuring the measures and indictors to automatically select candidates that meet your trading strategy. Once the list of results is returned, the analysis of the stocks does not end. Analysis at this point should involve reviewing fundamental information such as news and earnings, as well as viewing charts of selected stocks. StockFetcher provides a suite of features allowing you to customize the resulting charts. These features include changing the size of the charts, modifying the timeframe as well as adding additional indicators and measures to the charts. A majority of these settings can be saved on the website and applied to all of the charts you use on StockFetcher. However, to further increase the flexibility of the product, all of the customizations can be added directly to the stock screen syntax. Chapter 6 details the chart customization options available. Sample usage and illustrations are provided to further explain how each option will change the resulting charts. The options that follow should help whether you are looking to reduce the size of the resulting charts to optimize bandwidth or create charts with the strongest analysis features.

StockFetcher Usage Guide
142
Chart-Display Chart-display is a very specific phrase that tells a chart to be converted to weekly mode. Like the other chart options, this does not affect screening results; instead it provides another way to draw the chart. By telling StockFetcher to place the chart in weekly mode, all of the plots, including price, are converted to the appropriate weekly values. Any measures or indicators that were a part of the screen are also converted to their weekly counterpart. As an example, below is a screen that looks for a 10 and 50 day moving average crossover.
MA(10) crossed above the MA(50)
Adding the phrase chart-display is weekly to this screen doesn’t affect the individual matches; however, it does convert our averages from 10 and 50 day to 10 and 50 week averages. The new example is:
MA(10) crossed above the MA(50) and chart-display is weekly
While providing the ability to analyze weekly charts, this addition can be confusing when verifying that a particular condition occurred. Therefore, it is important to be careful when using weekly charts.
Chapter 6. Chart Customization
143
Chart-Scale As with other available charting tools, changing the scale from linear to logarithmic is an important feature on StockFetcher. Analyzing price information on a logarithmic scale can smooth some of the edges found when viewing long-term plots spanning a large price range. On StockFetcher, changing the scale of the chart can either be accomplished from the Chart Settings section, or through the phrase chart-scale is. The two scale options available are linear and logarithmic. Below is an example illustrating this phrase.
Close is above the MA(20) and MA(20) is above the MA(50) and MA(50) is above the MA(200) and Chart-time is 1 year and Chart-scale is logarithmic
By default StockFetcher displays charts using the linear scaling.
Chart-scale is only applied to the primary (price) plot. Other plots, such as volume, MACD, RSI, etc, are always linear.

StockFetcher Usage Guide
144
Chart-Size Chart-size tells StockFetcher how wide the resulting charts should be. This is entirely a user preference when it comes to analyzing charts, as well as managing bandwidth. Available widths include: Small Medium Large Giant Huge
Show stocks where the close is below the lower Bollinger Band(20) And chart-size is huge
In addition, specific pixel values of 100 to 1024 may be specified for the chart-width.
Show stocks where the MA(10) crossed above the MA(150) And chart-size is 250

Chapter 6. Chart Customization
145
Chart-Time As with any stock chart package, changing the amount of time covered by a chart on StockFetcher is critical. By default, StockFetcher provides 3-month, 6-month, and 1 year plot periods. Using the chart-time key phrase it is possible to customize the default time period for the charts. The chart-time may be configured from 2 years down to single day plots. While a single day plot typically doesn’t provide much perspective, short-term charts can provide important details when researching recent price or measure activity. For example, the detailed screen below watches for two crossovers in a short period of time. Reducing the amount of time for the plot allows for greater inspection of the activity.
MA(10) 5 days ago crossed above the MA(50) 5 days ago and MA(10) 1 day ago has been above and the MA(50) 1 day ago for 3 days and MA(10) is below the MA(50) and Chart-time is 2 weeks
The moving average analysis above describes a specific double crossover, but further information about the strength of the first crossover is easily seen in the resulting charts.

StockFetcher Usage Guide
146
Chart-type The chart-type option directs StockFetcher to change the default plotting style for stock prices. The available chart-types are line, OHLC and candlestick. The line option simply displays the price using a single value, the close. The OHLC option plots all 4 fundamental values. The lowest value on the bar represents the low, the tick facing left is the open, the tick facing right is the close, and the tallest point is the high. The following is an examples of an OHLC chart.
Finally the candlestick plot type is a popular short-term plotting style. Again including all 4 price values, the candlestick has 4 main characteristics.
• the tail, which ends at the lowest value of the day • the body, represents the range covered by the high and low • the head, ends at the high of the day • the body color, a shaded body indicates a close below the low while a clear or white body
indicates an increase in the price from open to close.
Depending on the timeframe used for charts, the chart-type can either simplify the chart viewing, or provide additional information for making decisions about the price pattern of a stock. Below are a couple examples demonstrating how to change the default chart-type:
Close is below the lower Bollinger band and Chart-time is 1 year and Chart-type is line
High is above high 1 day ago and Low is below low 1 day ago and Chart-time is 2 months and Chart-type is candlestick
The above provide excellent examples of where the actual price charting style can greatly enhance the interpretation of a chart

Chapter 6. Chart Customization
147
Excercises
1) Create a filter which shows all of the daily range above the upper Bollinger band. 2) Create a filter showing matches where the daily range “straddled” the MA(50).

StockFetcher Usage Guide
148
Comparison Chart When evaluating screen results, it can be helpful to compare the results with a known “good” stock. The comparison chart feature allows you to view the price change comparison between any of your filter matches and a given stock. As an example, suppose you are interested in stocks that recently had a moving average crossover, but you would also like to visually compare any matches with the Nasdaq Composite.
Show stocks where the MA(10) crossed above the MA(50) and draw comparison chart(^IXIC)

Chapter 6. Chart Customization
149
Draw StockFetcher automatically plots the appropriate measures included in a screening approach. However, plotting additional measures, not a part of the stock screen, can be extremely helpful to the analysis process. Nearly any number of additional measures may be plotted through the draw keyword. The strength of adding charted measures is the ability to confirm a trading approach, as well as further develop and refine an approach. As an example, take a basic approach of selecting stocks breaking through the lower Bollinger Band.
Close is below the lower Bollinger band(20)
The above is an easy test to find stocks trading below a statistical lower bound. Browsing through the results reveals a large number of choices, with very diverse characteristics. After viewing a few charts, it becomes apparent that this approach could be strengthened by finding stocks that were in a long-term positive trend prior to the current down trend. However, suppose the actual method of determining this longer trend is not available. To help develop the trend detection, a 200-day moving average is added to the charts.
Close is below the lower Bollinger band(20) And draw MA(200)
This new addition will not affect the total number of matches from the first part of the filter. After reviewing the charts with this new information, it is much easier to locate, from chart analysis, stocks in a strong uptrend. Simply including a plot of the MA(200) on the charts provides a simple and quick chart-based screening mechanism. The draw command may be used to add any number of measures and indicators to plots and is not limited to any particular measures. As noted above, the draw command will not affect the filter output. Additionally, duplicate instances of the same measure will not be a problem in cases where a screen includes the same measure as a draw command. draw options may be accessed by manually entering the text when creating a filter, or by saving the options in the Chart Settings section. Drawing Lines In addition to adding indicators to your charts, you can also use the draw command to manually insert lines on your charts. Line drawing is a useful feature if there are notable thresholds with particular indicators that may not be directly involved in your screen. For example:
Show stocks where the close is below the lower Bollinger Band(20) and draw RSI(14) line at 30 and draw RSI(14) line at 70

StockFetcher Usage Guide
150
The example above performs a screen based on the closing price and the Bollinger Bands, but the two draw commands add the RSI plot along with some popular thresholds.

Chapter 6. Chart Customization
151
Draw On In certain scenarios, it may be desirable to plot an indicator on an existing plot. The Draw On phrase allows control over where an indicator appears. The usage for this command is: Draw Measure on plot Measure Below are several examples:
set{upper,MA(10) * 1.05} set{lower,MA(10) * 0.95} close is above 5 and draw upper on plot close and draw lower on plot close
show stocks where close is above 5 and Fast Stochastic(15,5) Fast %K crossed above Fast Stochastic(15,5) Slow %D and draw RSI(14) on plot Fast Stochastic Fast(15,5) %K
show stocks where close is above 5 and RSI(14) crossed above 30 and draw RSI(10) on plot RSI(14) and draw RSI(5) on plot RSI(14)
Certain base values such as price value (open, high, low, close,volume) can not be drawn on different plots. Assignment to a variable is required to achieve this, for example:
set{my_hi,high} set{my_open,open} set{my_close,close} set{my_low,low} close is above 10 and draw my_hi and draw my_low on plot my_hi and draw my_open on plot my_hi and draw my_close on plot my_hi

StockFetcher Usage Guide
152
Primary-plot-size The primary-plot-size keyword controls the height of the main price plot for StockFetcher charts. By increasing the size of the price plot it may be easier to view price patterns as well as any measures plotted in the primary plot. The primary plot size may range from 100 to 500 pixels. Below is an example demonstrating this keyword.
Show stocks where the MA(10) crossed above the MA(50) And primary-plot-size is 400
This setting can also be adjusted globally through the “Chart Settings” on StockFetcher.

153
Chapter 7. Enhancing Filter Results The previous chapter demonstrated how to customize the charts on StockFetcher once you have executed a stock screen. StockFetcher also allows you to modify various aspects of the displayed screen results. These modifications can range from including additional values in the table of results to specifying a time in the past for back testing your screen. It is important to note that these enhancements will not modify either the purpose of your screen or appearance of your charts, but will help to provide additional insight into the stock screen.

StockFetcher Usage Guide
154
Add Column By default, StockFetcher returns basic price and volume information for each of the stocks returned in a screen. This information includes:
• most recent closing price. • percent change from previous close. • the number of shares traded during the most recent day.
The results columns can easily be augmented using the add column phrase. With add column nearly any measure or indicator may be added to the filter results. As an example, the ten day average volume is added as a column to a basic stock screen:
Price is between 10 and 50 and Add column average volume(10)
Now the results present the ten day average volume along with the standard information. In addition to providing new information with the filter results, each new measure can be sorted in either ascending or descending order by clicking on the appropriate column header. Sorting these additional columns is useful with measures whose high or low values can provide additional approach confirmation. For example, take an approach where the close-to-open gap in price is displayed.
Show stocks where the price is between 10 and 15 and Add column close to open gap
Clicking on the column heading for the “close to open gap” immediately presents the results where the most recent open price gapped significantly from the closing price the day before. Column Aliases Enclosing text inside the {} symbols provides an optional extension to the “add column” phrase. These braces are used to rename resulting column headers to something more concise or meaningful. Taking the average volume example above, suppose the column is renamed to “av10” to clean up the results.
Price is between 10 and 50 and Add column average volume(10) {av10}
The contents inside the {…} will be used as the new column header. This extension definitely proves useful when many measures are added to the results, or when the actual measures added to the results are complex and produce difficult to read headers. In the example below, a 52-week high of the MA(50) is added to the results.
Price is between 10 and 50 and Add column average volume(10) {av10} and Add column MA(50) 52 week high {ma50hi}

Chapter 7. Enhancing Filter Results
155
Exercise
1) Using the base filter:
Price is between 10 and 50
a) add the daily open, high and low to the filter results. b) add the 52 week low price and re-label the column toe “52wl” to the filter
results. c) add the ratio of the close to the lower 20-day Bollinger band (hint: use
divide) and sort in descending value.

StockFetcher Usage Guide
156
Apply to Watch List By default, StockFetcher will scan all stocks when performing a screen. Sometimes, it isn’t necessary to see all matches. As an example, when developing an exit strategy, it is helpful to look at specific stocks that have already met an entry requirement. On StockFetcher, this is accomplished by applying a filter specifically to a list of stocks called the watch list. Simply adding the phrase apply to watch list tells StockFetcher to scan stocks in the watch list. For example the following phrase
MA(50) crossed above MA(200) And apply to watch list
provides the crossover as an exit condition, but only for the stocks that are currently in the watch list.

Chapter 7. Enhancing Filter Results
157
Date Offset At a first glance the term date offset would be covered by the days ago phrasing. But, there is an important difference between the two constructs. days ago is important when creating a specific trading approach; it permits access to historical prices or measures for generating screens. “Date offset” is very different from this. In essence date offset is used to back test an entire screening approach. By specifying a date offset in the filter text indicates to StockFetcher that the entire screening approach needs to be run from a particular date in the past. The date offset provides an essential tool not only for judging the performance of a particular approach from different dates in the past, but it also helps to verify the quantity and quality of matches produced by an approach. Some approaches may produce more or less matches based on the market conditions at that time. Using the date offset helps to establish whether or not an approach is easily swayed by a changing environment. Using the date offset phrasing is very simple. All that is required is the text date offset along with a number of days. Below is an approach that returns matches ten days prior to the current date:
RSI(14) crossed above 30 and date offset is 10
Date offsets of as little as a single day and up to 1 year are valid on StockFetcher. Mentioned above, the date offset is not related to the days ago phrasing. An approach using days ago uses a look-back for the specific measure(s) involved. Including a date offset increases the number of days used in the days ago phrase. Once the offset has been applied to a screen, StockFetcher provides additional results that help to analyze the performance of a screen. From the results page, it is possible to see the price change from the offset specified to the current date. Additionally, accessing the performance pop-up provides breakdowns of different time periods as well as more information about advancing and declining matches. For U.S. stocks, the performance window also returns the performance of the major indices to help judge the matches’ performance.

StockFetcher Usage Guide
158
Sort Column By default StockFetcher returns stock screen results in order of highest to lowest volume. You can change this sorting manually by clicking on any of the column headers in your filter results. Additionally, using the sort column feature, you can have the initial filter results arrive using the sorting you want. For example:
Show stocks where MA(10) crossed above MA(50) and sort column 1 descending
The column numbers begin with “1” (which is the ticker symbol), so the example above will return all results sorted in descending order based on ticker symbol. Below is a table listing the default columns and associated column numbers.
Ticker Symbol 1 Last Price (Close) 2 Percent Change 3 Volume 4 First User Defined 5
The sort column feature also allows you to automatically sort based on any additional columns you add using the add column feature.
Show stocks where the MA(10) crossed above the MA(50) and add column RSI(14) and sort column 5 ascending
You can also set your default sorting through the Settings options on StockFetcher.

Appendix A - Reference
159
Appendix A – Reference [Arms 1983] R.W. Arms, Jr., Volume Cycles in the Stock Market, Irwin Professional Pub., (1983) [Achelis 2001] S. Achelis, Technical Analysis from A to Z, McGraw Hill, New York, NY (2001). [Appel 1979] G. Appel, The Moving Average Convergence-Divergence Method, Signalert, Great
Neck, NY (1979). [Blau 1993] W. Blau, “Stochastic Momentum,” Technical Analysis of Stocks & Commodities,
Volume 11, Number 1 (January 1993), pages 11-18. [Bollinger 1992] J. Bollinger, “Using Bollinger Bands,” Technical Analysis of Stocks &
Commodities, Volume 10, Number 2 (February 1992), pages 47-51. [Chaikin ???] [Chande 1995] T.S. Chande, “The Time Price Oscillator,” Technical Analysis of Stocks &
Commodities, Volume 13, Number 9 (September 1995), pages 369-374. [Chande and Kroll 1994] T.S. Chande, S. Kroll, The New Technical Trader, John Wiley and
Sons, New York, NY (1994). [DeMark 1997] T. Demark, “The TD Range Expansion Index (TD REI),” Technical Analysis of
Stocks & Commodities, Volume 15, Number 8 (August 1997), pages 353-359. [Donchian ???] [Dorsey 1992] D. Dorsey, “The Mass Index,” Technical Analysis of Stocks & Commodities,
Volume 10, Number 6 (June 1992), pages 265-267. [Ehlers 2002] J.F. Ehlers, “The Center of Gravity Oscillator,” Technical Analysis of Stocks &
Commodities, Volume 20, Number 4 (May, 2002), pages 20-24. [Elder 1993] A. Elder, Trading for a Living, John Wiley and Sons, New York, NY (1993). [Granville 1976] J. Granville, New Strategy of Daily Stock Market Timing for Maximum Profit,
Prentice-Hall, Englewood Cliffs, NJ (1976). [Hutson 1984] J. Hutson, “TRIX: Triple Exponential Smoothing Oscillator”, Technical Analysis
of Stocks & Commodities, Volume 2, Number 3 (May/June 1984), pages 91-93. [Kaufman 1987] P.J. Kaufman, The New Commodity Trading Systems and Methods, John Wiley
and Sons, New York, NY (1987). [Lambert 1980] D. Lambert, “Commodity Channel Index,” Commodities (October, 1980). [Narcouzi 2000] C. Narcouzi, “Chaikin’s Money Flow,” Technical Analysis of Stocks &
Commodities, Volume 18, Number 8 (August 2000), pages 42-46.

StockFetcher Usage Guide
160
[Pring 1992] M.J. Pring, “Summed Rate of Change (KST)”, Technical Analysis of Stocks & Commodities, Volume 10, Number 9 (September 1992), pages 365-369.
[Schutzman 1991] F. Schutzman, Futures, (April 1991). [TAS&C 1994] “SIDEBAR: The Money Flow Index,” Technical Analysis of Stocks &
Commodities, Volume 12, Number 8 (August 1994), pages 321-324. [Widner 1995] M. Widner, “Signalling Change with Projection Bands,” Technical Analysis of
Stocks & Commodities, Volume 13, Number 7 (July 1995), pages 275-281. [Wilder 1978] J.W. Wilder, New Concepts in Technical Trading Systems, Trend Research,
Greensboro, NC (1978). [Williams 1985] L. Williams, “The Ultimate Oscillator”, Technical Analysis of Stocks &
Commodities, Volume 3, Number 4 (July/August 1985), pages 140-141.

Appendix B – Exercise Solutions
161
Appendix B – Exercise Solutions Below are solutions to the exercises found in the user guide. There are likely many different ways to answer each question; hopefully the following solutions will provide hints or alternative solutions. Also, there is no guarantee that when you run the examples below that matches will be returned. Depending on market conditions, some of the filters below can be fairly restrictive.
Ch 2 Above / Below / Between Exercise 1
show stocks where the RSI(15) 6 days ago had been above 30 for 5 days and RSI(15) 1 day ago has been below 30 for 5 days and RSI(15) is above 30
Exercise 2
close is above close 1 day ago and open is below open 1 day ago and close 1 day ago is above open 1 day ago and high is above high 1 day ago and low is below low 1 day ago
Ch. 2 Crossovers
Exercise 1
show stocks where the MACD fast line crossed below 0
Exercise 2
show stocks where the MACD fast line is above 0 and MACD fast line crossed above the MACD slow line
Exercise 3
show stocks where the close crossed above the EMA(10) and the close crossed above the EMA(50)
Ch. 2 Dropped/Gained
Exercise 1
show stocks where the average volume(5) gained more than 100% within the last 1 week
Exercise 2
show stocks where the average volume(5) gained more than 100% within the last 1 week and volume has been increasing for the last 5 days
Exercise 3
show stocks where the close 1 month ago dropped more than 25% within the last 1 month and close gained more than 25% within the last month

StockFetcher Usage Guide
162
Ch. 2 Increasing/Decreasing Exercise 1
show stocks where the upper Bollinger(20) has been decreasing for 5 days and the lower Bollinger(20) has been increasing for 5 days
Exercise 2
show stocks where the upper Bollinger(20) has been increasing for 5 days and the lower Bollinger(20) has been decreasing for 5 days
Ch. 2 Near
Exercise 1
Show stocks where the RSI(14) is near 80
Exercise 2
Show stocks where the RSI(14) is near 80 from above
Ch. 2 Slope
Exercise 1
Show stocks where the 5 day slope of the upper Bollinger Band(20) is above 0.25
Exercise 2
Show stocks where the 5 day slope of the upper Bollinger Band(20) is above 0.25 and low is below the lower Bollinger(20)
Ch. 2 Record High/Low
Exercise 1
Show stocks where the high reached a new 6 month high
Exercise 2
Show stocks where the high reached a new 1 year high within the last 1 day
Exercise 3
Show stocks where the RSI(14) has reached a new 6 week low
Exercise 4
Show stocks where the close reached a new 52 week high and the close reached a new 52 week high 1 day ago and the close reached a new 52 week high 2 days ago
Exercise 5

Appendix B – Exercise Solutions
163
Show stocks where the MACD Histogram reached a new 14 week low
Exercise 6
Show stocks where the high reached a new 6 month high 1 day ago and close is more than 10% below close 1 day ago
Ch. 5 User Defined Variables
Exercise 1
Set{diff, rsi(14) – rsi(14) 1 day ago} Show stocks where diff < 20
Exercise 2
Set{width,upper Bollinger(20) – lower Bollinger(20)} Set{pos, close – lower Bollinger(20)} Set{ratio, pos / width} Show stocks where ratio is above 0.66
Ch. 6 Chart Type
Exercise 1
Show stocks where low is above the upper Bollinger Band(20) And chart-type is candlestick
Exercise 2
Show stocks where the high is above the MA(50) And low is below the MA(50) And chart-type is OHLC
Ch. 7 Add Column
Exercise 1a
Price is between 10 and 50 And add column open And add column high And add column low And add column close
Exercise 1b
Price is between 10 and 50 And add column close 52 week low {52wl}
Exercise 1c
Price is between 10 and 50 And add column close divided by lower Bollinger Band(20) {ratio} And sort column 5 descending

StockFetcher Usage Guide
164
Appendix C - Index
+ +DI, 53
< <. See below
> >. See above
A above, 8 ABS. See Absolute Value Absolute Day Change, 49 Absolute Price Oscillator, 30 Absolute Value, 123 Absolute Volume Oscillator, 31 Acceleration Bands, 32 actions, 7 add column, 154 ADX, 53 alias, 154 and, 5 APO. See Absolute Price Oscillator apply to watch list, 156 approaching, 12 Aroon, 33
Down, 33 Oscillator, 33 Up, 33
ATR. See Average True Range Average Day Range, 51 Average True Range, 35 Average Volume, 36 AVO. See Absolute Volume Oscillator
B backtest, 157 basic screen elements, 3 below, 8 between, 8 Bollinger
%B, 39 Bands, 37 Lower Band, 37 Median Band, 37 Oscillator, 38 Upper Band, 37 Width, 40
bullish engulfing, 4
C candlestick, 146 candlestick pattern
Morning Star, 129 candlesticks, 113 CCI. See Commodity Channel Index CEMA. See Custom Exponential Moving Average Center of Gravity, 41 Chaikin's Money Flow, 42 Chaikin's Volatility, 43 Chande Momentum Oscillator, 44 Chandelier Exit, 45 chart customization, 141
chart-display, 142 chart-scale, 143 chart-size, 144 chart-time, 145 chart-type, 146 draw, 149 draw on, 151 primary-plot-size, 152
chart-display, 142 chart-scale, 143 chart-size, 144 chart-time, 145 chart-type, 146 Close, 84 Close-to-Open Gap, 46 CMA. See Custom Moving Average CMO. See Chande Momentum Oscillator COG. See Center of Gravity comments, viii Commodity Channel Index, 47 comparative relative strength, 48 comparison chart, 148 contact us, viii, 2 conventions, viii converging, 13 count, 124 crossed above, 14 crossed below, 14 crossover, 14
moving average, 4 multiple, 16
cup and handle, 115 Custom Exponential Moving Average, 127 Custom Moving Average, 126
D date offset, 157 Day Change, 49 Day Point Range, 51 Day Position, 50 Day Range, 51 days ago, 128
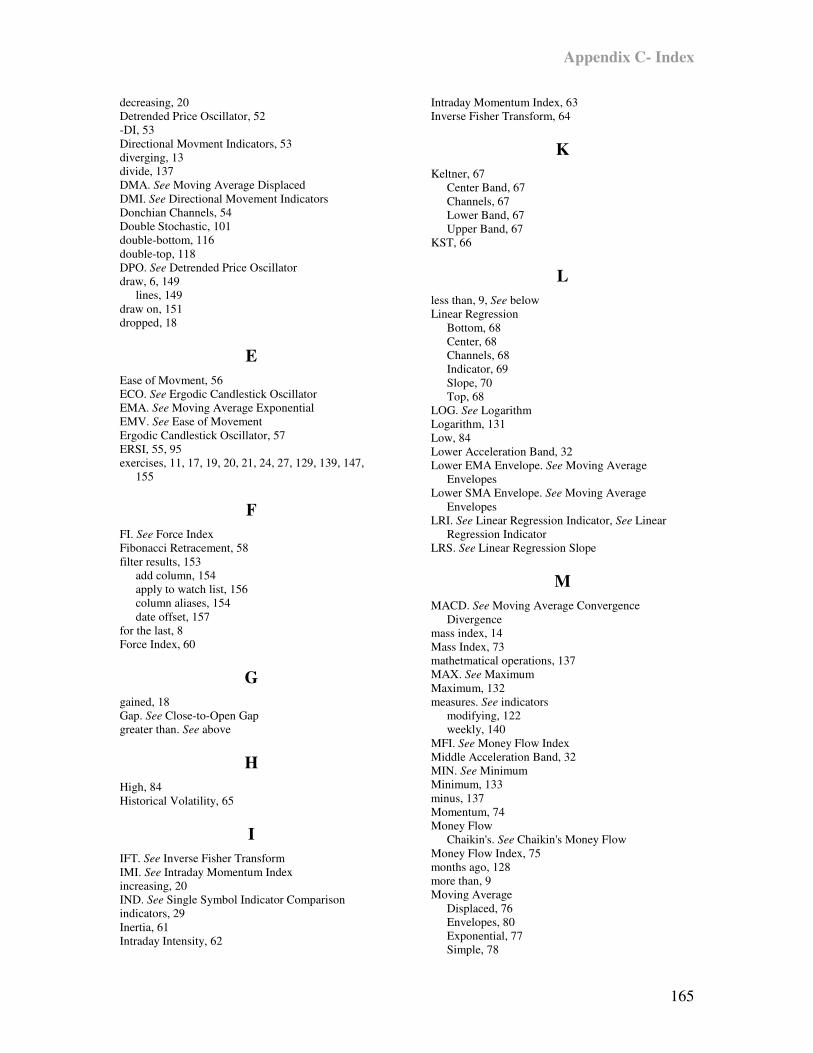
Appendix C- Index
165
decreasing, 20 Detrended Price Oscillator, 52 -DI, 53 Directional Movment Indicators, 53 diverging, 13 divide, 137 DMA. See Moving Average Displaced DMI. See Directional Movement Indicators Donchian Channels, 54 Double Stochastic, 101 double-bottom, 116 double-top, 118 DPO. See Detrended Price Oscillator draw, 6, 149
lines, 149 draw on, 151 dropped, 18
E Ease of Movment, 56 ECO. See Ergodic Candlestick Oscillator EMA. See Moving Average Exponential EMV. See Ease of Movement Ergodic Candlestick Oscillator, 57 ERSI, 55, 95 exercises, 11, 17, 19, 20, 21, 24, 27, 129, 139, 147,
155
F FI. See Force Index Fibonacci Retracement, 58 filter results, 153
add column, 154 apply to watch list, 156 column aliases, 154 date offset, 157
for the last, 8 Force Index, 60
G gained, 18 Gap. See Close-to-Open Gap greater than. See above
H High, 84 Historical Volatility, 65
I IFT. See Inverse Fisher Transform IMI. See Intraday Momentum Index increasing, 20 IND. See Single Symbol Indicator Comparison indicators, 29 Inertia, 61 Intraday Intensity, 62
Intraday Momentum Index, 63 Inverse Fisher Transform, 64
K Keltner, 67
Center Band, 67 Channels, 67 Lower Band, 67 Upper Band, 67
KST, 66
L less than, 9, See below Linear Regression
Bottom, 68 Center, 68 Channels, 68 Indicator, 69 Slope, 70 Top, 68
LOG. See Logarithm Logarithm, 131 Low, 84 Lower Acceleration Band, 32 Lower EMA Envelope. See Moving Average
Envelopes Lower SMA Envelope. See Moving Average
Envelopes LRI. See Linear Regression Indicator, See Linear
Regression Indicator LRS. See Linear Regression Slope
M MACD. See Moving Average Convergence
Divergence mass index, 14 Mass Index, 73 mathetmatical operations, 137 MAX. See Maximum Maximum, 132 measures. See indicators
modifying, 122 weekly, 140
MFI. See Money Flow Index Middle Acceleration Band, 32 MIN. See Minimum Minimum, 133 minus, 137 Momentum, 74 Money Flow
Chaikin's. See Chaikin's Money Flow Money Flow Index, 75 months ago, 128 more than, 9 Moving Average
Displaced, 76 Envelopes, 80 Exponential, 77 Simple, 78

StockFetcher Usage Guide
166
Volume Weighted, 79 Moving Average Convergence Divergence, 71
Volume Weighted, 72 multiply, 137
N near, 21 Negative Volume Index, 81 NVI. See Negative Volume Index
O OBV. See On Balance Volume OHLC, 146 On Balance Volume, 83 Open, 84 Optionable, 85
P P/E Ratio, 86 Parabolic SAR, 87 pattern
double-bottom, 116 double-top, 118
patterns, 112 ascending triangle, 119 candlesticks, 113 cup and handle, 115 descending triangle, 119 diverging triangle, 119 symmetric triangle, 119
Percent Price Oscillator, 88 Percent Volume Oscillator, 89 Pivot Points, 90
PP, 90 R1, 90 R2, 90 S1, 90 S2, 90
plus, 137 points vs. percent, 18 Positive Volume Index, 82 PPO. See Percent Price Oscillator Price and Volume Trend, 91 primary-plot-size, 152 Projection Bands, 92
Lower, 92 Upper, 92
Projection Oscillator, 93 PVI. See Positive Volume Index PVO. See Percent Volume Oscillator PVT. See Price and Volume Trend
Q QStick, 94
R record
as a measure, 22 as boundaries, 23 charts, 23 high, 22 low, 22 values, 22
Relative Strength Indicator, 95 relative strength, comparative. See comparative
relative strength Relative Volatility Index, 96 RSI. See Relative Strength Indicator RVI. See Relative Volatility Index
S screening steps, 1, 4 set{...}. See user-defined variables Sign, 134 Single Symbol Indicator Comparison, 135 slope, 25 SMA. See Moving Average Simple SMI. See Stochastic Momentum Index Smoothed Rate of Change, 97 sort column, 158 Standard Deviation, 98 Stochastic Momentum Index, 100 Stochastics, 102
Double, 101 Fast, 102 Fast %K, 102 Full, 102 Slow, 102 Slow %D, 102
StochRSI, 99 Sum, 136 syntax checking, 3
T T3 Moving Average, 104 TD REI, 105 touching, 28 trading stocks, 3 trend, 25 triangles, 119
ascending, 119 descending, 119 diverging, 119 symmetric, 119
TRIX, 106 EMA, 106 Histogram, 106
True Strength Index, 107 TSI. See True Strength Index
U Ultimate Oscillator, 108 Upper Acceleration Band, 32
Appendix C- Index
167
Upper EMA Envelope. See Moving Average Envelopes
Upper SMA Envelope. See Moving Average Envelopes
user-defined variables, 138
V Vestyl Software, L.L.C., vi Volatility, Chaikins. See Chaikin's Volatility Volume, 109
Volume Rate of Change, 110 Volume Weighted MACD. See Moving Average
Convergence Divergence Volume Weighted
W weekly, 140 weeks ago, 128 Williams %R, 111 within the last, 14