stocks, bonds, bills, and inflation • • historical returns
TRANSCRIPT

Roger G. Ibbotson Rex A. Sinquefield
Stocks, Bonds, Bills, and Inflation Historical Returns (1926-1987)
T h e R esearch Foundation of
T h e Institute of C harte red Financial Analysts
• •

The Research Foundation of The Institute of Chartered Financial Analysts
Board of TrusteesChairmanJames R. Vertin, CFA Alpine Counselors
Vice Chairman George W. Noyes, CFA Standish, Ayer & Wood
Research Director Charles A D’Ambrosio, CFA University of Washington
PresidentAlfred C. Morley, CFA The Institute of Chartered Financial Analysts
Darwin M. Bayston, CFA The Institute of Chartered Financial Analysts
Thomas A. Bowman, CFA The Institute of Chartered Financial Analysts
Charles D. Ellis, CFA Greenwich Associates
William F. Sharpe Sharpe-Tint, Inc.
Eugene C. Sit, CFA Sit Investment Associates, Inc.
Walter P. Stem, CFA Capital Research Co.
Donald L. Tuttle, CFA Indiana University
James N. von Germeten, CFA Boston, Massachusetts
Review Board
Gerald O. Bierwag University of Arizona
Charles A D’Ambrosio, CFA University of Washington
Joanne M. Hill Paine Webber, Inc.
Mark P. Kritzman, CFA Windham Capital Management
Richard Roll UCLARoll & Ross Asset Management
Gary G. Schlarbaum, CFA Miller, Anderson & Sherrerd
Officers
Alfred C. Morley, CFA President
Darwin M. Bayston, CFA Executive Vice President
Thomas A. Bowman, CFA Senior Vice President
Katrina F. Sherrerd Assistant Vice President

Stocks, Bonds, Bills, and Inflation: Historical Returns (1926-1987)


Roger G. Ibbotson Yale University and Ibbotson Associates
Rex A. Sinquefield Dimensional Fund Advisors
Stocks, Bonds, Bills, and Inflation: Historical Returns (1926-1987)
The Research Foundation ofThe Institute of Chartered Financial Analysts

Stocks, Bonds, Bills, and Inflation: Historical Returns
© 1989 Roger G. Ibbotson and Rex A. Sinquefield
Dow Jones-Irwin is a trademark of Dow Jones & Company, Inc.
All rights reserved. No part of this publication may be reproduced, stored in a retrieval system, or transmitted, in any form or by any means, electronic, mechanical, photocopying, recording, or otherwise, without the prior written permission of die copyright holder.
This publication is designed to provide accurate and authoritative information in regard to the subject matter covered. It is sold with the understanding that the publisher is not engaged in rendering legal, accounting, or other professional service. If legal advice or other expert assistance is required, the services of a competent professional should be sought.
From a Declaration o f Principles jointly adopted by a Committee o f the American Bar Association and a Committee o f Publishers.
For reprint information, please contact
Permissions Editor 8 South Michigan Avenue, Suite 707
Chicago, Illinois 60603 (312) 263-3434
Library o f C ongress C ataloging-in -P ublication D ata
Ibbotson, Roger G.Stocks, bonds, bills, and inflation : historical returns
(1926-1987) / Roger G. Ibbotson, Rex A. Sinquefield. p. cm.
Bibliography: p.ISBN 1-55623-140-7. — ISBN 1-55623-231-4 (pbk.)1. Stocks—Prices—United States. 2. Securities—Prices—United
States. 3. Stock price forecasting. I. Sinquefield, Rex A.II. Institute of Chartered Financial Analysts. Research Foundation.III. Title.HG4915.I2 1989332.63'222'0973—dc20 89-7840
CIP
Susan S. Brennan, Production Editor Ellen D. Goldlust, Editorial Assistant Joni L. Tomal, Editorial Assistant Diane B. Hamshar, Administrative Assistant
Printed in the United States of America
1 2 3 4 5 6 7 8 9 0 V 6 5 4 3 2 1 0 9

The Research Foundation of the Institute of Chartered Financial Analysts
Mission
The mission of the Research Foundation is to identify, fund and publish research material that:
• expands the body of relevant and useful knowledge available to practitioners;
• assists practitioners in understanding and applying this knowledge; and
• enhances the investment management community’s effectiveness in serving clients.
The Research Foundation of The Institute o f Chartered Financial Analysts
P.O. Box 3665Charlottesville, Virginia 22903

Table of Contents
Table of Contents
List of Exhibits ......................................................... ix
Foreword .................................................................. xv
Acknowledgments ..................................................... xvii
Chapter 1. In troduction .................................... 1
Chapter 2. The Long-Run Perspective ............ 7
Chapter 3. Description of the Basic Series . . . 15
Chapter 4. Description of the Derived Series . . 37
Chapter 5. Presentation of the Data: Returnsand In d e x e s ....................................... 53
Chapter 6. Statistics of the Stocks, Bonds, Bills,and Inflation R e tu rn s ........................ 69
Chapter 7. Time Series Behavior of theReturns ............................................. 93
Chapter 8. Firm Size and R e tu rn ...................... 105
Chapter 9. Estimating the Cost of Capital orDiscount R a t e .......................................119
Chapter 10. Using Historical Data to Forecastthe F u tu r e .............................................135
Appendix Rates of Return for all YearlyHolding Periods From 1926 to 1987 . 159
References ...................................................................200
vii


List of Exhibits
Exhibits
Exhibit 1 Wealth Indexes of Investments inthe U.S. Capital Markets (1926-1987) 9
Exhibit 2 Basic Series: Summary Statisticsof Annual Returns (1926-1987) . . . . 14
Exhibit 3 Common Stocks: Returns,Return Indexes, and Yields (1926-1987) ....................................... 16
Exhibit 4 Small-Company Stocks:Returns and Return Indexes (1926-1987) ....................................... 20
Exhibit 5 Long-Term Corporate Bonds:Returns and Return Indexes (1926-1987) 22
Exhibit 6 Long-Term Government Bonds:Returns, Return Indexes,and Yields (1926-1987)....................... 26
Exhibit 7 Intermediate-Term GovernmentBonds: Returns, Return Indexes, and Yields (1926-1987)....................... 30
Exhibit 8 U.S. Treasury Bills: Returns,Return Indexes, and Yields (1926-1987) ......................................... 32
Exhibit 9 Inflation: Rates of Change andCumulative Indexes(1926-1987) 34
Exhibit 10 U.S. Treasury Bills: Real and Nominal Return Indexes (1925-1987) 40
IX

Stocks, Bonds, Bills, and Inflation: Historical Returns
Exhibit 11 Long-Term Government Bonds:Real and Nominal ReturnIndexes (1925-1987)........................ 46
Exhibit 12 Common Stocks: Real and Nominal Return Indexes (1925-1987)....................................... 49
Exhibit 13 The Component Parts of SecurityReturns (1926-1987) ........................ 52
Exhibit 14 Basic Series: Year-By-Year TotalReturns (1926-1987) ........................ 54
Exhibit 15 Common Stocks, Long-Term Government Bonds, and Intermediate-Term Government Bonds: Year-by-Year Income,Capital Appreciation, Reinvestment Returns, and Yields (1926-1987) . . 58
Exhibit 16 Derived Series: Year-By-YearTotal Returns (1926-1987)............... 61
Exhibit 17 Basic Series: Indexes of Year-End Cumulative Wealth (1926-1987) 63
Exhibit 18 Derived Series: Indexes of Year-End Cumulative Wealth (1926-1987) 65
Exhibit 19 Basic Asset Classes: TotalReturns, Income, and Capital Appreciation: Summary Statistics of Annual Returns (1926-1987) . . . 72
Exhibit 20 Risk Premium Series: Summary Statistics of AnnualReturns (1926-1987) ........................ 73

Exhibit 21 Inflation-Adjusted Series:Summary Statistics ofAnnual Returns (1926-1987)............ 74
Exhibit 22 Month-by-Month Returns onStocks and Bonds (1926-1987) . . . . 76
Exhibit 23 Series Differences: Summary Statistics of Differences between Annual Returns on Common Stocks, Long- and Intermediate-Term Bonds, and Bills (1926-1987) . . . . 77
Exhibit 24-A Basic Series: Compound Annual Returns for Five-Year Holding Periods (1926-1987) 80
Exhibit 24-B Basic Series: Compound Annual Returns for 10-Year Holding Periods (1926-1987) 82
Exhibit 24-C Basic Series: Compound Annual Returns for 20-Year Holding Periods (1926-1987) 84
Exhibit 25 Equity Risk Premiums,Long-Horizon Equity Risk Premiums, and Real Riskless Returns: Compound Annual Returns for Different HoldingPeriods (1926-1987) ........................ 87
Exhibit 26-A Minimum and Maximum Values of Annual and Five-Year Rolling Period Returns (1926-1987) ........................ 89

Stocks, Bonds, Bills, and Inflation: Historical Returns
Exhibit 26-B Minimum and Maximum Values of 10- and 20-Year Rolling Period Returns (1926-1987) ........................ 90
Exhibit 27 Basic Asset Classes: Sample Serial and Cross-Correlations of Historical Yearly Returns (1926-1987) ............ 95
Exhibit 28 Risk Premiums and Inflation: Serial and Cross-Correlations of Historical Yearly Returns (1926-1987)............ 97
Exhibit 29 Inflation-Adjusted Basic Series:Serial and Cross-Correlations ofHistorical Yearly Returns(1926-1987)....................................... 98
Exhibit 30 Interpretation of the Yearly First Order Serial Correlations for Component Series (1926-1987) . . . 100
Exhibit 31 Basic and Derived Series:Annualized Monthly StandardDeviations for Each Year(1926-1987)....................................... 102
Exhibit 32 Capitalization Deciles of the NYSE: Summary Statistics of Annual Returns (1926-1987) ........................ 107
Exhibit 33 Year-by-Year Returns on Decile Portfolios of the NYSE Sorted by Market Capitalization (1926-1987) . 108
Exhibit 34 Year-End Index Values of Returns on Decile Portfolios of the NYSE Sorted by Market Capitalization (1926-1987)....................................... 110
xii

List of Exhibits
Exhibit 35
Exhibit 36
Exhibit 37
Market Value of the 10 Capitalization Deciles as a Percentage of the Total NYSE Market Value (1926-1987) ............... 114
First-Order Autocorrelations of Annual Decile Returns in Excess of the First (Largest) Decile (1926-1987) ....................................... 115
Returns on Capitalization Deciles of NYSE Stocks, in Excess of the First (Largest) Decile (1926-1987) . . . . 116

Stocks, Bonds, Bills, and Inflation: Historical Returns

Foreword
For more than a decade, the Research Foundation of the Institute of Chartered Financial Analysts has had the high privilege of being involved in the development of a standard reference work, commonly dubbed “Ibbotson and Sinquefield,” but more formally called Stocks, Bonds, Bills, and Inflation (SBB1). No one can be in the investment business for very long without referring to SBBI; it is the reference source for every serious financial analyst. It has perspicuity; its presentation is lucid, systematic, and coheren t; and it is the beginning of perform ance benchmarks.
This edition of SBBIcontinues and adds to the knowledge base of investment practitioners. The asset classes covered are those that dominate contemporary investing. Newly added are intermediate-term (five-year) government bonds, as well as two notably practical chapters.
The first new chapter examines how to estimate and use the cost of capital. Those analysts who have wrestled with these knotty and sensitive issues in such arenas as public utility rate making or valuation of damages in liability suits will value the authors’ approaches.
The second new chapter is an important addition because it provides insights about forecasting the probability distributions of returns on assets and portfolios. As valuable as yesterday’s returns are, we live in a world of tomorrows, and we must find a way to refine our ability to forecast, within reasonable probabilistic bounds, expected returns and their associated risks.
The full measure of SBBFs importance to financial analysts lies in its blend of theory and practice. But SBBFs

Stocks, Bonds, Bills, and Inflation: Historical Returns
value will never be discovered until it is fully tasted and digested. Bon Appetit!
Charles A. D’Ambrosio, CFA Research Foundation of the
Institute of Chartered Financial Analysts
Acknowledgements
Acknowledgments
We would like to thank the many colleagues who helped us with this version, as well as previous editions of Stocks, Bonds, Bills, and Inflation, published by the Financial Analysts Research Foundation. We owe a great debt to James H. Lorie and Lawrence Fisher, who founded the Center for Research in Security Prices (CRSP) at the University of Chicago and provided the foundation for the type of empirical research in finance found here. Mr. Fisher, along with Thomas S. Coleman of the State University of New York at Stony Brook (currently on leave and with the Bank of Boston), also provided the five-year Treasury-bond-yield data for 1926-33. We thank Yale University and Dimensional Fund Advisors, Inc., for their generosity in providing us with the resources to prepare this edition, and CRSP, for providing the data without which this analysis would not have been possible.
Laurence B. Siegel served for many years as the principal editor of periodical updates of this publication and made many improvements, including the addition of the five-year Treasury series. He continues to serve in an editorial role. At Ibbotson Associates, Katie B. Weigel is now principal editor of the updates and has reorganized the entire book; Kimberly A. Maselli is assistant editor of the updates; Paul D. Kaplan provided assistance at many stages of editing, production, and graphic display; and Tze-Wah Chan programmed the analysis with great skill and speed. Marvin B. Waring and Margaret A. Corwin, Managing Directors of Ibbotson Associates, provided encouragement and help.
Rolf W. Banz of Dimensional Asset Management Ltd. (London) contributed the small-stock series used for most of the period covered in this book. Stephen P. Manus, of
xvii

Stocks, Bonds, Bills, and Inflation: Historical Returns
the American National Bank of Chicago, updates the common stock return series, as he has for many years. Yasushi Hamao, of the University of California at San Diego, has participated in long discussions about the methods used.
At Dimensional Fund Advisors, we thank Jeanne Cairns Sinquefield for caretaking of the data over many years, and for insisting that we compute income returns correctly, a change th a t was long overdue. R am akrishnan Chandrasekar, Cem Severoglu, and Henry Otto (who is now with Brandywine Asset Management) have carefully scrutinized fixed-income and other data and have caught many errors. We, of course, are responsible for any that remain.
Eugene F. Fama, of the University of Chicago and a director of Dimensional Fund Advisors, has provided continual guidance and intellectual stimulation. David G. Booth, Co-Chair of Dimensional Fund Advisors, provided both encouragement and resources needed to produce this book.
Because this is the fourth edition of Stocks, Bonds, Bills, and Inflation intended for general publication, we would like to recognize those who had an impact on earlier editions, including Merton Miller, Eugene F. Fama, Fischer Black, and Myron Scholes. The staff and officers of the Research Foundation of the Institute of Chartered Financial Analysts were helpful throughout the production of the book and their help is hereby acknowledged. We would also like to express our thanks to the many other contributors to our ideas and research over the years, who are too numerous to name here.
XVlll
Roger G. Ibbotson Rex A. Sinquefield

1. Introduction
Who Should Read This Book?Stocks, Bonds, Bills, and Inflation: Historical Returns
(1926-1987) is a history of the returns of the capital markets in the United States from 1926 to 1987. It will be useful to several types of readers.
Foremost, anyone who is serious about investing must appreciate capital-market history. Such an appreciation, which this book provides, is valuable both to individual and institutional investors. For graduate and undergraduate students of finance, economics, and business, Stocks, Bonds, Bills, and Inflation is both a source of ideas and a reference. Other readers who will benefit from this publication include teachers; practitioners and scholars in finance, economics, and business; portfolio strategists; and security analysts.
Chief financial officers and, in some cases, chief executive officers of corporations will also find this book useful. People who are concerned with the cost of capital may apply the findings directly. More generally, economic historians may find it valuable to study the details revealed in more than six decades of capital market returns.
To all of these readers, the authors provide two resources. The first is the data. The second is a thinking person’s guide to using historical data to understand

Stocks, Bonds, Bills, and Inflation: Historical Returns
financial markets and the decision-making process. This guide is necessary to answer the questions raised by the historical record. This book illustrates the authors’ method of appreciating the past—only one of many possible techniques, but one grounded in real theory. In setting forth their appreciation, the authors enable the reader to think about the past and about financial markets.
Previous WorkIn 1976, The Journal of Business published the authors’
two companion papers on security returns (Ibbotson and Sinquefield January 1976 and July 1976). In the first paper, we presented historical data on the returns from stocks, government and corporate bonds, U.S. Treasury bills, and consumer goods (inflation). We described how the return on a security is the sum of two or more component returns.
In the second paper, we analyzed the time-series behavior of the component returns and the information contained in the U.S. government bond yield curve to obtain inputs to a simulation model of future security price behavior. We forecasted security returns through the year 2000 using the methods developed in the two papers.
The response to these works showed that historical data are fascinating in their own right. Both security and component historical returns have a wide range of applications in investment management, corporate finance, academic research, and regulation of industry.
Subsequent works—the 1977, 1979, and 1982 monographs of the Financial Analysts Research Foundation and, later, Ibbotson Associates’ Stocks, Bonds, Bills, and Inflation Yearbooks—updated and further developed the historical data and forecasts.
In 1981, we began tracking a new asset class, small- company stocks. This class consists of those issues listed
2
on the New York Stock Exchange (NYSE) which rank in the ninth and tenth (lowest) deciles when sorted by capitalization (price times number of shares outstanding), plus non-NYSE issues of comparable capitalization. This asset class has been of extraordinary interest to researchers and investors in recent years because of its high long-term returns.
In This EditionWith this edition, the authors continue to make changes
and improvements. Another asset class, intermediate-term (five-year) government bonds, is added. Monthly and annual total returns, yields, income returns, and capital appreciation returns are presented. Yields on long-term government bonds are also presented. A new chapter (Chapter 8) examines the relation between firm size and return in greater detail, presenting and analyzing the returns on all 10 deciles of the NYSE, sorted by market capitalization.
The present volume updates the historical data. The motivations continue to be (1) to provide a convenient and useful history of security market returns and (2) to discern the relations among the various returns by examining their components: inflation, real interest rates, risk premiums, and other premiums.
A few other changes distinguish this edition. The chapters have been reorganized and exhibits added. The Questions and Answers section of previous editions has been converted to two chapters focusing on the use of historical data. Chapter 9 discusses the formation of estimates of the cost of capital. The forecasting of probability distributions of returns on assets and portfolios is addressed in Chapter 10.
Stocks, Bonds, Bills, and Inflation: Historical Returns
Finally, this edition incorporates two new or revived calculation methods. First, the method of calculating series differences, or derived series (component and inflation- adjusted series) is different from that used in the 1982 edition of this book. In the 1982 edition, derived series were obtained by subtracting two monthly basic series. Returns on derived series C, defined as series A minus series B, were calculated as follows.
C = A - B.
In this volume, derived series are calculated by division. Returns on derived series C are related to series A and B as follows:
(1 + C) = (1 + A )/(1 + B),
where series A, B, and C are in decimal form (i.e., 5 percent is indicated by 0.05). Thus, C is given by
C= (1+A )/(1 + B)-1.
This method is referred to as “geometric subtraction.”The formulation corresponds to that which we used in our
original (1976) monograph. It rectifies many of the problems arising from annualization or other compounding of series differences, and simplifies the calculation of summary statistics on the derived series. All exhibits relating to derived series reflect this calculation method.
Second, annual income returns are now calculated as the sum of the 12 monthly income payments, divided by the beginning-of-year price. In previous editions, the 12 monthly income returns were linked (compounded) to form an annual return. This change applies to annual income
4

returns on common stocks and long- and intermediate-term government bonds.
The Data SeriesThe series presented here are total returns and, where
applicable or available, capital appreciation returns, income returns, and yields for
(1) Common Stocks, represented by the Standard & Poor’s 500 Stock Composite Index (S&P 500);
(2) Small Company Stocks, represented by the fifth capitalization quintile of stocks on the NYSE for 1926-81 and the performance of the Dimensional Fund A dvisors (DFA) Small Company Fund thereafter;
(3) Long-Term Corporate Bonds, represented by the Salomon Brothers long-term, high-grade corporate bond total return index;
(4) Long-Term Government Bonds, measured using a one-bond portfolio with a maturity near 20 years;
(5) Intermediate-Term Government Bonds, measured using a one-bond portfolio with a maturity near five years;
(6) U.S. Treasury Bills, measured by rolling over each m onth a one-bill portfolio containing, at the beginning of each month, the bill having the shortest maturity not less than one month; and
(7) Consumer Price Index for All Urban Consumers (CPI-U), not seasonally adjusted.
In addition, the 10 deciles of the NYSE sorted by market capitalization are studied, making a total of 17 asset classes for which returns are presented.


2 The Long-Run Perspective
MotivationThis study examines U.S. capital market returns for the
62-year period 1926-87. Using such a long period enables us to assess the basic relations among asset classes, between risk and return, and between nominal and real (inflation-adjusted) returns. This period, we hope, is long enough to include most of the major types of events that investors may expect to experience. Such events include war and peace, growth and decline, inflation and deflation, and less dramatic events that likewise affect asset returns.
In finance, we study the past to make inferences about the future. Although the actual events that occurred from 1926 to 1987 will not be repeated, the event-types of that period will probably recur. Some say that the past tells us little because one period or another is “unusual”—for example, the depression of 1929-32 or World War II. This logic is suspect: all periods are unusual. For example, two of the most “unusual” events of the century took place in the last decade. One was the inflation of the 1970s and early 1980s; the other was the stock market crash of October 1987. If historical event-types (not specific events) tend to repeat themselves, a study of long-run capital market returns may reveal a great deal about the future. (See Chapter 10.)
Stocks, Bonds, Bills, and Inflation: Historical Returns
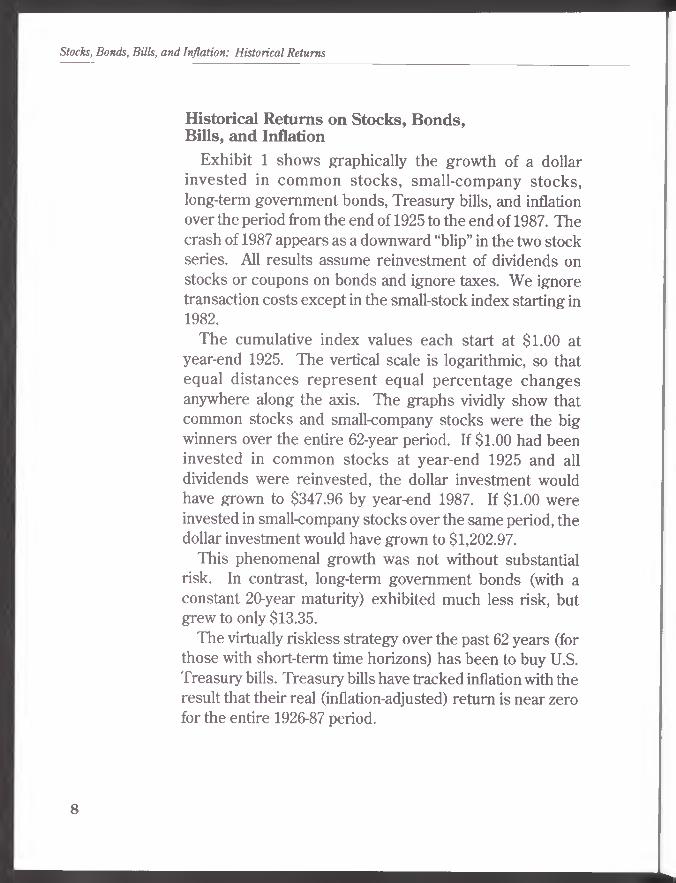
Historical Returns on Stocks, Bonds,Bills, and Inflation
Exhibit 1 shows graphically the growth of a dollar invested in common stocks, small-company stocks, long-term government bonds, Treasury bills, and inflation over the period from the end of 1925 to the end of 1987. The crash of 1987 appears as a downward “blip” in the two stock series. All results assume reinvestment of dividends on stocks or coupons on bonds and ignore taxes. We ignore transaction costs except in the small-stock index starting in 1982.
The cumulative index values each start at $1.00 at year-end 1925. The vertical scale is logarithmic, so that equal distances represent equal percentage changes anywhere along the axis. The graphs vividly show that common stocks and small-company stocks were the big winners over the entire 62-year period. If $1.00 had been invested in common stocks at year-end 1925 and all dividends were reinvested, the dollar investment would have grown to $347.96 by year-end 1987. If $1.00 were invested in small-company stocks over the same period, the dollar investment would have grown to $1,202.97.
This phenomenal growth was not without substantial risk. In contrast, long-term government bonds (with a constant 20-year maturity) exhibited much less risk, but grew to only $13.35.
The virtually riskless strategy over the past 62 years (for those with short-term time horizons) has been to buy U.S. Treasury bills. Treasury bills have tracked inflation with the result that their real (inflation-adjusted) return is near zero for the entire 1926-87 period.
8

The Long-Run Perspective
EXHIBIT 1WEALTH INDEXES OF INVESTMENTS IN
U.S. CAPITAL MARKETS (1926-1987)
(YEAR-END 1925 = 1.00)
Index
Year-End
9

Stocks, Bonds, Bills, and Inflation: Historical Returns
Common StocksAs noted above, an index of common stock total returns,
initialized on December 31, 1925 at $1.00, closed 1987 at $347.96. This was a yearly all-time high level, although far below the August 1987 monthly peak, when the S&P 500 total-return index closed at a level of $459.86.
The inflation-adjusted S&P 500 total-return index also reached its all-time monthly high level of $72.06 in August 1987. This index closed the year much lower but still at a yearly all-time high level of $54.05.
Small-Company StocksOver the long run, small-company stocks have far higher
returns than the S&P 500. The small-stock total-return index closed 1987 at $1,202.97. This represents a compound annual growth rate of 12.1 percent, the highest of any of the asset classes studied. Rolf W. Banz was the first to document the superior performance of small stocks (Banz 1981).
T he sm all-stock perfo rm ance in excess of the performance of large-company stocks exhibits long waves of high and low returns. In the late 1920s and early 1930s, small-company stocks fared far worse than large-company stocks. From 1932 to 1945, small stocks boomed; then, from 1946 to 1957, they lagged large stocks again. Starting in 1958, small stocks beat larger issues fairly consistently, with the biggest gains in small stocks occurring after 1974. From mid-1983 to late 1987, small stocks once again lagged their larger counterparts.
Long-Term Government BondsThe long-term government bond total-return index,
constructed with an approximately 20-year maturity, closed 1987 at a value of $13.35. This compares with the all-time

The Long-Run Perspective
high of $14.23 recorded at the end of February 1987. Long-term government bonds have had positive historical re tu rn s entirely because of income; the long-term government bond capital appreciation index fell to $0.66 at year-end 1987, about 50 percent below its all-time high.
Intermediate-Term Government BondsOver the 1926-87 period, intermediate-term government
bonds outperformed long-term government bonds. A dollar invested in intermediate-term bonds at year-end 1925, with coupons reinvested, grew to $17.89 by year-end 1987, compared to $13.35 for long-term government bonds. The compound annual total return for intermediate-term government bonds is 4.8 percent.
The superior performance of intermediate-term bonds was caused by the rise in bond yields over the period. Intermediate-term bond prices are less sensitive to yield changes than are long-term bonds; therefore, as yields rose, intermediate-term bonds suffered less than longer-term issues. Interm ediate-term bonds also outperformed Treasury bills because the intermediate issues had higher yields without offsetting price declines.
U.S. Treasury BillsA dollar invested in U.S. Treasury bills at the end of 1925
grew to $8.37 by year-end 1987, a compound annual growth rate of 3.5 percent. Treasury bills tend to track inflation, so that the average inflation-adjusted return on Treasury bills—the real riskless rate of return—was near zero (0.5 percent). Treasury bill returns followed distinct patterns throughout this period.
11

Stocks, Bonds, Bills, and Inflation: Historical Returns
Patterns in Treasury Bill ReturnsDuring periods of deflation (for example, the late 1920s
and early 1930s) Treasury bill returns were near zero but not negative, because no one intentionally buys securities with negative nominal yields. (Cash, which has a zero nominal yield, is always preferable to a security with a negative nominal yield. Investors do, however, intentionally buy securities with negative real yields when such securities offer the best yield available. This may occur in times of high inflation.) Beginning in the early 1940s, the yields (returns) on Treasury bills were pegged by the government at low rates while inflation was high.
Treasury bills tracked inflation after March 1951, when the U.S. Treasury-Federal Reserve Accord allowed Treasury bill yields to float freely. The tracking pattern weakened starting about 1973. Real riskless returns were unusually negative in the 1970s and unusually positive in the 1980s.
InflationThe compound annual inflation rate over the 1926-87
period was 3.0 percent. The inflation index, initiated at $1.00 at year-end 1925, grew to $6.44 by year-end 1987. All of this increase took place in the postwar period. The years 1926-33 were marked by deflation, but consumer prices rose to their 1926 levels by the middle of 1945. After a brief postwar spurt of inflation, prices rose slowly over most of the 1950s and 1960s. Then, in the 1970s, inflation reached a pace unprecedented in peacetime, peaking at 13.3 percent in 1979. (On a month-by-month basis, the peak inflation rate was a breathtaking 24.0 percent, stated in annualized terms, in August 1973.) The 1980s saw a reversion to more moderate, though still substantial, inflation rates averaging about 4 percent per year.
12

The Long-Run Perspective
Summary Statistics of Total ReturnsExhibit 2 presents summary statistics for the annual total
returns on each asset class over the entire 62-year period. The data summarized in these exhibits are described in detail in Chapters 3 and 6.
Note that in Exhibit 2, the arithmetic mean returns are always higher than the geometric mean returns. The difference between these two means relates directly to the variability of the series. For Treasury bills, the two means appear to be the same because of rounding, but the arithmetic mean is, in fact, higher than the geometric mean (see Chapter 6).
The histograms to the right in Exhibit 2 show the frequency distribution of returns on each asset class. The height of the common-stock histogram in the range between +10 and +20 percent, for example, shows the number of years that common stocks had a return in that range.
Riskier assets, such as common stocks and small- company stocks, have wide histograms, reflecting the broad distribution of returns from very poor to very good. Less risky assets, such as bonds, have narrow histograms, indicating the tightness of the distribution around the mean of the series. The histogram for T reasury bills is “one-sided,” lying almost entirely to the right of the vertical line representing a zero return; that is, Treasury bills experienced almost no negative returns on a yearly basis. Tire inflation histogram shows both positive and negative annual rates. Although deflationary months and even quarters have occurred recently, the last negative annual inflation rate was in 1954.
13

Stocks, Bonds, Bills, and Inflation: Historical Returns
EXHIBIT 2BASIC SERIES: SUMMARY STATISTICS
OF ANNUAL RETURNS (1926-1987)
Geometric Arithmetic StandardSeries Mean Mean Deviation Distribution
Common Stocks 9.9% 12.0% 21.1%
__ill. ■ llNilll.lSmall Company Stocks
12.1 17.7 35.9
___ >ll.lll.llilll l.l . ..Long-Term Corporate Bonds
4.9 5.2 8.5
.1 ill . .Long-Term Government Bonds 4.3 4.6 8.5
.ill... . .Intermediate-Term Government Bonds
4.8 4.9 5.5
IILU.S. Treasury Bills 3.5 3.5 3.4
i.Inflation Rates 3.0 3.2 4.8
------1------ 1------1------1------1------ !------ !-----lrr i i i i i i i
-90% 0% 90%
14

3 Description of the Basic Series
This chapter describes the construction of the returns on the seven basic asset classes and portrays the market results graphically. We form annual returns for each asset by compounding monthly returns. In all cases, with the exception of small-company stocks starting in 1982, we assume no taxes or transactions costs. As explained below, returns for small-company stocks starting in 1982 reflect the performance of an actual, tax-free investment and therefore reflect transaction costs but not taxes.
Common StocksTotal ReturnsThe common-stock total-return index is based on the
S&P’s Composite Index. This index is a readily available, carefully constructed, market-value-weighted benchmark of common stock performance. Market-value-weighted means that the weight of each stock in the index, for a given month, is proportionate to its price times the number of shares outstanding (i.e., market capitalization) at the beginning of that month. Currently, the S&P Composite includes 500 of the largest stocks (in terms of stock market value) in the United States; prior to March 1957, it consisted of 90 of the largest stocks.

Stocks, Bonds, Bills, and Inflation: Historical Returns
EXHIBIT 3COMMON STOCKS: RETURNS,
RETURN INDEXES, AND YIELDS (1926-1987)
Index
60-50-403020-10-
0-- 10-
- 20-
-30--40--50-
Total Annual Returns in Percent
i l l , 111 ..ill 1■ 11 1 III ll .ll l l .ll n il.i| r | ’||
1940 1950 1960Year
1970 1980 1987
16
Yields in Percent

Description of the Basic Series
The total return for a given month is equal to the capital appreciation plus income for that month.
Capital AppreciationThe capital appreciation component of the common stock
total return is the change in the S&P 500-stock index (or 90-stock index) as reported in the Wall Street Journal from 1977 to 1987, and in Standard & Poor’s Trade and Securities
Statistics from 1926 to 1976.
IncomeFor 1977-87, income equals realized dividends and is
provided by the American National Bank and Trust Company of Chicago. American National Bank and Trust obtains monthly income numbers from Wilshire Associates, Santa Monica, California, and makes occasional minor modifications. These modifications typically are made when a company pays a dividend in the form of another company’s stock; such payments are rare. American National Bank and Trust treats such payments differently from Wilshire.
We assume that dividends accumulate over the month, and we then invest them on the last trading day of the month in the S&P index at the day’s closing level. For 1926 through 1976, quarterly dividends are extracted from rolling yearly dividends reported quarterly in Standard & Poor’s Trade and Securities Statistics, and are then allocated to months within each quarter using proportions taken from the 1974 actual distribution of monthly dividends within quarters.
ResultsA dollar invested in common stocks at year-end 1925, with
dividends reinvested, grew to $347.96 by year-end 1987; this represents a compound annual growth rate of 9.9 percent

Stocks, Bonds, Bills, and Inflation: Historical Returns
(see Exhibit 3). Capital appreciation alone caused a dollar to grow to $19.37 over the 62-year period, representing a compound annual growth rate of 4.9 percent. Total annual returns ranged from a high of 54.0 percent in 1933 to a low of-43.3 percent in 1931. The average annual dividend yield was 4.8 percent.
Small Capitalization StocksNYSE Fifth Quintile Returns (1926-1981)To represent the equities of smaller companies from 1926
to 1980, we use the historical series developed by Rolf W. Banz. This is composed of stocks in the ninth and tenth (smallest) deciles (i.e., the fifth quintile) of the NYSE where the stocks on the NYSE are ranked by capitalization (price times number of shares outstanding) and each decile contains an equal number of stocks at the beginning of each formation period.
The ninth and tenth decile portfolio was first ranked and formed as of December 31,1925. This portfolio was “held” for five years, with value-weighted portfolio returns computed monthly. Every five years through December 31, 1980, the portfolio was rebalanced (i.e., all of the stocks on the NYSE were re-ranked, and a portfolio of those falling in the ninth and tenth deciles was again formed). Banz’s method avoids survivorship bias by including the return after the delisting from the NYSE. (Survivorship bias is the optional bias caused by studying only stocks which have survived bankruptcy, takeover, and so forth.)
For 1981, Dimensional Fund Advisors, Inc. updated the returns using Banz’s methods. The data for 1981 are significant to only three decimal places (in decimal form) or one decimal place when returns are expressed in percent, so that the trailing zeroes are superfluous for that year.
18

Description of the Basic Series
DFA Small Company Fund (1982-1987)Beginning in 1982, the small-company stock return series
is the total return, net of all expenses, of the Dimensional Fund Advisors (DFA) Small Company Fund. The fund is, in effect, a live market-value-weighted index of the ninth and tenth deciles of the NYSE, plus stocks listed on the American Stock Exchange (AMEX) and over-the-counter (OTC) with the same or less capitalization as the upper bound of the NYSE ninth decile. Through 1987, the Fund did not purchase stocks if they were smaller than $10 million in market capitalization (although it holds stocks that fall below that level). The portfolio does not buy bankrupt companies but will retain companies that become bankrupt. At least twice yearly, DFA recomputes size boundaries.
The portfolio retains stocks until they rise into the seventh NYSE decile or higher. Beginning in 1982, the portfolio’s performance represents after-transaction-cost returns, as contrasted with before-transaction-cost returns for the other asset classes and for pre-1982 small company stocks.
As of year-end 1987, the DFA Small Company Fund contained approximately 1,895 stocks, with an average capitalization of about $38 million. The upper bound of the ninth decile at that time was about $74 million.
ResultsA dollar invested in small-company stocks at year-end
1925 grew to $1,202.97 by year-end 1987 (see Exhibit 4). This represents a compound annual return of 12.1 percent over the past 62 years. Total annual returns ranged from a high of 142.9 percent in 1933 to a low of-58.0 percent in 1937.
19

Stocks, Bonds, Bills, and Inflation: Historical Returns
EXHIBIT 4SMALDCOMPANY STOCKS:
RETURNS AND RETURN INDEXES (1926-1987)
Index
Total Annua) Returns in Percent
J i l l I 1 if.. II. I 1 1III 1 1. I l l lllll 1.
PI
I >1 1 - ■ 1 ■ 1n i l
■ 1
“ 1 '—i----------1----------1--------- 1------ r11930 1940 1950 I 960 1970 1980 1987
Year
20

Description of the Basic Series
Long-Term Corporate BondsBecause most large corporate bond transactions take
place over the counter, the natural source of data is a major dealer. Salomon Brothers has constructed the Long-Term High-Grade Corporate Bond Index. This monthly index is used from its inception in 1969 through 1987. The index includes nearly all Aaa- and Aa-rated bonds. If a bond is downgraded during a particular month, its return for the month is included in the index and the bond is then removed from future portfolios.
In 1985, Salomon Brothers introduced a Broad Index, which some people consider to be a replacement for the Long-Term High-Grade Corporate Bond Index. We continue to use the Salomon B rothers Long-Term High-Grade Corporate Bond Index.
For the period 1946-68, the Salomon Brothers’ Index, using Salomon B ro th ers’ m onthly yield data, was backdated, with a methodology similar to that used by Salomon Brothers for 1969-87. For the period 1925-45, S&P’s monthly High-Grade Corporate Composite yield data were used, assuming a 4 percent coupon and a 20-year maturity.
Monthly capital appreciation returns for 1926-68 were calculated from yields assuming (at the beginning of each monthly holding period) a 20-year maturity, a bond price equal to par, and a coupon equal to the yield. The conventional present-value formula for bond price for the beginning and end-of-month prices was used (Ross and Westerfield 1988). The monthly income return is assumed to be one-twelfth of the coupon. Total returns are equal to capital appreciation plus income.
21

Stocks, Bonds, Bills, and Inflation: Historical Returns
EXHIBIT 5LONG-TERM CORPORATE BONDS: RETURNS AND RETURN INDEXES
(1926-1987)
Index
22
Total Annual Returns In Percent
Hill IllllihlmlL 111 III, 1 IlLl ■ hJ . J■ r i | - 11i------- 1------- 1------- 1------- 1—
1930 1940 1950 1960 1970
1 ||" 'i r
1900 1987

Description of the Basic Series
ResultsA dollar invested in long-term high-grade corporate
bonds at the end of 1925 grew to $19.78 by year-end 1987. The compound annual return is 4.9 percent (see Exhibit 5).
Long-Term Government BondsTotal ReturnsThe total returns on long-term U.S. government bonds
over 1926-76 come from the Government Bond file at the Center for Research in Security Prices (CRSP), Graduate School of Business, University of Chicago. Each year, we “buy” a one-bond portfolio containing a bond with a term of approximately 20 years and a reasonably current coupon, and which avoids potential tax benefits, im paired negotiability, or special redemption or call privileges. Where callable bonds are necessary, we assume that the term of the bond is a simple average of the maturity and first call dates minus the current date. The bond is “held” for the calendar year and monthly returns are recorded.
From 1977 to 1987 we used the same method with data from the Wall Street Journal For example, the bond used in 1987 is the 10 percent issue of May 2005/2010 (that is, first callable in 2005 and maturing in 2010).
Total returns for 1977 through 1987 are calculated as the change in the flat price. The flat price is the average of the bond’s bid and ask prices, plus the accrued coupon. (For the purpose of calculating the return in months when a coupon payment is made, the change in flat price includes the coupon.) The accrued coupon is equal to zero on the day a coupon is paid, and increases over time until the next coupon payment, according to this formula:
A = fC (1)
23

Stocks, Bonds, Bills, and Inflation: Historical Returns
where
A = accrued coupon;
C = semiannual coupon rate; and
f = number of davs since last coupon payment number of days from last coupon payment to next coupon payment
Prior to January 1985, the number of half-months instead of the number of days was used to calculate f in equation (1). This gives acceptable results, because coupons typically are paid on the 15th of the month; to obtain greater accuracy, the calculation method was converted to days between dates.
YieldThe yield on the long-term government bond series is
defined as the internal rate of return that equates the bond’s price (the average of bid and ask, without adding the accrued coupon) with the stream of cash flows (coupons and principal) promised to the bondholder. For years when a noncallable bond was used, the yield is calculated as if the bond were held to maturity; that is, the yield to maturity is reported. When a callable bond was used, the reported yield is the yield to first call if the bond was selling above par; otherwise the reported yield is the yield to maturity. The yield is calculated as a semiannually compounded rate, then multiplied by two to convert to an annual rate, and expressed as a percentage.
Income, or Yield, ReturnThe income return (or yield return) for a given month is
assumed to be equal to the previous month-end yield after conversion to a monthly rate. For the period 1926-76, the income return for a given month is calculated as the total
24

Description of the Basic Series
return minus the capital appreciation return (see below). For 1977-87, the income return (It) in month t is calculated as:
It=l +
V6
-1(2)
where
yt l = bond’s previous month-end yield to maturity or yield to first call, as explained above, stated as an annual rate in decimal (not percent) form.
The term “income return” is used here to mean the yield return. In other contexts, the same term is sometimes used to mean the current yield (coupon divided by price).
Return in Excess of Yield, or Capital Appreciation For 1926-76, we obtain the return in excess of yield
(labeled capital appreciation) from the CRSP Government Bond File. For the period 1977-87, we calculate the return in excess of yield as the total return minus the income return for each month.
The term capital appreciation is sometimes used to mean the price change on a bond, as it does for a stock. Here, a bond’s capital appreciation is defined as the total return minus the income (yield) return—that is, the return in excess of yield. This definition omits capital appreciation or depreciation that comes from the movement of a bond’s price toward par (in the absence of interest-rate change) as it matures. Stated another way, our measure of a bond’s capital appreciation captures changes in bond price caused by changes in the interest rate.
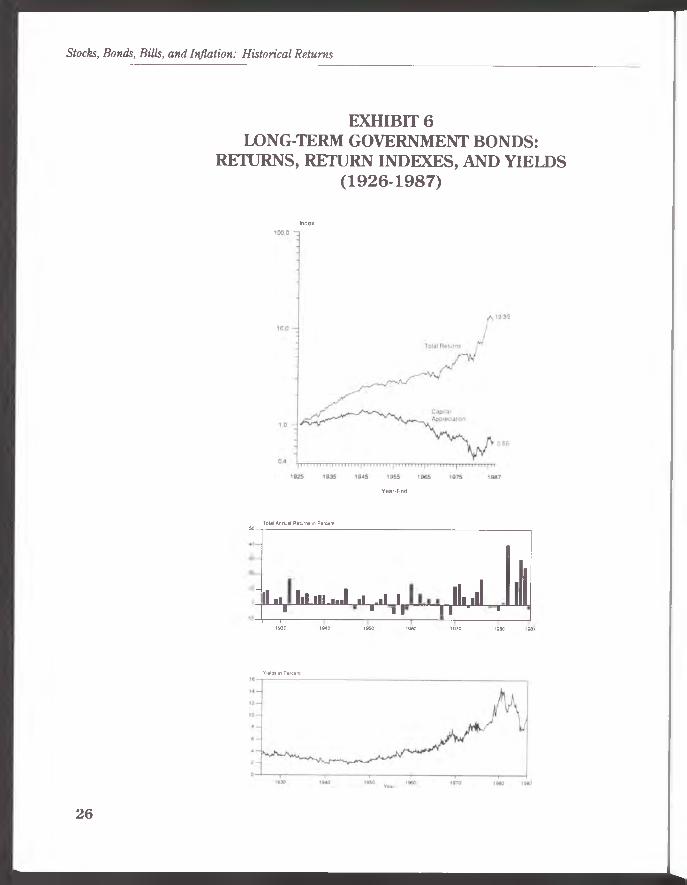
ResultsA dollar invested in long-term government bonds at
year-end 1925, with coupons reinvested, grew to $13.52 by25
Stocks, Bonds, Bills, and Inflation: Historical Returns
EXHIBIT 6LONG-TERM GOVERNMENT BONDS:
RETURNS, RETURN INDEXES, AND YIELDS (1926-1987)
Index
Year-End
Total Annual Returns in Percent 50—.------------------------------------------
' iL l IlLlll.ml- il .ii 1 _ ill ill i l- U 1 1 ■1 I I ' 1
1930 1 940 1950 1960 1970 1900 1 96/
Yields in Percent
26

Description of the Basic Series
year-end 1987; this represents a compound annual return of 4.3 percent (see Exhibit 6). Returns from the capital appreciation component, however, caused a dollar to decrease to $0.66, representing a compound annual return of almost -0.7 percent. Total annual returns ranged from a high of 40.4 percent in 1982 to a low of -9.2 percent in 1967. The average yield to maturity (or yield to first call, where applicable) was 4.9 percent.
Intermediate-Term Government Bonds
Total ReturnTotal returns of the intermediate-term government bonds
over the 1934-86 period come from the CRSP Government Bond File. We calculated returns for 1987 from Wall Street Journal prices, using the coupon accrual method described above for long-term government bonds.
As with long-term government bonds, we form one-bond portfolios. Each year, we choose the shortest noncallable bond with a maturity not less than five years. This bond is “held” for the calendar year, and monthly returns are recorded. (Bonds with impaired negotiability or special redemption privileges are passed over, as are partially or fully tax-exempt bonds starting in 1943.) If, for a given year, a noncallable bond with a maturity between five and eight years does not exist, we choose a callable bond, giving preference to bonds selling below par. Where callable bonds are necessary, we assume that the term of the bond is the term to maturity. The series consists entirely of noncallable bonds starting in 1955.
Over the period 1934-42, almost all bonds with maturities near five years were partially or fully tax exempt. Such bonds are used in this period, with the same selection rules as for the later period described above. Personal tax rates
27

Stocks, Bonds, Bills, and Inflation: Historical Returns
were generally low in that period, so that yields on tax-exempt bonds were similar to yields on taxables.
Over 1926-33 period, there were few or no bonds suitable for construction of a series with a five-year maturity. For this period, we use estimates of five-year bond yields (Coleman et al. 1988). The estimates reflect what a “pure play” five-year Treasury bond, selling at par and with no special redemption or call provisions, would have yielded had one existed. Estimates are for partially tax-exempt bonds for 1926-32 and for fully tax-exempt bonds for 1933.
We convert monthly yields to monthly total returns by calculating the beginning and end-of-month “flat” prices for the hypothetical bonds. We “buy” the bond at the beginning of the month at par (i.e., the coupon equals the previous month-end yield), assuming a maturity of five years. We then “sell” it at the end of the month, with the flat price calculated by discounting the coupons and principal at the end-of-month yield, assuming a maturity of 4 years and 11 months. The flat price is the price of the bond including coupon accruals, so that the change in flat price represents total return. We assume that monthly income returns are equal to the previous end-of-month yield, stated in monthly terms. We form monthly capital appreciation returns as total returns minus income.
YieldThe yield reported for intermediate-term government
bonds for the 1934-86 period was obtained from the CRSP Government Bond File. It is the semiannually compounded yield to maturity (or yield to first call where the bond is callable and selling above par), multiplied by two to form an annual rate, and stated in percent. Yields for 1926 through 1933 are estimates from Coleman et al. (1988). H ie yields for 1987 are calculated from Wall StreetJournal prices. The
28

Description of the Basic Series
yield is the internal rate of return that equates the bond’s price with the stream of cash flows (coupons and principal) promised to the bondholder.
Income and Capital AppreciationFor the period 1934-86, capital appreciation (return in
excess of yield) is taken directly from the CRSP Government Bond File. The income return is calculated as the total return minus the capital appreciation return. For the period 1926-33, the income and capital appreciation components of total return are generated from yield estimates as described above under ‘Total Return” for that period. Income and capital appreciation returns for 1987 are calculated from Wall Street Journal prices.
ResultsA dollar invested in intermediate-term government bonds
at year-end 1925, with coupons reinvested, grew to $17.89 by year-end 1987. This represents a compound annual return of 4.8 percent (see Exhibit 7).
Returns from the capital appreciation component caused a dollar to increase only to $1.12 over the 62-year period, representing a compound annual return of approximately0.2 percent. This result differs from what might be expected: because yields rose on average over the period, capital appreciation on a hypothetical intermediate-term government bond portfolio with a constant five-year maturity would be negative. This positive average return is explained at the end of this chapter.
Total annual returns ranged from a high of 29.1 percent in 1982 to a low o f-2.3 percent in 1931. The average yield to maturity (or yield to first call, where applicable) was 4.5 percent.
29

Stocks, Bonds, Bills, and Inflation: Historical Returns
EXHIBIT 7INTERMEDIATE-TERM GOVERNMENT BONDS:
RETURNS, RETURN INDEXES, AND YIELDS (1926-1987)
Index
Total Annual Returns in Percent 3 0 — |------------------------------20-
1930 1940 1950 1960 1970 1980 1987
30

Description of the Basic Series
United States Treasury BillsFor the U.S. Treasury bill index, data from the CRSP U.S.
Government Bond File were used through 1976; the Wall Street Journal is the source thereafter. Each month a one-bill portfolio containing the shortest-term bill having not less than one month to maturity is constructed. (The term to maturity of the bill when originally issued is not relevant.) To measure holding period returns for the one-bill portfolio, the bill is priced as of the last trading day of the previous month-end and as of the last trading day of the current month.
The price of the bill (Pt) at each point in time (t) is given as:
Pt = (l-rd /360) (3)
where
r = yield on the bill at that time (the average of bid and ask quotes, converted to decimal form), and
d = number of days to maturity.
The total return on the bill is then the month-end price divided by the previous month-end price, minus one.
ResultsA dollar invested in U.S. Treasury bills at year-end 1925
grew to $8.37 by year-end 1987; this represents a compound annual return of 3.5 percent (see Exhibit 8). Total annual returns ranged from a high of 14.7 percent in 1981 to a low of 0.0 percent in 1938. The average yield over the period was 3.5 percent.
InflationThe Consumer Price Index for All Urban Consumers, not
seasonally adjusted (CPI-U NSA) is used to measure
31

Stocks, Bonds, Bills, and Inflation: Historical Returns
EXHIBIT 8U.S. TREASURY BILLS: RETURNS, RETURN INDEXES, AND YIELDS
(1926-1987)
Index
Total Annual Raturns in Parcant
32

Description of the Basic Series
inflation, which is the rate of change of consumer goods prices. Unfortunately, the inflation rate as measured by the CPI is not measured over the same period as the other asset returns. All of the security returns are measured from one month-end to the next month-end. CPI commodity prices are collected during the month. Thus, measured inflation rates lag the other series by about one-half month. Prior to January 1978, we used the CPI (as contrasted with CPI-U), not seasonally adjusted. Both inflation measures are constructed by the U.S. Department of Labor, Bureau of Labor Statistics, Washington, D.C.
ResultsA basket of consumer goods costing a $1.00 at year-end
1925 would have cost $6.44 by year-end 1987 (see Exhibit 9). Of course, the exact contents of the basket would have changed over time. This increase represents a compound annual inflation rate of 3.0 percent over the past 62 years. Inflation rates ranged from a high of 18.2 percent in 1946 to a low of -10.3 percent in 1932.
Why Was Capital Appreciation on Intermediate-Term Government Bonds Positive?
The capital appreciation component of intermediate-term government bond returns causes $1.00 invested at year-end 1925 to grow to $1.12, a compound annual rate of 0.2 percent. This is surprising, as yields rose on average over the period.
An investor in a hypothetical five-year constant-maturity portfolio, with continuous rebalancing, suffers an 18.95 percent capital loss (excluding coupon income) over the period 1926-87, or -0.34 percent per year. An investor who rebalances yearly, choosing bonds according to the method set forth above, fares better, earning the 0.2 percent per year capital gain recorded here.
33

Stocks, Bonds, Bills, and Inflation: Historical Returns
EXHIBIT 9INFLATION: RATES OF CHANGE
AND CUMULATIVE INDEXES
Index
To<al Annua) Returns in Percent
20-----------------
34

Description of the Basic Series
The reason for this performance relates to the way the intermediate-term bond series was constructed. For the period 1926-33, we use a constant maturity of five years, rebalancing monthly. For the period 1934-87, we use a one-bond portfolio, choosing, at the beginning of each year, the shortest bond not less than five years to maturity. We use callable and fully or partially tax-exempt bonds only when necessary to obtain a bond for that year. The maturities of the bonds selected range from five to eight years.
There are several possible reasons for the positive capital appreciation return; any or all of them could apply. First, intermediate-term government bonds were scarce in the 1930s and 1940s. As a consequence, we sometimes held bonds with maturities substantially longer than five years. Second, the 1930s and the first half of the 1940s were very bullish for the bond market. Longer bonds, used to construct this series, not only had higher yields but also had substantially higher capital gain returns than bonds with exactly five years to maturity would have had if any had existed. This upward bias is particularly noticeable in 1934, 1937, and 1938.
The conversion of the Treasury bond market from tax-exempt to taxable status produced a one-time upward jump in stated yields, but not a capital loss on any given bond. Thus, part of the increase in stated yield from 1926 to 1987 does not cause a capital loss on the intermediate- term bond index. Further, the use of callable bonds in the early part of the period may command a return premium for taking this extra risk.
35

Stocks, Bonds, Bills, and Inflation: Historical Returns
36

4. Description of the Derived Series
Historical data suggest that investors are rewarded for taking risks and that returns are related to inflation rates. We can discern the risk-return and the real-nominal relations in the historical data by looking at the component parts of the basic asset series described in the previous chapter.
Geometric Subtraction Used to Calculate Derived Series
As noted in Chapter 1, the method of calculating series differences, or derived series (risk prem ium s and inflation-adjusted series) differs from the method used in some previous editions of this book. In this edition, derived series were calculated by division ra th e r than by subtraction. In the division method that we use, returns on basic series A and B and derived series C are related as follows:
(1 + C) = (1 + A )/(1 + B), (4)
whereseries A, B, and C are in decimal form (i.e., 5 percent is indicated by 0.05).

Stocks, Bonds, Bills, and Inflation: Historical Returns
Thus, series C is given by:
C = (1 + A )/(1 + B) -1. (5)
This method is referred to as geometric subtraction, to distinguish it from arithmetic subtraction.
For example, suppose return A equals 15 percent, or 0.15; and return B is 5 percent, or 0.05. Then, C equals (1.15/1.05) - 1 = 0.0952, or 9.52 percent. This result is different from the simple arithmetic difference of 10 percent.
Definitions of the Derived (Component) SeriesFrom the seven basic asset classes—common stocks,
small stocks, long-term corporate bonds, long-term government bonds, intermediate-term government bonds, U.S. T reasury bills (T-bills), and consum er goods (inflation)—10 additional series are derived representingthe component or elemental These 10 derived series are
Series Title
Risk Premium Series(1) Bond horizon premiums(2) Bond default premiums(3) Equity risk premiums(4) Small stock premiums
Inflation-Adjusted Series(5) Inflation-adjusted T-bill
returns (Real riskless rate of return)
(6) Inflation-adjusted common stock returns (Series 3 + 5)
parts of the asset returns.
Derivation
(LT Govt bonds) - (T-Bills)(LT Corp bonds) - (LT Govt bonds) (Common stocks) - (T-bills)(Small stocks) - (Common stocks)
(Treasury bills) - (Inflation)
(Common stocks) - (Inflation)
38

Description of the Derived Series
(7) Inflation-adjusted small stock returns (Series 3 + 4 + 5)
(Small stocks) - (Inflation)
(8) Inflation-adjusted (LT Corp bonds) - (Inflation)corporate bond returns (Series 1 + 2 + 5)
(9) Inflation-adjusted long-term (LT Govt bonds) - (Inflation) government bond returns(Series 1 + 5)
(10) Inflation-adjusted (IT Govt bonds) - (Inflation)intermediate-termgovernment bond returns
As noted, the 10 derived series are produced using geometric, not arithmetic, subtraction. The minus (-) sign is used for convenience in the above table, and in various places throughout this book, to express geom etric subtraction. Also, the plus (+) sign at various points in the left column of the above table refers to geometric, not arithmetic, addition. The geometric sum of A and B, signified by C, is formed as follows:
In the more lengthy description of each series, given below, the full mathematical expression is shown.
Two Categories of Derived SeriesThe 10 derived series may be categorized as risk
premiums, or payoffs for taking various types of risk, and inflation-adjusted asset returns. The risk premium series are the bond horizon and default premiums, the equity risk premium, and the small stock premium. The inflation- adjusted asset return series are the six series constructed by geometrically subtracting inflation from an asset total return series.
The construction and interpretation of the derived series is discussed in the following paragraphs.
C = [(1 + A )x ( l + B )]-1 (6)
39

Stocks, Bonds, Bills, and Inflation: Historical Returns
EXHIBIT 10U.S. TREASURY BILLS: REAL AND
NOMINAL RETURN INDEXES (1925-1987)
Index
40

Description of the Derived Series
Inflation-Adjusted U.S. Treasury Bill Returns (Real Riskless Rates of Return)
In contemporary finance, the real riskless rate of interest is commonly estimated as the difference in returns between consumer goods (inflation) and U.S. Treasury bills, which are a short-term, virtually risk-free asset. Thus, we call the real return on risk-free bills the real riskless rate of interest, Rr. This is represented by:
Rj- = Rfj- = 1(1 + Rf) / (1 + Rf) ] -1 (7)
where
Rf = return on 30-day Treasury bills,
Rj = rate of inflation, and
Rfr = Rf adjusted for inflation; the r in the expression signifies “real”.
ResultsTreasury bills returned 3.5 percent compounded annually
over the 1926-87 period in nominal terms, but only 0.4 percent in real (inflation-adjusted) terms. (See Exhibit 10.) Thus, an investor in Treasury bills would have barely kept ahead of inflation over the 62-year period.
Bond Horizon PremiumsLong-term government bonds behave differently from
short-term bills in that their prices (and hence returns) are more sensitive to interest-rate fluctuations. There is reason to believe that investors demand a premium for holding long-term bonds instead of short-term U.S. Treasury bills. This premium is called the bond horizon premium, Rfr.
The bond horizon premium is given by:
Rh = [(1 + R g)/(1 + Rf)] -1 (8)
41

Stocks, Bonds, Bills, and Inflation: Historical Returns
where
Rg = return on long-term government bonds, and
Rf = return on 30-day Treasury bills.
The bond horizon premium, Rft, has sometimes been referred to by the misnomer “liquidity premium.” In fact, Treasury securities are almost always highly liquid (marketable), regardless of their term to maturity. The rationale behind the term “horizon premium” is discussed below.
We use long-term ra ther than interm ediate-term government bonds to derive the bond horizon premium because they contain a “full unit” of price fluctuation risk. Intermediate-term government bonds may be expected to display a partial horizon premium, that is, one that is smaller than that observed as the difference between long-term bonds and short-term bills.
Does Maturity or Duration Determine the Bond Premium?In the previous edition of this work, R^ was referred to as
the “maturity premium,” based on the observation that bonds with longer maturities commanded a return premium over shorter-maturity bonds. Term to maturity, however, is not the bond characteristic that determines this return premium. More likely, the duration of a given bond determines the amount of return premium arising from differences in bond life.
Duration is the present-value-weighted average time to receipt of cash flows (coupons and principal) from holding a bond, and may be calculated from the bond’s yield, coupon rate, and term to maturity.
42

Description of the Derived Series
Why a “Horizon”Premium?Investors often strive to match the duration of their bond
holdings (cash inflows) with the estimated duration of their obligations, or cash outflows. As a consequence, investors with short time horizons regard long-duration bonds as risky (because of price fluctuation risk), and short-term bills as riskless. Conversely, investors with long time horizons regard short-term bills as risky (because of the uncertainty of the yield at which bills may be reinvested), and long-duration bonds as riskless or less risky.
Empirically, long-duration bonds have higher yields than short-term bills. That is, the yield curve slopes upward on average over time. Likewise, long-duration bond returns historically exceed bill returns. These observations indicate that more investors are averse to the price fluctuation risk of long bonds than to the reinvestment risk of bills. In other words, it appears that there are more investors with short time horizons than with long ones.
The conclusion, then, is that bond-duration risk is in the eye of the beholder, or bondholder. Therefore, rather than labeling Rft as a premium for long-bond risk (which implies a judgment that short-horizon investors are “correct” in their risk perceptions), it is better to go directly to the source of the return differential—the differing time horizons of investors—and label Rft a “horizon premium.”
Bond Default PremiumsInvestors in corporate bonds face the possibility of
default. Thus, in addition to inflation, the real riskless rate, and the horizon premium, holders of corporate bonds expect to receive a premium which reflects this default possibility. This default premium is measured as the difference in returns between corporate bonds and
43
Stocks, Bonds, Bills, and Inflation: Historical Returns
government bonds of equal maturity. The monthly default premiums, R^, are estimated according to:
R d - [ ( l + R c)/(i + R g )M (9)
where
Rc = return on long-term corporate bonds, and
Rg = return on long-term government bonds.
Components of the Default PremiumBonds susceptible to default have higher expected
returns than default-free bonds. Default on a bond may range from a small lo ss—such as a late in te res t payment—to loss of principal. Thus, part of the ex ante default premium on a portfolio of bonds is lost if some bonds default.
The remainder of the default premium—in excess of the portion lost by defaults—is a realized risk premium, which takes into account actual loss experience. The true expected return on a corporate bond, or portfolio of corporate bonds, then, is less than the bond’s yield. The portfolio’s yield may be thought of as an upper bound on the expected return. The expected return on a corporate bond is equal to the expected return on a government bond of like maturity, plus some estimate of the realized risk premium.
Callability Risk is Captured in the Default PremiumBecause the long-term U.S. government bond series and
the long-term corporate bond series have approximately equal maturities, the net rate of return between the two series is primarily related to differences in the probability of coupon or principal default. It should be noted, however, that the bond default premium as measured here also inadvertently captures any premium that investors may demand or receive for callability risk.
44

Description of the Derived Series
Callability risk is the risk that a bond will be redeemed (at or near par) by its issuer before maturity, at a time when market interest rates are lower than the bond’s coupon rate. The possibility of redemption causes risk because such a redemption would prevent the bondholder whose issue has been redeemed from reinvesting the proceeds at the original (higher) interest rate.
Inflation-Adjusted Long-Term Government Bond Returns
The monthly inflation-adjusted long-term government bond returns, Rgr, are estimated as:
Rgr = [(1 + Rg)/(1 + Rf)] - 1 (10)where
Rg = return on long-term government bonds, and
Rl = rate of inflation.
The additional subscript r on the symbol, Rgr, reflects the fact that the series is real (inflation-adjusted).
Because government bond returns are composed of inflation, the real riskless rate (Rr), and the horizon premium (Rft), the inflation-adjusted government bond returns may also be expressed as:
Rgr = [(1 + Rr) x (1 + Rfo)] -1 (11)
ResultsLong-term government bonds returned 4.3 percent
compounded annually in nominal terms, and 1.2 percent in real (inflation-adjusted) terms (see Exhibit 11) over the past 62 years. Thus, over this period, government bonds have outpaced inflation despite generally falling bond prices.
45

Stocks, Bonds, Bills, and Inflation: Historical Returns
EXHIBIT 11LONG-TERM GOVERNMENT BONDS:
REAL AND NOMINAL RETURN INDEXES (1925-1987)
Index
46

Description of the Derived Series
Inflation-Adjusted Intermediate-Term Government Bond Returns
The monthly inflation-adjusted interm ediate-term government bond returns, Rnr, are estimated as:
R n r= [(l + R n)/(l + R l)M (12)
where
Rn = retu rn on interm ediate-term governm ent bonds, and
Rj = rate of inflation.
The additional subscript r on the symbol, Rnr, reflects the fact that the series is real (inflation-adjusted). The symbol n is used here to represent intermediate-term government bonds.
Inflation-Adjusted Corporate Bond ReturnsMonthly inflation-adjusted corporate bond returns, Rcr ,
are estimated as:
Rcr = l(l + R c ) /a + R i) ] - l (13)
where
Rc = return on long-term corporate bonds, and
Rj = rate of inflation.
The additional subscript r on the symbol, R ^, signifies real returns.
Long-term corporate bond returns contain all of the components of long-term government bond returns, Rgr (i.e., government bonds adjusted for inflation) plus the default premium (R^); hence
Rc r « [ ( l + Rgr) x ( l + R d)l-1 (14)
47

Stocks, Bonds, Bills, and Inflation: Historical Returns
Equivalently,
Rcr =(1 + Rr) x (1 + Rh) x (1 + Rd) -1 (15)
where the variables are defined as above.
Equity Risk PremiumsBecause common stocks are not strictly comparable with
bonds, horizon and default premiums are omitted in analysis of the components of equity returns. (Common stocks have characteristics which are analogous to horizon and default risk, but they are not the same thing.) Hence, the difference between common stock returns and U.S. Treasury bill returns is taken as a whole and entitled the “equity risk premium.”
Common stock returns, then, are considered in this analysis to be composed of inflation, the real riskless rate, and the equity risk premium.
Estimation of the monthly risk premiums, Rp, is given by
Rp = [(1 + Rm)/ (1 + Rf) 1" 1 (lb)
where
Rm = return on common stock, and
Rf = return on 30-day Treasury bill.
Inflation-Adjusted Common Stock ReturnsMonthly inflation-adjusted common stock returns, Rmr,
are estimated as:
Rmr = [(1 + Rm) / (1 + R[)] -1 (17)
where
Rm = return on common stock, and
Rf = rate of inflation.
48

Description of the Derived Series
1000.0 -
100 .0 -
10.0
1.0
0.4
EXHIBIT 12COMMON STOCKS: REAL AND NOMINAL RETURN INDEXES
(1925-1987)
Index
Year-End
49

Stocks, Bonds, Bills, and Inflation: Historical Returns
This may also be expressed as the sum of the real riskless rate (Rr) and the equity risk premium (Rp):
Rmr = [ (1 + Rf) x (1 + Rp) ] -1 (18)
ResultsCom m on stock to ta l re tu rn s w ere 9.9 p e rc e n t
compounded annually from 1926 to 1987 in nominal terms (see Exhibit 12). In real (inflation-adjusted) terms, stocks provided a 6.6 percent compound return, indicating that a common stock investor would have experienced a great increase in real wealth, or purchasing power, over the 62-year period.
Small-Stock PremiumsThe small-stock premium, Rq, is defined as the excess of
monthly small-stock returns (Rg) over monthly common stock (S&P) returns (Rm). (The letter q in Rq signifies the fifth “quintile.”) Thus, Rq is given by
Rq = [(1 + Rs)/(1 + Rm) ] -1 (19)
Inflation-Adjusted Small-Stock ReturnsMonthly inflation-adjusted small-stock returns, Rsr, are
estimated as:
Rs r = [( l + Rs)/(1 + R i)]-1
where
Rs = return on small-company stocks, and
Rl = rate of inflation.
This may also be expressed as the sum of the components of common stock real returns (Rmr) plus the small-stock premium (Rq), hence:
50

Description of the Derived. Series
Rsr ~ [ (1 + Rmr) x (1 + Rq) ] ■ 1 (21)
This is equivalent to
Rsr = [ (1 + Rr) x (1 + Rp) x (1 + Rq) ] -1 (22)
where
Rr = real riskless rate,
Rp = equity risk premium, and
Rq = small-stock premium.
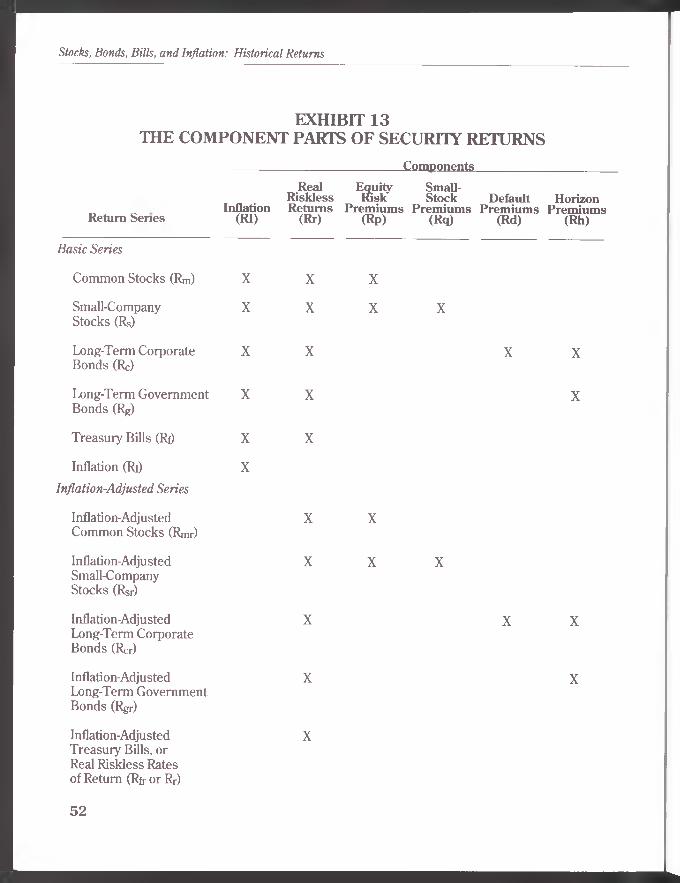
Component Returns: A SummaryAs illustrated above, the returns on various types of
securities may be broken into their component parts. Exhibit 13 presents a summary table of the basic and derived series component parts.
51
Stocks, Bonds, Bills, and Inflation: Historical Returns
EXHIBIT 13THE COMPONENT PARTS OF SECURITY RETURNS
______________________________ Com ponents_______________________
Real Equity Small-R isk less Risk Stock Default Horizon
„ „ Inflation Returns Prem ium s Prem ium s Prem ium s Prem ium sReturn S en es (RI) (Rr) (Rp) (Rq) (Rd) (Rh)
Basic Series
Common Stocks (Rm) X X X
Small-Company Stocks (Rs)
X X X X
Long-Term Corporate Bonds (Rc)
X X
Long-Term Government Bonds (Rg)
X X
Treasury Bills (Rf) X X
Inflation (Ri)
Inflation-Adjusted Series
X
Inflation-Adjusted Common Stocks (Rmr)
X X
Inflation-Adjusted Small-Company Stocks (Rsr)
X X X
Inflation-Adjusted Long-Term Corporate Bonds (Rcr)
X
Inflation-Adjusted Long-Term Government Bonds (Rgr)
X
Inflation-Adjusted XTreasury Bills, or Real Riskless Rates of Return (Rfr or Rr)
X X
X
X X
X
52

5 Presentation of the Data: Returns and Indexes
Annual and Monthly ReturnsReturns on the Basic Asset ClassesExhibit 14 displays annual total returns on each of the
seven basic asset classes. Annual returns, Rt , are formed by compounding the 12 monthly returns. (This method applies to total return and capital appreciation series; income and yield series are annualized differently.) To compound, or link, monthly returns, one multiplies return relatives and subtracts one from the result. A return relative is simply the return, expressed as a decimal, plus one. A simple example for three hypothetical months illustrates the compounding method:
MonthReturn
(Percent)Return
(Decimal)Return
Relative
1 + 10% 0.10 1.102 -10% -0.10 0.90
3 + 15% 0.15 1.15
The return for this hypothetical quarter is given by:
(1.10) x (.90) x (1.15) -1 = 1.1385 -1 = 0.1385, (23)
or a gain of 13.85 percent. Note that this is different from the simple addition result, (10 -10 + 15) = 15 percent. The compound return reflects the growth of funds invested in

2 EXHIBIT 14BASIC SERIES:
YEAR-BY-YEAR TOTAL RETURNS (1926-1987)
Intermediate-
YearCommon
Stocks
Small-Company
Stocks
Long-TermCorporate
B onds
Long-TermGovernment
Bonds
TermGovernment
B onds
u .s.T reasuiy
Bills
C onsum erPriceIndex
1926 0.1162 0.0028 0.0737 0.0777 0.0538 0.0327 -0.01491927 0.3749 0.2210 0.0744 0.0893 0.0452 0.0312 -0.02081928 0.4361 0.3969 0.0284 0.0010 0.0092 0.0324 -0.00971929 -0.0842 -0.5136 0.0327 0.0342 0.0601 0.0475 0.0019
1930 -0.2490 -0.3815 0.0798 0.0466 0.0671 0.0241 -0.06031931 -0.4334 -0.4975 -0.0185 -0.0531 -0.0232 0.0107 -0.09521932 -0.0819 -0.0539 0.1082 0.1684 0.0881 0.0096 -0.10301933 0.5399 1.4287 0.1038 -0.0008 0.0182 0.0030 0.00511934 -0.0144 0.2422 0.1384 0.1002 0.0900 0.0016 0.0203
1935 0.4767 0.4019 0.0961 0.0498 0.0701 0.0017 0.02991936 0.3392 0.6480 0.0674 0.0751 0.0306 0.0018 0.01211937 -0.3503 -0.5801 0.0275 0.0023 0.0156 0.0031 0.03101938 0.3112 0.3280 0.0613 0.0553 0.0623 -0.0002 -0.02781939 -0.0041 0.0035 0.0397 0.0594 0.0452 0.0002 -0.0048
1940 -0.0978 -0.0516 0.0339 0.0609 0.0296 0.0000 0.00961941 -0.1159 -0.0900 0.0273 0.0093 0.0049 0.0006 0.09721942 0.2034 0.4451 0.0260 0.0322 0.0194 0.0027 0.09291943 0.2590 0.8837 0.0283 0.0208 0.0281 0.0035 0.03161944 0.1975 0.5372 0.0473 0.0281 0.0180 0.0033 0.0211
1945 0.3644 0.7361 0.0408 0.1073 0.0222 0.0033 0.02251946 -0.0807 -0.1163 0.0172 -0.0010 0.0100 0.0035 0.18171947 0.0571 0.0092 -0.0234 -0.0263 0.0091 0.0050 0.09011948 0.0550 -0.0211 0.0414 0.0340 0.0185 0.0081 0.02711949 0.1879 0.1975 0.0331 0.0645 0.0232 0.0110 -0.0180
1950 0.3171 0.3875 0.0212 0.0006 0.0070 0.0120 0.05791951 0.2402 0.0780 -0.0269 -0.0394 0.0036 0.0149 0.05871952 0.1837 0.0303 0.0352 0.0116 0.0163 0.0166 0.00881953 -0.0099 -0.0649 0.0341 0.0363 0.0323 0.0182 0.00631954 0.5262 0.6058 0.0539 0.0719 0.0268 0.0086 -0.0050
Stocks, Bon
ds, Bills, an
d Inflation
: Historical R
eturn
s

EXHIBIT 14 (Continued)
YearComm on
Stocks
Small-Company
Stocks
Long-TermCorporate
B onds
Long-TermGovernm ent
B onds
Interm ediate-Term
Government B onds__
u .s.Treasury
Bills
C onsum erPriceIndex
1955 0.3156 0.2044 0.0048 -0.0130 -0.0065 0.0157 0.00371956 0.0656 0.0428 -0.0681 -0.0559 -0.0042 0.0246 0.02861957 -0.1078 -0.1457 0.0871 0.0745 0.0784 0.0314 0.03021958 0.4336 0.6489 -0.0222 -0.0610 -0.0129 0.0154 0.01761959 0.1196 0.1640 -0.0097 -0.0226 -0.0039 0.0295 0.0150
1960 0.0047 -0.0329 0.0907 0.1378 0.1175 0.0266 0.01481961 0.2689 0.3209 0.0482 0.0097 0.0185 0.0213 0.00671962 -0.0873 -0.1190 0.0795 0.0689 0.0556 0.0273 0.01221963 0.2280 0.2357\ 0.0219 0.0121 0.0164 0.0312 0.01651964 0.1648 0.235Z 0.0477 0.0351 0.0404 0.0354 0.0119
1965 0.1245 0.4175 -0.0046 0.0071 0.0102 0.0393 0.01921966 -0.1006 -0.0701 0.0020 0.0365 0.0468 0.0476 0.03351967 0.2398 0.8357 -0.0495 -0.0919 0.0101 0.0421 0.03041968 0.1106 0.3597 0.0257 -0.0026 0.0453 0.0521 0.04721969 -0.0850 -0.2505 -0.0809 -0.0508 -0.0074 0.0658 0.0611
1970 0.0401 -0.1743 0.1837 0.1210 0.1686 0.0653 0.05491971 0.1431 0.1650 0.1101 0.1323 0.0872 0.0439 0.03361972 0.1898 0.0443 0.0726 0.0568 0.0516 0.0384 0.03411973 -0.1466 -0.3090 0.0114 - 0.0111 0.0460 0.0693 0.08801974 -0.2647 -0.1995 -0.0306 0.0435 0.0569 0.0800 0.1220
1975 0.3720 0.5282 0.1464 0.0919 0.0783 0.0580 0.07011976 0.2384 0.5738 0.1865 0.1675 0.1287 0.0508 0.04811977 -0.0718 0.2538 0.0171 -0.0067 0.0140 0.0512 0.06771978 0.0656 0.2346 -0.0007 -0.0116 0.0348 0.0718 0.09031979 0.1844 0.4346 -0.0418 -0.0122 0.0409 0.1038 0.1331
1980 0.3242 0.3988 -0.0262 -0.0395 0.0391 0.1124 0.12401981 -0.0491 0.1388 -0.0096 0.0185 0.0945 0.1471 0.08941982 0.2141 0.2801 0.4379 0.4035 0.2910 0.1054 0.03871983 0.2251 0.3967 0.0470 0.0068 0.0741 0.0880 0.03801984 0.0627 -0.0667 0.1639 0.1543 0.1402 0.0985 0.0395
1985 0.3^16 0.2466 0.3090 0.3097 0.2033 0.0772 0.03771986 0.1847 0.0685 0.1985 0.2444 0.1514 0.0616 0.01131987 0.0523 -0.0930 -0.0027 -0.0269 0.0290 0.0547 0.0441
u iUl

Stocks, Bonds, Bills, and Inflation: Historical Returns
an asset. A dollar invested in this hypothetical asset at the beginning of the three-month period grows to slightly less than $1.14, not $1.15.
Equivalently, annual returns may be formed by dividing index values according to:
VTrt = -1
VT-1 (24)
where
VT = index value as of year-end T, and
Vp.j = index value for the previous year-end, T-l.
The construction of index values is discussed later in this chapter.
Annual Income ReturnsAnnual income returns are constructed unlike other
annual returns. The dividend or coupon-income payments, in dollars, are summed over the 12 months in a year. (The dollar payments are scaled to an investment equal to the index level at the previous year-end, Vt -1.) This sum is then divided by Vt-1 to form the annual income return. Mathematically,
12
I INCm
p - m=lT VT-1 (25)
income payment in the m month of the year from the previous year-end, T-l, to the present year-end, T, and
where
INCm=
56
Presentation of the Data: Returns and Indexes
= index value for the previous year end, T-l.
This method produces the true annual income return. For an investor who purchases a security at time T-l and holds it to time T, it is the return before figuring any capital gain or loss. This method differs from that used in the 1982 edition of this book.
Capital Appreciation, Income, Reinvestment Returns, andYields on Common Stocks and Government BondsExhibit 15 provides further detail on the returns of
common stocks, and on the returns and yields of long- and intermediate-term government bonds. Total annual returns are shown as the sum of three components: returns from capital appreciation, returns from the receipt of income, and returns from the reinvestment of income. (The capital appreciation and income components were previously explained in Chapter 3.) The third component, reinvestment return, reflects monthly income reinvested in the total return index in subsequent months in the year. Thus, for a single month the reinvestment return is zero, but over any longer period of time it is nonzero. Because the returns in Exhibit 15 are annual, reinvestment return is relevant. Such returns are generally positive when capital appreciation for the year is positive, because the income is being reinvested in a rising market; in a falling market, reinvestment returns are generally negative.
Because of this reinvestment return, the annual total return formed by compounding the monthly total returns does not equal the sum of the annual capital appreciation and income components; the difference is the return received from reinvesting the income component. A simple example illustrates this point. In 1985, an “up” year, the total annual return on common stocks was 32.16 percent. The annual capital appreciation was 26.34 percent and the annual
57

$ EXHIBIT 15COMMON STOCKS, LONG-TERM GOVERNMENT BONDS, AND
INTERMEDIATE-TERM GOVERNMENT BONDS: YEAR-BY-YEAR INCOME, CAPITAL APPRECIATION,
REINVESTMENT RETURNS, AND YIELDS (1926-1987)
C o m m o n S t o c k s ____________ ________ L o n g - T e r m G o v e r n m e n t B o n d s _________ I n t e r m e d i a t e - T e r m G o v e r n m e n t R o n d sR e in - R e in - R e in -
C a p i ta l v e s t C a p i ta l v e s t Y e a r - C a p i ta l v e s t Y e a r -A p p r e c . I n c o m e m e n t T o ta l A p p r e c . I n c o m e m e n t T o ta l e n d A p p r e c . I n c o m e m e n t T o ta l e n d
Y e a r R e t u r n R e t u r n R e t u r n R e t u r n R e t u r n R e t u r n R e t u r n R e t u r n Y ie ld R e t u r n R e t u r n R e t u r n R e t u r n Y ie ld
1926 .0572 .0541 .0050 .1162 .0391 .0373 .0014 .0777 .0361 .0150 .0378 .0010 .0538 .03611927 .3091 .0571 .0087 .3749 .0539 .0341 .0012 .0893 .0323 .0096 .0349 .0007 .0452 .03401928 .3788 .0481 .0091 .4361 -.0313 .0322 .0001 .0010 .0347 -.0274 .0364 .0002 .0092 .04011929 -.1191 .0398 -.0049 -.0842 -.0021 .0348 .0015 .0342 .0347 .0177 .0407 .0018 .0601 .0362
1930 -.2848 .0457 -.0098 -.2490 .0128 .0332 .0005 .0466 .0337 .0330 .0330 .0011 .0671 .02911931 -.4707 .0535 -.0162 -.4334 -.0847 .0333 -.0017 -.0531 .0385 -.0541 .0316 -.0008 -.0232 .04121932 -.1515 .0616 .0080 -.0819 .1292 .0369 .0023 .1684 .0321 .0502 .0363 .0016 .0881 .03041933 .4659 .0639 .0101 .5399 -.0314 .0312 -0005 -.0008 .0353 -.0099 .0283 -.0002 .0182 .03251934 -.0594 .0446 .0004 -.0144 .0676 .0318 .0009 .1002 .0298 .0597 .0293 .0009 .0900 .0249
1935 .4137 .0495 .0135 .4767 .0214 .0281 .0003 .0498 .0293 .0494 .0202 .0005 .0701 .01631936 .2792 .0536 .0064 .3392 .0464 .0277 .0010 .0751 .0252 .0160 .0144 .0002 .0306 .01291937 -.3859 .0466 -.0109 -.3503 -.0248 .0266 .0005 .0023 .0279 .0005 .0148 .0003 .0156 .01141938 .2521 .0483 .0107 .3112 .0283 .0264 .0006 .0553 .0257 .0437 .0182 .0004 .0623 .01521939 -.0545 .0469 * .0035 -.0041 .0348 .0240 .0006 .0594 .0238 .0318 .0131 .0003 .0452 .0098
1940 -.1529 .0536 .0014 -.0978 .0377 .0223 .0009 .0609 .0198 .0204 .0090 .0002 .0296 .00571941 -.1786 .0671 -.0044 -.1159 -.0102 .0194 .0000 .0093 .0254 -.0017 .0067 -.0000 .0049 .00821942 .1243 .0679 .0112 .2034 .0073 .0246 .0003 .0322 .0242 .0117 .0076 .0000 .0194 .00721943 .1945 .0624 .0021 .2590 -.0038 .0244 .0002 .0208 .0253 .0123 .0156 .0002 .0281 .01451944 .1380 .0548 .0047 .1975 .0032 .0246 .0003 .0281 .0259 .0034 .0144 .0001 .0180 .0140
1945 .3072 .0497 .0074 .3644 .0827 .0234 .0012 .1073 .0203 .0102 .0119 .0001 .0222 .01031946 -.1187 .0409 -.0029 -.0807 -.0215 .0204 .0001 -.0010 .0216 -.0008 .0108 .0000 .0100 .01121947 .0000 .0549 .0022 .0571 -.0470 .0213 -.0006 -.0263 .0240 -.0031 .0121 .0000 .0091 .01341948 -.0065 .0608 .0008 .0550 .0096 .0240 .0004 .0340 .0241 .0027 .0156 .0001 .0185 .01511949 .1026 .0750 .0103 .1879 .0414 .0225 .0006 .0645 .0220 .0095 .0136 .0001 .0232 .0123
1950 .2178 .0877 .0116 .3171 -.0207 .0212 .0000 .0006 .0243 -.0070 .0139 .0001 .0070 .01621951 .1646 .0691 .0065 .2402 -.0627 .0238 -.0004 -.0394 .0274 -.0163 .0198 .0001 .0036 .02171952 .1178 .0593 .0066 .1837 -.0148 .0266 -.0002 .0116 .0275 -.0058 .0219 .0001 .0163 .02351953 -.0662 .0546 .0018 -.0099 .0067 .0284 .0012 .0363 .0278 .0061 .0255 .0007 .0323 .02181954 .4502 .0621 .0139 .5262 .0435 .0279 .0005 .0719 .0271 .0108 .0160 .0001 .0268 .0172
Stocks, Bonds, B
ills, an
d Inflation: H
istorical Returns

EXHIBIT 15 (Continued)
C a p i t a lA p p r e c .
C o m m o
I n c o m e
n S t o c k s R e i n v e s t m e n t T o ta l
__ uC a p i t a lA p p r e c .
m g - T e r m
I n c o m e
G o v e m m <R e i n v e s t m e n t
a i t B o n d s
T o t a lY e a r -e n d
i n U
C a p i ta lA p p r e c .
■ r m e d i a t e
I n c o m e
- t e r m G m R e i n v e s t m e n t
r e m m e n t 13
T o ta l
►o n u s __
Y e a r -e n d
Y e a r R e t u r n R e t u r n R e t u r n R e t u r n R e t u r n R e t u r n R e t u r n R e t u r n Y ie ld R e t u r n R e t u r n R e t u r n R e t u r n Y ie ld
1955 .2640 .0456 .0060 .3156 -.0407 .0275 .0003 -.0130 .0306 -.0311 .0245 .0000 -.0065 .02801956 .0262 .0383 .0011 .0656 -.0846 .0299 -.0012 -.0559 .0352 -.0346 .0305 -.0002 -.0042 .03631957 -.1431 .0384 -.0030 -.1078 .0381 .0344 .0020 .0745 .0329 .0405 .0359 .0020 .0784 .02841958 .3806 .0438 .0093 .4336 -.0923 .0327 -.0013 -.0610 .0376 -.0418 .0293 -.0005 -.0129 .03811959 .0848 .0331 .0016 .1196 -.0620 .0401 -.0007 -.0226 .0426 -.0456 .0418 -.0001 -.0039 .0498
1960 -.0297 .0326 .0019 .0047 .0929 .0426 .0023 .1378 .0404 .0742 .0415 .0019 .1175 .03311961 .2313 .0348 .0028 .2689 -.0286 .0383 -.0000 .0097 .0447 -.0172 .0354 .0003 .0185 .03841962 -.1181 .0298 .0010 -.0873 .0278 .0400 .0011 .0689 .0391 .0173 .0373 .0010 .0556 .03501963 .1889 .0361 .0030 .2280 -.0270 .0389 .0002 .0121 .0422 -.0210 .0371 .0003 .0164 .04041964 .1297 .0333 .0018 .1648 -.0072 .0415 .0008 .0351 .0402 -.0004 .0400 .0008 .0404 .0403
1965 .0906 .0321 .0018 .1245 -.0345 .0419 -.0003 .0071 .0457 -.0311 .0415 -.0003 .0102 .04901966 -.1309 .0311 -.0008 -.1006 -.0106 .0449 .0022 .0365 .0479 -.0042 .0493 .0018 .0468 .04791967 .2009 .0363 .0025 .2398 -.1355 .0459 -.0023 -.0919 .0604 -.0386 .0488 -.0001 .0101 .05771968 .0766 .0318 .0022 .1106 -.0551 .0550 -.0025 -.0026 .0609 -.0099 .0549 .0004 .0453 .05961969 -.1142 .0304 -.0013 -.0850 -.1083 .0595 -.0019 -.0508 .0677 -.0728 .0665 -.0011 -.0074 .0829
1970 .0016 .0341 .0043 .0401 .0484 .0674 .0052 .1210 .0617 .0871 .0749 .0066 .1686 .05901971 .1079 .0333 .0019 .1431 .0660 .0632 .0031 .1323 .0608 .0272 .0575 .0026 .0872 .05251972 .1563 .0309 .0026 .1898 -.0035 .0587 .0017 .0568 .0651 -.0075 .0575 .0016 .0516 .05851973 -.1737 .0286 -.0016 -.1466 -.0773 .0651 .0010 -.0111 .0740 -.0219 .0658 .0022 .0460 .06791974 -.2972 .0369 -.0044 -.2647 -.0346 .0727 .0054 .0435 .0828 -.0200 .0724 .0044 .0569 .0712
1975 .3155 .0537 .0029 .3720 .0073 .0799 .0047 .0919 .0793 .0012 .0735 .0036 .0783 .07191976 .1915 .0438 .0031 .2384 .0807 .0789 .0080 .1675 .0764 .0525 .0710 .0051 .1287 .06001977 -.1150 .0431 .0001 -.0718 -.0795 .0724 .0004 -.0067 .0801 -.0515 .0649 .0006 .0140 .07511978 .0106 .0533 .0017 .0656 -.0908 .0795 -.0003 -.0116 .0899 -.0449 .0783 .0015 .0348 .08831979 .1231 .0571 .0042 .1844 -.0979 .0883 -.0026 -.0122 .0987 -.0507 .0904 .0012 .0409 .1033
1980 .2577 .0573 .0092 .3242 -.1377 .0974 .0008 -.0395 .1184 -.0681 .1055 .0017 .0391 .12451981 -.0972 .0489 -.0008 -.0491 -.1040 .1160 .0065 .0185 .1405 -.0455 .1297 .0103 .0945 .13961982 .1476 .0550 .0115 .2141 .2386 .1356 .0293 .4035 .1061 .1423 .1281 .0206 .2910 .09901983 .1727 .0500 .0024 .2251 -.0992 .1050 .0010 .0068 .1198 -.0330 .1035 .0035 .0741 .11411984 .0139 .0456 .0031 .0627 .0226 .1175 .0142 .1543 .1162 .0122 .1168 .0112 .1402 .1104
1985 .2634 .0509 .0072 .3216 .1779 .1128 .0190 .3097 .0946 .0901 .1029 .0104 .2033 .08551986 .1463 .0374 .0010 .1847 .1515 .0883 .0046 .2444 .0796 .0699 .0772 .0043 .1514 .06851987 .0203 .0364 -.0044 .0523 -.1065 .0789 .0006 -.0269 .0920 -.0473 .0749 .0014 .0290 .0832
tn<0
Presentation o
f the Data: R
eturn
s an
d Indexes

Stocks, Bonds, Bills, and Inflation: Historical Returns
income return was 5.09 percent. These two components sum to 31.43 percent; the remaining 0.72 percent of the total 1985 return came from the reinvestment of dividends in the appreciating market.
For the two government bond asset classes, we also give year-end yields. Unlike returns, which measure the behavior of an asset over time, the yield of a bond characterizes the bond at a point in time. The yield of a bond is approximately its expected return, on a per-year compound basis, if held to maturity. Bond yields are discussed in greater detail in Chapters 2 and 3.
Returns on the Derived SeriesAnnual returns for all 10 of the component or derived
series are calculated from monthly returns in the same manner as the annual total return and capital appreciation series. Exhibit 16 presents annual returns for each of these series. As noted in Chapter 4, four of the derived series are risk premiums and six are inflation-adjusted total returns on asset classes.
Index ValuesIndex values represent the cumulative effect of returns
on a dollar invested. For example, a dollar invested in common stocks (with dividends reinvested) as of December 31, 1925 grew to $1.12 by December 1926, reflecting the 12 percent return in 1926. Over the year 1927, the $1.12 grew to $1.54, reflecting the 37 percent return for that year.
Exhibit 17 presents indexes of total return for the seven basic asset classes, and indexes of capital appreciation for common stocks and long- and intermediate-term government bonds. Exhibit 18 gives indexes of the derived return series.
60
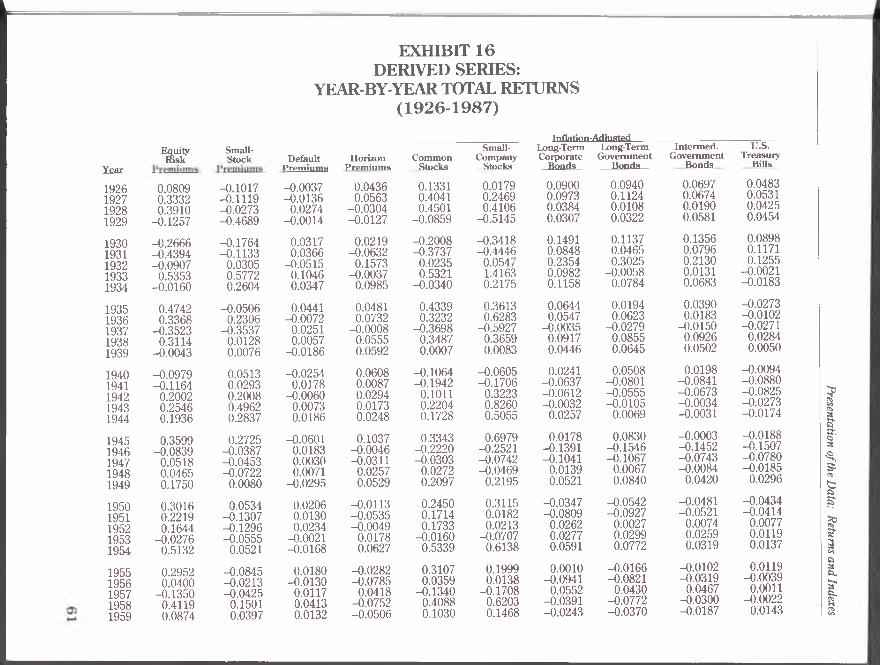
EXHIBIT 16 DERIVED SERIES:
YEAR-BY-YEAR TOTAL RETURNS (1926-1987)
I n f l a t i o n - A d ju s t e d ________
Year1926192719281929
E q u i tyR i s k
S m a l l -S t o c k D e f a u l t
P r e m i u m sH o r i z o n
P r e m i u m sC o m m o n
S t o c k s
S m a l l -C o m p a n y
S t o c k s
L o n g - T e r mC o r p o r a t e
B o n d s
L o n g - T e r m G o v e r n m e n t ___ B o n d s
I n t e r m e d .G o v e r n m e n t
B o n d s
u.s.T r e a s u r y
B i l l s
0.08090.33320.3910-0.1257
-0.1017-0.1119-0.0273-0.4689
-0.0037-0.01360.0274-0.0014
0.04360.0563-0.0304-0.0127
0.13310.40410.4501-0.0859
0.01790.24690.4106-0.5145
0.09000.09730.03840.0307
0.09400.11240.01080.0322
0.06970.06740.01900.0581
0.04830.05310.04250.0454
19301931193219331934
-0.2666-0.4394-0.09070.5353-0.0160
-0.1764-0.11330.03050.57720.2604
0.03170.0366-0.05150.10460.0347
0.0219-0.06320.1573-0.00370.0985
-0.2008-0.37370.02350.5321-0.0340
-0.3418-0.44460.05471.41630.2175
0.14910.08480.23540.09820.1158
0.11370.04650.3025-0.00580.0784
0.13560.07960.21300.01310.0683
0.08980.11710.1255-0.0021-0.0183
19351936193719381939
0.47420.3368-0.35230.3114-0.0043
-0.05060.2306-0.35370.01280.0076
0.0441-0.00720.02510.0057-0.0186
0.04810.0732-0.00080.05550.0592
0.43390.3232-0.36980.34870.0007
0.36130.6283-0.59270.36590.0083
0.06440.0547-0.00350.09170.0446
0.01940.0623-0.02790.08550.0645
0.03900.0183-0.01500.09260.0502
-0.0273-0.0102-0.02710.02840.0050
19401941194219431944
-0.0979-0.11640.20020.25460.1936
0.05130.02930.20080.49620.2837
-0.02540.0178-0.00600.00730.0186
0.06080.00870.02940.01730.0248
-0.1064-0.19420.10110.22040.1728
-0.0605-0.17060.32230.82600.5055
0.0241-0.0637-0.0612-0.00320.0257
0.0508-0.0801-0.0555-0.01050.0069
0.0198-0.0841-0.0673-0.0034-0.0031
-0.0094-0.0880-0.0825-0.0273-0.0174
19451946194719481949
0.3599-0.08390.05180.04650.1750
0.2725-0.0387-0.0453-0.07220.0080
-0.06010.01830.00300.0071-0.0295
0.1037-0.0046-0.03110.02570.0529
0.3343-0.2220-0.03030.02720.2097
0.6979-0.2521-0.0742-0.04690.2195
0.0178-0.1391-0.10410.01390.0521
0.0830-0.1546-0.10670.00670.0840
-0.0003-0.1452-0.0743-0.00840.0420
-0.0188-0.1507-0.0780-0.01850.0296
19501951195219531954
0.30160.22190.1644-0.02760.5132
0.0534-0.1307-0.1296-0.05550.0521
0.02060.01300.0234-0.0021-0.0168
-0.0113-0.0535-0.00490.01780.0627
0.24500.17140.1733-0.01600.5339
0.31150.01820.0213-0.07070.6138
-0.0347-0.08090.02620.02770.0591
-0.0542-0.09270.00270.02990.0772
-0.0481-0.05210.00740.02590.0319
-0.0434-0.04140.00770.01190.0137
19551956195719581959
0.29520.0400-0.13500.41190.0874
-0.0845-0.0213-0.04250.15010.0397
0.0180-0.01300.01170.04130.0132
-0.0282-0.07850.0418-0.0752-0.0506
0.31070.0359-0.13400.40880.1030
0.19990.0138-0.17080.62030.1468
0.0010-0.09410.0552-0.0391-0.0243
-0.0166-0.08210.0430-0.0772-0.0370
-0.0102-0.03190.0467-0.0300-0.0187
0.0119-0.00390.0011-0.00220.0143
Presentation o
f the Data:
Retu
rns a
nd
Indexes

EXHIBIT 16 (Continued)
E q u i tyR i s k
P r e m i u m s
S m a l l -S t o c k
P r e m i u m s
_______I n f l a t i o n - A d ju s t e d
YearD e f a u l t
P r e m i u m sH o r i z o n
PremiumsC o m m o n
S t o c k s
S m a l l -C o m p a n y
S t o c k s
L o n g - T e r mC o r p o r a t e
B o n d s
L o n g - T e r mG o v e r n m e n t
R o n d s
I n t e r m e d .G o v e r n m e n t
u.s.T r e a s u r y
B i l l s
0.01170.01440.01490.01440.0232
19601961196219631964
-0.02140.2425-0.11160.19090.1250
-0.03740.0410-0.03480.00620.0604
-0.04140.03810.00990.00970.0122
0.1082-0.01130.0404-0.0185-0.0003
-0.00990.2604-0.09830.20810.1511
-0.04700.3121-0.12970.21560.2207
0.07480.04120.06640.00540.0354
0.12120.00300.0559-0.00430.0229
0.10130.01170.0429-0.00010.0282
19651966196719681969
0.0820-0.14150.18970.0557-0.1416
0.26060.03390.48070.2243-0.1809
-0.0116-0.03330.04660.0285-0.0318
-0.0310-0.0106-0.1285-0.0520-0.1094
0.1033-0.12980.20310.0605-0.1377
0.3908-0.10030.78150.2984-0.2937
-0.0234-0.0306-0.0776-0.0205-0.1338
-0.01190.0029-0.1187-0.0476-0.1054
-0.00890.0129-0.0198-0.0018-0.0645
0.01970.01360.01130.00460.0045
19701971197219731974
-0.02360.09510.1458-0.2019-0.3192
-0.20610.0191-0.1222-0.19030.0887
0.0559-0.01960.01490.0227-0.0710
0.05240.08470.0177-0.0752-0.0338
-0.01410.10600.1505-0.2156-0.3446
-0.21730.12710.0099-0.3649-0.2865
0.12210.07410.0372-0.0704-0.1360
0.06270.09550.0220-0.0911-0.0700
0.10780.05190.0169-0.0385-0.0581
0.00980.00990.0041-0.0172-0.0374
19751976197719781979
0.29680.1785-0.1171-0.00580.0731
0.11380.27080.35080.15860.2113
0.04990.01620.02400.0110-0.0300
0.03200.1111-0.0551-0.0778-0.1050
0.28210.1816-0.1307-0.02260.0453
0.42800.50150.17430.13240.2662
0.07130.1320-0.0474-0.0834-0.1543
0.02040.1140-0.0697-0.0934-0.1282
0.00760.0769-0.0503-0.0508-0.0813
-0.01130.0026-0.0155-0.0169-0.0259
19801981198219831984
0.1904-0.17100.09830.1261-0.0326
0.05630.19760.05430.1400-0.1217
0.0139-0.02760.02450.03990.0083
-0.1366-0.11210.2696-0.07460.0508
0.1781-0.12710.16880.18030.0222
0.24450.04530.23230.3456-0.1022
-0.1336-0.09090.38430.00870.1196
-0.1455-0.06510.3512-0.03000.1104
-0.07560.00470.24280.03480.0968
-0.01030.05300.06420.04820.0567
198519861987
0.22680.1159-0.0022
-0.0567-0.0981-0.1381
-0.0005-0.03690.0249
0.21580.1722-0.0774
0.27360.17150.0079
0.20130.0566-0.1313
0.26150.1851-0.0448
0.26210.2305-0.0680
0.15960.1385-0.0144
0.03810.04980.0101
Stocks, Bonds, B
ills, an
d Inflation: H
istorical Returns

I
EXHIBIT 17 BASIC SERIES:
INDEXES OF YEAR-END CUMULATIVE WEALTH (1926-1987)(DECEMBER 1925 = 1.00)
S m a l lS t o c k s
L o n g - T e r m C o r p . B o n d s
L o n g - T e r mG o v e r n m e n t B o n d s ____
I n t e r m e d i a t e - T e r m G o v e r n m e n t B o n d s
u.s.T - B i l l s C o n s u m e r
T o t a l C a p i ta l T o t a l T o t a l T o t a l C a p i ta l T o t a l C a p i t a l T o t a l P r i c e
Y e a r R e t u r n s R e t u r n s R e t u r n s A p p r e c i a t i o n R e t u r n s A p p r e c i a t i o n R e t u r n s I n d e x
1925 1.0000 1.0000 1.0000 1.0000 1.0000 1.0000 1.0000 1.0000 1.0000 1.00001926 1.1162 1.0572 1.0028 1.0737 1.0777 1.0391 1.0538 1.0150 1.0327 0.98511927 1.5347 1.3840 1.2243 1.1537 1.1739 1.0951 1.1014 1.0248 1.0649 0.96461928 2.2040 1.9083 1.7103 1.1864 1.1751 1.0609 1.1116 0.9968 1.0995 0.95531929 2.0185 1.6810 0.8319 1.2253 1.2153 1.0587 1.1784 1.0144 1.1517 0.9572
1930 1.5159 1.2022 0.5146 1.3230 1.2719 1.0722 1.2575 1.0478 1.1794 0.89941931 0.8590 0.6364 0.2586 1.2985 1.2043 0.9814 1.2283 0.9912 1.1921 0.81381932 0.7886 0.5400 0.2446 1.4390 1.4071 1.1082 1.3365 1.0410 1.2035 0.73001933 1.2144 0.7915 0.5941 1.5883 1.4060 1.0734 1.3609 1.0307 1.2071 0.73371934 1.1969 0.7445 0.7380 1.8082 1.5470 1.1459 1.4833 1.0922 1.2091 0.7486
1935 1.7674 1.0525 1.0346 1.9821 1.6241 1.1705 1.5872 1.1461 1.2111 0.77091936 2.3669 1.3464 1.7051 2.1157 1.7461 1.2248 1.6357 1.1644 1.2133 0.78031937 1.5379 0.8268 0.7160 2.1738 1.7501 1.1944 1.6611 1.1649 1.2170 0.80451938 2.0165 1.0353 0.9508 2.3072 1.8469 1.2282 1.7646 1.2158 1.2168 0.78211939 2.0082 0.9788 0.9541 2.3987 1.9566 1.2710 1.8444 1.2545 1.2171 0.7784
1940 1.8117 0.8292 0.9049 2.4801 2.0757 1.3188 1.8990 1.2801 1.2171 0.78581941 1.6017 0.6810 0.8235 2.5478 2.0950 1.3054 1.9084 1.2779 1.2179 0.86221942 1.9275 0.7657 1.1900 2.6140 2.1624 1.3150 1.9453 1.2928 1.2211 0.94231943 2.4267 0.9146 2.2417 2.6881 2.2075 1.3101 2.0000 1.3088 1.2254 0.97211944 2.9060 1.0408 3.4459 2.8153 2.2696 1.3143 2.0359 1.3133 1.2294 0.9925
1945 3.9649 1.3605 5.9825 2.9300 2.5132 1.4230 2.0811 1.3267 1.2335 1.01491946 3.6448 1.1991 5.2871 2.9805 2.5106 1.3924 2.1019 1.3256 1.2378 1.19931947 3.8529 1.1991 5.3354 2.9109 2.4447 1.3270 2.1211 1.3215 1.2441 1.30731948 4.0649 1.1912 5.2227 3.0312 2.5277 1.3396 2.1602 1.3251 1.2541 1.34261949 4.8287 1.3135 6.2541 3.1315 2.6907 1.3951 2.2104 1.3377 1.2680 1.3184
1950 6.3601 1.5995 8.6774 3.1978 2.6923 1.3663 2.2258 1.3283 1.2831 1.39481951 7.8875 1.8629 9.3546 3.1118 2.5863 1.2806 2.2338 1.3067 1.3023 1.47671952 9.3363 2.0823 9.6378 3.2213 2.6162 1.2616 2.2703 1.2991 1.3238 1.48981953 9.2440 1.9444 9.0125 3.3312 2.7113 1.2701 2.3437 1.3071 1.3480 1.49911954 14.1085 2.8198 14.4726 3.5106 2.9061 1.3253 2.4065 1.3212 1.3596 1.4916
1955 18.5615 3.5643 17.4309 3.5275 2.8685 1.2714 2.3908 1.2801 1.3810 1.49721956 19.7784 3.6575 18.1774 3.2871 2.7081 1.1638 2.3806 1.2359 1.4150 1.54001957 17.6458 3.1340 15.5290 3.5735 2.9100 1.2082 2.5672 1.2859 1.4594 1.58661958 25.2976 4.3268 25.6052 3.4943 2.7326 1.0966 2.5341 1.2322 1.4819 1.61451959 28.3220 4.6936 29.8040 3.4605 2.6708 1.0286 2.5241 1.1760 1.5257 1.6387
o>00
Presentation o
f the Data: R
eturn
s an
d Indexes
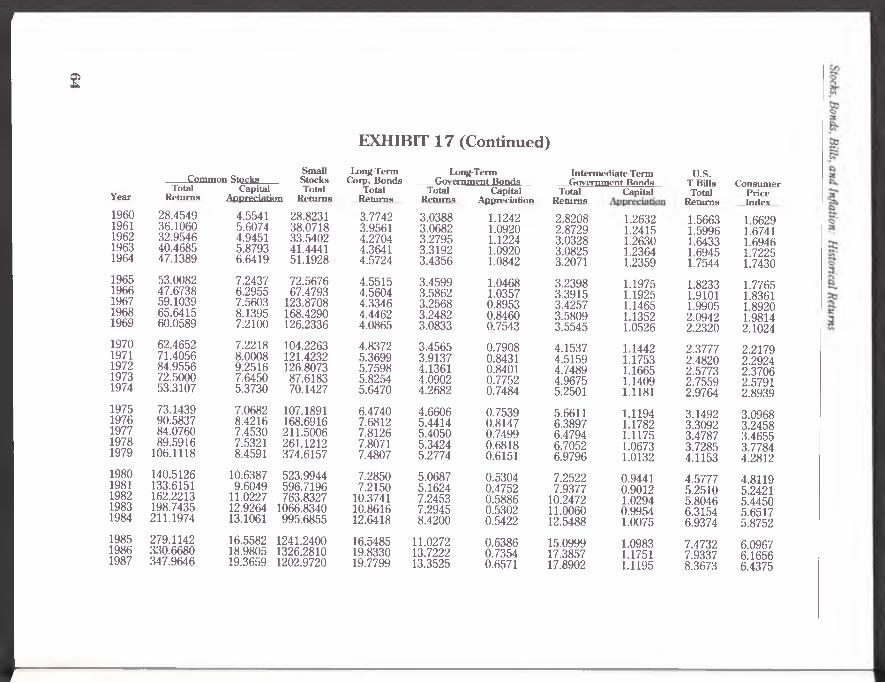
2
EXHIBIT 17 (Continued)
______ C o m m o n S t o c k sS m a l l
S t o c k sL o n g - T e r m
C o r p . B o n d s
Y e a rT o ta l C a p i ta l T o ta l T o ta l
R e t u r n s A p p r e c i a t i o n R e t u r n s R e t u r n s
1960 28.4549 4.5541 28.8231 3.77421961 36.1060 5.6074 38.0718 3.95611962 32.9546 4.9451 33.5402 4.27041963 40.4685 5.8793 41.4441 4.36411964 47.1389 6.6419 51.1928 4.5724
1965 53.0082 7.2437 72.5676 4.55151966 47.6738 6.2955 67.4793 4.56041967 59.1039 7.5603 123.8708 4.33461968 65.6415 8.1395 168.4290 4.44621969 60.0589 7.2100 126.2336 4.0865
1970 62.4652 7.2218 104.2263 4.83721971 71.4056 8.0008 121.4232 5.36991972 84.9556 9.2516 126.8073 5.75981973 72.5000 7.6450 87.6183 5.82541974 53.3107 5.3730 70.1427 5.6470
1975 73.1439 7.0682 107.1891 6.47401976 90.5837 8.4216 168.6916 7.68121977 84.0760 7.4530 211.5006 7.81261978 89.5916 7.5321 261.1212 7.80711979 106.1118 8.4591 374.6157 7.4807
1980 140.5126 10.6387 523.9944 7.28501981 133.6151 9.6049 596.7196 7.21501982 162.2213 11.0227 763.8327 10.37411983 198.7435 12.9264 1066.8340 10.86161984 211.1974 13.1061 995.6855 12.6418
1985 279.1142 16.5582 1241.2400 16.54851986 330.6680 18.9805 1326.2810 19.83301987 347.9646 19.3659 1202.9720 19.7799
L o n g - T e r m I n te r m e d i a t e - T e r m u.s.____ G o v e r n m e n t B o n d s G o v e r n m e n t R o n d s T - B i l l s
T o ta l C a p i ta l T o ta l C a p i ta l T o ta lR e t u r n s A p p r e c i a t i o n R e t u r n s R e t u r n s
3.0388 1.1242 2.8208 1.2632 1.56633.0682 1.0920 2.8729 1.2415 1.59963.2795 1.1224 3.0328 1.2630 1.64333.3192 1.0920 3.0825 1.2364 1.69453.4356 1.0842 3.2071 1.2359 1.7544
3.4599 1.0468 3.2398 1.1975 1.82333.5862 1.0357 3.3915 1.1925 1.91013.2568 0.8953 3.4257 1.1465 1.99053.2482 0.8460 3.5809 1.1352 2.09423.0833 0.7543 3.5545 1.0526 2.2320
3.4565 0.7908 4.1537 1.1442 2.37773.9137 0.8431 4.5159 1.1753 2.48204.1361 0.8401 4.7489 1.1665 2.57734.0902 0.7752 4.9675 1.1409 2.75594.2682 0.7484 5.2501 1.1181 2.9764
4.6606 0.7539 5.6611 1.1194 3.14925.4414 0.8147 6.3897 1.1782 3.30925.4050 0.7499 6.4794 1.1175 3.47875.3424 0.6818 6.7052 1.0673 3.72855.2774 0.6151 6.9796 1.0132 4.1153
5.0687 0.5304 7.2522 0.9441 4.57775.1624 0.4752 7.9377 0.9012 5.25107.2453 0.5886 10.2472 1.0294 5.80467.2945 0.5302 11.0060 0.9954 6.31548.4200 0.5422 12.5488 1.0075 6.9374
11.0272 0.6386 15.0999 1.0983 7.473213.7222 0.7354 17.3857 1.1751 7.933713.3525 0.6571 17.8902 1.1195 8.3673
C o n s u m e rP r i c eI n d e x
1.66291.67411.69461.72251.7430
1.77651.83611.89201.98142.1024
2.21792.29242.37062.57912.8939
3.09683.24583.46553.77844.2812
4.81195.24215.44505.65175.8752
6.09676.16566.4375

EXHIBIT 18 DERIVED SERIES
INDEXES OF YEAR-END CUMULATIVE WEALTH (1926-1987)(DECEMBER 1925 = 1.00)
I n f l a t i o n - A d iu s t e d ____
Y e a r
E q u i tyR i s k
P r e m i u m s
S m a l l -S t o c k
P r e m i u m sD e f a u l t
P r e m i u m sH o r i z o n
P r e m i u m sC o m m o n
S t o c k s
S m a l l -C o m p a n y
S t o c k s
L o n g - T e r mC o r p o r a t e
R o n d s
L o n g - T e r mG o v e r n m e n t
R o n d s
I n t e r m e d .G o v e r n m e n t
R o n d s
u.s.T r e a s u r y
R i l l s
19251926192719281929
1.00001.08091.44112.00461.7527
1.00000.89830.79780.77600.4122
1.00000.99630.98281.00971.0082
1.00001.04361.10231.06881.0552
1.00001.13311.59102.30712.1088
1.00001.01791.26931.79040.8692
1.00001.09001.19601.24201.2801
1.00001.09401.21701.23011.2697
1.00001.06971.14181.16361.2311
1.00001.04831.10401.15091.2032
19301931193219331934
1.28530.72060.65521.00600.9899
0.33940.30100.31020.48920.6166
1.04021.07821.02271.12961.1688
1.07841.01031.16911.16481.2795
1.68541.05551.08031.65511.5988
0.57210.31770.33510.80970.9858
1.47091.59571.97132.16482.4154
1.41411.47991.92761.91642.0665
1.39811.50941.83091.85481.9814
1.31131.46491.64871.64521.6151
19351936193719381939
1.45931.95081.26361.65721.6500
0.58540.72040.46560.47150.4751
1.22041.21171.24211.24921.2259
1.34101.43921.43811.51781.6076
2.29253.03351.91172.57822.5799
1.34202.18530.89001.21571.2258
2.57092.71162.70222.94993.0815
2.10662.23792.17552.36142.5136
2.05872.09632.06492.25622.3695
1.57101.55501.51281.55581.5636
19401941194219431944
1.48851.31521.57851.98042.3638
0.49950.51410.61740.92381.1858
1.19481.21611.20881.21771.2404
1.70541.72031.77091.80151.8461
2.30541.85772.04562.49642.9278
1.15150.95511.26292.30613.4718
3.15592.95502.77422.76532.8364
2.64132.42992.29492.27092.2866
2.41652.21342.06452.05752.0512
1.54881.41251.29591.26061.2386
19451946194719481949
3.21442.94463.09713.24123.8083
1.50891.45051.38481.28481.2952
1.16581.18721.19071.19921.1638
2.03762.02831.96512.01552.1221
3.90673.03932.94733.02753.6625
5.89474.40864.08143.88994.7436
2.88702.48532.22672.25772.3752
2.47632.09351.87011.88272.0408
2.05051.75271.62251.60891.6765
1.21541.03220.95160.93410.9617
19501951195219531954
4.95676.05677.05246.8576
10.3766
1.36441.18601.03230.97501.0258
1.18781.20321.23131.22861.2080
2.09821.98601.97622.01142.1374
4.55995.34126.26706.16659.4585
6.22136.33476.46936.01219.7026
2.29272.10722.16232.22222.3536
1.93021.75141.75611.80861.9483
1.59581.51271.52391.56341.6133
0.91990.88190.88860.89920.9115
Presentation o
f the Data: R
eturn
s an
d Indexes

0505
E q u i ty S m a l l -R i s k S t o c k
Y e a r P r e m i u m s P r e m i u m s
1955 13.4403 0.93911956 13.9777 0.91911957 12.0910 0.88001958 17.0710 1.01221959 18.5638 1.0523
1960 18.1672 1.01291961 22.5721 1.05441962 20.0538 1.01781963 23.8820 1.02411964 26.8684 1.0860
1965 29.0721 1.36901966 24.9586 1.41541967 29.6925 2.09581968 31.3451 2.56591969 26.9078 2.1018
1970 26.2715 1.66851971 28.7699 1.70051972 32.9635 1.49261973 26.3074 1.20851974 17.9109 1.3157
1975 23.2264 1.46541976 27.3731 1.86231977 24.1691 2.51561978 24.0291 2.91451979 25.7845 3.5304
1980 30.6950 3.72911981 25.4455 4.46591982 27.9468 4.70861983 31.4699 5.36791984 30.4434 4.7144
1985 37.3488 4.44701986 41.6789 4.01091987 41.5861 3.4571
D e f a u l tP r e m i u m s
1.22971.21381.22801.27871.2957
1.24201.28941.30221.31481.3309
1.31551.27171.3310 1.3688 1.3254
1.39951.37211.39261.42421.3231
1.38911.41161.44541.46131.4175
1.43731.39761.43181.48901.5014
1.50071.44531.4814
EXHIBIT 18 (Continued)
I n f l a t i o n - A d ju s t e d
H o r i z o n C o m m o nS m a ll - L o n g - T e r m L o n g - T e r m I n t e r m e d . U .S .
C o m p a n y C o r p o r a t e G o v e r n m e n t G o v e r n m e n t T r e a s u r yR i l l sP r e m i u m s S t o c k s S t o c k s B o n d s B o n d s
2.0770 12.3974 11.6423 2.3560 1.9159 1.5968 0.92241.9139 12.8428 11.8032 2.1344 1.7585 1.5458 0.91881.9940 11.1218 9.7876 2.2523 1.8341 1.6181 0.91981.8440 15.6688 15.8592 2.1643 1.6925 1.5696 0.91791.7506 17.2828 18.1872 2.1117 1.6298 1.5403 0.9310
1.9401 17.1112 17.3325 2.2696 1.8273 1.6963 0.94191.9182 21.5672 22.7414 2.3631 1.8328 1.7161 0.95551.9957 19.4468 19.7924 2.5200 1.9353 1.7897 0.96971.9588 23.4936 24.0599 2.5336 1.9269 1.7895 0.98371.9582 27.0444 29.3702 2.6233 1.9711 1.8400 1.0065
1.8976 29.8379 40.8477 2.5620 1.9476 1.8236 1.02631.8775 25.9643 36.7509 2.4837 1.9531 1.8471 1.04031.6361 31.2389 65.4710 2.2910 1.7214 1.8106 1.05211.5511 33.1291 85.0059 2.2440 1.6394 1.8073 1.05691.3814 28.5665 60.0420 1.9437 1.4666 1.6907 1.0616
1.4537 28.1643 46.9936 2.1810 1.5585 1.8728 1.07201.5769 31.1493 52.9685 2.3425 1.7073 1.9700 1.08271.6048 35.8375 53.4921 2.4297 1.7448 2.0033 1.08721.4842 28.1101 33.9718 2.2587 1.5859 1.9260 1.06851.4340 18.4220 24.2385 1.9514 1.4749 1.8142 1.0285
1.4799 23.6189 34.6125 2.0905 1.5050 1.8280 1.01691.6443 27.9079 51.9721 2.3665 1.6765 1.9686 1.01951.5538 24.2605 61.0294 2.2543 1.5596 1.8697 1.00381.4329 23.7115 69.1088 2.0662 1.4139 1.7746 0.98681.2824 24.7856 87.5026 1.7473 1.2327 1.6303 0.9613
1.1073 29.2009 108.8950 1.5140 1.0534 1.5071 0.95130.9831 25.4889 113.8323 1.3764 0.9848 1.5142 1.00171.2482 29.7924 140.2800 1.9052 1.3306 1.8819 1.06601.1550 35.1649 188.7612 1.9218 1.2907 1.9474 1.11741.2137 35.9472 169.4718 2.1517 1.4331 2.1359 1.1808
1.4756 45.7809 203.5904 2.7143 1.8087 2.4767 1.22581.7296 53.6309 215.1083 3.2167 2.2256 2.8198 1.28681.5958 54.0527 186.8687 3.0726 2.0742 2.7791 1.2998
Stocks, Bonds, B
ills, an
d Inflation: H
istorical Returns

Presentation of the Data: Returns and Indexes
The inflation-adjusted indexes in Exhibit 18 show the growth of each asset class in constant dollars or real terms. Thus, an investment in common stock, with dividends reinvested, multiplied real wealth by a factor of 54.05 between the end of 1925 and the end of 1987.
By using some mathematical notation, it is possible to describe the nature of the indexes in Exhibits 17 and 18 precisely. At the end of each month n, a cumulative wealth index (Vn) for each of the monthly return series (basic and derived) is formed. This index is initialized as of December 1925 at 1.00 (represented by Vi2/25 = 1.00). This index is formed for month n in the following manner:
Vn = V 12/25 X (1 + Ri /26) x (1 + R2/26) x . . . X (1 + Rn)
where
V 12/25 = initial index value as of December 1925 = 1.00,
R l/26 = return for January 1926, and
R2/26 = return for February 1926.
In general then, Rn = return for month n.Using product notation, the cumulative index may be
abbreviated as:
v n = n (l + Rn)n (27)
67

Stocks, Bonds, Bills, and Inflation: Historical Returns
68

Stocks, Bonds, Bills, and Inflation Returns
6. Statistics of theStocks, Bonds, Bills, and Inflation Returns
Arithmetic Mean ReturnsThe arithmetic mean of a series is the simple average of
the elements of the series. Stated mathematically, the arithmetic mean from time Ti to time T2 is given by
t 2
RaM ) =' ^t=Ti (28)
wheren is the number of periods from Ti to T2; that is, 0 2 -T i + l).
Geometric Mean ReturnsThe geometric mean (compound) annual return is the
rate of return per annum compounded annually. It is given
byT ,
Rg(T1,t 2)= n (i+Rt)<1/n)- it=T,
Using index values simplifies the above formula to
(29)
Rg(Ti T2) =VT2
Vt i
(1/n)-1 (30)
69

Stocks, Bonds, Bills, and Inflation: Historical Returns
where againn is the number of periods from Ti to T2.
Standard DeviationsThe standard deviation of a series is a measure of the
extent to which observations in the series differ from the arithmetic mean of the series. For a series of asset returns, the standard deviation is a measure of the volatility, or risk, of the asset.
In a normally distributed series, about two-thirds of the observations lie within plus or minus one standard deviation of the arithm etic m ean; about 95 pe rcen t of the observations, within two standard deviations; and more than 99 percent, within three standard deviations.
Mathematically, the standard deviation is given by
where
° r = V n - l tf 1 (r‘- f)2(31)
rt = is the return in period t,
r is the arithmetic mean of the returns designated by r, and
n is the number of periods.
First-Order AutocorrelationsThe first-order autocorrelation of a return series
describes the extent to which the return in one period relates to the return in the next period. A return series with a high (near 1) first-order autocorrelation is very predictable from one period to the next, whereas one with a low (near zero) first-order autocorrelation is random and unpredictable. A more thorough treatment of autocorrelation, and of correlation in general, appears in Chapter 7.
70

Stocks, Bonds, Bills, and Inflation Returns
Presentation of the Summary Statistics for Basic and Derived Series
For each asset class, summary statistics of annual total returns, and, where applicable, income and capital appreciation, are given in Exhibit 19. The summary statistics presented here are arithmetic mean, geometric mean, standard deviation, and first-order autocorrelation. Exhibits 20 and 21 present summary statistics for the four risk-premium series and for the six inflation-adjusted total return series, respectively.
Highlights of the Summary StatisticsExhibit 19 shows that small stocks are the riskiest asset
class and provide the greatest rewards to long-term investors, with an arithmetic mean annual return of 17.7 percent and a standard deviation of annual returns of 35.9 percent over the period 1926-87. The geometric mean of the small stock series is 12.1 percent. Common stocks, long-term corporate bonds, long-term government bonds, and intermediate-term government bonds are progressively less risky, and with correspondingly lower average returns. The only exception to this pattern is intermediate-term government bonds, which outperformed long-term bonds as a result of the general decline in the bond market over the period. Treasury bills were nearly riskless and had the lowest return. In general, then, risk is rewarded over the long term by higher returns.
In Exhibit 20, the equity risk premium exhibits the highest return and greatest variability. The mean horizon premium was 1.1 percent, which is small given its standard deviation.
Inflation-adjusted basic series summary statistics are presented in Exhibit 21. Note that the real rate of interest is close to zero (0.5 percent) on average. Both negative and
71

Stocks, Bonds, Bills, and Inflation: Historical Returns
EXHIBIT 19 BASIC ASSET CLASSES:
TOTAL RETURNS, INCOME, AND CAPITAL APPRECIATION: SUMMARY STATISTICS OF ANNUAL RETURNS
(1926-1987)
SeriesGeometric
MeanArithmetic
MeanStandardDeviation
First-OrderAuto
correlation
Common Stocks:Total Returns 9.9% 12.0% 21.1% 0.01Income 4.8 4.8 1.3 0.79Capital Appreciation 4.9 6.9 20.2 0.00
Small Company Stocks:Total Returns 12.1 17.7 35.9 0.10
Long-Term Corporate Bonds:Total Returns 4.9 5.2 8.5 0.17
Long-Term Government Bonds:Total Returns 4.3 4.6 8.5 0.10Income 4.8 4.8 2.9 0.96Capital Appreciation -0 .7 -0 .4 7.4 -0 .02
Intermediate-Term Government Bonds:
Total Returns 4.8 4.9 5.5 0.28Income 4.4 4.5 3.2 0.95Capital Appreciation 0.2 0.3 4.1 -0 .07
U.S. Treasury Bills:Total Returns 3.5 3.5 3.4 0.92
Inflation Rates 3.0 3.2 4.8 0.64
72

Stocks, Bonds, Bills, and Inflation Returns
EXHIBIT 20RISK PREMIUM SERIES:
SUMMARY STATISTICS OF ANNUAL RETURNS(1926-1987)
First-OrderGeometric Arithmetic Standard Auto-
Series Mean Mean Deviation Correlation
Equity Risk Premium s (stocks-bills)
6.2% 8.3% 21.1% 0.02
Small-Stock Premium s (small stocks-stocks)
2.0 3.7 19.0 0.38
Default Premium s (LT corps-L T govts)
0.6 0.7 3.0 -0 .30
Horizon Premium s (LT govts-b ills)
0.8 1.1 8.0 0.07
73

Stocks, Bonds, Bills, and Inflation: Historical Returns
EXHIBIT 21INFLATION-ADJUSTED SERIES:
SUMMARY STATISTICS OF ANNUAL RETURNS (1926-1987)
First-OrderGeometric Arithmetic Standard Auto-
________ Series________ Mean Mean Deviation Correlation
Inflation-Adjusted Common Stocks
6.6% 8.8% 21.2% 0.00
Inflation-Adjusted Small Stocks
8.8 14.2 35.2 0.07
Inflation-Adjusted Long-Term Corporate Bonds
1.8 2.3 10.0 0.29
Inflation-Adjusted Long-Term Government Bonds
1.2 1.7 10.2 0.18
Inflation-Adjusted Intermediate-Term Government Bonds
1.7 1.9 7.1 0.34
Inflation-Adjusted U.S. Treasury Bills (Real Interest Rates)
0.4 0.5 4.4 0.66
74

Stocks, Bonds, Bills, and Inflation Returns
positive real in terest rates occur historically. The geometric and arithmetic means of inflation-adjusted series are lower than the nominal series by approximately the amount of inflation.
The standard deviations of common-stock and small- company-stock returns remain approximately the same after adjusting for inflation, while bonds and bills are more volatile (i.e., have higher standard deviations) after adjusting for inflation.
Volatility of the MarketsThe bar graph of monthly returns in Exhibit 22 gives a
picture of the changing volatility of stocks and long-term bonds, in isolation and compared with each other. The stock market was unusually volatile in the early years reflecting the 1920s boom, the crash of 1929-32, and the volatile markets of the Great Depression. The market was much more stable between World War II and the 1970s. Since then, stock market volatility increased, but not to the extreme levels of the early years except for October 1987.
Bonds present a different picture. The nominal returns on long-term government bonds were stable in the 1920s and 1930s. Starting in the late 1960s, bond volatility soared; in the 1973-74 stock market decline, bonds did not provide the shelter they once offered. Bond yields peaked in 1981 and returns since then have been high, but the volatility of the bond market continues.
Additional Series DifferencesBecause the reader may wish to make other comparisons
among stock, bond, and bill returns, summary statistics of several additional series differences are given in Exhibit 23.
75
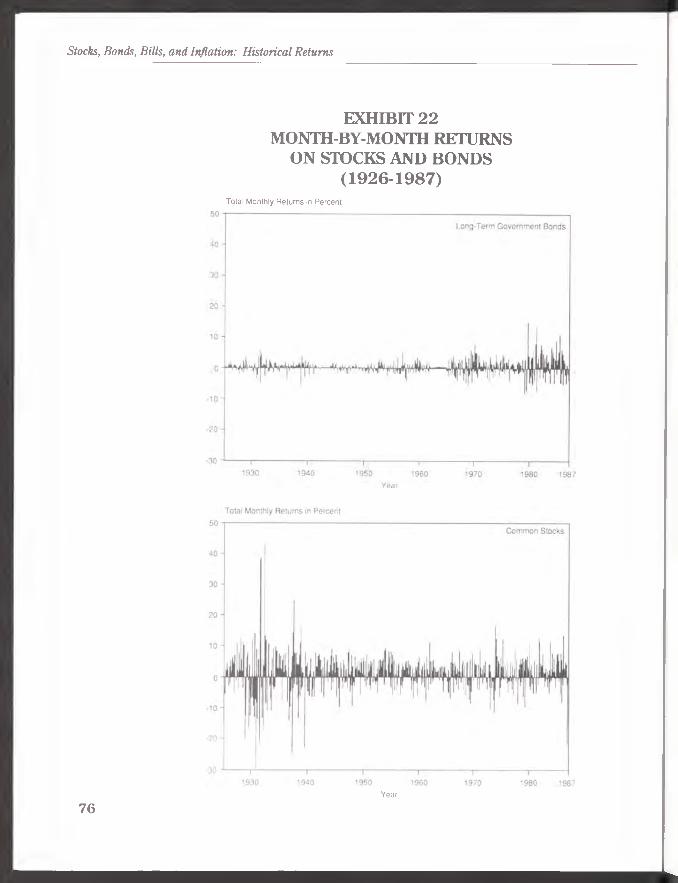
Stocks, Bonds, Bills, and Inflation: Historical Returns
EXHIBIT 22MONTH-BY-MONTH RETURNS
ON STOCKS AND BONDS (1926-1987)
Total Monthly Returns in Percent
76Year

Stocks, Bonds, Bills, and Inflation Returns
EXHIBIT 23 SERIES DIFFERENCES:
SUMMARY STATISTICS OF DIFFERENCES BETWEEN ANNUAL RETURNS ON COMMON STOCKS,
LONG- AND INTERMEDIATE-TERM BONDS, AND BILLS(1926-1987)
____________ Series__________
Stocks M inus Bonds and Bills:
Common stock total returns minus longterm government bond total returns
Common stock total returns minus intermediate-term government bond total returns
Equity risk premiums: Common stock total returns minus Treasury bill total returns
Long-horizon equity risk premiums:Common stock total returns minus long-term government bond yield (income) returns
Intermediate-horizon equity risk premiums: Common stock total returns minus intermediate-term government bond yield (income) returns
First-OrderGeom etric Arithmetic Standard Auto-
Mean Mean Deviation Correlation
5.4% 7.6% 21.5% -0.02
4.9 7.0 21.0 0.01
6.2 8.3 21.1 0.02
4.7 6.8 20.5 0.03
5.2 7.3 20.6 0.03
77

Stocks, Bonds, Bills, and Inflation: Historical Returns
EXHIBIT 23 (Continued)
Geometric Arithmetic Standard .Series____________ Mean M ean Deviation
Bonds an d Bills
Long-term government bond total returns minus intermediate-term government bond totalreturns -0.5 -0.4 4.0
Horizon premiums: Longterm government bond total returns minus Treasury bill totalreturns 0.8 1.1 8.0
Intermediate-term government bond total returns minus Treasurybill total returns 1.2 1.3 4.5
First-OrderAuto-
Correlation
0.09
0.07
0.05
78
Stocks, Bonds, Bills, and Inflation Returns
Geometric Mean Rates of Return for Different Holding Periods
Compound (geometric mean) annual returns for the seven basic series for all calendar year holding periods from 1926 to 1987 are presented in matrix form in the appendix, Exhibits A-l through A-7. The year-by-year annual returns are on the diagonals of each matrix. To find the compound annual return for any holding period, look in the beginning year column and the ending year row. For example, in Exhibit A-l, the compound annual return for common stocks for the period 1960-79 is 6.8 percent (column 1960, row 1979).
Matrices for two component series, equity risk premiums and real riskless rates of interest, are presented in Exhibits A-8 and A-9, respectively. Finally, Exhibit A-10 provides the long-horizon equity risk premium, which is calculated as total returns for stocks in excess of the yield return, or income return, on long-term government bonds. This series is useful in determining the equity cost of capital over a long future period (see Chapter 9). The long-horizon equity risk premium, Rih, is calculated as:
RihMG + RmVU + Ry)]- ! (32)
where
Rm is the return on common stock, and
Ry is the income return on long-term government bonds.
Rolling Period Compound Mean Returns Because of the interest in returns across certain holding
periods, compound annual returns for 5-, 10-, and 20-year periods are presented for the basic series (Exhibits 24-A, 24-B, and 24-C), and for the equity risk premium, the real
79

Stocks, Bonds, Bills, and Inflation: Historical Returns
EXHIBIT 24-A BASIC SERIES:
COMPOUND ANNUAL RETURNS FOR FIVE-YEAR HOLDING PERIODS
(Percent per Annum) (1926-1987)
PeriodCommonStocks
SmallCompany
Stocks
____Long-TermCorp. Govt Bonds Bonds
Interm.Govt
Bonds
4.69
U.S.Treasury
Bills
3.36
Tnflatinn
1926-1930 8.68 -12.44 5.76 4.93 -2.101927-1931 -5.10 -23.74 3.87 2.25 3.11 2.91 -3.751928-1932 -12.47 -27.54 4.52 3.69 3.94 2.48 -5.421929-1933 -11.24 -19.06 6.01 3.65 4.13 1.89 -5.141930-1934 -9.93 -2.37 8.09 4.95 4.71 0.98 -4.80
1931-1935 3.12 14.99 8.42 5.01 4.77 0.53 -3.041932-1936 22.47 45.83 10.26 7.71 5.90 0.35 -0.841933-1937 14.29 23.96 8.60 4.46 4.45 0.22 1.961934-1938 10.67 9.86 7.75 5.61 5.33 0.16 1.291935-1939 10.91 5.27 5.81 4.81 4.45 0.13 0.78
1936-1940 0.50 -2.64 4.59 5.03 3.65 0.10 0.381937-1941 -7.51 -13.55 3.79 3.71 3.13 0.08 2.021938-1942 4.62 10.70 3.76 4.32 3.21 0.07 3.211939-1943 3.77 18.71 3.10 3.63 2.54 0.14 4.441940-1944 7.67 29.28 3.25 3.01 2.00 0.20 4.98
1941-1945 16.96 45.90 3.39 3.90 1.85 0.27 5.251942-1946 17.87 45.05 3.19 3.69 1.95 0.33 6.821943-1947 14.86 35.00 2.17 2.48 1.74 0.37 6.771944-1948 10.87 18.43 2.43 2.75 1.55 0.47 6.671945-1949 10.69 12.66 2.15 3.46 1.66 0.62 5.84
1946-1950 9.91 7.72 1.76 1.39 1.35 0.79 6.571947-1951 16.70 12.09 0.87 0.60 1.22 1.02 4.251948-1952 19.37 12.55 2.05 1.37 1.37 1.25 2.651949-1953 17.86 11.53 1.91 1.41 1.64 1.45 2.231950-1954 23.92 18.27 2.31 1.55 1.71 1.41 2.50
1951-1955 23.89 14.97 1.98 1.28 1.44 1.48 1.431952-1956 20.18 14.21 1.10 0.92 1.28 1.67 0.841953-1957 13.58 10.01 2.10 2.15 2.49 1.97 1.271954-1958 22.31 23.22 0.96 0.16 1.57 1.91 1.501955-1959 14.96 15.54 -0.29 -1.67 0.96 2.33 1.90
80
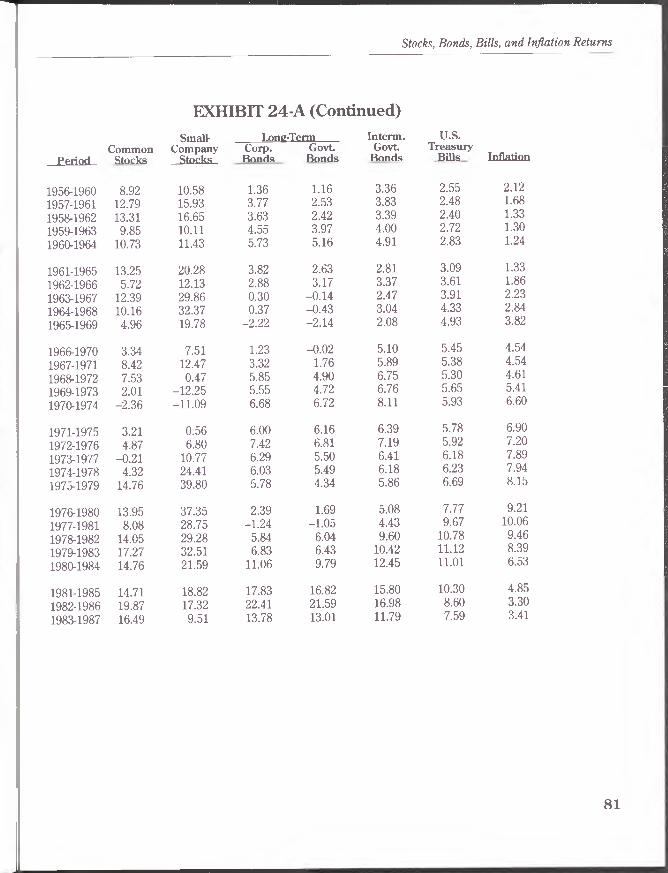
Stocks, Bonds, Bills, and Inflation Returns
EXHIBIT 24-A (Continued)
PeriodCommon
Stocks
SmallCompany
Stocks
Ix>ng-Term Corp. Govt. Ronds Bonds
Interm.Govt.
Bonds
U.S.Treasury
Bills Inflation
1956-1960 8.92 10.58 1.36 1.16 3.36 2.55 2.121957-1961 12.79 15.93 3.77 2.53 3.83 2.48 1.68
1958-1962 13.31 16.65 3.63 2.42 3.39 2.40 1.331959-1963 9.85 10.11 4.55 3.97 4.00 2.72 1.301960-1964 10.73 11.43 5.73 5.16 4.91 2.83 1.24
1961-1965 13.25 20.28 3.82 2.63 2.81 3.09 1.33
1962-1966 5.72 12.13 2.88 3.17 3.37 3.61 1.86
1963-1967 12.39 29.86 0.30 -0.14 2.47 3.91 2.231964-1968 10.16 32.37 0.37 -0.43 3.04 4.33 2.84
1965-1969 4.96 19.78 -2.22 -2.14 2.08 4.93 3.82
1966-1970 3.34 7.51 1.23 -0.02 5.10 5.45 4.54
1967-1971 8.42 12.47 3.32 1.76 5.89 5.38 4.54
1968-1972 7.53 0.47 5.85 4.90 6.75 5.30 4.611969-1973 2.01 -12.25 5.55 4.72 6.76 5.65 5.41
1970-1974 -2.36 -11.09 6.68 6.72 8.11 5.93 6.60
1971-1975 3.21 0.56 6.00 6.16 6.39 5.78 6.90
1972-1976 4.87 6.80 7.42 6.81 7.19 5.92 7.20
1973-1977 -0.21 10.77 6.29 5.50 6.41 6.18 7.89
1974-1978 4.32 24.41 6.03 5.49 6.18 6.23 7.94
1975-1979 14.76 39.80 5.78 4.34 5.86 6.69 8.15
1976-1980 13.95 37.35 2.39 1.69 5.08 7.77 9.21
1977-1981 8.08 28.75 -1.24 -1.05 4.43 9.67 10.06
1978-1982 14.05 29.28 5.84 6.04 9.60 10.78 9.46
1979-1983 17.27 32.51 6.83 6.43 10.42 11.12 8.39
1980-1984 14.76 21.59 11.06 9.79 12.45 11.01 6.53
1981-1985 14.71 18.82 17.83 16.82 15.80 10.30 4.85
1982-1986 19.87 17.32 22.41 21.59 16.98 8.60 3.30
1983-1987 16.49 9.51 13.78 13.01 11.79 7.59 3.41
81

Stocks, Bonds, Bills, and Inflation: Historical Returns
EXHIBIT 24-B BASIC SERIES:
COMPOUND ANNUAL RETURNS FOR 10-YEAR HOLDING PERIODS
(Percent per Annum) (1926-1987)
PeriodCommonStocks
Small-Company
Stocks
____Long-TermCorp. Govt. Bonds Bonds
Interm.GovtBonds
4.73
U.S.Treasury
Bills
1.93
Inflation
1926-1935 5.86 0.34 7.08 4.97 -2.571927-1936 7.81 5.45 7.02 4.94 4.50 1.62 -2.301928-1937 0.02 -5.22 6.54 4.07 4.19 1.34 -1.801929-1938 -0.89 -5.70 6.88 4.63 4.73 1.02 -1.981930-1939 -0.05 1.38 6.95 4.88 4.58 0.55 -2.05
1931-1940 1.80 5.81 6.49 5.02 4.21 0.32 -1.341932-1941 6.43 12.28 6.97 5.69 4.50 0.21 0.581933-1942 9.35 17.14 6.15 4.39 3.83 0.15 2.591934-1943 7.17 14.20 5.40 4.61 3.93 0.15 2.851935-1944 9.28 16.66 4.53 3.91 3.22 0.17 2.86
1936-1945 8.42 19.18 3.99 4.46 2.75 0.18 2.791937-1946 4.41 11.98 3.49 3.70 2.54 0.20 4.391938-1947 9.62 22.24 2.96 3.40 2.47 0.22 4.971939-1948 7.26 18.57 2.77 3.19 2.04 0.30 5.551940-1949 9.17 20.69 2.70 3.24 1.83 0.41 5.41
1941-1950 13.38 25.37 2.57 2.64 1.60 0.53 5.911942-1951 17.28 27.51 2.02 2.13 1.59 0.67 5.531943-1952 17.09 23.27 2.11 1.92 1.56 0.81 4.691944-1953 14.31 14.93 2.17 2.08 1.60 0.96 4.431945-1954 17.12 15.43 2.23 2.50 1.69 1.01 4.16
1946-1955 16.69 11.29 1.87 1.33 1.40 1.14 3.961947-1956 18.43 13.14 0.98 0.76 1.25 1.35 2.531948-1957 16.44 11.27 2.07 1.76 1.93 1.61 1.961949-1958 20.06 17.23 1.43 0.78 1.61 1.68 1.861950-1959 19.35 16.90 1.00 -0.07 1.34 1.87 2.20
1951-1960 16.16 12.75 1.67 1.22 2.40 2.01 1.771952-1961 16.43 15.07 2.43 1.72 2.55 2.08 1.261953-1962 13.44 13.28 2.86 2.29 2.94 2.19 1.301954-1963 15.91 16.48 2.74 2.04 2.78 2.31 1.401955-1964 12.82 13.47 2.68 1.69 2.91 2.58 1.57
82

Stocks, Bonds, Bills, and Inflation Returns
EXHIBIT 24-B (Continued)
CommonSmall
CompanyLong-Term
Corp. GovtInterm.Govt
U.S.Treasury
Period Stocks Stocks Bonds Bonds Bonds Bills
1956-1965 11.06 15.33 2.58 1.89 3.09 2.821957-1966 9.20 14.02 3.33 2.85 3.60 3.05
1958-1967 12.85 23.08 1.95 1.13 2.93 3.15
1959-1968 10.00 20.73 2.44 1.74 3.52 3.52
1960-1969 7.81 15.53 1.68 1.45 3.48 3.88
1961-1970 8.18 13.72 2.51 1.30 3.95 4.26
1962-1971 7.06 12.30 3.10 2.46 4.63 4.49
1963-1972 9.93 14.22 3.04 2.35 4.59 4.601964-1973 6.00 7.77 2.93 2.11 4.89 4.98
1965-1974 1.24 3.20 2.13 2.19 5.05 5.43
1966-1975 3.27 3.98 3.59 3.02 5.74 5.62
1967-1976 6.63 9.60 5.35 4.26 6.54 5.65
1968-1977 3.59 5.50 6.07 5.20 6.58 5.74
1969-1978 3.16 4.48 5.79 5.10 6.47 5.94
1970-1979 5.86 11.49 6.23 5.52 6.98 6.31
1971-1980 8.44 17.53 4.18 3.90 5.73 6.77
1972-1981 6.47 17.26 3.00 2.81 5.80 7.78
1973-1982 6.68 19.67 6.06 5.77 7.99 8.46
1974-1983 10.61 28.40 6.43 5.96 8.28 8.65
1975-1984 14.76 30.38 8.39 7.03 9.10 8.83
1976-1985 14.33 27.75 9.84 8.99 10.31 9.03
1977-1986 13.82 22.90 9.95 9.69 10.53 9.14
1978-1987 15.26 18.99 9.73 9.47 10.69 9.17
Inflation
1.731.771.78 2.07 2.52
2.923.19 3.41 4.125.20
5.715.866.246.67 7.37
8.058.628.67 8.16 7.34
7.016.636.39
83

Stocks, Bonds, Bills, and Inflation: Historical Returns
EXHIBIT 24-C BASIC SERIES:
COMPOUND ANNUAL RETURNS FOR 20-YEAR HOLDING PERIODS
(Percent per Annum) (1926-1987)
Small- ____Long-Term___ Interm. U.S.Common Company Corp. Govt Govt Treasury
Period Stocks Stocks Bonds Bonds Bonds Bills Inflation
1926-1945 7.13 9.36 5.52 4.72 3.73 1.05 0.071927-1946 6.10 8.67 5.24 4.32 3.51 0.91 0.991928-1947 4.71 7.64 4.74 3.74 3.33 0.78 1.531929-1948 3.11 5.74 4.80 3.90 3.38 0.66 1.721930-1949 4.46 10.61 4.80 4.05 3.20 0.48 1.61
1931-1950 7.43 15.17 4.51 3.82 2.90 0.42 2.221932-1951 11.72 19.65 4.47 3.90 3.04 0.44 3.021933-1952 13.15 20.16 4.11 3.15 2.68 0.48 3.631934-1953 10.68 14.56 3.77 3.34 2.76 0.55 3.641935-1954 13.13 16.04 3.37 3.20 2.45 0.59 3.51
1936-1955 12.48 15.17 2.92 2.88 2.07 0.66 3.371937-1956 11.20 12.56 2.23 2.22 1.89 0.77 3.461938-1957 12.98 16.63 2.52 2.57 2.20 0.91 3.451939-1958 13.48 17.90 2.10 1.98 1.83 0.99 3.691940-1959 14.15 18.78 1.85 1.57 1.58 1.14 3.79
1941-1960 14.76 18.89 2.12 1.92 2.00 1.27 3.821942-1961 16.86 21.13 2.22 1.93 2.07 1.37 3.371943-1962 15.25 18.17 2.48 2.10 2.25 1.50 2.981944-1963 15.11 15.70 2.45 2.06 2.19 1.63 2.901945-1964 14.95 14.44 2.45 2.09 2.30 1.79 2.86
1946-1965 13.84 13.29 2.23 1.61 2.24 1.97 2.841947-1966 13.72 13.58 2.15 1.80 2.42 2.19 2.151948-1967 14.63 17.03 2.01 1.44 2.43 2.38 1.871949-1968 14.92 18.97 1.93 1.26 2.56 2.60 1.961950-1969 13.43 16.21 1.34 0.68 2.40 2.87 2.36
1951-1970 12.10 13.23 2.09 1.26 3.17 3.13 2.351952-1971 11.65 13.67 2.77 2.09 3.58 3.28 2.221953-1972 11.67 13.75 2.95 2.32 3.76 3.39 2.351954-1973 10.85 12.04 2.83 2.08 3.83 3.64 2.751955-1974 6.87 8.21 2.41 1.94 3.98 4.00 3.37
84

Stocks, Bonds, Bills, and Inflation Returns
EXHIBIT 24-C (Continued)
P prioriCommonStocks
7.10
SmallCompany
Stocks
Lon^-Term Corp. Govt. Bonds Bonds
Interm.Govt.
Bonds
U.S.Treasury
Bills Inflation
1956-1975 9.51 3.08 2.46 4.40 4.21 3.701957-1976 7.91 11.78 4.34 3.55 5.06 4.34 3.801958-1977 8.12 13.95 3.99 3.14 4.74 4.44 3.981959-1978 6.53 12.31 4.10 3.41 4.99 4.72 4.341960-1979 6.83 13.49 3.93 3.46 5.22 5.09 4.92
1961-1980 8.31 15.61 3.34 2.59 4.83 5.51 5.461962-1981 6.76 14.75 3.05 2.64 5.21 6.12 5.871963-1982 8.30 16.92 4.54 4.04 6.28 6.51 6.011964-1983 8.28 17.63 4.66 4.02 6.57 6.80 6.121965-1984 7.79 16.00 5.22 4.58 7.06 7.12 6.26
1966-1985 8.66 15.25 6.67 5.97 8.00 7.31 6.361967-1986 10.17 16.06 7.63 6.94 8.52 7.38 6.241968-1987 9.27 12.04 7.89 7.31 8.62 7.44 6.31
85

Stocks, Bonds, Bills, and Inflation: Historical Returns
riskless rates of interest, and the excess of total returns on stocks over yield returns on long-term government bonds (Exhibit 25).
The maximum and minimum values of rolling period returns are given in Exhibits 26-A and 26-B. These extreme values show the limits of the historical experience. For example, five-year holding period returns for common stocks range from a high of 23.9 percent compounded annually in the period 1950-54 to a low of -12.5 percent compounded annually in the period 1928-32.
Geometric Mean versus Arithmetic MeanThe arithm etic and geom etric m eans formed by
equations (28) and (29), respectively, are of course different. Each has a specific meaning in the interpretation of returns; and they should not be confused with each other.
In general, the geometric mean for any time period is less than or equal to the arithmetic mean, as illustrated below:
Rg C T O < RAfTi,T2) (33)
The two means are equal only when returns are constant across the time period; the difference between the two is positively related to the variability or standard deviation of the returns. For example, in Exhibit 19, the difference between the arithmetic and geometric mean is much larger for risky common stocks than it is for nearly riskless Treasury bills. The mathematical relation between the two means is detailed in Chapter 9.
Change in Wealth Over Time versusPerformance in One PeriodA simple example illustrates the difference between
geometric and arithmetic means. Suppose $1.00 is invested in a common stock portfolio that experiences successive annual returns of +50 percent and -50 percent. At the end
86

EXHIBIT 25EQUITY RISK PREMIUMS, LONG-HORIZON EQUITY PREMIUMS,
AND REAL RISKLESS RETURNS:COMPOUND ANNUAL RETURNS FOR DIFFERENT HOLDING PERIODS
(Percent Per Annum)(1926-1987)
Five-Year Holding Period Returns Ten-Year Holding Period Returns Twentv-Year Holding Period Returns
P e r i o d
L o n g - H o r iz o nE q u i t y E q u i t y R e a l
R i s k R i s k R i s k l e s s P r e m i u m s P r e m i u m s R e t u r n s P e r i o d
L o n g - H o r i z o n E q u i t y E q u i ty R e a l
R i s k R i s k R i s k l e s s P r e m i u m s P r e m i u m s R e t u r n s P e r i o d
L o n g - H o n z o nE q u i t y E q u i t y R e a l
R i s k R i s k R i s k l e s s P r e m i u m s P r e m i u m s R e t u r n s
1926-1930 5.15 5.07 5.57 1926-1935 3.85 2.42 4.62 1926-1945 6.01 4.11 0.981927-1931 -7.79 -8.29 6.92 1927-1936 6.08 4.41 4.02 1927-1946 5.14 3.18 -0.081928-1932 -14.58 -15.41 8.35 1928-1937 -1.31 -3.09 3.20 1928-1947 3.90 1.87 -0.741929-1933 -12.88 -14.23 7.41 1929-1938 -1.89 -3.88 3.06 1929-1948 2.43 0.37 -1.041930-1934 -10.80 -12.88 6.07 1930-1939 -0.60 -2.97 2.65 1930-1949 3.96 1.74 -1.11
1931-1935 2.57 -0.18 3.68 1931-1940 1.48 -1.04 1.68 1931-1950 6.98 4.69 -1.761932-1936 22.04 18.87 1.20 1932-1941 6.20 3.59 -0.36 1932-1951 11.23 8.93 -2.511933-1937 14.04 11.02 -1.71 1933-1942 9.19 6.51 -2.38 1933-1952 12.62 10.35 -3.041934-1938 10.50 7.70 -1.11 1934-1943 7.01 4.49 -2.63 1934-1953 10.07 7.98 -2.981935-1939 10.76 8.06 -0.65 1935-1944 9.09 6.59 -2.62 1935-1954 12.47 10.38 -2.82
1936-1940 0.40 -1.90 -0.28 1936-1945 8.22 5.84 -2.53 1936-1955 11.74 9.73 -2.631937-1941 -7.58 -9.73 -1.90 1937-1946 4.20 1.97 -4.02 1937-1956 10.35 8.43 -2.601938-1942 4.55 2.19 -3.05 1938-1947 9.38 7.09 -4.53 1938-1957 11.95 10.14 -2.461939-1943 3.63 1.37 -4.12 1939-1948 6.94 4.80 -4.97 1939-1958 12.37 10.57 -2.601940-1944 7.45 5.13 -4.55 1940-1949 8.72 6.69 -4.74 1940-1959 12.86 11.12 -2.56
1941-1945 16.65 14.19 -4.73 1941-1950 12.78 10.75 -5.08 1941-1960 13.33 11.60 -2.461942-1946 17.49 15.17 -6.08 1942-1951 16.50 14.54 -4.60 1942-1961 15.27 13.53 -1.941943-1947 14.43 12.23 -5.99 1943-1952 16.15 14.32 -3.70 1943-1962 13.55 11.89 -1.441944-1948 10.35 8.35 -5.82 1944-1953 13.22 11.58 -3.32 1944-1963 13.26 11.66 -1.231945-1949 10.01 8.26 -4.93 1945-1954 15.94 14.30 -3.02 1945-1964 12.92 11.43 -1.03
1946-1950 9.05 7.42 -5.42 1946-1955 15.38 13.77 -2.72 1946-1965 11.64 10.22 -0.841947-1951 15.52 13.92 -3.10 1947-1956 16.85 15.31 -1.16 1947-1966 11.28 9.96 0.041948-1952 17.89 16.45 -1.36 1948-1957 14.59 13.28 -0.34 1948-1967 11.97 10.65 0.501949-1953 16.17 14.90 -0.76 1949-1958 18.07 16.65 -0.18 1949-1968 12.01 10.74 0.621950-1954 22.20 20.68 -1.07 1950-1959 17.16 15.73 -0.32 1950-1969 10.27 9.06 0.50
1951-1955 22.08 20.50 0.05 1951-1960 13.87 12.46 0.24 1951-1970 8.70 7.59 0.771952-1956 18.21 16.72 0.82 1952-1961 14.06 12.53 0.80 1952-1971 8.10 6.98 1.031953-1957 11.38 10.19 0.69 1953-1962 11.02 9.52 0.88 1953-1972 8.02 6.82 1.011954-1958 20.01 18.43 0.41 1954-1963 13.29 11.75 0.90 1954-1973 6.95 5.79 0.871955-1959 12.34 10.98 0.42 1955-1964 9.98 8.63 1.00 1955-1974 2.77 1.73 0.61
Stocks, Bon
ds, Bills, an
d Inflation
Retu
rns

EXHIBIT 25 (Continued)
E q u i tyL o n g -H o r iz o i
E q u i ty1
R e a lR i s k R i s k R i s k l e s s
Feriod P r e m i u m s P r e m i u m s R e t u r n s
1956-1960 6.21 4.96 0.421957-1961 10.06 8.49 0.791958-1962 10.65 8.85 1.061959-1963 6.95 5.44 1.401960-1964 7.67 6.33 1.57
1961-1965 9.86 8.65 1.731962-1966 2.03 1.36 1.721963-1967 8.17 7.32 1.641964-1968 5.59 4.81 1.451965-1969 0.03 -0.65 1.07
1966-1970 -2.01 -2.49 0.881967-1971 2.88 2.06 0.801968-1972 2.11 1.13 0.661969-1973 -3.44 -4.30 0.221970-1974 -7.82 -8.65 -0.63
1971-1975 -2.43 -3.76 -1.051972-1976 -0.99 -2.49 -1.201973-1977 -6.02 -7.47 -1.581974-1978 -1.80 -3.55 -1.581975-1979 7.56 5.78 -1.34
1976-1980 5.73 4.29 -1.321977-1981 -1.45 -2.21 -0.351978-1982 2.95 2.69 1.211979-1983 5.54 5.03 2.521980-1984 3.38 2.45 4.20
1981-1985 4.00 2.85 5.201982-1986 10.37 8.66 5.141983-1987 8.27 5.87 4.04
Ten-Year Holding Period ReturnsI /> n g - H o n z o n
E q u i ty E q u i ty R e a l R i s k R i s k R i s k l e s s
P r e m i u m s P r e m i u m s R e t u r n s
1956-1965 8.02 6.79 1.071957-1966 5.97 4.86 1.251958-1967 9.40 8.09 1.351959-1968 6.27 5.13 1.421960-1969 3.78 2.78 1.32
1961-1970 3.76 2.93 1.301962-1971 2.46 1.71 1.261963-1972 5.10 4.18 1.151964-1973 0.97 0.15 0.831965-1974 -3.97 -4.73 0.22
1966-1975 -2.22 -3.12 -0.091967-1976 0.93 -0.24 -0.201968-1977 -2.04 -3.27 -0.471969-1978 -2.62 -3.93 -0.681970-1979 -0.43 -1.69 -0.99
1971-1980 1.57 0.19 -1.191972-1981 -1.22 -2.35 -0.771973-1982 -1.64 -2.52 -0.201974-1983 1.81 0.65 0.451975-1984 5.45 4.10 1.39
1976-1985 4.86 3.57 1.891977-1986 4.29 3.08 2.361978-1987 5.58 4.27 2.62
P e r i o d
E q u i tyR i s k
P r e m i u m s
jo n g -H o r iz o nE q u i ty R e a l R i s k R i s k l e s s
P r e m i u m s R e t u r n s
1956-1975 2.77 1.71 0.491957-1976 3.42 2.28 0.521958-1977 3.52 2.25 0.441959-1978 1.72 0.50 0.361960-1979 1.66 0.52 0.16
1961-1980 2.66 1.55 0.051962-1981 0.60 -0.34 0.241963-1982 1.67 0.77 0.471964-1983 1.39 0.40 0.641965-1984 0.63 -0.41 0.80
1966-1985 1.26 0.17 0.891967-1986 2.60 1.40 1.071968-1987 1.70 0.43 1.06
Stocks, Bon
ds, Bills, an
d Inflation
: Historical R
eturn
s

Stocks, Bonds, Bills, and Inflation Returns
EXHIBIT 26-AMINIMUM AND MAXIMUM VALUES OF ANNUAL AND
FIVE-YEAR ROLLING PERIOD RETURNS (Compound Annual Rates of Return in Percent)
______________Series
Annual Returns
Tim esPositive
M aximum Value M inimum Value (out of Return Yearfsl Return Yearts) 6 2 years)
B asic Series
Common Stocks Small-Company Stocks Long-Term Corporate Bonds Long-Term Government Bonds Intermediate Government Bonds U.S. Treasury Bills Inflation
Selected D erived Series
Equity Risk Premiums Long-Horizon Equity Risk Premiums Inflation-Adjusted Common Stocks Inflation-Adjusted LT Govt Bonds Real Riskless Rates
53.99% 1933 -43.34% 1931 43142.87 1933 -58.01 1937 4243.79 1982 -8.09 1969 4740.35 1982 -9.19 1967 4429.10 1982 -2.32 1931 5614.71 1981 -0.02 1938 6118.17 1946 -10.30 1932 52
53.53 1933 -43.94 1931 3849.34 1933 -45.16 1931 3853.39 1954 -37.37 1931 4135.12 1982 -15.46 1946 3512.55 1932 -15.07 1946 36
Five-Year Rolling Period Returns
Basic Series
Common Stocks Small-Company Stocks Long-Term Corporate Bonds Long-Term Government Bonds Intermediate Government Bonds U.S. Treasury Bills Inflation
Selected D erived Series
Equity Risk Premiums Long-Horizon Equity Risk Premiums Inflation-Adjusted Common Stocks Inflation-Adjusted LT Govt Bonds Real Riskless Rates
23.92 % 1950-54 -12.47 % 1928-3245.90 1941-45 -27.54 1928-3222.41 1982-86 -2.22 1965-6921.59 1982-86 -2.14 1965-6916.98 1982-86 0.96 1955-5911.12 1979-83 0.07 1938-4210.06 1977-81 -5.42 1928-32
22.20 1950-54 -14.58 1928-3220.68 1950-54 -15.41 1928-3223.51 1932-36 -9.34 1937-4117.71 1982-86 -10.09 1977-818.35 1928-32 -6.08 1942-46
89

Stocks, Bonds, Bills, and Inflation: Historical Returns
EXHIBIT 26-BMINIMUM AND MAXIMUM VALUES OF 10- AND 20-YEAR
ROLLING PERIOD RETURNS (Compound Annual Rates of Return in Percent)
_________ Series___________
10-Year Rolling Period Returns
___ Maximum ValueReturn Year(s)
__ Minimum ValnpReturn Year! si
Basic Series
Common Stocks Small-Company Stocks Long-Term Corporate Bonds Long-Term Government Bonds Intermediate Government Bonds U.S. Treasury Bills Inflation
Selected D erived Series
Equity Risk Premiums Long-Horizon Equity Risk Premiums Inflation-Adjusted Common Stocks Inflation-Adjusted LT Govt Bonds Real Riskless Rates
20.06%30.389.959.69
10.699.178.67
18.0716.6517.877.744.62
1949-581975-841977-861977- 861978- 87 1978-87 1973-82
1949-581949-581949-581926-351926-35
-0.89%-0.57
0.98-0.07
1.250.15
-2.57
-3.97-4.73-3.77-5.35-5.08
1929-381929-381947-561950-591947-561933-421926-35
1965-741965-741965-741972-811941-50
20-Year Rolling Period Returns
Basic Series
Common Stocks Small-Company Stocks Long-Term Corporate Bonds Long-Term Government Bonds Intermediate Government Bonds U.S. Treasury Bills Inflation
Selected D erived Series
Equity Risk Premiums Long-Horizon Equity Risk Premiums Inflation-Adjusted Common Stocks Inflation-Adjusted LT Govt Bonds Real Riskless Rates
16.86%21.13
7.897.318.627.446.36
15.2713.5313.044.641.07
1942-611942-611968-871968-871968-871968-871966-85
1942-611942-611942-611926-451967-86
3.11%5.741.340.681.580.420.07
0.60-0.410.84
-3.06-3.04
1929-481929-481950-691950-691940-591931-501926-45
1962-811965-841962-811962-811933-52
90

Stocks, Bonds, Bills, and Inflation Returns
of the first year, the portfolio is worth $1.50. At the end of the second year, the portfolio is worth $0.75. The annual arithmetic mean is zero percent, whereas the annual geometric mean is -13.4 percent. The geometric mean is backward-looking, measuring the change in wealth over more than one period. On the other hand, the arithmetic mean is a better representation of typical performance over single periods, and is the correct rate for cost of capital estimation, forecasting, and discounting (see Chapters 9 and 10).

Stocks, Bonds, Bills, and Inflation: Historical Returns

7. Time SeriesBehavior of the Returns
Correlation Coefficients: Serial and Cross-Correlations
This chapter focuses on the behavior of the return series over time. Time series behavior is interesting because it reveals the predictability of an asset or component return. For example, a series may be revealed to be random, or unpredictable; or it may be subject to trends, cycles, or other patterns, making the series predictable to a greater or lesser degree. The first-o rder autocorrelation , or serial correlation, of a series determines its predictability given knowledge of the latest observation. The cross-correlation (corre la tion) betw een two se ries d e te rm in es the predictability of one series, conditional on knowledge of the
other.Mathematically, the correlation between two return
series A and B is given by:
PA,B = lcov(A,B) ]/[o AoB] (34)
where
<3A and gb are the standard deviations of series A and B respectively (see Chapter 5), and
cov(A,B) is the covariance of series A and B and is given as follows:

Stocks, Bonds, Bills, and Inflation: Historical Returns
n
cov(A,B)= E (A t-A) (Bt - B)
t=l (35)
where
At and Bt are the returns on series A and B, respectively, in period t,
A and B are the arithmetic means of series A and B, respectively, and
n is the number of periods.
The serial correlation of a single series is calculated in the same manner as the correlation between two series. For the serial correlation, the correlation is calculated between the series itself and the “lagged” series. The lagged series is the series of one-period-old returns, as in the following example (for an annual series starting in year 1):
Year ReturnLaggedReturn
1 0.10 undefined2 -0.10 0.103 0.15 -0.104 0.00 0.15etc.
Correlations o f the Basic SeriesExhibit 27 presents the yearly cross-correlations and
serial correlations for the seven basic series. Long- and intermediate-term government and long-term corporate bond returns are highly correlated with each other but negatively correlated with inflation. Because the inflation was largely unanticipated, it had a negative effect on fixed-income securities. In addition, U.S. Treasury bills and inflation are reasonably highly correlated, a result of the
94

Time Series Behavior of the Returns
EXHIBIT 27 BASIC ASSET CLASSES:
SAMPLE SERIAL AND CROSS-CORRELATIONS OF HISTORICAL YEARLY RETURNS*
(1926-1987)
CommonStocks
SmallStocks
Long-TermCorporate
B onds
Long-TermGovernment
B onds
Interm ed. U .S. Governm ent Treasury
B onds______ Bills__ Inflation
Common Stocks 1.00
Small Stocks 0.82 1.00
Long-Term Corp. Bonds 0.19 0.08 1.00
Long-Term Govt. Bonds 0.11 -0.01 0.93 1.00
Intermediate Govt. Bonds 0.03 -0.07 0.89 0.89 1.00
U.S. Treasury Bills -0.07 -0.09 0.18 0.21 0.50 1.00
Inflation -0.02 0.06 -0.17 -0.17 0.01 0.41 1.00
SerialCorrelations 0.01 0.10 0.17 0.10 0.28 0.92 0.64
*The standard error for all estimates is 0.13.
95

Stocks, Bonds, Bills, and Inflation: Historical Returns
post-1951 “tracking” described earlier in Chapter 2. Finally, both the U.S. Treasury bills and inflation series display high serial correlations.
Correlations of the Component SeriesThe yearly cross-correlations and serial correlations for
the four risk premium series and inflation are presented in Exhibit 28. These correlations reveal that the small stock prem ium s and perhaps bond default prem ium s are significantly correlated with equity risk premiums. With one exception, the remaining series are independent of one another, having cross-correlations which do not differ from zero at the 5 percent statistical significance level. The exception is that inflation is negatively correlated with the horizon premium, because unexpected increases in inflation cause long-term bond yields to rise and prices to fall; unexpected decreases have the opposite effect.
Exhibit 29 presents yearly cross-correlations and serial correlations for the inflation-adjusted asset return series. It is interesting to observe how the asset return relations differe substantially when they are expressed in inflation- adjusted form (compared to Exhibit 27). In general, the cross-correlations between asset classes are higher when one accounts for inflation (i.e., subtracts inflation out of the nominal returns).
The Meaning of Serial CorrelationA direct way to test for patterns in the series is to examine
the one-year serial-correlation coefficients. As noted above, the coefficients measure the degree of correlation between returns from each year and the previous year for the same series. Highly positive (near 1) serial correlations indicate trends, while highly negative (near -1) serial correlations indicate cycles. Serial correlations near zero suggest no patterns (i.e., random walks).
96

Time Series Behavior of the Returns
EXHIBIT 28RISK PREMIUMS AND INFLATION:
SERIAL AND CROSS-CORRELATIONS OF HISTORICAL YEARLY RETURNS*
(1926-1987)
Equity Risk Prem ium s
Sm all-StockPrem ium s
Default Horizon Prem ium s Prem ium s
InflationRates
Equity Risk Premiums 1.00
Small-Stock Premiums 0.39 1.00
Default Premiums 0.23 0.13 1.00
Horizon Premiums 0.16 -0.07 -0.21 1.00
Inflation Rates -0.08 0.15 -0.01 -0.34 1.00
SerialCorrelations 0.02 0.38 -0.30 0.11 0.64
*The standard error for all estimates is 0.13
97

Stocks, Bonds, Bills, and Inflation: Historical Returns
EXHIBIT 29INFLATION-ADJUSTED BASIC SERIES:
SERIAL AND CROSS-CORRELATIONS OF HISTORICAL YEARLY RETURNS*
(1926-1987)
------------- Inflation-Adjusted Total Returns
CommonStocks
SmallStocks
Long-TermCorp
B onds
Long-TermGovt
B onds
Interm ediate
GovtB onds
T-Bills(Real
InterestRates!
InflationRates
Inflation-Adjusted:
Common Stocks 1.00
Small Stocks 0.82 1.00
LT Corporate Bonds 0.27 0.11 1.00
LT Government Bonds 0.20 0.03 0.95 1.00
Intermed. Govt. Bonds 0.15 -0.02 0.94 0.94 1.00
Treasury Bills (Real Interest Rates)
0.09 -0.06 0.61 0.62 0.77 1.00
Inflation Rates -0.22 -0.07 -0.61 -0.60 -0.66 -0.76 1.00
Serial Correlations 0.00 0.07 0.28 0.18 0.34 0.66 0.64
*The standard error for all estimates is 0.13.
98

Time Series Behavior of the Returns
Serial Correlation in the Component Series:Trends or Random Walks?
The risk-return relations in the historical data are represented in the equity risk premiums, the small-stock premiums, the bond horizon premiums, and the bond default premiums. The real/nominal historical relations are represented in the inflation rates and the real interest rates. (See Exhibits 20 and 21.) The objective is to uncover whether each series is random or whether it is subject to any trends or cycles.
Each of the component series’ serial correlations can be interpreted as following a random walk, trend, or uncertain path. Equity risk premiums and bond horizon premiums appear to follow random walks. Conversely, there is strong evidence that both inflation rates and real riskless rates follow trends. Small-stock premiums and bond default premiums fall into a middle range; it cannot be determined with certainty that they follow either a trend or a random walk, although the serial correlation of small-stock premiums suggests some kind of pattern. The interpretation of each of the component series’ correlations is in Exhibit 30.
The term “random walk” is used somewhat loosely here. In a random walk, the best estimate of the next index level is the last index level. The cumulative index values formed by linking the returns on random variables follow a random walk, in the formal sense. The randomly distributed returns themselves are more precisely described as a stationary process with no serial correlation. In such a process, the best estimate of the next return is the arithmetic mean of historical returns.
The terminology used here has the advantage of being intuitively sensible. A random variable is said to follow a
99

Stocks, Bonds, Bills, and Inflation: Historical Returns
EXHIBIT 30INTERPRETATION OF THE YEARLY
FIRST-ORDER SERIAL CORRELATIONS FOR COMPONENT SERIES
__________ Series________Serial
Correlation Interoretation
Equity Risk Premiums 0.02 Random Walk
Small-Stock Premiums 0.38 Likely Trend
Bond Default Premiums 0.30 Uncertain
Bond Horizon Premiums 0.11 Random Walk
Inflation Rates 0.64 Trend
Real Interest Rates 0.66 Trend
*The standard error for all estimates is 0.13. To be statistically different from zero at the 5 percent significance level, serial correlations must have an absolute value greater than 0.26.
100

Time Series Behavior of the Returns
random walk. One should be aware, however, of the formal definitions set forth above.
Changes in the Risk of Assets over TimeIf a time series is stable, its risk (volatility) will not change
much over time. A simple test of stability is to examine standard deviations of the series over different subperiods.
Exhibit 31 displays the annualized standard deviation of monthly returns on each of the basic and derived series for every year from 1926 to 1987. The standard deviation of a series for a particular year is the standard deviation of the 12 monthly returns for that year (around that year’s arithmetic mean). This monthly estimate is then annualized, i.e., converted to annual-equivalent form, by multiplying by the square root of 12.
Earlier, in Exhibits 2 and 15 through 18, we reported the 62-year standard deviation of annual returns (around the 62-year annual arithmetic mean). It is important to remember that the estimates in Exhibit 31 are not strictly comparable to the annual 62-year results because the arithmetic mean drifts for a series which does not follow a random walk. A series with a drifting mean will have much higher deviations around its long-term mean than it has around the mean during a particular calendar year.
Exhibit 31 is revealing. Common stocks and equity risk premiums have virtually the same monthly standard deviations because there is very little deviation in the U.S. Treasury bill series. These two series also have much higher variability in the pre-World War II period than in the postwar period. On the other hand, the various bond series (long- and intermediate-term government bonds, long-term corporate bonds, horizon premiums, and default premiums) have been quite volatile in the Great Depression and even more so recently.
101

102
Common SmallYear Stocks Stocks
1926 11.74 16.541927 13.22 17.321928 17.35 20.561929 31.02 32.72
1930 26.26 36.191931 43.94 63.851932 68.02 94.361933 56.07 86.731934 22.22 51.58
1935 16.33 25.431936 14.40 38.391937 23.36 42.331938 41.19 66.481939 29.51 70.55
1940 26.70 42.811941 14.30 29.981942 14.71 25.751943 15.62 36.951944 7.86 18.97
1945 13.13 21.961946 18.70 28.891947 9.59 17.721948 19.94 23.701949 10.19 15.65
1950 10.79 15.031951 12.23 14.741952 11.32 9.351953 9.35 11.491954 12.95 12.84
EXHIBIT 31BASIC AND DERIVED SERIES:
ANNUALIZED MONTHLY STANDARD DEVIATIONS FOR EACH YEAR (1926-1987)
(Standard Deviations in Percent)
Basic Series Derived Series__ Long-Term__Corp. Govt.
In term. Govt.
U.S.Treas.
ConsumerPrice
EquityRisk
Small-Stock
BondDefault
BondHorizon
Inflation-Adjustedponds ponds Bonds Bills —index Premiums Premiums Premiums Premiums -T-Bills
0.90 1.76 0.97 0.31 2.05 11.75 10.67 1.64 1.61 1 981.39 2.66 1.01 0.11 2.83 13.18 12.29 2.94 2.62 2.891.82 3.21 1.26 0.59 1.73 17.17 14.64 2.68 3.20 1.782.3b 6.52 2.67 0.20 1.62 30.89 13.67 7.01 6.43 1.562.21 2.25 2.29 0.29 2.15 26.17 13.78 2.38 2.07 2.136.00 5.49 3.80 0.16 1.48 43.90 29.00 5.08 5.49 1.587.00 10.31 2.72 0.29 1.93 68.05 37.41 14.95 10.27 2.1510.65 5.11 3.64 0.10 4.21 55.95 42.90 6.98 5.07 4.152.75 4.12 3.76 0.04 1.99 22.20 31.96 2.44 4.09 1.972.32 2.76 2.61 0.01 2.12 16.33 15.57 1.31 2.76 2.101.11 2.10 1.23 0.02 1.54 14.39 29.57 1.79 2.11 1.521.94 5.02 2.41 0.05 1.69 23.35 23.62 3.84 5.01 1.672.26 2.23 2.34 0.07 1.83 41.17 28.96 1.88 2.20 1 845.16 8.11 4.85 0.02 2.27 29.50 39.35 8.51 8.12 2.231.96 4.92 3.16 0.02 1.08 26.69 23.62 4.01 4.91 1.081.63 3.67 1.49 0.03 2.11 14.28 19.72 3.53 3.67 2 070.71 1.38 0.78 0.03 1.28 14.68 21.20 1.16 1.38 1 270.88 0.64 0.49 0.01 2.29 15.62 22.73 0.58 0.64 2.271.28 0.36 0.28 0.01 0.95 7.86 11.93 1.10 0.36 0.951.37 2.70 0.49 0.01 1.29 13.13 13.42 2.03 2.71 1.282.12 2.74 0.93 0.00 5.70 18.69 12.52 1.71 2.73 5 402.18 2.93 0.52 0.07 3.09 9.58 10.95 3.25 2.98 3.012.12 1.90 0.58 0.07 2.83 19.92 6.88 1.90 1.91 2 772.10 1.72 0.46 0.02 1.66 10.19 6.65 2.51 1.72 1.661.05 1.45 0.33 0.03 1.72 10.78 8.37 1.32 1.45 1.694.02 3.14 1.91 0.05 1.70 12.20 6.93 2.63 3.11 1 692.76 3.20 1.30 0.07 1.14 11.31 4.29 3.74 3.24 1 135̂ 35 4.99 3.16 0.10 1.00 9.39 9.16 3.50 4.98 0.942.24 3.25 1.88 0.06 0.74 12.92 9.57 2.36 3.24 0.76
Stocks, Bon
ds, Bills, an
d Inflation
: Historical R
eturn
s

I
oCO
EXHIBIT 31 (Continued)
B asic. S e r ie s ___D e r iv e d S e r ie s _______
Y earC o m m o n S m a ll
S to c k s
__ Long-Term_C o rp . G ov t.
R n n d s R o n d s
In te rm .G ovt.
R o n d s
U .S .T re a s .R ills
C o n s u m e rP r ic eIn d e x
E q u ityR is k
P re m iu m s
S m all-S to c k
P r e m iu m s
B o n dD e fa u lt
P r e m iu m s
B o n dH o r iz o n
P re m iu m s
In fla tio n -A d ju s te dT -B ills
1955 12.41 6.48 2.16 3.64 1.66 0.13 0.67 12.43 9.52 2.32 3.56 0.701956 14.76 8.04 3.20 4.50 2.65 0.10 1.05 14.75 7.99 2.63 4.47 1.001957 12.62 11.92 8.66 7.71 5.19 0.07 0.65 12.58 10.31 5.41 7.67 0.651958 6.27 9.70 4.65 6.64 4.55 0.26 0.88 6.16 7.01 3.59 6.60 0.881959 8.00 8.95 3.94 3.31 2.73 0.17 0.64 8.00 7.03 3.30 3.33 0.59
1960 13.42 13.62 3.63 5.72 4.50 0.26 0.70 13.46 7.30 4.00 5.65 0.791961 8.92 14.54 3.47 3.51 1.55 0.07 0.51 8.92 7.41 3.79 3.54 0.501962 20.09 23.39 2.12 3.48 2.05 0.08 0.66 20.04 8.61 2.15 3.49 0.691963 9.81 11.01 1.23 0.71 0.59 0.08 0.54 9.77 7.20 1.27 0.74 0.551964 4.02 5.80 1.40 0.88 0.75 0.06 0.40 4.01 3.58 1.82 0.87 0.38
1965 8.54 14.72 1.96 1.50 1.81 0.08 0.65 8.57 9.00 1.10 1.51 0.631966 10.89 18.60 4.79 7.78 3.96 0.11 0.69 10.84 13.20 5.55 7.71 0.721967 12.11 20.66 7.65 7.16 3.77 0.15 0.43 12.04 11.97 4.92 7.09 0.531968 13.02 20.79 7.20 7.92 3.36 0.09 0.40 12.95 13.47 3.48 7.86 0.401969 12.98 23.47 7.46 10.36 5.57 0.20 0.59 12.91 11.58 7.59 10.32 0.62
1970 20.29 30.93 9.61 13.42 6.10 0.21 0.42 20.23 16.02 8.73 13.31 0.471971 13.67 24.87 10.04 9.47 6.45 0.18 0.55 13.62 14.18 6.21 9.37 0.631972 6.63 15.70 3.01 5.55 1.88 0.16 0.40 6.61 12.70 3.91 5.51 0.411973 13.87 29.05 7.46 8.19 4.78 0.34 1.42 13.68 16.92 3.21 8.05 1.361974 23.93 23.82 11.68 8.28 5.43 0.34 0.82 23.99 19.88 6.15 8.27 0.92
1975 17.89 29.82 10.07 8.38 5.29 0.20 0.73 17.77 17.75 4.23 8.27 0.771976 13.72 31.67 4.44 4.71 3.80 0.13 0.46 13.60 21.49 1.53 4.67 0.451977 9.55 13.70 4.50 5.55 2.70 0.19 0.72 9.46 10.06 1.27 5.52 0.871978 16.61 32.63 4.45 4.49 2.01 0.33 0.62 16.54 22.44 1.61 4.53 0.791979 13.36 24.05 10.77 10.90 7.02 0.26 0.47 13.24 12.98 2.24 10.79 0.61
1980 18.31 27.83 20.80 21.33 15.93 0.89 1.31 18.55 13.66 4.40 20.69 1.191981 12.89 18.56 20.73 22.16 10.82 0.45 1.07 12.74 13.44 5.18 21.87 0.951982 19.14 17.21 12.47 10.51 7.03 0.71 1.59 19.33 7.44 4.37 10.70 1.341983 9.92 15.82 11.16 11.33 5.35 0.17 0.71 9.92 12.58 3.63 11.27 0.651984 14.01 15.29 12.90 11.54 6.35 0.31 0.59 13.88 4.92 2.85 11.30 0.58
1985 12.17 14.59 10.76 12.22 5.64 0.16 0.32 12.05 6.76 2.84 12.07 0.331986 17.94 14.38 8.19 17.30 5.73 0.19 1.02 17.83 7.24 9.80 17.16 1.121987 30.50 34.53 9.64 10.28 4.80 0.22 0.66 30.45 12.71 2.96 10.15 0.64
s'
>2

Stocks, Bonds, Bills, and Inflation: Historical Returns
The series with drifting means (U.S. Treasury bills, inflation rates, and inflation-adjusted U.S. Treasury bills) all tend to have very low annualized monthly standard deviations, reflecting the fact that these series are quite predictable from month to month. Over the long term, however, these series are much less predictable because it is difficult to predict the direction and magnitude of the drift in the long-term mean.
104

8 Firm Size and Return
IntroductionOne of the most remarkable discoveries of modern
finance is Rolf Banz’s finding of a relation between firm size and return (Banz 1981). On average, small companies have higher returns than large ones. Earlier chapters document this phenomenon for the smallest stocks on the NYSE. In this chapter, we examine the returns of the entire spectrum of firm sizes. Firm size is defined throughout as equity market capitalization—that is, price per share times the number of shares outstanding. We rank all stocks listed on the NYSE according to their size, and sort them into 10 size groups (each containing one-tenth of the stocks). The group containing the largest stocks is the first decile, and that containing the smallest stocks, the tenth.
Each portfolio is market-capitalization weighted. All returns are total returns. We rerank stocks annually to determine the group boundaries, in contrast to the five-year rerankings used to generate the small-company return series described in earlier chapters.
The relation between firm size and return cuts across the entire size spectrum. It is not restricted to just the smallest stocks.
The firm size phenomenon is remarkable in several ways. First, the greater risk of small stocks does not, in the context
105

Stocks, Bonds, Bills, and Inflation: Historical Returns
of the capital asset pricing model (CAPM), account for their higher returns. In the CAPM, only systematic, or beta, risk is rewarded; small stocks have abnormal returns—that is, returns in excess of those implied by the betas of small stocks. This is Banz’s key finding.
Several corollary findings about firm size and return are as unexpected as the finding of higher returns on small stocks. The calendar annual return differences between small and large companies are serially correlated. This suggests that past annual returns may be of some value in predicting future annual returns. Such serial correlation, or autocorrelation, is practically unknown in the market for large stocks and in most other capital markets. In addition, the firm-size effect is seasonal. For example, small stocks outperformed large stocks in the month of January in a great many years. Again, such predictability is surprising and suspicious in light of modem capital market theory. These three aspects of the firm-size effect will be analyzed after the data are presented.
Presentation of the DataSummary statistics of annual returns on the 10 deciles,
over the period 1926-87, are presented in Exhibit 32. The average return tends to increase from the largest decile to the smallest. Because securities are ranked annually, returns on the ninth and tenth deciles are higher than those suggested by the small-company stock index presented in earlier chapters.
The total risk, or standard deviation of annual returns, also increases as firm size decreases. The serial correlation point estimates are near zero for all but the smallest two or three deciles.
Exhibit 33 provides a year-by-year history of the returns for the different size categories. Exhibit 34 shows the
106

Firm Size and Return
EXHIBIT 32CAPITALIZATION DECILES OF THE NYSE:
SUMMARY STATISTICS OF ANNUAL RETURNS (1926-1987)
GeometricD ecile Mean
ArithmeticMean
StandardDeviation
First-OrderAuto
correlation
1 (largest) 9.13% 10.96 % 19.43 % 0.042
2 10.58 13.05 22.75 0.058
3 10.08 12.91 24.50 0.035
4 11.74 15.19 28.26 -0.009
5 11.65 15.47 29.33 0.025
6 11.56 15.36 28.97 0.037
7 12.11 16.80 32.70 0.066
8 11.71 16.81 33.69 0.087
9 13.23 19.04 36.74 0.133
10 (smallest) 14.98 22.87 46.03 0.133
NYSE Value- Weighted Index 9.56 11.66 20.93 0.034
107

5 EXHIBIT 33YEAR-BY-YEAR RETURNS ON DECILE PORTFOLIOS OF THE NYSE
SORTED BY MARKET CAPITALIZATION (1926-1987)
(Returns in decimal form)
D e c ile D e c ile D e c ile D e c ile D e c ile D e c ile D e c ile D e c ile D e c ile D e c ileY ear 1 _ __ 2 ___ ___ 3__ 4 5 6 7 8 9 1 0
1926 0.1431 0.0831 0.0468 0.0315 -0.0549 0.0432 -0.0477 -0.0811 -0.0284 0.07171927 0.3440 0.2998 0.2951 0.4103 0.3359 0.2338 0.3474 0.3079 0.2042 0.36561928 0.3714 0.4339 0.3642 0.4028 0.5019 0.3367 0.3650 0.3885 0.6698 0.80241929 -0.0893 -0.0741 -0.2269 -0.2349 -0.2330 -0.3119 -0.3739 -0.4295 -0.4620 -0.4904
1930 -0.2488 -0.3185 -0.3855 -0.3395 -0.3396 -0.3541 -0.3943 -0.4436 -0.4752 -0.40411931 -0.4269 -0.4934 -0.5007 -0.4455 -0.4714 -0.4546 -0.4738 -0.4936 -0.4689 -0.53451932 -0.0883 -0.0360 -0.0110 -0.0835 -0.2013 -0.0577 -0.1824 -0.1044 -0.0598 -0.00351933 0.4852 0.7104 0.8499 1.1860 1.0863 1.1049 1.0998 1.1857 1.3090 2.14551934 0.0213 0.0669 0.0864 0.1383 0.1575 0.1553 0.1818 0.1840 0.2448 0.3955
1935 0.4229 0.5088 0.3848 0.3800 0.6274 0.5066 0.7360 0.5221 0.7495 0.57531936 0.3146 0.3035 0.2707 0.4497 0.4975 0.4627 0.5762 0.6332 0.6104 0.66411937 -0.3126 -0.3696 -0.3888 -0.4344 -0.4688 -0.4970 -0.4817 -0.5324 -0.5144 -0.57721938 0.2482 0.3325 0.3466 0.3766 0.4137 0.4128 0.3677 0.3588 0.3342 0.05581939 0.0413 -0.0591 -0.0330 -0.0028 -0.0134 0.0203 0.0417 -0.1020 -0.1050 0.0180
1940 -0.0767 -0.1000 -0.0766 -0.0638 -0.0158 -0.0556 -0.0724 -0.0264 -0.0744 -0.29561941 -0.1045 -0.0662 -0.0531 -0.0879 -0.1331 -0.0664 -0.1016 -0.1115 -0.0777 -0.06911942 0.1329 0.2405 0.1954 0.2330 0.2412 0.2726 0.2653 0.3475 0.4722 0.71061943 0.2310 0.3389 0.3427 0.4150 0.4876 0.4309 0.7023 0.6868 0.9447 1.17961944 0.1701 0.2595 0.2322 0.3340 0.3999 0.4027 0.3996 0.5102 0.5636 0.6771
1945 0.2989 0.4895 0.4975 0.6252 0.5911 0.5639 0.6412 0.6782 0.7384 0.95911946 -0.0525 -0.0336 -0.0912 -0.0942 -0.1103 -0.0480 -0.1637 -0.1091 -0.0810 -0.17571947 0.0528 0.0005 - 0.0001 0.0297 0.0296 -0.0097 -0.0253 0.0031 -0.0385 0.01991948 0.0380 0.0188 0.0017 -0.0073 -0.0262 -0.0256 -0.0463 -0.0677 -0.0853 0.00061949 0.1855 0.2677 0.2213 0.2128 0.1998 0.2261 0.1832 0.2109 0.1922 0.2348
1950 0.2858 0.3249 0.2500 0.3297 0.4093 0.3206 0.3959 0.4138 0.4090 0.60241951 0.2166 0.2353 0.1985 0.1866 0.1389 0.1680 0.1541 0.1677 0.1009 0.03031952 0.1398 0.1376 0.1221 0.1128 0.1120 0.0925 0.1172 0.0864 0.0801 0.05261953 0.0059 0.0199 0.0011 -0.0215 -0.0268 -0.0085 -0.0219 -0.0490 -0.0505 -0.05251954 0.4885 0.4758 0.5863 0.5628 0.5679 0.6099 0.6034 0.5369 0.6105 0.6660
\
Stocks, Bon
ds, Bills, an
d Inflation
: Historical R
eturn
s

10
9
i
EXHIBIT 33 (Continued)
D e c ile D e c ile D e c ile D e c ile D e c ile D e c ile D e c ile D e c ile D e c ile D e c ileY ea r 1 2 3 4 5 6 7 8 ___ 9 ___ 1 0
1955 0.2829 0.2132 0.1645 0.1758 0.2084 0.2158 0.1909 0.2014 0.2070 0.24891956 0.0849 0.1155 0.0678 0.0934 0.0739 0.0961 0.0610 0.0936 0.0766 -0.01861957 -0.1043 -0.0822 -0.1241 -0.1088 -0.1166 -0.1655 -0.1363 -0.1597 -0.1490 -0.12971958 0.4024 0.4784 0.5388 0.5795 0.5782 0.5760 0.6794 0.6870 0.6640 0.79071959 0.1290 0.0832 0.1396 0.1674 0.1674 0.1925 0.1763 0.1980 0.2203 0.1488
1960 -0.0077 0.0731 0.0374 0.0218 -0.0323 -0.0009 -0.0841 0.0031 -0.0541 -0.07651961 0.2628 0.2892 0.2948 0.2893 0.2947 0.2550 0.3710 0.2968 0.3402 0.27721962 -0.0823 -0.0920 -0.1105 -0.1353 -0.1368 -0.1909 -0.1254 -0.1158 -0.1467 -0.08271963 0.2286 0.1955 0.1793 0.1721 0.1602 0.1802 0.1779 0.2347 0.2391 0.16711964 0.1627 0.1464 0.1865 0.1868 0.1683 0.1451 0.1893 0.1578 0.2133 0.2595
1965 0.0878 0.2118 0.2436 0.2573 0.2778 0.3770 0.3591 0.3781 0.3647 0.45641966 -0.1025 -0.0471 -0.0680 -0.0577 -0.0614 -0.1106 -0.0612 -0.0695 -0.0402 -0.13751967 0.2147 0.2288 0.3306 0.4367 0.5235 0.5046 0.7584 0.7082 0.7422 0.96401968 0.0742 0.1752 0.1863 0.1963 0.2780 0.3057 0.3289 0.3364 0.4258 0.63471969 -0.0560 -0.1442 -0.1013 -0.1692 -0.1764 -0.2215 -0.2087 -0.2748 -0.2896 -0.2666
1970 0.0299 0.0046 0.0236 -0.0221 -0.0338 -0.0403 -0.0540 -0.0607 -0.0703 -0.07491971 0.1444 0.1456 0.2041 0.2239 0.1746 0.2912 0.1666 0.1886 0.1504 0.19541972 0.2289 0.1197 0.1061 0.1029 0.0528 0.0360 0.0829 0.0602 0.0596 0.03531973 -0.1296 -0.2088 -0.2501 -0.2492 -0.2882 -0.2723 -0.3175 -0.3225 -0.3318 -0.31261974 -0.2765 -0.2367 -0.2418 -0.2709 -0.2476 -0.2641 -0.2377 -0.2730 -0.2768 -0.2351
1975 0.3117 0.4562 0.5406 0.6768 0.5580 0.5758 0.6434 0.6821 0.6999 0.76091976 0.2117 0.2977 0.3714 0.3878 0.4493 0.4770 0.4897 0.5845 0.5698 0.57861977 -0.0843 -0.0372 -0.0142 0.0415 0.0970 0.1502 0.1717 0.1897 0.2399 0.20221978 0.0720 0.0524 0.0911 0.0973 0.0916 0.1608 0.1514 0.1394 0.1917 0.19541979 0.1491 0.2814 0.3605 0.3281 0.3436 0.3607 0.4517 0.4150 0.4978 0.4348
1980 0.3371 0.3177 0.3015 0.3224 0.2792 0.3199 0.3480 0.3023 0.3014 0.23571981 -0.0916 0.0310 0.0427 0.0168 0.0891 0.0677 0.0428 0.1091 0.1401 0.16131982 0.1838 0.1883 0.2376 0.2726 0.3673 0.3318 0.3809 0.4094 0.3734 0.38631983 0.2197 0.1929 0.2492 0.2859 0.2720 0.3264 0.3397 0.3949 0.4053 0.51111984 0.0725 0.0683 -0.0020 -0.0117 0.0021 0.0160 -0.0057 -0.0150 0.0269 -0.0866
1985 0.3050 0.3852 0.3082 0.3223 0.2995 0.2583 0.2376 0.2653 0.2711 0.36041986 0.2076 0.2000 0.1482 0.1462 0.1856 0.1212 0.1304 0.0799 0.0947 0.05501987 0.0871 -0.0093 0.0372 0.0386 -0.0086 -0.0246 -0.0757 -0.0708 -0.0635 -0.0811
Firm
Size an
d Retu
rn

110 EXHIBIT 34YEAR-END INDEX VALUES OF RETURNS ON DECILE PORTFOLIOS OF THE NYSE
SORTED BY MARKET CAPITALIZATION (1925-1987)
(Year-end 1925 = 1.000)
D e c ile D e c ile D e c ile D e c ile D e c ile D e c ile D e c ile D e c ile D e c ile D e c ileY ear 1 2 3 4 5 6 7 8 9 1 0
1925 1.000 1.000 1.000 1.000 1.000 1.000 1.000 1.000 1.000 1.0001926 1.143 1.083 1.047 1.031 0.945 1.043 0.952 0.919 0.972 1.0721927 1.536 1.408 1.356 1.455 1.263 1.287 1.283 1.202 1.170 1.4631928 2.107 2.019 1.849 2.041 1.896 1.720 1.751 1.669 1.954 2.6381929 1.919 1.869 1.430 1.561 1.454 1.184 1.097 0.952 1.051 1.344
1930 1.441 1.274 0.879 1.031 0.961 0.765 0.664 0.530 0.552 0.8011931 0.826 0.645 0.439 0.572 0.508 0.417 0.349 0.268 0.293 0.3731932 0.753 0.622 0.434 0.524 0.406 0.393 0.286 0.240 0.275 0.3721933 1.118 1.064 0.803 1.146 0.846 0.827 0.600 0.525 0.636 1.1691934 1.142 1.135 0.872 1.304 0.979 0.956 0.709 0.622 0.792 1.631
1935 1.625 1.713 1.207 1.800 1.594 1.440 1.231 0.946 1.385 2.5691936 2.137 2.233 1.534 2.609 2.387 2.106 1.940 1.546 2.230 4.2761937 1.469 1.408 0.938 1.476 1.268 1.059 1.006 0.723 1.083 1.8081938 1.833 1.876 1.263 2.031 1.792 1.496 1.375 0.982 1.445 1.9091939 1.909 1.765 1.221 2.026 1.768 1.527 1.433 0.882 1.293 1.943
1940 1.763 1.588 1.127 1.896 1.741 1.442 1.329 0.859 1.197 1.3691941 1.578 1.483 1.068 1.730 1.509 1.346 1.194 0.763 1.104 1.2741942 1.788 1.840 1.276 2.133 1.873 1.713 1.511 1.028 1.625 2.1791943 2.201 2.464 1.713 3.018 2.786 2.452 2.572 1.734 3.161 4.7501944 2.576 3.103 2.111 4.026 3.900 3.439 3.599 2.619 4.943 7.966
1945 3.346 4.622 3.162 6.543 6.206 5.378 5.907 4.395 8.592 15.6061946 3.170 4.466 2.873 5.926 5.521 5.120 4.940 3.915 7.897 12.8631947 3.337 4.469 2.873 6.102 5.685 5.070 4.816 3.927 7.593 13.1191948 3.464 4.553 2.878 6.058 5.536 4.940 4.592 3.661 6.945 13.1271949 4.107 5.771 3.515 7.347 6.642 6.057 5.434 4.434 8.280 16.209
1950 5.281 7.647 4.394 9.769 9.361 7.999 7.585 6.268 11.666 25.9721951 6.425 9.446 5.266 11.592 10.661 9.343 8.754 7.319 12.843 26.7611952 7.323 10.746 5.909 12.899 11.855 10.207 9.780 7.951 13.873 28.1671953 7.366 10.959 5.915 12.622 11.537 10.120 9.566 7.562 13.172 26.6891954 10.965 16.173 9.383 19.724 18.090 16.291 15.337 11.621 21.214 44.465
Stocks, Bon
ds, Bills, an
d Inflation
: Historical R
eturn
s

Ill
EXHIBIT 34 (Continued)
D e c ile D e c ile D e c ile D e c ile D e c ile D e c ile D e c ile D e c ile D e c ile D e c ileY ea r 1 2 3 4 5 6 ___ 7 8 ___ ___m
1955 14.067 19.622 10.927 23.192 21.859 19.807 18.266 13.962 25.606 55.5341956 15.262 21.888 11.667 25.359 23.475 21.710 19.380 15.269 27.568 54.5001957 13.670 20.088 10.220 22.600 20.738 18.116 16.738 12.830 23.462 47.4331958 19.171 29.697 15.725 35.697 32.728 28.552 28.111 21.644 39.041 84.9391959 21.644 32.169 17.921 41.672 38.207 34.047 33.068 25.929 47.643 97.577
1960 21.478 34.521 18.590 42.581 36.974 34.017 30.287 26.009 45.068 90.1161961 27.123 44.506 24.071 54.902 47.872 42.691 41.522 33.727 60.398 115.0951962 24.891 40.413 21.410 47.474 41.324 34.542 36.313 29.822 51.535 105.5801963 30.582 48.314 25.249 55.645 47.943 40.767 42.774 36.822 63.858 123.2211964 35.559 55.386 29.957 66.038 56.013 46.683 50.872 42.632 77.476 155.198
1965 38.680 67.119 37.256 83.028 71.571 64.283 69.142 58.750 105.730 226.0271966 34.716 63.957 34.721 78.237 67.180 57.171 64.911 54.667 101.481 194.9381967 42.170 78.591 46.199 112.401 102.348 86.017 114.140 93.379 176.804 382.8511968 45.300 92.360 54.806 134.470 130.805 112.310 151.682 124.789 252.091 625.8581969 42.763 79.042 49.254 111.716 107.735 87.432 120.026 90.492 179.089 459.028
1970 44.040 79.407 50.417 109.246 104.092 83.911 113.539 84.996 166.499 424.6391971 50.397 90.967 60.708 133.705 122.267 108.344 132.456 101.029 191.533 507.6121972 61.935 101.853 67.147 147.469 128.720 112.246 143.434 107.114 202.950 525.549
1973 53.907 80.585 50.351 110.721 91.627 81.677 97.894 72.574 135.612 361.2411974 39.002 61.507 38.178 80.722 68.941 60.104 74.620 52.762 98.076 276.324
1975 51.159 89.568 58.815 135.357 107.409 94.712 122.632 88.752 166.723 486.5811976 61.991 116.232 80.656 187.853 155.671 139.887 182.685 140.625 261.721 768.1301977 56.765 111.902 79.513 195.647 170.765 160.891 214.057 167.304 324.498 923.44/1978 60.851 117.767 86.757 214.681 186.415 186.761 246.463 190.622 386.714 1103.9041979 69.926 150.912 118.037 285.123 250.467 254.126 357.781 269.731 579.225 1583.915
1980 93.497 198.851 153.621 377.036 320.402 335.425 482.281 351.283 753.777 1957.2981981 84.935 205.015 160.184 383.356 348.949 358.127 502.941 389.623 859.390 2273.0621982 100.547 243.612 198.251 487.873 477.132 476.941 694.536 549.141 1180.284 3151.129
1983 122.636 290.593 247.653 627.345 606.919 632.620 930.452 766.012 1658.675 4761.6141984 131.525 310.437 247.150 620.006 608.171 642.766 925.146 754.534 1703.315 4349.399
1985 171.641 430.028 323.317 819.819 790.322 808.780 1144.917 954.726 2165.166 5916.7091986 207.279 516.031 371.246 939.637 937.028 906.793 1294.264 1030.961 2370.112 6241.8861987 225.326 511.210 385.072 975.870 928.982 884.490 1196.280 958.001 2219.541 5735.424

Stocks, Bonds, Bills, and Inflation: Historical Returns
growth of a $1.00 invested at year-end 1925 in each of the categories.
The magnitude of the firm-size effect in some years is noteworthy. Although the largest stocks actually declined in 1977, the smallest stocks rose more than 20 percent. A more extreme case occurred in the depression-recovery year of 1933, when the difference between first and tenth decile returns was over 170 percent. This near independence of the smallest and largest firms is common. It is as if there is not one single stock market, but several markets, each one moving differently according to the size of its firms.
Size of the DecilesExhibit 35 reveals that most of the market value of the
stocks listed on the NYSE is represented by the top three deciles. Two-thirds of the value is represented by the first decile, which currently consists of about 150 stocks. The smallest decile represents only 0.25 percent of the market value of the NYSE. The data in Exhibit 35 are averages across all years; of course, the proportions represented by the various deciles vary from year to year.
It is important to note that these proportions do not represent the AMEX or OTC markets. Small firms, as defined by NYSE rankings, make up far higher proportions of value in the AMEX and OTC markets. The aggregate market value of small firms in the AMEX and OTC markets is at least twice as large as the corresponding value on the NYSE. Thus, we cannot assume that findings which hold for NYSE firms will hold for firms elsewhere.
Serial Correlation in Small-Stock ReturnsThe serial correlation, or first-order autocorrelation, of
returns on large capitalization stocks is near zero (see
112

Firm Size and Return
Exhibit 32). If stock returns were autocorrelated, then one would gain some information from past returns. On the other hand, the first-order autocorrelation for the smallest deciles is above 0.1. This observation bears further examination.
To remove the randomizing effect of the market as a whole, we subtract [geometrically as in equation (5) in Chapter 4] the returns on the first decile from the returns on the other nine deciles. These series differences exhibit greater serial correlation than the decile series themselves. Autocorrelations of the excess returns of deciles two through ten are presented in Exhibit 36. These autocorrelations suggest some predictability of smaller-company excess returns. Caution is necessary, however. The autocorrelation of small-company excess returns for noncalendar years (February-through-January years, and so forth) do not always confirm the results shown for calendar years (January through December). The results for the noncalendar years, not shown in this book, mean that predicting small-company excess returns may not be easy.
SeasonalityUnlike returns on large stocks, the returns on small-
company stocks appear to be seasonal. Small-company stocks outperform larger stocks more often and by larger amounts than in any other month. This “January effect” was first documented by Donald Keim (1983).
Exhibit 37 shows the returns of capitalization deciles two through ten in excess of the return on decile one. This exhibit segregates excess returns into months. For each decile, for each month, the exhibit shows both the average excess return and the number of times the excess return is positive. These two statistics measure the seasonality of the excess return in slightly different ways. The average excess
113

Stocks, Bonds, Bills, and Inflation: Historical Returns
EXHIBIT 35MARKET VALUE OF THE 10 CAPITALIZATION DECILES AS A PERCENTAGE OF THE TOTAL
NYSE MARKET VALUE (Average over 1926-1987)
Average.Decile
Percent of Total Capitalization
1 (largest) 65.29
14.49
7.55
4.54
2.97
2.02
1.38
0.92
2
3
4
5
6
7
8
9 0.58
10 (smallest) 0.27
114

Firm Size and Return
EXHIBIT 36FIRST-ORDER AUTOCORRELATIONS OF
ANNUAL DECILE RETURNS IN EXCESS OF THE FIRST (LARGEST) DECILE
(1926-1987)
Decile
First-Order Autocorrelation of Decile Return in Excess
of Decile One Return
2
3
4
5
6
7
8
9
0.159
0.303
0.186
0.194
0.273
0.312
0.322
0.374
10 (smallest) 0.310
115

11
6
EXHIBIT 37RETURNS ON CAPITALIZATION DECILES OF NYSE STOCKS,
IN EXCESS OF THE FIRST (LARGEST) DECILE (1926-1987)
D e c ile J an F eb M ar A p r M av Ju n J u l Aug S ep O ct N o v D e cT otal
(J a n -D ec)
2 1.16%51
0.16%34
-0.05%27
-0.40%24
0.05%35
0.08%32
0.00%30
0.09%30
-0.04%29
-0.06%33
0.32%41
0.20%38
1.52%
3 1.4648
0.0938
0.0229
-0.3424
-0.2125
-0.1328
0.1230
-0.0832
0.1632
-0.2930
0.3341
0.0337
1.15
4 1.8549
0.3637
-0.1132
-0.0927
-0.0530
-0.1329
0.2131
0.2237
0.3834
-0.4727
0.5639
0.0629
2.80
5 2.8949
0.3336
-0.2228
-0.4226
-0.1626
-0.1628
0.2529
0.3034
0.1328
-0.6028
0.3933
0.1631
2.89
6 3.4353
0.2936
-0.3631
-0.3625
0.0925
-0.4724
0.1632
0.3634
0.2237
-0.9828
0.5835
-0.0430
2.94
7 4.1152
0.6040
-0.2334
-0.2326
0.2828
-0.4623
0.2731
-0.0432
0.1533
-0.6527
0.3031
-0.4425
3.66
8 5.4251
0.6940
-0.4729
-0.4624
0.2125
-0.6924
0.3532
-0.0526
-0.2332
-0.8329
0.3932
-0.6528
3.69
9 7.0656
0.8736
-0.0834
-0.4025
0.2027
-0.7124
0.4533
0.1329
-0.0829
-0.9127
0.2230
-1.0724
5.67
10 10.2757
0.9432
-0.9426
-0.3023
0.3729
-0.6424
0.6932
-0.0726
0.8330
-1.2324
-0.2723
-1.2624
8.40
F irst row : a v era g e e x c e s s retu rn in p e r c e n tS e c o n d row : n u m b e r o f t im e s e x c e s s retu rn w a s p o s it iv e ( in 6 2 y e a r s )
Firm Size and Return
return shows the size of the effect, and the number of times positive shows the reliability of the effect.
Virtually all of the small-stock effect occurs in January. The other months are, on net, negative for small stocks. Excess returns in January relate to size in a precisely rank-ordered fashion. This January phenomenon seems to pervade all size groups.
117


9. Estimating The Cost Of Capital Or Discount Rate
The data in this book may be used to forecast future returns on assets and portfolios. Such forecasts may take the form of probability distributions of future returns, so that risk as well as expected return is accounted for in the forecast. The means of these probabilistic forecasts have a useful application in the estimation of the cost of capital or discount rate.
In this chapter, we answer frequently asked questions about the estimation and use of cost of capital. We cover the debt and equity costs of capital, and the weighted- average cost of capital for a firm, project, or division. Chapter 10 addresses the more general issue of using historical data to make probabilistic forecasts of asset returns.
The cost of capital has three conceptual meanings. On the asset side of a firm’s balance sheet, it is the discount rate which should be used to reduce future values (dividends or cash flows, for example) to a present value. On the liability side, it is the economic cost to the firm of attracting and retaining capital in a competitive environment where investors (capital providers) carefully analyze and compare all return-generating opportunities. To the investor, the cost of capital is the expected return.

Stocks, Bonds, Bills, and Inflation: Historical Returns
The cost of capital is an opportunity cost. In fact, some people consider the phrase “opportunity cost of capital” to be the correct term, “cost of capital” being an abbreviation. The opportunity cost of an investment is the expected return that would be earned on the next-best investment. In a competitive world with many investment choices, a given investment and the next-best investment have practically identical expected returns.
Thus, cost of capital estim ation is a forecasting problem—a special case of the more general forecasting issue treated in Chapter 10. A cost of capital estimate is a forecast because it seeks to discern the expected return, or forecast mean, of an investment.
Example of Cost-of-Capital Estimation
1. Q. Please provide an example of the method used to estimate cost of capital for the equity (stock) of a firm.
A. This answer addresses the cost of equity capital over the short run. The long-run estimate has some additional subtleties which will be discussed later in this chapter.
The equity cost of capital equals the expected rate of return, or forecast mean, for the firm’s equity. (This is the market-required cost of capital, before any flotation costs or other market inefficiency costs which might be imputed.) For a stock having an amount of economy risk similar to that of the market as a whole, the short-term equity cost of capital is equal to the riskless (Treasury bill) rate plus the arithmetic mean of the equity risk premium. This calculation may be done in either nominal or real terms.
120

Estimating the Cost of Capital or Discount Rate
2. Q. How would you estimate the cost of debt capital for the firm?
A. In the SBBI component-return framework, the debt cost of capital equals the riskless rate plus the arithm etic m eans of the horizon and default premiums, assuming the debt in question has a maturity of 20 years and default risk similar to that of the long-term, high-grade index used to generate the corporate bond series. A simpler way to estimate the debt cost of capital, however, is to observe the yield to maturity on the debt, because that yield is the market-observable cost of capital for the debt.
To be precise, because the yield to maturity includes a market compensation for expected loss from defaults (in the probabilistic sense), the cost of debt capital is equal to the yield to maturity on the debt, minus this expected loss.
3. Q. How do you calculate the cost of capital for the entire firm (debt and equity)?
A. The cost of capital for the firm is the weighted- average cost of capital. This is simply the weighted average of the debt and equity costs of capital, where the weights are determined by some reasonable method. Market-value weights are theoretically the best to use, but that is not always practical.
The Capital Asset Pricing Model (CAPM)There are several widely used approaches to estimating
the cost of capital. Of these, one—the CAPM—relates directly to the information in this book. One of the key variables in the CAPM is the market risk premium. We posit that one reasonable estimate of the future market risk premium is the long-run historical market risk premium.
121
Stocks, Bonds, Bills, and Inflation: Historical Returns
Other approaches, including arbitrage pricing theory (APT) and the discounted cash flow (DCF) models, also contribute a great deal to the understanding of the cost of capital. We treat these approaches briefly at the end of the chapter.
4. Q. Is there a simple method of estimating the cost of capital for a stock that has risks different from those of the market?
A Yes. The CAPM, or beta model, produces a simple and useful result. (Other models will be discussed later.) The CAPM may be expressed, in its simplest form, as:
ECOC = Rf+B(Rp), (36)
where
ECOC = the equity cost of capital,
Rf = the riskless rate,
B = the beta of the stock, and
Rp = the equity risk premium.
There are other risks and nonrisk costs of capital inherent in stocks, but measuring them requires more complex methods.
The CAPM For Different Time Horizons
5. Q. Should the CAPM be used to estimate the short-term or the long-term cost of capital?
A. The CAPM was originally form ulated to measure the short-term cost of capital, but it may be adapted to measure the long-term cost of capital by using the expected return on a long-term govem-
122

Estimating the Cost of Capital or Discount Rate
ment bond, instead of the risk-free rate of return, as the riskless rate.
6. Q. In what sense is the expected return on a long-term government bond riskless?
A. In nominal terms, a long-term government bond is riskless if held to maturity, because the coupon and principal payments are known in advance. Of course, the price of the bond fluctuates during the holding period, so this question merits a more complete answer.
Certain investors seek to minimize risk in nominal terms over a long time horizon. For these investors, a long-term government bond is practically riskless. (Coupon reinvestment risk cannot be eliminated for coupon-paying bonds, although it can be reduced by the technique known as immunization. The yield on a hypothetical zero-coupon bond issued directly by the Treasury would be a better measure of the riskless long-term rate, because such a bond has no coupon reinvestment risk.) If longterm government bonds were actually held only by investors who perceived them as riskless, they would yield the riskless long-term rate.
7. Q. How would you estimate the long-term cost of capital?
A. For debt, one uses the yield to maturity. For equity, the most satisfactory way is to take the long-term government bond yield (income return) as the long-term risk less ra te—as described above—and the arithmetic mean excess of equity total returns over long-term government bond yield returns as the long-horizon equity risk premium. (We explain the construction of the long-horizon
123

Stocks, Bonds, Bills, and Inflation: Historical Returns
equity risk premium in Chapter 6.) Summary statistics of the long-horizon equity risk premium are shown in Exhibit 23, and more detailed data are shown in Appendix A (Exhibit A-10).
8. Q. In estimating the market risk premium, it is more traditional to subtract bill or bond total returns from equity total returns. Why do you subtract bond yield returns (the income component of bond total returns)?
A. The object is to determine what the market expects. When such an expectancy is directly observable, as with bond yields, one should use that measure. Historical bond total returns are biased downward as a measure of expectancy, because bondholders suffered an unanticipated capital loss over the period 1926-87. Bond yields, by contrast, are an almost unbiased measure of expectancy.
Total returns on equities are used to estimate the market risk premium because equities have no m arket-observable expected re tu rn , i.e., no counterpart to the yield to maturity on bonds. Therefore, the best measure available, realized total return, is used.
9. Q. Is your long-term formulation of the CAPM the only such formulation used?
A. No. A variety of methods are available to estimate the long-term cost of capital, each with its own advantages and disadvantages.
10. Q. When is it appropriate to use the long-term cost of capital?
A. It is necessary to use a long-term cost of capital when discounting cash flows projected over a long
124

Estimating the Cost of Capital or Discount Rate
period. Also, regulated ratesetting processes often specify or suggest that the rate of return should allow the firm to attract and retain debt and equity capital over the long term. Thus, the long-term cost of capital is typically the appropriate cost of capital to use in regulated ratesetting.
Estimation of the CAPM Beta
11. Q. How would you estimate the beta?
A. The beta of a stock is typically estimated by regressing the stock’s return on the overall equity market’s return. The traditional or Sharpe-Lintner beta is obtained by subtracting the return on short-term Treasury bills from both the stock and market returns before performing the regression. Many other variants are used in practice.
CAPM betas are published widely. In addition, anyone with a software package that performs regressions, and has data on stock returns, the stock market, and the market for riskless securities, may calculate their own betas.
Arithmetic versus Geometric Mean
12. Q. In your initial example, you use the arithmetic mean historical risk premium as the forecast of the future risk premium. Why do you use the arithmetic mean, instead of the geometric mean (compound annual return)?
A. The arithmetic mean is the rate of return which, when compounded over multiple periods, gives the mean of the probability distribution of ending wealth values. Thus, the arithm etic mean return is appropriate for calculation of a discount rate,
125

Stocks, Bonds, Bills, and Inflation: Historical Returns
because expected cash flows (i.e., the means of distributions of future values) are discounted to arrive at a present value. Similarly, it is appropriate for the cost of capital or market-required rate of return.
Definitionally, the discount rate that equates expected (mean) future values with the present value of an investment is that investment’s cost of capital (Van Home 1977). The logic is that investors will discount their expected (mean) ending wealth values using the arithmetic mean. They will, therefore, require such an expected (mean) return prospectively.
13. Q. Please provide a mathematical example that illustrates why the arithmetic mean is the rate of return that gives the probability distribution of ending wealth values.
A. Assume that a dollar invested has two possible outcomes each year: it rises 30 percent or falls 10 percent. T hese outcom es occur with equal probability, that is, each with a probability of 0.5. After one year, the possible outcomes are:
Ending wealth value Probability $ 1.30 0.50 *
0.90 0.50If the example is extended one more year, the investment could start at $1.30 and rise 30 percent or fall 10 percent, i.e., rise to $1.69 or fall to $1.17, each with a probability of 0.25. Alternatively, the investment could start at $0.90 and rise 30 percent or fall 10 percent, i.e., rise to $1.17 or fall to $0.81, again each with a probability of 0.25. After two years, the possible outcomes are
126
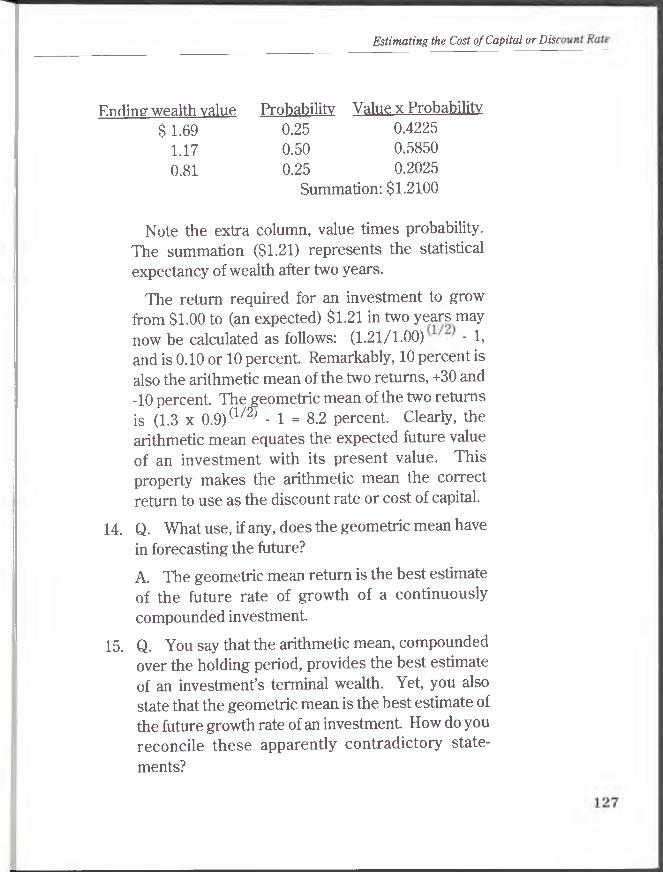
Estimating the Cost of Capital or Disc
Ending wealth value Probability Value x Probability$1.69 0.25 0.4225
1.17 0.50 0.5850
0.81 0.25 0.2025Summation: $1.2100
Note the extra column, value times probability. The summation ($1.21) represents the statistical expectancy of wealth after two years.
The return required for an investment to grow from $1.00 to (an expected) $1.21 in two years may now be calculated as follows: (1.21/1.00) - 1,and is 0.10 or 10 percent. Remarkably, 10 percent is also the arithmetic mean of the two returns, +30 and -10 percent. The geometric mean of the two returns is (1.3 x 0.9)(1/2' - 1 = 8.2 percent. Clearly, the arithmetic mean equates the expected future value of an investment with its present value. This property makes the arithmetic mean the correct return to use as the discount rate or cost of capital.
14. Q. What use, if any, does the geometric mean have in forecasting the future?
A. The geometric mean return is the best estimate of the future rate of growth of a continuously compounded investment.
15. Q. You say that the arithmetic mean, compounded over the holding period, provides the best estimate of an investment’s terminal wealth. Yet, you also state that the geometric mean is the best estimate of the future growth rate of an investment How do you reconcile these apparently contradictory state
ments?

Stocks, Bonds, Bills, and Inflation: Historical Returns
A. The reason these statements are not contradictory is that an investment with uncertain returns will have a higher expected ending wealth value than an investment which simply earns (with certainty) its compound or geometric rate of return every year. In the above exam ple, com pounding at the geometric rate of return (8.2 percent) for two years yields a terminal wealth of $1.17. But holding the uncertain investment, with a possibility of high returns (two +30 percent years in a row) as well as low returns (two -10 percent years in a row), yields a higher expected terminal wealth, $1.21. In other words, higher-than-expected returns more than offset lower-than-expected returns.
If returns are subject to a probability distribution, the arithmetic mean is the measure of prospective return that accounts for uncertainty.
Applications of the Cost of CapitalAs noted earlier, the cost of capital applies to investment
management, corporate finance, regulatory and tax issues, valuation, and other settings. The following are three of the most commonly asked questions about applications.
The Cost of Capital as a Discount Rate
16. Q. You have stated that the cost of capital may be used as a discount rate. How would you use the cost of capital for reducing future values (for example, dividends, wages, or cash flows) to a present value in the customary valuation formulas?
A. The cost of capital, using the arithmetic mean and the riskless rate for the appropriate time horizon (short, intermediate, or long), is the discount rate for valuation. The numerator (the future value) should
128

Estimating the Cost of Capital or Discount Rate
be the statistical expectancy of the future value. A common error is to use the “realistic best case” or some other measure which is not the expectancy. Possible applications include security valuations, valuation of businesses or real estate for planning, transaction, or tax purposes, and many other uses.
Regulatory Ratesetting
17. Q. Can the cost of capital methodology you have described be used directly in regulatory ratesetting, or do adjustments have to be made?
A. Adjustments are often necessary. One widely held view is that the cost of capital should be adjusted for flotation costs, because these costs must be paid by the issuer to attract and retain capital. In addition, certain regulatory environments impose a ceiling return. If the shareholder earns more, future returns might be reduced by the regulating body. Under this asymmetrical condition, the allowed rate of return must be higher than the cost of capital for the regulated business to attract and maintain capital. There are other regulatory conditions which may require the allowed rate of return to be different from the cost of capital.
Project Selection in the Corporate Financial Setting
18. Q. How would you use the cost of capital for project selection?
A. In a situation where there is no significant budget constraint, one should accept all projects whose internal rate of return exceeds the project- specific cost of capital. The internal rate of return on a project, business unit, or acquisition is the discount
129

Stocks, Bonds, Bills, and Inflation: Historical Returns
rate (found by iteration or trial and error) which equates the present value of all cash inflows, including the investment, with the present value of all cash outflows. If this discount rate, or internal rate of return, exceeds the project-specific cost of capital, then the project has a positive net present value and should be accepted because it would create value for the company.
The project-specific cost of capital is usually estimated using the CAPM or APT (see below), in which one seeks to find a set of publicly-traded companies which are comparable to the project under consideration in business type, size, and risk. The average beta of the comparable companies is then used as a proxy for the beta of the project. If such comparable companies cannot be found, it may be necessary to use accounting-based models of a project’s beta.
Other Methods of Cost of Capital EstimationThis section focuses on methods of cost-of-capital
estimation other than the CAPM. Of the methods discussed here, APT is the leading-edge model. The data and empirical research needed to put APT to practical use have not been available until recently. The discounted cash flow model is the most venerable approach, having been known since the 1930s and used very widely since the 1950s. Finally, a possible future approach based on investor costs is discussed.
Arbitrage Pricing Theory
19. Q. What is APT?
A. APT is a model of the expected return on a security. Stephen A. Ross originated APT, and
130

Estimating the Cost of Capital or Discount Rate
Richard Roll elaborated it. APT treats the expected return on a security (i.e., its cost of capital) as the sum of the payoffs for an indeterminate number of risk factors, where the amount of each risk factor inherent in a given security is estimated. Like the CAPM, APT is an equilibrium model that does not attempt to outguess the market. One may visualize APT as an extended CAPM with multiple “betas” and multiple risk premiums.
20. Q. Has any research been done indicating which risk factors are important?
A. Nai-Fu Chen, with Roll and Ross, conducted an empirical investigation of the APT, relating stock returns to macroeconomic factors. They found five factors to be important: (1) changes in industrial production, (2) changes in anticipated inflation, (3) unanticipated inflation, (4) the return differential between low-grade corporate bonds and government bonds (both with long maturities), and (5) the return differential between long-term government bonds and short-term Treasury bills.
21. Q. How would you apply APT to estimate the cost of capital for a stock, bond, or company?
A. One estimates the size of the payoffs for each risk factor and the amount of each risk factor in the given security.
22. Q. APT sounds complicated. Is it practical enough for cost of capital estimation?
A. Yes. There are software/data packages to form the estim ates, and printed (hard copy) APT estimates which make the model usable. Because of the extraordinary flexibility of APT, it is reasonable
131

Stocks, Bonds, Bills, and Inflation: Historical Returns
to expect that this model will become more prominent in the future, as more is learned about its explanatory and predictive power.
The Discounted Cash Flow Model
23. Q. What is the DCF model?
A. The DCF model, originated by John Burr Williams and elaborated by Myron J. Gordon and Eli Shapiro, is best described in terms of estimating the cost of equity capital for a dividend-paying stock. It specifies that the cost of equity capital is equal to (d/V) + g, where d is the expected dividend amount in the next period, V is the value of the stock (hence d/V is the dividend yield in percent), and g is the expected growth rate of dividends.
24. Q. How may the DCF model be applied to estimate the cost of capital or discount rate?
A. The DCF is very simple to use. The next period dividend is forecasted easily because it is closely related to the most recent dividend payment. The value of a stock is directly observable in the market. The difficult part is obtaining an accurate dividend growth forecast. One way of obtaining such a forecast is to use a consensus of security analysts’ estimates.
Future Directions for Cost of Capital Estimation
25. Q. Are there any other theories relevant to the problem of estimating the cost of capital?
A. Yes. One such theory was sketched out in a 1984 paper by Roger G. Ibbotson, Jeffrey J. Diermeier, and Laurence B. Siegel. They call for a “new
132

Estimating the Cost of Capital or Discount Rate
equilibrium theory” (NET) in which the cost of capital for a security is literally the sum of all of capital costs. Such costs include both nonrisk costs and risk costs. Nonrisk costs include marketability costs, taxes, maintenance, insurance and storage costs, nonpecuniary costs and benefits (negative costs), and diversification costs. Risk costs are the costs an investor bears for taking on market risk, inflation risk, and so forth. The cost of taking on a given risk may be thought of as the amount an investor would pay to eliminate the risk.
It is difficult to quantify these costs. The cost of a given attribute is different for each person. But NET may induce researchers to think of the cost of capital in terms of all of the attributes of a security, not just its risks. Moreover, NET allows one to think of all assets, including human capital as well as stocks, bonds, bills, real estate, and other conventional and unconventional investment assets, in a single, unified framework.
133

Stocks, Bonds, Bills, and Inflation: Historical Returns
134

10 Using Historical Data to Forecast the Future
Forecasts based on historical data have numerous applications: multiperiod investment planning, funding of liabilities, and other asset allocation-related uses. Most of the commonly used asset allocation software programs use a probabilistic forecast method similar to that explained here. This chapter answers questions regarding use of the data to form probabilistic forecasts of future real and nominal returns on the asset classes.
The forecasts delineated here are probabilistic forecasts. These are forecasts of the entire return distribution of an investment. Common stocks may have a 5 percent probability of returning 51.9 percent or more (for example) over one year, a 50 percent probability of returning 12.6 percent or more, and a 95 percent probability of returning -16.6 percent or more. These forecasts are an attempt to discern what the market will do and are based on statistical time-series properties of historical data and on current yields in the market. Thus, the forecasts are not an attempt to outguess, or beat, the market.
General and Philosophical IssuesBefore discussing the method of producing probabilistic
forecasts, we answer several general questions about forecasting and the method described here.

Stocks, Bonds, Bills, and Inflation: Historical Returns
Lognormal and Simulation ModelsWe used a simulation, or random drawing, method to
produce asset return forecasts in the 1977 edition of Stocks, Bonds, Bills, and Inflation. The simulation method, known as Monte Carlo simulation, relies on drawings from the actual historical data sets. Later, other researchers showed that the results of the forecasts could be closely replicated, and made easier to use, by a purely mathematical method that uses summary statistics of the historical data. We used this latter method, the lognormal model, in the 1982 edition of this book. There are no specific numerical forecasts in this book: Only the principles of forecasting are discussed.
1. Q. Do you still recommend the lognormal model of forecast returns presented in the 1982 volume?
A. It depends. Both equity risk premiums and small-stock premiums have distributions that differ substantially from a normal or lognormal distribution. It is conceptually better to use a “bootstrapping” technique—one which uses the actual past distributions of these component returns without attempting to characterize the distribution as normal or lognormal.
The simulation model presented in the Ibbotson and Sinquefield Journal of Business article Quly 1976) and the 1977 edition of this book is one of the simplest and best-known bootstrapping models, and we have used it periodically to supplement the results of the lognormal model.
Philosophy of Forecasting
2. Q. Before getting into specifics, what is the philosophy underlying your method of forecasting asset returns?
136

Using Historical Data to Forecast the Future
A. Our approach is to infer the market’s forecast of asset returns as contained in two sources of market data. One source is the historical data on security and component returns, and the other source is the estimates of future interest rates as revealed in a U.S. government bond yield curve.
The key assumptions are that the component historical returns which have followed a random walk will continue to do so, and those that have followed a trend will also continue to do so. The bond yields reflect consensus forecasts of nominal interest rates, inflation rates, and real interest rates.
3. Q. Do your forecasts assume that markets are efficient?
A. Our approach to forecasting is consistent with efficient capital market theory. This theory suggests that the market price of an asset reflects all the information currently available. Stated another way, securities are fairly priced.
One does not, of course, have to believe in the literal truth of the efficient market hypothesis to put the forecasts to practical use. One must believe, however, that markets are inefficient to use more traditional forecasts that attempt to outguess the market. Thus, these forecasts have a wider set of applications than do traditional forecasts.
4. Q. In what ways are your forecasts consistent with efficient capital market theory?
A. Our forecasts employ the market efficiency assumption in two principal ways. First, the yield curve is used to forecast future expected interest and inflation rates. Because the prices of the bonds that comprise the yield curve are market-determined, the
137

Stocks, Bonds, Bills, and Inflation: Historical Returns
interest- and inflation-rate forecasts are market- determined. Second, the forecasts of the four risk premiums are based on the assumption of random walk behavior, discussed in detail later. Neither of the above procedures represents an attempt to outguess the market.
5. Q. Why do you make probabilistic forecasts, as opposed to specific predictions?
A. We believe that it is better to look at forecasts in terms of the expected probability distributions, rather than as specific predictions. For example, a specific prediction might be that common stock returns will be 12.6 percent in 1989. Although this would reflect the market’s expected return on that category of asset, it is more valuable to know that, in 1989, common stocks have a 5 percent probability of returning as little as -16.6 percent or worse, and a 5 percent probability of returning 51.9 percent or better.
6. Q. Why do you believe such wide forecasts have any practical value?
A. Knowing the risk contained in different asset categories over various future periods of time may be just as important and useful as knowing the expected returns for those assets. Wide forecasts simply reflect the large risks inherent in some of the assets, particularly stocks. In other words, wide forecasts give a sense of the volatility or risk of the market, but “point estimates,” or specific predictions, do not. Forecasts that understate risks are not only useless, but may lead to harmful investment decisions.
138

Using Historical Data to Forecast the Future
7. Q. Can your forecasting techniques be used to make any money in the market?
A. Because they are market consensus forecasts, or readings of what the market itself is forecasting, they cannot be used to beat the market. Our forecasts are useful, however, in evaluating the risks involved in various investment strategies and in determining the expected rewards from taking these risks. A long-run investor who takes these asset allocation issues into account is likely to make more money (all other things being equal) than one who ignores them.
The Stocks, Bonds, Bills, and Inflation Forecast Model
In this section, the forecast model is described in general terms, using examples to promote intuitive understanding of the issues.
Forecasting the One-Year Stock Return: An Example
8. Q. Please provide an exam ple of the SBBI forecasting method.
A. The forecast of common stock total returns,for example, is the sum of the expected equity risk premium, the expected real riskless interest rate, and the expected inflation rate. The equity risk premium has historically followed a random walk centered on an arithmetic mean of 8.3 percent, or 6.2 percent compounded annually. The real riskless rate and the inflation rate both follow trends; that is, these two series have high serial correlations, and this year’s rate is statistically related to last year’s rate. Recent real riskless rates have been above
139

Stocks, Bonds, Bills, and Inflation: Historical Returns
their historical average, but they are likely to follow their historical pattern of gradually reverting toward their long-term mean of 0.5 percent. (This type of behavior for a return series is called an autoregressive process.) Therefore, we expect real riskless rates to decline slightly, but remain positive, in the future.
The inflation rate, which also follows a trend, varies a great deal from year to year. To forecast future inflation on the basis of past trends would give only a very approximate forecast. Fortunately, the market expresses its own forecasts of the inflation rate in the yield curve. If there were no inflation, the yield curve would reflect (1) the real riskless rate, which historically has averaged 0.5 percent; (2) the horizon premium, which may be estimated for each time to maturity; and (3) the default premium for the class of bonds under examination. Bond prices compensate investors for expected inflation as well as for these three factors. By looking at the difference between the observed yield curve arid what the yield curve would be if inflation were not a factor, it is possible to observe the m arket’s assessment of future inflation. Because the yield curve changes daily, a specific inflation forecast is not presented here.
The median forecast of total common stock annual returns for one year, then, is the sum of the expected equity risk premium (8.3 percent), the expected real riskless rate over that year as given by the autoregressive process, and the expected rate of inflation for that year as given by the present yield curve.
140
Using Historical Data to Forecast the Future
The distribution of returns around the mean, which was described earlier as the probabilistic forecast, is provided by the lognormal distribution model described below.
The Lognormal Distribution Model
9. Q. W hat is the m ethod used to obtain the distributions around the forecast median or mean?
A. We use the lognormal model. In the lognormal model, the natural logarithms of asset return relatives are assumed to be normally distributed. (A return relative is one plus the return. That is, if an asset has a return of 15 percent in a given period, its return relative in that period is 1.15.)
The Normal Distribution
10. Q. Because the description of the lognormal model refers to the normal distribution, please describe the normal distribution.
A. The exact description of a normal distribution is too technical to include here, but we can provide some intuition. A normal distribution of returns, when graphed, is a bell-shaped curve. If the mean of the normal distribution is zero percent, with a standard deviation of 20 percent, the bell curve is centered on the zero percent line. About two-thirds of the observations fall within 20 percent, or one standard deviation, either way, of the mean. About 95 percent of the observations fall within two standard deviations of the mean. Under this scenario, returns of -50 percent and +50 percent are equally probable.
141

Stocks, Bonds, Bills, and Inflation: Historical Returns
Problems with the Normal Distribution as a Model of theMarket
11. Q. Does the normal distribution describe the returns on capital market assets?
A. Superficially, the normal distribution seems to characterize the stock market fairly well, except that one would raise all the numbers by 10 percent because the historical stock market mean return is roughly 10 percent per year, not zero.
On closer examination, however, there are some problems with the normal distribution as a model of the stock m arket First, stocks cannot have a return below -100 percent. Second, an investor must gain more in percent, on average, than he or she loses, just to break even. Successive returns of -50 percent and +50 percent would result in a two-period loss of 25 percent; to break even, an investor with a one-period return of -50 percent would have to earn +100 percent in the next period. This observation is corroborated by the actual historical data: the distribution of stock returns is somewhat “right-tailed,” meaning that there are more observations on the high-return end of the distribution than one would expect if stock returns had a normal distribution.
The Lognormal Distribution
12. Q. How are the problem s with the norm al distribution best resolved?
A. The lognorm al m odel characterizes the behavior of the equity risk premium (the major component of stock returns) much better than does the norm al d istribu tion . W ith a lognorm al distribution, returns are distributed so that a
142

Using Historical Data to Forecast the Future
doubling or halving of the stock market’s level are equally probable, assuming a mean of zero. On average, the equity risk premium is positive (that is, the stock market beats Treasury bills), so the correct mean is above zero. Lognormally distributed returns cannot ever be lower than or equal to -100 percent.
The returns at various probability rankings—for example, 95th percentile or 5th percentile—are easily estimated. One calculates, or looks up in a table, the number of standard deviations above or below the mean that correspond to the desired percentile ranking. For example, the 95th percentile return (that is, the return which is exceeded only 5 percent of the time), is 1.65 standard deviations above the mean. With a little more mathematics, multiperiod probability rankings of returns can be estim ated also. These form the probabilistic forecasts.
It should be remembered that the lognormal model applies only to the randomly distributed components of asset returns. Trendlike series, such as real interest rates and inflation, are forecasted using a nonrandom process such as the autoregressive process mentioned earlier.
Random versus Nonrandom VariablesOnly a subset of the component series are modeled using
the lognormal distribution. That model is suitable for series which follow a random walk. For these, the best estimate of the next observation is the historical average of the series.
13. Q. You have stated that you expect the equity risk premium to remain at its historical mean because it follows what is known in statistics as a random walk.
143

Stocks, Bonds, Bills, and Inflation: Historical Returns
Is there also a fundamental reason why you expect this?
A. There is no compelling evidence that either (1) the equilibrium price (market compensation) for a given amount of risk, or (2) the amount of risk in common stocks, has changed over time. For modeling purposes, we thus assume that these quantities will remain stable in the future. Models that allow for changing levels of risk or changing risk aversion are also reasonable. One cannot prove that either approach is exclusively correct.
14. Q. Much academic work suggests that the returns on common stocks follow a random walk, while you assume that instead, equity risk premiums follow a random walk. Is it possible that they both follow a random walk?
A. We have broken down the returns on common stocks into two components: the returns from holding a riskless security (Treasury bills) and the returns from the equity risk premium. The returns from holding Treasury bills do not follow a random walk. Thus, equity risk premiums and common stock returns cannot both follow a random walk. Evidence suggests the expected return from taking risk (the equity risk premium) is constant through time, i.e., it is the risk premium that behaves randomly. Because most of the variability from common stock returns arises from the risk premium, some researchers have mistakenly concluded that the whole of the common stock return follows a random walk. The research presented in this book indicates that only the risk premium component follows a random walk.
144

Using Historical Data to Forecast the Future
15. Q. Do you expect any of the other component returns to follow a random walk and remain at the same levels on average as in the past?
A. Yes. Although small-stock and bond default premiums historically show statistical evidence of trendlike behavior, the evidence is not sufficiently compelling to abandon the random walk hypothesis for these variables. Bond horizon premiums have followed a random walk in the past. For forecasting purposes, we assume that these three variables will follow random walks in the future.
Forecast Summary
16. Q. To recapitulate, you have said that the equity risk, small-company stock, default, and maturity premiums may be predicted using the assumption of a random walk around historical levels; the real riskless rate may be predicted using the historical trend; and the inflation rate may be forecasted using present bond yield information. Is this all the information that you need to make your forecasts?
A. Yes. Because all of the total asset return series are made up of these components, one can add the appropriate ones together to forecast the return on each category of asset.
Validity of the Forecasts17. Q. Most forecasts incorporate estimates of macro-
economic variables such as GNP, employment, and productivity. You seem to ignore them completely. Why?
A. T he various m acro- and m icroeconom ic variables determine the prices of securities. In fact,
145

Stocks, Bonds, Bills, and Inflation: Historical Returns
the prices of securities are themselves forecasts of what occurs in the economy. Because our method uses the prices of securities as the inputs to our forecasts, these economic variables are implicitly contained in the forecasts.
18. Q. Many forecasts are produced by economists, financial analysts, or long-range planners. Are your forecasts in any way superior to theirs, and if so, how?
A. If capital markets are efficient, then at the very least our forecasts are not inferior to theirs. In fact, the forecasts of economists, financial analysts, long-range planners, and others help to determine the prices in the m arket, because investors incorporate these forecasts into their decision making. Because these prices are used to generate our forecasts, other forecasters’ predictions are, once again, incorporated into these forecasts.
Issues Related to the 1926-87 Historical Period19. Q. You treat all years in the historical period
equally. Would it not be better to emphasize recent events by weighting recent returns more heavily than distant returns?
A. In the absence of any particular reason to weight particular years more heavily than others, it is appropriate to weight all of the years equally. In general, we attempt to maintain a spirit of neutrality or objectivity in the forecasts. Any particular weighting scheme runs the risk of imparting subjectivity and biases into the historical data.
20. Q. During the past 62 years, there were a severe depression, three wars, a period of pegged interest
146

Using Historical Data to Forecast the Future
rates, several periods of wage and price controls, periods of inflation and deflation, and, recently, a stock price crash. Are you suggesting that these events will happen in the future with the same frequency as they have in the past?
A. It is impossible to forecast which specific events will occur because no one knows the future. It is reasonable to believe, however, that historical events are not unrepresentative of the types of events that will occur in the future. Thus, the rate-of-retum effects of these event-types should be expected to recur.
The Changing Variability of Returns
21. Q. The variability of stock market returns does not seem to be constant over the historical period. It seems to have been more variable during the depression and very recently. Also, bond returns have become substantially more variable in the past two decades. Does the market-consensus forecasting method take this into account?
A. In principle, it would be possible to take the changes in variability into account. But this would make the forecasting procedures much more complicated, with only limited benefits.
Choice of a Historical Period
22. Q. Why do you choose a 62-year period over which to measure your historical results?
A. The 62-year time period is arbitrary; it was selected because 1926 is the beginning date for the series that are based on data from CRSP. It is desirable to have a period long enough to include all
147

Stocks, Bonds, Bills, and Inflation: Historical Returns
types of events. The period is limited only because it is more difficult to obtain high-quality data prior to 1926.
Results of the ForecastsAlthough numerical forecast results are not reported in
this study, it is important to review the broad conclusions of the forecasts and to answer questions relating to these conclusions.
Stocks and Bonds
23. Q. Your historical results show that the stock market had a compound annual return of 9.9 percent over the past 62 years. The yield on high-quality corporate bonds is now at least that. What incentive is there to take the additional risk in buying stocks?
A. It is not correct to compare bond yields, which are a very close estimate of the expected return on a bond, with a historical average of stock returns. The historical average of stock returns includes many years in which the riskless part of the return— equivalent to the yield on a riskless bond—is very low. Today, the expected return on a stock is much higher because the riskless part of the return is much higher. The equity risk premium component has not visibly changed. Thus, the expected return on a stock, to which the bond yield should be compared, is higher than that of bonds by a substantial margin.
In general, the relevant relations are between risky and riskless asset returns, or between asset returns and inflation. Stocks have outperformed riskless U.S. Treasury bills by a geometric average of 6.2 percent per year, and have yielded a 6.6 percent
148

Using Historical Data to Forecast the Future
compound annual return in excess of inflation. (The geometric average return on stocks is used in this context because bond yields are a geometric average of expected returns on the bond.) High-grade corporate bonds have compound returns of less than 2 percent in excess of either Treasury bills or inflation. Because these relations are expected to continue in the future, stocks are expected to outperform bonds. They also have more risk.
The Effect of Inflation
24. Q. Your method seems to imply that if the market’s expectation of inflation is high, relative to the historical (1926-87) compound inflation rate of 3.0 percent, then nominal returns on common stocks will be higher than have been realized historically. Yet, the experience of the past two decades suggests the opposite: that high inflation rates are accompanied by poor stock market returns. How do you reconcile recent events with your forecasting procedure?
A. When high inflation rates are anticipated—that is, reflected in the yield curve—these higher rates tend to be impounded in the returns of common stocks. In some periods, such as the 1970s, however, increases in inflation are unanticipated. Evidence shows that unanticipated inflation tends to be detrimental to stock returns because unanticipated inflation generally occurs during periods of great uncertainty. Because the forecast model uses the yield curve to forecast inflation rates, only anticipated inflation rates are incorporated into the projected stock returns.
149

Stocks, Bonds, Bills, and Inflation: Historical Returns
25. Q. The yield curve changes every day. Do your forecasts also change every day, and if so, what purpose do they serve?
A. It is true that the yield curve changes every day, and it is also true that changes in the yield curve will change the forecast results every day. The yield curve reflects the changing anticipations of the marketplace, which continually revises its estimates. It is therefore necessary to incorporate the latest yield curve into the forecasts. As a practical matter, the yield curve changes are relatively small during short periods of time, so that it is not necessary to make abrupt changes in the forecasts.
Furthermore, the forecasts are very stable in real terms because it is the inflation-rate component of the yield curve which is the most variable.
26. Q. Some government bonds have much lower yields than others, even though they have approximately the same maturity dates. Which bonds should be used to calculate the yield curve?
A. A number of government bonds trade at unusual prices because of their special tax status. For example, some bonds, called flower bonds, enable the holder to pay estate taxes by tendering the bond at par value. Because these bonds are bought primarily for their tax benefits, not their yields, they are not included in the yield curve.
Forecast Errors on Interest and Inflation Rates
27. Q. Your forecast method uses the yield curve to forecast expected one-year interest and inflation rates each year into the future. How well has this procedure worked in the past?
150

Using Historical Data to Forecast the Future
A. Historically, yield-curve forecasts have had substantial forecast error. But, after allowing for horizon premiums, the interest-rate forecasts have been unbiased. After removing real interest rates, the inflation forecasts have also been unbiased. Furthermore, no reliable way to make more accurate forecasts exists. It is also possible to estimate the degree of the forecast error for both interest and inflation rates.
Behavior of the Real Riskless RateThe real riskless rate is one of the most important
components of the forecasts. An analysis of its behavior over time is germane to an understanding of the forecast process and results.
28. Q. Historically, the real rate of interest has been 0.5 percent and quite volatile (with an annual standard deviation of 4.4 percent), according to your data. The more traditional view is that the real rate of interest is stable and in the range of 1 to 2 percent. How do you reconcile this difference?
A. For about two decades following the 1951 U.S. Treasury-Federal Reserve Accord, real interest rates were low and stable, around 1 percent on average. This long experience convinced many economists that the “natural” real interest rate was 1 percent or perhaps somewhat higher. More recent experience indicates that real rates can turn sharply negative, as they did in the late 1970s, or sharply positive, as they did from mid-1981 to the end of 1986. That is, the low and stable real interest rate was simply one of various patterns that real rates could assume.
151
Stocks, Bonds, Bills, and Inflation: Historical Returns
The behavior of real interest rates illustrates the value of studying lengthy historical periods. By looking at even a reasonably long period such as 1953-72, one could conclude incorrectly that real rates are not only stable, but close to a random walk; the longer view indicates that real rates are volatile and follow very distinct trends.
29. Q. The real riskless rate has averaged approximately 4 percent throughout most of the 1980s. How does this conform to your statement that the real riskless rate is near zero?
A. The real riskless rate varies from year to year and may be positive, as from July 1980 to the present, or negative, as in most of the 1970s. On average, the rate has been near zero—0.5 percent. The real riskless rate seems to drift toward its long-term mean.
30. Q. How far into the future do you forecast?
A. We can forecast as far out as the yield curve goes. For Treasury bonds, there is typically a 30-year bond, so that one could make 30-year forecasts.
Applications of the Forecast Method to Specific Investment Questions
The forecast method described here has implications for all types of specific investments; for portfolios of different investments; and for specific investment environments, such as the pension funding discipline mandated by Employee Retirement Income Security Act (ERISA) and various Financial Accounting Standards Board (FASB) standards. Forecasts can be constructed for stocks with high or low betas; for bonds of various maturities, durations,
152

Using Historical Data to Forecast the Future
and quality ratings; and for other asset classes. These forecast distributions should be particularly useful to pension plans. The key to this flexibility is the component return approach, which regards the return on an asset as the sum of the returns on its components or elemental parts.
31. Q. In today’s pension fund environment, wherein ERISA mandates that pension funds have to be actuarially funded, should your forecasts have any bearing on actuarial assumptions?
A. Any assumptions that affect the funding of pension plans should be based on realistic forecasts. In that regard, our forecasts and our forecasting p ro ced u re have an obvious bearing on the assumptions used in pension planning.
This question m erits extensive treatm ent, b ecau se it su b su m es m any of the c u rre n t controversial issues of pension-fund management. Such treatment is outside the scope of this book. Both the asset and liability sides of the pension equation should be estim ated , for planning purposes, in accordance with the principles of forecasting set forth here.
32. Q. Most portfolios are made up of combinations of stocks, corporate bonds, government bonds, and so forth. How do you estimate returns associated with various portfolio mixes?
A. The forecast mean returns for a portfolio mix may be calculated by adding the forecast mean returns for the asset classes in the portfolio, for example, stocks, corporate bonds, and Treasury bills, each weighted by their weights in the portfolio.
It is not possible, however, to add sorted percentile distributions of portfolio components,
153

Stocks, Bonds, Bills, and Inflation: Historical Returns
because portfolios are more diversified than the individual asset classes comprising them. A number of commercially available asset allocation programs calculate probability distributions of expected returns for multiasset portfolios, taking into account the covariances between the assets held (i.e., the effects of portfolio diversification).
33. Q. Your stock m arket total returns are from investing in the S&P Composite Index. Suppose investors held high-beta or low-beta portfolios—how would this affect their historical and future returns?
A. Empirical evidence suggests that high-beta portfolios outperform low-beta portfolios on average. This has occurred over the past 62 years and it is reasonable to anticipate that it will continue in the future. The expected reward is not without its costs, because higher beta portfolios have higher risks, or wider distributions of returns.
34. Q. If an investor did not hold the market but rather held a highly undiversified portfolio, how would this have affected his or her returns?
A. In the past, on average, undiversified portfolios have neither outperformed nor underperformed diversified portfolios. The risks of undiversified portfolios, however, are larger than the risks of diversified portfolios. This will also be true in the future; that is, undiversified portfolios will have, on average, the same expected return, but wider distributions of return, or higher risk.
35. Q. Are your procedures useful in estimating the possible returns from superior money managers?
154

Using Historical Data to Forecast the Future
A. These procedures may be used to estimate returns for portfolios expected to outperform the market. If the belief that a portfolio can outperform the market is strong, then the model should be adjusted: The expectations input should be increased so that the expected return is increased by the am ount that the portfolio is expected to outperform the market. The risks are also increased by the amount of the additional risk incurred as a result of holding a portfolio that is less diversified than the market.
36. Q. You have shown that, historically, the bond horizon premium is 1.1 percent. Do you expect investors to be paid this amount in the future for taking the additional risk of long-term bonds?
A. Investors should expect to receive higher compensation for this risk. Over the post-World War II period, investors underestimated inflation. The result was that long-term bondholders suffered large unanticipated capital losses. Because these losses were both unanticipated and measurable as such, one can add back the annual rate of loss to the historical horizon premium to estimate what the expectancy was. The annual rate of capital loss, or addback, is 0.4 percent (arithmetic mean). Adding this to the historical horizon premium of 1.1 percent, it is reasonable to conclude that investors expect a somewhat larger horizon premium (1.5 percent) than was experienced over the period 1926-87.
37. Q. Are long-term bonds more risky now than in the past?
A. In the past decade, long-term bonds have been considerably more risky than in earlier years. (From
155

Stocks, Bonds, Bills, and Inflation: Historical Returns
1926 to 1932, annualized yields on long-term government bonds fluctuated within a 1 percentage point range.) This trend will not necessarily continue in the indefinite future. The volatility of bond returns follows distinct trends, so that long-term bonds are expected to be riskier in the near future than they were historically.
38. Q. What would have been the effect on returns of holding a portfolio of various duration bonds, not just short-term bills, or 20-year bonds?
A Historically, yields across the entire spectrum of bond maturities have risen dramatically over the period 1926-87, resulting in greater capital losses on bonds, with longer durations. Thus, intermediate- term governm ent bonds outperform ed both long-term bonds and short-term bills over that historical period.
Looking forward, the returns from short-term bills should not be expected to reflect any horizon premium, whereas the returns on a 20-year bond should reflect a horizon premium, appropriate to the duration of a 20-year bond. The expected returns of intermediate-term bonds may reflect a partial horizon premium.
39. Q. Long-term bonds, Guaranteed Investment Contracts, and various immunization and dedication strategies are purported to reduce risk for investors with long-term time horizons. Do they work?
A. Investors frequently engage in “horizon matching.” That is, they hold bond and bill portfolios with a duration equal or similar to the duration of the investor’s future obligation. Thus, short-horizon investors hold short-term bills because they perceive
156

Using Historical Data to Forecast the Future
bills as less risky than long-term bonds, which are subject to price fluctuation risk. Long-horizon investors may hold long-duration bonds, guaranteed investment contracts, or dedicated or immunized portfolios, all of which they perceive as less risky than short-term bills, which are subject to reinvestment risk. These long-horizon strategies work if structured properly, so that investors with a long time horizon and known nominal future obligations benefit from them.
Very few investors, however, have such known nominal needs and are interested in reducing risk in nominal (as opposed to real) terms. Pension funds that have obligations denominated in nominal terms with no inflation provison might be an exception. Most investors seek to reduce risk in nominal terms as a proxy for their primary, more difficult goal of reducing risk in real terms. Even if these investors have long-term tim e horizons, investing in short-term securities is a less risky strategy. If the market is dominated by investors who perceive short-term investments as less risky, then holders of long-term bonds should expect to be compensated for their taking on interest-rate risk.
40. Q. If one were to hold lower-quality bonds than the high-quality long-term corporate bonds listed in this study, how would this affect bondholder expected returns?
A. Lower-quality bonds have higher yields and h igher default risks than high-quality bonds. Because investors are paid a premium for taking default risk, holders of lower-quality bonds have, in
157

Stocks, Bonds, Bills, and Inflation: Historical Returns
general, h igher expected returns and higher variability than the holders of higher-quality bonds.
41. Q. On October 19, 1987, stock prices fell by more than 20 percent in one day. How does an event such as this crash affect your forecasts?
A. The crash of October 1987 broke new ground in terms of daily volatility: The crash was twice as large as the next largest decline in history, which occurred in 1929. In terms of monthly volatility, however, the crash has historical precedent. There were four months (in the 1920s, 1930s, and 1940s) that were worse. Thus, an investor with a sufficient base of historical knowledge would have known that such a crash was possible, although he or she could not have foreseen when it would occur.
This problem highlights the importance of a long historical time series in probabilistic forecasting— that is, in understanding the character of possible future risks and returns. An investor who looks only at the last half of the period will not perceive the possibility of months in which stock prices decline more than 20 percent. The crash of 1987 recalled the panics that punctuated the earlier, more turbulent half of the period studied, and shows the investor that history is indeed relevant to understanding the present.
158

Appendix
APPENDIX
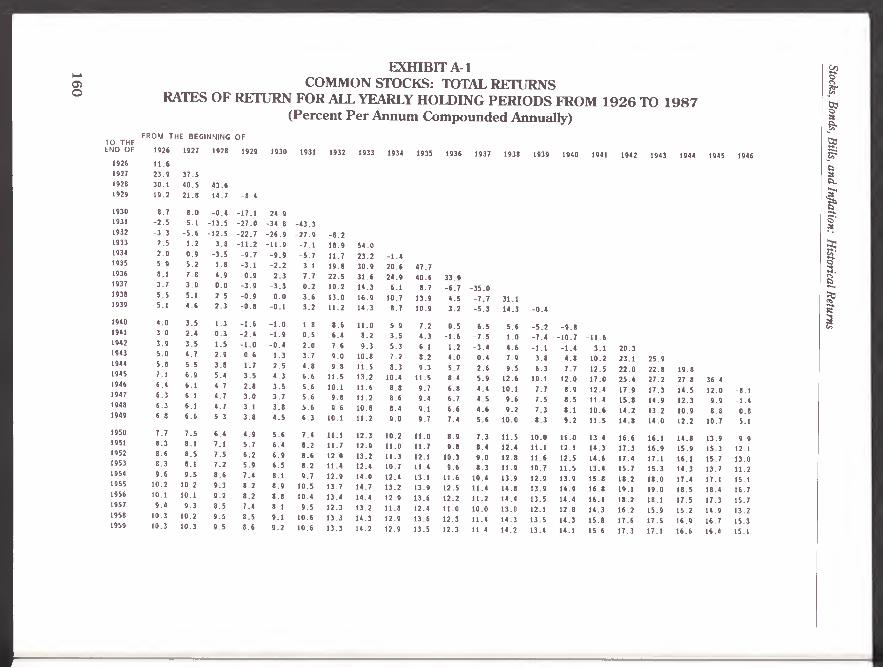
16
0
E X H IB IT A -1C O M M O N STOCKS: TOTAL R E T U R N S
RATES O F R E T U R N F O R ALL YEARLY H O L D IN G P E R IO D S FR O M 1 9 2 6 TO 1 9 8 7
(P e r c e n t P e r A n n u m C o m p o u n d e d A n n u a lly )
FROM THE BEGINNING OFTO THEEND OF 1926 1927 1928 1929 1930 1931 1932 1933 1934 1935 1936 1937 1938 1939 1940 1941 1942 1943 1944 1945 1946
1926 11.61927 23.9 37.51928 30.1 40.5 43.61929 19.2 21.8 14.7 -8.4
1930 8.7 8.0 -0.4 -17.1 -24.91931 -2.5 -5.1 -13.5 -27.0 -34.8 -43.31932 -3.3 -5.6 -12.5 -22.7 -26.9 -27.9 -8.21933 2.5 1.2 -3.8 -11.2 -11.9 -7.1 18.9 54.01934 2.0 0.9 -3.5 -9.7 -9.9 -5.7 11.7 23.2 -1.41935 5.9 5.2 1.8 -3.1 -2.2 3.1 19.8 30.9 20.6 47.71936 8.1 7.8 4.9 0.9 2.3 7.7 22.5 31.6 24.9 40.6 33.91937 3.7 3.0 0 .0 -3.9 -3.3 0.2 10.2 14.3 6.1 8.7 -6.7 -35.01938 5.5 5.1 2.5 -0.9 - 0 .0 3.6 13.0 16.9 10.7 13.9 4.5 -7.7 31.11939 5.1 4.6 2.3 -0.8 -0.1 3.2 11.2 14.3 8.7 10.9 3.2 -5.3 14.3 -0.4
1940 4.0 3.5 1.3 -1.6 - 1.0 1.8 8.6 11.0 5.9 7.2 0.5 -6.5 5.6 -5.2 -9.81941 3.0 2.4 0.3 -2.4 -1.9 0.5 6.4 8.2 3.5 4.3 -1.6 -7.5 1.0 -7.4 -10.7 -11.61942 3.9 3.5 1.5 - 1.0 -0.4 2.0 7.6 9.3 5.3 6.1 1.2 -3.4 4.6 -1.1 -1.4 3.1 20.31943 5.0 4.7 2.9 0.6 1.3 3.7 9.0 10.8 7.2 8.2 4.0 0.4 7.9 3.8 4.8 10.2 23.1 25.91944 5.8 5.5 3.8 1.7 2.5 4.8 9.8 11.5 8.3 9.3 5.7 2.6 9.5 6.3 7.7 12.5 22.0 22.8 19.81945 7.1 6.9 5.4 3.5 4.3 6.6 11.5 13.2 10.4 11.5 8.4 5.9 12.6 10.1 12.0 17.0 25.4 27.2 27.8 36.41946 6.4 6.1 4.7 2.8 3.5 5.6 10.1 11.6 8.8 9.7 6.8 4.4 10.1 7.7 8.9 12.4 17.9 17.3 14.5 12.0 -8.11947 6.3 6.1 4.7 3.0 3.7 5.6 9.8 11.2 8.6 9.4 6.7 4.5 9.6 7.5 8.5 11.4 15.8 14.9 12.3 9.9 -1.41948 6.3 6.1 4.7 3.1 3.8 5.6 9.6 10.8 8.4 9.1 6.6 4.6 9.2 7.3 8.1 10.6 14.2 13.2 10.9 8.8 0.81949 6.8 6.6 5.3 3.8 4.5 6.3 10.1 11.2 9.0 9.7 7.4 5.6 10.0 8.3 9.2 11.5 14.8 14.0 12.2 10.7 5.11950 7.7 7.5 6.4 4.9 5.6 7.4 11.1 12.3 10.2 11.0 8.9 7.3 11.5 10.0 11.0 13.4 16.6 16.1 14.8 13.9 9.91951 8.3 8.1 7.1 5.7 6.4 8.2 11.7 12.9 11.0 11.7 9.8 8.4 12.4 11.1 12.1 14.3 17.3 16.9 15.9 15.3 12.11952 8.6 8.5 7.5 6.2 6.9 8.6 12.0 13.2 11.3 12.1 10.3 9.0 12.8 11.6 12.5 14.6 17.4 17.1 16.1 15.7 13.01953 8.3 8.1 7.2 5.9 6.5 8.2 11.4 12.4 10.7 11.4 9.6 8.3 11.9 10.7 11.5 13.4 15.7 15.3 14.3 13.7 11.21954 9.6 9.5 8.6 7.4 8.1 9.7 12.9 14.0 12.4 13.1 11.6 10.4 13.9 12.9 13.9 15.8 18.2 18.0 17.4 17.1 15.11955 10.2 10.2 9.3 8.2 8.9 10.5 13.7 14.7 13.2 13.9 12.5 11.4 14.8 13.9 14.9 16.8 19.1 19.0 18.5 18.4 16.71956 10.1 10.1 9.2 8.2 8.8 10.4 13.4 14.4 12.9 13.6 12.2 11.2 14.4 13.5 14.4 16.1 18.2 18.1 17.5 17.3 15.71957 9.4 9.3 8.5 7.4 8.1 9.5 12.3 13.2 11.8 12.4 11.0 10.0 13.0 12.1 12.8 14.3 16.2 15.9 15.2 14.9 13.21958 10.3 10.2 9.5 8.5 9.1 10.6 13.3 14.3 12.9 13.6 12.3 11.4 14.3 13.5 14.3 15.8 17.6 17.5 16.9 16.7 15.31959 10.3 10.3 9.5 8.6 9.2 10.6 13.3 14.2 12.9 13.5 12.3 11.4 14.2 13.4 14.1 15.6 17.3 17.1 16.6 16.4 15.1
Stocks, Bonds, B
ills, and In
flation: H
istorical Retu
rns

161
,
EXHIBIT A-1 (Continued)
F R O M T H E B E G I N N I N G O F
T O T H E
E N D O F 1926 1927 1928 1929 1930 1931 1932 1933
1960 1 0 . 0 1 0 . 0 9 . 3 8 . 3 8 . 9 1 0 . 3 1 2 . 8 1 3 . 7
1961 1 0 . 5 1 0 . 4 9 . 7 8 . 8 9 . 4 1 0 . 8 1 3 . 3 1 4 . 1
1962 9 . 9 9 . 9 9 . 2 8 . 3 8 . 8 10 . 1 1 2 . 5 1 3 . 2
1963 1 0 . 2 1 0 . 2 9 . 5 8 . 7 9 . 2 1 0 . 5 1 2 . 8 1 3 . 5
1964 1 0 . 4 1 0 . 4 9 . 7 8 . 9 9 . 4 1 0 . 6 1 2 . 9 1 3 . 6
1965 1 0 . 4 1 0 . 4 9 . 8 9 . 0 9 . 5 1 0 . 7 12 . 9 1 3 . 6
1966 9 . 9 9 . 8 9 . 2 8 . 4 8 . 9 10 . 1 1 2 . 2 1 2 . 8
1967 10 . 2 1 0 . 2 9 . 6 8 . 8 9 . 3 1 0 . 4 1 2 . 5 13. 1
1968 1 0 . 2 1 0 . 2 9 . 6 8 . 9 9 . 3 10 . 4 1 2 . 4 13. 1
1969 9 . 8 9 . 7 9 . 1 8 . 4 8 . 9 9 . 9 1 1 . 8 1 2 . 4
1970 9 . 6 9 . 6 9 . 0 8 . 3 8 . 7 9 . 7 11 . 6 1 2 . 2
1971 9 . 7 9 . 7 9 . 1 8 . 4 8 . 9 9 . 9 1 1 . 7 1 2 . 2
1972 9 . 9 9 . 9 9 . 3 8 . 7 9 . 1 10 . 1 1 1 . 9 1 2 . 4
1973 9 . 3 9 . 3 8 . 7 8 . 1 8 . 5 9 . 4 11 . 1 11 . 7
1974 8 . 5 8 . 4 7 . 8 7 . 2 7 . 5 8 . 4 1 0 . 1 1 0 . 6
1975 9 . 0 8 . 9 8 . 4 7 . 7 8 . 1 9 . 0 1 0 . 6 11 . 1
1976 9 . 2 9 . 2 8 . 7 8 . 0 8 . 4 9 . 3 1 0 . 9 1 1 . 4
1977 8 . 9 8 . 8 8 . 3 7 . 7 8 . 1 8 . 9 1 0 . 5 1 0 . 9
1978 8 . 9 8 . 8 8 . 3 7 . 7 8 . 0 8 . 9 1 0 . 4 1 0 . 8
1979 9 . 0 9 . 0 8 . 5 7 . 9 8 . 2 9 . 1 1 0 . 6 11 . 0
1980 9 . 4 9 . 4 8 . 9 8 . 3 8 . 7 9 . 5 1 1 . 0 1 1 . 4
1981 9 . 1 9 . 1 8 . 6 8 . 1 8 . 4 9 . 2 10 . 6 1 1 . 0
1982 9 . 3 9 . 3 8 . 8 8 . 3 8 . 6 9 . 4 1 0 . 8 1 1 . 2
1983 9 . 6 9 . 5 9 . 1 8 . 5 8 . 9 9 . 6 1 1 . 0 1 1 . 5
1984 9 . 5 9 . 5 9 . 0 8 . 5 8 . 8 9 . 6 1 0 . 9 11 . 3
1985 9 . 8 9 . 8 9 . 4 8 . 9 9 . 2 9 . 9 1 1 . 3 11 . 7
1986 10 . 0 9 . 9 9 . 5 9 . 0 9 . 4 10. 1 11 . 4 1 1 . 8
1987 9 . 9 9 . 9 9 . 5 9 . 0 9 . 3 1 0 . 0 1 1 . 3 11. 7
1934 1935 1936 1937 1938 1939 1940 1941 1942
1 2 . 8 1 3 . 5 1 4 . 8 16 . 4
13 . 4 1 4 . 0 1 5 . 3 1 6 . 9
1 2 . 3 1 2 . 9 14. 1 1 5 . 5
12. 7 1 3 . 3 1 4 . 5 15. 8
1 2 . 9 13 . 5 1 4 . 5 1 5 . 8
1 2 . 9 1 3 . 4 1 4 . 5 15. 7
12 . 0 1 2 . 4 1 3 . 4 14. 5
1 2 . 4 1 2 . 8 1 3 . 8 14. 9
1 2 . 3 1 2 . 8 1 3 . 7 14. 7
1 1 . 6 1 2 . 0 1 2 . 8 13. 8
1 1 . 3 1 1 . 7 1 2 . 5 1 3 . 5
1 1 . 4 1 1 . 8 12 . 6 1 3 . 5
1 1 . 6 1 2 . 0 1 2 . 8 1 3 . 7
1 0 . 8 11. 1 1 1 . 8 1 2 . 7
9 . 5 9 . 8 1 0 . 5 11 . 2
1 0 . 2 1 0 . 5 11. 1 1 1 . 9
1 0 . 5 1 0 . 8 1 1 . 5 1 2 . 2
10 . 0 1 0 . 3 10 . 9 1 1 . 6
9 . 9 1 0 . 2 1 0 . 8 1 1 . 5
10. 1 1 0 . 4 1 1 . 0 1 1 . 7
1 0 . 6 10 . 9 1 1 . 5 12 . 2
1 0 . 2 1 0 . 5 11. 1 11 . 7
1 0 . 5 1 0 . 8 1 1 . 3 1 1 . 9
10 . 7 1 1 . 0 1 1 . 5 1 2 . 2
1 0 . 6 1 0 . 9 11 . 4 1 2 . 0
11. 1 1 1 . 3 1 1 . 8 1 2 . 4
1 1 . 2 11 . 5 1 2 . 0 1 2 . 6
11. 1 1 1 . 3 1 1 . 8 12 . 4
1945 1946
1 5 . 3 1 4 . 0
16 0 1 4 . 8
1 4 . 4 1 3 . 3
1 4 . 9 1 3 . 8
1 4 . 9 1 3 . 9
1 4 . 8 1 3 . 8
1 3 . 6 12 6
1 4 . 0 1 3 . 1
1 3 . 9 13 0
12 9 1 2 . 0
12 5 11 . 7
12 .6 11 .8
12 .8 12 .0
11 .7 10 .9
10 .2 9 .4
11 .0 10 .2
11 .3 10 .6
10 .7 10 .0
10 .6 9 .9
10 .8 10 .2
11 .4 10 7
10 .9 10 .3
11 .2 10 .6
Appen
dix
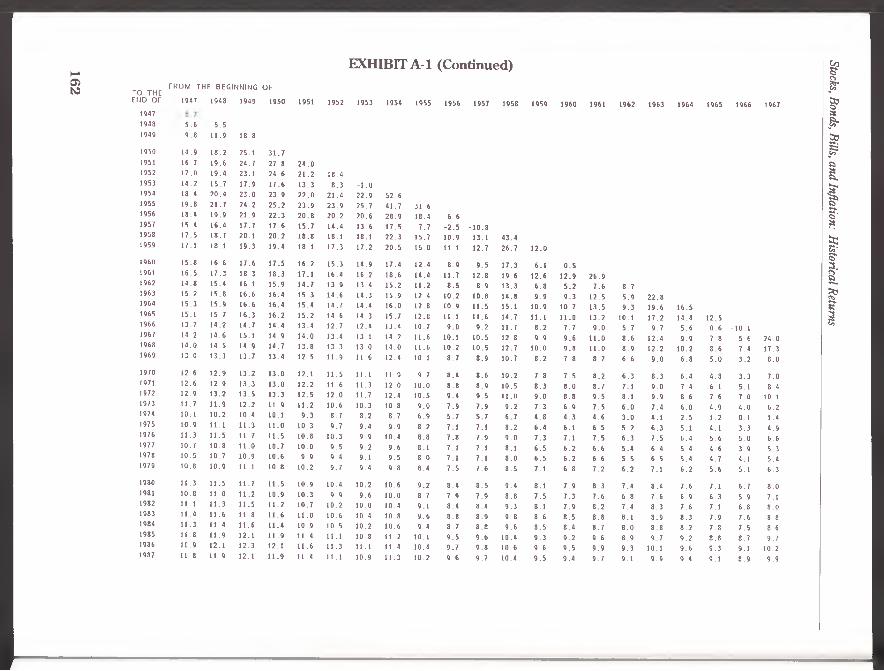
162
TO THE END OF
1947
1948
1949
1950
1951
1952
1953
1954
1955
1956
1957
1958
1959
1960
1961
1962
1963
1964
1965
1966
1967
1968
1969
1970
1971
1972
1973
1974
1975
1976
1977
1978
1979
1980
1981
1982
1983
1984
1985
1986
1987
EXHIBIT A-1 (Continued)FROM THE BEGINNING OF
1947 1948 1949 1950 1951 1952 1953 1954 1955 1956 1957 1958 1959 1960 1961 1962 1963 1964 1965 1966 1967
5 . 6 5 . 5
9 . 8 11 . 9 1 8 . 8
14. 9 18 . 2 25 . 1 3 1 . 7
16. 7 19 . 6 2 4 . 7 2 7 . 8 2 4 . 01 7 . 0 19. 4 23 . 1 2 4 . 6 2 1 . 2 1 8 . 4
1 4 . 2 15 . 7 1 7 . 9 1 7 . 6 1 3 . 3 8 . 3 - 1.018. 4 2 0 . 4 2 3 . 0 2 3 . 9 2 2 . 0 2 1 . 4 2 2 . 9 5 2 . 61 9 . 8 2 1 . 7 2 4 . 2 2 5 . 2 2 3 . 9 2 3 . 9 2 5 . 7 4 1 . 7 31 618. 4 1 9 . 9 2 1 . 9 2 2 . 3 2 0 . 8 2 0 . 2 2 0 . 6 2 8 . 9 18. 4 6 . 61 5 . 4 1 6 . 4 1 7 . 7 1 7 . 6 1 5 . 7 1 4 . 4 1 3 . 6 1 7 . 5 7 . 7 - 2 . 5 - 1 0 . 81 7 . 5 1 8 . 7 2 0 . 1 2 0 . 2 1 8 . 8 18. 1 18. 1 2 2 . 3 1 5 . 7 1 0 . 9 13. 1 4 3 . 417. 1 18. 1 1 9 . 3 1 9 . 4 18. 1 1 7 . 3 17 . 2 2 0 . 5 1 5 . 0 11. 1 12 . 7 2 6 . 7 1 2 . 0
1 5 . 8 1 6 . 6 1 7 . 6 1 7 . 5 1 6 . 2 1 5 . 3 1 4 . 9 17. 4 1 2 . 4 8 . 9 9 . 5 1 7 . 3 6 . 1 0 . 51 6 . 5 1 7 . 3 1 8 . 3 1 8 . 3 17. 1 16. 4 1 6 . 2 1 8 . 6 14. 4 1 1 . 7 1 2 . 8 1 9 . 6 1 2 . 6 1 2 . 9 2 6 . 914. 8 1 5 . 4 16. 1 1 5 . 9 1 4 . 7 1 3 . 9 1 3 . 4 15 . 2 1 1 . 2 8 . 5 8 . 9 1 3 . 3 6 . 8 5 . 2 7 . 6 - 8 . 71 5 . 2 1 5 . 8 1 6 . 6 1 6 . 4 1 5 . 3 1 4 . 6 1 4 . 3 15. 9 12. 4 1 0 . 2 1 0 . 8 1 4 . 8 9 . 9 9 . 3 1 2 . 5 5 . 9 2 2 . 81 5 . 3 1 5 . 9 1 6 . 6 1 6 . 4 15 . 4 1 4 . 7 14. 4 16 . 0 12. 8 1 0 . 9 1 1 . 5 15. 1 1 0 . 9 1 0 . 7 1 3 . 5 9 . 3 1 9 . 6 1 6 . 515. 1 1 5 . 7 1 6 . 3 1 6 . 2 1 5 . 2 1 4 . 6 1 4 . 3 15 . 7 1 2 . 8 11. 1 1 1 . 6 1 4 . 7 11. 1 1 1 . 0 1 3 . 2 10. 1 1 7 . 2 1 4 . 4 12 . 513. 7 14. 2 14. 7 1 4 . 4 13 . 4 1 2 . 7 12. 4 13. 4 1 0 . 7 9 . 0 9 . 2 1 1 . 7 8 . 2 7 . 7 9 . 0 5 . 7 9 . 7 5 . 6 0 . 6 - 10. 114. 2 1 4 . 6 15. 1 1 4 . 9 14 . 0 13. 4 13.1 14 . 2 1 1 . 6 10. 1 1 0 . 5 1 2 . 8 9 . 9 9 . 6 1 1 . 0 8 . 6 1 2 . 4 9 . 9 7 . 8 5 6 24 . 01 4 . 0 1 4 . 5 1 4 . 9 1 4 . 7 13 . 8 13. 3 1 3 . 0 14 . 0 11. 6 1 0 . 2 1 0 . 5 1 2 . 7 1 0 . 0 9 . 8 1 1 . 0 8 . 9 1 2 . 2 1 0 . 2 8 . 6 7 . 4 17. 313 . 0 13. 3 13 . 7 13. 4 12 . 5 11. 9 1 1 . 6 12. 4 10. 1 8 . 7 8 . 9 1 0 . 7 8 . 2 7 . 8 8 . 7 6 . 6 9 . 0 6 . 8 5 . 0 3 . 2 8 . 0
1 2 . 6 1 2 . 9 1 3 . 2 1 3 . 0 12. 1 1 1 . 5 11. 1 11. 9 9 . 7 8 . 4 8 . 6 1 0 . 2 7 . 8 7 . 5 8 . 2 6 . 3 8 . 3 6 . 4 4 . 8 3 . 3 7 . 01 2 . 6 1 2 . 9 1 3 . 3 1 3 . 0 1 2 . 2 1 1 . 6 11. 3 12 0 10 . 0 8 . 8 8 . 9 1 0 . 5 8 . 3 8 . 0 8 . 7 7 . 1 9 . 0 7 . 4 6 . 1 5. 1 8 . 41 2 . 9 1 3 . 2 1 3 . 5 1 3 . 3 1 2 . 5 1 2 . 0 1 1 . 7 1 2 . 4 10 . 5 9 . 4 9 . 5 11 . 0 9 . 0 8 . 8 9 . 5 8 . 1 9 . 9 8 . 6 7 . 6 7 . 0 10. 111 . 7 11. 9 1 2 . 2 1 1 . 9 1 1 . 2 10. 6 1 0 . 3 10. 8 9 . 0 7 . 9 7 . 9 9 . 2 7 . 3 6 . 9 7 . 5 6 . 0 7 . 4 6 . 0 4 . 9 4 . 0 6 . 210. 1 1 0 . 2 1 0 . 4 10. 1 9 . 3 8 . 7 8 . 2 8 . 7 6 . 9 5 . 7 5 . 7 6 . 7 4 . 8 4 . 3 4 . 6 3 . 0 4 . 1 2 . 5 1 . 2 0.1 1 . 410 . 9 11. 1 1 1 . 3 1 1 . 0 1 0 . 3 9 . 7 9 . 4 9 . 9 8 . 2 7 . 1 7 . 1 8 . 2 6 . 4 6 . 1 6 . 5 5 . 2 6 . 3 5 . 1 4 . 1 3 . 3 4 . 911 . 3 1 1 . 5 1 1 . 7 1 1 . 5 1 0 . 8 10 . 3 9 . 9 1 0 . 4 8 . 8 7 . 8 7 . 9 9 . 0 7 . 3 7 . 1 7 . 5 6 . 3 7 . 5 6 . 4 5 . 6 5 . 0 6 . 610 . 7 1 0 . 8 1 1 . 0 1 0 . 7 1 0 . 0 9 . 5 9 . 2 9 . 6 8 . 1 7 . 1 7 . 1 8 . 1 6 . 5 6 . 2 6 . 6 5 . 4 6 . 4 5 . 4 4 . 6 3 . 9 5 . 310 . 5 1 0 . 7 1 0 . 9 1 0 . 6 9 . 9 9 . 4 9 . 1 9 . 5 8 . 0 7 . 1 7 . 1 8 . 0 6 . 5 6 . 2 6 . 6 5 . 5 6 . 5 5 . 4 4 . 7 4 . 1 5 . 410 . 8 1 0 . 9 11. 1 1 0 . 8 1 0 . 2 9 . 7 9 . 4 9 . 8 8 . 4 7 . 5 7 . 6 8 . 5 7 . 1 6 . 8 7 . 2 6 . 2 7 . 1 6 . 2 5 . 6 5. 1 6 . 3
11 . 3 1 1 . 5 1 1 . 7 1 1 . 5 1 0 . 9 1 0 . 4 1 0 . 2 1 0 . 6 9 . 2 8 . 4 8 . 5 9 . 4 8 . 1 7 . 9 8 . 3 7 . 4 8 . 4 7 . 6 7 . 1 6 . 7 8 . 010 . 8 1 1 . 0 1 1 . 2 1 0 . 9 1 0 . 3 9 . 9 9 . 6 1 0 . 0 8 . 7 7 . 9 7 . 9 8 . 8 7 . 5 7 . 3 7 . 6 6 . 8 7 . 6 6 . 9 6 . 3 5 . 9 7. 111. 1 1 1 . 3 1 1 . 5 1 1 . 2 1 0 . 7 1 0 . 2 1 0 . 0 10. 4 9 . 1 8 . 4 8 . 4 9 . 3 8 . 1 7 . 9 8 . 2 7 . 4 8 . 3 7 . 6 7. 1 6 . 8 8 . 011 . 4 1 1 . 6 1 1 . 8 1 1 . 6 1 1 . 0 10 . 6 1 0 . 4 1 0 . 8 9 . 6 8 . 8 8 . 9 9 . 8 8 . 6 8 . 5 8 . 8 8 . 1 8 . 9 8 . 3 7 . 9 7 . 6 8 . 81 1 . 3 1 1 . 4 1 1 . 6 1 1 . 4 1 0 . 9 10 . 5 1 0 . 2 1 0 . 6 9 . 4 8 . 7 8 . 8 9 . 6 8 . 5 8 . 4 8 . 7 8 . 0 8 . 8 8 . 2 7 . 8 7 . 5 8 . 611 . 8 1 1 . 9 12. 1 1 1 . 9 1 1 . 4 11. 1 10 8 1 1 2 10. 1 9 . 5 9 . 6 1 0 . 4 9 . 3 9 . 2 9 . 6 8 . 9 9 . 7 9 . 2 8 . 8 8 . 7 9 . 71 1 . 9 12. 1 1 2 . 3 12. 1 1 1 . 6 11 . 3 11. 1 11. 4 10. 4 9 . 7 9 . 8 1 0 . 6 9 . 6 9 . 5 9 . 9 9 . 3 10. 1 9 . 6 9 . 3 9 . 1 10. 21 1 8 1 1 . 9 12. 1 1 1 . 9 1 1 . 4 11. 1 10. 9 1 1 . 3 10 . 2 9 . 6 9 . 7 10 . 4 9 . 5 9 . 4 9 . 7 9 . 1 9 . 9 9 . 4 9 . 1 8 . 9 9 . 9
Stocks, Bon
ds, Bills, an
d Inflation
: Historical R
eturn
s

16
3
EXHIBIT A-1 (Continued)
F R O M T H E B E G I N N I N G O F
1969 1970 1971 1972 1973 1974 1975 1976 1977 1978 1979 1980 1981 1982 1983 1984 1985 1986 1987
- 8 . 5
- 2 . 4
2.86 . 7
2.0- 3 . 4
1.6
4 . 1
2. 8
3 . 2
4 . 5
6 . 5
5 . 6
6 . 7
7 . 7
7 . 6
8 . 9
9 . 4
9 . 2
4 . 0
9 . 0
1 2 . 3
4 . 8
- 2 . 4
3 . 3
6.04 . 3
4 . 5
5 . 9
8.06 . 9
7 . 9
8 . 9
8 . 7
10.110.6
1 0 . 3
1 9 . 0
0 . 8- 9 . 3
0 . 64 . 9
2.83 . 3
5 . 1
7 . 8
6 . 5
7 . 7
8 . 9
8 . 7
10.2
10.8
1 0 . 4
- 1 4 . 7
-20.8- 4 . 9
1.6-0.2
0 . 9
3 . 2
6 . 5
5 . 2
6 . 7
8.07 . 9
9 . 6
10.29 . 9
- 2 6 . 5
0 . 4
7 . 7
3 . 8
4 . 3
6.6
9 . 9
7 . 9
9 . 4
10.6 10.21 1 . 9
1 2 . 4
1 1 . 9
3 7 . 2
3 0 . 4
1 6 . 4
1 3 . 9
14 . 8
1 7 . 5
1 4 . 0
1 4 . 9
1 5 . 7
1 4 . 8
1 6 . 2
16 . 4
1 5 . 5
2 3 . 8
7 . 2
7 . 0
9 . 7
1 3 . 9
10.6
12.11 3 . 3
1 2 . 5
1 4 . 3
1 4 . 7
1 3 . 9
- 7 . 2
- 0 . 5
5 . 4
6 . 61 2 . 3
1 1 . 6 1 8 . 7 2 5 . 2 3 2 . 4
8.1
10.21 1 . 9
11.21 3 . 3
13 . 8
1 3 . 0
1 2 . 3
1 4 . 0
1 5 . 4
14. 1
1 6 . 2
1 6 . 4
1 5 . 3
1 4 . 3
1 6 . 0
1 7 . 3
1 5 . 4
1 7 . 6
1 7 . 7
1 6 . 3
12.21 5 . 2
1 7 . 0
1 4 . 8
1 7 . 5
1 7 . 6
1 6 . 0
- 4 . 9
7 . 4
1 2 . 3
1 0 . 7
1 4 . 7
1 5 . 3
1 3 . 8
2 1 . 4
22.01 6 . 5
20.2 1 9 . 9
1 7 . 3
2 2 . 5
1 4 . 1
1 9 . 8
19 . 5
1 6 . 5
6 . 3
1 8 . 5
1 8 . 5
1 5 . 0
3 2 . 2
2 5 . 1
18. 1
1 8 . 5
11. 7

E X H IB IT A -2SM A LL-C O M PA N Y STOCKS: TOTAL R E T U R N S
RATES O F R E T U R N F O R A LL YEARLY H O L D IN G P E R IO D S FR O M 1 9 2 6 TO 1 9 8 7
(P e r c e n t P e r A n n u m C o m p o u n d e d A n n u a lly )
F R O M T H E B E G I N N I N G O FT O T H EE N D O F 1926 1927 1928 1929 1930 1931 1932 1933 1934 1935 1936 1937 1938 1939 1940 1941 1942 1943 1944 1945 1946
1926 0 . 3
1927 10. 7 22 . 1
1928 19. 6 3 0 . 6 3 9 . 71929 - 4 . 5 - 6 . 0 - 1 7 . 6 - 5 1 . 4
1930 12. 4 - 15. 4 2 5 . 1 - 4 5 . 1 - 3 8 . 11931 - 2 0 . 2 - 2 3 . 7 - 3 2 . 2 - 4 6 . 7 - 4 4 . 3 - 4 9 . 81932 - 1 8 . 2 - 2 1 . 0 - 2 7 . 5 - 3 8 . 5 - 3 3 . 5 - 3 1 . 1 - 5 . 41933 - 6 . 3 - 7 . 2 - 1 1 . 4 - 19. 1 - 8 . 1 4 . 9 5 1 . 6 1 4 2 . 91934 - 3 . 3 - 3 . 8 - 7 . 0 - 13. 1 - 2 . 4 9 . 4 4 1 . 9 7 3 . 7 2 4 . 21935 0 . 3 0 . 3 - 2 . 1 - 6 . 9 3 . 7 1 5 . 0 4 1 . 4 6 1 . 7 3 2 . 0 4 0 . 21936 5 . 0 5 . 5 3 . 7 - 0 . 0 1 0 . 8 2 2 . 1 4 5 . 8 6 2 . 5 4 2 . 1 5 2 . 0 6 4 . 81937 - 2 . 7 - 3 . 0 - 5 . 2 - 9 . 2 - 1 . 9 4 . 8 1 8 . 5 2 4 . 0 4 . 8 - 1 . 0 - 16. 8 - 5 8 . 01938 - 0 . 4 - 0 . 4 - 2 . 3 - 5 . 7 1 . 5 8 . 0 2 0 . 4 2 5 . 4 9 . 9 6 . 5 - 2 . 8 - 2 5 . 3 3 2 . 81939 0 . 3 - 0 . 4 - 2 . 1 - 5 . 2 1 . 4 7 . 1 1 7 . 7 2 1 . 5 8 . 2 5 . 3 - 2 . 0 - 1 7 . 6 1 5 . 4 0 . 3
1940 - 0 . 7 - 0 . 7 - 2 . 3 - 5 . 2 0 . 8 5 . 8 1 4 . 9 17 . 8 6 . 2 3 . 5 - 2 . 6 - 1 4 . 6 8 . 1 - 2 . 4 - 5 . 21941 - 1 . 2 - 1 . 3 - 2 . 8 - 5 . 5 - 0 . 1 4 . 4 1 2 . 3 1 4 . 4 4 . 2 1 . 6 - 3 . 7 - 1 3 . 5 3 . 6 - 4 . 7 - 7 . 1 - 9 . 01942 1 . 0 1. 1 - 0 . 2 - 2 . 6 2 . 8 7 . 2 1 4 . 9 17. 1 8 . 0 6 . 2 2 . 0 - 5 . 8 1 0 . 7 5 . 8 7 . 6 1 4 . 7 4 4 . 51943 4 . 6 4 . 8 3 . 9 1 . 8 7 . 3 1 2 . 0 19 . 7 2 2 . 3 1 4 . 2 13. 1 10. 1 4 . 0 2 1 . 0 1 8 . 7 2 3 . 8 3 5 . 3 6 5 . 0 8 8 . 41944 6 . 7 7 . 1 6 . 3 4 . 5 9 . 9 1 4 . 5 2 2 . 0 2 4 . 7 17. 3 1 6 . 7 1 4 . 3 9 . 2 2 5 . 2 2 3 . 9 2 9 . 3 3 9 . 7 6 1 . 1 7 0 . 2 5 3 . 71945 9 . 4 9 . 9 9 . 2 7 . 6 13 . 1 1 7 . 8 2 5 . 2 2 7 . 9 2 1 . 2 2 1 . 0 1 9 . 2 15 . 0 3 0 . 4 3 0 . 1 3 5 . 8 4 5 . 9 6 4 . 2 7 1 . 3 6 3 . 4 7 3 . 61946 8 . 3 8 . 7 8 . 0 6 . 5 1 1 . 5 1 5 . 7 2 2 . 3 2 4 . 5 1 8 . 3 1 7 . 8 1 6 . 0 1 2 . 0 2 4 . 9 2 3 . 9 2 7 . 7 3 4 . 2 4 5 . 0 4 5 . 2 33. 1 2 3 . 9 - 11. 61947 7 . 9 8 . 3 7 . 6 6 . 2 1 0 . 9 1 4 . 7 2 0 . 8 2 2 . 8 1 7 . 0 1 6 . 4 1 4 . 6 1 0 . 9 2 2 . 2 2 1 . 1 2 4 . 0 2 8 . 8 3 6 . 5 3 5 . 0 2 4 . 2 15. 7 - 5 . 61948 7 . 5 7 . 8 7 . 2 5 . 7 1 0 . 2 1 3 . 7 1 9 . 3 2 1 . 1 15 . 6 1 5 . 0 1 3 . 3 9 . 8 19 . 8 1 8 . 6 2 0 . 8 2 4 . 5 3 0 . 2 2 8 . 0 18. 4 11. 0 - 4 . 41949 7 . 9 8 . 3 7 . 7 6 . 4 1 0 . 6 1 4 . 0 1 9 . 4 2 1 . 0 15 . 8 1 5 . 3 1 3 . 7 1 0 . 5 1 9 . 8 1 8 . 7 2 0 . 7 2 4 . 0 2 8 . 8 2 6 . 7 18 . 6 12. 7 1. 1
1950 9 . 0 9 . 4 8 . 9 7 . 7 1 1 . 8 1 5 . 2 2 0 . 3 2 1 . 9 17. 1 1 6 . 7 1 5 . 2 1 2 . 3 2 1 . 2 2 0 . 2 2 2 . 2 2 5 . 4 2 9 . 9 2 8 . 2 2 1 . 3 16. 6 7 . 71951 9 . 0 9 . 3 8 . 8 7 . 7 1 1 . 6 14 . 8 1 9 . 7 2 1 . 1 1 6 . 5 16. 1 1 4 . 8 1 2 . 0 2 0 . 1 19 . 2 2 1 . 0 2 3 . 7 2 7 . 5 2 5 . 7 1 9 . 6 15. 3 7 . 71952 8 . 8 9 . 1 8 . 6 7 . 5 1 1 . 2 1 4 . 2 1 8 . 8 2 0 . 2 1 5 . 8 15 . 3 1 4 . 0 11. 4 1 8 . 9 1 8 . 0 1 9 . 5 2 1 . 8 2 5 . 1 2 3 . 3 1 7 . 6 13. 7 7 . 01953 8 . 2 8 . 5 8 . 0 6 . 9 1 0 . 4 13 . 3 17 . 5 18. 7 14. 6 14. 1 12 . 8 1 0 . 3 1 7 . 2 1 6 . 2 17. 4 1 9 . 3 2 2 . 1 2 0 . 2 14. 9 11. 3 5 . 31954 9 . 7 1 0 . 0 9 . 6 8 . 6 12 . 1 14 . 9 19. 1 2 0 . 4 16. 4 1 6 . 0 14 . 9 12. 6 1 9 . 3 1 8 . 6 19 . 9 2 1 . 9 2 4 . 7 23. 1 1 8 . 5 15. 4 10. 31955 1 0 . 0 1 0 . 3 9 . 9 9 . 0 1 2 . 4 15.1 19. 2 2 0 . 4 16. 6 1 6 . 3 15 . 2 13. 0 1 9 . 4 1 8 . 7 1 9 . 9 2 1 . 8 2 4 . 4 2 2 . 9 18. 6 15. 9 11. 31956 9 . 8 10. 1 9 . 7 8 . 8 12. 1 14 . 7 18 . 5 1 9 . 7 16. 0 15. 7 1 4 . 6 12 . 6 1 8 . 6 1 7 . 8 1 8 . 9 2 0 . 6 2 2 . 9 2 1 . 5 17. 5 14. 9 10. 61957 8 . 9 9 . 2 8 . 8 7 . 9 1 1 . 0 13. 4 17. 1 18. 1 14. 6 1 4 . 2 13. 1 11. 1 1 6 . 6 1 5 . 8 1 6 . 8 1 8 . 2 20. 1 18. 7 1 4 . 8 12. 3 8 . 31958 10 . 3 1 0 . 7 1 0 . 3 9 . 4 1 2 . 5 1 5 . 0 1 8 . 6 1 9 . 6 1 6 . 2 1 5 . 9 1 5 . 0 13. 1 18 . 6 1 7 . 9 1 8 . 9 2 0 . 4 2 2 . 4 2 1 . 1 1 7 . 6 15. 4 11. 81959 10. 5 1 0 . 8 1 0 . 5 9 . 7 1 2 . 7 1 5 . 0 18. 5 1 9 . 5 1 6 . 3 1 5 . 9 1 5 . 0 1 3 . 2 18 . 5 1 7 . 8 1 8 . 8 2 0 . 2 22 . 1 2 0 . 9 17. 6 15. 5 12. 2
Stocks, Bon
ds, Bills, an
d Inflation
: Historical R
eturn
s

16
5
■ i i i r~% a. ■. \m t u w j
E X H IB IT A -2 (C o n tin u e d )
T O T H E
E f J D O F
F R O M T H E B E G I N N I N G '
1926 1927 1928
O F
1929 1930
1960 10. 1 1 0 . 4 1 0 . 0 9 . 2 12 . 1
1961 10 . 6 1 0 . 9 10 . 6 9 . 9 1 2 . 7
1962 1 0 . 0 1 0 . 2 9 . 9 9 . 1 1 1 . 9
1963 1 0 . 3 1 0 . 6 1 0 . 3 9 . 5 1 2 . 2
1964 1 0 . 6 1 0 . 9 1 0 . 6 9 . 9 1 2 . 5
1965 1 1 . 3 1 1 . 6 1 1 . 3 1 0 . 7 1 3 . 2
1966 10 . 8 11. 1 1 0 . 8 1 0 . 2 1 2 . 6
1967 1 2 . 2 1 2 . 5 1 2 . 2 1 1 . 6 14. 1
1968 1 2 . 7 1 3 . 0 1 2 . 8 1 2 . 2 1 4 . 6
1969 11. 6 1 1 . 9 1 1 . 7 11. 1 1 3 . 4
1970 1 0 . 9 11. 1 1 0 . 9 1 0 . 3 1 2 . 5
1971 1 1 . 0 1 1 . 2 11 . 0 1 0 . 4 1 2 . 6
1972 10 . 9 11. 1 1 0 . 9 1 0 . 3 1 2 . 4
1973 9 . 8 1 0 . 0 9 . 7 9 . 1 1 1 . 2
1974 9 . 1 9 . 3 9 . 0 8 . 4 1 0 . 4
1975 9 . 8 1 0 . 0 9 . 8 9 . 2 11. 1
1976 1 0 . 6 1 0 . 8 1 0 . 6 1 0 . 0 1 2 . 0
1977 1 0 . 8 11 . 1 1 0 . 9 1 0 . 3 1 2 . 2
1978 1 1 1 1 1 . 3 11. 1 1 0 . 6 1 2 . 4
1979 11. 6 1 1 . 8 1 1 . 6 1 1 . 1 1 3 . 0
1980 12. 1 1 2 . 3 12. 1 11 . 6 1 3 . 5
1981 12. 1 1 2 . 3 12. 1 1 1 . 7 1 3 . 5
1982 1 2 . 4 1 2 . 6 1 2 . 4 1 2 . 0 1 3 . 7
1983 1 2 . 8 1 3 . 0 1 2 . 9 1 2 . 4 1 4 . 2
1984 12. 4 1 2 . 6 1 2 . 5 1 2 . 0 1 3 . 8
1985 12. 6 1 2 . 8 1 2 . 7 1 2 . 3 1 3 . 9
1986 1 2 . 5 1 2 . 7 1 2 . 6 1 2 . 2 1 3 . 8
1987 12. 1 1 2 . 3 1 2 . 2 1 1 . 8 1 3 . 4
1931 1932 1933 1934 1935 1936 1937 1938 1939 1940 1941 1942 1943 1944 1945 1946
1 4 . 4 1 7 . 7 1 8 . 6 1 5 . 5 15. 1 1 4 . 2 1 2 . 5 17 . 4 1 6 . 8 1 7 . 6 1 8 . 9 2 0 . 6 1 9 . 4 16 . 2 1 4 . 2 11. 1
1 4 . 9 18. 1 1 9 . 0 1 6 . 0 1 5 . 7 1 4 . 9 1 3 . 2 1 8 . 0 1 7 . 4 1 8 . 2 1 9 . 5 2 1 . 1 2 0 . 0 1 7 . 0 15. 2 12. 3
1 3 . 9 1 7 . 0 1 7 . 8 1 4 . 9 1 4 . 6 1 3 . 8 12. 1 1 6 . 6 1 6 . 0 1 6 . 7 1 7 . 8 1 9 . 3 1 8 . 2 1 5 . 3 1 3 . 5 10. 7
1 4 . 2 1 7 . 2 1 8 . 0 1 5 . 2 1 4 . 9 14. 1 1 2 . 5 1 6 . 9 1 6 . 3 1 7 . 0 18. 1 1 9 . 5 1 8 . 4 1 5 . 7 1 4 . 0 11. 4
1 4 . 5 1 7 . 4 1 8 . 2 15 . 5 1 5 . 2 1 4 . 4 1 2 . 9 17. 1 1 6 . 6 1 7 . 3 1 8 . 3 1 9 . 7 1 8 . 6 16. 1 14. 4 12. 0
1 5 . 2 1 8 . 0 1 8 . 8 1 6 . 2 1 6 . 0 15 . 2 1 3 . 8 1 7 . 9 1 7 . 4 18. 1 1 9 . 2 2 0 . 5 1 9 . 6 17. 1 15 . 6 13. 3
1 4 . 5 1 7 . 2 1 8 . 0 1 5 . 4 1 5 . 2 14 . 4 1 3 . 0 1 7 . 0 1 6 . 4 17. 1 1 8 . 0 1 9 . 3 1 8 . 3 1 6 . 0 1 4 . 5 12. 2
1 6 . 0 1 8 . 7 1 9 . 5 1 7 . 0 1 6 . 8 16. 1 1 4 . 8 1 8 . 7 1 8 . 3 1 9 . 0 2 0 . 0 2 1 . 3 2 0 . 4 18 . 2 16. 9 14. 8
1 6 . 5 19. 1 19 . 9 1 7 . 5 17 . 3 1 6 . 7 1 5 . 4 1 9 . 3 1 8 . 8 1 9 . 5 2 0 . 5 2 1 . 8 2 1 . 0 1 8 . 9 1 7 . 6 15. 6
1 5 . 2 17. 7 1 8 . 4 16. 1 1 5 . 8 1 5 . 2 1 3 . 9 1 7 . 5 17. 1 1 7 . 7 1 8 . 6 1 9 . 7 1 8 . 9 1 6 . 8 1 5 . 5 13. 5
1 4 . 2 16 . 6 1 7 . 3 1 5 . 0 1 4 . 7 14. 1 1 2 . 9 1 6 . 3 1 5 . 8 1 6 . 3 17. 1 1 8 . 2 17 . 3 1 5 . 3 1 4 . 0 12.1
1 4 . 3 1 6 . 6 1 7 . 3 15 0 1 4 . 8 1 4 . 2 1 3 . 0 1 6 . 3 1 5 . 8 1 6 . 4 17. 1 18. 1 1 7 . 3 1 5 . 3 14. 1 12 . 3
1 4 . 0 1 6 . 3 1 6 . 9 14. 7 1 4 . 5 13 . 9 1 2 . 7 1 5 . 9 1 5 . 5 1 6 . 0 1 6 . 7 1 7 . 6 1 6 . 8 1 4 . 9 13. 7 12. 0
12. 7 14. 9 1 5 . 4 1 3 . 3 1 3 . 0 12. 4 1 1 . 2 1 4 . 3 1 3 . 8 1 4 . 2 1 4 . 9 1 5 . 7 1 4 . 9 1 3 . 0 1 1 8 10.1
1 1 . 8 1 3 . 9 1 4 . 4 1 2 . 3 12. 1 1 1 . 4 1 0 . 3 1 3 . 2 1 2 . 7 13. 1 1 3 . 6 1 4 . 4 1 3 . 6 11 . 7 10. 6 8 . 9
1 2 . 6 1 4 . 7 1 5 . 2 1 3 . 2 1 2 . 9 1 2 . 3 1 1 . 2 14. 1 1 3 . 6 1 4 . 0 1 4 . 6 1 5 . 4 1 4 . 6 1 2 . 8 11. 7 10. 1
1 3 . 4 15 . 5 1 6 . 0 1 4 . 0 13 . 8 1 3 . 2 1 2 . 2 1 5 . 0 1 4 . 6 1 5 . 0 1 5 . 6 1 6 . 4 1 5 . 7 1 4 . 0 1 2 . 9 11. 4
1 3 . 7 15. 7 1 6 . 2 1 4 . 3 14. 1 1 3 . 5 1 2 . 5 1 5 . 3 1 4 . 9 1 5 . 3 15 . 9 1 6 . 7 16 . 0 1 4 . 3 1 3 . 3 11. 8
1 3 . 9 1 5 . 9 1 6 . 4 14 . 5 1 4 . 3 1 3 . 7 1 2 . 7 1 5 . 5 15. 1 1 5 . 5 16. 1 1 6 . 8 1 6 . 2 1 4 . 6 13. 6 12. 1
1 4 . 4 1 6 . 4 1 6 . 9 1 5 . 0 1 4 . 8 1 4 . 3 1 3 . 4 16. 1 1 5 . 7 16. 1 1 6 . 7 1 7 . 5 1 6 . 8 1 5 . 3 14. 3 12. 9
1 4 . 9 1 6 . 8 17 . 3 1 5 . 5 1 5 . 3 14 . 8 1 3 . 9 16 . 6 1 6 . 2 16 . 6 1 7 . 2 1 8 . 0 1 7 . 4 15 . 9 1 5 . 0 13. 6
1 4 . 8 1 6 . 8 1 7 . 3 1 5 . 5 1 5 . 3 1 4 . 8 1 3 . 9 1 6 . 5 1 6 . 2 1 6 . 6 1 7 . 2 1 7 . 9 1 7 . 3 1 5 . 8 14. 9 13. 6
15. 1 1 7 . 0 1 7 . 5 1 5 . 7 15 . 6 15. 1 1 4 . 2 1 6 . 8 1 6 . 4 1 6 . 8 1 7 . 4 18. 1 1 7 . 5 16. 1 15. 3 14. 0
1 5 . 5 1 7 . 4 1 7 . 9 1 6 . 2 16 . 0 1 5 . 6 1 4 . 7 1 7 . 2 1 6 . 9 1 7 . 3 1 7 . 9 1 8 . 6 18 . 0 1 6 . 7 15 8 14. 6
1 5 . 0 1 6 . 9 1 7 . 3 15. 7 1 5 . 5 1 5 . 0 1 4 . 2 1 6 . 6 16 . 3 1 6 . 7 1 7 . 3 1 7 . 9 17 . 4 1 6 . 0 15. 2 14. 0
1 5 . 2 1 7 . 0 1 7 . 5 15. 8 15. 7 1 5 . 2 1 4 . 4 1 6 . 8 1 6 . 5 1 6 . 9 1 7 . 4 18. 1 1 7 . 5 16. 2 15. 4 14. 3
15. 1 1 6 . 8 17 . 3 15. 7 1 5 . 5 15. 1 1 4 . 2 1 6 . 6 1 6 . 3 1 6 . 6 1 7 . 2 1 7 . 8 1 7 . 3 1 6 . 0 15. 2 14. 1
1 4 . 6 1 6 . 3 16. 7 15. 1 1 5 . 0 1 4 . 5 1 3 . 7 1 6 . 0 1 5 . 7 1 6 . 0 1 6 . 5 17 . 2 1 6 . 6 15. 4 14. 6 13. 5
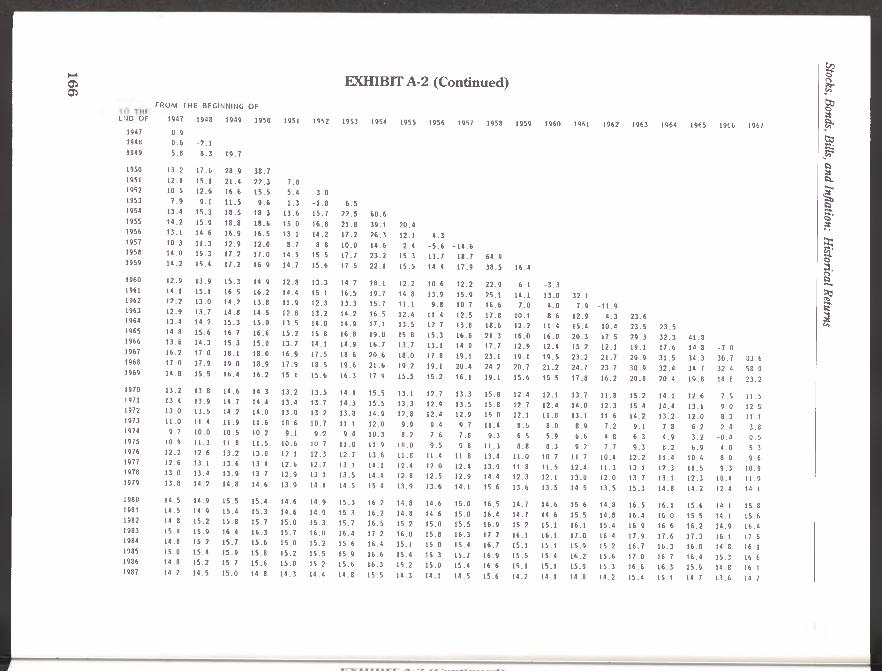
16
6 E X H IB IT A -2 (C o n tin u ed )
F R O M THE BEGINNING OF
E N D O F 1947 1948 1949 1950 1951 1952 1953 1954 1955 1956 1957 1958 1959 1960 1961 19621947 0 . 9
1948 - 0 . 6 - 2. 1
1949 5 . 8 8 . 3 1 9 . 7
1950 13. 2 17. 6 2 8 . 9 3 8 . 71951 12.1 15. 1 2 1 . 4 2 2 . 3 7 . 81952 1 0 . 5 12 . 6 1 6 . 6 1 5 . 5 5 . 4 3 . 01953 7 . 9 9 . 1 1 1 . 5 9 . 6 1 . 3 - 1 . 8 - 6 . 51954 1 3 . 4 1 5 . 3 1 8 . 5 1 8 . 3 1 3 . 6 1 5 . 7 2 2 . 5 6 0 . 61955 1 4 . 2 1 5 . 9 18 . 8 1 8 . 6 1 5 . 0 1 6 . 8 2 1 . 8 3 9 . 1 2 0 . 41956 13. 1 1 4 . 6 16 . 9 1 6 . 5 13. 1 14 . 2 1 7 . 2 2 6 . 3 12. 1 4 . 31957 10. 3 1 1 . 3 1 2 . 9 1 2 . 0 8 . 7 8 . 8 1 0 . 0 1 4 . 6 2 . 4 - 5 . 6 - 1 4 . 61958 1 4 . 0 1 5 . 3 1 7 . 2 1 7 . 0 1 4 . 5 1 5 . 5 1 7 . 7 2 3 . 2 1 5 . 3 13 . 7 1 8 . 7 6 4 . 91959 14. 2 15. 4 1 7 . 2 1 6 . 9 1 4 . 7 1 5 . 6 1 7 . 5 22. 1 1 5 . 5 1 4 . 4 17 . 9 3 8 . 5 16. 4
1960 1 2 . 9 1 3 . 9 1 5 . 3 14 . 9 1 2 . 8 1 3 . 3 14 . 7 18. 1 1 2 . 2 10. 6 1 2 . 2 2 2 . 9 6 . 1 - 3 . 31961 14. 1 15. 1 1 6 . 5 1 6 . 2 1 4 . 4 15. 1 16 . 5 19. 7 14. 8 1 3 . 9 1 5 . 9 25. 1 14. 1 1 3 . 0 32. 11962 12. 2 1 3 . 0 1 4 . 2 1 3 . 8 1 1 . 9 1 2 . 3 1 3 . 3 15 . 7 11. 1 9 . 8 1 0 . 7 1 6 . 6 7 . 0 4 . 0 7 . 9 - 1 1 . 91963 12 . 9 1 3 . 7 1 4 . 8 1 4 . 5 1 2 . 8 1 3 . 2 1 4 . 2 16 . 5 12. 4 1 1 . 4 1 2 . 5 1 7 . 8 10. 1 8 . 6 1 2 . 9 4 . 31964 13. 4 14 . 2 1 5 . 3 1 5 . 0 1 3 . 5 1 4 . 0 1 4 . 9 17. 1 13 . 5 1 2 . 7 13. 8 1 8 . 6 1 2 . 2 11 . 4 15. 4 10. 41965 1 4 . 8 15 . 6 1 6 . 7 1 6 . 6 1 5 . 2 1 5 . 8 1 6 . 8 1 9 . 0 15. 8 1 5 . 3 1 6 . 6 2 1 . 3 1 6 . 0 16 . 0 2 0 . 3 1 7 . 51966 13. 6 1 4 . 3 1 5 . 3 1 5 . 0 1 3 . 7 14. 1 1 4 . 9 16. 7 13. 7 13. 1 1 4 . 0 1 7 . 7 1 2 . 9 1 2 . 4 1 5 . 2 12. 11967 16. 2 1 7 . 0 18. 1 1 8 . 0 1 6 . 9 1 7 . 5 1 8 . 6 2 0 . 6 1 8 . 0 17. 8 19. 1 23 . 1 19. 1 1 9 . 5 2 3 . 2 2 1 . 71968 1 7 . 0 1 7 . 9 1 9 . 0 1 8 . 9 1 7 . 9 1 8 . 5 1 9 . 6 2 1 . 6 1 9 . 2 19. 1 2 0 . 4 2 4 . 2 2 0 . 7 2 1 . 2 2 4 . 7 2 3 . 71969 14. 8 1 5 . 5 16 . 4 1 6 . 2 15. 1 15 . 6 1 6 . 3 1 7 . 9 1 5 . 5 1 5 . 2 16. 1 19. 1 1 5 . 6 1 5 . 5 1 7 . 8 1 6 . 2
1970 1 3 . 2 1 3 . 8 1 4 . 6 1 4 . 3 1 3 . 2 13 . 5 14. 1 1 5 . 5 13. 1 1 2 . 7 1 3 . 3 15 . 8 1 2 . 4 12. 1 1 3 . 7 11 . 81971 13. 4 1 3 . 9 1 4 . 7 14. 4 1 3 . 4 1 3 . 7 1 4 . 3 1 5 . 5 1 3 . 3 1 2 . 9 1 3 . 5 15 . 8 1 2 . 7 12. 4 1 4 . 0 12 . 31972 1 3 . 0 1 3 . 5 1 4 . 2 1 4 . 0 1 3 . 0 1 3 . 2 13 . 8 1 4 . 9 12. 8 12. 4 1 2 . 9 1 5 . 0 12. 1 11. 8 13. 1 11 . 61973 1 1 . 0 1 1 . 4 1 1 . 9 11 . 6 1 0 . 6 1 0 . 7 11. 1 12 . 0 9 . 9 9 . 4 9 . 7 11 . 4 8 . 5 8 . 0 8 . 9 7 . 21974 9 . 7 1 0 . 0 1 0 . 5 1 0 . 2 9 . 1 9.-2 9 . 4 10 . 3 8 . 2 7 . 6 7 . 8 9 . 3 6 . 5 5 . 9 6 . 6 4 . 81975 10. 9 1 1 . 3 1 1 . 8 1 1 . 5 1 0 . 6 10. 7 1 1 . 0 11 . 9 1 0 . 0 9 . 5 9 . 8 1 1 . 3 8 . 8 8 . 3 9 . 2 7 . 71976 12 . 2 1 2 . 6 1 3 . 2 1 3 . 0 12. 1 12. 3 12. 7 13. 6 11. 8 11. 4 1 1 8 13. 4 1 1 . 0 10 . 7 1 1 . 7 10. 41977 12. 6 13. 1 1 3 . 6 1 3 . 4 12 . 6 1 2 . 7 13. 1 14.1 12. 4 1 2 . 0 12. 4 1 3 . 9 1 1 . 8 1 1 . 5 12. 4 11. 31978 1 3 . 0 13 . 4 1 3 . 9 1 3 . 7 12 . 9 13. 1 1 3 . 5 14. 4 12 . 8 12 . 5 12. 9 14. 4 1 2 . 3 12. 1 1 3 . 0 1 2 . 01979 13. 8 14 . 2 1 4 . 8 1 4 . 6 13 . 9 14. 1 14. 5 15. 4 13. 9 13 . 6 14. 1 1 5 . 6 1 3 . 6 1 3 . 5 14 . 5 1 3 . 5
1980 14. 5 1 4 . 9 1 5 . 5 1 5 . 4 1 4 . 6 1 4 . 9 1 5 . 3 1 6 . 2 14. 8 14. 6 15 . 0 1 6 . 5 1 4 . 7 1 4 . 6 15 . 6 1 4 . 81981 14. 5 1 4 . 9 15 . 4 1 5 . 3 1 4 . 6 14 . 9 1 5 . 3 16. 2 14. 8 1 4 . 6 15 . 0 16 . 4 1 4 . 7 1 4 . 6 1 5 . 5 14. 81982 14. 8 1 5 . 2 15 . 8 1 5 . 7 1 5 . 0 15 . 3 1 5 . 7 16. 5 1 5 . 2 1 5 . 0 1 5 . 5 16 . 9 1 5 . 2 15. 1 16. 1 15. 41983 15. 4 1 5 . 9 1 6 . 4 1 6 . 3 1 5 . 7 1 6 . 0 16. 4 1 7 . 2 16. 0 1 5 . 8 1 6 . 3 17 . 7 16. 1 16. 1 17. 0 16. 41984 14. 8 1 5 . 2 1 5 . 7 1 5 . 6 1 5 . 0 1 5 . 2 15 . 6 1 6 . 4 15. 1 1 5 . 0 15. 4 16 . 7 15. 1 15. 1 1 5 . 9 1 5 . 21985 15. 0 1 5 . 4 1 5 . 9 15 . 8 1 5 . 2 1 5 . 5 15 . 9 1 6 . 6 15. 4 1 5 . 3 1 5 . 7 1 6 . 9 15 . 5 1 5 . 4 1 6 . 2 1 5 . 61986 1 4 . 8 1 5 . 2 1 5 . 7 15 . 6 1 5 . 0 15. 2 1 5 . 6 1 6 . 3 15. 2 1 5 . 0 15. 4 1 6 . 6 15. 1 15. 1 1 5 . 9 1 5 . 31987 14. 2 1 4 . 5 1 5 . 0 1 4 . 8 1 4 . 3 14. 4 1 4 . 8 15. 5 1 4 . 3 14. 1 1 4 . 5 15. 6 14. 2 14. 1 1 4 . 8 14. 2
1963 1964
2 3 . 6
2 3 . 5 2 3 . 5
2 9 . 3 3 2 . 3
19. 1 1 7 . 6
2 9 . 9 3 1 . 5
3 0 . 9 3 2 . 4
2 0 . 8 2 0 . 4
1 5 . 2 14. 1
15. 4 14. 4
1 4 . 2 13 : 2
9 . 1 7 . 8
6 . 3 4 . 9
9 . 3 8 . 2
1 2 . 2 11 . 4
13. 1 1 2 . 3
1 3 . 7 13. 1
1 5 . 3 14 . 8
1 6 . 5 16. 1
1 6 . 4 1 6 . 0
1 6 . 9 1 6 . 6
1 7 . 9 1 7 . 6
1 6 . 7 1 6 . 3
1 7 . 0 1 6 . 7
16 . 6 1 6 . 3
15. 4 15. 1
1965 1966 1967
4 1 . 8
14. 8 - 7 . 0
3 4 . 3 3 0 . 7 83. 6
34 7 3 2 . 4 58. 0
1 9 . 8 14. 8 2 3 . 2
12 . 6 7 . 5 11. 5
13. 1 9 . 0 12 . 5
12 . 0 8 . 3 11. 1
6 . 2 2 . 4 3 . 8
3 . 2 - 0 . 4 0 . 5
6 . 9 4 . 0 5 . 3
10 . 4 8 . 0 9 . 6
1 1 . 5 9 . 3 10. 9
1 2 . 3 10. 4 11. 9
14. 2 12. 4 14. 1
15. 6 14.1 15. 8
15 . 5 14. 1 15. 6
16 . 2 14. 9 16. 4
17. 3 16. 1 17 6
16. 0 14. 8 16.1
16. 4 15. 3 16. 6
15. 9 14. 8 16 1
14. 7 13. 6 14. 7
Stocks, Bon
ds, Bills, an
d Inflation
: Historical R
eturn
s
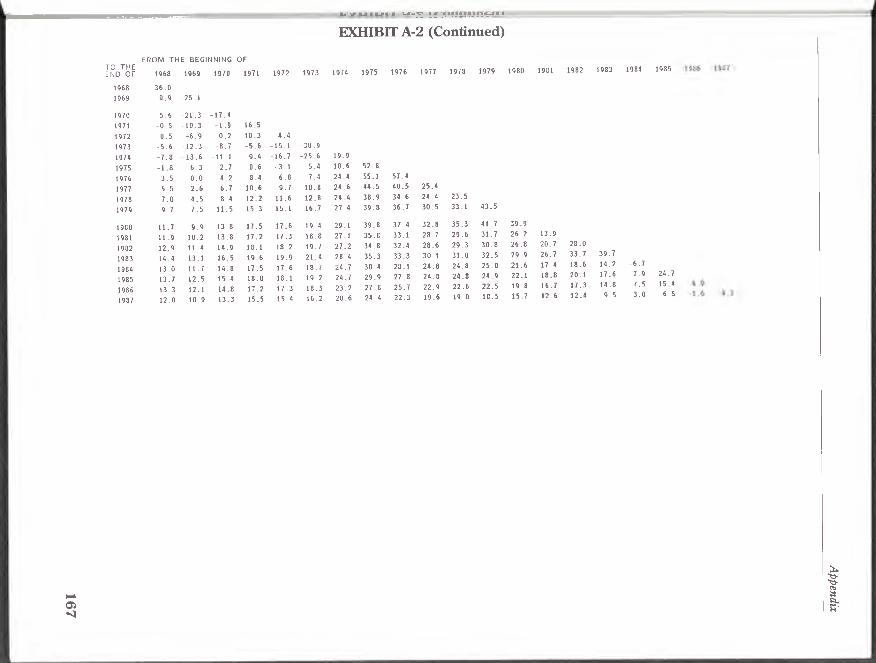
16
7
14'v u i l i i i v # - v ■ r - n n n u n c n 1
E X H IB IT A -2 (C o n tin u e d )
F R O M T H E B E G I N N I N G O F
T O T H E
E N D O F 1968 1969 1970 1971 1972 1973 1974 1975 1976 1977 1978 1979 1980 1981 1982 1983 1984 1985
1968 3 6 . 0
1969 0 . 9 - 2 5 . 1
1970 - 5 . 6 - 2 1 . 3 - 1 7 . 4
1971 - 0 . 5 - 1 0 . 3 - 1 . 9 1 6 . 5
1972 0 . 5 - 6 . 9 0 . 2 1 0 . 3 4 . 4
1973 - 5 . 6 - 1 2 . 3 - 8 . 7 - 5 . 6 - 15. 1 - 3 0 . 9
1974 - 7 . 8 1 3 . 6 - 1 1 . 1 - 9 . 4 - 1 6 . 7 - 2 5 . 6 - 1 9 . 9
1975 - 1 . 8 - 6 . 3 - 2 . 7 0 . 6 - 3 . 1 - 5 . 4 1 0 . 6 5 2 . 8
1976 3 . 5 0 . 0 4 . 2 8 . 4 6 . 8 7 . 4 2 4 . 4 5 5 . 1 5 7 . 4
1977 5 . 5 2 . 6 6 . 7 1 0 . 6 9 . 7 1 0 . 8 2 4 . 6 4 4 . 5 4 0 . 5 2 5 . 4
1978 7 . 0 4 . 5 8 . 4 1 2 . 2 1 1 . 6 1 2 . 8 2 4 . 4 3 8 . 9 3 4 . 6 2 4 . 4 2 3 . 5
1979 9 . 7 7 . 5 1 1 . 5 1 5 . 3 1 5 . 1 1 6 . 7 2 7 . 4 3 9 . 8 3 6 . 7 3 0 . 5 3 3 . 1 4 3 . 5
1980 1 1 . 7 9 . 9 1 3 . 8 1 7 . 5 1 7 . 6 1 9 . 4 29 . 1 3 9 . 8 3 7 . 4 3 2 . 8 3 5 . 3 4 1 . 7 3 9 . 9
1981 1 1 . 9 1 0 . 2 1 3 . 8 1 7 . 2 1 7 . 3 1 8 . 8 2 7 . 1 3 5 . 8 3 3 . 1 2 8 . 7 2 9 . 6 3 1 . 7 2 6 . 2 1 3 . 9
1982 1 2 . 9 1 1 . 4 1 4 . 9 1 8 . 1 1 8 . 2 19. 7 2 7 . 2 3 4 . 8 3 2 . 4 2 8 . 6 2 9 . 3 3 0 . 8 2 6 . 8 2 0 . 7 2 8 . 0
3 9 . 71983 1 4 . 4 13. 1 1 6 . 5 1 9 . 6 1 9 . 9 2 1 . 4 2 8 . 4 3 5 . 3 3 3 . 3 3 0 . 1 3 1 . 0 3 2 . 5 2 9 . 9 2 6 . 7 3 3 . 7
1984 1 3 . 0 11 . 7 1 4 . 8 1 7 . 5 1 7 . 6 1 8 . 7 2 4 . 7 3 0 . 4 2 8 . 1 2 4 . 8 2 4 . 8 2 5 . 0 2 1 . 6 1 7 . 4 1 8 . 6 1 4 . 2 - 6 . 7
2 4 . 71985 1 3 . 7 1 2 . 5 1 5 . 4 1 8 . 0 18. 1 1 9 . 2 2 4 . 7 2 9 . 9 2 7 . 8 2 4 . 8 2 4 . 8 2 4 . 9 2 2 . 1 1 8 . 8 2 0 . 1 1 7 . 6 7 . 9
1986 1 3 . 3 12. 1 14 . 8 1 7 . 2 1 7 . 3 1 8 . 3 2 3 . 2 2 7 . 8 2 5 . 7 2 2 . 9 2 2 . 6 2 2 . 5 1 9 . 8 1 6 . 7 1 7 . 3 1 4 . 8 7 . 5 1 5 . 4
1987 12 . 0 1 0 . 9 1 3 . 3 1 5 . 5 1 5 . 4 1 6 . 2 2 0 . 6 2 4 . 4 2 2 . 3 1 9 . 6 1 9 . 0 1 8 . 5 1 5 . 7 1 2 . 6 1 2 . 4 9 . 5 3 . 0 6 . 5
Appen
dix

168 EXHIBIT A-3LONG-TERM CORPORATE BONDS: TOTAL RETURNS
RATES OF RETURN FOR ALL YEARLY HOLDING PERIODS FROM 1926 TO 1987 (Percent Per Annum Compounded Annually)
F R O M THE BEGINNING OFT O T H E E N D O F 1926 1927 1928 1929 1930 1931 1932 1933 1934 1935 1936 1937 1938 1939 1940 1941 1942 1943 1944 1945 1946
1926 7 . 4
1927 7 . 4 7 . 4
1928 5 . 9 5 . 1 2 . 8
1929 5 . 2 4 . 5 3 . 1 3 . 3
1930 5 . 8 5 . 4 4 . 7 5 . 6 8 . 01931 4 . 4 3 . 9 3 . 0 3 . 1 2 . 9 - 1 . 91932 5 . 3 5 . 0 4 . 5 4 . 9 5 . 5 4 . 3 1 0 . 81933 6 . 0 5 . 8 5 . 5 6 . 0 6 . 7 6 . 3 1 0 . 6 10 . 41934 6 . 8 6 . 7 6 . 6 7 . 3 8 . 1 8 . 1 1 1 . 7 12 . 1 1 3 . 81935 7 . 1 7 . 0 7 . 0 7 . 6 8 . 3 8 . 4 1 1 . 2 1 1 . 3 1 1 . 7 9 . 61936 7 . 1 7 . 0 7 . 0 7 . 5 8 . 1 8 . 1 1 0 . 3 10 . 1 1 0 . 0 8 . 2 6 . 71937 6 . 7 6 . 6 6 . 5 7 . 0 7 . 4 7 . 4 9 . 0 8 . 6 8 . 2 6 . 3 4 . 7 2 . 71938 6 . 6 6 . 6 6 . 5 6 . 9 7 . 3 7 . 2 8 . 6 8 . 2 7 . 8 6 . 3 5 . 2 4 . 4 6 . 11939 6 . 4 6 . 4 6 . 3 6 . 6 6 . 9 6 . 8 8 . 0 7 . 6 7 . 1 5 . 8 4 . 9 4 . 3 5 . 0 4 . 0
1940 6 . 2 6 . 2 6 . 1 6 . 3 6 . 6 6 . 5 7 . 5 7 . 0 6 . 6 5 . 4 4 . 6 4 . 1 4 . 5 3 . 7 3 . 41941 6 . 0 5 . 9 5 . 8 6 . 1 6 . 3 6 . 1 7 . 0 6 . 6 6 . 1 5 . 0 4 . 3 3 . 8 4 . 0 3 . 4 3 . 1 2 . 71942 5 . 8 5 . 7 5 . 6 5 . 8 6 . 0 5 . 8 6 . 6 6 . 2 5 . 7 4 . 7 4 . 0 3 . 6 3 . 8 3 . 2 2 . 9 2 . 7 2 . 61943 5 . 6 5 . 5 5 . 4 5 . 6 5 . 8 5 6 6 . 3 5 . 8 5 . 4 4 . 5 3 . 9 3 . 5 3 . 6 3 . 1 2 . 9 2 . 7 2 . 7 2 . 81944 5 . 6 5 . 5 5 . 4 5 . 5 5 . 7 5 . 5 6 . 1 5 . 8 5 . 3 4 . 5 4 . 0 3 . 6 3 . 8 3 . 4 3 . 3 3 . 2 3 . 4 3 . 8 4 . 71945 5 . 5 5 . 4 5 . 3 5 . 5 5 . 6 5 . 4 6 . 0 5 . 6 5 . 2 4 . 5 4 . 0 3 . 7 3 . 8 3 . 5 3 . 4 3 . 4 3 . 6 3 . 9 4 . 4 4. 11946 5 . 3 5 . 2 5 . 1 5 . 3 5 . 4 5 . 2 5 . 7 5 . 3 5 . 0 4 . 3 3 . 8 3 . 5 3 . 6 3 . 3 3 . 2 3 . 1 3 . 2 3 . 3 3 . 5 2 . 9 1. 71947 5 . 0 4 . 9 4 . 7 4 . 8 4 . 9 4 . 7 5 . 2 4 . 8 4 . 4 3 . 7 3 . 3 2 . 9 3 . 0 2 . 6 2 . 4 2 . 3 2 . 2 2 . 2 2 . 0 1. 1 - 0 . 31948 4 . 9 4 . 8 4 . 7 4 . 8 4 . 9 4 . 7 5 . 1 4 . 8 4 . 4 3 . 8 3 . 3 3 . 0 3 . 1 2 . 8 2 . 6 2 . 5 2 . 5 2 . 5 2 . 4 1 . 9 1 11949 4 . 9 4 . 8 4 . 6 4 . 7 4 . 8 4 . 6 5 . 0 4 . 7 4 . 3 3 . 7 3 . 3 3 . 1 3 . 1 2 . 8 2 . 7 2 . 6 2 . 6 2 . 6 2 . 6 2 . 2 1 . 7
1950 4 . 8 4 . 7 4 . 5 4 . 6 4 . 7 4 . 5 4 . 9 4 . 5 4 . 2 3 . 6 3 . 2 3 . 0 3 . 0 2 . 8 2 . 6 2 . 6 2 . 6 2 . 6 2 . 5 2 . 1 1. 81951 4 . 5 4 . 3 4 . 2 4 . 3 4 . 3 4 . 2 4 . 5 4 . 1 3 . 8 3 . 2 2 . 9 2 . 6 2 . 6 2 . 3 2 . 2 2 . 1 2 . 0 2 . 0 1 . 8 1 . 4 1 . 01952 4 . 4 4 . 3 4 . 2 4 . 2 4 . 3 4 . 1 4 . 4 4 . 1 3 . 8 3 . 3 2 . 9 2 . 7 2 . 7 2 . 4 2 . 3 2 . 2 2 . 2 2 . 1 2 . 0 1 . 7 1 . 41953 4 . 4 4 . 3 4 . 2 4 . 2 4 . 3 4 . 1 4 . 4 4 . 1 3 . 8 3 . 3 2 . 9 2 . 7 2 . 7 2 . 5 2 . 4 2 . 3 2 . 3 2 . 2 2 . 2 1 . 9 1. 61954 4 . 4 4 . 3 4 . 2 4 . 3 4 . 3 4 . 2 4 . 4 4 . 1 3 . 8 3 . 4 3 . 1 2 . 9 2 . 9 2 . 7 2 . 6 2 . 5 2 . 5 2 . 5 2 . 5 2 . 2 2 . 01955 4 . 3 4 . 2 4 . 1 4 . 1 4 . 2 4 . 0 4 . 3 4 . 0 3 . 7 3 . 2 2 . 9 2 . 7 2 . 7 2 . 5 2 . 4 2 . 4 2 . 4 2 . 3 2 . 3 2. 1 1 . 91956 3 . 9 3 . 8 3 . 7 3 . 7 3 . 7 3 . 6 3 . 8 3 . 5 3 . 2 2 . 8 2 . 4 2 . 2 2 . 2 2 . 0 1 . 9 1 . 8 1 . 7 1 . 6 1 . 6 1 . 3 1 11957 4 . 1 4 . 0 3 . 8 3 . 9 3 . 9 3 . 7 4 . 0 3 . 7 3 . 4 3 . 0 2 . 7 2 . 5 2 . 5 2 . 3 2 . 2 2 . 2 2 . 1 2 . 1 2 . 1 1 . 9 1. 71958 3 . 9 3 . 8 3 . 6 3 . 7 3 . 7 3 . 5 3 . 7 3 . 5 3 . 2 2 . 8 2 . 5 2 . 3 2 . 3 2 . 1 2 . 0 1 . 9 1 . 9 1 . 8 1 . 8 1 . 6 1. 41959 3 . 7 3 . 6 3 . 5 3 . 5 3 . 5 3 . 4 3 . 6 3 . 3 3 . 0 2 . 6 2 . 3 2 . 2 2 . 1 1 . 9 1 . 8 1 . 8 1 . 7 1 . 7 1 .6 1 . 4 1 2
Stocks, Bon
ds, Bills, an
d Inflation
: Historical R
eturn
s

16
9
EXHIBIT A-3 (Continued)
F R O M T H E B E G I N N I N G O F
T O T H E
E N D O F 1926 1927 1928 1929 1930 1931 1932 1933 1934 1935 1936 1937 1938
1960 3 . 9 3 . 8 3 . 7 3 . 7 3 . 7 3 . 6 3 . 7 3 . 5 3 . 3 2 . 9 2 . 6 2 . 4 2 . 4
1961 3 . 9 3 . 8 3 . 7 3 . 7 3 . 7 3 . 6 3 . 8 3 . 5 3 . 3 2 . 9 2 . 7 2 . 5 2 . 5
1962 4 . 0 3 . 9 3 . 8 3 . 8 3 . 9 3 . 7 3 . 9 3 . 7 3 . 5 3 . 1 2 . 9 2 . 7 2 . 7
1963 4 . 0 3 . 9 3 . 8 3 . 8 3 . 8 3 . 7 3 . 9 3 . 6 3 . 4 3 . 1 2 . 9 2 . 7 2 . 7
1964 4 . 0 3 . 9 3 . 8 3 . 8 3 . 8 3 . 7 3 . 9 3 . 7 3 . 5 3 . 1 2 . 9 2 . 8 2 . 8
1965 3 . 9 3 . 8 3 . 7 3 . 7 3 . 7 3 . 6 3 . 8 3 . 6 3 . 3 3 . 0 2 . 8 2 . 7 2 . 7
1966 3 . 8 3 . 7 3 . 6 3 . 6 3 . 6 3 . 5 3 . 7 3 . 5 3 . 2 2 . 9 2 . 7 2 . 6 2 . 6
1967 3 . 6 3 . 5 3 . 4 3 . 4 3 . 4 3 . 3 3 . 4 3 . 2 3 . 0 2 . 7 2 . 5 2 . 3 2 . 3
1968 3 . 5 3 . 4 3 . 3 3 . 4 3 . 4 3 . 2 3 . 4 3 . 2 3 . 0 2 . 7 2 . 5 2 . 3 2 . 3
1969 3 . 3 3 . 2 3 . 1 3 . 1 3 . 1 2 . 9 3 . 1 2 . 9 2 . 7 2 . 4 2 . 2 2 . 0 2 . 0
1970 3 . 6 3 . 5 3 . 4 3 . 4 3 . 4 3 . 3 3 . 4 3 . 2 3 . 1 2 . 8 2 . 6 2 . 5 2 . 5
1971 3 . 7 3 . 6 3 . 6 3 . 6 3 . 6 3 . 5 3 . 6 3 . 4 3 . 3 3 . 0 2 . 8 2 . 7 2 . 7
1972 3 . 8 3 . 7 3 . 6 3 . 7 3 . 7 3 . 6 3 . 7 3 . 5 3 . 4 3 . 1 2 . 9 2 . 8 2 . 8
1973 3 . 7 3 . 7 3 . 6 3 . 6 3 . 6 3 . 5 3 . 6 3 . 5 3 . 3 3 . 0 2 . 9 2 . 8 2 . 8
1974 3 . 6 3 . 5 3 . 4 3 . 4 3 . 5 3 . 4 3 . 5 3 . 3 3 . 1 2 . 9 2 . 7 2 . 6 2 . 6
1975 3 . 8 3 . 7 3 . 7 3 . 7 3 . 7 3 . 6 3 . 7 3 . 6 3 . 4 3 . 2 3 . 0 2 . 9 2 . 9
1976 4 . 1 4 . 0 3 . 9 4 . 0 4 . 0 3 . 9 4 . 0 3 . 9 3 . 7 3 . 5 3 . 4 3 . 3 3 . 3
1977 4 . 0 4 . 0 3 . 9 3 . 9 3 . 9 3 . 9 4 . 0 3 . 8 3 . 7 3 . 5 3 . 3 3 . 2 3 . 2
1978 4 . 0 3 . 9 3 . 8 3 . 8 3 . 9 3 . 8 3 . 9 3 . 7 3 . 6 3 . 4 3 . 2 3 . 2 3 . 2
1979 3 . 8 3 . 7 3 . 7 3 . 7 3 . 7 3 6 3 . 7 3 . 6 3 . 4 3 . 2 3 . 1 3 . 0 3 . 0
1980 3 . 7 3 . 6 3 . 5 3 . 6 3 . 6 3 . 5 3 . 6 3 . 4 3 . 3 3 . 1 2 . 9 2 . 8 2 . 9
1981 3 . 6 3 . 5 3 . 5 3 . 5 3 . 5 3 . 4 3 . 5 3 . 3 3 . 2 3 . 0 2 . 8 2 . 8 2 . 8
1982 4 . 2 4 . 1 4 . 1 4 . 1 4 . 1 4 . 0 4 . 2 4 . 0 3 . 9 3 . 7 3 . 6 3 . 5 3 . 5
1983 4 . 2 4 . 1 4 . 1 4 . 1 4 . 1 4 . 1 4 . 2 4 . 0 3 . 9 3 . 7 3 . 6 3 . 5 3 . 6
1984 4 . 4 4 . 3 4 . 3 4 . 3 4 . 3 4 . 3 4 . 4 4 . 3 4 . 2 4 . 0 3 . 9 3 . 8 3 . 8
1985 4 . 8 4 . 7 4 . 7 4 . 7 4 . 8 4 . 7 4 . 8 4 . 7 4 . 6 4 . 4 4 . 3 4 . 3 4 . 3
1986 5 . 0 5 . 0 4 . 9 5 . 0 5 . 0 5 . 0 5 . 1 5 . 0 4 . 9 4 . 7 4 . 6 4 . 6 4 . 6
1987 4 . 9 4 . 9 4 . 9 4 . 9 4 . 9 4 . 9 5 . 0 4 . 9 4 . 8 4 . 6 4 . 5 4 . 5 4 . 5
/
1939 1940 1941 1942
2 . 3 2 . 2 2 . 1 2 . 1
2 . 4 2 . 3 2 . 2 2 . 2
2 . 6 2 . 5 2 . 5 2 . 5
2 . 6 2 . 5 2 . 5 2 . 5
2 . 7 2 . 6 2 . 6 2 . 6
2 . 5 2 . 5 2 . 5 2 . 4
2 . 5 2 . 4 2 . 4 2 . 4
2 . 2 2 . 1 2 . 1 2 . 1
2 . 2 2 . 2 2 . 1 2 . 1
1 . 9 1 . 8 1 . 7 1 . 7
2 . 3 2 . 3 2 . 3 2 . 2
2 . 6 2 . 6 2 . 5 2 . 5
2 . 7 2 . 7 2 . 7 2 . 7
2 . 7 2 . 6 2 . 6 2 . 6
2 . 5 2 . 5 2 . 4 2 . 4
2 . 8 2 . 8 2 . 8 2 . 8
3 . 2 3 . 2 3 . 2 3 . 2
3 . 2 3 . 2 3 . 1 3 . 2
3 . 1 3 . 1 3 . 1 3 . 1
2 . 9 2 . 9 2 . 9 2 . 9
2 . 8 2 . 7 2 . 7 2 . 7
2 . 7 2 . 7 2 . 6 2 . 6
3 . 5 3 . 5 3 . 5 3 . 5
3 . 5 3 . 5 3 . 5 3 . 5
3 . 8 3 . 8 3 . 8 3 . 8
4 . 3 4 . 3 4 . 3 4 . 3
4 . 6 4 . 6 4 . 6 4 . 7
4 . 5 4 . 5 4 . 5 4 . 6
1943 1944 1945 1946
2 . 1 2 . 0 1 . 8 1 . 7
2 . 2 2 . 2 2 . 0 1 . 9
2 . 5 2 . 5 2 . 3 2 . 2
2 . 5 2 . 5 2 . 3 2 . 2
2 . 6 2 . 6 2 . 5 2 . 4
2 . 4 2 . 4 2 . 3 2 . 2
2 . 3 2 . 3 2 . 2 2. 1
2 . 0 2 . 0 1 . 9 1 . 8
2 . 1 2 . 0 1 . 9 1 . 8
1 . 7 1 . 6 1 . 5 1. 4
2 . 2 2 . 2 2 . 1 2 . 0
2 . 5 2 . 5 2 . 4 2 . 4
2 . 7 2 . 7 2 . 6 2 . 5
2 . 6 2 . 6 2 . 5 2 . 5
2 . 4 2 . 4 2 . 3 2 . 3
2 . 8 2 . 8 2 . 7 2 . 7
3 . 2 3 . 2 3 . 2 3 . 2
3 . 2 3 . 2 3 . 1 3 . 1
3 . 1 3 . 1 3 . 0 3 . 0
2 . 9 2 . 9 2 . 8 2 . 8
2 . 7 2 . 7 2 . 7 2 . 6
2 . 6 2 . 6 2 . 6 2 . 5
3 . 5 3 . 5 3 . 5 3 . 5
3 . 5 3 . 6 3 . 5 3 . 5
3 . 8 3 . 8 3 . 8 3 . 8
4 . 4 4 . 4 4 . 4 4 . 4
4 . 7 4 . 8 4 . 8 4 . 8
4 . 6 4 . 6 4 . 6 4 . 7
Appen
dix

17
0 E X H IB IT A -3 (C o n tin u ed )
F R O M T H E B E G I N N I N G O FT O T H E E N D O F 1947 1948 1949 1950 1951 1952 1953 1954 1955 1956 1957 1958 1959 1960 1961 1962 1963 1964 1965 1966 1967
1947 - 2 . 3
1948 0 . 8 4 . 1
1949 1 . 7 3 . 7 3 . 3
1950 1 . 8 3 . 2 2 . 7 2 . 11951 0 . 9 1 . 7 0 . 9 - 0 . 3 - 2 . 71952 1 . 3 2 . 0 1 . 5 0 . 9 0 . 4 3 . 51953 1 . 6 2 . 3 1 . 9 1 . 6 1 . 4 3 . 5 3 . 41954 2 . 1 2 . 7 2 . 5 2 . 3 2 . 4 4 . 1 4 . 4 5 . 41955 1 .9 2 . 4 2 . 2 2 . 0 2 . 0 3 . 2 3 . 1 2 . 9 0 . 51956 1.0 1 . 4 1.0 0 . 7 0 . 5 1. 1 0 . 5 - 0 . 4 - 3 . 2 - 6 . 81957 1 . 7 2 . 1 1 . 8 1 . 7 1 . 6 2 . 3 2 . 1 1 . 8 0 . 6 0 . 7 8 . 71958 1 . 3 1 . 7 1 . 4 1 . 2 1. 1 1 . 7 1 . 4 1 . 0 - 0 . 1 - 0 . 3 3 . 1 - 2 . 21959 1 . 2 1 . 5 1 . 2 1.0 0 . 9 1 . 3 1.0 0 . 6 - 0 . 3 - 0 . 5 1 . 7 - 1 . 6 - 1 . 0
1960 1 . 7 2 . 0 1 . 8 1 . 7 1 . 7 2 . 2 2 . 0 1 . 8 1 . 2 1 . 4 3 . 5 1 . 8 3 . 9 9 . 11961 1 . 9 2 . 2 2 . 1 2 . 0 2 . 0 2 . 4 2 . 3 2 . 2 1 . 7 1 . 9 3 . 8 2 . 6 4 . 2 6 . 9 4 . 81962 2 . 3 2 . 6 2 . 5 2 . 4 2 . 4 2 . 9 2 . 9 2 . 8 2 . 5 2 . 8 4 . 5 3 . 6 5 . 1 7 . 3 6 . 4 7 . 91963 2 . 3 2 . 6 2 . 5 2 . 4 2 . 4 2 . 9 2 . 8 2 . 7 2 . 4 2 . 7 4 . 1 3 . 4 4 . 5 6 . 0 5 . 0 5 . 0 2 . 21964 2 . 4 2 . 7 2 . 6 2 . 6 2 . 6 3 . 0 3 . 0 2 . 9 2 . 7 2 . 9 4 . 2 3 . 6 4 . 6 5 . 7 4 . 9 4 . 9 3 . 5 4 . 81965 2 . 3 2 . 5 2 . 4 2 . 4 2 . 4 2 . 8 2 . 7 2 . 6 2 . 4 2 . 6 3 . 7 3 . 1 3 . 8 4 . 7 3 . 8 3 . 6 2 . 1 2. 1 - 0 . 51966 2 . 1 2 . 4 2 . 3 2 . 2 2 . 2 2 . 6 2 . 5 2 . 4 2 . 2 2 . 4 3 . 3 2 . 7 3 . 4 4 . 0 3 . 2 2 . 9 1 . 7 1 . 5 - 0 . 1 0 . 21967 1 . 8 2 . 0 1 . 9 1 . 8 1 . 8 2 . 1 2 . 0 1 . 9 1 . 6 1 . 7 2 . 5 1 . 9 2 . 4 2 . 9 2 . 0 1 . 5 0 . 3 - 0 . 2 - 1 . 8 - 2 . 4 - 5 . 01968 1 . 8 2 . 0 1 . 9 1 . 9 1 . 8 2 . 1 2 . 0 1 . 9 1 . 7 1 . 8 2 . 5 2 . 0 2 . 4 2 . 8 2 . 1 1 . 7 0 . 7 0 . 4 - 0 . 7 - 0 . 8 - 1 . 31969 1 . 4 1 . 6 1 . 4 1 . 3 1 . 3 1 . 5 1 . 4 1 . 3 1.0 1. 1 1 . 7 1. 1 1 . 4 1 . 7 0 . 9 0 . 4 - 0 . 6 - 1. 1 - 2 . 2 - 2 . 7 - 3 . 6
1970 2 . 0 2 . 2 2 . 1 2 . 1 2 . 1 2 . 3 2 . 3 2 . 2 2 . 0 2 . 1 2 . 8 2 . 4 2 . 7 3 . 1 2 . 5 2 . 3 1 . 6 1 . 5 0 . 9 1 . 2 1 . 51971 2 . 4 2 . 6 2 . 5 2 . 5 2 . 5 2 . 8 2 . 7 2 . 7 2 . 5 2 . 7 3 . 3 3 . 0 3 . 4 3 . 7 3 . 3 3 . 1 2 . 6 2 . 6 2 . 3 2 . 8 3 . 31972 2 . 6 2 . 8 2 . 7 2 . 7 2 . 7 3 . 0 2 . 9 2 . 9 2 . 8 2 . 9 3 . 6 3 . 2 3 . 6 4 . 0 3 . 6 3 . 5 3 . 0 3. 1 2 . 9 3 . 4 4 . 01973 2 . 5 2 . 7 2 . 6 2 . 6 2 . 6 2 . 9 2 . 9 2 . 8 2 . 7 2 . 8 3 . 4 3 . 1 3 . 5 3 . 8 3 . 4 3 . 3 2 . 9 2 . 9 2 . 7 3 . 1 3 . 61974 2 . 3 2 . 5 2 . 4 2 . 4 2 . 4 2 . 6 2 . 6 2 . 5 2 . 4 2 . 5 3 . 1 2 . 7 3 . 0 3 . 3 2 . 9 2 . 8 2 . 4 2 . 4 2 . 1 2 . 4 2 . 71975 2 . 7 2 . 9 2 . 9 2 . 8 2 . 9 3 . 1 3 . 1 3 . 1 3 . 0 3 . 1 3 . 6 3 . 4 3 . 7 4 . 0 3 . 7 3 . 6 3 . 3 3 . 3 3 . 2 3 . 6 4 . 01976 3 . 2 3 . 4 3 . 4 3 . 4 3 . 4 3 . 7 3 . 7 3 . 7 3 . 6 3 . 8 4 . 3 4 . 1 4 . 5 4 . 8 4 . 5 4 . 5 4 . 3 4 . 4 4 . 4 4 . 9 5 . 41977 3 . 2 3 . 3 3 . 3 3 . 3 3 . 4 3 . 6 3 . 6 3 . 6 3 . 5 3 . 7 4 . 2 4 . 0 4 . 3 4 . 6 4 . 4 4 . 3 4 . 1 4 . 2 4 . 2 4 . 6 5 . 01978 3 . 1 3 . 2 3 . 2 3 . 2 3 . 2 3 . 5 3 . 5 3 . 5 3 . 4 3 . 5 4 . 0 3 . 8 4 . 1 4 . 4 4 . 1 4 . 1 3 . 8 4 . 0 3 . 9 4 . 2 4 . 61979 2 . 8 3 . 0 3 . 0 2 . 9 3 . 0 3 . 2 3 . 2 3 . 2 3 . 1 3 . 2 3 . 6 3 . 4 3 . 7 3 . 9 3 . 7 3 . 6 3 . 4 3 . 4 3 . 3 3 . 6 3 . 9
1980 2 . 7 2 . 8 2 . 8 2 . 8 2 . 8 3 . 0 3 . 0 2 . 9 2 . 8 2 . 9 3 . 4 3. 1 3 . 4 3 . 6 3 . 3 3 . 3 3 . 0 3 . 1 3 . 0 3 . 2 3 . 41981 2 . 6 2 . 7 2 . 7 2 . 6 2 . 7 2 . 8 2 . 8 2 . 8 2 . 7 2 . 8 3 . 2 3 . 0 3 . 2 3 . 4 3 . 1 3 . 1 2 . 8 2 . 8 2 . 7 2 . 9 3 . 11982 3 . 5 3 . 7 3 . 7 3 . 7 3 . 7 4 . 0 4 . 0 4 . 0 3 . 9 4 . 1 4 . 5 4 . 4 4 . 6 4 . 9 4 . 7 4 . 7 4 . 5 4 . 7 4 . 7 5 . 0 5 . 31983 3 . 6 3 . 7 3 . 7 3 . 7 3 . 8 4 . 0 4 . 0 4 . 0 4 . 0 4 . 1 4 . 5 4 . 4 4 . 6 4 . 9 4 . 7 4 . 7 4 . 5 4 . 7 4 . 7 5 . 0 5 . 21984 3 . 9 4 . 0 4 . 0 4 . 1 4 . 1 4 . 3 4 . 4 4 . 4 4 . 4 4 . 5 4 . 9 4 . 8 5. 1 5 . 3 5 . 2 5 . 2 5. 1 5 . 2 5 . 2 5 . 5 5 . 81985 4 . 5 4 . 7 4 . 7 4 . 7 4 . 8 5 . 0 5 . 1 5 . 1 5 . 1 5 . 3 5 . 7 5 . 6 5 . 9 6 . 2 6 . 1 6 . 1 6 . 1 6 . 2 6 . 3 6 . 7 7 . 01986 4 . 9 5 . 0 5 . 1 5 . 1 5 . 2 5 . 4 5 . 5 5 . 6 5 . 6 5 . 7 6 . 2 6. 1 6 . 4 6 . 7 6 . 6 6 . 7 6 . 6 6 . 8 6 . 9 7 . 3 7 . 61987 4 . 7 4 . 9 4 . 9 5 . 0 5 . 0 5 . 3 5 . 3 5 . 4 5 . 4 5 . 5 6 . 0 5 . 9 6 . 2 6 . 4 6 . 3 6 . 4 6 . 3 6 . 5 6 . 6 6 . 9 7 . 2
Stocks, Bonds, B
ills, an
d Inflation: H
istorical Returns
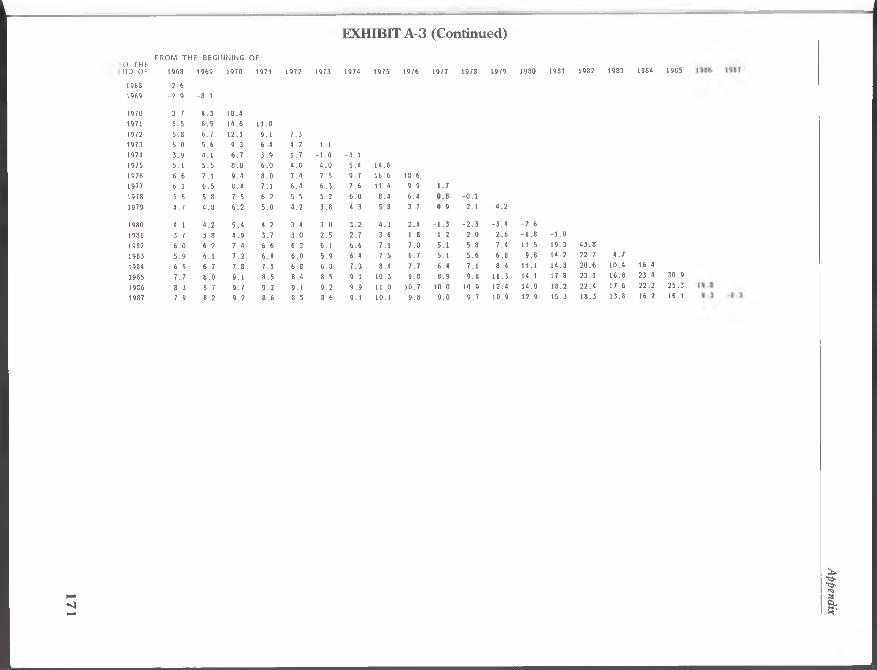
17
1
EXHIBIT A-3 (Continued)
F R O M T H E B E G I N N I N G O F
O T H EN D O F 1968 1969 1970 1971 1972 1973 1974 1975 1976 1977 1978 1979 1980 1981 1982 1983 1984 1985
1968 2 . 6
1969 - 2 . 9 - 8 . 1
1970 3 . 7 4 . 3 1 8 . 4
1971 5 . 5 6 . 5 1 4 . 6 1 1 . 0
1972 5 . 8 6 . 7 1 2 . 1 9 . 1 7 . 3
1973 5 . 0 5 . 6 9 . 3 6 . 4 4 . 2 1.1
1974 3 . 9 4 . 1 6 . 7 3 . 9 1 . 7 - 1 . 0 - 3 . 1
1975 5 . 1 5 . 5 8 . 0 6 . 0 4 . 8 4 . 0 5 . 4 1 4 . 6
1976 6 . 6 7 . 1 9 . 4 8 . 0 7 . 4 7 . 5 9 . 7 1 6 . 6 18 . 6
1977 6 . 1 6 . 5 8 . 4 7 . 1 6 . 4 6 . 3 7 . 6 1 1 . 4 9 . 9 1 . 7
1978 5 . 5 5 . 8 7 . 5 6 . 2 5 . 5 5 . 2 6 . 0 8 . 4 6 . 4 0 . 8 - 0 . 1
1979 4 . 7 4 . 8 6 . 2 5 . 0 4 . 2 3 . 8 4 . 3 5 . 8 3 . 7 - 0 . 9 - 2 . 1 - 4 . 2
1980 4 . 1 4 . 2 5 . 4 4 . 2 3 . 4 3 . 0 3 . 2 4 . 3 2 . 4 - 1 . 3 - 2 . 3 - 3 . 4 - 2 . 6
1981 3 . 7 3 . 8 4 . 9 3 . 7 3 . 0 2 . 5 2 . 7 3 . 6 1 . 8 - 1 . 2 - 2 . 0 - 2 . 6 - 1 . 8 - 1 . 0
1982 6 . 0 6 . 2 7 . 4 6 . 6 6 . 2 6 . 1 6 . 6 7 . 9 7 . 0 5 . 1 5 . 8 7 . 4 1 1 . 5 1 9 . 3 4 3 . 8
1983 5 . 9 6 . 1 7 . 2 6 . 4 6 . 0 5 . 9 6 . 4 7 . 5 6 . 7 5 . 1 5 . 6 6 . 8 9 . 8 1 4 . 2 2 2 . 7 4 . 7
1984 6 . 5 6 . 7 7 . 8 7 . 1 6 . 8 6 . 8 7 . 3 8 . 4 7 . 7 6 . 4 7 . 1 8 . 4 11 . 1 1 4 . 8 2 0 . 6 1 0 . 4 1 6 . 4
1985 7 . 7 8 . 0 9 . 1 8 . 5 8 . 4 8 . 5 9 . 1 1 0 . 3 9 . 8 8 . 9 9 . 8 1 1 . 3 14. 1 1 7 . 8 2 3 . 1 1 6 . 8 2 3 . 4 3 0 . 9
1986 8 . 3 8 . 7 9 . 7 9 . 2 9 . 1 9 . 2 9 . 9 1 1 . 0 1 0 . 7 1 0 . 0 1 0 . 9 12 . 4 1 4 . 9 18 . 2 2 2 . 4 1 7 . 6 2 2 . 2 2 5 . 3
1987 7 . 9 8 . 2 9 . 2 8 . 6 8 . 5 8 . 6 9 . 1 10. 1 9 . 8 9 . 0 9 . 7 1 0 . 9 1 2 . 9 15 . 3 1 8 . 3 13 . 8 1 6 . 2 16. 1
Appen
dix

17
2 E X H IB IT A -4LO NG -TERM G O V E R N M EN T B O N D S : TOTAL R E T U R N S
RATES O F R E T U R N F O R A LL Y EARLY H O L D IN G P E R IO D S FR O M 1 9 2 6 TO 1 9 8 7
(P e r c e n t P e r A n n u m C o m p o u n d e d A n n u a lly )
F R O M T H E B E G I N N I N G O FT O T H E E N D O F 1926 1927 1928 1929 1930 1931 1932 1933 1934 1935 1936 1937 1938 1939 1940 1941 1942 1943 1944 1945 1946
1926 7 . 8
1927 8 . 3 8 . 9
1928 5 . 5 4 . 4 0 . 1
1929 5 . 0 4 . 1 1 . 7 3 . 4
1930 4 . 9 4 . 2 2 . 7 4 . 0 4 . 71931 3 . 1 2 . 2 0 . 6 0 . 8 - 0 . 5 - 5 . 31932 5 . 0 4 . 5 3 . 7 4 . 6 5 . 0 5 . 2 1 6 . 81933 4 . 4 3 . 9 3 . 1 3 . 7 3 . 7 3 . 4 8 . 1 - 0 . 11934 5 . 0 4 . 6 4 . 0 4 . 7 4 . 9 5 . 0 8 . 7 4 . 9 10 . 01935 5 . 0 4 . 7 4 . 1 4 . 7 5 . 0 5 . 0 7 . 8 4 . 9 7 . 5 5 . 01936 5 . 2 4 . 9 4 . 5 5 . 1 5 . 3 5 . 4 7 . 7 5 . 5 7 . 5 6 . 2 7 . 51937 4 . 8 4 . 5 4 . 1 4 . 5 4 . 7 4 . 7 6 . 4 4 . 5 5 . 6 4 . 2 3 . 8 0 . 21938 4 . 8 4 . 6 4 . 2 4 . 6 4 . 8 4 . 8 6 . 3 4 . 6 5 . 6 4 . 5 4 . 4 2 . 8 5 . 51939 4 . 9 4 . 7 4 . 3 4 . 7 4 . 9 4 . 9 6 . 3 4 . 8 5 . 7 4 . 8 4 . 8 3 . 9 5 . 7 5 . 9
1940 5 . 0 4 . 8 4 . 5 4 . 9 5 . 0 5 . 0 6 . 2 5 . 0 5 . 7 5 . 0 5 . 0 4 . 4 5 . 9 6 . 0 6 . 11941 4 . 7 4 . 5 4 . 2 4 . 5 4 . 6 4 . 6 5 . 7 4 . 5 5. 1 4 . 4 4 . 3 3 . 7 4 . 6 4 . 3 3 . 5 0 . 91942 4 . 6 4 . 4 4 . 2 4 . 5 4 . 5 4 . 5 5 . 5 4 . 4 4 . 9 4 . 3 4 . 2 3 . 6 4 . 3 4 . 0 3 . 4 2 . 1 3 . 21943 4 . 5 4 . 3 4 . 0 4 . 3 4 . 4 4 . 3 5 . 2 4 . 2 4 . 6 4 . 0 3 . 9 3 . 4 3 . 9 3 . 6 3 . 1 2 . 1 2 . 6 2 . 11944 4 . 4 4 . 2 4 . 0 4 . 2 4 . 3 4 . 2 5 . 0 4 . 1 4 . 4 3 . 9 3 . 8 3 . 3 3 . 8 3 . 5 3 . 0 2 . 3 2 . 7 2 . 4 2 . 81945 4 . 7 4 . 6 4 . 3 4 . 6 4 . 6 4 . 6 5 . 4 4 . 6 5 . 0 4 . 5 4 . 5 4 . 1 4 . 6 4 . 5 4 . 3 3 . 9 4 . 7 5 . 1 6 . 7 1 0 . 71946 4 . 5 4 . 3 4 . 1 4 . 3 4 . 4 4 . 3 5 . 0 4 . 2 4 . 6 4 . 1 4 . 0 3 . 7 4 . 1 3 . 9 3 . 6 3 . 2 3 . 7 3 . 8 4 . 4 5 . 2 - 0. 11947 4 . 1 4 . 0 3 . 7 3 . 9 4 . 0 3 . 9 4 . 5 3 . 8 4 . 0 3 . 6 3 . 5 3 . 1 3 . 4 3 . 2 2 . 8 2 . 4 2 . 6 2 . 5 2 . 6 2 . 5 - 1.41948 4 . 1 4 . 0 3 . 7 3 . 9 3 . 9 3 . 9 4 . 5 3 . 7 4 . 0 3 . 6 3 . 5 3. 1 3 . 4 3 . 2 2 . 9 2 . 5 2 . 7 2 . 6 2 . 7 2 . 7 0 . 21949 4 . 2 4 . 1 3 . 8 4 . 0 4 T 4 . 0 4 . 6 3 . 9 4 . 1 3 . 8 3 . 7 3 . 4 3 . 6 3 . 5 3 . 2 2 . 9 3 . 2 3 . 2 3 . 4 3 . 5 1 . 7
1950 4 . 0 3 . 9 3 . 7 3 . 8 3 . 9 3 . 8 4 . 3 3 . 7 3 . 9 3 . 5 3 . 4 3 . 1 3 . 4 3 . 2 2 . 9 2 . 6 2 . 8 2 . 8 2 . 9 2 . 9 1. 41951 3 . 7 3 . 6 3 . 3 3 . 5 3 . 5 3 . 4 3 . 9 3 . 3 3 . 4 3 . 1 3 . 0 2 . 7 2 . 8 2 . 6 2 . 4 2 . 0 2 . 1 2 . 0 2 . 0 1 . 9 0 . 51952 3 . 6 3 . 5 3 . 3 3 . 4 3 . 4 3 . 3 3 . 8 3 . 1 3 . 3 3 . 0 2 . 8 2 . 6 2 . 7 2 . 5 2 . 3 1 . 9 2 . 0 1 . 9 1 . 9 1 . 8 0 . 61953 3 . 6 3 . 5 3 . 3 3 . 4 3 . 4 3 . 3 3 . 8 3 . 2 3 . 3 3 . 0 2 . 9 2 . 6 2 . 8 2 . 6 2 . 4 2 . 1 2 . 2 2. 1 2 . 1 2 . 0 1 . 01954 3 . 7 3 . 6 3 . 4 3 . 5 3 . 5 3 . 5 3 . 9 3 . 4 3 . 5 3 . 2 3. 1 2 . 9 3 . 0 2 . 9 2 . 7 2 . 4 2 . 5 2 . 5 2 . 5 2 . 5 1 . 61955 3 . 6 3 . 4 3 . 2 3 . 4 3 . 4 3 . 3 3 . 7 3 . 1 3 . 3 3 . 0 2 . 9 2 . 6 2 . 8 2 . 6 2 . 4 2 . 2 2 . 3 2 . 2 2 . 2 2 . 2 1 . 31956 3 . 3 3 . 1 2 . 9 3 . 0 3 . 0 2 . 9 3 . 3 2 . 8 2 . 9 2 . 6 2 . 5 2 . 2 2 . 3 2 . 1 1 . 9 1 . 7 1 . 7 1 . 6 1 . 6 1 . 5 0 . 71957 3 . 4 3 . 3 3 . 1 3 . 2 3 . 2 3 . 1 3 . 5 2 . 9 3 . 1 2 . 8 2 . 7 2 . 5 2 . 6 2 . 4 2 . 2 2 . 0 2 . 1 2 . 0 2 . 0 1 . 9 1 . 21958 3. 1 3 . 0 2 . 8 2 . 9 2 . 8 2 . 8 3 . 1 2 . 6 2 . 7 2 . 4 2 . 3 2 . 1 2 . 1 2 . 0 1 . 8 1 . 5 1 . 6 1 . 5 1 . 4 1 . 3 0 . 61959 2 . 9 2 . 8 2 . 6 2 . 7 2 . 7 2 . 6 2 . 9 2 . 4 2 . 5 2 . 2 2 . 1 1 . 9 1 . 9 1 . 8 1 . 6 1 . 3 1 . 4 1 . 2 1 . 2 1. 1 0 . 4
Stocks, Bon
ds, Bills, an
d Inflation
: Historical R
eturn
s

17
3
EXHIBIT A-4 (Continued)
F R O M T H E B E G I N N I N G O F
T O T H E
E N D O F 1926 1927 1928 1929 1930 1931 1932 1933 1934 1935 1936 1937 1938 1939 1940 1941 1942 1943 1944 1945 1946
1960 3 . 2 3 . 1 2 . 9 3 . 0 3 . 0 2 . 9 3 . 2 2 . 8 2 . 9 2 . 6 2 . 5 2 . 3 2 . 4 2 . 3 2 . 1 1 . 9 2 . 0 1 . 9 1 . 9 1 . 8 1 . 3
1961 3 . 2 3 . 0 2 . 9 3 . 0 2 . 9 2 . 9 3 . 2 2 . 7 2 . 8 2 . 6 2 . 5 2 . 3 2 . 4 2 . 2 2 . 1 1 . 9 1 . 9 1 . 9 1 . 8 1 . 8 1 . 3
1962 3 . 3 3 . 1 3 . 0 3 . 1 3 . 1 3 . 0 3 . 3 2 . 9 3 . 0 2 . 7 2 . 6 2 . 5 2 . 5 2 . 4 2 . 3 2 . 1 2 . 2 2 . 1 2 . 1 2 . 1 1 . 6
1963 3 . 2 3 . 1 2 . 9 3 . 0 3 . 0 2 . 9 3 . 2 2 . 8 2 . 9 2 . 7 2 . 6 2 . 4 2 . 5 2 . 4 2 . 2 2 . 1 2 . 1 2 . 1 2 . 1 2 . 0 1 . 6
1964 3 . 2 3 . 1 2 . 9 3 . 0 3 . 0 3 . 0 3 . 2 2 . 8 2 . 9 2 . 7 2 . 6 2 . 4 2 . 5 2 . 4 2 . 3 2 . 1 2 . 2 2 . 1 2 . 1 2 . 1 1 . 7
1965 3 . 2 3 . 0 2 . 9 3 . 0 2 . 9 2 . 9 3 . 2 2 . 8 2 . 9 2 . 6 2 . 6 2 . 4 2 . 5 2 4 2 . 2 2 . 1 2 . 1 2 . 1 2 . 1 2 . 0 1 . 6
1966 3 . 2 3 . 1 2 . 9 3 . 0 3 . 0 2 . 9 3 . 2 2 . 8 2 . 9 2 . 7 2 . 6 2 . 4 2 . 5 2 . 4 2 . 3 2 . 1 2 . 2 2 . 1 2 . 1 2 . 1 1 . 7
1967 2 . 9 2 . 7 2 . 6 2 . 6 2 . 6 2 . 6 2 . 8 2 . 4 2 . 5 2 . 3 2 . 2 2 . 0 2 . 1 2 . 0 1 . 8 1 . 7 1 . 7 1 . 7 1 . 6 1 . 6 1 . 2
1968 2 . 8 2 . 7 2 . 5 2 . 6 2 . 6 2 . 5 2 . 7 2 . 4 2 . 4 2 . 2 2 . 1 2 . 0 2 . 0 1 . 9 1 . 8 1 . 6 1 . 6 1 . 6 1 . 6 1 . 5 1. 1
1969 2 . 6 2 . 5 2 . 3 2 . 4 2 . 4 2 . 3 2 . 5 2 . 1 2 . 2 2 . 0 1 . 9 1 . 7 1 . 8 1 . 7 1 . 5 1 . 4 1 . 4 1 . 3 1 . 3 1 . 2 0 . 9
1970 2 . 8 2 . 7 2 . 5 2 . 6 2 . 6 2 . 5 2 . 7 2 . 4 2 . 5 2 . 3 2 . 2 2 . 0 2 . 1 2 . 0 1 . 9 1 . 7 1 . 7 1 . 7 1 . 7 1 . 6 1 . 3
1971 3 . 0 2 . 9 2 . 8 2 . 8 2 . 8 2 . 8 3 . 0 2 . 7 2 . 7 2 . 5 2 . 5 2 . 3 2 . 4 2 . 3 2 . 2 2 . 1 2 . 1 2 . 1 2 . 1 2 . 0 1 . 7
1972 3 . 1 3 . 0 2 . 8 2 . 9 2 . 9 2 . 8 3 . 1 2 . 7 2 . 8 2 . 6 2 . 6 2 . 4 2 . 5 2 . 4 2 . 3 2 . 2 2 . 2 2 . 2 2 . 2 2 . 2 1 . 9
1973 3 . 0 2 . 9 2 . 8 2 . 8 2 . 8 2 . 8 3 . 0 2 . 6 2 . 7 2 . 5 2 . 5 2 . 3 2 . 4 2 . 3 2 . 2 2 . 1 2 . 1 2 . 1 2 . 1 2 . 1 1 . 8
1974 3 . 0 2 . 9 2 . 8 2 . 8 2 . 8 2 . 8 3 . 0 2 . 7 2 . 7 2 . 6 2 . 5 2 . 4 2 . 4 2 . 4 2 . 3 2 . 1 2 . 2 2 . 1 2 . 1 2 . 1 1 . 8
1975 3 . 1 3 . 0 2 . 9 3 . 0 3 . 0 2 . 9 3 . 1 2 . 8 2 . 9 2 . 7 2 . 7 2 . 5 2 . 6 2 . 5 2 . 4 2 . 3 2 . 4 2 . 4 2 . 4 2 . 3 2 . 1
1976 3 . 4 3 . 3 3 . 2 3 . 2 3 . 2 3 . 2 3 . 4 3 . 1 3 . 2 3 . 0 3 . 0 2 . 9 3 . 0 2 . 9 2 . 8 2 . 7 2 . 8 2 . 8 2 . 8 2 . 8 2 . 5
1977 3 . 3 3 . 2 3 . 1 3 . 2 3 . 2 3 . 1 3 . 3 3 . 0 3 . 1 3 . 0 2 . 9 2 . 8 2 . 9 2 . 8 2 . 7 2 . 6 2 . 7 2 . 7 2 . 7 2 . 7 2 . 4
1978 3 . 2 3 . 1 3 . 0 3 . 1 3 . 1 3 . 0 3 . 2 2 . 9 3 . 0 2 . 9 2 . 8 2 . 7 2 . 8 2 . 7 2 . 6 2 . 5 2 . 6 2 . 5 2 . 6 2 . 5 2 . 3
1979 3 . 1 3 . 0 2 . 9 3 . 0 3 . 0 2 . 9 3 . 1 2 . 9 2 . 9 2 . 8 2 . 7 2 . 6 2 . 7 2 . 6 2 . 5 2 . 4 2 . 5 2 . 4 2 . 5 2 . 4 2 . 2
1980 3 . 0 2 . 9 2 . 8 2 . 9 2 . 8 2 . 8 3 . 0 2 . 7 2 . 8 2 . 6 2 . 6 2 . 5 2 . 5 2 . 4 2 . 3 2 . 3 2 . 3 2 . 3 2 . 3 2 . 3 2 . 0
1981 3 . 0 2 . 9 2 . 8 2 . 8 2 . 8 2 8 3 . 0 2 . 7 2 . 7 2 . 6 2 . 5 2 . 4 2 . 5 2 . 4 2 . 3 2 . 2 2 . 3 2 . 3 2 . 3 2 . 2 2 . 0
1982 3 . 5 3 . 5 3 . 4 3 . 4 3 . 4 3 . 4 3 . 6 3 . 3 3 . 4 3 . 3 3 . 2 3 . 1 3 . 2 3 . 2 3 . 1 3 . 0 3 . 1 3 . 1 3 . 1 3 . 1 2 . 9
1983 3 . 5 3 . 4 3 . 3 3 . 4 3 . 4 3 . 4 3 . 5 3 . 3 3 . 3 3 . 2 3 . 2 3 . 1 3 . 2 3 . 1 3 . 0 3 . 0 3 . 0 3 . 0 3 . 0 3 . 0 2 . 8
1984 3 . 7 3 . 6 3 . 5 3 . 6 3 . 6 3 . 6 3 . 7 3 . 5 3 . 6 3 . 4 3 . 4 3 . 3 3 . 4 3 . 4 3 . 3 3 . 2 3 . 3 3 . 3 3 . 3 3 . 3 3 . 1
1985 4 . 1 4 . 0 3 . 9 4 . 0 4 . 0 4 . 0 4 . 2 4 . 0 4 . 0 3 . 9 3 . 9 3 . 8 3 . 9 3 . 9 3 . 8 3 . 8 3 . 8 3 . 9 3 . 9 3 . 9 3 . 8
1986 4 . 4 4 . 3 4 . 3 4 . 3 4 . 3 4 . 3 4 . 5 4 . 3 4 . 4 4 . 3 4 . 3 4 . 2 4 . 3 4 . 3 4 . 2 4 . 2 4 . 3 4 . 3 4 . 3 4 . 4 4 . 2
1987 4 . 3 4 . 2 4 . 1 4 . 2 4 . 2 4 . 2 4 . 4 4 . 2 4 . 3 4 . 2 4 . 1 4 . 1 4 . 1 4 . 1 4 . 1 4 . 0 4 . 1 4 . 1 4 . 2 4 . 2 4 . 1
Appen
dix

G o17
4 E X H IB IT A -4 (C o n tin u ed )S '
prF R O M T H E B E G I N N I N G O F
T O T H EE N D O F 1947 1948 1949 1950 1951 1952 1953 1954 1955 1956 1957 1958 1959 1960 1961 1962 1963 1964 1965 1966 1967 8 *
1947 - 2 . 6
1948 0 . 3 3 . 4 Co
1949 2 . 3 4 . 9 6 . 4 j?
1950 1 . 8 3 . 3 3 . 2 0.1 81951 0 . 6 1 . 4 0 . 8 - 2 . 0 - 3 . 9 a .
1952 0 . 7 1 . 4 0 . 9 - 0 . 9 - 1 . 4 1 . 2 ,81953 1. 1 1 . 7 1 . 4 0 . 2 0 . 2 2 . 4 3 . 61954 1 . 8 2 . 5 2 . 4 1 . 6 1 . 9 4 . 0 5 . 4 7 . 21955 1 . 5 2 . 0 1 . 8 1. 1 1 . 3 2 . 6 3. 1 2 . 9 1 . 31956 0 8 1. 1 0 . 9 0.1 0 . 1 0 . 9 0 . 9 0.0 3 . 5 5 . 61957 1 . 4 1 . 8 1 . 6 1.0 1. 1 2 . 0 2 . 2 1 . 8 0.0 0 . 7 7 . 5 531958 0 . 7 1.0 0 . 8 0 . 2 0 . 2 0 . 8 0 . 7 0 . 2 - 1 . 5 - 1 . 6 0 . 5 - 6 . 1
Oo
1959 0 . 5 0 . 7 0 . 5 -0.1 -0.1 0 . 4 0 . 3 - 0 . 3 1 . 7 - 1 . 8 - 0 . 5 - 4 . 2 - 2 . 3 3.1960 1 . 4 1 . 7 1 . 5 1 . 1 1 . 2 1 . 8 1 . 9 1 . 6 0 . 7 1 . 2 2 . 9 1 . 5 5 . 5 1 3 . 8
81961 1 . 3 1 . 6 1 . 5 1. 1 1 . 2 1 . 7 1 . 8 1 . 6 0 . 8 1. 1 2 . 5 1 . 3 3 . 9 7 . 2 1.01962 1 . 7 2 . 0 1 . 9 1 . 5 1 . 7 2 . 2 2 . 3 2 . 1 1 . 5 1 . 9 3 . 2 2 . 4 4 . 7 7. 1 3 . 9 6 . 91963 1 . 7 1 . 9 1 . 8 1 . 5 1 . 6 2 . 1 2 . 2 2 . 0 1 . 5 1 . 8 2 . 9 2 . 2 4 . 0 5 . 6 3 . 0 4 . 0 1 . 21964 1 . 8 2 . 0 1 . 9 1 . 6 1 . 8 2 . 2 2 . 3 2 . 2 1 . 7 2 . 0 3 . 0 2 . 4 3 . 9 5 . 2 3 . 1 3 . 8 2 . 4 3 . 51965 1 . 7 1 . 9 1 . 9 1 . 6 1 . 7 2 . 1 2 . 2 2 . 1 1 . 6 1 . 9 2 . 8 2 . 2 3 . 4 4 . 4 2 . 6 3 . 0 1 . 8 2 . 1 0 . 71966 1 . 8 2 . 0 2 . 0 1 . 7 1 . 8 2 . 2 2 . 3 2 . 2 1 . 8 2 . 1 2 . 8 2 . 3 3 . 5 4 . 3 2 . 8 3 . 2 2 . 3 2 . 6 2 . 2 3 . 61967 1 . 2 1 . 4 1 . 3 1. 1 1.1 1 . 5 1 . 5 1 . 3 0 . 9 1 . 1 1 . 7 1. 1 2 . 0 2 . 5 1.0 1 . 0 0 . 1 - 0 . 5 - 1 . 8 - 3 . 0 - 9 . 21968 1 . 2 1 . 4 1 . 3 1.0 1 . 0 1 . 3 1 . 4 1 . 2 0 . 8 1.0 1 . 5 1 . 0 1 . 7 2 . 2 0 . 8 0 . 8 - 0 . 2 - 0 . 4 - 1 . 4 - 2 . 1 - 4 . 81969 0 . 9 1. 1 1 . 0 0 . 7 0 . 7 1 . 0 1 . 0 0 . 8 0 . 4 0 . 5 1 . 0 0 . 5 1. 1 1 . 4 0 . 2 0.1 - 0 . 9 - 1 . 2 - 2 . 1 - 2 . 8 - 4 . 9
1970 1 .3 1 . 5 1 . 4 1 . 2 1 . 3 1 . 5 1 . 6 1 . 4 1.1 1 . 3 1 . 8 1 . 3 2 . 0 2 . 4 1 . 3 1 .3 0 . 7 0 . 6 0.1 -0.0 - 0 . 91971 1 . 8 2 . 0 1 . 9 1 . 7 1 . 8 2 . 1 2 . 1 2. 1 1 . 8 2 . 0 2 . 5 2 . 1 2 . 8 3 . 2 2 . 3 2 . 5 2 . 0 2 . 1 1 . 9 2 . 1 1 . 81972 1 . 9 2 . 1 2 . 1 1 . 9 2 . 0 2 . 3 2 . 3 2 . 2 2 . 0 2 . 2 2 . 7 2 . 4 3 . 0 3 . 4 2 . 6 2 . 8 2 . 3 2 . 5 2 . 3 2 . 6 2 . 41973 1 . 8 2 . 0 1 . 9 1 . 8 1 . 8 2 . 1 2 . 2 2 . 1 1 . 8 2 . 0 2 . 5 2 . 2 2 . 7 3 . 1 2 . 3 2 . 4 2 . 0 2 . 1 2 . 0 2 . 1 1 . 91974 1 . 9 2 . 1 2 . 0 1 . 9 1 . 9 2 . 2 2 . 2 2 . 2 1 . 9 2 . 1 2 . 6 2 . 3 2 . 8 3 . 2 2 . 5 2 . 6 2 . 2 2 . 3 2 . 2 2 . 4 2 . 21975 2 . 2 2 . 3 2 . 3 2 . 1 2 . 2 2 . 5 2 . 5 2 . 5 2 . 3 2 . 5 2 . 9 2 . 7 3 . 2 3 . 5 2 . 9 3 . 0 2 . 7 2 . 9 2 . 8 3 . 0 3 . 01976 2 . 6 2 . 8 2 . 8 2 . 6 2 . 7 3 . 0 3 . 1 3 . 1 2 . 9 3 . 1 3 . 6 3 . 3 3 . 9 4 . 3 3 . 7 3 . 9 3 . 7 3 . 9 3 . 9 4 . 2 4 . 31977 2 . 5 2 . 7 2 . 7 2 . 5 2 . 6 2 . 9 2 . 9 2 . 9 2 . 7 2 . 9 3 . 3 3 . 1 3 . 7 4 . 0 3 . 4 3 . 6 3 . 4 3 . 5 3 . 5 3 . 8 3 . 81978 2 . 4 2 . 6 2 . 5 2 . 4 2 . 5 2 . 7 2 . 8 2 . 8 2 . 6 2 . 7 3 . 1 2 . 9 3 . 4 3 . 7 3 . 2 3 . 3 3. 1 3 . 2 3 . 2 3 . 4 3 . 41979 2 . 3 2 . 4 2 . 4 2 . 3 2 . 3 2 . 6 2 . 6 2 . 6 2 . 4 2 . 6 2 . 9 2 . 7 3 . 2 3 . 5 2 . 9 3 . 1 2 . 8 2 . 9 2 . 9 3 . 1 3 . 0
1980 2 . 1 2 . 2 2 . 2 2 . 1 2 . 1 2 . 3 2 . 4 2 . 3 2 . 2 2 . 3 2 . 6 2 . 4 2 . 8 3 . 1 2 . 6 2 . 7 2 . 4 2 . 5 2 . 5 2 . 6 2 . 51981 2 . 1 2 . 2 2 . 2 2 . 1 2 . 1 2 . 3 2 . 4 2 . 3 2 . 2 2 . 3 2 . 6 2 . 4 2 . 8 3 . 0 2 . 6 2 . 6 2 . 4 2 . 5 2 . 4 2 . 5 2 . 51982 3 . 0 3 . 2 3 . 1 3 . 0 3 . 1 3 . 4 3 . 5 3 . 4 3 . 3 3 . 5 3 . 9 3 . 7 4 . 1 4 . 4 4 . 0 4 . 2 4 . 0 4 . 2 4 . 2 4 . 4 4 . 51983 2 . 9 3 . 1 3 . 1 3 . 0 3 . 1 3 . 3 3 . 4 3 . 4 3 . 2 3 . 4 3 . 7 3 . 6 4 . 0 4 . 3 3 . 9 4 . 0 3 . 9 4 . 0 4 . 0 4 . 2 4 . 31984 3 . 2 3 . 4 3 . 4 3 . 3 3 . 4 3 . 6 3 . 7 3 . 7 3 . 6 3 . 8 4 . 1 4 . 0 4 . 4 4 . 7 4 . 3 4 . 5 4 . 4 4 . 5 4 . 6 4 . 8 4 . 91985 3 . 9 4 . 0 4 . 1 4 . 0 4 . 1 4 . 4 4 . 5 4 . 5 4 . 4 4 . 6 5 . 0 4 . 9 5 . 3 5 . 6 5 . 3 5 . 5 5 . 4 5 . 6 5 . 7 6 . 0 6 . 11986 4 . 3 4 . 5 4 . 6 4 . 5 4 . 6 4 . 9 5 . 0 5 . 0 5 . 0 5 . 2 5 . 6 5 . 5 5 . 9 6 . 2 6 . 0 6 . 2 6 . 1 6 . 4 6 . 5 6 . 8 6 . 91987 4 . 2 4 . 3 4 . 4 4 . 3 4 . 4 4 . 7 4 . 8 4 . 8 4 . 7 4 . 9 5 . 3 5 . 2 5 . 6 5 . 9 5 . 6 5 . 8 5 . 8 6 . 0 6 . 1 6 . 3 6 . 5

17
5
E X H IB IT A -4 (C o n tin u e d )
F R O M T H E B E G I N N I N G O F
T O T H E
E N D O F 1968 1969 1970 1971 1972 1973 1974 1975 1976 1977 1978 1979 1980 1981 1982 1983 1984 1985
1968 0 . 3
1969 - 2 . 7 - 5 . 1
1970 2 . 0 3 . 2 1 2 . 1
1971 4 . 7 6 . 4 1 2 . 7 1 3 . 2
1972 4 . 9 6 . 2 1 0 . 3 9 . 4 5 . 7
1973 3 . 9 4 . 7 7 . 3 5 . 8 2 . 2 - 1 . 1
1974 3 . 9 4 . 7 6 . 7 5 . 4 2 . 9 1 . 6 4 . 4
1975 4 . 6 5 . 3 7 . 1 6 . 2 4 . 5 4 . 1 6 . 7 9 . 2
1976 5 . 9 6 . 7 8 . 5 7 . 9 6 . 8 7 . 1 1 0 . 0 1 2 . 9 1 6 . 8
1977 5 . 2 5 . 8 7 . 3 6 . 6 5 . 5 5 . 5 7 . 2 8 . 2 7 . 7 - 0 . 7
1978 4 . 6 5 . 1 6 . 3 5 . 6 4 . 5 4 . 4 5 . 5 5 . 8 4 . 7 - 0 . 9 - 1 . 2
1979 4 . 1 4 . 5 5 . 5 4 . 8 3 . 8 3 . 5 4 . 3 4 . 3 3 . 2 - 1 . 0 - 1 . 2 - 1 . 2
1980 3 . 5 3 . 8 4 . 6 3 . 9 2 . 9 2 . 6 3 . 1 2 . 9 1 . 7 - 1 . 8 - 2 . 1 - 2 . 6 - 4 . 0
1981 3 . 3 3 . 6 4 . 4 3 . 7 2 . 8 2 . 5 3 . 0 2 . 8 1 . 7 - 1 . 0 - 1 . 1 - 1 . 1 - 1 . 1 1 . 8
1982 5 . 5 5 . 9 6 . 8 6 . 4 5 . 8 5 . 8 6 . 6 6 . 8 6 . 5 4 . 9 6 . 0 7 . 9 11 . 1 1 9 . 6 4 0 . 3
1983 5 . 2 5 . 5 6 . 3 5 . 9 5 . 3 5 . 3 6 . 0 6 . 1 5 . 8 4 . 3 5 . 1 6 . 4 8 . 4 1 2 . 9 1 8 . 9 0 . 7
1984 5 . 7 6 . 1 6 . 9 6 . 6 6 . 1 6 . 1 6 . 8 7 . 0 6 . 8 5 . 6 6 . 5 7 . 9 9 . 8 1 3 . 5 1 7 . 7 7 . 8 1 5 . 4
3 1 . 01985 7 . 0 7 . 5 8 . 3 8 . 0 7 . 7 7 . 8 8 . 6 9 . 0 9 . 0 8 . 2 9 . 3 1 0 . 9 13 . 1 1 6 . 8 2 0 . 9 1 5 . 0 2 3 . 0
1986 7 . 9 8 . 3 9 . 2 9 . 0 8 . 7 8 . 9 9 . 8 1 0 . 2 1 0 . 3 9 . 7 1 0 . 9 1 2 . 5 1 4 . 6 18. 1 2 1 . 6 1 7 . 3 2 3 . 4 2 7 . 7
1987 7 . 3 7 . 7 8 . 5 8 . 3 8 . 0 8 . 1 8 . 8 9 . 2 9 . 2 8 . 5 9 . 5 1 0 . 7 1 2 . 3 1 4 . 8 1 7 . 2 1 3 . 0 1 6 . 3 1 6 . 6
1986 1987
2 4 . 4
10.0
Appen
dix

17
6 E X H IB IT A -5INTERM ED IA TE-TER M G O V E R N M E N T B O N D S : TO TAL R E T U R N S
RATES O F R E T U R N F O R A LL Y EARLY H O L D IN G P E R IO D S FR O M 1 9 2 6 TO 1 9 8 7
(P e r c e n t P e r A n n u m C o m p o u n d e d A n n u a lly )
T O T H EF R O M T H E B E G I N N I N G O F
E N D O F 1926 1927 1928 1929 1930 1931 1932 1933 1934 1935 1936 1937 1938 1939 1940 1941 1942 1943 1944 1945 1946
1926 5 . 4
1927 4 . 9 4 . 5
1928 3 . 6 2 . 7 0 . 91929 4 . 2 3 . 8 3 . 4 6.01930 4 . 7 4 . 5 4 . 5 6 . 4 6 . 71931 3 . 5 3 . 1 2.8 3 . 4 2.1 - 2 . 31932 4 . 2 4 . 0 3 . 9 4 . 7 4 . 3 3 . 1 8.81933 3 . 9 3 . 7 3 . 6 4 . 1 3 . 7 2 . 7 5 . 3 1.81934 4 . 5 4 . 4 4 . 3 4 . 9 4 . 7 4 . 2 6 . 5 5 . 3 9 . 01935 4 . 7 4 . 7 4 . 7 5 . 2 5 . 1 4 . 8 6.6 5 . 9 8.0 7 . 01936 4 . 6 4 . 5 4 . 5 4 . 9 4 . 8 4 . 5 5 . 9 5 . 2 6 . 3 5 . 0 3 . 11937 4 . 3 4 . 2 4 . 2 4 . 6 4 . 4 4 . 1 5 . 2 4 . 4 5 . 1 3 . 8 2 . 3 1.61938 4 . 5 4 . 4 4 . 4 4 . 7 4 . 6 4 . 3 5 . 3 4 . 7 5 . 3 4 . 4 3 . 6 3 . 9 6.21939 4 . 5 4 . 4 4 . 4 4 . 7 4 . 6 4 . 3 5 . 2 4 . 7 5 . 2 4 . 5 3 . 8 4 . 1 5 . 4 4 . 5
1940 4 . 4 4 . 3 4 . 3 4 . 6 4 . 4 4 . 2 5 . 0 4 . 5 4 . 9 4 . 2 3 . 7 3 . 8 4 . 6 3 . 7 3 . 01941 4. 1 4 . 0 4 . 0 4 . 2 4 . 1 3 . 9 4 . 5 4 . 0 4 . 3 3 . 7 3 . 1 3 . 1 3 . 5 2.6 1 . 7 0 . 51942 4 . 0 3 . 9 3 . 9 4 . 1 3 . 9 3 . 7 4 . 3 3 . 8 4 . 1 3 . 4 2 . 9 2 . 9 3 . 2 2 . 5 1.8 1.2 1 . 91943 3 . 9 3 . 8 3 . 8 4 . 0 3 . 9 3 . 6 4 . 1 3 . 7 3 . 9 3 . 4 2 . 9 2 . 9 3 . 1 2 . 5 2.0 1 . 7 2 . 4 2.81944 3 . 8 3 . 7 3 . 7 3 . 9 3 . 7 3 . 5 4 . 0 3 . 6 3 . 7 3 . 2 2.8 2.8 2 . 9 2 . 4 2.0 1.8 2.2 2 . 3 1.81945 3 . 7 3 . 6 3 . 6 3 . 8 3 . 6 3 . 4 3 . 8 3 . 5 3 . 6 3 . 1 2 . 7 2 . 7 2 . 9 2 . 4 2.0 1.8 2.2 2 . 3 2.0 2.21946 3 . 6 3 . 5 3 . 5 3 . 6 3 . 5 3 . 3 3 . 6 3 . 3 3 . 4 2 . 9 2.6 2 . 5 2.6 2.2 1 . 9 1 . 7 2.0 2.0 1 . 7 1.6 1.01947 3 . 5 3 . 4 3 . 3 3 . 5 3 . 3 3 . 1 3 . 5 3 . 1 3 . 2 2.8 2 . 4 2 . 4 2 . 5 2.1 1.8 1.6 1.8 1 . 7 1 . 5 1 . 4 1.01948 3 . 4 3 . 3 3 . 3 3 . 4 3 . 2 3 . 1 3 . 4 3 . 0 3 . 1 2 . 7 2 . 4 2 . 3 2 . 4 2.0 1.8 1.6 1.8 1.8 1.6 1 . 5 1 . 31949 3 . 4 3 . 3 3 . 2 3 . 3 3 . 2 3 . 0 3 . 3 3 . 0 3 . 1 2 . 7 2 . 4 2 . 3 2 . 4 2.1 1.8 1 . 7 1 . 9 1.8 1 . 7 1 . 7 1 . 5
1950 3 . 3 3 . 2 3 . 1 3 . 2 3 . 1 2 . 9 3 . 2 2 . 9 2 . 9 2.6 2 . 3 2.2 2 . 3 2.0 1 . 7 1.6 1 . 7 1 . 7 1 . 5 1 . 5 1 . 41951 3 . 1 3 . 1 3 . 0 3 . 1 2 . 9 2.8 3 . 0 2 . 7 2.8 2 . 4 2.2 2.1 2.1 1.8 1.6 1 . 5 1.6 1 . 5 1 . 4 1 . 3 1.21952 3 . 1 3 . 0 2 . 9 3 . 0 2 . 9 2 . 7 3 . 0 2 . 7 2 . 7 2 . 4 2.1 2.1 2.1 1.8 1.6 1 . 5 1.6 1.6 1 . 4 1 . 4 1 . 31953 3 . 1 3 . 0 2 . 9 3 . 0 2 . 9 2 . 7 3 . 0 2 . 7 2.8 2 . 4 2.2 2.1 2.2 1 . 9 1 . 7 1.6 1 . 7 1 . 7 1.6 1.6 1 . 51954 3 . 1 3 . 0 2 . 9 3 . 0 2 . 9 2 . 7 3 . 0 2 . 7 2.8 2 . 4 2.2 2.2 2.2 2.0 1.8 1 . 7 1.8 1.8 1 . 7 1 . 7 1.61955 2 . 9 2 . 9 2.8 2 . 9 2.8 2.6 2.8 2.6 2.6 2 . 3 2.1 2.0 2.0 1.8 1.6 1 . 5 1.6 1.6 1 . 5 1 . 5 1 . 41956 2.8 2.8 2 . 7 2.8 2.6 2 . 5 2 . 7 2 . 4 2 . 5 2.2 1 . 9 1 . 9 1 . 9 1 . 7 1 . 5 1 . 4 1 . 5 1 . 5 1 . 3 1 . 3 1.21957 3 . 0 2 . 9 2 . 9 2 . 9 2.8 2 . 7 2 . 9 2.6 2 . 7 2 . 4 2.2 2.2 2.2 2.0 1 . 9 1.8 1 . 9 1 . 9 1.8 1.8 1.81958 2 . 9 2.8 2 . 7 2.8 2 . 7 2 . 5 2 . 7 2 . 5 2 . 5 2 . 3 2.1 2.0 2.0 1.8 1 . 7 1.6 1 . 7 1 . 7 1.6 1.6 1 . 51959 2.8 2 . 7 2.6 2 . 7 2.6 2 . 4 2.6 2 . 4 2 . 4 2.1 2.0 1 . 9 1 . 9 1 . 7 1.6 1 . 5 1.6 1 . 5 1 . 5 1 . 4 1 . 4
Stocks, Bon
ds, Bills, an
d Inflation
: Historical R
eturn
s
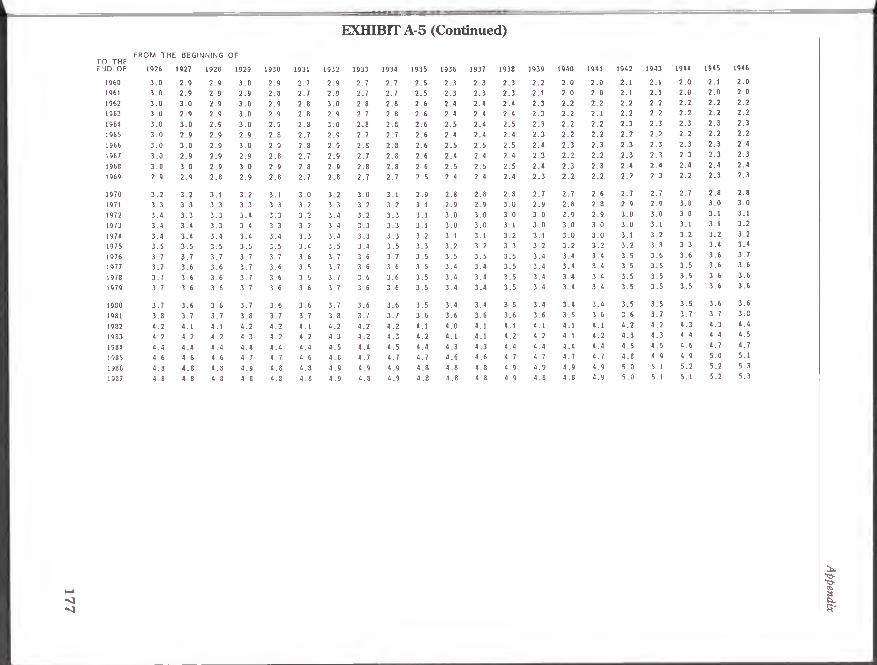
17
7
i
E X H IB IT A -5 (C o n tin u e d )
F R O M T H E B E G I N N I N G O FT O T H E
E N D O F 1926 1927 1928 1929 1930 1931 1932 1933 1934 1935 1936 1937 1938 1939 1940 1941 1942 1943 1944 1945 1946
1960 3 . 0 2 . 9 2 . 9 3 . 0 2 . 9 2 . 7 2 . 9 2 . 7 2 . 7 2 . 5 2 . 3 2 . 3 2 . 3 2.2 2.0 2.0 2.1 2.1 2.0 2.1 2.01961 3 . 0 2 . 9 2 9 2 . 9 2.8 2 . 7 2 . 9 2 . 7 2 . 7 2 . 5 2 . 3 2 . 3 2 . 3 2.1 2.0 2.0 2.1 2.1 2.0 2.0 2.01962 3 . 0 3 . 0 2 . 9 3 . 0 2 . 9 2.8 3 . 0 2.8 2.8 2.6 2 . 4 2 . 4 2 . 4 2 . 3 2.2 2.2 2.2 2.2 2.2 2.2 2.21963 3 . 0 2 . 9 2 . 9 3 . 0 2 . 9 2.8 2 . 9 2 . 7 2.8 2.6 2 . 4 2 . 4 2 . 4 2 . 3 2.2 2.1 2.2 2.2 2.2 2.2 2.21964 3 . 0 3 . 0 2 . 9 3 . 0 2 . 9 2.8 3 . 0 2.8 2.8 2.6 2 . 5 2 . 4 2 . 5 2 . 3 2.2 2.2 2 . 3 2 . 3 2 . 3 2 . 3 2 . 3
1965 3 . 0 2 . 9 2 . 9 2 . 9 2.8 2 . 7 2 . 9 2 . 7 2 . 7 2.6 2 . 4 2 . 4 2 . 4 2 . 3 2.2 2.2 2.2 2.2 2.2 2.2 2.21966 3 . 0 3 . 0 2 . 9 3 . 0 2 . 9 2.8 2 . 9 2.8 2.8 2.6 2 . 5 2 . 5 2 . 5 2 . 4 2 . 3 2 . 3 2 . 3 2 . 3 2 . 3 2 . 3 2 . 4
1967 3 . 0 2 . 9 2 . 9 2 . 9 2.8 2 . 7 2 . 9 2 . 7 2.8 2.6 2 . 4 2 . 4 2 . 4 2 . 3 2.2 2.2 2 . 3 2 . 3 2 . 3 2 . 3 2 . 3
1968 3 . 0 3 . 0 2 . 9 3 . 0 2 . 9 2.8 2 . 9 2.8 2.8 2.6 2 . 5 2 . 5 2 . 5 2 . 4 2 . 3 2 . 3 2 . 4 2 . 4 2 . 4 2 . 4 2 . 4
1969 2 . 9 2 . 9 2.8 2 . 9 2.8 2 . 7 2.8 2 . 7 2 . 7 2 . 5 2 . 4 2 . 4 2 . 4 2 . 3 2.2 2.2 2.2 2 . 3 2.2 2 . 3 2 . 3
1970 3 . 2 3 . 2 3 . 1 3 . 2 3 . 1 3 . 0 3 . 2 3 . 0 3 . 1 2 . 9 2.8 2.8 2.8 2 . 7 2 . 7 2.6 2 . 7 2 . 7 2 . 7 2.8 2.81971 3 . 3 3 . 3 3 . 3 3 . 3 3 . 3 3 . 2 3 . 3 3 . 2 3 . 2 3 . 1 2 . 9 2 . 9 3 . 0 2 . 9 2.8 2.8 2 . 9 2 . 9 3 . 0 3 . 0 3 . 0
1972 3 . 4 3 . 3 3 . 3 3 . 4 3 . 3 3 . 2 3 . 4 3 . 2 3 . 3 3 . 1 3 . 0 3 . 0 3 . 0 3 . 0 2 . 9 2 . 9 3 . 0 3 . 0 3 . 0 3 . 1 3 . 1
1973 3 . 4 3 . 4 3 . 3 3 . 4 3 . 3 3 . 2 3 . 4 3 . 3 3 . 3 3 . 1 3 . 0 3 . 0 3 . 1 3 . 0 3 . 0 3 . 0 3 . 0 3 . 1 3 . 1 3 . 1 3 . 2
1974 3 . 4 3 . 4 3 . 4 3 . 4 3 . 4 3 . 3 3 . 4 3 . 3 3 . 3 3 . 2 3 . 1 3 . 1 3 . 2 3 . 1 3 . 0 3 . 0 3 . 1 3 . 2 3 . 2 3 . 2 3 . 2
1975 3 . 5 3 . 5 3 . 5 3 . 5 3 . 5 3 . 4 3 . 5 3 . 4 3 . 5 3 . 3 3 . 2 3 . 2 3 . 3 3 . 2 3 . 2 3 . 2 3 . 2 3 . 3 3 . 3 3 . 4 3 . 4
1976 3 . 7 3 . 7 3 . 7 3 . 7 3 . 7 3 . 6 3 . 7 3 . 6 3 . 7 3 . 5 3 . 5 3 . 5 3 . 5 3 . 4 3 . 4 3 . 4 3 . 5 3 . 6 3 . 6 3 . 6 3 . 7
1977 3 . 7 3 . 6 3 . 6 3 . 7 3 . 6 3 . 5 3 . 7 3 . 6 3 . 6 3 . 5 3 . 4 3 . 4 3 . 5 3 . 4 3 . 4 3 . 4 3 . 5 3 . 5 3 . 5 3 . 6 3 . 6
1978 3 . 7 3 . 6 3 . 6 3 . 7 3 . 6 3 . 5 3 . 7 3 . 6 3 . 6 3 . 5 3 . 4 3 . 4 3 . 5 3 . 4 3 . 4 3 . 4 3 . 5 3 . 5 3 . 5 3 . 6 3 . 6
1979 3 . 7 3 . 6 3 . 6 3 . 7 3 . 6 3 . 6 3 . 7 3 . 6 3 . 6 3 . 5 3 . 4 3 . 4 3 . 5 3 . 4 3 . 4 3 . 4 3 . 5 3 . 5 3 . 5 3 . 6 3 . 6
1980 3 . 7 3 . 6 3 . 6 3 . 7 3 . 6 3 . 6 3 . 7 3 . 6 3 . 6 3 . 5 3 . 4 3 . 4 3 . 5 3 . 4 3 . 4 3 . 4 3 . 5 3 . 5 3 . 5 3 . 6 3 . 6
1981 3 . 8 3 . 7 3 . 7 3 . 8 3 . 7 3 . 7 3 . 8 3 . 7 3 . 7 3 . 6 3 . 6 3 . 6 3 . 6 3 . 6 3 . 5 3 . 6 3 . 6 3 . 7 3 . 7 3 . 7 3 . 8
1982 4 . 2 4 . 1 4 . 1 4 . 2 4 . 2 4 . 1 4 . 2 4 . 2 4 . 2 4 . 1 4 . 0 4 . 1 4 . 1 4 . 1 4 . 1 4 . 1 4 . 2 4 . 2 4 . 3 4 . 3 4 . 4
1983 4 . 2 4 . 2 4 . 2 4 . 3 4 . 2 4 . 2 4 . 3 4 . 2 4 . 3 4 . 2 4 . 1 4 . 1 4 . 2 4 . 2 4 . 1 4 . 2 4 . 3 4 . 3 4 . 4 4 . 4 4 . 5
1984 4 . 4 4 . 4 4 . 4 4 . 4 4 . 4 4 . 4 4 . 5 4 . 4 4 . 5 4 . 4 4 . 3 4 . 3 4 . 4 4 . 4 4 . 4 4 . 4 4 . 5 4 . 5 4 . 6 4 . 7 4 . 7
1985 4 . 6 4 . 6 4 . 6 4 . 7 4 . 7 4 . 6 4 . 8 4 . 7 4 . 7 4 . 7 4 . 6 4 . 6 4 . 7 4 . 7 4 . 7 4 . 7 4 . 8 4 . 9 4 . 9 5 . 0 5. 1
1986 4 . 8 4 . 8 4 . 8 4 . 9 4 . 8 4 . 8 4 . 9 4 . 9 4 . 9 4 . 8 4 . 8 4 . 8 4 . 9 4 . 9 4 . 9 4 . 9 5 . 0 5 . 1 5 . 2 5 . 2 5 . 3
1987 4 . 8 4 . 8 4 . 8 4 . 8 4 . 8 4 . 8 4 . 9 4 . 8 4 . 9 4 . 8 4 . 8 4 . 8 4 . 9 4 . 8 4 . 8 4 . 9 5 . 0 5 . 1 5 . 1 5 . 2 5 . 3
Ap
pen
dix

17
8 E X H IB IT A -5 (C o n tin u ed )
FROM THE BEGINNING OFT O T H E E N D O F 1947 1948 1949 1950 1951 1952 1953 1954 1955 1956 1957 1958 1959 1960 1961 1962 1963 1964 1965 1966 1967
1947 0 . 9
1948 1 . 4 1.81949 1 . 7 2.1 2 . 3
1950 1 . 4 1.6 1 . 5 0 . 7
1951 1.2 1 . 3 1.1 0 . 5 0 . 4
1952 1 . 3 1 . 4 1 . 3 0 . 9 1.0 1.61953 1.6 1 . 7 1.6 1 . 5 1 . 7 2 . 4 3 . 21954 1 . 7 1.8 1.8 1 . 7 2.0 2 . 5 3 . 0 2 . 71955 1 . 4 1 . 5 1 . 5 1 . 3 1 . 4 1 . 7 1 . 7 1.0 - 0 . 71956 1 . 3 1 . 3 1.2 1.1 1.1 1 . 3 1.2 0 . 5 - 0 . 5 - 0 . 41957 1.8 1 . 9 1 . 9 1 . 9 2.1 2 . 3 2 . 5 2 . 3 2.2 3 . 6 7 . 81958 1.6 1.6 1.6 1 . 5 1.6 1.8 1.8 1.6 1 . 3 2.0 3 . 2 - 1 . 31959 1 . 4 1 . 5 1 . 4 1 . 3 1 . 4 1 . 5 1 . 5 1.2 1.0 1 . 4 2.0 - 0 . 8 - 0 . 4
1960 2.1 2.2 2.2 2.2 2 . 4 2.6 2.8 2 . 7 2 . 7 3 . 4 4 . 3 3 . 2 5 . 5 11.81961 2.1 2.2 2.2 2.2 2 . 3 2 . 5 2 . 7 2.6 2.6 3. 1 3 . 8 2 . 9 4 . 3 6 . 7 1.81962 2 . 3 2 . 4 2 . 5 2 . 5 2.6 2.8 2 . 9 2 . 9 2 . 9 3 . 5 4 . 1 3 . 4 4 . 6 6 . 3 3 . 7 5 . 61963 2 . 3 2 . 4 2 . 4 2 . 4 2 . 5 2 . 7 2.8 2.8 2.8 3 . 2 3 . 8 3 . 1 4 . 0 5 . 1 3 . 0 3 . 6 1.61964 2 . 4 2 . 5 2 . 5 2 . 5 2.6 2.8 2 . 9 2 . 9 2 . 9 3 . 3 3 . 8 3 . 2 4 . 0 4 . 9 3 . 3 3 . 7 2.8 4 . 01965 2 . 3 2 . 4 2 . 4 2 . 4 2 . 5 2 . 7 2.8 2 . 7 2 . 7 3 . 1 3 . 5 3 . 0 3 . 6 4 . 2 2.8 3 . 0 2.2 2 . 5 1.01966 2 . 4 2 . 5 2 . 5 2.6 2 . 7 2.8 2 . 9 2 . 9 2 . 9 3 . 2 3 . 6 3 . 1 3 . 7 4 . 3 3 . 1 3 . 4 2.8 3 . 2 2.8 4 . 71967 2 . 4 2 . 4 2 . 5 2 . 5 2.6 2 . 7 2.8 2 . 7 2.8 3 . 0 3 . 4 2 . 9 3 . 4 3 . 9 2.8 3 . 0 2 . 5 2 . 7 2.2 2.8 1.01968 2 . 5 2 . 5 2.6 2.6 2 . 7 2.8 2 . 9 2 . 9 2 . 9 3 . 2 3 . 5 3 . 1 3 . 5 4 . 0 3 . 0 3 . 2 2.8 3 . 0 2.8 3 . 4 2.81969 2 . 3 2 . 4 2 . 4 2 . 4 2 . 5 2.6 2 . 7 2.6 2.6 2 . 9 3 . 1 2 . 7 3 . 1 3 . 5 2.6 2 . 7 2 . 3 2 . 4 2.1 2 . 3 1.61970 2 . 9 3 . 0 3 . 0 3 . 0 3 . 2 3 . 3 3 . 4 3 . 4 3 . 5 3 . 8 4 . 1 3 . 8 4 . 2 4 . 6 3 . 9 4 . 2 4 . 0 4 . 4 4 . 4 5 . 1 5 . 21971 3. 1 3 . 2 3 . 3 3 . 3 3 . 4 3 . 6 3 . 7 3 . 7 3 . 8 4 . 1 4 . 4 4 . 1 4 . 5 5 . 0 4 . 4 4 . 6 4 . 5 4 . 9 5 . 0 5 . 7 5 . 91972 3 . 2 3 . 3 3 . 3 3 . 4 3 . 5 3 . 7 3 . 8 3 . 8 3 . 8 4 . 1 4 . 4 4 . 2 4 . 6 5 . 0 4 . 4 4 . 7 4 . 6 4 . 9 5 . 0 5 . 6 5 . 8
1973 3 . 2 3 . 3 3 . 4 3 . 4 3 . 6 3 . 7 3 . 8 3 . 8 3 . 9 4 . 1 4 . 4 4 . 2 4 . 6 5 . 0 4 . 4 4 . 7 4 . 6 4 . 9 5 . 0 5 . 5 5 . 61974 3 . 3 3 . 4 3 . 5 3 . 5 3 . 6 3 . 8 3 . 9 3 . 9 4 . 0 4 . 2 4 . 5 4 . 3 4 . 7 5 . 0 4 . 5 4 . 7 4 . 7 5 . 0 5 . 1 5 . 5 5 . 6
1975 3 . 5 3 . 6 3 . 6 3 . 7 3 . 8 4 . 0 4 . 1 4 . 1 4 . 2 4 . 4 4 . 7 4 . 5 4 . 8 5 . 2 4 . 8 5 . 0 4 . 9 5 . 2 5 . 3 5 . 7 5 . 91976 3 . 8 3 . 9 3 . 9 4 . 0 4 . 1 4 . 3 4 . 4 4 . 5 4 . 5 4 . 8 5. 1 4 . 9 5 . 3 5 . 6 5 . 2 5 . 5 5 . 5 5 . 8 5 . 9 6 . 4 6 . 51977 3 . 7 3 . 8 3 . 9 3 . 9 4 . 0 4 . 2 4 . 3 4 . 3 4 . 4 4 . 6 4 . 9 4 . 7 5. 1 5 . 4 5 . 0 5 . 2 5 . 2 5 . 4 5 . 6 5 . 9 6.11978 3 . 7 3 . 8 3 . 8 3 . 9 .4 . 0 4 . 2 4 . 3 4 . 3 4 . 4 4 . 6 4 . 8 4 . 7 5 . 0 5 . 3 4 . 9 5 . 1 5 . 1 5 . 3 5 . 4 5 . 8 5 . 8
1979 3 . 7 3 . 8 3 . 9 3 . 9 4 . 0 4 . 2 4 . 2 4 . 3 4 . 4 4 . 6 4 . 8 4 . 7 4 . 9 5 . 2 4 . 9 5 . 1 5 . 0 5 . 2 5 . 3 5 . 6 5 . 7
1980 3 . 7 3 . 8 3 . 9 3 . 9 4 . 0 4 . 1 4 . 2 4 . 3 4 . 3 4 . 5 4 . 8 4 . 6 4 . 9 5 . 2 4 . 8 5 . 0 5 . 0 5 . 2 5 . 2 5 . 5 5 . 6
1981 3 . 9 4 . 0 4 . 0 4 . 1 4 . 2 4 . 3 4 . 4 4 . 5 4 . 5 4 . 7 4 . 9 4 . 8 5 . 1 5 . 3 5 . 1 5 . 2 5 . 2 5 . 4 5 . 5 5 . 8 5 . 8
1982 4 . 5 4 . 6 4 . 7 4 . 8 4 . 9 5 . 0 5 . 2 5 . 2 5 . 3 5 . 5 5 . 8 5 . 7 6.0 6 . 3 6.0 6.2 6 . 3 6 . 5 6 . 7 7 . 0 7 . 2
1983 4 . 6 4 . 7 4 . 8 4 . 8 5 . 0 5 . 1 5 . 2 5 . 3 5 . 4 5 . 6 5 . 8 5 . 8 6.1 6 . 3 6.1 6 . 3 6 . 3 6.6 6 . 7 7 . 0 7 . 21984 4 . 8 4 . 9 5 . 0 5. 1 5 . 2 5 . 4 5 . 5 5 . 6 5 . 7 5 . 9 6.1 6.1 6 . 3 6.6 6 . 4 6.6 6 . 7 6 . 9 7 . 1 7 . 4 7 . 5
1985 5 . 2 5 . 3 5 . 4 5 . 5 5 . 6 5 . 8 5 . 9 6.0 6.1 6 . 3 6.6 6 . 5 6.8 7 . 1 6 . 9 7 . 2 7 . 2 7 . 5 7 . 7 8.0 8.21986 5 . 4 5 . 5 5 . 6 5 . 7 5 . 9 6.0 6.2 6 . 3 6 . 4 6.6 6 . 9 6.8 7 . 1 7 . 4 7 . 2 7 . 5 7 . 5 7 . 8 8.0 8 . 3 8 . 5
1987 5 . 4 5 . 5 5 . 6 5 . 7 5 . 8 5 . 9 6.1 6.2 6 . 3 6 . 5 6 . 7 6 . 7 7 . 0 7 . 2 7 . 1 7 . 3 7 . 4 7 . 6 7 . 8 8.1 8.2
Stocks, Bonds, B
ills, and In
flation: H
istorical Retu
rns

17
9
/
E X H IB IT A -5 (C o n tin u e d )
T O T H EE N D O F
F R O M T H E B E G I N N I N G O F
1968 1969 1970 1971
1968
1969
4 . 5
1 . 9 - 0 . 7
1970 6.6 7 . 7 1 6 . 9
1971 7 . 2 8.0 1 2 . 7
1972 6.8 7 . 3 10.11973 6 . 4 6.8 8 . 7
1974 6 . 3 6.6 8.11975 6 . 5 6.8 8.11976 7 . 2 7 . 5 8 . 7
1977 6.6 6.8 7 . 8
1978 6 . 3 6 . 5 7 . 3
1979 6.1 6 . 3 7 . 0
1980 5 . 9 6.1 6 . 7
1981 6.2 6 . 3 6 . 9
1982 7 . 6 7 . 8 8 . 5
1983 7 . 6 7 . 8 8 . 4
1984 7 . 9 8.2 8.81985 8.6 8.8 9 . 5
1986 8 . 9 9 . 2 9 . 8
1987 8.6 8.8 9 . 4
1975 1976 1977 1978 1979 1980 1981 1982 1983 1984 1985 1986 1987
3 . 9
6.6 9 . 5
1 3 . 7 1 8 . 9 2 9 . 1
12.1 1 4 . 9 1 7 . 8 7 . 4
1 2 . 4 1 4 . 7 1 6 . 5 1 0 . 7 1 4 . 0
1 3 . 7 1 5 . 8 1 7 . 4 1 3 . 8 1 7 . 1 2 0 . 3
1 3 . 9 1 5 . 7 1 7 . 0 14. 1 1 6 . 5 1 7 . 7
1 2 . 5 1 3 . 8 1 4 . 5 11.8 1 2 . 9 1 2 . 5
Ap
pen
dix

18
0 E X H IB IT A -6
U .S . TR E A SU R Y BILLS: TOTAL R E T U R N S RATES O F R E T U R N F O R A LL Y EARLY H O L D IN G P E R IO D S FR O M 1 9 2 6 TO 1 9 8 7
(P e r c e n t P e r A n n u m C o m p o u n d e d A n n u a lly )
F R O M T H E B E G I N N I N G O FT O T H E E N D O F 1926 1927 1928 1929 1930 1931 1932 1933 1934 1935 1936 1937 1938 1939 1940 1941 1942 1943 1944 1945 1946
1926 3 . 3
1927 3 . 2 3 . 1
1928 3 . 2 3 . 2 3 . 2
1929 3 . 6 3 . 7 4 . 0 4 . 7
1930 3 . 4 3 . 4 3 . 5 3 . 6 2 . 41931 3 . 0 2 . 9 2 . 9 2 . 7 1 . 7 1.11932 2 . 7 2.6 2 . 5 2 . 3 1 . 5 1.0 1.01933 2 . 4 2 . 3 2.1 1 . 9 1.2 0.8 0.6 0 . 31934 2.1 2.0 1.8 1.6 1.0 0.6 0 . 5 0.2 0.21935 1 . 9 1.8 1.6 1 . 4 0.8 0 . 5 0 . 4 0.2 0.2 0.21936 1.8 1.6 1 . 5 1.2 0 . 7 0 . 5 0 . 4 0.2 0.2 0.2 0.21937 1.6 1 . 5 1 . 3 1.1 0 . 7 0 . 4 0 . 3 0.2 0.2 0.2 0.2 0 . 31938 1 . 5 1 . 4 1.2 1.0 0.6 0 . 4 0 . 3 0.2 0.2 0.2 0.2 0.1 - 0.01939 1 . 4 1 . 3 1.1 0 . 9 0.6 0 . 3 0 . 3 0.2 0.1 0.1 0.1 0.1 0.0 0. 0
1940 1 . 3 1.2 1.0 0 . 9 0 . 5 0 . 3 0.2 0.1 0.1 0.1 0.1 0.1 0. 0 0. 0 0. 01941 1.2 1.1 1.0 0.8 0 . 5 0 . 3 0.2 0.1 0.1 0.1 0.1 0.1 0.0 0. 0 0. 0 0.11942 1.2 1.1 0 . 9 0.8 0 . 5 0 . 3 0.2 0.1 0.1 0.1 0.1 0.1 0.1 0.1 0.1 0.2 0 . 31943 1.1 1.0 0 . 9 0 . 7 0 . 4 0 . 3 0.2 0.2 0.2 0.1 0.1 0.1 0.1 0.1 0.2 0.2 0 . 3 0 . 31944 1.1 1.0 0.8 0 . 7 0 . 4 0 . 3 0.2 0.2 0.2 0.2 0.2 0.2 0.1 0.2 0.2 0 . 3 0 . 3 0 . 3 0 . 31945 1.1 0 . 9 0.8 0 . 7 0 . 4 0 . 3 0.2 0.2 0.2 0.2 0.2 0.2 0.2 0.2 0.2 0 . 3 0 . 3 0 . 3 0 . 3 0 . 31946 1.0 0 . 9 0.8 0 . 7 0 . 4 0 . 3 0 . 3 0.2 0.2 0.2 0.2 0.2 0.2 0.2 0.2 0 . 3 0 . 3 0 . 3 0 . 3 0 . 3 0 . 41947 1.0 0 . 9 0.8 0 . 7 0 . 4 0 . 3 0 . 3 0.2 0.2 0.2 0.2 0.2 0.2 0.2 0 . 3 0 . 3 0 . 4 0 . 4 0 . 4 0 . 4 0 . 41948 1.0 0 . 9 0.8 0 . 7 0 . 4 0 . 3 0 . 3 0 . 3 0 . 3 0 . 3 0 . 3 0 . 3 0 . 3 0 . 3 0 . 3 0 . 4 0 . 4 0 . 4 0 . 5 0 . 5 0.61949 1.0 0 . 9 0.8 0 . 7 0 . 5 0 . 4 0 . 3 0 . 3 0 . 3 0 . 3 0 . 3 0 . 3 0 . 3 0 . 4 0 . 4 0 . 5 0 . 5 0 . 5 0.6 0.6 0 . 7
1950 1.0 0 . 9 0.8 0 . 7 0 . 5 0 . 4 0 . 4 0 . 4 0 . 4 0 . 4 0 . 4 0 . 4 0 . 4 0 . 4 0 . 5 0 . 5 0.6 0.6 0 . 7 0 . 7 0.81951 1.0 0 . 9 0.8 0 . 7 0.6 0 . 5 0 . 4 0 . 4 0 . 4 0 . 4 0 . 5 0 . 5 0 . 5 0 . 5 0.6 0.6 0 . 7 0 . 7 0.8 0.8 0 . 91952 1.0 1.0 0 . 9 0.8 0.6 0 . 5 0 . 5 0 . 5 0 . 5 0 . 5 0 . 5 0 . 5 0.6 0.6 0.6 0 . 7 0.8 0.8 0 . 9 0 . 9 1.01953 1.1 1.0 0 . 9 0.8 0 . 7 0.6 0.6 0 . 5 0.6 0.6 0.6 0.6 0.6 0 . 7 0 . 7 0.8 0.8 0 . 9 1.0 1.0 1.11954 1.1 1.0 0 . 9 0.8 0 . 7 0.6 0.6 0.6 0.6 0.6 0.6 0.6 0 . 7 0 . 7 0 . 7 0.8 0 . 9 0 . 9 0 . 9 1.0 1.11955 1.1 1.0 0 . 9 0.8 0 . 7 0.6 0.6 0.6 0.6 0.6 0 . 7 0 . 7 0 . 7 0 . 7 0.8 0.8 0 . 9 1.0 1.0 1.1 1.11956 1.1 1.1 1.0 0 . 9 0.8 0 . 7 0 . 7 0 . 7 0 . 7 0 . 7 0 . 7 0.8 0.8 0.8 0 . 9 0 . 9 1.0 1.1 1.1 1.2 1 . 31957 1.2 1.1 1.1 1.0 0.8 0.8 0.8 0.8 0.8 0.8 0 . 9 0 . 9 0 . 9 1.0 1.0 1.1 1.1 1.2 1 . 3 1 . 3 1. 41958 1.2 1.1 1.1 1.0 0 . 9 0.8 0.8 0.8 0.8 0 . 9 0 . 9 0 . 9 0 . 9 1.0 1.0 1.1 1.2 1.2 1 . 3 1 . 3 1. 41959 1 . 3 1.2 1.1 1.1 0 . 9 0 . 9 0 . 9 0 . 9 0 . 9 0 . 9 1.0 1.0 1.0 1.1 1.1 1.2 1 . 3 1 . 3 1 . 4 1 . 4 1 . 5
Stocks, Bon
ds, Bills, an
d Inflation
: Historical R
eturn
s

181
EXHIBIT A-6 (Continued)
T O T H E
E N D O F
F R O M T H E B E G I N N I N G O F
1926 1927 1928 1929 1930 1931 1932
1 . 3 1.2 1 . 2 1.1 1.0 1.0 0 . 9
1 . 3 1 . 3 1.2 1.1 1.0 1.0 1.01 . 4 1 . 3 1.2 1.2 1.1 1.0 1.01 . 4 1 . 3 1 . 3 1.2 1.1 1.1 1.11 . 5 1 . 4 1 . 4 1 . 3 1.2 1.2 1.21 . 5 1 . 5 1 . 4 1 . 4 1 . 3 1 . 3 1 . 3
1.6 1 . 5 1 . 5 1 . 5 1 . 4 1 . 3 1 . 4
1 . 7 1.6 1.6 1 . 5 1 . 5 1 . 4 1 . 4
1 . 7 1 . 7 1 . 7 1.6 1 . 5 1 . 5 1 . 5
1.8 1.8 1.8 1 . 7 1 . 7 1.6 1 . 7
1 . 9 1 . 9 1 . 9 1 . 9 1.8 1.8 1.82.0 2.0 1 . 9 1 . 9 1.8 1.8 1 . 9
2.0 2.0 2.0 2.0 1 . 9 1 . 9 1 . 9
2.1 2.1 2.1 2.1 2.0 2.0 2.02 . 3 2.2 2.2 2.2 2.1 2.1 2.22 . 3 2 . 3 2 . 3 2 . 3 2.2 2.2 2.22 . 4 2 . 4 2 . 3 2 . 3 2 . 3 2 . 3 2 . 3
2 . 4 2 . 4 2 . 4 2 . 4 2 . 3 2 . 3 2 . 4
2 . 5 2 . 5 2 . 5 2 . 5 2 . 4 2 . 4 2 . 5
2 . 7 2.6 2.6 2.6 2.6 2.6 2.62.8 2.8 2.8 2.8 2 . 7 2 . 7 2.83 . 0 3 . 0 3 . 0 3 . 0 3 . 0 3 . 0 3 . 0
3. 1 3 . 1 3 . 1 3 . 1 3 . 1 3 . 1 3 . 2
3 . 2 3 . 2 3 . 2 3 . 2 3 . 2 3 . 2 3 . 3
3 . 3 3 . 3 3 . 3 3 . 3 3 . 3 3 . 3 3 . 4
3 . 4 3 . 4 3 . 4 3 . 4 3 . 4 3 . 4 3 . 5
3 . 5 3 . 5 3 . 5 3 . 5 3 . 4 3 . 5 3 . 5
3 . 5 3 . 5 3 . 5 3 . 5 3 . 5 3 . 5 3 . 5
1933 1934 1935 1936 1937 1939 1940 1941 1942 1943 1944 1945 1946
Appen
dix

182 E X H IB IT A -6 (C o n tin u ed )
F R O M T H E B E G I N N I N G O FT O T H E E N D O F 1947 1948 1949 1950 1951 1952 1953 1954 1955 1956 1957 1958 1959 1960 1961 1962 1963 1964 1965 1966 1967
1947 0 . 5
1948 0 . 7 0.81949 0.8 1.0 1.11950 0 . 9 1.0 1.1 1.21951 1.0 1.2 1 . 3 1 . 3 1 . 51952 1.1 1 . 3 1 . 4 1 . 4 1.6 1 . 7
1953 1.2 1 . 3 1 . 5 1 . 5 1 . 7 1 . 7 1.81954 1.2 1 . 3 1 . 4 1 . 4 1 . 5 1 . 4 1 . 3 0 . 91955 1.2 1 . 3 1 . 4 1 . 4 1 . 5 1 . 5 1 . 4 1.2 1.61956 1 . 3 1 . 4 1 . 5 1.6 1.6 1 . 7 1 . 7 1.6 2.0 2 . 51957 1 . 5 1.6 1 . 7 1.8 1 . 9 1 . 9 2.0 2.0 2 . 4 2.8 3 . 11958 1 . 5 1.6 1 . 7 1 . 7 1.8 1 . 9 1 . 9 1 . 9 2.2 2 . 4 2 . 3 1 . 51959 1.6 1 . 7 1.8 1 . 9 1 . 9 2.0 2.0 2.1 2 . 3 2 . 5 2 . 5 2.2 3 . 0
1960 1 . 7 1.8 1 . 9 1 . 9 2.0 2.1 2.1 2.2 2 . 4 2 . 5 2.6 2 . 4 2.8 2 . 71961 1 . 7 1.8 1 . 9 2.0 2.0 2.1 2.1 2.2 2 . 3 2 . 5 2 . 5 2 . 3 2.6 2 . 4 2.11962 1.8 1 . 9 1 . 9 2.0 2.1 2.1 2.2 2.2 2 . 4 2 . 5 2 . 5 2 . 4 2.6 2 . 5 2 . 4 2 . 71963 1 . 9 2.0 2.0 2.1 2.2 2.2 2 . 3 2 . 3 2 . 5 2.6 2.6 2 . 5 2 . 7 2 . 7 2 . 7 2 . 9 3 . 11964 2.0 2.0 2.1 2.2 2 . 3 2 . 3 2 . 4 2 . 4 2.6 2 . 7 2 . 7 2 . 7 2 . 9 2.8 2 . 9 3 . 1 3 . 3 3 . 51965 2.1 2.1 2.2 2 . 3 2 . 4 2 . 4 2 . 5 2 . 5 2 . 7 2.8 2 . 9 2.8 3 . 0 3 . 0 3 . 1 3 . 3 3 . 5 3 . 7 3 . 91966 2.2 2 . 3 2 . 4 2 . 4 2 . 5 2.6 2 . 7 2 . 7 2 . 9 3 . 0 3 . 0 3 . 0 3 . 2 3 . 3 3 . 4 3 . 6 3 . 8 4 . 1 4 . 3 4 . 81967 2 . 3 2 . 4 2 . 5 2 . 5 2.6 2 . 7 2.8 2.8 3 . 0 3 . 1 3 . 2 3 . 2 3 . 3 3 . 4 3 . 5 3 . 7 3 . 9 4 . 1 4 . 3 4 . 5 4 . 21968 2 . 4 2 . 5 2.6 2 . 7 2.8 2.8 2 . 9 3 . 0 3. 1 3 . 3 3 . 3 3 . 3 3 . 5 3 . 6 3 . 7 3 . 9 4 . 1 4 . 3 4 . 5 4 . 7 4 . 71969 2.6 2 . 7 2.8 2 . 9 3 . 0 3 . 0 3 . 1 3 . 2 3 . 4 3 . 5 3 . 6 3 . 6 3 . 8 3 . 9 4 . 0 4 . 3 4 . 5 4 . 7 4 . 9 5 . 2 5 . 3
1970 2.8 2 . 9 3 . 0 3 . 0 3 . 1 3 . 2 3 . 3 3 . 4 3 . 6 3 . 7 3 . 8 3 . 8 4 . 0 4 . 1 4 . 3 4 . 5 4 . 7 5 . 0 5 . 2 5 . 5 5 . 61971 2.8 2 . 9 3 . 0 3 . 1 3 . 2 3 . 3 3 . 4 3 . 4 3 . 6 3 . 7 3 . 8 3 . 9 4 . 0 4 . 1 4 . 3 4 . 5 4 . 7 4 . 9 5 . 1 5 . 3 5 . 41972 2 . 9 3 . 0 3 . 0 3 . 1 3 . 2 3 . 3 3 . 4 3 . 5 3 . 6 3 . 7 3 . 8 3 . 9 4 . 0 4 . 1 4 . 2 4 . 4 4 . 6 4 . 8 4 . 9 5 . 1 5. 11973 3 . 0 3 . 1 3 . 2 3 . 3 3 . 4 3 . 5 3 . 6 3 . 6 3 . 8 3 . 9 4 . 0 4 . 1 4 . 2 4 . 3 4 . 4 4 . 6 4 . 8 5 . 0 5 . 1 5 . 3 5 . 41974 3 . 2 3 . 3 3 . 4 3 . 5 3 . 6 3 . 7 3 . 8 3 . 8 4 . 0 4 . 1 4 . 2 4 . 3 4 . 5 4 . 6 4 . 7 4 . 9 5 . 1 5 . 3 5 . 4 5 . 6 5 . 71975 3 . 3 3 . 4 3 . 5 3 . 6 3 . 7 3 . 7 3 . 8 3 . 9 4 . 1 4 . 2 4 . 3 4 . 4 4 . 5 4 . 6 4 . 8 5 . 0 5 . 1 5 . 3 5 . 5 5 . 6 5 . 71976 3 . 3 3 . 4 3 . 5 3 . 6 3 . 7 3 . 8 3 . 9 4 . 0 4 . 1 4 . 2 4 . 3 4 . 4 4 . 6 4 . 7 4 . 8 5 . 0 5 . 1 5 . 3 5 . 4 5 . 6 5 . 61977 3 . 4 3 . 5 3 . 6 3 . 7 3 . 8 3 . 9 3 . 9 4 . 0 4 . 2 4 . 3 4 . 4 4 . 4 4 . 6 4 . 7 4 . 8 5 . 0 5 . 1 5 . 3 5 . 4 5 . 5 5 . 61978 3 . 5 3 . 6 3 . 7 3 . 8 3 . 9 4 . 0 4 . 1 4 . 2 4 . 3 4 . 4 4 . 5 4 . 6 4 . 7 4 . 8 4 . 9 5 . 1 5 . 3 5 . 4 5 . 5 5 . 7 5 . 71979 3 . 7 3 . 8 3 . 9 4 . 0 4 . 1 4 . 2 4 . 3 4 . 4 4 . 5 4 . 7 4 . 8 4 . 8 5 . 0 5 . 1 5 . 2 5 . 4 5 . 5 5 . 7 5 . 8 6.0 6.11980 3 . 9 4 . 0 4 . 1 4 . 2 4 . 3 4 . 4 4 . 5 4 . 6 4 . 8 4 . 9 5 . 0 5 . 1 5 . 3 5 . 4 5 . 5 5 . 7 5 . 9 6.0 6.2 6 . 3 6 . 41981 4 . 2 4 . 3 4 . 4 4 . 5 4 . 7 4 . 8 4 . 9 5 . 0 5. 1 5 . 3 5 . 4 5 . 5 5 . 7 5 . 8 5 . 9 6.1 6 . 3 6 . 5 6 . 7 6.8 7 . 01982 4 . 4 4 . 5 4 . 6 4 . 7 4 . 8 4 . 9 5 . 1 5 . 2 5 . 3 5 . 5 5 . 6 5 . 7 5 . 9 6.0 6.1 6 . 3 6 . 5 6 . 7 6 . 9 7 . 0 7 . 21983 4 . 5 4 . 6 4 . 7 4 . 8 4 . 9 5 . 1 5 . 2 5 . 3 5 . 4 5 . 6 5 . 7 5 . 8 6.0 6.1 6.2 6 . 4 6.6 6.8 7 . 0 7 . 1 7 . 31984 4 . 6 4 . 8 4 . 9 5 . 0 5 . 1 5 . 2 5 . 3 5 . 4 5 . 6 5 . 7 5 . 8 5 . 9 6.1 6.2 6 . 4 6.6 6.8 6 . 9 7 . 1 7 . 3 7 . 41985 4 . 7 4 . 8 4 . 9 5 . 1 5 . 2 5 . 3 5 . 4 5 . 5 5 . 7 5 . 8 5 . 9 6.0 6.2 6 . 3 6 . 4 6.6 6.8 7 . 0 7 . 1 7 . 3 7 . 41986 4 . 8 4 . 9 5 . 0 5 . 1 5 . 2 5 . 3 5 . 4 5 . 5 5 . 7 5 . 8 5 . 9 6.0 6.2 6 . 3 6 . 4 6.6 6.8 6 . 9 7 . 1 7 . 3 7 . 41987 4 . 8 4 . 9 5 . 0 5 . 1 5 . 2 5 . 3 5 . 4 5 . 5 5 . 7 5 . 8 5 . 9 6.0 6.2 6 . 3 6 . 4 6.6 6 . 7 6 . 9 7 . 0 7 . 2 7 . 3
Stocks, Bon
ds, Bills, an
d Inflation
: Historical R
eturn
s

18
3
EXHIBIT A-6 (Continued)
F R O M T H E B E G I N N I N G O F
E N D O F 1968 1969 1970 1971 1972 1973 1974 1975 1976 1977 1978 1979
1968 5 . 2
1969 5 . 9 6.61970 6.1 6.6 6 . 5
1971 5 . 7 5 . 8 5 . 5 4 . 4
1972 5 . 3 5 . 3 4 . 9 4 . 1 3 . 8
1973 5 . 6 5 . 6 5 . 4 5 . 0 5 . 4 6 . 9
1974 5 . 9 6.0 5 . 9 5 . 8 6.2 7 . 5 8.01975 5 . 9 6.0 5 . 9 5 . 8 6.1 6 . 9 6 . 9 5 . 8
1976 5 . 8 5 . 9 5 . 8 5 . 7 5 . 9 6 . 4 6 . 3 5 . 4 5 . 1
1977 5 . 7 5 . 8 5 . 7 5 . 6 5 . 8 6.2 6.0 5 . 3 5 . 1 5. 1
1978 5 . 9 5 . 9 5 . 9 5 . 8 6.0 6 . 3 6.2 5 . 8 5 . 8 6.1 7 . 2
1979 6.2 6 . 3 6 . 3 6 . 3 6 . 5 6 . 9 6 . 9 6 . 7 6 . 9 7 . 5 8.8 1 0 . 4
1980 6.6 6 . 7 6 . 7 6.8 7 . 0 7 . 4 7 . 5 7 . 4 7 . 8 8 . 5 9 . 6 10.81981 7 . 2 7 . 3 7 . 4 7 . 5 7 . 8 8.2 8 . 4 8 . 4 8 . 9 9 . 7 10.8 12.11982 7 . 4 7 . 6 7 . 6 7 . 7 8.0 8 . 5 8.6 8 . 7 9 . 1 9 . 8 10.8 1 1 . 7
1983 7 . 5 7 . 6 7 . 7 7 . 8 8.1 8 . 5 8.6 8 . 7 9 . 1 9 . 7 10 . 4 11.11984 7 . 6 7 . 8 7 . 9 7 . 9 8.2 8.6 8.8 8.8 9 . 2 9 . 7 10 . 4 1 0 . 9
1985 7 . 6 7 . 8 7 . 8 7 . 9 8.2 8 . 5 8 . 7 8 . 7 9 . 0 9 . 5 10.0 1 0 . 4
1986 7 . 5 7 . 7 7 . 7 7 . 8 8.1 8 . 4 8 . 5 8 . 5 8.8 9 . 1 9 . 6 9 . 9
1987 7 . 4 7 . 6 7 . 6 7 . 7 7 . 9 8.2 8 . 3 8 . 3 8 . 5 8.8 9 . 2 9 . 4
1980 1981 1982 1983 1984 1985 1986 1987
11.21 3 . 0 1 4 . 7
12.1 12.6 10 . 5
1 1 . 3 1 1 . 3 9 . 7 8.811.0 11.0 9 . 7 9 . 3
1 0 . 5 1 0 . 3 9 . 2 8.89 . 8 9 . 6 8.6 8.19 . 3 9 . 0 8.1 7 . 6
9 . 8
8 .8 7 . 7
7 . 9 6 . 9 6 . 2
7 . 3 6 . 4 5 . 8 5 . 5

E X H IB IT A -7C O N SU M E R P R IC E IN D E X : IN FLA TIO N RATES
RATES O F R E T U R N F O R A LL YEARLY H O L D IN G P E R IO D S FR O M 1 9 2 6 TO 1 9 8 7
(P e r c e n t P e r A n n u m C o m p o u n d e d A n n u a lly )
FROM THE BEGINNING OFT O T H E E N D O F 1926 1927 1928 1929 1930 1931 1932 1933 1934 1935 1936 1937 1938 1939 1940 1941 1942 1943 1944 1945 1946
1926 - 1 . 5
1927 - 1 . 8 - 2 . 1
1928 - 1 . 5 - 1 . 5 - 1.01929 - 1 . 1 - 1.0 - 0 . 4 0.21930 - 2 . 1 - 2 . 2 - 2 . 3 - 3 . 0 - 6 . 0
1931 - 3 . 4 - 3 . 7 - 4 . 2 - 5 . 2 - 7 . 8 - 9 . 51932 - 4 . 4 - 4 . 9 - 5 . 4 - 6 . 5 - 8 . 6 9 . 9 - 1 0 . 31933 - 3 . 8 - 4 . 1 - 4 . 5 - 5 . 1 - 6 . 4 - 6 . 6 - 5 . 0 0 . 51934 - 3 . 2 - 3 . 4 - 3 . 6 - 4 . 0 - 4 . 8 - 4 . 5 - 2 . 7 1 . 3 2.01935 - 2 . 6 - 2 . 7 - 2 . 8 - 3 . 0 - 3 . 5 - 3 . 0 - 1 . 3 1.8 2 . 5 3 . 01936 2.2 2 . 3 - 2 . 3 - 2 . 5 - 2 . 9 - 2 . 3 - 0 . 8 1 . 7 2.1 2.1 1.21937 - 1 . 8 - 1 . 8 - 1 . 8 - 1 . 9 - 2 . 1 - 1 . 6 - 0 . 2 2.0 2 . 3 2 . 4 2.2 3 . 11938 - 1 . 9 - 1 . 9 - 1 . 9 - 2 . 0 - 2 . 2 - 1 . 7 - 0 . 6 1.2 1 . 3 1.1 0 . 5 0.1 - 2 . 81939 - 1 . 8 - 1 . 8 - 1 . 8 - 1 . 8 - 2 . 0 1.6 0.6 0 . 9 1.0 0.8 0.2 - 0.1 - 1 . 6 - 0 . 5
1940 - 1 . 6 - 1 . 6 - 1 . 6 - 1 . 6 - 1 . 8 - 1 . 3 - 0 . 4 0 . 9 1.0 0.8 0 . 4 0.2 - 0 . 8 0.2 1.01941 - 0 . 9 - 0 . 9 - 0 . 8 - 0 . 8 - 0 . 9 - 0 . 4 0.6 1 . 9 2.0 2.0 1 . 9 2.0 1 . 7 3 . 3 5 . 2 9 . 71942 - 0 . 3 - 0 . 3 - 0 . 2 - 0.1 - 0.1 0 . 4 1 . 3 2.6 2.8 2 . 9 2 . 9 3 . 2 3 . 2 4 . 8 6.6 9 . 5 9 . 31943 - 0 . 2 - 0.1 0.0 0.1 0.1 0.6 1 . 5 2.6 2 . 9 2 . 9 2 . 9 3 . 2 3 . 2 4 . 4 5 . 7 7 . 3 6.2 3 . 21944 0.0 0.0 0.2 0.2 0.2 0 . 7 1 . 5 2.6 2.8 2 . 9 2.8 3 . 1 3 . 0 4 . 1 5 . 0 6.0 4 . 8 2.6 2.11945 0.1 0.2 0 . 3 0 . 4 0 . 4 0.8 1.6 2.6 2 . 7 2.8 2.8 3 . 0 2 . 9 3 . 8 4 . 5 5 . 2 4 . 2 2 . 5 2.2 2 . 31946 0 . 9 1.0 1.2 1 . 3 1 . 3 1.8 2.6 3 . 6 3 . 9 4 . 0 4 . 1 4 . 4 4 . 5 5 . 5 6 . 4 7 . 3 6.8 6.2 7 . 3 9 . 9 18. 21947 1.2 1 . 4 1 . 5 1 . 7 1 . 7 2.2 3 . 0 4 . 0 4 . 2 4 . 4 4 . 5 4 . 8 5 . 0 5 . 9 6 . 7 7 . 5 7 . 2 6.8 7 . 7 9 . 6 13 . 51948 1 . 3 1 . 4 1.6 1 . 7 1.8 2 . 3 3 . 0 3 . 9 4 . 1 4 . 3 4 . 4 4 . 6 4 . 8 5 . 6 6.2 6 . 9 6 . 5 6.1 6 . 7 7 . 8 9 . 81949 1.2 1 . 3 1 . 4 1 . 5 1.6 2.0 2 . 7 3 . 5 3 . 7 3 . 8 3 . 9 4 . 1 4 . 2 4 . 9 5 . 4 5 . 9 5 . 5 4 . 9 5 . 2 5 . 8 6.81950 1 . 3 1 . 5 1.6 1 . 7 1.8 2.2 2 . 9 3 . 7 3 . 9 4 . 0 4 . 0 4 . 2 4 . 3 4 . 9 5 . 4 5 . 9 5 . 5 5 . 0 5 . 3 5 . 8 6.61951 1 . 5 1.6 1.8 1 . 9 2.0 2 . 4 3 . 0 3 . 8 4 . 0 4 . 1 4 . 1 4 . 3 4 . 4 5 . 0 5 . 5 5 . 9 5 . 5 5 . 1 5 . 4 5 . 8 6 . 51952 1 . 5 1.6 1.8 1 . 9 1 . 9 2 . 3 2 . 9 3 . 6 3 . 8 3 . 9 4 . 0 4 . 1 4 . 2 4 . 7 5 . 1 5 . 5 5 . 1 4 . 7 4 . 9 5 . 2 5 . 61953 1 . 5 1.6 1 . 7 1.8 1 . 9 2.2 2.8 3 . 5 3 . 6 3 . 7 3 . 8 3 . 9 4 . 0 4 . 4 4 . 8 5 . 1 4 . 7 4 . 3 4 . 4 4 . 7 5 . 01954 1 . 4 1 . 5 1.6 1 . 7 1.8 2.1 2 . 7 3 . 3 3 . 4 3 . 5 3 . 5 3 . 7 3 . 7 4. 1 4 . 4 4 . 7 4 . 3 3 . 9 4 . 0 4 . 2 4 . 41955 1. 4 1 . 5 1.6 1 . 7 1 . 7 2.1 2.6 3 . 2 3 . 3 3 . 4 3 . 4 3 . 5 3 . 5 3 . 9 4 . 2 4 . 4 4 . 0 3 . 6 3 . 7 3 . 8 4 . 01956 1 . 4 1 . 5 1.6 1 . 7 1.8 2.1 2.6 3 . 2 3 . 3 3 . 3 3 . 3 3 . 5 3 . 5 3 . 8 4 . 1 4 . 3 3 . 9 3 . 6 3 . 6 3 . 7 3 . 91957 1 . 5 1 . 5 1 . 7 1.8 1.8 2.1 2.6 3 . 2 3 . 3 3 . 3 3 . 3 3 . 4 3 . 5 3 . 8 4 . 0 4 . 2 3 . 9 3 . 5 3 . 6 3 . 7 3 . 81958 1 . 5 1.6 1 . 7 1.8 1.8 2.1 2.6 3 . 1 3 . 2 3 . 3 3 . 3 3 . 4 3 . 4 3 . 7 3 . 9 4 . 1 3 . 8 3 . 4 3 . 4 3 . 5 3 . 61959 1 . 5 1.6 1 . 7 1.8 1 . 8 2.1 2 . 5 3 . 0 3 . 1 3 . 2 3 . 2 3 . 3 3 . 3 3 . 6 3 . 8 3 . 9 3 . 6 3 . 3 3 . 3 3 . 4 3 . 5
Stocks, Bon
ds, Bills, an
d Inflation
: Historical R
eturn
s
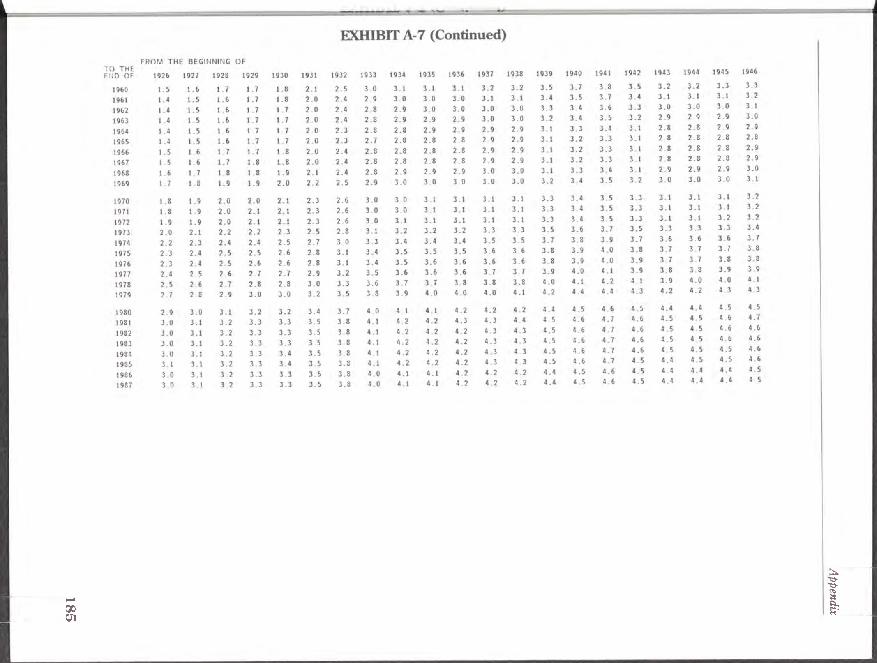
18
5
Appen
dix

186 E X H IB IT A -7 (C o n tin u ed )
FROM THE BEGINNING OFT O T H E E N D O F 1947 1948 1949 1950 1951 1952 1953 1954 1955 1956 1957 1958 1959 1960 1961 1962 1963 1964 1965 1966 1967
1947 9 . 0
1948 5 . 8 2 . 7
1949 3 . 2 0 . 4 - 1 . 8
1950 3 . 8 2.2 1 . 9 5 . 81951 4 . 3 3 . 1 3 . 2 5 . 8 5 . 91952 3 . 7 2.6 2.6 4 . 2 3 . 3 0 . 91953 3 . 2 2 . 3 2.2 3 . 3 2 . 4 0.8 0.61954 2.8 1 . 9 1.8 2 . 5 1 . 7 0 . 3 0.1 0 . 51955 2 . 5 1 . 7 1.6 2.1 1 . 4 0 . 3 0.2 - 0 . 1 0 . 41956 2 . 5 1.8 1 . 7 2.2 1 . 7 0.8 0.8 0 . 9 1.6 2 . 91957 2.6 2.0 1 . 9 2 . 3 1 . 9 1.2 1 . 3 1 . 4 2.1 2 . 9 3 . 01958 2 . 5 1 . 9 1 . 9 2 . 3 1.8 1 . 3 1 . 3 1 . 5 2.0 2 . 5 2 . 4 1.81959 2 . 4 1 . 9 1.8 2.2 1.8 1 . 3 1 . 4 1 . 5 1 . 9 2 . 3 2.1 1.6 1 . 5
1960 2 . 4 1 . 9 1.8 2.1 1.8 1 . 3 1 . 4 1 . 5 1.8 2.1 1 . 9 1.6 1 . 5 1 . 51961 2.2 1.8 1 . 7 2.0 1 . 7 1 . 3 1 . 3 1 . 4 1 . 7 1 . 9 1 . 7 1 . 4 1.2 1.1 0 . 71962 2.2 1 . 7 1 . 7 1 . 9 1.6 1 . 3 1 . 3 1 . 4 1.6 1.8 1.6 1 . 3 1.2 1.1 0 . 9 1.21963 2.2 1 . 7 1 . 7 1 . 9 1.6 1 . 3 1 . 3 1 . 4 1.6 1.8 1.6 1 . 4 1 . 3 1 . 3 1.2 1 . 4 1.61964 2.1 1 . 7 1.6 1 . 9 1.6 1 . 3 1 . 3 1 . 4 1.6 1 . 7 1.6 1 . 4 1 . 3 1.2 1.2 1 . 4 1 . 4 1.21965 2.1 1 . 7 1 . 7 1 . 9 1.6 1 . 3 1 . 4 1 . 4 1.6 1 . 7 1.6 1 . 4 1 . 4 1 . 4 1 . 3 1 . 5 1.6 1.6 1 . 91966 2.2 1.8 1.8 2.0 1 . 7 1 . 5 1 . 5 1.6 1 . 7 1 . 9 1.8 1.6 1.6 1.6 1 . 7 1 . 9 2.0 2.2 2.6 3 . 41967 2.2 1 . 9 1.8 2.0 1.8 1.6 1.6 1 . 7 1.8 2.0 1 . 9 1.8 1.8 1.8 1 . 9 2.1 2.2 2 . 4 2.8 3 . 2 3 . 01968 2 . 3 2.0 2.0 2.2 2.0 1 . 7 1.8 1 . 9 2.0 2.2 2.1 2.0 2.1 2.1 2.2 2 . 4 2.6 2.8 3 . 3 3 . 7 3 . 91969 2 . 5 2.2 2.2 2 . 4 2.2 2.0 2.0 2.1 2 . 3 2 . 5 2 . 4 2 . 4 2 . 4 2 . 5 2.6 2 . 9 3 . 1 3 . 4 3 . 8 4 . 3 4 . 6
1970 2.6 2 . 3 2 . 3 2 . 5 2 . 3 2.2 2.2 2 . 3 2 . 5 2 . 7 2.6 2.6 2 . 7 2.8 2 . 9 3 . 2 3 . 4 3 . 7 4 . 1 4 . 5 4 . 81971 2.6 2 . 4 2 . 4 2 . 5 2 . 4 2.2 2 . 3 2 . 4 2.6 2 . 7 2 . 7 2 . 7 2 . 7 2.8 3 . 0 3 . 2 3 . 4 3 . 6 4 . 0 4 . 3 4 . 51972 2 . 7 2 . 4 2 . 4 2.6 2 . 4 2 . 3 2 . 3 2 . 4 2.6 2 . 7 2 . 7 2 . 7 2.8 2 . 9 3 . 0 3 . 2 3 . 4 3 . 6 3 . 9 4 . 2 4 . 31973 2 . 9 2.6 2.6 2.8 2 . 7 2.6 2.6 2.8 2 . 9 3 . 1 3 . 1 3 . 1 3 . 2 3 . 3 3 . 4 3 . 7 3 . 9 4 . 1 4 . 4 4 . 8 5 . 01974 3 . 2 3 . 0 3 . 0 3 . 2 3 . 1 3 . 0 3 . 1 3 . 2 3 . 4 3 . 5 3 . 6 3 . 6 3 . 7 3 . 9 4 . 0 4 . 3 4 . 6 4 . 8 5 . 2 5 . 6 5 . 91975 3 . 3 3 . 1 3 . 1 3 . 3 3 . 2 3 . 1 3 . 2 3 . 4 3 . 5 3 . 7 3 . 7 3 . 8 3 . 9 4 . 1 4 . 2 4 . 5 4 . 7 5 . 0 5 . 4 5 . 7 6.01976 3 . 4 3 . 2 3 . 2 3 . 4 3 . 3 3 . 2 3 . 3 3 . 4 3 . 6 3 . 8 3 . 8 3 . 8 4 . 0 4 . 1 4 . 3 4 . 5 4 . 8 5 . 0 5 . 3 5 . 6 5 . 91977 3 . 5 3 . 3 3 . 3 3 . 5 3 . 4 3 . 3 3 . 4 3 . 6 3 . 7 3 . 9 3 . 9 4 . 0 4 . 1 4 . 2 4 . 4 4 . 7 4 . 9 5 . 1 5 . 4 5 . 7 5 . 91978 3 . 7 3 . 5 3 . 5 3 . 7 3 . 6 3 . 5 3 . 6 3 . 8 3 . 9 4 . 1 4 . 2 4 . 2 4 . 3 4 . 5 4 . 7 4 . 9 5 . 1 5 . 4 5 . 7 6.0 6.21979 3 . 9 3 . 8 3 . 8 4 . 0 3 . 9 3 . 9 4 . 0 4 . 1 4 . 3 4 . 5 4 . 5 4 . 6 4 . 8 4 . 9 5 . 1 5 . 4 5 . 6 5 . 9 6.2 6 . 5 6 . 7
1980 4 . 2 4 . 0 4 . 1 4 . 3 4 . 2 4 . 2 4 . 3 4 . 4 4 . 6 4 . 8 4 . 9 4 . 9 5 . 1 5 . 3 5 . 5 5 . 7 6.0 6.2 6.6 6 . 9 7. 11981 4 . 3 4 . 2 4 . 2 4 . 4 4 . 4 4 . 3 4 . 4 4 . 6 4 . 8 4 . 9 5 . 0 5 . 1 5 . 3 5 . 4 5 . 6 5 . 9 6.1 6 . 4 6 . 7 7 . 0 7 . 21982 4 . 3 4 . 2 4 . 2 4 . 4 4 . 3 4 . 3 4 . 4 4 . 5 4 . 7 4 . 9 5 . 0 5 . 1 5 . 2 5 . 4 5 . 5 5 . 8 6.0 6.2 6 . 5 6.8 7 . 01983 4 . 3 4 . 2 4 . 2 4 . 4 4 . 3 4 . 3 4 . 4 4 . 5 4 . 7 4 . 9 4 . 9 5 . 0 5. 1 5 . 3 5 . 5 5 . 7 5 . 9 6.1 6 . 4 6.6 6.81984 4 . 3 4 . 1 4 . 2 4 . 4 4 . 3 4 . 3 4 . 4 4 . 5 4 . 7 4 . 8 4 . 9 5 . 0 5 . 1 5 . 2 5 . 4 5 . 6 5 . 8 6.0 6 . 3 6 . 5 6 . 71985 4 . 3 4 . 1 4 . 2 4 . 3 4 . 3 4 . 3 4 . 4 4 . 5 4 . 6 4 . 8 4 . 9 4 . 9 5 . 0 5 . 2 5 . 3 5 . 5 5 . 7 5 . 9 6.1 6 . 4 6 . 51986 4 . 2 4 . 1 4 . 1 4 . 3 4 . 2 4 . 2 4 . 3 4 . 4 4 . 5 4 . 7 4 . 7 4 . 8 4 . 9 5 . 0 5 . 2 5 . 4 5 . 5 5 . 7 5 . 9 6.1 6.21987 4 . 2 4 . 1 4 . 1 4 . 3 4 . 2 4 . 2 4 . 3 4 . 4 4 . 5 4 . 7 4 . 7 4 . 8 4 . 9 5 . 0 5 . 1 5 . 3 5 . 5 5 . 6 5 . 8 6.0 6.2
Stocks, Bon
ds, Bills, an
d Inflation
: Historical R
eturn
s

18
7
/
EXHIBIT A -7 (C o n tin u e d )
F R O M T H E B E G I N N I N G O F
1970 1971J D O F 1968 1969
1968 4 . 7
1969 5 . 4 6.11970 5 . 4 5 . 8
1971 4 . 9 5 . 0
1972 4 . 6 4 . 6
1973 5 . 3 5 . 4
1974 6 . 3 6 . 5
1975 6 . 4 6.61976 6.2 6 . 4
1977 6.2 6 . 4
1978 6 . 5 6 . 7
1979 7 . 0 7 . 3
1980 7 . 4 7 . 7
1981 7 . 6 7 . 8
1982 7 . 3 7 . 5
1983 7 . 1 7 . 2
1984 6 . 9 7 . 0
1985 6 . 7 6.81986 6 . 4 6 . 5
1987 6 . 3 6 . 4
1973 1974 1975 1976 1977 1978 1979 1980 1981 1982 1983 1984 1985 1986 1987
5 . 5
4 . 4 3 . 4
4 . 1 3 . 4 3 . 4
5 . 2 5 . 2 6.1 8.86.6 6 . 9 8.1 1 0 . 5 12.26 . 7 6 . 9 7 . 8 9 . 3 9 . 6 7 . 0
6 . 4 6.6 7 . 2 8.2 8.0 5 . 9 4 . 8
6 . 4 6.6 7 . 1 7 . 9 7 . 7 6.2 5 . 8 6.86 . 7 6 . 9 7 . 4 8.1 7 . 9 6 . 9 6 . 9 7 . 9 9 . 0
7 . 4 7 . 6 8.1 8.8 8.8 8.1 8 . 4 9 . 7 11.1 1 3 . 3
7 . 8 8.1 8.6 9 . 3 9 . 3 8.8 9 . 2 1 0 . 3 11.6 1 2 . 9 1 2 . 4
7 . 9 8.1 8.6 9 . 2 9 . 3 8 . 9 9 . 2 10.1 1 0 . 9 1 1 . 5 1 0 . 7 8 . 9
7 . 6 7 . 8 8.2 8 . 7 8 . 7 8.2 8 . 4 9 . 0 9 . 5 9 . 6 8 . 3 6 . 4 3 . 9
7 . 3 7 . 5 7 . 8 8.2 8.2 7 . 7 7 . 8 8.2 8 . 5 8 . 4 7 . 2 5 . 5 3 . 8 3 . 8
7 . 1 7 . 2 7 . 5 7 . 9 7 . 8 7 . 3 7 . 4 7 . 7 7 . 8 7 . 6 6 . 5 5 . 1 3 . 9 3 . 9 4 . 0
6 . 9 7 . 0 7 . 2 7 . 5 7 . 4 7 . 0 7 . 0 7 . 3 7 . 3 7 . 1 6.1 4 . 8 3 . 8 3 . 8 3 . 9 3 . 8
6 . 5 6.6 6.8 7 . 1 6 . 9 6 . 5 6 . 5 6.6 6.6 6 . 3 5 . 3 4 . 2 3 . 3 3 . 2 2 . 9 2 . 4
6 . 4 6 . 5 6 . 7 6 . 9 6.8 6 . 3 6 . 3 6 . 4 6 . 4 6.1 5 . 2 4 . 2 3 . 5 3 . 4 3 . 3 3 . 1
1.12. 8
Appen
dix

18
8 E X H IB IT A -8E Q U IT Y R ISK PR E M IU M S: C O M M O N STO C K S M IN U S T R E A SU R Y BILLS
RATES O F R E T U R N FO R ALL YEARLY H O L D IN G P E R IO D S FR O M 1 9 2 6 TO 1 9 8 7
(P e r c e n t P e r A n n u m C o m p o u n d e d A n n u a lly )
F R O M T H E B E G I N N I N G O FT O T H EE N D O F 1926 1927 1928 1929 1930 1931 1932 1933 1934 1935 1936 1937 1938 1939 1940 1941 1942 1943 1944 1945 1946
1926 8.11927 20.0 3 3 . 3
1928 26. 1 3 6 . 2 3 9 . 11929 15. 1 1 7 . 5 1 0 . 3 - 1 2 . 6
1930 5 . 1 4 . 4 - 3 . 7 - 1 9 . 9 - 2 6 . 71931 - 5 . 3 - 7 . 8 - 1 5 . 9 - 2 8 . 9 - 3 5 . 9 - 4 3 . 91932 - 5 . 9 - 8 . 0 - 1 4 . 6 - 2 4 . 4 - 2 8 . 0 - 2 8 . 6 - 9 . 11933 0.1 - 1 . 0 - 5 . 8 - 12 . 9 - 1 3 . 0 - 7 . 8 1 8 . 2 5 3 . 51934 - 0 . 1 - 1 . 1 - 5 . 2 - 1 1 . 1 - 1 0 . 8 - 6 . 3 11.2 2 2 . 9 - 1 . 61935 3 . 9 3 . 4 0.2 - 4 . 4 - 3 . 0 2.6 19 . 3 3 0 . 6 2 0 . 4 4 7 . 41936 6 . 3 6.1 3 . 4 - 0 . 3 1 . 5 7 . 2 22.0 3 1 . 4 2 4 . 7 4 0 . 4 3 3 . 71937 2.0 1 . 4 - 1 . 3 - 5 . 0 - 4 . 0 - 0 . 2 9 . 8 1 4 . 0 5 . 9 8 . 5 6 . 9 - 3 5 . 21938 4 . 0 3 . 6 1 . 3 - 1 . 9 - 0 . 6 3 . 2 12.6 1 6 . 7 1 0 . 5 13. 7 4 . 3 - 7 . 8 31 . 11939 3 . 6 3 . 3 1.1 - 1 . 8 - 0 . 6 2.8 1 0 . 9 14. 1 8.6 10.8 3 . 1 - 5 . 4 1 4 . 3 - 0 . 4
1940 2 . 7 2 . 3 0.2 - 2 . 4 - 1 . 5 1 . 5 8 . 4 10.8 5 . 8 7 . 0 0 . 4 6 . 5 5 . 6 - 5 . 2 - 9 . 81941 1 . 7 1 . 3 - 0 . 7 - 3 . 2 - 2 . 4 0.2 6.2 8.0 3 . 4 4 . 1 - 1 . 7 - 7 . 6 1.0 - 7 . 4 - 10. 7 - 1 1 . 61942 2 . 7 2 . 4 0.6 - 1 . 7 - 0 . 8 1 . 7 7 . 4 9 . 2 5 . 1 6.0 1.1 - 3 . 5 4 . 5 - 1 . 2 - 1 . 5 3 . 0 20.01943 3 . 9 3 . 6 2.0 - 0 . 1 0 . 9 3 . 4 8.8 10.6 7 . 0 8.0 3 . 9 0.2 7 . 8 3 . 6 4 . 7 10.0 2 2 . 7 2 5 . 51944 4 . 6 4 . 4 3 . 0 1.0 2.0 4 . 4 9 . 6 1 1 . 3 8.1 9 . 1 5 . 5 2 . 4 9 . 4 6.1 7 . 5 1 2 . 3 21.6 2 2 . 4 19. 41945 6.0 5 . 9 4 . 6 2.8 3 . 9 6 . 3 1 1 . 3 1 3 . 0 10.2 1 1 . 3 8.2 5 . 7 12. 4 9 . 9 11.8 1 6 . 6 2 5 . 0 2 6 . 8 2 7 . 4 3 6 . 01946 5 . 3 5 . 1 3 . 8 2.2 3 . 1 5 . 3 9 . 8 1 1 . 3 8.6 9 . 5 6.6 4 . 2 9 . 9 7 . 5 8.6 12.0 1 7 . 5 16 . 9 14. 1 11.6 8 . 41947 5 . 3 5 . 1 3 . 9 2 . 3 3 . 2 5 . 3 9 . 5 1 0 . 9 8 . 4 9 . 2 6 . 5 4 . 3 9 . 4 7 . 2 8.2 11.0 1 5 . 3 1 4 . 4 11.8 9 . 4 - 1 . 81948 5 . 2 5 . 1 3 . 9 2 . 4 3 . 3 5 . 3 9 . 2 1 0 . 5 8.1 8.8 6 . 3 4 . 3 8 . 9 6 . 9 7 . 8 10.2 1 3 . 8 1 2 . 7 10. 4 8.2 0 . 31949 5 . 7 5 . 6 4 . 5 3 . 1 4 . 0 5 . 9 9 . 7 1 0 . 9 8 . 7 9 . 4 7 . 1 5 . 3 9 . 6 7 . 9 8 . 7 11.0 1 4 . 2 1 3 . 4 11 . 5 10.0 4 . 3
1950 6.6 6.6 5 . 5 4 . 2 5 . 1 7 . 0 1 0 . 7 11 . 9 9 . 8 10.6 8 . 5 6 . 9 11.1 9 . 6 1 0 . 5 12.8 1 5 . 9 15. 4 1 4 . 0 13. 1 9 . 01951 7 . 2 7. 1 6.2 4 . 9 5 . 8 7 . 7 11.2 1 2 . 4 10. 5 11.2 9 . 3 7 . 8 11.8 1 0 . 5 1 1 . 4 1 3 . 6 16 . 5 16. 1 15. 0 14. 4 11.11952 7 . 5 7 . 5 6.6 5 . 4 6.2 8.0 11 . 5 12.6 10.8 1 1 . 5 9 . 7 8 . 4 12.1 1 0 . 9 11.8 1 3 . 8 16 . 5 16. 1 1 5 . 2 14. 6 11. 91953 7. 1 7 . 1 6.2 5 . 0 5 . 8 7 . 6 10.8 11.8 10.1 1 0 . 7 9 . 0 7 . 7 11.1 9 . 9 10 . 7 1 2 . 5 1 4 . 8 14. 3 13. 2 12.6 9 . 91954 8 . 4 8 . 4 7 . 6 6 . 5 7 . 4 9 . 1 12 . 3 1 3 . 4 11.8 12. 5 1 0 . 9 9 . 7 13 . 2 12.1 13 . 0 14. 9 17. 2 17 . 0 1 6 . 2 15. 9 13. 91955 9 . 0 9 . 1 8 . 3 7 . 3 8.2 9 . 8 13 . 0 1 4 . 0 12. 5 1 3 . 2 1 1 . 7 10. 7 1 4 . 0 13. 1 14. 0 15. 8 18. 1 17. 9 1 7 . 3 17. 1 15. 41956 8 . 9 8 . 9 8.1 7 . 2 8.0 9 . 6 12.6 1 3 . 6 12.1 12.8 11. 4 10 . 3 1 3 . 5 12.6 13. 4 15. 0 17. 1 1 6 . 9 1 6 . 2 16. 0 14. 31957 8.1 8.1 7 . 3 6 . 4 7 . 1 8 . 7 1 1 . 5 12 . 4 10. 9 1 1 . 5 10.1 9 . 1 12.0 11.0 1 1 . 7 13. 1 14. 9 1 4 . 5 13. 8 13. 4 11. 71958 9 . 0 9 . 0 8 . 3 7 . 4 8.2 9 . 7 12. 4 13. 4 12.0 12.6 1 1 . 3 10. 4 1 3 . 2 12. 4 13. 1 14 . 5 1 6 . 3 1 6 . 0 15. 4 15. 2 13. 71959 9 . 0 9 . 0 8 . 3 7 . 4 8.2 9 . 6 1 2 . 3 13 . 2 1 1 . 9 12. 4 11.2 10. 3 1 3 . 0 12.2 1 2 . 9 14 . 2 15. 8 15. 6 15 . 0 14. 7 13. 3
Stocks, Bon
ds, Bills, an
d Inflation
: Historical R
eturn
s

18
9
o --- ---------
EXHIBIT A-8 (Continued)
T O T H E
E N D O F
1960
1961
1962
1963
1964
1965
1966
1967
1968
1969
1970
1971
1972
1973
1974
1975
1976
1977
1978
1979
1980
1981
1982
1983
1984
1985
1986
1987
F R O M T H E B E G I N N I N G O F
1926 1927 1928 1929
8 . 6 9 0
8 . 4
8.28 . 4
8 . 3
7 . 8
7 . 5
7 . 6
7 . 7
7 . 0
6.1
6 . 5
6 . 7
6 . 3
6 . 26 . 2
6 . 06.1
6 . 06.26 . 3
6.2
9 . 1
8 . 5
8 . 7
8 . 8 8 88.28 . 4
8 . 3
7 . 5
7 . 6
7 . 7
7 . 0
6 . 06 . 5
6 . 7
6 . 3
6.1
6.2
6 . 4
5 . 9
6 . 06 . 1
5 . 9
6.26 . 3
6.2
8 . 08 . 4
7 . 8
8 . 1
8 . 28 . 27 . 6
7 . 1
7 . 6
7 . 0
7 . 3
7 . 5
7 . 5
6 9
7 . 8
8 . 3
7 . 7
8 0
8 . 1
8 . 1
7 . 4
1931
9 . 2
9 . 7
9 0
9 . 3
9 . 4
9 . 3
8 . 6
1932
11.8
12.21 1 . 3
1 1 . 6
11.6
1 1 . 5
1 0 . 7
1933 1934 1935 1936 1937 1938
12.61 3 . 0
12.11 2 . 3
12 . 3
12.2
1 1 . 3
1 1 . 3
11.8
1 0 . 9
11. 1
11.2
11.110.2
11.8
1 2 . 3
1 1 . 3
11.6
11.6
11 . 5
10.6
1 0 . 9
10.6
11.110.21 0 . 5
10.6
1 0 . 5
9 . 6
9 . 9
9 . 7
1 0 . 3
9 . 4
9 . 7
9 . 8
9 . 8
8 . 9
9 . 2
1 2 . 3
12.8
1 1 . 7
12.0
12.0
1 1 . 9
10.8
11.1
1939
11 . 5
12.0
1 0 . 9
1 1 . 3
1 1 . 3
11.2
10.2
1 0 . 5
1940
12.112.6
1 1 . 5
11.8
11.8
1 1 . 7
10.61 0 . 9
1941
13 . 3
1 3 . 8
1 2 . 5
12.8
12.8
12.6
1 1 . 5
11 . 7
1942
1 4 . 8
1 5 . 3
1 3 . 9
14. 1
1 4 . 0
1 3 . 8
1 2 . 5
1 2 . 7
1943
1 4 . 5
1 5 . 0
1 3 . 6
1 3 . 8
1 3 . 8
1 3 . 5
12.2
1 2 . 5
1944 1945 1946
1 3 . 9
1 4 . 5
1 3 . 0
1 3 . 3
13. 2
1 3 . 0
11.6
1 1 . 9
1 3 . 6
14. 2
12.6
12. 9
1 2 . 9
12. 7
1 1 . 3
11.6
12.213. 0
11. 4
11.8
11.8
11.6
10. 3
10.6( . y
7 . 8
/ . z
7 . 1
i . i
7 . 7
0 . *
8 . 8 1 0 . 7 1 1 . 3 1 0 . 3 10. 7 9 . 7 9 . 1 1 0 . 9 1 0 . 3 1 0 . 7 1 1 . 5 1 2 . 5 1 2 . 2 1 1 . 7 1 1 . A 1 0 . A
7 . 2 6 . 5 7 . 1 8 . 1 1 0 . 0 1 0 . 6 9 . 6 9 . 9 9 . 0 8 . 3 1 0 . 0 9 . 4 9 . 8 1 0 . 5 1 1 . 4 11. 1 1 0 . 6 10. 2 9 . 3
7 . 0 6 . 3 6 . 8 7 . 8 9 . 7 10 . 2 9 . 2 9 . 5 8 . 6 7 . 9 9 . 6 9 . 0 9 . 3 1 0 . 0 10 . 9 1 0 . 6 1 0 . 0 9 . 7 8 . 8
7 . 0 6 . 4 6 . 9 7 . 9 9 . 7 1 0 . 2 9 . 2 9 . 5 8 . 6 8 . 0 9 . 6 9 . 0 9 . 3 1 0 . 0 1 0 . 8 1 0 . 5 1 0 . 0 9 . 7 8 . 8
7 . 2 6 . 6 7 . 1 8 . 0 9 . 8 1 0 . 3 9 . 4 9 . 7 8 . 8 8 . 2 9 . 8 9 . 2 9 . 5 1 0 . 2 1 1 . 0 1 0 . 7 1 0 . 2 9 . 9 9 . 0
6 . 5 5 . 9 6 . 3 7 . 3 8 . 9 9 . 4 8 . 5 8 . 8 7 . 9 7 . 3 8 . 8 8 . 2 8 . 5 9 . 1 9 . 8 9 . 5 9 . 0 8 . 7 7 . 8
5 . 5 4 . 9 5 . 3 6 . 2 7 . 8 8 . 2 7 . 3 7 . 5 6 . 6 6 . 0 7 . 4 6 . 8 7 . 1 7 . 6 8 . 2 7 . 9 7 . 4 7 . 0 6 . 1
6 . 0 5 . 4 5 . 8 6 . 6 8 . 2 8 . 7 7 . 8 8 . 0 7 . 2 6 . 6 8 . 0 7 . 4 7 . 6 8 . 2 8 . 8 8 . 5 8 . 0 7 . 6 6 . 8
6 . 2 5 . 6 6 . 0 6 . 9 8 . 4 8 . 9 8 . 0 8 . 2 7 . 4 6 . 8 8 . 2 7 . 7 7 . 9 8 . 4 9 . 1 8 . 8 8 . 3 8 . 0 7 . 2
5 . 8 5 . 2 5 . 6 6 . 4 7 . 9 8 . 3 7 . 5 7 . 7 6 . 9 6 . 3 7 . 7 7 . 1 7 . 3 7 . 8 8 . 4 8 . 1 7 . 6 7 . 3 6 . 5
5 . 7 5 . 1 5 . 5 6 . 3 7 . 7 8 . 1 7 . 3 7 . 5 6 . 7 6 . 2 7 . 4 6 . 9 7 . 1 7 . 6 8 . 2 7 . 9 7 . 4 7 . 1 6 . 3
5 . 7 5 . 1 5 . 5 6 . 3 7 . 7 8 . 1 7 . 3 7 . 5 6 . 7 6 . 2 7 . 4 6 . 9 7 . 1 7 . 6 8 . 1 7 . 8 7 . 4 7 . 1 6 . 3
5 . 9 5 . 4 5 . 8 6 . 6 8 . 0 8 . 3 7 . 5 7 . 8 7 . 0 6 . 5 7 . 7 7 . 2 7 . 4 7 . 9 8 . 4 8 . 1 7 . 7 7 . A 6 . 7
5 . 5 4 . 9 5 . 3 6 . 0 7 . 4 7 . 8 7 . 0 7 . 2 6 . 4 5 . 9 7 . 1 6 . 6 6 . 7 7 . 2 7 . 7 7 . 4 6 . 9 6 . 6 5 . 9
5 5 5 . 0 5 . 4 6 . 1 7 . 4 7 . 8 7 . 0 7 . 2 6 . 5 6 . 0 7 . 1 6 . 6 6 . 8 7 . 2 7 . 7 7 . 4 7 . 0 6 . 7 6 . 0
5 . 7 5 . 1 5 . 5 6 . 2 7 . 5 7 . 9 7 . 1 7 . 3 6 . 6 6 . 1 7 . 2 6 . 8 6 . 9 7 . 4 7 . 9 7 . 6 7 . 2 6 . 9 6 . 2
5 . 5
5 . 8
5 . 0
5 . 3
5 . 3
5 . 6
6 . 0
6 . 3
7 . 3
7 . 6
7 . 7
7 . 9
6 . 9
7 . 2
7 . 1
7 . 4
6 . 4
6 . 7
5 . 9
6 . 2
7 . 0
7 . 3
6 . 5
6 . 9
6 . 7
7 . 0
7 . 1
7 . 4
7 . 6
7 . 9
7 . 3
7 . 6
6 . 9
7 . 2
6 . 6
7 . 0
5 . 9
6 . 3
5 . 9 5 . 4 5 . 7 6 . 4 7 . 7 8 . 0 7 . 3 7 . 5 6 . 8 6 . 3 7 . 4 6 . 9 7 . 1 7 . 5 8 . 0 7 . 7 7 . 3 7 . 1 6 . A
5 . 8 5 . 3 5 . 6 6 . 3 7 . 5 7 . 8 7 . 1 7 . 3 6 . 7 6 . 2 7 . 2 6 . 8 7 . 0 7 . 3 7 . 8 7 . 5 7 . 2 6 . 9 6 . 3
Appen
dix

19
0 E X H IB IT A -8 (C o n tin u ed )
F R O M T H E B E G I N N I N G O FT O T H E E N D O F 1947 1948 1949 1950 1951 1952 1953 1954 1955 1956 1957 1958 1959 1960 1961 1962 1963 1964 1965 1966 1967
1947 5 . 2
1948 4 . 9 4 . 7
1949 9 . 0 1 0 . 9 1 7 . 5
1950 13. 9 1 7 . 0 2 3 . 7 3 0 . 21951 15. 5 1 8 . 3 2 3 . 2 26. 1 2 2 . 21952 15. 7 1 7 . 9 2 1 . 5 2 2 . 8 19. 3 16. 41953 12. 8 1 4 . 2 1 6 . 2 1 5 . 8 11 . 4 6 . 4 - 2 . 81954 17. 1 18. 9 21 4 2 2 . 2 2 0 . 3 19. 7 2 1 . 3 5 1 . 31955 18. 4 20. 1 2 2 . 5 2 3 . 4 2 2 . 1 22. 1 2 4 . 0 4 0 . 0 2 9 . 51956 16 9 1 8 . 2 2 0 . 0 2 0 . 4 18 . 9 1 8 . 2 18. 7 2 6 . 8 16. 1 4 . 01957 13. 7 14 6 1 5 . 8 15 5 13 . 6 1 2 . 2 1 1 4 15. 2 5 . 2 5 . 2 1 3 . 51958 15. 8 16. 8 18. 1 18. 1 16 . 7 1 6 . 0 1 5 . 9 2 0 . 0 1 3 . 3 8 . 3 1 0 . 5 4 1 . 21959 15. 2 16. 1 1 7 . 2 1 7 . 2 15 . 8 1 5 . 0 14. 8 18 1 1 2 . 3 8 . 4 9 . 9 2 3 . 9 8 . 7
1960 13. 9 14. 6 15. 4 1 5 . 3 13 9 1 3 . 0 1 2 . 6 14. 9 9 . 8 6 . 2 6 . 8 14 . 5 3 . 2 2 . 11961 14. 5 15. 2 16. 1 1 6 . 0 14 8 14. 1 1 3 . 8 16.1 11. 7 9 . 0 10. 1 16 . 9 9 . 8 10 . 3 2 4 . 21962 12. 7 13. 3 13. 9 1 3 . 6 12 4 11. 5 11. 0 12. 7 8 . 6 5 . 9 6 . 2 10 . 6 4. 1 2 . 6 5. 1 1 1 . 21963 13.1 13. 6 1 4 . 2 1 4 . 0 12. 9 12. 1 11. 7 1 3 . 3 9 . 7 7 . 5 8 . 0 1 2 . 0 6 . 9 6 . 5 9 . 5 2 . 9 19. 11964 13.1 13. 6 14. 1 1 3 . 9 12. 8 12.1 11. 8 1 3 . 2 10. 0 8 . 0 8 . 5 12. 1 7 . 9 7 . 7 1 0 . 3 6 . 0 15 . 8 1 2 . 51965 12 8 13. 2 1 3 . 8 13 5 12. 5 1 1 9 11. 5 12 8 9 . 8 8 . 0 8 . 5 11 . 6 7 . 9 7 . 8 9 . 9 6 . 5 1 3 . 2 10 . 3 8 . 21966 1 1 . 3 1 1 6 1 2 . 0 11. 7 1 0 . 6 9 . 9 9 . 4 10 . 4 7 . 6 5 . 8 6 . 0 8 . 4 4 . 9 4 . 3 5 . 4 2 . 0 5 . 6 1 . 5 - 3 . 6 14.11967 11. 6 12. 0 12 . 4 12. 1 11. 1 10 4 10. 1 1 1 . 0 8 . 4 6 . 8 7 . 1 9 . 4 6 . 3 6 . 0 7 . 3 4 . 7 8 . 2 5 . 6 3 . 4 1.1 19. 01968 11. 3 1 1 7 12 0 1 1 . 7 1 0 . 8 1 0 . 2 9 . 8 10 . 7 8 . 2 6 . 7 7 . 0 9 . 0 6 . 3 6 . 0 7 . 1 4 . 8 7 . 7 5 . 6 3 . 9 2 . 5 12.11969 10.1 10. 3 1 0 . 6 10. 3 9 . 3 8 . 6 8 . 2 8 . 9 6 . 6 5. 1 5 . 2 6 . 9 4 . 2 3 . 8 4 . 5 2 . 2 4 . 3 2 . 0 0 . 0 - 1 . 9 2 . 5
1970 9 . 5 9 . 7 10 0 9 6 8 . 7 8 . 0 7 . 6 8 . 2 6 . 0 4 . 6 4 . 6 6 . 2 3 . 7 3 . 2 3 . 8 1 . 7 3 . 4 1. 4 - 0 . 4 - 2 . 0 1. 31971 9 5 9 . 7 10. 0 9 . 6 8 . 7 8 1 7 . 7 8 . 3 6 . 2 4 . 9 4 . 9 6 . 4 4. 1 3 . 7 4 . 3 2 . 5 4. 1 2 . 4 1 . 0 0 . 2 2 . 91972 9 . 7 9 . 9 10. 1 9 . 8 9 . 0 8 . 4 8 . 0 8 . 6 6 . 6 5 . 4 5 . 5 6 . 9 4 . 8 4 . 5 5. 1 3 . 5 5. 1 3 . 6 2 . 6 1 . 8 4 . 71973 8 . 4 8 . 6 8 . 7 8 . 4 7 . 5 6 . 9 6 . 5 7 . 0 5 . 0 3 . 8 3 . 8 5 . 0 2 . 9 2 . 5 2 . 9 1 . 3 2 . 5 1 . 0 0 . 2 1. 2 0 . 81974 6 . 7 6 . 7 6 . 8 6 . 4 5 . 5 4 . 8 4 . 3 4 . 7 2 . 8 1 . 5 1. 4 2 . 3 0 . 3 0 . 2 0 . 1 1 8 0 . 9 2 . 6 4 . 0 5 . 2 4 11975 7 . 4 7 . 5 7 . 6 7 . 2 6 . 4 5 . 8 5 . 3 5 . 7 3 . 9 2 . 8 2 . 7 3 . 7 1. 8 1. 4 1 . 7 0 . 2 1.1 0 . 2 - 1 . 3 2 . 2 0 81976 7 . 7 7 . 8 7 . 9 7 . 6 6 . 8 6 . 2 5 . 8 6 . 2 4 . 5 3 . 4 3 . 4 4 . 4 2 . 7 2 . 3 2 . 6 1 . 3 2 . 2 1.1 0 . 2 0 . 5 0 . 91977 7 . 0 7. 1 7 . 2 6 8 6 . 0 5 . 5 5. 1 5 4 3 . 7 2 . 7 2 . 6 3 . 5 1 . 8 1 . 5 1 . 7 0 . 4 1 . 3 0. 1 - 0 . 8 1 . 5 - 0 . 31978 6 8 6 . 8 6 . 9 6 . 6 5 . 8 5 . 2 4 . 8 5. 1 3 . 6 2 . 6 2 . 5 3 . 3 1 .7 1. 4 1 . 6 0 . 4 1. 1 0 . 0 0 . 8 1 . 5 0 . 31979 6 . 8 6 8 6 . 9 6 . 6 5 . 9 5 . 3 4 . 9 5 . 2 3 . 7 2 . 8 2 . 7 3 . 5 2 . 0 1. 7 1 . 9 0 . 7 1 . 5 0 . 5 0 . 3 0 9 0 . 3
1980 7 . 1 7 . 2 7 . 3 7 . 0 6 . 3 5 . 8 5 . 4 5 . 7 4 . 3 3 . 4 3 . 3 4. 1 2 . 7 2 . 4 2 . 7 1 . 6 2 . 4 1 . 5 0 . 8 0 . 4 1 . 51981 6 . 4 6 . 4 6 . 4 6 . 1 5 . 4 4 . 9 4 . 5 4 . 8 3 . 4 2 . 5 2 . 4 3 . 1 1 . 8 1. 4 1 . 6 0 . 6 1 . 3 0 . 4 0 . 3 - 0 . 8 0. 11982 6 . 5 6 . 5 6 . 5 6 . 2 5 . 6 5 . 1 4 . 7 5 . 0 3 . 6 2 . 7 2 . 7 3 . 4 2 . 1 1 . 8 2 . 0 1 . 0 1 . 7 0 . 8 0 . 2 0 . 2 0 . 71983 6 . 6 6 . 7 6 . 7 6 4 5 . 8 5 . 3 4 . 9 5 . 2 3 . 9 3. 1 3 . 1 3 . 7 2 . 5 2 . 2 2 . 4 1 . 5 2 . 2 1 . 4 0 . 8 0 . 4 1. 41984 6 . 3 6 . 4 6 . 4 6 . 1 5 . 5 5 0 4 . 7 4 . 9 3 . 7 2 . 9 2 . 8 3 . 5 2 . 2 2 . 0 2 . 2 1 .3 1 9 1 .2 0 . 6 0 . 2 1 .11985 6 . 7 6 8 6 . 8 6 . 5 5 . 9 5 . 5 5 . 2 5 . 4 4 . 2 3 5 3 . 4 4 . 1 2 . 9 2 . 7 2 . 9 2. 1 2 . 7 2. 1 1 . 6 1. 3 2. 11986 6 . 8 6 9 7 . 0 6 . 7 6 . 1 5 . 7 5 4 5 . 6 4 . 4 3 . 7 3 . 7 4 . 4 3 . 2 3 . 0 3 . 2 2 . 5 3. 1 2 . 5 2 . 0 1 . 7 2 . 61987 6 . 7 6 . 7 6 8 6 . 5 5 9 5 5 5 . 2 5 . 4 4 . 3 3 . 6 3 . 6 4 . 2 3. 1 2 . 9 3. 1 2 . 4 3 . 0 2 . 3 1 .9 1 6 2 . 5
Stocks, Bon
ds, Bills, an
d Inflation
: Historical R
eturn
s

19
1
E X H IB IT A -8 (C o n tin u e d )
F R O M T H E B E G I N N I N G O F
i n t
E N D O F 1968 1969 1970 1971 1972 1973 1974 1975 1976 1977
1968 5 . 6
1969 - 4 . 8 - 1 4 . 2
1970 - 4 . 0 - 8 . 5 - 2 . 4
1971 - 0 . 8 - 2 . 8 3 . 4 9 . 5
1972 2 . 1 1 . 3 7 . 0 1 2 . 0 1 4 . 6
1973 - 2 . 0 - 3 . 4 - 0 . 6 0 . 0 - 4 . 4 - 2 0 . 2
1974 - 7 . 0 - 8 . 9 - 7 . 8 9 . 1 - 1 4 . 6 - 2 6 . 3 - 3 1 . 9
1975 - 3 . 0 - 4 . 2 - 2 . 4 - 2 . 4 - 5 . 2 - 1 1 . 0 - 6 . 0 2 9 . 7
1976 - 0 . 9 - 1 . 7 0 . 2 0 . 7 - 1 . 0 4 . 5 1 . 3 2 3 . 6 1 7 . 9
1977 - 2 . 0 - 2 . 8 - 1 . 3 - 1 . 2 - 2 . 9 - 6 . 0 2 . 1 1 0 . 5 2 . 0 - 1 1 . 7
1978 - 1 . 9 - 2 . 6 - 1 . 2 - 1 . 1 - 2 . 5 - 5 . 1 - 1 . 8 7 . 6 1 . 1 - 6 . 3
1979 - 1 . 2 - 1 . 8 - 0 . 4 - 0 . 2 - 1 . 4 - 3 . 4 - 0 . 3 7 . 6 2 . 6 - 2 . 0
1980 0 . 3 - 0 . 2 1 . 2 1 . 6 0 . 7 - 0 . 9 2 . 2 9 . 4 5 . 7 2 . 9
1981 - 1. 1 - 1 . 6 - 0 . 5 - 0 . 3 - 1 . 2 - 2 . 8 - 0 . 4 5 . 1 1 . 5 - 1 . 4
1982 - 0 . 4 - 0 . 8 0 . 3 0 . 5 - 0 . 3 - 1 . 6 0 . 7 5 . 7 2 . 7 0 . 3
1983 0 . 4 0 . 0 1 . 1 1 . 4 0 . 8 - 0 . 4 1 . 8 6 . 5 3 . 9 2 . 0
1984 0 . 1 - 0 . 2 0 . 8 1 . 1 0 . 4 - 0 . 7 1 . 3 5 . 4 3 . 1 1 . 3
1985 1 . 3 1 . 0 2 . 1 2 . 4 1 . 9 1 . 0 3 . 0 6 . 9 4 . 9 3 . 5
1986 1 . 8 1 . 6 2 . 6 2 . 9 2 . 5 1 . 7 3 . 6 7 . 3 5 . 5 4 . 3
1987 1 . 7 1 . 5 2 . 4 2 . 7 2 . 3 1 . 6 3 . 3 6 . 7 5 . 0 3 . 9
1978 1979 1980 1981 1982 1983 1984 1985 1986 1987
0 .63 . 3 7 . 3
8 . 3 1 3 . 0 1 9 . 0
1 . 3 1 . 9 - 0 . 7
2 . 9 3 . 8 2 . 7
4 . 5 5 . 5 5 . 1
3 . 4 4 . 0 3 . 4
5 . 6 6 . 5 6 . 4
6 . 2 7 . 1 7 . 1
5 . 6 6 . 3 6 . 2
- 17. 1
- 4 . 6 9 . 8
0 . 8 1 1 . 2 1 2 . 6
- 0 . 2 6 . 2 4 . 4
4 . 0 10 . 1 10. 1
5 . 2 1 0 . 4 1 0 . 5
4 . 4 8 . 5 8 . 3
- 3 . 3
8 . 9 2 2 . 7
9 . 8 1 7 . 0 1 1 . 6
7 . 2 1 1 . 0 5 . 5 - 0.2
/
Appen
dix

19
2 E X H IB IT A -9REA L IN T E R E ST RATES: TR E A SU R Y B IL L S M IN U S IN FLA TIO N
RATES O F R E T U R N F O R ALL Y EARLY H O L D IN G P E R IO D S FR O M 1 9 2 6 TO 1 9 8 7
(P e r c e n t P e r A n n u m C o m p o u n d e d A n n u a lly )
FROM THE BEGINNING OF
E N D O F 1926 1927 1928 1929 1930 1931 1932 1933 1934 1935 1936 1937 1938 1939 1940 1941 1942 1943 1944 1945 19461926 4 . 8
1927 5.1 5 . 31928 4 . 8 4 . 8 4 . 21929 1 . 7 4 . 7 4 . 4 4 . 5
1930 5 . 6 5 8 5 . 9 6 . 7 9 . 01931 6 . 6 6 . 9 7 . 3 8 . 4 10 . 3 1 1 . 71932 7 . 4 7 . 8 8 . 4 9 . 4 11. 1 12. 1 1 2 . 61933 6 . 4 6 . 7 6 . 9 7 . 4 8 . 1 7 . 9 6 . 0 0 . 21934 5 . 5 5 . 6 5 . 6 5 . 8 6 . 1 5 . 3 3 . 3 - 1 . 0 1 . 81935 4 . 6 4 . 6 4 . 5 4 . 5 4 . 5 3 . 7 1 . 8 - 1 . 6 - 2 . 3 2 . 71936 4. 1 4 . 0 3 . 9 3 . 8 3 . 7 2 . 9 1 . 2 1 . 5 - 1 . 9 - 1 . 9 - 1.01937 3 . 5 3 . 4 3 . 2 3 . 1 2 . 9 2 . 1 0 . 5 - 1 . 7 - 2 . 1 - 2 . 2 - 1 . 9 - 2 . 71938 3 . 5 3 . 3 3 2 3 . 1 2 . 9 2 . 2 0 . 9 1 . 0 - 1. 1 0 . 9 - 0 . 3 0 . 0 2 . 81939 3 . 2 3 . 1 2 . 9 2 . 8 2 . 7 2 . 0 0 . 8 0 . 8 0 . 8 0 . 6 - 0 . 1 0 . 2 1 . 7 0 . 5
1940 3 . 0 2 . 8 2 . 6 2 . 5 2 . 3 1 . 7 0 . 6 0 . 8 - 0 . 9 0 . 7 - 0 . 3 - 0 . 1 0 . 8 0 . 2 0 . 91941 2 . 2 2 . 0 1 . 8 1 . 6 1 . 3 0 . 7 0 . 4 - 1 . 7 - 1 . 9 -1 .9 - 1 . 8 - 1 . 9 1 . 7 - 3 . 2 - 5 . 0 8 . 81942 1 . 5 1 . 3 1. 1 0 . 9 0 . 6 0. 1 1. 1 - 2 . 4 - 2 . 6 2 . 7 2 . 7 - 3 . 0 - 3 . 0 4 . 5 6 . 1 8 . 5 8 . 31943 1 . 3 1. 1 0 . 8 0 . 6 0 . 3 0 . 3 - 1 2 - 2 . 4 - 2 . 6 2 . 7 - 2 . 7 - 3 . 0 3 . 0 4. 1 - 5 . 2 - 6 . 6 - 5 . 5 - 2 . 71944 1.1 0 . 9 0 . 7 0 . 5 0 . 2 0 4 - 1 . 3 - 2 . 4 - 2 . 5 - 2 . 6 - 2 . 6 2 . 8 2 . 8 3 . 7 4 . 6 5 4 4 . 3 - 2 . 2 - 1 . 71945 1 0 0 . 8 0 . 5 0 . 3 0 . 1 0 . 5 1 . 3 - 2 . 3 - 2 . 5 - 2 . 6 - 2 . 5 2 . 7 2 . 7 - 3 . 5 4. 1 4 . 7 3 . 7 2 . 1 - 1 . 8 1. 91946 0 . 2 0 . 1 - 0 . 4 0 . 6 0 . 9 - 1 . 5 2 . 3 - 3 . 3 3 . 5 3 . 7 3 . 7 4 . 0 4 . 2 - 5 . 0 5 . 8 - 6 . 5 6. 1 - 5 . 5 6 . 4 8 . 7 15 11947 0 . 2 0 . 5 - 0 . 7 - 1 . 0 1 .3 1 9 - 2 . 7 3 . 6 - 3 . 8 4 . 0 4 . 1 4 . 4 4 . 5 5 . 3 6 . 0 6 . 7 6 . 4 6 . 0 - 6 . 8 - 8 . 4 1 1 51948 0 . 3 - 0 . 5 0 . 8 1 . 0 1 . 3 1 . 9 - 2 . 6 3 . 5 3 . 7 3 . 8 - 3 . 9 4 . 2 4 . 3 5 . 0 5 . 6 6 . 1 5 . 7 5 . 3 - 5 . 8 - 6 . 8 8 . 41949 0 . 2 0 . 4 - 0 . 6 0 . 9 - 1. 1 -1 6 2 . 3 - 3 . 1 3 . 3 - 3 . 4 - 3 . 4 - 3 . 6 - 3 . 7 4 . 3 4 . 7 5 . 2 4 . 7 4 . 2 4 . 4 4 . 9 5 . 7
1950 0 . 3 0 . 5 0 . 8 1 .0 1 3 1 . 8 - 2 . 4 - 3 . 2 3 . 4 - 3 . 5 - 3 . 5 3 . 7 - 3 . 8 4 . 3 4 . 7 - 5 . 1 4 . 7 4 . 2 4 . 4 4 . 8 5 . 41951 0 . 5 - 0 . 7 0 . 9 1 . 2 1 . 4 - 1 . 9 2 . 5 3 . 2 3 . 4 - 3 . 5 - 3 . 5 3 . 7 - 3 . 8 4 . 3 4 . 7 - 5 . 0 4 . 6 4 . 2 - 4 . 4 4 . 7 5 . 21952 0 . 4 0 . 6 - 0 . 9 1. 1 - 1 . 3 - 1 . 8 - 2 . 4 - 3 . 0 3 . 2 - 3 . 3 3 . 3 - 3 . 4 3 . 5 3 . 9 4 . 3 - 4 . 5 4 . 1 - 3 . 7 - 3 . 8 4 . 1 4 . 41953 0 . 4 0 . 6 - 0 . 8 1 . 0 - 1 . 2 - 1 . 6 2 . 2 - 2 . 8 3 . 0 - 3 . 0 - 3 . 1 3 . 2 3 . 2 3 . 6 - 3 . 9 - 4 . 1 3 . 7 3 . 3 - 3 . 3 3 . 5 3 . 71954 0 . 3 - 0 . 5 0 . 7 0 . 9 1.1 1 . 5 2 . 0 2 . 7 2 . 8 2 . 8 - 2 . 8 2 . 9 2 . 9 3 . 3 - 3 . 5 3 . 7 3 . 3 2 . 9 2 . 9 - 3 . 0 3. 11955 0 . 3 0 . 4 - 0 . 6 0 . 8 1 . 0 - 1 . 4 - 1 . 9 - 2 . 5 2 . 6 2 . 6 2 . 6 2 . 7 2 . 7 3 . 0 3 . 2 - 3 . 4 - 3 . 0 - 2 . 6 - 2 . 6 2 . 6 2 . 71956 0 . 3 0 . 4 - 0 . 6 - 0 . 8 1 . 0 - 1 . 4 1 . 8 - 2 . 4 2 . 5 - 2 . 5 2 . 5 2 . 6 2 . 6 - 2 . 9 3. 1 - 3 . 2 2 . 8 - 2 . 4 2 . 4 2 . 5 2 . 51957 0 . 3 - 0 . 4 0 . 6 0 . 8 1 . 0 1 . 3 - 1 . 8 2 . 3 2 . 4 2 . 4 - 2 . 4 - 2 . 5 2 . 5 2 . 7 2 . 9 3 . 0 2 . 6 2 . 3 2 . 2 2 . 3 2 . 31958 0 . 3 - 0 . 4 0 . 6 0 . 8 0 . 9 - 1 . 3 1 . 7 2 . 2 2 . 3 2 . 3 - 2 . 3 2 . 4 - 2 . 4 2 . 6 2 . 8 2 . 9 2 . 5 2. 1 2. 1 2 . 1 2 11959 0 . 2 0 . 4 0 . 5 0 . 7 0 . 9 - 1 . 2 1 6 - 2. 1 2 . 2 2 . 2 - 2 . 2 2 . 2 2 . 2 2 . 4 2 . 6 2 . 6 2 . 3 - 1 . 9 1 . 9 1 9 1 9
Stocks, Bon
ds, Bills, an
d Inflation
: Historical R
eturn
s

19
3
EXHIBIT A-9 (Continued)
T O T H E E N D O F
F R O M T H E B E G I N N I N G O F
1926 1927 1928 1929 1930 1931 1932 1933 1934 1935
1960 0 . 2 0 . 3 0 . 5 0 6 0 8 1. 1 1 . 5 2 . 0 2 . 0 2 . 1
1961 0 . 1 0 . 3 0 . 4 0 6 0 . 7 1 .0 1 .4 1 .9 1 .9 - 1 . 9
1962 0 . 1 0 . 2 0 4 0 . 5 0 7 0 9 1 . 3 1 . 8 1 .8 1 . 8
1963 0 0 0 . 2 0 . 3 0 . 4 0 . 6 0 . 9 1 .2 1 . 7 1 . 7 1 .7
1964 0.0 0 1 0 . 2 0 . 4 0 . 5 0 8 1. 1 1 5 1 6 1 6
1966 0 . 1 0 . 1 0 . 2 0 . 3 0 4 0 7 1 .0 1 . 4 1 . 5 1 . 5
1966 0 1 0 0 0 . 2 0 . 3 0 . 4 0 6 1 . 0 1 .3 1 .4 1 . 4
1967 0 . 1 0.0 0 . 1 0 . 2 0 . 4 0 . 6 0 . 9 1 . 3 1 .3 1 . 3
1968 0 . 1 0 . 0 0 . 1 0 . 2 0 . 3 0 6 0 . 9 1 . 2 1 .3 1. 2
1969 0 . 1 0. 0 0 . 1 0 . 2 0 3 0 5 0 . 8 1 .2 1 .2 1 . 2
1970 0 2 0.1 0.1 0 . 2 0 . 3 0 . 5 0 . 8 1.1 1 . 2 1.1
1971 0 2 0 1 0. 0 0.1 0 . 3 0 . 5 0 . 8 - 1. 1 1.1 1.1
1972 0 . 2 0.1 0. 0 0.1 0 . 2 0 4 0 . 7 1.0 1 1 1 .0
1973 0 1 0.0 0.1 0 . 2 0 3 0 5 0 . 7 - 1.1 1. 1 - 1.1
1974 0.1 0. 0 0 . 2 0 . 2 0 . 3 0 6 0 . 8 1 1 1. 1 1. 1
1975 0. 0 0 1 0 . 2 0 3 0 . 4 0 6 0 . 8 1. 1 1. 1 1. 1
1976 0 0 0.1 0 . 2 0 . 3 0 . 4 0 . 5 0 . 8 1.1 1.1 1.1
1977 0 0 0.1 0 2 0 . 3 0 . 4 0 . 6 0 . 8 1.1 1 .1 1.1
1978 0 0 0.1 0 . 2 0 3 0 4 0 6 0 . 8 1 1 1.1 1 1
1979 0 1 0 2 0 . 3 0 4 0 4 0 6 0 . 9 1 1 1 . 2 1 . 1
1980 0 1 0 2 0 3 0 4 0 . 5 0 . 6 0 . 9 1.1 1 .2 1.1
1981 0 0 0 1 0 . 2 0 3 0 4 0 5 0 . 8 1 . 0 1 .0 1 .0
1982 0.1 0 0 0 1 0.1 0 . 2 0 . 4 0 . 6 0 . 9 0 . 9 0 . 9
1983 0 . 2 0 1 0 . 0 0.1 0.1 0 . 3 0 . 5 0 . 8 0 . 8 0 . 7
1984 0 . 3 0 2 0.1 0. 0 0. 0 0 . 2 0 . 4 0 . 6 0 . 6 0 . 6
1985 0 3 0 3 0 2 0 . 1 0.0 0.1 0 . 3 0 . 6 0 . 6 0 . 5
1986 0 4 0 3 0 . 3 0 . 2 0.1 0 0 0 . 2 0 . 5 0 . 5 0 . 4
1987 0 4 0 . 4 0 . 3 0 . 2 0.1 0. 0 0 . 2 0 . 4 0 . 4 0 . 4
1936 1937 1938 1939 1940 1941 1942 1943 1944 1945 1946
- 2 . 0 2 . 1 - 2 . 0 2 . 3 - 2 . 4 2 . 5 2 . 1 1 . 8 -1 .7 1 . 7 - 1. 7
1 . 9 - 1 . 9 1 . 9 2 . 1 2 . 2 2 . 3 - 1 . 9 1 . 6 1 . 5 1 . 5 1 . 5
- 1 . 8 1 .8 - 1 . 8 2 . 0 2 . 1 2 . 1 1 . 8 - 1 . 4 - 1 . 4 1 . 4 1. 3
1 . 7 1 . 7 1 .6 1 8 1 9 2 . 0 1 .6 - 1 . 3 - 1 . 2 1 . 2 1. 2
1 . 5 1 . 5 1 . 5 1 . 7 1 . 7 1 . 8 1 . 5 1.1 1. 1 1 .0 1 .0
1. 4 1 . 4 - 1 . 4 1 5 1 . 6 1 6 1 . 3 1 . 0 - 0 . 9 0 . 9 0 . 8
1 . 3 1 .3 1 . 3 1 .4 1 . 5 1 . 5 1 .2 0 . 9 0 . 8 0 . 8 0 . 7
1 .2 1 . 3 1 . 2 1 . 3 - 1 . 4 - 1 . 4 1. 1 0 . 8 0 . 8 0 . 7 0 . 7
1 .2 1 .2 1 .2 1 . 3 1 . 3 1 . 4 1 . 1 0 . 8 0 . 7 0 . 7 0 . 6
1 .1 1 1 1. 1 1 . 2 1 . 3 1 . 3 - 1 . 0 0 . 7 0 . 7 0 . 6 0 . 6
- 1. 1 1. 1 1 . 0 1 . 2 1 . 2 1 . 2 0 . 9 0 . 7 0 . 6 0 . 6 0 . 5
1 . 0 1 . 0 - 1 . 0 1 1 1.1 1.1 0 . 9 - 0 . 6 - 0 . 5 0 . 5 0 . 4
1 .0 - 1 . 0 0 . 9 1 . 0 1. 1 - 1. 1 0 . 8 0 . 6 0 . 5 0 . 5 0 . 4
1 . 0 - 1 . 0 1 . 0 1. 1 1. 1 - 1. 1 0 . 9 0 . 6 0 . 5 0 . 5 0 . 5
1. 1 - 1. 1 1 0 - 1. 1 1 . 2 1 . 2 1 . 0 - 0 . 7 0 . 7 0 . 6 0 . 6
1. 1 1. 1 1 0 1.1 1 . 2 1 . 2 1 . 0 0 . 7 0 . 7 0 . 6 0 . 6
1 . 0 1 . 0 1 0 1.1 1. 1 1 .2 0 . 9 0 . 7 0 . 6 0 . 6 0 . 6
1. 1 1.1 - 1 . 0 1 1 1 .2 1 . 2 0 . 9 0 . 7 0 . 7 0 . 6 0 . 6
1. 1 1.1 1 .0 1 1 1 .2 1 . 2 1 . 0 0 . 8 0 . 7 0 . 7 0 . 6
1 1 1. 1 1 1 1 . 2 1 .2 1 .2 1 . 0 0 . 8 0 . 8 0 . 7 0 . 7
1, 1 , , 1 1 1 .2 1 .2 1 .2 1 .0 0 . 8 0 . 8 0 . 7 0 . 7
1 . 0 1 . 0 0 . 9 1 . 0 1.1 1 . 1 0 . 9 0 . 7 0 . 6 0 . 6 0 . 5
0 . 8 0 . 8 0 . 8 0 . 9 0 . 9 0 . 9 0 . 7 0 . 5 0 . 4 0 4 0 4
0 . 7 0 . 7 0 . 7 0 . 7 0 . 8 0 . 8 0 . 6 - 0 . 4 0 . 3 0 . 3 0 . 2
0 . 6 0 . 6 0 . 5 0 . 6 0 . 6 0 . 6 0 . 4 0 . 2 0 . 2 0 . 1 0 . 1
0 5 0 . 5 0 . 4 0 . 5 0 . 5 0 . 5 0 . 3 0 . 1 0 . 1 0 . 0 0 . 0
0 . 4 0 . 4 0 . 3 0 . 4 0 . 4 0 . 4 0 . 2 0 . 0 0 . 0 0 . 1 0 . 1
0 . 4 0 . 4 0 . 3 0 . 4 0 . 4 0 . 4 0 . 2 0 . 0 0 . 1 0 . 1 0 . 2

194 EXHIBIT A-9 (Continued)F R O M T H E B E G I N N I N G O F
T O T H E E N D O F 1947 1948 1949 1950 1951 1952 1953 1954 1955 1956 1957 1958 1959 1960 1961 1962 1963 1964 1965 1966 1967
1947 - 7 . 8
1948 - 4 . 9 - 1 . 8
1949 2 . 3 0 . 5 3 . 0
1950 - 2 . 8 - 1 . 1 - 0 . 8 - 4 . 3
1951 - 3 . 1 - 1 . 9 - 1 . 9 - 4 . 2 - 4 . 1
1952 - 2 . 5 - 1 . 4 - 1 . 2 - 2 . 6 - 1 . 7 0 . 8
1953 - 2 . 0 - 0 . 9 - 0 . 8 - 1 . 7 - 0 . 8 1.0 1 . 21954 - 1 . 5 - 0 . 6 - 0 . 4 - 1 . 1 - 0 . 2 1 . 1 1 . 3 1 . 4
1955 1 . 2 - 0 . 4 - 0 . 2 - 0 . 7 0.1 1 . 1 1 . 3 1 . 3 1 . 21956 - 1 . 2 - 0 . 4 - 0 . 2 - 0 . 6 - 0. 0 0 . 8 0 . 8 0 . 7 0 . 4 - 0 . 4
1957 - 1.0 - 0 . 3 - 0 . 2 - 0 . 6 0. 0 0 . 7 0 . 7 0 . 6 0 . 3 - 0.1 0.11958 1 . 0 - 0 . 3 - 0 . 2 - 0 . 5 - 0. 0 0 . 6 0 . 5 0 . 4 0 . 2 - 0 . 2 - 0.1 - 0 . 21959 - 0 . 8 - 0 . 2 - 0. 0 - 0 . 3 0.1 0 . 7 0 . 7 0 . 6 0 . 4 0 . 2 0 . 4 0 . 6 1 . 4
1960 - 0 . 7 - 0 . 1 0.1 - 0 . 2 0 . 2 0 . 7 0 . 7 0 . 7 0 . 5 0 . 4 0 . 6 0 . 8 1 . 3 1 . 21961 - 0 . 5 0 . 0 0 . 2 - 0.1 0 . 3 0 . 8 0 . 8 0 . 8 0 . 7 0 . 6 0 . 8 1.0 1 . 3 1 . 3 1 . 41962 - 0 . 4 0 . 1 0 . 3 0.1 0 . 4 0 . 9 0 . 9 0 . 8 0 . 8 0 . 7 0 . 9 1. 1 1 . 4 1 . 4 1 . 5 1 . 51963 - 0 . 3 0 . 2 0 . 3 0 . 2 0 . 5 0 . 9 0 . 9 0 . 9 0 . 9 0 . 8 1.0 1. 1 1 . 4 1 . 4 1 . 5 1 . 5 1 . 41964 - 0.1 0 . 3 0 . 5 0 . 3 0 . 6 1.0 1.0 1.0 1.0 1.0 1. 1 1 . 3 1 . 5 1 . 6 1 . 7 1 . 8 1 . 9 2 . 31965 0. 0 0 . 4 0 . 6 0 . 4 0 . 7 1. 1 1. 1 1. 1 1. 1 1. 1 1 . 2 1 . 4 1 . 6 1 . 6 1 . 7 1 . 8 1 . 9 2 . 1 2 . 01966 0. 0 0 . 5 0 . 6 0 . 5 0 . 8 1 . 1 1. 1 1. 1 1. 1 1. 1 1 . 2 1 . 4 1 . 6 1 . 6 1 . 7 1 . 7 1 . 8 1 . 9 1 . 7 1 . 41967 0 . 1 0 . 5 0 . 6 0 . 5 0 . 8 1 . 1 1. 1 1. 1 1.1 1.1 1 . 2 1 . 4 1 . 5 1 . 5 1 . 6 1 . 6 1 . 6 1 . 7 1 . 5 1 . 2 1.11968 0.1 0 . 5 0 . 6 0 . 5 0 . 8 1 . 1 1. 1 1. 1 1.1 1. 1 1 . 2 1 . 3 1 . 4 1 . 4 1 . 5 1 . 5 1 . 4 1 . 4 1 . 2 1.0 0 . 81969 0.1 0 . 5 0 . 6 0 . 5 0 . 8 1.0 1. 1 1.0 1.0 1.0 1. 1 1 . 2 1 . 3 1 . 3 1 . 3 1 . 3 1 . 3 1 . 3 1. 1 0 . 8 0 . 7
1970 0 . 2 0 . 5 0 . 6 0 . 5 0 . 8 1.0 1.0 1.0 1.0 1.0 1 . 1 1 . 2 1 . 3 1 . 3 1 . 3 1 . 3 1 . 3 1 . 2 1. 1 0 . 9 0 . 81971 0 . 2 0 . 5 0 . 6 0 . 5 0 . 8 1.0 1.0 1.0 1.0 1.0 1. 1 1 . 2 1 . 3 1 . 3 1 . 3 1 . 3 1 . 2 1 . 2 1.0 0 . 9 0 . 81972 0 . 2 0 . 5 0 . 6 0 . 5 0 . 8 1.0 1 . 0 1.0 1.0 1.0 1. 1 1. 1 1 . 2 1 . 2 1 . 2 1 . 2 1. 1 1. 1 1 . 0 0 . 8 0 . 71973 0.1 0 . 4 0 . 5 0 . 4 0 . 7 0 . 9 0 . 9 0 . 9 0 . 8 0 . 8 0 . 9 0 . 9 1.0 1.0 1.0 0 . 9 0 . 9 0 . 8 0 . 7 0 . 5 0 . 41974 - 0. 0 0 . 3 0 . 4 0 . 3 0 . 5 0 . 7 0 . 7 0 . 6 0 . 6 0 . 6 0 . 6 0 . 7 0 . 7 0 . 7 0 . 6 0 . 6 0 . 5 0 . 4 0 . 2 0. 0 - 0.11975 0.1 0 . 2 0 . 3 0 . 2 0 . 4 0 . 6 0 . 6 0 . 6 0 . 5 0 . 5 0 . 5 0 . 6 0 . 6 0 . 6 0 . 5 0 . 4 0 . 4 0 . 3 0 . 1 0.1 0 . 31976 - 0.0 0 . 2 0 . 3 0 . 2 0 . 4 0 . 6 0 . 6 0 . 5 0 . 5 0 . 5 0 . 5 0 . 5 0 . 6 0 . 5 0 . 5 0 . 4 0 . 4 0 . 3 0.1 0 . 1 0 . 21977 0.1 0 . 2 0 . 2 0 . 2 0 . 3 0 . 5 0 . 5 0 . 5 0 . 4 0 . 4 0 . 4 0 . 4 0 . 5 0 . 4 0 . 4 0 . 3 0 . 2 0.1 - 0. 0 - 0 . 2 - 0 . 31978 0.1 0.1 0 . 2 0.1 0 . 3 0 . 4 0 . 4 0 . 4 0 . 3 0 . 3 0 . 3 0 . 3 0 . 4 0 . 3 0 . 3 0 . 2 0.1 0. 0 - 0 . 1 - 0 . 3 - 0 . 41979 - 0 . 2 0 . 0 0 . 1 0. 0 0 . 2 0 . 3 0 . 3 0 . 3 0 . 2 0 . 2 0 . 2 0 . 2 0 . 2 0 . 2 0.1 0 . 0 - 0.1 - 0.1 - 0 . 3 - 0 . 5 0 . 6
1980 - 0 . 2 0. 0 0.1 - 0. 0 0.1 0 . 3 0 . 2 0 . 2 0 . 2 0.1 0 . 1 0.1 0 . 2 0.1 0. 0 - 0. 0 - 0.1 - 0 . 2 - 0 . 4 - 0 . 5 - 0 . 61981 - 0.1 0 . 2 0 . 2 0.1 0 . 3 0 . 4 0 . 4 0 . 4 0 . 4 0 . 3 0 . 3 0 . 4 0 . 4 0 . 3 0 . 3 0 . 2 0 . 2 0.1 - 0. 0 - 0 . 2 - 0 . 31982 0.1 0 . 3 0 . 4 0 . 3 0 . 5 0 . 6 0 . 6 0 . 6 0 . 6 0 . 5 0 . 6 0 . 6 0 . 6 0 . 6 0 . 6 0 . 5 0 . 5 0 . 4 0 . 3 0 . 2 0 . 21983 0 . 2 0 . 4 0 . 5 0 . 4 0 . 6 0 . 7 0 . 7 0 . 7 0 . 7 0 . 7 0 . 7 0 . 8 0 . 8 0 . 8 0 . 7 0 . 7 0 . 7 0 . 6 0 . 6 0 . 5 0 . 41984 0 . 4 0 . 6 0 . 7 0 . 6 0 . 7 0 . 9 0 . 9 0 . 9 0 . 9 0 . 9 0 . 9 0 . 9 1.0 1.0 0 . 9 0 . 9 0 . 9 0 . 9 0 . 8 0 . 7 0 . 71985 0 . 4 0 . 7 0 . 7 0 . 7 0 . 8 1.0 1.0 1.0 1.0 1.0 1.0 1.0 1. 1 1. 1 1.1 1.0 1.0 1.0 0 . 9 0 . 9 0 . 91986 0 . 6 0 . 8 0 . 8 0 . 8 0 . 9 1 . 1 1. 1 1. 1 1. 1 1. 1 1. 1 1 . 2 1 . 2 1 . 2 1 . 2 1 . 2 1 . 2 1 . 2 1. 1 1. 1 1.11987 0 . 6 0 . 8 0 . 9 0 . 8 0 . 9 1 . 1 1. 1 1. 1 1. 1 1. 1 1. 1 1 . 2 1 . 2 1 . 2 1 . 2 1 . 2 1 . 2 1 . 2 1.1 1. 1 1.1
i . . ..« -« !>W W t W X W W' /V «>
cks, Bonds, B
ills, an
d Inflation: H
istorical Returns
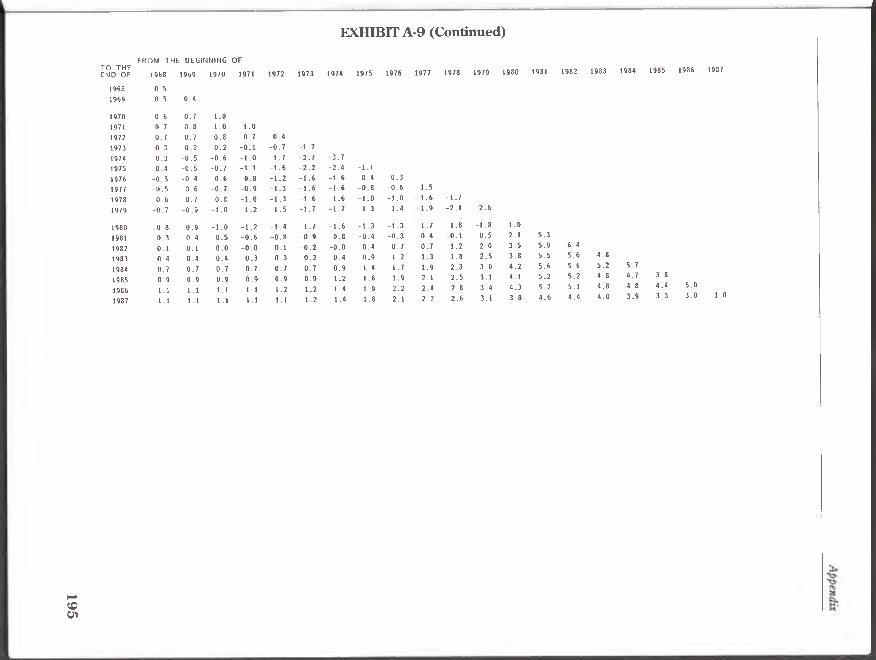
19
5
EXHIBIT A-9 (Continued)
F R O M T H E B E G I N N I N G O F
L V S F 1968 1969 1970 1971 1972 1973 1974 1975 1976 1977 1978 1979 1980 1981 1982 1983 1984 1985 1986 1987
1968 0 . 5
1969 0 . 5 0 . 4
1970 0 . 6 0 . 7 1.01971 0 . 7 0 . 8 1.0 1.01972 0 . 7 0 . 7 0 . 8 0 . 7
1973 0 . 3 0 . 2 0 . 2 - 0 . 1
1974 0 . 3 - 0 . 5 - 0 . 6 - 1 . 0
1975 - 0 . 4 - 0 . 5 - 0 . 7 - 1 . 1
1976 - 0 . 3 - 0 . 4 - 0 . 6 - 0 . 8
1977 - 0 . 5 - 0 . 6 - 0 . 7 - 0 . 9
1978 - 0 . 6 - 0 . 7 - 0 . 8 - 1 . 0
1979 - 0 . 7 - 0 . 9 - 1 . 0 - 1 . 2
1980 0 . 8 - 0 . 9 - 1 . 0 - 1 . 2
1981 - 0 . 3 - 0 . 4 - 0 . 5 - 0 . 6
1982 0.1 0.1 0.0 - 0 . 0
1983 0 . 4 0 . 4 0 . 4 0 . 3
1984 0 . 7 0 . 7 0 . 7 0 . 7
1985 0 . 9 0 . 9 0 . 9 0 . 9
1986 1.1 1 . 1 1. 1 1 . 1
1987 1. 1 1 . 1 1. 1 1 . 1
0 . 4
- 0 . 7
- 1 . 7
- 1 . 6
- 1 . 2
- 1 . 7
- 2 . 7
- 2 . 2
- 1 . 6
- 3 . 7
- 2 . 4
- 1 . 6
- 1. 1
- 0 . 4 0 . 3
- 1 . 3 - 1 . 6 - 1 . 6 - 0 . 8 - 0 . 6
- 1 . 3 - 1 . 6 - 1 . 6 - 1 . 0 - 1 . 0
- 1 . 5 - 1 . 7 - 1 . 7 - 1 . 3 - 1 . 4
- 1 . 4 - 1 . 7 - 1 . 6 - 1 . 3 - 1 . 3
- 0 . 8 - 0 . 9 - 0 . 8 - 0 . 4 - 0 . 3
- 0 . 1 - 0 . 2 - 0 . 0 0 . 4 0 . 7
0 . 3 0 . 2 0 . 4 0 . 9 1 . 2
0 . 7 0 . 7 0 . 9 1 . 4 1 . 7
0 . 9 0 . 9 1 . 2 1 . 6 1 . 9
1 . 2 1 . 2 1 . 4 1 . 9 2 . 2
1.1 1 . 2 1 . 4 1 . 8 2 . 1
- 1 . 5
1 . 6 - 1 . 7
1 . 9 - 2 . 1 - 2 . 6
1 . 7 1 . 8 - 1 . 8 - 1 . 0
- 0 . 4 - 0 . 1 0 . 5 2 . 1 5 . 3
0 . 7 1 . 2 2 . 0 3 . 5 5 . 9 6 . 4
1 . 3 1 . 8 2 . 5 3 . 8 5 . 5 5 . 6
1 . 9 2 . 3 3 . 0 4 . 2 5 . 6 5 . 6
2 . 1 2 . 5 3 . 1 4 . 1 5 . 2 5 . 2
2 . 4 2 . 8 3 . 4 4 . 3 5 . 2 5. 1
2 . 2 2 . 6 3 . 1 3 . 8 4 . 6 4 . 4
4 . 8
5 . 2 5 . 7
4 . 8 4 . 7 3 . 8
4 . 8 4 . 8 4 . 4 5 . 0
4 . 0 3 . 9 3 . 3 3 . 0 1. 0

19
6 E X H IB IT A -1 0
L O N G -H O R IZ O N E Q U IT Y R ISK P R E M IU M S
RATES O F R E T U R N FO R A LL YEARLY H O L D IN G P E R IO D S FRO M 1 9 2 6 TO 1 9 8 7
(P e r c e n t P e r A n n u m C o m p o u n d e d A n n u a lly )
F R O M T H E B E G I N N I N G O FT O T H E
E N D O F 1926 1927 1928 1929 1930 1931 1932 1933 1934 1935 1936 1937 1938 1939 1940 1941 1942 1943 1944 1945 1946
1926 7 . 6
1927 1 9 . 6 3 3 . 0
1928 2 5 . 8 3 6 . 0 3 9 . 1
1929 1 5 . 2 1 7 . 9 1 1 . 0 - 1 1 . 5
1930 5 . 1 4 . 4 - 3 . 6 - 1 9 . 8 - 2 7 . 31931 - 5 . 7 - 8 . 2 - 1 6 . 3 - 2 9 . 3 - 3 6 . 9 - 4 5 . 21932 - 6 . 6 - 8 . 7 - 1 5 . 4 - 2 5 . 2 - 2 9 . 3 - 3 0 . 3 - 1 1 . 51933 - 0 . 9 - 2 . 1 - 7 . 0 - 14. 1 - 1 4 . 8 - 1 0 . 2 1 5 . 0 4 9 . 31934 - 1 . 3 - 2 . 4 - 6 . 6 - 1 2 . 6 - 1 2 . 8 - 8 . 8 8 . 1 19 . 4 - 4 . 51935 2 . 5 1 . 9 - 1 . 4 - 6 . 2 - 5 . 3 - 0 . 1 16. 1 2 7 . 0 17. 1 4 3 . 61936 4 . 7 4 . 4 1 . 7 - 2 . 2 - 0 . 8 4 . 4 18 . 8 2 7 . 8 2 1 . 4 3 6 . 8 3 0 . 31937 0 . 4 - 0 . 2 - 3 . 0 - 6 . 9 - 6 . 3 - 2 . 8 6 . 9 11. 1 3 . 1 5 . 8 - 9 . 2 - 3 6 . 71938 2 . 3 1 . 9 - 0 . 6 - 3 . 9 - 3 . 0 0 . 6 9 . 7 1 3 . 7 7 . 6 10 . 9 1 . 8 - 10. 1 2 7 . 71939 1 . 9 1 . 5 - 0 . 8 - 3 . 8 - 3 . 0 0 . 2 8 . 1 1 1 . 2 5 . 8 8 . 0 0 . 6 - 7 . 7 1 1 . 5 - 2 . 7
1940 0 . 9 0 . 5 - 1 . 7 - 4 . 5 - 3 . 8 - 1. 1 5 . 7 8 . 0 3 . 1 4 . 5 - 2 . 0 - 8 . 7 3 . 1 - 7 . 4 - 11. 81941 0 . 0 0 . 5 - 2 . 5 - 5 . 2 - 4 . 6 - 2 . 2 3 . 6 5 . 4 0 . 9 1 . 7 - 4 . 0 - 9 . 7 - 1 . 3 - 9 . 4 - 1 2 . 5 - 1 3 . 31942 0 . 9 0 . 5 - 1 . 3 - 3 . 7 - 3 . 1 0 . 7 4 . 8 6 . 6 2 . 6 3 . 6 - 1 . 2 - 5 . 6 2 . 2 - 3 . 3 - 3 . 5 0 . 9 1 7 . 51943 2 . 1 1 . 7 0 . 0 - 2 . 1 - 1 . 4 0 . 9 6 . 2 7 . 9 4 . 5 5 . 5 1 . 6 - 2 . 0 5 . 4 1 . 4 2 . 5 7 . 8 20 . 1 2 2 . 91944 2 . 8 2 . 5 1 . 0 - 1 . 0 - 0 . 3 2 . 0 7 . 0 8 . 7 5 . 6 6 . 6 3 . 2 0 . 2 7 . 0 3 . 9 5 . 2 10 . 0 1 9 . 0 1 9 . 8 1 6 . 91945 4 . 1 4 . 0 2 . 5 0 . 7 1 . 5 3 . 8 8 . 7 10 . 4 7 . 6 8 . 8 5 . 8 3 . 4 1 0 . 0 7 . 6 9 . 5 1 4 . 3 2 2 . 5 2 4 . 2 2 4 . 8 3 3 . 31946 3 . 4 3 . 2 1 . 8 0 . 1 0 . 8 2 . 9 7 . 3 8 . 8 6 . 2 7 . 1 4 . 3 2 . 0 7 . 6 5 . 3 6 . 5 9 . 9 1 5 . 2 14 . 6 1 2 . 0 9 . 6 - 9 . 91947 3 . 4 3 . 2 1 . 9 0 . 3 1 . 0 2 . 9 7 . 1 8 . 4 6 . 0 6 . 8 4 . 2 2 . 1 7 . 1 5 . 1 6 . 1 8 . 9 13. 1 12 . 3 9 . 8 7 . 5 - 3 . 41948 3 . 4 3 . 2 2 . 0 0 . 4 1. 1 2 . 9 6 . 8 8 . 1 5 . 8 6 . 6 4 . 1 2 . 2 6 . 8 4 . 9 5 . 7 8 . 2 11 . 6 1 0 . 7 8 . 4 6 . 4 1. 31949 3 . 9 3 . 7 2 . 6 1. 1 1 . 8 3 . 6 7 . 3 8 . 5 6 . 4 7 . 2 5 . 0 3 . 2 7 . 5 5 . 8 6 . 7 9 . 0 12 . 2 1 1 . 5 9 . 7 8 . 3 2 . 8
1950 4 . 8 4 . 7 3 . 6 2 . 2 2 . 9 4 . 7 8 . 4 9 . 6 7 . 6 8 . 4 6 . 4 4 . 9 9 . 0 7 . 6 8 . 6 10 . 9 1 3 . 9 13. 5 12 . 2 1 1 5 7 . 61951 5 . 4 5 . 3 4 . 3 3 . 0 3 . 7 5 . 5 9 . 0 10 . 2 8 . 3 9 . 1 7 . 3 5 . 9 9 . 9 8 . 6 9 . 6 11 . 8 14 . 6 1 4 . 3 13 . 3 12. 8 9 . 71952 5 . 7 5 . 7 4 . 7 3 . 5 4 . 2 5 . 9 ' 9 . 3 10. 4 8 . 7 9 . 5 7 . 7 6 . 5 1 0 . 2 9. 1 10 . 0 12. 1 14. 7 14. 4 13. 5 13 1 10. 51953 5 . 4 5 . 3 4 . 4 3 . 2 3 . 8 5 . 5 8 . 6 9 . 7 8 . 0 8 . 7 7 . 1 5 . 8 9 . 3 8 . 2 9 . 0 10 . 8 13 . 0 1 2 . 6 1 1 . 7 11. 1 8 . 61954 6 . 6 6 . 6 5 . 7 4 . 6 5 . 3 7 . 0 10. 1 1 1 . 2 9 . 7 10 . 4 8 . 9 7 . 8 11 . 3 10 . 3 11. 2 13. 1 15. 4 15. 3 1 4 . 6 14. 4 12. 41955 7 . 3 7 . 3 6 . 5 5 . 4 6. 1 7 . 7 10 . 8 11 . 9 10. 5 11. 2 9 . 8 8 . 8 12. 1 1 1 . 3 12. 2 14 . 0 1 6 . 3 16. 2 15. 7 15. 6 13. 91956 7 . 2 7 . 2 6 . 4 5 . 3 6 . 0 7 . 6 1 0 . 5 11 . 5 10.1 10. 9 9 . 5 8 . 5 1 1 . 7 10 . 8 1 1 . 7 13. 4 15. 4 1 5 . 2 14. 7 14. 5 12. 91957 6 . 4 6 . 4 5 . 6 4 . 6 5 . 2 6 . 7 9 . 5 1 0 . 4 9 . 0 9 . 6 8 . 3 7 . 4 10 . 2 9 . 4 10. 1 11 . 5 1 3 . 3 1 3 . 0 12. 4 12. 0 10. 41958 7 . 3 7 . 3 6 . 6 5 . 6 6 . 3 7 . 7 10 . 4 1 1 . 4 10. 1 10. 7 9 . 5 8 . 6 11 . 5 10 . 7 1 1 . 5 12. 9 1 4 . 7 1 4 . 5 14. 0 13. 8 12. 41959 7 . 3 7 . 3 6 . 6 5 . 7 6 . 3 7 . 7 1 0 . 3 11 . 2 1 0 . 0 10. 6 9 . 4 8 . 6 1 1 . 3 1 0 . 5 11. 3 12. 6 1 4 . 3 14. 1 13. 6 13. 3 12. 0
Stocks, Bonds, B
ills, and In
flation: H
istorical Retu
rns
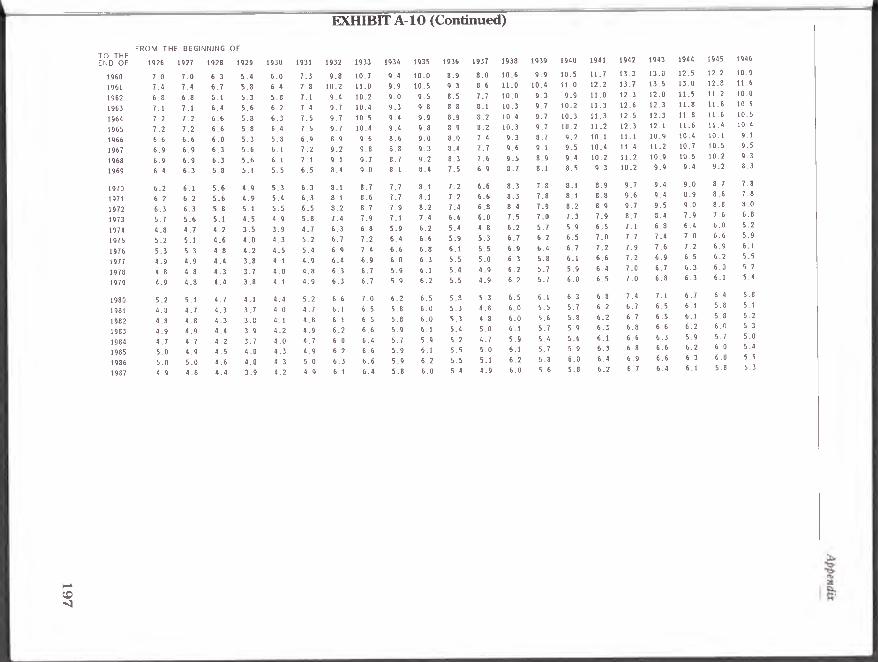
19
7
EXHIBIT A-10 (Continued)
F R O M T H E B E G I N N I N G O F
T O T H E
E N D O F 1926 1927 1928 1929 1930 1931
1960 7 . 0 7 . 0 6 . 3 5 . 4 6 . 0 7 . 3
1961 7 . 4 7 . 4 6 . 7 5 . 8 6 . 4 7 . 8
1962 6 . 8 6 . 8 0 . 1 5 . 3 5 . 8 7 . 1
1963 7 . 1 7 . 1 6 . 4 5 . 6 6 . 2 7 . 4
1964 7 . 2 7 . 2 6 . 6 5 . 8 6 . 3 7 . 5
1965 7 . 2 7 . 2 6 . 6 5 . 8 6 . 4 7 . 5
1966 6 . 6 6 . 6 6 . 0 5 . 3 5 . 8 6 . 9
1967 6 . 9 6 . 9 6 . 3 5 . 6 6 . 1 7 . 2
1968 6 . 9 6 . 9 6 . 3 5 . 6 6 . 1 7 . 1
1969 6 . 4 6 . 3 5 . 8 5 . 1 5 . 5 6 . 5
1970 6 . 2 6 . 1 5 . 6 4 . 9 5 . 3 6 . 3
1971 6 . 2 6 . 2 5 . 6 4 . 9 5 . 4 6 . 3
1972 6 . 3 6 . 3 5 . 8 5 . 1 5 . 5 6 . 5
1973 5 . 7 5 . 6 5 . 1 4 . 5 4 . 9 5 . 8
1974 4 . 8 4 . 7 4 . 2 3 . 5 3 . 9 4 . 7
1975 5 . 2 5. 1 4 . 6 4 . 0 4 . 3 5 . 2
1976 5 . 3 5 . 3 4 . 8 4 . 2 4 . 5 5 . 4
1977 4 . 9 4 . 9 4 . 4 3 . 8 4 . 1 4 . 9
1978 4 . 8 4 . 8 4 . 3 3 . 7 4 . 0 4 . 8
1979 4 . 9 4 . 8 4 . 4 3 . 8 4 . 1 4 . 9
1980 5 . 2 5 . 1 4 . 7 4 . 1 4 . 4 5 . 2
1981 4 . 8 4 . 7 4 . 3 3 . 7 4 0 4 . 7
1982 4 . 8 4 . 8 4 . 3 3 . 8 4 . 1 4 . 8
1983 4 . 9 4 . 9 4 . 4 3 . 9 4 . 2 4 . 9
1984 4 . 7 4 . 7 4 . 2 3 . 7 4 . 0 4 . 7
1985 5 . 0 4 . 9 4 . 5 4 . 0 4 . 3 4 . 9
1986 5 . 0 5 . 0 4 . 6 4 . 0 4 . 3 5 . 0
1987 4 . 9 4 . 8 4 . 4 3 . 9 4 . 2 4 . 9
1932 1933 1934 1935 1936 1937 1938
9 . 8 1 0 . 7 9 . 4 1 0 . 0 8 . 9 8 . 0 1 0 . 6
1 0 . 2 1 1 . 0 9 . 9 1 0 . 5 9 . 3 8 . 6 1 1 . 0
9 . 4 1 0 . 2 9 . 0 9 . 5 8 . 5 7 . 7 1 0 . 0
9 . 7 1 0 . 4 9 . 3 9 . 8 8 . 8 8 . 1 1 0 . 3
9 . 7 1 0 . 5 9 . 4 9 . 9 8 . 9 8 . 2 1 0 . 4
9 . 7 10 . 4 9 . 4 9 . 8 8 . 9 8 . 2 1 0 . 3
8 . 9 9 . 6 8 . 6 9 . 0 8 . 0 7 . 4 9 . 3
9 . 2 9 . 8 8 . 8 9 . 3 8 . 4 7 . 7 9 . 6
9 . 1 9 . 7 8 . 7 9 . 2 8 . 3 7 . 6 9 . 5
8 . 4 9 . 0 8 . 1 8 . 4 7 . 5 6 . 9 8 . 7
8 . 1 8 . 7 7 . 7 8 . 1 7 . 2 6 . 6 8 . 3
8 . 1 8 . 6 7 . 7 8 . 1 7 . 2 6 . 6 8 . 3
8 . 2 8 . 7 7 . 9 8 . 2 7 . 4 6 . 8 8 . 4
7 . 4 7 . 9 7 . 1 7 . 4 6 . 6 6 . 0 7 . 5
6 . 3 6 . 8 5 . 9 6 . 2 5 . 4 4 . 8 6 . 2
6 . 7 7 . 2 6 . 4 6 . 6 5 . 9 5 . 3 6 . 7
6 . 9 7 . 4 6 . 6 6 . 8 6 . 1 5 . 5 6 . 9
6 . 4 6 . 9 6 . 0 6 . 3 5 . 5 5 . 0 6 . 3
6 . 3 6 . 7 5 . 9 6 . 1 5 . 4 4 . 9 6 . 2
6 . 3 6 . 7 5 . 9 6 . 2 5 . 5 4 . 9 6 . 2
6 . 6 7 . 0 6 . 2 6 . 5 5 . 8 5 . 3 6 . 5
6 . 1 6 . 5 5 . 8 6 . 0 5 . 3 4 . 8 6 . 0
6 . 1 6 . 5 5 . 8 6 . 0 5 . 3 4 . 8 6 . 0
6 . 2 6 . 6 5 . 9 6 . 1 5 . 4 5 . 0 6 . 1
6 0 6 . 4 5 . 7 5 . 9 5 . 2 4 . 7 5 . 9
6 . 2 6 . 6 5 . 9 6 . 1 5 . 5 5 . 0 6 . 1
6 . 3 6 . 6 5 . 9 6 . 2 5 . 5 5 . 1 6 . 2
6 . 1 6 . 4 5 . 8 6 . 0 5 . 4 4 . 9 6 . 0
1939 1940 1941 1942 1943 1944 1945 1946
9 . 9 1 0 . 5 1 1 . 7 1 3 . 3 1 3 . 0 1 2 . 5 12 . 2 10. 9
1 0 . 4 1 1 . 0 1 2 . 2 1 3 . 7 1 3 . 5 1 3 . 0 1 2 . 8 11. 6
9 . 3 9 . 9 1 1 . 0 1 2 . 3 1 2 . 0 1 1 . 5 1 1 . 2 10. 0
9 . 7 1 0 . 2 1 1 . 3 1 2 . 6 1 2 . 3 1 1 . 8 11. 6 10. 5
9 . 7 1 0 . 3 1 1 . 3 1 2 . 5 1 2 . 3 1 1 . 8 1 1 . 6 10. 5
9 . 7 1 0 . 2 1 1 . 2 12 . 3 12. 1 1 1 . 6 11. 4 10. 4
8 . 7 9 . 2 10 . 1 11 . 1 1 0 . 9 1 0 . 4 10. 1 9 . 1
9 . 1 9 . 5 1 0 . 4 1 1 . 4 1 1 . 2 10. 7 1 0 . 5 9 . 5
8 . 9 9 . 4 1 0 . 2 1 1 . 2 1 0 . 9 1 0 . 5 1 0 . 2 9 . 3
8 . 1 8 . 5 9 . 3 1 0 . 2 9 . 9 9 . 4 9 . 2 8 . 3
7 . 8 8 . 1 8 . 9 9 . 7 9 . 4 9 . 0 8 . 7 7 . 8
7 . 8 8 . 1 8 . 8 9 . 6 9 . 4 8 . 9 8 . 6 7 . 8
7 . 9 8 . 2 8 . 9 9 . 7 9 . 5 9 . 0 8 . 8 8 . 0
7 . 0 7 . 3 7 . 9 8 . 7 8 . 4 7 . 9 7 . 6 6 . 8
5 . 7 5 . 9 6 . 5 7 . 1 6 . 8 6 . 4 6 . 0 5 . 2
6 . 2 6 . 5 7 . 0 7 . 7 7 . 4 7 . 0 6 . 6 5 . 9
6 . 4 6 . 7 7 . 2 7 . 9 7 . 6 7 . 2 6 . 9 6 . 1
5 . 8 6 . 1 6 . 6 7 . 2 6 . 9 6 . 5 6 . 2 5 . 5
5 . 7 5 . 9 6 . 4 7 . 0 6 . 7 6 . 3 6 . 0 5 . 2
5 . 7 6 . 0 6 . 5 7 . 0 6 . 8 6 . 3 6 . 1 5 . 4
6 . 1 6 . 3 6 . 8 7 . 4 7 . 1 6 . 7 6 . 4 5 . 8
5 . 5 5 . 7 6 . 2 6 . 7 6 . 5 6 . 1 5 . 8 5. 1
5 . 6 5 . 8 6 . 2 6 . 7 6 . 5 6 . 1 5 . 8 5 . 2
5 . 7 5 . 9 6 . 3 6 . 8 6 . 6 6 . 2 6 . 0 5 . 3
5 . 4 5 . 6 6 . 1 6 . 6 6 . 3 5 . 9 5 . 7 5 . 0
5 . 7 5 . 9 6 . 3 6 . 8 6 . 6 6 . 2 6 . 0 5 . 4
5 . 8 6 . 0 6 . 4 6 . 9 6 . 6 6 . 3 6 . 0 5 . 5
5 . 6 5 . 8 6 . 2 6 . 7 6 . 4 6 . 1 5 . 8 5 . 3

19
8 E X H IB IT A -1 0 (C o n tin u e d )
F R O M T H E B E G I N N I N G O F
E N D O F 1947 1948 1949 1950 1951 1952 1953
1947 3 . 5
1948 3 . 3 3 . 0
1949 7 . 4 9 . 4 1 6 . 2
1950 1 2 . 4 1 5 . 6 2 2 . 4 2 9 . 01951 14. 1 1 6 . 9 2 2 . 0 2 5 . 0 2 1 . 11952 1 4 . 3 1 6 . 6 2 0 . 3 2 1 . 7 1 8 . 2 1 5 . 31953 1 1 . 5 1 2 . 9 1 5 . 0 1 4 . 8 1 0 . 4 5 . 4 - 3 . 71954 1 5 . 6 17 . 4 2 0 . 0 2 0 . 8 1 8 . 9 18. 1 1 9 . 61955 1 6 . 9 18 . 7 2 1 . 2 2 2 . 0 2 0 . 7 2 0 . 5 2 2 . 31956 1 5 . 5 16 . 9 1 8 . 8 1 9 . 2 1 7 . 6 16 . 9 1 7 . 31957 1 2 . 5 1 3 . 4 1 4 . 6 1 4 . 4 1 2 . 5 11. 1 1 0 . 31958 1 4 . 5 1 5 . 5 1 6 . 9 1 6 . 9 1 5 . 5 1 4 . 7 1 4 . 61959 1 3 . 9 1 4 . 8 1 6 . 0 1 6 . 0 1 4 . 6 1 3 . 8 1 3 . 6
1960 1 2 . 6 1 3 . 3 1 4 . 2 1 4 . 0 1 2 . 6 1 1 . 7 1 1 . 31961 1 3 . 2 1 3 . 9 1 4 . 8 1 4 . 7 1 3 . 5 1 2 . 7 1 2 . 41962 11. 4 1 2 . 0 1 2 . 6 1 2 . 4 11. 1 1 0 . 2 9 . 71963 1 1 . 8 1 2 . 3 1 3 . 0 1 2 . 8 1 1 . 6 1 0 . 8 1 0 . 41964 1 1 . 8 1 2 . 3 1 2 . 9 1 2 . 7 1 1 . 6 1 0 . 9 1 0 . 61965 1 1 . 6 12. 1 1 2 . 6 1 2 . 4 1 1 . 4 1 0 . 7 10 . 41966 1 0 . 2 1 0 . 5 1 0 . 9 1 0 . 6 9 . 6 8 . 9 8 . 41967 1 0 . 5 1 0 . 9 1 1 . 3 11. 1 10. 1 9 . 4 9 . 11968 1 0 . 3 1 0 . 6 1 1 . 0 1 0 . 8 9 . 8 9 . 2 8 . 81969 9 . 1 9 . 4 9 . 7 9 . 4 8 . 4 7 . 8 7 . 3
1970 8 . 6 8 . 8 9 . 1 8 . 8 7 . 9 7 . 2 6 . 81971 8 . 6 8 . 8 9 . 0 8 . 7 7 . 8 7 . 2 6 . 81972 8 . 7 8 . 9 9 . 2 8 . 9 8 . 0 7 . 5 7 . 11973 7 . 5 7 . 6 7 . 8 7 . 5 6 . 7 6 . 0 5 . 61974 5 . 8 5 . 9 6 . 0 5 . 6 4 . 7 4 . 0 3 . 61975 6 . 4 6 . 6 6 . 7 6 . 3 5 . 5 4 . 9 4 . 51976 6 . 7 6 . 8 7 . 0 6 . 6 5 . 9 5 . 3 4 . 91977 6 . 0 6 . 1 6 . 2 5 . 8 5 . 1 4 . 5 4 . 11978 5 . 8 5 . 8 5 . 9 5 . 6 4 . 8 4 . 3 3 . 91979 5 . 9 5 . 9 6 . 0 5 . 7 5 . 0 4 . 4 4 . 1
1980 6 . 3 6 . 3 6 . 5 6 . 2 5 . 5 5 . 0 4 . 61981 5 . 6 5 . 7 5 . 7 5 . 4 4 . 7 4 . 2 3 . 91982 5 . 6 5 . 7 5 . 8 5 . 5 4 . 8 4 . 3 4 . 01983 5 . 8 5 . 8 5 . 9 5 . 6 5 . 0 4 . 5 4 . 21984 5 . 5 5 . 5 5 . 6 5 . 3 4 . 7 4 . 2 3 . 91985 5 . 8 5 . 9 5 . 9 5 . 7 5 . 1 4 . 6 4 . 31986 5 . 9 5 . 9 6 . 0 5 . 7 5 . 2 4 . 7 4 . 41987 5 . 7 5 . 7 5 . 8 5 . 5 4 . 9 4 . 5 4 . 2
1960 1961 1962 1963 1964 1965 1966 1967
- 3 . 6
8 . 5 2 2 . 2
1. 1 3 . 6 - 1 2 . 2
5 . 1 8 . 2 1 . 9 1 8 . 2
6 . 4 9 . 1 5 . 1 1 5 . 0 1 1 . 8
6 . 7 8 . 9 5 . 8 1 2 . 6 9 . 9 7 . 9
3 . 5 4 . 7 1 . 5 5 . 3 1 . 3 - 3 . 6 - 13 9
5 . 2 6 . 6 4 . 2 7 . 8 5 . 3 3 . 3 1 . 0 18. 5
5 . 2 6 . 4 4 . 3 7 . 4 5 . 3 3 . 8 2 . 4 11. 7
3 . 2 4 . 0 1 . 9 4 . 1 1 . 9 0 . 0 - 1 . 9 2 . 5
2 . 6 3 . 3 1 . 4 3 . 2 1 . 3 - 0 . 4 - 2 . 0 1. 2
3 . 0 3 . 7 2 . 0 3 . 7 2 . 0 0 . 7 - 0 . 5 2 . 5
3 . 7 4 . 4 2 . 9 4 . 5 3 . 1 2 . 1 1 . 3 4 . 0
1 . 8 2 . 3 0 . 8 2 . 0 0 . 5 - 0 . 6 - 1 . 7 0 . 2
- 0 . 8 - 0 . 6 - 2 . 2 - 1 . 3 - 2 . 9 - 4 . 3 - 5 . 5 - 4 . 4
0 . 7 1 . 0 - 0 . 3 0 . 6 - 0 . 7 - 1 . 8 - 2 . 7 1 . 3
1 . 5 1 . 8 0 . 6 1 . 6 0 . 4 - 0 . 5 1 . 2 0 . 2
0 . 6 0 . 9 - 0 . 3 0 . 5 - 0 . 6 - 1 . 5 - 2 . 3 1 . 20 . 5 0 . 7 - 0 . 4 0 . 4 - 0 . 7 - 1 . 5 - 2 . 2 1 . 2
0 . 9 1 . 2 0 . 1 0 . 9 - 0 . 1 - 0 . 9 - 1 . 5 0 . 4
1 . 8 2 . 1 1. 1 1 . 9 1 . 0 0 . 4 - 0 . 1 0 . 9
1 . 0 1 . 2 0 . 2 0 . 9 0 . 1 - 0 . 6 1. 1 0 . 2
1 . 2 1 . 4 0 . 5 1 . 2 0 . 4 - 0 . 2 - 0 . 7 0 , 2
1 .6 1 . 8 1 . 0 1 . 7 0 . 9 0 . 4 0 . 0 0 . 8
1 . 3 1 . 5 0 . 7 1 . 4 0 . 6 0 . 1 - 0 . 3 0 . 5
1 . 9 2 . 2 1 . 4 2 . 1 1 . 4 0 . 9 0 . 6 1. 4
2 . 2 2 . 4 1 . 7 2 . 3 1 . 7 1 . 3 0 . 9 1 . 8
2 . 0 2 . 2 1 . 5 2 . 1 1 . 5 1 . 1 0 . 8 1 . 5
K X M I R r T * /V - * O
Stocks, Bon
ds, Bills, an
d Inflation
: Historical R
eturn
s

19
9
E X H IB IT A -1 0 (C o n tin u e d )
F R O M T H E B E G I N N I N G O F
I O 1 H EE N D O F 1968 1969 1970 1971 1972 1973 1974 1975 1976 1977 1978 1979
1968 5 . 3
1969 - 4 . 7 - 1 3 . 6
1970 - 4 . 0 - 8 . 3 - 2 . 6
1971 - 1 . 2 - 3 . 3 2 . 4 7 . 5
1972 1 . 4 0 . 4 5 . 6 9 . 9 1 2 . 4
1973 - 2 . 5 - 4 . 0 - 1 . 4 - 1 . 1 - 5 . 1 - 1 9 . 9
1974 - 7 . 3 - 9 . 3 - 8 . 4 - 9 . 7 - 1 4 . 9 - 2 5 . 9 - 3 1 . 4
1975 - 3 . 6 - 4 . 8 - 3 . 2 - 3 . 4 - 5 . 9 - 1 1 . 3 - 6 . 7 2 7 . 0
1976 - 1 . 7 - 2 . 5 - 0 . 8 - 0 . 5 - 2 . 1 - 5 . 4 0 . 0 2 0 . 8 1 4 . 8
1977 2 . 9 - 3 . 8 - 2 . 5 - 2 . 5 - 4 . 1 - 7 . 1 - 3 . 6 8 . 1 - 0 . 3 1 3 . 5
1978 - 2 . 8 - 3 . 6 - 2 . 4 - 2 . 3 - 3 . 7 - 6 . 1 - 3 . 1 5 . 7 - 0 . 6 - 7 . 6 - 1 . 3
1979 - 1 . 9 - 2 . 5 - 1 . 3 - 1 . 2 - 2 . 2 - 4 . 1 - 1 . 2 6 . 3 1 . 6 - 2 . 4 3 . 6 8 . 8
1980 - 0 . 3 - 0 . 7 0 . 5 0 . 8 0 . 1 - 1 . 3 1 . 7 8 . 6 5 . 2 2 . 9 9 . 0 1 4 . 6
1981 - 1 . 4 - 1 . 9 - 0 . 9 - 0 . 7 - 1 . 5 - 2 . 9 - 0 . 6 4 . 9 1 . 6 0 . 9 2 . 5 3 . 8
1982 - 0 . 9 - 1 . 3 - 0 . 3 - 0 . 1 - 0 . 8 - 2 . 0 0 . 2 5 . 1 2 . 3 0 . 4 3 . 4 4 . 6
1983 - 0 . 2 - 0 . 5 0 . 5 0 . 7 0 . 2 - 0 . 9 1 . 3 5 . 7 3 . 3 1 . 8 4 . 6 5 . 8
1984 - 0 . 5 - 0 . 8 0 . 1 0 . 3 - 0 . 2 - 1 . 2 0 . 7 4 . 6 2 . 4 0 . 9 3 . 2 3 . 9
1985 0 . 5 0 . 2 1 . 2 1 . 4 1 . 0 0 . 2 2 . 1 5 . 8 3 . 9 2 . 8 5 . 0 5 . 9
1986 0 . 9 0 . 7 1 . 6 1 . 9 1 . 5 0 . 8 2 . 6 6 . 1 4 . 4 3 . 4 5 . 4 6 . 3
1987 0 . 8 0 . 5 1 . 4 1 . 6 1 . 3 0 . 6 2 . 2 5 . 4 3 . 8 2 . 8 4 . 6 5 . 3
1980 1981 1982 1983 1984 1985
2 0 . 7
1 . 4
3 . 2
- 1 4 . 8
- 4 . 6 6 . 9
5 . 1 0 . 3 8 . 9
3 . 0 - 1.0 4 . 1
5 . 5 2 . 7 7 . 6
5 . 9 3 . 7 7 . 8
4 . 9 2 . 8 6 . 0
1 0 . 9
2 . 7 - 4 . 9
7 . 8 6 . 3 1 8 . 8
8 . 1 7 . 1 1 3 . 7
5 . 9 4 . 6 8 . 0
1986
8 . 9
3 . 0
1987
Appen
dix

REFERENCES
Banz, Rolf W. “The Relationship Between Returns and Market Value of Common Stocks.” Journal of Financial Economics 9(1981): 3-18.
Chen, Nai-Fu, Richard Roll, and Stephen A. Ross. “Economic Forces and the Stock Market.” Journal of Business 59 (1986): 383-403.
Coleman, Thomas S., Lawrence Fisher, and Roger G. Ibbotson. U.S. Treasury Yield Curves: 1926 through 1987. New York: Moody’s Investors Service, 1988.
Gordon, Myron J. and Eli Shapiro. “Capital Equipment Analysis: The Required Rate of Profit.” Management Science 3 (1956): 102-10.
Ibbotson, Roger G., Jeffrey J. Diermeier, and Laurence B. Siegel. “The Demand for Capital Market Returns: A New Equilibrium Theory.” Financial AnalystsJournal 40 (1984): 22-23.
Ibbotson, Roger G., and Rex A. Sinquefield. Stocks, Bonds, Bills, and Inflation. H istorical Returns (1926-1978). Charlottesville, Virginia: The Financial Analysts Research Foundation, 1979.
Ibbotson, Roger G., and Rex A. Sinquefield. Stocks, Bonds, Bills, and Inflation. The Past and The Future, 1982 ed. Charlottesville, Virginia: The Financial Analysts Research Foundation, 1982.

Ibbotson, Roger G., and Rex A. Sinquefield. Stocks, Bonds, Bills, and Inflation. The Past (1926-1976) and The Future (1977-2000). 1977 ed. Charlottesville, Virginia: TheFinancial Analysts Research Foundation, 1977.
Ibbotson, Roger G., and Rex A. Sinquefield. “Stocks, Bonds, Bills, and Inflation. Simulations of the Future (1976-2000).” Journal of Business 49 (1976): 313-38.
Ibbotson, Roger G., and Rex A. Sinquefield. “Stocks, Bonds, Bills, and Inflation. Year-by-Year Historical Returns (1926-1974).” Journal of Business 49 (1976): 11-47.
Keim, Donald B. “Size-Related Anomalies and Stock Return Seasonality: Further Empirical Evidence.” Journal of Financial Economics 12 (1983): 13-32.
Roll, Richard and Stephen A. Ross. “The Arbitrage Pricing Theory Approach to S trategic Portfolio P lanning.” Financial Analysts Journal 40 (1984): 14-26.
Ross, Stephen A. “The Arbitrage Theory of Capital Asset Pricing,” Journal of Economic Theory 13 (1976): 341-60.
Ross, Stephen A “Return, Risk, and Arbitrage,” in Friend and Bicklser, eds., Risk and Return in Finance. Cambridge, Massachusetts: Ballinger, 1976.
Ross, Stephen A. and Randolph W. Westerfield. “Level- Coupon Bonds.” Corporate Finance. St. Louis: Times Mirror/Mosby, 1988, 97.

Stocks, Bonds, Bills, and Inflation Yearbook, annual. Chicago, Illinois: Ibbotson Associates, Inc., 1984, 1985, 1986,1987,1988,1989.
Van Home, James C. Financial Management and Policy. 8th edition. Englewood Cliffs, New Jersey: Prentice-Hall, Inc., 1989.
Williams, John B. The Theory o f Investm ent Value. Cambridge, Massachusetts: Harvard University Press, 1938.
