stop-ad methods progress report final
TRANSCRIPT
Centre for Studies on Prevention of Alzheimer’s Disease
Progress report on: methods for detection of progress in pre-symptomatic AD. A key challenge for our Centre is the development of methods sensitive to change in the evolution of Alzheimer’s disease (AD) in its pre-symptomatic stages. Here we describe a series of investigations that represent our progress through July 2013 on this topic.
1. Studies with PiB-PET and FDG-PET. Our Centre has not yet begun using Positron Emission Tomography (PET) but, with adequate funding, this is clearly a “next step” for us. The Montreal Neurologic Institute (MNI) PET center, directed by team member Dr. Jean-Paul Soucy, has been producing radioactively labeled (radiolabeled) 11C-Pittsburgh compound B (11C-PiB) as a ligand for (binds to) Alzheimer amyloid in PET images since 2008. PiB binds with high avidity to fibrillar amyloid, but the 11C carbon isotope is extremely short-lived, limiting the use of this compound to centers that can produce (using a cyclotron) and administer it in highly radioactive form over an interval of less than one hour. More recently, in cooperation with their manufacturers, the Centre has been testing other amyloid ligands that use a positron-emitting isotope of Fluorine (18F). The fluoridated ligands have the advantage that the Fluorine isotope has a much longer half-life and can be handled more easily for clinical investigations. The PET Centre has been producing a positron-emitting fluoridated ligand, 18F-fluorodeoxyglucose (18FDG) for more than 20 years. FDG is a chemical analogue of glucose, the brain’s sole source of energy. It is taken up by various brain regions in proportion to their metabolic demand. Unlike glucose, however, FDG cannot be metabolized along the usual pathways, so instead the substance accumulates in quantities proportional to metabolic demand. With the longer half-life of its radio-isotope, 18FDG can be produced and used over a period of several hours. When FDG uptake (glucose uptake) is reduced in whole brain or in a specific region, this is often taken as a sign of decreased metabolism resulting from neurodegeneration.
Drs. Soucy and team member Dr. P. Rosa-Neto (neurology) have abundant experience with PET imaging using these ligands and others. For example, they compared the global and regional cortical amyloid burden as well as glucose uptake in 157 persons with Early Mild Cognitive Impairment (EMCI), 39 with Late MCI (LMCI), and 109 cognitively normal (CN) persons, each grouping as defined by the ADNI_GO consortium (1). They found that amyloid load was higher in EMCI than NC, especially in precuneus, posterior cingulate, medial and dorso-lateral prefrontal cortex (DLPFC). This suggests that detectable changes in amyloid pathology arise somewhere between full normality and EMCI. LMCI subjects showed additional amyloid burden, with involvement of other brain regions including superior temporal, inferior parietal, and DLPFC bilaterally. All of these regions are known “hot-spots” for amyloid accumulation in AD. By contrast, FDG-PET showed no differences between CN and EMCI, but by the time subjects had reached the stage of LMCI there was reduced metabolism in the precuneus, hippocampus, entorhinal and inferior parietal cortices (again, all important in AD pathology). Thus, FDG evidence of neurodegeneration becomes detectable somewhere between the stages of EMCI and LMCI. Together these results suggest that
2
amyloid deposits appear earlier than hypometabolism (neurodegeneration) in the evolution of pre-symptomatic AD. This observation an important reason why we have chosen PiB-PET as primary endpoint for our proposed probucol trial.
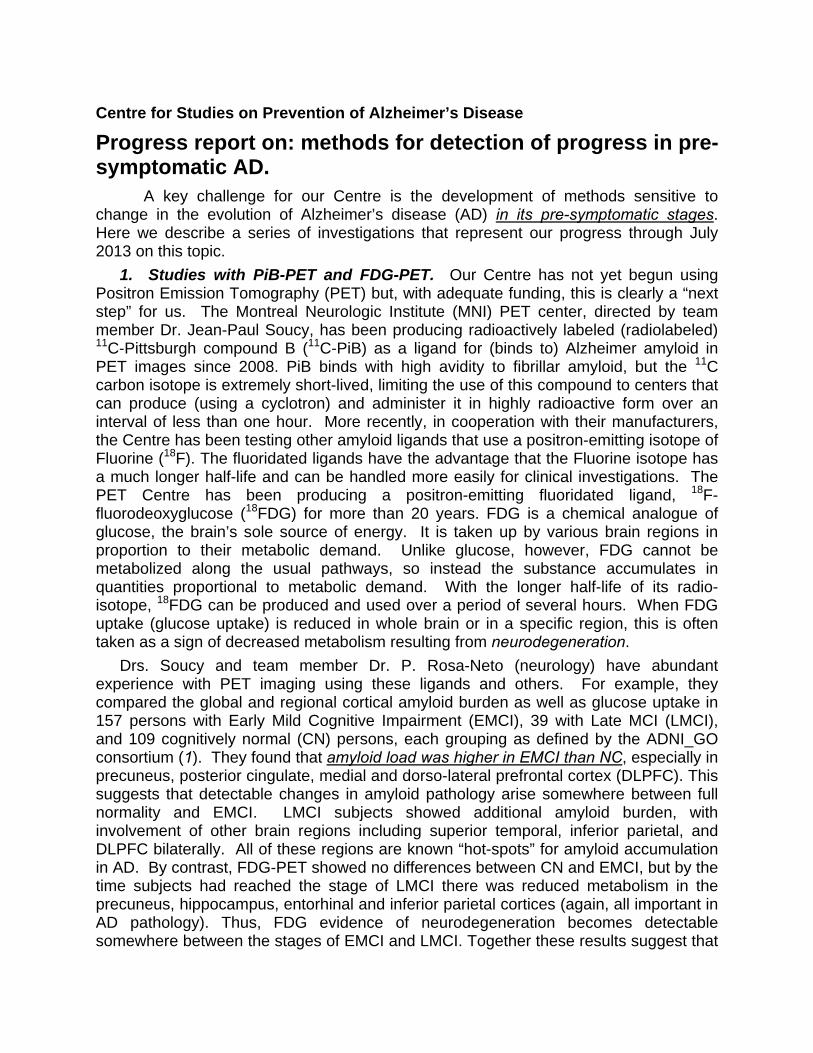
In other important work, Dr. Rosa-Neto’s group has examined amyloid binding and change in 18FDG uptake over three years within subjects who are cognitively normal, contrasting such change in subjects who carry the APOE 4 risk allele vs others.
This last is exactly the sort of thing that we propose to do in our grant application for a randomized placebo-controlled trial of probucol for delay in the evolution of pre-symptomatic AD, only we will look for differences in progression associated with treatment assignment rather than with genotype. Although these participants were not selected on the basis of family history (so their change should be less than what would be seen in our probucol trial subjects), they still show progression. Figure 1, above, shows the rate of decline in the uptake (SUVR) of 18FDG (% per year) estimated in healthy controls with known APOE genotype from a public dataset (ADNI). Panel A shows results in non-carriers of the 4 allele (n=81, age=81.1±s.d. 5.9 yrs). The red coloration suggests there is only a modest decline in FDG uptake over 3 years. B and C show different views for carriers of the 4 allele (n=24; age=80.7±3.6 yrs). The green-to-blue coloration in these images suggests a greater decline in FDG uptake (increased neurodegeneration), especially in precuneus and inferior parietal cortex.
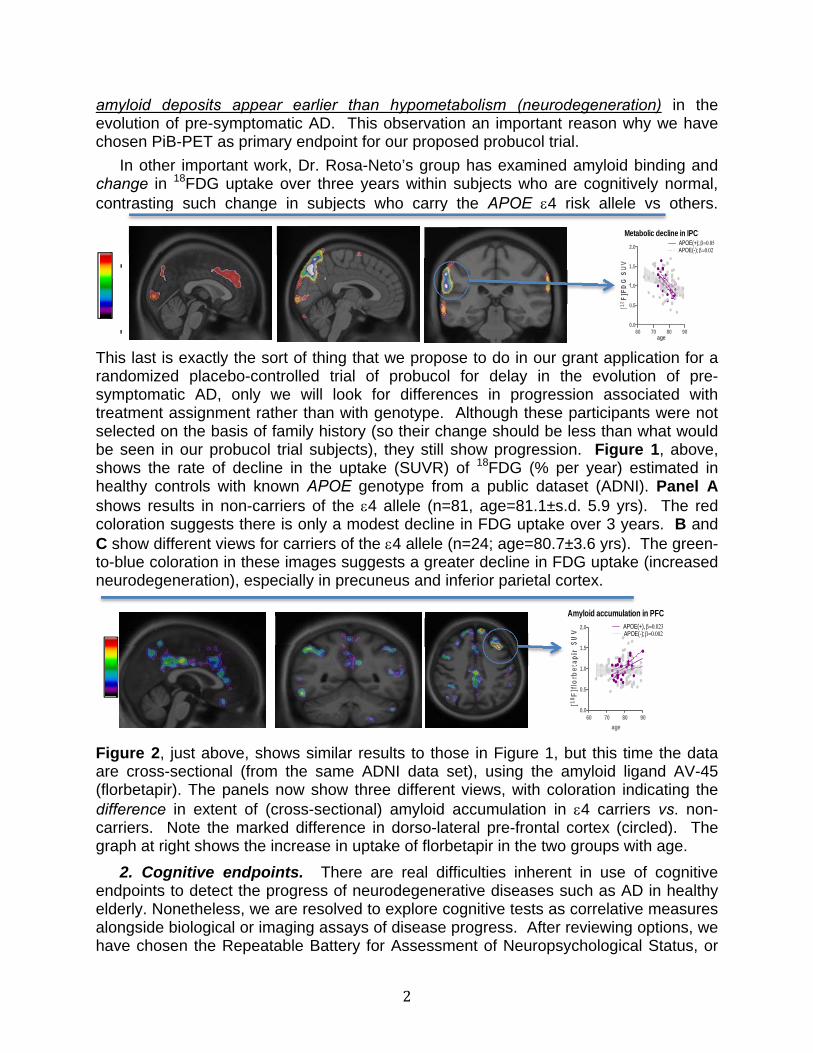
Figure 2, just above, shows similar results to those in Figure 1, but this time the data are cross-sectional (from the same ADNI data set), using the amyloid ligand AV-45 (florbetapir). The panels now show three different views, with coloration indicating the difference in extent of (cross-sectional) amyloid accumulation in 4 carriers vs. non-carriers. Note the marked difference in dorso-lateral pre-frontal cortex (circled). The graph at right shows the increase in uptake of florbetapir in the two groups with age.
2. Cognitive endpoints. There are real difficulties inherent in use of cognitive endpoints to detect the progress of neurodegenerative diseases such as AD in healthy elderly. Nonetheless, we are resolved to explore cognitive tests as correlative measures alongside biological or imaging assays of disease progress. After reviewing options, we have chosen the Repeatable Battery for Assessment of Neuropsychological Status, or
‐
‐
Metabolic decline in IPC
60 70 80 900.0
0.5
1.0
1.5
2.0APOE(+); APOE(-);
age
[18F
]FD
G S
UV
Amyloid accumulation in PFC
60 70 80 900.0
0.5
1.0
1.5
2.0 APOE(+), APOE(-);
age
[18F
]flo
rbet
apir
SU
V
3
RBANS (2) for cognitive assessment in our studies to date. This battery assesses 5 major cognitive domains that are relevant to dementia and cognitive disorders (attention, language, spatial cognition, immediate memory, and delayed memory). Each of these domains, as well as a total index score, uses the same, familiar scale (mean=100, SD=15). Raw scores (without age correction) can also be used in primary data analyses. The RBANS has matched, alternate forms and is available in Canadian French. Moreover, it has been subjected to extensive psychometric study as a battery, most notably by Kevin Duff and associates from Iowa. Thus, there are: age- and education-adjusted normative data on individual subtests, Index Scores, and Total Score for community-residing elders (3); test-retest stability and practice effect norms over one year in community-residing elders (4) regression-based norms for expected change over 3 years, based on initial performance and demographic characteristics (5); and demonstrations of diagnostic accuracy in detection of mild AD (6) and MCI (7).
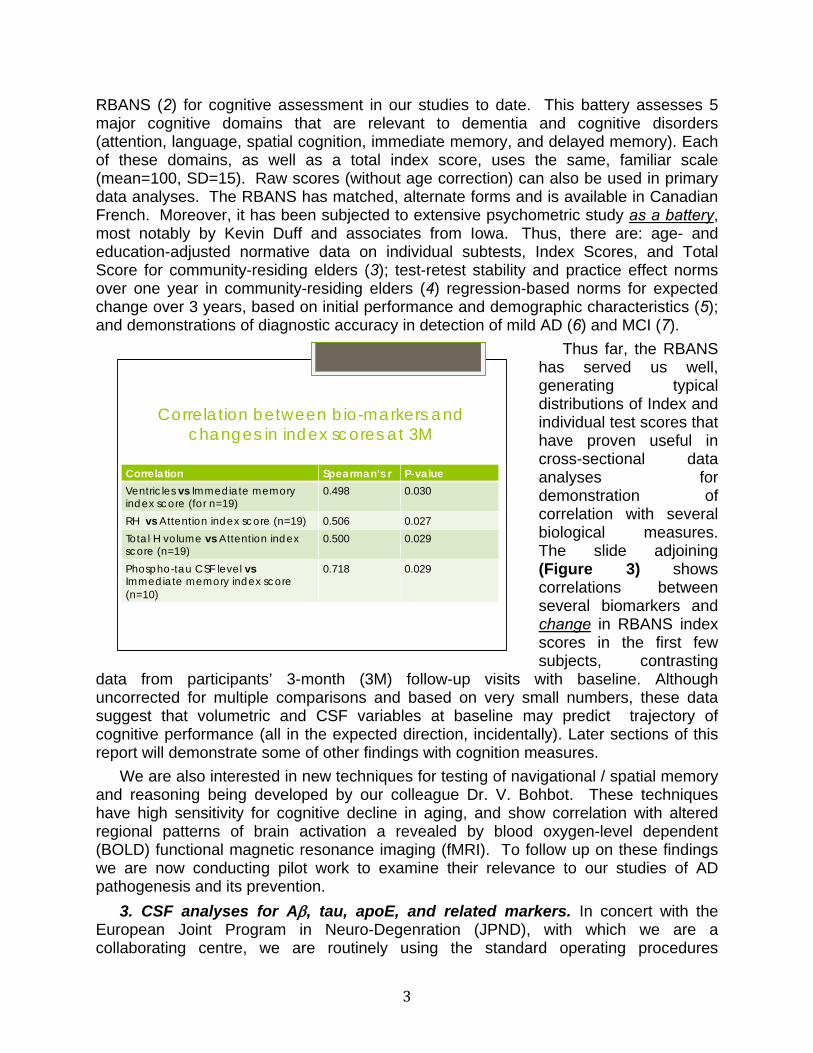
Thus far, the RBANS has served us well, generating typical distributions of Index and individual test scores that have proven useful in cross-sectional data analyses for demonstration of correlation with several biological measures. The slide adjoining (Figure 3) shows correlations between several biomarkers and change in RBANS index scores in the first few subjects, contrasting
data from participants’ 3-month (3M) follow-up visits with baseline. Although uncorrected for multiple comparisons and based on very small numbers, these data suggest that volumetric and CSF variables at baseline may predict trajectory of cognitive performance (all in the expected direction, incidentally). Later sections of this report will demonstrate some of other findings with cognition measures.
We are also interested in new techniques for testing of navigational / spatial memory and reasoning being developed by our colleague Dr. V. Bohbot. These techniques have high sensitivity for cognitive decline in aging, and show correlation with altered regional patterns of brain activation a revealed by blood oxygen-level dependent (BOLD) functional magnetic resonance imaging (fMRI). To follow up on these findings we are now conducting pilot work to examine their relevance to our studies of AD pathogenesis and its prevention.
3. CSF analyses for A, tau, apoE, and related markers. In concert with the European Joint Program in Neuro-Degenration (JPND), with which we are a collaborating centre, we are routinely using the standard operating procedures
Correlation between bio-markers and changes in index scores at 3M
Correlation Spearman’s r P-value
Ventricles vs Immediate memory index score (for n=19)
0.498 0.030
RH vs Attention index score (n=19) 0.506 0.027 Total H volume vs Attention index score (n=19)
0.500 0.029
Phospho-tau CSF level vs Immediate memory index score (n=10)
0.718 0.029
4
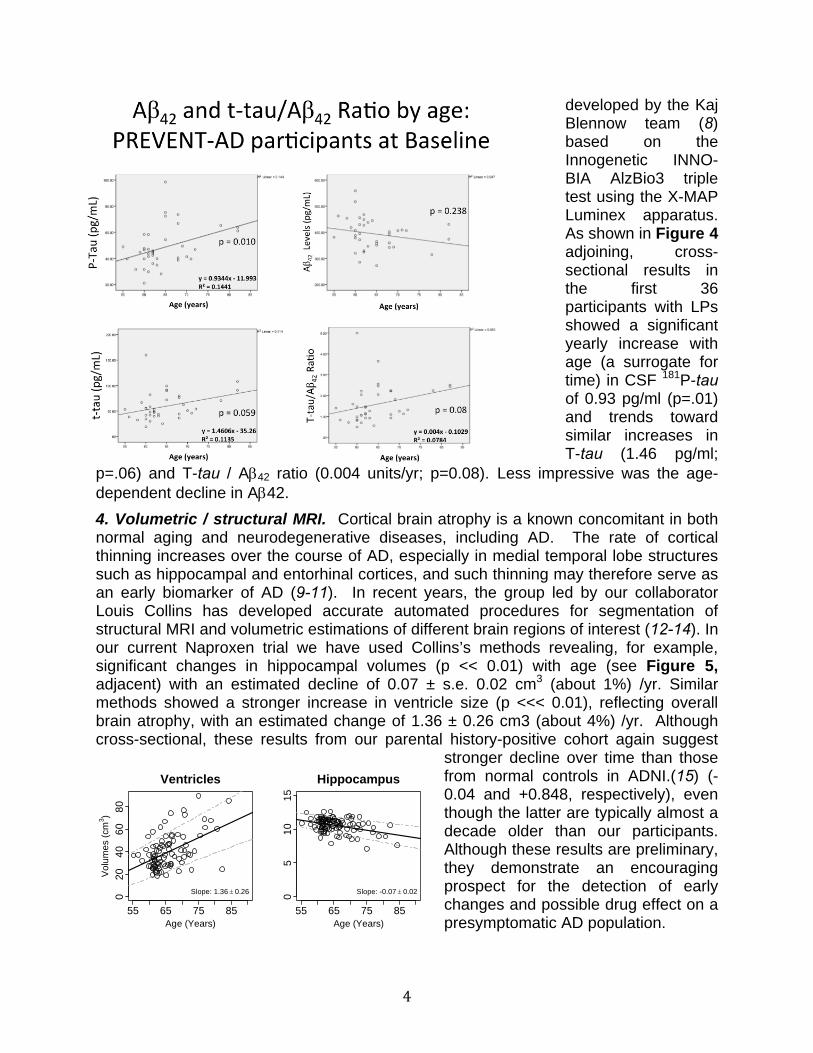
developed by the Kaj Blennow team (8) based on the Innogenetic INNO-BIA AlzBio3 triple test using the X-MAP Luminex apparatus. As shown in Figure 4 adjoining, cross-sectional results in the first 36 participants with LPs showed a significant yearly increase with age (a surrogate for time) in CSF 181P-tau of 0.93 pg/ml (p=.01) and trends toward similar increases in T-tau (1.46 pg/ml;
p=.06) and T-tau / A42 ratio (0.004 units/yr; p=0.08). Less impressive was the age-dependent decline in A42.
4. Volumetric / structural MRI. Cortical brain atrophy is a known concomitant in both normal aging and neurodegenerative diseases, including AD. The rate of cortical thinning increases over the course of AD, especially in medial temporal lobe structures such as hippocampal and entorhinal cortices, and such thinning may therefore serve as an early biomarker of AD (9-11). In recent years, the group led by our collaborator Louis Collins has developed accurate automated procedures for segmentation of structural MRI and volumetric estimations of different brain regions of interest (12-14). In our current Naproxen trial we have used Collins’s methods revealing, for example, significant changes in hippocampal volumes (p << 0.01) with age (see Figure 5, adjacent) with an estimated decline of 0.07 ± s.e. 0.02 cm3 (about 1%) /yr. Similar methods showed a stronger increase in ventricle size (p <<< 0.01), reflecting overall brain atrophy, with an estimated change of 1.36 ± 0.26 cm3 (about 4%) /yr. Although cross-sectional, these results from our parental history-positive cohort again suggest
stronger decline over time than those from normal controls in ADNI.(15) (-0.04 and +0.848, respectively), even though the latter are typically almost a decade older than our participants. Although these results are preliminary, they demonstrate an encouraging prospect for the detection of early changes and possible drug effect on a presymptomatic AD population.
55 65 75 85
020
4060
80
Ventricles
Age (Years)
Vol
ume
s (c
m3 )
Slope: 1.36 0.26
55 65 75 85
05
1015
Hippocampus
Age (Years)
Slope: -0.07 0.02
5
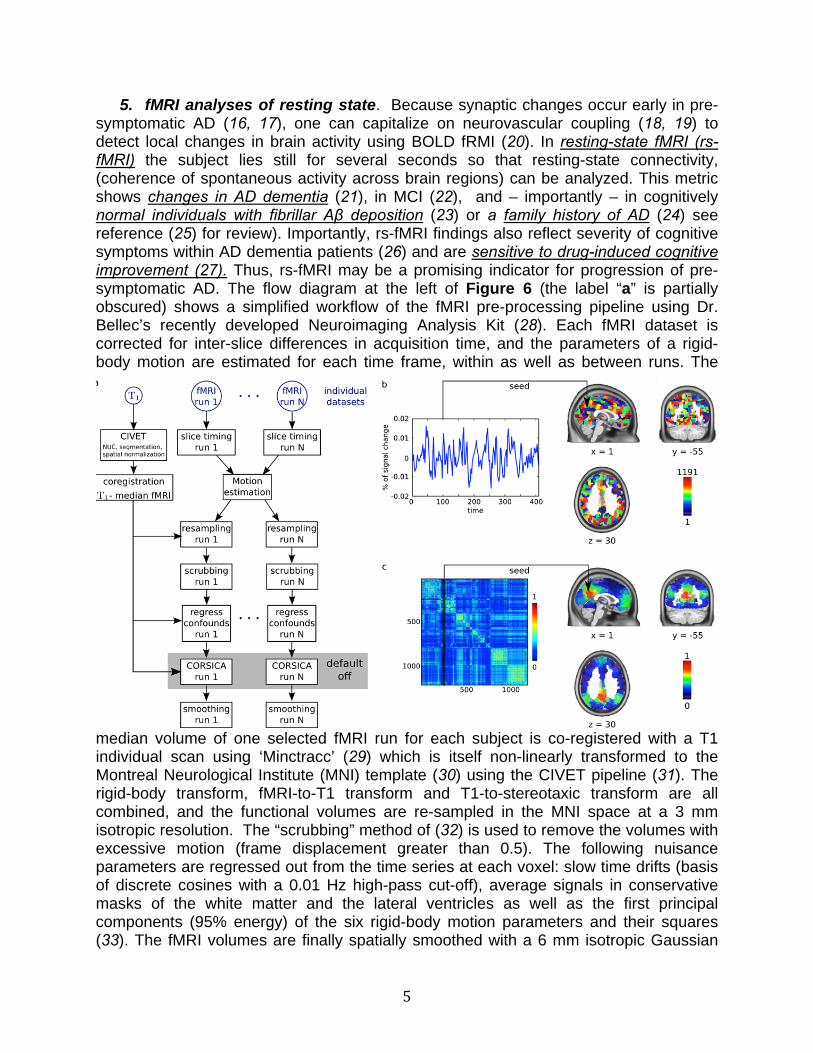
5. fMRI analyses of resting state. Because synaptic changes occur early in pre-symptomatic AD (16, 17), one can capitalize on neurovascular coupling (18, 19) to detect local changes in brain activity using BOLD fRMI (20). In resting-state fMRI (rs-fMRI) the subject lies still for several seconds so that resting-state connectivity, (coherence of spontaneous activity across brain regions) can be analyzed. This metric shows changes in AD dementia (21), in MCI (22), and – importantly – in cognitively normal individuals with fibrillar Aβ deposition (23) or a family history of AD (24) see reference (25) for review). Importantly, rs-fMRI findings also reflect severity of cognitive symptoms within AD dementia patients (26) and are sensitive to drug-induced cognitive improvement (27). Thus, rs-fMRI may be a promising indicator for progression of pre-symptomatic AD. The flow diagram at the left of Figure 6 (the label “a” is partially obscured) shows a simplified workflow of the fMRI pre-processing pipeline using Dr. Bellec’s recently developed Neuroimaging Analysis Kit (28). Each fMRI dataset is corrected for inter-slice differences in acquisition time, and the parameters of a rigid-body motion are estimated for each time frame, within as well as between runs. The
median volume of one selected fMRI run for each subject is co-registered with a T1 individual scan using ‘Minctracc’ (29) which is itself non-linearly transformed to the Montreal Neurological Institute (MNI) template (30) using the CIVET pipeline (31). The rigid-body transform, fMRI-to-T1 transform and T1-to-stereotaxic transform are all combined, and the functional volumes are re-sampled in the MNI space at a 3 mm isotropic resolution. The “scrubbing” method of (32) is used to remove the volumes with excessive motion (frame displacement greater than 0.5). The following nuisance parameters are regressed out from the time series at each voxel: slow time drifts (basis of discrete cosines with a 0.01 Hz high-pass cut-off), average signals in conservative masks of the white matter and the lateral ventricles as well as the first principal components (95% energy) of the six rigid-body motion parameters and their squares (33). The fMRI volumes are finally spatially smoothed with a 6 mm isotropic Gaussian
6
blurring kernel. A more detailed description of the pipeline can be found on the NIAK manual (nitrc.org/projects/niak).
In panel b, the grey matter is parcellated into functional homogeneous resting-state networks using a data-driven clustering algorithm(34, 35), and network-level average time series are extracted. Panel c shows a full brain functional connectivity (correlation) matrix, generated based on network-level time series, here averaged over 43 subjects at baseline. Each column of the matrix is thus a full brain connectivity map, illustrated here with a seed in the precuneus, a key region of the Default-Mode Network (DMN). We combined a literature review with our own test-retest analysis using a public dataset (36) to select 13 target connections, involving mainly regions of the DMN (21). Resting-state connectivity measures were generated using Dr. Bellec’s recent NIAK software (28). The baseline scans of 78 participants in our ongoing trial of naproxen showed significant associations between brain connectivity measures and age as well as RBANS index scores. Intriguingly, these associations also differed significantly in APOE 4 carriers vs. others. Preliminary as they are, these data suggest good prospects for the possible use of rs-fMRI connectivity as a sensitive indicator of relevant changes in the progression of pre-symptomatic AD.
6. Task fMRI. Episodic memory impairment is a consistent and pronounced deficit in AD, including its pre-clinical stages of AD (37, 38). Therefore, we are exploring how brain regions that subserve episodic memory change with progression of AD at baseline, and we wish to know how treatment with probucol affects these changes. In an event-related task fMRI episodic memory paradigm individuals in the scanner are asked to perform memory tasks while undergoing BOLD fMRI. Participants are asked to memorize a series of object stimuli and later to perform item recognition and spatial source retrieval tasks that engage key brain regions of hippocampus, prefrontal cortex and parietal cortex.(39-42) Prior studies have shown task-related activity changes in these regions in patients with AD dementia and MCI,(39, 43-45) and healthy older APOE 4 carriers vs others(46, 47). Moreover, these task-related changes in brain activity are correlated with episodic memory abilities in individuals and are sensitive to memory improvements following memory training (44, 48, 49).
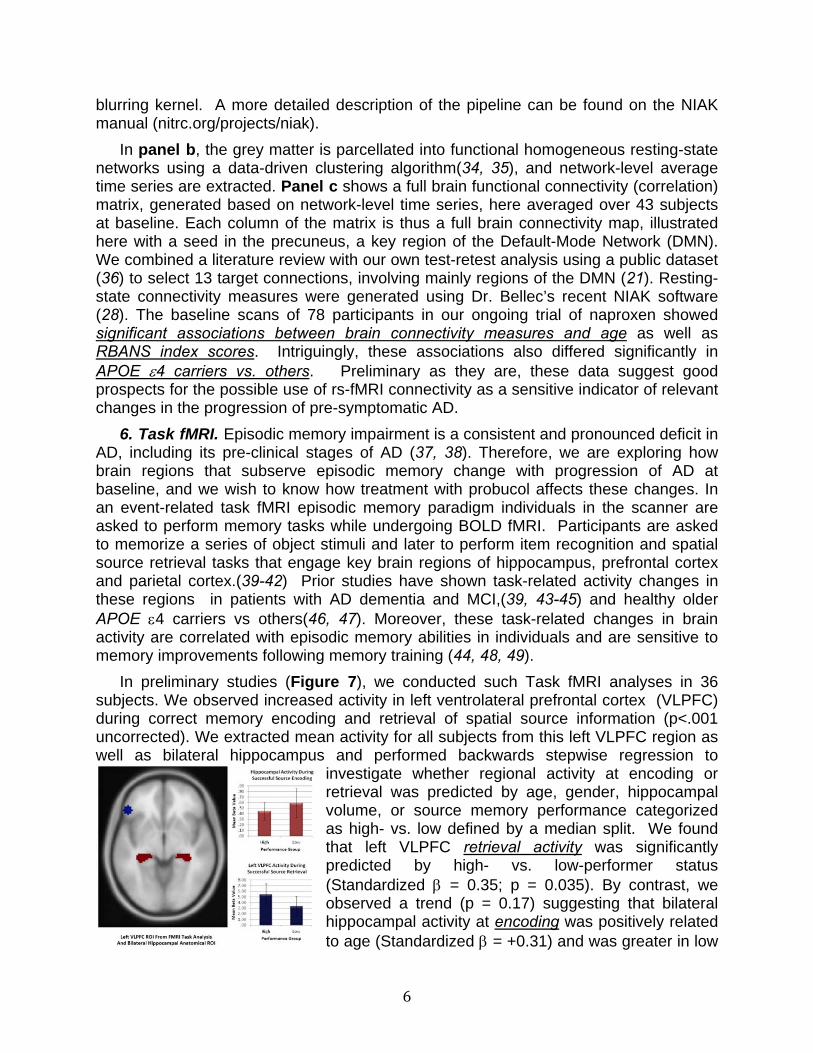
In preliminary studies (Figure 7), we conducted such Task fMRI analyses in 36 subjects. We observed increased activity in left ventrolateral prefrontal cortex (VLPFC) during correct memory encoding and retrieval of spatial source information (p<.001 uncorrected). We extracted mean activity for all subjects from this left VLPFC region as well as bilateral hippocampus and performed backwards stepwise regression to
investigate whether regional activity at encoding or retrieval was predicted by age, gender, hippocampal volume, or source memory performance categorized as high- vs. low defined by a median split. We found that left VLPFC retrieval activity was significantly predicted by high- vs. low-performer status (Standardized = 0.35; p = 0.035). By contrast, we observed a trend (p = 0.17) suggesting that bilateral hippocampal activity at encoding was positively related to age (Standardized = +0.31) and was greater in low
7
vs. high-performers (Standardized = - 0.07; see figure). These results are preliminary, but appear to highlight the potential for task-based fMRI to track memory-related activity in the hippocampus and PFC in vivo.
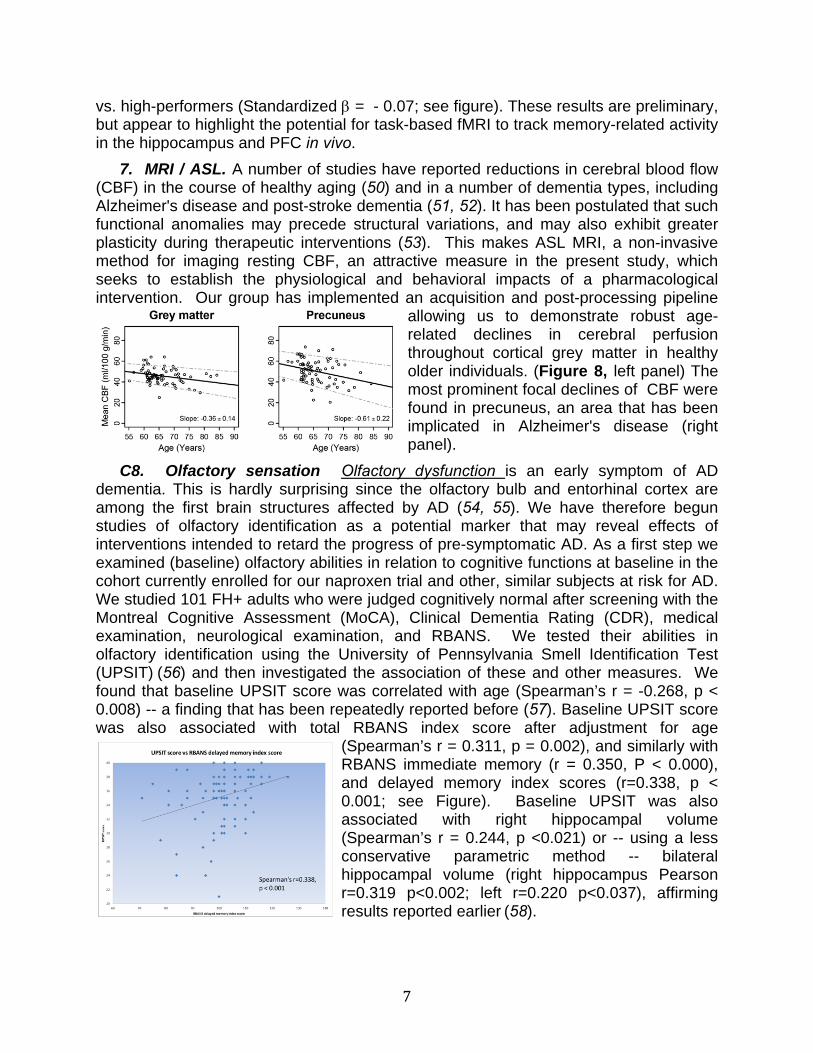
7. MRI / ASL. A number of studies have reported reductions in cerebral blood flow (CBF) in the course of healthy aging (50) and in a number of dementia types, including Alzheimer's disease and post-stroke dementia (51, 52). It has been postulated that such functional anomalies may precede structural variations, and may also exhibit greater plasticity during therapeutic interventions (53). This makes ASL MRI, a non-invasive method for imaging resting CBF, an attractive measure in the present study, which seeks to establish the physiological and behavioral impacts of a pharmacological intervention. Our group has implemented an acquisition and post-processing pipeline
allowing us to demonstrate robust age-related declines in cerebral perfusion throughout cortical grey matter in healthy older individuals. (Figure 8, left panel) The most prominent focal declines of CBF were found in precuneus, an area that has been implicated in Alzheimer's disease (right panel).
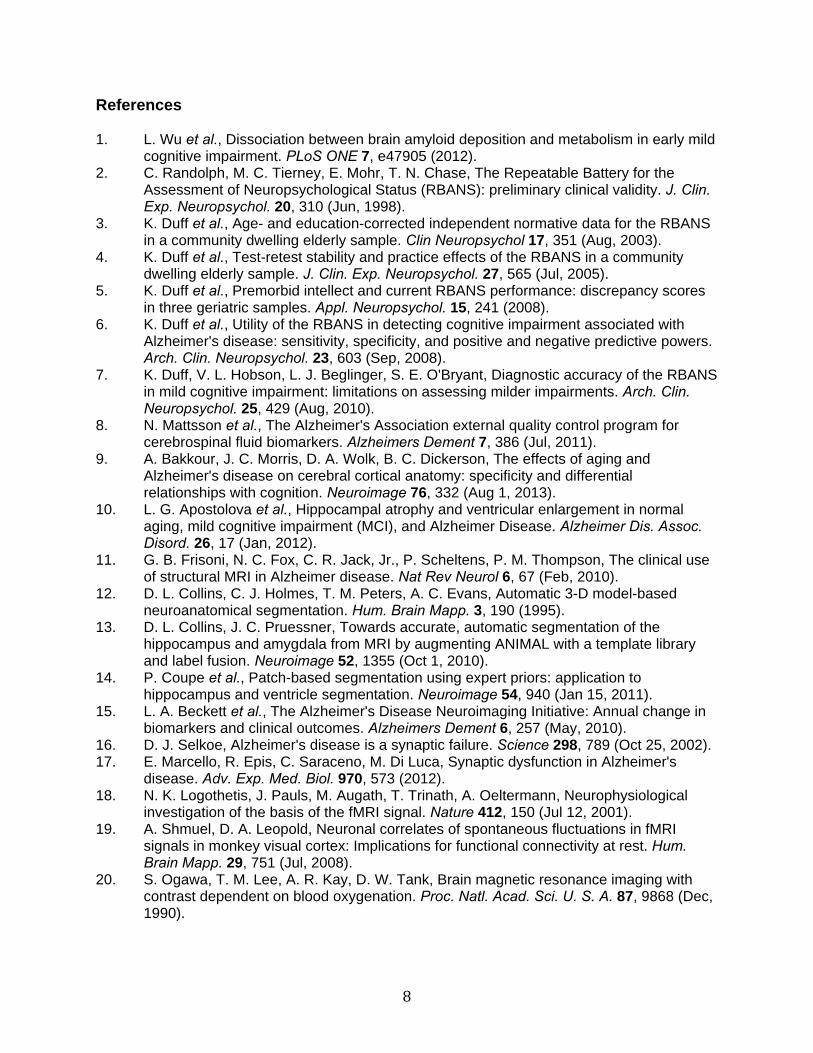
C8. Olfactory sensation Olfactory dysfunction is an early symptom of AD dementia. This is hardly surprising since the olfactory bulb and entorhinal cortex are among the first brain structures affected by AD (54, 55). We have therefore begun studies of olfactory identification as a potential marker that may reveal effects of interventions intended to retard the progress of pre-symptomatic AD. As a first step we examined (baseline) olfactory abilities in relation to cognitive functions at baseline in the cohort currently enrolled for our naproxen trial and other, similar subjects at risk for AD. We studied 101 FH+ adults who were judged cognitively normal after screening with the Montreal Cognitive Assessment (MoCA), Clinical Dementia Rating (CDR), medical examination, neurological examination, and RBANS. We tested their abilities in olfactory identification using the University of Pennsylvania Smell Identification Test (UPSIT) (56) and then investigated the association of these and other measures. We found that baseline UPSIT score was correlated with age (Spearman’s r = -0.268, p < 0.008) -- a finding that has been repeatedly reported before (57). Baseline UPSIT score was also associated with total RBANS index score after adjustment for age
(Spearman’s r = 0.311, p = 0.002), and similarly with RBANS immediate memory (r = 0.350, P < 0.000), and delayed memory index scores (r=0.338, p < 0.001; see Figure). Baseline UPSIT was also associated with right hippocampal volume (Spearman’s r = 0.244, p <0.021) or -- using a less conservative parametric method -- bilateral hippocampal volume (right hippocampus Pearson r=0.319 p<0.002; left r=0.220 p<0.037), affirming results reported earlier (58).
8
References 1. L. Wu et al., Dissociation between brain amyloid deposition and metabolism in early mild
cognitive impairment. PLoS ONE 7, e47905 (2012). 2. C. Randolph, M. C. Tierney, E. Mohr, T. N. Chase, The Repeatable Battery for the
Assessment of Neuropsychological Status (RBANS): preliminary clinical validity. J. Clin. Exp. Neuropsychol. 20, 310 (Jun, 1998).
3. K. Duff et al., Age- and education-corrected independent normative data for the RBANS in a community dwelling elderly sample. Clin Neuropsychol 17, 351 (Aug, 2003).
4. K. Duff et al., Test-retest stability and practice effects of the RBANS in a community dwelling elderly sample. J. Clin. Exp. Neuropsychol. 27, 565 (Jul, 2005).
5. K. Duff et al., Premorbid intellect and current RBANS performance: discrepancy scores in three geriatric samples. Appl. Neuropsychol. 15, 241 (2008).
6. K. Duff et al., Utility of the RBANS in detecting cognitive impairment associated with Alzheimer's disease: sensitivity, specificity, and positive and negative predictive powers. Arch. Clin. Neuropsychol. 23, 603 (Sep, 2008).
7. K. Duff, V. L. Hobson, L. J. Beglinger, S. E. O'Bryant, Diagnostic accuracy of the RBANS in mild cognitive impairment: limitations on assessing milder impairments. Arch. Clin. Neuropsychol. 25, 429 (Aug, 2010).
8. N. Mattsson et al., The Alzheimer's Association external quality control program for cerebrospinal fluid biomarkers. Alzheimers Dement 7, 386 (Jul, 2011).
9. A. Bakkour, J. C. Morris, D. A. Wolk, B. C. Dickerson, The effects of aging and Alzheimer's disease on cerebral cortical anatomy: specificity and differential relationships with cognition. Neuroimage 76, 332 (Aug 1, 2013).
10. L. G. Apostolova et al., Hippocampal atrophy and ventricular enlargement in normal aging, mild cognitive impairment (MCI), and Alzheimer Disease. Alzheimer Dis. Assoc. Disord. 26, 17 (Jan, 2012).
11. G. B. Frisoni, N. C. Fox, C. R. Jack, Jr., P. Scheltens, P. M. Thompson, The clinical use of structural MRI in Alzheimer disease. Nat Rev Neurol 6, 67 (Feb, 2010).
12. D. L. Collins, C. J. Holmes, T. M. Peters, A. C. Evans, Automatic 3-D model-based neuroanatomical segmentation. Hum. Brain Mapp. 3, 190 (1995).
13. D. L. Collins, J. C. Pruessner, Towards accurate, automatic segmentation of the hippocampus and amygdala from MRI by augmenting ANIMAL with a template library and label fusion. Neuroimage 52, 1355 (Oct 1, 2010).
14. P. Coupe et al., Patch-based segmentation using expert priors: application to hippocampus and ventricle segmentation. Neuroimage 54, 940 (Jan 15, 2011).
15. L. A. Beckett et al., The Alzheimer's Disease Neuroimaging Initiative: Annual change in biomarkers and clinical outcomes. Alzheimers Dement 6, 257 (May, 2010).
16. D. J. Selkoe, Alzheimer's disease is a synaptic failure. Science 298, 789 (Oct 25, 2002). 17. E. Marcello, R. Epis, C. Saraceno, M. Di Luca, Synaptic dysfunction in Alzheimer's
disease. Adv. Exp. Med. Biol. 970, 573 (2012). 18. N. K. Logothetis, J. Pauls, M. Augath, T. Trinath, A. Oeltermann, Neurophysiological
investigation of the basis of the fMRI signal. Nature 412, 150 (Jul 12, 2001). 19. A. Shmuel, D. A. Leopold, Neuronal correlates of spontaneous fluctuations in fMRI
signals in monkey visual cortex: Implications for functional connectivity at rest. Hum. Brain Mapp. 29, 751 (Jul, 2008).
20. S. Ogawa, T. M. Lee, A. R. Kay, D. W. Tank, Brain magnetic resonance imaging with contrast dependent on blood oxygenation. Proc. Natl. Acad. Sci. U. S. A. 87, 9868 (Dec, 1990).
9
21. M. D. Greicius, G. Srivastava, A. L. Reiss, V. Menon, Default-mode network activity distinguishes Alzheimer's disease from healthy aging: evidence from functional MRI. Proc. Natl. Acad. Sci. U. S. A. 101, 4637 (Mar 30, 2004).
22. W. Koch et al., Diagnostic power of default mode network resting state fMRI in the detection of Alzheimer's disease. Neurobiol. Aging 33, 466 (Mar, 2012).
23. Y. I. Sheline et al., Amyloid plaques disrupt resting state default mode network connectivity in cognitively normal elderly. Biol. Psychiatry 67, 584 (Mar 15, 2010).
24. L. Wang et al., Alzheimer disease family history impacts resting state functional connectivity. Ann. Neurol. 72, 571 (Oct, 2012).
25. Y. I. Sheline, M. E. Raichle, Resting State Functional Connectivity in Preclinical Alzheimer's Disease. Biol. Psychiatry, (Jan 3, 2013).
26. J. S. Damoiseaux, K. E. Prater, B. L. Miller, M. D. Greicius, Functional connectivity tracks clinical deterioration in Alzheimer's disease. Neurobiol. Aging 33, 828 e19 (Apr, 2012).
27. J. S. Goveas et al., Recovery of hippocampal network connectivity correlates with cognitive improvement in mild Alzheimer's disease patients treated with donepezil assessed by resting-state fMRI. J. Magn. Reson. Imaging 34, 764 (Oct, 2011).
28. P. Bellec et al., in Proceedings of the 17th International Conference on Functional Mapping of the Human Brain. (2011).
29. D. L. Collins, P. Neelin, T. M. Peters, A. C. Evans, Automatic 3D intersubject registration of MR volumetric data in standardized Talairach space. J. Comput. Assist. Tomogr. 18, 192 (Mar-Apr, 1994).
30. V. Fonov et al., Unbiased average age-appropriate atlases for pediatric studies. Neuroimage 54, 313 (Jan 1, 2011).
31. A. P. Zijdenbos, R. Forghani, A. C. Evans, Automatic "pipeline" analysis of 3-D MRI data for clinical trials: application to multiple sclerosis. IEEE Trans. Med. Imaging 21, 1280 (Oct, 2002).
32. J. D. Power, K. A. Barnes, A. Z. Snyder, B. L. Schlaggar, S. E. Petersen, Spurious but systematic correlations in functional connectivity MRI networks arise from subject motion. Neuroimage 59, 2142 (Feb 1, 2012).
33. F. Giove, T. Gili, V. Iacovella, E. Macaluso, B. Maraviglia, Images-based suppression of unwanted global signals in resting-state functional connectivity studies. Magn. Reson. Imaging 27, 1058 (Oct, 2009).
34. P. Bellec et al., Identification of large-scale networks in the brain using fMRI. Neuroimage 29, 1231 (Feb 15, 2006).
35. P. Bellec, P. Rosa-Neto, O. C. Lyttelton, H. Benali, A. C. Evans, Multi-level bootstrap analysis of stable clusters in resting-state fMRI. Neuroimage 51, 1126 (Jul 1, 2010).
36. Z. Shehzad et al., The resting brain: unconstrained yet reliable. Cereb. Cortex 19, 2209 (Oct, 2009).
37. J. Hodges, The amnestic prodrome of Alzheimer's disease. Brain 121 ( Pt 9), 1601 (Sep, 1998).
38. R. Perri, L. Serra, G. A. Carlesimo, C. Caltagirone, Amnestic mild cognitive impairment: difference of memory profile in subjects who converted or did not convert to Alzheimer's disease. Neuropsychology 21, 549 (Sep, 2007).
39. R. A. Sperling et al., Functional alterations in memory networks in early Alzheimer's disease. Neuromolecular Med. 12, 27 (Mar, 2010).
40. R. Cabeza, E. Ciaramelli, I. R. Olson, M. Moscovitch, The parietal cortex and episodic memory: an attentional account. Nat. Rev. Neurosci. 9, 613 (Aug, 2008).
41. M. N. Rajah, M. D'Esposito, Region-specific changes in prefrontal function with age: a review of PET and fMRI studies on working and episodic memory. Brain 128, 1964 (Sep, 2005).
10
42. L. Nyberg et al., Longitudinal evidence for diminished frontal cortex function in aging. Proc. Natl. Acad. Sci. U. S. A. 107, 22682 (Dec 28, 2010).
43. R. Sperling, Functional MRI studies of associative encoding in normal aging, mild cognitive impairment, and Alzheimer's disease. Ann. N. Y. Acad. Sci. 1097, 146 (Feb, 2007).
44. F. Clement, S. Belleville, S. Mellah, Functional neuroanatomy of the encoding and retrieval processes of verbal episodic memory in MCI. Cortex 46, 1005 (Sep 10, 2010).
45. M. A. Trivedi et al., fMRI activation changes during successful episodic memory encoding and recognition in amnestic mild cognitive impairment relative to cognitively healthy older adults. Dement. Geriatr. Cogn. Disord. 26, 123 (2008).
46. M. M. Adamson, J. B. Hutchinson, A. L. Shelton, A. D. Wagner, J. L. Taylor, Reduced hippocampal activity during encoding in cognitively normal adults carrying the APOE varepsilon4 allele. Neuropsychologia 49, 2448 (Jul, 2011).
47. G. Xu et al., The influence of parental history of Alzheimer's disease and apolipoprotein E epsilon4 on the BOLD signal during recognition memory. Brain 132, 383 (Feb, 2009).
48. B. M. Hampstead et al., Activation and effective connectivity changes following explicit-memory training for face-name pairs in patients with mild cognitive impairment: a pilot study. Neurorehabil. Neural Repair 25, 210 (Mar-Apr, 2011).
49. D. Maillet, M. N. Rajah, Age-related changes in the three-way correlation between anterior hippocampus volume, whole-brain patterns of encoding activity and subsequent context retrieval. Brain Res. 1420, 68 (Oct 28, 2011).
50. J. J. Chen, H. D. Rosas, D. H. Salat, Age-associated reductions in cerebral blood flow are independent from regional atrophy. Neuroimage 55, 468 (Mar 15, 2011).
51. M. J. Firbank et al., Cerebral blood flow by arterial spin labeling in poststroke dementia. Neurology 76, 1478 (Apr 26, 2011).
52. C. Luckhaus et al., The relation of regional cerebral perfusion and atrophy in mild cognitive impairment (MCI) and early Alzheimer's dementia. Psychiatry Res. 183, 44 (Jul 30, 2010).
53. J. C. de la Torre, Is Alzheimer's disease preceded by neurodegeneration or cerebral hypoperfusion? Ann. Neurol. 57, 783 (Jun, 2005).
54. H. Braak, E. Braak, Neuropathological stageing of Alzheimer-related changes. Acta Neuropathol 82, 239 (1991).
55. T. Kovacs, Mechanisms of olfactory dysfunction in aging and neurodegenerative disorders. Ageing Res. Rev. 3, 215 (Apr, 2004).
56. R. L. Doty, P. Shaman, M. Dann, Development of the University of Pennsylvania Smell Identification Test: a standardized microencapsulated test of olfactory function. Physiol. Behav. 32, 489 (Mar, 1984).
57. R. L. Doty, Influence of age and age-related diseases on olfactory function. Ann. N. Y. Acad. Sci. 561, 76 (1989).
58. D. P. Devanand et al., Combining early markers strongly predicts conversion from mild cognitive impairment to Alzheimer's disease. Biol. Psychiatry 64, 871 (Nov 15, 2008).