storage megatrends impacting your datacenter · storage megatrends impacting your datacenter tien...
TRANSCRIPT


© Copyright 2017 Dell Inc.2
For Enterprise SSDs...
Who do you think of?

© Copyright 2017 Dell Inc.3
Samsung is the #1 SSD Supplier
41%16%
12%7%
5%4%3%
12%
SamsungIntel
Lite-onMicron
Total SSD
51%10%
8%7%7%
6%11%
SamsungLite-on
KingstonOther
Client SSD31%
23%21%
7%19%
Samsung
Intel
Other
Enterprise SSD
Source: IDC, cQ2 2016. Based on revenue.

© Copyright 2017 Dell Inc.4
SSD Leadership in Technology
1st PCIe PC SSD20132014 1st NVMe Enterprise SSD2015 1st NVMe M.2 SSD
1st V-NAND 20132014 1st TLC V-NAND
Over 30 million PCIe SSDs shipped
Performance
NAND Technology
World’s Largest PCIe SSD shipment
First mover in V-NAND technology
Largest Supplier
World’s Top Memory SupplierWorld’s #1 SSD Supplier
1st MLC SSD20082012 1st TLC SSD2014 1st TLC V-NAND SSD
Cost Optimization
World’s 1st Multi-bit SSDs
2015 1st 48-stack 256Gb V-NANDThe world’s 1st & biggest, 2.5” 32TB SSD
World’s #1 NAND Producer
World’s #1 DRAM Supplier
© Copyright 2017 Dell Inc.5
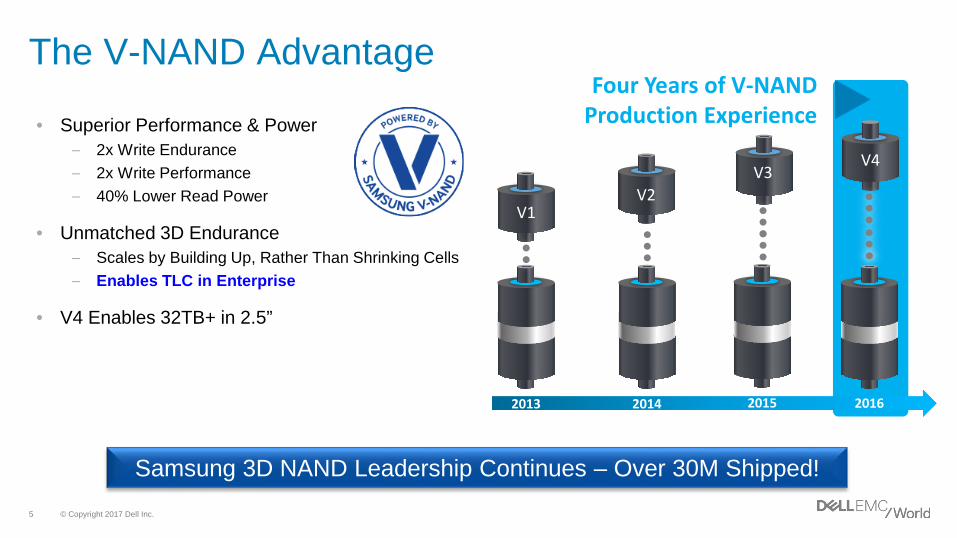
The V-NAND Advantage
• Superior Performance & Power– 2x Write Endurance– 2x Write Performance– 40% Lower Read Power
• Unmatched 3D Endurance– Scales by Building Up, Rather Than Shrinking Cells– Enables TLC in Enterprise
• V4 Enables 32TB+ in 2.5”
2013
V1
2016
V4
Four Years of V-NAND Production Experience
2014
V2
2015
V3
Samsung 3D NAND Leadership Continues – Over 30M Shipped!

© Copyright 2017 Dell Inc.6
3D NAND Enables TLC to go Mainstream
0%
20%
40%
60%
80%
100%
2014 2015 2016 2017
Samsung
MLC TLC 3D MLC 3D TLC
3D TLC3D TLC
0%
20%
40%
60%
80%
100%
2014 2015 2016 2017
Everyone Else
MLC TLC 3D MLC 3D TLC
Source: Forward Insights

© Copyright 2017 Dell Inc.7
Leading the World’s Highest Density SSDs
1TB BGA
4TB M.2
32TB NVMe SSD
32TB 2.5” SAS SSD
(11.5x13)

© Copyright 2017 Dell Inc.8
MegaTrend #1: Shift to High Capacity Drives
2016 2017 2018 2019 2020
512GB
1TB
2TB
4TB
8TB 16TB
2016
< 4TB
4TB+
16%
Source: Samsung, Forward Insights
Industry UnitsSamsung Units

© Copyright 2017 Dell Inc.9
Capacity: Inflection Point Reached
Source: IDC
TLC V-NAND, Low Endurance fueling SSD Capacity Growth
© Copyright 2017 Dell Inc.10
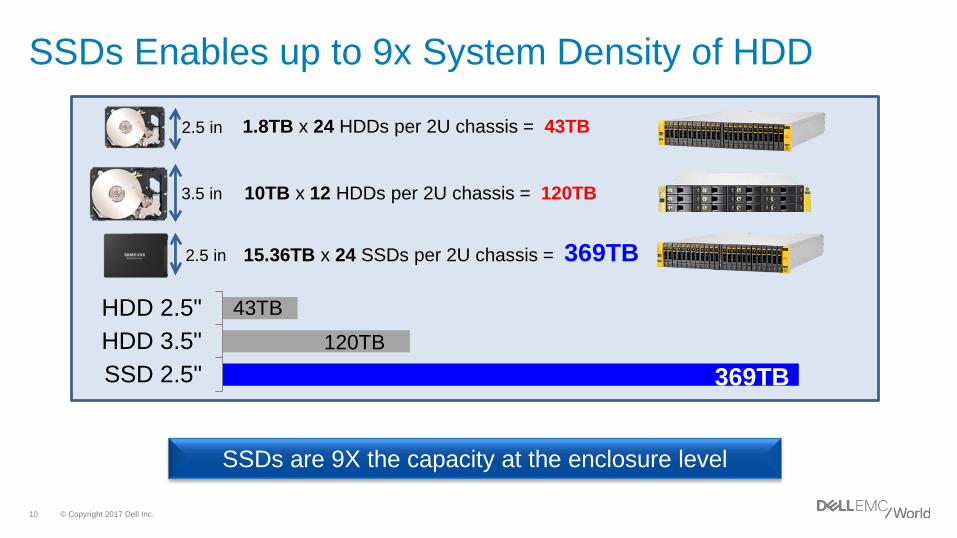
SSDs Enables up to 9x System Density of HDD
2.5 in 1.8TB x 24 HDDs per 2U chassis = 43TB
SSD 2.5"HDD 3.5"HDD 2.5"
369TB
43TB120TB
2.5 in 15.36TB x 24 SSDs per 2U chassis = 369TB
3.5 in 10TB x 12 HDDs per 2U chassis = 120TB
SSDs are 9X the capacity at the enclosure level

© Copyright 2017 Dell Inc.11
Why? Cost savings in Power & Space
2.5 in 1.8TB x 205 HDDs in 9 x 2U24 chassis
2.5 in 15.36TB x 24 SSDs in 1 x 2U24 chassis
3.5 in 10TB x 36 HDDs in 3 x 2U12 chassis
369TB of Storage
X 9
X 3
X 1
High Density SSDs provide up to 9:1 space and 7:1 power savings
(7x)
(1.4x)
1,600W
302W
216W
Number of Enclosures Power
Drive (W): 1.8T HDD 7.8W, 10T HDD 8.4W, 15.36T SSD 9W

© Copyright 2017 Dell Inc.12
MegaTrend #2: Shift to Low Endurance Drives
0%
20%
40%
60%
80%
100%
1Q14 2Q14 3Q14 4Q14 1Q15 2Q15 3Q15 4Q15
SSD Shipments by Endurance
≤ 3 DWPDRI
MU
WI
1
2
4
8
16
32
480 960 1,920 3,840 7,680 15,360
DW
PD
Capacity (GB)
Constant Bytes Written
Source: Samsung
VOC: “We can make low endurance work in our systems”

© Copyright 2017 Dell Inc.13
Telemetry Data Collected by Customers
Network
Storage
< 0.1 DWPD for enterprise applications
Compute
Telemetry data

© Copyright 2017 Dell Inc.14
Why? SSD DWPD Impacts Cost
High Low WPD decision can save you 58%
Example Costs
Raw $/GB $0.40 Raw GB 4,096
Cost $1,638
$1.02
$0.64 $0.51
$0.43
1,600 2,560 3,200 3,840$/
Usa
ble
GB
Usable GBDWPD 25 10 3 1
58% savings

© Copyright 2017 Dell Inc.15
MegaTrend #3: SSD Displacement of 15K/10K HDD
2015 2016 2017 2018
Storage Attached (units)
15K/10K HDD
SSD
Source: IDC, Forward Insights Source: IDC, Forward Insights, Samsung
Perf HDD
SSD
Performance HDD market is being wiped out
2015 2016 2017 2018
Storage Attached (GB)
15K/10K HDDSSD

© Copyright 2017 Dell Inc.16
Use of Data Reduction TechnologiesApplications Type Data Reduction Ratio
Virtual Desktop Infrastructure (VDI) Deduplication 7 to 12:1
Virtual Server Infrastructure (VSI) Deduplication 5 to 8:1
Email Deduplication 4 to 6:1
Analytics Compression 3 to 4:1
Online Transactional Processing (OLTP) Compression 3 to 4:1
Data Warehousing Compression 2 to 4:1
Media Compression 1.2 to 1.5:1
Unity All Flash
SC Series All Flash
XtremIOAll Flash
VMAXAll Flash
https://www.emc.com/en-us/microsites/guarantee-programs/all-flash-storage-efficiency.htm
Source: Gartner Q4/16 (based on survey of over 20 industry participants and end users)

© Copyright 2017 Dell Inc.17
Why? Data Reduction Lowers Effective Cost of Flash
$1.02
$0.43
$0.11 $0.20 $0.15
1,600 3,840 15,360 600 1800
- 58%
$/G
B (u
sabl
e)
25 DWPD 1 DWPD
Lowering DWPD reduces cost
© Copyright 2017 Dell Inc.18
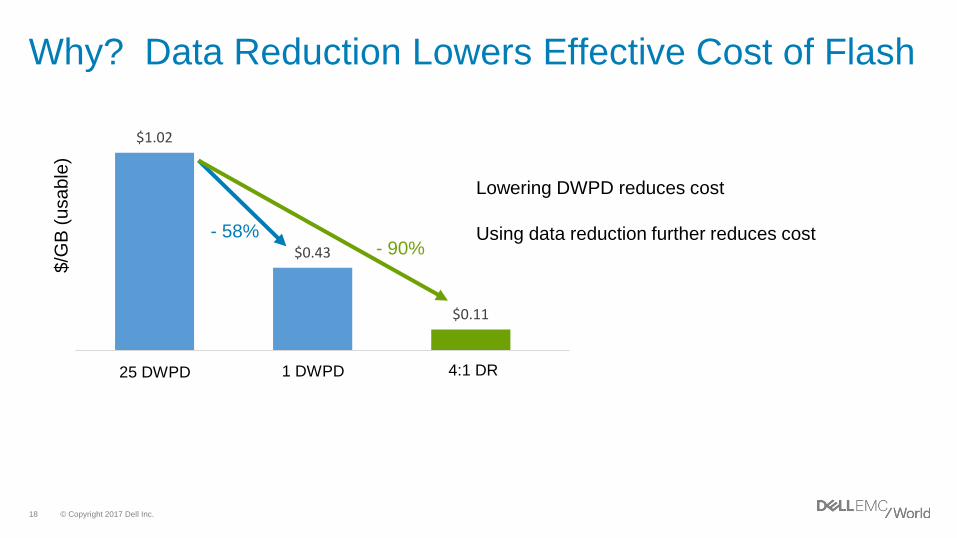
Why? Data Reduction Lowers Effective Cost of Flash
$1.02
$0.43
$0.11 $0.20 $0.15
1,600 3,840 15,360 600 1800
- 58% - 90%
$/G
B (u
sabl
e)
25 DWPD 1 DWPD 4:1 DR
Using data reduction further reduces cost
Lowering DWPD reduces cost

© Copyright 2017 Dell Inc.19
Why? Data Reduction Lowers Effective Cost of Flash
$1.02
$0.43
$0.11 $0.20 $0.15
1,600 3,840 15,360 600 1800
- 58% - 90%
Why??
$/G
B (u
sabl
e)
25 DWPD 1 DWPD 4:1 DR 15K HDD 10K HDD
Why buy 15K/10K HDDs any more?

© Copyright 2017 Dell Inc.20
MegaTrend #4: Transition to NVMe
Server attached moving rapidly to NVMeStorage attached transitioning w/ dual port NVMe
Source: Forward Insights (Q1/17)
0
10
20
30
40
50
60
70
80
90
2017 2018 2019 2020 2021
Server Attached SSDB GB
NVMe
SATASAS 0
10
20
30
40
50
60
70
80
90
2017 2018 2019 2020 2021
Storage Attached SSDB GB
SAS
NVMeDual Port

© Copyright 2017 Dell Inc.21
Why? SATA Performance Limits Capacity
100 IOPS/GB Requirement Limits SATA Capacity to 960GB

© Copyright 2017 Dell Inc.22
NVMe Performance Extends Capacity
NVMe Enables Larger Drives that meet IOPS/GB Requirement

© Copyright 2017 Dell Inc.23
Samsung @ Heart of Your Data Center
Hyper-Converged All Flash ArraysConverged

© Copyright 2017 Dell Inc.24
Summary and TakeAways
• Samsung is the largest NAND and SSD supplier in the industry– Key Dell Technologies storage partner
• Samsung technologies are key enablers to storage mega-trends– Shift to high capacity drives– Shift to low endurance drives– SSD displacement of 15K/10K HDDs– Transition to NVMe
• Have you REALIZED whether your current data center solution gives your business the storage advantage it needs in today's market?
Come visit our booth near the entrance #1305 to see how Samsung & Dell Technologies can invigorate the heart of your data center
Samsung @ the Heart of your Data
Center

Storage MegaTrends Impacting Your DataCenter
Puneet DhawanDell EMC PowerEdge Product Management

© Copyright 2017 Dell Inc.26
Towers ModularRacks Extreme Scale Infrastructure
INDUSTRY'S #1
Server PortfolioPowerEdge
THE BEDROCK OF THE MODERN DATA CENTER
*Based on units sold (tie). IDC Worldwide Quarterly Server Tracker, Q1-Q3, 2016.
26
OpenManage Enterprise – Intelligent Automation Systems Management

© Copyright 2017 Dell Inc.27
Fundamental economics SHIFT to FLASH
$0.10
$1.00
$10.00
$100.00
2000 2002 2004 2006 2008 2010 2012 2014 2016 2018 2020
$5.00
$0.50
$50.00
CROSSOVERPOINT
SOURCE: EMC MARKET RESEARCH 2016
$/G
B

© Copyright 2017 Dell Inc.28
Flash - a compelling offering to replace 15K drives for a multitude of use cases
Read Intensive SATA SSDCapacity 960GBIOPS (R/W) ~87K / 28KBW (W/R) ~510 MB/s / 480MB/sPower ~3.5WMTBF ~2M Hrs
15K Hard DriveCapacity 300/900GBIOPS ~270 (R)BW ~250 MB/sPower ~12WMTBF ~2M Hrs
300X more IOPS2X more BW1/3 the power
1x $/GB
Other SSDs will have different specs. Pricing is per drive, system-level pricing will be different.
Mixed Use SAS SSDCapacity 400GBIOPS (R/W) ~270K / 90KBW (W/R) ~1900 MB/s / 850MB/sPower ~3.2WMTBF ~2M Hrs
1000X more IOPS7X more BW1/3 the power
1x $/GB

© Copyright 2017 Dell Inc.29
Endu
ranc
e
Write Performance
• Interface: SATA and SAS• Form Factor: 1.8“
(SATA)/2.5”• Capacity: 120GB –
3.84TB• Endurance: 1-3 DWPD• Usage Model:
Applications with seldom writes and mostly reads; i.e. Boot, Web/file servers, Media Streaming
• Warranty: Limited System Warranty
• Interface: SATA and SAS• Form Factor: 1.8
(SATA)/2.5”• Capacity: 240GB –
1.92TB• Endurance: 3 – 10
DWPD• Usage Model:
Applications w/ even mix of read/writes; i.e. Data warehousing, Read Cache
• Warranty: LimitedSystem Warranty
• Interface: SATA and SAS• Form Factor: 1.8 (SATA)
2.5”• Capacity: 200GB - 800GB• Endurance: 10 – 25
DWPD• Usage Model: Mission
critical enterprise (highperformance) applications; Write caching, Database/OLTP, Media Editing, Server Virtualization
• Warranty: Limited SystemWarranty
Read Intensive/Boot(Low-Endurance)
Mixed Use(Mid-Endurance)
Write Intensive(High Endurance)
Dell EMC PowerEdge SATA/SAS SSD Categories

© Copyright 2017 Dell Inc.30
Dell EMC NVMe Technology Leadership
Founding Member – NVMeConsortiumDell developed SFF8639 (U2) and provided to communityWorking Group Member – 2.5-inch PCIe SSDs
1st to Ship – PCIe SSD (12G) 1st to Ship NVMe PCIe SSD (12G)
1st to Ship – Hot Plug PCIe SSD1st to Ship Universal 2.5-inch Bay

© Copyright 2017 Dell Inc.31 Dell - Internal Use - Confidential
PowerEdge server solutions for every workload
Cyber Resilient Architecture. Rule-based authentication. Hardware root of trust.
Accelerate workloads using SSD and NVMe drives across the portfolio
THE BEDROCK OF THE MODERN DATA CENTER
R6401U / 2S
R740R740XD
2U / 2S R9403U / 4S
M640FC640
4 x 1/2U / 2SC64202U / 4 X 2S
Key
W
orkl
oads HPC, HFT
Application Tier SDS: ScaleIO, XC
(Nutanix), VSAN Virtualization
ERP E-Commerce In-Memory DB Analytics & Dense
Virtualizations
MS Exchange Virtualization In-memory OLTP SQL Server
HPC Web Tech / SaaS HCI Financial Modeling Data Analytics
Virtual Desktop Infrastructure SDS: VSAN, XC Deep Storage Big Data

© Copyright 2017 Dell Inc.32
Towers ModularRacks Extreme Scale Infrastructure
INDUSTRY'S #1
Server PortfolioPowerEdge
THE BEDROCK OF THE MODERN DATA CENTER
*Based on units sold (tie). IDC Worldwide Quarterly Server Tracker, Q1-Q3, 2016.
32
OpenManage Enterprise – Intelligent Automation Systems Management
