storage stability study of a commercial spray-dried hen …
TRANSCRIPT
STORAGE STABILITY STUDY OF A COMMERCIAL SPRAY-DRIED HEN EGG
YOLK POWDER
A THESIS SUBMITTED TO THE FACULTY OF UNIVERSITY OF MINNESOTA
BY
Mufan Guo
IN PARTIAL FULFILLMENT OF THE REQUIREMENTS FOR THE DEGREE OF
DOCTOR OF PHILOSOPHY
Dr. Ted Labuza
March 2016

© Mufan Guo 2016
i
Acknowledgements
I would like to express my thanks and grateful feelings for everyone that have
helped and supported me in various ways during my Ph.D. study. Completion of a Ph.D.
degree is not an easy task for me, and I cannot image myself getting this far without
everyone’s help and support.
First of all, I would like to thank Dr. Ted Labuza for accepting me as his Ph.D.
student and provided me funding from multiple projects for two and half years. Dr.
Labuza is an experienced and famous advisor and one of the founders of water activity
and shelf life theory; therefore, he provided me a lot of expertise and great guidance and
suggestions with my research. He is also funny and has a lot of stories. But when talking
about research, he is a little bit of tough and really has a high standard and is not easy to
be persuaded. Thanks to his serious attitude about research, I become a better researcher
and learned the ability of critical thinking, problem solving, and trouble shooting and am
more confident to face any difficult tasks that may confront me in the future.
Second, I want to express my thanks to all my committee members, Dr. Baraem
(Pam) Ismail, Dr. Tonya Schoenfuss, Dr. Qinchun Rao, Dr. Joanne Slavin, and Dr. Ulrike
Tschirner. Thanks for their effort to be on my committee and go though my oral proposal,
defense, and my thesis and final defense. Thanks especially to Dr Rao, Ismail, and
Schoenfuss for their support and suggestions on my research. It really helped a lot.
Third, I would like to thank Dr. LeeAnn Higgins and Todd Markowski, both
working at Center for Mass Spectrometry and Proteomics at the University of Minnesota.
They were very helpful with my proteomic study and provided a lot of suggestions and
expertise. I also want to thank the Mass Center for its free workshop on proteomics. I
learned the basics and decided to conduct proteomic studies of my research after the
workshop.
Fourth, I want to give thanks to several labs in the Dept. of Food Science and
Nutrition and other departments for allowing me to use their lab equipment and

ii
resources. The labs are Dr. Ismail’s lab, Dr. Shoenfuss’s lab, Dr. Dan Gallaher’s lab, Dr.
Xiaoli Chen’s lab, Dr. Jerry Cohen’s lab (Horticulture), Dr. William Gray (Biological
Science), Dr. Jane Glazebrook (Plant Biology).
Fifth, I would like to thank all my lab members and other undergraduate and
graduate students in the food science program. Thanks for their help on the method
development, equipment operation, and data analysis. I feel so lucky to be working with
this group of people who are fun, creative, and nice, which makes my PhD study much
easier and much less miserable.
Last but not least, I would like to thank my family and friends who supported me
through all my way. There have been happy times and tough times and I am very grateful
that they are always there so that I know I am not alone. With their support and help, I am
stronger and braver to conquer any projects and solve any problems in the past, now, and
future.
iii
Abstract
Dehydration is a good process approach for food preservation. However, dried
food products may still suffer from deterioration if store in an abused environment such
as high humidity (water activity (aw) > 0.6) and/or high temperature (> 45°C). These
storage conditions can induce undesirable chemical reactions (disulfide bond interactions,
Maillard reaction and/or lipid oxidation), resulting in a significant decrease in food
quality.
In this study, the storage stability of a commercial spray-dried egg yolk powder
was evaluated. The dried egg yolk powder (DEY) was stored at three temperatures (room
temperature, 35°C, and 45°C) and at six aw (0.05, 0.12, 0.37, 0.44, 0.54, 0.66) for at least
two months, and several physicochemical changes and extent of protein aggregation were
measured.
The overall color change of DEY was that it became slightly darker (decrease of
L* value), more red (increase of a* value), and less yellow (decrease of b* value) with
increased storage time. The reaction kinetics of the L* value of DEY was also calculated
using a first-order hyperbolic model. Its Q10 (rate increase with temperature increase at
10°C) was 2.9, which was more indicative of lipid oxidation, and the Ea (activation
energy) was around 83 kJ/mole. The color change was mostly due to the browning
pigments that were produced from the Maillard reaction and lipid oxidation. The glucose
content went to zero after one-week during storage at 45°C at an aw of 0.66, confirming
the occurrence of the Maillard reaction. The peroxide value of DEY storage at 45°C at aw
of 0.66 was significantly increased compared to the control (vacuum packaged at -20°C),
iv
proving the occurrence of lipid oxidation. In addition, the Maillard reaction products and
lipid oxidation products were both detected using the front face fluorescence
spectrometer.
After storage at an aw of 0.66 at 45°C for 8 weeks, protein solubility of DEY in
TBS-SDS buffer [Tris-buffered saline (TBS: 20 mM Tris and 500 mM sodium chloride,
pH 7.5) containing 1% sodium dodecyl sulfate (SDS, g/ml)] decreased to ~ 78%
compared with that of the original DEY. Formations of buffer-soluble and –insoluble
protein aggregates were discovered using SDS-PAGE. The protein aggregates were
mainly formed through unfolded intermediates and unfolded states as well as direct
chemical linkages. The proteins in DEY were all denatured after storage at an aw of 0.66
at 45°C for 8 weeks, resulting in numerous unfolded intermediates and states that could
interact with each other to form aggregates. The spray drying process during the
manufacturing of DEY also caused denaturation of protein, which explained the detection
of buffer-insoluble protein aggregates in the original sample. Increases of disulfide bond
links and protein-lipid interaction during storage were also found using techniques such
as Raman spectrometry, fourier transform infrared spectroscopy, and front-face
fluorescence spectrometry, indicating that some of the protein aggregates were induced
by chemical reactions.
The high molecular weight protein aggregates (HMWPAs) were further
evaluated. Results showed that 32 proteins were involved with formation of buffer-
soluble and -insoluble HMWPAs. They were products of natural egg yolk proteins and
egg white proteins including serum albumin, vitellogenin, apovitellenin, as well as
v
ovotansferrin, ovalbumin, lysozyme, ovomucoid, and ovastatin. Most of them contain
disulfide bonds and some of them contain ligand and fatty acid binding sites, which
corresponded with the theory of the direct chemical linkages induced protein aggregates.
Overall, physicochemical changes and protein aggregates were found during the
storage of DEY and it is mostly due to three undesirable chemical reactions, i.e., disulfide
bond interactions, the Maillard reaction and/or lipid oxidation. Therefore, most effective
approaches to reduce and/or inhibit the occurrence of those reactions include adjusting
storage temperature and humidity as well as vacuum packaging after drying.
vi
Table of Contents
LIST OF TABLES ...................................................................................................................................... IX
LIST OF FIGURES ...................................................................................................................................... X
CHAPTER 1 INTRODUCTION ................................................................................................................ 2
CHAPTER 2 LITERATURE REVIEW .................................................................................................... 1 EGG YOLK POWDER ................................................................................................................................................. 1
Egg yolk powder composition ........................................................................................................................... 1 Plasma Structure ................................................................................................................................................................................... 4 Granule Structure ................................................................................................................................................................................. 5
Proteins in egg yolk powder ............................................................................................................................... 6 The vitellogenin cleavage products ............................................................................................................................................. 7
Apolipovitellins ............................................................................................................................................................................... 7 Phosvitin ............................................................................................................................................................................................. 7 Apovitellenins .................................................................................................................................................................................. 8
Livetins (serum albumin, IgY, α-glycoprotein) ...................................................................................................................... 9 Other proteins ........................................................................................................................................................................................ 9
Lipids in egg yolk powder .................................................................................................................................... 9 Neutral lipids ........................................................................................................................................................................................ 10 Phospholipids ....................................................................................................................................................................................... 11
Phoshatidycholine (PC) ............................................................................................................................................................. 12 Phosphatidylethanolamine (PE) ........................................................................................................................................... 12 Lysophosphatidylcholine (LPC) ............................................................................................................................................ 12 Sphingomyelins (SM) ................................................................................................................................................................. 13
Cholesterol ............................................................................................................................................................................................. 13 Carotenoids ............................................................................................................................................................. 14 Nutritional value of egg yolk powder ......................................................................................................... 14
Proteins.................................................................................................................................................................................................... 14 Lipids ........................................................................................................................................................................................................ 15 Vitamins................................................................................................................................................................................................... 16 Minerals ................................................................................................................................................................................................... 17
Bioactivity of egg yolk ........................................................................................................................................ 18 Discovery of IgY ................................................................................................................................................................................... 18 Production of Ig ................................................................................................................................................................................... 19 Extraction and Purification of IgY ............................................................................................................................................... 19 General Application of use of IgY ................................................................................................................................................ 21
Functionality of egg yolk powder ................................................................................................................. 22 Emulsion ability ................................................................................................................................................................................... 22 Gelation ability ..................................................................................................................................................................................... 24
Processing of egg yolk powder ....................................................................................................................... 25 STORAGE STABILITY .............................................................................................................................................. 26
Water activity ........................................................................................................................................................ 27 Definition and importance of water activity.......................................................................................................................... 27 Water activity and glass transition ............................................................................................................................................ 31 Water activity and food system ................................................................................................................................................... 33 Effect of water activity on storage stability with examples ........................................................................................... 35
Temperature .......................................................................................................................................................... 36 The importance of temperature .................................................................................................................................................. 36 Examples of the effect of storage temperature on storage stability .......................................................................... 37
Shelf life prediction.............................................................................................................................................. 38
vii
CHAPTER 3 STORAGE INDUCED PHYSICOCHEMICAL CHANGES OF A COMMERCIAL
SPRAY-DRIED EGG YOLK POWDER ................................................................................................ 40 SUMMARY ............................................................................................................................................................... 40 INTRODUCTION ...................................................................................................................................................... 41 METHODS AND MATERIALS ................................................................................................................................. 43
Materials .................................................................................................................................................................. 43 Methods .................................................................................................................................................................... 43
Characterization of DEY ................................................................................................................................................................... 43 Moisture sorption isotherm ........................................................................................................................................................... 44 DEY storage ........................................................................................................................................................................................... 44 Color measurement of DEY ............................................................................................................................................................ 45 Glucose content.................................................................................................................................................................................... 45 Solid Fat Index (SFI) of DEY ........................................................................................................................................................... 47 o-Phthalaldehyde (OPA) method ................................................................................................................................................ 48 Front-face fluorescence ................................................................................................................................................................... 49 Peroxide value of DEY during storage ...................................................................................................................................... 50
RESULTS .................................................................................................................................................................. 51 Characteristics of DEY ....................................................................................................................................... 51 The moisture sorption isotherm of DEY .................................................................................................... 51 Physicochemical changes of DEY during storage ................................................................................. 53
Color .......................................................................................................................................................................................................... 53 Glucose content.................................................................................................................................................................................... 64 The free amino groups ..................................................................................................................................................................... 68 The Maillard reaction products ................................................................................................................................................... 70 The progress of lipid oxidation .................................................................................................................................................... 76 Peroxide value ...................................................................................................................................................................................... 79
DISCUSSION ............................................................................................................................................................ 81 CONCLUSION........................................................................................................................................................... 82 ACKNOWLEDGEMENT: .......................................................................................................................................... 83
CHAPTER 4 STORAGE INDUCED PROTEIN AGGREGATION OF A COMMERCIAL SPRAY-
DRIED EGG YOLK POWDER ............................................................................................................... 84 SUMMARY ............................................................................................................................................................... 84 INTRODUCTION ...................................................................................................................................................... 85 MATERIALS AND METHOD ................................................................................................................................... 87
Materials .................................................................................................................................................................. 87 Storage Study ......................................................................................................................................................... 87 Denaturation Temperature of DEY ............................................................................................................. 87 Secondary structure changes of DEY during storage ......................................................................... 88
Front-face fluorescence ................................................................................................................................................................... 89 Fourier transform infrared spectroscopy (FTIR) ................................................................................................................ 89
Preparation of buffer-soluble and –insoluble protein of DEY during storage ......................... 91 Protein solubility of DEY during storage .................................................................................................. 92 Protein profile of buffer-soluble and –insoluble DEY during storage .......................................... 93 Identification of HMWPAs of DEY during storage ................................................................................ 93
In-gel trypsin digestion .................................................................................................................................................................... 93 Stop and go extraction (STAGE) tips desalting..................................................................................................................... 95 Mass spectrometric analysis and protein identification .................................................................................................. 96
RESULTS .................................................................................................................................................................. 97 Protein aggregates generated during DEY storage ............................................................................. 97
Protein solubility changes of DEY during storage .............................................................................................................. 97 Protein profile of DEY during storage ....................................................................................................................................... 98
viii
Protein aggregates as accessed by tryptophan front-face fluorescence ............................................................... 103 Molecular mechanism of protein aggregates formation during DEY storage ..................... 106
Thermo analysis of DEY during storage ............................................................................................................................... 106 Secondary structure changes of DEY during storage ..................................................................................................... 109 HMWPAs formation during storage ....................................................................................................................................... 119
DISCUSSION ......................................................................................................................................................... 125 CONCLUSION........................................................................................................................................................ 127 ACKNOWLEDGEMENT ........................................................................................................................................ 128
THESIS CONCLUSION: ........................................................................................................................ 129
REFERENCE: .......................................................................................................................................... 133
APPENDIX .............................................................................................................................................. 151 APPENDIX 1: SELECTED RAW DATA OF THE COLOR MEASUREMENT ......................................................... 151 APPENDIX 2: SELECTED RAW DATA OF THE GLUCOSE CONTENT ............................................................... 153 APPENDIX 3: SELECTED RAW DATA OF THE PEROXIDE VALUE ................................................................... 154 APPENDIX 4: SELECTED RAW DATA OF THE PROTEIN SOLUBILITY ............................................................ 154 APPENDIX 5: SELECTED RAW DATA OF THE FREE AMINO GROUP MEASUREMENT ................................. 154 APPENDIX 6: SELECTED SPREADSHEET OF KINETIC ANALYSIS AND ARRHENIUS PLOT OF L* AND ΔE*
VALUE ................................................................................................................................................................... 155 APPENDIX 7: R CODE FOR THE PCA ANALYSIS ............................................................................................. 157
ix
List of Tables
TABLE 1.1: NUTRITION VALUES OF DRIED EGG YOLK POWDER. (USDA NUTRITION DATABASE) ....................................... 3 TABLE 1.2: FATTY ACID COMPOSITION OF DRIED EGG YOLK POWDER (100 G). .................................................................... 10 TABLE 1.3: COMPOSITION OF EGG YOLK PHOSPHOLIPIDS. ......................................................................................................... 12 TABLE 1.4: AMINO ACIDS COMPOSITION OF DEHYDRATED EGG YOLK. .................................................................................... 15 TABLE 1.5: VITAMINS IN EGG YOLK WITH RECOMMENDED DAILY INTAKE (RDI) BASED ON A 2,000 CALORIE DIET
(STADELMAN & COTTERILL, 1973). ................................................................................................................................. 17 TABLE 1.6: MINERALS IN EGG YOLK WITH RECOMMENDED DAILY INTAKE (RDI) BASED ON A 2,000 CALORIE DIET
(STADELMAN & COTTERILL, 1973). ................................................................................................................................. 18 TABLE 1.7: WATER ACTIVITY PARADIGMS. .................................................................................................................................. 34 TABLE 2.1: SAMPLE BLANK, REAGENT BLANK, AND SAMPLE TEST COMPOSITION CHART. ................................................... 46 TABLE 2.2: CHARACTERISTICS OF A COMMERCIAL SPRAY-DRIED EGG YOLK POWDER. ......................................................... 51 TABLE 2.3: PROCESSING CONDITIONS OF A COMMERCIAL SPRAY-DRIED EGG YOLK POWDER (INFORMATION OBTAINED
FROM THE EGG YOLK MANUFACTURE). .............................................................................................................................. 51 TABLE 2.4: KINETIC ANALYSIS OF APPARENT FIRST-ORDER HYPERBOLIC MODEL FIT FOR THE CHANGE IN L* VALUE AS A
FUNCTION OF WATER ACTIVITY (AW) FOR DEY STORED AT 45°C. ............................................................................... 56 TABLE 2.5: KINETIC ANALYSIS OF APPARENT FIRST-ORDER HYPERBOLIC MODEL FIT FOR THE CHANGE IN ΔE* VALUE AS
A FUNCTION OF WATER ACTIVITY (AW) FOR DEY STORED AT 45°C. ............................................................................ 57 TABLE 2.6: KINETIC ANALYSIS OF APPARENT FIRST-ORDER HYPERBOLIC MODEL FIT FOR THE CHANGE IN L* VALUE AS A
FUNCTION OF WATER ACTIVITY (AW) FOR DEY STORED AT 35°C. ............................................................................... 59 TABLE 2.7: KINETIC ANALYSIS OF APPARENT FIRST-ORDER HYPERBOLIC MODEL FIT FOR THE CHANGE IN ΔE* VALUE AS
A FUNCTION OF WATER ACTIVITY (AW) FOR DEY STORED AT 35°C. ............................................................................ 60 TABLE 3.1: MEAN ABSORPTION FREQUENCIES OF VARIOUS SECONDARY STRUCTURE ELEMENTS IN PROTEINS. ........................... 91 TABLE 3.2: RELATIVE INTENSITY VALUES (PRIVS) AT SELECTED REGIONS OF THE RAMAN SPECTRA OF LIQUID EGG
YOLK, SPRAY DRIED EGG YOLK, AND SPRAY DRIED EGG YOLK STORAGE AT AW OF 0.66 AFTER 8 WEEKSA. .......... 111 TABLE 3.3: ESTIMATION OF PROTEIN SECONDARY STRUCTURE CONTENT OF DEY DURING STORAGE ........................... 119 TABLE 3.4: LIST OF PROTEINS INVOLVED IN THE FORMATION OF SOLUBLE AND INSOLUBLE HMWPS IN ORIGINAL DEY
AND DEY STORAGE AFTER 8 WEEKS. .............................................................................................................................. 121 TABLE 3.5:RELATIVE PROTEIN QUANTITY VALUE (RPQV) OF PROTEINS INVOLVED IN FORMATION OF SOLUBLE AND
INSOLUBLE HMWPS IN ORIGINAL DEY AND DEY STORAGE AFTER 8 WEEKS. ....................................................... 123
x
List of Figures
FIGURE 1.1: THE COMPOSITION OF EGG YOLK. LDL: LOW-DENSITY LIPOPROTEIN; HDL: HIGH-DENSITY LIPOPROTEIN.
(ADOPTED FROM ANTON (2013)) ...................................................................................................................................... 4 FIGURE 1.2: THE STRUCTURE OF LOW DENSITY LIPOPROTEINS. (ADOPTED FROM ANTON (2007)) ................................. 5 FIGURE 1.3:FISCHER PROJECTION OF A TRIACYL-SN-GLYCEROL (ADAPT FROM
HTTP://LIPIDLIBRARY.AOCS.ORG/LIPIDS/TAG1/INDEX.HTM) .................................................................................... 11 FIGURE 1.4: THE FLOW CHART OF PROCESSING DRIED EGG YOLK POWDER............................................................................ 26 FIGURE 1.5: THREE TYPES OF MOISTURE SORPTION ISOTHERM. TYPE I: CURVE A, TYPE II: CURVE B, TYPE III: CURVE C.
.................................................................................................................................................................................................. 30 FIGURE 1.6: FOOD STABILITY MAP AS A FUNCTION OF WATER ACTIVITY (ADAPTED FROM LABUZA (1970)). ............... 34 FIGURE 2.1: MOISTURE SORPTION ISOTHERMS OF A COMMERCIAL SPRAY-DRIED EGG YOLK POWDER (DEY)
GENERATED FROM THE GAB MODEL. THE DOTTED LINES INDICATE THE GAB MO AND THE RELEVANT AW OF DEY.
.................................................................................................................................................................................................. 52 FIGURE 2.2: MOISTURE SORPTION ISOTHERM OF DRIED EGG WHITE AND HYDROLYZED EGG WHITE POWDERS. (RAO ET
AL., 2012) .............................................................................................................................................................................. 53 FIGURE 2.3: (A) L* VALUE AND (B) ΔΕ* VALUE CHANGES OF DEY DURING STORAGE AT 45°C AT AW OF 0.66 ON A
SEMI-LOG SCALE. .................................................................................................................................................................... 54 FIGURE 2.4: CHANGE OF L* VALUE AS A FUNCTION OF TIME OF DEY DURING STORAGE AT 45°C AT DIFFERENT AW. .... 55 FIGURE 2.5: CHANGES OF ΔE* VALUE AS A FUNCTION OF TIME OF DEY DURING STORAGE AT 45°C AT DIFFERENT AW.56 FIGURE 2.6: EFFECT OF WATER ACTIVITY (AW) ON THE L* VALUE OF HYDROLYZED EGG WHITE (HEW) DURING
STORAGE AT 45°C (QINCHUN RAO, ROCCA-SMITH, ET AL., 2012). ............................................................................ 57 FIGURE 2.7: CHANGES OF L* VALUE AS A FUNCTION OF TIME OF DEY DURING STORAGE AT ROOM TEMPERATURE AT
DIFFERENT AW. ....................................................................................................................................................................... 60 FIGURE 2.8: CHANGES OF ΔE* VALUE AS A FUNCTION OF TIME OF DEY DURING STORAGE AT ROOM TEMPERATURE AT
DIFFERENT AW. ....................................................................................................................................................................... 61 FIGURE 2.9: ARRHENIUS PLOT OF (A) L* VALUE AND (B) ΔE* VALUE OF DEY DURING STORAGE AT 45°C AT AW OF
0.66. ........................................................................................................................................................................................ 63 FIGURE 2.10: GLUCOSE RETENTION IN DEY AS A FUNCTION OF STORAGE TIME (A) IN A REGULAR SCALE (B) IN A SEMI
LOG SCALE ............................................................................................................................................................................... 65 FIGURE 2.11:LIQUID FAT CONTENT IN THE INITIAL DEY AS A FUNCTION OF TEMPERATURE. THE BLUE DOTTED AREA
INDICATES THE TOTAL AREA OF FAT MELTING. SFI: SOLID FAT INDEX. ....................................................................... 66 FIGURE 2.12: CHANGE OF % FREE AMINO GROUP AS A FUNCTION OF WATER ACTIVITY (AW) OF DEY DURING STORAGE
AT 45°C. ................................................................................................................................................................................. 68 FIGURE 2.13: CHANGE OF % FREE AMINO GROUP AS A FUNCTION OF WATER ACTIVITY (AW) OF DEY DURING STORAGE
AT 35°C. ................................................................................................................................................................................. 69 FIGURE 2.14: CHANGE OF % FREE AMINO GROUP AS A FUNCTION OF WATER ACTIVITY (AW) OF DEY DURING STORAGE
AT ROOM TEMPERATURE. ..................................................................................................................................................... 69 FIGURE 2.15: FLUORESCENCE SPECTRA OF THE MAILLARD REACTION PRODUCTS FROM DEY DURING STORAGE AT
23°C AND 45°C AND MEASURED AT 28 AND 56 DAYS AT AW OF 0.66. ....................................................................... 73 FIGURE 2.16: PRINCIPLE COMPONENT ANALYSIS RESULT OF THE MAILLARD REACTION PRODUCTS SPECTRA OF DEY
DURING STORAGE AT AN AW OF 0.66. CONTROL: THE ORIGINAL DEY VACUUM PACKAGED STORAGE AT -20°C;
23°C: THE DEY STORAGE AT 23°C FOR 28 DAYS AND 56 DAYS. 45°C D28: DEY STORAGE AT 45°C FOR 28
DAYS; 45°C D56: DEY STORAGE AT 45°C FOR 56 DAYS. ............................................................................................. 74 FIGURE 2.17: PRINCIPLE COMPONENT ANALYSIS RESULT OF THE MAILLARD REACTION PRODUCTS SPECTRA OF DEY
DURING STORAGE AT AN AW OF 0.66 AFTER REMOVAL OF OUTLIERS. CONTROL: THE ORIGINAL DEY VACUUM
PACKAGED STORAGE AT -20°C; 23C D28: THE DEY STORAGE AT 23°C FOR 28 DAYS; 23C D56: THE DEY
STORAGE AT 23°C FOR 56 DAYS; 45°C D28: DEY STORAGE AT 45°C FOR 28 DAYS; 45°C D56: DEY STORAGE
AT 45°C FOR 56 DAYS. ......................................................................................................................................................... 75 FIGURE 2.18: FLUORESCENCE SPECTRA OF THE LIPID OXIDATION PRODUCTS FROM DEY DURING STORAGE AT 23°C
AND 45°C AND MEASURED AT 28 AND 56 DAYS AT AW OF 0.66. .................................................................................. 77
xi
FIGURE 2.19: PRINCIPLE COMPONENT ANALYSIS RESULT OF THE MAILLARD REACTION PRODUCTS SPECTRA OF DEY
DURING STORAGE AT AN AW OF 0.66 AFTER REMOVAL OF OUTLIERS. CONTROL: THE ORIGINAL DEY VACUUM
PACKAGED STORAGE AT -20°C; 23C D28: THE DEY STORAGE AT 23°C FOR 28 DAYS; 23C D56: THE DEY
STORAGE AT 23°C FOR 56 DAYS; 45°C D28: DEY STORAGE AT 45°C FOR 28 DAYS; 45°C D56: DEY STORAGE
AT 45°C FOR 56 DAYS. ......................................................................................................................................................... 78 FIGURE 2.20: THE PEROXIDE VALUE OF DEY STORAGE AT 45°C AT AN AW OF 0.66. CONTROL: THE ORIGINAL DEY
VACUUM PACKAGED AND STORED AT -20°C; D28: AFTER STORAGE FOR 28 DAYS; D56: AFTER STORAGE FOR 56
DAYS. ........................................................................................................................................................................................ 80 FIGURE 3.1: RELATIVE PROTEIN SOLUBILITY IN TBS-SDS BUFFER AFTER STORED AT AW OF 0.66 FOR 8 WEEKS AT
DIFFERENT TEMPERATURES. CONTROL: THE ORIGINAL SAMPLE VACUUM PACKAGE STORAGE AT -20°C; RT:
ROOM TEMPERATURE. .......................................................................................................................................................... 98 FIGURE 3.2: SDS-PAGE OF DEY STORED AT AN AW OF 0.66 FOR 8 WEEKS AT DIFFERENT TEMPERATURES. (A): NON-
REDUCING GEL (WITHOUT 2-MERCAPTOETHANOL) OF TBS-SDS BUFFER SOLUBLE PROTEIN; (B) REDUCING GEL
(WITH 2-MERCAPTOETHANOL) OF TBS-SDS BUFFER SOLUBLE PROTEIN; (C): REDUCING GEL (WITH 2-
MERCAPTOETHANOL) OF TBS-SDS WITH 5% 2-MERCAPTOETHANOL BUFFER SOLUBLE PROTEIN. THE DASHED
LINE IS THE BOUNDARY OF THE STACKING GEL AND THE SEPARATING GEL. C: THE ORIGINAL SAMPLE AFTER
VACUUM PACKAGED AND STORED AT -20°C; RT: ROOM TEMPERATURE..................................................................... 99 FIGURE 3.3: DEY (-20°C) PROTEIN BAND LABELING ON REDUCING SDS-PAGE. ............................................................ 100 FIGURE 3.4: FRONT-FACE FLUORESCENCE SPECTRA OF TRYPTOPHAN FROM DEY DURING STORAGE AT AW OF 0.66. THE
D VALUES ARE DAYS IN STORAGE AT THE GIVEN TEMPERATURE AND WATER ACTIVITY (0.6 = 0.66). .............. 104 FIGURE 3.5: PRINCIPLE COMPONENT ANALYSIS RESULT OF THE TRYPTOPHAN SPECTRA OF DEY DURING STORAGE AT
AW OF 0.66 AFTER REMOVAL OF OUTLIERS. CONTROL: THE ORIGINAL DEY VACUUM PACKAGED STORAGE AT -
20°C; 23C: THE DEY STORAGE AT 23°C FOR 28 DAYS AND 56 DAYS; 45°C D28: DEY STORAGE AT 45°C FOR
28 DAYS; 45°C D56: DEY STORAGE AT 45°C FOR 56 DAYS. .................................................................................... 106 FIGURE 3.6: DSC THERMOGRAMS OF LIQUID EGG YOLK (LEY), DRIED EGG YOLK (DEY), AND DEY STORAGE FOR 8
WEEKS AT 45°C AT AN AW OF 0.66. ................................................................................................................................ 108 FIGURE 3.7: PROTEIN AGGREGATIONS PATHWAYS. (REPRODUCED FROM WANG ET AL. (2010)) ................................ 109 FIGURE 3.8: RAMAN SPECTRA OF LIQUID EGG YOLK (LEY) AND DRIED EGG YOLK (DEY) AS RECEIVED AND AFTER
STORAGE AT 45°C AND 0.66 AW FOR 8 WEEKS. ............................................................................................................ 111 FIGURE 3.9: FRONT-FACE FLUORESCENCE SPECTRA OF VITAMIN A FROM DEY DURING STORAGE AT AW OF 0.66. .... 113 FIGURE 3.10: PRINCIPLE COMPONENT ANALYSIS RESULT OF THE VITAMIN A SPECTRA OF DEY DURING STORAGE AT AW
OF 0.66 AFTER REMOVAL OF OUTLIERS. CONTROL: THE ORIGINAL DEY VACUUM PACKAGED STORAGE AT -20°C;
23C: THE DEY STORAGE AT 23°C FOR 28 DAYS AND 56 DAYS; 45°C D28: DEY STORAGE AT 45°C FOR 28
DAYS; 45°C D56: DEY STORAGE AT 45°C FOR 56 DAYS. .......................................................................................... 114 FIGURE 3.11: FTIR SPECTRA OF DEY DURING STORAGE AT AW OF 0.66 AT DIFFERENT TEMPERATURES. ................... 116 FIGURE 3.12: SECOND DERIVATIVE OF THE FTIR SPECTRA OF THE CONTROL DEY SAMPLE IN THE AMIDE I REGION
WITH REGIONS LABELED WITH EACH SECONDARY STRUCTURE FOR THE SECONDARY STRUCTURE ESTIMATION.
............................................................................................................................................................................................... 117 FIGURE 3.13: SECOND DERIVATIVE OF FTIR SPECTRA OF DEY DURING STORAGE AT AW OF 0.66 AT DIFFERENT
CONDITIONS ......................................................................................................................................................................... 118 FIGURE 3.14: SDS-PAGE OF D0-S: SOLUBLE PROTEINS/PROTEIN AGGREGATES IN ORIGINAL DEY; D56-S: SOLUBLE
PROTEINS/PROTEIN AGGREGATES IN DEY STORAGE 8 WEEKS AT 45°C AND 0.66 AW; D56-INS: INSOLUBLE
PROTEINS/PROTEIN AGGREGATES IN DEY STORAGE 8 WEEKS AT 45°C AND 0.66 AW. THE HMWPAS BAND FOR
LC-MS/MS ANALYSIS WAS CIRCLED USING RED RECTANGLES. ................................................................................. 120
2
Chapter 1 Introduction
Food deterioration is a worldwide problem for food products during storage.
Deterioration includes not only becoming non-edible, but also the reduction in nutritional
quality overtime. In dry and intermediate moisture food systems, the low to moderate
water activity (0.2 to 0.85) helps to inhibit the growth of pathogenic microorganisms
(Scott, 1957). But in that range, chemical reactions lead to increases by a factor of 2 to
3fold for every 0.1 water activity increase (Labuza, 1970).
Our previous studies showed physicochemical changes and the formation of
protein aggregates during storage of pure protein powder such as whey isolates and egg
white (Qinchun Rao & Labuza, 2012; Qinchun Rao, Rocca-Smith, Schoenfuss, &
Labuza, 2012; Zhou & Labuza, 2007), and protein/buffer systems (Qinchun Rao, Rocca-
smith, & Labuza, 2012; Qinchun Rao, Rocca-Smith, & Labuza, 2013; Zhou, Liu, &
Labuza, 2008b). Both systems showed an increase in darkening of color and texture
hardening as well as a decrease in free amino groups. Disulfide linkage formation
between single proteins was the main reason for the formation of protein aggregates in
whey protein based systems (Zhou & Labuza, 2007; Zhou et al., 2008b); while in egg
protein based systems, the Maillard reaction induced protein aggregation was the more
prevalent mechanism (Qinchun Rao & Labuza, 2012; Qinchun Rao, Rocca-Smith,
Schoenfuss, & Labuza, 2012; Qinchun Rao, Rocca-Smith, & Labuza, 2013; Qinchun
Rao, Rocca-smith, & Labuza, 2012). Besides disulfide linkages and the Maillard reaction,
lipid oxidation can also induce the formation of protein aggregates mainly through two
pathways: 1) formation of a lipid-protein complex through hydrogen bonding; 2)
3
formation of protein radicals, which can react with other protein/lipid radicals through
covalent bonds (Gardner, 1979).
Dried egg yolk (DEY) is an egg product and has broad application in the food
industry. It can be used in infant formula, mayonnaise, salad dressing, and bakery
products primarily for emulsification, and also has the potential to be mixed with other
protein powders (whey, casein, soy, and egg white) to be applied into high protein
nutrition and energy bars. Dried egg yolk contains protein (36%), unsaturated fat (61%),
and a small amount of the reducing sugar, glucose (0.12%). Therefore, chemical reactions
are highly likely to occur during storage thus resulting in loss of quality. However, few
studies have evaluated the storage stability of dried egg yolk. So in this thesis, we want to
study the storage induced physicochemical changes and protein aggregation of a
commercial spray-dried egg yolk powder with the objective of providing useful
suggestions to maximize quality when used by the food industry.
Objectives and Hypothesis
Our long-term goal is to determine the molecular mechanism behind the storage
induced physicochemical changes including protein aggregation of a commercial spray-
dried egg yolk powder and its relationship with storage environment (humidity and
temperature).
Our central null hypothesis is that NO physicochemical changes and formation of
protein aggregates of a commercial spray-dried egg yolk powder will be found during
storage, and it is not correlated with environmental humidity and storage temperature.
4
We plan to test our central hypothesis and accomplish our goal through pursuing
the following objectives:
1) To elucidate the molecular mechanism of storage induced physicochemical
changes of a commercial spray-dried egg yolk powder when stored at several
temperatures and different water activities
2) To elucidate the molecular mechanism of storage induced protein aggregation of a
commercial spray-dried egg yolk powder when stored at several temperatures and
different water activities
1
Chapter 2 Literature Review
Egg yolk powder
The per capita consumption of shell & processed egg products has remained
almost constant (equivalent to around 250 whole eggs) since 1984, but the per capita
consumption of egg product has been increasing to an equivalent 37 whole eggs in 1984
to 76 whole eggs in 2014 (American Egg Board: Egg Production and Consumption,
2014), indicating an increasing demand of egg products as ingredients in food products to
provide bioactivity and/or functionality. Dried egg yolk powder (DEY) is an egg product,
which enjoys several advantages over liquid egg yolk especially in terms of shelf stability
(American Egg Board, EGGSolutions - The complete reference for egg products, 2004;
American Egg Board, Egg product reference guide, 2006). The low moisture content
prevents the growth of microorganisms (Beuchat, 1981; Christian, 1963; Harris, 1981)
and reduces chemical reactions (Theodore P Labuza, 1980). DEY has a broad application
not only in food but also in medical, pharmaceutical, cosmetic, nutraceutical and
biotechnological industries due to its functionality and bioactivity. In the food industry,
DEY can be used in many food products, for nutrition like infant formula as well as for
physical functionality in mayonnaise, salad dressing, bakery products, and custard. It also
has huge potential to be applied in high protein nutrition and energy bars, a current
nutrition fed.
Egg yolk powder composition
According to the USDA (United States Department of Agriculture) National
Agriculture Library, 100 g of DEY contains approximately 33.7 g of protein, 58.1 g of
2
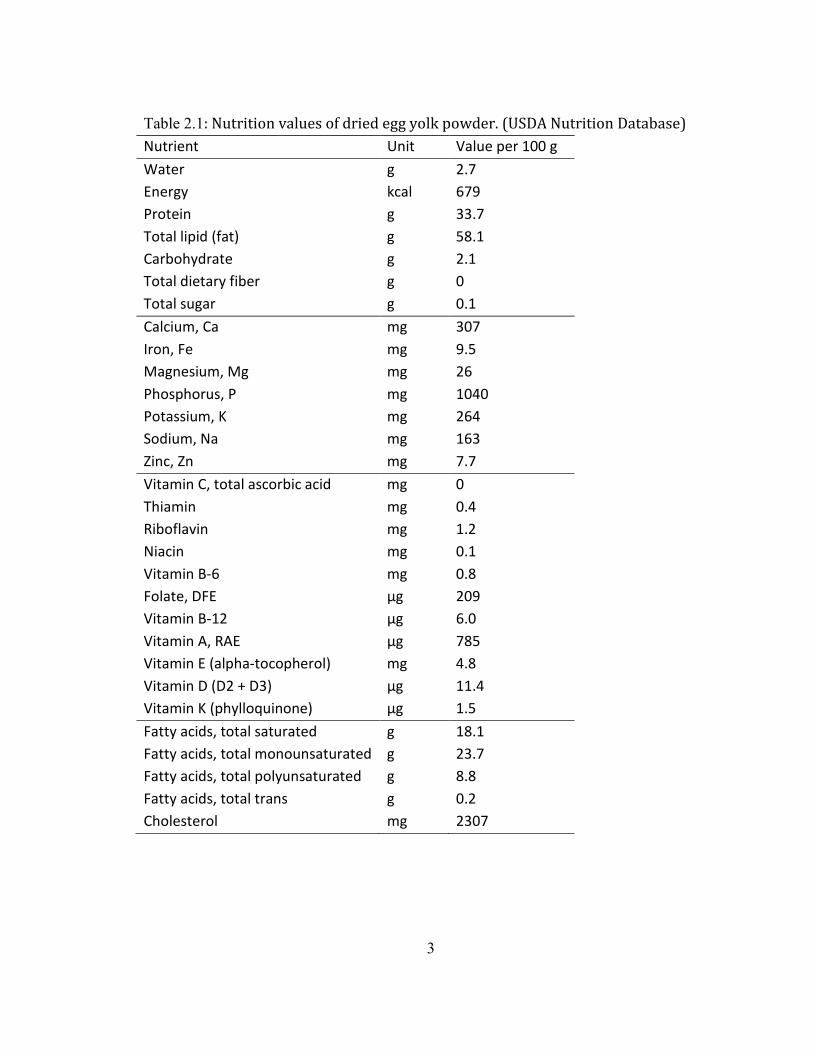
lipid, 2.7 g of water, and 2.1 g of carbohydrate. In addition, it contains numerous
minerals and vitamins, especially rich in folate, vitamin A and D, as well as calcium (Ca)
and iron (Fe) (Table 2.1).
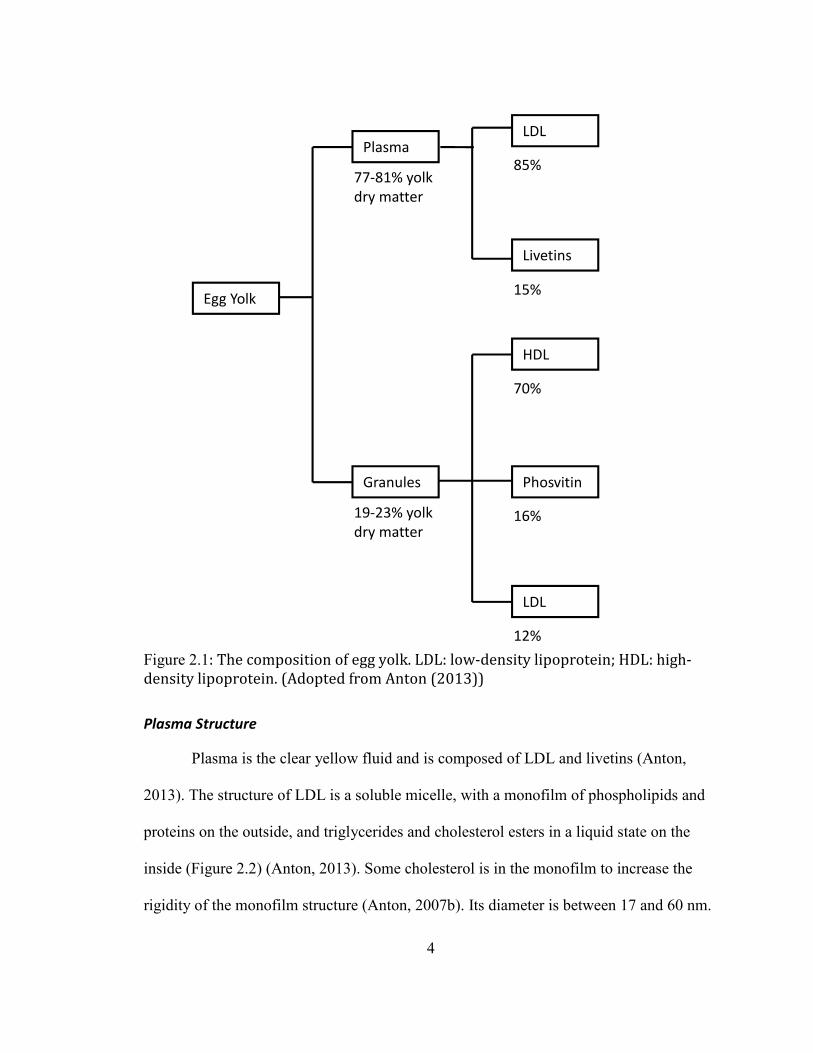
Egg yolk can be separated into plasma (supernatant) and granule (sediment) under
certain centrifuge condition (dissolving in 0.16 M NaCl solution, and then centrifuged at
10,000 ×g for 45 min at 10°C) (Anton & Gandemer, 1997; MC Bee & Cotterill, 1979).
Plasma represents 77-81% yolk dry matter, while granule represents what is left 19-23%.
Plasma is composed of low-density lipoproteins (LDL) (85%) and livetins (15%),
accounting for 50% of yolk proteins and 90% of yolk lipids. Granule is mainly composed
of high-density lipoprotein (HDL) (70%) and phosvitin (16%), with minor LDL (12%). It
accounts for about 50% of yolk proteins and 7% of yolk lipids (Anton, 2013; Burley &
Cook, 1961). However, Mann’s proteomic study (Mann & Mann, 2008a) of egg yolk
found most proteins can be detected in both plasma and granule but with different
abundances, indicating that the boundary of plasma and granule is not very strict and
proteins are dispersed in the whole yolk.
3
Table 2.1: Nutrition values of dried egg yolk powder. (USDA Nutrition Database)
Nutrient Unit Value per 100 g
Water g 2.7
Energy kcal 679
Protein g 33.7
Total lipid (fat) g 58.1
Carbohydrate g 2.1
Total dietary fiber g 0
Total sugar g 0.1
Calcium, Ca mg 307
Iron, Fe mg 9.5
Magnesium, Mg mg 26
Phosphorus, P mg 1040
Potassium, K mg 264
Sodium, Na mg 163
Zinc, Zn mg 7.7
Vitamin C, total ascorbic acid mg 0
Thiamin mg 0.4
Riboflavin mg 1.2
Niacin mg 0.1
Vitamin B-6 mg 0.8
Folate, DFE µg 209
Vitamin B-12 µg 6.0
Vitamin A, RAE µg 785
Vitamin E (alpha-tocopherol) mg 4.8
Vitamin D (D2 + D3) µg 11.4
Vitamin K (phylloquinone) µg 1.5
Fatty acids, total saturated g 18.1
Fatty acids, total monounsaturated g 23.7
Fatty acids, total polyunsaturated g 8.8
Fatty acids, total trans g 0.2
Cholesterol mg 2307
4
Figure 2.1: The composition of egg yolk. LDL: low-density lipoprotein; HDL: high-
density lipoprotein. (Adopted from Anton (2013))
Plasma Structure
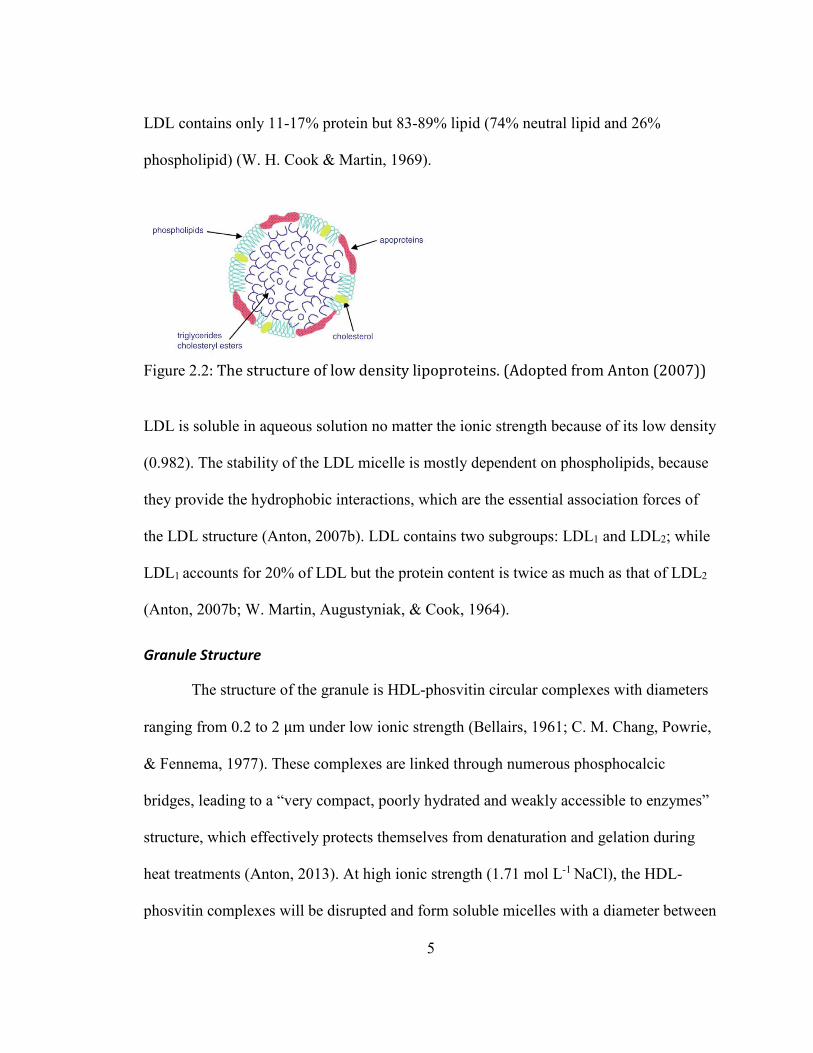
Plasma is the clear yellow fluid and is composed of LDL and livetins (Anton,
2013). The structure of LDL is a soluble micelle, with a monofilm of phospholipids and
proteins on the outside, and triglycerides and cholesterol esters in a liquid state on the
inside (Figure 2.2) (Anton, 2013). Some cholesterol is in the monofilm to increase the
rigidity of the monofilm structure (Anton, 2007b). Its diameter is between 17 and 60 nm.
Egg Yolk
Plasma
Granules
77-81% yolk
dry matter
19-23% yolk
dry matter
LDL
Livetins
85%
15%
HDL
70%
Phosvitin
LDL
16%
12%
5
LDL contains only 11-17% protein but 83-89% lipid (74% neutral lipid and 26%
phospholipid) (W. H. Cook & Martin, 1969).
Figure 2.2: The structure of low density lipoproteins. (Adopted from Anton (2007))
LDL is soluble in aqueous solution no matter the ionic strength because of its low density
(0.982). The stability of the LDL micelle is mostly dependent on phospholipids, because
they provide the hydrophobic interactions, which are the essential association forces of
the LDL structure (Anton, 2007b). LDL contains two subgroups: LDL1 and LDL2; while
LDL1 accounts for 20% of LDL but the protein content is twice as much as that of LDL2
(Anton, 2007b; W. Martin, Augustyniak, & Cook, 1964).
Granule Structure
The structure of the granule is HDL-phosvitin circular complexes with diameters
ranging from 0.2 to 2 μm under low ionic strength (Bellairs, 1961; C. M. Chang, Powrie,
& Fennema, 1977). These complexes are linked through numerous phosphocalcic
bridges, leading to a “very compact, poorly hydrated and weakly accessible to enzymes”
structure, which effectively protects themselves from denaturation and gelation during
heat treatments (Anton, 2013). At high ionic strength (1.71 mol L-1 NaCl), the HDL-
phosvitin complexes will be disrupted and form soluble micelles with a diameter between
6
100 and 200 nm instead. Between low ionic strength and high ionic strength, both HDL-
phosvitin complexes and micelles are present (Anton, 2013).
HDL has a pseudo-molecular structure (close to globular proteins), which is
unlike LDL. Therefore, HDL is not formally a lipoprotein (Anton, 2007a). It is composed
of 75-80% proteins and 20 – 25% lipids, leading to a density close to that of proteins
(1.120 g/ml). The lipids are composed of 65% phospholipids, 30% triglycerides, and 5%
cholesterol (W. H. Cook & Martin, 1969). HDL exists as a dimer of two monomers of
around 200 kDa each. The structure of each monomer is a globular protein containing a
cavity for phospholipids (Anderson, Levitt, & Banaszak, 1998). Since phospholipids are
enclosed within the HDL structure, it is difficult for enzyme access. Phospholipase C will
only liberate 6% lipid phosphorus of HDLs whereas it can liberate 95% of that of LDLs
(Burley & Cook, 1961). HDL also has two subgroups: α- and β- HDL (Radomski &
Cook, 1964). α- HDL accounts for 40% of yolk HDL and is more acidic but less water
soluble than β- HDL, because α- HDL contains more sialic acid and phosphorus. They
are very similar in terms of chemical composition. They both contain around 30% amino
acids that are hydrophobic (Anton, 2007a).
Proteins in egg yolk powder
Egg yolk contains about 36% protein (dry basis), which accounts for about 40%
of the protein of a whole egg. In 2008, Mann’s lab identified 119 proteins from chicken
egg yolk using 1D SDS-PAGE, LC-MS/MS, and MS3, which is the most in-depth
proteomic analysis of hen egg yolk so far (Mann & Mann, 2008b). Among all the
proteins, serum albumin (α-livetin), the vitellogenin cleavage products, apovitellenins,
7
IgY (γ-livetin), ovalbumin, and 12 kDa serum protein with cross-reactivity to β2-
microglobulin are the most abundant proteins (Mann & Mann, 2008b). However, the
amount of phosvitin was underestimated due to the low detectability of phovitin peptides,
which is because of “the dense spacing and high number of phosphorylated amino acids
and the correspondingly low number of cleavage sites” (Mann & Mann, 2008b).
The vitellogenin cleavage products
The proteins, apolipovitellins and phosvitin, in HDL are cleaved products from
vitellogenin (dimeric protein, 480 kDa) (S. Wang, Smith, & Williams, 1983), which is
synthesized in the liver under the regulation of estrogen and transferred from blood to
yolk (Anton, 2007a).
Apolipovitellins
As mentioned above, HDL is present as a dimer of two monomers. Each
monomer is composed of five main apoproteins. The molecular weights of the five
apoproteins range from 35 to 110 kDa (Anton, 2007a). However, in Mann’s paper, they
only detected two apolipovitellins: apolipovitellins I (125 kDa), and II (35 kDa). They are
cleaved products of vitellogenin I and II (Yamamura et al., 1995), and possibly of
vitellogenin III, because vitellogenin III has been detected both in yolk plasma and
granule and its fragments include partial fragments of apolipovitellins I and II, and
phosvitin (Mann & Mann, 2008b).
Phosvitin
Phosvitin is also cleaved from vitellogenin I, II, and III. It is a non-lipid
phosphoglycoprotein, which accounts for 60% of phosphoproteins and 90% of
8
phosphorous in yolk. It is also the most highly phosphorylated protein existing in nature
(Mecham & Olcott, 1949), more than 55% of which is composed of serine (Allerton &
Perlmann, 1965). The clusters of phosphoserines can effectively bind minerals like
calcium and iron, thus improve their bioavailability. In addition, phosvitin contains 6.5%
carbohydrate, which includes six hexose, five glucosamine and two sialic acids attached
to the N-acetyl derivatives per 40 kDa molecular weight (Samaraweera, Zhang, Lee, &
Ahn, 2011; Shainkin & Perlmann, 1971).
Apovitellenins
Apovitellenins are proteins in yolk LDL, which are all constituents of blood
derived very-low-density lipoprotein (VLDL). The major blood VLDL, apoprotein B
(apo B), which is a 523 kDa protein, very similar to human apoB-100, cleaves into seven
fragments, apovitellenins III – VI, during or after transferring from blood to egg yolk by
cathepsin D or a cathepsin D-like pepstatin A-sensitive protease (Evans & Burley, 1987).
The molecular weights of the seven fragments range from 55 to 190 kDa (Jolivet,
Boulard, Beaumal, Chardot, & Anton, 2006). Another major apovetellenin of egg yolk
LDL is apovitellenin I, which is not derived from apo B (Anton et al., 2003).
Apovitellenin I is a small homodimer linked with disulfide bond. It is present in egg yolk
LDL as a monomer (9 kDa) or homodimer (18 kDa) (Jolivet et al., 2006). All
apovitellenins have neutral isoelectric point (pI = 6.3 – 7.5) (Kojima & Nakamura, 1985)
and contain 40% of hydrophobic amino acids, indicating a highly hydrophobic and
flexible structure (Anton, 2007b). The glycosylation sites of apovitellenins are on
asparaginyl residues. The composition of carbohydrate in apovitellenins is 1.3% hexose,
0.7% hexosamine, and 0.4% sialic acid (Saari, Powrie, & Fennema, 1964).
9
Livetins (serum albumin, IgY, α-glycoprotein)
Livetins are water-soluble, non-lipid, globular glycoproteins in yolk. In 1949,
Shepard and Hottle discovered that livetins are composed of three fractions (Shepard &
Hottle, 1949). Later in 1957, Martin, Vandegaer, and Cook confirmed the three fractions:
α-, β-, and γ-livetins (W. G. Martin, Vandegaer, & Cook, 1957). William further
identified α-, β-, and γ-livetins as serum albumin, α-glycoprotein, and IgY respectively
(Williams, 1962). Serum albumin (α-livetin) is sensitive to high ionic strength and
both α- and β-livetin are vulnerable to organic solvents (Juneja & Kim, 1996).
Livetins are also the most heat sensitive proteins in yolk due to the globular
structure, especially for γ-livetins (Dixon & Cotterill, 1981; Juneja & Kim, 1996;
Woodward & Cotterill, 1983).
Other proteins
Yolk also contains other lipid-binding proteins, including apoliporotein A-I and
apolipoprotein D. In addition, it contains vitamin- and cofactor-binding proteins, e.g.
biotin-binding proteins and vitamin D-binding proteins. In addition, several egg white
proteins have been detected in yolk, which are ovalbumin, ovomucoid, ovotransferrin,
and ovoinhibitor. This is due to: 1) a possible route with receptor-mediated endocytosis,
and 2) the up-to-date breaking technology cannot separate white from yolk completely,
which will be considered later in the “Processing of egg yolk powder” section.
Lipids in egg yolk powder
Egg yolk contains 60% of lipids (dry basis), which accounts for all the lipids in a
whole egg. The function of lipids is to provide metabolic energy for the embryo. In fresh
10
egg, lipids are mostly combined with proteins through non-covalent interactions as in
lipoproteins. However through dehydration processing, some of the lipids are liberated
from the inside core, especially for LDL.
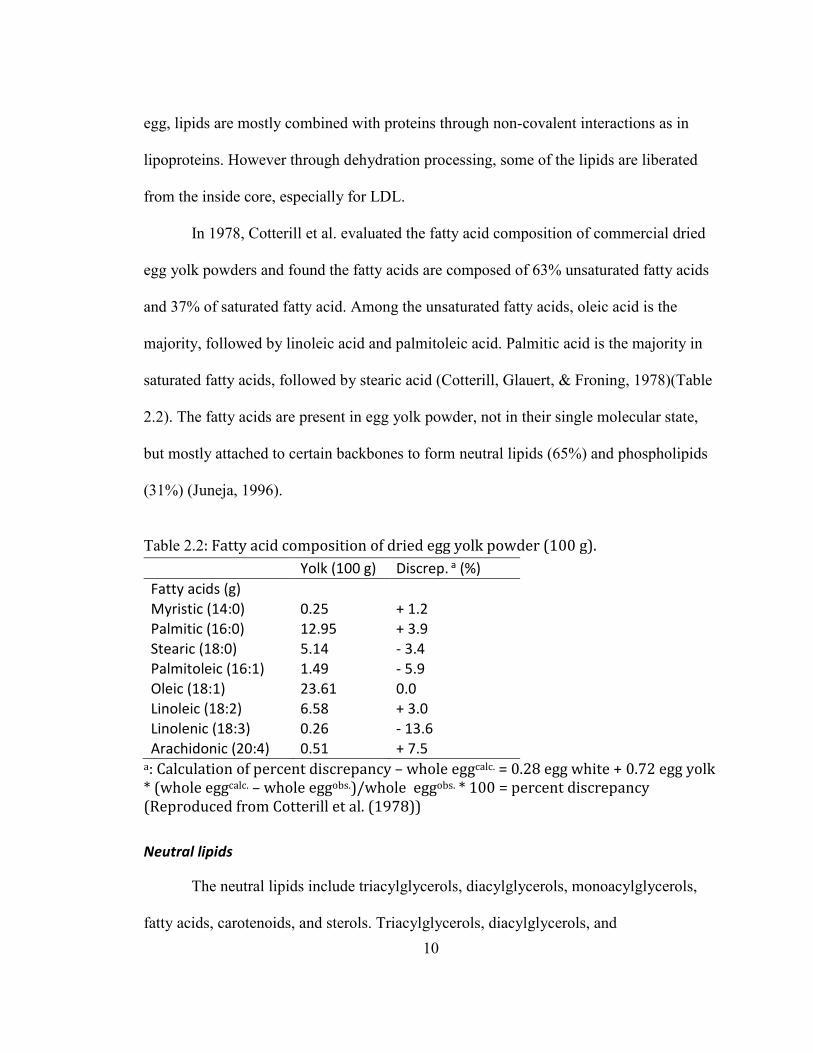
In 1978, Cotterill et al. evaluated the fatty acid composition of commercial dried
egg yolk powders and found the fatty acids are composed of 63% unsaturated fatty acids
and 37% of saturated fatty acid. Among the unsaturated fatty acids, oleic acid is the
majority, followed by linoleic acid and palmitoleic acid. Palmitic acid is the majority in
saturated fatty acids, followed by stearic acid (Cotterill, Glauert, & Froning, 1978)(Table
2.2). The fatty acids are present in egg yolk powder, not in their single molecular state,
but mostly attached to certain backbones to form neutral lipids (65%) and phospholipids
(31%) (Juneja, 1996).
Table 2.2: Fatty acid composition of dried egg yolk powder (100 g).
Yolk (100 g) Discrep. a (%)
Fatty acids (g)
Myristic (14:0) 0.25 + 1.2
Palmitic (16:0) 12.95 + 3.9
Stearic (18:0) 5.14 - 3.4
Palmitoleic (16:1) 1.49 - 5.9
Oleic (18:1) 23.61 0.0
Linoleic (18:2) 6.58 + 3.0
Linolenic (18:3) 0.26 - 13.6
Arachidonic (20:4) 0.51 + 7.5 a: Calculation of percent discrepancy – whole eggcalc. = 0.28 egg white + 0.72 egg yolk
* (whole eggcalc. – whole eggobs.)/whole eggobs. * 100 = percent discrepancy
(Reproduced from Cotterill et al. (1978))
Neutral lipids
The neutral lipids include triacylglycerols, diacylglycerols, monoacylglycerols,
fatty acids, carotenoids, and sterols. Triacylglycerols, diacylglycerols, and
11
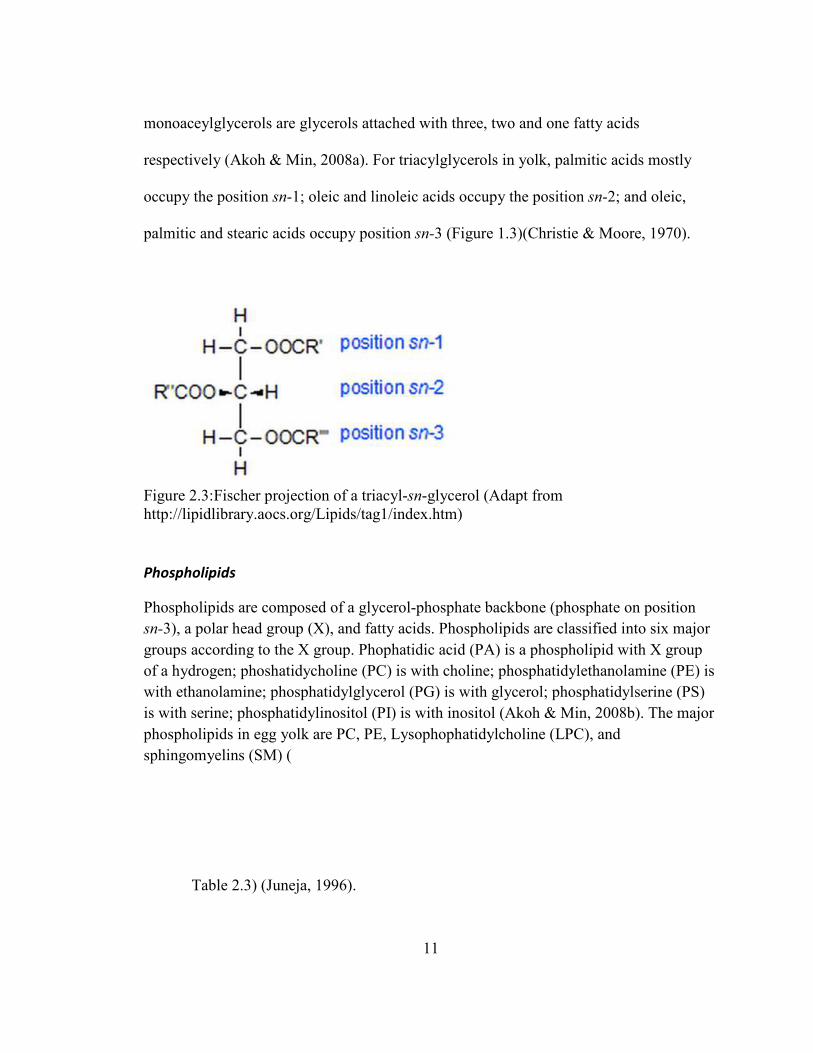
monoaceylglycerols are glycerols attached with three, two and one fatty acids
respectively (Akoh & Min, 2008a). For triacylglycerols in yolk, palmitic acids mostly
occupy the position sn-1; oleic and linoleic acids occupy the position sn-2; and oleic,
palmitic and stearic acids occupy position sn-3 (Figure 1.3)(Christie & Moore, 1970).
Figure 2.3:Fischer projection of a triacyl-sn-glycerol (Adapt from http://lipidlibrary.aocs.org/Lipids/tag1/index.htm)
Phospholipids
Phospholipids are composed of a glycerol-phosphate backbone (phosphate on position
sn-3), a polar head group (X), and fatty acids. Phospholipids are classified into six major
groups according to the X group. Phophatidic acid (PA) is a phospholipid with X group
of a hydrogen; phoshatidycholine (PC) is with choline; phosphatidylethanolamine (PE) is
with ethanolamine; phosphatidylglycerol (PG) is with glycerol; phosphatidylserine (PS)
is with serine; phosphatidylinositol (PI) is with inositol (Akoh & Min, 2008b). The major
phospholipids in egg yolk are PC, PE, Lysophophatidylcholine (LPC), and
sphingomyelins (SM) (
Table 2.3) (Juneja, 1996).
12
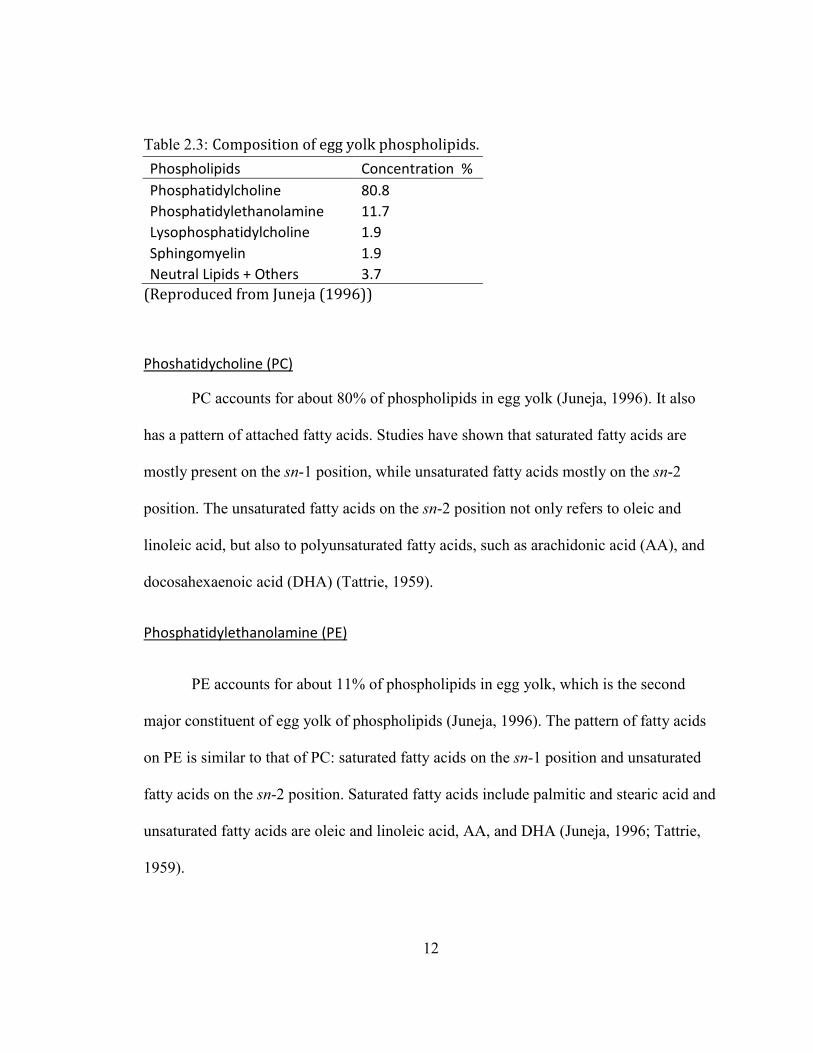
Table 2.3: Composition of egg yolk phospholipids.
Phospholipids Concentration %
Phosphatidylcholine 80.8
Phosphatidylethanolamine 11.7
Lysophosphatidylcholine 1.9
Sphingomyelin 1.9
Neutral Lipids + Others 3.7
(Reproduced from Juneja (1996))
Phoshatidycholine (PC)
PC accounts for about 80% of phospholipids in egg yolk (Juneja, 1996). It also
has a pattern of attached fatty acids. Studies have shown that saturated fatty acids are
mostly present on the sn-1 position, while unsaturated fatty acids mostly on the sn-2
position. The unsaturated fatty acids on the sn-2 position not only refers to oleic and
linoleic acid, but also to polyunsaturated fatty acids, such as arachidonic acid (AA), and
docosahexaenoic acid (DHA) (Tattrie, 1959).
Phosphatidylethanolamine (PE)
PE accounts for about 11% of phospholipids in egg yolk, which is the second
major constituent of egg yolk of phospholipids (Juneja, 1996). The pattern of fatty acids
on PE is similar to that of PC: saturated fatty acids on the sn-1 position and unsaturated
fatty acids on the sn-2 position. Saturated fatty acids include palmitic and stearic acid and
unsaturated fatty acids are oleic and linoleic acid, AA, and DHA (Juneja, 1996; Tattrie,
1959).
13
Lysophosphatidylcholine (LPC)
LPC is a PC that is missing a fatty acid (usually on the sn-2 position). LPC is a
minor component, only accounting for 1.9% of phospholipids in egg yolk (Juneja, 1996).
Sphingomyelins (SM)
SM is composed of a PC polar head group (X), a sphingosine, and a fatty acid
(Akoh & Min, 2008a) and accounts for 1.9% of phospholipids in egg yolk (Juneja, 1996).
The fatty acids of SM are usually composed of medium chain length fatty acids, e.g.
palmitic acid. Therefore, palmitoylsphingosine is the major constituent of SM in egg yolk
(Connelly & Kuksis, 1983; Do, Pei, & Minard, 1981).
Cholesterol
Cholesterol is the main sterol in egg yolk. Unlike fatty acids, all cholesterols exist
in their free form and are trapped within LDL and HDL. The cholesterol content in yolk
varies due to different measurement approaches. As early as 1962, a study evaluated the
total cholesterol content in yolk using the Thin Layer Chromatography (TLC) technique.
They found that cholesterol accounted for 5.2% (15 mg/g liquid yolk) of yolk lipids
(Privett, Blank, & Schmit, 1962). Then another study used high-performance
chromatography (HPLC) to measure the total cholesterol and found a lower content
(10.97 mg/g liquid yolk) compared with TLC method, which has been considered more
accurate (Beyer & Jensen, 1989). Other studies agreed with the lower cholesterol content
result since they obtained similar results when using other techniques (on-column
capillary gas chromatography and supercritical carbon dioxide extraction) (Dyer-Hurdon
& Nnanna, 1993; Fenton & Sim, 1991; R. Sun, Sivik, & Larsson, 1995). However, the
14
cholesterol content in yolk is dependent on the feed of the chicken. Studies have shown
that feeding dietary fiber and probiotics could help reduce the cholesterol content in yolk
(Kurtoglu*, Kurtoglu, & Seker, 2004; McNaughton, 1978). But the change is slight.
Carotenoids
Carotenoids are organic pigments, which contribute to the yellow-orange color of
egg yolk. Since carotenoids cannot be produced by animals, it is obtained through the
pigmented feeding ingredients including yellow corn, alfalfa, and corn gluten meal
(Brockman & Volker, 1934; Gillam & Heilbron, 1935; Smith & Perdue, 1966).
Therefore, the content of carotenoids is largely dependent on the feed ingredients.
Carotenoids have two classes: xanthophylls and carotenes. Xanthophylls are the major
constituents of carotenoids in yolk, which can be further divided into lutein, zeaxanthin,
and cryptoxanthin. Lutein is the dominant xanthophylls in yolk, followed by zeaxanthin
(Stadelman & Cotterill, 1973).
Nutritional value of egg yolk powder
Eggs have been an important and valuable source of food since prehistory.
Chicken eggs were consumed as food in Asia and India before 7500 BCE and brought to
Sumer, Egypt and other places of the world afterwards (Stadelman, 1995). Nowadays,
eggs are still considered to have great nutritional value because they are a rich source of
protein, unsaturated fatty acids, iron, phosphorus, trace minerals, and various vitamins
(Watkins, 1995).
15
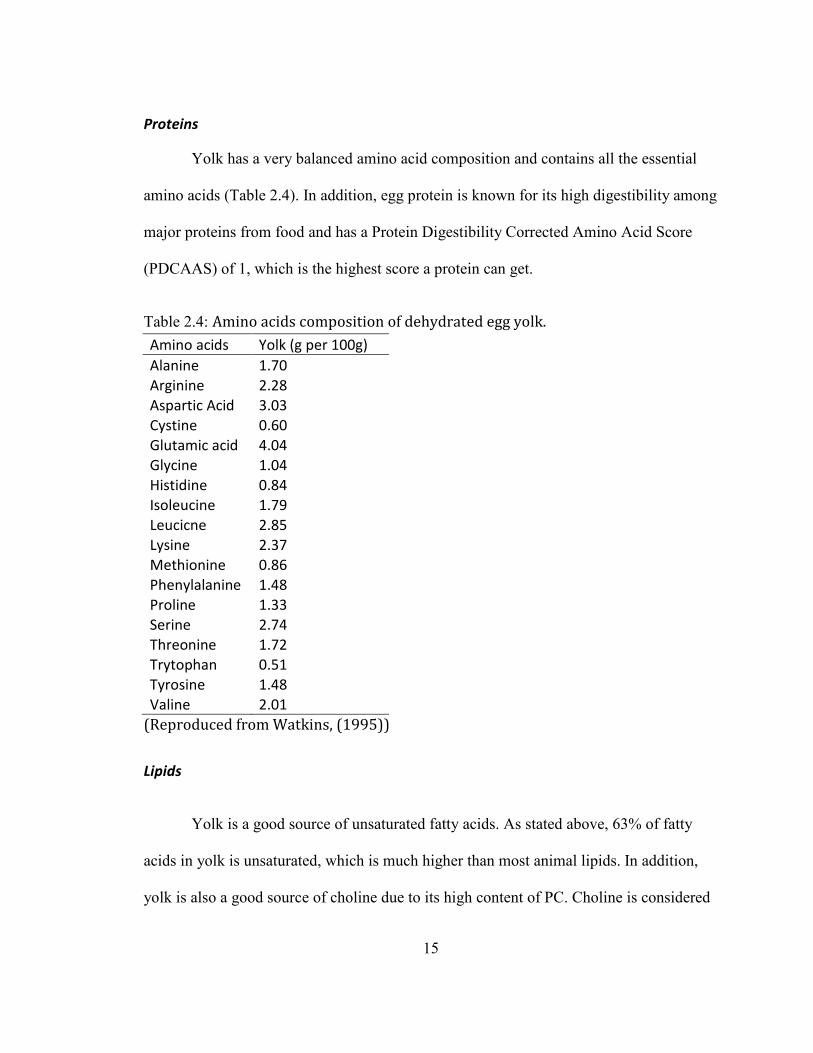
Proteins
Yolk has a very balanced amino acid composition and contains all the essential
amino acids (Table 2.4). In addition, egg protein is known for its high digestibility among
major proteins from food and has a Protein Digestibility Corrected Amino Acid Score
(PDCAAS) of 1, which is the highest score a protein can get.
Table 2.4: Amino acids composition of dehydrated egg yolk.
Amino acids Yolk (g per 100g)
Alanine 1.70
Arginine 2.28
Aspartic Acid 3.03
Cystine 0.60
Glutamic acid 4.04
Glycine 1.04
Histidine 0.84
Isoleucine 1.79
Leucicne 2.85
Lysine 2.37
Methionine 0.86
Phenylalanine 1.48
Proline 1.33
Serine 2.74
Threonine 1.72
Trytophan 0.51
Tyrosine 1.48
Valine 2.01
(Reproduced from Watkins, (1995))
Lipids
Yolk is a good source of unsaturated fatty acids. As stated above, 63% of fatty
acids in yolk is unsaturated, which is much higher than most animal lipids. In addition,
yolk is also a good source of choline due to its high content of PC. Choline is considered
16
good for brain development, liver function, and cancer prevention (Woodbury &
Woodbury, 1993; Zeisel, 1992).
Except for the good, healthy fatty acids, yolk is also rich in cholesterol, which has
been considered a not healthy part of the diet. Research evaluating the relationship
between dietary cholesterol and several human diseases has been controversial (Hu et al.,
2012; McNamara, 2014). For example a great number of animal experiments,
epidemiological surveys, and clinical interventions did not find a direct correlational
relationship between dietary cholesterol and human disease such as heart disease,
cardiovascular disease (Fernandez & Webb, 2008; Fernandez, Wilson, Conde, Vergara-
Jimenez, & Nicolosi, 1999; Herron et al., 2002; Kritchevsky & Kritchevsky, 2000; Lee &
Griffin, 2006). Some studies also found that dietary fat intake had a more significant
affect in increasing the blood cholesterol content, especially dietary saturated fat intake
(Moore, 1989). This indicates that eggs are healthier when compared with other animal
fats in terms of dietary saturated fat. But researchers do suggest limiting the consumption
of eggs for patients at risk of cardiovascular disease (Spence, Jenkins, & Davignon, 2010)
and for older people in their 70s (Houston et al., 2011), because the cholesterol content in
one fresh egg is 275 mg, which is more than the recommended daily intake value (200
mg/day).
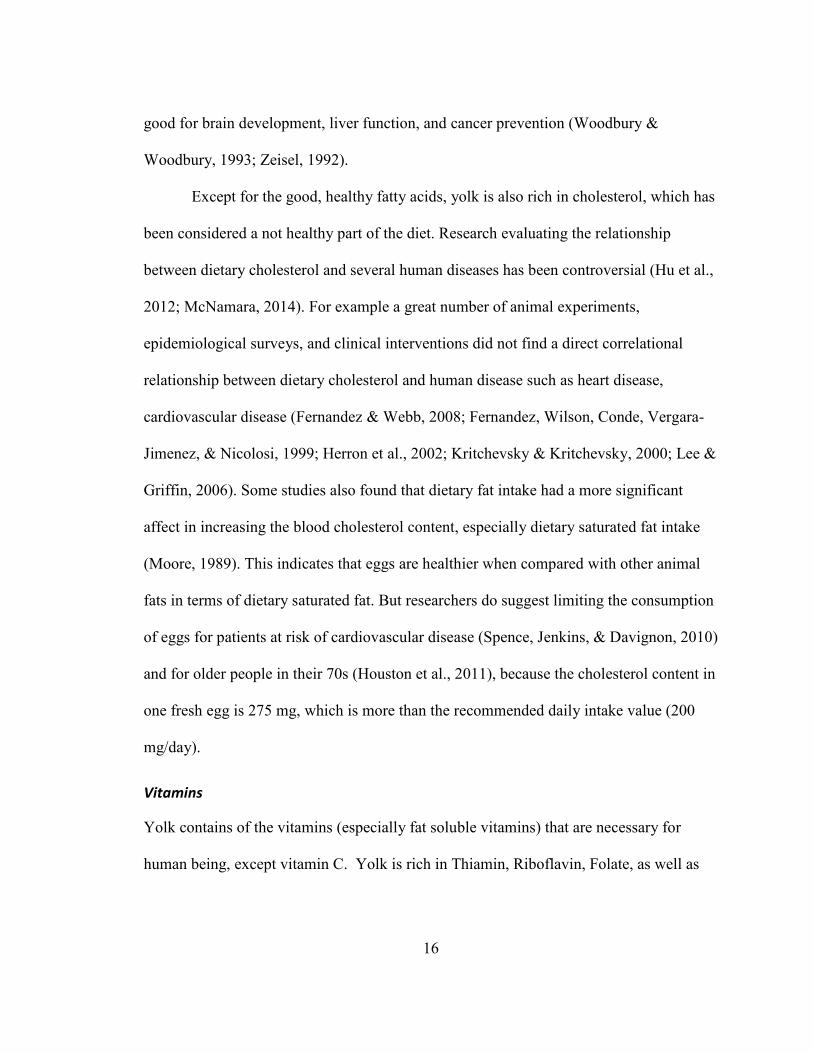
Vitamins
Yolk contains of the vitamins (especially fat soluble vitamins) that are necessary for
human being, except vitamin C. Yolk is rich in Thiamin, Riboflavin, Folate, as well as
17
Vitamin B-6, B-12, A, E, and D (Table 1.5). It has all the nutrients simply because they
are all necessary for the development of the embryo.
Table 2.5: Vitamins in egg yolk with Recommended Daily Intake (RDI) based on a
2,000 calorie diet (Stadelman & Cotterill, 1973).
Vitamins Unit Value per 100 g RDI
Vitamin C, total ascorbic acid mg 0 60
Thiamin mg 0.4 1.5
Riboflavin mg 1.2 1.7
Niacin mg 0.1 20
Vitamin B-6 mg 0.8 1.7
Folate, DFE µg 209 400
Vitamin B-12 µg 6 6
Vitamin A, RAE µg 785 900
Vitamin E (alpha-tocopherol) mg 4.8 15 (Tocopherol)
Vitamin D (D2 + D3) µg 11.4 10 (D3)
Vitamin K (phylloquinone) µg 1.5 80
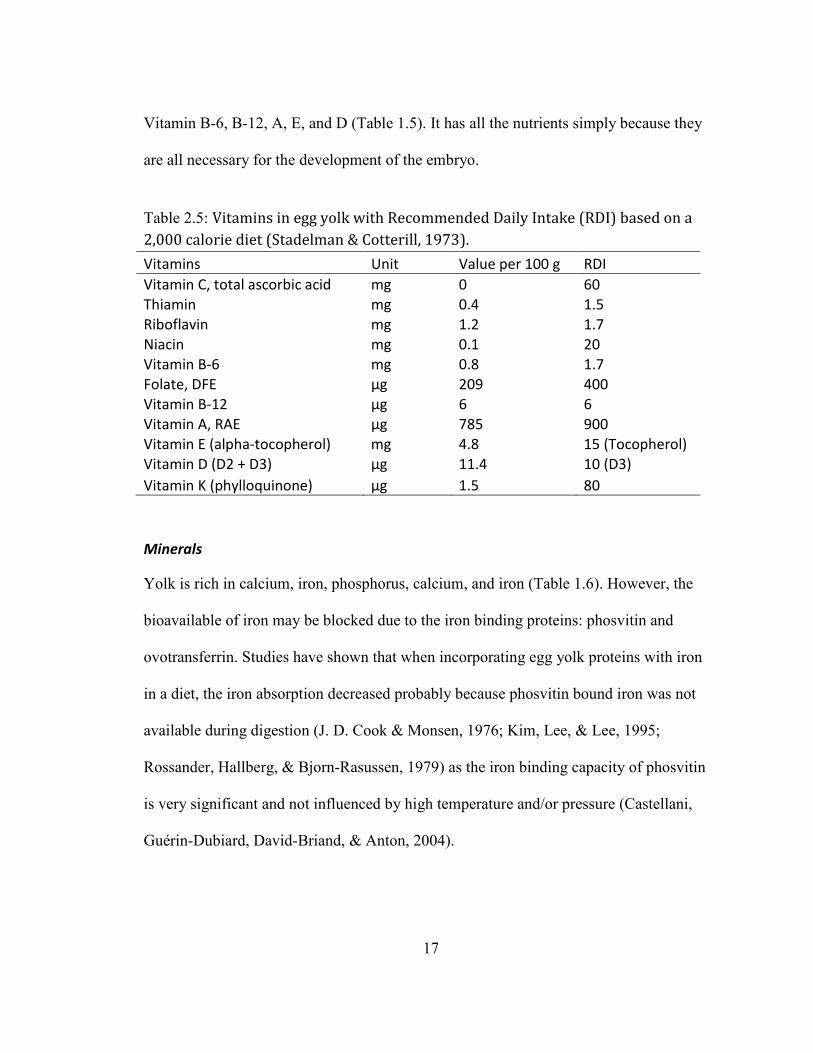
Minerals
Yolk is rich in calcium, iron, phosphorus, calcium, and iron (Table 1.6). However, the
bioavailable of iron may be blocked due to the iron binding proteins: phosvitin and
ovotransferrin. Studies have shown that when incorporating egg yolk proteins with iron
in a diet, the iron absorption decreased probably because phosvitin bound iron was not
available during digestion (J. D. Cook & Monsen, 1976; Kim, Lee, & Lee, 1995;
Rossander, Hallberg, & Bjorn-Rasussen, 1979) as the iron binding capacity of phosvitin
is very significant and not influenced by high temperature and/or pressure (Castellani,
Guérin-Dubiard, David-Briand, & Anton, 2004).
18
Table 2.6: Minerals in egg yolk with Recommended Daily Intake (RDI) based on a
2,000 calorie diet (Stadelman & Cotterill, 1973).
Minerals Unit Value per 100 g RDI
Calcium, Ca mg 307 1000
Iron, Fe mg 9.5 18
Magnesium, Mg mg 26 400
Phosphorus, P mg 1040 1000
Potassium, K mg 264 3500
Sodium, Na mg 163 2400
Zinc, Zn mg 7.7 15
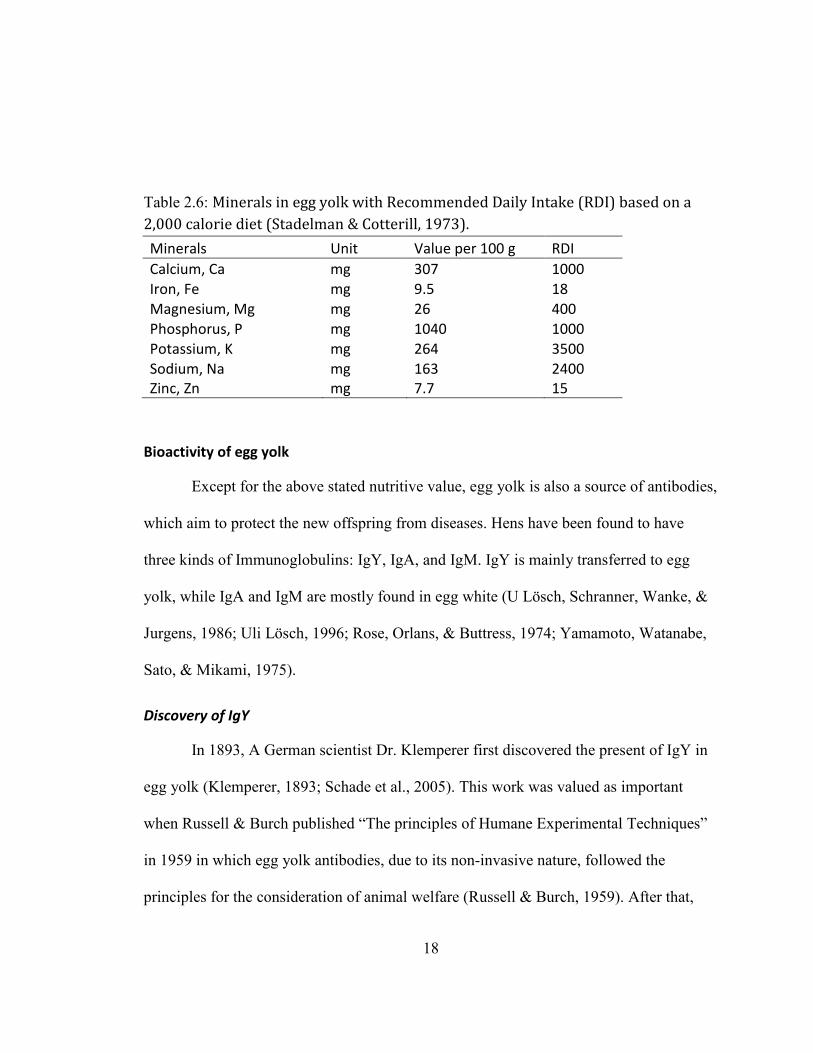
Bioactivity of egg yolk
Except for the above stated nutritive value, egg yolk is also a source of antibodies,
which aim to protect the new offspring from diseases. Hens have been found to have
three kinds of Immunoglobulins: IgY, IgA, and IgM. IgY is mainly transferred to egg
yolk, while IgA and IgM are mostly found in egg white (U Lösch, Schranner, Wanke, &
Jurgens, 1986; Uli Lösch, 1996; Rose, Orlans, & Buttress, 1974; Yamamoto, Watanabe,
Sato, & Mikami, 1975).
Discovery of IgY
In 1893, A German scientist Dr. Klemperer first discovered the present of IgY in
egg yolk (Klemperer, 1893; Schade et al., 2005). This work was valued as important
when Russell & Burch published “The principles of Humane Experimental Techniques”
in 1959 in which egg yolk antibodies, due to its non-invasive nature, followed the
principles for the consideration of animal welfare (Russell & Burch, 1959). After that,
19
IgY has been intensively studied during production, extraction and purification as well as
clinical needed application into many fields including diagnosis, therapy and prophylaxis
(Schade et al., 2005).
Production of Ig
IgY (also known as γ-livetin) is composed of two light and two heavy chains with
a molecular weight of about 167 kDa. The isoelectric point (pI) of IgY is between 5.7 and
7.6 (S. Sun, Mo, Ji, & Liu, 2001). It is transferred to yolk through receptor-mediated
processes as the receptor is located on the surface of the yolk membrane (Mohammed et
al., 1998; Morrison, Mohammed, Wims, Trinh, & Etches, 2002). Therefore, the
production of IgY is mainly in the egg yolk. Some studies evaluating the effect of
chicken environmental conditions (in cage vs free range) on production of IgY, found
that the IgY concentration was higher in eggs laid by chickens kept in cages (Erhard,
Ozpinar, & Bilal, 1999).
Specific antibodies can be produced through immunization of the chicken; even
though the results are unpredictable due to four main variables: the antigen, the adjuvant,
the route of application, and the chicken (Schade et al., 1996, 2005). The concentration of
IgY can reach to 15-25 mg/ml yolk, which is 18 times higher than that produced from
rabbits (Juneja, 1996).
Extraction and Purification of IgY
IgY is pH and heat sensitive. IgY will lose its activity in acid environment
(pH = 3 and 4) (Hatta, Tsuda, Akachi, Kim, & Yamamoto, 1993; Schade et al., 1996;
Shimizu et al., 1992) and will be denatured above 70°C (Hatta et al., 1993; Jaradat &
20
Marquardt, 2000; Shimizu et al., 1992). Therefore, the extraction condition should be
mild in case of reduction of destroying the structure of IgY. Many approaches can be
applied in extraction and purification of IgY from yolk and can be categorized into three
groups: precipitation, chromatographic, and filtration methods (Meulenaer &
Huyghebaert, 2001; Schade et al., 2005).
The first step is to separate egg yolk from egg white, which can be done manually
or using an egg-breaking machine. However, the yolk can be easily contaminated with 20%
egg white when using the machine, which makes the further extraction and purification
steps difficult (Fichtali, Charter, Lo, & Nakai, 1992).
Extraction
The crude extraction of IgY from lipoproteins can be mostly achieved through
precipitation methods using various solvents. After this, IgY and other soluble proteins
are left in the water-soluble fraction.
The simplest method to extract IgY from yolk is the water dilution method. When
diluting yolk with water (10-fold), the low ionic strength helps separate IgY from lipids.
The results would be better if incorporating pH adjustment (pH 5) and/or a freeze/thaw
process. However, the drawback of this method is the loss of IgY in the water-soluble
fraction (Jensenius, Andersen, Hau, Crone, & Koch, 1981; Kwan, Li‐Chan, Helbig, &
Nakai, 1991).
A more broadly used method for extraction of IgY from yolk is the
polyethyleneglycol (PEG) precipitation method. Through adjusting the PEG
21
concentration in different steps, IgY with concentration of 6 -12 mg/ml is yield (Polson,
von Wechmar, & Van Regenmortel, 1980).
Other precipitation substances include natural gums (xanthan and carrageenan)
(Hatta, Kim, & Yamamoto, 1990), anionic polysaccharides (H. M. Chang, Lu, Chen, Tu,
& Hwang, 2000), acetone (Bade & Stegemann, 1984), and chloroform (Ntakarutimana,
Demedts, Van Sande, & Scharpe, 1992).
Purification
Purification methods include precipitation, chromatographic, and filtration
methods. Salt precipitation is a traditional method to purify IgY from the water-soluble
fraction. The mechanism is to use salt or organic solution to change the environment to
precipitate other proteins in the water-soluble fraction and leave IgY in the soluble
fraction. The salt and organic solvent used in purification is similar with that used in
extraction (Meulenaer & Huyghebaert, 2001).
Chromatographic methods are applied to separate IgY from other proteins based
on their different affinity to different kinds of columns. However, the cost of this method
is more expensive compared with others, thus may not be applied in large scale in an
industrial environment, but more suitable for laboratory environment.
Filtration methods have a potential to be applied in large-scale industrial
environment due to the low cost, high recoveries (72 - 89%) and purity (74 - 99%). These
methods include funnel filtration, diafiltration, columnfiltration, and ultrafiltration.
22
General Application of use of IgY
The commercial use of IgY is very broad in the diagnostic and therapeutic field
due to its manifold antigen-binding specificity (Schade, 2001). It is able to qualify and
quantify certain substances, such as proteins and peptides, when incorporated into
diagnostic assays (Kovacs-Nolan, Mine, Immerseel, Nys, & Bain, 2011). Similar to IgG,
it can be used for detection of certain proteins and peptides (Schade et al., 2005) and even
cancer biomarkers (Xiao & Gao, 2010). Its above-mentioned advantages provide a huge
potential to replace IgG in diagnostic area. In addition, it can be also used in
immunotherapy to protect human from lung and gastrointestinal infections due to its
ability to block and/or inhibit the pathogens, bacterial and virus (Mine & Kovacs-Nolan,
2002). It takes a passive immune approach, which is very effective in reducing bacterial
and virus in vivo animal studies and clinical trials (Kollberg et al., 2003; Krüger et al.,
2003; Sarker et al., 2001). For example, it can neutralize toxins (Pauly et al., 2009) and
treat snakebites (Almeida et al., 1998; Araújo, Lobato, Chavez-Olortegui, & Velarde,
2010; de Almeida et al., 2008; Meenatchisundaram, Parameswari, Michael, &
Ramalingam, 2008a, 2008b; Paul et al., 2007). IgY is mostly administrated through the
oral path, therefore, adding IgY as a function ingredient into food and/or diets is more
likely to be a good approach to reduce/prevent the risk of several infectious diseases. But
IgY is vulnerable to acid and high temperature environment (as mentioned above); its
application in food, particularly processed food products may be limited.
Functionality of egg yolk powder
23
The main functionalities of egg yolk are emulsion formation and gelation ability,
which gain yolk as a broad application in food products including mayonnaise, salad
dressing, and bakery products. These functionalities are associated with structures of
certain components in yolk, which will be stated in detail in the following two sections.
Emulsion ability
Egg yolk itself is an oil-in-water (o/w) emulsion and it can be used in foods like
mayonnaise and salad dressing to perform as an emulsifying agent (S.-C. Yang &
Baldwin, 1995). The mechanism of egg yolk as emulsifier is that it can absorb at the o/w
interfaces and form a film around the oil phase to prevent oil droplets from coalescence.
It stabilizes the emulsion system through reducing the interfacial tension between the two
phases.
The major components in egg yolk contributing to the formation of an emulsion
have been extensively studied. As early as 1935, scientists found that the lecithoproteins
were the key to a good emulsion (Sell, Olsen, & Kremers, 1935). Chapin then found
proteins and lipoproteins in yolk were the main components in terms of emulsion
formation (Chapin, 1951), especially lipoproteins and phosvitins, because of their
amphipholic state which provides for a better ability to absorb at the interface . The main
component of emulsion formation is also dependent on the emulsion environment. With
different pH, the proteins absorbed at the interfaces are different. Under acidic
environment, more plasma proteins, LDL, would be detected at the interface; whereas
under neutral pH, the proteins at the interface were composed of 48% plasma protein and
52% granule proteins (Anton, 2013). Another study also showed that after the removal of
24
livetins, the emulsion is more vulnerable to coalescence, even though the sizes of oil
droplets and the emulsion capacity is similar (Navidghasemizad, Temelli, & Wu, 2014).
In conclusion, every component of egg yolk works together to provide a stable emulsion.
Lipoprotein may be the most important part but other proteins also involve in as a support
to enhance the emulsion stability and activity, which is indirectly approved by a recent
study finding that even though the egg yolk proteins had not been detected at the
interfaces, the emulsion stability was still improved with egg yolk present in emulsion
continuous phase, which resulted in the “intensification of interdroplet interaction
effects” (Nikiforidis, Biliaderis, & Kiosseoglou, 2012).
Several approaches can be applied to improve egg yolk emulsion stability through
modification of the components in egg yolk or adding salts (S. Yang & Cotterill, 1989).
For example, enzymatic modification, which converts PC into phosphatidic acid (PA),
can enhance the emulsion’s thermal stability (Buxmann et al., 2010). However, some
manufacturing process can decrease the emulsion capacity such as the drying process,
because during drying, the structure of lipoprotein has been disrupted with releasing of
triglycerides and cholesterol (Funk & Zabik, 1971). However, the drying process did not
prevent dried egg yolk from still being used as a good emulsifier. Moros et al. studied the
emulsion formed using spray-dried egg yolk and found it can form a stable emulsion as
long as it is at the optimized concentration (Moros, Franco, & Gallegos, 2002).
Gelation ability
Gelation is a process in which heat induced denatured proteins interact with each
other and gradually form a cross-linking network with development of a hard and rubbery
25
structure (A Paraskevopoulou & Kiosseoglou, 1997). Egg yolk gelation, due to its unique
structure, can be applied into various food products including sauces, creams, and bakery
products (Kiosseoglou, 2003). The main components in terms of gelation of egg yolk are
apolipoproteins of LDL, due to their more labile nature and sensitivity to heat treatment
(Anton, Le Denmat, Beaumal, & Pilet, 2001; Denmat, Anton, & Gandemer, 1999). The
spray drying process, as it is similar to the heat treatment of gel formation, may also be
able to denature proteins and lipoproteins in yolk, which then forms a weak gel.
Egg yolk gel stability is also influenced by its lipids since lipids have been found
involved in the gel structure formation (Adamantini, KIiosseoglou, Alevisopoulos, &
Kasapis, 2000). This is mostly like because the formation of protein-lipid complex,
therefore, the gel network is not only with protein-protein cross-linking, but also
incorporate protein-lipid polymerization.
Processing of egg yolk powder
The processing of egg yolk powder begins with receiving shell eggs. The shell
eggs are then stored under refrigeration temperature (≤ 41°F) before further processing.
The next step is to wash and sanitize the shell egg surface. Alkaline detergents (pH = 11)
are used to wash away all the adhering materials on shells and chlorinated water is
sprayed to sanitize the shell eggs. After that, the shell eggs go through candling, which is
a step to look inside the egg without breaking it to determine its quality. If blood spots are
observed, the egg is rejected. Then the shell eggs are separated to white, yolk, and shells
using breaking machines. However, even the up-to-date breaking machine cannot
separate the yolk from white completely, thus the separated yolk liquid still contains up
26
to 20% residual white liquid (Fichtali et al., 1992; Meulenaer & Huyghebaert, 2001) as
mentioned above in the “Extraction and Purification of IgY”. After breaking, yolk liquid
is de-sugared first before further processing. De-sugaring is conducted through adding a
glucose-oxidase-catalase enzyme system. However it cannot remove all the glucose from
the yolk liquid. Up to 1.8% of glucose (dry basis) may be present in egg yolk powder.
The yolk liquid then goes through a homogenization process to obtain a uniform mixture,
which can be effectively pasteurized. Pasteurization conditions for yolk liquid are 61.1°C
for 3.5 min or 60.0°C for 6.2 min. This was determined based on the effectiveness of
eliminating salmonella (6 log cycle kill) and maintain functional properties. Spray drying
is the predominate method for drying egg products (Goresline & Hayes, 1951). For dried
egg yolk powder, the spray drying condition is at inlet temperature of 185°C at 21.4 MPa.
After spray drying, the dried egg yolk powders are stored in a cool environment
(< 21.1°C) (Figure 1.3). The shelf life of unopened egg yolk powder storage at a cool
environment is approximately one year.
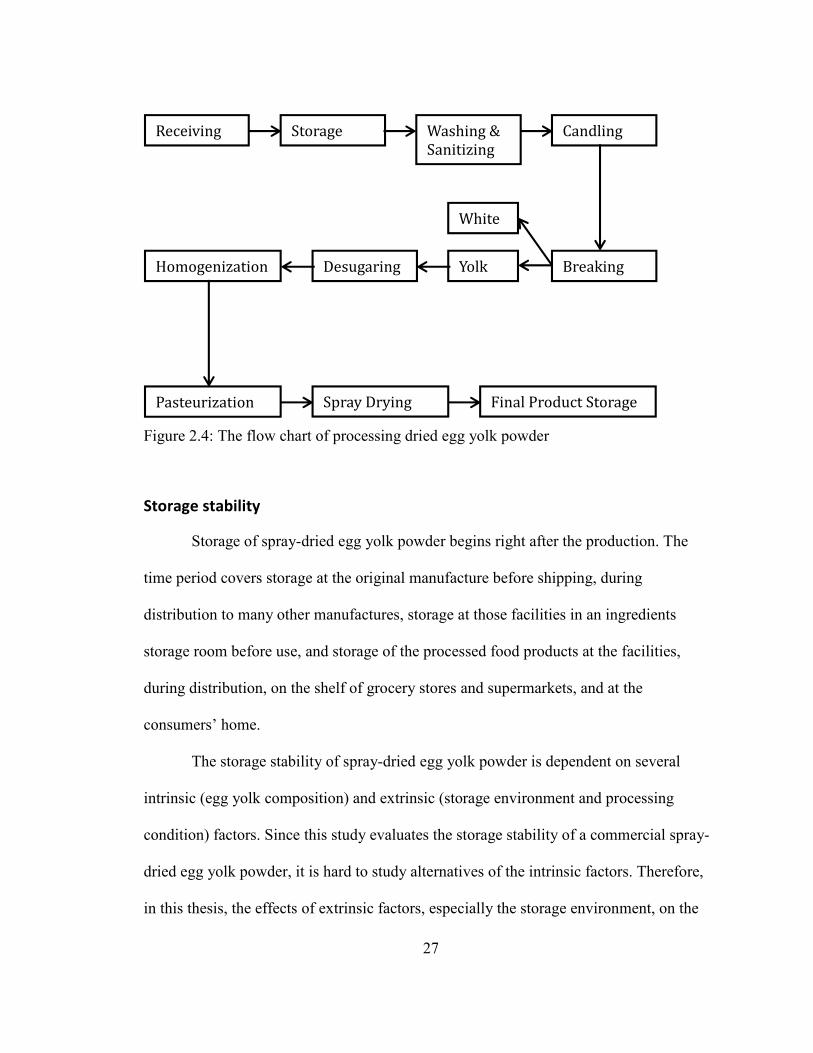
27
Figure 2.4: The flow chart of processing dried egg yolk powder
Storage stability
Storage of spray-dried egg yolk powder begins right after the production. The
time period covers storage at the original manufacture before shipping, during
distribution to many other manufactures, storage at those facilities in an ingredients
storage room before use, and storage of the processed food products at the facilities,
during distribution, on the shelf of grocery stores and supermarkets, and at the
consumers’ home.
The storage stability of spray-dried egg yolk powder is dependent on several
intrinsic (egg yolk composition) and extrinsic (storage environment and processing
condition) factors. Since this study evaluates the storage stability of a commercial spray-
dried egg yolk powder, it is hard to study alternatives of the intrinsic factors. Therefore,
in this thesis, the effects of extrinsic factors, especially the storage environment, on the
Receiving Storage Washing &
Sanitizing
Candling
Breaking Yolk
White
Desugaring Homogenization
Pasteurization Spray Drying Final Product Storage
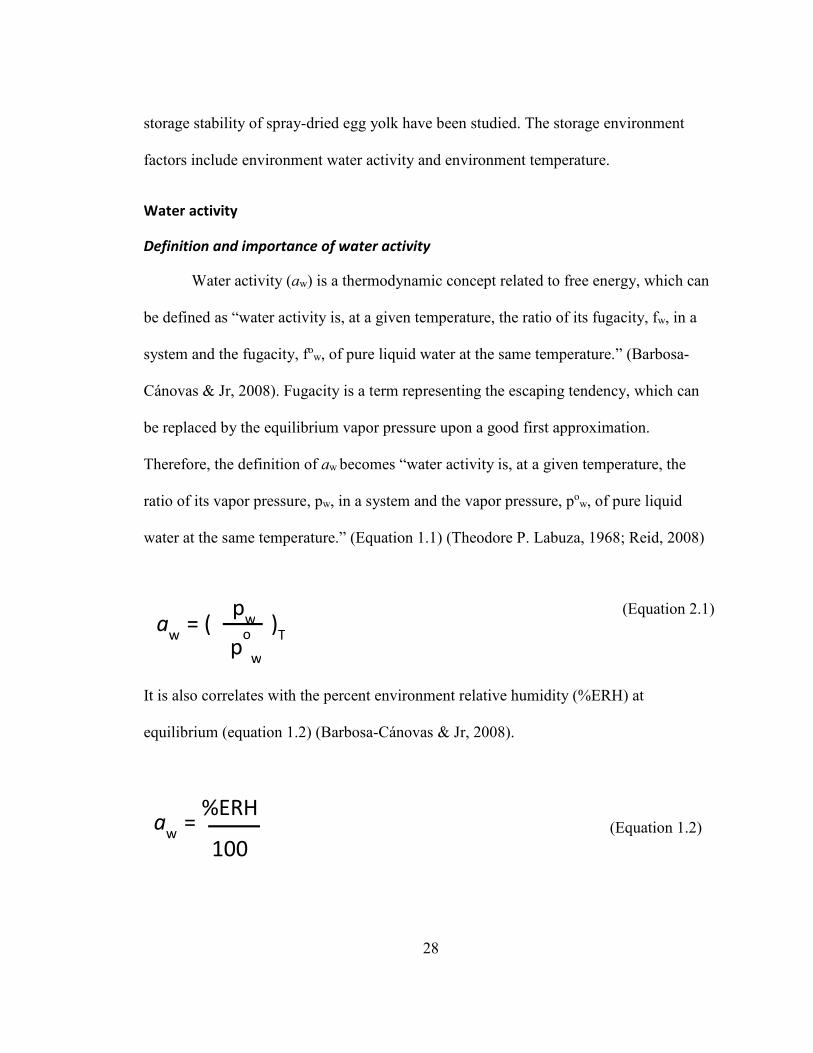
28
storage stability of spray-dried egg yolk have been studied. The storage environment
factors include environment water activity and environment temperature.
Water activity
Definition and importance of water activity
Water activity (aw) is a thermodynamic concept related to free energy, which can
be defined as “water activity is, at a given temperature, the ratio of its fugacity, fw, in a
system and the fugacity, fow, of pure liquid water at the same temperature.” (Barbosa-
Cánovas & Jr, 2008). Fugacity is a term representing the escaping tendency, which can
be replaced by the equilibrium vapor pressure upon a good first approximation.
Therefore, the definition of aw becomes “water activity is, at a given temperature, the
ratio of its vapor pressure, pw, in a system and the vapor pressure, pow, of pure liquid
water at the same temperature.” (Equation 1.1) (Theodore P. Labuza, 1968; Reid, 2008)
(Equation 2.1)
It is also correlates with the percent environment relative humidity (%ERH) at
equilibrium (equation 1.2) (Barbosa-Cánovas & Jr, 2008).
(Equation 1.2) aw
= %ERH
100
aw
= ( )T
p
w
po
w
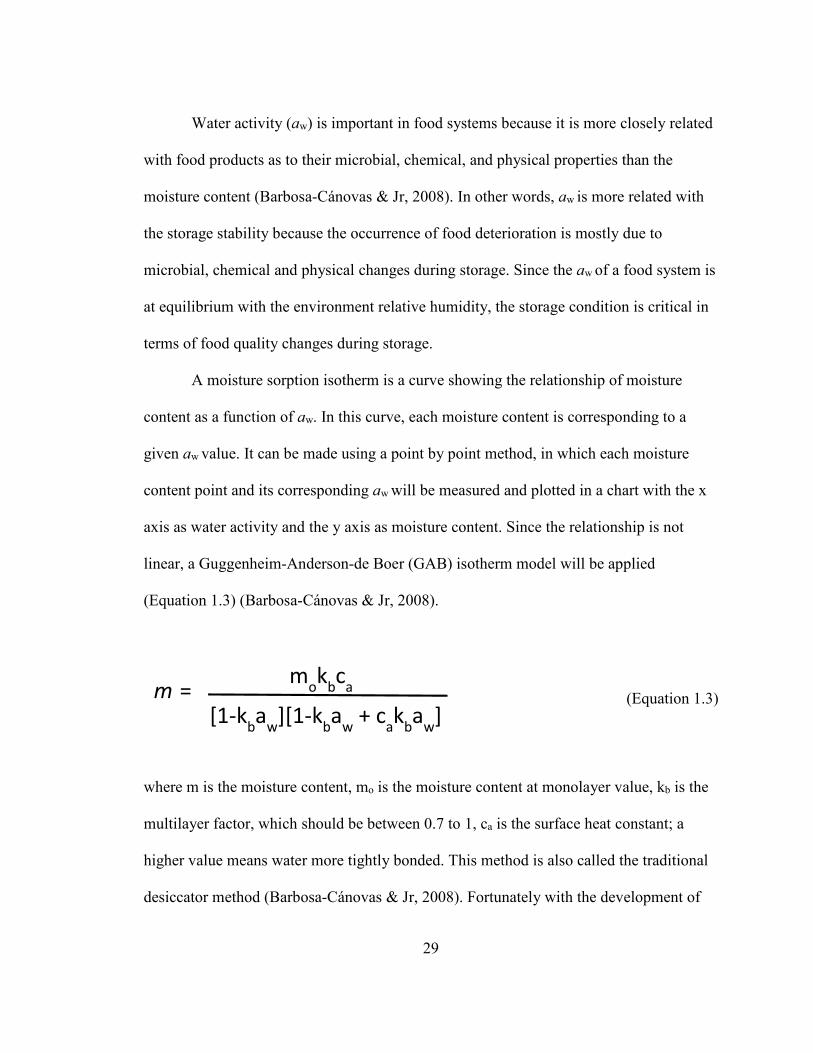
29
Water activity (aw) is important in food systems because it is more closely related
with food products as to their microbial, chemical, and physical properties than the
moisture content (Barbosa-Cánovas & Jr, 2008). In other words, aw is more related with
the storage stability because the occurrence of food deterioration is mostly due to
microbial, chemical and physical changes during storage. Since the aw of a food system is
at equilibrium with the environment relative humidity, the storage condition is critical in
terms of food quality changes during storage.
A moisture sorption isotherm is a curve showing the relationship of moisture
content as a function of aw. In this curve, each moisture content is corresponding to a
given aw value. It can be made using a point by point method, in which each moisture
content point and its corresponding aw will be measured and plotted in a chart with the x
axis as water activity and the y axis as moisture content. Since the relationship is not
linear, a Guggenheim-Anderson-de Boer (GAB) isotherm model will be applied
(Equation 1.3) (Barbosa-Cánovas & Jr, 2008).
where m is the moisture content, mo is the moisture content at monolayer value, kb is the
multilayer factor, which should be between 0.7 to 1, ca is the surface heat constant; a
higher value means water more tightly bonded. This method is also called the traditional
desiccator method (Barbosa-Cánovas & Jr, 2008). Fortunately with the development of
(Equation 1.3) m =
mok
bc
a
[1-kba
w][1-k
ba
w + c
ak
ba
w]
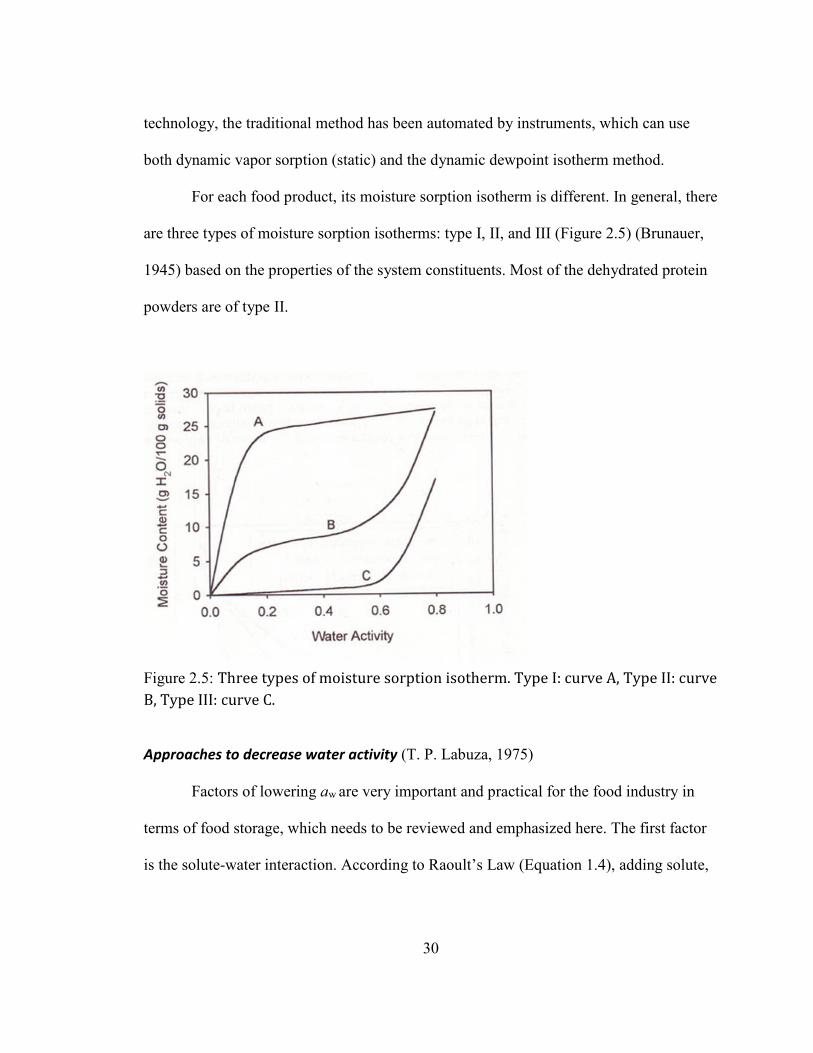
30
technology, the traditional method has been automated by instruments, which can use
both dynamic vapor sorption (static) and the dynamic dewpoint isotherm method.
For each food product, its moisture sorption isotherm is different. In general, there
are three types of moisture sorption isotherms: type I, II, and III (Figure 2.5) (Brunauer,
1945) based on the properties of the system constituents. Most of the dehydrated protein
powders are of type II.
Figure 2.5: Three types of moisture sorption isotherm. Type I: curve A, Type II: curve
B, Type III: curve C.
Approaches to decrease water activity (T. P. Labuza, 1975)
Factors of lowering aw are very important and practical for the food industry in
terms of food storage, which needs to be reviewed and emphasized here. The first factor
is the solute-water interaction. According to Raoult’s Law (Equation 1.4), adding solute,
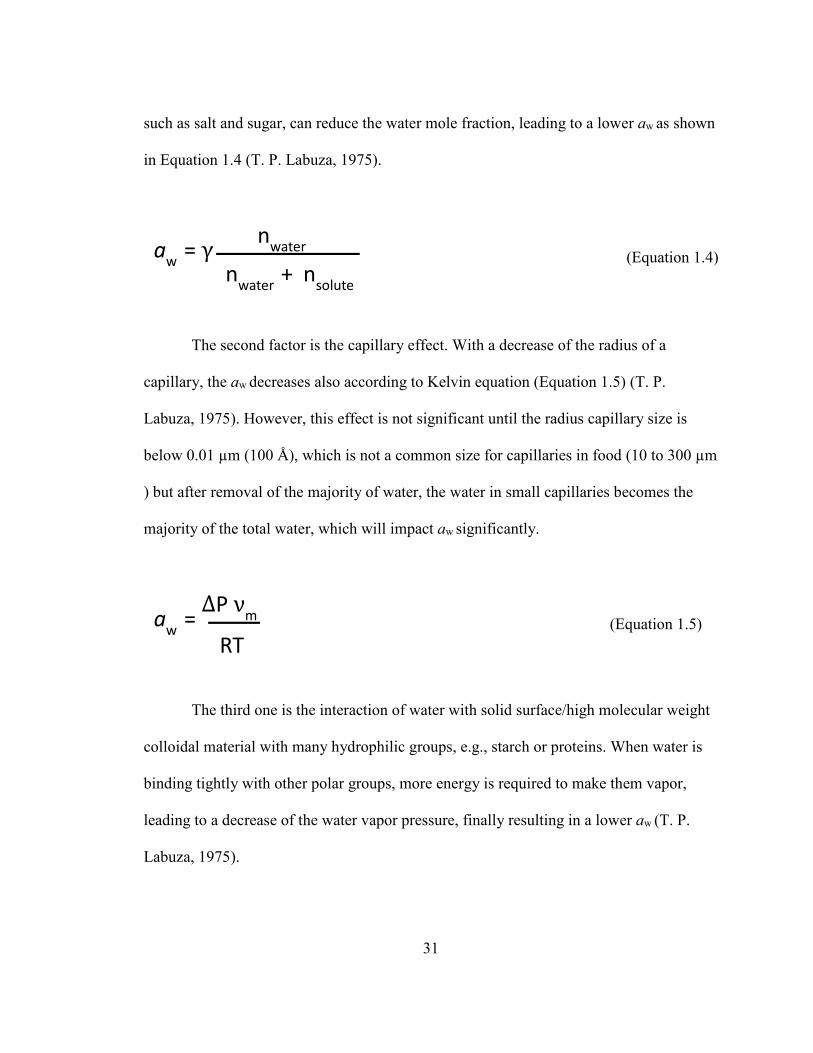
31
such as salt and sugar, can reduce the water mole fraction, leading to a lower aw as shown
in Equation 1.4 (T. P. Labuza, 1975).
The second factor is the capillary effect. With a decrease of the radius of a
capillary, the aw decreases also according to Kelvin equation (Equation 1.5) (T. P.
Labuza, 1975). However, this effect is not significant until the radius capillary size is
below 0.01 µm (100 Å), which is not a common size for capillaries in food (10 to 300 µm
) but after removal of the majority of water, the water in small capillaries becomes the
majority of the total water, which will impact aw significantly.
The third one is the interaction of water with solid surface/high molecular weight
colloidal material with many hydrophilic groups, e.g., starch or proteins. When water is
binding tightly with other polar groups, more energy is required to make them vapor,
leading to a decrease of the water vapor pressure, finally resulting in a lower aw (T. P.
Labuza, 1975).
(Equation 1.4)
(Equation 1.5)
aw
= γ n
water
nwater
+ n
solute
aw
= ΔP ν
m
RT
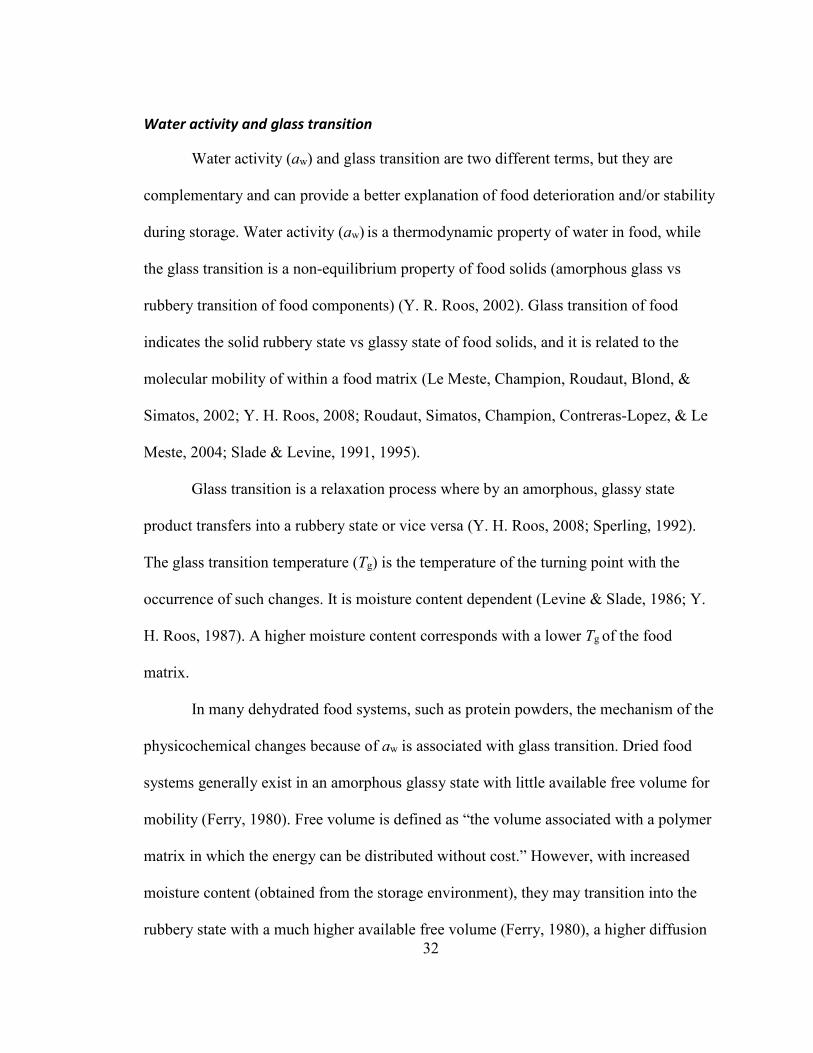
32
Water activity and glass transition
Water activity (aw) and glass transition are two different terms, but they are
complementary and can provide a better explanation of food deterioration and/or stability
during storage. Water activity (aw) is a thermodynamic property of water in food, while
the glass transition is a non-equilibrium property of food solids (amorphous glass vs
rubbery transition of food components) (Y. R. Roos, 2002). Glass transition of food
indicates the solid rubbery state vs glassy state of food solids, and it is related to the
molecular mobility of within a food matrix (Le Meste, Champion, Roudaut, Blond, &
Simatos, 2002; Y. H. Roos, 2008; Roudaut, Simatos, Champion, Contreras-Lopez, & Le
Meste, 2004; Slade & Levine, 1991, 1995).
Glass transition is a relaxation process where by an amorphous, glassy state
product transfers into a rubbery state or vice versa (Y. H. Roos, 2008; Sperling, 1992).
The glass transition temperature (Tg) is the temperature of the turning point with the
occurrence of such changes. It is moisture content dependent (Levine & Slade, 1986; Y.
H. Roos, 1987). A higher moisture content corresponds with a lower Tg of the food
matrix.
In many dehydrated food systems, such as protein powders, the mechanism of the
physicochemical changes because of aw is associated with glass transition. Dried food
systems generally exist in an amorphous glassy state with little available free volume for
mobility (Ferry, 1980). Free volume is defined as “the volume associated with a polymer
matrix in which the energy can be distributed without cost.” However, with increased
moisture content (obtained from the storage environment), they may transition into the
rubbery state with a much higher available free volume (Ferry, 1980), a higher diffusion
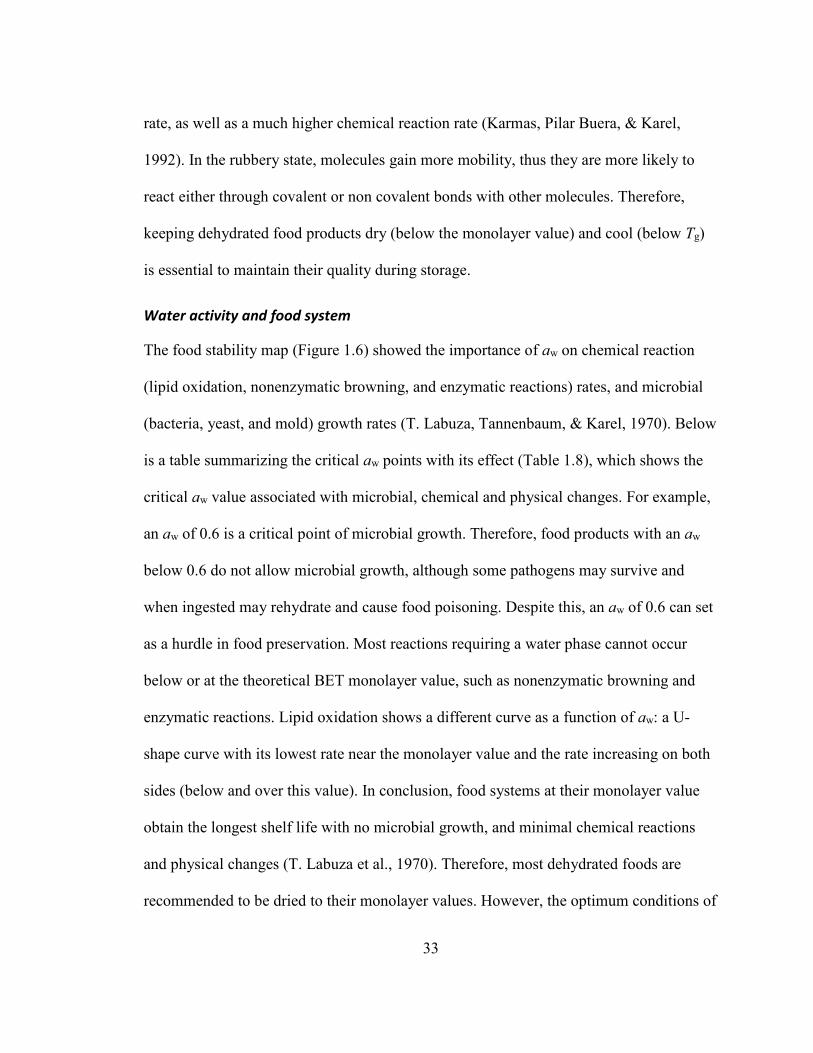
33
rate, as well as a much higher chemical reaction rate (Karmas, Pilar Buera, & Karel,
1992). In the rubbery state, molecules gain more mobility, thus they are more likely to
react either through covalent or non covalent bonds with other molecules. Therefore,
keeping dehydrated food products dry (below the monolayer value) and cool (below Tg)
is essential to maintain their quality during storage.
Water activity and food system
The food stability map (Figure 1.6) showed the importance of aw on chemical reaction
(lipid oxidation, nonenzymatic browning, and enzymatic reactions) rates, and microbial
(bacteria, yeast, and mold) growth rates (T. Labuza, Tannenbaum, & Karel, 1970). Below
is a table summarizing the critical aw points with its effect (Table 1.8), which shows the
critical aw value associated with microbial, chemical and physical changes. For example,
an aw of 0.6 is a critical point of microbial growth. Therefore, food products with an aw
below 0.6 do not allow microbial growth, although some pathogens may survive and
when ingested may rehydrate and cause food poisoning. Despite this, an aw of 0.6 can set
as a hurdle in food preservation. Most reactions requiring a water phase cannot occur
below or at the theoretical BET monolayer value, such as nonenzymatic browning and
enzymatic reactions. Lipid oxidation shows a different curve as a function of aw: a U-
shape curve with its lowest rate near the monolayer value and the rate increasing on both
sides (below and over this value). In conclusion, food systems at their monolayer value
obtain the longest shelf life with no microbial growth, and minimal chemical reactions
and physical changes (T. Labuza et al., 1970). Therefore, most dehydrated foods are
recommended to be dried to their monolayer values. However, the optimum conditions of
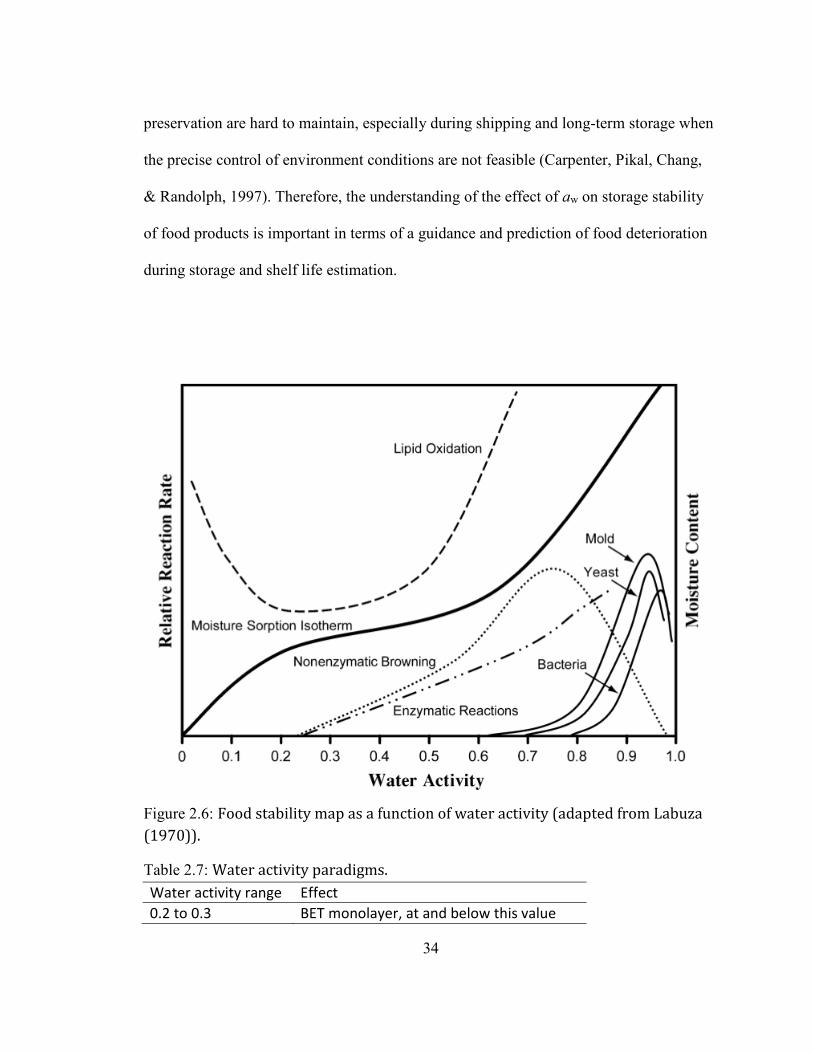
34
preservation are hard to maintain, especially during shipping and long-term storage when
the precise control of environment conditions are not feasible (Carpenter, Pikal, Chang,
& Randolph, 1997). Therefore, the understanding of the effect of aw on storage stability
of food products is important in terms of a guidance and prediction of food deterioration
during storage and shelf life estimation.
Figure 2.6: Food stability map as a function of water activity (adapted from Labuza
(1970)).
Table 2.7: Water activity paradigms.
Water activity range Effect
0.2 to 0.3 BET monolayer, at and below this value
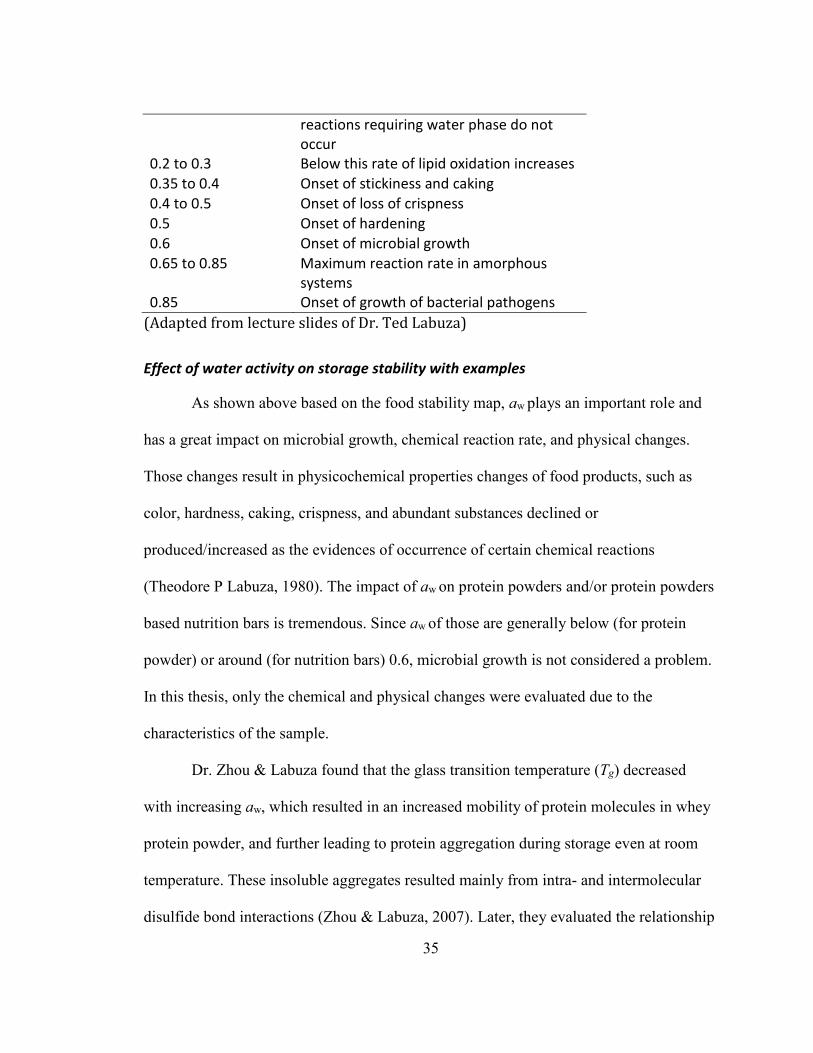
35
reactions requiring water phase do not
occur
0.2 to 0.3 Below this rate of lipid oxidation increases
0.35 to 0.4 Onset of stickiness and caking
0.4 to 0.5 Onset of loss of crispness
0.5 Onset of hardening
0.6 Onset of microbial growth
0.65 to 0.85 Maximum reaction rate in amorphous
systems
0.85 Onset of growth of bacterial pathogens
(Adapted from lecture slides of Dr. Ted Labuza)
Effect of water activity on storage stability with examples
As shown above based on the food stability map, aw plays an important role and
has a great impact on microbial growth, chemical reaction rate, and physical changes.
Those changes result in physicochemical properties changes of food products, such as
color, hardness, caking, crispness, and abundant substances declined or
produced/increased as the evidences of occurrence of certain chemical reactions
(Theodore P Labuza, 1980). The impact of aw on protein powders and/or protein powders
based nutrition bars is tremendous. Since aw of those are generally below (for protein
powder) or around (for nutrition bars) 0.6, microbial growth is not considered a problem.
In this thesis, only the chemical and physical changes were evaluated due to the
characteristics of the sample.
Dr. Zhou & Labuza found that the glass transition temperature (Tg) decreased
with increasing aw, which resulted in an increased mobility of protein molecules in whey
protein powder, and further leading to protein aggregation during storage even at room
temperature. These insoluble aggregates resulted mainly from intra- and intermolecular
disulfide bond interactions (Zhou & Labuza, 2007). Later, they evaluated the relationship
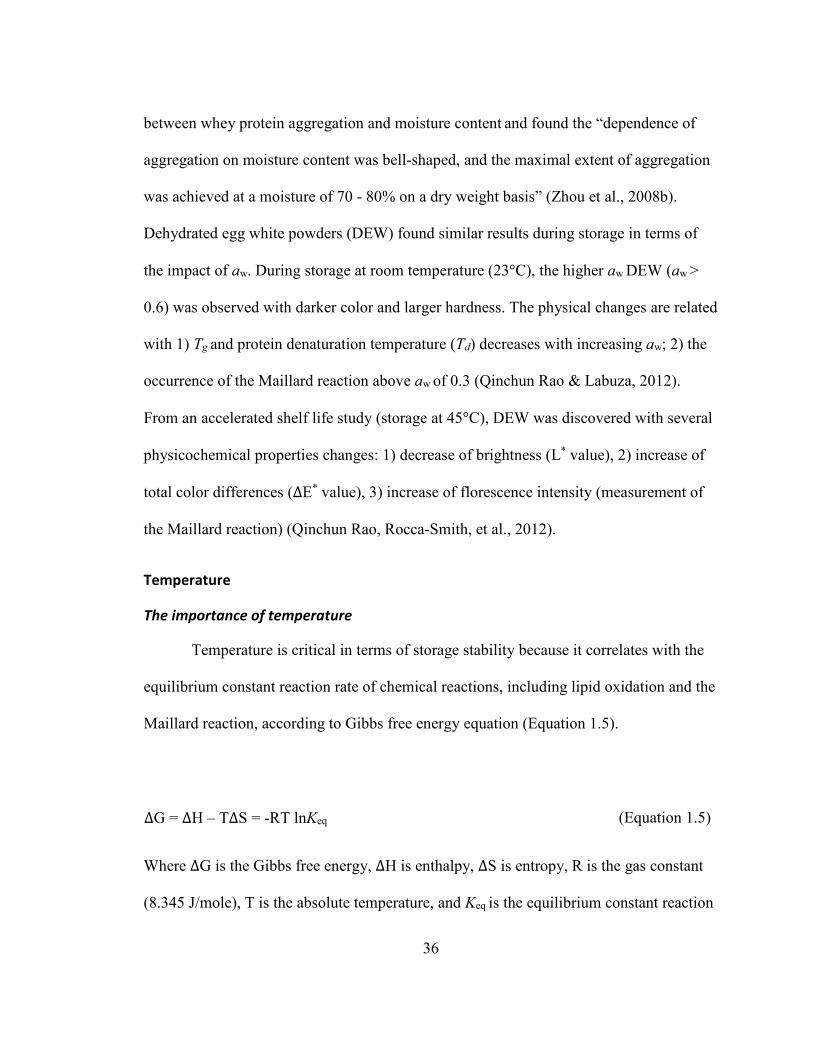
36
between whey protein aggregation and moisture content and found the “dependence of
aggregation on moisture content was bell-shaped, and the maximal extent of aggregation
was achieved at a moisture of 70 - 80% on a dry weight basis” (Zhou et al., 2008b).
Dehydrated egg white powders (DEW) found similar results during storage in terms of
the impact of aw. During storage at room temperature (23°C), the higher aw DEW (aw >
0.6) was observed with darker color and larger hardness. The physical changes are related
with 1) Tg and protein denaturation temperature (Td) decreases with increasing aw; 2) the
occurrence of the Maillard reaction above aw of 0.3 (Qinchun Rao & Labuza, 2012).
From an accelerated shelf life study (storage at 45°C), DEW was discovered with several
physicochemical properties changes: 1) decrease of brightness (L* value), 2) increase of
total color differences (ΔE* value), 3) increase of florescence intensity (measurement of
the Maillard reaction) (Qinchun Rao, Rocca-Smith, et al., 2012).
Temperature
The importance of temperature
Temperature is critical in terms of storage stability because it correlates with the
equilibrium constant reaction rate of chemical reactions, including lipid oxidation and the
Maillard reaction, according to Gibbs free energy equation (Equation 1.5).
Where ΔG is the Gibbs free energy, ΔH is enthalpy, ΔS is entropy, R is the gas constant
(8.345 J/mole), T is the absolute temperature, and Keq is the equilibrium constant reaction
ΔG = ΔH – TΔS = -RT lnKeq (Equation 1.5)
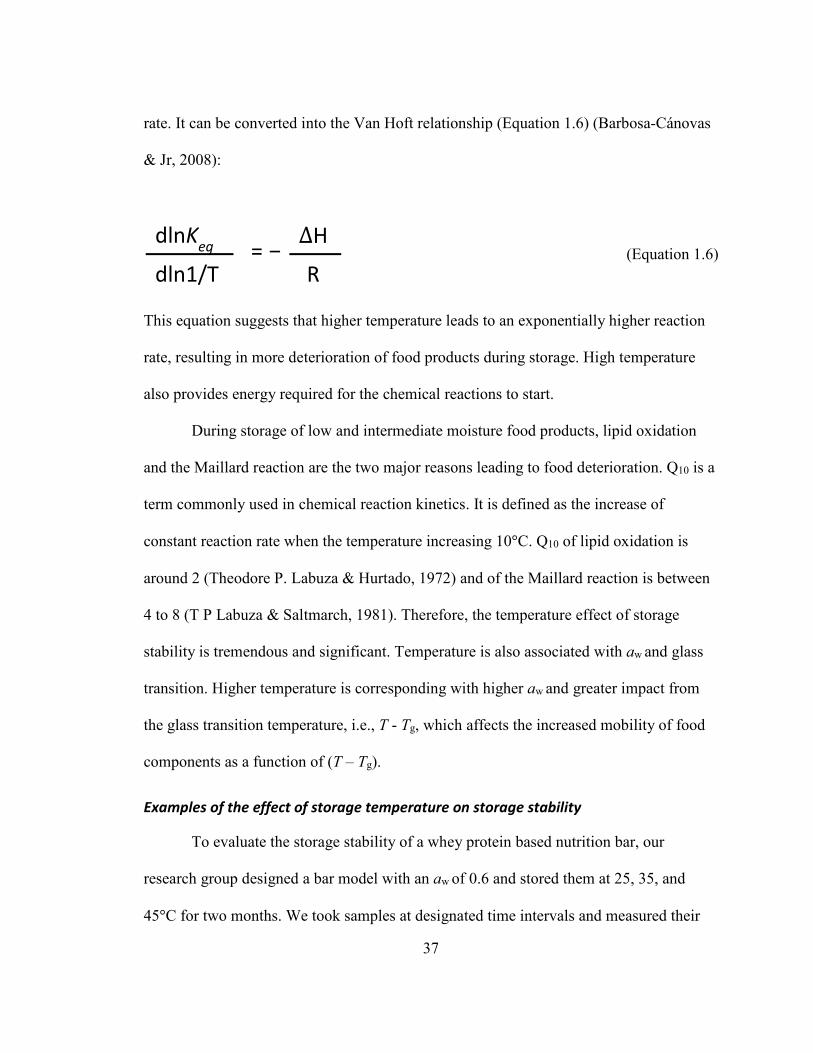
37
rate. It can be converted into the Van Hoft relationship (Equation 1.6) (Barbosa-Cánovas
& Jr, 2008):
This equation suggests that higher temperature leads to an exponentially higher reaction
rate, resulting in more deterioration of food products during storage. High temperature
also provides energy required for the chemical reactions to start.
During storage of low and intermediate moisture food products, lipid oxidation
and the Maillard reaction are the two major reasons leading to food deterioration. Q10 is a
term commonly used in chemical reaction kinetics. It is defined as the increase of
constant reaction rate when the temperature increasing 10°C. Q10 of lipid oxidation is
around 2 (Theodore P. Labuza & Hurtado, 1972) and of the Maillard reaction is between
4 to 8 (T P Labuza & Saltmarch, 1981). Therefore, the temperature effect of storage
stability is tremendous and significant. Temperature is also associated with aw and glass
transition. Higher temperature is corresponding with higher aw and greater impact from
the glass transition temperature, i.e., T - Tg, which affects the increased mobility of food
components as a function of (T – Tg).
Examples of the effect of storage temperature on storage stability
To evaluate the storage stability of a whey protein based nutrition bar, our
research group designed a bar model with an aw of 0.6 and stored them at 25, 35, and
45°C for two months. We took samples at designated time intervals and measured their
(Equation 1.6) dlnK
eq
dln1/T
= − ΔH
R
38
hardness, progress of the Maillard reaction, and protein solubility. The samples stored at
45°C developed brown color more rapidly and had a higher rate of the Maillard reaction
calculated using an apparent first order model compared with samples storage at 25, and
35°C. The calculated Q10 from the Arrhenius plot is 6.3. It means that if the bar is shelf
stable for 12 months storage at room temperature, it can only be acceptable for 2 months
at 35°C, which is 83% of reduction in shelf life. An increased rate of the Maillard
reaction, increased hardness and decreased protein solubility were observed as well
(Zhou, Guo & Labuza, 2013).
Dr. Rao evaluated the storage stability of egg white protein powder/water dough
system, in which he found that samples stored at 45°C had a greater increase in hardness,
and a greater decrease of free amino groups and brightness (L* value) compared with
samples stored at room temperature and 35°C (Qinchun Rao, Rocca-Smith, et al., 2013).
Shelf life prediction
Shelf life is defined as “a function of the environmental condition and the amount
of quality change that can be allowed over the necessary time to reach the consumers
shelf” (T.P. Labuza & Schmidl, 1988). According to shelf life rules, a food can be
divided into four categories: 1) Perishable (1-14 days at refrigerated temperature), 2)
Extended refrigerated shelf life (60-90 days), 3) Semi perishable (≤ 6 months at room
temperature), 4) Shelf stable (≥ 6 months to 3 years). Most of low and intermediate
moisture food products are in the shelf stable category due to the hurdles to
microorganism growth, which is good in terms of storage stability but not good enough
for shelf life testing because it will be very time consuming. Therefore, shelf life

39
prediction is very important for the food industry. It requires a shorter time but with
multiple storage conditions to evaluate the reaction kinetics and build a prediction model.
For shelf life estimation, one usually stores the products at three temperatures (room
temperature, 35°C, and 45°C) and at least three aw for each temperature and measure at
least 6 different times for each parameter during storage. Then one can plot the 6 points
using zero or first order kinetics to calculate the reaction rate constant (k). One then
makes a plot of k vs 1/T for the Arrhenius plot to calculate activation energy (Ea) and
Q10. Obtaining those factors can help us build the relationship of quality changes as a
function of storage time at certain temperature and certain aw.
40
Chapter 3 Storage induced physicochemical changes of a commercial
spray-dried egg yolk powder
Summary
In dehydrated food products, the physicochemical changes during storage are due
to chemical reactions. In this study, a commercial spray-dried egg yolk powder (DEY)
was stored at different water activities (aw), and temperatures and several selected
physicochemical changes were evaluated. The moisture sorption isotherm of DEY fitted
well to the Guggenheim-Anderson-de Boer (GAB) model and showed a type II curve
with monolayer value m0 of 2.3 g H2O/100 g DEY (aw of 0.25). The color of DEY
showed a decrease of L* and a* value, and an increase of b* and ΔE* value during storage.
The overall change of color was towards orange-brown in the L*a*b* color system.
However, the change of color was very slight as the decline rate constant of L* value was
only 0.0015 day-1 after storage at 45°C for two months. To evaluate the progress of the
Maillard reaction, glucose content and free amino groups, and the Maillard reaction
products were measured. Results showed that the glucose content went to zero after seven
days storage at 45°C at an aw of 0.6. The glucose content of DEY during storage at 23°C
41
at an aw of 0.05 only showed a slight decline during 2 month storage. The lipid oxidation
progress was also tested and lipid oxidation products were found in all samples,
confirming the occurrence of the reaction.
Introduction
Eggs have been an important and valuable source of food since prehistory.
Chicken eggs were consumed as food in Asia and India before 7500 BCE and brought to
Sumer, Egypt, and other places of the world afterwards (Cotterill, 1995). Nowadays, eggs
are still considered to have great nutritional value because they are a rich source of
protein, unsaturated fatty acids, iron, phosphorus, and other trace minerals and various
vitamins (Stadelman & Cotterill, 1973). In the last decade, the production of hen eggs has
increased slightly from 86 to 92 billions of eggs per year in the United States (USDA
Layers and Eggs: Production by Year, US, 2014). In the last 25 years, the per capital
consumption of eggs has been almost constant, however, the per capital consumption of
egg products in 2010 is more than twice as that in 1986 (increased from 36.8 to 75.7 per
capital consumption (numbers of shell egg equivalent)) (American Egg Board:Egg
Production and Consumption, 2014). It indicates that the market of egg components as
ingredients to be applied into food products is growing. The first egg product in the
United States was partially dehydrated egg yolk and albumin in 1878 (Stadelman, 1995).
After that, with the development of egg-breaking and drying technology, various egg
products have been produced including dried egg yolk (DEY). DEY has great advantages
over liquid egg yolk (LEY) in terms of preservation and has a broad application in the
food industry. It can be used in mayonnaise, salad dressing, and bakery products, and also
42
has the potential to be mixed with other protein powders (whey, casein, soy, and egg
white) to be applied into high protein products such as high protein nutrition and energy
bars.
DEY is a shelf stable dry food product given the right packaging and is essentially
safe in terms of microorganisms due to its low moisture content if pasteurized before and
after drying. It can suffer after drying from physicochemical changes if exposed to an
abused environment such as high humidity (aw > 0.6) and/or high temperature (>45°C),
which is more likely to happen during transportation and long-term storage when the
precise control of conditions is not feasible (Carpenter et al., 1997).
Few studies have evaluated the physicochemical changes in storage of DEY. One
study showed that the color changes of DEY is not significant after 90 days storage at
room temperature, but the loss of unsaturated fatty acids was significant (Du & Ahn,
2000a). Storage of LEY was found with similar results: no significant color changes
during storage at room temperature, but with a significant decrease of protein solubility
(Koç et al., 2011). Wahle et al. also found increased peroxidized lipid during storage of
whole egg powder while the increase correlated inversely with the Vitamin E content
(Wahle, Hoppeb, & Mcintosh, 1993). Other researchers also discovered an increase
cholesterol oxidation products (COPs) and early Maillard reaction products during
storage of spray-dried whole egg powder at room temperature (Caboni et al., 2005).
Extensive studies have evaluated the physicochemical changes of other important
protein powders (whey protein, egg white protein) during storage (Qinchun Rao &
Labuza, 2012; Zhou et al., 2013; Zhou & Labuza, 2007). They found a decrease of
43
brightness (L* value), free amino groups, protein solubility, glass transition temperature
(Tg), and protein denaturation temperature (Td) with increasing aw and/or temperature.
Therefore, the objectives of this study were to fill the gap to determine the effect
of storage conditions (aw and temperature) on the physicochemical changes of DEY and
provide possible mechanisms for these changes. Possible approaches to reduce/inhibit
these changes would be suggested.
Methods and Materials
Materials
The commercial spray-dried egg yolk powder (DEY, H483) was obtained from
Deb-EL Food Products, LLC (Elizabeth, NJ, USA). After arrival, a portion of DEY
(around 20 g) was taken out for tests of several sample characteristics. The rest of the
DEY was vacuum packaged and then stored at -20°C to eliminate any possible chemical
reactions before use.
All the other reagents and chemicals used in this study were of analytical grade.
Methods
Characterization of DEY
After receiving the sample, several characteristics were analyzed according to
previous work (Qinchun Rao & Labuza, 2012). The initial moisture content of DEY was
measured using the Aquatest cma Karl fischer Coulometric Titrator (Photovolt Co.,
Minneapolis, MN, USA). Water activity (aw) was measured using the AquaLab Vapor
Sorption Analyzer (Decagon Devices, Pullman, WA, USA). The glucose content was
measured using the Glucose (HK) Assay Kit (Sigma-Aldrich Co., Saint Louis, MO,
44
USA). The protein content was measured using TruSpec N (LECO corp., St. Joseph, MI,
USA) according to the Dumas combustion method (Padmore, 1990). The specific factor
for the conversion of nitrogen content to egg protein content is 6.25 (FAO, 2003).
Moisture sorption isotherm
The moisture sorption isotherm of DEY at room temperature was generated using
two methods in the Aqualab Vapor Sorption Analyzer (Decagon Devices, Inc., Pullman,
WA, USA): the dynamic vapor sorption (DVS) method for static isotherm and the
dynamic dewpoint isotherm (DDI) method for a dynamic isotherm. The GAB isotherm
model was used for the prediction of the moisture content and aw relationship.
DEY storage
DEY samples (pre-weighed) were put into water activity cups (Decagon Devices,
Inc., Pullman, WA, USA), glass petri dish, and clear glass bottles without cap based on
requirement of selected physicochemical properties’ tests. Then each set of samples were
put into six plastic desiccators containing either Drierite desiccant or saturated salt
slurries (LiCl, MgCl2, K2CO3, Mg(NO3)2, CoCl2) with an aw range from 0.05 to 0.66
(Greenspan, 1977). Then each set of six desiccators were put into three storage chambers
at 23°C, 35°C, and 45°C. Therefore, overall 18 desiccators were used for this storage
study and each desiccator was filled with samples of a given amount for future analysis
of selected physicochemical properties. The storage time was set based on the presumed
Q10 value (for lipid oxidation, Q10 is around 2). For 45°C storage, the storage time is
about two months, which translates to four months and eight months for 35°C and room
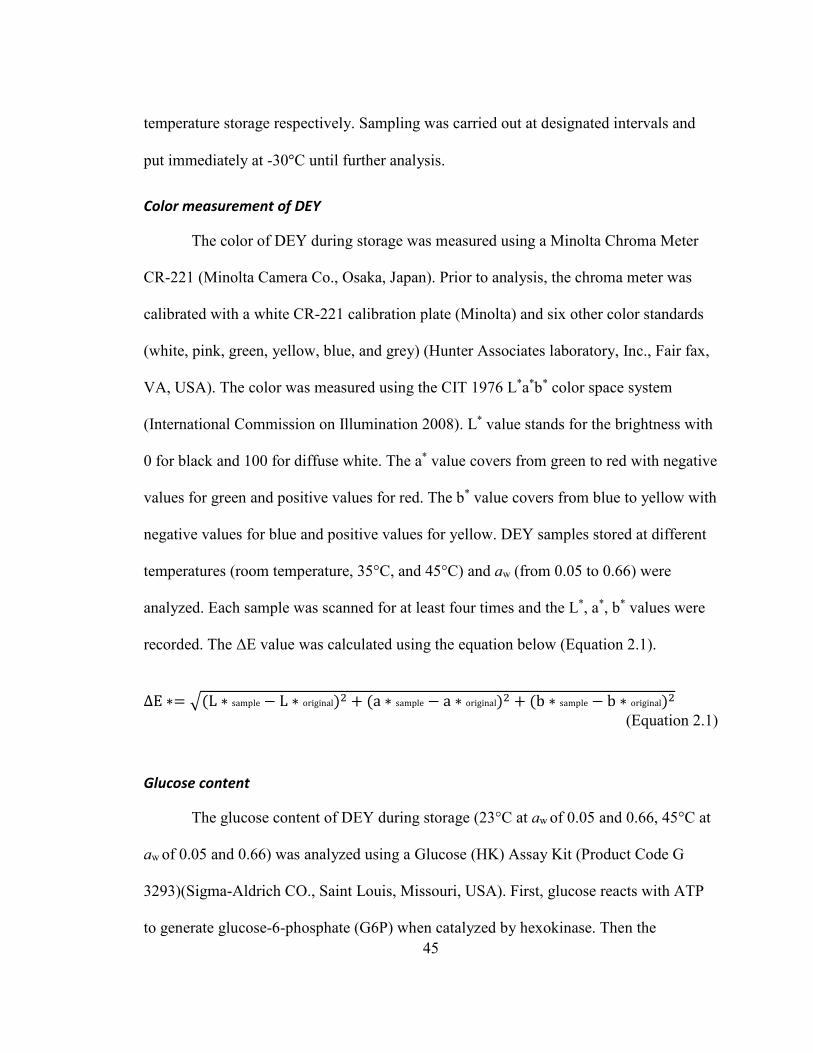
45
temperature storage respectively. Sampling was carried out at designated intervals and
put immediately at -30°C until further analysis.
Color measurement of DEY
The color of DEY during storage was measured using a Minolta Chroma Meter
CR-221 (Minolta Camera Co., Osaka, Japan). Prior to analysis, the chroma meter was
calibrated with a white CR-221 calibration plate (Minolta) and six other color standards
(white, pink, green, yellow, blue, and grey) (Hunter Associates laboratory, Inc., Fair fax,
VA, USA). The color was measured using the CIT 1976 L*a*b* color space system
(International Commission on Illumination 2008). L* value stands for the brightness with
0 for black and 100 for diffuse white. The a* value covers from green to red with negative
values for green and positive values for red. The b* value covers from blue to yellow with
negative values for blue and positive values for yellow. DEY samples stored at different
temperatures (room temperature, 35°C, and 45°C) and aw (from 0.05 to 0.66) were
analyzed. Each sample was scanned for at least four times and the L*, a*, b* values were
recorded. The ΔE value was calculated using the equation below (Equation 2.1).
ΔE ∗= �(L ∗ sample − L ∗ original)� + (a ∗ sample − a ∗ original)� + (b ∗ sample − b ∗ original)� (Equation 2.1)
Glucose content
The glucose content of DEY during storage (23°C at aw of 0.05 and 0.66, 45°C at
aw of 0.05 and 0.66) was analyzed using a Glucose (HK) Assay Kit (Product Code G
3293)(Sigma-Aldrich CO., Saint Louis, Missouri, USA). First, glucose reacts with ATP
to generate glucose-6-phosphate (G6P) when catalyzed by hexokinase. Then the
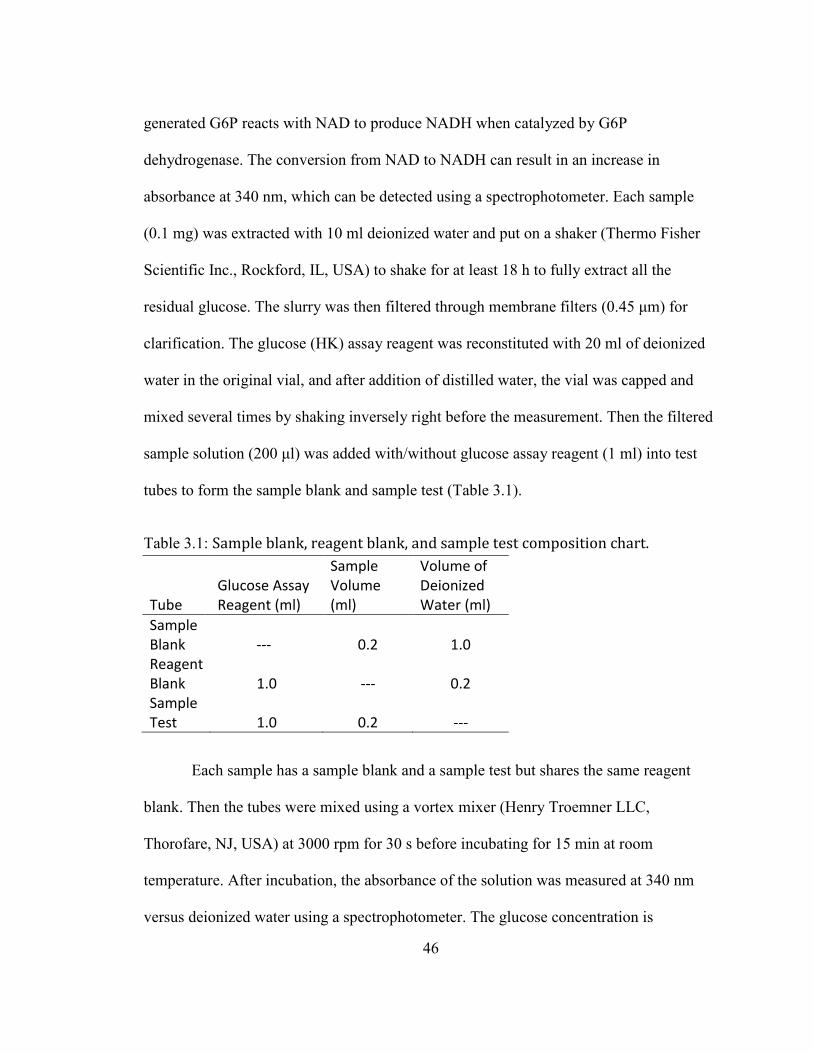
46
generated G6P reacts with NAD to produce NADH when catalyzed by G6P
dehydrogenase. The conversion from NAD to NADH can result in an increase in
absorbance at 340 nm, which can be detected using a spectrophotometer. Each sample
(0.1 mg) was extracted with 10 ml deionized water and put on a shaker (Thermo Fisher
Scientific Inc., Rockford, IL, USA) to shake for at least 18 h to fully extract all the
residual glucose. The slurry was then filtered through membrane filters (0.45 μm) for
clarification. The glucose (HK) assay reagent was reconstituted with 20 ml of deionized
water in the original vial, and after addition of distilled water, the vial was capped and
mixed several times by shaking inversely right before the measurement. Then the filtered
sample solution (200 μl) was added with/without glucose assay reagent (1 ml) into test
tubes to form the sample blank and sample test (Table 3.1).
Table 3.1: Sample blank, reagent blank, and sample test composition chart.
Each sample has a sample blank and a sample test but shares the same reagent
blank. Then the tubes were mixed using a vortex mixer (Henry Troemner LLC,
Thorofare, NJ, USA) at 3000 rpm for 30 s before incubating for 15 min at room
temperature. After incubation, the absorbance of the solution was measured at 340 nm
versus deionized water using a spectrophotometer. The glucose concentration is
Tube
Glucose Assay
Reagent (ml)
Sample
Volume
(ml)
Volume of
Deionized
Water (ml)
Sample
Blank --- 0.2 1.0
Reagent
Blank 1.0 --- 0.2
Sample
Test 1.0 0.2 ---
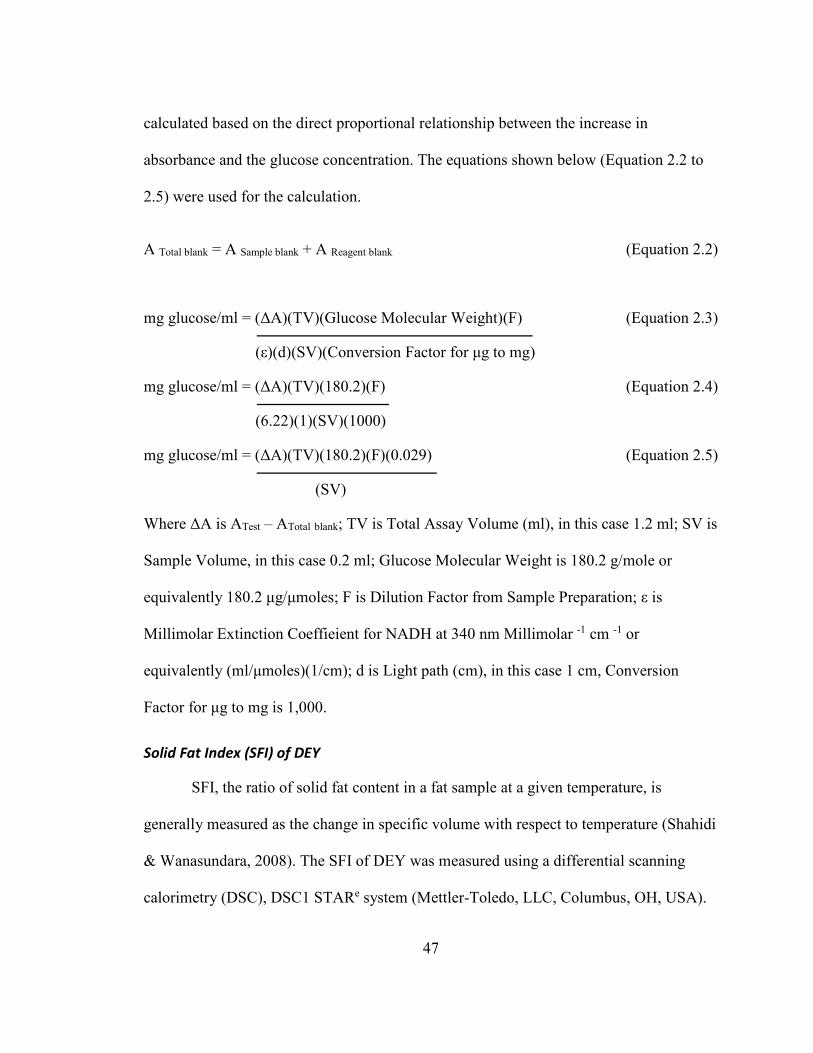
47
calculated based on the direct proportional relationship between the increase in
absorbance and the glucose concentration. The equations shown below (Equation 2.2 to
2.5) were used for the calculation.
A Total blank = A Sample blank + A Reagent blank (Equation 2.2)
mg glucose/ml = (ΔA)(TV)(Glucose Molecular Weight)(F)
(ε)(d)(SV)(Conversion Factor for μg to mg)
(Equation 2.3)
mg glucose/ml = (ΔA)(TV)(180.2)(F)
(6.22)(1)(SV)(1000)
(Equation 2.4)
mg glucose/ml = (ΔA)(TV)(180.2)(F)(0.029)
(SV)
(Equation 2.5)
Where ΔA is ATest – ATotal blank; TV is Total Assay Volume (ml), in this case 1.2 ml; SV is
Sample Volume, in this case 0.2 ml; Glucose Molecular Weight is 180.2 g/mole or
equivalently 180.2 μg/μmoles; F is Dilution Factor from Sample Preparation; ε is
Millimolar Extinction Coeffieient for NADH at 340 nm Millimolar -1 cm -1 or
equivalently (ml/μmoles)(1/cm); d is Light path (cm), in this case 1 cm, Conversion
Factor for μg to mg is 1,000.
Solid Fat Index (SFI) of DEY
SFI, the ratio of solid fat content in a fat sample at a given temperature, is
generally measured as the change in specific volume with respect to temperature (Shahidi
& Wanasundara, 2008). The SFI of DEY was measured using a differential scanning
calorimetry (DSC), DSC1 STARe system (Mettler-Toledo, LLC, Columbus, OH, USA).
48
The sample was cycled through a heat-cool-reheat cycle, during which it was heated from
-50°C to 80°C at 10°C/min, cooled rapidly back to -50°C and then reheated at 10°C/min
back to 80°C. The melting endotherm of the fat during the second heating segment was
analyzed to determine the SFI values using STARe software (version 11.00a, Mettler-
Toledo).
o-Phthalaldehyde (OPA) method
The effect of aw and temperature on the loss of free amino groups of DEY during
storage was measured using the OPA method with minor modifications. The OPA
method is based on a reaction involved with free amino groups, which can be detected
using a spectrophotometer. Basically, OPA reagent reacts with amino groups on the
proteins or free amino acids in an alkaline environment, which gives rise to strongly
fluorescing compounds. The OPA reagent is freshly prepared just before the test. Each
100 ml OPA reagent is composed of two parts: 1) 80 mg OPA (dissolved in 1 ml absolute
methanol), 2) 200 μl of 2-mercaptoethanol (2-ME). The two parts were diluted to 100 ml
volume with CB-SDS buffer (50 nM carbonate buffer (CB) containing 1% SDS (g/ml),
pH 9.6). The fresh prepared OPA was protected from direct light and used within 2 h.
Each sample (0.1 mg) was diluted with 20 ml CB-SDS and incubated for 2 h on a shaker
at 100 rpm. Then 100 μl of sample solution was added into a 96-well clear flat bottom
polystyrene microplate (Corning In., Corning, NY, USA) (100 μl/well). The blank was
the CB-SDS buffer without DEY (100 μl/well). The OPA reagent (100 μl/well) was then
added into each well using a Matrix electronic eight-channel pipette (Thermo Fisher
Scientific). Right before measurement, the microplate was shaken briefly. The
49
absorbance was read using a microplate reader (BioTek Instruments) at 340 nm. In order
to obtain the optimal results, the incubation time of each sample after adding the OPA
reagent was set to 1.5 min. All the steps were performed at room temperature and each
sample was tested at least in duplicate. The remaining free amino groups in each sample
were calculated using the following equation (Equation 2.6):
% Free amino groups = ((Treated A340 – Blank A340)/(Original A340 – Blank A340))*100
(Equation 2.6)
Front-face fluorescence
The progress of the Maillard reaction and lipid oxidation were measured using
front-face fluorescence at room temperature (LS50 B Perking-Elmer Luminescence
Spectrometer, Perkin-Elmer Co., Waltham, MA, USA). The Maillard reaction products
emission was monitored from 380 to 580 nm by excitation at 360 nm (Karoui,
Schoonheydt, Decuypere, Nicolaï, & De Baerdemaeker, 2007). The slits of excitation and
emission are 5.0 and 3.5 nm respectively. The lipid oxidation products emission was
monitored from 400 to 640 nm by excitation at 380 nm (Wold & Baardseth, 2002). The
slits of excitation and emission are 5.0 and 3.5 nm respectively. DEY samples stored at
specific conditions (23°C and 45°C at aw of 0.66) were tested. Briefly, a certain amount
of DEY powder was put into the silica window of the Powder Holder. Then the cap of the
Powder Holder was screwed down tightly. The Powder Holder is then put into the Front
Surface accessory for scanning. Each sample was scanned at least in triplicate at the
speed of 500 nm/min. The data was extracted from the FL WinLab software (Perkin
50
Elmer) into Excel and undergone principle component analysis (PCA) using R software.
The R package for PCA is FactoMineR. The code for PCA is shown in Appendix.
Peroxide value of DEY during storage
The peroxide value of DEY was measured using the ferrous oxidation-xylenol
orange (FOX) method (Hermes-lima, Willmore, & Storey, 1995). This method is based
on a fluorescence reaction involved with the primary oxidation products of lipid
oxidation: hydroperoxides, which can be detected by a spectrophotometer at 560 nm.
Basically, the hydroperoxides will convert ferrous ions into ferric ions, which can form a
complex with xylenol orange. The complex can be detected at 560 nm. The FOX method
is easy, efficient, and sensitive, and has been used for many matrixes including food
systems. Briefly, 0.5 g DEY (storage at 45°C and aw of 0.66) was added into 15 ml cold
(-20°C) absolute methanol in a 50 ml centrifuge tube. Then the slurry was homogenized
at level 6 (the maximum level) for 1 min. After centrifuging at 1,400 g for 3 min, the
supernatant was collected. The supernatant (50 μl) was added into a 2 ml centrifuge tube
containing 250 μl 0.25 mM FeSO4, 100 μl 25 mM H2SO4, 100 μl 0.1 mM xylenol orange,
and 500 μl deionized water. The blank sample is 50 μl of absolute methanol instead of the
sample solution. Then the mixture was vortexed for 30 s before incubation in the dark at
room temperature for 30 min. After that, the mixture (200 μl/well) was pipetted into a 96-
well clear flat bottom polystyrene microplate (Corning In., Corning, NY, USA) and read
at an absorbance at 560 nm. The peroxide value was calculated based on a standard
curve. The standard curve was performed using 50 μl FeCl3 solutions of different
concentration (0.05 – 0.6 mmol) instead of the sample solution. The other steps are the
51
same with the sample test. The peroxide value was finally expressed as meq active
oxygen/g fat.
Results
Characteristics of DEY
DEY was analyzed for its initial moisture content, aw, glucose content, and protein
content. Results showed it contained 36% protein, 0.21% glucose, and 2.1% of moisture
(all on a dry basis) as well as being at an aw of 0.27 (Table 3.2). The fat content (60%, dry
basis) and the processing condition of DEY were obtained from Deb-El Food Products,
LLC. (Elizabeth, NJ, USA) (Table 3.3).
Table 3.2: Characteristics of a commercial spray-dried egg yolk powder.
dry basis
sample protein fat moisture content glucose content aw
DEY 36% 60% 2.10% 0.21% 0.27
Table 3.3: Processing conditions of a commercial spray-dried egg yolk powder
(Information obtained from the egg yolk manufacture).
spray-drying condition pasteurization
sample pressure inlet Temp. Temp. Holding Time
DEY 21.4 Mpa 185°C 62°C 4 min
The moisture sorption isotherm of DEY
Two moisture sorption isotherms of DEY at room temperature, static and dynamic,
were generated using the GAB model (Figure 3.1). There was no significant difference
(P > 0.05) between these two isotherms (Figure 3.1). DEY shows the typical type II
isotherm (sigmoidal curve) for proteins (Figure 2.5). The MAPE values of both methods
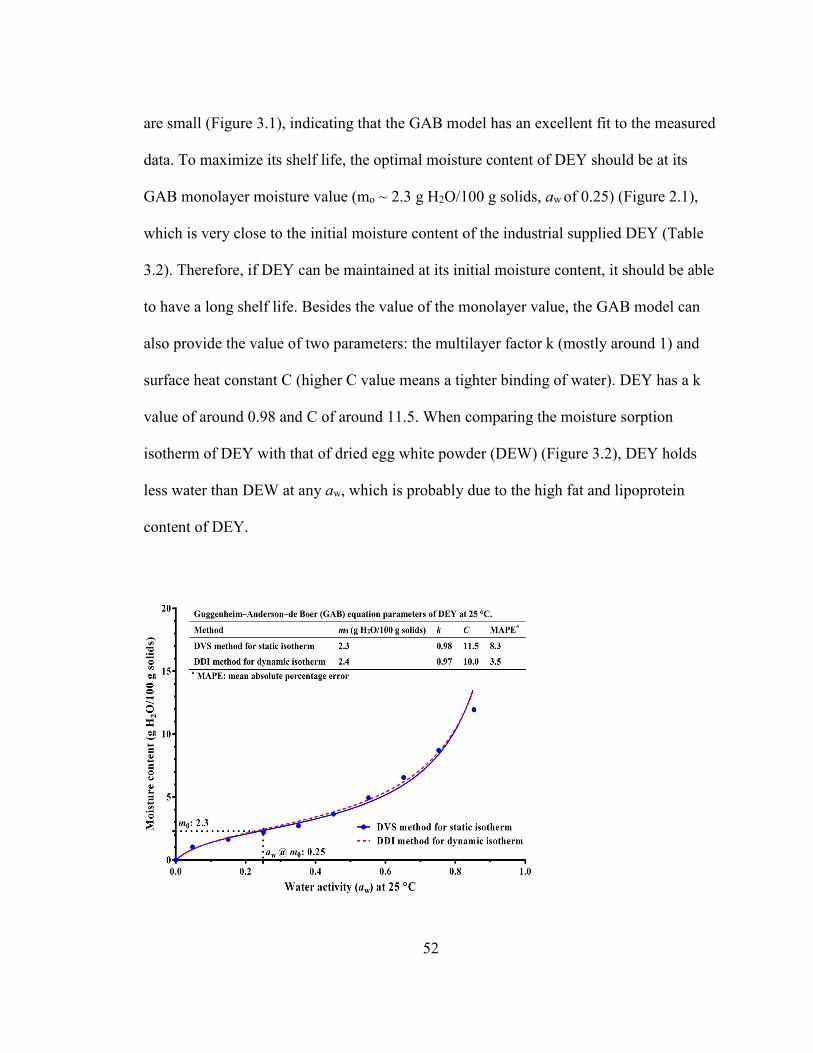
52
are small (Figure 3.1), indicating that the GAB model has an excellent fit to the measured
data. To maximize its shelf life, the optimal moisture content of DEY should be at its
GAB monolayer moisture value (mo ~ 2.3 g H2O/100 g solids, aw of 0.25) (Figure 2.1),
which is very close to the initial moisture content of the industrial supplied DEY (Table
3.2). Therefore, if DEY can be maintained at its initial moisture content, it should be able
to have a long shelf life. Besides the value of the monolayer value, the GAB model can
also provide the value of two parameters: the multilayer factor k (mostly around 1) and
surface heat constant C (higher C value means a tighter binding of water). DEY has a k
value of around 0.98 and C of around 11.5. When comparing the moisture sorption
isotherm of DEY with that of dried egg white powder (DEW) (Figure 3.2), DEY holds
less water than DEW at any aw, which is probably due to the high fat and lipoprotein
content of DEY.
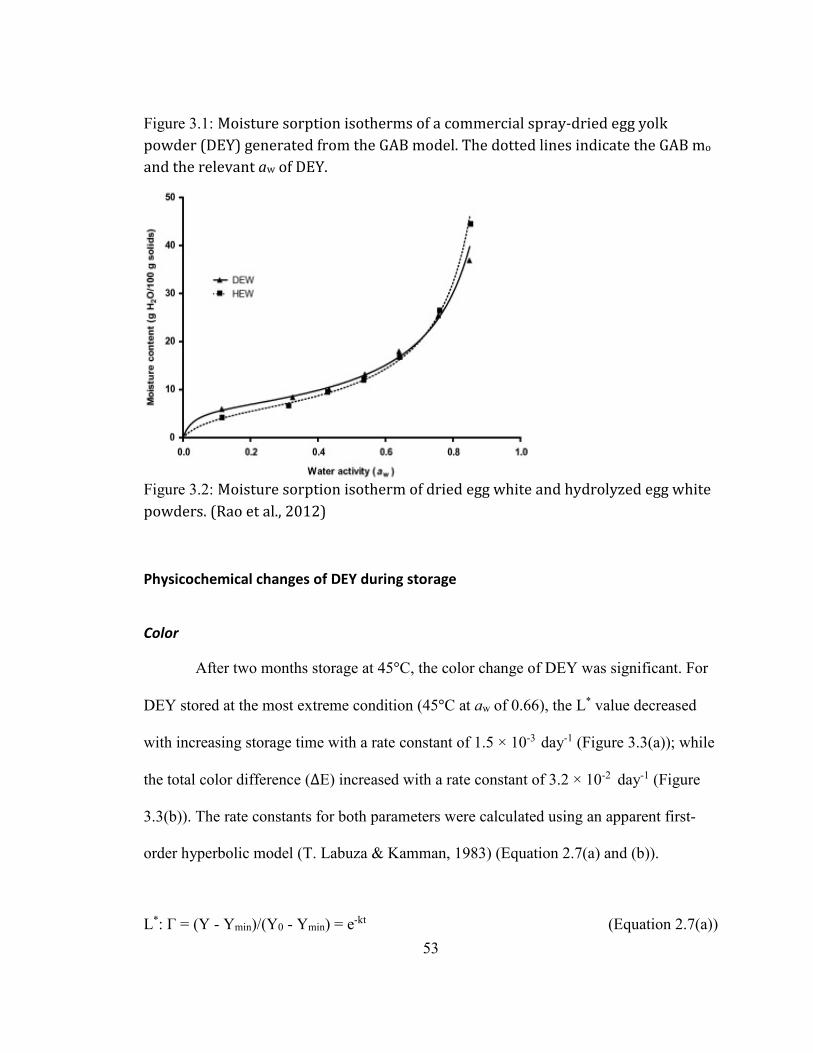
53
Figure 3.1: Moisture sorption isotherms of a commercial spray-dried egg yolk
powder (DEY) generated from the GAB model. The dotted lines indicate the GAB mo
and the relevant aw of DEY.
Figure 3.2: Moisture sorption isotherm of dried egg white and hydrolyzed egg white
powders. (Rao et al., 2012)
Physicochemical changes of DEY during storage
Color
After two months storage at 45°C, the color change of DEY was significant. For
DEY stored at the most extreme condition (45°C at aw of 0.66), the L* value decreased
with increasing storage time with a rate constant of 1.5 × 10⁻³ day-1 (Figure 3.3(a)); while
the total color difference (ΔE) increased with a rate constant of 3.2 × 10⁻² day-1 (Figure
3.3(b)). The rate constants for both parameters were calculated using an apparent first-
order hyperbolic model (T. Labuza & Kamman, 1983) (Equation 2.7(a) and (b)).
L*: Γ = (Y - Ymin)/(Y0 - Ymin) = e-kt (Equation 2.7(a))
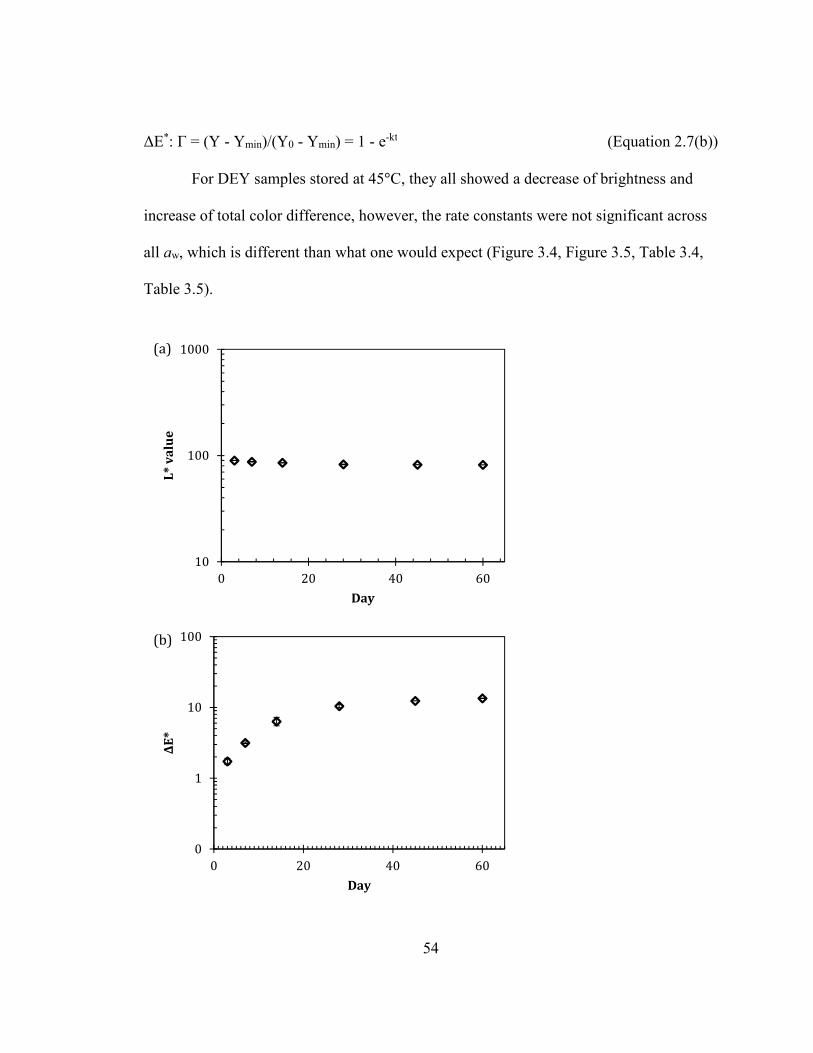
54
ΔE*: Γ = (Y - Ymin)/(Y0 - Ymin) = 1 - e-kt (Equation 2.7(b))
For DEY samples stored at 45°C, they all showed a decrease of brightness and
increase of total color difference, however, the rate constants were not significant across
all aw, which is different than what one would expect (Figure 3.4, Figure 3.5, Table 3.4,
Table 3.5).
10
100
1000
0 20 40 60
L*
va
lue
Day
(a)
0
1
10
100
0 20 40 60
ΔE
*
Day
(b)
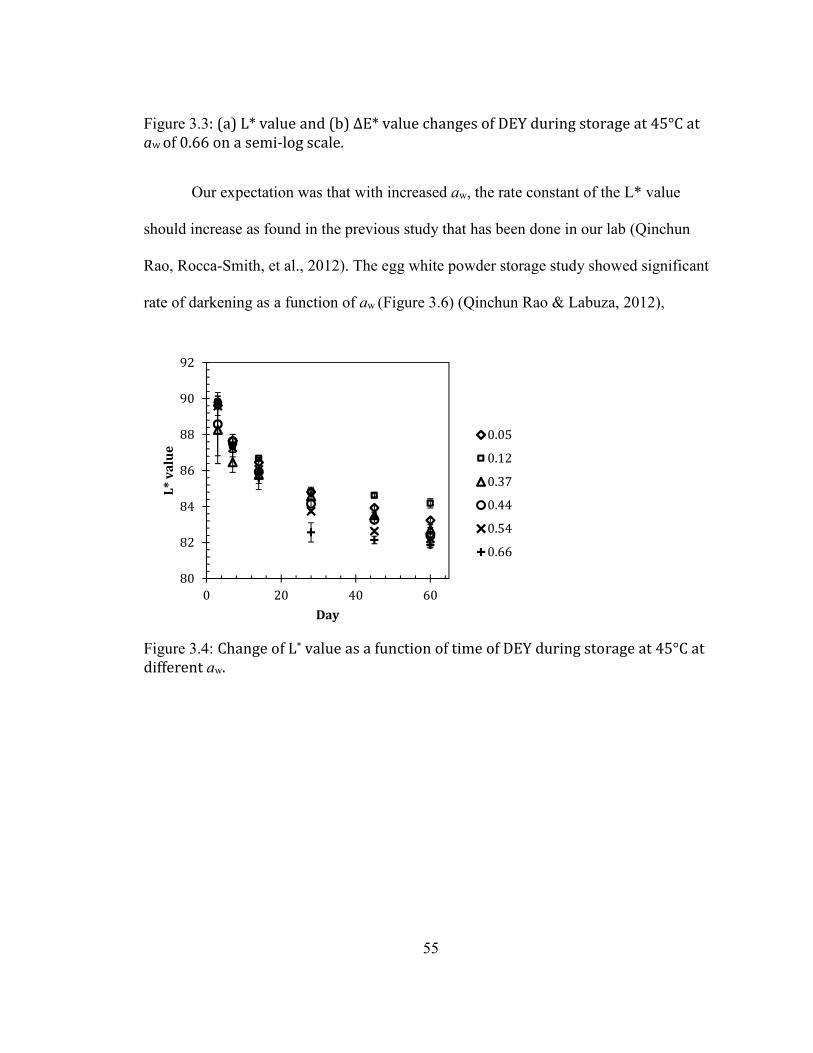
55
Figure 3.3: (a) L* value and (b) ΔΕ* value changes of DEY during storage at 45°C at
aw of 0.66 on a semi-log scale.
Our expectation was that with increased aw, the rate constant of the L* value
should increase as found in the previous study that has been done in our lab (Qinchun
Rao, Rocca-Smith, et al., 2012). The egg white powder storage study showed significant
rate of darkening as a function of aw (Figure 3.6) (Qinchun Rao & Labuza, 2012),
Figure 3.4: Change of L* value as a function of time of DEY during storage at 45°C at
different aw.
80
82
84
86
88
90
92
0 20 40 60
L*
va
lue
Day
0.05
0.12
0.37
0.44
0.54
0.66
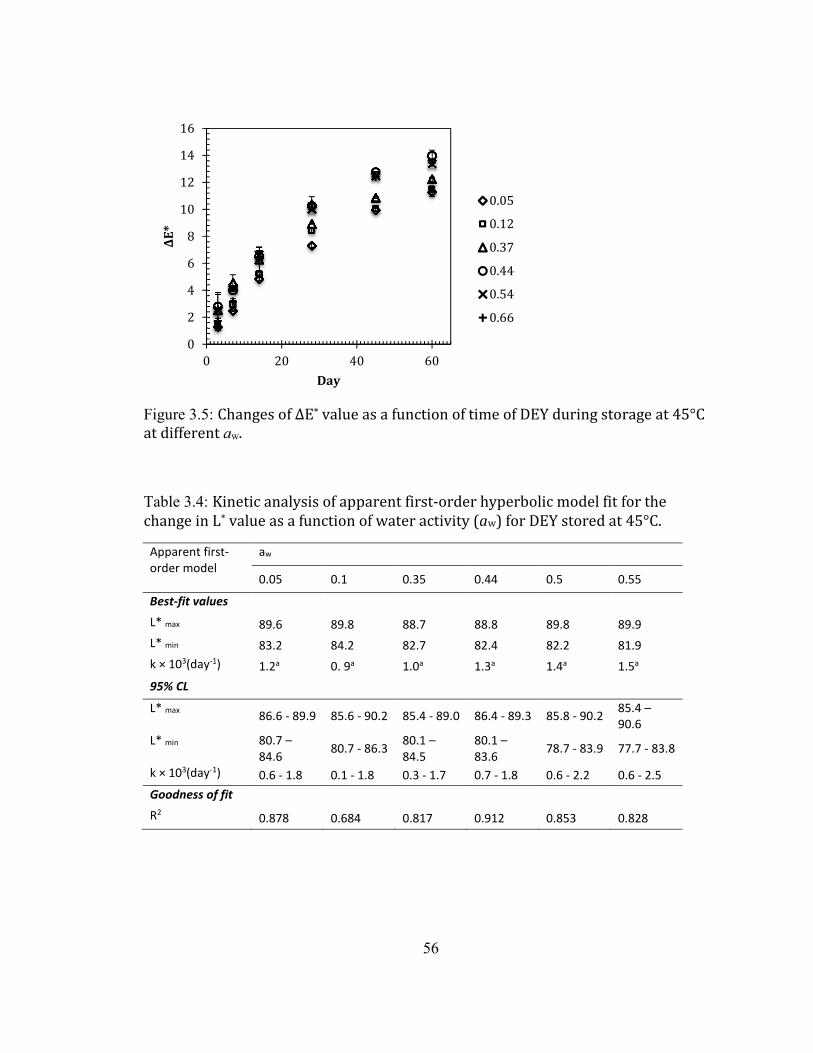
56
Figure 3.5: Changes of ΔE* value as a function of time of DEY during storage at 45°C
at different aw.
Table 3.4: Kinetic analysis of apparent first-order hyperbolic model fit for the
change in L* value as a function of water activity (aw) for DEY stored at 45°C.
Apparent first-
order model
aw
0.05 0.1 0.35 0.44 0.5 0.55
Best-fit values
L* max 89.6 89.8 88.7 88.8 89.8 89.9
L* min 83.2 84.2 82.7 82.4 82.2 81.9
k × 103(day-1) 1.2a 0. 9a 1.0a 1.3a 1.4a 1.5a
95% CL
L* max 86.6 - 89.9 85.6 - 90.2 85.4 - 89.0 86.4 - 89.3 85.8 - 90.2
85.4 –
90.6
L* min 80.7 –
84.6 80.7 - 86.3
80.1 –
84.5
80.1 –
83.6 78.7 - 83.9 77.7 - 83.8
k × 103(day-1) 0.6 - 1.8 0.1 - 1.8 0.3 - 1.7 0.7 - 1.8 0.6 - 2.2 0.6 - 2.5
Goodness of fit
R2 0.878 0.684 0.817 0.912 0.853 0.828
0
2
4
6
8
10
12
14
16
0 20 40 60
ΔE
*
Day
0.05
0.12
0.37
0.44
0.54
0.66
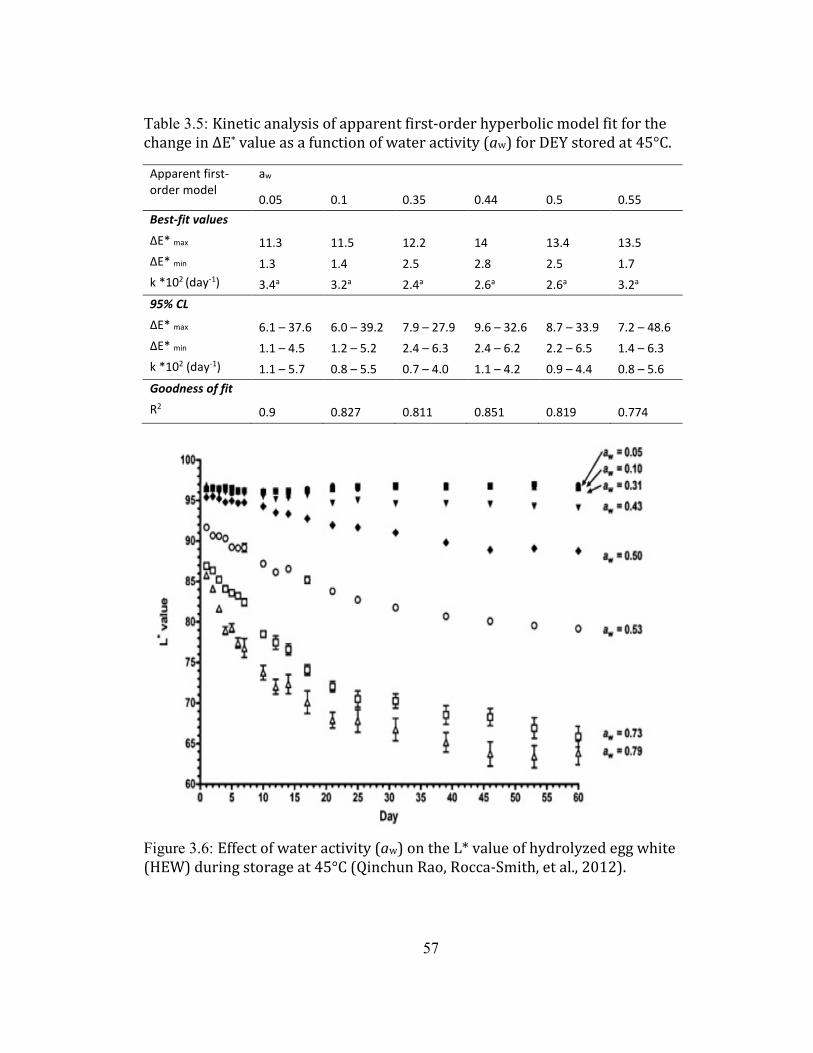
57
Table 3.5: Kinetic analysis of apparent first-order hyperbolic model fit for the
change in ΔE* value as a function of water activity (aw) for DEY stored at 45°C.
Apparent first-
order model
aw
0.05 0.1 0.35 0.44 0.5 0.55
Best-fit values
ΔE* max 11.3 11.5 12.2 14 13.4 13.5
ΔE* min 1.3 1.4 2.5 2.8 2.5 1.7
k *102 (day-1) 3.4a 3.2a 2.4a 2.6a 2.6a 3.2a
95% CL
ΔE* max 6.1 – 37.6 6.0 – 39.2 7.9 – 27.9 9.6 – 32.6 8.7 – 33.9 7.2 – 48.6
ΔE* min 1.1 – 4.5 1.2 – 5.2 2.4 – 6.3 2.4 – 6.2 2.2 – 6.5 1.4 – 6.3
k *102 (day-1) 1.1 – 5.7 0.8 – 5.5 0.7 – 4.0 1.1 – 4.2 0.9 – 4.4 0.8 – 5.6
Goodness of fit
R2 0.9 0.827 0.811 0.851 0.819 0.774
Figure 3.6: Effect of water activity (aw) on the L* value of hydrolyzed egg white
(HEW) during storage at 45°C (Qinchun Rao, Rocca-Smith, et al., 2012).
58
which is not the case for egg yolk powder. The reason for this differences in the color
changes of whey protein and egg white powder is due to the Maillard reaction. The
Maillard reaction (refers to nonenzymatic browning, NEB) is a reaction between primary
amine groups and reducing sugar, which results in hundreds of products including the
brown pigment melanoidin (Hodge, 1953). Its rate constant is a function of aw as stated in
the literature review part: as aw increases from the dry state, the rate constant of the
Maillard reaction increases as well (T. Labuza et al., 1970). However, egg yolk powder
may be different most likely due to the composition. For whey protein and egg white
protein powder, protein comprises almost 90% of the solid base. But for egg yolk
powder, protein is only about 36% of the solid base while fat is at 60%, in which more
than half is unsaturated fatty acids (Table 2.2). Therefore lipid oxidation is highly likely.
One study assessed the lipid oxidation in freeze-dried egg yolk during storage and found
an increase in the 2-thiobarbituric acid (TBA) value after 20 days storage (Hasegawa,
Endo, & Fujimoto, 1993). Similarly, another study detected a decline of unsaturated fatty
acid content in spray-dried egg yolk powder after 90 days storage (Du & Ahn, 2000b).
Lipid oxidation can also result in browning as major products are aldehydes and ketones
which can participate in the Maillard reaction. Zamora and Hidalgo claimed that both
reactions also share similar pathways and polymerization mechanisms at least from a
browning reaction point of view (Zamora & Hidalgo, 2005). According to the food
stability map, the relationship of aw and lipid oxidation rate constant is a U shape curve.
As aw increases from the dry state, the lipid oxidation reaction rate decreases to a
minimum just above the mo, then the rate increases as aw increases (T. Labuza et al.,
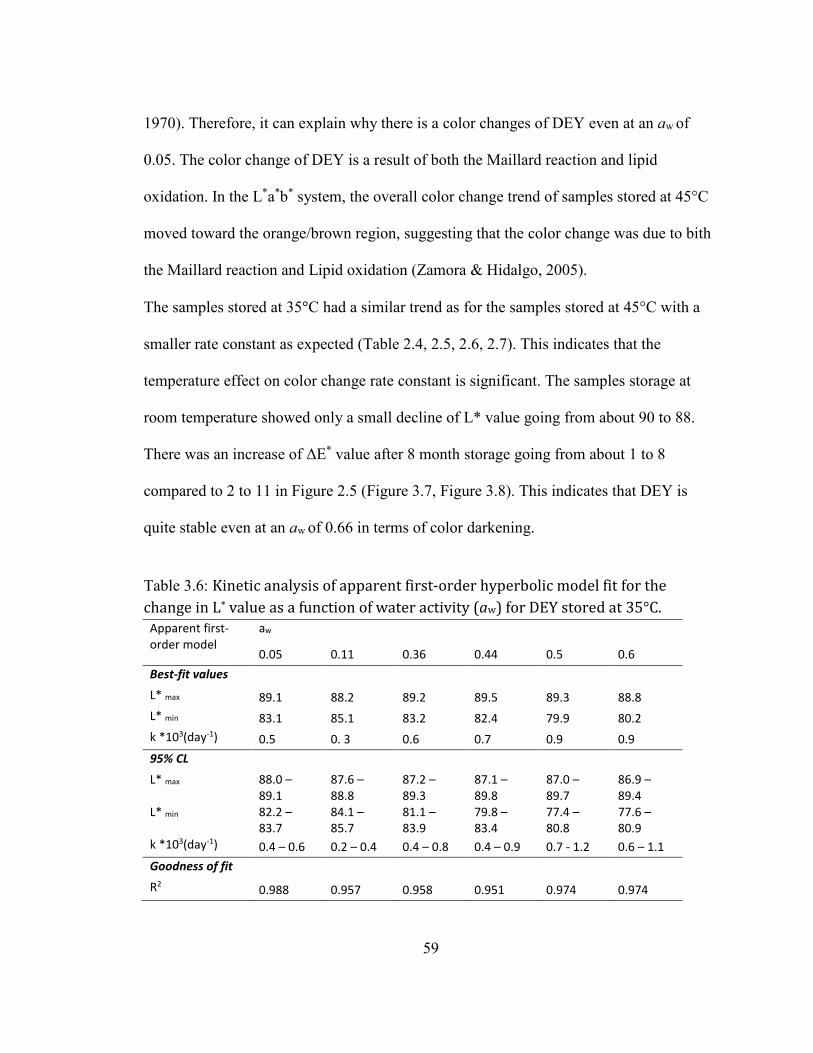
59
1970). Therefore, it can explain why there is a color changes of DEY even at an aw of
0.05. The color change of DEY is a result of both the Maillard reaction and lipid
oxidation. In the L*a*b* system, the overall color change trend of samples stored at 45°C
moved toward the orange/brown region, suggesting that the color change was due to bith
the Maillard reaction and Lipid oxidation (Zamora & Hidalgo, 2005).
The samples stored at 35°C had a similar trend as for the samples stored at 45°C with a
smaller rate constant as expected (Table 2.4, 2.5, 2.6, 2.7). This indicates that the
temperature effect on color change rate constant is significant. The samples storage at
room temperature showed only a small decline of L* value going from about 90 to 88.
There was an increase of ΔE* value after 8 month storage going from about 1 to 8
compared to 2 to 11 in Figure 2.5 (Figure 3.7, Figure 3.8). This indicates that DEY is
quite stable even at an aw of 0.66 in terms of color darkening.
Table 3.6: Kinetic analysis of apparent first-order hyperbolic model fit for the
change in L* value as a function of water activity (aw) for DEY stored at 35°C. Apparent first-
order model
aw
0.05 0.11 0.36 0.44 0.5 0.6
Best-fit values
L* max 89.1 88.2 89.2 89.5 89.3 88.8
L* min 83.1 85.1 83.2 82.4 79.9 80.2
k *103(day-1) 0.5 0. 3 0.6 0.7 0.9 0.9
95% CL
L* max 88.0 –
89.1
87.6 –
88.8
87.2 –
89.3
87.1 –
89.8
87.0 –
89.7
86.9 –
89.4
L* min 82.2 –
83.7
84.1 –
85.7
81.1 –
83.9
79.8 –
83.4
77.4 –
80.8
77.6 –
80.9
k *103(day-1) 0.4 – 0.6 0.2 – 0.4 0.4 – 0.8 0.4 – 0.9 0.7 - 1.2 0.6 – 1.1
Goodness of fit
R2 0.988 0.957 0.958 0.951 0.974 0.974
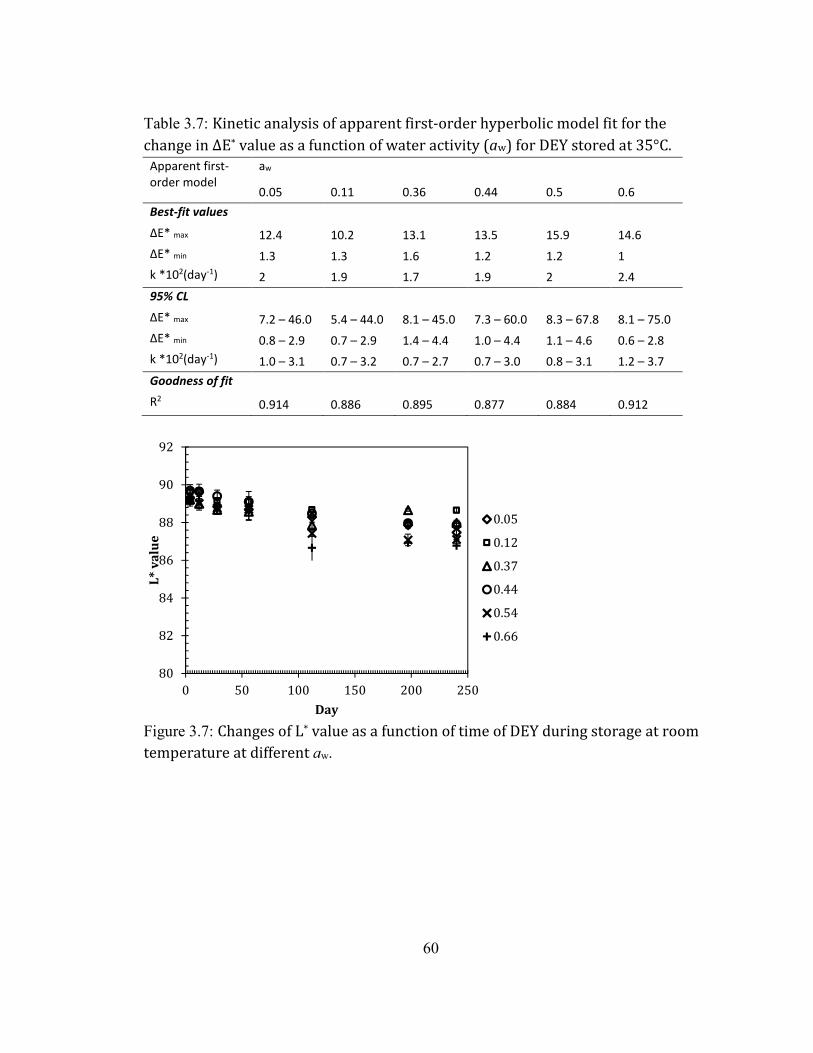
60
Table 3.7: Kinetic analysis of apparent first-order hyperbolic model fit for the
change in ΔE* value as a function of water activity (aw) for DEY stored at 35°C.
Apparent first-
order model
aw
0.05 0.11 0.36 0.44 0.5 0.6
Best-fit values
ΔE* max 12.4 10.2 13.1 13.5 15.9 14.6
ΔE* min 1.3 1.3 1.6 1.2 1.2 1
k *102(day-1) 2 1.9 1.7 1.9 2 2.4
95% CL
ΔE* max 7.2 – 46.0 5.4 – 44.0 8.1 – 45.0 7.3 – 60.0 8.3 – 67.8 8.1 – 75.0
ΔE* min 0.8 – 2.9 0.7 – 2.9 1.4 – 4.4 1.0 – 4.4 1.1 – 4.6 0.6 – 2.8
k *102(day-1) 1.0 – 3.1 0.7 – 3.2 0.7 – 2.7 0.7 – 3.0 0.8 – 3.1 1.2 – 3.7
Goodness of fit
R2 0.914 0.886 0.895 0.877 0.884 0.912
Figure 3.7: Changes of L* value as a function of time of DEY during storage at room
temperature at different aw.
80
82
84
86
88
90
92
0 50 100 150 200 250
L*
va
lue
Day
0.05
0.12
0.37
0.44
0.54
0.66
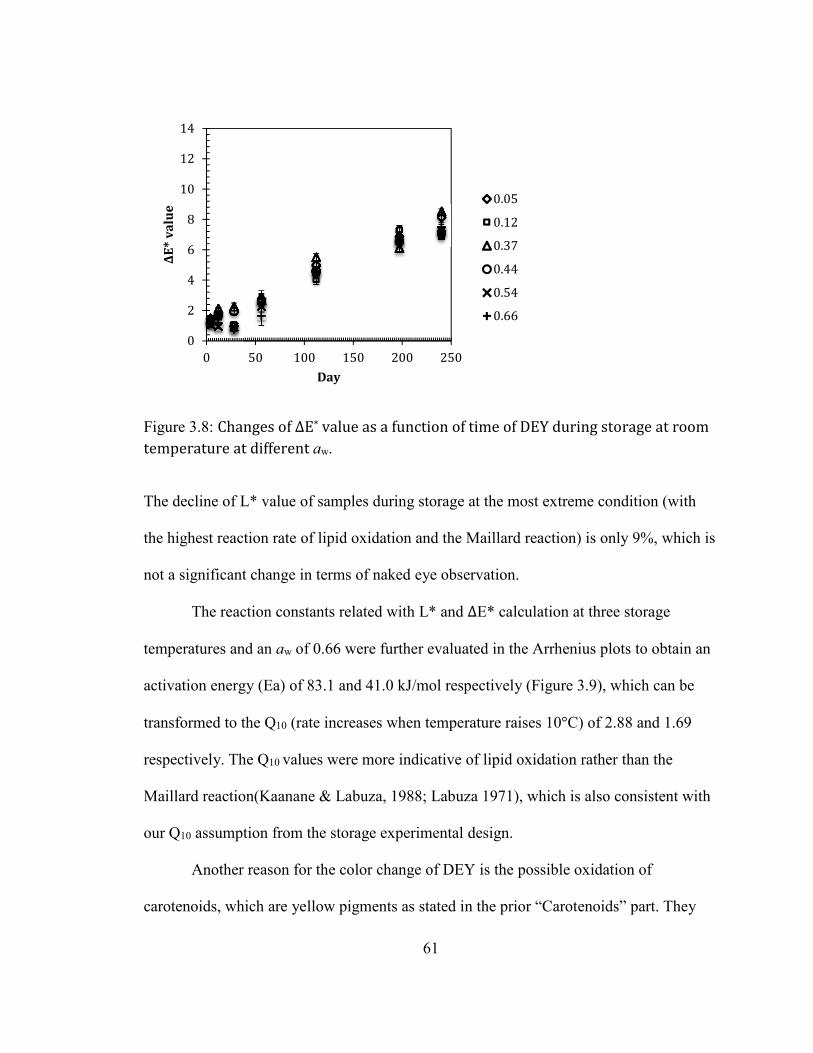
61
Figure 3.8: Changes of ΔE* value as a function of time of DEY during storage at room
temperature at different aw.
The decline of L* value of samples during storage at the most extreme condition (with
the highest reaction rate of lipid oxidation and the Maillard reaction) is only 9%, which is
not a significant change in terms of naked eye observation.
The reaction constants related with L* and ΔE* calculation at three storage
temperatures and an aw of 0.66 were further evaluated in the Arrhenius plots to obtain an
activation energy (Ea) of 83.1 and 41.0 kJ/mol respectively (Figure 3.9), which can be
transformed to the Q10 (rate increases when temperature raises 10°C) of 2.88 and 1.69
respectively. The Q10 values were more indicative of lipid oxidation rather than the
Maillard reaction(Kaanane & Labuza, 1988; Labuza 1971), which is also consistent with
our Q10 assumption from the storage experimental design.
Another reason for the color change of DEY is the possible oxidation of
carotenoids, which are yellow pigments as stated in the prior “Carotenoids” part. They
0
2
4
6
8
10
12
14
0 50 100 150 200 250
ΔE
* v
alu
e
Day
0.05
0.12
0.37
0.44
0.54
0.66
62
are highly unsaturated compounds and considered as antioxidants. Several studies have
shown the protection effect of xanthophylls as antioxidants in vitro (Krinsky, 2002; Yen
& Chen, 1995). Xanthophylls are capable of reducing the rate of increase of peroxide
value of soy oil (lipid oxidation), and are possibly able to protect against macular
degradation of the retina (Krinsky, 2002). Therefore, it is highly likely that xanthophylls
have been oxidized during storage and resulted in the decrease of the yellow color. So the
overall color change is contributed by lipid oxidation and the Maillard reaction and
possibly the oxidation of xanthophylls. Lipid oxidation and the Maillard reaction impact
on color causing an increase brown color, while the effect of oxidation of xanthophylls is
to decrease yellow color. These two trends are contrary to each other, which may be the
reason for only a slight decrease of L* value even during storage at the most severe
conditions (45°C, aw of 0.66).
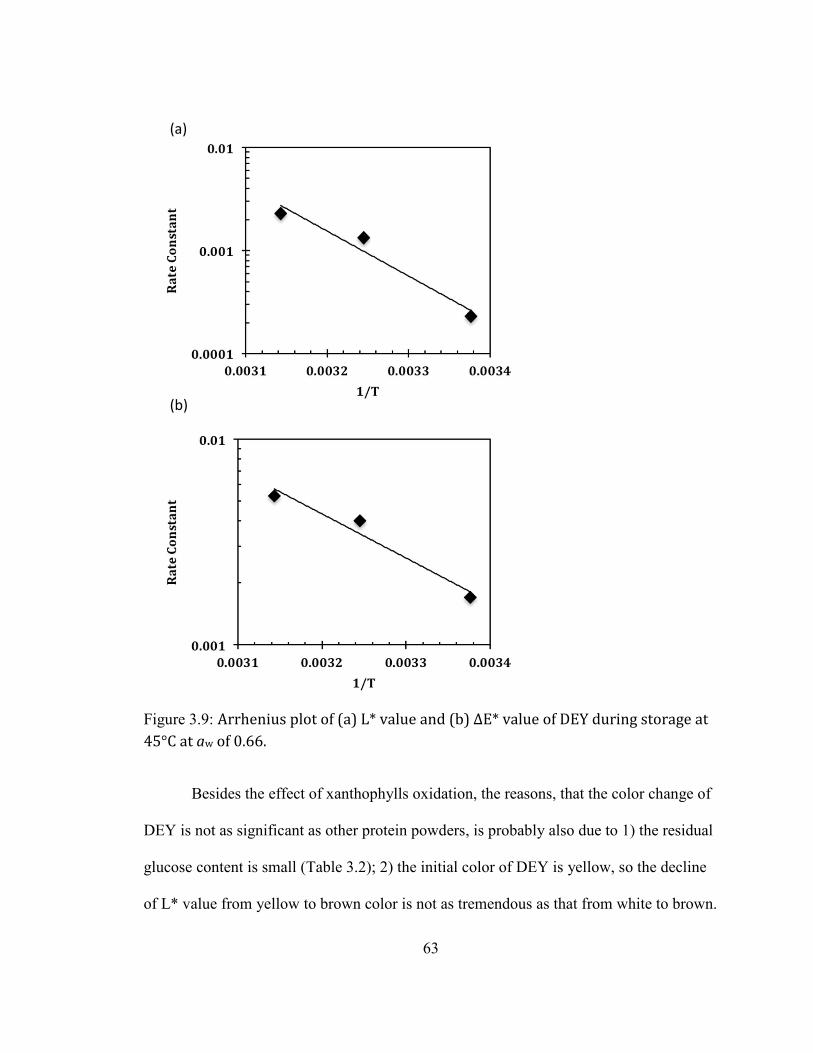
63
Figure 3.9: Arrhenius plot of (a) L* value and (b) ΔE* value of DEY during storage at
45°C at aw of 0.66.
Besides the effect of xanthophylls oxidation, the reasons, that the color change of
DEY is not as significant as other protein powders, is probably also due to 1) the residual
glucose content is small (Table 3.2); 2) the initial color of DEY is yellow, so the decline
of L* value from yellow to brown color is not as tremendous as that from white to brown.
(a)
(b)
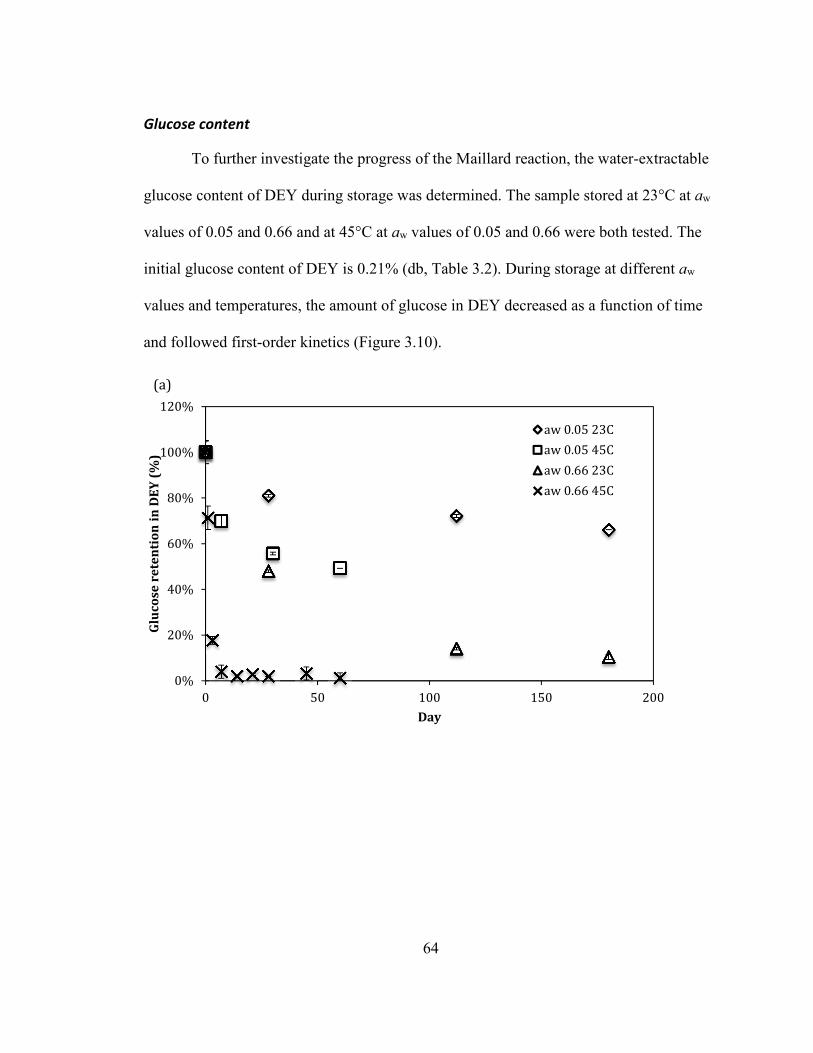
64
Glucose content
To further investigate the progress of the Maillard reaction, the water-extractable
glucose content of DEY during storage was determined. The sample stored at 23°C at aw
values of 0.05 and 0.66 and at 45°C at aw values of 0.05 and 0.66 were both tested. The
initial glucose content of DEY is 0.21% (db, Table 3.2). During storage at different aw
values and temperatures, the amount of glucose in DEY decreased as a function of time
and followed first-order kinetics (Figure 3.10).
0%
20%
40%
60%
80%
100%
120%
0 50 100 150 200
Glu
co
se r
ete
nti
on
in
DE
Y (
%)
Day
aw 0.05 23C
aw 0.05 45C
aw 0.66 23C
aw 0.66 45C
(a)
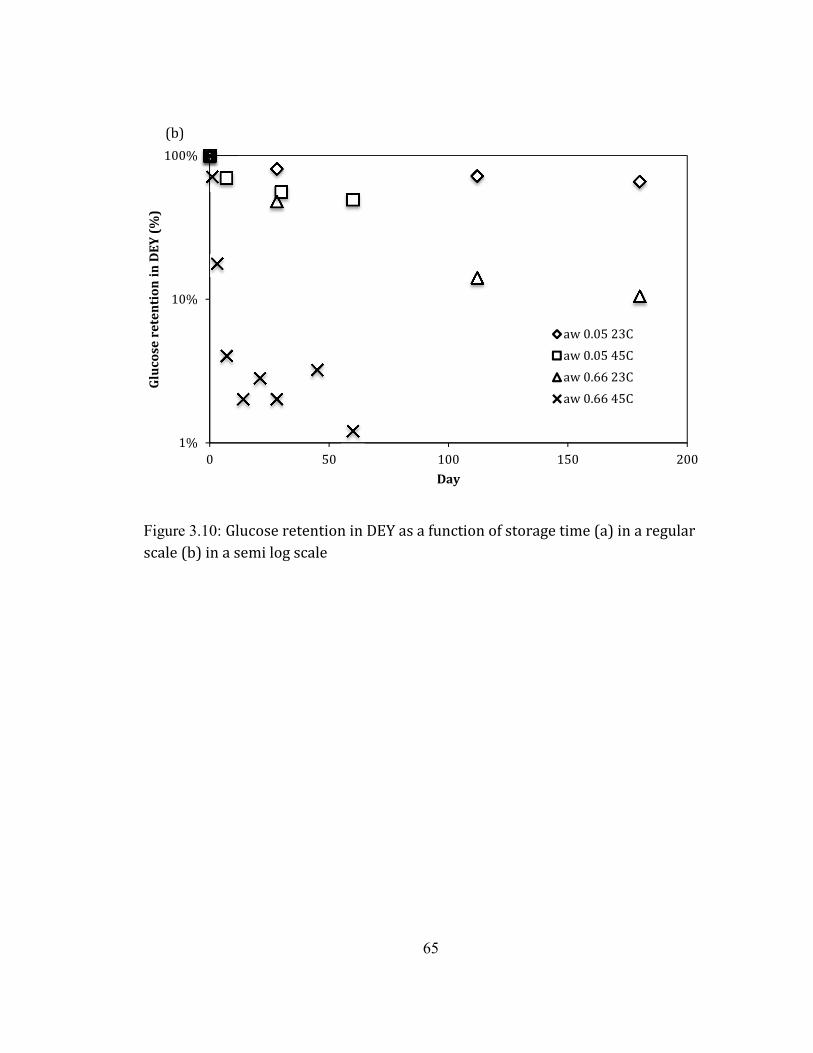
65
Figure 3.10: Glucose retention in DEY as a function of storage time (a) in a regular
scale (b) in a semi log scale
1%
10%
100%
0 50 100 150 200
Glu
co
se r
ete
nti
on
in
DE
Y (
%)
Day
aw 0.05 23C
aw 0.05 45C
aw 0.66 23C
aw 0.66 45C
(b)
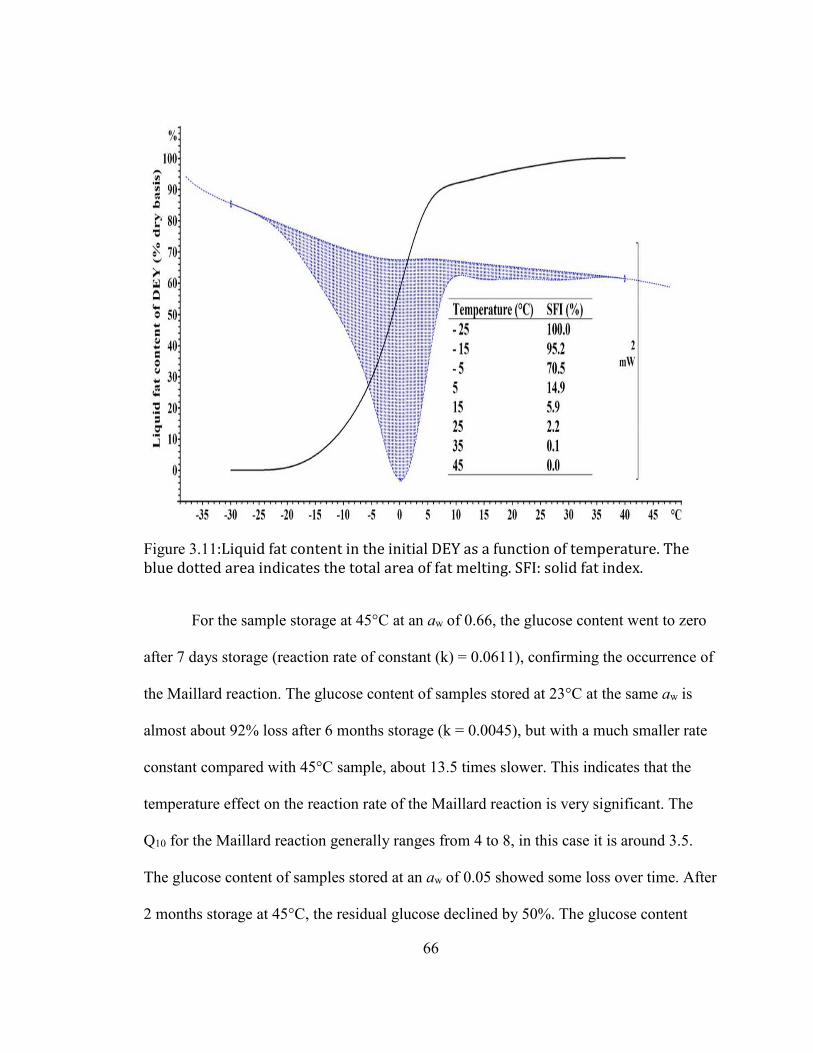
66
Figure 3.11:Liquid fat content in the initial DEY as a function of temperature. The
blue dotted area indicates the total area of fat melting. SFI: solid fat index.
For the sample storage at 45°C at an aw of 0.66, the glucose content went to zero
after 7 days storage (reaction rate of constant (k) = 0.0611), confirming the occurrence of
the Maillard reaction. The glucose content of samples stored at 23°C at the same aw is
almost about 92% loss after 6 months storage (k = 0.0045), but with a much smaller rate
constant compared with 45°C sample, about 13.5 times slower. This indicates that the
temperature effect on the reaction rate of the Maillard reaction is very significant. The
Q10 for the Maillard reaction generally ranges from 4 to 8, in this case it is around 3.5.
The glucose content of samples stored at an aw of 0.05 showed some loss over time. After
2 months storage at 45°C, the residual glucose declined by 50%. The glucose content
67
decline of samples stored at 23°C and an aw of 0.05 showed only 20% loss after 6 months
storage. However, even the slight progress of the Maillard reaction can lead to
tremendous food quality deterioration (Qinchun Rao & Labuza, 2012). The glucose
content decline at very low aw is very interesting. It should not happen according to the
food stability map. When aw is smaller than that of its m0, that is, at an aw of 0.05, the
Maillard reaction is stopped due to the lack of moisture as a reaction medium (T. Labuza
et al., 1970).
However, the reaction medium is not only restricted to moisture, liquid form
lipids can allow for the Maillard reaction (Kamman & Labuza, 1985). As seen in Figure
2.11, the SFI (solid fat index) of DEY samples is 2.2 and 0% at 25 and 45 °C,
respectively, indicating that at least 97% of the fats in DEY are in their liquid form
during storage at or above room temperature. These liquid form fats can act as a solvent
and mobilizing agent for glucose to be able to react with protein at the interface (the
Maillard reaction) (Figure 2.10 and 2.11). Overall, when aw is low; lipids, instead of
water, act as the reaction medium for the Maillard reaction. When the aw is greater than
that of its m0, the moisture is absorbed into the dry matrix and functioning as a solvent for
the dissolution of reactants, resulting in a faster reaction rate for the Maillard reaction.
Therefore, at an aw of 0.05 at 23 °C and 45 °C, the decrease of glucose content of DEY
was also due to the Maillard reaction while with liquid fats as the reaction medium to
provide the mobility and reduce the activation energy (Ea) (Figure 2.10). Similar results
have been found in a model system consisting of glucose (10%, g/g), monosodium
glutamate (MSG, 11.8%, g/g), and lipids (8%, g/g) during storage (Kamman & Labuza,
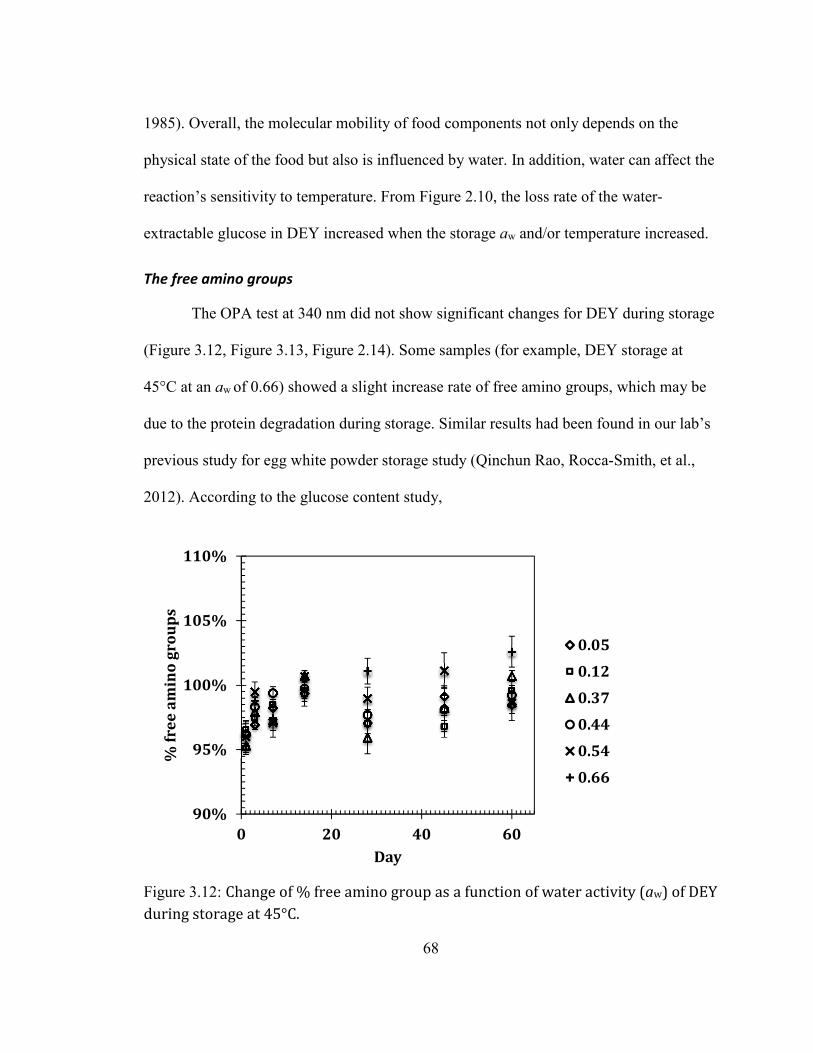
68
1985). Overall, the molecular mobility of food components not only depends on the
physical state of the food but also is influenced by water. In addition, water can affect the
reaction’s sensitivity to temperature. From Figure 2.10, the loss rate of the water-
extractable glucose in DEY increased when the storage aw and/or temperature increased.
The free amino groups
The OPA test at 340 nm did not show significant changes for DEY during storage
(Figure 3.12, Figure 3.13, Figure 2.14). Some samples (for example, DEY storage at
45°C at an aw of 0.66) showed a slight increase rate of free amino groups, which may be
due to the protein degradation during storage. Similar results had been found in our lab’s
previous study for egg white powder storage study (Qinchun Rao, Rocca-Smith, et al.,
2012). According to the glucose content study,
Figure 3.12: Change of % free amino group as a function of water activity (aw) of DEY
during storage at 45°C.
90%
95%
100%
105%
110%
0 20 40 60
% f
ree
am
ino
gro
up
s
Day
0.05
0.12
0.37
0.44
0.54
0.66
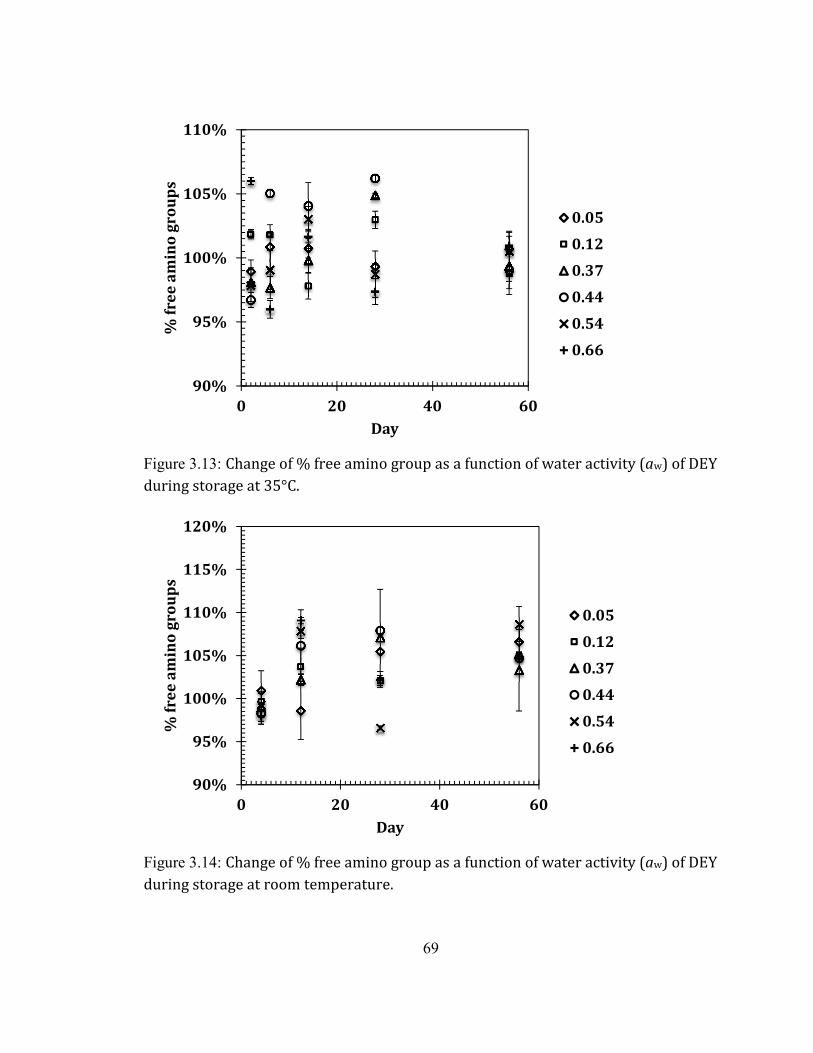
69
Figure 3.13: Change of % free amino group as a function of water activity (aw) of DEY
during storage at 35°C.
Figure 3.14: Change of % free amino group as a function of water activity (aw) of DEY
during storage at room temperature.
90%
95%
100%
105%
110%
0 20 40 60
% f
ree
am
ino
gro
up
s
Day
0.05
0.12
0.37
0.44
0.54
0.66
90%
95%
100%
105%
110%
115%
120%
0 20 40 60
% f
ree
am
ino
gro
up
s
Day
0.05
0.12
0.37
0.44
0.54
0.66
70
the occurrence of the Maillard reaction is confirmed. Therefore, a decrease of the free
amino groups should be observed to correspond with the concurrent loss of glucose. The
reason for no decline of free amino groups may be due to the lipid oxidation. Lipid
oxidation is an oxidation reaction of unsaturated lipids/fatty acids, producing numerous
substances that are fluorescence reactive (Frankel, 2005). Therefore, the reading at 340
nm may be interfered with those lipid oxidation products. Another possible reason may
come from the interference of yellow pigments (referred to Carotenoids), as they are hard
to wash out during sample preparation. OPA is a reliable chemical method for the
measurement of free amino groups, developed by Vigo (Vigo, Malec, Gomez, & Llosa,
1992), if has been found suitable for a protein bar model system, and high carbohydrate
samples. However, this method is probably not a good measurement of available amino
groups for samples rich in fat/unsaturated fat. As a consequence, for the measurement of
the progress of the Maillard reaction in high fat content samples, more direct
methodology should be considered, such as for the measurement of glucose, and using
mass spectrometry (MS) to detect certain Maillard reaction products.
The Maillard reaction products
The Maillard reaction products were also measured using front-face fluorescence
according to Karoui’s work (Karoui et al., 2007). Front-face fluorescence is a technology
of analysis of fluorescence of a sample. Basically, a beam of light excites the electrons of
certain molecules moving from the ground state to an excited state. After that, the excited
molecule rapidly relaxes from the higher vibrational state to the lowest vibrational state.
During this period, the molecular decay from the excited state to the ground state through
71
the emission of a photon, can be detected using fluorescence spectroscopy (Strasburg &
Ludescher, 1995). Front-face fluorescence has several advantages for the measurements
of molecular interactions and reactions: 1) It is much more sensitive than other
spectrophometric technologies (Strasburg & Ludescher, 1995)(Karoui et al., 2005); 2)
Fluorescence compounds are very sensitive to their environment change, such as
tryptophan, the most commonly intrinsic probe used for protein analysis. The fluorescent
property of tryptophan buried in the interior core of protein is totally different from that
exposed on the surface. This characteristic enables one to identify conformational
changes as well as interactions of protein with other compounds in food systems, such as
sugar and lipids (Steiner & Weinryb, 1971); 3) It is simple, rapid, and accurate, and only
requires very small quantities of a sample (Karoui et al., 2005; Strasburg & Ludescher,
1995).
The results of front-face fluorescence are shown in Figure 3.15. Samples stored at
an aw of 0.66 and either 23°C or 45°C were tested. As we can see, the emission spectra of
all samples (vacuum packaged at -20°C) have three peaks, with the highest peak
appearing at around 425 nm followed by peak at around 530 nm and 475 nm, which is a
little bit different as compared to other Front-face studies (Karoui et al., 2007; A.
Kulmyrzaev & Dufour, 2002). The other studies showed either only one peak (at around
425 nm) or two peaks (at around 425 nm and 530 nm) as a result of the Maillard reaction
products. The reason for the difference will be stated later in detail (Refer to “The
progress of lipid oxidation”). One major Maillard reaction product detected by Front-face
fluorescence is furosine. Furosine is one of the hydrolysis products from the Amadori
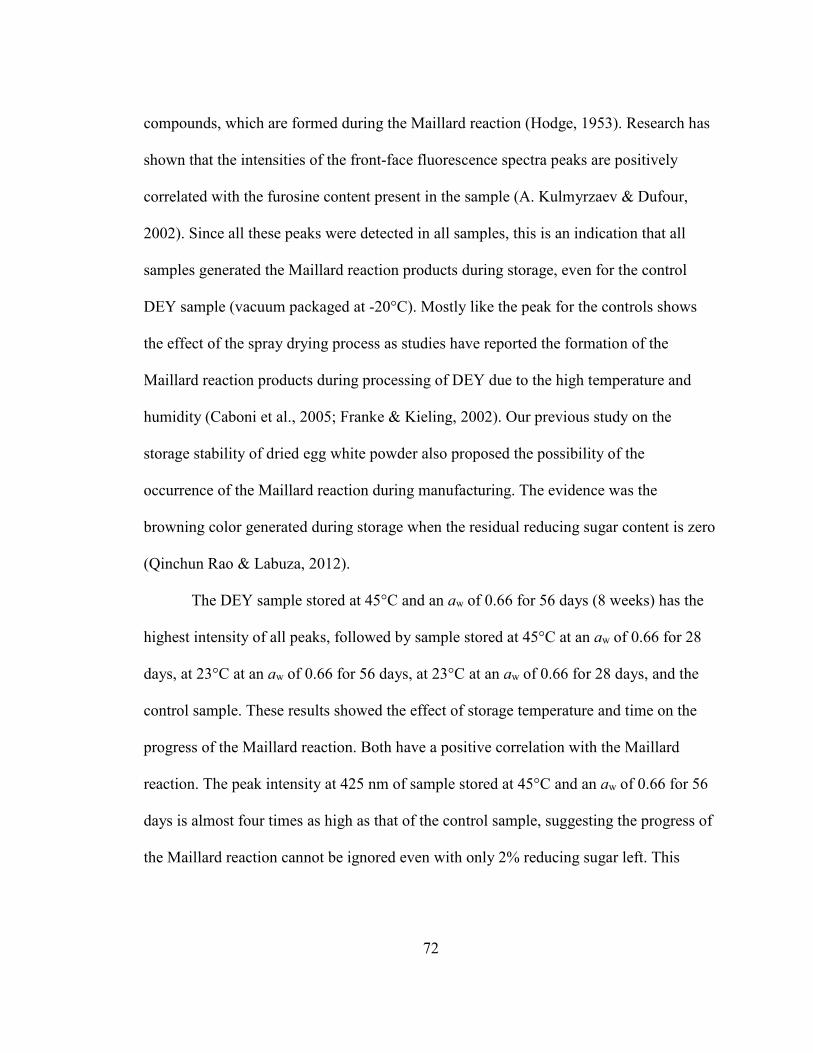
72
compounds, which are formed during the Maillard reaction (Hodge, 1953). Research has
shown that the intensities of the front-face fluorescence spectra peaks are positively
correlated with the furosine content present in the sample (A. Kulmyrzaev & Dufour,
2002). Since all these peaks were detected in all samples, this is an indication that all
samples generated the Maillard reaction products during storage, even for the control
DEY sample (vacuum packaged at -20°C). Mostly like the peak for the controls shows
the effect of the spray drying process as studies have reported the formation of the
Maillard reaction products during processing of DEY due to the high temperature and
humidity (Caboni et al., 2005; Franke & Kieling, 2002). Our previous study on the
storage stability of dried egg white powder also proposed the possibility of the
occurrence of the Maillard reaction during manufacturing. The evidence was the
browning color generated during storage when the residual reducing sugar content is zero
(Qinchun Rao & Labuza, 2012).
The DEY sample stored at 45°C and an aw of 0.66 for 56 days (8 weeks) has the
highest intensity of all peaks, followed by sample stored at 45°C at an aw of 0.66 for 28
days, at 23°C at an aw of 0.66 for 56 days, at 23°C at an aw of 0.66 for 28 days, and the
control sample. These results showed the effect of storage temperature and time on the
progress of the Maillard reaction. Both have a positive correlation with the Maillard
reaction. The peak intensity at 425 nm of sample stored at 45°C and an aw of 0.66 for 56
days is almost four times as high as that of the control sample, suggesting the progress of
the Maillard reaction cannot be ignored even with only 2% reducing sugar left. This
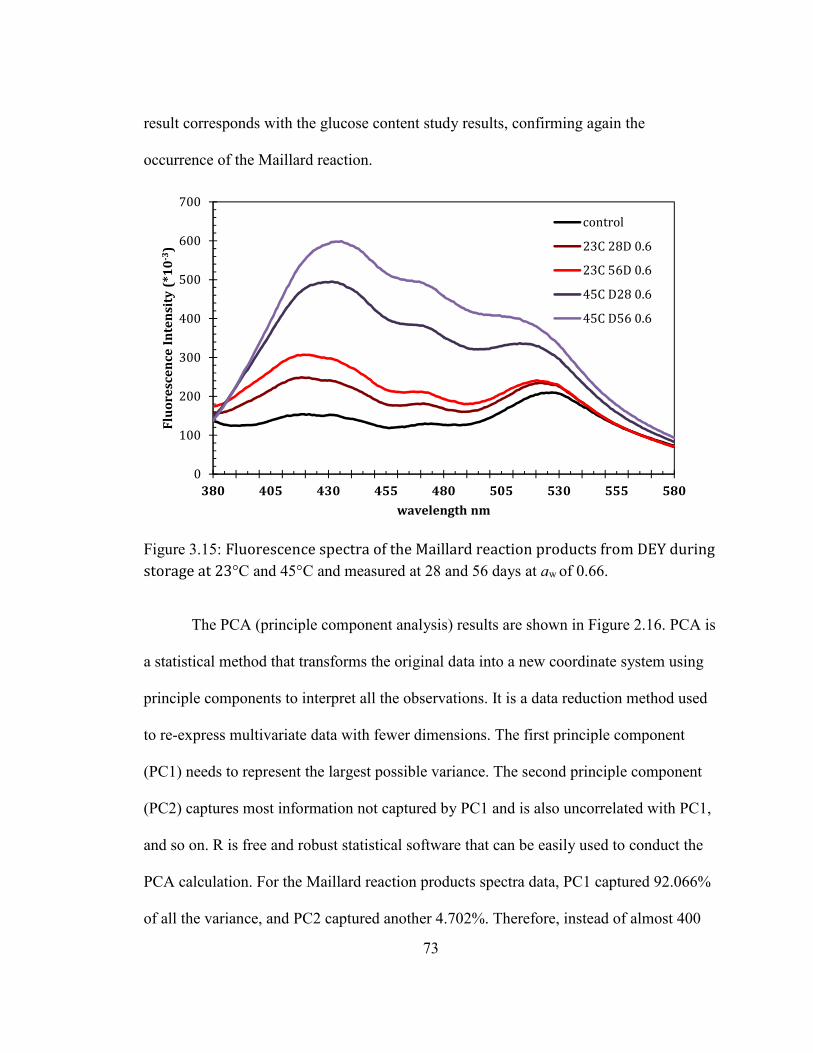
73
result corresponds with the glucose content study results, confirming again the
occurrence of the Maillard reaction.
Figure 3.15: Fluorescence spectra of the Maillard reaction products from DEY during
storage at 23°C and 45°C and measured at 28 and 56 days at aw of 0.66.
The PCA (principle component analysis) results are shown in Figure 2.16. PCA is
a statistical method that transforms the original data into a new coordinate system using
principle components to interpret all the observations. It is a data reduction method used
to re-express multivariate data with fewer dimensions. The first principle component
(PC1) needs to represent the largest possible variance. The second principle component
(PC2) captures most information not captured by PC1 and is also uncorrelated with PC1,
and so on. R is free and robust statistical software that can be easily used to conduct the
PCA calculation. For the Maillard reaction products spectra data, PC1 captured 92.066%
of all the variance, and PC2 captured another 4.702%. Therefore, instead of almost 400
0
100
200
300
400
500
600
700
380 405 430 455 480 505 530 555 580
Flu
ore
sce
nc
e I
nte
nsi
ty (
*10
-3)
wavelength nm
control
23C 28D 0.6
23C 56D 0.6
45C D28 0.6
45C D56 0.6
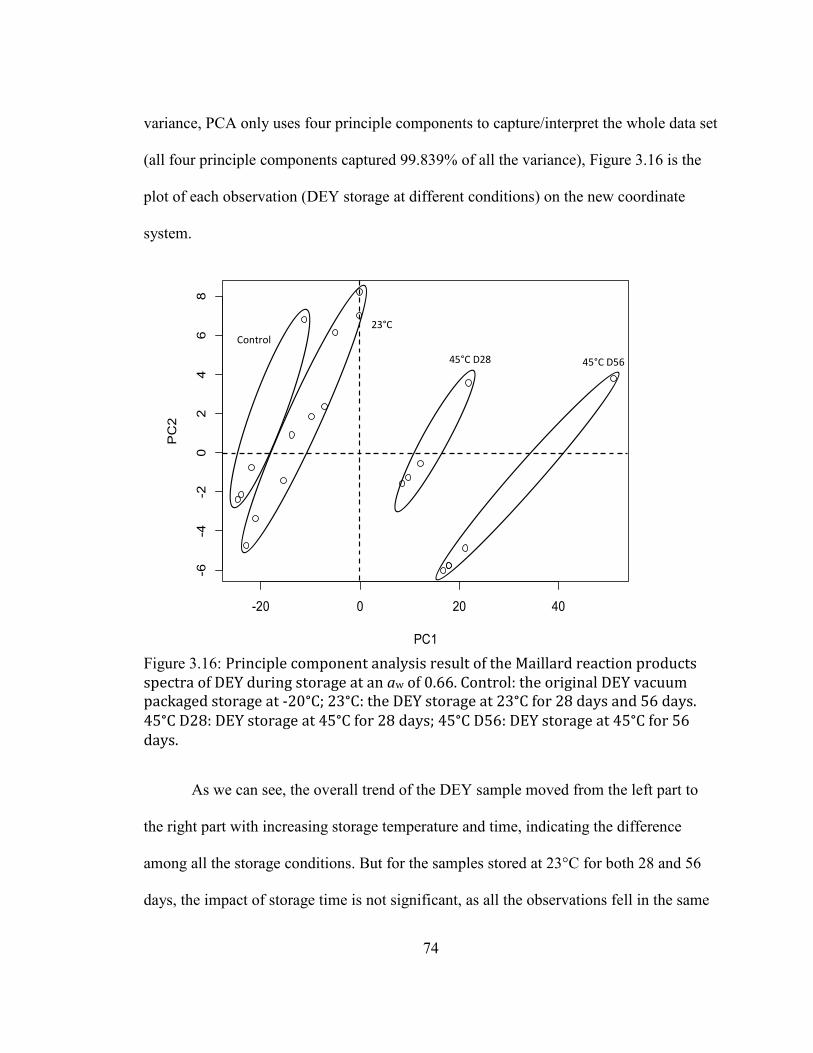
74
variance, PCA only uses four principle components to capture/interpret the whole data set
(all four principle components captured 99.839% of all the variance), Figure 3.16 is the
plot of each observation (DEY storage at different conditions) on the new coordinate
system.
Figure 3.16: Principle component analysis result of the Maillard reaction products
spectra of DEY during storage at an aw of 0.66. Control: the original DEY vacuum
packaged storage at -20°C; 23°C: the DEY storage at 23°C for 28 days and 56 days.
45°C D28: DEY storage at 45°C for 28 days; 45°C D56: DEY storage at 45°C for 56
days.
As we can see, the overall trend of the DEY sample moved from the left part to
the right part with increasing storage temperature and time, indicating the difference
among all the storage conditions. But for the samples stored at 23°C for both 28 and 56
days, the impact of storage time is not significant, as all the observations fell in the same
-20 0 20 40
-6-4
-20
24
68
PC1
PC
2
45°C D56 45°C D28
23°C
Control
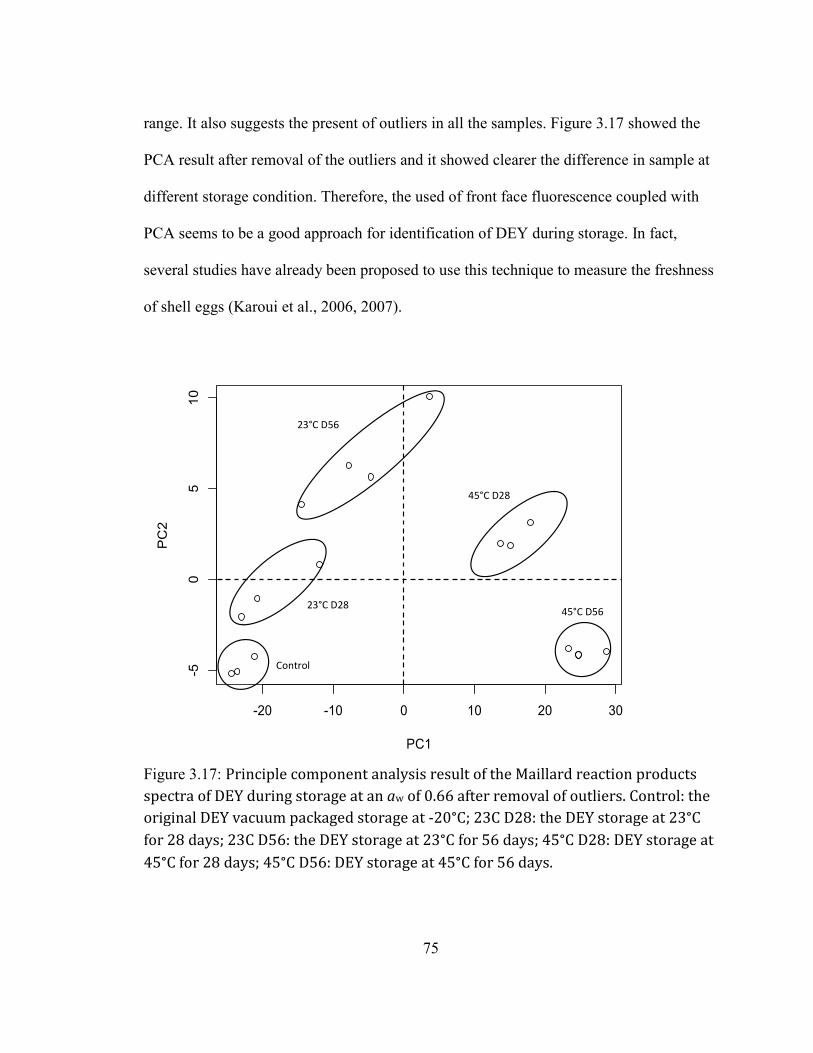
75
range. It also suggests the present of outliers in all the samples. Figure 3.17 showed the
PCA result after removal of the outliers and it showed clearer the difference in sample at
different storage condition. Therefore, the used of front face fluorescence coupled with
PCA seems to be a good approach for identification of DEY during storage. In fact,
several studies have already been proposed to use this technique to measure the freshness
of shell eggs (Karoui et al., 2006, 2007).
Figure 3.17: Principle component analysis result of the Maillard reaction products
spectra of DEY during storage at an aw of 0.66 after removal of outliers. Control: the
original DEY vacuum packaged storage at -20°C; 23C D28: the DEY storage at 23°C
for 28 days; 23C D56: the DEY storage at 23°C for 56 days; 45°C D28: DEY storage at
45°C for 28 days; 45°C D56: DEY storage at 45°C for 56 days.
-20 -10 0 10 20 30
-50
51
0
PC1
PC
2
Control
23°C D28
23°C D56
45°C D28
45°C D56
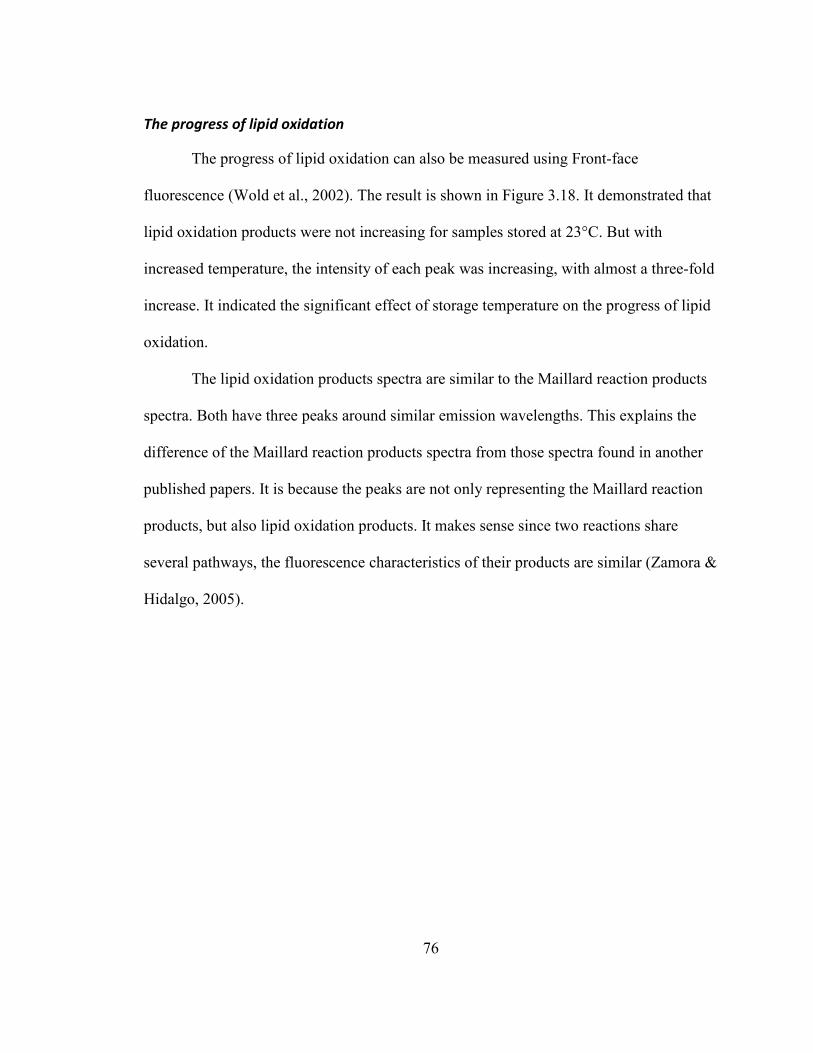
76
The progress of lipid oxidation
The progress of lipid oxidation can also be measured using Front-face
fluorescence (Wold et al., 2002). The result is shown in Figure 3.18. It demonstrated that
lipid oxidation products were not increasing for samples stored at 23°C. But with
increased temperature, the intensity of each peak was increasing, with almost a three-fold
increase. It indicated the significant effect of storage temperature on the progress of lipid
oxidation.
The lipid oxidation products spectra are similar to the Maillard reaction products
spectra. Both have three peaks around similar emission wavelengths. This explains the
difference of the Maillard reaction products spectra from those spectra found in another
published papers. It is because the peaks are not only representing the Maillard reaction
products, but also lipid oxidation products. It makes sense since two reactions share
several pathways, the fluorescence characteristics of their products are similar (Zamora &
Hidalgo, 2005).
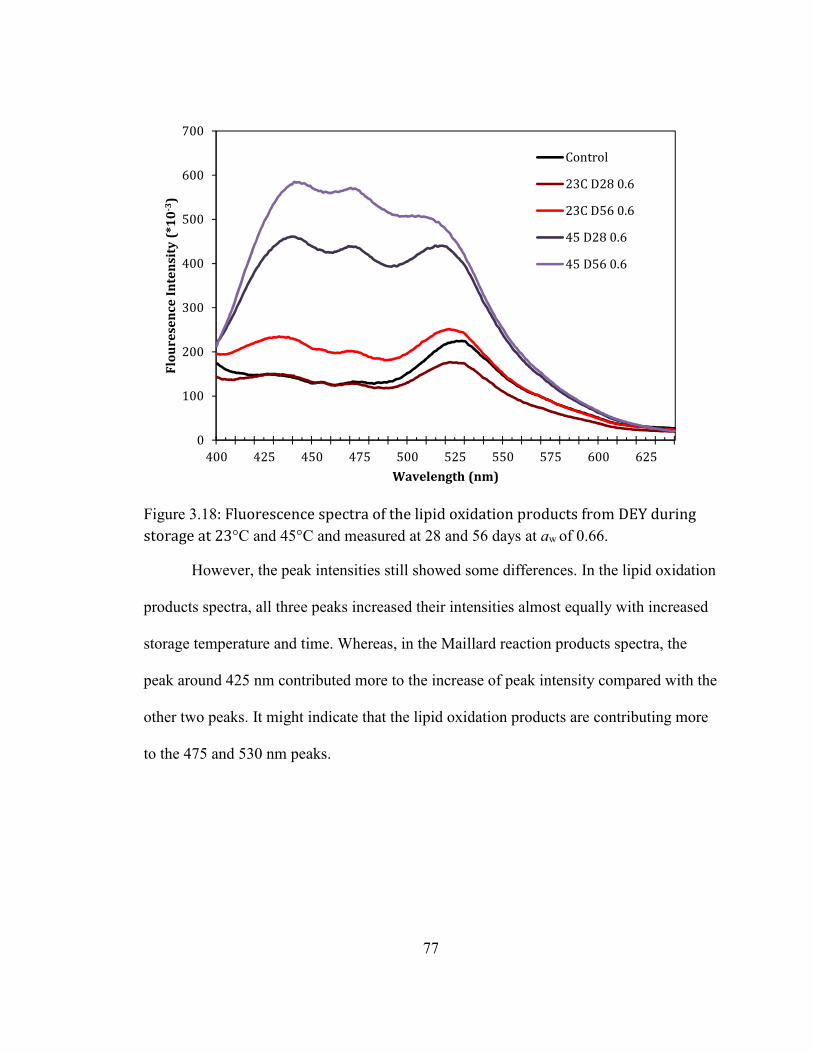
77
Figure 3.18: Fluorescence spectra of the lipid oxidation products from DEY during
storage at 23°C and 45°C and measured at 28 and 56 days at aw of 0.66.
However, the peak intensities still showed some differences. In the lipid oxidation
products spectra, all three peaks increased their intensities almost equally with increased
storage temperature and time. Whereas, in the Maillard reaction products spectra, the
peak around 425 nm contributed more to the increase of peak intensity compared with the
other two peaks. It might indicate that the lipid oxidation products are contributing more
to the 475 and 530 nm peaks.
0
100
200
300
400
500
600
700
400 425 450 475 500 525 550 575 600 625
Flo
ure
sen
ce
In
ten
sity
(*1
0-3
)
Wavelength (nm)
Control
23C D28 0.6
23C D56 0.6
45 D28 0.6
45 D56 0.6
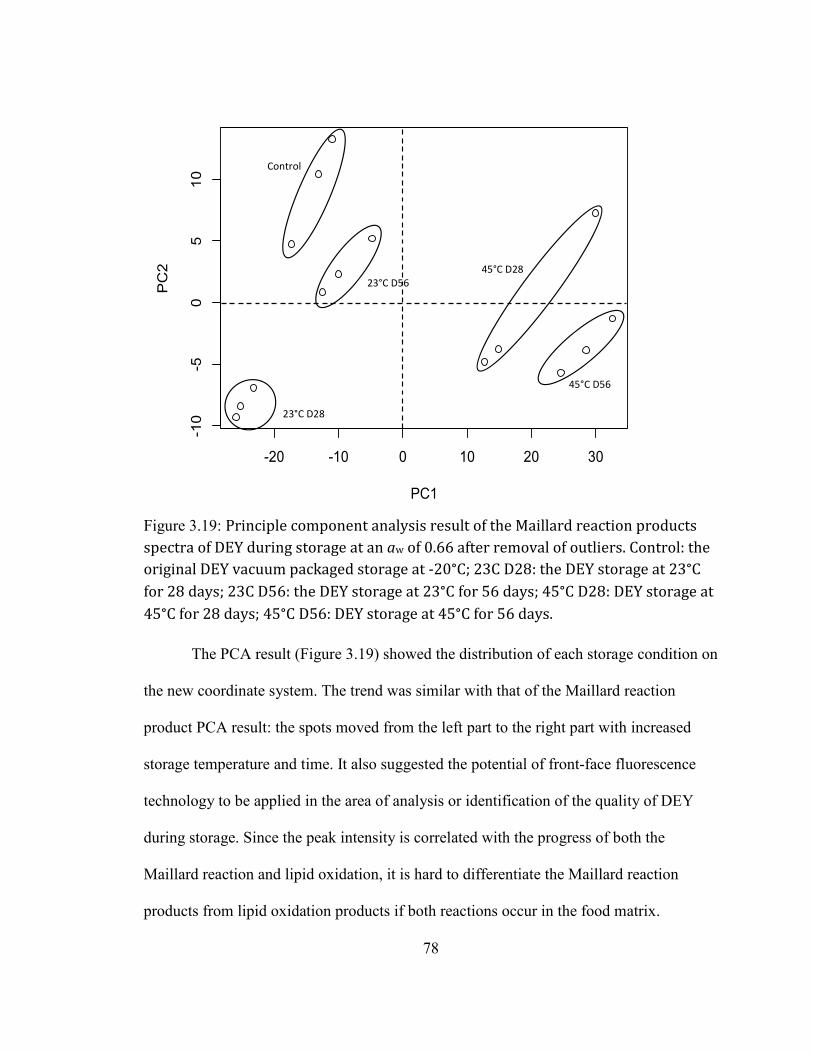
78
Figure 3.19: Principle component analysis result of the Maillard reaction products
spectra of DEY during storage at an aw of 0.66 after removal of outliers. Control: the
original DEY vacuum packaged storage at -20°C; 23C D28: the DEY storage at 23°C
for 28 days; 23C D56: the DEY storage at 23°C for 56 days; 45°C D28: DEY storage at
45°C for 28 days; 45°C D56: DEY storage at 45°C for 56 days.
The PCA result (Figure 3.19) showed the distribution of each storage condition on
the new coordinate system. The trend was similar with that of the Maillard reaction
product PCA result: the spots moved from the left part to the right part with increased
storage temperature and time. It also suggested the potential of front-face fluorescence
technology to be applied in the area of analysis or identification of the quality of DEY
during storage. Since the peak intensity is correlated with the progress of both the
Maillard reaction and lipid oxidation, it is hard to differentiate the Maillard reaction
products from lipid oxidation products if both reactions occur in the food matrix.
-20 -10 0 10 20 30
-10
-50
51
0
PC1
PC
2Control
23°C D28
23°C D56
45°C D28
45°C D56
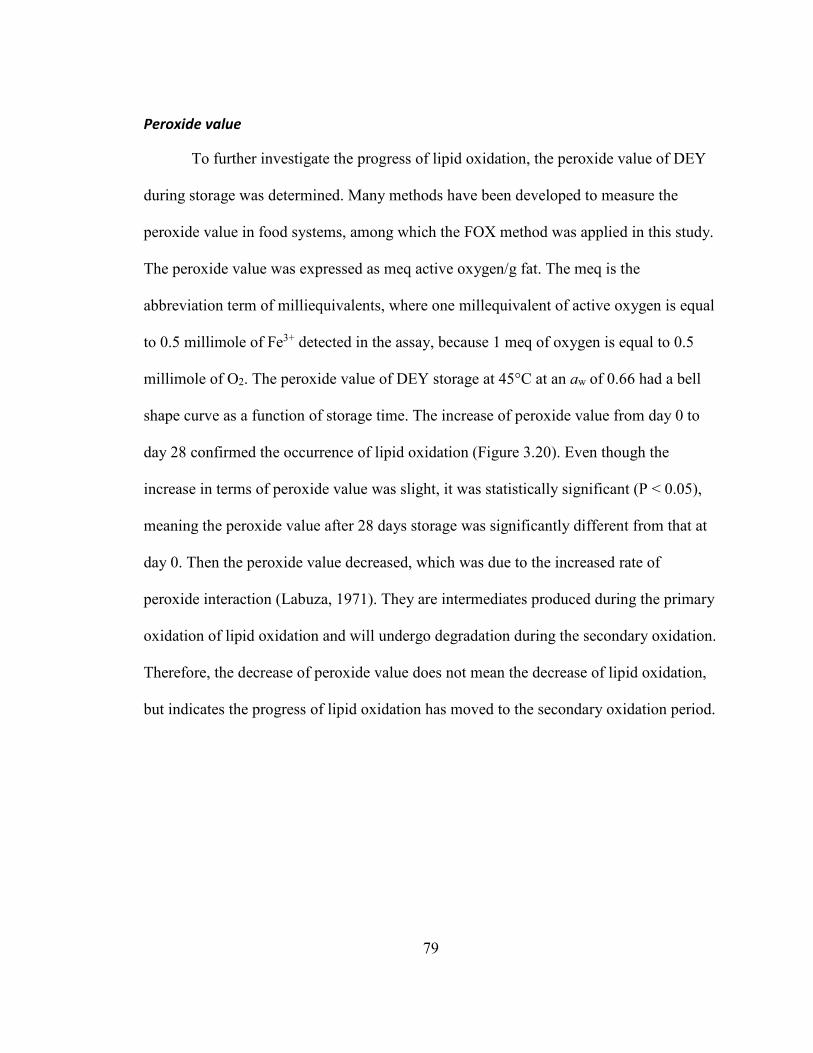
79
Peroxide value
To further investigate the progress of lipid oxidation, the peroxide value of DEY
during storage was determined. Many methods have been developed to measure the
peroxide value in food systems, among which the FOX method was applied in this study.
The peroxide value was expressed as meq active oxygen/g fat. The meq is the
abbreviation term of milliequivalents, where one millequivalent of active oxygen is equal
to 0.5 millimole of Fe3+ detected in the assay, because 1 meq of oxygen is equal to 0.5
millimole of O2. The peroxide value of DEY storage at 45°C at an aw of 0.66 had a bell
shape curve as a function of storage time. The increase of peroxide value from day 0 to
day 28 confirmed the occurrence of lipid oxidation (Figure 3.20). Even though the
increase in terms of peroxide value was slight, it was statistically significant (P < 0.05),
meaning the peroxide value after 28 days storage was significantly different from that at
day 0. Then the peroxide value decreased, which was due to the increased rate of
peroxide interaction (Labuza, 1971). They are intermediates produced during the primary
oxidation of lipid oxidation and will undergo degradation during the secondary oxidation.
Therefore, the decrease of peroxide value does not mean the decrease of lipid oxidation,
but indicates the progress of lipid oxidation has moved to the secondary oxidation period.
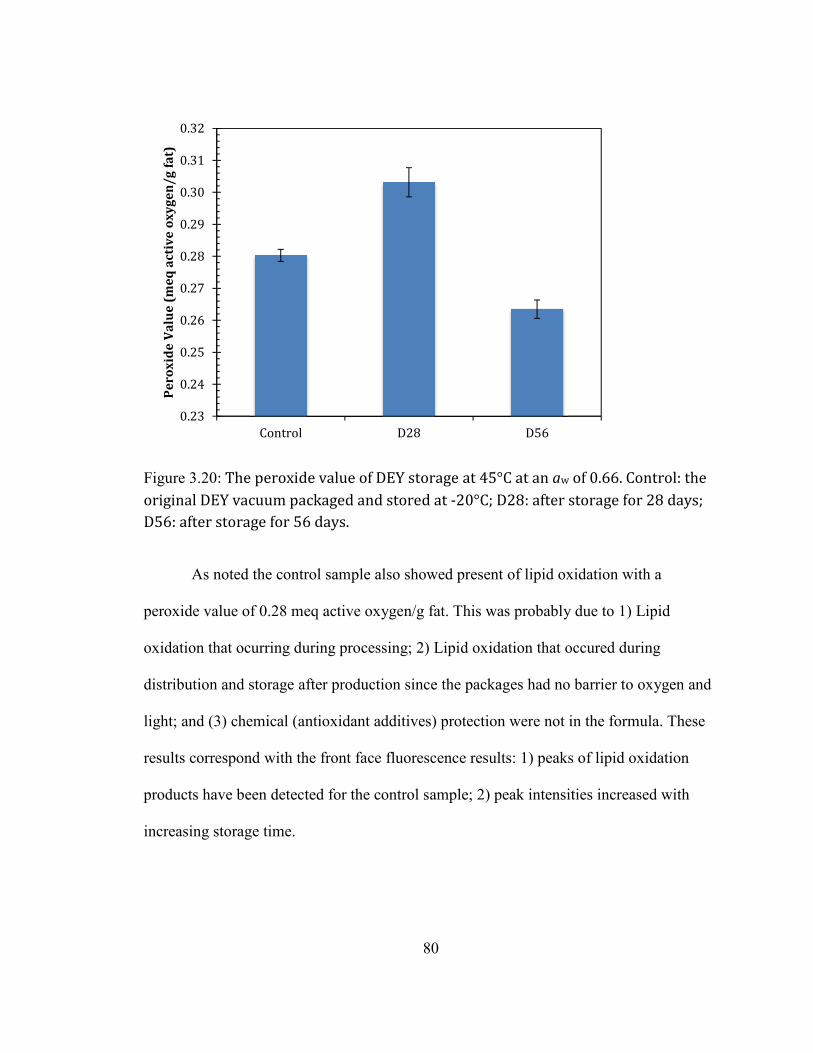
80
Figure 3.20: The peroxide value of DEY storage at 45°C at an aw of 0.66. Control: the
original DEY vacuum packaged and stored at -20°C; D28: after storage for 28 days;
D56: after storage for 56 days.
As noted the control sample also showed present of lipid oxidation with a
peroxide value of 0.28 meq active oxygen/g fat. This was probably due to 1) Lipid
oxidation that ocurring during processing; 2) Lipid oxidation that occured during
distribution and storage after production since the packages had no barrier to oxygen and
light; and (3) chemical (antioxidant additives) protection were not in the formula. These
results correspond with the front face fluorescence results: 1) peaks of lipid oxidation
products have been detected for the control sample; 2) peak intensities increased with
increasing storage time.
0.23
0.24
0.25
0.26
0.27
0.28
0.29
0.30
0.31
0.32
Control D28 D56
Pe
rox
ide
Va
lue
(m
eq
ac
tiv
e o
xy
ge
n/
g f
at)
81
Discussion
Storage induced changes in physicochemical properties of DEY is caused by two
chemical reactions: lipid oxidation and the Maillard reaction, which are also the two
major reasons of quality deterioration of intermediate moisture food (IMF) products
(Theodore P Labuza, 1980). With the high content of unsaturated fatty acids and 0.21%
(Table 3.2) of glucose, lipid oxidation and the Maillard reaction did happen during
storage and were confirmed using multiple test procedures.
The effect of aw is significant on physicochemical properties, as well as the
temperature effect. The rate of loss of glucose increased with increasing aw. Even though
the L* value decrease rate constant and ΔE* value increase rate constant did not show a
significant difference with different aw, it still indirectly showed the applicability of the
food stability map. When adding up both lipid oxidation and the Maillard reaction rate,
because both contributed to the color change, the rate difference is not that much to show
a significant difference with aw. If just looking at the rate of the decline of the L* value at
45°C (table 2.3), the lowest rate appears at an aw of 0.12, which is near the aw value that
corresponded to mo (Figure 2.1), where there is the lowest reaction rate of lipid oxidation
and the Maillard reaction. Therefore, storage conditions (temperature and humidity) are
crucial in terms of storage stability.
Besides the storage conditions, the processing condition is also important in the
storage stability aspect. Our previous paper showed the impact of the drying process on
the storage stability (Qinchun Rao & Labuza, 2012). The Maillard reaction occurred
during the drying process and had a prolonged effect on the stability of DEW during
82
storage, as the color of DEW changed from white to yellow with zero glucose content
(Qinchun Rao & Labuza, 2012). Other studies have also confirmed the occurrence of the
Maillard reaction and lipid oxidation during the drying process of eggs with detection of
the Maillard reaction products and cholesterol oxidation products (COPs) (Caboni et al.,
2005; Franke & Kieling, 2002). Therefore, possible protection approaches may need to
applied to reduce/inhibit those reactions.
Possible approaches include complete removal of reducing sugars (glucose) as
well as adding antioxidants. Another approach would be replace spray drying with freeze
drying, however, the cost is expensive and may not be practical for the egg ingredient
industry. Optimizing spray drying conditions to minimize the heat treatment may be more
feasible, factors like inlet and outlet temperature, and spraying time. Therefore, the
practical way to limit the damage caused by two chemical reactions is using the way we
apply in food preservation, i.e. setting multiple hurdles. As each hurdle can reduce the
reactions to some extent, all of them together may be able to inhibit or at least reduce the
progress of both reactions.
It may seem that the slight change of color may not be a big problem for the egg
ingredient industry. However, the impact of the two chemical reactions is not only on
color, but also on protein and lipid quality, which may lead to the loss of functionality
and bioactivity, and this part will be presented and discussed in detail in Chapter 3.
Conclusion
Both the Maillard reaction and lipid oxidation are contributing to the
physicochemical changes of DEY during storage. The progress of the Maillard reaction
83
and lipid oxidation are dependent of extrinsic factors: aw and temperature. Therefore, the
physicochemical changes of DEY during storage are related with the storage humidity
and temperature. As a consequence, keeping DEY at relatively low humidity and
temperature environment helps maintain its quality and maximize its shelf life.
Acknowledgement:
The authors would like to thank Deb-EL Food Products, LLC for providing the spray-
dried egg yolk powder. Thanks also to Lian Lian for the help on principle components
analysis using R. This these research was funded by the American Egg Board and we
thank them for their support.
84
Chapter 4 Storage induced protein aggregation of a commercial spray-
dried egg yolk powder
Summary
Protein aggregation is defined as “any protein species in non-native states and
whose sizes are larger than that of the native protein” (W. Wang, Nema, & Teagarden,
2010). The formation of protein aggregation during processing and/or storage is
dependent on many factors including intrinsic and extrinsic factors. In this study, we
evaluated the extrinsic factors (storage environment) that resulted in protein aggregation
during storage of a commercial spray-dried egg yolk powder (DEY). Overall, DEY after
56-day storage at aw of 0.66 and 45°C (an abuse condition) was studied. We found an
increase in both soluble and insoluble protein aggregates as compared to the original
DEY. The molecular mechanism of protein aggregate formation was further evaluated.
DEY after 56-day storage at 45°C had no native proteins left as observed by an increase
in disulfide bonds and lipid-protein interactions. The total of 32 proteins were identified
to form soluble and insoluble high molecular weight protein aggregates (HMWPAs of >
200 kDa). They were typical egg yolk proteins and egg white proteins including serum
albumin, vitellogenin, apovitellenin, as well as ovotansferrin, ovalbumin, lysozyme,
ovomucoid, and ovastatin. Most of them contain disulfide bonds and some of them
contain ligand and fatty acids binding sites. The formation of protein aggregates was
mainly from disulfide bond formation/exchange or other direct chemical linkages induced
85
by lipid oxidation and the Maillard reaction. Furthermore, the effective approaches to
avoid DEY deterioration during storage are discussed.
Introduction
Chicken egg yolk contains many biologically active substances including
phospholipids, long chain polyunsaturated fatty acids, phosvitin, lipoproteins, as well as
sialic acid and antibodies (IgY), which provides egg yolk to have a broad application not
only in food but also in medical, pharmaceutical, cosmetic, nutraceutical and
biotechnological industries (Anton, Nau, & Nys, 2006; Hartmann & Wilhelmson, 2001).
Dried egg yolk powder (DEY) is an egg product, which enjoys several advantages over
liquid egg yolk especially in terms of preservation stability (American Egg Board Egg
product reference guide. 2006)(American Egg Board EGGSolutions - The complete
reference for egg products. 2004). However, DEY still suffers from deterioration when
stored in an abused environment such as high humidity (aw > 0.6) and/or high
temperature (≥45°C). In Chapter 2, we reported a decrease of L* value (brightness) and
glucose content, as well as increase of ΔE* value and peroxide value during storage of
DEY. We proposed that these physicochemical changes were mainly due to the Maillard
reaction and lipid oxidation. However, these two reactions can provide more than color
changes. They are also related with formation of protein aggregates.
The Maillard reaction was found to correlate with whey protein aggregates as
decreasing glucose content/free amino acids correlated with an increase of protein
aggregates (Chevalier, Chobert, Dalgalaprondo, & Haertle, 2001; Theodore P Labuza,
1980; Nagaraj, Shipanova, & Faust, 1996; Zhou et al., 2013). However the aggregation
86
mechanism at the molecular lever has not been completely discovered because of the
hundreds or possible thousands of products produced through the Maillard reaction. It is
possible that some small molecular compounds such as reducing compounds from lipid
oxidation (aldehydes and ketones) and from the reductions produced in intermediate step
of the Maillard reaction they may then result in protein cross-linking. Lipid oxidation
shares some pathways with the Maillard reaction (Zamora & Hidalgo, 2005), which may
be a consequence of protein aggregates. Besides this, the lipid and/or lipid peroxyl
radicals can cause damage to proteins and amino acids, leading to further polymerization,
which has been shown in lipid-protein/amino acid systems in the 1960s (Desai & Tappel,
1963; Kanner & Karel, 1975; Matsushita, 1975; Roubal, 1971; Rouball & Tappel, 1966;
Schaich & Karel, 1975).
Besides these two reactions, another direct chemical linkage that can result in
protein aggregates formation is intra and intermolecular disulfide bond
formation/exchange. The disulfide bond interaction causing protein aggregation has been
studied and reported in several papers (Liu, Zhou, Tran, & Labuza, 2009; Zhou &
Labuza, 2007; Zhou, Liu, & Labuza, 2008a; Zhou et al., 2008b; Zhu & Labuza, 2010)
including our previous paper (Qinchun Rao, Fisher, Guo, & Labuza, 2013). The thiol
group buried in the core of intact proteins may be exposed when unfolding, which can
form intra- and intermolecular disulfide bonds with other thiol groups (Jang &
Swaisgood, 1990).
Besides direct chemical linkages, additional minor protein aggregates can be
formed through protein self-association. However, few studies have conducted an in-
87
depth study of protein aggregate formation of DEY, so this paper intends to fill the gap
through evaluating the protein aggregate formation during storage of DEY and also
elucidating the molecular mechanism behind it.
Materials and Method
Materials
The commercial dried egg yolk is the same as in the storage induced
physicochemical properties study discussed in Chapter 2. All reagents and chemicals
used in this study were of analytical grade.
Storage Study
A certain weight of DEY was put into a sealed desiccator with saturated cobalt
chloride slurries at aw of 0.66 and stored at room temperature (RT) and 45°C for two
months. DEY was sampled at designated time intervals for further analysis. The reason
we chose aw of 0.66 is because it generated the most amounts of protein aggregations
among DEY storage among all storage conditions and is low enough to limit mold
growth.
Denaturation Temperature of DEY
The denaturation temperature of DEY was analyzed using DSC 1 STARe System
(Mettler Toledo, Columbus, OH, USA). DEY was hydrated with water (1 to 1 ratio
(w:w)) and placed overnight at 4°C for equilibration. About 10 mg of the hydrated DEY
was put into the aluminum pan and run under the designated procedure, which includes 5
steps: 1) cool and hold at -40°C for 10 min; 2) heat from -40°C to 100°C at the rate of

88
10°C/min; 3) cool from 100°C to -40°C at the rate of -10°C/min; 4) hold at -40°C for 10
min; 5) heat from -40°C to 100°C at the rate of 10°C/min. After each run, the curve was
analyzed using STARe Excellence Software (Mettler Toledo, Columbus, OH, USA). The
endothermic peak above 40°C was recognized as the protein denaturation peak from the
second step. The denaturation temperature (Td) was determined using the 1st derivatives
of the curve. Td was the spot where the 1st derivative value is zero. ΔH was calculated and
normalized based on the protein amount in the sample. Tg can be recognized as the
inflection point of the slope from the fifth step at which point the slope of the curve
changes from a decrease to an increase or vice versa depending on whether the
endothermic is up or down.
Secondary structure changes of DEY during storage
Raman spectroscopy (Qinchun Rao & Labuza, 2012)
The secondary structure of DEY powder was analyzed using the DXR Raman
microscope (Thermo Fisher Scientific, Madison, WI). Briefly, the DEY powder stored
for 8 weeks and the original DEY powder were measured. The instrument is equipped
with 780 nm excitation of SERS spetra through a 10 × confocal microscope objective. It
can produce an approximately 2.5 μm diameter laser spot, with a 5 cm-1 spectral
resolution. The laser power is 150 mW with a 25 μm split aperture. Each scan is actually
the average of four spots randomly picked by the machine within the selected spot. Each
sample was scanned at least 10 times with manually selecting the spot. The spectra of
each scan were collected using the OMNIC for Dispersive Raman Software (version 8.2,
89
Thermo Fisher Scientific). The final spectrum of each sample is thus the average of at
least 10 scans.
Front-face fluorescence
The secondary structure was also measured using front-face fluorescence at room
temperature (LS50 B Perking-Elmer Luminescence Spectrometer, Perkin-Elmer Co.,
Waltham, MA, USA). DEY samples storage at certain conditions (RT and 45°C at aw of
0.66) were tested. Two parameters: tryptophan and Vitamin A, were selected. The
tryptophan emission was monitored from 305 to 450 nm by excitation at 290 nm (A.
Kulmyrzaev & Dufour, 2002). The slits of excitation and emission are 5.0 and 0 nm
respectively. The Vitamin A emission was monitored from 270 to 350 nm by excitation
at 410 nm. The slits of excitation and emission are both 5.0 nm. Briefly, a certain amount
of DEY powder was put onto the silica window of the Powder Holder. Then the cap of
the Powder Holder was screwed down until the sample is held tightly. Then the Powder
Holder is put into the Front Surface accessory for scanning. Each sample was scanned at
least in triplicate. The spectra data was extracted from FL WinLab (Perkin Elmer) to
Excel and the PCA was calculated and plotted using R. The PCA package in R is
FactoMineR. The R code for the PCA calculation can be found in the Appendix.
Fourier transform infrared spectroscopy (FTIR)
FTIR Spectrometer Tensor 37 (Bruker Optics Inc., Madison, WI, USA) was used
for the FTIR analysis. The instrument was coupled with a horizontal multireflectance
ZnSe crystal accessory (sample chamber), a deuterated triglycine sulfate detector, and a
90
KBr beam splitter. Data were collected in the 600 to 4000 cm-1 infrared spectral range at
room temperature. Spectral acquisition was conducted at a resolution of 4 cm-1. The
background and sample scans were set to 32. Briefly, a background scan was run before
the sample scan, which collected the spectra of the empty crystal accessory. Then a
measured amount of sample was put into the crystal accessory and fully covered the
window part. The final sample spectrum is the spectrum signals of sample test after
subtracting the background spectrum signals. Each sample was tested at least in triplicate.
The spectra were analyzed using OPUS Software version 6.5 (Bruker). Each spectra was
processed through the undergone baseline correction as well as by calculations of the
second derivatives, which was used for the estimation of protein secondary structure. The
protein secondary structure was estimated according to other literature (Susi & Michael
Byler, 1983)(Dong, Huang, & Caughey, 1990)(Dong, Caughey, Caughey, Bhat, & Coe,
1992)(Kalnin, Baikalov, & Venyaminov SYu, 1990)(KONG & YU, 2007). Briefly, the
second derivatives of the amide I region (1600 to 1700 cm-1) was used for the secondary
structure estimation with the β-sheet assigned for the spectral range of 1600 to 1647 and
1685 to 1701 cm-1, random coil assigned for 1647 to 1654 cm-1, α-helix assigned for 1654
to 1664 cm-1, β-turn assigned for 1664 to 1685 cm-1 based on the spectrum of the control
sample and the study of Dong et al. (Table 3.1)(Dong et al., 1990).
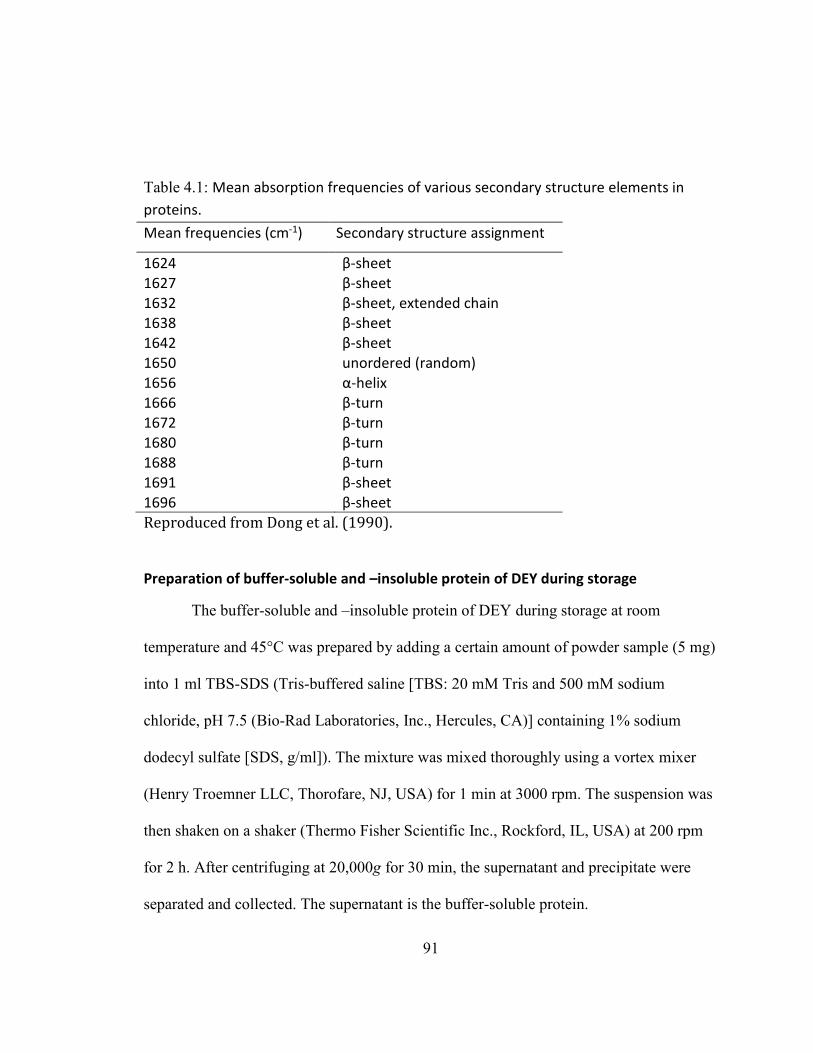
91
Table 4.1: Mean absorption frequencies of various secondary structure elements in
proteins.
Mean frequencies (cm-1) Secondary structure assignment
1624 β-sheet
1627 β-sheet
1632 β-sheet, extended chain
1638 β-sheet
1642 β-sheet
1650 unordered (random)
1656 α-helix
1666 β-turn
1672 β-turn
1680 β-turn
1688 β-turn
1691 β-sheet
1696 β-sheet
Reproduced from Dong et al. (1990).
Preparation of buffer-soluble and –insoluble protein of DEY during storage
The buffer-soluble and –insoluble protein of DEY during storage at room
temperature and 45°C was prepared by adding a certain amount of powder sample (5 mg)
into 1 ml TBS-SDS (Tris-buffered saline [TBS: 20 mM Tris and 500 mM sodium
chloride, pH 7.5 (Bio-Rad Laboratories, Inc., Hercules, CA)] containing 1% sodium
dodecyl sulfate [SDS, g/ml]). The mixture was mixed thoroughly using a vortex mixer
(Henry Troemner LLC, Thorofare, NJ, USA) for 1 min at 3000 rpm. The suspension was
then shaken on a shaker (Thermo Fisher Scientific Inc., Rockford, IL, USA) at 200 rpm
for 2 h. After centrifuging at 20,000g for 30 min, the supernatant and precipitate were
separated and collected. The supernatant is the buffer-soluble protein.
92
Simultaneously, the precipitate, i.e. TBS-SDS buffer-insoluble proteins, was
washed three times with 1 ml TBS-SDS. For each wash, the mixture was mixed
thoroughly using a vortex mixer (Henry Troemner) for 1 min at 3000 rpm. After
centrifuging at 15000g for 15 min, the liquid portion was removed carefully. After three
washes, the precipitate was then mixed with 1 ml TBS-SDS containing 5% 2-
mercaptoethanol (ml/ml, TBS-SDS-2-ME). After being mixed thoroughly using a vortex
mixer (Henry Troemner) for 1 min at 3000 rpm, the mixture was heated in a water bath
(95 °C) for 5 min. After centrifuging at 15,000g for 15 min, the supernatant was carefully
collected and it is the buffer-insoluble protein. Simultaneously, the control sample (the
original DEY powder (vacuum packaged and stored at ˗20 °C) was prepared using the
same procedure. All steps were carried out at room temperature unless otherwise
specified.
Protein solubility of DEY during storage
The previous prepared buffer-soluble protein solutions were used for
determination of protein solubility. The protein solubility was determined using the
Peirce BCA (bicinchoninic acid) Protein Assay Kit (Thermo Fisher Scientific). Bovine
serum albumin (BSA) was used as the protein standard (working range 20 – 2000 μg/ml).
Briefly, 60 μl buffer-soluble protein solution was added with 480 μl BCA working
reagent (ratio 1:8) in 2 ml centrifuge tube. The BCA working reagent was prepared
through mixing 50 parts of BCA Reagent A with 1 part of BCA Reagent B (v:v = 50:1,
Reagent A:B; Thermo Fisher Scientific). The reagent is stable for several days in a closed
container at room temperature. After mixing the sample with BCA thoroughly using a
vortex mixer (Henry Troemner) for 1 min at 3000 rpm, the mixture was incubated at
93
37°C for 30 min. Then 200 μl of the mixture was pipetted into a 96-well clear flat bottom
polystyrene microplate (Corning In., Corning, NY, USA) (200 μl/well) and the
absorption was read using a microplate reader (BioTek Instruments) at 562 nm. Each
sample was tested in duplicate.
Protein profile of buffer-soluble and –insoluble DEY during storage
Both the buffer-soluble and –insoluble protein solutions were used for the
measurement of protein profile. It was analyzed using SDS-polyacrylamide gel
electrophoresis (SDS-PAGE) according to the method of Laemmli (Laemmli, 1970).
Before heating at 95 °C for 5 min, one part of the sample was mixed with one part of
Laemmli sample buffer (Bio-Rad) with or without 5% 2-ME (ml/ml). The heated sample
(20 μl/lane) was then added onto the 4-20% Mini-PROTEAN TGX Precast Gel (Bio-
Rad). The running buffer was 25 mM Tris (pH 8.3) containing 192 mM glycine and 0.1%
SDS (g/ml). After running at 110 V for a certain time (about 2 h) at 4°C, the gel was
stained with the EZBlue Gel Staining Reagent (Sigma-Aldrich Co., Saint Louis, MO,
USA). After destained with deionized water, the gel was scanned by the Gel Doc XR
system (Bio-Rad). The SDS-PAGE Molecular Weight Standards (broad range, Bio-Rad)
were used for accurate molecular weight estimation on the gel.
Identification of HMWPAs of DEY during storage
In-gel trypsin digestion
HMWPAs of DEY were identified using proteomic technologies. HMWPAs were
defined as the proteins/protein aggregates with over 200 kDa molecular weight, which
were labeled on the SDS-PAGE gel. The HMWPs band was cut using a sterile blade and
went through the in-gel trypsin digestion procedure (Shevchenko, Wilm, Vorm, & Mann,
94
1996). Briefly, the band was cut into ~2×2 mm cubes and place in a 1.5 ml snap-cap
microfuge tube. Then 75 μl of 100mM ammonium bicarbonate in 50% acetonitrile was
added for the first wash and shake on a vortex (Henry Troemner) at 3000 rpm for 30 s
before incubation at room temperature for 15 min. After incubation the solution was
removed using a pipette and the gel pieces were pipetted into 75 μl of 100% acetonitrile
for the second wash. After the gel pieces shrank and turned white and semi-opaque, the
added acetonitrile was removed. The gel pieces were then rehydrated with 75 μl of 10
mM dithiothreitol (DTT) in 10 mM ammonium bicarbonate and then incubated at 56°C
in a water bath for 1 h. After that, the tubes were briefly spin down before removal of the
DTT solution. Then the gel pieces were added into 75 μl of 55 mM iodoacetamide in 100
mM NH4HCO3 and incubated for 30 min at room temperature in dark. Then the first
wash and second wash steps as stated above were repeated. The gel pieces after the last
wash should be opaque white. They were then rehydrated with digestion buffer (50 mM
NH4HCO3, 5 mM CaCl2, 12.5 ng/μl trypsin) and incubated at 4°C for 15 min. The
digestion buffer was freshly prepared. Then the supernatant was removed and replaced
with 70 μl of 50 mM NH4HCO3, 5 mM CaCl2 and incubated at 37°C overnight. The
supernatant after overnight incubation was collected in a new 1.5 ml tube and was added
with 60 μl of 50% acetonitrile and 0.3% formic acid and incubated for 15 min. Then the
supernatant in the new 1.5 ml tube was collected and added with 60 μl of 80%
acetonitrile and 0.3% formic acid and incubated for 15 min. After that, the supernatant
was collected and froze at -80°C for 30 min before speed vacuum dried.
95
Stop and go extraction (STAGE) tips desalting
Desalting was carried out using C18 stop and go extraction (STAGE)-tips
(Rappsilber, Ishihama, & Mann, 2003). Firstly, the stage tip was assembled. Briefly, the
Empore disk flat (3M, St. Paul, MN, USA) was placed on a glass microscope slide, and
then the 18 gauge blunt ended syringe needle was pressed into the Empore disk to core
out a piece of the filter material. The needle was pressed again for a second core into the
syringe needle for extra loading capacity. Then the needle was placed into a 200 μl
pipette tip and the cored disk pieces were pushed into the pipette tip with fused silica
tubing. After that, the material was gently packed into the end of the pipette tip. The
pipette tip with Empore disk cores is the stage tip. Secondly, the stage tip/tube was
assembled. To begin with, the cap of a 1.5 ml Eppendorf tube was cut and a hole was
bored into the center. Then the cap was snapped onto a 2 ml Eppendorf tube. Then the
stage tip (pipette tip with Empore disk cores) was placed into the hole in the cap. The tip
of the pipette tip should be adjusted to be about 1 cm from the bottom of the tube. The
whole tube with stage tip and cap is the stage tip/tube. After the assembly of the stage
tip/tube, the desalting can begin. It began with rehydrating the speed vacuum dried
sample after trypsin digestion with 60 μl wash solvent (98:2:0.1%,
water:acetonitrile:trifluorozcetic acid (TFA)). Then the rehydrated sample was
centrifuged at 3000g for 1 min and put at 4°C. The stage tip/tube was first washed by a
wetting solvent (80:20:0.1%, water:acetonitrile:TFA) and then centrifuged at 450g for 2
min. After that, the stage tip/tube was washed by wash solvent (98:2:0.1%,
water:acetonitrile:TFA) and then centrifuged at the same condition as the first wash.
Then the rehydrated sample was loaded (~60 μl) into stage tip and then centrifuged at 450
96
g for 2 min. The next step is to wash the stage tip/tube with 60 μl wash solvent
(98:2:0.1%, water:acetonitrile:TFA) and centrifuged at 450g for 2 min and then repeating
the washing step twice. After that, the stage tip with cap was assembled onto a new 1.5
ml Eppendorf tube. The peptides were eluted through pipetting 60 μl elution solvent
(60:40:0.1%, water:acetonitrile:TFA) and then centrifuged at 450g for 2 min. The peptide
solution was speed vacuum to dryness before mass spectrometry (MS) analysis.
Mass spectrometric analysis and protein identification
A linear ion trap-Orbitrap (LTQ-Orbitrap) Velos instrument (Thermo Fisher
Scientific) was used for the MS analysis. The sample after desalting was rehydrated in a
load solvent (98:2:0.01%, water:acetonitrile:TFA) and then injected into the instrument
for MS analysis. Tandem mass spectra were searched against a NCBI chicken database
and common contaminant proteins database using Sequest (Thermo Fisher Scientific, San
Jose, CA, USA; version 27, rev. 12). An Iodoacetamide derivative of cysteine was set as
the fixed modification. Oxidation of methionine was set as the variable modification.
Other parameters included 0.80 Da mass tolerance, two missed cleavages, and partial
trypsin specificity. Scaffold (version Scaffold_4.2.1, Proteome Software Inc., Portland,
OR) was used to validate Sequest data (Searle, 2010). Peptide identification was accepted
if greater than 95% probability (Keller, Nesvizhskii, Kolker, & Aebersold, 2002) and
protein identifications were accepted if greater than 99% probability (Nesvizhskii, Keller,
Kolker, & Aebersold, 2003) with at least 2 identified peptides.
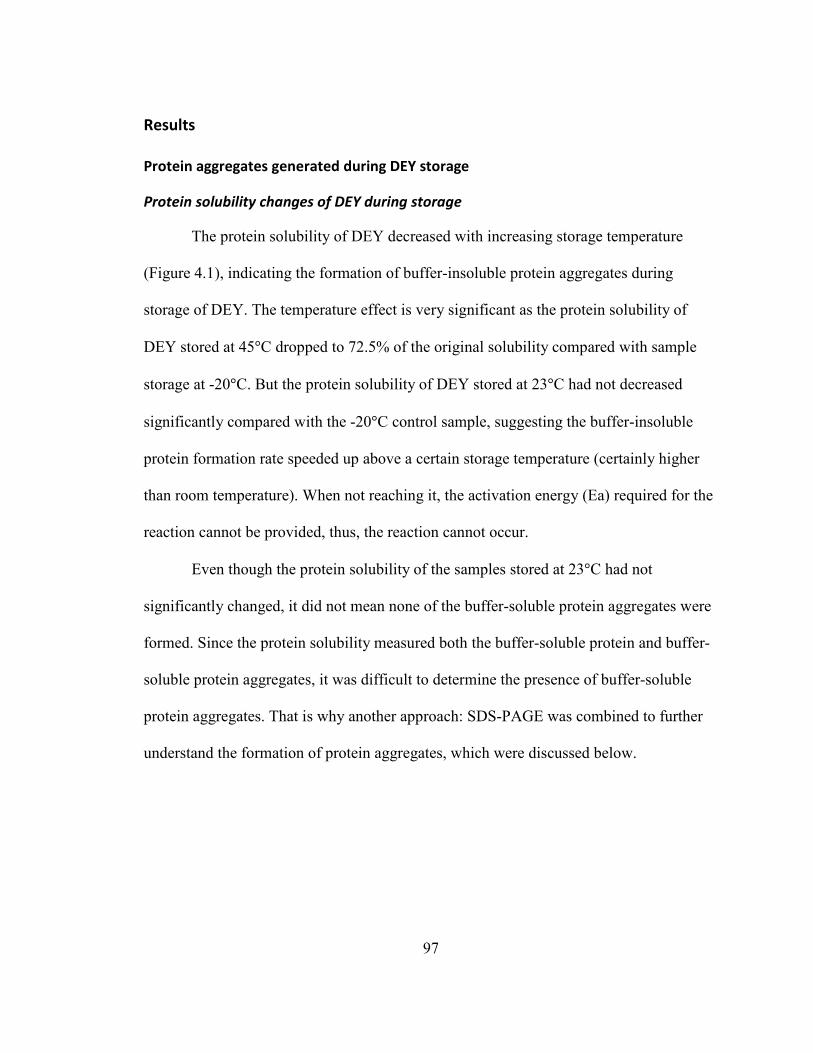
97
Results
Protein aggregates generated during DEY storage
Protein solubility changes of DEY during storage
The protein solubility of DEY decreased with increasing storage temperature
(Figure 4.1), indicating the formation of buffer-insoluble protein aggregates during
storage of DEY. The temperature effect is very significant as the protein solubility of
DEY stored at 45°C dropped to 72.5% of the original solubility compared with sample
storage at -20°C. But the protein solubility of DEY stored at 23°C had not decreased
significantly compared with the -20°C control sample, suggesting the buffer-insoluble
protein formation rate speeded up above a certain storage temperature (certainly higher
than room temperature). When not reaching it, the activation energy (Ea) required for the
reaction cannot be provided, thus, the reaction cannot occur.
Even though the protein solubility of the samples stored at 23°C had not
significantly changed, it did not mean none of the buffer-soluble protein aggregates were
formed. Since the protein solubility measured both the buffer-soluble protein and buffer-
soluble protein aggregates, it was difficult to determine the presence of buffer-soluble
protein aggregates. That is why another approach: SDS-PAGE was combined to further
understand the formation of protein aggregates, which were discussed below.
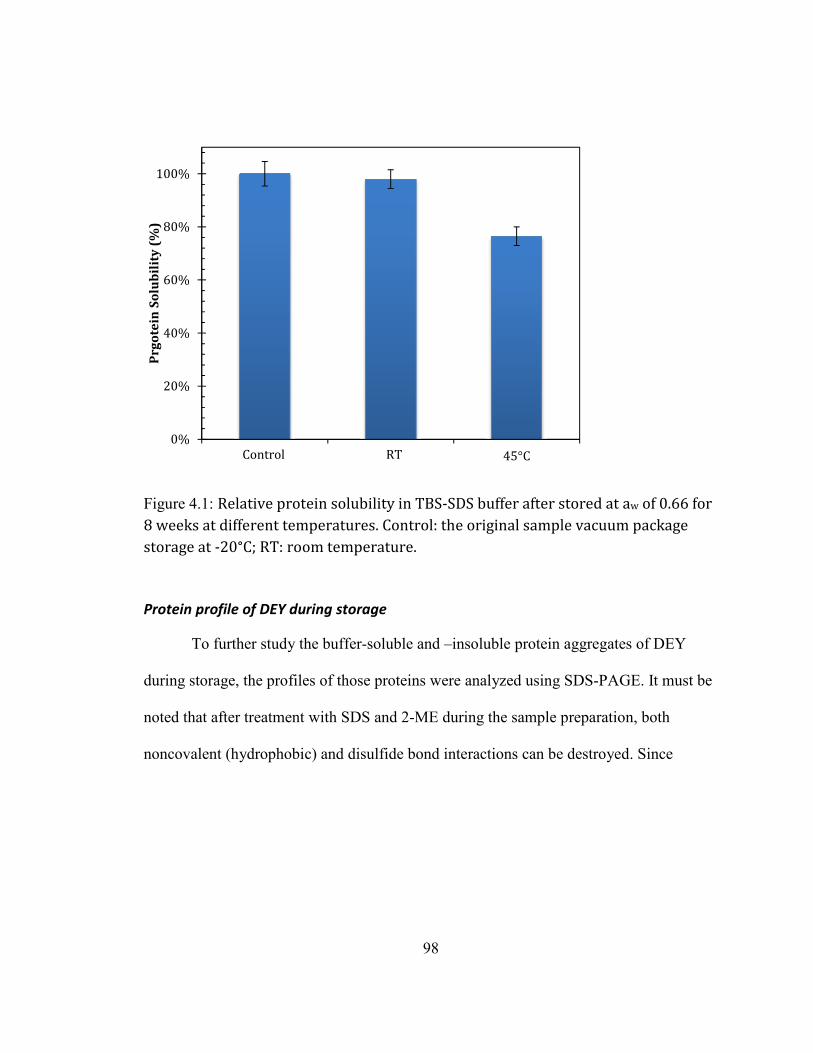
98
Figure 4.1: Relative protein solubility in TBS-SDS buffer after stored at aw of 0.66 for
8 weeks at different temperatures. Control: the original sample vacuum package
storage at -20°C; RT: room temperature.
Protein profile of DEY during storage
To further study the buffer-soluble and –insoluble protein aggregates of DEY
during storage, the profiles of those proteins were analyzed using SDS-PAGE. It must be
noted that after treatment with SDS and 2-ME during the sample preparation, both
noncovalent (hydrophobic) and disulfide bond interactions can be destroyed. Since
0%
20%
40%
60%
80%
100%
−20°C 23°C 45°C
Prg
ote
in S
olu
bil
ity
(%
)
Control RT
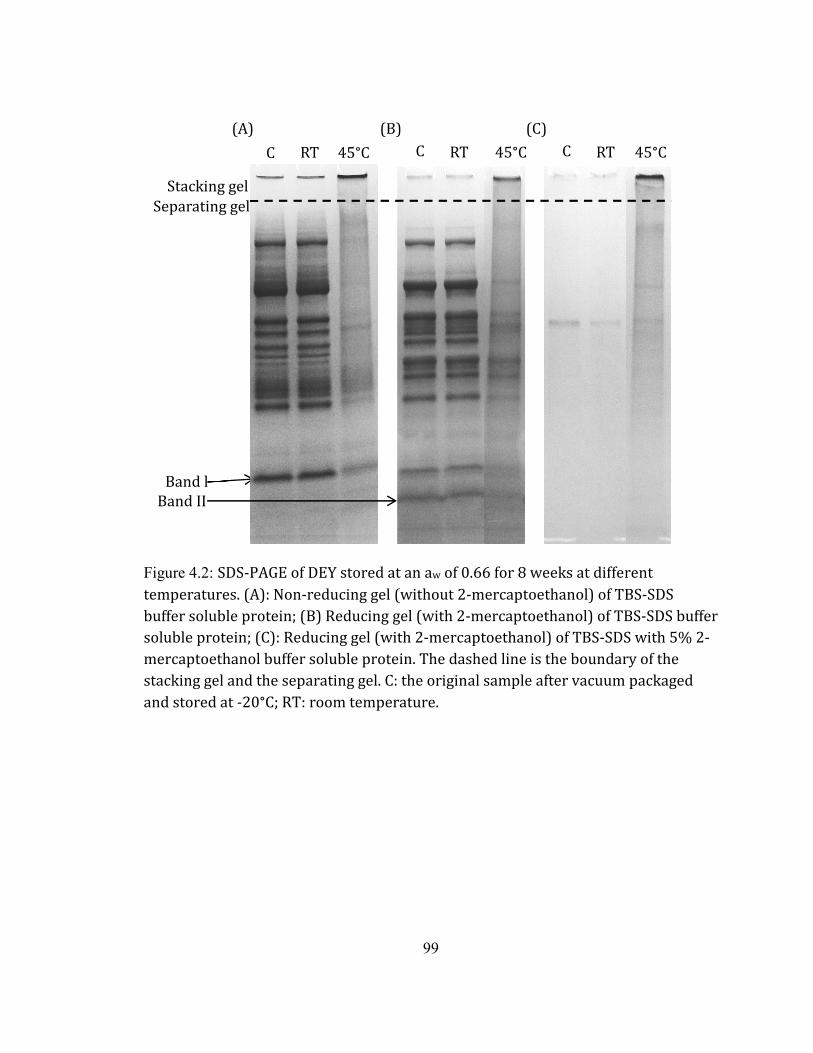
99
Figure 4.2: SDS-PAGE of DEY stored at an aw of 0.66 for 8 weeks at different
temperatures. (A): Non-reducing gel (without 2-mercaptoethanol) of TBS-SDS
buffer soluble protein; (B) Reducing gel (with 2-mercaptoethanol) of TBS-SDS buffer
soluble protein; (C): Reducing gel (with 2-mercaptoethanol) of TBS-SDS with 5% 2-
mercaptoethanol buffer soluble protein. The dashed line is the boundary of the
stacking gel and the separating gel. C: the original sample after vacuum packaged
and stored at -20°C; RT: room temperature.
C RT 45°C C RT 45°C C RT 45°C
Stacking gel
Separating gel
(A) (B) (C)
Band l
Band II
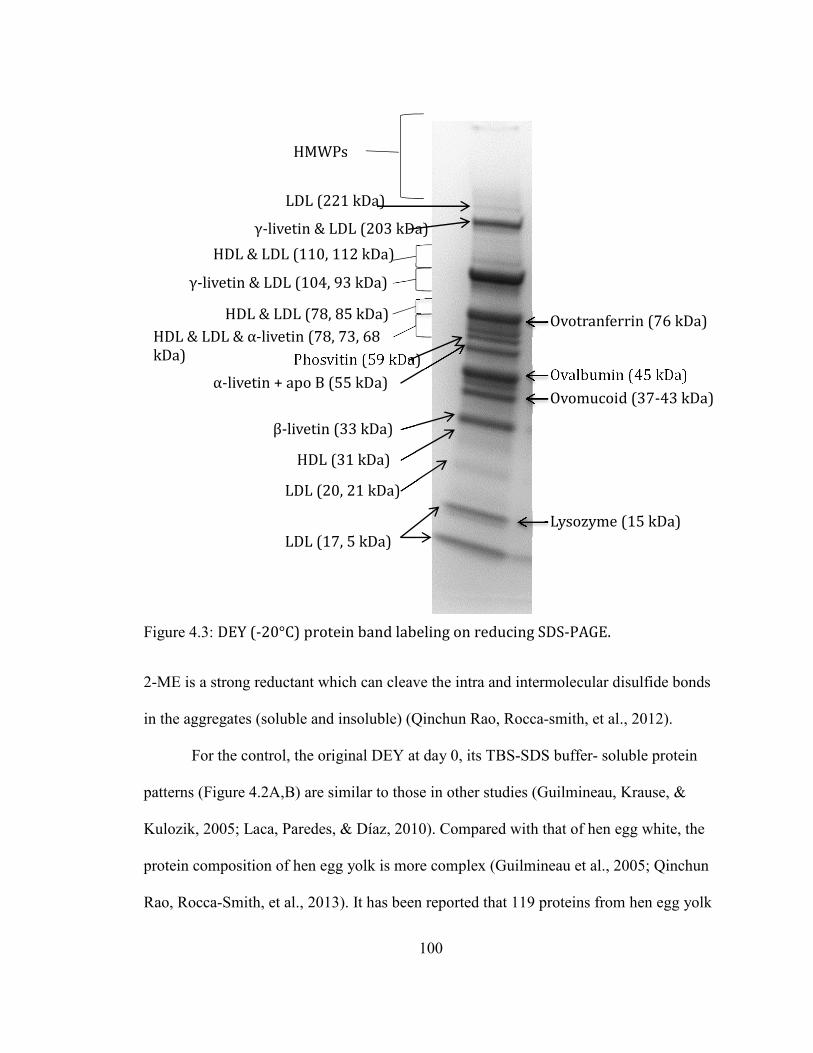
100
Figure 4.3: DEY (-20°C) protein band labeling on reducing SDS-PAGE.
2-ME is a strong reductant which can cleave the intra and intermolecular disulfide bonds
in the aggregates (soluble and insoluble) (Qinchun Rao, Rocca-smith, et al., 2012).
For the control, the original DEY at day 0, its TBS-SDS buffer- soluble protein
patterns (Figure 4.2A,B) are similar to those in other studies (Guilmineau, Krause, &
Kulozik, 2005; Laca, Paredes, & Díaz, 2010). Compared with that of hen egg white, the
protein composition of hen egg yolk is more complex (Guilmineau et al., 2005; Qinchun
Rao, Rocca-Smith, et al., 2013). It has been reported that 119 proteins from hen egg yolk
HDL & LDL (78, 85 kDa)
HDL & LDL (110, 112 kDa)
LDL (17, 5 kDa)
LDL (221 kDa)
HMWPs
Lysozyme (15 kDa)
γ-livetin & LDL (104, 93 kDa)
α-livetin + apo B (55 kDa)
Phosvitin (59 kDa)
LDL (20, 21 kDa)
HDL (31 kDa)
γ-livetin & LDL (203 kDa)
Ovalbumin (45 kDa)
HDL & LDL & α-livetin (78, 73, 68
kDa)
β-livetin (33 kDa)
Ovomucoid (37-43 kDa)
Ovotranferrin (76 kDa)
101
have been identified as noted in the literature review part (Mann & Mann, 2008b). The
major egg yolk proteins are labeled in Figure 4.3. For more detailed egg yolk protein
information such as protein name and its molecular weight, the readers can refer to
several relevant studies (Guilmineau et al., 2005; Laca et al., 2010; Mann & Mann,
2008b). Additionally, no visible TBS-SDS buffer-insoluble precipitate was observed.
However, after extraction with the TBS-SDS-ME buffer, a weak protein band (∼78 kDa)
was found in its TBS-SDS buffer-insoluble precipitate (Figure 4.2C). This protein may be
ovotransferrin from egg white, which has 15 disulfide groups (Q Rao, Kamdar, &
Labuza, 2013), and/or apovitellin (Guilmineau et al., 2005). This assumption needs to be
further confirmed using other methods such as immunoblotting and/or mass
spectrometry.
In the gel portion containing the high molecular weight proteins (HMWP, >200
kDa), especially in the stacking gel, the band color intensity of all supernatant samples in
the absence of 2-ME (Figure 4.2A) decreased dramatically after the addition of 2-ME to
the same sample (Figure 4.2B). Compared with the change in the control, it is clearly
shown that TBS-SDS buffer-soluble disulfide bond induced protein aggregates were
formed during storage. On the other hand, compared with the pattern of the precipitate
from the control in the presence of 2-ME (Figure 4.2B), it is confirmed that many
different proteins in DEY were involved in the formation of the TBS-SDS buffer-
insoluble disulfide- induced protein aggregates during storage. One typical example is
apovitellenin-I (9 kDa, primary accession number P02659), which is one of the low-
density lipoproteins (LDL) in hen egg yolk and has a disulfide-linked homodimer (Jolivet
102
et al., 2006). In the absence of 2-ME, for different storage samples (Figure 4.2A), the
color intensity of the band containing the homodimer of apovitellenin- I (Band I) was
much greater than that of the band containing its monomer (Band II). However, when its
intermolecular disulfide bond was destroyed by 2-ME, the color intensity of Band II
(Figure 4.2B) increases dramatically.
As discussed in Chapter 2, when the moisture content of DEY is greater than its
mo, the amino groups can react with glucose to produce the Maillard cross-linked
products during storage, which are more likely to contribute to both buffer-soluble and –
insoluble protein aggreagtes. Besides disulfide bond interaction and the Maillard reaction,
lipid oxidation can also affect the storage stability of DEY due to its high unsaturated fat
content (38%, g/g). Two types of lipid oxidation reactions, namely, radical reactions and
reactions involving the secondary products, can cause both rancidity and free radical
attack on proteins and amino acids (Gardner, 1979). This protein damage caused by
oxidized lipids includes (1) formation of various fluorescent chromophores and
aggregates (lipid−protein adducts and protein−protein cross-links), (2) protein scission,
and (3) amino acid damage (Kikugawa & Beppu, 1987). Additionally, both lipid
oxidation and the Maillard reaction pathways (1) can produce common intermediate
products such as carbonyl compounds, which results in increased browning, and (2) may
have common polymerization mechanisms that lead to hardening (Zamora & Hidalgo,
2005). In summary, direct chemical linkages induced by disulfide bond formation, the
Maillard reaction, and lipid oxidation are the primary reasons leading to the formation of
buffer-soluble and –insoluble protein aggregates. Due to the co-action of these three
103
chemical reactions and non-covalent interactions such as hydrophobic interactions,
different types and amounts of aggregates (soluble and insoluble) formed in DEY powder
under different storage conditions.
Protein aggregates as accessed by tryptophan front-face fluorescence
Tryptophan, a common amino acid present in food proteins, has been well studied
for its fluorescence characteristics. Therefore, it is a good probe to study protein structure
changes, as tryptophan exhibits different emission fluorescence spectra when present in
different environments (Dufour, Genot, & Haertlé, 1994)(Bonomi, Mora, Pagani, &
Iametti, 2004)(Kulmyrzaev, Karoui, De Baerdemaeker, & Dufour, 2007)(Huschka,
Bonomi, Marengo, Miriani, & Seetharaman, 2012). For example, the tryptophan in a
hydrophobic environment has a different emission peak from that in a hydrophilic
environment. Besides protein structure, tryptophan is also a good probe for the detection
of protein aggregates (Kulmyrzaev, Levieux, & Dufour, 2005).
As noted in “Nutritional value of egg yolk powder” in the literature review, DEY
(100 g) contains 0.51 g tryptophan (Table 2.4), which is enough for the front-face
fluorescence analysis. Results are shown in Figure 4.4. The spectra was similar to those
in published articles (Karoui et al., 2005)(Karoui et al., 2007). The peak shown in each
spectrum was tryptophan. The decreases of peak intensity and minor shift of emission
peak during storage indicated the formation of protein aggregates and changes of protein
structure.
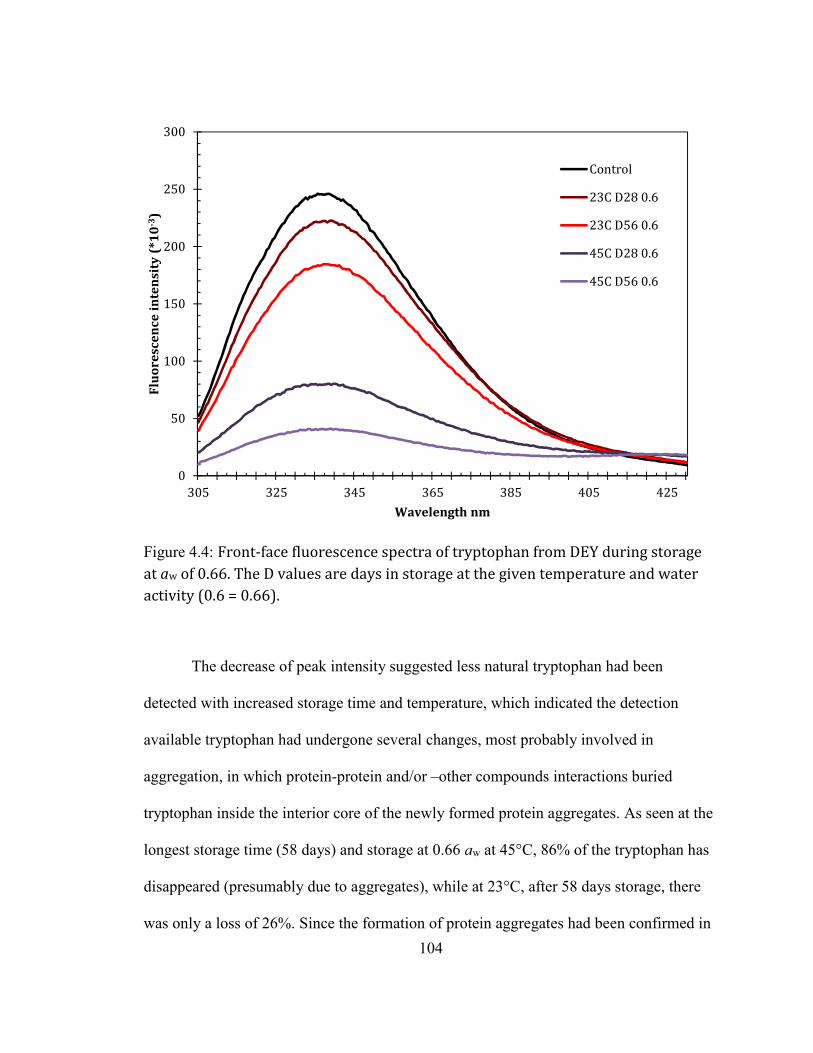
104
Figure 4.4: Front-face fluorescence spectra of tryptophan from DEY during storage
at aw of 0.66. The D values are days in storage at the given temperature and water
activity (0.6 = 0.66).
The decrease of peak intensity suggested less natural tryptophan had been
detected with increased storage time and temperature, which indicated the detection
available tryptophan had undergone several changes, most probably involved in
aggregation, in which protein-protein and/or –other compounds interactions buried
tryptophan inside the interior core of the newly formed protein aggregates. As seen at the
longest storage time (58 days) and storage at 0.66 aw at 45°C, 86% of the tryptophan has
disappeared (presumably due to aggregates), while at 23°C, after 58 days storage, there
was only a loss of 26%. Since the formation of protein aggregates had been confirmed in
0
50
100
150
200
250
300
305 325 345 365 385 405 425
Flu
ore
sce
nc
e i
nte
nsi
ty (
*10
-3)
Wavelength nm
Control
23C D28 0.6
23C D56 0.6
45C D28 0.6
45C D56 0.6
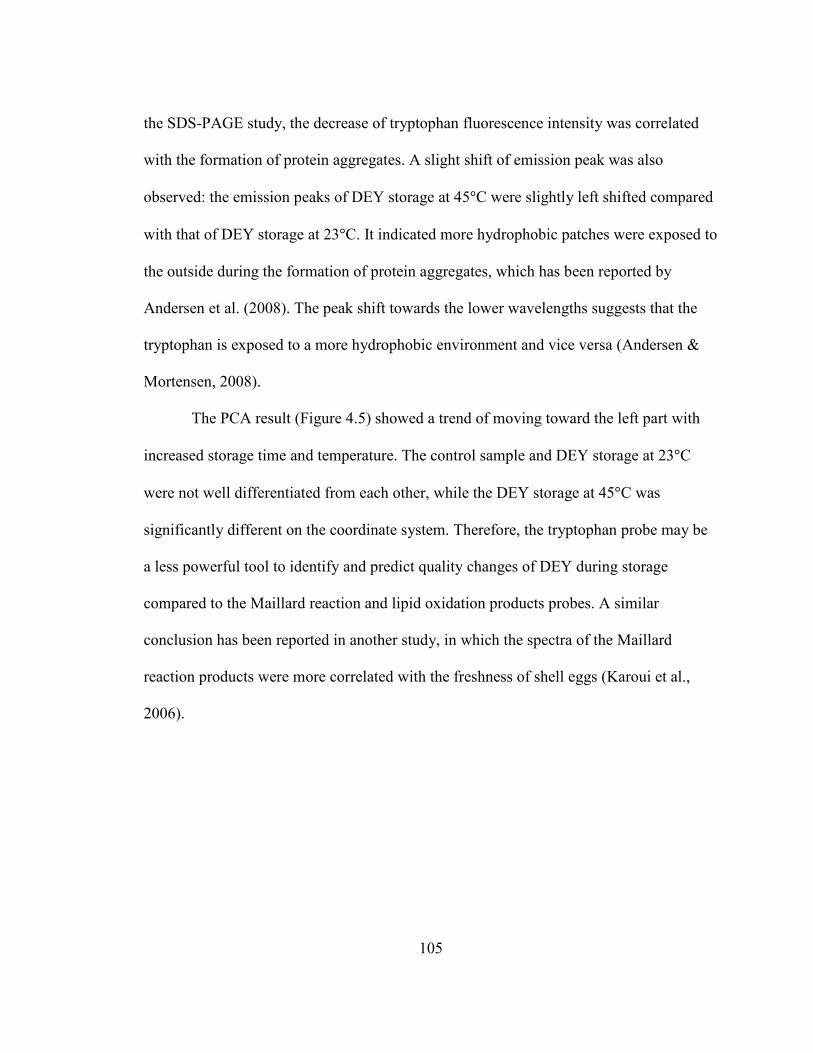
105
the SDS-PAGE study, the decrease of tryptophan fluorescence intensity was correlated
with the formation of protein aggregates. A slight shift of emission peak was also
observed: the emission peaks of DEY storage at 45°C were slightly left shifted compared
with that of DEY storage at 23°C. It indicated more hydrophobic patches were exposed to
the outside during the formation of protein aggregates, which has been reported by
Andersen et al. (2008). The peak shift towards the lower wavelengths suggests that the
tryptophan is exposed to a more hydrophobic environment and vice versa (Andersen &
Mortensen, 2008).
The PCA result (Figure 4.5) showed a trend of moving toward the left part with
increased storage time and temperature. The control sample and DEY storage at 23°C
were not well differentiated from each other, while the DEY storage at 45°C was
significantly different on the coordinate system. Therefore, the tryptophan probe may be
a less powerful tool to identify and predict quality changes of DEY during storage
compared to the Maillard reaction and lipid oxidation products probes. A similar
conclusion has been reported in another study, in which the spectra of the Maillard
reaction products were more correlated with the freshness of shell eggs (Karoui et al.,
2006).
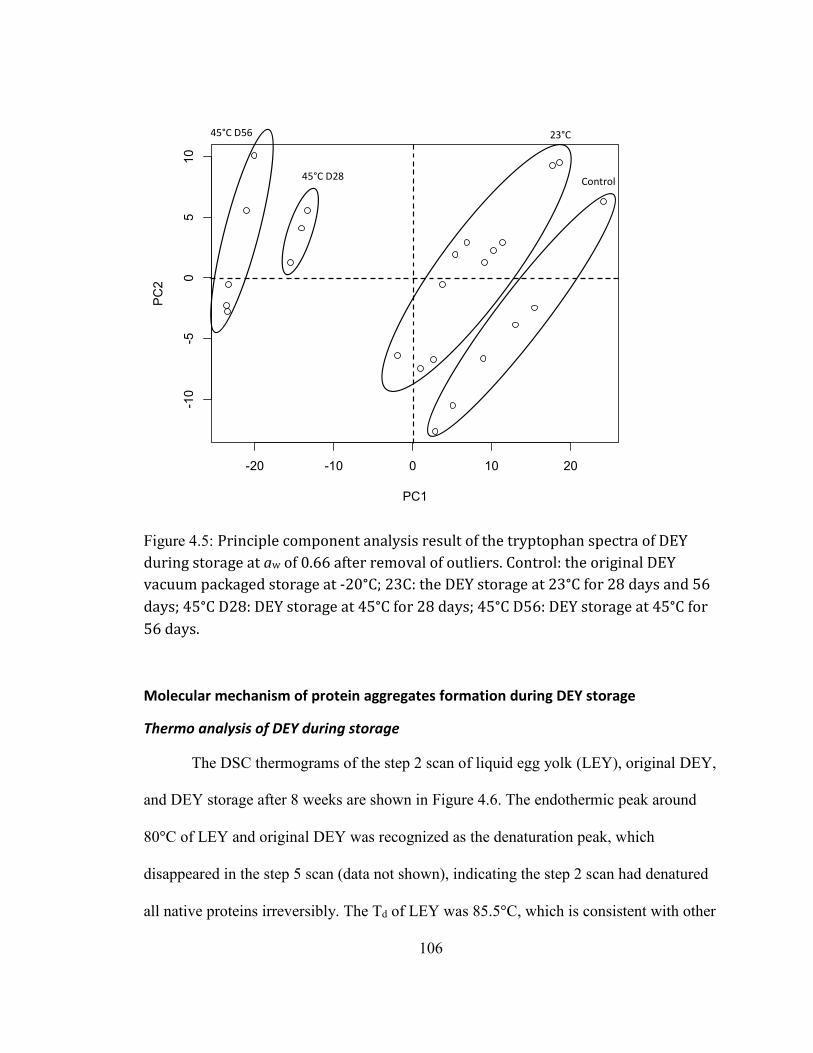
106
Figure 4.5: Principle component analysis result of the tryptophan spectra of DEY
during storage at aw of 0.66 after removal of outliers. Control: the original DEY
vacuum packaged storage at -20°C; 23C: the DEY storage at 23°C for 28 days and 56
days; 45°C D28: DEY storage at 45°C for 28 days; 45°C D56: DEY storage at 45°C for
56 days.
Molecular mechanism of protein aggregates formation during DEY storage
Thermo analysis of DEY during storage
The DSC thermograms of the step 2 scan of liquid egg yolk (LEY), original DEY,
and DEY storage after 8 weeks are shown in Figure 4.6. The endothermic peak around
80°C of LEY and original DEY was recognized as the denaturation peak, which
disappeared in the step 5 scan (data not shown), indicating the step 2 scan had denatured
all native proteins irreversibly. The Td of LEY was 85.5°C, which is consistent with other
-20 -10 0 10 20
-10
-50
510
PC1
PC
2
45°C D56
45°C D28
23°C
Control
107
research (Rossi & Schiraldi, 1992). Td of DEY was 83.5°C. The decline was due to the
difference in moisture content. Hydrated DEY contained more moisture leading to a
lower Td. Cotterill et al. (1983) measured Td of several egg yolk proteins using SDS-
PAGE, and found the Td range is from 62 to 84°C with livetins as the most heat
sensitive proteins and phosvitin as the most heat stable proteins (Woodward &
Cotterill, 1983). Gandemer et al. also found that granules proteins were more heat
stable than plasma proteins (Denmat et al., 1999) due to their compact structure
leading to an efficient protection against thermal treatment (refer to “Proteins in
egg”; Anton, 2013). They also found that the denaturation of yolk proteins resulted
in a decrease of emulsifying activity (Denmat et al., 1999). Furthermore, due to the
high oil content, egg proteins are more likely to expose more hydrophobic patches
to have more flexibility (W. Wang et al., 2010).
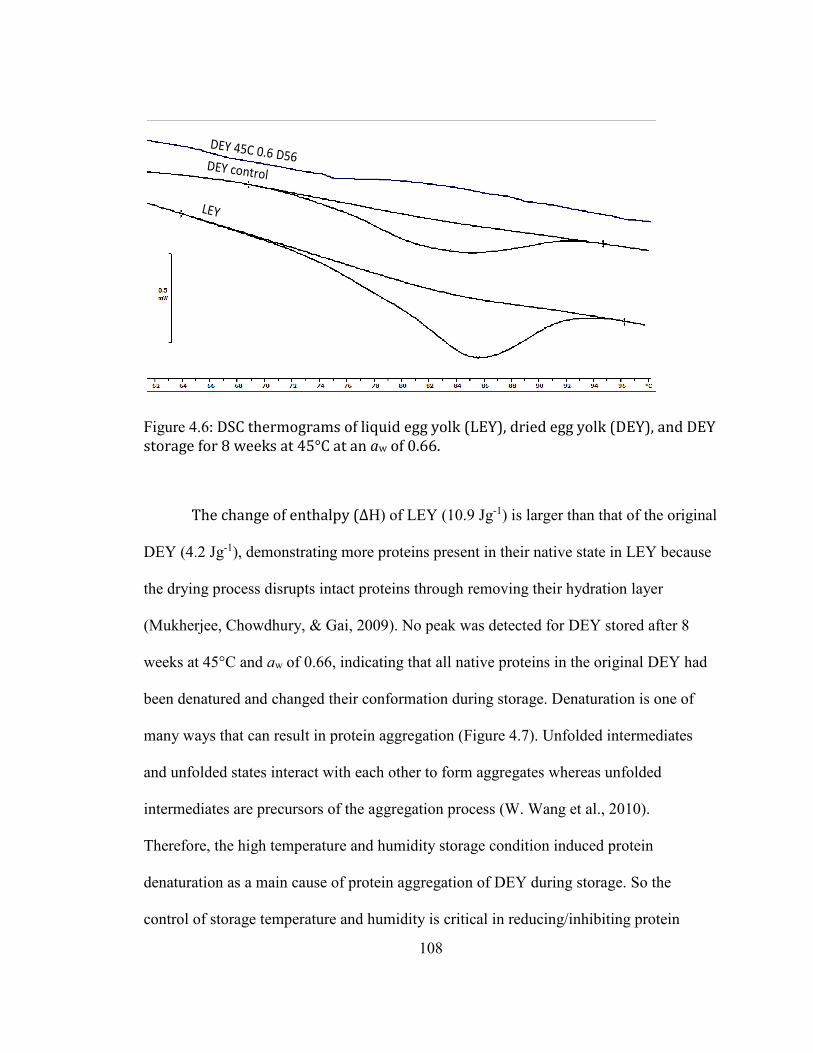
108
Figure 4.6: DSC thermograms of liquid egg yolk (LEY), dried egg yolk (DEY), and DEY
storage for 8 weeks at 45°C at an aw of 0.66.
The change of enthalpy (ΔH) of LEY (10.9 Jg-1) is larger than that of the original
DEY (4.2 Jg-1), demonstrating more proteins present in their native state in LEY because
the drying process disrupts intact proteins through removing their hydration layer
(Mukherjee, Chowdhury, & Gai, 2009). No peak was detected for DEY stored after 8
weeks at 45°C and aw of 0.66, indicating that all native proteins in the original DEY had
been denatured and changed their conformation during storage. Denaturation is one of
many ways that can result in protein aggregation (Figure 4.7). Unfolded intermediates
and unfolded states interact with each other to form aggregates whereas unfolded
intermediates are precursors of the aggregation process (W. Wang et al., 2010).
Therefore, the high temperature and humidity storage condition induced protein
denaturation as a main cause of protein aggregation of DEY during storage. So the
control of storage temperature and humidity is critical in reducing/inhibiting protein
DEY 45C 0.6 D56 DEY control
LEY
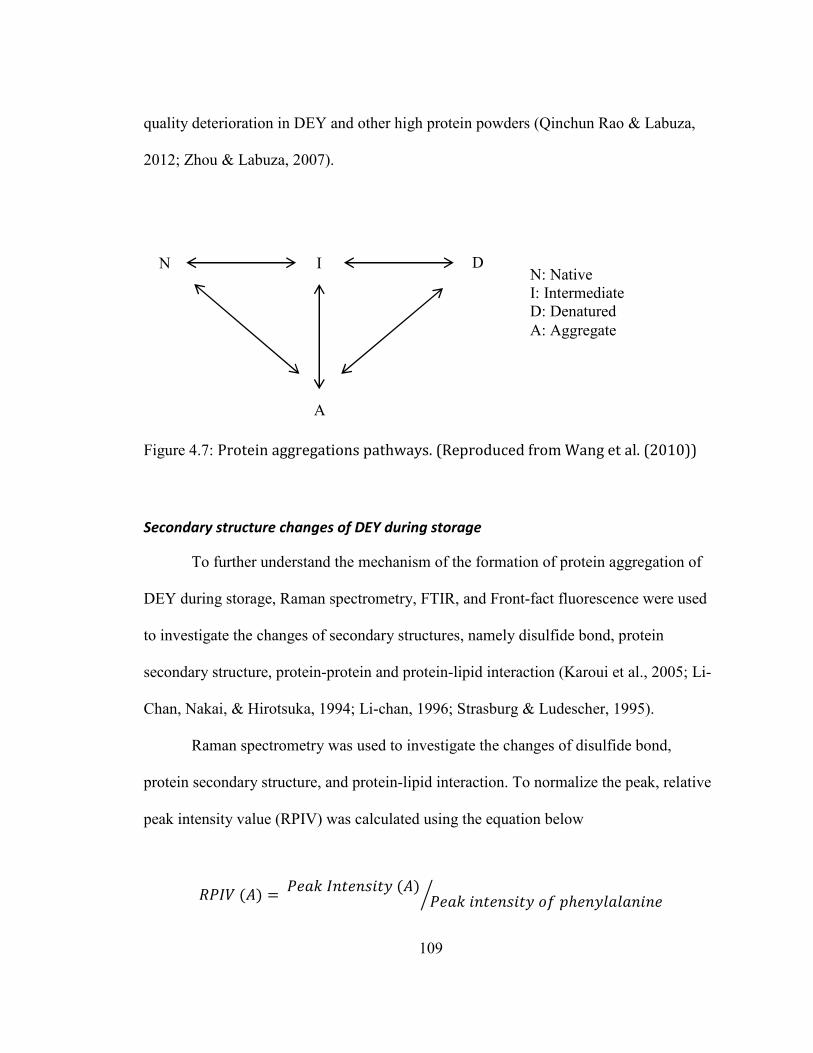
109
quality deterioration in DEY and other high protein powders (Qinchun Rao & Labuza,
2012; Zhou & Labuza, 2007).
Figure 4.7: Protein aggregations pathways. (Reproduced from Wang et al. (2010))
Secondary structure changes of DEY during storage
To further understand the mechanism of the formation of protein aggregation of
DEY during storage, Raman spectrometry, FTIR, and Front-fact fluorescence were used
to investigate the changes of secondary structures, namely disulfide bond, protein
secondary structure, protein-protein and protein-lipid interaction (Karoui et al., 2005; Li-
Chan, Nakai, & Hirotsuka, 1994; Li-chan, 1996; Strasburg & Ludescher, 1995).
Raman spectrometry was used to investigate the changes of disulfide bond,
protein secondary structure, and protein-lipid interaction. To normalize the peak, relative
peak intensity value (RPIV) was calculated using the equation below
���� (�) = ��� �!"�!#$"% (�) ��� $!"�!#$"% &' (ℎ�!%*�*�!$!�+
N I D
A
N: Native I: Intermediate D: Denatured A: Aggregate
110
From Figure 4.8, we can see that no peak was observed between 500 and 560 cm-1
for LEY and DEY. But it does not mean the disulfide bonds are not present in both
samples. It is probably because the disulfide bond peak has been blocked by other
compounds with similar Raman detection regions. However the disulfide bond peak was
observed in the DEY samples stored for 8 weeks showing a high intensity, indicating that
disulfide bond involvement occurred in the protein aggregation of DEY. The β sheet peak
was also blocked by other compounds: possibly unsaturated fatty acids, because the peak
of –C=C- is around 1665 cm-1. Therefore, from this point of view, it is very hard to
illustrate the changes of the protein secondary structure.
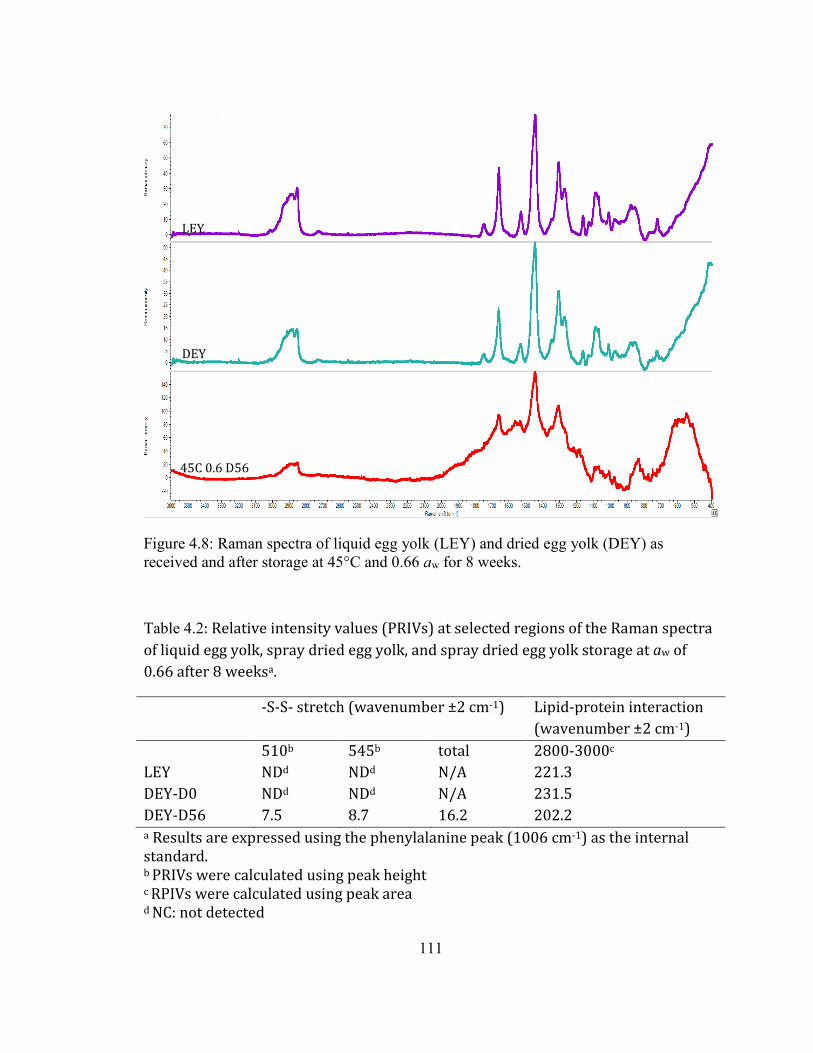
111
Figure 4.8: Raman spectra of liquid egg yolk (LEY) and dried egg yolk (DEY) as received and after storage at 45°C and 0.66 aw for 8 weeks.
Table 4.2: Relative intensity values (PRIVs) at selected regions of the Raman spectra
of liquid egg yolk, spray dried egg yolk, and spray dried egg yolk storage at aw of
0.66 after 8 weeksa.
-S-S- stretch (wavenumber ±2 cm-1) Lipid-protein interaction
(wavenumber ±2 cm-1)
510b 545b total 2800-3000c
LEY NDd NDd N/A 221.3
DEY-D0 NDd NDd N/A 231.5
DEY-D56 7.5 8.7 16.2 202.2 a Results are expressed using the phenylalanine peak (1006 cm-1) as the internal
standard. b PRIVs were calculated using peak height c RPIVs were calculated using peak area d NC: not detected
LEY
DEY
45C 0.6 D56
112
The lipid-protein interaction peaks are observed between 2800 and 3000 cm-1.
The decreasing RPIV of peaks in that area indicated an increase of lipid-protein
interaction. DEY after storage at aw of 0.66 at 45°C had the lowest peak area, indicating
the involvement of lipid-protein interactions during storage. The LEY having lower peak
area than DEY-D0 may be due to the different moisture contents between the two
samples (Carey, 1998). The correlation between lipid-protein interaction and formation of
protein aggregates again confirmed the involvement of lipid oxidation in formation of
protein aggregates through the pathway of lipid-protein polymerization.
Front-face fluorescence of Vitamin A was used to investigate lipid-protein
interaction. The decrease of the Vitamin A peak intensity was detected with increasing
storage time and temperature (Figure 4.9), suggesting the amount of detection available
Vitamin A was decreasing. Since Vitamin A is only soluble in fat, the decline of
available Vitamin A is probably due to: 1) The increase of lipid-protein interaction; 2)
Oxidation of Vitamin A. Considering the occurrence of both lipid oxidation and lipid-
protein interaction have been confirmed (refer to “The progress of lipid oxidation”,
“Peroxide value”, “Secondary structure changes of DEY during storage”), both reasons
are probably contributing to the decline of the Vitamin A peak.
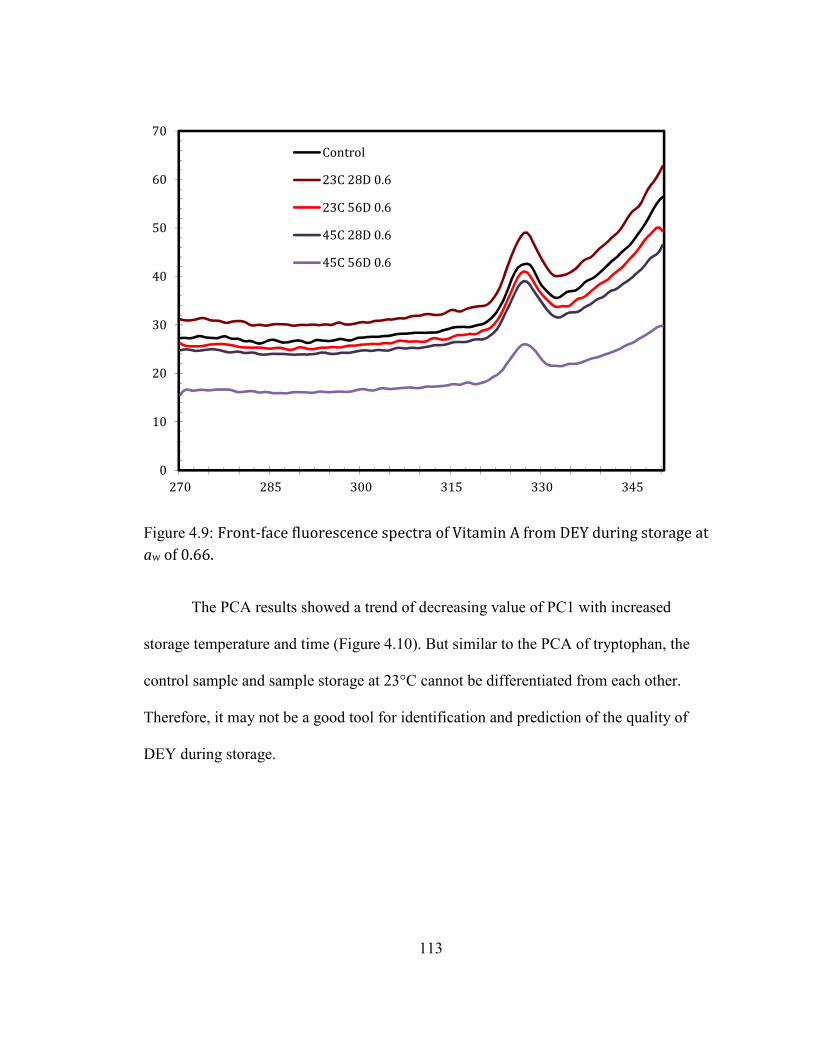
113
Figure 4.9: Front-face fluorescence spectra of Vitamin A from DEY during storage at
aw of 0.66.
The PCA results showed a trend of decreasing value of PC1 with increased
storage temperature and time (Figure 4.10). But similar to the PCA of tryptophan, the
control sample and sample storage at 23°C cannot be differentiated from each other.
Therefore, it may not be a good tool for identification and prediction of the quality of
DEY during storage.
0
10
20
30
40
50
60
70
270 285 300 315 330 345
Control
23C 28D 0.6
23C 56D 0.6
45C 28D 0.6
45C 56D 0.6
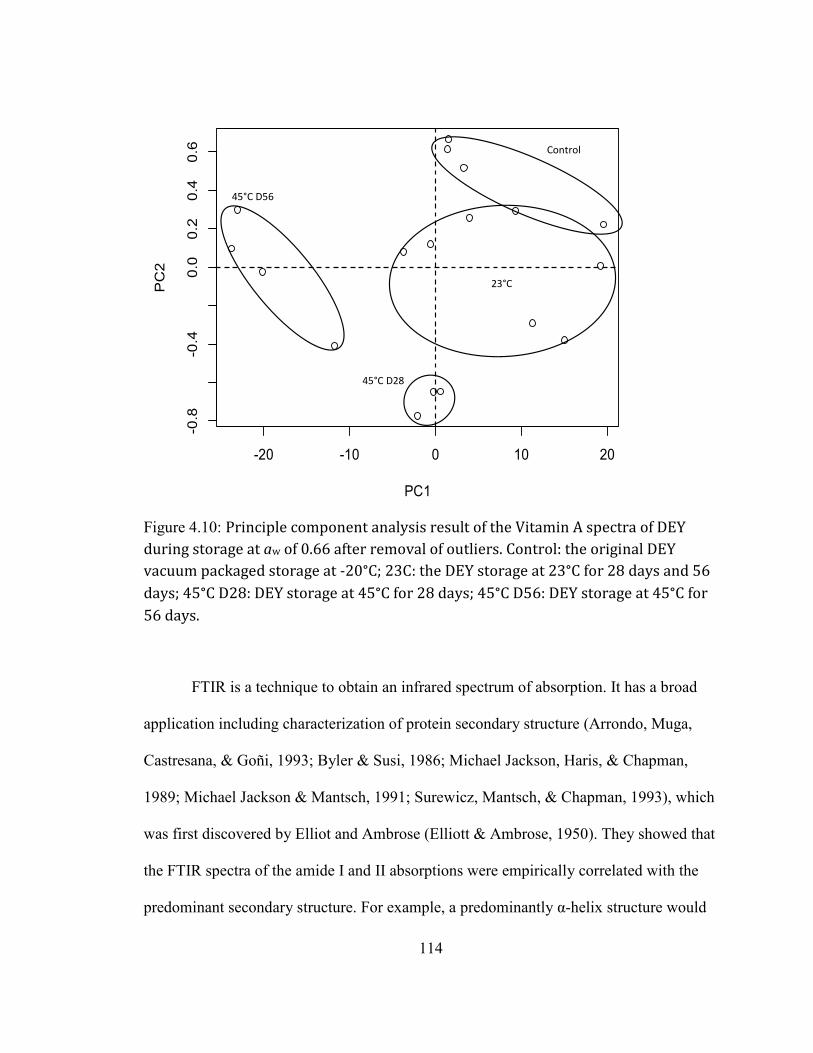
114
Figure 4.10: Principle component analysis result of the Vitamin A spectra of DEY
during storage at aw of 0.66 after removal of outliers. Control: the original DEY
vacuum packaged storage at -20°C; 23C: the DEY storage at 23°C for 28 days and 56
days; 45°C D28: DEY storage at 45°C for 28 days; 45°C D56: DEY storage at 45°C for
56 days.
FTIR is a technique to obtain an infrared spectrum of absorption. It has a broad
application including characterization of protein secondary structure (Arrondo, Muga,
Castresana, & Goñi, 1993; Byler & Susi, 1986; Michael Jackson, Haris, & Chapman,
1989; Michael Jackson & Mantsch, 1991; Surewicz, Mantsch, & Chapman, 1993), which
was first discovered by Elliot and Ambrose (Elliott & Ambrose, 1950). They showed that
the FTIR spectra of the amide I and II absorptions were empirically correlated with the
predominant secondary structure. For example, a predominantly α-helix structure would
-20 -10 0 10 20
-0.8
-0.4
0.0
0.2
0.4
0.6
PC1
PC
2
45°C D56
45°C D28
23°C
Control
115
show amide I and II absorptions in the frequency range of 1652 to 1657 and 1545 to 1551
cm-1, respectively (Ambrose & Elliott, 1951; Elliott & Ambrose, 1950). The contribution
of amide I adsorption is mostly from the C=O stretching vibration with a minor C-N
stretching vibration, whereas, the contribution of amide II adsorption is from both the N-
H bending and C-N stretching vibrations (Miyazawa, Shimanouchi, & Mizushima, 1956).
Therefore, amide I adsorption has proven to be a better measurement of protein
secondary structure than amide II adsorption because it only measures one functional
group. The secondary structures can also be quantitatively estimated using curve fitting
of the amide I absorption, which is to assign the absorption frequency region to each
secondary structure and then calculate the area on a secondary derivative curve.
Figure 4.11 shows the result of the full spectra of DEY during storage for 28 and
56 days storage at 23 and 45°C and the frozen control using FTIR spectroscopy. They
looked very similar to each other. The two peaks between 2550 to 3050 cm-1 refer to the
fat, which does not show any significant difference on the peak height among all samples.
The absorption region between 1600 to 1700 cm-1 is the amide I absorption, which is used
for the estimation of protein secondary structure.
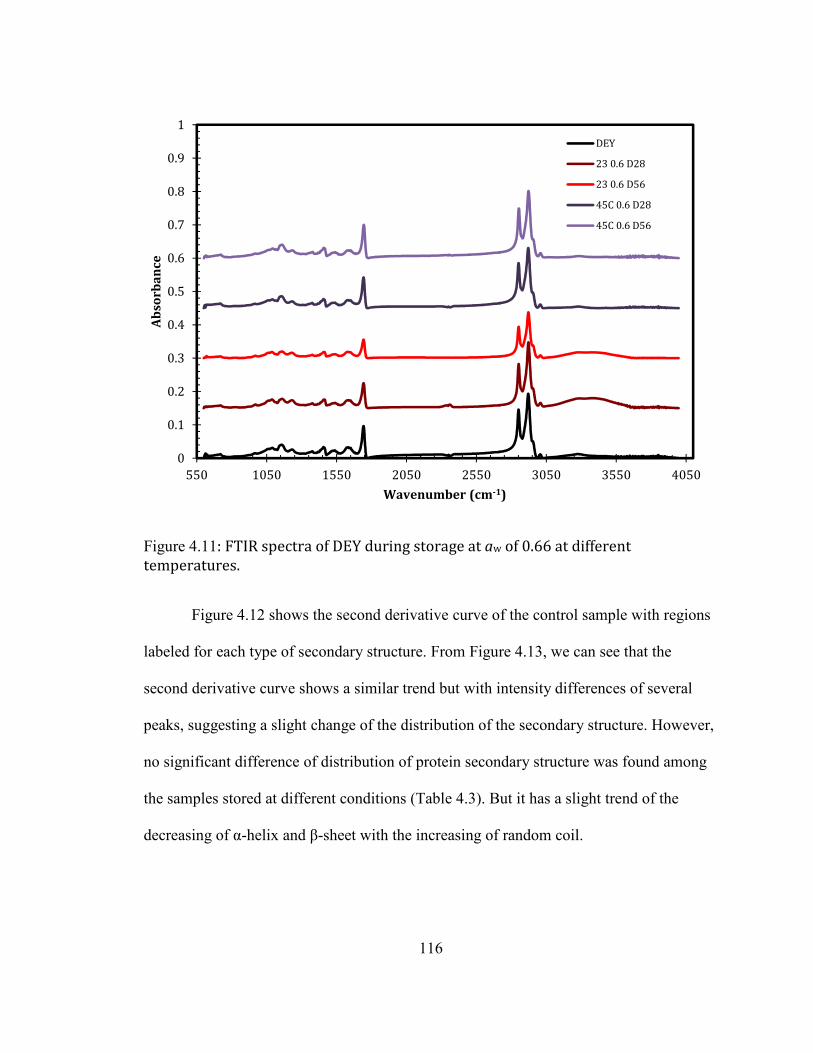
116
Figure 4.11: FTIR spectra of DEY during storage at aw of 0.66 at different
temperatures.
Figure 4.12 shows the second derivative curve of the control sample with regions
labeled for each type of secondary structure. From Figure 4.13, we can see that the
second derivative curve shows a similar trend but with intensity differences of several
peaks, suggesting a slight change of the distribution of the secondary structure. However,
no significant difference of distribution of protein secondary structure was found among
the samples stored at different conditions (Table 4.3). But it has a slight trend of the
decreasing of α-helix and β-sheet with the increasing of random coil.
0
0.1
0.2
0.3
0.4
0.5
0.6
0.7
0.8
0.9
1
550 1050 1550 2050 2550 3050 3550 4050
Ab
sorb
an
ce
Wavenumber (cm-1)
DEY
23 0.6 D28
23 0.6 D56
45C 0.6 D28
45C 0.6 D56
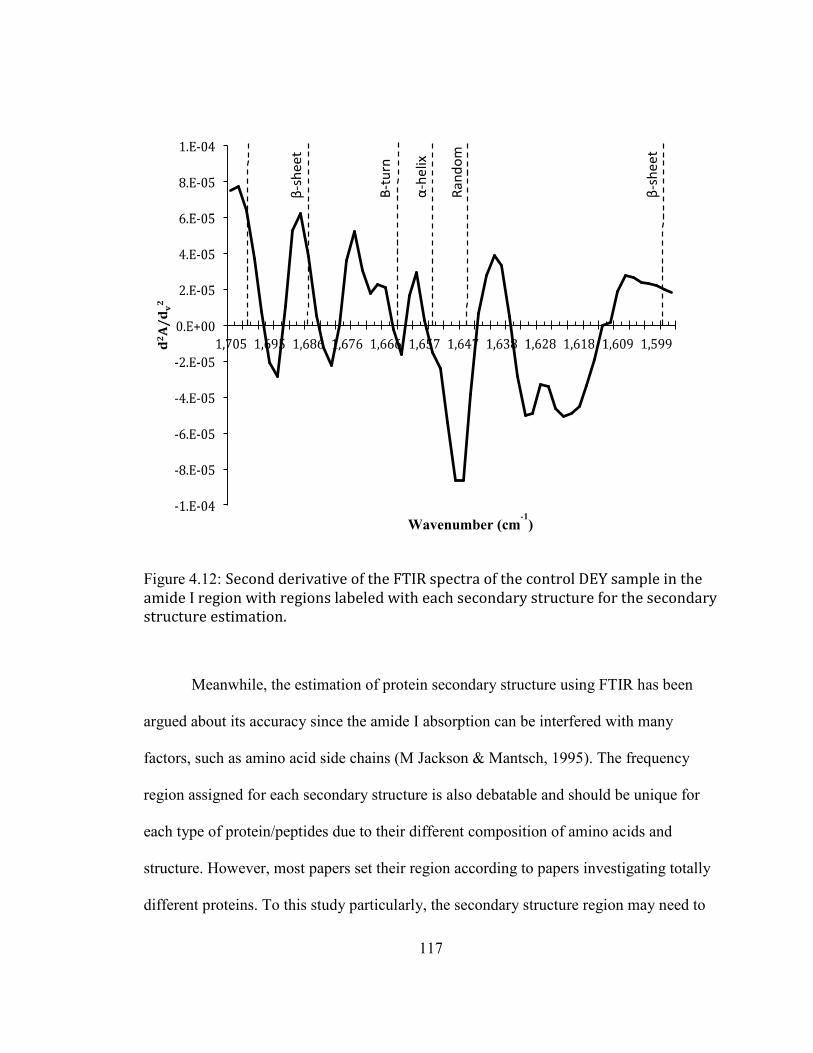
117
Figure 4.12: Second derivative of the FTIR spectra of the control DEY sample in the
amide I region with regions labeled with each secondary structure for the secondary
structure estimation.
Meanwhile, the estimation of protein secondary structure using FTIR has been
argued about its accuracy since the amide I absorption can be interfered with many
factors, such as amino acid side chains (M Jackson & Mantsch, 1995). The frequency
region assigned for each secondary structure is also debatable and should be unique for
each type of protein/peptides due to their different composition of amino acids and
structure. However, most papers set their region according to papers investigating totally
different proteins. To this study particularly, the secondary structure region may need to
Wavenumber (cm-1
)
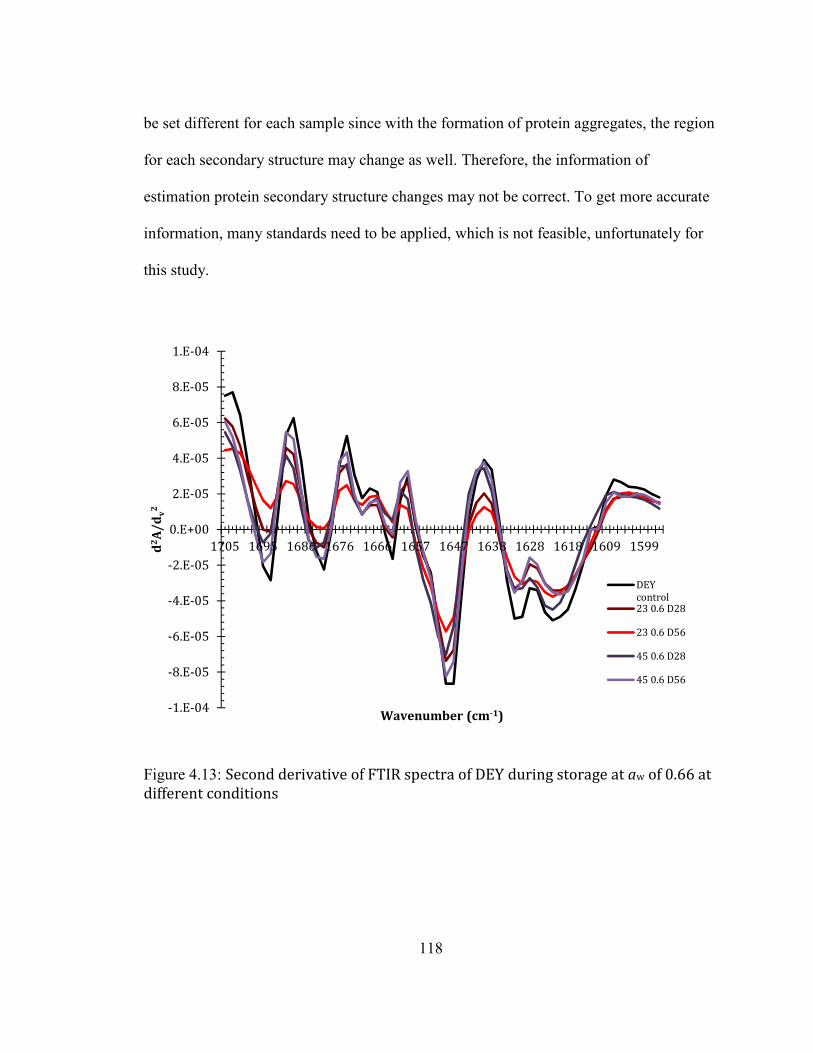
118
be set different for each sample since with the formation of protein aggregates, the region
for each secondary structure may change as well. Therefore, the information of
estimation protein secondary structure changes may not be correct. To get more accurate
information, many standards need to be applied, which is not feasible, unfortunately for
this study.
Figure 4.13: Second derivative of FTIR spectra of DEY during storage at aw of 0.66 at
different conditions
-1.E-04
-8.E-05
-6.E-05
-4.E-05
-2.E-05
0.E+00
2.E-05
4.E-05
6.E-05
8.E-05
1.E-04
1705 1695 1686 1676 1666 1657 1647 1638 1628 1618 1609 1599d2A
/d
v2
Wavenumber (cm-1)
DEY
control23 0.6 D28
23 0.6 D56
45 0.6 D28
45 0.6 D56
119
Table 4.3: Estimation of protein secondary structure content of DEY during storage
β-sheet (%) random (%) α-helix (%) β-turn (%)
Control 71.8±2.9 20.6±5.7 2.3±2.3 5.2±0.5
23C D28 68.2±2.6 26.3±5.4 2.0±2.0 3.4±4.1
23C D56 70.3±2.2 27.9±2.2 1.5±0.4 0.4±0.7
45C D28 63.9±2.2 31.0±3.1 1.5±0.8 3.6±2.4
45C D56 65.4±1.2 27.5±6 1.9±1.4 5.2±4.7
HMWPAs formation during storage
Using 1D SDS-PAGE and LC-MS/MS, 33 proteins (including predicted proteins)
were identified (Table 4.4), which were involved with HMWPAs formation according to
NCBI gallus gallus database. Among them were several typical egg yolk proteins:
vitellogenin, apovitellenin, and livetins and egg white proteins: ovotansferrin, ovalbumin,
lysozyme, ovomucoid, and ovastatin. Most of the identified proteins contain disulfide
bonds. For example, serum albumin (70 kDa), also known as α-livetin, contains
approximately 17 disulfide bonds. Another examples is a 12 kDa lipoprotein,
apovitellenin-1, which has a subunit of homodimer linked with disulfide bonds.
Therefore unfolding induced intra and intermolecular disulfide bond formation/exchange
is one pathway to result in the formation of HMWPAs. In addition, many proteins have
good binding capacity for metal, fatty acids, and other compounds, indicating lipid
oxidation and the Maillard reaction induced direct chemical linkages would be another
pathway for the formation of HMWPAs. The similar mechanism of formation of egg
white protein aggregates have been found in our lab’s previous study (Qinchun Rao &
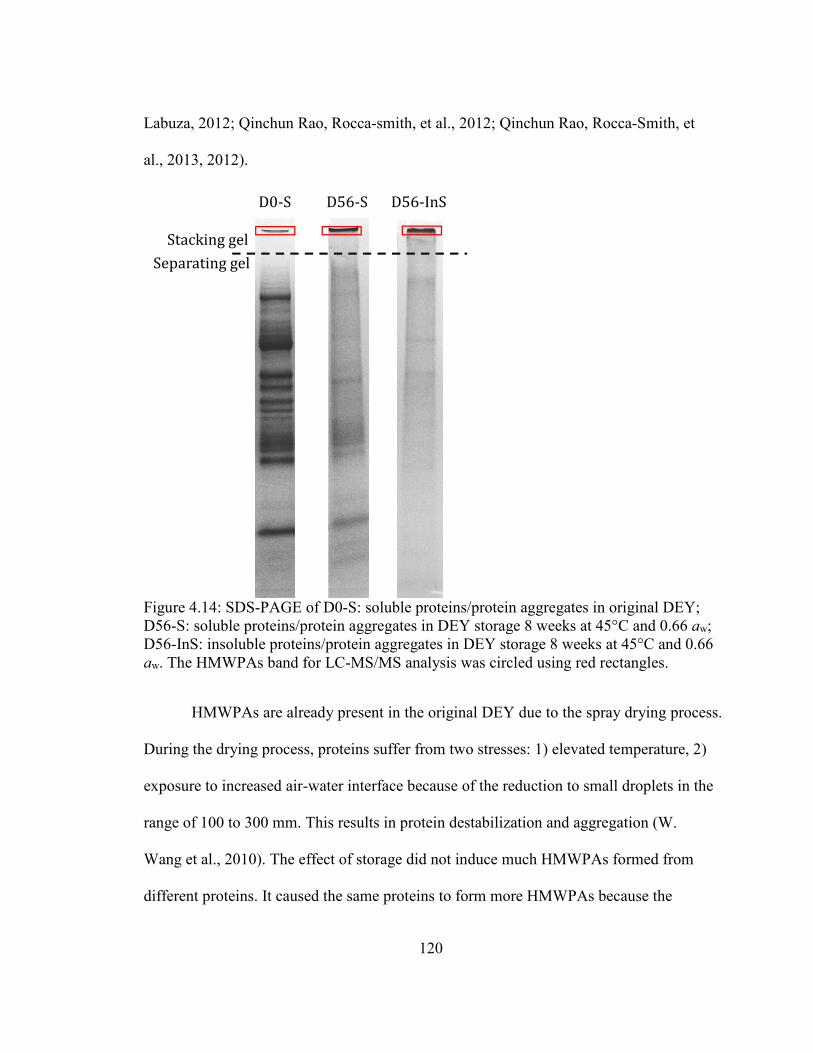
120
Labuza, 2012; Qinchun Rao, Rocca-smith, et al., 2012; Qinchun Rao, Rocca-Smith, et
al., 2013, 2012).
Figure 4.14: SDS-PAGE of D0-S: soluble proteins/protein aggregates in original DEY; D56-S: soluble proteins/protein aggregates in DEY storage 8 weeks at 45°C and 0.66 aw; D56-InS: insoluble proteins/protein aggregates in DEY storage 8 weeks at 45°C and 0.66 aw. The HMWPAs band for LC-MS/MS analysis was circled using red rectangles.
HMWPAs are already present in the original DEY due to the spray drying process.
During the drying process, proteins suffer from two stresses: 1) elevated temperature, 2)
exposure to increased air-water interface because of the reduction to small droplets in the
range of 100 to 300 mm. This results in protein destabilization and aggregation (W.
Wang et al., 2010). The effect of storage did not induce much HMWPAs formed from
different proteins. It caused the same proteins to form more HMWPAs because the
Stacking gel
Separating gel
D0-S D56-S D56-InS
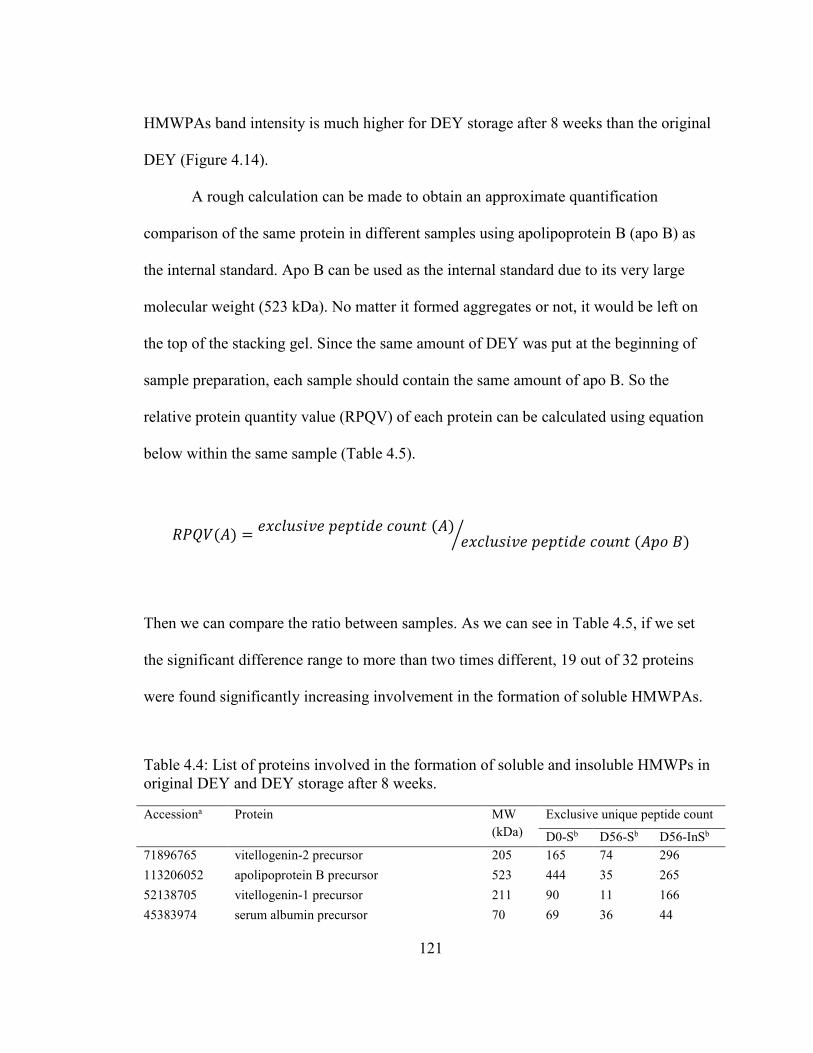
121
HMWPAs band intensity is much higher for DEY storage after 8 weeks than the original
DEY (Figure 4.14).
A rough calculation can be made to obtain an approximate quantification
comparison of the same protein in different samples using apolipoprotein B (apo B) as
the internal standard. Apo B can be used as the internal standard due to its very large
molecular weight (523 kDa). No matter it formed aggregates or not, it would be left on
the top of the stacking gel. Since the same amount of DEY was put at the beginning of
sample preparation, each sample should contain the same amount of apo B. So the
relative protein quantity value (RPQV) of each protein can be calculated using equation
below within the same sample (Table 4.5).
��,�(�) = �-.*/#$0� (�("$1� .&/!" (�)�-.*/#$0� (�("$1� .&/!" (�(& 2)+
Then we can compare the ratio between samples. As we can see in Table 4.5, if we set
the significant difference range to more than two times different, 19 out of 32 proteins
were found significantly increasing involvement in the formation of soluble HMWPAs.
Table 4.4: List of proteins involved in the formation of soluble and insoluble HMWPs in original DEY and DEY storage after 8 weeks.
Accessiona Protein MW
(kDa)
Exclusive unique peptide count
D0-Sb D56-Sb D56-InSb
71896765 vitellogenin-2 precursor 205 165 74 296
113206052 apolipoprotein B precursor 523 444 35 265
52138705 vitellogenin-1 precursor 211 90 11 166
45383974 serum albumin precursor 70 69 36 44
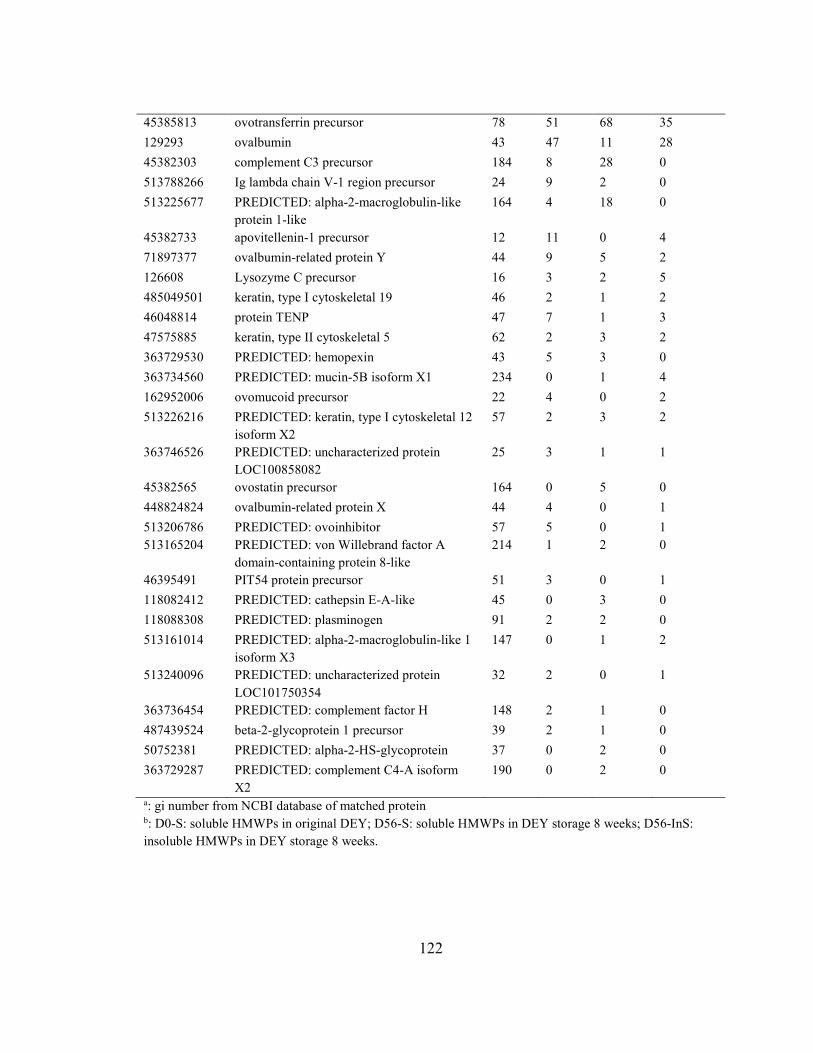
122
45385813 ovotransferrin precursor 78 51 68 35
129293 ovalbumin 43 47 11 28
45382303 complement C3 precursor 184 8 28 0
513788266 Ig lambda chain V-1 region precursor 24 9 2 0
513225677 PREDICTED: alpha-2-macroglobulin-like
protein 1-like
164 4 18 0
45382733 apovitellenin-1 precursor 12 11 0 4
71897377 ovalbumin-related protein Y 44 9 5 2
126608 Lysozyme C precursor 16 3 2 5
485049501 keratin, type I cytoskeletal 19 46 2 1 2
46048814 protein TENP 47 7 1 3
47575885 keratin, type II cytoskeletal 5 62 2 3 2
363729530 PREDICTED: hemopexin 43 5 3 0
363734560 PREDICTED: mucin-5B isoform X1 234 0 1 4
162952006 ovomucoid precursor 22 4 0 2
513226216 PREDICTED: keratin, type I cytoskeletal 12
isoform X2
57 2 3 2
363746526 PREDICTED: uncharacterized protein
LOC100858082
25 3 1 1
45382565 ovostatin precursor 164 0 5 0
448824824 ovalbumin-related protein X 44 4 0 1
513206786
513165204
PREDICTED: ovoinhibitor
PREDICTED: von Willebrand factor A
domain-containing protein 8-like
57
214
5
1
0
2
1
0
46395491 PIT54 protein precursor 51 3 0 1
118082412 PREDICTED: cathepsin E-A-like 45 0 3 0
118088308 PREDICTED: plasminogen 91 2 2 0
513161014 PREDICTED: alpha-2-macroglobulin-like 1
isoform X3
147 0 1 2
513240096 PREDICTED: uncharacterized protein
LOC101750354
32 2 0 1
363736454 PREDICTED: complement factor H 148 2 1 0
487439524 beta-2-glycoprotein 1 precursor 39 2 1 0
50752381 PREDICTED: alpha-2-HS-glycoprotein 37 0 2 0
363729287 PREDICTED: complement C4-A isoform
X2
190 0 2 0
a: gi number from NCBI database of matched protein b: D0-S: soluble HMWPs in original DEY; D56-S: soluble HMWPs in DEY storage 8 weeks; D56-InS:
insoluble HMWPs in DEY storage 8 weeks.
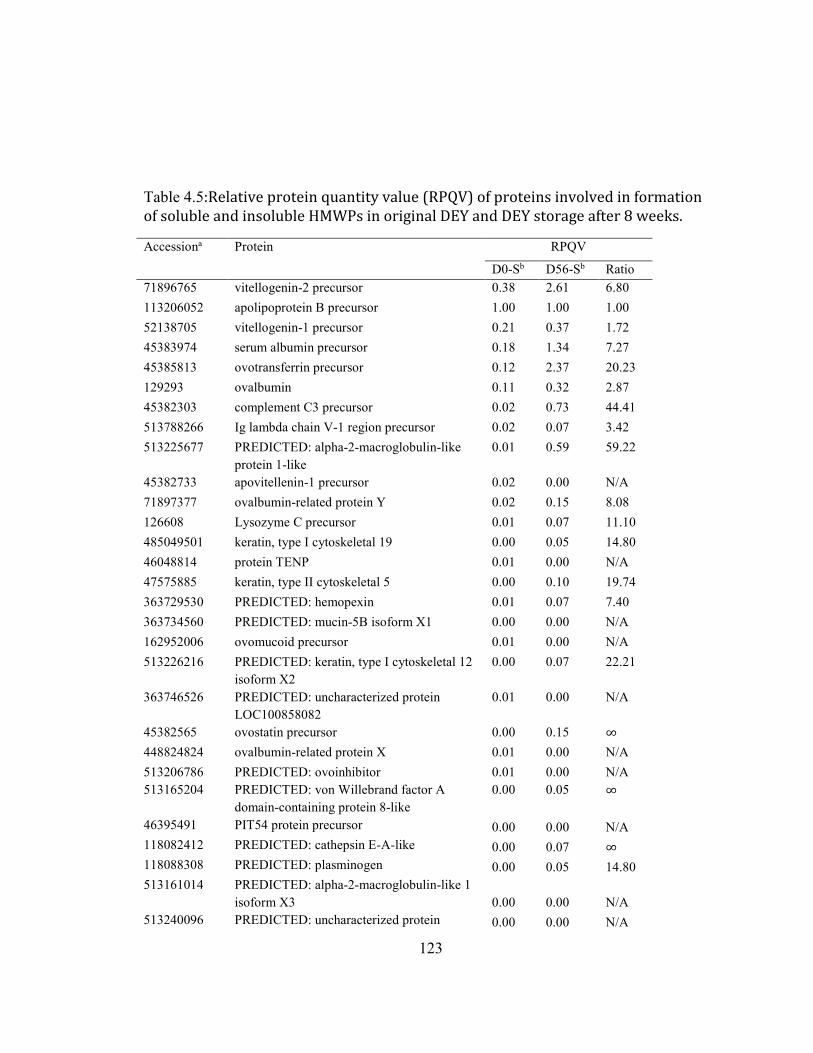
123
Table 4.5:Relative protein quantity value (RPQV) of proteins involved in formation
of soluble and insoluble HMWPs in original DEY and DEY storage after 8 weeks.
Accessiona Protein RPQV
D0-Sb D56-Sb Ratio
71896765 vitellogenin-2 precursor 0.38 2.61 6.80
113206052 apolipoprotein B precursor 1.00 1.00 1.00
52138705 vitellogenin-1 precursor 0.21 0.37 1.72
45383974 serum albumin precursor 0.18 1.34 7.27
45385813 ovotransferrin precursor 0.12 2.37 20.23
129293 ovalbumin 0.11 0.32 2.87
45382303 complement C3 precursor 0.02 0.73 44.41
513788266 Ig lambda chain V-1 region precursor 0.02 0.07 3.42
513225677 PREDICTED: alpha-2-macroglobulin-like
protein 1-like
0.01 0.59 59.22
45382733 apovitellenin-1 precursor 0.02 0.00 N/A
71897377 ovalbumin-related protein Y 0.02 0.15 8.08
126608 Lysozyme C precursor 0.01 0.07 11.10
485049501 keratin, type I cytoskeletal 19 0.00 0.05 14.80
46048814 protein TENP 0.01 0.00 N/A
47575885 keratin, type II cytoskeletal 5 0.00 0.10 19.74
363729530 PREDICTED: hemopexin 0.01 0.07 7.40
363734560 PREDICTED: mucin-5B isoform X1 0.00 0.00 N/A
162952006 ovomucoid precursor 0.01 0.00 N/A
513226216 PREDICTED: keratin, type I cytoskeletal 12
isoform X2
0.00 0.07 22.21
363746526 PREDICTED: uncharacterized protein
LOC100858082
0.01 0.00 N/A
45382565 ovostatin precursor 0.00 0.15 ∞
448824824 ovalbumin-related protein X 0.01 0.00 N/A
513206786
513165204
PREDICTED: ovoinhibitor
PREDICTED: von Willebrand factor A
domain-containing protein 8-like
0.01
0.00
0.00
0.05
N/A
∞
46395491 PIT54 protein precursor 0.00 0.00 N/A
118082412 PREDICTED: cathepsin E-A-like 0.00 0.07 ∞
118088308 PREDICTED: plasminogen 0.00 0.05 14.80
513161014 PREDICTED: alpha-2-macroglobulin-like 1
isoform X3 0.00 0.00 N/A
513240096 PREDICTED: uncharacterized protein 0.00 0.00 N/A
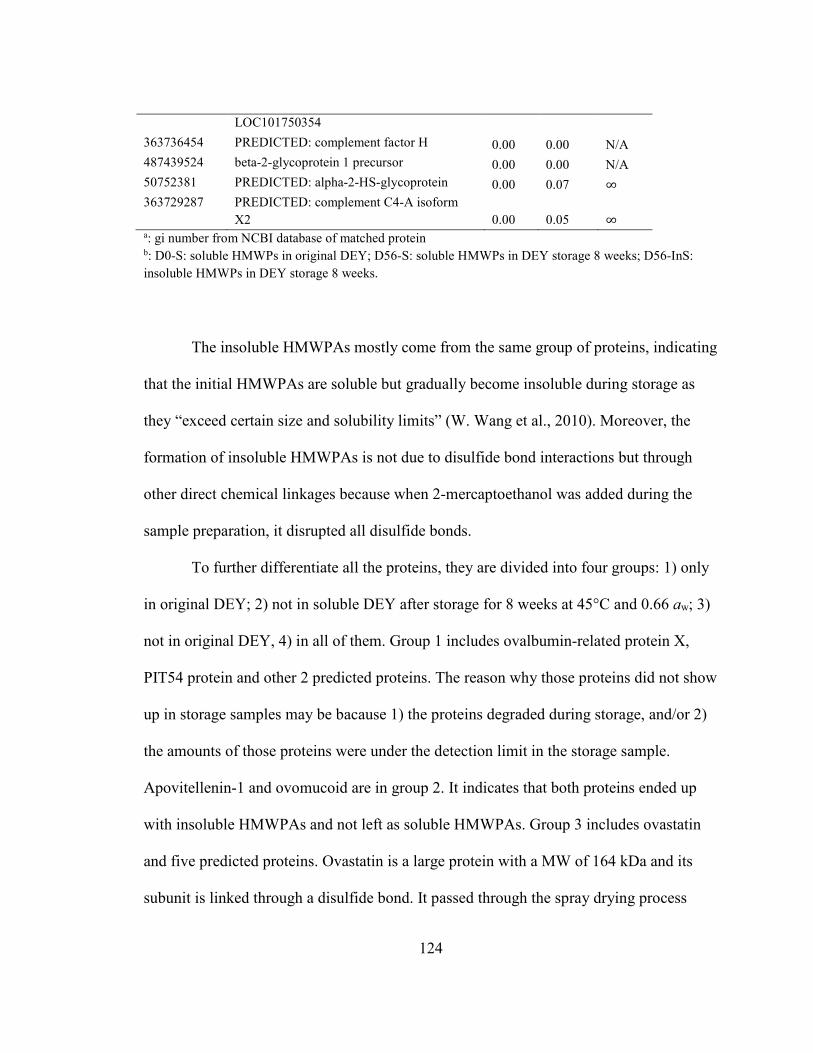
124
LOC101750354
363736454 PREDICTED: complement factor H 0.00 0.00 N/A
487439524 beta-2-glycoprotein 1 precursor 0.00 0.00 N/A
50752381 PREDICTED: alpha-2-HS-glycoprotein 0.00 0.07 ∞
363729287 PREDICTED: complement C4-A isoform
X2 0.00 0.05 ∞ a: gi number from NCBI database of matched protein b: D0-S: soluble HMWPs in original DEY; D56-S: soluble HMWPs in DEY storage 8 weeks; D56-InS:
insoluble HMWPs in DEY storage 8 weeks.
The insoluble HMWPAs mostly come from the same group of proteins, indicating
that the initial HMWPAs are soluble but gradually become insoluble during storage as
they “exceed certain size and solubility limits” (W. Wang et al., 2010). Moreover, the
formation of insoluble HMWPAs is not due to disulfide bond interactions but through
other direct chemical linkages because when 2-mercaptoethanol was added during the
sample preparation, it disrupted all disulfide bonds.
To further differentiate all the proteins, they are divided into four groups: 1) only
in original DEY; 2) not in soluble DEY after storage for 8 weeks at 45°C and 0.66 aw; 3)
not in original DEY, 4) in all of them. Group 1 includes ovalbumin-related protein X,
PIT54 protein and other 2 predicted proteins. The reason why those proteins did not show
up in storage samples may be bacause 1) the proteins degraded during storage, and/or 2)
the amounts of those proteins were under the detection limit in the storage sample.
Apovitellenin-1 and ovomucoid are in group 2. It indicates that both proteins ended up
with insoluble HMWPAs and not left as soluble HMWPAs. Group 3 includes ovastatin
and five predicted proteins. Ovastatin is a large protein with a MW of 164 kDa and its
subunit is linked through a disulfide bond. It passed through the spray drying process
125
without forming HMWPAs, indicating that the unfolding induced direct chemical
linkages may not be the main reason. The main reason would be direct chemical linkages
induced aggregates due to Maillard reaction and Lipid oxidation.
Discussion
The mechanism of protein aggregate formation of DEY proteins during storage is
dependent on two extrinsic factors, mainly storage temperature and humidity. High
temperature and humidity will lead to the occurrence of several chemical reactions
resulting in protein aggregates. The spray drying process could cause protein aggregation
to a different degree due to its high temperature. During the process, proteins will be
partially denatured and expose its potential binding sites (thiol group, ligand and fatty
acid binding sites), which can interact with other denatured proteins to form protein
aggregates. Storage at high temperature and humidity can promote further denaturation of
proteins, leading to more unfolded protein interactions, which ends up with formation of
protein aggregates. It also promotes lipid oxidation and the Maillard reaction, which
provides non-disulfide cross-linking pathways leading to protein aggregation.
The formation of protein aggregates may have an impact on the nutrition value of
DEY as it involves lipid and protein interactions. Lipid oxidation can cause damage to
the unsaturated fatty acid and can produce multiple substances that may have adverse
effects on human health (Frankel, 2005). The formation of protein aggregates may have
adverse effect on the digestion in the gastrointestinal tract, which may block the
bioactivity of certain proteins, such as IgY.
126
The formation of protein aggregates may also have adverse effects on the
functionality of DEY as well. As stated in the “Functionality of egg yolk powder” part in
the literature review, egg yolk has the abilities to form emulsion and gels. The
functionality of DEY is closely related with its protein structure. Therefore, the changes
of protein structure resulting from the formation of protein aggregates probably alters the
emulsion and gelation ability, but was measured in this study. Research has shown that
the denaturation of proteins during spray-drying process may improve the emulsion
ability of DEY (Caboni et al., 2005), which is due to the partially unfolded protein
exposing several hydrophobic patches outside, leading to a better balance of
hydrophobic/hydrophilic ratio, which can help the stabilization of the fat in water.
However, the damage of protein from the spray-dried process is minor compared to that
caused during the storage. With completely denatured proteins and rearrangement of
protein structure, the decline of functionalities of DEY is possible. But since the
functionality changes of DEY during storage has not been measured in the study, it is
hard to make any assumption on that.
Besides the nutritional value and functionality, lipid oxidation also produces off-
flavor and rancidity, which is definitely not welcomed for any DEY made products.
Therefore, effective approaches need to be applied to prevent the deterioration of DEY
during storage. The main stress to protein during spray drying is the exposure to the air-
water interface; therefore adding surfactants is an effective approach avoiding protein
aggregation. Controlling the storage condition of DEY is very important as stated in
Chapter 2. According to the food stability map (T. Labuza et al., 1970), the Maillard
127
reaction will not occur at very low aw (usually below 0.3) due to the lack of water as the
reaction medium, however, it did occur in DEY system due to the high liquid fat content
at 23°C. But the Maillard reaction rate at low water activity is much lower than the high
water activity. The relationship of lipid oxidation and aw is a U shape curve with the
lowest oxidation rate at its monolayer moisture value (2.3 g H2O for 100 g solids for
DEY, Figure 3.1). Therefore, storing DEY at its monolayer moisture value can reduce
both Maillard reaction and lipid oxidation. If reducing both reactions is not enough for
protecting deterioration of DEY, completely remove glucose and better packaging
techniques such as vacuum package can be applied to obtain a longer shelf life as long as
the water of the film is also low so as to not allow water vapor transmission into the
package.
Conclusion
The mechanism of formation of protein aggregation of dried egg yolk (DEY) at
different temperature and aw was investigated in this paper and effective approaches to
avoid DEY deterioration during storage were discussed. Overall, the denatured proteins
are precursors of the aggregation process. Unfolded intermediates and states interact with
each other through disulfide bonds or other chemical linkages to form protein aggregates.
With further denaturation of proteins and involvement of chemical reactions, lipid
oxidation and the Maillard reaction, more disulfide bonds and direct chemical linkages
are involved to build a protein-protein cross linking network, leading to the formation of
high molecular weight protein aggregates (HMWPAs). Therefore the best way to avoid
the formation of protein aggregation is to maintain proteins in their native states and
128
inhibit potential chemical reactions by control of storage condition, i.e., humidity and
temperature.
Acknowledgement
The authors would like to thank Del Inc. for providing the spray-dried egg yolk
powder. Thanks also to the Center of Mass Spectrometry at the University of Minnesota,
especially Dr. LeeAnn Higgins and Todd Markowski for their help with sample
preparation and MS analysis, and to Dr. Alessandra Marti for her help with FTIR and
front-face fluorescence analysis. We also thank the American Egg Board for the grant to
work on this project.
129
Thesis Conclusion:
From the storage study of a commercial spray-dried egg yolk powder (DEY), we
showed results that give evidence negating our central null hypothesis as we showed
physicochemical changes and the formation of protein aggregates of DEY during storage
were closely related with storage environment (aw and temperature).
The DEY samples stored at 45°C showed significant changes in physical and
chemical properties such as protein aggregation. The color change (a decrease of L* value
and an increase of ΔE* value) was mostly due to the Maillard reaction and lipid oxidation
as the products of both reactions have been found in all DEY samples stored at 45°C (at
aw of 0.05, 0.10, 0.37, 0.44, 0.54, 0. 66) using multiple techniques and their quantities
increased with increasing storage time. Both soluble and insoluble protein aggregates
were also found. The protein compositions of both soluble and insoluble high molecular
weight protein aggregates were similar, including major egg yolk and white proteins,
indicating that certain proteins are more suspectable than others to form aggregates when
placed in an abused environment, probably due to their intrinsic structures.
The molecular mechanism of the formation of protein aggregates is the result of
three mechanisms. The first is through the unfolding of intermediates and unfolded states;
The second is through direct chemical linkages, i.e., disulfide bonding, while the third
one is through self-association. The first two are the major ones as we have found protein
denaturation during storage, and again the occurrence of the Maillard reaction, lipid
oxidation and disulfide bond interactions, while the third one is a minor one. Therefore,
the effective approach to limit the formation of protein aggregates is to control the
130
temperature during manufacturing and storage (to avoid protein denaturation), as well as
to reduce/inhibit the Maillard reaction, lipid oxidation, and disulfide bond interaction
through adjusting environmental humidity.
The DEY samples stored at room temperature were very stable in terms of
physicochemical changes and the formation of protein aggregation even at an aw of 0.66.
The color had almost no decline in the brightness (L* value) and there were no visible
soluble or insoluble aggregates on a SDS-PAGE gel. Therefore, as long as DEY is stored
at a temperature below 25°C and at aw of 0.05 to 0.66, the powder should have at least a
year long shelf life with minimal and definitely acceptable quality changes. We have not
studied the storage stability of DEY with an aw higher than 0.66, because DEY gets
moldy easily, which confounds the results. We also did not add anti-microbial chemicals,
such as sodium azide, into our samples, because we did not want to introduce any
interference. However from other studies, we do see dramatic changes when the aw is
higher than 0.66 as shown on the food stability map. However, high aw (above 0.80) may
not be practical for a dehydrated products to achieve desired shelf life. Therefore, it may
not be a concern for the food industry. For example, the commercial egg yolk powder
that we received for our project has a moisture content of 2.3% of moisture (db) and was
contained in an opaque plastic package.
Even though little changes were found for color and protein aggregation of DEY
storage at room temperature, the occurrence of both the Maillard reaction and lipid
oxidation were confirmed with detection of decreased glucose content, increased
peroxide value, as well as increased other Maillard reaction and lipid oxidation products.
131
It must be noted that some of the reaction products are generated during the
manufacturing process, which include liquid pasteurization followed by spray drying.
The progress of both the Maillard reaction and lipid oxidation is mild and does not result
in significant changes in terms of physicochemical properties.
The impact of the aw is significant. It basically corresponds with the food stability
map. However due to the complexity of the sample system, with the Maillard reaction
and lipid oxidation occurring at the same time, several parameters do not show significant
difference as a function of aw. This is because when evaluating the reaction rates of both
reactions, the differences are not large enough to result statistical significant.
The storage temperature also has a huge impact on the storage stability of DEY. If
the Q10 of color change is adapted, which is around two, the shelf-life of DEY storage at
45°C would only be six months assuming that the shelf-life of DEY stored at room
temperature is about two years. The shelf-life decline can be bigger if the Q10 of protein
aggregation is adapted considering the tremendous difference between DEY stored at
room temperature and at 45°C in terms of formation of protein aggregates.
Therefore, both storage humidity and temperature are key factors in terms of DEY
storage stability. An appropriate storage environment can help maintain the quality of
DEY and probably extend the shelf life as well. Through adjusting storage environment,
the Maillard reaction, lipid oxidation, and disulfide linkages can be reduced, which
further decreases or eliminates the physicochemical changes and protein aggregates
formation during storage.
132
Besides storage environment, the manufacturing process can be adjusted to obtain
a better quality DEY as well through avoiding high temperature, humidity, and/or
pressure treatment. However, those technologies such as freeze drying may be too
expensive for the food industry to afford. While, from our storage study, the
manufacturing treatment, including spray drying and homogenization, does not affect the
overall quality of DEY as long as it is stored at ≤ 23°C and aw ≤ 0.66.
In conclusion, commercial spray-dried egg yolk powder is a shelf-stable product
if kept in an appropriate storage condition i.e., ≤ 23°C and aw ≤ 0.66, which is not hard
to maintain during distribution and storage. However, since DEY is not the final product,
it is mostly applied as an ingredient to put into food products such as mayonnaises, salad
dressing, baking products, and infant formula. Therefore, further studies of evaluating the
storage stability of those food products are necessary, as minor physicochemical changes
of DEY may result in significant quality changes of the final food products. Further
studies of analyzing all the protein aggregates (instead of just the high molecular weight
protein aggregates) may be necessary as well, because knowing the basic principle is
important in terms of problem solving and trouble shooting in the future.
133
Reference:
Akoh, C. C., & Min, D. B. (2008a). Food lipids: chemistry, nutrition, and biotechnology.
CRC Press.
Akoh, C. C., & Min, D. B. (2008b). Food lipids: chemistry, nutrition, and biotechnology.
CRC Press.
Allerton, S. E., & Perlmann, G. E. (1965). Chemical characterization of the
phosphoprotein phosvitin. Journal of Biological Chemistry, 240(10), 3892–3898.
Almeida, C. M. C., Kanashiro, M. M., Rangel Filho, F. B., Mata, M. F. R., Kipnis, T. L., &
da Silva, W. D. (1998). Development of snake antivenom antibodies in chickens
and their purification from yolk. Veterinary Record, 143(21), 579–584.
Ambrose, E. J., & Elliott, A. (1951). The structure of synthetic polypeptides. II.
Investigation with polarized infra-red spectroscopy. Proceedings of the Royal
Society A: Mathematical, Physical and Engineering Sciences, 205(1080), 47–60.
American Egg Board (2004) EGGSolutions - The complete reference for egg
products. (2004). Retrieved from
http://www.aeb.org/images/website/documents/food-manufacturers/order-
aeb-resources/EGGSolutions_The_Complete_Reference_for_Egg_Products.pdf
American Egg Board (2006). Egg product reference guide. (2006). Retrieved from
http://www.aeb.org/images/website/documents/food-manufacturers/order-
aeb-resources/Egg_Products_Reference_Guide.pdf
American Egg Board:Egg Production and Consumption. (2014). Retrieved from
http://www.aeb.org/egg-industry/industry-facts/egg-production-and-
consumption
Andersen, C. M., & Mortensen, G. (2008). Fluorescence spectroscopy: a rapid tool for
analyzing dairy products. Journal of Agricultural and Food Chemistry, 56(3),
720–9.
Anderson, T. A., Levitt, D. G., & Banaszak, L. J. (1998). The structural basis of lipid
interactions in lipovitellin, a soluble lipoprotein. Structure, 6(7), 895–909.
Anton, M. (2007a). High-density lipoproteins (HDL) or lipovitellin fraction. In
Bioactive egg compounds (pp. 13–16). Springer Berlin Heidelberg.
Anton, M. (2007b). Low-density lipoproteins (LDL) or lipovitellenin fraction. In
Bioactive egg compounds (Vol. 1, pp. 7–12). Springer Berlin Heidelberg.
Anton, M. (2013). Egg yolk: structures, functionalities and processes. Journal of the
Science of Food and Agriculture, 93(12), 2871–2880.
Anton, M., & Gandemer, G. (1997). Composition, solubility and emulsifying
134
properties of granules and plasma of egg yolk. Journal of Food Science, 62(3),
484–487.
Anton, M., Le Denmat, M., Beaumal, V., & Pilet, P. (2001). Filler effects of oil droplets
on the rheology of heat-set emulsion gels prepared with egg yolk and egg yolk
fractions. Colloids and Surfaces B: Biointerfaces, 21(1), 137–147.
Anton, M., Martinet, V., Dalgalarrondo, M., Beaumal, V., David-Briand, E., & Rabesona,
H. (2003). Chemical and structural characterisation of low-density lipoproteins
purified from hen egg yolk. Food Chemistry, 83(2), 175–183.
Anton, M., Nau, F., & Nys, Y. (2006). Bioactive egg components and their potential
uses. World’s Poultry Science Journal, 62(03), 429–438.
Araújo, A. S., Lobato, Z. I. P., Chavez-Olortegui, C., & Velarde, D. T. (2010). Brazilian
IgY-< i> Bothrops </i> antivenom: Studies on the development of a process in
chicken egg yolk. Toxicon, 55(4), 739–744.
Arrondo, J. L. R., Muga, A., Castresana, J., & Goñi, F. M. (1993). Quantitative studies of
the structure of proteins in solution by fourier-transform infrared
spectroscopy. Progress in Biophysics and Molecular Biology, 59(1), 23–56.
Bade, H., & Stegemann, H. (1984). Rapid method of extraction of antibodies from
hen egg yolk. Journal of Immunological Methods, 72(2), 421–426.
Barbosa-Cánovas, G., & Jr, A. F. (2008). Water activity in foods: fundamentals and
applications. John Willey & Sons, Inc., New York.
Bellairs, R. (1961). The structure of the yolk of the hen’s egg as studied by electron
microscopy I. The yolk of the unincubated egg. The Journal of Biophysical and
Biochemical Cytology, 11(1), 207–225.
Beuchat, L. R. (1981). Microbial stability as affected by water activity. Cereal Foods
World, 26(7), 345–349.
Beyer, R. S., & Jensen, S. J. (1989). Overestimation of the cholesterol content of eggs.
Journal of Agricultural and Food Chemistry, 37(4), 917–920.
Bonomi, F., Mora, G., Pagani, M. A., & Iametti, S. (2004). Probing structural features
of water-insoluble proteins by front-face fluorescence. Analytical Biochemistry,
329(1), 104–11.
Brockman, H., & Volker, O. (1934). The yellow pigment of the canary and the
occurrence of carotenoids in birds. Z. Physiol. Chem, 224, 193.
Brunauer, S. (1945). The adsorption of gases and vapors. Princeton, NJ: Princeton
University Press.
Burley, R. W., & Cook, W. H. (1961). Isolation and composition of avian egg yolk
granules and their constituent α-and β-lipovitellins. Canadian Journal of
Biochemistry and Physiology, 39(8), 1295–1307.
Buxmann, W., Bindrich, U., Strijowski, U., Heinz, V., Knorr, D., & Franke, K. (2010).
135
Influencing emulsifying properties of egg yolk by enzymatic modification with
phospholipase D. Part 2: structural changes of egg yolk due to incubation.
Colloids and Surfaces. B, Biointerfaces, 76(1), 192–198.
Byler, D. M., & Susi, H. (1986). Examination of the secondary structure of proteins by
deconvolved FTIR spectra. Biopolymers, 25(3), 469–87.
Caboni, M., Boselli, E., Messia, M., Velazco, V., Fratianni, A., Panfili, G., & Marconi, E.
(2005). Effect of processing and storage on the chemical quality markers of
spray-dried whole egg. Food Chemistry, 92(2), 293–303.
Carey, D. M. (1998). Measurement of the Raman spectrum of liquid water. Journal of
Chemical Physics, 108, 2669–2675.
Carpenter, J. F., Pikal, M. J., Chang, B. S., & Randolph, T. W. (1997). Rational design of
stable lyophilized protein formulations: some practical advice. Pharmaceutical
Research, 14(8), 969–975.
Castellani, O., Guérin-Dubiard, C., David-Briand, E., & Anton, M. (2004). Influence of
physicochemical conditions and technological treatments on the iron binding
capacity of egg yolk phosvitin. Food Chemistry, 85(4), 569–577.
Chang, C. M., Powrie, W. D., & Fennema, O. (1977). Microstructure of egg yolk.
Journal of Food Science, 42(5), 1193–1200.
Chang, H. M., Lu, T. C., Chen, C. C., Tu, Y. Y., & Hwang, J. Y. (2000). Isolation of
immunoglobulin from egg yolk by anionic polysaccharides. Journal of
Agricultural and Food Chemistry, 48(4), 995–999.
Chapin, R. B. (1951). Some factors affecting the emulsifying properties of hen’s egg.
Iowa State College.
Chevalier, F., Chobert, J., Dalgalaprondo, M., & Haertle, T. (2001). Characterization of
the Maillard reaction products of beta-lactoglobulin glucosylated in mild
conditions. Journal of Food Biochemistry, 25(1), 33–55.
Christian, J. H. B. (1963). Water activity and the growth of microorganisms. Recent
Advances in Food Science, 3, 248–255.
Christie, W. W., & Moore, J. H. (1970). The structure of egg yolk triglycerides.
Biochimica et Biophysica Acta (BBA)-Lipids and Lipid Metabolism, 218(1), 83–88.
Connelly, P. W., & Kuksis, A. (1983). Influence of divalent cations on rat
apolipoprotein transfer to synthetic lipoproteinlike lipid emulsions in vitro.
Canadian Journal of Biochemistry and Cell Biology, 61(1), 63–71.
Cook, J. D., & Monsen, E. R. (1976). Food iron absorption in human subjects. III.
Comparison of the effect of animal proteins on nonheme iron absorption. The
American Journal of Clinical Nutrition, 29(8), 859–867.
Cook, W. H., & Martin, W. G. (1969). Egg lipoproteins. In Structural and functional
aspects of lipoproteins in living systems (pp. 579–615). Academic Press, London
New York.
136
Cotterill, O. J. (1995). Egg-products industry. In Egg Science and Technology (fourth
edi., pp. 221–223). Food Products Press.
Cotterill, O. J., Glauert, J., & Froning, G. W. (1978). Nutrient composition of
commercially spray-dried egg products. Poultry Science, 57(2), 439–442.
de Almeida, C. M. C., de Silva, C. L., Couto, H. P., Escocard, R. D. C. M., da Rocha, D. G.,
Sentinelli, L. D. P., … da Silva, W. D. (2008). Development of process to produce
polyvalent IgY antibodies anti-African snake venom. Toxicon, 52(2), 293–301.
Denmat, M., Anton, M., & Gandemer, G. (1999). Protein denaturation and emulsifying
properties of plasma and granules of egg yolk as related to heat treatment.
Journal of Food Science, 64(2), 194–197.
Desai, I. D., & Tappel, a L. (1963). Damage to proteins by peroxidized lipids. Journal
of Lipid Research, 4(2), 204–7.
Dixon, D. K., & Cotterill, O. J. (1981). Electrophoretic and chromatographic changes
in egg yolk proteins due to heat. Journal of Food Science, 46(4), 981–983.
Do, U. H., Pei, P. T., & Minard, R. D. (1981). Separation of molecular species of
ceramides as benzoyl andp-nitrobenzoyl derivatives by high performance
liquid chromatography. Lipids, 16(11), 855–862.
Dong, A., Caughey, B., Caughey, W. S., Bhat, K. S., & Coe, J. E. (1992). Secondary
structure of the pentraxin female protein in water determined by infrared
spectroscopy: effects of calcium and phosphorylcholine. Biochemistry, 31(39),
9364–9370.
Dong, A., Huang, P., & Caughey, W. S. (1990). Protein secondary structures in water
from second-derivative amide I infrared spectra. Biochemistry, 29(13), 3303–
3308.
Du, M., & Ahn, D. U. (2000a). Effects of Antioxidants and Packaging on Lipid and
Cholesterol Oxidation and Color Changes of Irradiated Egg Yolk Powder. Journal
of Food Science, 65(4), 625–629.
Du, M., & Ahn, D. U. (2000b). Effects of Antioxidants and Packaging on Lipid and
Cholesterol Oxidation and Color Changes of Irradiated Egg Yolk Powder. Food
Chemistry and Toxicology, 65(4), 625–629.
Dufour, E., Genot, C., & Haertlé, T. (1994). β-lactoglobulin binding properties during
its folding changes studied by fluorescence spectroscopy. Biochimica et
Biophysica Acta (BBA) - Protein Structure and Molecular Enzymology, 1205(1),
105–112.
Dyer-Hurdon, J. N., & Nnanna, A. (1993). Cholesterol content and functionality of
plasma and granules fractionated from egg yolk. Journal of Food Science, 58(6),
1277–1281.
Elliott, A., & Ambrose, E. J. (1950). Structure of Synthetic Polypeptides. Nature,
165(4206), 921–922.
137
Erhard, M. H., Ozpinar, H., & Bilal, T. (1999). The humoral immune response and the
productivity of laying hens kept on the ground or in cages. Alternatives to
Laboratory Animals: ATLA, 28(5), 699–705.
Evans, A. J., & Burley, R. W. (1987). Proteolysis of apoprotein B during the transfer of
very low density lipoprotein from hens’ blood to egg yolk. The Journal of
Biological Chemistry, 262(2), 501–504.
FAO. (2003). Food energy: Methods of analysis and conversion factors: Report of a
technical workshop, rome, 3-6 December 2002. In Food and Agriculture
Organization of the United Nations.
Fenton, M., & Sim, J. S. (1991). Determination of egg yolk cholesterol content by on-
column capillary gas chromatography. Journal of Chromatography A, 540, 323–
329.
Fernandez, M. L., & Webb, D. (2008). The LDL to HDL cholesterol ratio as a valuable
tool to evaluate coronary heart disease risk. Journal of the American College of
Nutrition, 27(1), 1–5.
Fernandez, M. L., Wilson, T. A., Conde, K., Vergara-Jimenez, M., & Nicolosi, R. J.
(1999). Hamsters and guinea pigs differ in their plasma lipoprotein cholesterol
distribution when fed diets varying in animal protein, soluble fiber, or
cholesterol content. The Journal of Nutrition, 129(7), 1323–1332.
Ferry, J. D. (1980). Viscoelastic properties of polymers (3rd ed.). John Willey & Sons,
Inc., New York.
Fichtali, J., Charter, E. A., Lo, K. V., & Nakai, S. (1992). Separation of egg yolk
immunoglobulins using an automated liquid chromatography system.
Biotechnology and Bioengineering, 40(11), 1388–1394.
Franke, K., & Kieling, M. (2002). Influence of spray drying conditions on
functionality of dried whole egg. Journal of the Science of Food and Agriculture,
82(15), 1837–1841.
Frankel, E. (2005). Lipid oxidation. The oil press.
Funk, K., & Zabik, M. E. (1971). Comparison of frozen, foam-spray-dried, freeze-
dried and spray-dried eggs. Journal of Food Science, 36(5), 715–717.
Gardner, H. W. (1979). Lipid Hydroperoxide Reactivity with Proteins and Amino
Acids: A Review. Journal of Agricultural and Food Chemistry, 27(2), 220–229.
Gillam, A. E., & Heilbron, I. M. (1935). Vitamin A-active substances in egg-yolk.
Biochem. J., 29, 1064.
Goresline, H. E., & Hayes, K. M. (1951). Pasteurization of liquid whole egg under
commercial conditions to eliminate Salmonella.
Goulas, A., Triplett, E. L., & Taborsky, G. (1996). Oligophosphopeptides of varied
structural complexity derived from the egg phosphoprotein, phosvitin. Journal
of Protein Chemistry, 15(1), 1–9.
138
Greenspan, L. (1977). Humidity fixed points of binary saturated aqueous solutions.
Journal of Research of the National Bureau of Standards Section - A. Physics and
Chemistry, 81(1), 89–96.
Guilmineau, F., Krause, I., & Kulozik, U. (2005). Efficient analysis of egg yolk proteins
and their thermal sensitivity using sodium dodecyl sulfate polyacrylamide gel
electrophoresis under reducing and nonreducing conditions. Journal of
Agricultural and Food Chemistry, 53(24), 9329–36. doi:10.1021/jf050475f
Harris, R. (1981). Effect of water potential on microbial growth and activity. In
Water potential relations in soil microbiology (pp. 23–95). Special Publication
No 9. Soil Science Society of America, Madison, WI.
Hartmann, C., & Wilhelmson, M. (2001). The hen’s egg yolk: a source of biologically
active substances. World’s Poultry Science, 57, 13–28.
Hasegawa, K., Endo, Y., & Fujimoto, K. (1993). Assessment of lipid oxidation in
freeze-dried pork and egg yolk by solid sample spectrofluorometry. Nippon
Shokuhin Kogyo Gakkaishi, 40(2), 150–153.
Hatta, H., Kim, M., & Yamamoto, T. (1990). A novel isolation method for hen egg yolk
antibody, “IgY.” Agric. Biol. Chem, 54(10), 2531–2535.
Hatta, H., Tsuda, K., Akachi, S., Kim, M., & Yamamoto, T. (1993). Productivity and
some properties of egg yolk antibody (IgY) against human rotavirus compared
with rabbit IgG. Biosci Biotechnol Biochem, 57(3), 450–454.
Hermes-lima, M., Willmore, W. G., & Storey, K. B. (1995). Quantification of lipid
peroxidation in tissue extracts based on Fe(III) xylenol orange compelx
formation. Free Radical Biology & Medicine, 19(3), 271–280.
Herron, K. L., Vega-Lopez, S., Conde, K., Ramjiganesh, T., Roy, S., Shacheter, N. S., &
Fermandez, M. L. (2002). Pre-menopausal women, classified as hypo-or hyper-
responders, do not alter their LDL/HDL ratio following a high dietary
cholesterol challenge. Journal of the American College of Nutrition, 21(3), 250–
258.
Hodge, J. E. (1953). Dehydrated foods, chemistry of browning reactions in model
systems. Journal of Agricultural and Food Chemistry, 1, 928–943.
Houston, D. K., Ding, J., Lee, J. S., Garcia, M., Kanaya, A. M., Tylavsky, F. A., …
Kritchevsky, S. B. (2011). Dietary fat and cholesterol and risk of cardiovascular
disease in older adults: the Health ABC Study. Nutrition, Metabolism, and
Cardiovascular Diseases, 21(6), 430–437.
Hu, J., La Vecchia, C., De Groh, M., Negri, E., Morrison, H., & Mery, L. (2012). Dietary
cholesterol intake and cancer. Annals of Oncology, 23(2), 491–500.
Huschka, B., Bonomi, F., Marengo, M., Miriani, M., & Seetharaman, K. (2012).
Comparison of lipid effects on structural features of hard and soft wheat flour
proteins assessed by front-face fluorescence. Food Chemistry, 133(3), 1011–
139
1016.
Jackson, M., Haris, P. I., & Chapman, D. (1989). Fourier transform infrared
spectroscopic studies of lipids, polypeptides and proteins. Journal of Molecular
Structure, 214, 329–355.
Jackson, M., & Mantsch, H. H. (1991). Protein secondary structure from FT-IR
spectroscopy: correlation with dihedral angles from three-dimensional
Ramachandran plots. Canadian Journal of Chemistry, 69(11), 1639–1642.
Jackson, M., & Mantsch, H. H. (1995). The use and misuse of FTIR spectroscopy in the
determination of protein structure. Critical Reviews in Biochemistry and
Molecular Biology, 30(2), 95–120.
Jang, H., & Swaisgood, H. (1990). Disulfide bond formation between thermally
denatured β-lactoglobulin and κ-casein in casein micelles. Journal of Dairy
Science, 73(4), 900–904.
Jaradat, Z. W., & Marquardt, R. R. (2000). Studies on the stability of chicken IgY in
different sugars, complex carbohydrates and food materials. Food and
Agricultural Immunology, 12(4), 263–272.
Jensenius, J. C., Andersen, I., Hau, J., Crone, M., & Koch, C. (1981). Eggs: conveniently
packaged antibodies. Methods for purification of yolk IgG. Journal of
Immunological Methods, 46(1), 63–68.
Jolivet, P., Boulard, C., Beaumal, V., Chardot, T., & Anton, M. (2006). Protein
components of low-density lipoproteins purified from hen egg yolk. Journal of
Agricultural and Food Chemistry, 54(12), 4424–4429.
Juneja, L. R. (1996). Egg yolk lipids. In Hen eggs: Their basic and applied science (pp.
73–99). CRC Press.
Juneja, L. R., & Kim, M. (1996). Egg yolk proteins. In Hen eggs: Their basic and applied
science (pp. 57–62). CRC Press.
Kaanane, A., & Labuza, T. (1988). The Maillard reaction in foods. Progress in Clinical
and Biological Research, 304, 301–327.
Kalnin, N. N., Baikalov, I. A., & Venyaminov SYu. (1990). Quantitative IR
spectrophotometry of peptide compounds in water (H2O) solutions. III.
Estimation of the protein secondary structure. Biopolymers, 30(13-14), 1273–
80. Retrieved from http://www.ncbi.nlm.nih.gov/pubmed/2085661
Kamman, J. F., & Labuza, T. P. (1985). A comparison of the effect of oil versus
plasticized vegetable shortening on rates of glucose utilization in nonenzymatic
browning. Journal of Food Processing and Preservation, 9(3), 217–222.
Kanner, J., & Karel, M. (1975). Changes in lysozyme due to reactions with
peroxidizing methyl linoleate in a dehydrated model system. Journal of
Agricultural and Food Chemistry, 24(3), 468–472.
Karmas, R., Pilar Buera, M., & Karel, M. (1992). Effect of glass transition on rates of
140
nonenzymic browning in food systems. Journal of Agricultural and Food
Chemistry, 40(5), 873–879.
Karoui, R., Kemps, B., Bamelis, F., Ketelaere, B., Decuypere, E., & Baerdemaeker, J.
(2005). Methods to evaluate egg freshness in research and industry: A review.
European Food Research and Technology, 222(5-6), 727–732.
Karoui, R., Kemps, B., Bamelis, F., Ketelaere, B., Merten, K., Schoonheydt, R., …
Baerdemaeker, J. (2006). Development of a rapid method based on front-face
fluorescence spectroscopy for the monitoring of egg freshness: 2—evolution of
egg yolk. European Food Research and Technology, 223(2), 180–188.
Karoui, R., Schoonheydt, R., Decuypere, E., Nicolaï, B., & De Baerdemaeker, J. (2007).
Front face fluorescence spectroscopy as a tool for the assessment of egg
freshness during storage at a temperature of 12.2 degrees C and 87% relative
humidity. Analytica Chimica Acta, 582(1), 83–91.
Keller, A., Nesvizhskii, A. I., Kolker, E., & Aebersold, R. (2002). Empirical Statistical
Model To Estimate the Accuracy of Peptide Identifications Made by MS/MS and
Database Search. Analytical Chemistry, 74(20), 5383–5392.
Kikugawa, K., & Beppu, M. (1987). Involvement of lipid oxidation products in the
formation of fluorescent and cross-linked proteins. Chemistry and Physics of
Lipids, 44(2-4), 277–296.
Kim, M., Lee, D. T., & Lee, Y. S. (1995). Iron absorption and intestinal solubility in rats
are influenced by dietary proteins. Nutrition Research, 15(11), 1705–1716.
Kiosseoglou, V. (2003). Egg yolk protein gels and emulsions. Current Opinion in
Colloid & Interface Science, 8(4-5), 365–370.
Klemperer, F. (1893). ueber natürliche immunität und ihre verwerthung für die
immunisirungstherapie. Naunyn-Schmiedeberg’s Archives of Pharmacology,
31(4), 356–382.
Koç, M., Koç, B., Susyal, G., Yilmazer, M. S., Bağdatlıoğlu, N., & Kaymak-Ertekin, F.
(2011). Improving functionality of whole egg powder by the addition of
gelatine, lactose, and pullulan. Journal of Food Science, 76(9), S508–S515.
KOJIMA, E., & NAKAMURA, R. (1985). Heat gelling properties of hen’s egg yolk low
density lipoprotein (LDL) in the presence of other protein. Journal of Food
Science.
Kollberg, H., Carlander, D., Olesen, H., Wejaker, P. E., Johannensson, M., & Larsson, A.
(2003). Oral administration of specific yolk antibodies (IgY) may prevent
Pseudomonas aeruginosa infections in patients with cystic fibrosis: a phase I
feasibility study. Pediatric Pulmonology, 35(6), 433–440.
KONG, J., & YU, S. (2007). Fourier transform infrared spectroscopic analysis of
protein secondary structures. Acta Biochimica et Biophysica Sinica, 39(8), 549–
559.
141
Kovacs-Nolan, J., Mine, Y., Immerseel, F. V., Nys, Y., & Bain, M. (2011). Using egg IgY
antibodies for health, diagnostic and other industrial applications. Improving
the Safety and Quality of Eggs and Egg Products, Volume 2, 346–373.
Krinsky, N. I. (2002). Possible Biologic Mechanisms for a Protective Role of
Xanthophylls. J. Nutr., 132(3), 540S–542.
Kritchevsky, S., & Kritchevsky, D. (2000). Egg consumption and coronary heart
disease: an epidemiologic overview. Journal of the American College of
Nutrition, 19(sup5), 549S–555S.
Krüger, C., Pearson, S. K., Kodama, Y., Vacca Smith, A., Bowen, W. H., & Hammarstrom
L. (2003). The effects of egg-derived antibodies to glucosyltransferases on
dental caries in rats. Caries Research, 38(1), 9–14.
Kulmyrzaev, A. A., Karoui, R., De Baerdemaeker, J., & Dufour, E. (2007). Infrared and
Fluorescence Spectroscopic Techniques for the Determination of Nutritional
Constituents in Foods. International Journal of Food Properties, 10(2), 299–320.
Kulmyrzaev, A. A., Levieux, D., & Dufour, E. (2005). Front-face fluorescence
spectroscopy allows the characterization of mild heat treatments applied to
milk. Relations with the denaturation of milk proteins. Journal of Agricultural
and Food Chemistry, 53(3), 502–7. Retrieved from
http://pubs.acs.org.ezp1.lib.umn.edu/doi/abs/10.1021/jf049224h
Kulmyrzaev, A., & Dufour, �ric. (2002). Determination of lactulose and furosine in
milk using front-face fluorescence spectroscopy. Le Lait, 82(6), 725–735.
doi:10.1051/lait:2002045
Kurtoglu*, V., Kurtoglu, F., & Seker, E. (2004). Effect of probiotic supplementation on
laying hen diets on yield performance and serum and egg yolk cholesterol. Food
Additives and …, 21(9), 817–823.
Kwan, L., Li-Chan, E., Helbig, N., & Nakai, S. (1991). Fractionation of water-soluble
and -insoluble components from egg yolk with minimum use of organic
Solvents. Journal of Food Science, 56(6), 1537–1541.
Labuza, T., & Kamman, J. (1983). Reaction kinetics and accelerated tests simulation
as a function of temperature. Computer-Aided Techniques in Food Technology,
71–115.
Labuza, T. P. (1968). Sorption phenomena in foods. Food Technology, 22, 263–
265,268,270,272.
Labuza, T. P. (1975). Sorption phenomena in foods: Theoretical and practical
aspects. In C. Rha (Ed.), Theory, determination and control of physical properties
of Food materials (pp. 197–219). Springer Netherlands.
Labuza, T. P. (1980). The effect of water activity on reaction kinetics of food
deterioration. Food Technology, 34, 36–41,59.
Labuza, T. P., & Dugan Jr, L. R. (1971). kinetics of lipid oxidation in foods. Critical
142
Reviews in Food Science and Nutrition, 2(3), 355–405.
Labuza, T. P., McNally, L., Gallagher, D., Hawkes, J., & Hurtado, F. (1972). STABILITY
OF INTERMEDIATE MOISTURE Oxidation Foods. 1. Lipid Oxidation. Journal of
Food Science, 37, 154–159.
Labuza, T. P., & Saltmarch, M. (1981). Kinetics of browning and protein quality loss
in whey powders during steady state and nonsteady state storage conditions.
Journal of Food Science, 47, 92–96.
Labuza, T. P., & Schmidl, M. K. (1988). Use of sensory data in the shelf life testing of
foods: principles and graphical methods for evaluation. Cereal Foods World
(USA), 33(2), 193–206. Retrieved from http://agris.fao.org/agris-
search/search.do?recordID=US8851564
Labuza, T., Tannenbaum, S., & Karel, M. (1970). Water content and stability of low-
moisture & intermediate-moisture foods. Food Technology, 24, 543–550.
Laca, A., Paredes, B., & Díaz, M. (2010). A method of egg yolk fractionation.
Characterization of fractions. Food Hydrocolloids, 24(4), 434–443.
Laemmli, U. K. (1970). Cleavage of structural proteins during the assembly of the
head of bacteriophage T4. Nature, 227, 680–685.
Le Meste, M., Champion, D., Roudaut, G., Blond, G., & Simatos, D. (2002). Glass
transition and food technology: A critical appraisal. J. Food. Sci., 67, 2444–2458.
Lee, A., & Griffin, B. (2006). Dietary cholesterol, eggs and coronary heart disease risk
in perspective. Nutrition Bulletin, 31(1), 21–27.
Levine, H., & Slade, L. (1986). A polymer physico-chemical approach to the study of
commercial starch hydrolysis products (SHPs). Carbohydrate Polymers, 6(3),
213–244.
Li-chan, E. (1996). The application of Raman spectroscopy in food science. Trends in
Food Science & Technology, 7, 361–370.
Li-Chan, E., Nakai, S., & Hirotsuka, M. (1994). Raman spectroscopy as a probe of
protein structure in food systems. In Protein structure-function relationships in
foods (pp. 163–197). Springer US.
Liu, X., Zhou, P., Tran, A., & Labuza, T. P. (2009). Effects of polyols on the stability of
whey proteins in intermediate-moisture food model systems. Journal of
Agricultural and Food Chemistry, 57(6), 2339–45.
Lösch, U. (1996). How do the antibodies get into the chicken egg? ALTEX, 13(5), 15–
17.
Lösch, U., Schranner, I., Wanke, R., & Jurgens, L. (1986). The chicken egg, an antibody
source. Journal of Veterinary Medicine, Series B, 33(1-10), 609–619.
Mann, K., & Mann, M. (2008a). The chicken egg yolk plasma and granule proteomes.
Proteomics, 8, 178–191. doi:10.1002/pmic.200700790
143
Mann, K., & Mann, M. (2008b). The chicken egg yolk plasma and granule proteomes.
Proteomics, 8(1), 178–91.
Martin, W., Augustyniak, J., & Cook, W. (1964). Fractionation and characterization of
the low-density lipoproteins of hen’s egg yolk. Biochimica et Biophysica Acta
(BBA)-Specialized Section on Lipids and Related Subjects, 84(6), 714–720.
Martin, W. G., Vandegaer, J. E., & Cook, W. H. (1957). Fractionation of livetin and the
molecular weights of the α-and β-components. Canadian Journal of
Biochemistry and Physiology, 35(4), 241–250.
Matsushita, S. (1975). Specific interactions of linoleic acid hydroperoxides and their
secondary degraded products with enzyme proteins. Journal of Agricultural and
Food Chemistry, 23(2), 150–154.
MC Bee, L. E., & Cotterill, O. J. (1979). Ion-exchange chromatography and
electrophoresis of egg yolk proteins. Journal of Food Science, 44, 656–667.
McNamara, D. (2014). Dietary cholesterol, heart disease risk and cognitive
dissonance. The Proceedings of the Nutrition Society, 1–6.
McNaughton, J. (1978). Effect of dietary fiber on egg yolk, liver, and plasma
cholesterol concentrations of the laying hen. The Journal of Nutrition, 108(11),
1842–1848.
Mecham, D. K., & Olcott, H. S. (1949). Phosvitin, the principal phosphoprotein of egg
yolk. Journal of the American Chemical Society, 71(11), 3670–3679.
Meenatchisundaram, S., Parameswari, G., Michael, A., & Ramalingam, S. (2008a).
Neutralization of the pharmacological effects of Cobra and Krait venoms by
chicken egg yolk antibodies. Toxicon, 52(2), 221–227.
Meenatchisundaram, S., Parameswari, G., Michael, A., & Ramalingam, S. (2008b).
Studies on pharmacological effects of Russell’s viper and Saw-scaled viper
venom and its neutralization by chicken egg yolk antibodies. International
Immunopharmacology, 8(8), 1067–1073.
Meulenaer, B. De, & Huyghebaert, A. (2001). Isolation and purification of chicken egg
yolk immunoglobulins: A review. Food and Agricultural Immunology, 13(4),
275–288.
Mine, Y., & Kovacs-Nolan, J. (2002). Chicken egg yolk antibodies as therapeutics in
enteric infectious disease: a review. Journal of Medicinal Food, 5(3), 159–169.
Miyazawa, T., Shimanouchi, T., & Mizushima, S. (1956). Characteristic Infrared
Bands of Monosubstituted Amides. The Journal of Chemical Physics, 24(2), 408.
Retrieved from
http://scitation.aip.org/content/aip/journal/jcp/24/2/10.1063/1.1742489
Mohammed, S., Morrison, S., Wims, L., Trinh, K. R., Wildeman, A. G., Bonselaar, J., &
Etches, R. J. (1998). Deposition of genetically engineered human antibodies into
the egg yolk of hens. Immunotechnology, 4(2), 115–125.
144
Moore, T. (1989). The cholesterol myth. Atlantic Monthly, 264(3), 37–70.
Moros, J. E., Franco, J. M., & Gallegos, C. (2002). Rheology of spray-dried egg yolk-
stabilized emulsions. International Journal of Food Science and Technology,
37(3), 297–307.
Morrison, S., Mohammed, M., Wims, L., Trinh, R., & Etches, R. (2002). Sequences in
antibody molecules important for receptor-mediated transport into the chicken
egg yolk. Molecular Immunology, 38(8), 619–625.
Mukherjee, S., Chowdhury, P., & Gai, F. (2009). Effect of dehydration on the
aggregation kinetics of two amyloid peptides. The Journal of Physical Chemistry.
B, 113, 531–535.
Nagaraj, R., Shipanova, I., & Faust, F. (1996). Protein cross-linking by the Maillard
reaction isolation, characterization, and in vivo detection of a lysine-lysine
cross-link derived from methylglyoxal. Journal of Biological Chemistry, 271(32),
19338–19345.
Navidghasemizad, S., Temelli, F., & Wu, J. (2014). Physicochemical properties of
leftover egg yolk after livetins removal. LWT-Food Science and Technology,
55(1), 170–175.
Nesvizhskii, A. I., Keller, A., Kolker, E., & Aebersold, R. (2003). A statistical model for
identifying proteins by tandem mass spectrometry. Analytical Chemistry,
75(17), 4646–4658.
Nikiforidis, C. V., Biliaderis, C. G., & Kiosseoglou, V. (2012). Rheological
characteristics and physicochemical stability of dressing-type emulsions made
of oil bodies–egg yolk blends. Food Chemistry, 134(1), 64–73.
Ntakarutimana, V., Demedts, P., Van Sande, M., & Scharpe, S. (1992). A simple and
economical strategy for downstream processing of specific antibodies to human
transferrin from egg yolk. Journal of Immunological Methods, 153(1), 133–140.
Padmore, J. (1990). Protein (crude) in animal feed—Dumas method, method no.
968.06. Official Methods of Analysis of the Association of Official Analytical
Chemists, AOAC, Int., Arlington, VA, 71–72.
Paraskevopoulou, A., KIiosseoglou, V., Alevisopoulos, S., & Kasapis, S. (2000). Small
deformation measurements of science and mixed gels of low cholesterol yolk
and egg white. Journal of Texture Studies, 31(2), 225–244.
Paraskevopoulou, A., & Kiosseoglou, V. (1997). Texture profile analysis of heat-
formed gels and cakes prepared with low cholesterol egg yolk concentrates.
Journal of Food Science, 62(1), 208–211.
Paul, K., Manjula, J., Deepa, E., Selvanayagam, Z. E., Ganesh, K. A., & Subba Rao, P. V.
(2007). Anti-< i> Echis carinatus</i> venom antibodies from chicken egg yolk:
Isolation, purification and neutralization efficacy. Toxicon, 50(7), 893–900.
Pauly, D., Dorner, M., Zhang, X., Hlinak, A., Dorner, B., & Schade, R. (2009).
145
Monitoring of laying capacity, immunoglobulin Y concentration, and antibody
titer development in chickens immunized with ricin and botulinum toxins over.
Poultry Science, 88(2), 281–290.
Polson, A., von Wechmar, M. B., & Van Regenmortel, M. H. V. (1980). Isolation of viral
IgY antibodies from yolks of immunized hens. Immunological Investigations,
9(5), 475–493.
Privett, O. S., Blank, M. L., & Schmit, J. a. (1962). Studies on the Composition of Egg
Lipid. Journal of Food Science, 27(5), 463–468.
Radomski, M., & Cook, W. (1964). Fractionation and dissociation of the avian
lipovitellins and their interaction with phosvitin. Canadian Journal of
Biochemistry, 42(3), 395–406.
Rao, Q., Fisher, M. C., Guo, M., & Labuza, T. P. (2013). Storage stability of a
commercial hen egg yolk powder in dry and intermediate-moisture food
matrices. Journal of Agricultural and Food Chemistry, 61(36), 8676–86.
Rao, Q., Kamdar, A., & Labuza, T. (2013). Storage Stability of Food Protein
Hydrolysates—a Review. Critical Reviews in Food Science and Nutrition, just
accep.
Rao, Q., & Labuza, T. P. (2012). Effect of moisture content on selected
physicochemical properties of two commercial hen egg white powders. Food
Chemistry, 132(1), 373–384.
Rao, Q., Rocca-smith, J. R., & Labuza, T. P. (2012). Moisture-induced Quality Changes
of Hen Egg White Proteins in a Protein/Water Model System. Journal of
Agricultural and Food Chemistry, 60(42), 10625–10633.
Rao, Q., Rocca-Smith, J. R., & Labuza, T. P. (2013). Storage stability of hen egg white
powders in three protein/water dough model systems. Food Chemistry, 138(2-
3), 1087–94.
Rao, Q., Rocca-Smith, J. R., Schoenfuss, T. C., & Labuza, T. P. (2012). Accelerated shelf-
life testing of quality loss for a commercial hydrolysed hen egg white powder.
Food Chemistry, 135(2), 464–472.
Rappsilber, J., Ishihama, Y., & Mann, M. (2003). Stop and go extraction tips for
matrix-assisted laser desorption/ionization, nanoelectrospray, and LC/MS
sample pretreatment in proteomics. Analytical Chemistry, 75, 663–670.
Reid, D. S. (2008). Water activity: Fundamentals and relationships. In Water activity
in foods: Fundamentals and applications (pp. 15–28). John Willey & Sons, Inc.,
New York.
Roos, Y. H. (1987). Effect of moisture on the thermal behavior of strawberries
studied using differential scanning calorimetry. Journal of Food Science, 52(1),
146–149.
Roos, Y. H. (2008). Water activity and glass transition. In Water activity in foods:
146
Fundamentals and applications (pp. 29–45). John Willey & Sons, Inc., New York.
Roos, Y. R. (2002). Thermal analysis, state transitions and food quality. Journal of
Thermal Analysis and Calorimetry, 71, 197–203.
doi:10.1023/A:1022234805054
Rose, M., Orlans, E., & Buttress, N. (1974). Immunoglobulin classes in the hen’s egg:
their segregation in yolk and white. European Journal of Immunology, 4(7),
521–523.
Rossander, L., Hallberg, L., & Bjorn-Rasussen, E. (1979). Absorption of iron from
breakfast meals. The American Journal of Clinical Nutrition, 32(12), 2484–2489.
Rossi, M., & Schiraldi, A. (1992). Thermal denaturation and aggregation of egg
proteins. Thermochimica Acta, 199, 115–123.
Roubal, W. T. (1971). Free radicals, malonaldehyde and protein damage in lipid-
protein systems. Lipids, 6(1), 62–4.
Rouball, W. T., & Tappel, A. L. (1966). Damage to proteins , enzymes , and lipids
amino acids by peroxidizing Lipids. Archives of Biochemistry and Biophysics,
113, 5–8.
Roudaut, G., Simatos, D., Champion, D., Contreras-Lopez, E., & Le Meste, M. (2004).
Molecular mobility around the glass transition temperature: A mini review.
Innovative Food Science & Emerging Technologies, 5, 127–134.
Russell, W., & Burch, R. (1959). The principles of humane experimental technique.
London: Methuen & Co. Ltd.
Saari, A., Powrie, W. D., & Fennema, O. (1964). Isolation and characterization of low-
density in native egg yolk plasma. Journal of Food Science, 29(3), 307–315.
Samaraweera, H., Zhang, W., Lee, E. J., & Ahn, D. U. (2011). Egg yolk phosvitin and
functional phosphopeptides--review. Journal of Food Science, 76(7), R143–50.
Sarker, S., Casswall, T., Juneja, L. R., Hoq, E., Hossain, I., Fuchs, G. J., & Hammarstrom,
L. (2001). Randomized, placebo-controlled, clinical trial of hyperimmunized
chicken egg yolk immunoglobulin in children with rotavirus diarrhea. Journal of
Pediatric Gastroenterology and Nutrition, 32(1), 19–25.
Schade, R. (2001). Chicken egg yolk antibodies, production and, application: IgY-
technology. Springer.
Schade, R., Calzado, E., Sarmiento, R., Chacana, P. A., Porankiewicz-Asplund, J., &
Terzolo, H. R. (2005). Chicken egg yolk antibodies (IgY-technology): a review of
progress in production and use in research and human and veterinary
medicine. Altern Lab Anim, 33(2), 129–154.
Schade, R., Staak, C., Hendriksen, C., Erhard, M., Hugl, H., Koch, G., … Straughan, D.
(1996). The production of avian (egg yolk) antibodies: IgY. ATLA, 24, 925–934.
Schaich, K. M., & Karel, M. (1975). Free radicals in slysozyme reacted with
147
peroxidzing methyl linoleate. Journal of Food Science, 40, 456–459.
Scott, W. (1957). Water relations of food spoilage microorganisms. Adv. Food Res, 7,
83–127. Retrieved from
https://publications.csiro.au/rpr/pub?list=BRO&pid=procite:b91e2dc0-475c-
41e0-8884-251fc3d7ac76
Searle, B. (2010). Scaffold: A bioinformatic tool for validating MS/MS-based
proteomic studies. Proteomics, 10(6), 1265–1269.
Sell, H. M., Olsen, A. G., & Kremers, R. E. (1935). Lecithoprotein: The emulsifying
ingredient in egg yolk. Ind. Eng. Chem., 27, 1222–1223.
Shahidi, F., & Wanasundara, P. K. J. P. D. (2008). Extraction and analysis of lipids. In
Food Lipids - Chemistry, Nutrition, and Biotechnology (3rd ed., pp. 125–156).
CRC Press, New York.
Shainkin, R., & Perlmann, G. (1971). Phosvitin, a phosphoglycoprotein: Composition
and partial structure of carbohydrate moiety. Archives of Biochemistry and
Biophysics, 145(2), 693–700.
Shepard, C., & Hottle, G. (1949). Studies of the composition of the livetin fraction of
the yolk of hen’s eggs with the use of electrophoretic analysis. Journal of
Biological Chemistry, 179(1), 345–357.
Shevchenko, A., Wilm, M., Vorm, O., & Mann, M. (1996). Mass spectrometric
sequencing of proteins from silver stained polyacrylamide gels. Analytical
Chemistry, 68, 850–858.
Shimizu, M., Nagashima, H., Sano, K., Hashimoto, K., Ozeki, M., Tsuda, K., & Hatta, H.
(1992). Molecular stability of chicken and rabbit immunoglobulin G. Bioscience,
Biotechnology, and Biochemistry, 56(2), 270–274.
Slade, L., & Levine, H. (1991). Beyond water activity: recent advances based on an
alternative approach to the assessment of food quality and safety. Critical
Reviews in Food Science and Nutrition, 30, 115–360.
Slade, L., & Levine, H. (1995). Glass transitions and water-food structure
interactions. Advances in Food and Nutrition Research, 38, 103–269.
Smith, I., & Perdue, H. (1966). Isolation and tentative identification of the
carotenoids present in chicken skin and egg yolks. Poultry Science, 45(3), 577–
581.
Spence, J., Jenkins, D., & Davignon, J. (2010). Dietary cholesterol and egg yolks: not
for patients at risk of vascular disease. Canadian Journal of Cardiology, 26(9),
e336–e339.
Sperling, L. H. (1992). Introduction to physical polymer science. Wiley.
Stadelman, W. J. (1995). The egg industry. In Egg Science and Technology (Fourth
Edi., pp. 1–7). Food Products Press.
148
Stadelman, W. J., & Cotterill, O. J. (1973). Egg science and technology. The Avi
Publishing Company, Inc., Westport, Connecticut.
Steiner, R. F., & Weinryb, I. (1971). Excited states of proteins and nucleic acids.
Boston, MA: Springer US.
Strasburg, G. M., & Ludescher, R. D. (1995). Theory and applications of fluorescence
spectroscopy in food research. Trends in Food Science & Technology, 6(3), 69–
75.
Sun, R., Sivik, B., & Larsson, K. (1995). The fractional extraction of lipids and
cholesterol from dried egg yolk using supercritical carbon dioxide. Lipid/Fett,
97(6), 214–219.
Sun, S., Mo, W., Ji, Y., & Liu, S. (2001). Preparation and mass spectrometric study of
egg yolk antibody (IgY) against rabies virus. Rapid Communications in Mass
Spectrometry, 15(9), 708–712.
Surewicz, W. K., Mantsch, H. H., & Chapman, D. (1993). Determination of protein
secondary structure by Fourier transform infrared spectroscopy: A critical
assessment. Biochemistry, 32(2), 389–394.
Susi, H., & Michael Byler, D. (1983). Protein structure by Fourier transform infrared
spectroscopy: Second derivative spectra. Biochemical and Biophysical Research
Communications, 115(1), 391–397.
Tattrie, N. H. (1959). Positional distribution of saturated and unsaturated fatty acids
on egg lecithin. Journal of Lipid Research, 1(1), 60–65.
USDA. (2014). Eggs: Production, disposition, and value. Retrieved from
http://usda.mannlib.cornell.edu/MannUsda/viewDocumentInfo.do?documentI
D=1367
Vigo, M. S., Malec, L. S., Gomez, R. G., & Llosa, R. A. (1992). Spectrophotometric assay
using o-phthaldialdehyde for determination of reactive lysine in dairy products.
Food Chemistry, 44(5), 363–365. Retrieved from
http://www.sciencedirect.com/science/article/pii/0308814692902698
Wahle, K. W. J., Hoppeb, P. P., & Mcintosh, G. (1993). Effects of Storage and Various
Intrinsic Vitamin E Concentratiohs on Lipid Oxidation in Dried Egg Powders.
Journal of Agricultural and Food Chemistry, 61, 463–469.
Wang, S., Smith, D., & Williams, D. (1983). Purification of avian vitellogenin III:
comparison with vitellogenins I and II. Biochemistry, 22(26), 6206–6212.
Wang, W., Nema, S., & Teagarden, D. (2010). Protein aggregation-Pathways and
influencing factors. International Journal of Pharmaceutics, 390(2), 89–99.
Watkins, B. A. (1995). The nutritive value of the egg. In Egg science and technology
(4th Editio., pp. 177–194). The Haworth Press, Inc.
Williams, J. (1962). Serum proteins and the livetins of hen’s egg yolk. Biochemical
Journal, 83(2), 346.
149
Wold, J. P., Mielnik, M., Pettersen, M. K., Aaby, K., & Baardseth, P. (2002). Rapid
assessment of rancidity in complex meat products by front face fluorescence
spectroscopy. Journal of Food Science, 67(6), 2397–2404.
Woodbury, M., & Woodbury, M. (1993). Neuropsychiatric development: two case
reports about the use of dietary fish oils and/or choline supplementation in
children. Journal of the American College of Nutrition, 12(3), 239–245.
Woodward, S. a., & Cotterill, O. J. (1983). Electrophoresis and chromatography of
heat-treated plain, sugared and salted whole egg. Journal of Food Science, 48(2),
501–506. doi:10.1111/j.1365-2621.1983.tb10776.x
Xiao, Y., & Gao, X. (2010). Use of IgY antibodies and semiconductor nanocrystal
detection in cancer biomarker quantitation. Biomarkers in Medicine, 4(2), 227–
239.
Yamamoto, H., Watanabe, H., Sato, G., & Mikami, T. (1975). Identification of
immunoglobulins in chicken eggs and their antibody activity. Japanese Journal
of Veterinary Research, 23(4), 131–140.
Yamamura, J., Adachi, T., Aoki, N., Nakjima, H., Nakamura, R., & Matsuda, T. (1995).
Precursor-product relationship between chicken vitellogenin and the yolk
proteins: the 40 kDa yolk plasma glycoprotein is derived from the C-terminal
cysteine-rich. Biochimica et Biophysica Acta (BBA)-General Subjects, 1244(2),
384–394.
Yang, S., & Cotterill, O. J. (1989). Physical and functional properties of 10 % salted
egg yolk in mayonnaise. Journal of Food Science, 54(1), 210–213.
Yang, S.-C., & Baldwin, R. E. (1995). Functional properties of eggs in foods. In Egg
science and technology (4th Editio., pp. 405–464). The Haworth Press, Inc.
Yen, W. ., & Chen, B. . (1995). Isolation of xanthophylls from Taiwanese orange peels
and their effects on the oxidation stability of soybean oil. Food Chemistry, 53(4),
417–425.
Zamora, R., & Hidalgo, F. J. (2005). Coordinate contribution of lipid oxidation and
Maillard reaction to the nonenzymatic food browning. Critical Reviews in Food
Science and Nutrition, 45(1), 49–59.
Zeisel, S. (1992). Choline: an important nutrient in brain development, liver function
and carcinogenesis. Journal of the American College of Nutrition, 11(5), 473–
481.
Zhou, P., Guo, M., Liu, D., Liu, X., & Labuza, T. P. (2013). Maillard-reaction-induced
modification and aggregation of proteins and hardening of texture in protein
bar model systems. Journal of Food Science, 78(3), C437–44.
Zhou, P., & Labuza, T. P. (2007). Effect of water content on glass transition and
protein aggregation of whey protein Ppowders during short-term storage. Food
Biophysics, 2, 108–116.
150
Zhou, P., Liu, X., & Labuza, T. P. (2008a). Effects of moisture-induced whey protein
aggregation on protein conformation, the state of water molecules, and the
microstructure and texture of high-protein-containing matrix. Journal of
Agricultural and Food Chemistry, 56(12), 4534–40.
Zhou, P., Liu, X., & Labuza, T. P. (2008b). Moisture-induced aggregation of whey
proteins in a protein/buffer model system. Journal of Agricultural and Food
Chemistry, 56(6), 2048–2054.
Zhu, D., & Labuza, T. P. (2010). Effect of cysteine on lowering protein aggregation
and subsequent hardening of whey protein isolate (WPI) protein bars in
WPI/buffer model systems. Journal of Agricultural and Food Chemistry, 58,
7970–7979.

151
Appendix
Appendix 1: Selected raw data of the color measurement
Table 1: L*, a*, and b* values of DEY during storage at 45°C at aw of 0.66 Day L* a* b*
0 88.52 -2.98 54.67
88.33 -3.17 55.13
88.40 -2.91 55.92
88.42 -3.02 55.24
3 89.65 -2.26 54.20
89.85 -2.51 55.00
89.99 -2.38 54.44
89.93 -2.32 54.92
7 87.79 -1.54 52.44
87.46 -1.64 52.67
87.00 -1.70 52.68
87.11 -1.63 52.61
14 85.70 -0.54 50.69
85.83 -0.37 50.57
84.88 0.50 49.78
84.91 0.49 50.07
28 83.16 0.94 47.85
83.55 0.87 47.85
83.25 0.78 47.52
83.30 0.60 47.86
84.06 1.53 47.54
83.94 1.42 47.69
45 82.38 1.76 45.55
83.42 1.60 46.48
83.10 2.01 46.16
60 81.69 2.03 44.71
81.88 2.01 44.48
82.00 1.92 44.59
Table 2: L*, a*, and b* values of DEY during storage at 35°C at aw of 0.66
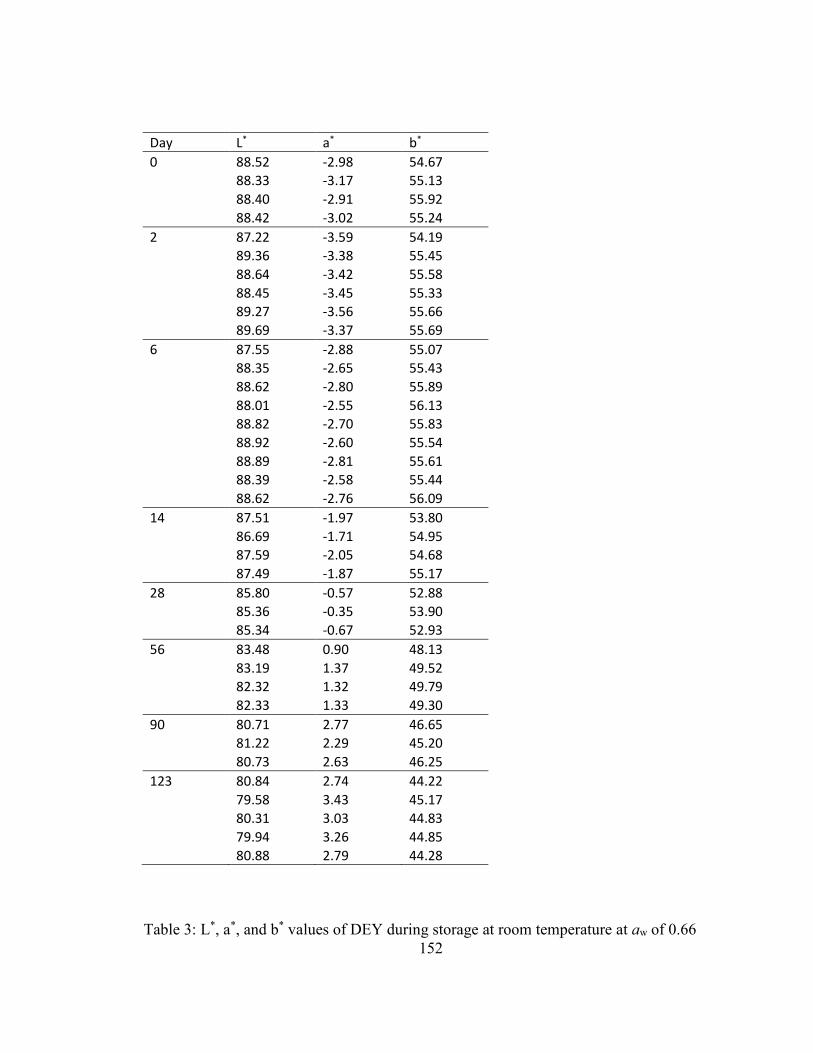
152
Day L* a* b*
0 88.52 -2.98 54.67
88.33 -3.17 55.13
88.40 -2.91 55.92
88.42 -3.02 55.24
2 87.22 -3.59 54.19
89.36 -3.38 55.45
88.64 -3.42 55.58
88.45 -3.45 55.33
89.27 -3.56 55.66
89.69 -3.37 55.69
6 87.55 -2.88 55.07
88.35 -2.65 55.43
88.62 -2.80 55.89
88.01 -2.55 56.13
88.82 -2.70 55.83
88.92 -2.60 55.54
88.89 -2.81 55.61
88.39 -2.58 55.44
88.62 -2.76 56.09
14 87.51 -1.97 53.80
86.69 -1.71 54.95
87.59 -2.05 54.68
87.49 -1.87 55.17
28 85.80 -0.57 52.88
85.36 -0.35 53.90
85.34 -0.67 52.93
56 83.48 0.90 48.13
83.19 1.37 49.52
82.32 1.32 49.79
82.33 1.33 49.30
90 80.71 2.77 46.65
81.22 2.29 45.20
80.73 2.63 46.25
123 80.84 2.74 44.22
79.58 3.43 45.17
80.31 3.03 44.83
79.94 3.26 44.85
80.88 2.79 44.28
Table 3: L*, a*, and b* values of DEY during storage at room temperature at aw of 0.66
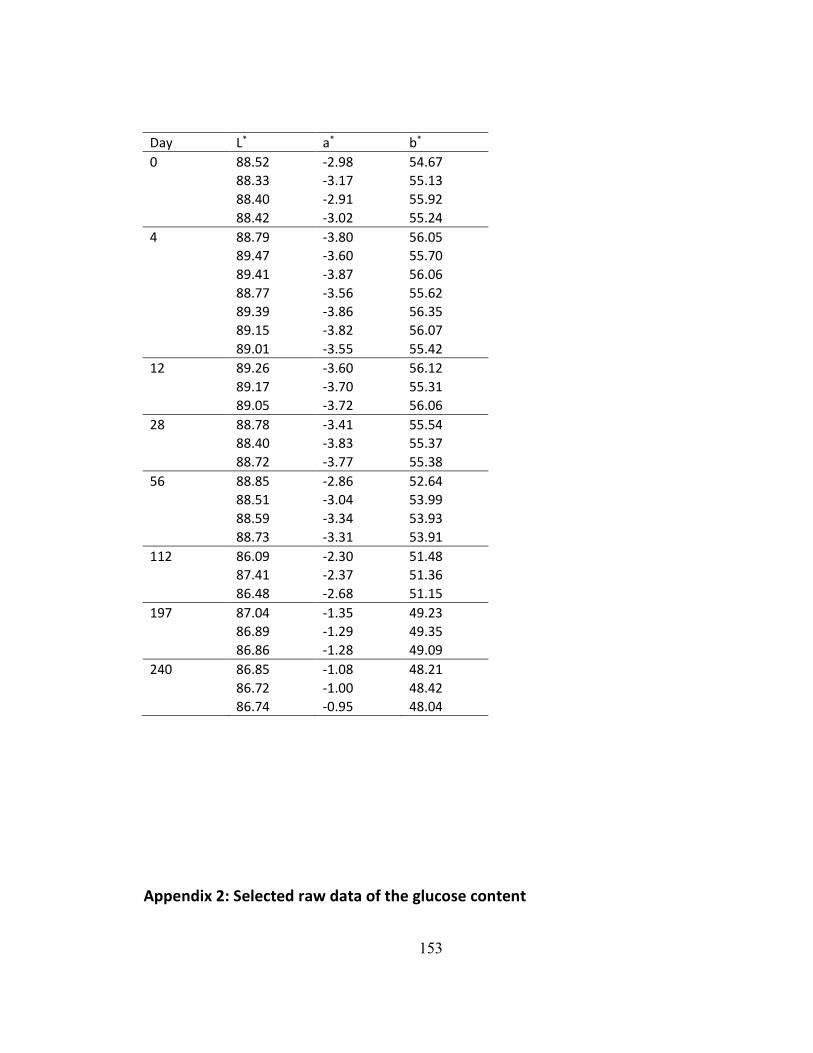
153
Day L* a* b*
0 88.52 -2.98 54.67
88.33 -3.17 55.13
88.40 -2.91 55.92
88.42 -3.02 55.24
4 88.79 -3.80 56.05
89.47 -3.60 55.70
89.41 -3.87 56.06
88.77 -3.56 55.62
89.39 -3.86 56.35
89.15 -3.82 56.07
89.01 -3.55 55.42
12 89.26 -3.60 56.12
89.17 -3.70 55.31
89.05 -3.72 56.06
28 88.78 -3.41 55.54
88.40 -3.83 55.37
88.72 -3.77 55.38
56 88.85 -2.86 52.64
88.51 -3.04 53.99
88.59 -3.34 53.93
88.73 -3.31 53.91
112 86.09 -2.30 51.48
87.41 -2.37 51.36
86.48 -2.68 51.15
197 87.04 -1.35 49.23
86.89 -1.29 49.35
86.86 -1.28 49.09
240 86.85 -1.08 48.21
86.72 -1.00 48.42
86.74 -0.95 48.04
Appendix 2: Selected raw data of the glucose content
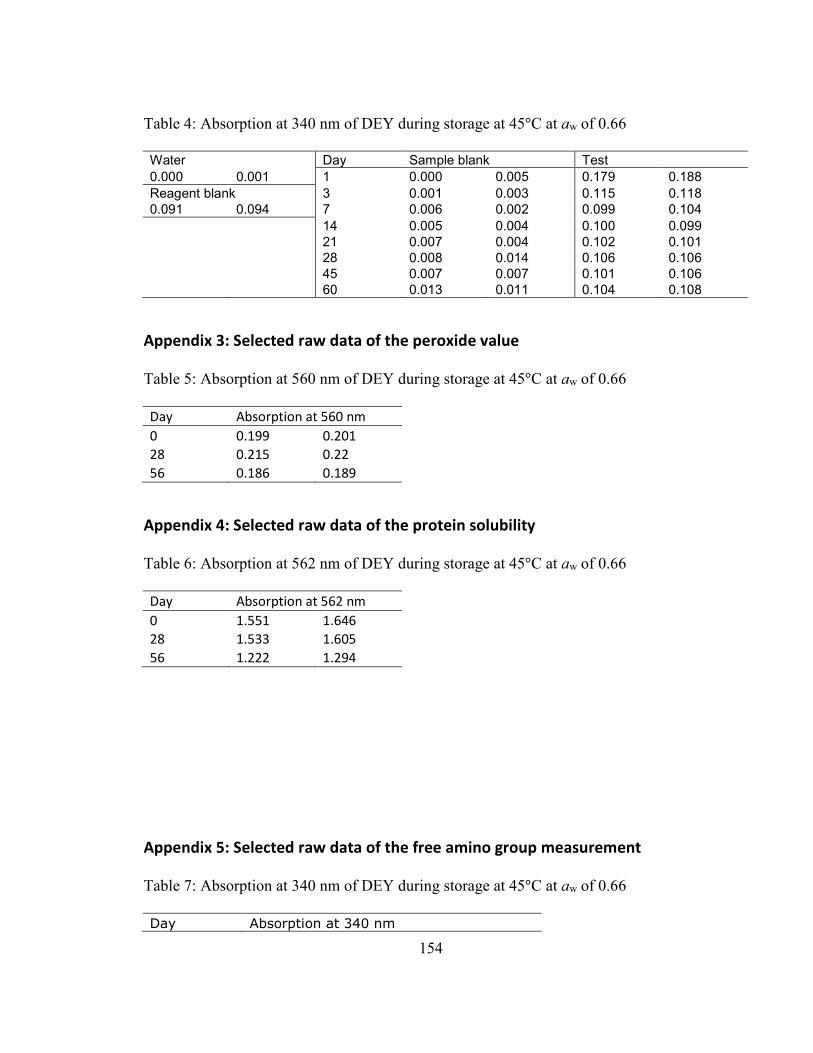
154
Table 4: Absorption at 340 nm of DEY during storage at 45°C at aw of 0.66 Water Day Sample blank Test
0.000 0.001 1 0.000 0.005 0.179 0.188
Reagent blank 3 0.001 0.003 0.115 0.118
0.091 0.094 7 0.006 0.002 0.099 0.104
14 0.005 0.004 0.100 0.099
21 0.007 0.004 0.102 0.101
28 0.008 0.014 0.106 0.106
45 0.007 0.007 0.101 0.106
60 0.013 0.011 0.104 0.108
Appendix 3: Selected raw data of the peroxide value
Table 5: Absorption at 560 nm of DEY during storage at 45°C at aw of 0.66 Day Absorption at 560 nm
0 0.199 0.201
28 0.215 0.22
56 0.186 0.189
Appendix 4: Selected raw data of the protein solubility
Table 6: Absorption at 562 nm of DEY during storage at 45°C at aw of 0.66 Day Absorption at 562 nm
0 1.551 1.646
28 1.533 1.605
56 1.222 1.294
Appendix 5: Selected raw data of the free amino group measurement
Table 7: Absorption at 340 nm of DEY during storage at 45°C at aw of 0.66 Day Absorption at 340 nm
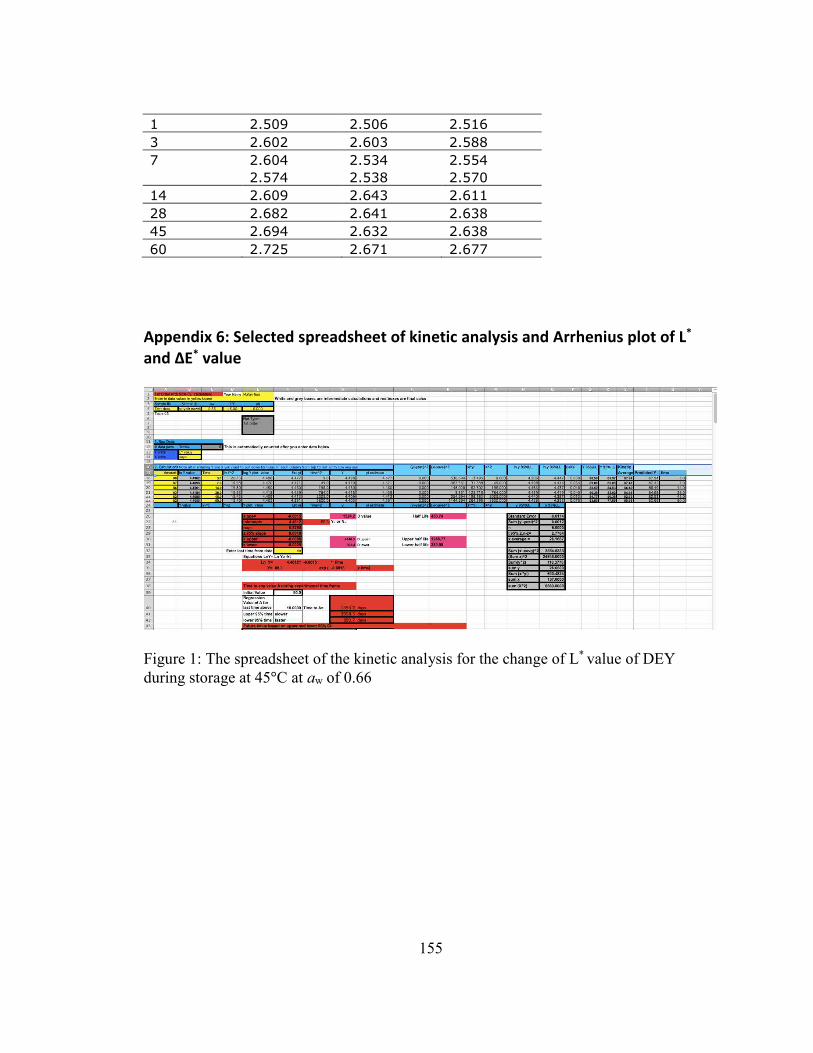
155
1 2.509 2.506 2.516
3 2.602 2.603 2.588
7 2.604 2.534 2.554
2.574 2.538 2.570
14 2.609 2.643 2.611
28 2.682 2.641 2.638
45 2.694 2.632 2.638
60 2.725 2.671 2.677
Appendix 6: Selected spreadsheet of kinetic analysis and Arrhenius plot of L*
and ΔE* value
Figure 1: The spreadsheet of the kinetic analysis for the change of L* value of DEY during storage at 45°C at aw of 0.66
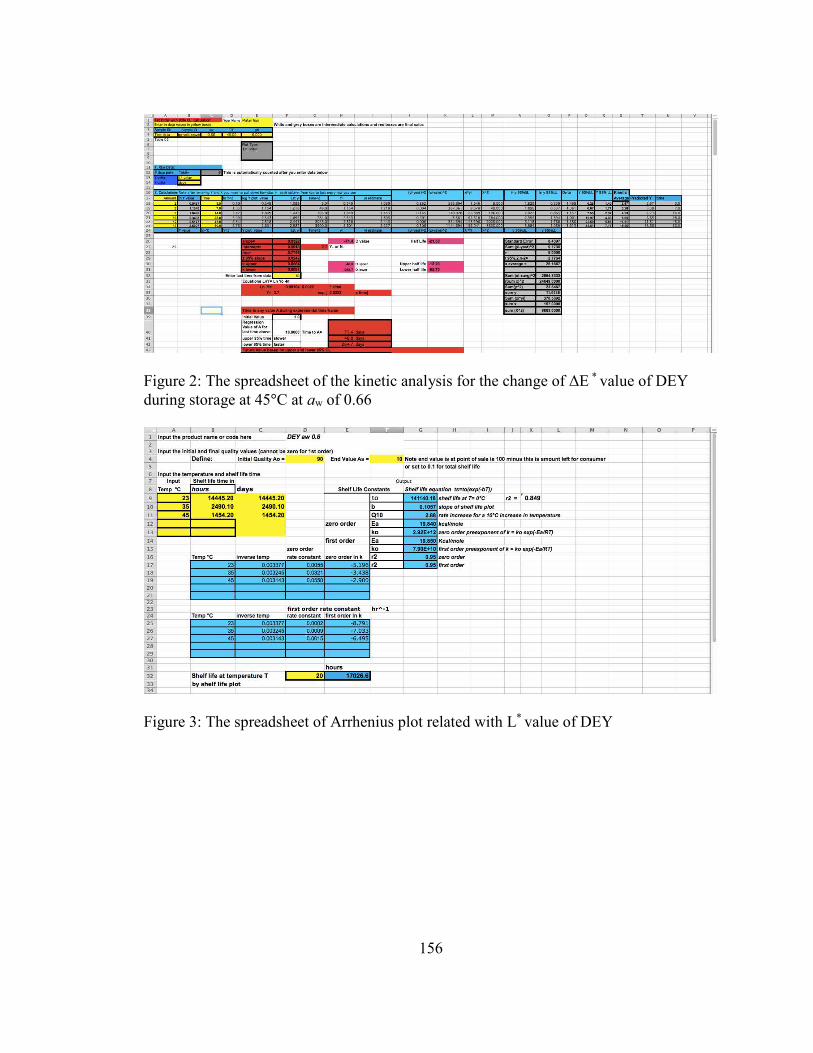
156
Figure 2: The spreadsheet of the kinetic analysis for the change of ΔE * value of DEY during storage at 45°C at aw of 0.66
Figure 3: The spreadsheet of Arrhenius plot related with L* value of DEY
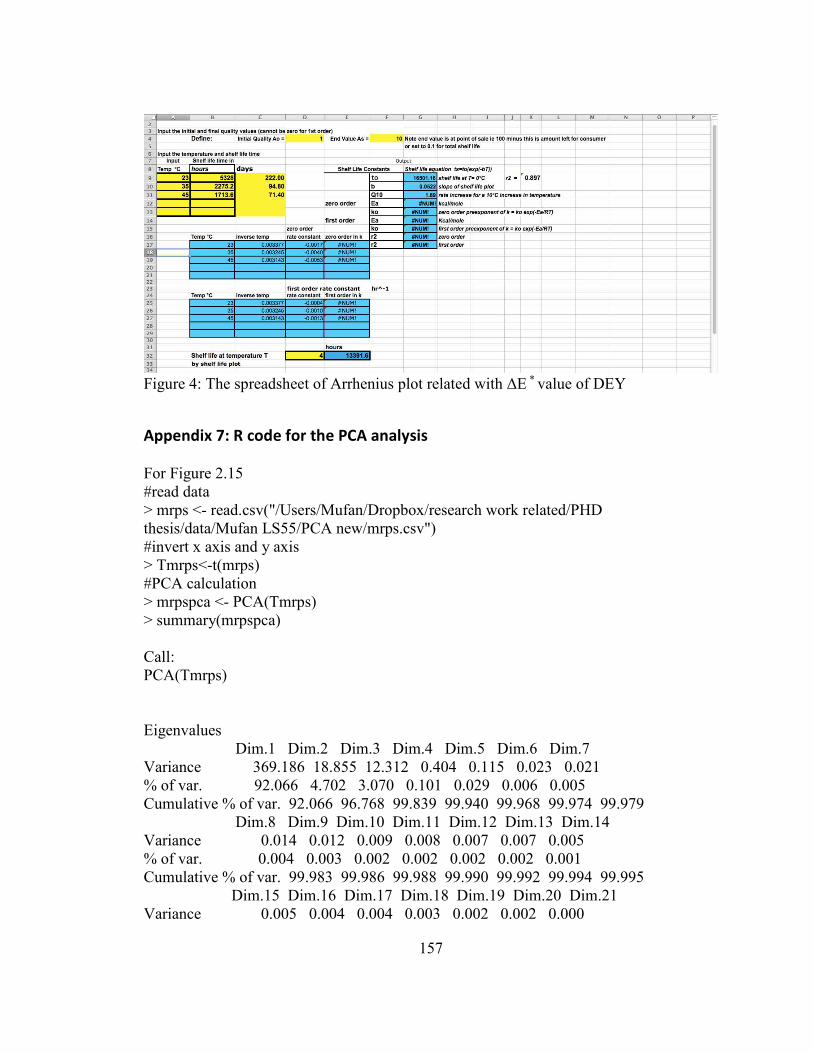
157
Figure 4: The spreadsheet of Arrhenius plot related with ΔE * value of DEY
Appendix 7: R code for the PCA analysis
For Figure 2.15 #read data > mrps <- read.csv("/Users/Mufan/Dropbox/research work related/PHD thesis/data/Mufan LS55/PCA new/mrps.csv") #invert x axis and y axis > Tmrps<-t(mrps) #PCA calculation > mrpspca <- PCA(Tmrps) > summary(mrpspca) Call: PCA(Tmrps) Eigenvalues Dim.1 Dim.2 Dim.3 Dim.4 Dim.5 Dim.6 Dim.7 Variance 369.186 18.855 12.312 0.404 0.115 0.023 0.021 % of var. 92.066 4.702 3.070 0.101 0.029 0.006 0.005 Cumulative % of var. 92.066 96.768 99.839 99.940 99.968 99.974 99.979 Dim.8 Dim.9 Dim.10 Dim.11 Dim.12 Dim.13 Dim.14 Variance 0.014 0.012 0.009 0.008 0.007 0.007 0.005 % of var. 0.004 0.003 0.002 0.002 0.002 0.002 0.001 Cumulative % of var. 99.983 99.986 99.988 99.990 99.992 99.994 99.995 Dim.15 Dim.16 Dim.17 Dim.18 Dim.19 Dim.20 Dim.21 Variance 0.005 0.004 0.004 0.003 0.002 0.002 0.000
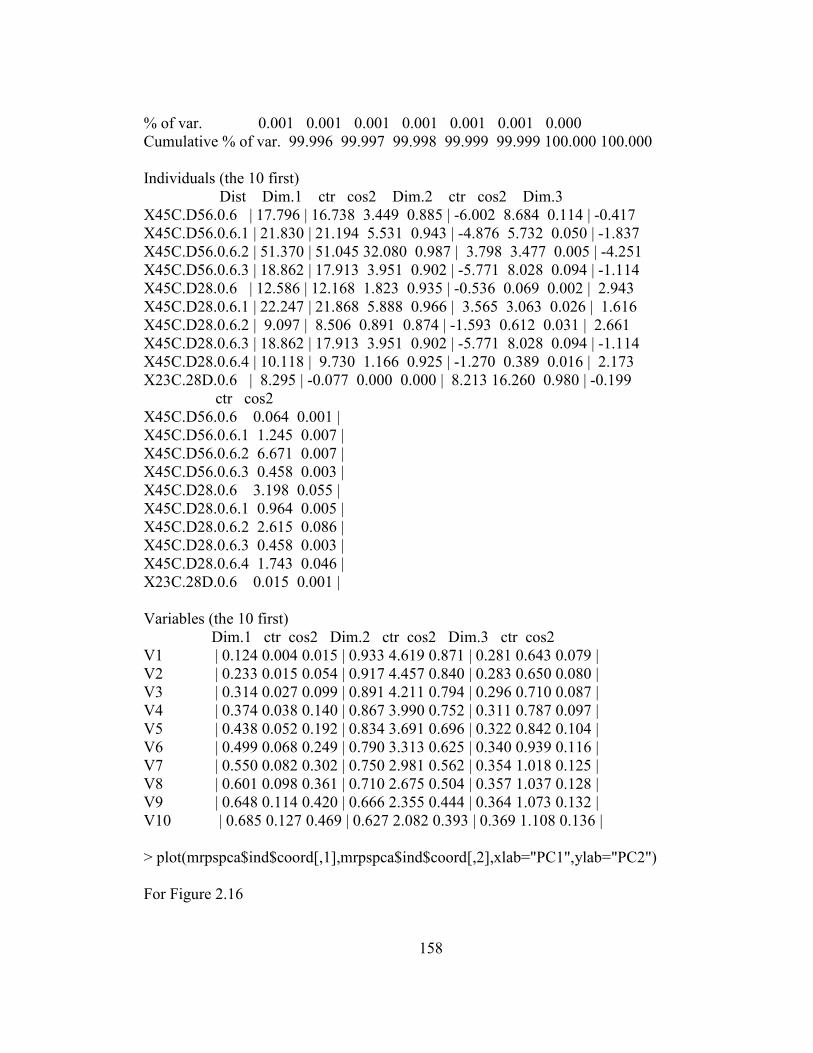
158
% of var. 0.001 0.001 0.001 0.001 0.001 0.001 0.000 Cumulative % of var. 99.996 99.997 99.998 99.999 99.999 100.000 100.000 Individuals (the 10 first) Dist Dim.1 ctr cos2 Dim.2 ctr cos2 Dim.3 X45C.D56.0.6 | 17.796 | 16.738 3.449 0.885 | -6.002 8.684 0.114 | -0.417 X45C.D56.0.6.1 | 21.830 | 21.194 5.531 0.943 | -4.876 5.732 0.050 | -1.837 X45C.D56.0.6.2 | 51.370 | 51.045 32.080 0.987 | 3.798 3.477 0.005 | -4.251 X45C.D56.0.6.3 | 18.862 | 17.913 3.951 0.902 | -5.771 8.028 0.094 | -1.114 X45C.D28.0.6 | 12.586 | 12.168 1.823 0.935 | -0.536 0.069 0.002 | 2.943 X45C.D28.0.6.1 | 22.247 | 21.868 5.888 0.966 | 3.565 3.063 0.026 | 1.616 X45C.D28.0.6.2 | 9.097 | 8.506 0.891 0.874 | -1.593 0.612 0.031 | 2.661 X45C.D28.0.6.3 | 18.862 | 17.913 3.951 0.902 | -5.771 8.028 0.094 | -1.114 X45C.D28.0.6.4 | 10.118 | 9.730 1.166 0.925 | -1.270 0.389 0.016 | 2.173 X23C.28D.0.6 | 8.295 | -0.077 0.000 0.000 | 8.213 16.260 0.980 | -0.199 ctr cos2 X45C.D56.0.6 0.064 0.001 | X45C.D56.0.6.1 1.245 0.007 | X45C.D56.0.6.2 6.671 0.007 | X45C.D56.0.6.3 0.458 0.003 | X45C.D28.0.6 3.198 0.055 | X45C.D28.0.6.1 0.964 0.005 | X45C.D28.0.6.2 2.615 0.086 | X45C.D28.0.6.3 0.458 0.003 | X45C.D28.0.6.4 1.743 0.046 | X23C.28D.0.6 0.015 0.001 | Variables (the 10 first) Dim.1 ctr cos2 Dim.2 ctr cos2 Dim.3 ctr cos2 V1 | 0.124 0.004 0.015 | 0.933 4.619 0.871 | 0.281 0.643 0.079 | V2 | 0.233 0.015 0.054 | 0.917 4.457 0.840 | 0.283 0.650 0.080 | V3 | 0.314 0.027 0.099 | 0.891 4.211 0.794 | 0.296 0.710 0.087 | V4 | 0.374 0.038 0.140 | 0.867 3.990 0.752 | 0.311 0.787 0.097 | V5 | 0.438 0.052 0.192 | 0.834 3.691 0.696 | 0.322 0.842 0.104 | V6 | 0.499 0.068 0.249 | 0.790 3.313 0.625 | 0.340 0.939 0.116 | V7 | 0.550 0.082 0.302 | 0.750 2.981 0.562 | 0.354 1.018 0.125 | V8 | 0.601 0.098 0.361 | 0.710 2.675 0.504 | 0.357 1.037 0.128 | V9 | 0.648 0.114 0.420 | 0.666 2.355 0.444 | 0.364 1.073 0.132 | V10 | 0.685 0.127 0.469 | 0.627 2.082 0.393 | 0.369 1.108 0.136 | > plot(mrpspca$ind$coord[,1],mrpspca$ind$coord[,2],xlab="PC1",ylab="PC2") For Figure 2.16
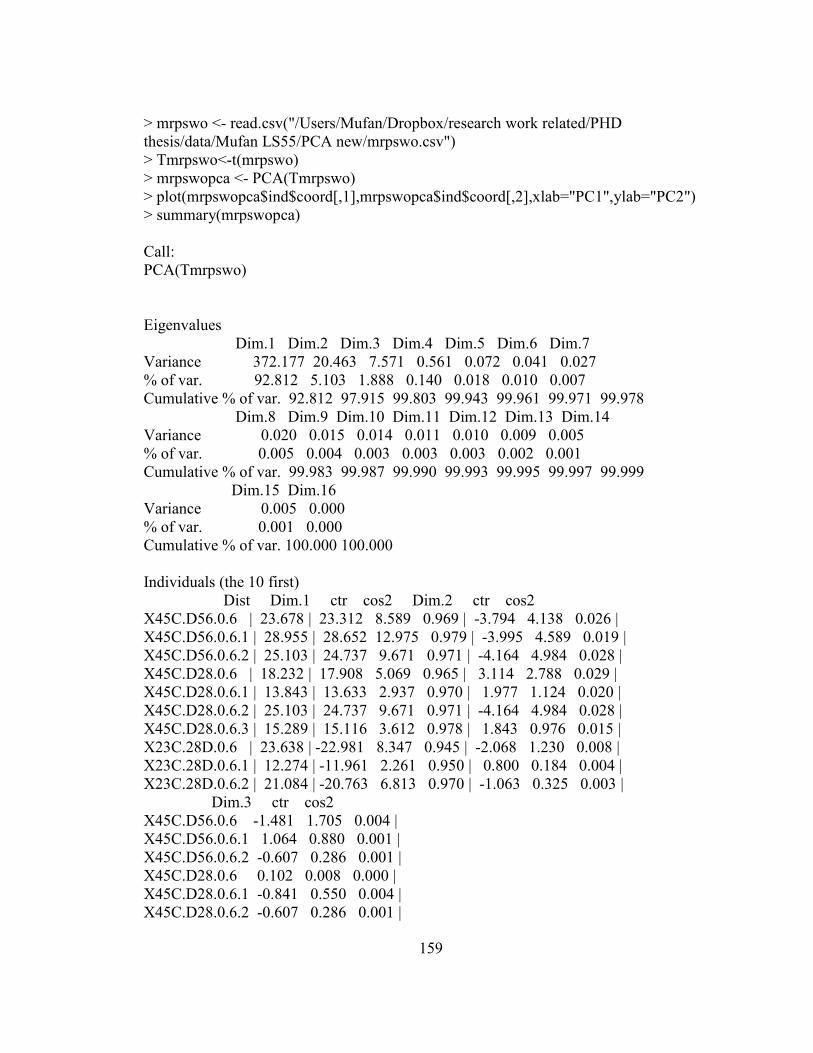
159
> mrpswo <- read.csv("/Users/Mufan/Dropbox/research work related/PHD thesis/data/Mufan LS55/PCA new/mrpswo.csv") > Tmrpswo<-t(mrpswo) > mrpswopca <- PCA(Tmrpswo) > plot(mrpswopca$ind$coord[,1],mrpswopca$ind$coord[,2],xlab="PC1",ylab="PC2") > summary(mrpswopca) Call: PCA(Tmrpswo) Eigenvalues Dim.1 Dim.2 Dim.3 Dim.4 Dim.5 Dim.6 Dim.7 Variance 372.177 20.463 7.571 0.561 0.072 0.041 0.027 % of var. 92.812 5.103 1.888 0.140 0.018 0.010 0.007 Cumulative % of var. 92.812 97.915 99.803 99.943 99.961 99.971 99.978 Dim.8 Dim.9 Dim.10 Dim.11 Dim.12 Dim.13 Dim.14 Variance 0.020 0.015 0.014 0.011 0.010 0.009 0.005 % of var. 0.005 0.004 0.003 0.003 0.003 0.002 0.001 Cumulative % of var. 99.983 99.987 99.990 99.993 99.995 99.997 99.999 Dim.15 Dim.16 Variance 0.005 0.000 % of var. 0.001 0.000 Cumulative % of var. 100.000 100.000 Individuals (the 10 first) Dist Dim.1 ctr cos2 Dim.2 ctr cos2 X45C.D56.0.6 | 23.678 | 23.312 8.589 0.969 | -3.794 4.138 0.026 | X45C.D56.0.6.1 | 28.955 | 28.652 12.975 0.979 | -3.995 4.589 0.019 | X45C.D56.0.6.2 | 25.103 | 24.737 9.671 0.971 | -4.164 4.984 0.028 | X45C.D28.0.6 | 18.232 | 17.908 5.069 0.965 | 3.114 2.788 0.029 | X45C.D28.0.6.1 | 13.843 | 13.633 2.937 0.970 | 1.977 1.124 0.020 | X45C.D28.0.6.2 | 25.103 | 24.737 9.671 0.971 | -4.164 4.984 0.028 | X45C.D28.0.6.3 | 15.289 | 15.116 3.612 0.978 | 1.843 0.976 0.015 | X23C.28D.0.6 | 23.638 | -22.981 8.347 0.945 | -2.068 1.230 0.008 | X23C.28D.0.6.1 | 12.274 | -11.961 2.261 0.950 | 0.800 0.184 0.004 | X23C.28D.0.6.2 | 21.084 | -20.763 6.813 0.970 | -1.063 0.325 0.003 | Dim.3 ctr cos2 X45C.D56.0.6 -1.481 1.705 0.004 | X45C.D56.0.6.1 1.064 0.880 0.001 | X45C.D56.0.6.2 -0.607 0.286 0.001 | X45C.D28.0.6 0.102 0.008 0.000 | X45C.D28.0.6.1 -0.841 0.550 0.004 | X45C.D28.0.6.2 -0.607 0.286 0.001 |
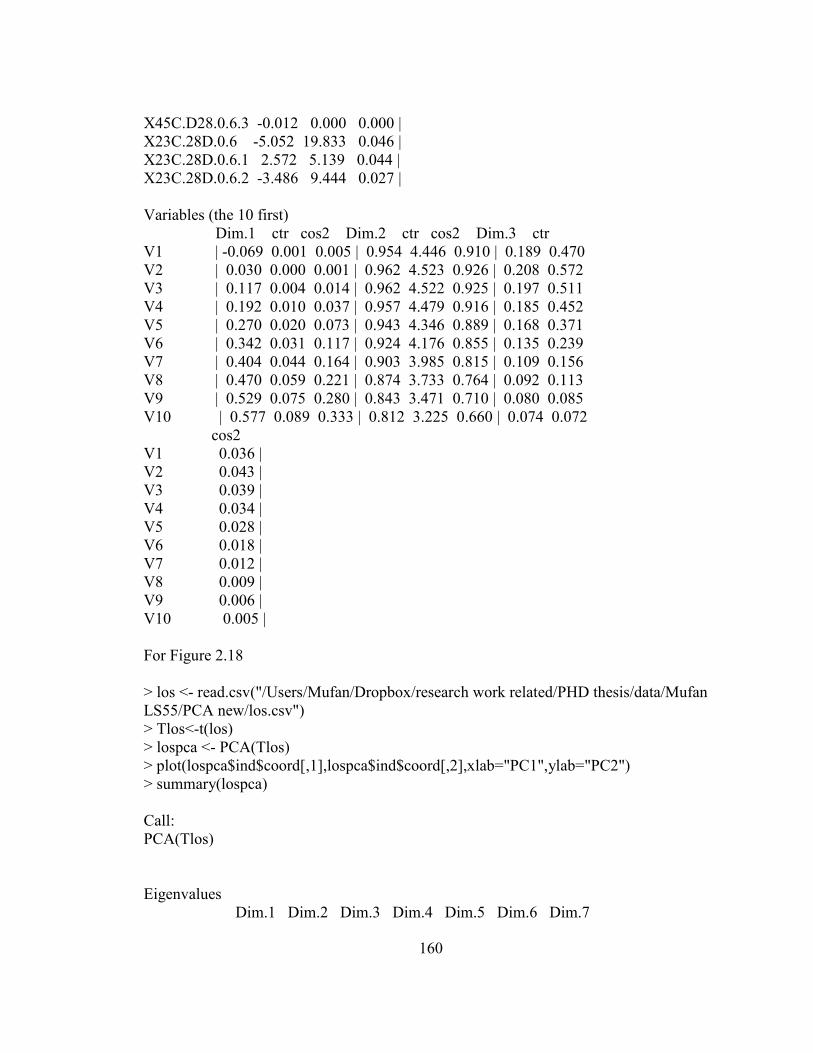
160
X45C.D28.0.6.3 -0.012 0.000 0.000 | X23C.28D.0.6 -5.052 19.833 0.046 | X23C.28D.0.6.1 2.572 5.139 0.044 | X23C.28D.0.6.2 -3.486 9.444 0.027 | Variables (the 10 first) Dim.1 ctr cos2 Dim.2 ctr cos2 Dim.3 ctr V1 | -0.069 0.001 0.005 | 0.954 4.446 0.910 | 0.189 0.470 V2 | 0.030 0.000 0.001 | 0.962 4.523 0.926 | 0.208 0.572 V3 | 0.117 0.004 0.014 | 0.962 4.522 0.925 | 0.197 0.511 V4 | 0.192 0.010 0.037 | 0.957 4.479 0.916 | 0.185 0.452 V5 | 0.270 0.020 0.073 | 0.943 4.346 0.889 | 0.168 0.371 V6 | 0.342 0.031 0.117 | 0.924 4.176 0.855 | 0.135 0.239 V7 | 0.404 0.044 0.164 | 0.903 3.985 0.815 | 0.109 0.156 V8 | 0.470 0.059 0.221 | 0.874 3.733 0.764 | 0.092 0.113 V9 | 0.529 0.075 0.280 | 0.843 3.471 0.710 | 0.080 0.085 V10 | 0.577 0.089 0.333 | 0.812 3.225 0.660 | 0.074 0.072 cos2 V1 0.036 | V2 0.043 | V3 0.039 | V4 0.034 | V5 0.028 | V6 0.018 | V7 0.012 | V8 0.009 | V9 0.006 | V10 0.005 | For Figure 2.18 > los <- read.csv("/Users/Mufan/Dropbox/research work related/PHD thesis/data/Mufan LS55/PCA new/los.csv") > Tlos<-t(los) > lospca <- PCA(Tlos) > plot(lospca$ind$coord[,1],lospca$ind$coord[,2],xlab="PC1",ylab="PC2") > summary(lospca) Call: PCA(Tlos) Eigenvalues Dim.1 Dim.2 Dim.3 Dim.4 Dim.5 Dim.6 Dim.7
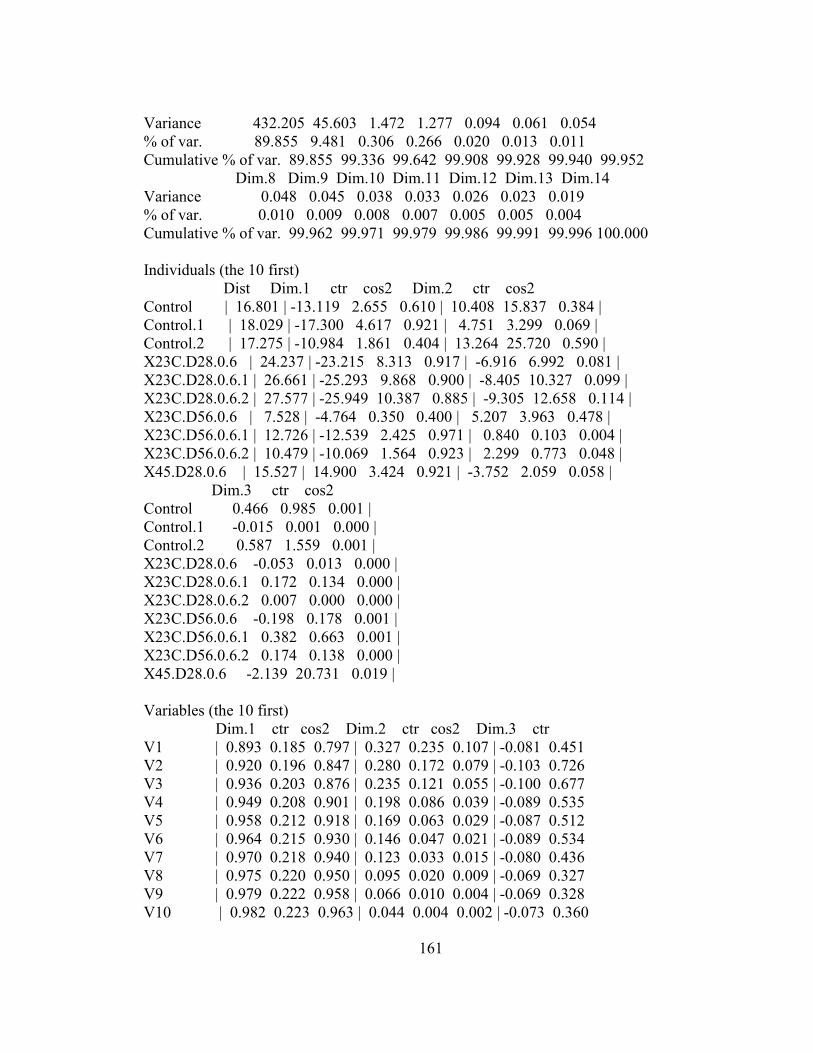
161
Variance 432.205 45.603 1.472 1.277 0.094 0.061 0.054 % of var. 89.855 9.481 0.306 0.266 0.020 0.013 0.011 Cumulative % of var. 89.855 99.336 99.642 99.908 99.928 99.940 99.952 Dim.8 Dim.9 Dim.10 Dim.11 Dim.12 Dim.13 Dim.14 Variance 0.048 0.045 0.038 0.033 0.026 0.023 0.019 % of var. 0.010 0.009 0.008 0.007 0.005 0.005 0.004 Cumulative % of var. 99.962 99.971 99.979 99.986 99.991 99.996 100.000 Individuals (the 10 first) Dist Dim.1 ctr cos2 Dim.2 ctr cos2 Control | 16.801 | -13.119 2.655 0.610 | 10.408 15.837 0.384 | Control.1 | 18.029 | -17.300 4.617 0.921 | 4.751 3.299 0.069 | Control.2 | 17.275 | -10.984 1.861 0.404 | 13.264 25.720 0.590 | X23C.D28.0.6 | 24.237 | -23.215 8.313 0.917 | -6.916 6.992 0.081 | X23C.D28.0.6.1 | 26.661 | -25.293 9.868 0.900 | -8.405 10.327 0.099 | X23C.D28.0.6.2 | 27.577 | -25.949 10.387 0.885 | -9.305 12.658 0.114 | X23C.D56.0.6 | 7.528 | -4.764 0.350 0.400 | 5.207 3.963 0.478 | X23C.D56.0.6.1 | 12.726 | -12.539 2.425 0.971 | 0.840 0.103 0.004 | X23C.D56.0.6.2 | 10.479 | -10.069 1.564 0.923 | 2.299 0.773 0.048 | X45.D28.0.6 | 15.527 | 14.900 3.424 0.921 | -3.752 2.059 0.058 | Dim.3 ctr cos2 Control 0.466 0.985 0.001 | Control.1 -0.015 0.001 0.000 | Control.2 0.587 1.559 0.001 | X23C.D28.0.6 -0.053 0.013 0.000 | X23C.D28.0.6.1 0.172 0.134 0.000 | X23C.D28.0.6.2 0.007 0.000 0.000 | X23C.D56.0.6 -0.198 0.178 0.001 | X23C.D56.0.6.1 0.382 0.663 0.001 | X23C.D56.0.6.2 0.174 0.138 0.000 | X45.D28.0.6 -2.139 20.731 0.019 | Variables (the 10 first) Dim.1 ctr cos2 Dim.2 ctr cos2 Dim.3 ctr V1 | 0.893 0.185 0.797 | 0.327 0.235 0.107 | -0.081 0.451 V2 | 0.920 0.196 0.847 | 0.280 0.172 0.079 | -0.103 0.726 V3 | 0.936 0.203 0.876 | 0.235 0.121 0.055 | -0.100 0.677 V4 | 0.949 0.208 0.901 | 0.198 0.086 0.039 | -0.089 0.535 V5 | 0.958 0.212 0.918 | 0.169 0.063 0.029 | -0.087 0.512 V6 | 0.964 0.215 0.930 | 0.146 0.047 0.021 | -0.089 0.534 V7 | 0.970 0.218 0.940 | 0.123 0.033 0.015 | -0.080 0.436 V8 | 0.975 0.220 0.950 | 0.095 0.020 0.009 | -0.069 0.327 V9 | 0.979 0.222 0.958 | 0.066 0.010 0.004 | -0.069 0.328 V10 | 0.982 0.223 0.963 | 0.044 0.004 0.002 | -0.073 0.360
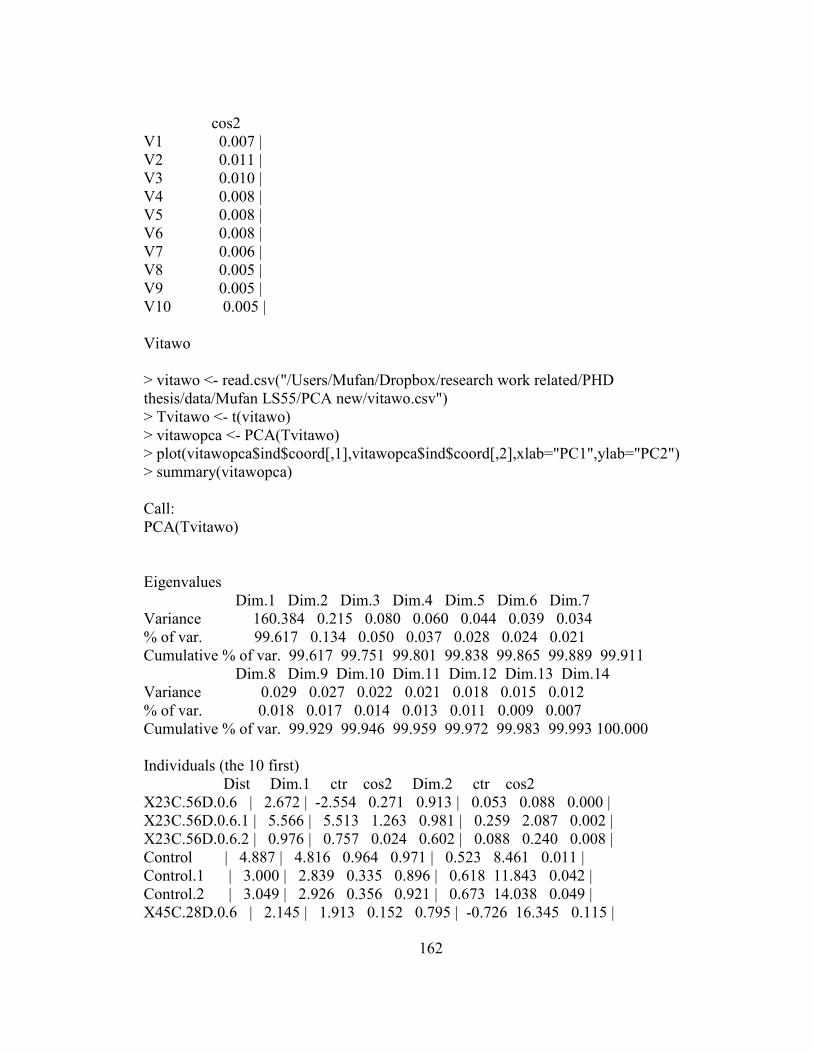
162
cos2 V1 0.007 | V2 0.011 | V3 0.010 | V4 0.008 | V5 0.008 | V6 0.008 | V7 0.006 | V8 0.005 | V9 0.005 | V10 0.005 | Vitawo > vitawo <- read.csv("/Users/Mufan/Dropbox/research work related/PHD thesis/data/Mufan LS55/PCA new/vitawo.csv") > Tvitawo <- t(vitawo) > vitawopca <- PCA(Tvitawo) > plot(vitawopca$ind$coord[,1],vitawopca$ind$coord[,2],xlab="PC1",ylab="PC2") > summary(vitawopca) Call: PCA(Tvitawo) Eigenvalues Dim.1 Dim.2 Dim.3 Dim.4 Dim.5 Dim.6 Dim.7 Variance 160.384 0.215 0.080 0.060 0.044 0.039 0.034 % of var. 99.617 0.134 0.050 0.037 0.028 0.024 0.021 Cumulative % of var. 99.617 99.751 99.801 99.838 99.865 99.889 99.911 Dim.8 Dim.9 Dim.10 Dim.11 Dim.12 Dim.13 Dim.14 Variance 0.029 0.027 0.022 0.021 0.018 0.015 0.012 % of var. 0.018 0.017 0.014 0.013 0.011 0.009 0.007 Cumulative % of var. 99.929 99.946 99.959 99.972 99.983 99.993 100.000 Individuals (the 10 first) Dist Dim.1 ctr cos2 Dim.2 ctr cos2 X23C.56D.0.6 | 2.672 | -2.554 0.271 0.913 | 0.053 0.088 0.000 | X23C.56D.0.6.1 | 5.566 | 5.513 1.263 0.981 | 0.259 2.087 0.002 | X23C.56D.0.6.2 | 0.976 | 0.757 0.024 0.602 | 0.088 0.240 0.008 | Control | 4.887 | 4.816 0.964 0.971 | 0.523 8.461 0.011 | Control.1 | 3.000 | 2.839 0.335 0.896 | 0.618 11.843 0.042 | Control.2 | 3.049 | 2.926 0.356 0.921 | 0.673 14.038 0.049 | X45C.28D.0.6 | 2.145 | 1.913 0.152 0.795 | -0.726 16.345 0.115 |
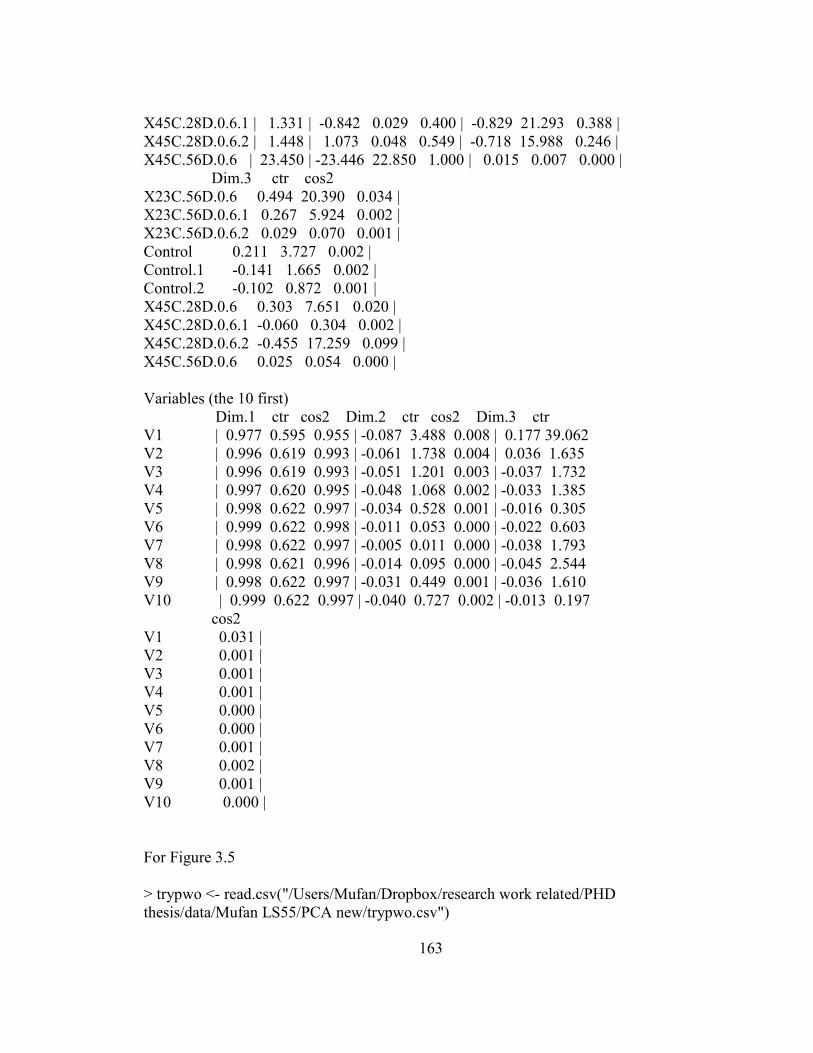
163
X45C.28D.0.6.1 | 1.331 | -0.842 0.029 0.400 | -0.829 21.293 0.388 | X45C.28D.0.6.2 | 1.448 | 1.073 0.048 0.549 | -0.718 15.988 0.246 | X45C.56D.0.6 | 23.450 | -23.446 22.850 1.000 | 0.015 0.007 0.000 | Dim.3 ctr cos2 X23C.56D.0.6 0.494 20.390 0.034 | X23C.56D.0.6.1 0.267 5.924 0.002 | X23C.56D.0.6.2 0.029 0.070 0.001 | Control 0.211 3.727 0.002 | Control.1 -0.141 1.665 0.002 | Control.2 -0.102 0.872 0.001 | X45C.28D.0.6 0.303 7.651 0.020 | X45C.28D.0.6.1 -0.060 0.304 0.002 | X45C.28D.0.6.2 -0.455 17.259 0.099 | X45C.56D.0.6 0.025 0.054 0.000 | Variables (the 10 first) Dim.1 ctr cos2 Dim.2 ctr cos2 Dim.3 ctr V1 | 0.977 0.595 0.955 | -0.087 3.488 0.008 | 0.177 39.062 V2 | 0.996 0.619 0.993 | -0.061 1.738 0.004 | 0.036 1.635 V3 | 0.996 0.619 0.993 | -0.051 1.201 0.003 | -0.037 1.732 V4 | 0.997 0.620 0.995 | -0.048 1.068 0.002 | -0.033 1.385 V5 | 0.998 0.622 0.997 | -0.034 0.528 0.001 | -0.016 0.305 V6 | 0.999 0.622 0.998 | -0.011 0.053 0.000 | -0.022 0.603 V7 | 0.998 0.622 0.997 | -0.005 0.011 0.000 | -0.038 1.793 V8 | 0.998 0.621 0.996 | -0.014 0.095 0.000 | -0.045 2.544 V9 | 0.998 0.622 0.997 | -0.031 0.449 0.001 | -0.036 1.610 V10 | 0.999 0.622 0.997 | -0.040 0.727 0.002 | -0.013 0.197 cos2 V1 0.031 | V2 0.001 | V3 0.001 | V4 0.001 | V5 0.000 | V6 0.000 | V7 0.001 | V8 0.002 | V9 0.001 | V10 0.000 | For Figure 3.5 > trypwo <- read.csv("/Users/Mufan/Dropbox/research work related/PHD thesis/data/Mufan LS55/PCA new/trypwo.csv")
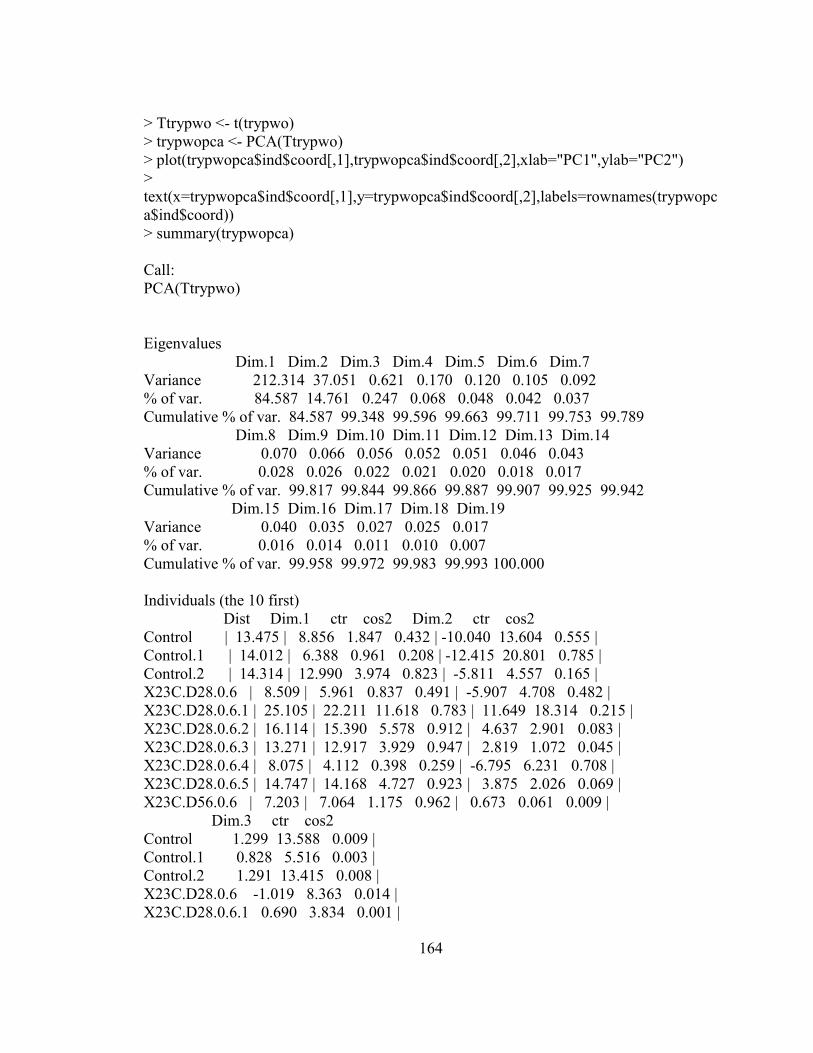
164
> Ttrypwo <- t(trypwo) > trypwopca <- PCA(Ttrypwo) > plot(trypwopca$ind$coord[,1],trypwopca$ind$coord[,2],xlab="PC1",ylab="PC2") > text(x=trypwopca$ind$coord[,1],y=trypwopca$ind$coord[,2],labels=rownames(trypwopca$ind$coord)) > summary(trypwopca) Call: PCA(Ttrypwo) Eigenvalues Dim.1 Dim.2 Dim.3 Dim.4 Dim.5 Dim.6 Dim.7 Variance 212.314 37.051 0.621 0.170 0.120 0.105 0.092 % of var. 84.587 14.761 0.247 0.068 0.048 0.042 0.037 Cumulative % of var. 84.587 99.348 99.596 99.663 99.711 99.753 99.789 Dim.8 Dim.9 Dim.10 Dim.11 Dim.12 Dim.13 Dim.14 Variance 0.070 0.066 0.056 0.052 0.051 0.046 0.043 % of var. 0.028 0.026 0.022 0.021 0.020 0.018 0.017 Cumulative % of var. 99.817 99.844 99.866 99.887 99.907 99.925 99.942 Dim.15 Dim.16 Dim.17 Dim.18 Dim.19 Variance 0.040 0.035 0.027 0.025 0.017 % of var. 0.016 0.014 0.011 0.010 0.007 Cumulative % of var. 99.958 99.972 99.983 99.993 100.000 Individuals (the 10 first) Dist Dim.1 ctr cos2 Dim.2 ctr cos2 Control | 13.475 | 8.856 1.847 0.432 | -10.040 13.604 0.555 | Control.1 | 14.012 | 6.388 0.961 0.208 | -12.415 20.801 0.785 | Control.2 | 14.314 | 12.990 3.974 0.823 | -5.811 4.557 0.165 | X23C.D28.0.6 | 8.509 | 5.961 0.837 0.491 | -5.907 4.708 0.482 | X23C.D28.0.6.1 | 25.105 | 22.211 11.618 0.783 | 11.649 18.314 0.215 | X23C.D28.0.6.2 | 16.114 | 15.390 5.578 0.912 | 4.637 2.901 0.083 | X23C.D28.0.6.3 | 13.271 | 12.917 3.929 0.947 | 2.819 1.072 0.045 | X23C.D28.0.6.4 | 8.075 | 4.112 0.398 0.259 | -6.795 6.231 0.708 | X23C.D28.0.6.5 | 14.747 | 14.168 4.727 0.923 | 3.875 2.026 0.069 | X23C.D56.0.6 | 7.203 | 7.064 1.175 0.962 | 0.673 0.061 0.009 | Dim.3 ctr cos2 Control 1.299 13.588 0.009 | Control.1 0.828 5.516 0.003 | Control.2 1.291 13.415 0.008 | X23C.D28.0.6 -1.019 8.363 0.014 | X23C.D28.0.6.1 0.690 3.834 0.001 |
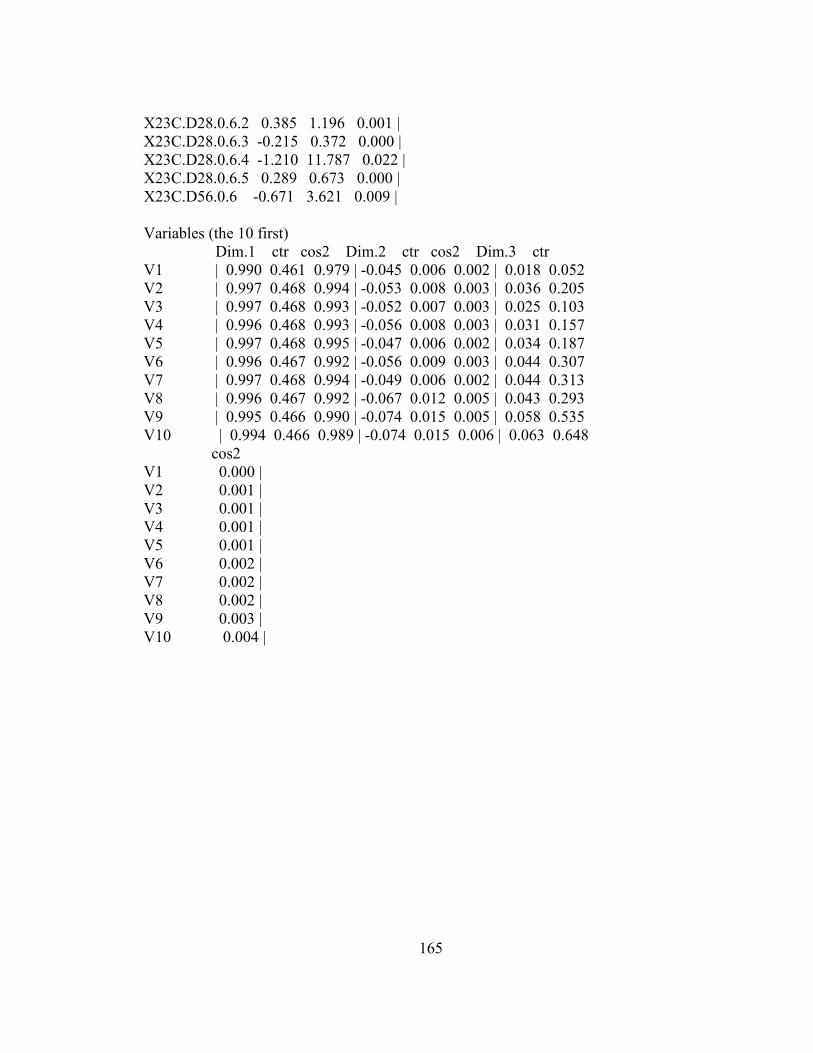
165
X23C.D28.0.6.2 0.385 1.196 0.001 | X23C.D28.0.6.3 -0.215 0.372 0.000 | X23C.D28.0.6.4 -1.210 11.787 0.022 | X23C.D28.0.6.5 0.289 0.673 0.000 | X23C.D56.0.6 -0.671 3.621 0.009 | Variables (the 10 first) Dim.1 ctr cos2 Dim.2 ctr cos2 Dim.3 ctr V1 | 0.990 0.461 0.979 | -0.045 0.006 0.002 | 0.018 0.052 V2 | 0.997 0.468 0.994 | -0.053 0.008 0.003 | 0.036 0.205 V3 | 0.997 0.468 0.993 | -0.052 0.007 0.003 | 0.025 0.103 V4 | 0.996 0.468 0.993 | -0.056 0.008 0.003 | 0.031 0.157 V5 | 0.997 0.468 0.995 | -0.047 0.006 0.002 | 0.034 0.187 V6 | 0.996 0.467 0.992 | -0.056 0.009 0.003 | 0.044 0.307 V7 | 0.997 0.468 0.994 | -0.049 0.006 0.002 | 0.044 0.313 V8 | 0.996 0.467 0.992 | -0.067 0.012 0.005 | 0.043 0.293 V9 | 0.995 0.466 0.990 | -0.074 0.015 0.005 | 0.058 0.535 V10 | 0.994 0.466 0.989 | -0.074 0.015 0.006 | 0.063 0.648 cos2 V1 0.000 | V2 0.001 | V3 0.001 | V4 0.001 | V5 0.001 | V6 0.002 | V7 0.002 | V8 0.002 | V9 0.003 | V10 0.004 |